yang yu - wur
TRANSCRIPT

Crop yields in intercropping: meta-analysis
and virtual plant modelling
Yang Yu

Thesis committee
Promotor
Prof. Dr N.P.R. Anten
Professor of Crop and Weed Ecology
Wageningen University
Co-promotors
Dr W. van der Werf
Associate professor, Centre for Crop Systems Analysis
Wageningen University
Dr T.J. Stomph
Assistant professor, Centre for Crop Systems Analysis
Wageningen University
Other members
Prof. Dr E. Hoffland, Wageningen University
Prof. Dr F.S. Zhang, China Agricultural University, Beijing, China
Prof. Dr E.S. Jensen, Swedish University of Agricultural Science, Sweden
Dr L. Hemerik, Wageningen University
This research was conducted under the auspices of the C. T. de Wit Graduate School for
Production Ecology and Resource Conservation

Crop yields in intercropping: meta-analysis
and virtual plant modelling
Yang Yu
Thesis
submitted in fulfillment of the requirements for the degree of doctor
at Wageningen University
by the authority of the Rector Magnificus
Prof. Dr A.P.J. Mol,
in the presence of the
Thesis Committee appointed by the Academic Board
to be defended in public
on Wednesday 20 April 2016
at 1.30 p.m. in the Aula.

Yu, Y. (2016)
Crop yields in intercropping: meta-analysis and virtual plant modelling
172 pages.
PhD thesis, Wageningen University, Wageningen, NL (2016)
With references, with summary in English
ISBN: 978-94-6257-676-6

AbstractIntercropping, the cultivation of two or more crop species simultaneously in the same field,
has been widely practiced by smallholder farmers in developing countries and is gaining
increasing interest in developed countries. Intercropping can increase the yield per unit land
compared to sole cropping. The yield advantage of intercropping is often assessed using the
land equivalent ratio (LER). LER may be interpreted as the relative area required by sole
crops to produce the same yields as achieved in a unit area of intercrop. LER>1 means
intercropping is more efficient in land use than sole cropping. A large variation of LER has
been found in the literature. However, few studies attempted to investigate reasons for this
variation in LER. This thesis aims to reveal how temporal niche difference, crop type
combination, and agronomic practices affect LER, productivity and interspecific interactions
in annual intercrops.
LER increased with temporal niche differentiation according to our meta-analysis of
literature data. This positive relationship was valid in mixtures of C3 and C4 species but not
in C3/C3 mixtures. Application of N fertilizer in intercropping decreased LER when the
intercropped species were sown and harvested simultaneously. However, reducing overlap in
growing periods of the intercropped species mitigated the negative effect of N fertilizer on
LER. A functional-structural plant (FSP) model was developed to investigate the interplay
between temporal and spatial complementarity and plant traits in mixed plant systems. The
results showed that complementarity of light use in time and space likely determine
productivity of species mixtures. The early-sown plants benefited from later sowing of the
late-sown plants due to the relaxed competition for light from the late-sown plants until a
plateau when the growth durations of the intercropped species overlapped less than 50% of
the total growth period of the intercrop. By contrast, the late-sown plants suffered a great
reduction in biomass due to the competition for light from the early-sown plants especially at
moderately delayed sowing time and when spatial arrangement of the intercrop allowed
strong interspecific competition. The shading effect from the early-sown plants on the growth
and productivity of the late-sown plants was smaller if the late-sown plants had the potential
to grow tall and if it had a high maximum CO2 assimilation rate. A meta-analysis of relative
yields in cereal/legume intercrops was conducted to investigate the relationship between
performance of intercropped species and management. Earlier sowing of one species
increased its competitiveness towards the other species while later sowing decreased it.
Application of N fertilizer enhanced the competitiveness of a cereal towards a legume,

resulting in overall low productivity of legumes in intercrops. However, sowing legumes
earlier than cereals mitigated the negative effect of N on productivity of legumes.
Overall, this thesis shows that the complementary resource use resulting from plant
traits diversity and temporal and spatial arrangements of plant mixtures is one of the key
factors for high productivity of intercropping. This finding strengthens the basis for further
research on the possible contribution of species diversity in agricultural systems to meeting
the demand for food and other agricultural products while mitigating the environmental
impacts of modern agriculture.

Contents
Chapter 1 General introduction 1
Chapter 2 Temporal niche differentiation increases the land equivalent ratio 11
of annual intercrops: A meta-analysis
Chapter 3 Robust increases of land equivalent ratio with temporal niche 37
differentiation: A meta-analysis with quantile regression
Chapter 4 Plant traits drive spatially and temporally complementary 53
light capture, photosynthesis, and productivity in plant mixtures
Chapter 5 A meta-analysis of relative crop yields in cereal/legume 77
mixtures suggests options for management
Chapter 6 General discussion 99
References 115
Appendix A 129
Appendix B 149
Appendix C 153
Appendix D 155
Summary 159
Acknowledgements 163
Publication list 167
PE & RC Training and Educational Statement 169
Curriculum vitae 171


Chapter 1
General introduction

Chapter 1
2
General introduction
What, where and why is intercropping?Intercropping is defined as the cultivation of two or more crop species in the same field for the
whole or part of their growing period (Willey, 1990; Hauggaard-Nielsen et al., 2008).
Intercropping is an ancient agronomic practice and was applied worldwide. Before the 1940s,
intercropping was commonly practiced in the United States and Europe (Andersen, 2005;
Machado, 2009). It however has gradually disappeared in developed countries due to
mechanization and the availability of cheap synthetic fertilizers and pesticides which make sole
cropping an efficient way to go (Horwith, 1985; Machado, 2009). In developing countries in
Asia, Africa and Latin America, where farmers have limited access to mechanization and
agricultural chemicals, intercropping is still widely used (Machado, 2009; Lithourgidis et al.,
2011). In Latin America, 70-90% of beans are intercropped with maize, potatoes and other
crops (Lithourgidis et al., 2011). Vandermeer (1992) reported that almost all of the cowpeas
grown in Africa were grown in intercrops.
It is clear from the ecological literature that ecological functioning and ecological
services tend to increase with species richness (Tilman, 1999; Loreau et al., 2001). In this sense,
intercropping is no exception (Cardinale et al., 2007) and intercropping has been shown to have
clear advantages over sole crops in many aspects. For instance, intercropping may utilize land
and other resources more efficiently than sole cropping (Reddy and Willey, 1981; Zhang and
Li, 2003); intercropping may suppress pests and diseases (Andow, 1991; Trenbath, 1993), and
weeds (Ayeni et al., 1984; Banik et al., 2006); and intercropping can increase stocks of organic
soil carbon and nitrogen (Cong et al., 2015).
One of the challenges facing the world is to match the rapidly changing demand for food
from an increasing population with limited land, using environmentally friendly agricultural
methods (Godfray et al., 2010). Sustainable intensification of agriculture is one way to tackle
the challenge (Tilman et al., 2011). Sustainable intensification is defined as a set of agricultural
practices and technnologies that increase crop production and resource use efficiency on
croplands, while reducing the environmental impact of agriculture. Given the advantages of
intercrops, intercropping has the potential to contribute to sustainable intensification of modern
agriculture (Bedoussac et al., 2015; Jensen et al., 2015). Therefore, intercropping is currently
receiving renewed interest as an environmentally friendly agronomic practice in developed
countries.

General introduction
3
Land-use efficiency of intercropsLand-use efficiency is one of the most widely studied aspects in intercropping research. Land-
use efficiency of an intercrop may be compared to that of sole crops using the so-called land
equivalent ratio (LER) (Mead and Willey, 1980). The LER is calculated as the sum of relative
yields of component crops in an intercrop versus sole crops (Eq. 1).
212
2
1
1 PLERPLERLER +=+=MY
MY (1)
where Y1 and Y2 are the yields (per unit of total area of the intercrop) of species 1 and 2 in the
intercrop, and M1 and M2 are the yields of the species in sole crops (per unit area of the sole
crops), and PLER1 and PLER2 are the partial land equivalent ratios of the intercropped
species, i.e. the relative yields of the species.
If the relative yield of one species in a two species intercrop is 70% and the relative
yield of the other species in the intercrop is 50%, the LER is 120%, or 1.2. LER indicates the
relative land area required by sole crops to produce the same yield/biomass of component
species as achieved on one unit area of intercrops (Mead and Willey, 1980; Reddy and
Willey, 1981). LER > 1 means that, in order to produce the same component crop yield as in a
unit area of intercrop, a greater land area of sole crops would be needed.
In addition to being the partial land equivalent ratios, PLER values are also a measure
of competitiveness of the species within the system when comparing PLER of a species to its
relative density (a ratio between density in intercrop to density in sole crop). If the PLER of a
species is greater than its relative density, yield or biomass per plant in the intercrop is greater
than in the sole crop indicating the species somehow experiences less competition in the
intercrop as compared to sole crop situation. In contrast, if the PLER of a species is lower
than its relative density, its productivity at plant level is decreased in the intercrop as
compared to in its sole crop due to greater competition the species suffered in the intercrop.
Published studies show large variation in LER. Most intercropping studies reported
values of LER well above one, but some reported values below one. Examples of high LER
are 1.41 (maize/faba bean, Mei et al., 2012), 1.67-1.69 (maize/cowpea, Ofori and Stern, 1986;
Ofori and Stern, 1987b) and 1.83 (sorghum/groundnut, Harris et al., 1987). Examples of low
LER are 0.77 (wheat/pea, Naudin et al., 2010), 0.82 (wheat/soybean, Haymes and Lee, 1999)
and 0.89 (maize/cowpea, Chang and Shibles, 1985). While a large number of intercropping
studies have been conducted, few have attempted to generalize and quantitatively synthesize
what factors contribute to variation in LER, and which species under what conditions

Chapter 1
4
contribute to a high LER. Such knowledge however could contribute important information
needed in designing intercrops with a high LER. In this thesis, I aimed to synthesize and
explore what factors affect LER and what factors influence the contribution of individual
species to LER using meta-analysis and functional-structural plant modelling.
Meta-analysis In this thesis, I use meta-analysis as the main research methodology (adopted in Chapters 2, 3
and 5). Meta-analysis is a set of statistical methods to quantitatively review and synthesize
published information on a topic (Sileshi et al., 2008). Broadly, the goal of meta-analysis is to
describe the distribution of the effect sizes associated with a set of experiments (Hedges et al.,
1999). One of the advantages of meta-analysis is that effects that are not significant in a single
study may become statistically significant when multiple studies are combined (Madden and
Paul, 2011). Thus, the power to detect departures from a null hypothesis of “no effect” is
enhanced. Furthermore, meta-analysis can be used to study the effect of co-variables on a
measure of effect size (Viechtbauer, 2007). Meta-analysis has distinct advantages over the
alternative so-called narrative review of research synthesis which is considered to be
subjective, and not suitable for making quantitative predictions (Madden and Paul, 2011).
Possible mechanisms for high LER
Niche differentiation theory/complementary interactions In ecology, niche theory has been developed to explain competition and coexistence of
different species in natural communities (Vandermeer, 1972). According to niche theory, if
the niches of two species are similar, the two species cannot coexist in the same community
over years because of intense interspecific competition for resources (Vandermeer, 1992),
while if their niches are different, the species in question can coexist and be productive due to
complementary use of resources (Cardinale et al., 2011). Niche differentiation may be one of
the mechanisms for high LER of intercrops (Vandermeer, 1992; Fukai, 1993; Lithourgidis et
al., 2011), as species that occupy different niches when grown together in a crop or vegetation
stand may together use growth resources more completely than when grown as mono-species
stands, due to a complementary usage of the resources in time and/or space. This, in turn,
results in higher production per unit area in intercrop than sole crops. According to

General introduction
5
Lithourgidis et al. (2011), yield advantage of intercrops occurs when the component crops do
not compete for the same ecological niches.
Under the niche differentiation hypothesis, niche differentiation in time, i.e. less overlap
of resource usage in time, is one of the mechanisms for high production of species-rich plant
communities (Vandermeer, 1992; Tilman, 1999; Loreau, 2000). Greater LER is expected with
greater temporal niche differentiation because it may allow component species to realize a
greater relative yield due to complementary use of resources in time (Li et al., 2013), and
relaxed competition from the other species (Vandermeer, 1992; Keating and Carberry, 1993; Li
et al., 2001a; Zhang et al., 2008). Effects of temporal niche differentiation on LER have been
implied in many studies, but few studies analyzed it quantitatively. No indicators have been
defined to quantify temporal niche differentiation in intercrops. In this thesis, I developed an
index to quantify temporal niche differentiation in annual intercrops and quantitatively
characterize the effect of temporal niche differentiation on LER using meta-analysis (Chapters 2
and 3).
Spatial niche differentiation, related to differences in plant stature or rooting depth,
enabling intercrops to exploit available resources more completely than corresponding sole
crops, may be another reason for high LER (Anten and Hirose, 1999; Li et al., 2006). Few
studies reported information on plant stature, rooting depth etc., I am therefore not able to
analyze the effect of spatial niche differentiation on LER using meta-analysis in this thesis.
Instead, I investigated the effect of plant stature on intercropping productivity using an
architectural plant modelling approach (Chapter 4).
Functional complementarity between intercropped species may improve resource
capture and/or resource use efficiency in intercrops thus resulting in high LER. An example of
this complementarity is mixing species with the C3 and C4 photosynthetic pathways. Plants
with the C4 photosynthetic pathway have higher photosynthetic capacity than those with the C3
pathway, which means C4 plants have higher rates of photosynthesis than C3 plants at high
light conditions (Connor et al., 2011), provided temperatures are conducive. By contrast, at low
light, C3 plants might use light more efficiently than C4 plants (Anten and Hirose, 2003).
Complementary effects of mixing C3 and C4 species may be correlated with other plant traits,
e.g. plant stature. In mixtures of C3 and C4 species with similar plant stature one might expect
no complementary capture of light but only intense competition for light. In this case, light use
efficiency of the mixture might be low. In contrast, in C3/C4 mixtures with different plant
stature, tall C4 plants might fully use light in the upper canopy layer where light intensity is

Chapter 1
6
high while short C3 plants could comparatively efficiently use light in the lower canopy layer
where light intensity is low, resulting in an overall high light use efficiency for the canopy as a
whole. Therefore, mixing short C3 and tall C4 species may be more effective in light use than
combining C3 and C4 species of similar stature. This hypothesis is tested with functional-
structural plant modelling.
Another example of functional complementarity is mixing legume and non-legume
species since legumes can fix nitrogen from air through symbionts in addition to using soil N,
while non-legume species acquire nitrogen only from the soil (Jensen, 1996; Hauggaard-
Nielsen and Jensen, 2001; Chu et al., 2004; Corre-Hellou et al., 2006). In this thesis, I
investigated whether species type combination (C3/C3 mixtures vs C3/C4 mixtures) affects
LER (Chapters 2, 3 and 4). However, the effect of including legume species in intercrops was
not assessed because I was not able to compare LER of legume/non-legume intercrops with
non-legume/non-legume intercrops using information from the literature. The main body of the
intercropping literature I used for the meta-analysis studies consists of papers about
legume/non-legume intercrops while only few are related to non-legume/non-legume mixtures.
Facilitative effects in intercropFacilitative effects entail that one species is positively affected by the presence of another
species, e.g. by directly or indirectly improving nutrient availability. An important example in
relation to intercropping involves facilitative interactions between legumes and non-legumes
that can contribute to higher nutrient uptake in intercrops as compared to sole crops, resulting
in high LER (Zhang and Li, 2003). For instance, phosphorus uptake by maize was
significantly higher in a maize/faba bean intercrop than in sole maize, because organic acids
excreted by faba bean facilitate P uptake by maize in the intercrop (Li et al., 2003). Iron
uptake by peanut was higher in an intercrop with maize than in sole peanut as the maize plants
secrete siderophores that mobilize Fe (Inal et al., 2007). The contribution of facilitation of
nutrient uptake can usually not be disentangled from that of niche complementarity, based on
measurements of productivity and resource uptake (Loreau and Hector, 2001). Therefore, the
effects of facilitation were not addressed specifically in this thesis.
Intercropping has often been reported to suppress pests, diseases, or weeds (Trenbath,
1993). Intercropping, on the one hand, may enhance the abundance of predators and parasites,
which in turn prevent the build-up of pests. On the other hand, the environment and quality of
host plants may be altered in intercropping, which affects the searching behavior and dispersal

General introduction
7
of pest insects and their population growth (Trenbath, 1993; Lithourgidis et al., 2011). A
review of 209 studies containing 287 pest species showed that populations of pest insects in
intercrops were lower compared with sole crop in 52% of studies, and higher in 15% of
studies (Andow, 1991). Intercropping was often reported more successful in weed
suppression than sole cropping which might be attributed to the improved competitive ability
of crop stand towards weeds (Banik et al., 2006). In view of time constrains, I decided to
exclude the effects of the biotic factors (pest, disease and weeds) on intercropping and limit
the study to systems where biotic factors are managed to the point that system performance
can be seen as essentially limited by abiotic factors and their interactions.
Agronomic practices influence intercropsThe stress gradient hypothesis (SGH) states that plant-plant interactions depend on
environmental context, with competitive interactions dominating in favorable environments
but facilitative interactions dominating in unfavorable environments (Brooker et al., 2008; He
et al., 2013). In the context of intercropping, the hypothesis would for instance predict
dominance of competitive interactions at high N input, but potentially greater importance of
beneficial interactions at low N input, e.g. due to complementary N use strategies in mixtures
of legume and non-legume crop species (Patra et al., 1986; Jensen, 1996). Therefore,
application of nitrogen fertilizer might influence the interspecific interactions in intercrops
and as such LER.
Sowing density of component species in intercrops is another key factor determining
intra- and interspecific interactions (Vandermeer, 1992). Increasing density of one species in
an intercrop might increase its productivity, while decreasing productivity of the associated
species (De Wit, 1960; Braakhekke, 1980; Gardiner and Craker, 1981; Fawusi et al., 1982).
As a result, LER as well as the contribution of individual species to LER might be changed by
sowing density of component species in intercrops.
The way of mixing species may also affect species interactions in intercrops. There are
roughly three main intercropping patterns, i.e. strip intercrop, row intercrop and fully mixed
intercrop (Vandermeer, 1992). Mixed intercrops allow maximum interspecific interactions
while strip intercrops minimize interspecific interactions.
In this thesis, the effects of agronomic practices on productivity (Chapters 2 and 3)
and on relative contribution of individual species to productivity of intercrops (Chapter 5)
have been analyzed using meta-analysis.

Chapter 1
8
Statistical approachTwo statistical approaches are adopted in the meta-analysis chapters, i.e. mixed effects
modeling (Chapters 2 and 5) and quantile regression (Chapter 3). I use mixed effects models
to study the expected responses of dependent variables (LER or PLER) to independent
variables (temporal niche differentiation, crop type combination and agronomic practices)
based on data collected from intercropping publications. Random effects are included to
account for the possibility of correlation between data originating from the same experiment
and/or publication (Pinheiro and Bates, 2000; Zuur et al., 2009). Random effects associated
with experiments and publications account for location, year, and study effects that are not
accounted for by the independent variables.
Apart from the variation in LER related to the independent variables mentioned above,
there is still a large unexplained variation in LER. Published studies often do not report
environmental factors related to intercrop performance, such as weather conditions, soil
fertility or other aspects of soil quality. Due to lack of measurements or reporting on these
factors, their effects cannot be quantified and they end up in the scatter of the response
variable. Mixed effects models can only estimate mean responses of dependent variables to
independent variables, while the mean responses are only representative for average
conditions of factors not included in the regression model, and are not necessarily valid for
the entire distribution of the dependent variable. As a result, the sole use of mixed effects
models will only give an incomplete picture of the relationships between dependent- and
independent variables.
In order to get a more complete picture of the relationships between LER and the
independent variables, I use quantile regression (Chapter 3) as a supplement to the analysis
using mixed effects models (Chapter 2). Quantile regression (Koenker and Bassett, 1978) is a
method that allows estimating functional relationships between a dependent variable and one
or more independent variables for all portions (defined by quantiles) of a probability
distribution. Quantile regression provides a more complete picture of possible spread in causal
relationships between variables (Cade and Noon, 2003). The distribution of the regression
curves fitted for different quantiles shows whether relationships between LER and
independent variables depend on factors not included in the regression models.

General introduction
9
Functional structural plant modelling The effect of species type combination (C3/C3 vs C3/C4) on LER is studied using meta-
analysis in Chapters 2 and 3 with data from the intercropping literature. However, in most of
the cases reported in literature, C3/C3 intercrops are combinations of two species with a
similar plant stature, while C3/C4 intercrops are usually short/tall combinations in which the
C3 species is shorter than the C4 species. A combination of short/tall species may result in a
complementary capture of light while a combination of species of different photosynthetic
pathways (C3/C4) is a kind of functional complementarity resulting in more efficient use of
captured light than in C3/C3 intercrops. Both complementarity in space and in plant function
may contribute to the difference of LER between C3/C3 intercrops and C3/C4 intercrops.
Nevertheless it is not possible to disentangle which plant traits (plant stature or photosynthetic
pathway) contribute to the difference in LER between C3/C3 and C3/C4 intercrops using
meta-analysis due to the confounding between plant stature and photosynthetic pathway in the
literature. I hence use functional structural plant (FSP) modelling to investigate how the two
plant traits and variation therein affect intercropping productivity and interspecific
interactions (Chapter 4). FSP modelling is used since (i) it is a powerful tool for investigating
plant-environment and plant-plant interactions (Evers et al., 2010; Bongers et al., 2014), (ii) it
may be applied to explore how plant traits affect complementary use of light in intercrops
(Zhu et al., 2015).
The C3 and C4 photosynthetic pathways differs in many aspects. For simplicity
however , I do not include all differences in the process of photosynthesis that distinguish C3
and C4 photosynthetic pathways. Instead, I focus on a single key factor distinguishing C3 and
C4 photosynthesis, maximum CO2 assimilation rate (Amax) which is the photosynthesis rate
of leaves at light saturation. In this modelling study (Chapter 4), I investigate the effect on
LER of plant stature, Amax, and the interactions between these two and with temporal niche
differentiation.
Outline of the thesisIn this thesis, I aimed to investigate how temporal niche differentiation, crop type
combination as well as agronomic practices affect interspecific interactions and associated
productivity and LER in intercrops. The thesis consists of six chapters: this general
introduction (Chapter 1), four research chapters (Chapters 2 to 5), and a general discussion
(Chapter 6).

Chapter 1
10
In Chapter 2, I focus on temporal niche differentiation and LER in annual intercrops. Using
mixed effects modeling, I evaluate the response of LER to temporal niche differentiation,
demonstrating a positive relationship between LER and temporal niche differentiation in
C3/C4 intercrops but not in C3/C3 intercrops.
In Chapter 3, I also study the effect of temporal niche differentiation on LER, but I use
quantile regression to estimate the relationship for different quantiles of the distribution of
LER. I demonstrate that the relationship between temporal niche differentiation and LER is
robust for all quantiles of LER, indicating the relationship of LER and TND is not affected by
the factors not included in the analysis.
In Chapter 4, I investigate how biomass production in species mixture is affected by
maximum plant height and Amax as well as their interactions with each other and with
temporal niche differentiation. I show how spatial and temporal complementarity in mixed
cultivation systems is strongly determined by maximum plant height and Amax of the
component species.
In Chapter 5, I examine the effects of agronomic practices on interspecific interactions
between component species in cereal/legume intercrops, using meta-analysis. This study
shows how competitive relationships between cereals and legumes are determined by the
interplay between agronomic practices including relative sowing time, relative sowing
density, and nitrogen fertilizer.
In Chapter 6, I integrate results of the research chapters and discuss the implications of the
results for understanding mechanisms of high land use efficiency of intercrops, and deriving
principles for the design of intercropping systems. Besides, I discuss some important aspects
of intercropping including comparison between land use efficiency and productivity,
contribution of intercropping to global food security and mechanization of intercropping.

Chapter 2
Temporal niche differentiation increases the land
equivalent ratio of annual intercrops:
A meta-analysis
Yang Yu1, Tjeerd-Jan Stomph1, David Makowski2,
Wopke van der Werf*1
1Wageningen University, Centre for Crop System Analysis, Droevendaalsesteeg 1,
6708PB Wageningen, the Netherlands2INRA, UMR 211 Agronomie, F-78000 Thiverval Grignon, France
This chapter has been published in Field Crops Research 184: 133-144

Chapter 2
12
Abstract
Sustainable intensification of agriculture is needed to meet higher future food demands while
mitigating agriculture’s ecological footprint. Intercropping is a strategy for increasing agricultural
productivity per unit land that is based on ecological mechanisms for improved resource capture. No
quantitative synthesis has been made on the effect of intercrop system properties and species trait
combinations on intercrop productivity. Here we use meta-analysis of the intercropping literature to
study how the productivity of mixed systems is affected by intercrop system design and species traits.
We focus on the effects of temporal niche differentiation between species, intercropping pattern,
relative densities, the use of C3 and C4 species and the rate of nitrogen fertilizer. Land equivalent ratio
(LER) is used as index for assessing the relative productivity of a mixed system as compared to sole
crops. Average LER was 1.22 ± 0.02, and no differences in LER were found between the 50 most
highly cited studies and a random sample from the literature, indicating that high LERs in highly cited
papers are representative of the entire literature. Temporal niche differentiation contributed
substantially to high LER in systems combining a C3 and C4 species, but not in systems based on C3
species mixtures. The amount of N fertilizer interacted positively with the effect of temporal niche
differentiation on LER. The intercropping literature is dominated by studies on cereal/legume
mixtures. However, the few studies on C3 cereal/C4 cereal mixtures indicate these mixtures have high
LER.
Substantial improvements in land use efficiency in agriculture may be obtained by using
mixtures, particularly C3/C4 mixtures. Thus, enhanced within-field crop diversity can make an
important contribution to sustainable increases in food production.
Keywords: intercropping; land equivalent ratio; meta-analysis; nutrients; temporal niche
differentiation

Temporal niche differentiation increases LER
13
IntroductionIntercropping is the cultivation of two or more crop species simultaneously in the same field
for the whole or a part of their growing period (Willey, 1990; Hauggaard-Nielsen et al.,
2008). Intercrops may use land and other resources more efficiently than sole crops
(Vandermeer, 1992; Zhang and Li, 2003; Lithourgidis et al., 2011) and could achieve food
security with reduced anthropogenic inputs and lower environmental impacts (Brooker et al.,
2015). Intercropping is a practical application of the principle of productivity increase by
biodiversity (Cardinale et al., 2007). An important question is what system and species traits
make intercropping productive. While there is a vast intercropping literature reporting yield
advantages and other benefits of intercropping, little quantitative synthesis has been made.
There is therefore insufficient guidance on how intercropping systems for the future might be
designed.
The ecosystem service of food production in intercrops is often evaluated and
compared to sole crops using the land equivalent ratio (LER). LER is calculated as the sum of
the relative yields of component species in an intercrop as compared to their respective sole
crops. LER may be interpreted as the area of sole crops that would be required to obtain the
same yield or biomass of the component crops as a unit area of intercrop (Mead and Willey,
1980). LER is therefore not strictly an index for productivity but rather for the efficiency of
land use. LER is useful to assess the benefits of intercropping for achieving sustainable yield
increase in agriculture to meet future food demands.
Studies show large variation of LER, because of the wide variety of species
combinations, management practices and environmental conditions. LERs range from well
below one, e.g. 0.77 for wheat/pea (Naudin et al., 2010) to well above one, e.g. 1.83 for
sorghum/groundnut (Harris et al., 1987). To date, no overarching quantitative analysis has
been made of the causes of the variation of LER across systems. The large variability in LER
is therefore unexplained. Insight in the factors responsible for variability of LER is necessary
to select intercropping options for the future.
Here we use meta-analysis (Koricheva et al., 2013) to synthesize information from the
literature, and determine the key system and plant traits affecting LER. In meta-analysis, the
phenomenon of publication bias is well known (Koricheva et al., 2013). Publication bias
occurs if published studies tend to report larger or more significant effect sizes (e.g. the effect
of a treatment) than unpublished studies. Publication bias results in a biased sample of effect
sizes in the literature, and affects the value of meta-analysis. By analogy, here, we

Chapter 2
14
hypothesized that there could also exist a citation bias in the intercropping literature. A
citation bias could arise if authors preferentially cite studies reporting strong effects of
intercropping. To detect such a citation bias, we made a comparative analysis of two datasets:
a dataset with records of the most highly cited studies and an equally large dataset with a
random sample of studies from the remaining intercropping literature. We use sensitivity
analysis and bootstrapping to ascertain that our sample sizes are sufficient to draw robust and
representative conclusions.
In ecological studies, it has been shown that primary production in natural ecosystems
increases with species richness, in part through improved resource capture (Tilman et al.,
1996; Yachi and Loreau, 2007; Cardinale et al., 2012). Greater LER is expected with greater
temporal niche differentiation because it may allow component species to realize a greater
relative yield due to complementary use of resource in time (Li et al., 2013), and relaxed
competition from the other species (Vandermeer, 1992; Li et al., 2001a; Zhang et al., 2008).
Here we study the role of temporal niche differentiation as a result of differences in growing
period between species.
The stress gradient hypothesis (SGH) states that plant-plant interactions depend on
environmental context, with competitive interactions dominating in favorable environments
but facilitative interactions dominating in unfavorable environments (Brooker et al., 2008; He
et al., 2013). In the context of intercropping, the hypothesis would predict dominance of
competitive interactions at high N input, but potentially greater importance of facilitative
interactions at low N input, e.g. due to complementary N use strategies of component crop
species, e.g. a legume and non-legume (Jensen, 1996). Temporal niche differentiation, which
relaxes competitive interactions, may therefore be especially relevant in highly productive
situations, but less so in stressed environments, e.g. due to low nitrogen availability.
However, it is equally possible that temporal niche differentiation would be important when
resources are scarce, i.e. at low N input, to enable to access complementary resources in time.
We therefore investigate the effect of N fertilization on LER and ask the questions whether
the effect of temporal niche differentiation on LER is affected by N fertilizer amount.
Plant growth context in intercrops such as relative density compared to sole crops,
intercropping patterns would also influence intra- and interspecific interactions in
intercropping communities, consequently affecting LER and the effect of temporal niche
differentiation on LER. Hence we study the effects of relative density and intercropping
pattern on LER and the corresponding interactions with temporal niche differentiation.

Temporal niche differentiation increases LER
15
Mixing C3 and C4 species, associated with combinations of different plant traits
(growing season, plant height, photosynthetic mechanisms) is a form of functional
complementarity that might enhance resource capture and LER in intercrops (Cong et al.,
2014, 2015). We therefore study the effect of mixing C3 and C4 species.
In this study, we address three main questions 1) Does LER increase with temporal
niche differentiation? 2) How do different factors influence effect of temporal niche
differentiation on LER? 3) Are the results of highly cited studies consistent with those of a
random sample of the intercropping literature?
Materials and methods
Data collection and extraction from the literatureA literature search was conducted on the Web of Science Core Collection (WoSCC) on 21st
May 2013. We used as search terms: intercrop* OR “mixed crop*” OR “crop mixture*” OR
“mixed cultivation*” OR polyculture in the title. The search yielded 3313 publications. Two
samples from these 3313 publications were analyzed further: a top cited sample and a random
sample (Appendix: Table A1 and Table A2). The top cited sample was made by first ranking
the 3313 publications according to the citations received between 2003 and 2012 and then
screening them one by one until 50 publications had been accumulated that met the inclusion
criteria (Methods A1 and Fig. A1). A second sample of 50 publications was made by simple
random sampling from the entire database, excluding the 50 publications already included in
the top-cited sample (Methods A1 and Fig. A1).
Based on the number of experiments and relevant treatments within experiments in a
publication, multiple data records were extracted from each publication. We coded the
publication and each experiment in order to account for nested random effects during the data
analysis. An experiment was defined by a unique combination of site and year. Treatments
were defined by crop species, sowing dates, fertilizer amount, crop density and intercropping
pattern within an experiment Information of each treatment and that of the corresponding
experiment and publication were extracted (Table 1). Treatments not satisfying the inclusion
criteria on control of disease, pest and weed were excluded. Besides, treatments in which the
density in the intercrop was lower than that of the sole crops (see below, relative density total
RDT<1) were excluded (Methods A2).

Chapter 2
16
Table 1 Variables extracted from publications.Variable Definition Unit
Title Title of publication -
Authors Authors of publication -
Continent Continent where experiments were carried out -
Country Country where experiments were carried out -
Latitude and longitude Latitude and longitude of experimental site Degree
Species Latin name and common name of crop species -
Sowing and harvest date Sowing and harvest date of intercropped species or
information on total period and overlap period of
intercrops to calculate TND
-
C3/C4 Whether one or both crop species are C3 or C4
species (C3/C3, C3/C4, or C4/C4)
-
Legume/non-legume Whether one or both crop species are legume or
non-legume species (non-legume/non-legume,
legume/non-legume, legume/legume)
-
Intercropping pattern In which way the two species were intercropped. -
Strip intercropping: two species cultivated in
alternative strips and at least one strip includes
more than one row;
Row intercropping: two species cultivated in
alternate rows;
Fully mixed intercropping: two species cultivated in
the same field without any distinct row or strip
pattern.
Density of crops Density of each species in sole crops and in
intercrop
plants/ha
Rate of N fertilization Amount of N fertilizer was applied to sole crops
and to intercrops
kg/ha
Yield Grain yield or total biomass in the case of fodder
crops
ton/ha
The sample of 50 top cited publications yielded 87 experiments and 345 data records.
The random sample yielded 102 experiments and 401 data records. Initial analyses were

Temporal niche differentiation increases LER
17
conducted to compare the responses of LER to explanatory variables between the top cited
sample and the random sample with mixed effects models given in Table 2. As initial
analyses showed the two datasets gave very similar results, subsequent analyses were carried
out on the combined sample of 100 publications, 189 experiments, and 746 data records.
These publications appeared from 1978 to 2012.
Response variableIn all analyses, land equivalent ratio (LER) was taken as the response variable. LER is defined
as:
1 2
1 2
LER Y YM M
= + (1)
where Y1 and Y2 are the yields (per unit of total area of the intercrop) of species 1 and 2 in the
intercrop, and M1 and M2 are the yields of the species in sole crops (per unit area of the
respective sole crop).
Explanatory variablesIn the analyses, we use six explanatory variables, i.e. 1) continents, 2) crop type combinations
(categorical with 2 levels: C3/C3 or C3/C4), 3) rate of N fertilization in intercrops
(continuous), 4) intercropping patterns (categorical; 3 levels: mixed, row, strip), 5) relative
density total (continuous; see eq. 2 below) and 6) TND (continuous; eq. 3 below). Values of
the first four variables were directly extracted from publications, while relative density,
relative density total and temporal niche differentiation were calculated.
Rate of N fertilization in intercrops may be different from that in sole crops. A
categorical variable N_code with six levels (Table A4) was defined according to the amount
of N fertilizer applied in an intercrop and the respective sole crops.
Three intercropping patterns are common: fully mixed intercropping, row
intercropping and strip intercropping (Vandermeer, 1992). Mixed intercropping is growing
two or more crops simultaneously with no distinct row arrangement or two crops growing in
the same row; row intercropping is growing two or more crops simultaneously where at least

Chapter 2
18
Table 2 Specification of the models fitted to the data. The indices i, j and k represent publication ID, experiment ID and treatment ID respectively. In all mixed effects models (model 1-12), ai is a random publication effect. bij is a random experiment effect nested within the ith publication. ai and bij are assumed normally distributed with constant variances. εijk is a residual random error assumed normally distributed with constant variance. The variance terms ai, bi j and εij k were all assumed independent. Citation bias was analyzed using a linear model (model 13), relating the number of citations of a study to its average LER. In model 13, εi is a residual random error assumed normally distributed with constant variance.Model Equations
1 LERijk = β0 + β1*TNDijk + a i + b ij + εijk
2 LERijk = β0 + a i + b ij + ε ijk
3 LERijk = β0 + β1*Continenti2 + β2* Continent i
3 + β3* Continent i4 + β4*
Continent i5 + β5* Continent i
6 + a i + b ij + ε ijk
4 LERijk = β0 + β1*C3/C4 ijk + a i + b ij + ε ijk
5 LERijk = β0 + β1* ICpatternijk2+ β2* ICpattern ijk
3 + a i + b ij + ε ijk
6 LERijk = β0 + β1*Nijk + a i + b ij + ε ijk
7 LERijk = β0 + β1*RDT ijk + a i + b ij + εijk
8 LERijk = β0 + β1*TNDijk + β2* C3/C4 ijk + β3*TND ijk* C3/C4 ijk + ai + b ij + ε ijk
9 LERijk = β0 + β1*TNDijk + β2* ICpattern ijk2+ β3*ICpatternijk
3 + a i + b ij + εijk
10 LERijk = β0 + β1*TNDijk + β2* Nijk + β3*TND ijk* Nijk + a i + b ij + ε ijk
11 LERijk = β0 + β1*TNDijk + β2* RDT ijk + ai + b ij + ε ijk
12 LERijk = β0 + β1*TNDijk + β2* Nijk + β3*N_code_2 ijk+ β4*N_code_4 ijk+
β5*TNDijk* Nijk + β6*TNDijk*N_code_2 ijk+ β7*TNDijk*N_code_4 ijk+a i + b ij +
ε ijk
13 Citations i = β0 + β1* LERi + ε i

Temporal niche differentiation increases LER
19
one of the crops is planted in single rows bordered by the other species; strip intercropping is
growing two or more crops simultaneously in different strips. Interactions with the other
species are strongest in the fully mixed intercropping, while interactions with “same” are by
comparison most prevalent in strip intercropping.
Relative density total (RDT) is calculated as the sum of relative densities of
intercropped species as compared to respective sole crops:
sc2,
ic2,
sc1,
ic1,RDTdd
dd
+= (2)
where d1,ic, d2,ic are densities of species 1 and 2, respectively, in the intercrop, and d1,sc and
d2,sc are densities of species 1 and 2, respectively, in sole crops. An RDT equal to 1 indicates
replacement intercropping and a value of 2 indicates fully additive intercropping (density of
the intercrop is the sum of densities of sole crops). A RDT between 1 and 2 is a partially
additive intercropping system, for which we will use the term “augmentative”, as overall
density is augmented as compared to sole crops, but less than the full sum of sole crop
densities. Intercrops with RDT < 1 were excluded from the database.
An index for temporal niche differentiation (TND) was calculated using sowing and
harvesting dates of each species in the intercrop:
system overlap overlap
system system
TND 1P P P
P P−
= = −(3)
where Poverlap represents the period of overlap of the growth period of the intercropped
species, while Psystem represents the duration of the whole intercrop (Fig. 1). This indicator
quantifies the proportion of the total growing period of the intercrop that the two component
species are growing as sole crops (i.e. before sowing or after harvest of the other species). In
theory, TND is zero when both species are sown and harvested at the same time and TND
would be one in the case of double cropping (i.e. the second species is sown after the first is
harvested). Double cropping (i.e. a rotation within one year) is not included in our analysis.

Chapter 2
20
Fig. 1 Illustration of the quantitative characterization of temporal niche differentiation. The upper bar represents the growing period of the first sown species, and the lower bar represents the growing period of the second sown species. The index for temporal niche differentiation, TND, is defined as the proportion of the total system time (Psystem) that component crops grow alone, i.e. don’t overlap (Psystem – Poverlap).
Statistical analysis
Relationships between LER and explanatory variables and the effect of interaction between
TND and co-variables (i.e. C3/C4, intercropping pattern, rate of N fertilization and RDT) on
LER were estimated via mixed effects modelling. Random effects were included to account
for the possibility of correlation between data originating from the same experiment and/or
publication (Pinheiro and Bates, 2000; Zuur et al., 2009). Random effects associated with
experiments and publications account for effects of location, year, and study effects that are
not accounted for by the explanatory variables (fixed effects). Eleven mixed effects models
were fitted to the data of the two samples of publications (model 1-11 in Table 2). Data
records with missing values of a variable were excluded from analyses which required that
variable (Methods A3 and Table A3).
The interaction between TND and rate of N fertilizer might differ between intercrops
that received the same amount of N as the sole crops and intercrops that received a different
amount of N than the sole crops. An analysis was conducted to determine whether the
interaction between TND and rate of N fertilizer is affected by the amount of fertilizer given
to the sole crops. Practices on the comparative amounts of N given to mixed and sole crops
were coded using a categorical variable “N_code” (Table A4 and Methods A4).

Temporal niche differentiation increases LER
21
All analyses were conducted in R (R Core Team, 2013). Mixed effects models were
fitted using the R function lme (R package nlme; (Pinheiro et al., 2013). Model selection was
conducted using the R functions AIC and anova (R package stats; (R Core Team, 2013). The
assumptions of normality and equal variance were checked by quantile plots and plotting
model residuals against fitted values, respectively (Zuur et al., 2009). No violations of
assumptions were found. Figures were made using R packages plotrix and graphics (Lemon,
2006; R Core Team, 2013). In meta-analysis, data are often weighed by their associated level
of precision if standard errors are available. We did not do this because standard errors could
not be estimated with sufficient confidence for many papers, due to lack of information.
Publication bias was evaluated using a funnel plot (Duval and Tweedie, 2000). A
funnel plot is a scatterplot of effect sizes against some measure of their precision (e.g. sample
size or standard error) (Richard, 1984; Koricheva et al., 2013). A symmetrical funnel shape
indicates absence of publication bias (Peters et al., 2008). In this meta-analysis, a funnel plot
of study size against LER of each publication was made to assess publication bias. For the
funnel plot, we used average LER for each study, and we calculated a measure of accuracy,
“study size”, by summing the number of experimental units (replicates) over experiments and
treatments:
,StudySize N_replicatei ijk
j k=∑
where StudySizei is the study size of publication i, N_replicateijk is the number of replicates of
treatment k from experiment j in publication i.
Citation bias was studied in two ways. First, we analyzed the relationship between the
number of citations of a publication and its average LER using an ordinary linear regression
(model 13 in Table 2). Secondly, we compared the cumulative probability distribution of LER
values from the top-cited sample with those from the random sample using the Kolmogorov-
Smirnov test (Pearson and Hartley, 1954; Lilliefors, 1967).
The sufficiency of a sample size of 100 was evaluated by bootstrapping from the
combined sample of 100 publications and the associated 746 data records and constructing
95% confidence intervals for the estimated parameters as a function of sample size (Methods
A5).
Chapter 2
22
Results
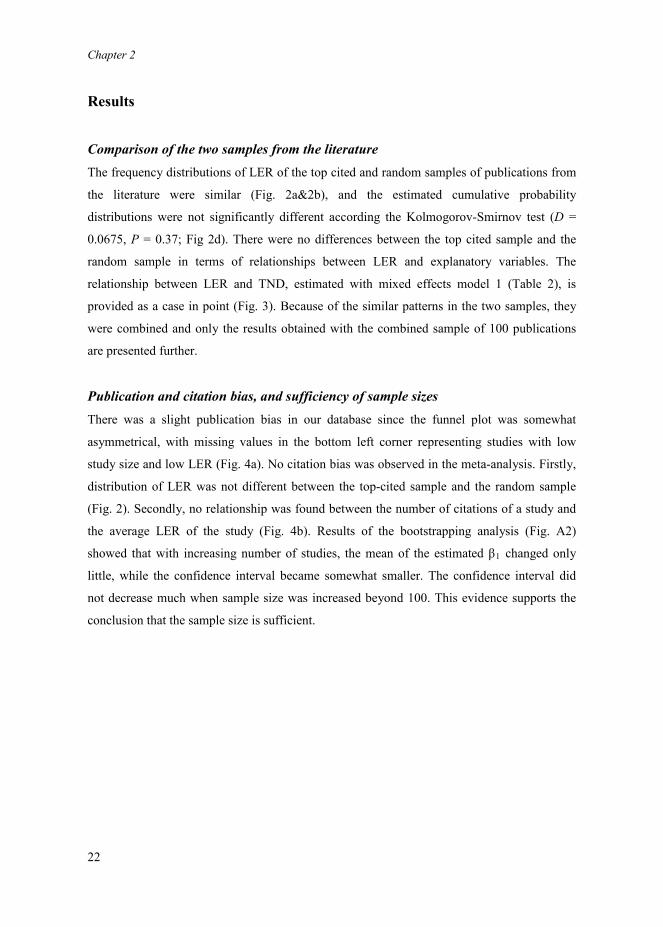
Comparison of the two samples from the literatureThe frequency distributions of LER of the top cited and random samples of publications from
the literature were similar (Fig. 2a&2b), and the estimated cumulative probability
distributions were not significantly different according the Kolmogorov-Smirnov test (D =
0.0675, P = 0.37; Fig 2d). There were no differences between the top cited sample and the
random sample in terms of relationships between LER and explanatory variables. The
relationship between LER and TND, estimated with mixed effects model 1 (Table 2), is
provided as a case in point (Fig. 3). Because of the similar patterns in the two samples, they
were combined and only the results obtained with the combined sample of 100 publications
are presented further.
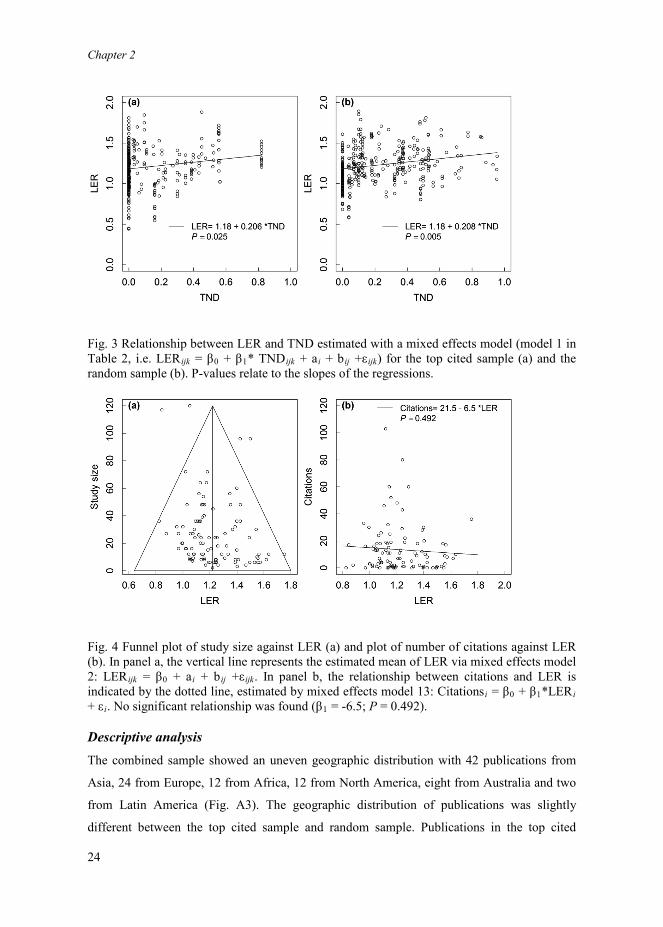
Publication and citation bias, and sufficiency of sample sizesThere was a slight publication bias in our database since the funnel plot was somewhat
asymmetrical, with missing values in the bottom left corner representing studies with low
study size and low LER (Fig. 4a). No citation bias was observed in the meta-analysis. Firstly,
distribution of LER was not different between the top-cited sample and the random sample
(Fig. 2). Secondly, no relationship was found between the number of citations of a study and
the average LER of the study (Fig. 4b). Results of the bootstrapping analysis (Fig. A2)
showed that with increasing number of studies, the mean of the estimated β1 changed only
little, while the confidence interval became somewhat smaller. The confidence interval did
not decrease much when sample size was increased beyond 100. This evidence supports the
conclusion that the sample size is sufficient.

Temporal niche differentiation increases LER
23
Fig. 2 Frequency distribution of LER for the top cited sample (a), the random sample (b) and the combined sample (c), and cumulative probability of LER for the top cited sample and the random sample (d). Vertical lines in panels of frequency distribution (a-c) indicate the first quartile (Q1), median and the third (Q3) quartile of LER. In panel d, D denotes the test statistic belonging to the Kolmogorov-Smirnov test. It represents the greatest difference of cumulative probability between the two samples. The P value indicates the probability of obtaining a value of D equal to or greater than the value found under the null hypothesis of no difference between the samples. The null hypothesis was not rejected.
Chapter 2
24
Fig. 3 Relationship between LER and TND estimated with a mixed effects model (model 1 in Table 2, i.e. LERijk = β0 + β1* TNDijk + ai + bij +εijk) for the top cited sample (a) and the random sample (b). P-values relate to the slopes of the regressions.
Fig. 4 Funnel plot of study size against LER (a) and plot of number of citations against LER (b). In panel a, the vertical line represents the estimated mean of LER via mixed effects model 2: LERijk = β0 + ai + bij +εijk. In panel b, the relationship between citations and LER is indicated by the dotted line, estimated by mixed effects model 13: Citationsi = β0 + β1*LERi+ εi. No significant relationship was found (β1 = -6.5; P = 0.492).
Descriptive analysisThe combined sample showed an uneven geographic distribution with 42 publications from
Asia, 24 from Europe, 12 from Africa, 12 from North America, eight from Australia and two
from Latin America (Fig. A3). The geographic distribution of publications was slightly
different between the top cited sample and random sample. Publications in the top cited

Temporal niche differentiation increases LER
25
sample were mostly from Asia and Europe (15 and 18, respectively, out of 50) and five from
Africa, six from North America and six from Australia. More than half of the publications in
the random sample were from Asia (27 out of 50), while six were from Europe, seven from
Africa, six from the North America, two from Australia and two from Latin America.
There was confounding between continents, species combination and intercropping
pattern. For instance, intercrops in Asia were mostly strip-based, whereas intercrop systems in
Europe were mostly mixed (Fig. 5a). This reflects a difference in purpose: most systems in
Asia consist of two grain crops which are harvested separately for human or animal
consumption, whereas in Europe, many of the tested systems are cereal/legume mixtures
which are harvested as a mixture for animal feed. The frequency of strip, row and mixed
systems in the other continents was intermediate between Asia and Europe. Overall, the
dataset has 301 records on strip-based systems, 191 records on row-based systems and 205
records on mixed systems.
Usage of C4 species in intercrop systems also differed between continents. It was
highly prevalent in Africa, the Americas and Oceania, less common in Asia, and rare in
Europe (Fig. 5b). Overall, the combined dataset has 406 records on C3/C3 intercrops, 338
records on C3/C4 intercrops, and only two records on a C4/C4 intercrop. Intercrops of non-
legume and legume species prevailed in the literature, as 625 out of 746 data records in the
combined sample were non-legume/legume intercrops (Table A5). Out of the 406 C3/C3
records, 312 were a combination of a legume with a non-legume, 63 consisted of non-legumes
only, and 31 records were mixtures of two legumes. Out of 338 records on C3/C4 mixtures,
313 had a legume as the C3 species, and 25 had a non-legume as the C3 species. The vast
majority of C3/C3 intercrops with a single legume were cereal/legume combinations (239 out
of 312). All C3/C4 intercrops with a legume were cereal/legume combinations (313 out of
313). A bias towards cereal-legume systems is true for all of the continents, except Asia,
which has originated studies on a broad range of crop combinations, with cereals mixed with
legumes, other cereals, or further crop species, as well as intercrops of legumes with non-
cereals, e.g. vegetables or sesame (Sesamum indicum L.) (Fig. 5c). Regarding the use of
replacement versus augmentative or fully additive designs, there is little difference between
continents, with overall 301 records on replacement designs, 191 records on augmentative
designs, and 295 records on fully additive designs (Fig. 5d).
The median LER in the whole data set was 1.17, the mean 1.22 ± 0.02 (Fig. 2c). Six
hundred and five LER values (81%) were greater than one, indicating that a large majority of

Chapter 2
26
intercropping systems give higher land use efficiency than sole crops, but a substantial
number of tested systems (19%) did not provide an advantage over sole crops.
As shown in Fig. 6a, LER was significantly higher in Asia than in Europe (model 3,
β1=-0.18, P<0.001), Africa (model 3, β2=-0.12, P=0.03) or Latin America (model 3, β3=-
0.13, P=0.03). No significant difference of LER between any two other continents was
observed.
Fig. 5 Number of data records in the database related to traits of intercrop systems in different continents: intercropping patterns (a), usage of C3/C3, C3/C4 or C4/C4 combinations (b), species combinations in terms of cereals, legumes and other main groups (c) and intercropping designs (d).
LER of C3/C4 intercrops was significantly higher than of C3/C3 intercrops (model 4,
β1=0.12, P<0.001, Fig. 6b). LER of mixed intercrops was lower than of row and strip

Temporal niche differentiation increases LER
27
intercrops while the difference was only significant between mixed and strip intercrops
(model 5, β2=-0.10, P=0.001, Fig. 6c).
No response of LER to rate of N fertilization was found (model 6, β1=0.000315,
P=0.104, Fig. 7a). There was, however, a significantly positive relationship between LER and
RDT, indicating that, overall, LER increases if densities are increased beyond replacement
(model 7, β1=0.162, P<0.001, Fig. 7b).
Fig. 6 Estimated means of LER across continents (a), crop type combinations (b) and intercropping patterns (c). The vertical dotted lines indicate LER equal to 1; the horizontal bars represent 95% confidence interval of estimations.

Chapter 2
28
Fig. 7 Scatter plots of LER against rate of N fertilization (a) and relative density total (b). Relationships between LER and rate of N fertilization and relative density total were estimated by two mixed effects models; model 6: LERijk = β0 + β1*Nijk + ai + bij +εijk and model 7: LERijk = β0 + β1*RDTijk + ai + bij +εijk, respectively. Regression lines, estimated relationships and P values of β1 are presented in each panel.
Effect of TND on LER
Overall effect of TND on LER
We had hypothesized a positive relationship between LER and temporal niche differentiation
due to reduced competition between intercropped species with increased temporal niche
differentiation. Our results indeed showed a positive relationship between LER and temporal
niche differentiation. LER increased by 0.211 units per unit TND (model 1, β1=0.211, P <
0.001, Fig. 8a).
Interaction between effects of TND and other variables on LER
TND had a significant and positive effect on LER in intercrops mixing C3 and C4 species;
LER increased with 0.274 units per unit increase in TND (model 8, β1+ β3=0.274, P= 0
.0019, Fig. 8b). On the contrary, for C3/C3 intercrops, TND had no significant effect on LER
(model 8, β1=0.095, P = 0.214, Fig. 8b).
The effect of TND was consistent across intercropping pattern (no significant
interaction). A model with a common slope for different patterns (model 9, β1=0.21, P<0.001),
showed that LER was significantly lower in mixed intercrops than in strip intercrops (model
9, β3=-0.08, P = 0.0092, Fig. 8c).

Temporal niche differentiation increases LER
29
Fig. 8 Scatter plots and estimated regression lines relating LER to TND and two categorical co-variables, fitted by mixed effects models. Relationship between LER and TND was estimated by model 1: LERijk = β0 + β1* TNDijk + ai + bij +εijk (a); relationship between LER and TND separately for C3/C4 and C3/C3 combinations was estimated by model 8: LERijk =β0 + β1*TNDijk + β2* C3/C4 ijk + β3*TND ijk*C3/C4 ijk + a i + b ij + ε ijk (b); relationship between LER and TND separately for three intercropping patterns was estimated by model 9: LERijk = β0 +β1*TNDijk + β2* ICpatternijk
2+ β3*ICpattern ijk3 + a i + b ij + ε ijk (c). Regression lines, estimated
relationships and P values of slopes are presented in each panel.
The interaction between the effects of TND and rate of N fertilization on LER did not
depend on the relative amounts of fertilizer in the sole crops as compared to the intercrop
(Fig. A4). There was a significant positive interaction between TND and the amount of N
applied to the intercrop, indicating that niche complementarity between a short and a long
season crop with relatively short period of overlap is more fully expressed when high levels of
nutrients are provided. With a baseline effect of TND on LER of 0.227 unit increase of LER
with one unit of TND, every application of 100 kg N/ha increased this effect of temporal
niche differentiation on LER (i.e., the slope of the response of LER to TND) by 0.153 unit

Chapter 2
30
(model 10, β3=0.153, P = 0.013, Fig. 9a). This interaction was mainly due to a decrease in the
intercept value of LER at a TND of zero of 0.09 unit with every application of 100 kg N/ha
(model 10, β2=0.09, P < 0.001, Fig. 9a). In other words: to obtain the same LER at a higher
rate of N fertilizer requires a greater TND. This result is in line with the stress gradient
hypothesis.
No interaction between RDT and TND was found, but the effect of RDT on LER was
significant, irrespective of TND; an increase of one unit of RDT increased LER by 0.16 unit
(model 11, β2=0.16, P < 0.001, Fig. 9b).
Fig. 9 Scatter plots and linear functions relating LER to TND and two continuous co-variables fitted by mixed effects models. Relationship between LER and TND and rate of N fertilization was estimated by model 10: LERijk = β0 + β1*TNDijk + β2* Nijk + β3*TND ijk * Nijk +a i + b ij + ε ijk (a); The relationship between LER and TND and relative density total was estimated by model 11: LERijk = β0 + β1*TNDijk + β2* RDT ijk + a i + b ij + ε ijk (b). The intercepts of equations in panel a show the negative effect of N fertilizer on LER when TND is zero (β2* Nijk); slopes of equations show the combination of the main effect of TND (β1*TNDijk ) and the interaction effect of TND with N fertilizer (β3*TND ijk * Nijk). The regression lines in panel a cross at TND = 0.54, where the effect of N and the interaction of N and TND cancel out (β2* Nijk + β3*TNDijk* Nijk=0, i.e. at TND = -β2/β3). The intercepts of equations in panel b show the positive effect of relative density total on LER (β2* RDT ijk ).
DiscussionThis is the first study showing that temporal niche differentiation is an important factor
determining the land equivalent ratio in intercropping. This response of LER to TND only
held when C3 and C4 species were combined. No significant response was found for C3/C3
combinations. Application of N fertilizer decreased LER when two intercropped species were
sown and harvested simultaneously. Enhancing temporal niche differentiation alleviated the

Temporal niche differentiation increases LER
31
negative effect of N fertilization on LER. Furthermore, we found that LER increased with the
relative density total, but there was no interaction between TND and relative density total. No
interaction between TND and intercropping pattern was found.
Responses of intercrops to temporal niche differentiationIntercrops of an early- and late-maturing species are adopted widely to exploit the length of
the growing season (Lithourgidis et al., 2011) and increase light interception over time
(Keating and Carberry, 1993; Zhang et al., 2008). Such relay intercropping (i.e. intercropping
species with only partial overlap in growing periods) results in higher land use efficiency than
can be achieved with sole crops, as these leave the soil uncovered during part of the growing.
An alternative to relay intercropping would be sowing a second crop after harvest of the first.
The theoretical maximum LER at a temporal niche differentiation approaching 1 would be
1.39 according to our analysis; therefore, if the temperature sum in a region is sufficient,
double cropping would be a better alternative than relay intercropping. This is understandable
as relay intercropping usually leaves part of the land bare during part of the growing season
(e.g. Zhang et al., 2008). However, in many climates, growing a second crop for food is not
possible due to limitations in length of the growing season.
Mechanistic reasons why C3/C4 intercrops respond more strongly to temporal niche
differentiation than C3/C3 mixturesOur statistical analysis shows that LER of C3/C4 intercrops increases with temporal niche
differentiation, whereas the LER of C3/C3 does not respond significantly to TND. One
explanatory factor might be the functional complementarity in terms of stature of the plants.
In our dataset, C4 species are invariably tall cereals (including maize (Zea mays L.), millet
(Pennisetum glaucum (L.) R.Br.), and sorghum (Sorghum bicolor (L.) Moench) while most
C3 species are short by comparison, e.g. wheat (Triticum aestivum L.), soybean (Glycine max
L.) and cowpea (Vigna unguiculata (L.) Walp). Therefore, C3/C3 intercropping is usually a
short/short combination and C3/C4 intercropping is usually a short/tall combination, which
could allow for better complementary light capture in a C3/C4 stand (Ghanbari et al., 2010).
Functional structural plant modelling is a suitable method to explore the relative role in plant
stature in shaping complementary light capture (Zhu et al., 2015). However, there is also a
difference in photosynthesis mechanism and adaptation to higher temperatures as C4 species
are better adapted to warm summer conditions whereas C3 species are better adapted to cool

Chapter 2
32
conditions in early spring (Ehleringer et al., 1997). Thus, the performance of C3/C4 mixtures
may be explained by any combination of the factors stature, photosynthesis mechanism and
temperature response. Our finding only partly confirms the hypothesis of complementary
usage of growth resources in time since only C3/C4 intercrops responded significantly to
temporal niche differentiation. Complementarity in other functional traits (plant stature and/or
photosynthetic mechanism) between intercropped species might be involved in high land use
efficiency in relay intercrop with high temporal niche differentiation.
Effect of intercropping patterns on LERIn the current study, we found that strip intercrops yielded higher LER than mixed intercrops.
This is in part confounded with intercropping design: most strip intercrops in our dataset (179
out of 271) used an additive design, whereas only half of the mixed intercrops (92 out of 205)
had an additive design. Intercrops with an additive design have a higher relative density total
than intercrops with a replacement design and as a result a higher LER (Fig.7b). Hence, on
average, LER of strip intercrops is expected to be higher than that of mixed intercrops.
Dominance of legumes in intercropping studiesThe current dataset, based on combining a set of 50 most highly cited publications and a
random sample of 50 publications was dominated by non-legume/legume intercrops (625 data
records of non-legume/legume out of 726), both for C3/C3 and C3/C4 combinations. An
extension of the database would be required to build a dataset allowing exploration of
differences between legumes and non-legumes in the effects reported here for C3/C3 and
C3/C4 intercrops. Based on the current database, the results largely represent systems with C3
legumes rather than C3 non-legumes.
Interactive effects of N fertilizer and temporal niche differentiationSince our database mainly contains cereal/legume combinations due to their prevalence in the
literature, our finding on response of LER to N fertilizer largely reflects the behavior of
cereal/legume intercrops. It has been observed in both natural ecosystems (He et al., 2013)
and intercropping systems (Li et al., 2013) that facilitative interactions between plants become
less important as growth conditions improve, while competitive interactions become more
important. Cereal/legume combinations are advantageous in low input agricultural systems,
but LER could decrease with increasing application rate of N (Searle et al., 1981; Ofori and

Temporal niche differentiation increases LER
33
Stern, 1986; Ofori and Stern, 1987b; Tobita et al., 1994). Our analysis shows a negative effect
of N fertilization on LER when cereals and legumes are grown simultaneously (TND=0). At
TND=0, an application of 100 kg N/ha decreases LER by 0.09 units. The negative effect of
application of N on LER when TND equals zero could be due to the enhanced interspecific
competition by application of N, and/or the loss of the advantage of nitrogen fixation from air
by the legume. However, the negative effect of N fertilization on LER decreases as temporal
niche differentiation between intercropped species increases. This finding is in agreement
with the stress gradient hypothesis. When conditions are good (high N), competition is strong,
and high LER is achieved by allowing temporal niche differentiation to mitigate strong
competition. On the other hand, when nutrients are limiting (0 or low N), the effect of
temporal niche differentiation on LER was not as strong as at high nutrient levels.
Learning from nature for future intercrop designResults of this meta-analysis inform the design of intercropping systems that are adapted to
future needs, with high productivity and high efficiency (Shen et al., 2013). Temporal niche
differentiation is relevant in places where the growing season is too short for double cropping
due to limitations of temperature but long enough for more than one crop, and with sufficient
water. A C3/C4 intercrop with a large separation of growing period could then have high land
use efficiency.
Other ecosystem services from intercropping
Intercropping can provide ecosystem services beyond food production including the
suppression of pests and diseases (Andow, 1991; Trenbath, 1993), the suppression of weeds
(Ayeni et al., 1984; Liebman and Dyck, 1993; Banik et al., 2006), and an increase in the
retention of organic soil carbon and nitrogen (Cong et al., 2015). Intercropping as an
agricultural strategy could therefore contribute to sustainable intensification of agriculture
(Tilman et al., 2011; Bedoussac et al., 2015; Jensen et al., 2015).
Future research needsWe found that most intercropping research focusses on cereal/legume combinations;
nevertheless, cereal/cereal intercropping systems tended to have higher land equivalent ratios
than cereal/legume systems although not significantly (results not shown) probably due to
lack of data on cereal/cereal combinations in our database (13 vs 552 data records for

Chapter 2
34
cereal/cereal and cereal/legume, respectively,). Only a couple of cereal/cereal intercropping
systems have been studied in China and proved advantageous (Li et al., 2001a; Li et al.,
2001b; Yang et al., 2011; Gao et al., 2014). Additional studies on cereal/cereal intercrops are
needed to determine whether it can succeed in other places besides China. Such studies are of
great importance because cereal production is one of the cornerstones of food security. If
cereal/cereal intercrops prove more efficient in land use than sole crops in more ecological
conditions around the world, it could greatly contribute to future food security, and provide
important options for sustainable yield increase.
Appendix AMethods A1 Inclusion criteria and procedure of paper selection and data extraction
Methods A2 Inclusion criteria for treatments of the 100 publications
Methods A3 Missing variables of data records in the random sample
Methods A4 Analysis of the interaction between TND and amount of N fertilization for three
common strategies for supplying N in intercropping experiments
Methods A5 Bootstrapping strategy for testing sufficiency of a sample size of 100
publications
Methods A6 Reference list of the 100 publications used in this meta-analysis
Fig. A1 Paper selection procedure for the top cited publications and the random sample
Fig. A2 Bootstrap estimates and confidence intervals for β1, estimated via mixed effects
modelling
Fig. A3 World map with experimental sites
Fig. A4 Scatter plots and linear models relating LER to TND and N for three common
strategies for supplying N in intercropping experiments
Table A1 List of the 50 publications in the top cited sample
Table A2 List of the 50 publications in the random sample
Table A3 Availability of information on selected variables in data sets of the random sample.
Table A4 Coding system for the strategy for N supply in intercropping experiments
Table A5 Contingency table for frequency of intercrops without a legume, or with one or two
legumes in the case of C3/C3, C3/C4 and C4/C4 species combinations in the intercrop

Temporal niche differentiation increases LER
35
AcknowledgementsFinancial support by the China Scholarship Council (File No. 2011635011) and the Key Sino-
Dutch Joint Research Project of NSFC (grant number: 31210103906) are gratefully
acknowledged.


Chapter 3
Robust increases of land equivalent ratio with temporal
niche differentiation: A meta-analysis
with quantile regression
Yang Yu1, David Makowski2, Tjeerd-Jan Stomph1,
Wopke van der Werf*1
1Wageningen University, Centre for Crop System Analysis, Droevendaalsesteeg 1,
6708PB Wageningen, the Netherlands2INRA, UMR 211 Agronomie, F-78000 Thiverval Grignon, France

Chapter 3
38
Abstract Intercropping has been proven more productive than sole crops in many studies, but large variation in
land equivalent ratio (LER) among studies has been observed. Here we used quantile regression to
estimate, for different parts of the LER distribution, the effect of temporal niche differentiation (TND)
and its interaction with other key characteristics of intercropping systems, using data extracted from
the intercropping literature. Quantile regression not only estimates the median response, but also other
quantiles of the distribution of response. This method therefore gives a holistic view of the response.
LER increased with temporal niche differentiation and the effect of TND was significant for
all tested quantiles. Response of LER to TND was significantly stronger for C3/C4 intercrops than for
C3/C3 intercrops, but only at lower LER (quantiles below 20%). At higher quantiles of LER, no
significant difference was found between C3/C3 and C3/C4 mixtures. There was a negative effect of N
fertilizer on LER in the absence of temporal niche differentiation for all tested quantiles. At lower
LER (corresponding to quantiles < 30%), this negative effect was alleviated by increasing temporal
niche differentiation. There was a significant interaction between intercropping pattern (strip or row)
and TND at higher LER only (quantile ≥ 65%). The analysis of interaction between intercropping
pattern and TND did not include data of fully mixed intercrops, since most fully mixed intercrops had
TND equal to zero (165 out of 205). The interaction between TND and relative density total was only
significant at low to median LER (25% ≤ quantile ≤ 55%).
The results indicate that temporal niche differentiation has a robust positive effect on LER
over a wide range of LER values, but the strength of this effect was influenced by intercrop
characteristics, especially at low to median LER values.
Keywords: intercropping, land equivalent ratio, temporal niche differentiation, meta-analysis, quantile
regression

Robust increases of LER with temporal niche differentiation
39
IntroductionIntercropping is the cultivation of two or more crop species simultaneously in the same field
(Ofori and Stern, 1987a; Vandermeer, 1992; Lithourgidis et al., 2011). It is an ancient
agronomic practice which is still adopted by smallholder farmers in developing countries.
Many advantages of intercrops have been reported, such as yield advantage (e.g. Ofori and
Stern, 1986; Mei et al., 2012), suppression of pests and diseases (Trenbath, 1993),
suppression of weeds (Ayeni et al., 1984) and retention of soil organic carbon and nitrogen
(Cong et al., 2015). Intercropping has the potential for ecological and sustainable
intensification of agriculture since intercropping is able to produce more food on limited
arable land while exerting less impact on the environment than sole crops due to better
exploitation of ecological mechanisms (Bedoussac et al., 2015; Jensen et al., 2015).
Yield advantage of intercrops is normally assessed by the land equivalent ratio (LER),
defined as the sum of relative yields of the component crops. LER is interpreted as the relative
land area required by sole crops to produce the same yields as achieved by a unit area of
intercrop (Mead and Willey, 1980). Large variation of LER among studies has been observed
(Yu et al., 2015). Many factors could contribute to the variation of LER, including crop
species combination, fertilization, planting densities, etc. Yu et al. (2015) synthesized
information from the literature and concluded that LER increases with temporal niche
differentiation in intercrops that combine a C3 and a C4 species. LER was also found to
increase with relative density total of intercrops. In general, there is no effect of N fertilization
on LER (Pelzer et al., 2014) while a negative N effect is observed when intercropped species
are sown and harvested simultaneously (Yu et al., 2015).
Apart from the variation of LER that can be related to the factors studied by Pelzer et
al. (2014) and Yu et al. (2015), there is still large unexplained variation in LER.
Environmental factors related to intercrop performance may not be reported, e.g. weather
conditions, soil fertility or soil quality. As these factors are unmeasured, their effects on LER
cannot be quantified and they end up in the scatter of the response variable. So far, the
unexplained LER variability resulting from these unmeasured factors was not taken into
account in published statistical analyses of LER data. Besides, statistical methods such as
linear regression and mixed effects models were commonly used to estimate mean responses
of LER to one or several explanatory variables (e.g. Yu et al., 2015). The mean responses
fitted by these standard methods are only representative for average conditions of factors not
included in the regression model, and are not necessarily valid for the entire distribution of the

Chapter 3
40
response variable. Responses of LER to explanatory variables might be modified by those
factors not included in the regression models. It is well known in ecology that the relationship
between a response variable and an explanatory variable could be stronger in the upper part of
the response variable distribution and weaker in the lower part in case of interactions between
the explanatory variable and one or several unmeasured factors (Cade, 1999; Cade and Noon,
2003). By focusing on the mean response, classic regression methods may give an incomplete
picture of the relationships between LER and explanatory variables.
Quantile regression (Koenker and Bassett, 1978) is a method that allows estimating
functional relationships between a response variable and one or more explanatory variables
for all portions (defined by quantiles) of a probability distribution and provides a more
complete picture of possible spread in causal relationships between variables (Cade and Noon,
2003). The distribution of the regression curves fitted for different quantiles indicates whether
the relationship between the response variable and the explanatory variable depends on
factors not included in the regression model. At a given value of an explanatory variable in a
given regression model, the variability of the response variable across quantiles is due to these
missing factors. Quantile regression has already been applied in ecology and agriculture to
investigate relationships between variables for different conditional quantiles (Cade et al.,
1999; Cade and Noon, 2003; Makowski et al., 2007; Casagrande et al., 2010; Hossard et al.,
2014).
The objective of this paper is to further extend the meta-analysis of Yu et al. (2015) by
studying the robustness of the relationship between LER and temporal niche differentiation
and assess how the effect of temporal niche differentiation on LER is changed by crop type
combination, rate of N fertilization, intercropping pattern and relative density total for
different quantiles of the distribution of LER.
Materials and methods
Data collection and extraction from the literatureWe use the dataset of 100 intercropping publications described in detail by Yu et al. (2015).
Literature was searched from the Web of Science Core Collection (WoSCC) on 21 May 2013
with the intercropping related terms: intercrop* OR “mixed crop*” OR “crop mixture*” OR
“mixed cultivation*” OR polyculture in the title. The 100 publications (Appendix Table B1
and A2) yielded 189 experiments and 746 data records. An experiment was defined by a

Robust increases of LER with temporal niche differentiation
41
unique combination of site and year. A data record consisted of identifiers for the publication
and the experiment, and values specifying all relevant inputs, outputs and co-variables (Table
B1). Not all data records did include all information on co-variables so there were some
missing values for rate of N fertilization, intercropping patterns and relative density total
(Table B2).
Response and explanatory variablesLand equivalent ratio (LER) was used as response variable. LER is defined as:
1 2
1 2
LER Y YM M
= + (1)
where Y1 and Y2 are the yields (per unit of total area of the intercrop) of species 1 and 2 in the
intercrop, and M1 and M2 are the yields of the species in sole crops (per unit area of the
respective sole crop).
We used five explanatory variables in the current study, i.c. crop type combination
(categorical variable, two levels: C3/C3 or C3/C4), intercropping pattern (categorical variable,
three levels: strip, row or mixed intercrops), rate of nitrogen fertilization (continuous variable,
in kg ha-1), relative density total (continuous variable; see eq. 2 below) and TND (continuous
variable; see eq. 3 below).
The rate of N fertilizer in intercrops is not necessarily the same as in sole crops. Six
experimental strategies of N fertilizer rate were distinguished. In strategy 1 (n = 339 data
records), the fertilizer rate is the same in all treatments, both in the intercrop and the sole
crops. In strategy 2 (n = 67), the fertilizer rate in the intercrop is intermediate between rates
applied in the two sole crops, while N rate in the sole crops are different according to sole
crop demand. In the remaining strategies, the N rate in the intercrops is (i) equal to the lowest
of the sole crop fertilizer rate (strategy 3: n = 67), (ii) equal to the greatest of the sole crop
fertilizer rate (strategy 4: n = 109), (iii) greater than the greatest of the sole crop fertilizer rate
(strategy 5: n = 4) or (iv) smaller than the lowest of the sole crop fertilizer rate (strategy 6: n =
6).
Relative density total (RDT) is calculated as the sum of relative densities of
intercropped species as compared to the sole crops:
sc2,
ic2,
sc1,
ic1,RDTdd
dd
+= (2)

Chapter 3
42
where d1,ic, and d2,ic are densities of species 1 and 2, respectively, in the intercrop, and d1,sc
and d2,sc are densities of species 1 and 2, respectively, in the sole crops.
An index for temporal niche differentiation (TND) was calculated using sowing and
harvest dates of each species in the intercrop (Yu et al., 2015):
system
overlap
system
overlapsystem 1TNDpp
ppp
−=−
= (3)
where poverlap represents the period of overlap of the growth period of the intercropped
species, i.e. from sowing of the late sown species till harvest of the early sown species, while
psystem represents the duration of the whole intercrop, i.e. from sowing of the early sown
species till harvest of the late sown species. This indicator quantifies the proportion of the
total growing period of the intercrop that the two component species are growing as sole crops
(i.e. before sowing of the second sown species and after harvest of the first harvested species).
Statistical analysisQuantile regression was used to determine the relationship between LER and TND for
different quantiles (corresponding to probabilities ranging from 0.1 to 0.9 with increments of
0.05). The same approach was used to analyze the effects of interactions between TND and
any of the other four explanatory variables (crop type combination, rate of N fertilization,
intercropping pattern, and relative density total) on LER.
When only one explanatory variable is considered, say X, the τth quantile of Y is
related to X by QY(τ|X) = β0(τ) + β1(τ)*X, where β0(τ) and β1(τ) are the regression parameters
for the τth quantile. When two variables are included in the regression, QY(τ|X) = β0(τ) +
β1(τ)*X1 + β2(τ)*X2, where β0(τ), β1(τ), and β2(τ) are the regression parameters and X is now
a vector of variables. The conditional quantile QY(τ|X) is the inverse of the cumulative
distribution function of the response variable LER (noted Y), and is defined such that P[Y <
QY(τ|X)] = τ, where τ is a probability (τ ∈ [0,1]) (Cade et al., 1999). A range of conditional
quantiles is defined here by selecting different values for τ (0.1, 0.15, 0.2, ..., 0.85, 0.9). For
example, QY(τ|X) represents the median if τ = 0.5 and represents the 1st quartile if τ = 0.25.
The estimates of quantile regression are semiparametric since no parametric
distributional form is assumed for the random residual error of the model, while a parametric
form is assumed for the deterministic part of the model (Cade and Noon, 2003). Five types of
quantile regression models (Table 1) were fitted to data using the function rq of the package
quantreg (Koenker, 2015) in R (R Core Team, 2013). We used 17 different values of τ (0.1,

Robust increases of LER with temporal niche differentiation
43
0.15, …, 0.85, 0.9). Figures were made via R package graphics (R Core Team, 2013). A 95%
confidence interval was computed for each parameter estimate using the R function rq.
The interaction between TND and rate of N fertilizer might depend on the strategy of
N fertilization. We therefore analyzed the interaction between TND and rate of N fertilization
using two different datasets, one dataset with all data records reporting the rate of N fertilizer,
irrespective of the N fertilizer strategy, and a subset with only the data of N strategy 1 which
is the main strategy in the dataset (Fig. B1).
The interaction between TND and intercropping patterns was analyzed using a subset
of the dataset including strip and row intercrops but excluding mixed intercrops. As most
mixed intercrops had TND equal to zero, the effect of TND on LER could not be estimated
with sufficient accuracy for mixed intercrops.
Results
Effect of TND on LER (model 1)LER increased with TND across all tested quantiles of LER (Fig. 1). The effect of TND on
LER (parameter β1(τ) of model 1) was always significant (p < 0.05) and varied from 0.2 to
0.3 units of LER per unit of TND across quantiles (Fig. 2b). The intercept of model 1, i.e. the
LER at a TND of zero, increased with the quantile and became significantly greater than 1
when the quantile exceeded 0.3 (Fig. 2a).
Interaction between TND and the crop type combination (model 2)LER increased with TND in both C3/C3 and C3/C4 intercrops (Fig. 3; Fig. 4b and d). The
estimated slope of the effect of TND on LER ranged from 0.15 to 0.28 for C3/C3 intercrops
(parameter β1(τ) of model 2) and from 0.2 to 0.5 for C3/C4 intercrops (β1(τ) + β3 (τ)) (Fig. 4b
and d). The response of LER to TND was stronger for C3/C4 intercrops, especially at lower
quantiles. At τ ≤ 0.2, the effect of TND on LER was significantly higher for C3/C4 than for
C3/C3, while at higher quantiles no significant difference was found between C3/C3 and
C3/C4 intercrops (Fig. 4b and d). Both crop type combinations led to similar estimates for
β0(τ), the value of LER at TND = 0, but the estimated values were slightly lower for C3/C4
mixtures at τ ≤ 0.3 and slightly higher for C3/C4 at τ > 0.3 (Fig. 4a and c). In both crop type
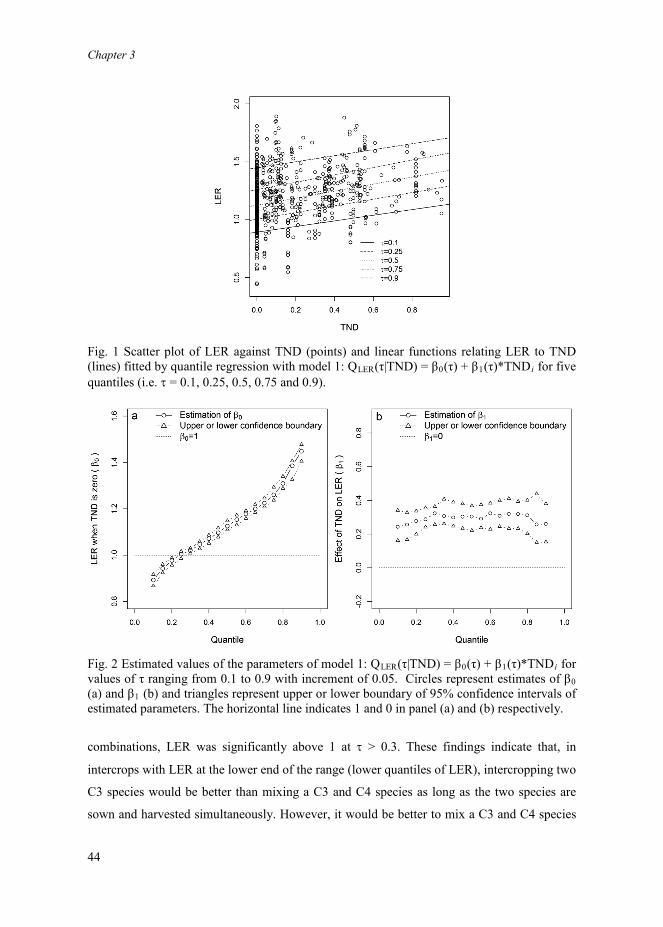
Chapter 3
44
Fig. 1 Scatter plot of LER against TND (points) and linear functions relating LER to TND (lines) fitted by quantile regression with model 1: QLER(τ|TND) = β0(τ) + β1(τ)*TNDi for five quantiles (i.e. τ = 0.1, 0.25, 0.5, 0.75 and 0.9).
Fig. 2 Estimated values of the parameters of model 1: QLER(τ|TND) = β0(τ) + β1(τ)*TNDi for values of τ ranging from 0.1 to 0.9 with increment of 0.05. Circles represent estimates of β0(a) and β1 (b) and triangles represent upper or lower boundary of 95% confidence intervals of estimated parameters. The horizontal line indicates 1 and 0 in panel (a) and (b) respectively.
combinations, LER was significantly above 1 at τ > 0.3. These findings indicate that, in
intercrops with LER at the lower end of the range (lower quantiles of LER), intercropping two
C3 species would be better than mixing a C3 and C4 species as long as the two species are
sown and harvested simultaneously. However, it would be better to mix a C3 and C4 species

Robust increases of LER with temporal niche differentiation
45
if there is a difference in growing period. In intercrops with comparatively high LER given
the observed variables (higher quantiles of LER), intercrops of C3 and C4 species would be
recommended irrespective of the degree of temporal niche differentiation.
Interaction between TND and N fertilization (model 3)LER increased with TND when the rate of N fertilizer was zero; the estimated value of β1
ranged from 0.11 to 0.45 from quantile 0.1 to quantile 0.9 (Fig. 5b). The effect of N fertilizer
amount on LER (all quantiles) was negative when TND was zero (significant at most
quantiles: τ = 0.1, 0.15, 0.25, 0.4, 0.45, 0.7, 0.75, 0.85 and 0.9) (Fig. 5c). Interaction between
TND and N fertilizer dose was positive at most of the tested quantiles, but was significant
only at low quantiles values (τ < 0.3) (Fig. 5d). This positive interaction shows that the
negative effect of N fertilizer on LER was alleviated by reducing overlap of growing period
between intercropped species. When both TND and rate of N fertilizer were zero, LER was
significantly greater than one at most quantiles (τ > 0.2) (Fig. 5a).
Fig. 3 Scatter plots of LER against TND (points) and linear functions (lines) relating LER to TND for C3/C3 (a) and C3/C4 intercrops (b) fitted by quantile regression with model 2: QLER(τ|TND and C3/C4) = β0(τ) + β1(τ)*TNDi + β2(τ)*C3/C4i + β3 (τ)*TNDi*C3/C4i for five quantiles (i.e. τ = 0.1, 0.25, 0.5, 0.75 and 0.9).

Chapter 3
46
Fig. 4 Estimated values of parameters of model 2: QLER(τ|TND and C3/C4) = β0(τ) + β1(τ)*TNDi + β2(τ)*C3/C4i + β3(τ)*TNDi*C3/C4i for values of τ ranging from 0.1 to 0.9 with increment of 0.05. Circles represent estimates of β0 (a), β1 (b), β0 + β2 (c) and β1 + β3(d) and triangles represent upper or lower boundary of 95% confidence intervals of estimated parameter values. The horizontal line indicates 1 in panel a and c, and 0 in panel b and d, respectively.
Interaction between TND and intercropping pattern (model 4)TND had a positive effect on LER in both strip and row intercrops (Fig. 6b and d). In strip
intercrops, the TND effect decreased with quantile, ranging from 0 to 0.25 units of LER per
unit of TND (Fig. 6b). In row intercrops, the effect of TND was stronger at the higher
quantiles of LER, ranging from 0.22 to 0.62 (Fig. 6d). The largest estimate of the TND effect
(β1(τ) + β3(τ)) on LER was found at τ = 0.75. Thus, the strength of the positive response of

Robust increases of LER with temporal niche differentiation
47
LER to TND increased with quantile in row intercrops, but decreased with quantile in strip
intercrops, indicating that other factors than TND that increase LER in row intercrops interact
positively with TND, whereas factors that increase LER in strip intercrops interact negatively
with TND.
Fig. 5 Estimated values of parameters of model 3: QLER(τ|TND and N) = β0(τ) + β1 (τ)*TNDi+ β2(τ)*Ni + β3(τ)*TND i *Ni for values of τ ranging from 0.1 to 0.9 with increment of 0.05. Circles represent estimates of β0 (a), β1 (b), β2 (c) and β3 (d) and triangles represent upper or lower boundary of 95% confidence intervals of estimated values. The horizontal line indicates 1 in panel a and c, and 0 in panel b and d, respectively.

Chapter 3
48
Fig. 6 Estimated values of parameters of model 4: QLER(τ|TND and ICpattern) = β0(τ) + β1(τ)*TNDi + β2(τ)*ICpatterni
1 + β3(τ)*TNDi*ICpatterni1 for values of τ ranging from 0.1 to
0.9 with increment of 0.05. Circles represent estimates of β0 (a), β1 (b), β0 + β2 (c) and β1 +β3 (d) and triangles represent upper or lower boundary of 95% confidence intervals of estimated values. The horizontal line indicates 1 in panel a and c, and 0 in panel b and d, respectively.
Interaction between TND and RDT (model 5)LER increased with RDT when TND was zero at all tested quantiles, with only one exception
(τ = 0.1) (Fig. 7c). The value of β2 increased from 0 to 0.26 with quantiles increasing from 0.1
to 0.35, and varied from 0.2 to 0.25 at quantiles between 0.4 and 0.8, increasing again with
quantile to reach a maximum value of 0.31 at τ = 0.9 (Fig. 7c). The interaction between TND
and RDT was negative at almost all tested quantiles. However, this interaction was significant
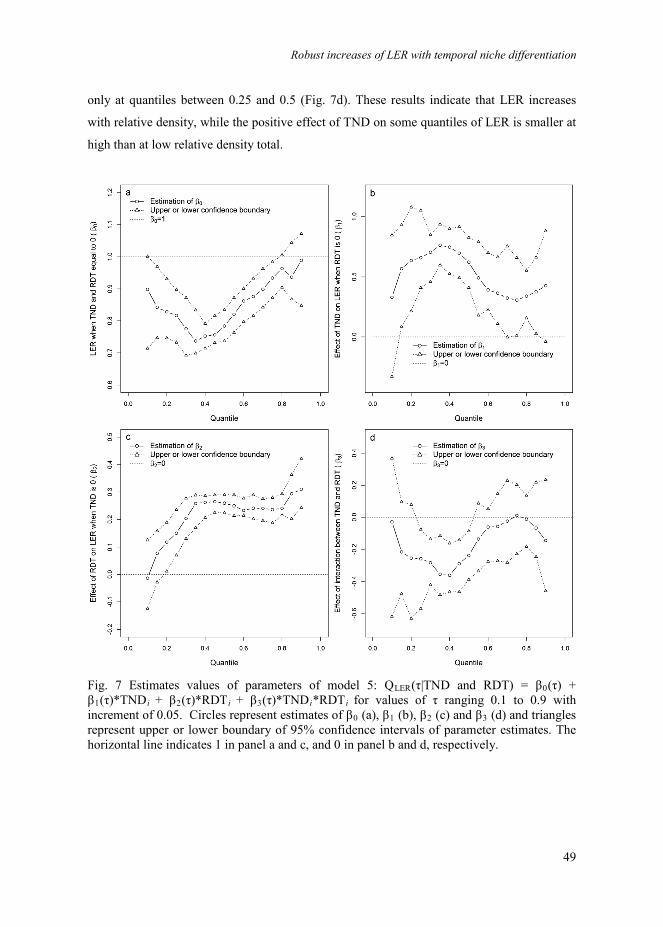
Robust increases of LER with temporal niche differentiation
49
only at quantiles between 0.25 and 0.5 (Fig. 7d). These results indicate that LER increases
with relative density, while the positive effect of TND on some quantiles of LER is smaller at
high than at low relative density total.
Fig. 7 Estimates values of parameters of model 5: QLER(τ|TND and RDT) = β0(τ) + β1(τ)*TNDi + β2(τ)*RDTi + β3(τ)*TNDi*RDTi for values of τ ranging 0.1 to 0.9 with increment of 0.05. Circles represent estimates of β0 (a), β1 (b), β2 (c) and β3 (d) and triangles represent upper or lower boundary of 95% confidence intervals of parameter estimates. The horizontal line indicates 1 in panel a and c, and 0 in panel b and d, respectively.

Chapter 3
50
DiscussionThis study explored the effect of temporal niche differentiation on LER and its interaction
with crop type combination, rate of N fertilization, intercropping pattern and relative density
total at different quantiles of the LER distribution. The positive effect of temporal niche
differentiation on LER held across all tested quantiles, but interactions with other variables
modified the general picture. The response of LER to TND was stronger for C3/C4 as
compared to C3/C3 intercrops only at low quantiles. Increasing the rate of N fertilizer
decreased LER in the absence of temporal niche differentiation at all tested quantiles. This
negative effect of N fertilization on LER was alleviated by increasing TND, but only at lower
quantiles of LER (τ < 0.3). Effects of TND on LER decreased with quantile in strip intercrops
but increased with quantile in row intercrops. In other words, the positive effect of TND on
LER in strip intercrops interacts negatively with factors that increase LER but are not
included in the regression model. In contrast, in row intercrops, the response of LER to TND
interacts positively with the factors not included in the model. Increasing relative density total
reduced the positive effect of temporal niche differentiation on LER, especially in intercrops
with a low to median LER.
Effect of TND on LER for C3/C3 and C3/C4 The current study gives a more complete picture of the interaction between TND and crop
type combinations than the previous study by Yu et al. (2015). We show here that if LER of
an intercrop would be low due to some unknown/unmeasured factors or factors not included
in the regression model, the LER is greater in C3/C3 intercrops than in C3/C4 intercrops, if
the two species are sown and harvested simultaneously. However, if LER is comparatively
low (lower quantiles) while the growing season would allow temporal niche differentiation
between the intercropped species, it would be better to combine a C3 and C4 species.
However, in intercrops with high LER, we show that a C3/C4 intercrop is better in terms of
land use efficiency than a C3/C3 intercrop, irrespective of temporal niche differentiation.
Effect of interaction between rate of N fertilization and TND on LERA negative effect of N fertilizer on LER has been reported in many studies (e.g. Ofori and
Stern, 1986; Ofori and Stern, 1987b; Tobita et al., 1994). Nevertheless, one recent meta-
analysis by Pelzer et al. (2014) found no evidence for an effect of N fertilizer on LER, while
another meta-analysis by Yu et al. (2015) found a negative effect of N fertilizer on LER when

Robust increases of LER with temporal niche differentiation
51
intercropped species are sown and harvested simultaneously. In the current study, we show
that LER decreases with N fertilizer amount in the absence of temporal niche differentiation
which is consistent with Yu et al. (2015). This negative effect could be alleviated by
increasing temporal niche differentiation between intercropped species (Yu et al., 2015). The
negative nitrogen effect thus only holds when there is little or no temporal niche
differentiation. However, we also found that the positive interaction between TND and the
rate of N fertilizer only holds at lower quantiles (τ ≤ 0.25). In other words, only for intercrops
of low LER, e.g. conditions where competition between species dominates, the negative effect
of N fertilization on LER can be alleviated by having temporal niche differentiation, while for
intercrops with high LER, e.g. conditions where facilitative or complementary interactions
dominate, the negative effect of N fertilization is little affected by temporal niche
differentiation.
Quantile regression In standard linear regression and in mixed effects model, estimates of parameters in a
regression model only represent the relationship between the mean of a response variable and
the chosen explanatory variable(s). Such a regression represents the mean condition of
factors that are not included in the regression model. However, the relationship between the
response variable and explanatory variable(s) may interact with these factors not included in
the regression model. Factors not included in the model cause variation of the response
variable at given values of explanatory variables. Quantile regression provides us an
opportunity to analyze relationship between variables for different portions of the response
variable instead of only focusing on relationship between conditional means of the response
and explanatory variables (Koenker and Bassett, 1978; Cade et al., 1999; Koenker and
Hallock, 2001). In other words, quantile regression is capable of analyzing the interaction
effect between factors included in a regression model and those not included in the structural
part of the model but only in the distribution of the error.
This study is fundamentally different from the previous meta-analysis conducted by
Yu et al. (2015). In the current study, we asked how the response of LER to temporal niche
differentiation changes across different quantiles of the distribution of LER. We show that the
effect of temporal niche differentiation on LER is robust and is valid for all quantiles, not only
for the mean response.

Chapter 3
52
A disadvantage of using the rq function to conduct quantile regression is that it does
not account for nested error structures. In quantile regression, all data records are assumed to
be independent. This is a simplification. As a result of this simplification, degrees of freedom
are increased, which could lower p-values, while random errors associated with nesting are
pooled into an overall error term, which could lower the power of the analysis. In the study by
Yu et al. (2015), mixed effects models were used to analyze the causal relationships between
LER and intercropping characteristics, considering correlations between data from the same
experiment and study by taking experiment and study as random effects. Results of both
methods are valuable. The study by Yu et al. (2015) showed us a general picture of
relationships between LER and intercropping characteristics while the current study reveals a
fuller picture of the causal relationships. The reader may focus on consistency and trends in
significance in these two studies. Both of the studies show similar trends for the effect of
temporal niche differentiation on LER, confirming that temporal niche differentiation is an
important factor for increasing LER of annual intercrops. We found interactions between
temporal niche differentiation and crop type combinations (C3/C3 vs C3/C4) or N rate in both
studies, indicating crop type combination and N rate are two key factors modifying the effect
of temporal niche differentiation on LER.
Appendix BFig. B1 Estimates of interactive effect between TND and rate of N fertilizer with two
datasets: one dataset with all data reporting N rate, irrespective of N strategies and one subset
with only the data of N strategy 1 which is the main N strategy in the database
Table B1 Variables extracted from publications
Table B2 Availability of information on selected variables in data set for this meta-analysis
AcknowledgementsThe financial support by China Scholarship Council (File No. 2011635011) and Key Sino-
Dutch Joint Research Project of NSFC (grant number: 31210103906) are gratefully
acknowledged.

Chapter 4
Plant traits drive spatially and temporally complementary
light capture, photosynthesis, and
productivity in plant mixtures
Yang Yu1, Jorad de Vries1, Tjeerd-Jan Stomph1, Jochem B. Evers1,
Niels P. R. Anten1, Lizhen Zhang2, Wopke van der Werf*1
1Wageningen University, Centre for Crop System Analysis, Droevendaalsesteeg 1,
6708PB Wageningen, the Netherlands2China Agricultural University, College of Resources and Environmental Sciences,
Beijing, 100193, China

Chapter 4
54
Abstract Species richness tends to positively affect primary production in natural and agricultural ecosystems,
an effect that is often strongly determined by spatial and temporal niche differentiation between
species. Niche differentiation in turn is associated with variation in plant traits but the extent of this
mediating effect has rarely been quantified.
Here, we use a functional-structural plant (FSP) model to explore the effect of temporal niche
differences on biomass production of early- and late-emerging plants in an agricultural plant species
mixture. This model contains the feedback between light absorption, photosynthesis, and the
emergence of plant structure and biomass in species mixtures under different conditions of spatial and
temporal arrangement. We quantify how the productivity of mixtures of an early-emerging tillering
plant type with a late-emerging non-tillering plant type is affected by plant traits, i.c. the maximum
plant height and rate of CO2 assimilation (Amax), of the later emerging species, in an interplay with the
spatial configuration of the mixture and the relative times of sowing of the two plant types.
Biomass of the early-emerging plants increased with later sowing of the late-emerging plants,
reaching a plateau when the temporal overlap between the growth durations of the early- and late-
emerging plants was less than 50% of the total growing period of the mixture. Productivity of the late-
emerging plants suffered from competition for light with the early-emerging plants, especially at
moderate delays in sowing time compared to the early-emerging plants and when the spatial
configuration of the mixture allowed strong interaction. Maximum plant height of the late-emerging
plants did not qualitatively affect its response to sowing time. The negative effect of the early-
emerging plants on the late-emerging ones decreased when the Amax of the latter sown species was
higher.
These results show how spatial and temporal complementarity (sowing pattern and sowing
date) in mixed cultivation systems is strongly determined by the traits of the component species. FSP
modelling is a useful tool to disentangle these interactions, and to help design productive intercrop
systems that maximize complementarity and minimize the effects of competition.
Key words: temporal niche difference, plant height, maximum rate of CO2 assimilate, FSP modelling,
relative yield total, relative yield
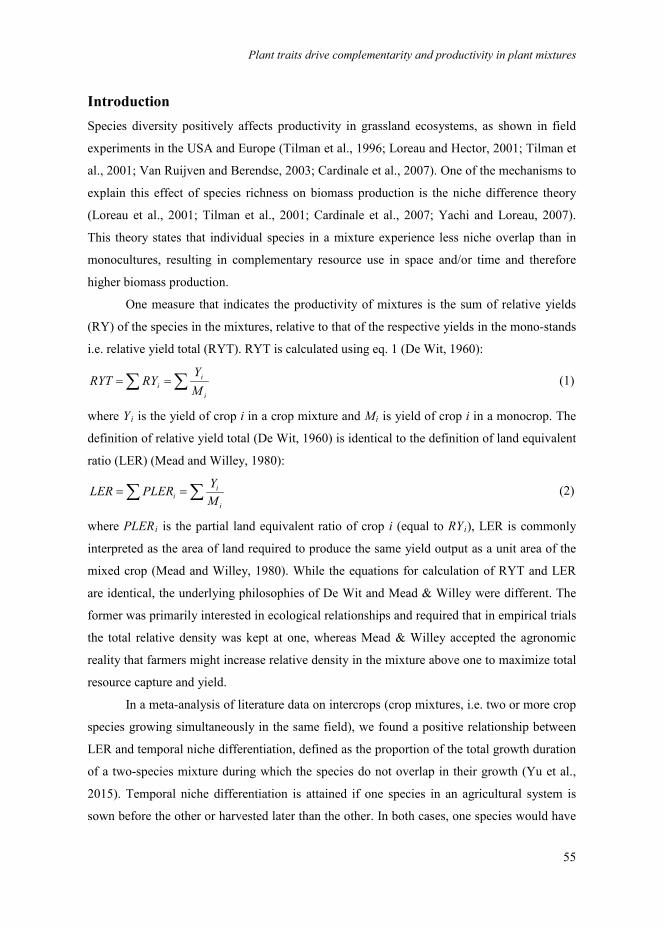
Plant traits drive complementarity and productivity in plant mixtures
55
Introduction Species diversity positively affects productivity in grassland ecosystems, as shown in field
experiments in the USA and Europe (Tilman et al., 1996; Loreau and Hector, 2001; Tilman et
al., 2001; Van Ruijven and Berendse, 2003; Cardinale et al., 2007). One of the mechanisms to
explain this effect of species richness on biomass production is the niche difference theory
(Loreau et al., 2001; Tilman et al., 2001; Cardinale et al., 2007; Yachi and Loreau, 2007).
This theory states that individual species in a mixture experience less niche overlap than in
monocultures, resulting in complementary resource use in space and/or time and therefore
higher biomass production.
One measure that indicates the productivity of mixtures is the sum of relative yields
(RY) of the species in the mixtures, relative to that of the respective yields in the mono-stands
i.e. relative yield total (RYT). RYT is calculated using eq. 1 (De Wit, 1960):
∑∑ ==i
ii M
YRYRYT (1)
where Yi is the yield of crop i in a crop mixture and Mi is yield of crop i in a monocrop. The
definition of relative yield total (De Wit, 1960) is identical to the definition of land equivalent
ratio (LER) (Mead and Willey, 1980):
∑ ∑==i
ii M
YPLERLER (2)
where PLERi is the partial land equivalent ratio of crop i (equal to RYi), LER is commonly
interpreted as the area of land required to produce the same yield output as a unit area of the
mixed crop (Mead and Willey, 1980). While the equations for calculation of RYT and LER
are identical, the underlying philosophies of De Wit and Mead & Willey were different. The
former was primarily interested in ecological relationships and required that in empirical trials
the total relative density was kept at one, whereas Mead & Willey accepted the agronomic
reality that farmers might increase relative density in the mixture above one to maximize total
resource capture and yield.
In a meta-analysis of literature data on intercrops (crop mixtures, i.e. two or more crop
species growing simultaneously in the same field), we found a positive relationship between
LER and temporal niche differentiation, defined as the proportion of the total growth duration
of a two-species mixture during which the species do not overlap in their growth (Yu et al.,
2015). Temporal niche differentiation is attained if one species in an agricultural system is
sown before the other or harvested later than the other. In both cases, one species would have

Chapter 4
56
all the resources to itself for part of the growing season, allowing an increase in its relative
yield that would not directly go at the expense of the other species, as this species is not
present at the same time. Under niche differentiation theory, complementary use of light has
been suggested as one possible reason for the positive effect of species diversity on
productivity of ecosystems (Naeem et al., 1994). However, it is not clear how performance of
individual species would be affected by increasing temporal niche differentiation resulting in
changed light conditions for the species in the mixtures in interaction with the species traits.
A positive effect of temporal niche differentiation on LER was found in mixtures with
plants of C3 and C4 photosynthetic pathways (C3/C4 mixtures) but not in C3/C3 mixtures
(Yu et al., 2015). C3/C3 mixtures were usually combinations of two short-stature species,
while C3/C4 mixtures entailed combinations of a short C3 and a tall C4 species. In C3/C4
mixtures, it is very common that a C3 species is sown earlier than a C4 species. Normally, a
late-sown tall C4 species is shaded by the early-sown short C3 species during its early growth,
while it will overgrow the short C3 species at a later time (Fan et al., 2006; Zhu et al., 2014)
and thereafter may recover from the early stress (Li et al., 2001a). Similar patterns can be
observed in many natural grasslands where short C3 species dominate in spring and are
gradually replaced by taller C4 grasses (Turner and Knapp, 1996; Anten and Hirose, 1999). A
mixture of a C3 species (early and short) with a C4 species (late and tall) might have a better
light capture as compared to short/short C3 mixtures (Anten and Hirose, 1999), as the early
short species may dominate the light capture in early season while the late tall species would
recover when it overgrows the short species and dominates in late season, achieving a
complementary light capture in both time and space.
C4 species have higher maximum photosynthesis rates than C3 species (Connor et al.,
2011) and this photosynthetic capacity, Amax is one of the key factors distinguishing C3 and
C4 photosynthesis (Lövenstein et al., 1995; Lambers et al., 2008; Connor et al., 2011). A
mixture of a C3 and a C4 species may have high light use efficiency especially if the species
with the higher photosynthetic rate (C4) captures most of the light (high in the canopy), while
the species with the lower rate of photosynthesis (C3) is better adapted to lower light
conditions (Anten and Hirose, 2003). Such functional complementarity would further
strengthen productivity increase arising from greater light capture due to differences in
growth period (temporal complementarity).
However, to our knowledge few studies have quantitatively assessed the contribution
of interspecific variation in individual traits to niche differentiation. Thus the question
Plant traits drive complementarity and productivity in plant mixtures
57
remains to what extent different responses of LER to temporal niche differentiation between
C3/C3 and C3/C4 mixtures can be attributed to variation in maximum plant height and
associated complementarity in light capture or variation in leaf photosynthesis and associated
complementarity in light-use.
The current study has two objectives. Firstly we investigate how productivity of
individual species in mixtures is affected by temporal niche differentiation. We expected that
in a mixed cropping system, an early-sown species may profit from temporal niche
differentiation because of the delayed sowing of the other species resulting in relaxed
competition for light. Therefore, biomass production of the early-sown species is expected to
increase with temporal niche differentiation, until a point at which sowing of the late-sown
species has little effect on the early-sown one; after that point, biomass production of the
early-sown species is not affected by further increasing temporal niche differentiation.
Conversely, performance of the late-sown species is expected to decrease as its sowing is
delayed and the competitiveness of the early-sown species increases. Therefore, biomass
production of the late-sown species might decrease with temporal niche differentiation.
However, from a certain time onward (the recovery point), later sowing of the late species
which also implies that its growth duration extends beyond the harvesting time of the early
species, will allow the late species to recover during its late growth and suffer less
competitive impact from the early species.
Secondly, we assess the effect of the maximum plant height and photosynthesis rate
(Amax) of the late-sown plant type on the temporally complementary use of light and the
productivity of the mixture. A taller late-sown plant type may suffer less competition from the
presence of early-sown plants because it can grow out of the shade more rapidly and reach the
recovery point earlier. Therefore, we expect a smaller biomass reduction in a taller late-sown
plant type than a shorter late-sown plant type. A taller late-sown plant type is furthermore
likely to be a stronger competitor versus the early-sown plants than a shorter late-sown plant
type. We hence expect that biomass production of the early-sown plants is lower in mixtures
with the tall late-sown plant type than with the short late-sown plant type. We may expect that
a late-sown plant type with a high Amax would suffer less growth reduction as a result of
competition from the early plants than a plant type with a low Amax because of its greater
photosynthesis, biomass accumulation and resulting length growth, which should allow it to
grow out of the shade more rapidly. Thus, the recovery of a high Amax plant type is expected
to be faster than that of a low Amax plant type.
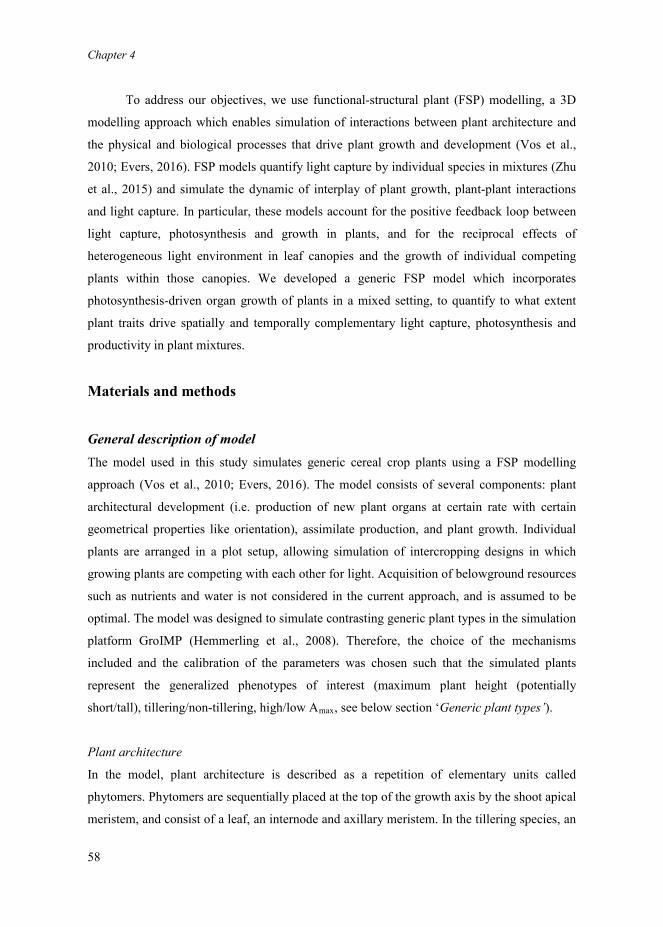
Chapter 4
58
To address our objectives, we use functional-structural plant (FSP) modelling, a 3D
modelling approach which enables simulation of interactions between plant architecture and
the physical and biological processes that drive plant growth and development (Vos et al.,
2010; Evers, 2016). FSP models quantify light capture by individual species in mixtures (Zhu
et al., 2015) and simulate the dynamic of interplay of plant growth, plant-plant interactions
and light capture. In particular, these models account for the positive feedback loop between
light capture, photosynthesis and growth in plants, and for the reciprocal effects of
heterogeneous light environment in leaf canopies and the growth of individual competing
plants within those canopies. We developed a generic FSP model which incorporates
photosynthesis-driven organ growth of plants in a mixed setting, to quantify to what extent
plant traits drive spatially and temporally complementary light capture, photosynthesis and
productivity in plant mixtures.
Materials and methods
General description of model The model used in this study simulates generic cereal crop plants using a FSP modelling
approach (Vos et al., 2010; Evers, 2016). The model consists of several components: plant
architectural development (i.e. production of new plant organs at certain rate with certain
geometrical properties like orientation), assimilate production, and plant growth. Individual
plants are arranged in a plot setup, allowing simulation of intercropping designs in which
growing plants are competing with each other for light. Acquisition of belowground resources
such as nutrients and water is not considered in the current approach, and is assumed to be
optimal. The model was designed to simulate contrasting generic plant types in the simulation
platform GroIMP (Hemmerling et al., 2008). Therefore, the choice of the mechanisms
included and the calibration of the parameters was chosen such that the simulated plants
represent the generalized phenotypes of interest (maximum plant height (potentially
short/tall), tillering/non-tillering, high/low Amax, see below section ‘Generic plant types’).
Plant architecture
In the model, plant architecture is described as a repetition of elementary units called
phytomers. Phytomers are sequentially placed at the top of the growth axis by the shoot apical
meristem, and consist of a leaf, an internode and axillary meristem. In the tillering species, an

Plant traits drive complementarity and productivity in plant mixtures
59
axillary meristem develops into a bud and grows into a tiller only if the assimilate status of
the plant is favorable. After having produced a fixed number of vegetative phytomers, the
plant goes to its generative stage and the meristems produce an inflorescence after which no
further new organs will be produced on the shoot. The inflorescence subsequently acts as a
carbon sink. Individual grains are not considered. The root system architecture is not taken
into account, but the root does act as a carbon sink (see below section ‘Plant growth’).
Assimilate production
The light capture of the organs in the canopy (leaves, internodes) is calculated using the
Monte Carlo pathtracer embedded in GroIMP; for details see Hemmerling et al. (2008). Light
sources are set up in a hemispherical configuration providing both direct and diffuse light
(Evers et al., 2010). Using reflectance and transmittance coefficients, the amount of
photosynthetically active radiation (PAR) absorbed by each individual leaf is calculated.
Subsequently, leaf photosynthesis rate is determined using a light response curve relating
absorbed PAR to photosynthesis rate. Distribution of photosynthetic capacity in the canopy is
approximated by making organ maximum CO2 assimilate rate (Amax) dependent on the
fraction of radiation absorbed by the organ using an established relationship between the two
(Niinemets and Anten, 2009). The acquired assimilates by every organ are stored in a central
carbon pool from which costs of respiration and growth are deducted each time step; the
remainder is used for plant growth.
Plant growth
Sink strength of all organ types (leaf, internode, root system, inflorescence) in the model is
defined as the potential capacity of the organ for biomass accumulation, and described by the
beta growth function in relation to organ age (Yin et al., 2003). When assimilates are plentiful
all organs have their demand satisfied, resulting in growth matching the sink strength. When
assimilates are limiting they are distributed based on the relative sink strengths of the organs,
i.e. the fraction of organ sink strength in the total plant sink strength (Heuvelink, 1996). This
means that there is no hierarchy among organs for the allocation of assimilates under limiting
conditions, and all organs are allocated the same percentage of demand. When the plant goes
into the generative stage a large new sink emerges (the inflorescence), which strongly reduces
the biomass allocation towards leaves and internodes, reducing their growth rate. Similarly, a
change in sink strength of an internode through shade avoidance (see below section ‘Shade

Chapter 4
60
avoidance’) will affect plant growth by potentially lowering allocation to leaves and therefore
reducing photosynthetic gain. The effects of source-sink dynamics on plant growth is the
main driving mechanism in the model.
Shade avoidance
Shade avoidance in response to reductions in the red/far-red ratio (R:FR) of the light absorbed
was added to make the plants respond plastically to the presence or absence or growth
dynamics of a neighboring plant (Bongers et al., 2014). Plants generally absorb red light but
scatter far-red light, and the change in R:FR is used to assess neighbor presence and perform
shade avoidance responses such as increased stem elongation (Smith, 1982). The model uses
separate reflectance and transmittance coefficients for red and far-red to calculate the
absorption and scattering of light in both wavebands by the organs in the canopy. When the
observed whole-plant R:FR (average R:FR values perceived by its organs) drops below a
threshold (the same for all plant types used) the modelled plant initiates shade avoidance by
increasing stem elongation (Franklin and Whitelam, 2005) in all plant types and by initiating
tiller abortion (Sparkes et al., 2006; Evers et al., 2007) in the tillering plant type. Increased
stem elongation is achieved by increasing internode sink strength, thereby increasing the
demand for assimilates. Tiller abortion is performed during a juvenile stage only, before the
start of stem extension of the main stem.
Generic plant types Five generic plant types were defined. For the first-emerging (sown) plant, we use a short
tillering and low Amax plant type (called “tillering type” from here on). This plant type
broadly represents small grain cereal species which are commonly the first sown-species in
relay-intercrops (but without attempting to represent any species in particular), and could be
easily adapted to represent early season tillering grasses. The other four plant types do not
tiller and are collectively called “non-tillering types”. They are potentially either short or tall,
and they have either a low or high maximum rate of photosynthesis. This plant type can
represents a tall non-tillering cereal (e.g. maize or sorghum), again without the aim to
represent any species in particular. The four types of the non-tillering species are: (1) short &
low Amax, (2) short & high Amax, (3) tall & low Amax, and (4) tall and high Amax. The
qualification of plant height as short or low reflects a potential because plant height is plastic.
The maximum plant height was controlled by parameterization of the sink strength of the

Plant traits drive complementarity and productivity in plant mixtures
61
internodes. If their demand is always fully met, plant height will reach its maximum. If the
demand is not fully met, due to competition, height will be less than the maximum. Tillering
ability, maximum height and photosynthesis rate were the only plant traits that were varied in
this study. Key parameters determining features of each plant type are listed in Table 1, and
the expressions of features of plant types in monoculture are listed in Table 2.
In order to keep the analysis tangible, we fixed the traits of the early-emerging plants
and only varied the type of the late-emerging plants, though noting that analysis could be
extended in the future to include variation of plant traits in the early-emerging plants. The
tillering plant type with low Amax was used as the early-emerging plants in the simulation
studies, while the other four were used as the late-emerging plants to explore the plant height
× Amax interaction with temporal niche differentiation and spatial configuration in the system
as a whole.
Table 1 Key parameters determining features of each plant type. The parameter Tillerdetermines whether a plant is a tillering type or not. Amax determines the photosynthetic capacity of a plant type. Sink strength of internode determines the maximum height of a plant. Growth period indicate the total life cycle of a plant type.Parameters Tillering Short&low
Amax
Short&high Amax
Tall&low Amax
Tall&high Amax
Tiller Yes No No No NoAmax (μmol/m2/s) 25 25 57 25 57Sink strength of internode(mg/internode)
150 3000 3000 6000 6000
Growth period (simulation days)
150 150 150 150 150
Table 2 The realized plant traits in mono-stand. Biomass represents the total aboveground biomass of a plant type at ‘harvest’ (simulation day 150). Maximum height is the maximum height a plant type can achieve. Maximum leaf area index is the leaf area per unit land area when the plant canopy is closed.Features Tillering Short&low
Amax
Short&high Amax
Tall&low Amax Tall&high Amax
Biomass in monoculture (ton/ha)
~15 ~20 ~30 ~18 ~30
Maximum height (m)
~1.0 ~1.0 ~1.0 ~1.8 ~2.0
Maximum leaf area index
~5.0 ~5.0 ~5.0 ~5.0 ~5.0

Chapter 4
62
Modelling assumptionsOur study focuses on the interaction between temporal niche differentiation and a set of plant
functional traits, therefore we simplified the effects of abiotic conditions. Firstly, we did not
implement a relationship between photosynthetic rate and temperature in our model.
Therefore, leaf photosynthetic rate here was only a function of light absorption and the
position of a leaf in the canopy. Second, a constant daily radiation was used (~18 MJ/m2/day)
throughout our simulations, and the seasonal variation of solar radiation and temperature was
not considered. Third, we assume no constraint of water or nutrients on plant growth. In other
words, light is the only limiting factor for plant growth.
Layout of the simulated scenes for monocultures and mixturesAll of the five plant types were simulated in both monocultures and mixtures. In plots of
monoculture, the tillering plant type was sown at a density of 160 plants/m2 with inter-plant
and inter-row distances of 0.05 and 0.125 m, respectively, while the non-tillering plant type
was sown at a density of 10.26 plants/m2 and inter-plant and inter-row distances of 0.13 and
0.75 m, respectively. Species mixtures were designed based on the replacement principle (De
Wit and van den Bergh, 1965) using a strip pattern, i.e. two species growing in alternative
strips (Vandermeer, 1992; Zhang et al., 2007). There were four kinds of intercrop in this
study, each with the early-emerging tillering plant type intercropped with one of the four late-
emerging non-tillering plant types. Two configurations were adopted for every intercrop to
vary the intimacy of the spatial species association in the intercrops and its effect on the
strength of interaction: every six rows of the early crop intercropped with either one
(Configuration I) row or two (Configuration II) rows of the late crop (Fig. 1). In
Configuration I, a row of the late-emerging species is bordered on both sides by a row of the
early-emerging species, while in Configuration II, a row of the late-emerging species is
bordered on only one side by the first-emerging species. Thus, the opportunity for
interspecific competition effects on the late-emerging species is greater in Configuration I. On
the other hand, the opportunity for interspecific competition effects on the first plant type is
somewhat diminished in Configuration I, because the six rows of this plant type are
interacting with only one row of the late-emerging plant type on either side, versus 2 rows of
the late-emerging plant type in Configuration II. In plots of the intercrop, the inter-plant and
inter-row distances within a plant type were the same as in the monoculture, while the
distance between strips of different plant types was set to 0.4375 m, i.e. equal to the mean

Plant traits drive complementarity and productivity in plant mixtures
63
Fig. 1 Configurations of monocultures and mixtures. Monocultures of the tillering plant type (a) were simulated with inter-plant and inter-row distance of 0.05 and 0.125 m, respectively. Monoculture of the non-tillering plant types (b) were simulated with inter-plant and inter-row distance of 0.13 and 0.75 m, respetively. In Configuration I of mixtures, every 6 rows of the tillering plant type were mixed with 1 row of the non-tillering plant type (c), with a distance of 0.4375 m between strips of tillering and non-tillering plant types. The inter-plant and inter-row distance of each plant type was the same as the respective monocultures. In Configuration I, the relative density of the tillering and non-tillering plant types is 0.5, respectively. In Configuration II of mixtures, every 6 rows of the tillering plant type were mixed with 2 rows of the non-tillering plant type (d). The relative density of the tillering and non-tillering plant types is 0.33 and 0.67, respectively. Distances between plants, rows and strips in Configuration II were the same as in Configuration I. The red box indicates the number of plants simulated in each scence and the blue box indicates the number of plants used for data analyses.
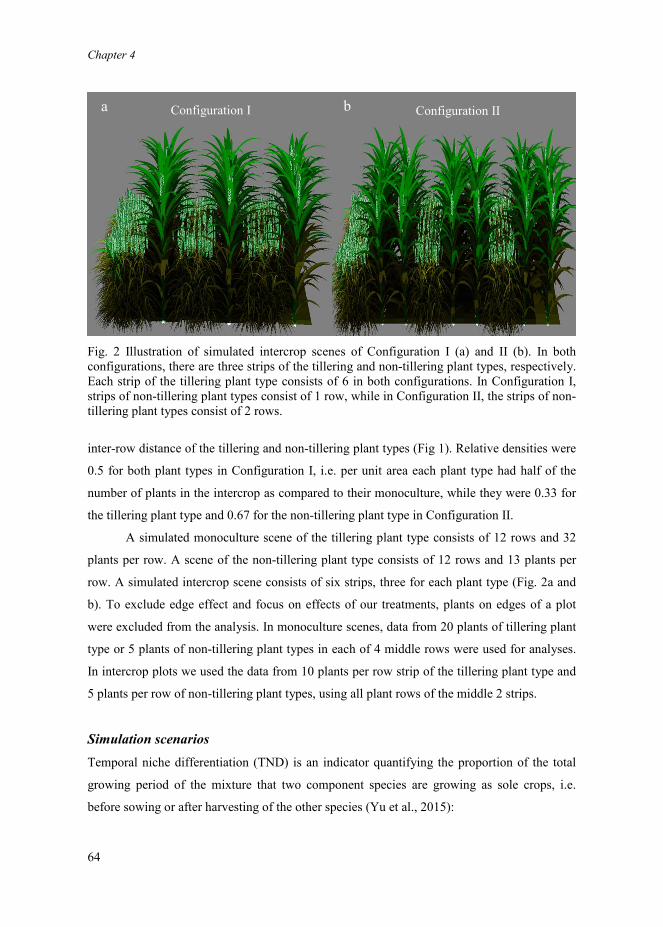
Chapter 4
64
Fig. 2 Illustration of simulated intercrop scenes of Configuration I (a) and II (b). In both configurations, there are three strips of the tillering and non-tillering plant types, respectively. Each strip of the tillering plant type consists of 6 in both configurations. In Configuration I, strips of non-tillering plant types consist of 1 row, while in Configuration II, the strips of non-tillering plant types consist of 2 rows.
inter-row distance of the tillering and non-tillering plant types (Fig 1). Relative densities were
0.5 for both plant types in Configuration I, i.e. per unit area each plant type had half of the
number of plants in the intercrop as compared to their monoculture, while they were 0.33 for
the tillering plant type and 0.67 for the non-tillering plant type in Configuration II.
A simulated monoculture scene of the tillering plant type consists of 12 rows and 32
plants per row. A scene of the non-tillering plant type consists of 12 rows and 13 plants per
row. A simulated intercrop scene consists of six strips, three for each plant type (Fig. 2a and
b). To exclude edge effect and focus on effects of our treatments, plants on edges of a plot
were excluded from the analysis. In monoculture scenes, data from 20 plants of tillering plant
type or 5 plants of non-tillering plant types in each of 4 middle rows were used for analyses.
In intercrop plots we used the data from 10 plants per row strip of the tillering plant type and
5 plants per row of non-tillering plant types, using all plant rows of the middle 2 strips.
Simulation scenariosTemporal niche differentiation (TND) is an indicator quantifying the proportion of the total
growing period of the mixture that two component species are growing as sole crops, i.e.
before sowing or after harvesting of the other species (Yu et al., 2015):
a bConfiguration I Configuration II
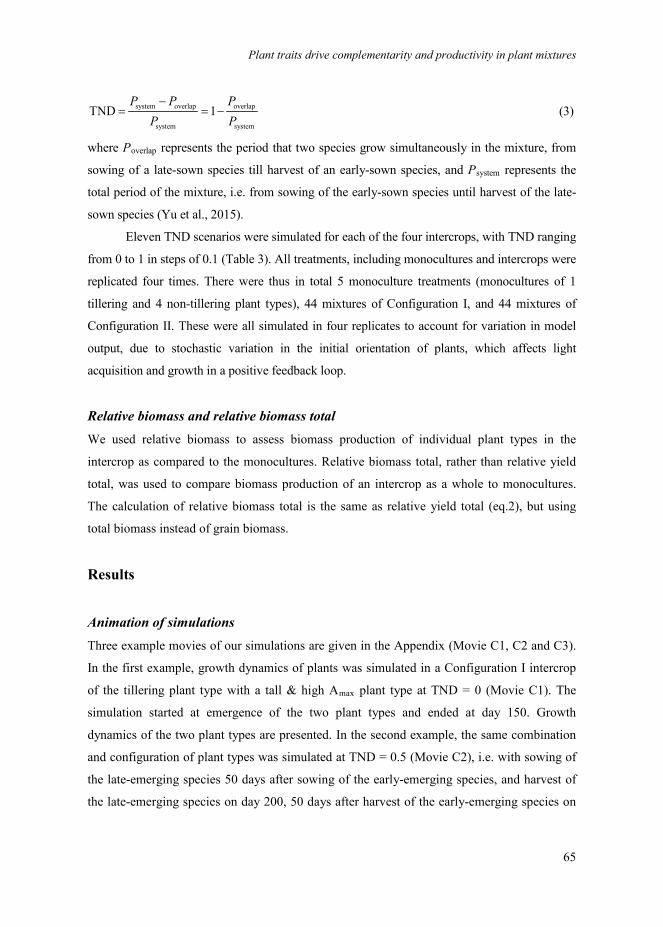
Plant traits drive complementarity and productivity in plant mixtures
65
system overlap overlap
system system
TND 1P P P
P P−
= = − (3)
where Poverlap represents the period that two species grow simultaneously in the mixture, from
sowing of a late-sown species till harvest of an early-sown species, and Psystem represents the
total period of the mixture, i.e. from sowing of the early-sown species until harvest of the late-
sown species (Yu et al., 2015).
Eleven TND scenarios were simulated for each of the four intercrops, with TND ranging
from 0 to 1 in steps of 0.1 (Table 3). All treatments, including monocultures and intercrops were
replicated four times. There were thus in total 5 monoculture treatments (monocultures of 1
tillering and 4 non-tillering plant types), 44 mixtures of Configuration I, and 44 mixtures of
Configuration II. These were all simulated in four replicates to account for variation in model
output, due to stochastic variation in the initial orientation of plants, which affects light
acquisition and growth in a positive feedback loop.
Relative biomass and relative biomass totalWe used relative biomass to assess biomass production of individual plant types in the
intercrop as compared to the monocultures. Relative biomass total, rather than relative yield
total, was used to compare biomass production of an intercrop as a whole to monocultures.
The calculation of relative biomass total is the same as relative yield total (eq.2), but using
total biomass instead of grain biomass.
Results
Animation of simulationsThree example movies of our simulations are given in the Appendix (Movie C1, C2 and C3).
In the first example, growth dynamics of plants was simulated in a Configuration I intercrop
of the tillering plant type with a tall & high Amax plant type at TND = 0 (Movie C1). The
simulation started at emergence of the two plant types and ended at day 150. Growth
dynamics of the two plant types are presented. In the second example, the same combination
and configuration of plant types was simulated at TND = 0.5 (Movie C2), i.e. with sowing of
the late-emerging species 50 days after sowing of the early-emerging species, and harvest of
the late-emerging species on day 200, 50 days after harvest of the early-emerging species on

Chapter 4
66
day 150. The third example shows the same plant type mixture at TND = 0.5 in Configuration
II (Movie C3).
Relative biomass of early emerging plants (tillering plant type) in Configuration IIn Configuration I, relative density of the tillering plant type was 0.5, i.e. half of its density in
monoculture, but relative biomass of the tillering plant type was in general above 0.5 (Fig.
3a), indicating that the early-emerging plants had an advantage in terms of biomass
production in intercrops as compared to the monoculture. The maximum value of relative
biomass (~0.8) was achieved at TND > 0.4. Thus, with half of the density of monoculture, the
early-emerging plants in intercrops produced 80% of the biomass in monoculture, in line with
our hypothesis that the relative biomass of the early-emerging plants would increase with
TND till a point when later sowing of the late-emerging species would not further diminish its
competitive effect on the early-emerging species.
The traits of the late-emerging plants had a clear effect on the biomass of the early-
emerging plants at low TND (TND < 0.4) when interspecific competition is strong. The tall
plant type with a high Amax had the greatest competitive effect on the biomass of the early-
emerging plant among the four types tested as late-emerging plant (Fig. 3a). At low TND (0
or 0.1), tall stature was a more important competitive trait of the late-emerging plants, while
at higher TND (0.2 or 0.3) high photosynthesis rate was more important, indicating that at low
TND, light interception was a more important determinant of competitiveness of the late-
emerging plants, while at somewhat higher TND, efficiency of light conversion into biomass
was more influential. The early-emerging plants did not attain 100% of the monoculture yield,
even with late sowing (TND > 0.4) of the late-emerging plants, reflecting incomplete light
capture because of limitations in plasticity to fully cover the soil with leaves.
Relative biomass of late-emerging plants (non-tillering plant type) in Configuration
IThe response of the late-emerging plants to TND was radically different from that of the
early-emerging plants. While the early-emerging plants showed a saturating response, with
the plateau being reached at TND > 0.4, the late-emerging plants showed a minimum
response, with high relative biomass at low or high TND (up to approximately 0.8) and low
relative biomass (approaching 0) at TND 0.3-0.6. Thus, the competitive effects of the first on
the second-emerging plants were moderate to small at very low or high TND, but strong at

Plant traits drive complementarity and productivity in plant mixtures
67
intermediate TND, i.e. at moderate sowing delays of the second compared to the first plant
types (Fig. 3b).
We had hypothesized that the relative biomass of the late-emerging plants would
decrease with temporal niche differentiation up to a recovery point, beyond which relative
biomass would again increase. The results support this hypothesis (Fig. 3b).
Fig. 3 Relative biomass of early-emerging plants (a) and late-emerging plants (b) at different TND categories for Configuration I, i.e. mixtures of six rows of early-emerging plants and one row of late-emerging plants. For Configuration I, relative density of each plant type is 0.5. The horizontal dashed line represents relative biomass equal to 0.5.

Chapter 4
68
Fig. 4 Development of plant height of late-emerging plants in Configuration I at TND equal to 0.2 (a) and 0.3 (b). In Configuration I, mixtures consist of strips of six rows of the early-emerging plant type alternated with single rows of the late-emerging plant type. With TND = 0.2, the late-emerging plants emerged 17 simulation days after the early plants. With TND = 0.3, the late-emerging plants were delayed by 26 days as compared to the early-emerging plants. For both plant types, a growth duration of 150 days was simulated. This figure shows the positive interaction between the two plant traits maximum plant height and photosynthesis rate. A late-emerging type with a large maximum height will only realize its height growth potential if it photosynthesizes enough.
Amax of the late-emerging plants influenced the response to TND. Late-emerging
plants with low Amax suffered a greater reduction in biomass with increasing TND than plant
types with a high Amax (Fig. 3b). The greater robustness of plant types with high Amax to
competition was related to their greater length growth. For example, at TND equal to 0.2 and
0.3 the plant type with high Amax exhibited greater height increment as compared to the type
of low Amax (Fig. 4). Therefore, in turn, more light could be intercepted by the crop of high
Amax due to its better development in plant height, resulting in a positive feedback. Indeed,
maintaining high rates of photosynthesis under shade conditions appears to be a key trait for
species to perform in an intercrop if sown at a growth delay compared to a companion crop.
Maximum plant height of the late-emerging plants also affected the response of its
relative biomass to TND but only at very low TND (TND < 0.2) and less strongly than Amax.
Relative biomass of a potentially tall late-emerging plant-type was greater than of a
potentially short late-emerging plant-type at TND < 0.2 (Fig. 3b).

Plant traits drive complementarity and productivity in plant mixtures
69
Relative biomass of early-emerging plants in Configuration IIConfiguration II, with a relative density of 0.33 for the first-emerging plants and 0.67 for the
second-emerging plants, showed responses of relative biomass to TND and plant traits that
were similar in shape but not as strong as the pattern observed for Configuration I. The less
intimate association with the early plant type allowed the late plant type to perform relatively
better in this configuration than in Configuration I. The early-emerging plants showed a high
relative biomass in Configuration II when compared to relative density (0.33), ranging from a
minimum value of 0.4 at TND = 0 to almost 0.6 at TND > 0.4 (Fig. 5a), but not as high as in
Configuration I, due to low relative density (0.33 in Configuration II, compared to 0.5 in
Configuration I). The effects of traits of the late-emerging plants on relative biomass of the
early-emerging plants were similar in shape as those in Configuration I.
Relative biomass of late-emerging plants in Configuration IIThe competitive effects of the first-emerging plants on the second-emerging plants were
markedly less in Configuration II (Fig. 5b) than in Configuration I (Fig. 3b). This is because
each row of the second-emerging plant in Configuration II interacted with both a row of the
same plant type and a row of another plant type, whereas in Configuration I, between-row
interactions of the second-emerging plants were exclusively with rows of the first emerging
plant type, which aggravated competitive effects of the first-emerging plants on the second-
emerging plants up to TND of 0.8. Relative biomass of the late-emerging plants did not
decrease as much with increasing TND as in Configuration I, and relative biomass had a
minimum slightly above 0.4, at values of TND from 0.3 to 0.5. The recovery point was not
changed compared to Configuration I, and the highest relative biomass was about 0.8, similar
to Configuration I. High Amax resulted in greater competitiveness of the second-emerging
plants, and a higher value for the biomass at TND = 0.4 (Fig. 5b). As in Configuration I,
height of the late-emerging plants had a minor effect on relative biomass at TND < 0.4 and no
effect at higher TND. Conversely, high Amax contributed noticeably to relative biomass at
TND values from 0.2 to 0.4, indicating importance of photosynthesis response of the later
emerging plants for its productivity in a situation in which it is overshadowed by earlier
emerging plants (Fig. 5b).

Chapter 4
70
Fig. 5 Relative biomass of early-emerging plants (a) and late-emerging plants (b) at different TND categories for Configuration II, i.e. mixtures consisting of strips of six rows of early-emerging plants alternated with strips of 2 rows of late-emerging plant types. For Configuration II, relative density of early-emerging plants and late-emerging plants is 0.33 and 0.67, respectively. The horizontal line represents relative biomass equal to 0.33 in panel a and 0.67 in panel b.
Effect of TND and plant type combinations on relative biomass total in species
mixturesThe sum of relative biomasses of the two components in a mixture showed different responses
to TND in the two configurations. In Configuration I, with a strong competitive effect of the
first-emerging plants on the second-emerging plants, the decrease in relative biomass of the
second-emerging plants at intermediate TND (0.4-0.6) was greater than the increase (already

Plant traits drive complementarity and productivity in plant mixtures
71
Fig. 6 Relative biomass total of different mixtures at different categories of TND for Configuration I (a) and Configuration II (b). In Configuration I, every six rows of the early-emerging plant type are grown with one row of either of the late-emerging plant types; in Configuration II, every six rows of early-emerging plants are grown with two rows of either of the late-emerging plant types. The horizontal line represents LER equal to 1.
at plateau) of relative biomass of the first-emerging plants and at TND = 0.3 for low Amax.
Thus, the relative biomass total in Configuration I had a minimum at TND 0.3 to 0.6. This
asymmetry in intercropped components response to TND was not clearly expressed in
Configuration II. In this case, with less strong competitive effects on the second-emerging
plants, the overall system performance was more robust (high relative biomass total) than in
Configuration I. However, the highest relative biomass total was attained at high TND in
Configuration I, when both the first- and second-emerging plants profited maximally from the

Chapter 4
72
temporal niche differentiation, and the later sown plants were more evenly distributed
reducing intra-specific competition.
DiscussionTo our knowledge, this is the first functional structural plant modelling study addressing
mechanistically the interactions between plant growth and photosynthesis and the reciprocal
effects between the light environment and plant photosynthesis and growth in mixtures. In
this modelling study, we found that the early-emerging plants benefited from later sowing of
the late-emerging plants due to the relaxed competition for light from the late-emerging
plants, while this positive relationship levelled off when the temporal overlap between the
growth durations of plant types was less than 50% of the total growing period of the mixture.
The late-emerging plants suffered a great reduction in biomass due to the competition for light
from the early-emerging plants especially at moderately delayed sowing time and when
spatial arrangement of the mixture allowed strong interspecific interactions (i.c. Configuration
I). High Amax or potential plant height reduced the negative effect of competition from an
early-emerging plant type if the later species was sown with a relatively short delay after the
first species.
Model choicesIn our model, we assumed a constant daily incoming solar radiation (~18MJ/m2/day),
allowing us to investigate the effect of temporal niche differentiation on performance of
species mixtures without confounding effects of the course of seasonal radiation intensity.
This enabled us to also analyze extreme TND scenarios (TND = 1) in which total growing
time was 300 days.
The maximum assimilation rate of CO2, i.e. Amax, is one of the key factors
distinguishing the photosynthetic pathways for C3 and C4 species (Connor et al., 2011). C4
species normally have higher Amax than C3 species (Goudriaan and Van Laar, 1994; Lambers
et al., 2008). According to Lövenstein et al. (1995), Amax of C3 species ranges from 12 to 32
μmol /m2/s depending on plant species and growth environment, while Amax of C4 species in
general varies between 30 and 50 μmol/m2/s. In some extreme cases, Amax of C4 species
could be even higher, for instance Evans et al. (2000) reported a value of Amax for maize
approximating 60 μmol/m2/s. In this modelling study, we used an Amax of 25 μmol /m2/s for
plant types with C3 photosynthesis and 57 μmol /m2/s for plant types with C4 photosynthesis.

Plant traits drive complementarity and productivity in plant mixtures
73
We chose a rather extreme value for the ‘high Amax’ plant type to be able to identify
significant effects. However, under real field conditions, the actual difference in
photosynthesis between C3 and C4 plants depends strongly on the abiotic environment, e.g.
nutrient and water availability. Hence, the effects of differences in photosynthetic capacity
between species in different environments needs to be further explored.
We distinguished C3 and C4 photosynthetic pathways using Amax only because the
difference in respiration rate between C3 and C4 photosynthetic pathways is much smaller
than the difference in their Amax (Yin et al., 2011). Nevertheless, plant species with a high
Amax may also have a high respiration rate (Anten and Hirose, 2003) both in monoculture and
mixed stands. It is difficult to assess whether taking this difference into account would
increase or decrease the potential benefit of mixtures. This issues also deserves further study.
Interactive effect between niche differentiation and plant traitsIn this study, we explored answers to the question: which species traits contribute to the
difference in response of LER to TND between C3/C3 and C3/C4 mixtures. In a meta-
analysis of published empirical experiments, Yu et al. (2015) found that LER of C3/C4
mixtures responded more strongly to increasing TND than C3/C3 mixtures. It has also been
argued that temporal niche differentiation between early short C3 species and later taller C4
species may contribute to high productivity in tall-grass prairies (a wide spread ecosystem in
the North America) (Turner and Knapp, 1996; Anten and Hirose, 2003). Yet, the relative
contributions of variation in plant height and photosynthesis rate to the difference in response
to TND in these systems is unclear. The results presented here indicate that in intercropping
systems the high rate of photosynthesis of C4 plants as compared to C3 plants is likely to be a
key factor underlying the different response, while variation in maximum plant height may
also have an effect but possibly not as large as photosynthesis rate.
A factor that is also likely involved in the stronger response of C3/C4 mixtures to
temporal complementarity, but was not studied here, is the difference between C3 and C4
species in temperature response. Temperature is one of the key factors influencing plant
photosynthesis (Sage and Kubien, 2007; Yin and Struik, 2009). C4 plants have on average
higher temperature optima for photosynthesis and growth than C3 species (Connor et al.,
2011). There is a divergence between C3 and C4 plants in their response to temperature,
which could also underlie strong complementarity when grown in different parts of the
growing season in a particular region. In our modelling framework, we assumed that the

Chapter 4
74
growth and photosynthesis of the C3 and C4 species was not constrained by temperature. This
simplification was intentionally made to allow focusing on complementarity mechanisms for
light capture, in relation to plant traits and spatial and temporal configuration of the system.
Effectively, therefore, we did not consider the cultivation of a C4 species during the early
season, because this assumption would in many situations not be biologically realistic. In
future work, the temperature responses for real species should be built into the modelling
framework to further explore the comparative importance of temperature in shaping the
complementarity between C3 and C4 plants in mixed plant communities. In real systems, the
scope for increasing TND may be constrained by the available length of growing season with
sufficiently high temperatures. This might particularly apply to C4 species which require
higher temperatures than C3 species to fully realize high rates of photosynthesis and growth.
Temporal and spatial complementarityYachi and Loreau (2007) distinguished two possible species relationships in light competition
in mixtures: competitive relaxation (complementarity) and competitive imbalance
(dominance). Competitive relaxation refers to the relaxed competition for resources - in our
case light - between mixed species due to niche differences while competitive imbalance
means unequal access to light since one of the mixed species is dominant. The current study
showed that the extent to which competitive relaxation is accomplished depends on
interactions between temporal niche differentiation and configuration. At low (TND < 0.4)
and high (TND ≥0.8) temporal niche difference, most species combinations exhibit
competitive relaxation in both tested configurations. At medium TND (0.4 ≤ TND ≤ 0.7), all
species in Configuration I experienced competitive imbalance, i.e. the early-emerging plants
dominates the mixture while no competitive imbalance was observed in Configuration II. The
competitive imbalance was strongest in the second species in Configuration I, in which it was
growing in a single row, neighboring at both sides to the first species which was dominant. At
high TND, the late-emerging plants experienced greater competitive relaxation in
Configuration I than Configuration II. The difference in competitive relaxation is not so much
related to the interspecific competition, but rather due to less intraspecific competition
between the late-emerging plants in Configuration I, as the late-emerging plants are more
evenly spaced in Configuration I than in Configuration II. This finding shows that spatial
effects that enhance competitive imbalance (narrow rows) may be mitigated by increasing
temporal complementarity, and vice versa. Likewise, in a situation with competitive

Plant traits drive complementarity and productivity in plant mixtures
75
relaxation (high TND), the effects are stronger if the spatial arrangement allows reduced
intraspecific competition (Configuration I).
Effect of TND on relative biomass totalIn the meta-analysis by Yu et al. (2015), a positive relationship between LER and TND was
found using a linear model: LER = β0+β1*TND, with β0 the LER at TND = 0 and β1 the
effect of TND on LER. The estimations of β0 and β1 equal to 1.18 and 0.21, which means
TND increasing from 0 to 1 results in an increase of LER from 1.18 to 1.39. In the current
modelling study, our simulations show that at TND = 1, relative biomass total (equal to LER)
are greater than 1.39 in all species mixtures and all configurations, especially in Configuration
I, in which relative biomass total are all greater than 1.5. The difference of LER at extreme
TND are likely due to the difference of limiting factors between the modelling study and the
meta-analysis. In the modelling study, light is the only abiotic factor affecting plant growth
and interactions. In the modelling framework, under condition of extreme TND, both species
in the mixtures could maximize the use of captured light without limitation on growth from
the other abiotic factors, e.g. nutrients and water. On the contrary, in the meta-analysis
framework, apart from light, other abiotic factors could also limit plant growth, therefore the
benefit of light use in species mixtures at extreme TND might be limited by e.g. nutrient or
water limitation, as well as by seasonal trends in temperature and light.
Conclusion In this study, an FSP model incorporating photosynthesis-driven growth of plant organs was
developed to investigate the interplay of temporal and spatial complementarity and plant traits
in mixed plant systems. We have shown that complementarity of light use in time (sowing
time) and space (row arrangement) likely determine productivity of species mixtures. This
spatial and temporal complementarity is affected by plant traits of component species in the
mixtures, i.e. maximum plant height and photosynthetic capacity. These findings help us to
identify species trait combinations and spatial and temporal configurations of species with
different traits to maximize the complementary effect, minimize competitive unbalance, and
achieve sustainably high yield output.
Chapter 4
76
Appendix CMovie C1* Simulation of plant growth in a mixture of tillering species with tall&high Amax
species in configuration I (every 6 rows of tillering species mixed with 1 row of non-tillering
species) at TND=0, i.e. simultaneously sown and harvested. The total simulation time is 150
simulation days.
Movie C2 Simulation of plant growth in a mixture of tillering species with tall&high Amax
species in configuration I (every 6 rows of tillering species mixed with 1 row of non-tillering
species) at TND=0.5. TND equal to 0.5 means the tillering species is sown first and harvested
at simulation day of 150 while the non-tillering species is sown 50 simulation days later than
sowing of the tillering species and harvested at simulation day of 200. The total simulation
time is 200 simulation days.
Movie C3 Simulation of plant growth in a mixture of tillering species with tall&high Amax
species in configuration II (every 6 rows of tillering species mixed with 2 rows of non-
tillering species) at TND=0.5. TND equal to 0.5 means the tillering species is sown first and
harvested at simulation day of 150 while the non-tillering species is sown 50 simulation days
later than sowing of the tillering species and harvested at simulation day of 200. The total
simulation time is 200 simulation days.
* In Appendix C, no movies but links for these movies are presented. These movies can be
watched on YouTube through the links.
AcknowledgementsFinancial support by the National Science Foundation of China (grant number: 31461143025,
31210103906) and China Scholarship Council (File No. 2011635011) are gratefully
acknowledged.

Chapter 5
A meta-analysis of relative crop yields in cereal/legume
mixtures suggests options for management
Yang Yu1, Tjeerd-Jan Stomph1, David Makowski2,
Lizhen Zhang3, Wopke van der Werf*1
1Wageningen University, Centre for Crop System Analysis, Droevendaalsesteeg 1,
6708PB Wageningen, the Netherlands2INRA, UMR 211 Agronomie, F-78000 Thiverval Grignon, France
3China Agricultural University, College of Resources and Environmental Sciences,
Beijing 100193, China

Chapter 5
78
AbstractIntercrops of cereals and legumes are grown worldwide, both in smallholder agriculture in developing
countries and in organic farming systems in developed countries. The competitive balance between
species is a key factor determining productivity in mixtures. Management factors, e.g. sowing time,
sowing density and rate of N fertilizer, affect the relative competitiveness and performance of
intercropped species. There is a need for an overarching analysis to elucidate general principles
governing the relative performance of legumes and cereals in mixtures. We therefore conducted a
meta-analysis of published studies to explore how the relative yield of legumes and cereals in mixtures
responds to relative sowing time, relative density and nitrogen fertilizer.
An index for relative sowing time, RST, was developed to quantify the relative difference in
sowing time between the intercropped species. RST is defined as the amount of time that a species is
sown earlier or later than its companion species, relative to the length of its own growing period. RST
is greater than zero if a species is sown earlier than its companion species and smaller than zero if it is
sown later. Relative performance of a species was characterized by its relative yield (or partial land
equivalent ratio, PLER) in the intercrop compared to the yield in the sole crop.
In 409 out of 552 cases, the cereal had a greater relative yield than the legume. Sowing a
species earlier than its companion increased its relative yield, and vice versa. An increase in density of
a species increased its relative yield and decreased the relative yield of the companion species. The
relative yield of cereals increased and that of legumes decreased with the amount of N fertilizer,. The
negative effect of N on the relative yield of legumes was mitigated if the legume was sown before the
cereal.
The study shows how the performance of cereals and legumes in an intercrop is affected by
sowing densities, relative sowing times, and nitrogen fertilizer. Growers can exploit these relationships
to manage competition between cereals and legumes in mixtures and enhance species
complementarity, total productivity and economic profit.
Keywords: intercrops, competition, PLER, cereal, legume, relative density, relative sowing time,
nitrogen fertilizer, meta-analysis
The relative performance of cereals and legumes
79
IntroductionIntercropping (i.e. the mixed cultivation of crop species) is a traditional agronomic practice
that is widely used by smallholder farmers in Asia, Africa and Latin America (Vandermeer,
1992; Lithourgidis et al., 2011). Intercropping is also drawing increasing interest as a strategy
for increasing productivity and sustainability of mechanized western crop production systems,
e.g. through incorporation of legumes in cereal production systems (e.g. Dhima et al., 2007;
Lithourgidis et al., 2007; Bedoussac and Justes, 2010; Pelzer et al., 2012). There are many
types of intercrops, including mixtures of two cereals, mixtures of two legumes, as well as
mixtures of a cereal and a legume or non-legume (Li et al., 2013; Yu et al., 2015). Mixtures of
a cereal and a legume are by far the most common type of intercrop (Rao et al., 1987).
Cereals and legumes are complementary in their acquisition of nitrogen because
legumes can fix nitrogen from air through symbionts in addition to using soil N, while cereals
acquire nitrogen only from the soil (Jensen, 1996; Hauggaard-Nielsen and Jensen, 2001; Chu
et al., 2004; Corre-Hellou et al., 2006). Nitrogen fixation from air is critical if there is little N
available from the soil. Acquisition of soil N by the cereals may reduce the availability to the
legumes and trigger the legumes to fix more N from the air (Lambers et al. 2008). Nitrogen
fixation from the air is also seen as a step in making agriculture more sustainable because it
circumvents the need for industrial nitrogen fixation based on fossil energy (Courty et al.,
2015; Duc et al., 2015).
The different N acquisition strategies of the cereals and the legumes offer opportunity
for complementarity, which could result in a high relative yield for each species (little
reduction from competition), and a high relative yield total of the mixture. The relative yield
of each species is considered a useful index for the extent to which each species has realized
its potential growth, given the conditions and the competition from the other species, while
the relative yield total is a useful index for the total niche realized in mixture (Vandermeer,
1992). The extent to which this relative yield total exceeds one is an indicator for
complementarity.
The land equivalent ratio (LER) is widely used to characterize the land use efficiency
in intercropping. LER is calculated as the sum of the relative yields of intercropped species in
an intercrop, as compared to their sole crops (Mead and Willey, 1980). The value of LER may
be interpreted as the land area required to produce the same yields in sole crops as obtained
from a unit area of intercrop. An LER greater than one implies that intercropping makes a
more efficient use of the land than sole cropping. The partial land equivalent ratio (PLER) is

Chapter 5
80
the relative yield of an intercropped species compared to its yield in a sole crop (Ofori and
Stern, 1987a). PLER can be interpreted as a measure for the contribution of each species to
the efficiency of land use by the system as a whole.
In older literature (e.g. Mead and Riley, 1981), a distinction is made between relative
yield (total) and (partial) land equivalent ratio. The premise is that relative yield total should
be measured in experimental settings with replacement designs in which the relative density
total is one (e.g. De Wit’s replacement series; De Wit, 1960), whereas land equivalent ratios
are measured in experimental settings with a much wider set of designs, including additive
designs with a relative density total of two, and augmentative designs that have a relative
density total between one and two. Relative yield (RY) is calculated in the same way as
partial land equivalent ratio, while the relative yield total (RYT) is calculated in the same way
as the land equivalent ratio. Therefore the distinction between RY and PLER, and between
RYT and LER is nowadays seldom made, and we consider it unnecessary and obsolete.
According to the stress gradient hypothesis (SGH) (Brooker et al., 2008), plant-plant
interactions depend on the environmental context with negative interactions (competition)
dominating under favorable conditions, and positive interactions (facilitation) prevailing
under unfavorable conditions. The SGH predicts that at high doses of nitrogen fertilizer,
interspecific competition would be dominant in intercrops, whereas at low nutrient inputs,
complementary use of N would be dominant. In cereal/legume intercropping, under low
nitrogen input conditions, the complementary acquisition of nitrogen from different sources
would be dominant (Jensen, 1996) while at high nitrogen input, interspecific competition
would lead to a dominance of cereals in the mixture due to the stronger competitiveness of
cereals as compared to the companion legumes (Ofori and Stern, 1987a).
The competitiveness of individual species in mixtures might be affected by differences
in sowing date. The first-sown species will get a competitive advantage while the second-
sown species is likely to have a competitive disadvantage. However, if the sowing delay of
the second species is very large, such that its growth period is to a large extent after the
growth period of the first species (as in relay intercropping), the suppression on the second
species might be minor or transient (Zhang and Li, 2003). The strength of interspecific
competition could also be determined by relative plant densities of the mixed species (Ofori
and Stern, 1987a; Vandermeer, 1992). Increased density of one intercropped species is likely
to increase its competitiveness in the intercrop, and suppress the performance of the
associated species (De Wit, 1960; Braakhekke, 1980; Gardiner and Craker, 1981; Fawusi et

The relative performance of cereals and legumes
81
al., 1982). Although the effects of these agronomic practices (rate of N fertilizer, sowing time
and sowing density of intercropped components) on competitiveness of the species in
mixtures have been reported, there is a large variation in these effects across studies. There is
a lack of quantitative assessment across studies of the extent to which these agronomic
practices can influence the performance of individual species in mixtures. Besides, it is not
clear how species performance in mixtures is affected by the interplay between these factors.
In this study we conduct a meta-analysis to investigate how performance of cereals
and legumes is affected by sowing time, sowing density, rate of N fertilizer and the
interactions between these factors in cereal/legume intercrops. PLER is taken as a measure of
performance of intercropped species. As PLER is the ratio of yield of one species in an
intercrop over yield in the respective sole crop, low yields in sole crops might result in high
PLERs. We therefore also explore whether high PLERs are associated with low yields of the
sole crops.
Materials and methods
Paper and data selection Data on yields in cereal/legume intercrops used here are a subset of records from a database
built by Yu et al. (2015). From the original database, 552 data records of cereal/legume
intercrops were extracted, representing data from 144 experiments out of 77 publications.
Each data record provides the PLER of both the cereal and the legume. An experiment was
defined as a unique combination of site and year. Within experiments, data records were
defined by treatment, including crop species combination, sowing dates, rate of fertilizer
application and crop densities. Data were entered into the database using identifiers for the
publications, and the experiments, and listing all relevant inputs and outputs (Appendix: Table
D1). Not all data records reported all variables mentioned in Table D1. There were some
missing values for density of crops (5 out of 552 records) and rate of N fertilizer (92 out of
552 records; Table D1). Data records with missing values of a variable were excluded only
from those analyses that required that variable.
Response and explanatory variables In all analyses, partial land equivalent ratio (PLER), was taken as response variable. PLER is
defined as:

Chapter 5
82
MY
=PLER (1)
where Y and M represent yield of a species in intercrop and sole crop respectively.
In this meta-analysis, we used four explanatory variables, i.e. (i) relative sowing time
(RST, continuous, see Eq. 2 below), (ii) relative density (RD, continuous, see Eq. 3 below),
(iii) rate of N fertilizer application in the intercrop (N, continuous), and (iv) Crop type (0 for
cereal or 1 for legume). Rates of N fertilizer application and crop type were extracted from the
publications while relative sowing time and relative density were calculated.
In many studies, rates of N fertilizer are different between intercrops and sole crops. A
categorical variable “N strategy” with four levels was defined according to the comparative
amounts of N applied in intercrops and sole crops. In strategy 1, all treatments receive the
same amount of N fertilizer (n = 243). In strategy 2, the rate of N fertilizer in the intercrop is
intermediate between that in the two respective sole crops (n = 43), while in strategy 3, the N
rate in the intercrop is equal to the lowest N rate in sole crops (n = 67), and in strategy 4, the
N rate in intercrop is equal to the highest N rate used in sole crops (n = 107). For N strategies
2-4, sole cropped cereals usually received more N fertilizer than sole cropped legumes (215
cases out of 217).
Relative sowing time of a species is calculated as the ratio of the difference of sowing
time of that species and its companion species divided by its own growing period:
aa
ab
SHSS
−−
=aRST (2)
where RSTa represents relative sowing time of species a with respect to species b. In the
analysis, a can represent either the cereal or the legume, while b represents the companion
species. Sa and Sb represent sowing times of species a and b in Julian day number,
respectively. Ha represents harvesting time of species a in Julian day number (Fig. 1). The
magnitude of RSTa is the ratio of the difference in sowing time between species a and the
species it is intercropped with to the growing period of species a. For the earlier sown species
RST > 0, while for the later sown species RST < 0. RST measures the time, relative to the
total growing period, that a species is growing before (after), and therefore without (with)
competition from, the companion species. This index is expected to be a useful predictor of
the relative yield in the intercrop.

The relative performance of cereals and legumes
83
Fig. 1 Illustration of calculation of relative sowing time. The upper bar represents the growing period of the first-sown species (species a) and the lower bar represents the growing period of the second-sown species (species b). The arrows represent sowing and harvesting time of eachspecies in days after sowing of the first sown species. Relative sowing time is calculated as:RSTa = (Sb-Sa)/(Ha-Sa). RSTa > 0 means species a is sown earlier than species b, and vice versa. In the analysis, a can represent either the cereal or the legume, while b represents the companion species.
Relative density of a species is calculated as the ratio between the density of that
species in intercrop and in its sole crop:
asc,
aic,aRD
dd
= (3)
where dic,a, and dsc,a are densities of species a in the intercrop and sole crop, respectively.
Density of a species in intercrop is defined as number of plants of a species per land area of
the intercrop. Relative density of an analyzed species is denoted by RD, relative density of the
companion species is denoted by RDassociated.
Statistical analysis Relationships between PLER and explanatory variables, i.c. relative sowing time, relative
density and rate of N fertilizer, were estimated for cereals and legumes using mixed effects
modelling to account for correlation between data belonging to the same experiment and/or
publication (Pinheiro and Bates, 2000; Zuur et al., 2009). Six mixed effects models were
formulated (Table 1, models 2-7). All these six models were fitted to the dataset of 1104 (i.e.
2 * 552) PLER records. All analyses were conducted in R (R Core Team, 2013). Mixed

Chapter 5
84
effects models were fitted using R function lme from R package nlme (Pinheiro et al., 2015).
Mixed effects models were also used to estimate the relationships between PLERs of cereals
and the associated legumes (Table 1, model 1) and between PLER and yield of the
corresponding sole crop (Table 1, model 8). The assumption of equal variance for mixed
effects models was checked by analyses of quantile plots and plots of residuals against fitted
values (Zuur et al., 2009). No violations of assumptions were observed. Figures were made
using R packages plotrix and graphics (Lemon, 2006; R Core Team, 2013).
The PLERs of the cereal and the legume from the same data record might be
correlated and have a negative correlation due to the interspecific competition. Therefore, a
negative correlation structure of data between the cereal and the legume from the same data
record was added in the mixed effects models to account for the correlation using R function
corCompSymm for the argument of correlation in lme (Pinheiro and Bates, 2000).
A mixed effects model (Table 1, model 9) was fitted to the data to detect whether the
effect of N fertilizer on PLER differed between N strategies. The relationship between PLER
of the cereals and PLER of the legumes might be non-linear, and PLER of the cereal should
be one when PLER of the legume is zero (i.e. sole crop of cereal) and vice versa. Therefore, a
non-linear model which could reveal this feature of the relationship between PLER of the
cereals and PLER of the legumes (Table 1, model 10) was fitted to the data using R function
gnls (Pinheiro et al., 2015). The non-linear model is
legume,cereal,
legume,
(1 )1 ( 1)(1 )
jkijk ijk
ijk
q PLERPLER ε
q PLER−
= ++ − −
(4)
A comparison of goodness of fit between the linear mixed effects model (model 1) and
the non-linear model (model 10) was conducted with Akaike information criterion (Zuur et
al., 2009). In this meta-analysis, we did not use the inverse variance of LER as a weight
since there were too few publications reporting measures of variance of yields.
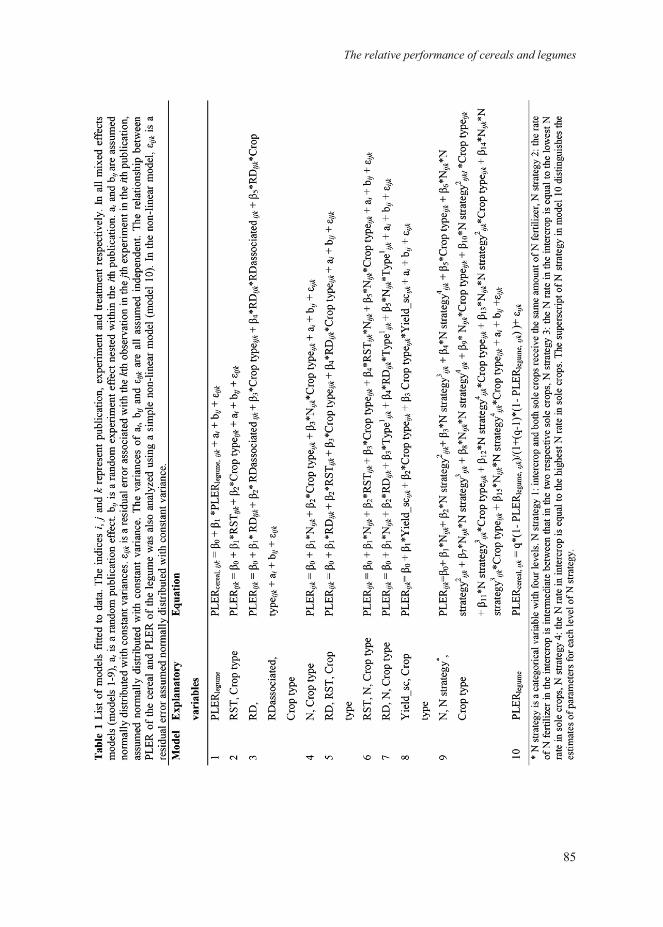
The relative performance of cereals and legumes
85

Chapter 5
86
Results
Characteristics of cereal-legume intercropsOn average, intercrops were more efficient in land use than the corresponding sole crops, with
434 out of 552 calculated LER values larger than 1 (Fig. 2a). The median LER was 1.16 (Fig.
2b), the mean 1.17 and the standard deviation 0.24, indicating substantial variation of LER
over treatments, experiments and publications. More than 90 percent of the intercrops in the
database received less than 100 kg/ha N fertilizer (Fig. 3a) and about 80 percent of the
intercrops were sown simultaneously, i.e. RST equal to zero (436 out of 552 cases, Fig. 3b, c).
Each data record provides yield and relative yield of both cereal and legume. Among the 116
cases with an RST not equal to zero, the cereals were sown earlier than the legumes in 71
cases, and in 45 cases the cereals were sown later than the legumes (Fig. 3b, c).
Competitiveness of individual species in cereal/legume intercropsPLER of the cereals was greater than that of the legumes in ~75% of the cases (409 out of 552
cases) indicating that the competitiveness of cereals is normally higher than that of legumes in
a mixture. A high PLER of the cereal corresponded with a low PLER of the legume and vice
versa (Fig. 4). We chose a linear model to represent the
Fig. 2 Cumulative frequency (a) and frequency distribution (b) of land equivalent ratios (LER) for cereal/legume mixtures.

The relative performance of cereals and legumes
87
relationship between PLER of the cereal and the legume since the goodness of fit of the linear
model (model 1) was better than that of the non-linear model (model 10) according to
Akaike’s information criterion. One unit increase of PLER of the legume resulted in 0.605
unit decrease of PLER of the cereal (model 1, β1=0.605, SE=0.035, P<0.001, Fig. 4).
Fig. 3 Frequency distribution of the rate of N fertilizer on intercropping (a) and relative sowing time of the cereal (b) and the legume (c) in intercrops. (Note the broken y-axis.)

Chapter 5
88
Fig. 4 Scatter plot of partial land equivalent ratio (PLER) of the cereal against PLER of the legume in analyzed intercrops. The broken line represents a theoretical negative relationship with a slope of 1 between the two PLERs, the solid line represents the observed relationshipbetween PLERcereal and PLERlegume as fitted by mixed effects model 1: PLERcereal,ijk = β0 + β1*PLERlegume,ijk + ai + bij + εijk.
Effect of relative sowing time on PLER
Earlier sowing as compared to the companion species increased PLER for both the cereals
and the legumes (Fig. 5). The effect of relative sowing time on PLER was not significantly
different between the cereals and the legumes. Therefore, a model with a common slope for
cereals and legumes (model 2) was fitted to the data. Increase of one unit in relative sowing
time resulted in an increase of 0.7 unit of PLER (model 2, β1 = 0.7, SE = 0.15, P < 0.001) for
both cereals and legumes.

The relative performance of cereals and legumes
89
Fig. 5 Effect of relative sowing time (RST) on partial land equivalent ratio (PLER) of cereals (black circles) and legumes (red squares). The solid and broken line respectively represent relationships between PLERs of cereals and legumes and their relative sowing time fitted by mixed effects model 2: PLERijk = β0 + β1*RSTijk + β2*Crop typeijk + ai + bij + εijk.
Effect of relative density on PLER
A significant positive effect of relative density on PLER was observed for both cereals (model
3, β1 = 0.35, SE = 0.06, P < 0.001) and legumes (model 3, β1+ β5 = 0.22, SE = 0.06, P <
0.001). The effect of relative density on PLER was stronger in cereals than in legumes (model
3, β5 = 0.13, SE = 0.04, P = 0.002). On the other hand, there was a negative relationship
between PLER of a species and the relative density of the associated species in both cereals
and legumes (model 3, β2 = -0.36, SE = 0.06, P < 0.001, Fig. 6), i.e. increasing relative
density of one species decreased PLER of the associated species. There was no difference in
this negative effect between cereals and legumes. This result supports the hypothesis that
increasing density of one species in a mixture increases its relative yield while decreasing the
relative yield of the associated species.
There was a significant positive interaction between the relative density of an analyzed
species and the relative density of the associated species on PLER of the analyzed species
(model 3, β4 = 0.16, SE = 0.07, P = 0.03). This positive interaction indicates that the negative
effect of relative density of the associated species on PLER of the analyzed species is
mitigated by increased relative density of the analyzed species.

Chapter 5
90
Fig. 6 Linear functions relating partial land equivalent ratio (PLER) of cereals (a) and legumes (b) to relative densities of both cereals and legumes fitted by mixed effects model 3: PLERijk = β0 + β1*RDijk + β2*RDassociated ijk + β3*Crop typeijk + β4*RDijk*RDassociated ijk +
β5*RDijk*Crop typeijk + ai + bij + εijk. The colors of dots represent relative density of the companion species, i.e. either legume (a) or cereal (b), from low (blue) to high (red).
Effect of N fertilizer applicate on PLER
We found a significant negative effect of N fertilizer application rate on PLER of legumes
(model 4, β1+ β3 = -0.0013, SE = 0.0002, P < 0.001, Fig. 7). PLER of legumes decreased 0.13
unit when the rate of N fertilizer application was increased with 100 kg/ha. PLER of cereals
increased slightly with N fertilizer (model 4, β1 = 0.00058, SE = 0.00023, P = 0.01, Fig. 7).
This finding is in line with the hypothesis that increasing the rate of N fertilizer leads to an
increase in the relative performance of the cereals but a decrease for the legumes.
The effect of N was not expected to be different between different N strategies.
However, the results showed some pattern in cereals (Fig. D1a). There was a slight positive
effect of N on PLER of the cereals for strategies 1 (equal rate of N in intercrop and sole crops)
and 2 (N in intercrop intermediate between sole crops). However, for strategy 3 (N in
intercrop equal to lowest level in sole crops), there was a strong positive effect of N fertilizer
on PLER while there was a strong negative effect of N fertilizer on PLER with strategy 4 (N
in intercrop equal to the highest level in sole crops) (Fig. D1a). This pattern is mainly due to
confounding between the rate of N and the relative density of cereals in strategies 3 and 4. For
strategy 3, low N plots of the cereals were also those with low relative density, that the
apparent N effect was therefore driven by the relative density. The reverse held for strategy 4
where a low rate of N was associated with a higher relative density of the cereals compared to

The relative performance of cereals and legumes
91
the treatments receiving higher rate of N. The effect of N fertilizer on PLER of the legumes
was consistently negative (Fig. D1b).
Fig. 7 Effect of N fertilizer application on partial land equivalent ratios (PLER) of cereals (circles) and legumes (squares). The solid and broken lines respectively represent relationships between PLER and rate of N fertilizer application for cereals and legumes fitted by mixed effects model 4: PLERijk = β0 + β1*Nijk + β2*Crop typeijk + β3*Nijk*Crop typeijk + ai +bij + εijk.
Fig. 8 Linear functions relating the partial land equivalent ratio (PLER) to the relative sowing time and relative density for cereals (a) and legumes (b) fitted by a mixed effects model 5:PLERijk = β0 + β1*RDijk + β2*RSTijk + β3*Crop typeijk + β4*RDijk*Crop typeijk + ai + bij + εijk.The colors of dots represent relative densities from low (blue) to high (red).
Chapter 5
92
Interactions between factors
No interaction between RST and RD was found for either cereals or legumes. A model with
RST and RD but without interaction was therefore fitted to the dataset (model 5). For cereals
(Fig. 8a) and legumes (Fig. 8b), both the effects of RD (β1 = 0.39, SE = 0.03, P < 0.001 and β1
+ β4 = 0.29, SE = 0.03, P < 0.001 respectively) and of RST (β2 = 0.58, SE = 0.07, P < 0.001)
were positive and significant. These results indicate that relative sowing time and relative
density of the species in mixtures may be adjusted to achieve desired PLERs of the cereals
and the legumes according to production aims.
A positive interaction effect of N rate and relative sowing time on PLERs of cereals
and legumes was expected. In other words, we expected that the positive effect of N fertilizer
on competitiveness of cereals would be enhanced by sowing cereals earlier than legumes
while the negative effect of N on competitiveness of legumes would be alleviated by sowing
legumes earlier than cereals. Indeed, a positive interaction between the relative sowing time
and the rate of N fertilizer was found in both the cereals and the legumes (model 6, β4 =
0.0051, SE = 0.0021, P = 0.017, Fig. 9). For the cereals, there was a slight positive effect of N
fertilizer on PLER when the two intercropped species were sown simultaneously, i.e. RST = 0
(model 6, β1 = 0.00064, SE = 0.00022, P = 0.003). The positive interaction between RST and
the rate of N fertilizer for the cereals indicates that sowing legumes later than the cereals
enhances the positive effect of N fertilizer on PLER of cereals. For legume species, there was
a negative effect of N fertilizer on PLER when the legumes were sown simultaneously with
the cereals (model 6, β1 + β5 = -0.0014, SE = 0. 00022, P < 0.001). However, this negative
effect was alleviated by sowing the cereals later than the legumes.

The relative performance of cereals and legumes
93
Fig. 9 Relationships of partial land equivalent ratio (PLER) to relative sowing time and rate of N fertilizer application for cereals (a) and legumes (b). Relationships were analyzed by fittingmixed effects model 6: PLERijk = β0 + β1*Nijk + β2*RSTijk + β3*Crop typeijk + β4*RSTijk*Nijk +β5*Nijk*Crop typeijk + ai + bij + εijk. The colors of dots represent N fertilizer rates from low (blue) to high (red).
Fig. 10 Relationships of partial land equivalent ratio (PLER) with relative density and rate of N fertilizer for cereals (a) and legumes (b). Relationships were analyzed by fitting mixed effects model 7: PLERijk = β0 + β1*Nijk + β2*RDijk + β3*Crop typeijk + β4*RDijk*Crop typeijk +β5*Nijk*Crop typeijk + ai + bij + εijk. The colors of dots represent N fertilizer rates from low (blue) to high (red).

Chapter 5
94
We expected that increasing N fertilizer in intercrops would enhance the positive
effect of relative density on relative performance of the cereals but decrease the density effect
for the legumes. However, the results showed no interaction between relative density and rate
of N on PLER for either the cereals or the legumes (model 7, Fig. 10).
Relationship between PLER and yield of corresponding sole crops
A negative relationship between PLERs of both the cereals and the legumes and yields in sole
crops was hypothesized, as low yields of sole crops would result in high PLERs. For the
cereal species, indeed, a slight negative effect of sole crop yield on its PLER was observed
(model 8, β1 = -0.007, SE = 0.0024, P = 0.04, Fig. 11a) however this did not seem to be
related to a high PLER at low sole crop yields, but rather to a low PLER with some extremely
high sole crop yields of C4 fodder cereals e.g. maize or millet, harvested as whole plants. For
the legume species there was no effect of sole crop yield on PLER (model 8, β1+β3 = 0.0023,
SE = 0.0029, P = 0.44, Fig. 11b). Our results indicate therefore that in the sampled
intercropping literature, PLER was not biased by low yield of sole crops.
Fig. 11 Relationships between partial land equivalent ratio (PLER) of cereals (a) or legumes (b) and yield of their respective sole crops. The lines represent relationships between PLER and sole crop yields fitted by mixed effects model 8: PLERijk= β0 + β1*Yield_scijk + β2*Crop typeijk + β3*Crop typeijk *Yield_scijk + ai + bij + εijk.

The relative performance of cereals and legumes
95
Discussion and conclusionThis is the first meta-analysis to quantitatively assess the effects of agronomic management
levers (sowing date, density, N fertilizer) on the relative performance of the cereals and
legumes in mixtures. We showed that sowing time is a key factor determining species
competitiveness. Sowing one species earlier increases its competitiveness and decreases the
competitiveness of the later sown species. Besides, we confirmed the hypothesis that
increasing relative density of a species increases its performance while decreasing the
performance of the associated species in a mixture. Furthermore, we showed that application
of N in cereal/legume intercrops increases the competitiveness of the cereals but decreases
that of the legumes. A positive interaction between relative sowing time and rate of N
fertilizer was found for both the cereal and the legume. For the cereals, the positive interaction
means that sowing the cereals earlier enhances the positive effect of N fertilizer, while for the
legumes the positive interaction means that sowing the legumes earlier mitigates the negative
effect of N fertilizer. Finally, we showed that partial land equivalent ratio values were not
biased by low yields of sole crops.
Competitive balance in species mixturesIn species mixtures, competition between species is always present as the plants require the
same growth resources, e.g. water, nutrient and light. While nutrients and water may be
supplied at a level that they are no longer limiting, competition for them being negligible, the
same is not true for light, because the interception of light by one species in a closed stand
goes inevitably at the expense of light interception by another species. The strength of
competition depends on the similarity of the patterns of resource acquisition in time and space
between the species in the mixture. The species of similar spatial and/or temporal niche tend
to compete intensively, which in turn, would result in reduced biomass and seed production of
the relatively weaker species. In natural systems this could lead to extinction of the weaker
species (Vandermeer, 1992), while in agricultural systems this could mean failure of one of
the two crops. The competitive balance, i.e. equal/similar competitiveness of the mixed
species plays an important role in maintaining high productivity of the community (Yachi and
Loreau, 2007) and LER values greater than one in intercrops. Therefore, understanding how
the competitiveness of the mixed species changes with the environment is important for
achieving a high productivity in a mixture.

Chapter 5
96
In this study, we showed that in general, the cereals achieve higher relative yields than
the legumes in cereal/legume intercrops. This balance depends on the sowing times of the
species relative to one another (relative sowing time, RST). We showed that separating the
growing period of the cereals and the legumes results in a stronger competitiveness of the
early sown species and a weaker competitiveness of the late sown one as compared to the
corresponding species in an intercrop in which two species are sown simultaneously.
Therefore, to maintain the competitive balance in cereal/legume intercrops, sowing the
legumes earlier than the cereals would be one option, though other agro-ecological demands
of the species (e.g. a difference in optimal growth temperature in relation to the spring-
summer sequence) should obviously also be considered.
Many studies have shown that application of N fertilizer in cereal/legume intercrops
would increase the competitiveness of the cereals, very likely leading to a competitive
imbalance and a failure of legumes in mixtures (Ofori and Stern, 1986; Ofori and Stern,
1987b; Cowell et al., 1989; Tobita et al., 1994; Pelzer et al., 2014). This meta-analysis
confirmed the negative effect of N fertilizer on competitiveness of the legumes. The negative
effect of N fertilizer on the legumes might be one of the reasons that researchers state that
intercropping is mainly important in low-input agriculture (e.g. Brooker et al., 2015).
However, we show there are options to combine higher N rates with maintained production
gains of intercropping because of the positive interaction between relative sowing time and N
fertilizer. This interaction indicates that the negative effect of N fertilizer on the legumes can
be alleviated by sowing the legumes before the cereals. This finding may be used to further
integrate legumes in modern high-input agricultural systems.
Implications for the design of productive intercropsThis study shows how an increase in competitiveness of one species results in a decrease in
competitiveness of the companion species. To increase productivity of intercrops, it is
important to achieve a greater increase in performance of one species associated with a
smaller decrease in performance of the companion species resulting overall in
complementarity within the system. The results of this study suggest possibilities for
achieving higher intercropping productivity by manipulating the agronomic practices
including sowing time, sowing density and rate of N fertilizer in cereal/legume intercrops.
In this study, we showed an identical effect of relative sowing time on PLER for
cereals and legumes. The positive effect of sowing one species earlier on its relative yield is

The relative performance of cereals and legumes
97
canceled out by the negative effect of delayed sowing of the companion species, which results
in an overall null effect on productivity of the system as a whole. However, this is only true
when the span of growing periods of intercropped species are identical. For instance, in a
cereal/legume intercrop, the growth period of both the cereal and the legume is 150 days.
Sowing the legume 50 days earlier than the cereal results in a relative sowing time of 0.33
(50/150) for the legume and -0.33 for the cereal. According to the estimated relationship
between RST and PLER (model 2, Fig. 5), PLER of the legume increases 0.23 while PLER of
the cereal decreases 0.23 with RST, which would suggest no effect on the total productivity
(LER). However, if a species with a short growing period is grown together with a species
with a longer growing period, sowing the former before the latter would result in an increase
in the total productivity of the intercrop due to the greater positive RST for the species with
the short growing period as compared to the negative RST for the species with the longer
growing period.
It has been shown that application of N in cereal/legume intercrops decreases total
productivity of the intercrop when the cereals and the legumes are sown simultaneously (Yu
et al., 2015), because the legumes suffer more from the competition with cereals. The finding
of a positive interaction between relative sowing time and N rate indicates that combining an
early sown short growing period legume with a later sown longer growing period cereal is an
option for high-input cropping systems.
Our results show that the relative yield of a species is increased by increasing its
density, but at the expense of the relative yield of the companion species. On average, the
positive effect of increasing the relative density of the cereal on its relative yield was stronger
than the negative effect on the companion legume. The findings altogether imply that
increasing density of the cereal species in a cereal/legume intercrop would not only increases
the productivity of the cereal but also increase the productivity of the intercrop as a whole.
ConclusionIn this study, we quantitatively assessed how the performance of each species in
cereal/legume intercrops is affected by agronomic practices including sowing time, sowing
density and rate of N fertilizer as well as the interplay between these factors. These three
factors play important roles in determining the relative performance of individual species in
cereal/legume intercrops and overall system performance. These findings can be used to
design cereal/legume intercrops by fitting the competitive balance with production aims that

Chapter 5
98
farmers have related to intercrop productivity. Such aims are related to prices of inputs and
outputs and the uses farmers may have for the two products. A next step would be to translate
our findings to decision support tools rather than to set rules simply to optimize total yield.
Appendix DTable D1 List of Variables extracted from publications
Fig. D1 Estimates of relationship between PLER and rate of N fertilizer application for
different N application strategies.
AcknowledgementsWe thank staff from the crop systems analysis and plant production systems groups of
Wageningen University for suggestion how to improve this study. The financial support by
China Scholarship Council (CSC) and Key Sino-Dutch Joint Research Project of NSFC (grant
number: 31210103906) are gratefully acknowledged.

Chapter 6
General discussion

Chapter 6
100
General discussionIt has been shown that species richness tends to increase primary production in plant
communities (Loreau and Hector, 2001; Van Ruijven and Berendse, 2003). In crop production
systems, the cultivation of two or more species simultaneously in the same field, i.e.
intercropping, has also been observed to be more productive than monoculture (Zhang and Li,
2003; Li et al., 2013). The yield advantage of intercropping is very often evaluated using the
land equivalent ratio (LER). LER is calculated as the sum of the relative yield of the
intercropped species compared to the respective sole crop. LER thus can be seen as the
relative land area required by sole cropping to produce the same yields as achieved in
intercropping (Mead and Willey, 1980). Values of LER above one mean intercropping is
more efficient in land use than sole cropping and values below one mean intercropping is less
efficient. While advantage in efficiency of land use in intercrops has been documented in
many studies (e.g. Zhang et al., 2007; Lithourgidis et al., 2011) the pattern and direction in
which this increased efficiency is affected by variation in environmental factors, species
identity and crop management is still poorly understood. In this thesis, I therefore investigated
how temporal niche difference, plant traits, agronomic practices and their interactions affect
LER and interspecific interactions between intercropped species in annual intercrops using
both meta-analysis (Chapters 2, 3, and 5) and functional-structural plant (FSP) modelling
(Chapter 4). According to my knowledge, this is the first thesis combining meta-analysis and
FSP modelling to analyze the factors that affect yield advantage in intercropping. This chapter
will place the findings of this thesis in a broader context and discuss how the findings can
improve our understanding of intercropping.
Does intercropping have advantages over sole cropping?Many studies have indicated that intercropping is advantageous over sole cropping, having
benefits such as higher land and/or resource use efficiency (Reddy and Willey, 1981;
Lithourgidis et al., 2011). Intercropping may also suppress pests, diseases and weeds (Ayeni
et al., 1984; Trenbath, 1993) as compared to sole cropping. However, reported effects of
intercropping vary widely and some studies have found negative effects whereby
intercropping performed less well in terms of land use efficiency. While a large number of
studies reported LER > 1, e.g. 1.41 in a maize/faba bean (Mei et al., 2012) and 1.36 in a
barley/faba bean intercrop (Agegnehu et al., 2006), there are also a couple of studies reporting
LER < 1, e.g. 0.77 (wheat/pea, Naudin et al., 2010) , 0.82 (wheat/soybean, Haymes and Lee,

General discussion
101
1999), 0.89 (maize/cowpea, Chang and Shibles, 1985). These latter results show that
intercropping is not always more efficient in land use than sole cropping. Similar variable
results have been obtained for other performance measures. For instance, Marshall and Willey
(1983) reported that in a millet/groundnut intercropping, light capture of the whole system
was not increased while light conversion efficiency (i.e., growth per unit of absorbed light) of
groundnut was enhanced. By contrast, in a wheat/cotton intercropping system, high
productivity of intercropping was only attributed to increased light capture while light
conversion efficiency was not changed in intercropping (Zhang et al., 2008). The findings
illustrate that both the benefits of intercropping and the processes underlying these benefits
can vary considerably. To date however, very little systematic research has been done to
determine under what conditions intercropping is advantageous over sole cropping or what
factors make intercropping advantageous.
This thesis in part fills this knowledge gap as I investigated land use efficiency in
intercropping, using LER and tried to generalize which factors determine LER in annual
intercrops. Though a large variation in LER was observed in the literature (ranging from ~0.5
to ~2), the estimated mean of LER was 1.22±0.02 which is significantly greater than 1
(Chapter 2). This finding indicates that on average intercropping is 22% more efficient in land
use than sole cropping. Many factors however, may be involved in determining the large
variation in LER that was observed.
Temporal niche difference drives productivity of species mixturesTemporal niche difference has been proposed as one of the factors driving the positive effect
of species richness on productivity in vegetation stands (Vandermeer, 1992; Tilman, 1999;
Loreau, 2000). Temporal niche difference refers to asynchronous life cycle of the species in a
mixture resulting in a distinct demand for resources in time (Loreau, 2000), which may allow
for temporal complementary use of resources by these species. For example, a species with a
short growth cycle mixed with a species with a long growth cycle might complementarily
capture the resources e.g. light or nutrients, due to the asynchrony of resource demand, which
in turn, would result in a high productivity of the mixture (Zhang et al., 2008). Though the
term temporal niche difference is not often used in agricultural research, in practice several
cropping systems exist that benefit from this mechanism. Relay intercropping is an exemplary
application of the principle of temporal niche difference. In relay intercropping, two or more
species grow simultaneously during part of the life cycle of each (Vandermeer, 1992), For

Chapter 6
102
instance, in the case of wheat/maize intercrops, wheat is sown in strips in spring and gaps
between wheat strips are kept for the late-sown maize; maize is sown in the gaps in summer
when the wheat is approaching maturity (Zhang and Li, 2003; Zhu et al., 2014). Such relay
intercropping could better exploit the length of the growing season (Lithourgidis et al., 2011)
and intercept more light over the whole growing season (Keating and Carberry, 1993; Zhang
et al., 2008) than sole crops. Relay intercropping has been widely applied in China. In
Northwest China, the area of wheat/maize strip intercropping has been estimated at ~275,000
ha (Li et al., 2001b). More than 65% of cotton was cultivated as a relay intercrop in the
Yellow River valley; the total area of wheat/cotton relay intercropping in China has been
estimated at ~1.4 million ha (Zhang et al., 2007).
While the potential for temporal niche difference to contribute to productivity of
intercrops has been documented there was still little known about the magnitude of this effect
and how this in turn was affected by growth conditions and species traits. In this thesis a new
index TND was developed to quantify the temporal niche complementarity in annual
intercrops, calculated as:
system
overlap
system
overlapsystem
PP
PPP
TND −=−
= 1 (1)
where Psystem represents the total growing period of the intercrop and Poverlap represents the
overlap in growing period of the intercropped species. TND quantifies the proportion of the
total growing period that the two intercrop species grow as sole crops, i.e. before sowing of
the later-sown species or after harvest of the first-harvested species. TND equal to 0 means
the two intercropped species are sown and harvested simultaneously, while TND equal to 1
means there is no overlap of growing period between intercropped species.
I found that LER increased by 0.21 unit per unit increase in TND (Chapter 2) and the
positive relationship between TND and LER was robust and was not influenced by the factors
not included in the analysis, e.g. soil and climate conditions (Chapter 3). This positive effect
indicates that relay intercropping results in higher land use efficiency than can be achieved in
sole crops and this effect increases with further separation of growing period of intercropped
species. Double cropping/sequential cropping in which a second crop is sown after harvest of
the first crop is an alternative to relay intercropping when season length allows it. Double
cropping is similar to relay intercropping with TND equal to one in terms of sowing sequence,
as in both cases two species are grown sequentially on the same field without overlap.
However double cropping is different from relay intercropping because two sole crops are

General discussion
103
sequentially sown full field in double cropping systems while in relay intercropping space is
left between the first sown plants for the sowing of the second plants. A maximum theoretical
value of LER at a TND approaching 1 was estimated to be 1.39 (Chapter 2), while an LER of
2 can be achieved by double cropping. Higher land use efficiency of double cropping is
reasonable since it keeps the land fully covered throughout the growing season but a relay
intercrop usually leaves part of the land bare during part of the growing season. Therefore, if
climatic conditions such as temperature sum and solar radiation is favorable, double cropping
is definitely more efficient in terms of land use than relay intercropping. However, in many
climates, the length of the growing season is not sufficient for a second crop. In such a
situation, relay intercropping may be the best option to increase land use efficiency for
agricultural production.
Functional complementarity matters in species mixturesFunctional complementarity might be another driver for high productivity in mixed
cultivation (Cong et al., 2014; Cong et al., 2015). Mixing species with C3 and C4 pathways is
an example of functional complementarity increasing plant productivity (Tilman et al., 1997).
In most cases C3/C4 mixtures are combinations of a short C3 species and a tall C4 species as
C4 species tend to be taller than most C3 species. A mixture of short C3 and tall C4 species
might increase light use efficiency resulting from complementary use of light, since the taller
C4 species can express its higher photosynthetic capacity associated with its C4 pathway at
high light (upper layer of the canopy) while C3 species may perform relatively better at low
light (lower canopy layer) (Anten and Hirose, 2003). In this thesis I indeed observed that
mixtures of C3 and C4 species have greater LER than C3/C3 combinations (Chapter 2).
Furthermore, in the meta-analysis studies (Chapter 2 and 3), I found that C3/C4 intercrops
have a stronger response of LER to temporal niche difference than C3/C3 intercrops. Contrary
to C3/C4 mixtures, C3/C3 mixtures normally are combinations of two short-stature species. In
agricultural systems C3/C4 mixtures most often entail an early-sown C3 species mixed with a
late-sown C4 species in which the late-sown tall C4 species is shaded by the early-sown short
C3 species during its early growth (Fan et al., 2006; Zhu et al., 2014). A mixture of a C3
(short and early) and a C4 (tall and late) species might achieve better light acquisition than
short/short C3 mixtures (Anten and Hirose, 1999) since the early short species may dominate
the light capture in early season while the late tall species would recover once overgrowing
the short species and dominate in late season, resulting in complementary light acquisition

Chapter 6
104
over time. Therefore both the spatial complementarity in light acquisition resulting from
combinations of short/tall species and functional complementarity in light use from
combining species with C3 and C4 photosynthetic pathways might contribute to the
difference in response of LER to temporal niche difference between C3/C3 and C3/C4
mixtures. In a modelling study (Chapter 4), I showed for the first time that both types of
complementarity can drive the effect of temporal niche differentiation on productivity in
species mixtures but that the effect of functional complementarity is stronger than that of
spatial complementarity. These findings help us to design intercrops of species with different
traits and temporal arrangement to maximize the complementary effect and minimize the
competitiveness, in order to achieve high yield output.
Mixing a legume with a non-legume species is another example of functional
complementarity. Such mixtures tend to have greater plant productivity than mixtures that
include only legume or non-legume species (Hector et al., 1999). Mixtures of legume and
non-legume species might be complementary in acquisition of nitrogen as legumes can
capture nitrogen from the air through symbionts in addition to using soil nitrogen, while non-
legume species acquire nitrogen only from the soil (Jensen, 1996; Hauggaard-Nielsen and
Jensen, 2001). Legume species fix more nitrogen from the air when soil N is limited. In
legume/non-legume mixtures, the non-legume species may be a stronger competitor for soil
nitrogen than the legume species and may capture most of the soil nitrogen, stimulating the
nitrogen fixation of the legume from the air (Jensen, 1996) which would increase nitrogen in
the system as a whole. However, according to the stress gradient hypothesis (SGH), plant-
plant interactions depend on environmental context with negative interactions, e.g.
competition dominating in favorable environments while positive interactions, e.g.
complementarity dominate in unfavorable conditions (Brooker et al., 2008; He et al., 2013).
In the intercropping context, the SGH would predict dominance of interspecific competition
under high N input but greater interspecific complementarity at low N input, e.g.
complementary N use strategies in legume/non-legume mixtures. Temporal niche difference
which relaxes interspecific competition therefore might work well in a high N input
environment but less so in low N input conditions. Nevertheless, it could also be that temporal
niche difference would play a role when N is scarce, as it may enable complementary
acquisition of N over time. In the meta-analysis studies on LER (Chapter 2 and 3) and PLER
(Chapter 5) with data mainly consisting of cereal/legume intercrops, I found that there is a
negative effect of N fertilization on LER which is due to the decrease of PLER of legumes

General discussion
105
when two species were sown and harvested simultaneously (TND = 0), while this negative
effect is alleviated by separating the growth period of the mixed species, i.e. increasing
temporal niche difference. These results are in line with the stress gradient hypothesis: when
growing conditions are favorable (high N input), interspecific competition dominates and high
LER can be achieved by having temporal niche difference. On the contrary, when resources
are limited (low N input), complementary interactions dominate while increasing temporal
niche difference reduces this complementary effect. This finding to some extent contributes to
the debate about relevance of complementarity with respect to N uptake in agricultural and
natural systems. In agricultural or other ecosystems in which soil is rich in N, the
complementary acquisition of N by mixing legume and non-legume species may not have a
large positive effect on production. But when temporal niche difference is involved, e.g. when
species with asynchronous life cycles are combined, productivity of the mixtures could be
increased. By contrast, under conditions where soil N availability is low (e.g. in low input
agriculture or in many natural systems), growing legume with non-legume species
simultaneously may increase total productivity.
Does a high land equivalent ratio mean high productivity?Productivity is defined by yield or useful product per unit land area (Connor et al., 2011). A
key question is therefore whether intercropping can increase total production per unit area. A
“transgressive” overyielding of a mixture is defined as that the total yield in the mixture is
greater than the highest yield among the sole crops (Schmid et al., 2008). Indeed transgressive
overyielding has been found. For instance, Corre-Hellou et al. (2006) reported that a
pea/barley intercrop had greater total yield (6.6 ton/ha) than either sole pea (3.6 ton/ha) or sole
barley (5.3 ton/ha), so an overyielding by about 25% as compared to the highest yielding sole
crop (i.e., (6.6 – 5.3)/5.3 = 1.245) . On the other hand, as noted above, the land equivalent
ratio (LER) is a more widely used index for assessing land use efficiency of intercropping. An
LER > 1 means more land area is needed for sole crops to produce the same yield as in
intercrop. In the example of Corre-Hellou et al. (2006), the yield of pea in the intercrop was
2.1 ton/ha, and the yield of barley was 4.5 ton/ha. The LER was therefore 1.43
(2.1/3.6+4.5/5.3). A value of 1.43 means that 1.43 ha of land would be needed to produce the
same yield as achieved on 1 ha of intercrop when growing pea and barley as sole crops: 2.1
ton pea (0.58 ha) and 4.5 ton barley (0.85 ha).

Chapter 6
106
The question is: does an LER > 1 always imply a transgressive overyielding? That is
not always the case. In the database I used for the meta-analysis of LER (Chapter 2 and 3),
there were 746 sole- vs intercrop comparisons and in most of the cases (605), LER was
greater than 1, while only 292 out of these 605 cases represented transgressive overyielding.
However the reverse statement, i.e. transgressive overyielding indicates LER > 1, is always
true. Here I define a transgressive overyielding index (TOI) to demonstrate why transgressive
overyielding leads to LER > 1. The transgressive overyielding index is calculated as the ratio
of total intercropping yield over the maximum sole crop yield:
1 2 1 2
1 2 1 2 1 2
TOIMax( , ) Max( , ) Max( , )
Y Y Y YM M M M M M+
= = + (2)
where Y1 and Y2 represent yield of species 1 and 2 in intercrop, and M1 and M2 represent the
respective yields in sole crop. TOI>1 means that an intercrop is more productive than either of
the sole crops (transgressive overyielding). LER is calculated as:
1 2
1 2
LER Y YM M
= + (3)
Given,1
1
MY
≥ 1
1 2Max( , )YM M
and 2
2
MY
≥ 2
1 2Max( , )YM M
(4)
Therefore, LER ≥ TOI (5)
According to the Eqs 2-5, LER is always greater or equal to TOI. Therefore, when
there is transgressive overyielding (TOI > 1), LER must be greater than 1, but if LER > 1,
TOI can be smaller than 1.
Species combinations involving the principle of complementarity would probably
achieve higher land use efficiency than sole crops. However, such complementarity may not
guarantee transgressive overyielding, because of differences in yield potential between
species, e.g. in relation to their growth duration. Transgressive overyielding depends on
species composition. Mixtures of species with a similar yield are more likely to achieve
transgressive overyielding than mixtures of species with different yield levels. Or, from the
other perspective, if one of the species in the mixture has much greater yield than the other,
transgressive overyielding is not easily achieved. For example, Chu et al. (2004) reported
transgressive overyielding from a rice/peanut intercrop, where the sole crop yields of rice and
peanut ranged from ~2.5 to 4.5 ton/ha. In such an intercrop, yield of each species in the
intercrop is lower than in the respective sole crop due to relative densities (density of one
species in intercrop compared to in the sole crop) below 1. However, the yield loss of the

General discussion
107
species in intercrop due to lower density could well be compensated by yield of the other
species if there is complementary resource use in the mixture, resulting in a greater total yield
in intercropping than sole cropping. On the other hand, the loss of yield of a high yielding
species in an intercrop would not be easily compensated by yield of the lower yielding species
in the mixture, even if resource acquisition was complementary, and relative yield total well
above one.
Here I used the data for the meta-analysis of LER (Chapter 2 and 3) to link TOI and
yield ratio of sole crops, further illustrating the relationship between transgressive
overyielding and yield levels of the sole crops. The yield ratio is defined as the ratio of sole
crop yields of the highest yielding to the lowest yielding species, when grown as sole crops.
The yield ratio is per definition at least one (i.e. if the sole crop yields are the same). A yield
ratio equal to 1 means equal sole crop yields of the intercropped species, and a larger yield
ratio means a greater difference of yield between the sole crops. The results showed TOI > 1
mainly occurred at yield ratios smaller than 5 (Fig. 1a), indicating that transgressive
overyielding can be hardly achieved if sole crop yield of one species is more than four times
greater than of the other species.
Transgressive overyielding may be more common in fully additive intercropping
(simply adding the two species together without reducing their density in the mixture
compared to the sole crops) than in replacement intercropping. For instance, Haymes and Lee
(1999) reported transgressive overyielding in wheat/bean intercropping, when plant density in
the intercrop was higher than in replacement intercropping. Based on the database for the
meta-analysis of LER (Chapter 2 and 3), a mixed effects model (TOI = β0 + β1*RDT + ai +
bij +εijk) was used to analyze the relationship between transgressive overyielding index (TOI)
and relative density total (RDT, the sum of relative densities of intercropped species
compared to their respective sole crops). Here ai is the random effect of publication, bij is the
random effect of experiment, nested in the ith publication, and εijk is the residual random
error. TOI increased 0.102 unit per unit increase of relative density total (P < 0.001, Fig. 1b).
This finding indicates that increasing plant density in intercrop may increase its total
productivity, enhancing the chance of transgressive overyielding. However, there is still a
large unexplained variation in the transgressive overyielding index (Fig. 1b), illustrating the
need for further work to investigate what factors determine total productivity in intercropping.

Chapter 6
108
Fig. 1 Scatter plot of transgressive overyielding index (TOI) against the yield ratio of the sole crops (a) and relative density total (b). The yield ratio is defined as the ratio of sole crop yields of the highest yielding to the lowest yielding species, when grown as sole crops. The vertical line in panel a indicate yield ratio equal to 1. The yield ratio is per definition at least one (i.e. if the sole crop yields are the same). Yield ratio equal to 1 means the yields of sole crops are equal and a larger yield ratio indicates a greater difference of yield between the sole crops. The transgressive overyielding index is calculated as the ratio of the total yield in intercropping over the maximum yield in the corresponding sole crops (cf. eq. 2). The horizontal line in panel a indicate TOI equal to 1. TO I> 1 means intercropping is more productive than both of the sole crops. Relative density total equal to 1 means intercropping has the same density as sole crops (replacement intercropping) and greater relative density total indicates a higher plant density in intercropping than in sole cropping. Fully additive intercropping means a relative density of 2. The regression line in panel b is fitted using a mixed effects model: TOI = β0 + β1*RDT + ai + bij +εijk. P < 0.001 means β1 is significantly greater than 0.
How can intercropping contribute to modern agriculture?One of the challenges for modern agriculture is to feed the increasing population with limited
arable land while alleviating the environmental impacts of modern agriculture (Tilman et al.,
2011). It has been projected that the world’s population will reach ~9.15 billion by 2050.
Together with shifts in diets (e.g. more meat consumption) and increases in biofuel
production, this entails that overall agricultural production will need to increase by an
estimated 60 percent between 2005-07 and 2050 (Alexandratos and Bruinsma, 2012).
Intercropping has the potential to increase crop production with limited area of cropland as it
is in general more efficient in land use than sole cropping. However, the issue is not only
about how to feed the increasing population but also related to how to reduce the
environmental impact of agriculture. Modern agriculture already imposes major strains on the

General discussion
109
environment including biodiversity loss due to expansion of agriculture (Dirzo and Raven,
2003), global climate change (Foley et al., 2005) and pollution.
Ecological intensification entailing environmentally friendly replacement of
anthropogenic input and/or enhancement of crop productivity is suggested as a means to
tackle the issue (Bommarco et al., 2013; Jensen et al., 2015). Intercropping based on
ecological mechanisms for increasing resources use may contribute to the ecological
intensification of modern agriculture and may reduce anthropogenic inputs and lower
environmental impacts without decreasing productivity (Brooker et al., 2015). For instance
intercropping is capable of suppressing pests, diseases and weeds, and reducing the
corresponding damages to crop production (Trenbath, 1993; Smith and McSorley, 2000;
Banik et al., 2006), which in turn leads to a lower need for chemical inputs and the associated
environmental impacts compared to sole crops (Lithourgidis et al., 2011). Given the
symbiotic nitrogen fixation by legumes, intercropping a non-legume with a legume species is
an option to reduce the use of synthetic nitrogen fertilizer and the associated fossil energy
consumption and environmental impacts (Lithourgidis et al., 2011). These legume/non-
legume intercrops are currently mainly used in organic farming systems which do not allow
the use of agricultural chemicals (Bedoussac et al., 2015). All in all, intercropping can play a
crucial role in meeting the challenge of global food security by increasing/maintaining crop
production with reduced environmental impact. As depicted in the next section however, this
potential can only be realized if intercropping is compatible with modern mechanization.
Might intercropping disappear due to lack of mechanization? If so how to
reverse the trend?Intercropping was widely used across the globe until the 1940s (Andersen, 2005; Machado,
2009), likely because of the earlier-mentioned advantages over sole cropping. With the onset
of modern mechanization and the increased availability of synthetic inputs for agriculture, this
situation changed and growing only one crop in a field became an economically more
attractive option (Horwith, 1985). As a result, intercropping gradually disappeared in
developed countries (Machado, 2009). By contrast, in developing countries, where access to
mechanization and synthetic fertilizer and pesticides is limited for farmers, intercropping is
still widely used (Machado, 2009; Lithourgidis et al., 2011). Nevertheless, along with
economic development in developing countries, the accessibility to mechanization and

Chapter 6
110
agricultural chemicals increases as well, which in turn may drive the farmers to shift from
intercropping to sole cropping.
Such a shift has been observed in China. Around one-third of the arable land was used
for intercropping in the early 1990s (Zhang and Li, 2003), while the figure strongly decreased
in the last two decades. For instance, in the North China Plain, one of the major agricultural
regions in China, only five percent of arable land was cultivated by intercropping in 2010
(Feike et al., 2012). The decrease in cultivated area of intercropping can be partly attributed to
the migration of labor from agriculture to non-agricultural sectors which is more profitable
than agriculture. Due to lack of labor, farm households switch from intercropping to sole
cropping which can be more easily mechanized and managed and requires less labor input
than intercropping.
Interestingly, interest in intercropping in Europe seems to be reemerging, particularly
as the pressure to reduce agricultural inputs, and environmental impact of agriculture is
increasing (Bedoussac and Justes, 2010; Pelzer et al., 2012). Even so the eventual adoption of
intercropping by farmers depends on the compatibility with modern agricultural practices,
particularly mechanization. In the mixtures of cereals and legumes for silage production
(Dhima et al., 2007), in which cereals and legumes are fully mixed, sown and harvested
simultaneously and where there is no need for post-harvest separation of seeds, mechanization
of sowing and harvest using current machinery is not a problem. In more complicated
intercropping such as strip or row intercropping in which component species are cultivated in
alternative strips or rows, current machines would not work. In this case, there are two
possible pathways to adapt intercropping to future demands: either intercropping has to be
innovated in a way that at least part of the management practices can be accomplished by
existing machinery, or new machinery has to be developed that enables the mechanization of
existing systems (Feike et al., 2012). Both pathways require that firstly we find out which
species combinations we want to mechanize, e.g. cereal/legume, cereal/cereal,
cereal/vegetable, or some other species combinations. The choice of species combinations is
determined by the purpose of crop production and the demand of farmers. The second issue
involves planting designs and particularly strip width. Generally, wider strips would facilitate
mechanized planting and harvesting of crops but they reduce interspecific interactions and
thus the potential benefits of niche differentiation and complementarity. The challenge thus
lies in finding optimal designs that meet both demands. The selection of intercropping
patterns needs efforts from both agronomists and engineers, since agronomists can research

General discussion
111
what intercropping patterns are most productive while engineers are able to analyze what
innovations are needed for which pattern and so which patterns can be mechanized relatively
easily.
Some last remarks
Citation bias analysisOne of the novel aspects of this thesis is the analysis of citation bias. I determined whether
publications reporting high LERs were cited more often than publications reporting low
LERs. If this was the case, a positive relationship would result between the number of
citations of a publication and its reported LER. The results show that there is no relationship
between number of citations and LER in our dataset, indicating no citation bias in
intercropping research (Chapter 2). Researchers do not only cite publications reporting high
LERs but also publications reporting low LERs in their studies. Analysis of citation bias is
novel and interesting and might be applied to other research areas. If citation bias is detected
in certain research topics, then researchers should make their new hypotheses not only based
on the findings from publications receiving high citations but also considering the
publications with low citations. In this case, an analysis of all publications on the topic is
necessary before making new hypotheses, for instance using meta-analysis.
Analysis on temporal niche difference and relative sowing timeIn this thesis I analyzed the effect of temporal niche difference on land equivalent ratios
(LER) (Chapter 2) and the effect of relative sowing time on partial land equivalent ratios
(PLER) of individual species (Chapter 5). There are important differences between these
analyses. LER is an index characterizing the land use efficiency of an intercropping system as
a whole compared with the respective sole crops. Temporal niche difference (TND) is the
factor representing the extent to which the growing periods of intercropped species are
asynchronous. The greater the temporal niche difference, the more asynchronous the growing
periods of intercropped species are, and consequently the greater the scope for
complementarity in resource use. Both LER and TND are indicators for the system as a
whole and do not allow a zooming in at the performance of individual species. On the other
hand, PLER (relative yield of a species in an intercrop compared to the respective sole crop)
can be used to assess the performance of the species within an intercrop. Thereby it allows

Chapter 6
112
assessment of the distribution among species of advantages and disadvantages of growing in
competition with a different species as neighbor compared to growing with conspecific
competitors. Relative sowing time is an index for the proportion of the growth duration of one
species that it is sown earlier or later than the companion species in an intercrop. This index is
defined with reference to the growth duration of each species separately, not with reference to
the aggregate growing period of the two species, as is the case with TND. There are therefore
subtle but important differences in the mathematical formulation and ecological interpretation
of the metrics and indices that are used in the Chapters 2 and 5. While Chapter 2 focuses on
system level performance, Chapter 5 focuses on the species level.
It is important to understand what factors would contribute to high productivity of
intercrops. The study of the effect of temporal niche difference on LER (Chapter 2 and 3)
investigated how the productivity of an intercropping system as a whole is influenced by
temporal niche difference resulting in a complementary use of resources in time. However,
the same species combination with the same productivity may end up with different
composition of output due to the variable competitiveness of the intercropped species in
different environments or when the order of sowing is inversed. It is important to understand
the variation in competitiveness of intercropped species for optimizing designs of intercrops
according to our demand for different products. The study on competitiveness of intercropped
species (Chapter 5) showed that the competitiveness of individual species increases if the
species in question is sown earlier than the companion species.
Combination of meta-analysis with FSPMMeta-analysis is a way of quantitative research synthesis (Koricheva et al., 2013). Meta-
analysis is applied to test hypotheses using data from publications with potentially large
variation in results. For instance, due to the debate of whether organic agriculture has lower
productivity than conventional farming system, meta-analyses were conducted and showed
that organic agriculture indeed has lower productivity than conventional agriculture (de Ponti
et al., 2012; Seufert et al., 2012). Using meta-analysis, hypotheses can be tested while also
new hypotheses may arise. In Chapters 2 and 3, I confirmed the hypothesis that LER responds
to temporal niche difference stronger in short C3/tall C4 than in short C3/short C3 intercrops
using meta-analysis, but the underlying mechanisms were not clear. In agricultural systems,
the short C3 species are normally sown earlier than the tall C4 species. I hypothesized that a
combination of a C3 species (short and early) with a C4 species (tall and late) either (i)

General discussion
113
realizes complementary light acquisition in time due to the height differences (cf. section
Functional complementarity matters in species mixtures), or (ii) realizes complementary light
use by combing an early C3 (short) with a late C4 (tall) species that is able to use the light in a
more efficient way after harvest of the early species or when it outgrows the early C3.
Crop modelling is an effective tool to test the plausibility of new ideas before
conducting new experiments based on these new ideas. A concept model can be built to assess
possible performance of plants in different environmental settings based on our current
knowledge about plant physiology, plant architecture development, plant-plant interactions,
and plant-environment interactions. Functional-structural plant (FSP) modelling is a 3D
modelling approach which enables simulation of the interplay of plant architecture and the
physical and biological processes that drive plant development (Vos et al., 2010; Evers,
2016). FSP models are able to quantify light capture by individual species in mixtures (Zhu et
al., 2015) and simulate the dynamic interplay between plant growth, plant-plant interactions
and light capture. Though less developed in this regard they can do the same with respect to
belowground interactions and soil resources (e.g. Postma and Lynch, 2012; Lobet et al.,
2014). In this thesis, an innovative generic FSP model was developed, that incorporates
photosynthesis-driven organ growth of plants in a mixed setting, to quantify to what extent
plant traits drive spatially and temporally complementary light capture, photosynthesis and
productivity in plant mixtures. Using this model, I explored the plausibility of ideas
developed from the meta-analysis studies (Chapter 2 and 3). This thesis showed that the
combination of meta-analysis and modelling approach is a powerful tool to extend our
knowledge, to find patterns among seemingly controversial observations and to understand
the underlying mechanisms. Such a powerful combination of methods may not only be
applied in intercropping research, but may be adopted more widely in plant ecological
research.
ConclusionMany studies have been conducted on intercropping and have reported a large variation in
performance of intercropping systems in terms of productivity, land use efficiency,
interspecific interactions etc. There exist a number of possible mechanisms formulated in the
ecological literature that would influence performance of species mixtures that seem relevant
also for intercropping, e.g. niche differentiation theory entailing complementary use of
resources in space and/or time, and stress gradient hypothesis which states plant-plant

Chapter 6
114
interactions depend on environmental conditions. However, there was a lack of quantitative
synthesis of information from intercropping studies and a need to generalize what factors
related to these mechanisms influence the performance of intercropping . As far as I know this
is the first thesis using the combination of meta-analysis and FSP modelling to quantify the
effects of plant traits, temporal niche difference, and other agronomic practices and their
respective interplays on productivity and the interspecific interaction in annual intercrops. I
hope that the analyses and datasets assembled in this thesis provide a useful basis for further
work demonstrating how diversification of our production systems can help to meet the
demand for food and other crop production while moderating environmental impacts of
agriculture.
115
ReferencesA
Agegnehu, G., Ghizaw, A., Sinebo, W., 2006. Yield performance and land-use efficiency of
barley and faba bean mixed cropping in Ethiopian highlands. European Journal of
Agronomy 25, 202-207.
Alexandratos, N., Bruinsma, J., 2012. World agriculture towards 2030/2050: the 2012
revision. ESA Work paper 3, FAO.
Andersen, M.K., 2005. Competition and complementarity in annual intercrops-the role of
plant available nutrients. Department of Soil Science. The Royal Veterinary and
Agricultural University, Copenhagen, Denmak.
Andow, D.A., 1991. Vegetational diversity and arthropod population response. Annual
Review of Entomology 36, 561-586.
Anten, N.P.R., Hirose, T., 1999. Interspecific differences in above‐ground growth patterns
result in spatial and temporal partitioning of light among species in a tall‐grass
meadow. Journal of Ecology 87, 583-597.
Anten, N.P.R., Hirose, T., 2003. Shoot structure, leaf physiology, and daily carbon gain of
plant species in a tallgrass meadow. Ecology 84, 955-968.
Ayeni, A.O., Akobundu, I.O., Duke, W.B., 1984. Weed interference in maize, cowpea and
maize/cowpea intercrop in a subhumid tropical environment. II. Early growth and
nutrient content of crops and weeds. Weed Research 24, 281-290.
B
Banik, P., Midya, A., Sarkar, B.K., Ghose, S.S., 2006. Wheat and chickpea intercropping
systems in an additive series experiment: advantages and weed smothering. European
Journal of Agronomy 24, 325-332.
Bedoussac, L., Journet, E.-P., Hauggaard-Nielsen, H., Naudin, C., Corre-Hellou, G., Jensen,
E.S., Prieur, L., Justes, E., 2015. Ecological principles underlying the increase of
productivity achieved by cereal-grain legume intercrops in organic farming. A review.
Agronomy for Sustainable Development 35, 911-935.
Bedoussac, L., Justes, E., 2010. The efficiency of a durum wheat-winter pea intercrop to
improve yield and wheat grain protein concentration depends on N availability during
early growth. Plant and Soil 330, 19-35.
Bommarco, R., Kleijn, D., Potts, S.G., 2013. Ecological intensification: harnessing ecosystem
services for food security. Trends in Ecology & Evolution 28, 230-238.
References
116
Bongers, F.J., Evers, J.B., Anten, N.P.R., Pierik, R., 2014. From shade avoidance responses to
plant performance at vegetation level: using virtual plant modelling as a tool. New
Phytologist 204, 268-272.
Braakhekke, W.G., 1980. On coexistence: a causal approach to diversity and stability in
grassland vegetation. Agricultural Research Reports.
Brooker, R.W., Bennett, A.E., Cong, W.F., Daniell, T.J., George, T.S., Hallett, P.D., Hawes,
C., Iannetta, P.P.M., Jones, H.G., Karley, A.J., Li, L., McKenzie, B.M., Pakeman, R.J.,
Paterson, E., Schoeb, C., Shen, J., Squire, G., Watson, C.A., Zhang, C., Zhang, F.,
Zhang, J., White, P.J., 2015. Improving intercropping: a synthesis of research in
agronomy, plant physiology and ecology. New Phytologist 206, 107-117.
Brooker, R.W., Maestre, F.T., Callaway, R.M., Lortie, C.L., Cavieres, L.A., Kunstler, G.,
Liancourt, P., Tielbörger, K., Travis, J.M.J., Anthelme, F., Armas, C., Coll, L.,
Corcket, E., Delzon, S., Forey, E., Kikvidze, Z., Olofsson, J., Pugnaire, F., Quiroz,
C.L., Saccone, P., Schiffers, K., Seifan, M., Touzard, B., Michalet, R., 2008.
Facilitation in plant communities: The past, the present, and the future. Journal of
Ecology 96, 18-34.
C
Cade, B.S., Noon, B.R., 2003. A gentle introduction to quantile regression for ecologists.
Frontiers in Ecology and the Environment 1, 412-420.
Cade, B.S., Terrell, J.W., Schroeder, R.L., 1999. Estimating effects of limiting factors with
regression quantiles. Ecology 80, 311-323.
Cardinale, B.J., Duffy, J.E., Gonzalez, A., Hooper, D.U., Perrings, C., Venail, P., Narwani, A.,
Mace, G.M., Tilman, D., Wardle, D.A., 2012. Biodiversity loss and its impact on
humanity. Nature 486, 59-67.
Cardinale, B.J., Matulich, K.L., Hooper, D.U., Byrnes, J.E., Duffy, E., Gamfeldt, L.,
Balvanera, P., O’Connor, M.I., Gonzalez, A., 2011. The functional role of producer
diversity in ecosystems. American journal of botany 98, 572-592.
Cardinale, B.J., Wright, J.P., Cadotte, M.W., Carroll, I.T., Hector, A., Srivastava, D.S.,
Loreau, M., Weis, J.J., 2007. Impacts of plant diversity on biomass production
increase through time because of species complementarity. Proceedings of the
National Academy of Sciences 104, 18123-18128.

References
117
Casagrande, M., Makowski, D., Jeuffroy, M.H., Valantin-Morison, M., David, C., 2010. The
benefits of using quantile regression for analysing the effect of weeds on organic
winter wheat. Weed Research 50, 199-208.
Chang, J.F., Shibles, R.M., 1985. An analysis of competition between intercropped cowpea
and maize I. Soil N and P levels and their relationships with dry matter and seed
productivity. Field Crops Research 12, 133-143.
Chu, G.X., Shen, Q.R., Cao, J.L., 2004. Nitrogen fixation and N transfer from peanut to rice
cultivated in aerobic soil in an intercropping system and its effect on soil N fertility.
Plant and Soil 263, 17-27.
Cong, W.F., Hoffland, E., Li, L., Six, J., Sun, J.H., Bao, X.G., Zhang, F.S., van der Werf, W.,
2015. Intercropping enhances soil carbon and nitrogen. Global Change Biology 21,
1715-1726.
Cong, W.F., van Ruijven, J., Mommer, L., De Deyn, G.B., Berendse, F., Hoffland, E., 2014.
Plant species richness promotes soil carbon and nitrogen stocks in grasslands without
legumes. Journal of Ecology 102, 1163-1170.
Connor, D.J., Loomis, R.S., Cassman, K.G., 2011. Crop ecology: productivity and
management in agricultural systems. Cambridge University Press, New York, USA.
Corre-Hellou, G., Fustec, J., Crozat, Y., 2006. Interspecific competition for soil N and its
interaction with N2 fixation, leaf expansion and crop growth in pea–barley intercrops.
Plant and Soil 282, 195-208.
Courty, P.E., Smith, P., Koegel, S., Redecker, D., Wipf, D., 2015. Inorganic nitrogen uptake
and transport in beneficial plant root-microbe interactions. Critical Reviews in Plant
Sciences 34, 4-16.
Cowell, L., Bremer, E., vanKessel, C., 1989. Yield and N2 fixation of pea and lentil as
affected by intercropping and N application. Canadian Journal of Soil Science 69, 243-
251.
D
De Ponti, T., Rijk, B., van Ittersum, M.K., 2012. The crop yield gap between organic and
conventional agriculture. Agricultural Systems 108, 1-9.
De Wit, C.T., 1960. On competition. Verslagen landbouwkundige onderzoekingen 66.8
PUDOC, Centrum voor landbouwpublikaties en landbouwdocumentatie. Wageningen,
The Netherlands.

References
118
De Wit, C.T., van den Bergh, J., 1965. Competition between herbage plants. Journal of
Agricultural Science 13, 212-221.
Dhima, K.V., Lithourgidis, A.S., Vasilakoglou, I.B., Dordas, C.A., 2007. Competition indices
of common vetch and cereal intercrops in two seeding ratio. Field Crops Research 100,
249-256.
Dirzo, R., Raven, P.H., 2003. Global state of biodiversity and loss. Annual Review of
Environment and Resources 28, 137-167.
Duc, G., Agrama, H., Bao, S., Berger, J., Bourion, V., De Ron, A.M., Gowda, C.L., Mikic, A.,
Millot, D., Singh, K.B., 2015. Breeding annual grain legumes for sustainable
agriculture: New methods to approach complex traits and target new cultivar ideotypes.
Critical Reviews in Plant Sciences 34, 381-411.
Duval, S., Tweedie, R., 2000. Trim and fill: a simple funnel-plot-based method of testing and
adjusting for publication bias in meta‐analysis. Biometrics 56, 455-463.
E
Ehleringer, J.R., Cerling, T.E., Helliker, B.R., 1997. C4 photosynthesis, atmospheric CO2,
and climate. Oecologia 112, 285-299.
Evans, J.R., von Caemmerer, S., J.E. Sheehy, P.L.M., Hardy, B., 2000. Would C4 rice
produce more biomass than C3 rice? Studies in Plant Science. Elsevier, pp. 53-71.
Evers, J.B., 2016. Simulating crop growth and development using functional-structural plant
modeling. In: Hikosaka, K., Niinemets, Ü., Anten, N.P.R. (Eds.), Canopy
Photosynthesis: From Basics to Applications. Springer, pp. 219-236.
Evers, J.B., Vos, J., Chelle, M., Andrieu, B., Fournier, C., Struik, P.C., 2007. Simulating the
effects of localized red: far‐red ratio on tillering in spring wheat (Triticum aestivum)
using a three‐dimensional virtual plant model. New Phytologist 176, 325-336.
Evers, J.B., Vos, J., Yin, X.Y., Romero, P., Van Der Putten, P., Struik, P.C., 2010. Simulation
of wheat growth and development based on organ-level photosynthesis and assimilate
allocation. Journal of Experimental Botany 61, 2203-2216.
Fan, F.L., Zhang, F.S., Song, Y.N., Sun, J.H., Bao, X.G., Guo, T.W., Li, L., 2006. Nitrogen
Fixation of Faba Bean (Vicia faba L.) Interacting with a Non-legume in Two
Contrasting Intercropping Systems. Plant and Soil 283, 275-286.
Fawusi, M.O.A., Wanki, S.B.C., Nangju, D., 1982. Plant density effects on growth, yield, leaf
area index and light transmission on intercropped maize and Vigna unguiculata (L.)
Walp. in Nigeria. The Journal of Agricultural Science 99, 19-23.

References
119
Feike, T., Doluschitz, R., Chen, Q., Graeff-Hönninger, S., Claupein, W., 2012. How to
overcome the slow death of intercropping in the North China Plain. Sustainability 4,
2550-2565.
Foley, J.A., DeFries, R., Asner, G.P., Barford, C., Bonan, G., Carpenter, S.R., Chapin, F.S.,
Coe, M.T., Daily, G.C., Gibbs, H.K., 2005. Global consequences of land use. science
309, 570-574.
Franklin, K.A., Whitelam, G.C., 2005. Phytochromes and shade-avoidance responses in
plants. Annals of botany 96, 169-175.
Fukai, S., 1993. Intercropping—bases of productivity. Field Crops Research 34, 239-245.
G
Gao, Y., Wu, P., Zhao, X.N., Wang, Z.K., 2014. Growth, yield, and nitrogen use in the
wheat/maize intercropping system in an arid region of northwestern China. Field
Crops Research 167, 19-30.
Gardiner, T.R., Craker, L.E., 1981. Bean growth and light interception in a bean-maize
intercrop. Field Crops Research 4, 313-320.
Ghanbari, A., Dahmardeh, M., Siahsar, B.A., Ramroudi, M., 2010. Effect of maize (Zea mays
L.)-cowpea (Vigna unguiculata L.) intercropping on light distribution, soil temperature
and soil moisture in arid environment. Journal of Food Agriculture & Environment 8,
102-108.
Godfray, H.C.J., Beddington, J.R., Crute, I.R., Haddad, L., Lawrence, D., Muir, J.F., Pretty, J.,
Robinson, S., Thomas, S.M., Toulmin, C., 2010. Food security: the challenge of
feeding 9 billion people. science 327, 812-818.
Goudriaan, J., Van Laar, H., 1994. Modelling potential crop growth processes: textbook with
exercises. Kluwer academic publishers, Dordrecht, The Netherlands.
H
Harris, D., Natarajan, M., Willey, R.W., 1987. Physiological basis for yield advantage in a
sorghum/groundnut intercrop exposed to drought. 1. Dry-matter production, yield, and
light interception. Field Crops Research 17, 259-272.
Hauggaard-Nielsen, H., Jensen, E.S., 2001. Evaluating pea and barley cultivars for
complementarity in intercropping at different levels of soil N availability. Field Crops
Research 72, 185-196.
Hauggaard-Nielsen, H., Jornsgaard, B., Kinane, J., Jensen, E.S., 2008. Grain legume-cereal
intercropping: The practical application of diversity, competition and facilitation in

References
120
arable and organic cropping systems. Renewable Agriculture and Food Systems 23, 3-
12.
Haymes, R., Lee, H.C., 1999. Competition between autumn and spring planted grain
intercrops of wheat (Triticum aestivum) and field bean (Vicia faba). Field Crops
Research 62, 167-176.
He, Q., Bertness, M.D., Altieri, A.H., 2013. Global shifts towards positive species interactions
with increasing environmental stress. Ecology letters 16, 695-706.
Hector, A., Schmid, B., Beierkuhnlein, C., Caldeira, M., Diemer, M., Dimitrakopoulos, P.,
Finn, J., Freitas, H., Giller, P., Good, J., 1999. Plant diversity and productivity
experiments in European grasslands. science 286, 1123-1127.
Hedges, L.V., Gurevitch, J., Curtis, P.S., 1999. The meta-analysis of response ratios in
experimental ecology. Ecology 80, 1150-1156.
Hemmerling, R., Kniemeyer, O., Lanwert, D., Kurth, W., Buck-Sorlin, G., 2008. The rule-
based language XL and the modelling environment GroIMP illustrated with simulated
tree competition. Functional Plant Biology 35, 739-750.
Heuvelink, E., 1996. Dry matter partitioning in tomato: validation of a dynamic simulation
model. Annals of botany 77, 71-80.
Horwith, B., 1985. A role for intercropping in modern agriculture. BioScience 35, 286-291.
Hossard, L., Philibert, A., Bertrand, M., Colnenne-David, C., Debaeke, P., Munier-Jolain, N.,
Jeuffroy, M.H., Richard, G., Makowski, D., 2014. Effects of halving pesticide use on
wheat production. Scientific Reports 4.
I
Inal, A., Gunes, A., Zhang, F., Cakmak, I., 2007. Peanut/maize intercropping induced changes
in rhizosphere and nutrient concentrations in shoots. Plant Physiology and
Biochemistry 45, 350-356.
J
Jensen, E.S., 1996. Grain yield, symbiotic N2 fixation and interspecific competition for
inorganic N in pea-barley intercrops. Plant and Soil 182, 25-38.
Jensen, E.S., Bedoussac, L., Carlsson, G., Journet, E.-P., Justes, E., Hauggaard-Nielsen, H.,
2015. Enhancing yields in organic crop production by eco-functional intensification.
Sustainable Agriculture Research 4, 42-50.
K

References
121
Keating, B.A., Carberry, P.S., 1993. Resource capture and use in intercropping: solar
radiation. Field Crops Research 34, 3-4.
Koenker, R., 2015. quantreg: Quantile Regression. R package version 5.11. http://CRAN.R-
project.org/package=quantreg.
Koenker, R., Bassett, G., 1978. Regression quantiles. Econometrica 46, 33-50.
Koenker, R., Hallock, K., 2001. Quantile regression: An introduction. Journal of Economic
Perspectives 15, 43-56.
Koricheva, J., Gurevitch, J., Mengersen, K., 2013. Handbook of meta-analysis in ecology and
evolution. Princeton University Press, New Jersey, USA.
L
Lambers, H., Chapin III, F.S., Pons, T.L., 2008. Plant Physiological Ecology. Springer, New
York, USA.
Lemon, J., 2006. Plotrix: A package in the red ligth district of R. R-News 6, 8-12.
Li, L., Sun, J.H., Zhang, F.S., Guo, T.W., Bao, X.G., Smith, F.A., Smith, S.E., 2006. Root
distribution and interactions between intercropped species. Oecologia 147, 280-290.
Li, L., Sun, J.H., Zhang, F.S., Li, X.L., Rengel, Z., Yang, S.C., 2001a. Wheat/maize or
wheat/soybean strip intercropping: II. Recovery or compensation of maize and
soybean after wheat harvesting. Field Crops Research 71, 173-181.
Li, L., Sun, J.H., Zhang, F.S., Li, X.L., Yang, S.C., Rengel, Z., 2001b. Wheat/maize or
wheat/soybean strip intercropping: I. Yield advantage and interspecific interactions on
nutrients. Field Crops Research 71, 123-137.
Li, L., Zhang, F.S., Li, X.L., Christie, P., Sun, J.H., Yang, S.C., Tang, C.X., 2003.
Interspecific facilitation of nutrient uptake by intercropped maize and faba bean.
Nutrient Cycling in Agroecosystems 65, 61-71.
Li, L., Zhang, L.Z., Zhang, F.S., 2013. Crop Mixtures and the Mechanisms of Overyielding.
Encyclopedia of Biodiversity, second edition. Waltham, MA: Academic Press, pp.
382-395.
Liebman, M., Dyck, E., 1993. Crop Rotation and Intercropping Strategies for Weed
Management. Ecological Applications 3, 92-122.
Lilliefors, H.W., 1967. On the Kolmogorov-Smirnov test for normality with mean and
variance unknown. Journal of the American Statistical Association 62, 399-402.

References
122
Lithourgidis, A., Dhima, K., Vasilakoglou, I., Dordas, C., Yiakoulaki, M., 2007. Sustainable
production of barley and wheat by intercropping common vetch. Agronomy for
sustainable development 27, 95-99.
Lithourgidis, A.S., Dordas, C.A., Damalas, C.A., Vlachostergios, D.N., 2011. Annual
intercrops: an alternative pathway for sustainable agriculture. Australian Journal of
Crop Science 5, 396-410.
Lobet, G., Pagès, L., Draye, X., 2014. A modeling approach to determine the importance of
dynamic regulation of plant hydraulic conductivities on the water uptake dynamics in
the soil-plant-atmosphere system. Ecological Modelling 290, 65-75.
Loreau, M., 2000. Biodiversity and ecosystem functioning: recent theoretical advances. Oikos
91, 3-17.
Loreau, M., Hector, A., 2001. Partitioning selection and complementarity in biodiversity
experiments. Nature 412, 72-76.
Loreau, M., Naeem, S., Inchausti, P., Bengtsson, J., Grime, J., Hector, A., Hooper, D., Huston,
M., Raffaelli, D., Schmid, B., 2001. Biodiversity and ecosystem functioning: current
knowledge and future challenges. science 294, 804-808.
Lövenstein, H., Lantinga, E.A., Rabbinge, R., van Keulen, H., 1995. Principles of Production
Ecology: Textbook. Wageningen University, The Netherlands.
M
Machado, S., 2009. Does intercropping have a role in modern agriculture? Journal of soil and
water conservation 64, 55A-57A.
Madden, L., Paul, P., 2011. Meta-analysis for evidence synthesis in plant pathology: an
overview. Phytopathology 101, 16-30.
Makowski, D., Doré, T., Monod, H., 2007. A new method to analyse relationships between
yield components with boundary lines. Agronomy for sustainable development 27,
119-128.
Marshall, B., Willey, R., 1983. Radiation interception and growth in an intercrop of pearl
millet/groundnut. Field Crops Research 7, 141-160.
Mead, R., Riley, J., 1981. A review of statistical ideas relevant to intercropping research.
Journal of the Royal Statistical Society. Series A (General), 462-509.
Mead, R., Willey, R., 1980. The concept of a ‘land equivalent ratio’and advantages in yields
from intercropping. Experimental Agriculture 16, 217-228.

References
123
Mei, P.P., Gui, L.G., Wang, P., Huang, J.C., Long, H.Y., Christie, P., Li, L., 2012. Maize/faba
bean intercropping with rhizobia inoculation enhances productivity and recovery of
fertilizer P in a reclaimed desert soil. Field Crops Research 130, 19-27.
Naeem, S., Thompson, L.J., Lawler, S.P., Lawton, J.H., Woodfin, R.M., 1994. Declining
biodiversity can alter the performance of ecosystems. Nature 368, 734-737.
Naudin, C., Corre-Hellou, G., Pineau, S., Crozat, Y., Jeuffroy, M.-H., 2010. The effect of
various dynamics of N availability on winter pea–wheat intercrops: Crop growth, N
partitioning and symbiotic N2 fixation. Field Crops Research 119, 2-11.
Niinemets, Ü., Anten, N.P.R., 2009. Packing the photosynthetic machinery: from leaf to
canopy. In: Laisk, A., Govindjee, L.N. (Eds.), Photosynthesis in silico. Springer the
Netherlands, pp. 363-399.
Ofori, F., Stern, W.R., 1986. Maize/cowpea intercrop system: Effect of nitrogen fertilizer on
productivity and efficiency. Field Crops Research 14, 247-261.
Ofori, F., Stern, W.R., 1987a. Cereal–legume intercropping systems. Advances in Agronomy
41, 41-90.
Ofori, F., Stern, W.R., 1987b. The combined effects of nitrogen fertilizer and density of the
legume component on production efficiency in a maize/cowpea intercrop system.
Field Crops Research 16, 43-52.
Ofori, F., Stern, W.R., 1987b. The combined effects of nitrogen fertilizer and density of the
legume component on production efficiency in a maize/cowpea intercrop system.
Field Crops Research 16, 43-52.
P
Patra, D., Sachdev, M., Subbiah, B., 1986. 15N studies on the transfer of legume-fixed
nitrogen to associated cereals in intercropping systems. Biology and fertility of soils 2,
165-171.
Pearson, E.S., Hartley, H.O., 1954. Biometrika tables for statisticians. Biometrika Trust.
Pelzer, E., Bazot, M., Makowski, D., Corre-Hellou, G., Naudin, C., Al Rifaï, M., Baranger, E.,
Bedoussac, L., Biarnès, V., Boucheny, P., 2012. Pea–wheat intercrops in low-input
conditions combine high economic performances and low environmental impacts.
European Journal of Agronomy 40, 39-53.
Pelzer, E., Hombert, N., Jeuffroy, M.-H., Makowski, D., 2014. Meta-Analysis of the Effect of
Nitrogen Fertilization on Annual Cereal–Legume Intercrop Production. Agronomy
Journal 106, 1775-1786.

References
124
Peters, J.L., Sutton, A.J., Jones, D.R., Abrams, K.R., Rushton, L., 2008. Contour-enhanced
meta-analysis funnel plots help distinguish publication bias from other causes of
asymmetry. Journal of clinical epidemiology 61, 991-996.
Pinheiro, J., Bates, D., DebRoy, S., Sarkar, D., R Core Team, 2013. nlme: Linear and
Nonlinear Mixed Effects Models.
Pinheiro, J.C., Bates, D.M., 2000. Mixed-effects models in S and S-PLUS. Springer, New
York, USA.
Pinheiro, J.C., Bates, D.M., DebRoy, S., Sarkar, D., R Core Team, 2015. nlme: Linear and
Nonlinear Mixed Effects Models.
Postma, J.A., Lynch, J.P., 2012. Complementarity in root architecture for nutrient uptake in
ancient maize/bean and maize/bean/squash polycultures. Annals of botany 110, 521-
534.
R
R Core Team, 2013. R: A language and environment for statistical computing. R Foundation
for Statistical Computing, Vienna, Austria.
Rao, M.R., Rego, T.J., Willey, R.W., 1987. Response of cereals to nitrogen in sole cropping
and intercropping with different legumes. Plant and Soil 101, 167-177.
Reddy, M.S., Willey, R.W., 1981. Growth and resource use studies in an intercrop of pearl
millet/groundnut. Field Crops Research 4, 13-24.
Richard, J., 1984. Summing up. Harvard University Press.
S
Sage, R.F., Kubien, D.S., 2007. The temperature response of C3 and C4 photosynthesis. Plant,
Cell & Environment 30, 1086-1106.
Schmid, B., Hector, A., Saha, P., Loreau, M., 2008. Biodiversity effects and transgressive
overyielding. Journal of Plant Ecology 1, 95-102.
Searle, P.G.E., Comudom, Y., Shedden, D.C., Nance, R.A., 1981. Effect of maize + legume
intercropping systems and fertilizer nitrogen on crop yields and residual nitrogen.
Field Crops Research 4, 133-145.
Seufert, V., Ramankutty, N., Foley, J.A., 2012. Comparing the yields of organic and
conventional agriculture. Nature 485, 229-232.
Shen, J.B., Cui, Z.L., Miao, Y.X., Mi, G.H., Zhang, H.Y., Fan, M.S., Zhang, C.C., Jiang, R.F.,
Zhang, W.F., Li, H.G., 2013. Transforming agriculture in China: from solely high
yield to both high yield and high resource use efficiency. Global Food Security 2, 1-8.

References
125
Sileshi, G., Akinnifesi, F.K., Ajayi, O.C., Place, F., 2008. Meta-analysis of maize yield
response to woody and herbaceous legumes in sub-Saharan Africa. Plant and Soil 307,
1-19.
Smith, H., 1982. Light quality, photoperception, and plant strategy. Annual review of plant
physiology 33, 481-518.
Smith, H.A., McSorley, R., 2000. Intercropping and pest management: a review of major
concepts. American Entomologist 46, 154-161.
Sparkes, D., Holme, S., Gaju, O., 2006. Does light quality initiate tiller death in wheat?
European Journal of Agronomy 24, 212-217.
T
Tilman, D., 1999. The ecological consequences of changes in biodiversity: A search for
general principles. Ecology 80, 1455-1474.
Tilman, D., Balzer, C., Hill, J., Befort, B.L., 2011. Global food demand and the sustainable
intensification of agriculture. Proceedings of the National Academy of Sciences 108,
20260-20264.
Tilman, D., Knops, J., Wedin, D., Reich, P., Ritchie, M., Siemann, E., 1997. The influence of
functional diversity and composition on ecosystem processes. science 277, 1300-1302.
Tilman, D., Reich, P.B., Knops, J., Wedin, D., Mielke, T., Lehman, C., 2001. Diversity and
productivity in a long-term grassland experiment. Science 294, 843-845.
Tilman, D., Wedin, D., Knops, J., 1996. Productivity and sustainability influenced by
biodiversity in grassland ecosystems. Nature 379, 718-720.
Tobita, S., Ito, O., Matsunaga, R., Rao, T.P., Rego, T.J., Johansen, C., Yoneyama, T., 1994.
Field evaluation of nitrogen fixation and use of nitrogen fertilizer by
sorghum/pigeonpea intercropping on an Alfisol in the Indian semi-arid tropics.
Biology and Fertility of Soils 17, 241-248.
Trenbath, B.R., 1993. Intercropping for the management of pests and diseases. Field Crops
Research 34, 381-405.
Turner, C., Knapp, A., 1996. Responses of a C4 grass and three C3 forbs to variation in
nitrogen and light in tallgrass prairie. Ecology, 1738-1749.
V
Van Ruijven, J., Berendse, F., 2003. Positive effects of plant species diversity on productivity
in the absence of legumes. Ecology Letters 6, 170-175.
Vandermeer, J., 1972. Niche theory. Annual Review of Ecology and Systematics, 107-132.
References
126
Vandermeer, J., 1992. The ecology of Intercropping. Cambridge University Press, New York,
USA.
Vandermeer, J.H., 1992. The ecology of intercropping. Cambridge University Press, New
York, USA.
Viechtbauer, W., 2007. Confidence intervals for the amount of heterogeneity in meta‐
analysis. Statistics in medicine 26, 37-52.
Vos, J., Evers, J.B., Buck-Sorlin, G., Andrieu, B., Chelle, M., De Visser, P.H., 2010.
Functional–structural plant modelling: a new versatile tool in crop science. Journal of
experimental botany 61, 2815-2824.
W
Willey, R.W., 1990. Resource use in intercropping systems. Agricultural Water Management
17, 215-231.
Y
Yachi, S., Loreau, M., 2007. Does complementary resource use enhance ecosystem
functioning? A model of light competition in plant communities. Ecology Letters 10,
54-62.
Yang, C.H., Huang, G.B., Chai, Q., Luo, Z.X., 2011. Water use and yield of wheat/maize
intercropping under alternate irrigation in the oasis field of northwest China. Field
Crops Research 124, 426-432.
Yin, X.Y., Goudriaan, J., Lantinga, E.A., Vos, J., Spiertz, H.J., 2003. A flexible sigmoid
function of determinate growth. Annals of botany 91, 361-371.
Yin, X.Y., Struik, P.C., 2009. C3 and C4 photosynthesis models: an overview from the
perspective of crop modelling. NJAS-Wageningen Journal of Life Sciences 57, 27-38.
Yin, X.Y., Sun, Z.P., Struik, P.C., Gu, J.F., 2011. Evaluating a new method to estimate the
rate of leaf respiration in the light by analysis of combined gas exchange and
chlorophyll fluorescence measurements. Journal of Experimental Botany 62, 3489-
3499.
Yu, Y., Stomph, T.-J., Makowski, D., van der Werf, W., 2015. Temporal niche differentiation
increases the land equivalent ratio of annual intercrops: A meta-analysis. Field Crops
Research 184, 133-144.
Z

References
127
Zhang, F.S., Li, L., 2003. Using competitive and facilitative interactions in intercropping
systems enhances crop productivity and nutrient-use efficiency. Plant and Soil 248,
305-312.
Zhang, L., van der Werf, W., Zhang, S., Li, B., Spiertz, J., 2007. Growth, yield and quality of
wheat and cotton in relay strip intercropping systems. Field Crops Research 103, 178-
188.
Zhang, L.Z., van der Werf, W., Bastiaans, L., Zhang, S.P., Li, B.G., Spiertz, J.H.J., 2008.
Light interception and utilization in relay intercrops of wheat and cotton. Field Crops
Research 107, 29-42.
Zhang, L.Z., van der Werf, W., Zhang, S.P., Li, B.G., Spiertz, J.H.J., 2007. Growth, yield and
quality of wheat and cotton in relay strip intercropping systems. Field Crops Research
103, 178-188.
Zhu, J.Q., van der Werf, W., Anten, N.P.R., Vos, J., Evers, J.B., 2015. The contribution of
phenotypic plasticity to complementary light capture in plant mixtures. New
Phytologist 207, 1213-1222.
Zhu, J.Q., Vos, J., van der Werf, W., van der Putten, P.E.L., Evers, J.B., 2014. Early
competition shapes maize whole-plant development in mixed stands. Journal of
experimental botany 65, 641-653.
Zuur, A., Ieno, E.N., Walker, N., Saveliev, A.A., Smith, G.M., 2009. Mixed effects models
and extensions in ecology with R. Springer, New York, USA.


129
Appendix A
Temporal niche differentiation increases the land equivalent ratio of annual
intercrops: a meta-analysis
Methods A1 Inclusion criteria and procedure of paper selection and data extraction
Methods A2 Inclusion criteria for treatments of the 100 publications
Methods A3 Missing variables of data records in the random sample
Methods A4 Analysis of the interaction between TND and amount of N fertilization for three
common strategies for supplying N in intercropping experiments
Methods A5 Bootstrapping strategy for testing sufficiency of a sample size of 100 publications
Methods A6 Reference list of the 100 publications used in this meta-analysis
Fig. A1 Paper selection procedure for the top cited publications and the random sample
Fig. A2 Bootstrap estimates and confidence intervals for β1, estimated via mixed effects
modelling
Fig. A3 World map with experimental sites
Fig. A4 Scatter plots and linear models relating LER to TND and N for three common
strategies for supplying N in intercropping experiments
Table A1 List of the 50 publications in the top cited sample
Table A2 List of the 50 publications in the random sample.
Table A3 Availability of information on selected variables in data sets of the random sample.
Table A4 Coding system for the strategy for N supply in intercropping experiments
Table A5 Contingency table for frequency of intercrops without a legume, or with one or two
legumes in the case of C3/C3, C3/C4 and C4/C4 species combinations in the intercrop

Appendix A
130
Methods A1 Inclusion criteria, and procedure of paper selection and data extraction for the
top cited sample and random sample.
Inclusion criteria of publications for the top cited sample are: (1) peer reviewed English
language publication, i.e. excluding conference proceedings, (2) reporting primary data, i.e.
excluding reviews (3) reporting field data on annual intercrops, thus excluding publications
on systems with perennials, (4) reporting yield data on both intercrops and sole crops, (5)
reporting treatments in which pests, diseases and weeds had been adequately controlled, (6)
intercropping design was either replacement or additive, (7) reporting of sowing and
harvesting dates or reporting total duration and overlapping period of intercrops to allow
estimating temporal niche differentiation, (8) reporting consistent results, i.e. excluding
publications with discrepancies between reported LER and yield data, or inconsistencies
between data in different figures and tables. In the case of the top cited sample we selected
only those publications that reported information on all key explanatory variables: temporal
niche differentiation, rate of N fertilizer, intercropping pattern and plant densities for
intercrops and sole crops. The criterion of completeness of data was not applied to the random
sample because only few randomly sampled publications reported information on all
explanatory variables. This resulted in a lower number of records for some analysis for which
records with missing data had to be excluded (see below, Methods A3).
To find the 50 publications for the top cited sample, 420 publications were reviewed
and screened according to our criteria for paper selection (Fig. A1). Among these 420
publications, 13 publications were excluded because they were not journal publications in
English, 36 publications were excluded because they lacked primary research data, 21 were
excluded because they reported results of non-field experiments, 110 were excluded because
they only reported on systems with perennial species, and 8 were excluded because the
intercrops consisted of more than two species. A large number of publications were excluded
(168 publications) due to lack of information on yield. Two publications without disease
control and 11 publications having no information on sowing and harvesting date of
intercrops were excluded. One publication lacked information on the rate of N fertilizer,
intercropping pattern and relative densities. In all remaining 50 publications results were
reported consistently.
Similarly, 499 randomly selected publications were reviewed to obtain a random
sample (Fig. A1). In this 499 publications, 49 were excluded because they were not journal

Temporal niche differentiation increases LER
131
publications, in English, 3 publications were excluded because they did not report primary
research data, 39 were excluded because they reported results of non-field experiments, 61
were excluded because they only reported on systems with perennial species, 3 were excluded
because they only reported on intercrops with more than two species, 172 were excluded
because of lacking of yield information, 23 publications were excluded because of inadequate
control of diseases, pest or weeds, and 98 were excluded because of lack of information to
calculate TND. One publication was excluded because results were not consistent. For this
second set of publications, selection criteria were less stringent, and papers lacking
information on rate of N fertilizer, intercropping pattern or relative densities were not
excluded.
A total of 746 data records out of 100 publications published between 1978 and 2012
were used in the meta-analysis.
Methods A2 Inclusion criteria for treatments of the 100 publications.
Inclusion criteria needed to be met at the treatment level; otherwise a treatment would not be
included, even if other treatments from the same publication did meet the criteria and were
included.
Methods A3 Missing variables of data records in the random sample.
In the random sample, there were 401 data records, while not all of these data records
reported all variables of interest. There were records with missing values for rate of N
fertilizer, intercropping pattern and relative density total in the random sample (Table A3).
Data records with missing values of a variable were excluded only from those analyses that
required that variable.
Methods A4 Analysis of the interaction between TND and amount of N fertilizer for three
common strategies for supplying N in intercropping experiments.
The interaction between TND and rate of N fertilizer might be different between intercrops
that received the same amount of N as the sole crops and intercrops that received a different
amount of N than the sole crops. An analysis was conducted to detect whether interaction

Appendix A
132
between TND and rate of N fertilization is different for different N situations using a mixed
effects model (model 12 in Table 2): LERijk = β0 + β1*TNDijk + β2* Nijk + β3*N_code_2 ijk+
β4*N_code_4 ijk+ β5*TNDijk* Nijk + β6*TNDijk*N_code_2 ijk+ β7*TNDijk*N_code_4 ijk+a i + b ij + ε ijk.
This model was fitted to a subset consisting of three of N_code groups (1, 2 and 4, Table A4).
The other three N_code groups were excluded from this analysis, either because the range of
TND in the group was too limited for a meaningful analysis (N_code group 3) or because of
low number of observations (N_code groups 5 and 6).
Methods A5 Bootstrapping strategy for testing sufficiency of a sample size of 100
publications.
In the bootstrapping strategy, the effect of temporal niche differentiation on LER (parameter
β1) was estimated via a mixed effects model (model 1 in Table 2):
LERijk=β0 + β1*TNDijk + ai + bij + εijk
where β0 is the intercept, β1 is the slope, ai is a random study effect, bij is a random
experiment effect and εijk is the within study error in LER. Bootstrapping was conducted by
sampling with replacement 50, 100, 150, 200, 250 or 300 publications out of the population of
100 publications. The sampling from the 100 publications was replicated 100 times at each
bootstrap sample size (50, 100, ..., 300), and the parameter β1 was estimated 100 times at each
sample size. Mean and confidence intervals of the resulting sets of estimated values of β1
were then plotted against bootstrap sample size and compared to the value of β1 estimated
with the full sample (Fig. A2a).
The same bootstrapping method was applied to models 3-11 in Table 2. Parameters for
other main effects and interactions were very little affected by sample size, demonstrating that
the sample from the literature was sufficient to obtain robust results (Fig. A2b,c).

Temporal niche differentiation increases LER
133
Methods A6 Reference list of the 100 publications used in this meta-analysis.
Agegnehu, G., Ghizaw, A., Sinebo, W., 2006. Yield performance and land-use efficiency of barley and faba bean mixed cropping in Ethiopian highlands. Eur. J. Agron. 25, 202-207.
Agegnehu, G., Ghizaw, A., Sinebo, W., 2008. Yield potential and land-use efficiency of wheat and faba bean mixed intercropping. Agron. Sustain. Dev. 28, 257-263.
Aggarwal, P., Garrity, D.P., Liboon, S., Morris, R., 1992. Resource use and plant interactions in a rice-mungbean intercrop. Agron. J. 84, 71-78.
Ahmed, F., Hirota, O., Yamada, Y., Haraguchi, T., Matsumoto, M., Mochizuki, T., 2000. Studies on yield, land equivalent ratio and crop performance rate in maize-mungbean intercropping. J. Fac. Agric. Kyushu. U. 45, 39-48.
Akanvou, R., Kropff, M.J., Bastiaans, L., Becker, M., 2002. Evaluating the use of two contrasting legume species as relay intercrop in upland rice cropping systems. Field Crops Res. 74, 23-36.
Allen, J.R., Obura, R.K., 1983. Yield of corn, cowpea, and soybean under different intercropping systems. Agron. J. 75, 1005-1009.
Andersen, M., Hauggaard-Nielsen, H., Ambus, P., Jensen, E., 2005. Biomass production, symbiotic nitrogen fixation and inorganic N use in dual and tri-component annual intercrops. Plant Soil 266, 273-287.
Arlauskiene, A., Maiksteniene, S., Sarunaite, L., Kadziuliene, Z., Deveikyte, I., Zekaite, V., Cesnuleviciene, R., 2011. Competitiveness and productivity of organically grown pea and spring cereal intercrops. Zemdirbyste 98, 339-348.
Asl, A.N., Nassab, A.D.M., Salmasi, S.Z., Moghaddam, M., Javanshir, A., 2009. Potato (Solanum tuberosum L.) and pinto bean (Phaseolus vulgaris L. var. pinto) intercropping based on replacement method. J. Food Agric. Environ 7, 295-299.
Awal, M.A., Koshi, H., Ikeda, T., 2006. Radiation interception and use by maize/peanut intercrop canopy. Agric. For. Meteorol. 139, 74-83.
Banik, P., Midya, A., Sarkar, B.K., Ghose, S.S., 2006. Wheat and chickpea intercropping systems in an additive series experiment: advantages and weed smothering. Eur. J. Agron. 24, 325-332.
Banik, P., Sasmal, T., Ghosal, P., Bagchi, D., 2000. Evaluation of Mustard (Brassica compestris Var. Toria) and Legume Intercropping under 1: 1 and 2: 1 Row‐Replacement Series Systems. J. Agron. Crop Sci. 185, 9-14.
Baumann, D.T., Bastiaans, L., Kropff, M.J., 2001. Competition and crop performance in a leek–celery intercropping system. Crop Sci. 41, 764-774.
Bedoussac, L., Justes, E., 2010. The efficiency of a durum wheat-winter pea intercrop to improve yield and wheat grain protein concentration depends on N availability during early growth. Plant Soil 330, 19-35.
Behera, B., Singh, G.S., Mohanty, S.K., Senapati, P.C., 2002. Biological and economical feasibility of intercropping vegetables with rainfed upland rice (Oryza sativa) in Eastern Ghats, Orissa. Indian J. Agron. 47, 168-172.
Bulson, H.A.J., Snaydon, R.W., Stopes, C.E., 1997. Effects of plant density on intercropped wheat and field beans in an organic farming system. J. Agric. Sci. 128, 59-71.
Carr, P.M., Gardner, J.J., Schatz, B.G., Zwinger, S.W., Guldan, S.J., 1995. Grain yield and weed biomass of a wheat-lentil intercrop. Agron. J. 87, 574-579.
Carruthers, K., Prithiviraj, B., Fe, Q., Cloutier, D., Martin, R.C., Smith, D.L., 2000. Intercropping corn with soybean, lupin and forages: yield component responses. Eur. J. Agron. 12, 103-115.

Appendix A
134
Cenpukdee, U., Fukai, S., 1992. Agronomic modification of competition between cassava and pigeonpea in intercropping. Field Crops Res. 30, 131-146.
Chabi-Olaye, A., Nolte, C., Schulthess, F., Borgemeister, C., 2005. Relationships of intercropped maize, stem borer damage to maize yield and land-use efficiency in the humid forest of Cameroon. Bull. Entomol. Res. 95, 417-427.
Chang, J., Shibles, R.M., 1985. An analysis of competition between intercropped cowpea and maize II. The effect of fertilization and population density. Field Crops Res. 12, 145-152.
Chowdhury, M., Rosario, E., 1994. Comparison of nitrogen, phosphorus and potassium utilization efficiency in maize/mungbean intercropping. J. Agric. Sci. 122, 193-199.
Chu, G.X., Shen, Q.R., Cao, J.L., 2004. Nitrogen fixation and N transfer from peanut to rice cultivated in aerobic soil in an intercropping system and its effect on soil N fertility. Plant Soil 263, 17-27.
Ciftci, V., Ulker, M., 2005. Economic benefits of mixed cropping of lentil (Lens culinaris) with wheat (Triticum aestivum) and barley (Hordeum vulgare) at different seeding ratios. Indian J. Agric. Sci. 75, 100-102.
Clément, A., Chalifour, F.-P., Gendron, G., Bharati, M.P., 1992. Effects of nitrogen supply and spatial arrangement on the grain yield of a maize/soybean intercrop in a humid subtropical climate. Can. J. Plant Sci. 72, 57-67.
Corre-Hellou, G., Fustec, J., Crozat, Y., 2006. Interspecific Competition for Soil N and its Interaction with N2 Fixation, Leaf Expansion and Crop Growth in Pea–Barley Intercrops. Plant Soil 282, 195-208.
Das, S.R., Mahapatra, P.K., Satpathy, D., Uttaray, S.K., 1991. Studies on pigeonpea + groundnut intercropping system. Indian J. Agron. 36, 129-131.
Dhima, K., Lithourgidis, A., Vasilakoglou, I., Dordas, C., 2007. Competition indices of common vetch and cereal intercrops in two seeding ratio. Field Crops Res. 100, 249-256.
Dua, V.K., Lal, S.S., Govindakrishnan, P.M., 2005. Production potential and competition indices in potato (Solanum tuberosum)+French bean (Phaseolus vulgaris) intercropping system in Shimla hills. Indian J. Agric. Sci. 75, 321-323.
Fan, F., Zhang, F., Song, Y., Sun, J., Bao, X., Guo, T., Li, L., 2006. Nitrogen Fixation of Faba Bean (Vicia faba L.) Interacting with a Non-legume in Two Contrasting Intercropping Systems. Plant Soil 283, 275-286.
Fisher, N.M., 1979. Studies in mixed cropping. III. Further results with maize-bean mixtures. Exp. Agric. 15, 49-58.
Gao, Y., Duan, A., Qiu, X., Liu, Z., Sun, J., Zhang, J., Wang, H., 2010. Distribution of roots and root length density in a maize/soybean strip intercropping system. Agric. Water Manag. 98, 199-212.
Gao, Y., Duan, A., Sun, J., Li, F., Liu, Z., Liu, H., Liu, Z., 2009. Crop coefficient and water-use efficiency of winter wheat/spring maize strip intercropping. Field Crops Res. 111, 65-73.
Ghaley, B., Hauggaard-Nielsen, H., Høgh-Jensen, H., Jensen, E., 2005. Intercropping of Wheat and Pea as Influenced by Nitrogen Fertilization. Nutr. Cycl. Agroecosyst. 73, 201-212.
Ghosh, P.K., 2004. Growth, yield, competition and economics of groundnut/cereal fodder intercropping systems in the semi-arid tropics of India. Field Crops Res. 88, 227-237.
Giri, G., 1990. Studies on pigeonpea + groundnut intercropping under rain-fed conditions. Indian J. Agron. 35, 446-449.

Temporal niche differentiation increases LER
135
Gunes, A., Inal, A., Adak, M.S., Alpaslan, M., Bagci, E.G., Erol, T., Pilbeam, D.J., 2007. Mineral nutrition of wheat, chickpea and lentil as affected by mixed cropping and soil moisture. Nutr. Cycl. Agroecosyst. 78, 83-96.
Guvenc, I., Yildirim, E., 2006. Increasing productivity with intercropping systems in cabbage production. J. Sustain. Agric. 28, 29-44.
Hauggaard-Nielsen, H., Ambus, P., Jensen, E.S., 2001. Interspecific competition, N use and interference with weeds in pea–barley intercropping. Field Crops Res. 70, 101-109.
Hauggaard-Nielsen, H., Ambus, P., Jensen, E.S., 2003. The comparison of nitrogen use and leaching in sole cropped versus intercropped pea and barley. Nutr. Cycl. Agroecosyst. 65, 289-300.
Hauggaard-Nielsen, H., Andersen, M.K., Jørnsgaard, B., Jensen, E.S., 2006. Density and relative frequency effects on competitive interactions and resource use in pea–barley intercrops. Field Crops Res. 95, 256-267.
Hauggaard-Nielsen, H., Jensen, E.S., 2001. Evaluating pea and barley cultivars for complementarity in intercropping at different levels of soil N availability. Field Crops Res. 72, 185-196.
Haymes, R., Lee, H.C., 1999. Competition between autumn and spring planted grain intercrops of wheat (Triticum aestivum) and field bean (Vicia faba). Field Crops Res. 62, 167-176.
Helenius, J., Jokinen, K., 1994. Yield advantage and competition in intercropped oats (Avena sativa L.) and faba bean (Vicia faba L.): Application of the hyperbolic yield-density model. Field Crops Res. 37, 85-94.
Hummel, J.D., Dosdall, L.M., Clayton, G.W., Turkington, T.K., Lupwayi, N.Z., Harker, K.N., O'Donovan, J.T., 2009. Canola-wheat intercrops for improved agronomic performance and integrated pest management. Agron. J. 101, 1190-1197.
Jahansooz, M.R., Yunusa, I.A.M., Coventry, D.R., Palmer, A.R., Eamus, D., 2007. Radiation-and water-use associated with growth and yields of wheat and chickpea in sole and mixed crops. Eur. J. Agron. 26, 275-282.
Jensen, E.S., 1996. Grain yield, symbiotic N-2 fixation and interspecific competition for inorganic N in pea-barley intercrops. Plant Soil 182, 25-38.
Knudsen, M.T., Hauggaard-Nielsen, H., Jornsgard, B., Jensen, E.S., 2004. Comparison of interspecific competition and N use in pea-barley, faba bean-barley and lupin-barley intercrops grown at two temperate locations. J. Agric. Sci. 142, 617-627.
Kontturi, M., Laine, A., Niskanen, M., Hurme, T., Hyovela, M., Peltonen-Sainio, P., 2011. Pea-oat intercrops to sustain lodging resistance and yield formation in northern European conditions. Acta Agric. Scand. Sect. B Soil Plant Sci. 61, 612-621.
Kumar, P., Prasad, N.K., 2003. Biological and economical sustainability of forage maize (Zea mays) plus cowpea (Vigna unguiculata) intercrop. Indian J. Agric. Sci. 73, 341-342.
Lei, T., Zhan, W., Xiao, J., Huang, X., Mao, J., 2005. Water use efficiency of a mixed cropping system of corn with grasses. Int. J. Sustain. Dev. World Ecol. 12, 55-59.
Li, L., Sun, J., Zhang, F., Guo, T., Bao, X., Smith, F.A., Smith, S.E., 2006. Root distribution and interactions between intercropped species. Oecologia 147, 280-290.
Li, L., Sun, J., Zhang, F., Li, X., Yang, S., Rengel, Z., 2001. Wheat/maize or wheat/soybean strip intercropping: I. Yield advantage and interspecific interactions on nutrients. Field Crops Res. 71, 123-137.
Li, L., Yang, S., Li, X., Zhang, F., Christie, P., 1999. Interspecific complementary and competitive interactions between intercropped maize and faba bean. Plant Soil 212, 105-114.

Appendix A
136
Lithourgidis, A., Vlachostergios, D., Dordas, C., Damalas, C., 2011. Dry matter yield, nitrogen content, and competition in pea–cereal intercropping systems. Eur. J. Agron. 34, 287-294.
Lithourgidis, A.S., Dhima, K.V., Vasilakoglou, I.B., Dordas, C.A., Yiakoulaki, M.D., 2007. Sustainable production of barley and wheat by intercropping common vetch. Agron. Sustain. Dev. 27, 95-99.
Mandal, B.K., Mahapatra, S.K., 1990. Barley, lentil, and flax yield under different intercropping systems. Agron. J. 82, 1066-1068.
Martin, R.C., Voldeng, H.D., Smith, D.L., 1990. Intercropping corn and soybean for silage in a cool-temperature region: yield, protein and economic effects. Field Crops Res. 23, 295-310.
Mason, S., Leihner, D., Vorst, J., Salazar, E., 1986. Cassava-cowpea and cassava-peanut intercropping. II. Leaf area index and dry matter accumulation. Agron. J. 78, 47-53.
Mason, W., Pritchard, K., 1987. Intercropping in a temperate environment for irrigated fodder production. Field Crops Res. 16, 243-253.
Mei, P.-P., Gui, L.-G., Wang, P., Huang, J.-C., Long, H.-Y., Christie, P., Li, L., 2012. Maize/faba bean intercropping with rhizobia inoculation enhances productivity and recovery of fertilizer P in a reclaimed desert soil. Field Crops Res. 130, 19-27.
Miyazawa, K., Murakami, T., Takeda, M., Murayama, T., 2010. Intercropping green manure crops—effects on rooting patterns. Plant Soil 331, 231-239.
Mohapatra, B.K., Pradhan, L., 1993. Energy relationship in intercropping of maize (Zea-Mays) with cowpea (Vigna-Unguiculata) and rice bean (Vigna-Umbellata). Indian J. Agric. Sci. 63, 581-583.
Mondal, S., Sarkar, S., Pramanik, C., 2004. Effect of K on soil fertility and productivity under intercropped soya bean (Glycine max L. Merrill) and sesame (Sesamum indicum L.). Trop. Agric.
Morgado, L.B., Willey, R.W., 2003. Effects of plant population and nitrogen fertilizer on yield and efficiency of maize-bean intercropping. Pesqu. Agropecu. Bras. 38, 1257-1264.
Morgado, L.B., Willey, R.W., 2008. Optimum plant population for maize-bean intercropping system in the Brazilian semi-arid region. Sci. Agric. 65, 474-480.
Moynihan, J.M., Simmons, S.R., Sheaffer, C.C., 1996. Intercropping annual medic with conventional height and semidwarf barley grown for grain. Agron. J. 88, 823-828.
Mutsaers, H., 1978. Mixed cropping experiments with maize and groundnuts. Neth. J. Agric. Sci.
Nelson, A.G., Pswarayi, A., Quideau, S., Frick, B., Spaner, D., 2012. Yield and weed suppression of crop mixtures in organic and conventional systems of the western Canadian Prairie. Agron. J. 104, 756-762.
Neumann, A., Werner, J., Rauber, R., 2009. Evaluation of yield-density relationships and optimization of intercrop compositions of field-grown pea-oat intercrops using the replacement series and the response surface design. Field Crops Res. 114, 286-294.
Ntare, B.R., 1990. Intercropping morphologically different cowpeas with pearl millet in a short season environment in the Sahel. Exp. Agric. 26, 41-47.
Ofori, F., Pate, J.S., Stern, W.R., 1987. Evaluation of N2 fixation and nitrogen econommy of a maize-cowpea intercrop system using N-15 dilution methods. Plant Soil 102, 149-160.
Ofori, F., Stern, W.R., 1986. Maize/cowpea intercrop system: Effect of nitrogen fertilizer on productivity and efficiency. Field Crops Res. 14, 247-261.

Temporal niche differentiation increases LER
137
Ofori, F., Stern, W.R., 1987a. The combined effects of nitrogen fertilizer and density of the legume component on production efficiency in a maize/cowpea intercrop system. Field Crops Res. 16, 43-52.
Ofori, F., Stern, W.R., 1987b. Relative sowing time and density of component crops in maize-cowpea intercrop system. Exp. Agric. 23, 41-52.
Ogbuehi, C., Orzolek, M., 1987. Intercropping carrot and sweetcorn in a multiple cropping system. Sci. Hortic. 31, 17-24.
Olasantan, F., Lucas, E., Ezumah, H.C., 1994. Effects of intercropping and fertilizer application on weed control and performance of cassava and maize. Field Crops Res. 39, 63-69.
Ong, C., Subrahmanyam, P., Khan, A., 1991. The microclimate and productivity of a groundnut/millet intercrop during the rainy season. Agric. For. Meteorol. 56, 49-66.
Ossom, E., Thwala, M., 2005. Intercropping maize with grain legumes influences weed suppression, soil temperature, and disease incidence in Swaziland. Trop. Agric.
Prasad, K., Srivastava, V., 1991. Pigeonpea and soybean intercropping systems under rain-fed situation. Indian J. Agric. Sci. 61, 243-246.
Reddy, K., Van der Ploeg, J., Maga, I., 1990. Genotype effects in millet/cowpea intercropping in the semi-arid tropics of Niger. Exp. Agric. 26, 387-396.
Reddy, M.S., Willey, R.W., 1981. Growth and resource use studies in an intercrop of pearl millet/groundnut. Field Crops Res. 4, 13-24.
Rees, D., 1986. Crop growth, development and yield in semi-arid conditions in Botswana. II. The effects of intercropping Sorghum bicolor with Vigna unguiculata. Exp. Agric. 22, 169-177.
Reynolds, M., Sayre, K., Vivar, H., 1994. Intercropping wheat and barley with N-fixing legume species: a method for improving ground cover, N-use efficiency and productivity in low input systems. J. Agric. Sci. 123, 175-183.
Sarkar, R.K., Sanyal, S.R., 2000. Production potential and economic feasibility of sesame (Sesamum indicum)-based intercropping system with pulse and oilseed crops on rice fallow land. Indian J. Agron. 45, 545-550.
Schmidtke, K., Neumann, A., Hof, C., Rauber, R., 2004. Soil and atmospheric nitrogen uptake by lentil (Lens culinaris Medik.) and barley (Hordeum vulgare ssp. nudum L.) as monocrops and intercrops. Field Crops Res. 87, 245-256.
Silwana, T.T., Lucas, E.O., Olaniyan, A.B., 2007. The effects of inorganic and organic fertilizers on the growth and development of component crops in maize/bean intercrop in Eastern Cape of South Africa. J. Food Agric. Environ 5, 267-272.
Singh, K.K., Rathi, K.S., 2003. Dry matter production and productivity as influenced by staggered sowing of mustard intercropped at different row ratios with chickpea. J. Agron. Crop Sci. 189, 169-175.
Song, Y.N., Zhang, F.S., Marschner, P., Fan, F.L., Gao, H.M., Bao, X.G., Sun, J.H., Li, L., 2007. Effect of intercropping on crop yield and chemical and microbiological properties in rhizosphere of wheat (Triticum aestivum L.), maize (Zea mays L.), and faba bean (Vicia faba L.). Biol. Fertil. Soils 43, 565-574.
Subedi, K., 1998. Profitability of barley and peas mixed intercropping in the subsistence farming systems of the Nepalese hills. Exp. Agric. 34, 465-474.
Subramanian, V.B., Rao, D.G., 1988. Intercropping effects on yield components of dryland sorghum, pigeonpea and mung bean. Trop. Agric. 65, 145-149.
Teasdale, J., Deahl, K., 1987. Performance of four tomato cultivars intercropped with snap beans. Hortscience 22.
Tobita, S., Ito, O., Matsunaga, R., Rao, T.P., Rego, T.J., Johansen, C., Yoneyama, T., 1994. Field evaluation of nitrogen fixation and use of nitrogen fertilizer by

Appendix A
138
sorghum/pigeonpea intercropping on an Alfisol in the Indian semi-arid tropics. Biol. Fertil. Soils 17, 241-248.
Tomar, R.S.S., Upadhyay, M.S., Sharma, R.A., 1987. Effect of planting patterns in pigeonpea + soybean intercropping system. Indian J. Agron. 32, 322-325.
Tsubo, M., Walker, S., 2004. Shade effects on Phaseolus vulgaris L. intercropped with Zea mays L. under well-watered conditions. J. Agron. Crop Sci. 190, 168-176.
Vyas, A.K., Billore, S.D., Joshi, O.P., 2006. Productivity and economics of integrated nutrient management in soybean (Glycine max)+pigeonpea (Cajanus cajan) intercropping system. Indian J. Agric. Sci. 76, 7-10.
Waterer, J.G., Vessey, J.K., Stobbe, E.H., Soper, R.J., 1994. Yield and symbiotic nitrogen-fixation in a pea-mustard intercrop as influenced by N fertilzer addtion. Soil Biol. Biochem. 26, 447-453.
Watiki, J.M., Fukai, S., Banda, J.A., Keating, B.A., 1993. Radiation Interception and Growth of Maize/Cowpea Intercrop as Affected by Maize Plant-Density and Cowpea Cultivar. Field Crops Res. 35, 123-133.
Willey, R., Reddy, M., 1981. A field technique for separating above-and below-ground interactions in intercropping: an experiment with pearl millet/groundnut. Exp. Agric. 17, 257-264.
Zhang, L., van der Werf, W., Zhang, S., Li, B., Spiertz, J.H.J., 2007. Growth, yield and quality of wheat and cotton in relay strip intercropping systems. Field Crops Res. 103, 178-188.

Temporal niche differentiation increases LER
139
Fig. A1 Paper selection procedure for the top cited publications (left) and the random sample
(right).

Appendix A
140
Fig. A2 Bootstrap estimates and confidence intervals for parameters, estimated via a mixed
effects models with sample size of 50, 100, 150, 200, 250 and 300 publications sampled with
replacement out of the population of 100 publications. Estimate of β1 of model 1: LERijk = β0
+ β1*TNDijk + ai + bij + εijk (a). Estimate of β1 of model 6: LERijk = β0 + β1*Nijk + ai + bij +
εijk (b). Estimate of β3 of model 10: LERijk = β0 + β1*TNDijk + β2*Nijk + β3TNDijk*Nijk + ai
+ bij + εijk (c). X-axis indicates number of publications used for the estimates of parameters.
The label “True” on the X-axis represents the estimates of parameters with the actual samples
size of 100 publications. Y-axis represents the value of estimates. For each sample size along
the X-axis, resampling was carried out 100 times, thus mean and confidence interval of
estimates of parameters were calculated with 100 estimates. Circles represent means of
estimates of parameters and error bars represent 95% confidence intervals.

Temporal niche differentiation increases LER
141
Fig. A3 World map with experimental sites.

Appendix A
142
Fig. A4 Scatter plots and linear models relating LER to TND and N for three common
strategies for supplying N in intercropping experiments: N_code group 1 (a), group 2 (b) and
group 4 (c). Relationship between LER and TND and rate of N fertilization was estimated by
model: LERijk = β0 + β1*TNDijk + β2*Nijk + β3*N_code_2ijk+ β4*N_code_4ijk+
β5*TNDijk*Nijk + β6*TNDijk*N_code_2ijk+ β7*TNDijk*N_code_4ijk + ai + bij + εijk.
Regression lines for different rates of N fertilization are presented in each panel.

Temporal niche differentiation increases LER
143

Appendix A
144

Temporal niche differentiation increases LER
145

Appendix A
146

Temporal niche differentiation increases LER
147
Table A3 Availability of information on selected variables in the data set of the random sample.Variable Number of
publications
Number of
experiments
Number of data records
Title 50 102 401
Authors 50 102 401
Continent 50 102 401
Country 50 102 401
Latitude and longitude 50 102 401
Species 50 102 401
Sowing and harvest date 50 102 401
C3/C4 50 102 401
Legume/non-legume 50 102 401
Intercropping pattern 45 88 352
Density of crops 41 80 331
Amount of N fertilizer 30 56 247
Yield 50 102 401
* In the top cited sample, 345 data records with all variables mentioned above were extracted from 87 experiments out of the 50 publications.
Table A4 Coding system for the strategy for supplying N in intercropping experiments. Nicrepresent amount of N applied in intercrops, Nsc,1 and Nsc, 2 represent the amount of N applied in sole crops.N_Code N in intercrops and sole crops No. of data records
1 Nic=Nsc,1=Nsc,2 339
2 min(Nsc,1,Nsc,2)< Nic < max(Nsc,1,Nsc,2) 67
3 Nic = min(Nsc,1,Nsc,2) 67
4 Nic = max(Nsc,1,Nsc,2) 109
5 Nic > max(Nsc,1,Nsc,2) 4
6 Nic < min(Nsc,1,Nsc,2) 6

Appendix A
148
Table A5 Contingency table for frequency of intercrops without a legume, or with one or two legumes in the case of C3/C3, C3/C4 and C4/C4 species combinations in the intercrop.
No legume 1 legume species 2 legume species Total
C3/C3 63 312 31 406
C3/C4 25 313 0 338
C4/C4 2 0 0 2
Total 90 625 31 746

149
Appendix B
Robust increases of land equivalent ratio with temporal niche
differentiation: A meta-analysis with quantile regression
Fig. B1 Estimates of interactive effect between TND and rate of N fertilizer with two
datasets: one dataset with all data reporting N rate, irrespective of N strategies and one subset
with only the data of N strategy 1 which is the main N strategy in the database.
Table B1 Variables extracted from publications.
Table B2 Availability of information on selected variables in data set for this meta-analysis.

Appendix B
150
Fig. B1 Estimates of interactive effect between TND and rate of N fertilizer using model 3: QLER(τ|TND, N) = β0(τ) + β1(τ)*TNDi + β2(τ)*N i + β3(τ)*TNDi*Ni, for values of τ ranging from 0.1 to 0.9 with increment of 0.05 with two datasets. Estimates with a dataset including all data reporting rate of N (a). Estimates with a subset only consisting of N Strategy 1 (b), i.e. equal amount of N fertilizer was received in intercrops and sole crops. Circles represent estimates of β3 and triangles represent upper or lower boundary of 95% confidence intervals of estimated values. The horizontal line indicates 0. There was no difference of trend for interactive effect between TND and rate of N fertilizer with quantiles between datasets.

Robust increases of LER with temporal niche differentiation
151
Table B1 Variables extracted from publications.Variable Definition Unit
Title Title of publication -
Authors Authors of publication -
Continent In which continent experiments were carried out -
Country In which country experiments were carried out -
Latitude and longitude Latitude and longitude of experimental site Degree
Year Year in which experiments were carried out -
Species Latin name and common name of crop species -
Sowing and harvest date Sowing and harvest date of intercropped species or
related information for calculating TND
-
C3/C4 Whether one or both crops are C3 or C4 species -
Legume/non-legume Whether one or both crops are legume or non-
legume species
-
Intercropping pattern In which way the two species were intercropped. -
Strip intercropping: two species cultivated in
alternative strips and at least one strip includes
more than one row;
Row intercropping: two species cultivated in
alternative rows;
Fully mixed intercropping: two species cultivated in
the same field without any pattern.
Density of crops Density of each species in sole crops and in
intercrop
Plants/ha
Rate of N fertilization How much N fertilizer was applied to sole crops
and to intercrops
kg/ha
Yield Grain yield or total biomass if fodder crops ton/ha

Appendix B
152
Table B2 Availability of information on selected variables in the dataset for this meta-analysis.Variable Number of
publications
Number of
experiments
Number of data
records
Title 100 189 746
Authors 100 189 746
Continent 100 189 746
Country 100 189 746
Latitude and
longitude
100 189 746
Species 100 189 746
Sowing and harvest
date
100 189 746
C3/C4 100 189 746
Legume/non-legume 100 189 746
Intercropping
pattern
95 175 697
Density of crops 91 167 676
Amount of N
fertilizer
80 143 592
Yield 100 189 746

153
Appendix C
Plant traits drive spatially and temporally complementary light capture,
photosynthesis, and productivity in plant mixtures
Movie C1 Simulation of plant growth in a mixture of tillering species with tall&high Amax
species in configuration I (every 6 rows of tillering species mixed with 1 row of non-tillering
species) at TND=0, i.e. simultaneously sown and harvested. The total simulation time is 150
simulation days.
Link: https://youtu.be/2NT-mFxW0Rk
Movie C2 Simulation of plant growth in a mixture of tillering species with tall&high Amax
species in configuration I (every 6 rows of tillering species mixed with 1 row of non-tillering
species) at TND=0.5. TND equal to 0.5 means the tillering species is sown first and harvested
at simulation day of 150 while the non-tillering species is sown 50 simulation days later than
sowing of the tillering species and harvested at simulation day of 200. The total simulation
time is 200 simulation days.
Link: https://youtu.be/8c-iLZrZRPc
Movie C3 Simulation of plant growth in a mixture of tillering species with tall&high Amax
species in configuration II (every 6 rows of tillering species mixed with 2 rows of non-
tillering species) at TND=0.5. TND equal to 0.5 means the tillering species is sown first and
harvested at simulation day of 150 while the non-tillering species is sown 50 simulation days
later than sowing of the tillering species and harvested at simulation day of 200. The total
simulation time is 200 simulation days.
Link: https://youtu.be/YF4YzsyxzXE

155
Appendix D
A meta-analysis of relative crop yields in cereal/legume mixtures suggests
options for management
Table D1 List of Variables extracted from publications and availability of information.
Fig. D1 Estimates of relationship between PLER and rate of N fertilizer application for
different N application strategies.

Appendix D
156
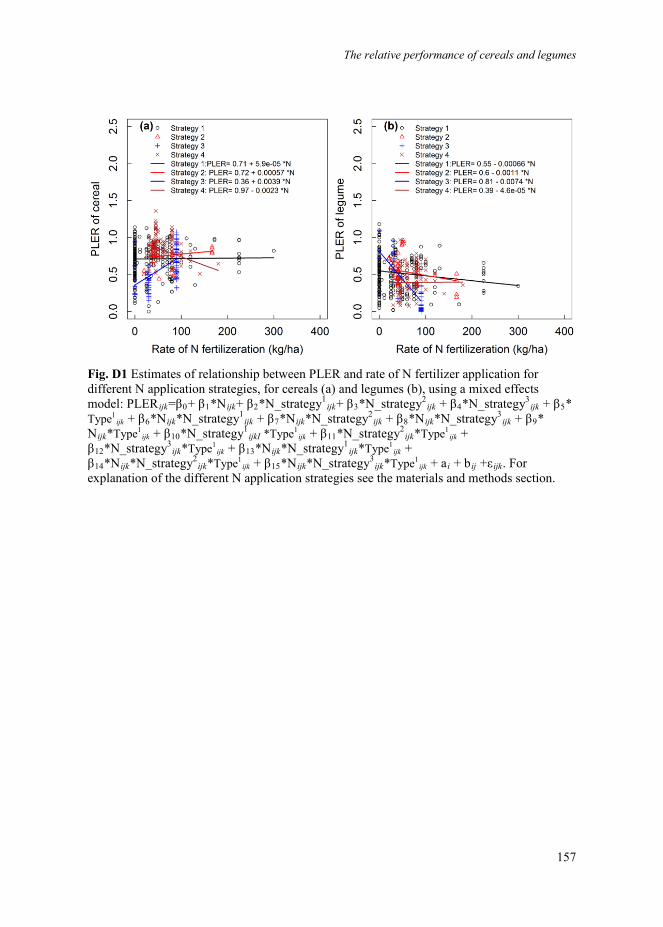
The relative performance of cereals and legumes
157
Fig. D1 Estimates of relationship between PLER and rate of N fertilizer application for different N application strategies, for cereals (a) and legumes (b), using a mixed effects model: PLERijk=β0+ β1*Nijk+ β2*N_strategy1
ijk+ β3*N_strategy2ijk + β4*N_strategy3
ijk + β5*Type1
ijk + β6*Nijk*N_strategy1ijk + β7*Nijk*N_strategy2
ijk + β8*Nijk*N_strategy3ijk + β9*
Nijk*Type1ijk + β10*N_strategy1
ijkI *Type1ijk + β11*N_strategy2
ijk*Type1ijk +
β12*N_strategy3ijk*Type1
ijk + β13*Nijk*N_strategy1ijk*Type1
ijk +β14*Nijk*N_strategy2
ijk*Type1ijk + β15*Nijk*N_strategy3
ijk*Type1ijk + ai + bij +εijk. For
explanation of the different N application strategies see the materials and methods section.


159
SummaryOne of the major global challenges is to produce enough food for an increasing and more
affluent population with reduced environmental impacts. Ecological intensification of modern
agriculture, i.e. using ecological means to increase or at least maintain crop production while
simultaneously mitigating the footprint of agriculture on the environment is one way to go.
Intercropping, i.e. the growing of more than one species simultaneously on a field, is an
application of ecological intensification in agriculture. As compared to sole cropping (i.e.,
growing only one species), intercropping may increase productivity and resource use
efficiency. The ecological mechanisms that drive these benefits include: niche
complementarity and facilitation. The yield advantage of intercropping is often assessed using
the land equivalent ratio (LER). LER is calculated as the sum of relative yield of intercropped
species as compared to the respective sole crops. LER can be interpreted as the relative area
required by sole crops to produce the same yields as achieved in intercrop. LER>1 means
intercropping is more efficient in land use than sole cropping and LER<1 implies
intercropping is less efficient. A large variation in LER is found in the literature. Many factors
could contribute to this variation, including temporal arrangement of mixed species, crop
management and species identity. Knowing the relative contributions of these factors would
provide important clues to improve intercropping systems. However, so far, few studies have
attempted to quantitatively analyze how these factors affect LER. In this thesis, I therefore
investigated how temporal niche difference, crop type combination as well as agronomic
practices affect LER, productivity and the interspecific interactions in annual intercrops.
In Chapter 2, I investigated how LER is affected by species traits and designs of
intercropping systems using meta-analysis, based on data collected from publications on
intercrop productivity around the globe. I focused on the effects of temporal niche difference
between the intercropped species, intercropping pattern, relative density total (sum of the
relative densities of intercropped species as compared to the respective sole crops), the use of
C3 and C4 species and the rate of N fertilizer. Statistical mixed effects models were used to
evaluate the relationships. Random effects were included to account for factors that influence
crop performance, but could not be analyzed in detail due to lack of consistent and
sufficiently detailed reporting in the literature, e.g. weather variables, soil factors, pest,
diseases, and weeds. Random effects associated with experiments and publications account
for the effects associated with location, year and study which are not accounted by the
independent variables. The analysis showed that LER increases with temporal niche

Summary
160
differentiation. The positive relationship between LER and the temporal niche difference is
stronger in C3/C4 mixtures than in C3/C3 mixtures (only two cases about C4/C4 mixtures
occur in the data set, therefore not analyzed). Application of nitrogen fertilizer decreases LER
when there is no temporal niche difference between intercropped species (i.e. sown and
harvested simultaneously) while the negative effect of N on LER is alleviated when the
temporal niche difference increases. These findings indicate that temporal niche difference is
a key factor determining land use efficiency of intercropping but this effect can be modified
by species traits and agronomic practices.
Apart from the variation in LER related to temporal niche difference, crop type
combination and agronomic practices, there is still large unexplained variation in LER that is
likely associated with variation in environmental factors, e.g. weather conditions, soil
qualities which are not often measured in intercropping studies. In Chapter 3, quantile
regression is used to test whether relationships between LER and explanatory variables, e.g.
temporal niche difference depend on these unmeasured factors. The results showed that the
effect of temporal niche difference on LER is not changed with quantiles, indicating that the
relationships found in Chapter 2 are robust and are not changed qualitatively or quantitatively
by the factors not included in the analyses.
In Chapter 4, a functional-structural plant (FSP) model was developed to investigate
how interspecific interactions and productivity of individual species in strip intercropping are
affected by the interplay between temporal and spatial complementarity and plant traits of the
late-sown species, i.c. variation in maximum plant height and CO2 assimilation rate (Amax).
The analysis showed that temporal niche difference increases productivity of early-sown
species until a plateau when the temporal overlap between the growth duration of the early-
and late-sown species becomes less than 50% of the total growing period. By contrast,
productivity of the late-sown species suffered from competition for light with the early-sown
species, especially at moderate delays in sowing time compared to the early-sown species and
when the spatial configuration of the mixture allowed strong interspecific interactions. The
negative effect of shading by the early-sown species on growth and productivity of the late-
sown species was smaller if the later-sown species had a high genetic potential for length
growth and a high Amax. The competition mitigating effect of a high Amax in the later-sown
species was greater than that of its tallness. The analysis shows that the spatial and temporal
complementarity in species mixtures (sowing pattern and sowing time) can be strongly
affected by plant traits of the component species.

Summary
161
In Chapter 5, I investigated how competitiveness of individual species in
cereal/legume intercrop is affected by agronomic management practices, i.c. sowing time,
sowing density and rate of N fertilizer. The analysis shows that cereals are overall more
competitive than legumes. Earlier sowing of one species increases its competitiveness towards
the other species while later sowing decreases it. A high density of a species in the intercrop
compared to its density in the respective sole crop had a positive effect on its competitiveness.
Application of N fertilizer enhanced the competitiveness of a cereal towards a legume,
resulting in overall low productivity of legumes in intercrops. However, sowing legumes a bit
earlier than cereals mitigates the negative effect of N on productivity of the legume. These
findings help us understand how competitiveness of intercropped species are influenced by
agronomic practices and can be used to optimize designs of intercropping systems according
to our demands.
In conclusion, many studies have been conducted on intercropping and have reported a
large variation in performance of intercropping in terms of land use efficiency, productivity
and interspecific interactions. There was a lack of quantitative synthesis of information from
the large body of intercropping studies and a need to generalize what factors influence the
performance of intercropping. In this thesis, I quantitatively showed that complementarity of
resource use resulting from plant traits diversity and temporal and spatial arrangements of the
mixtures is one of the key mechanisms for high productivity of intercropping. This thesis only
focused on elaborating complementary use of light and nitrogen in species mixtures. More
research is needed to explore how other mechanisms drive intercropping productivity, e.g.
complementary nutrient acquisition below-ground due to asynchronous distribution of plant
roots and effects of pests and diseases. I hope that the analyses and datasets assembled in this
thesis provide a useful basis for further analyses demonstrating how diversification of
agricultural systems can help to meet the demand for food and other crop produce while
moderating agriculture’s environmental impacts.


163
Acknowledgements This thesis is not complete without expressing my sincere gratitude to people who helped me
during my PhD study.
Firstly, I want to thank Lizhen Zhang at China Agricultural University who supervised
me during my MSc study and encouraged me to conduct my PhD research in the Netherlands.
Without Lizhen’s encouragement and suggestions, I would never have had the courage to
study in the Netherlands, some 8000 km away from China.
I would like to express my deepest gratitude to my excellent supervision team, Niels
Anten, Wopke van der Werf, and Tjeerd Jan Stomph. Without you, I would never have
finished my PhD thesis. I am very grateful that Niels joined in my project and became my
promoter. I want to thank Niels for his great contributions to the revisions of my thesis. His
timely and critical comments enormously improved the quality of my thesis.
I want to express my earnest thanks to Wopke van der Werf, my first co-promoter,
who gave me the chance to pursue my PhD degree at Wageningen University. I benefited
greatly from his professional supervision and critical commenting. He taught me the
importance of articulating research questions and scientific hypotheses. I also appreciate the
suggestions from Wopke on the need for a broader personal development. Taking courses
greatly improved my English, and scientific and social skills. I am very grateful for his
comments and criticisms on my manuscripts which not only greatly improved the quality of
my work but also my scientific writing. All this training will be extremely valuable in my
further career. In my daily life in the Netherlands, Wopke is like a friend and a father to me.
When I was facing problems, he always gave me timely suggestions. My gratitude to Wopke
is beyond words. I also want to thank his wife, Saskia Beverloo for her hospitality and
delicious Dutch dinners.
I would like to express my sincere gratitude to Tjeerd Jan Stomph, my second co-
promoter. I am so lucky to have him as one of my co-promoters. I am amazed by the breadth
of his knowledge and scientific interests. His understanding of intercropping provided an
indispensable source of ideas. I am grateful to Tjeerd Jan for his patience and constructive
suggestions. Whenever I was stuck with writing or analyzing the data, he was willing to
discuss and to inspire me. I enjoyed the discussions with Tjeerd Jan. I benefited a lot from his
careful attitude. His critical comments and suggestions on my manuscripts enhanced the
quality of my thesis greatly.

Acknowledgements
164
I want to thank David Makowski, at INRA, Thiverval-Grignon, France. When I was
struggling with statistical methods to conduct meta-analyses, he helped me disentangle the
puzzles. I visited him two times at INRA for collaboration. He is wise, cooperative and open-
minded. I enjoyed the collaboration with him and appreciate his great contributions to my
thesis.
I would like to express my gratitude to Jorad de Vries and Jochem Evers. I am
impressed by their knowledge and skills in functional-structural plant (FSP) modelling. I am
grateful that I had the chance to collaborate with them. I learnt a lot from them, not only about
development of FSP models, but also about scientific writing. I appreciate their contributions
to the FSP modelling study in Chapter 4 of my thesis.
I would like to thank Fusuo Zhang for inviting me to two international intercropping
workshops and the field trips to Gansu, China. In these workshops and field trips, I broadened
my understanding about agricultural production systems and gained a lot of knowledge about
soil-plant feedbacks.
I want to thank Gerrit Gort of the Mathematical and Statistical Methods group for his
helpful suggestions on data analysis. I am very grateful to him for organizing so many
interesting and useful PhD statistical courses. I improved my statistical skills by taking these
courses.
I want to thank all the staff and colleagues from Centre for Crop Systems Analysis
(CSA), who made me feel very welcome. Special thanks to the secretaries: Sjanie van Wetten,
Nicole Wolffensperger, and Wampie van Schouwenburg and the financial officer: Alex-Jan
de Leeuw. I am very grateful for their help and support during my PhD study. Their help
made my life in Wageningen much easier. I want to thank Jan Vos and his wife Ada for
serving me and other Chinese friends many times delicious Dutch dinners and organizing a
wonderful trip to the Northern Netherlands. I would like to express my gratitude to all the
staff and colleagues from CSA and Plant Production Systems for the interesting discussions
and the helpful suggestions on my study. Many thanks to Paul Struik, Xinyou Yin, Lammert
Bastiaans, Pepijn van Oort, Bob Douma, Peter Vermeulen, Aad van Ast, Peter van der Putten,
Willemien Lommen, Steven Driever, Marjolein Lof, Willemien Geertsema, Maja Slingerland,
Marcel Lubbers, Bert Rijk, Joost van Heerwaarden, Ken Giller, Martin van Ittersum and many
others for their help.
I want to thank all my friends and PhD fellows in Wageningen. I am so lucky that I
know you guys in Wageningen, which makes me feel like home away from home. Special

Acknowledgements
165
thanks to Wei Qin, Chunxu Song, Mingtian Yao, Xiaosu Gao, Xinxin Wang, Junqi Zhu,
Wenfeng Cong, Lin Ma, Liansun Wu: your help and advice when I arrived at Wageningen
facilitated my adaptation to the Western life style. I will keep this beautiful time in memory
for ever. Many thanks to Guohua Li, Fang Gou, Feng Zhu, Zhaohai Bai, Xia Liu, Jingying
Jing, Junfei Gu, Vivi He, Chidu Huang, Yong Hou, Jingmeng Wang, Qian Liu, Yong Liu,
Hao Zhang, Baoliang Chi, Dan Yan, Tian Zeng, Hongming Zhang, Tingting Li, Peipei Yang,
Yunyu Pan, Bin Chen, Kailei Tang, Wenjing Ouyang, Chunjie Li, Zheng Huang, Yu Hong,
Xu Cheng, Bing Bai, Wei Song, Kaile Sun, Xiao Lin, Liping Weng, Guiyan Wang, Fulu Tao,
Shenghao Gu, Yi Zou, Chaochun Zhang, Chengdong Huang, Xiaoyan Tang, Meixiu Tan,
Yajun Wang for your company, help, and understanding. Thanks to my PhD fellows Ioannis
Baltzakis, Uta Priegnitz, Tatiana Rittl, Vu Nam, Stella Kabiri, Alejandro Morales Sierra,
Marcelo Labra Fernandez, Herman Berghuijs, Andre Braga Junqueira, Marcia Carvalho,
Clara Pena Venegas, Marloes van Loon, Merel Jansen, Giovani Theisen, Franca Bongers,
Guillaume Ezui, Joao Nunes Vieira da Silva, Luuk van Dijk, Martin Sikma, Cesar Ospina
Nieto, Vicky Aerts, Adugna Bote, Waga Dersseh, Dennis Tippe, Nynke Lobregt, and Ingrid
Lubbers: you made my life in Wageningen full of sweet memories.
I would like to express my deepest gratitude to my parents for their love and support.
Their understanding and encouragements helped me to move forward. I would like to express
my gratitude to Chuchu Liu: your support and encouragements was indispensable for the
completion of my thesis. I am grateful for your company, bringing me a lot of happiness and
making my life more colourful.
Thanks to all of you!
Yang Yu,
Wageningen, the Netherlands,
14th March, 2016


167
Publication list
Yu, Y., Stomph, T.J., Makowski, D., van der Werf, W., 2015. Temporal niche differentiation
increases the land equivalent ratio of annual intercrops: A meta-analysis. Field Crops
Research 184: 133-144.
Yu, Y., Makowski, D., Stomph, T.J., van der Werf, W. Robust increase of land equivalent
ratio with temporal niche differentiation: A meta-analysis with quantile regression. (In
preparation)
Yu, Y., de Vries, J., Stomph, T.J., Evers, J.B., Anten, N.P.R., Zhang, L.Z., van der Werf, W.
Plant traits drive spatially and temporally complementary light capture,
photosynthesis, and productivity in plant mixtures. (In preparation)
Yu, Y., Stomph, T.J., Makowski, D., Zhang, L.Z., van der Werf, W. A meta-analysis of
relative crop yields in cereal/legume mixtures suggests options for management. (In
preparation)
Zhang, C.C., Dong, Y., Yu, Y., Tang, L., Zheng, Y., Makowski, D., van der Werf, W., Zhang,
F.S. Cereal/legume intercropping suppresses plant diseases: A meta-analysis. (In
preparation)


169
PE&RC Training and Education Statement
With the training and education activities listed below the PhD
candidate has complied with the requirements set by the C.T. de
Wit Graduate School for Production Ecology and Resource
Conservation (PE&RC) which comprises of a minimum total of
32 ECTS (= 22 weeks of activities)
Review of literature (6 ECTS)
- Resource use efficiency in intercrop systems
Writing of project proposal (4.5 ECTS)
- Resource use efficiency in intercrop systems: from empirical analysis to process-based modelling (2013)
Post-graduate courses (6.3 ECTS)
- Introduction to R for statistical analysis; PE&RC (2012)- Meta-analysis; PE&RC (2012)- Mixed linear models; PE&RC (2013)- Zero inflated models and GLMM with R; PE&RC (2014)- Meta-analysis; PE&RC (2014)- Bayesian statistics; PE&RC (2014)
Laboratory training and working visits (2.4 ECTS)
- Discussion on techniques of meta-analysis; INRA, Grignon, France (2013)- Study techniques of meta-analysis; INRA, Grignon, France (2013)
Invited review of (unpublished) journal manuscript (1 ECTS)
- Organic Agriculture: intercropping of maize and pulse: an evaluation of organic systems
Deficiency, refresh, brush-up courses (18 ECTS)
- Systems analysis, simulation and systems management (2011)- Advanced statistics (2011)- Ecological models and data in R (2012)

PE&RC Training and Education Statement
170
Competence strengthening / skills courses (2.7 ECTS)
- Information literacy PhD including EndNote introduction; Wageningen UR Library (2012)
- Project and time management; Wageningen Graduate Schools (2013)- Interpersonal communication for PhD candidates; Wageningen Graduate Schools
(2013)
PE&RC Annual meetings, seminars and the PE&RC weekend (1.5 ECTS)- PE&RC Weekend (2011)- PE&RC Weekend (2014)
Discussion groups / local seminars / other scientific meetings (5.5 ECTS)- Plant production system seminars (2012-2014)- R Using meeting (2014)- Sustainable intensification of agriculture systems (2014)
International symposia, workshops and conferences (8.8 ECTS)- International intercropping workshop; oral presentation; China (2013)- European Society of Agronomy Congress; poster and oral presentation; Hungry
(2014)- Netherlands Annual Ecology Meeting; oral presentation; the Netherlands (2014)- International intercropping workshop; oral presentation; China (2015)
Lecturing / supervision of practical’s / tutorials (3.6 ECTS)- Plant and soil interaction (2013-2014)- Population and systems ecology (2014)

171
Curriculum vitae Yang Yu was born on 31st July, 1986 and grew up in Dandong,
Liaoning Province, China. In 2005, he graduated from high school and
began a four year BSc study at Agro-meteorology group, China
Agricultural University (CAU). He received his BSc degree in 2009
and started a two year MSc study at Agro-meteorology group, CAU.
During his MSc study, he focused the effect of intercropping on
mitigating the soil wind erosion in Inner Mongolia, China. In 2011, he received his MSc
degree and got a scholarship from China Scholarship Council supporting him to start his PhD
research in Wageningen University in Centre for Crop Systems Analysis group. During his
PhD study, he focused on productivity and land use efficiency in intercropping, under the
supervision of promoter Prof. dr. Niels Anten and co-promoters dr. Wopke van der Werf and
dr. Tjeerd Jan Stomph. Details of his PhD research are presented in this thesis.

172
FundingThe research described in this thesis was financially supported by the scholarship from China
Scholarship Council and National Science Foundation of China (grant number:
31210103906).
Cover design Yang Yu
Printing GVO drukkers & vormgevers B.V., Ede