· web viewuse the word “biomass” where necessary. gross primary productivity - _____ net...
TRANSCRIPT

AP Biology
Lab: Energy Dynamics in an Ecosystem
BACKGROUND
Almost all life on this planet is powered, either directly or indirectly, by sunlight. Energy captured from sunlight drives the production of energy-rich organic compounds during the process of photosynthesis. These organic compounds are the biomass of the ecosystem. The biomass is equivalent to the net primary productivity, which is the net amount of energy captured and stored by the producers. This is also the amount of energy available to the next trophic level. The net primary productivity is derived from the gross primary productivity, which is a measure of the total amount of light energy that was captured and converted into chemical energy (organic compounds) during Photosynthesis. To obtain the net productivity you must subtract all the energy that was used in cellular respiration and ultimately released as heat, from the gross productivity.
In terrestrial systems, plants play the role of producers. Plants allocate that biomass (energy) to power their life processes or to store energy. Different plants have different strategies of energy allocation that reflect their role in various ecosystems. For example, annual weedy plants allocate a larger percentage of their biomass production to reproductive processes and seeds than do slower growing perennials. As plants, the producers are consumed or decomposed, and their stored chemical energy powers additional individuals, the consumers, or trophic levels of the biotic community. Biotic systems run on energy much as economic systems run on money. Energy is generally in limited supply in most communities. Energy dynamics in a biotic community is fundamental to understanding ecological interactions.
Learning Objectives• To explain community/ecosystem energy dynamics, including energy transfer between the
difference trophic levels.• To calculate biomass, net primary productivity (NPP), secondary productivity, and respiration,
using a model consisting of Brussels sprouts and butterfly larvae.
There are two parts to this lab:
Part 1. You will estimate the net primary productivity (NPP) of Wisconsin Fast Plants over several weeks
Part 2. You will calculate the flow of energy from plants (producers) to butterfly larvae (primary consumers). These calculations will include an estimate of (a) secondary productivity, which would be the amount of biomass added to the larvae and therefore available to the next trophic level, and (b) the amount of energy lost to cellular
respiration.
1

PART 1: Estimating Net Primary Productivity (NPP) of Fast Plants
Primary productivity is a rate—energy captured by photosynthetic organisms in a given area per unit of time. Based on the second law of thermodynamics, when energy is converted from one form to another, some energy will be lost as heat. When light energy is converted to chemical energy in photosynthesis or transferred from one organism (a plant or producer) to its consumer (e.g., an herbivorous insect), some energy will be lost as heat during each transfer.
In terrestrial ecosystems, productivity (or energy capture) is generally estimated by the change in biomass of plants produced over a specific time period. Measuring biomass or changes in biomass is relatively straightforward: simply mass the organism(s) on an appropriate balance and record the mass over various time intervals. The complicating factor is that a large percentage of the mass of a living organism is water—not the energy-rich organic compounds of biomass. Therefore, to determine the biomass at a particular point in time accurately, you must dry the organism. Obviously, this creates a problem if you wish to take multiple measurements on the same living organism. Another issue is that different organic compounds store different amounts of energy; in proteins and carbohydrates it is about 4 kcal/g dry weight and in fats it is 9 kcal/g of dry weight).
Define the following terms, and then fill in the diagram below showing energy transfer in plants. Use the word “biomass” where necessary.
• gross primary productivity - ________________________________________________________
_________________________________________________________________________________
• net primary productivity - __________________________________________________________
_________________________________________________________________________________
• secondary productivity - ___________________________________________________________
_________________________________________________________________________________
Review the energy transfer in plants by filling in the arrows below:
Review the energy transfer in primary consumers (butterflies) by filling in the arrows below:
2
Gross Productivityin Plants

Procedure (For each section, you need to show ALL CALCULATIONS on the lines or spaces provided)
Step 1:A student started 40 Wisconsin Fast Plants and grew them for 7 days under controlled conditions in a plant tray.
Step 2:On day 7, she randomly selected 10 of the plants and removed them with their roots intact from the soil. She carefully washed the soil from the roots and then blotted the roots dry and measured the wet mass of the 10 plants collectively.
Wet Mass of 10 Plants (Day 7) = 19.6g
Step 3:She then took the 10 plants and placed them in a ceramic drying bowl and placed them in a drying oven at 200oC for 24 hours. After 24 hours, she measured the mass of the dry plants.
Dry Mass 10 Plants (Day 7) = 4.2g
Step 4:Use the following equation to calculate percent biomass:
% biomass = mass of dry plants x 100 mass of wet plants
Calculate the percent biomass of the 10 plants. ____________________________________
3
Energy Processed by Butterfly Larvae
Wisconsin Fast Plant Growth

Note how much of the plant’s total mass is actually biomass (organic compounds), and how much is made up of water.
Calculations of Net Primary Productivity:
Each gram of a Fast Plant’s dry biomass is equivalent to 4.35 kcal of energy. Note: throughout this lab, the energy equivalents of biomass in kcal (plant or animal) were obtained in a laboratory using a calorimeter that measures the amount of energy per gram of organism.
To calculate the amount of energy (in kcal) in the plants, multiply 4.35 kcal/g x the dried biomass (from previous page).
• Calculate the amount of energy (in kcal) in 10 plants that are 7 days old. ___________________
• Calculate the average amount of energy in 1 plant that is 7 days old. _______________________
Net Primary Productivity (NPP) is the amount of energy stored (added) as biomass per day by autotrophs in an ecosystem and is expressed in units of kcal/day.In this section, you will be calculating the NPP per plant per day.
Organize your data from the previous page in the following table:
Age in days
Wet Mass/10 plants
Dry mass/10 plants
Percent biomass
Energy (g biomass x 4.35 kcal per 10 plants)
Energy (g biomass x 4.35 kcal per plant)
Net primary productivity per day per plant
7 19.6 4.2 21.4% 18.3 1.83Note: To adjust the data to “per day,” in the last column divide by 7 because the plants are 7 days old.
Step 5:On day 14, she again randomly selected 10 plants and removed them with their roots intact from the soil. After cleaning the soil off the roots, she obtained the wet mass and dry mass of the plants.
Wet Mass 10 Plants (Day 14) = 38.4gDry Mass 10 Plants (Day 14) = 9.3g
Again, organize your data from above in the following table:
Age in days
Wet Mass/10 plants
Dry mass/10 plants
Percent biomass
Energy (g biomass x 4.35 kcal per 10 plants)
Energy (g biomass x 4.35 kcal per plant)
Net primary productivity per day per plant
14
4

Note: To adjust the data to “per day,” in the last column divide by 14 because the plants are 14 days old.
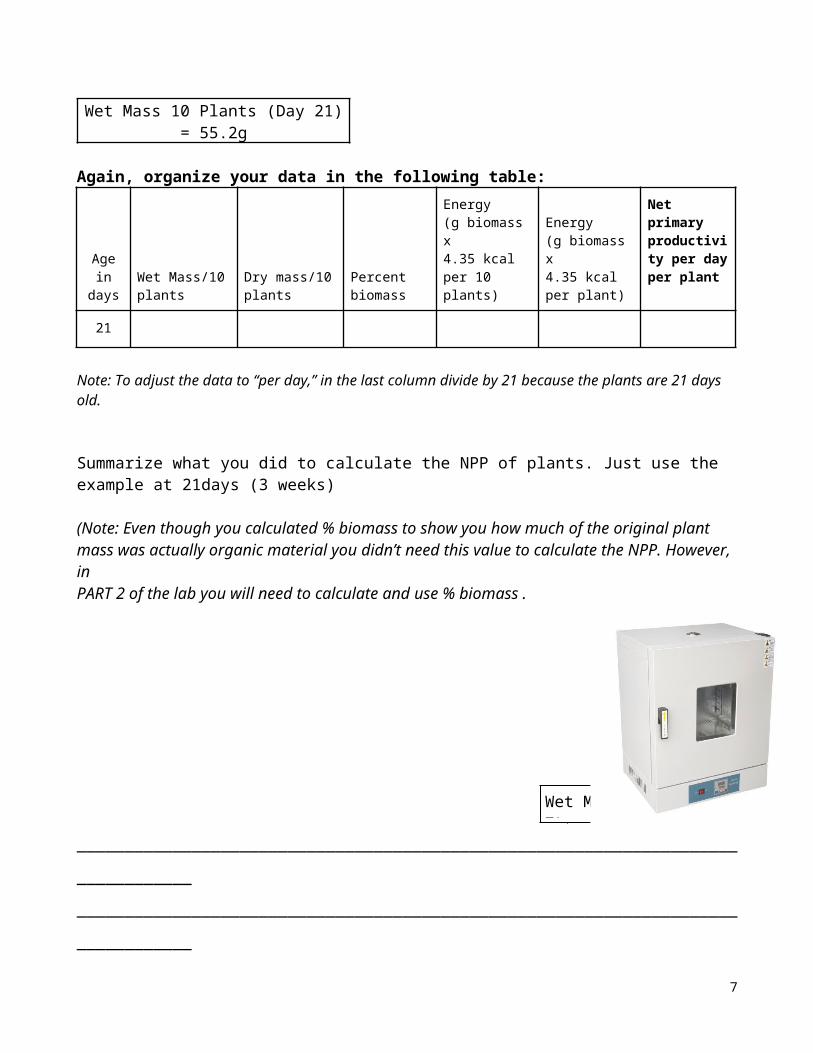
Step 6: On day 21, she again randomly selected 10 plants and removed them with their roots intact from the soil. After cleaning the soil off the roots, she obtained the wet mass and dry mass of the plants.
Wet Mass 10 Plants (Day 21) = 55.2gDry Mass 10 Plants (Day 21) = 15.5g
Again, organize your data in the following table:
Age in days
Wet Mass/10 plants
Dry mass/10 plants
Percent biomass
Energy (g biomass x 4.35 kcal per 10 plants)
Energy (g biomass x 4.35 kcal per plant)
Net primary productivity per day per plant
21
Note: To adjust the data to “per day,” in the last column divide by 21 because the plants are 21 days old.
Summarize what you did to calculate the NPP of plants. Just use the example at 21days (3 weeks)
(Note: Even though you calculated % biomass to show you how much of the original plant mass was actually organic material you didn’t need this value to calculate the NPP. However, in PART 2 of the lab you will need to calculate and use % biomass .
_________________________________________________________________________________
_________________________________________________________________________________
_________________________________________________________________________________
_________________________________________________________________________________
_________________________________________________________________________________
5
Dry Mass 10 Plants (Day 7) = 4.2gWet Mass of 10 Plants (Day 7) = 19.6g

_________________________________________________________________________________
_________________________________________________________________________________
_________________________________________________________________________________
_________________________________________________________________________________
______________________________________________________________________________
Step 7:The NPP data for a sample class with 7 groups is shown in the table below. The data for Group 1 has been left out. You are to fill in your data as Group 1.
Class Data: Net Primary Productivity – Wisconsin Fast PlantsTime
(Days)Group
1Group
2Group
3Group
4Group
5Group
6Group
7
AverageData
(Mean)
7 0.25 0.25 0.27 0.26 0.27 0.26
14 0.28 0.29 0.30 0.29 0.30 0.28
21 0.31 0.32 0.31 0.32 0.33 0.32
6
Step 8:
Data Analysis• Graph the Class Average (mean) NPP vs. Time.
7

• Why does the NPP increase over time (as the plants grow and mature)?_________________________________________________________________________________
_______________________________________________________________________________________________________________________________________________________________________________________________________________________________________
PART 2: Estimating Energy Transfer from Producers to Primary Consumers
In this experiment, you will be using a simple two-step food chain using Brussels sprouts as the producers, and cabbage butterflies as the primary consumers.
Review the energy transfer in primary consumers (butterflies) by filling in the arrows below:
In this part of the lab you will be using Brussels sprouts as your producers, and cabbage butterfly larvae as your primary consumers. Refer to the diagram above, and on a separate piece of paper discuss with your group how you would go about calculating the secondary productivity (in kcal) and the amount of energy (in kcal) lost to cellular respiration.
In order to calculate plant, larvae, and frass energy in kilocalories (kcal), you must multiply by known values measured in kilocalories for these organisms. Example: to calculate plant energy, you multiple the biomass by 4.35 kcal/g, for the larvae you multiple biomass by 5.5 kcal/g, and for the frass you multiply by 4.75 kcal/g.
Explain why these values differ depending on which organism (or waste material) you are measuring?
__________________________________________________________________________________8
Energy Processed by Butterfly Larvae
Wet Mass 10 Plants (Day 14) = 38.4g
Dry Mass 10 Plants (Day 14) = 9.3g
Wet Mass 10 Plants (Day 21) = 55.2g
Dry Mass 10 Plants (Day 21) = 15.5g

__________________________________________________________________________________
__________________________________________________________________________________
Step 1:The student took Brussels sprouts, which are in the same family (Brassicacae) as Wisconsin Fast Plants and placed them in an aerated container with air holes along with 10 caterpillar larvae that were 12 days old. (Figure 4)
Before assembling the container, the wet mass of the Brussels sprouts and wet mass of the caterpillars was taken.
Wet Mass Brussels sprouts = 30gWet Mass of 10 Larvae = 0.3g
Step 2:After 3 days, she disassembled the container and took the mass of the components indicated below. At this point the caterpillar larvae were 15 days old.
Wet Mass Brussels sprouts = 11gWet Mass 10 Larvae = 1.8g
Step 3:She then used a drying oven to obtain the dry biomass of the 10 caterpillar larvae, the remaining Brussels sprouts, and the dried frass.
Dry Mass Brussels sprouts = 2.2gDry Mass 10 Caterpillar Larvae = 0.27g
Mass of Frass (Dry Egested Waste) from 10 Larvae = 0.5g
In order to calculate the flow of energy from plants to butterfly larvae, you will fist need to calculate the % biomass of both the plant and the larva. Use the information on this page to complete the following chart. You will than use the % biomass value to calculate energy flow.
Brussel Sprouts 10 Larvae FrassDay 1WET wt. N/A
Day 3WET wt. N/A
9

Day 3DRY wt.% BiomassDry/Wet N/A
Tables of Energy/Biomass Flow from Plants to Butterfly LarvaeYou will be using the percent biomass of both plants and larvae to calculate the energy lost by plants or gained larvae in the following calculations. In part 1 of the lab the dried biomass was used to calculate net primary productivity. In part 2 of the lab you are using percent biomass because you cannot directly calculate the biomass for the Brussels sprouts or larvae on day 1. Why? Answer on pg. 10
Table 1: Brussels SproutsDay 1 Day 3
Wet mass of Brussels Sprouts gms consumed ____________
Plant percent biomass (dry/wet)
Plant energy (wet mass x percent biomass x 4.35 kcal) kcals consumedper 10 larvae ___________
Plant energy consumed per larvae (plant energy/10) kcals consumedper larvae (÷ 10) ___________
Table 2: Butterfly LarvaeDay 1 Day 3
Wet mass of 10 larvae gms gained ____________
Wet mass per individual gms gainedper larvae ____________
Larvae percent biomass (dry/wet)
Energy production per individual(individual wet mass x percent biomass x 5.5 kcal/g
kcals gainedper larvae ____________
Table 3: FrassDay 3
Dry mass of the frass from 10 larvae
Frass energy (waste) = frass mass x 4.75 kcal/g
Dry mass of the frass from 1 larva
Table 4: Respiration
10

Respiration (show calculation) Day 3
Questions: 1) In part 1 of the lab the dried biomass was used to calculate net primary productivity. In part 2 of the lab you are using percent biomass because you cannot directly calculate the biomass for the Brussels sprouts or larvae on day 1. Why?_________________________________________________________________________________
__________________________________________________________________________________
__________________________________________________________________________________
Refer to Tables 1, 2 and 4 on the previous page to answer the next 2 questions.
2) What percent of the energy consumed by the larvae became biomass that is now available to the next trophic level? Show calculation.
_________________________________________________________________________________
__________________________________________________________________________________
3) What percent of the energy consumed by the larvae was used in cellular rerpiration and eventually lost as heat? Show calculation.
_________________________________________________________________________________
__________________________________________________________________________________
4) Are these values close enough to what you would expect given your previous knowledge of energy transfer in ecosystems? Explain your answer.
_________________________________________________________________________________
__________________________________________________________________________________
_________________________________________________________________________________
__________________________________________________________________________________
_________________________________________________________________________________
11

__________________________________________________________________________________
_________________________________________________________________________________
Other Ways of Measuring NPP and GPPThe fertility of any body of water depends on the productivity of the photosynthetic organisms within it, primarily green plants, algae, and photosynthetic bacteria. The primary productivity of an ecosystem is defined as the rate at which light energy is converted by plants into organic compounds. Primary productivity can be measured by using either the rate of CO2 uptake, the rate of carbohydrate formation, or the rate of oxygen production. In practice, the easiest to measure is O2 production; for each milliliter of O2 produced, approximately 0.546 milligrams of carbon has been formed as carbohydrate. Since oxygen is produced as carbohydrates are formed in approximately a 6:1 ratio, it is a good indicator of primary productivity. For every glucose molecule produced in photosynthesis, 6 molecules of oxygen are produced.
If photosynthesis were the only process occurring in plants, we could measure primary production by simply measuring the O2 given off (and thus the carbohydrate production). But at the same time that plants photosynthesize, they also respire (metabolizing carbohydrate in the presence of oxygen) to produce ATP for their own maintenance and growth activities. For this reason, primary productivity has two components:
Gross primary productivity = energy fixed in photosynthesis (proportional to O2 produced)Net primary productivity = energy fixed in photosynthesis (O2 produced) – energy lost by
respiration (O2 used)
Essentially net productivity is the amount of carbohydrate that is available to the next trophic level. It is what is left of the carbohydrates produced after the plant uses a significant portion in cellular respiration in order to generate ATP for life functions.
Experiment - The Measurement of Primary Productivity Using the Light/Dark Bottle Method
This lab measures oxygen production in what is known as the light and dark bottle method. In this method a chemical is used to fix or bind up the total amount of dissolved oxygen in a water sample. A precipitate containing the oxygen forms, which can then be extracted from the water sample, re-dissolved, and used in a titration to determine the measurement of dissolved oxygen in mg/mL.
In this method, the DO concentration of samples of water are measured initially, and then compared after an incubation period in both light and darkness.
In the bottles exposed to light, the biological processes of photosynthesis and respiration are occurring; therefore, the change in DO concentration from the initial concentration over time is a measure of net primary productivity.
In the bottles kept in the darkness, the change in DO
12

concentration from the initial concentration is a measure of respiration only.
The difference over time between the DO concentrations in the light bottle and the dark bottle is the total oxygen productivity, and therefore a measure of gross primary productivityFactors Affecting Dissolved Oxygen:There are several chemical and physical factors that may affect dissolved oxygen concentrations in water. For example:
a) There is a lower DO concentration in water than in air because non-polar oxygen does not dissolve readily in polar water.b) Warm water will have a lower DO [ ] compared to cold water because the increased
kinetic energy of both the oxygen and the water molecules will allow for more diffusion of oxygen into the air.
c) A moving stream will act like an aerator and impart more oxygen into the water compared to a calm pond.
d) Surface water will generally have more oxygen than water at greater depths. This is because there is more light near the surface and therefore more P/S by aquatic plants, algae and cyanobacteria.
e) DO levels will be higher in the day than at night because of increased photosynthesis. f) There is more DO in water at lower altitudes because the air pressure is greater. g) DO in fresh water is higher than that of ocean water (salt water). h) Eutrophication and overgrowth of algae can reduce the oxygen content near the
water surface.
Any experiment that includes the measurement of DO will require that the above variables be controlled. In order to control for variables, samples should be collected at the same time of day, from the same type of water at a similar temperature, and from the same depth.
Questions:In a classroom investigation, students filled two bottles with pond water containing only photosynthesizing organisms. They used a dissolved oxygen (DO2) sensor to measure the amount of dissolved oxygen in each bottle. One bottle was put under light. The second bottle was wrapped in aluminum foil to block all light and was put under the same light. After 24 hours, pond water DO2 in the two bottles was again measured. Average values for DO2 from all students are provided in the following table:
Initial Value (mg O2/L)
Final Value (mg O2/L)
Light for 24 hours 6.24 6.39Dark for 24 hours 6.24 6.16
1) Calculate the gross primary productivity for the observed sample. Express your answer in mg fixed carbon/L/day to the nearest hundredth. In order to get the answer in the correct form you must use the “Primary Productivity Calculation” on the “AP Equations and Formulas” page: mL O2/L x 0.536 = mg carbon fixed / L/ day.
13

You will be given this page as part of your AP test in May to help you solve certain problems.
Answer:
__________________________________________________________________________________
2) Explain why dissolved oxygen is a good indicator of NPP. Make sure your answer is well explained. Type your answer on a separate sheet of paper.
__________________________________________________________________________________
__________________________________________________________________________________
__________________________________________________________________________________
__________________________________________________________________________________
__________________________________________________________________________________
__________________________________________________________________________________
__________________________________________________________________________________
__________________________________________________________________________________
__________________________________________________________________________________
__________________________________________________________________________________
Answer question 3 (from the AP Biology Practice Exam) below using the following flow chart:
14

__________________________________________________________________________________
15