Федеральная служба России по ... · web viewfig. 3 tm-12 with ship...
TRANSCRIPT

FINAL REPORT OF RIHMI-WDC, OBNINSK, RUSSIA ON THE
ACCOMPLISHMENT OF SUBCONTRACT #S01-23286
(Period of 2001-2003)
“DIGITIZATION OF HISTORICAL MARINE METEOROLOGICAL
AND ACTINOMETRIC (RADIATION) OBSERVATIONS FROM
RUSSIAN RESEARCH VESSELS”
Marsel Shaimardanov,
Project PI from the Russian Side,
Director, RIHMI - WDC
OBNINSK, 2003

REPORT ON ACCOMPLISHMENTS NSF Cooperative Agreement
ATM-9732665, Subcontract №. S01-23286
CONTENTS
ABSTRACT………………………………………………………………………………..3
1. BRIEF DESCRIPTION OF HISTORICAL TABLE DOCUMENTS……………….3
2. METHODS OF PREPARING OBSERVATION DATA TO BE ENTERED ON PC-
COMPATIBLE MEDIA ……………………..…………………………………………..7
2.1. Cloudiness ……………………..……………………………………………………..7
2.2. Pyrheliometric Scale………………………………………………………………...14
2.3. Local time…………………………………………………………………………….14
2.4. Radiation balance components……………………………………………………...16
2.5. Sea surface state……………………………………………………………………..16
2.6. Wind direction………………………………………………………………………..19
2.7. Coding of sun disc state (DS) and sky color (SC). ………………………………....21
2.8. Visibility………………………………………………………………………………21
3. TABLE DATA PC DIGITIZATION TECHNOLOGY …………………………….22
4. TABLE DATA CONTROL AND CONVERSION TO THE UNIFORM
PRESENTATION FORMAT …………………………………………………………...23
4.1. Actinometrical Observations Format (AOF)………………………………………23
4.2. Meteorological Observations Format (MOF)………………………………………24
5. RESCUED DATA SPACE-TIME DISTRIBUTION IN THE PC INFORMATION
BASE…………………………………………..…………………………………………..27
SUMMARY OF RESULTS .…………………………………………………………30
Appendix 1. …………………………………………………………………………….....32
1.1. Archive Format for Presentation of Ship Marine Actinometrical Data
Version 2. 05 April 2002…………………………………………………………………32
Appendix 2………………………………………………..………………………………37
2.1. Archive Format for Presentation of Ship Marine Meteorological Data
Version 2. 24 January 2002…..……………………….…………………………. …..…37
REFERENCES …………………………………………………………………………...41
2

REPORT ON ACCOMPLISHMENTS NSF Cooperative Agreement
ATM-9732665, Subcontract №. S01-23286
ABSTRACT
In the period of 2000-2003 the All Union Research Institute of Hydrometeorological
Information – World Data Center (RIHMI-WDC) was involved in the work under the US
University Corporation for Atmospheric Research (UCAR) Subcontract No S01-23286
“Digitization of historical marine meteorological and actinometrical (radiation)
observations from Russian research vessels (RV)”.
Marine environmental observations serve as the only source of information on marine
climate. Weather and climate observations made over the ocean are of considerable
interest for the experts involved in the modeling of atmospheric processes, study of the
ocean atmosphere interaction, monitoring of air and water pollution, investigation of
climate warming. Most of the data are still obtained by measurements or visual
assessments from ships although in recent time buoys are being used more and more.
Marine meteorological data are exchanged via the Global Telecommunication System
(GTS). Many countries have accumulated their own marine meteorological data sets. The
WMO Member States for many years have been continuously exchanging ship data under
the framework of Marine Climatologically Summaries Scheme (MCSS). At present
COADS is the largest data set in this field. It incorporates national data sets of many
countries as well as the sets resulted from different research climate programs.
The project under consideration was aimed at rescuing historical ship data held in the
RIHMI-WDC data holding on paper and in different formats. In their present state the data
are not available for the international scientific community.
1. BRIEF DESCRIPTION OF HISTORICAL TABLE DOCUMENTS
RIHMI-WDC holds data of ship marine meteorological and actinometrical observations on
paper. The data were obtained by RVs in the period of 1931-2000. The inventory of records
of the RIHMI-WDC data holding allowed the computer-based catalog of RV cruises
performing meteorological and actinometrical observations to be made. Fig. 1 gives a
general distribution of the data on paper by years.
3

REPORT ON ACCOMPLISHMENTS NSF Cooperative Agreement
ATM-9732665, Subcontract №. S01-23286
1931 1935 1947 1956 1960 1964 1968 1972 1976 1980 1984 1988 1992 1996 2000V1
0
50
100
150
200
250
Cou
nt
Fig.1. Distribution of table documents with ship meteorological and actinometrical
observations of Russian RVs by years.
Observations were obtained for a long historical period. Most of the data resulted from
scientific experiments and research programs, which had different aims and were of
different duration. All this led to a wide variety of initial tables with meteorological and
actinometrical observations.
With this in mind methods of observing and encoding meteorological and actinometrical
parameters used in different years have been analyzed as well as a strategy of data
digitization and preparation of tables with observations for computer compatible media has
been developed.
Fig. 2 and 3 give samples of the tables with meteorological and actinometrical
observations.
4

REPORT ON ACCOMPLISHMENTS NSF Cooperative Agreement
ATM-9732665, Subcontract №. S01-23286
Fig. 2 TGM-15 with ship meteorological observations
Fig. 3 TM-12 with ship actinometrical observations
5

REPORT ON ACCOMPLISHMENTS NSF Cooperative Agreement
ATM-9732665, Subcontract №. S01-23286
Table 1 gives a list of parameters with their units included into TM-12, TGM-3M and
TGM-15 tables for different years.
ТABLE 1.1.
List of radiation balance components and basic meteorological parameters included
into TM-12, TGM-3M and TGM-15 tables
№No
Parameter Units
1 Altitude of sun(h) degrees, 0.10
2 Radiation balance (B) cal/sm2min, kW/m2
3 Radiation balance of long-wave radiation,
cal/sm2min, kW/m2
4 Direct solar radiation (S) onto perpendicular surface
cal/sm2min, kW/m2
5 Direct solar radiation (S') onto horizontal surface
cal/sm2min, kW/m2
6 Albedo (A) %7 Total radiation (Q) cal/sm2min, kW/m2
8 Diffuse radiation (D) cal/sm2min, kW/m2
9 Reflected solar radiation (R) cal/sm2min, kW/m2
10 Total cloud amount (N) Numbers, KN-01 code11 Low-level cloud amount Numbers, KN-01 code12 Form of low-level cloud Symbol, code from Upper Air Annual,
KN-01 code 13 Height of cloud base m, KN-01 code14 Form of medium-level cloud Symbol, code from upper air annual, KN-
01 code15 Form of high-level cloud Symbol, code from Upper Air Annual,
KN-01 code16 True wind direction degrees, tens of degrees17 Wind speed m/s, 0.1 m/s18 Visual range (meteorological) M, miles, cables, KN-01 code, numbers19 Present weather Symbol, KN-01 code20 Atmospheric pressure 0.1 mb, hPa21 Air temperature 0.10С, integer degrees22 Water temperature 0.10С, integer degrees23 Dew point temperature 0.10С, integer degrees24 Relative humidity %25 Water vapour pressure Mb, 0.1 mb26 Wind wave period sec27 Height of wind waves m, 0.5 m28 Sea surface state number, code29 Skylight color symbol, code
6

REPORT ON ACCOMPLISHMENTS NSF Cooperative Agreement
ATM-9732665, Subcontract №. S01-23286
2. METHODS OF PREPARING OBSERVATION DATA TO BE ENTERED ON
PC-COMPATIBLE MEDIA
The information contained in the tables covered a long historical period of observations,
therefore methods of encoding meteorological and actinometrical parameters change from
one report to another.
Analyzing the regulatory documents on actinometrical observations made from RVs we
have found out that there isn’t any approved manual on making ship observations of the
radiation balance components. Only scientific reports of the Main Geophysical Observatory
and reprinted individual guidelines resulted from individual R & D activities / 5, 6, 7, 8/ are
available.
As for meteorological observations, they were regulated by Manuals on
Hydrometeorological Stations and Posts from 1944 to 1999.
The tables with actinometrical observations required additional processing before data
entry on computer compatible media. This is due to the fact that there were various groups
of meteorological parameters expressed in words. To make the statistical generalization of
initial data and scientific analysis of information it is necessary to digitize all types of
meteorological and actinometrical observations.
2.1. Cloudiness.
Clouds serve as the basic factor to determine a space-time variability of the radiation
balance components. The group “CLOUDS” is presented in the tables in three forms: in the
КН-01 code; in the code for encoding cloud forms, that is used in the “Manual on
Preparation of Upper Air Annuals”; and in the symbol form, where a form, type and kind of
low, mid and upper clouds being observed are indicated. Eventually the group “CLOUDS”
is brought to the form adequate to the КН-01 / 1 / code.
To encode the verbal group “Clouds” Tables 2.1-2.3 based on the КН-01 code and the 1989
FM 13-IX SHIP international code were used. In the tables for each specific cloud level
Latin symbols designating a cloud form, type and kind are given (in accordance with the
7

REPORT ON ACCOMPLISHMENTS NSF Cooperative Agreement
ATM-9732665, Subcontract №. S01-23286
adopted classification presented in the “Atlas of Clouds”) as well as additional conditions
and respective КН-01 code figures. In encoding clouds it was necessary to take into
account the total cloud amount (N) and the low-level cloud amount (Nh) that are given in
the respective columns of ТМ-12, TGM-3M and TGM-15 tables in octas (the 10-octa
scale) or in the code figures. The groups “Atmospheric Phenomenon” and “Visibility”
should be used as complementary information.
TABLE 2.1.Low – Level Clouds CL
CL
FORM TYPE KIND Additional conditions
CODE
Cu
Cu hum Cu fr These are not bad weather clouds
No Frnb
1
Cu med
Cu cong
Cu pil Cu hum, Cu fr, Sc Cloud base is at the same level N≥5
2
Сb
Cb calv Cb calv arc CuScSt
3
Cb cap Cb cap arcCb incCb hum
9
Sc Sc cuf
Sc diurSc vesp Formed from Cu or
Cb4
Sc castSc man
5
Sc und Sc trans Sc opSc lent
5
St
St nebSt undSt fr
These are not bad weather clouds 6
St fr FrnbBad weather clouds
As, Ns, CbSc op
7
8

REPORT ON ACCOMPLISHMENTS NSF Cooperative Agreement
ATM-9732665, Subcontract №. S01-23286
CL
Cu and Sc (with the exception of Sc diur and Sc vesp
Observed concurrently.
8
/ - clouds are not visible due to the darkness, fog and other phenomena.If it is possible to encode CL by several figures the smallest figure is usedOrder 1 2 3 4 5 6 Code figures 9 3 4 8 2 1 5 6 7
where N is greater
All groups of clouds (CL, CM, CH) with the “sl.” symbol used in the form, type or kind, e.g. Cu hum sl. or As trans sl. are not encoded.
TABLE 2.2.Medium – level Clouds, CM
FORM TYPE KINDAdditional conditions CODE
AsAs neb As trans 1
As und As op, As pr 2
Ns 2
Ac
Ac und
Ac trans
N < 10, Ас 3
N = 10 , Ас 5
* Several layers of Ac op
7
Ac opAc trans * N < 10 Ас
7
N = 10 , Ас 5
Ac lent Ac inh
4
9

REPORT ON ACCOMPLISHMENTS NSF Cooperative Agreement
ATM-9732665, Subcontract №. S01-23286
TABLE 2.2. Continuation.
Ac
Ac cuf
Ac floc Ac сast 8
Ac cug, Ac vir Formed either from cumulus clouds or from Cb
Cu cong Or C
6
Ac and As or Aс and Ns 7Ac with chaotic sky 9
Clouds are not visible due to the darkness, fog and other phenomena ….. /
If it is possible to encode CM by several figures the greatest figure is used irrespective of the cloud amount. Exception : if along with clouds with the symbol “*” in “Additional
conditions” clouds encoded by figures 4 and 5 or 6 are observed, figure 7 is not used for CM.
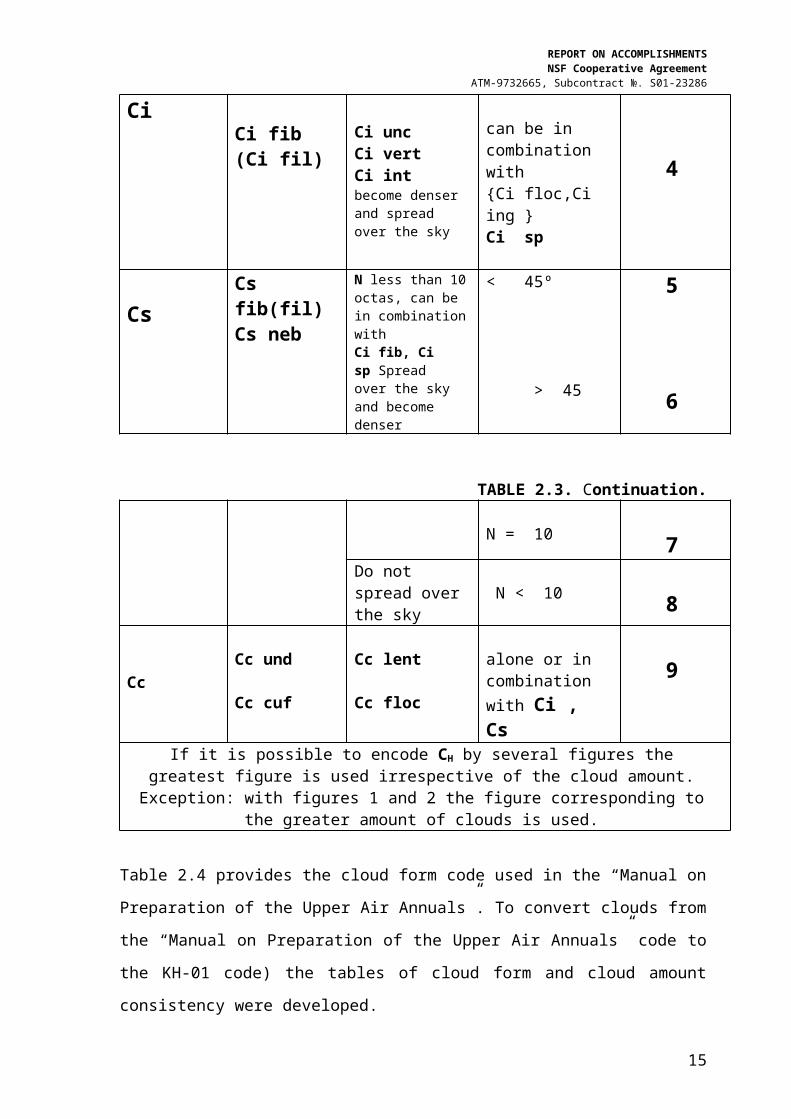
TABLE 2.3.Upper - Level Clouds, CH
FORM TYPE KINDAdditional conditions CODE
Ci
Ci fib(Ci fil)
Ci uncCi vertCi int
Amount does not increase CH up to 3 octas 1
Ci sp
N for Сн10 > N >3
2
Ci floc
Сi ing
N for Сн10 > N >3Сb inc 3
Ci fib(Ci fil)
Ci uncCi vertCi intbecome denser and spread over the sky
can be in combination with {Ci floc,Ci ing }Ci sp
4
Сs Cs fib(fil)Cs neb
N less than 10 octas, can be in combination withCi fib, Ci sp Spread over the sky and become denser
< 45º
> 45
5
6
10

REPORT ON ACCOMPLISHMENTS NSF Cooperative Agreement
ATM-9732665, Subcontract №. S01-23286
TABLE 2.3. Continuation.
N = 10 7Do not spread over the sky N < 10 8
Cc
Cc und
Cc cuf
Cc lent
Cc floc
alone or in combination with Ci , Cs
9
If it is possible to encode CH by several figures the greatest figure is used irrespective of the cloud amount. Exception: with figures 1 and 2 the figure corresponding to the greater
amount of clouds is used.
Table 2.4 provides the cloud form code used in the “Manual on Preparation of the Upper
Air Annuals”. To convert clouds from the “Manual on Preparation of the Upper Air
Annuals” code to the KH-01 code) the tables of cloud form and cloud amount consistency
were developed.
Table 2.5 provides the consistency between codes used for clouds forms. The table is used
in the QC algorithms used for cloud parameters. In 2002 some amendments were made that
are marked in blue. The amendments are reflected in the respective QC programs.
Table 2.6. provides the consistency between octas and the КН-01 code figures for N and
Nh /2/.
TABLE 2.4.
Code of clouds used in the “Manual on Preparation of the Upper Air Annuals”.
CODE
Designation of columns in the table.
1 2 3 4 5
CH CM CL
1 Ci Ac Cu St
2 Cc As Cb Sc Ns
3 Cs Frnb
4 Ci, Cc Ac, As Cu, Cb St, Sc
11

REPORT ON ACCOMPLISHMENTS NSF Cooperative Agreement
ATM-9732665, Subcontract №. S01-23286
TABLE 2.4. Continuation.5 Ci, Cs
6 Cc, Cs Ns, Frnb
7 Ci, Cc, Cs
8 It is impossible to identify a cloud form due to the lower clouds
9 It is impossible to identify a cloud form due to the darkness or
atmospheric phenomena
0 Clouds are missing
TABLE 2.5.
Table of consistency between codes used for cloud forms
Form of clouds
Code used in the “Manual on Preparation of the Upper Air Annuals”
KH-01 Code
Code used in the “Manual on Preparation of the Upper air Annuals”,
Year 2002-2003
KH-01 Code,Year 2002-2003
CL
0 0 000 0100 1 100 110 6 010 6200 3 200 920 5 020 5400 9 400 340 6 040 6120 8 120 8210 7 210 3220 4 220 3
046 722 7 022 2(CM)23 7 023 726 7 026 73 7 003 7213 9 213 3123 7 123 8223 9 223 3243 9 243 3423 9 423 3403 9 403 343 6 043 7420 9 420 3240 9 240 3
12

REPORT ON ACCOMPLISHMENTS NSF Cooperative Agreement
ATM-9732665, Subcontract №. S01-23286
TABLE 2.5. Continuation.
Form of clouds
Code used in the “Manual on Preparation of the Upper Air Annuals”
KH-01 Code
Code used in the “Manual on Preparation of the Upper air Annuals”,Year 2002-2003
KH-01 Code,Year 2002-2003
CL
440 3 440 3203 9110 6016 2103 7006 7002 2(CM)012 7206 3
999 0 999 0888 KOT 888 KOT
CM0 01 32 14 79 08 KOT
CH0 01 22 93 74 55 56 97 99 08 KOT
TABLE 2.6.
Table of consistency between N and Nh octas and the KH-01 code digits.
Numbers КН-01
0 01 12 23 24 35 46 57 6
13

REPORT ON ACCOMPLISHMENTS NSF Cooperative Agreement
ATM-9732665, Subcontract №. S01-23286
8 69 710 811 ( [10] ) 710 with СН=СМ= 8 andСL=888
9
The entire of the group CLOUDS should be brought to the form adequate to the KH-01
code. The element of the CLOUDS group is considered erroneous if the appropriate field
contains the impermissible value of the code.
2.2.Pyrheliometric Scale.
Methods of radiation balance observations performed by RVs, instruments and radiometric
scales are described in works /3, 4/. In the last 60 years they were changed and refined
many times. According to /5/ the whole of radiation balance data of the former USSR,
obtained before December 31, 1956 are presented in the European Pyrheliometric Scale.
Data for the period of January 1, 1957 – December 31, 1980 – in the International
Pyrheliometric Scale (IPS-56), which exceeds the European scale by 1.5%. Beginning with
July 1, 1982 data are presented in the International Radiometric Standard Scale (IRS),
which exceeds IPS-56 by 1.8%. So when long-term historical data series of radiation
balance observations are inter-compared the following corrections (coefficients) should be
introduced to make conversion to IRS:
- before December 31, 1956 the coefficient equals to 1.025;
- January 1, 1957 – April 30, 1966 – 1.010
- May 1, 1966 – June 30, 1982 – 1.018.
2.3. Local time.
Actinometrical data given in the initial tables have been obtained in apparent (true) solar
time (AST). AST is measured by an hour angle taken from the upper culmination. A civil
(legal) day is the time period between two lower culminations and the moment of a lower
culmination (midnight) is taken for 00 hours 00 minutes AST.
Mean Solar Time (MST), which is also referred to as local time, is correlated with AST as
follows (the equation of time):
Gr = Gl + .
14
REPORT ON ACCOMPLISHMENTS NSF Cooperative Agreement
ATM-9732665, Subcontract №. S01-23286
Where Gr – AST; Gl – MST (in hours and minutes); - a correction to MST given in
Table 1 in minutes.
UTC is also included in the format. We calculated it by the following formula.
Gl = UTC + / 15, where - is longitude of the location of observation (in minutes
and degrees)
Table 2.7.
Correction (in minutes) to MST
Day of a month Monthordinary leap 1 2 3 4 5 6 7 8 9 10 11 12
1 -3 -13 0 0 0 0 0 0 0 0 0 01 2 -3 -14 -13 -4 3 2 -4 -6 0 10 16 112 3 -4 -14 -12 -4 3 2 -4 -6 0 10 16 113 4 -4 -14 -12 -4 3 2 -4 -6 0 11 16 104 5 -5 -14 -12 -3 3 2 -4 -6 1 11 16 105 6 -5 -14 -12 -3 3 2 -4 -6 1 11 16 106 7 -6 -14 -12 -3 3 2 -4 -6 1 12 16 97 8 -6 -14 -11 -2 4 2 -5 -6 2 12 16 98 9 -6 -14 -11 -2 4 1 -5 -6 2 12 16 89 10 -7 -14 -11 -2 4 1 -5 -6 2 12 16 810 11 -7 -14 -11 -2 4 1 -5 -5 3 13 16 811 12 -8 -14 -10 -1 4 1 -5 -5 3 13 16 712 13 -8 -14 -10 -1 4 0 -6 -5 3 13 16 713 14 -8 -14 -10 -1 4 0 -6 -5 4 14 16 614 15 -9 -14 -10 -1 4 0 -6 -5 4 14 16 615 16 -9 -14 -9 0 4 0 -6 -5 5 14 16 516 17 -10 -14 -9 0 4 0 -6 -4 5 14 15 517 18 -10 -14 -9 0 4 0 -6 -4 5 14 15 418 19 -10 -14 -8 0 4 -1 -6 -4 6 15 15 419 20 -11 -14 -8 1 4 -1 -6 -4 6 15 15 320 21 -11 -14 -8 1 4 -1 -6 -4 6 15 14 321 22 -11 -14 -8 1 4 -1 -6 -3 7 15 14 222 23 -12 -14 -7 1 4 -2 -6 -3 7 15 14 223 24 -12 -14 -7 2 3 -2 -6 -3 7 16 14 124 25 -12 -14 -7 2 3 -2 -6 -3 8 16 14 125 26 -12 -13 -6 2 3 -2 -6 -2 8 16 13 026 27 -12 -13 -6 2 3 -2 -6 -2 8 16 13 027 28 -13 -13 -6 2 3 -3 -6 -2 9 16 13 -128 29 -13 -13 -5 2 3 -3 -6 -1 9 16 12 -129 30 -13 0 -5 3 3 -3 -6 -1 9 16 12 -230 31 -13 0 -5 3 3 -3 -6 -1 10 16 12 -231 1 -13 0 -4 0 3 0 -6 -1 0 16 0 -3
15

REPORT ON ACCOMPLISHMENTS NSF Cooperative Agreement
ATM-9732665, Subcontract №. S01-23286
2.4. Radiation balance components.
All the observations of direct, diffuse, total and reflected radiations made in actinometrical
hours, which in the initial tables are given in cal/(sm2min) have been converted to kW/m2
and brought to the Apparent Solar Time. Bearing in mind the differences in pyrheliometric
scale used during the period of records all the radiation balance component data have been
converted to the International Radiometric Standard Scale (IRS)
2.5. Sea surface state.
The sea surface state (MS) is determined visually and depends upon the wind force. The
wind force is visually described both in words and in the Beaufort wind scale numbers
(Forces).
We have made an attempt to review manuals and guides on ship wind observations and so
far managed to find the only one, namely, “Instructions to Hydrometeorological Stations
and Posts”(Issue 9, Part 2, 1948), which gives the joint table of the wind force and the sea
surface state described by the so-called Beaufort-Simpson scale (Table 2.8.). This table was
used in Russian observations to estimate both the wind force and the MS parameter.
In the period of 1962-1992 the same Beaufort scale was used and the word description of
indicators required to define the surface state of the ocean, sea, lake or large water body
(MS) is consistent with that given in Table 3, which we included into the format. Since
1992 the Beaufort scale has been modified. The wind speed increased and the
corresponding wind force given in numbers remained unchanged (Table 2.9.).
In original historical tables the MS parameter has already been encoded and given in
numbers. The Russian National Manuals on ship observations do not mention that Beaufort
scale should be used to estimate MS. They give only Code. Table A.1.3. Sea Surface
State (MS), which we include into the format.
16

REPORT ON ACCOMPLISHMENTS NSF Cooperative Agreement
ATM-9732665, Subcontract №. S01-23286
Table 2.8.
Wind force, wind speed and sea surface state
Wind force W
ind
spee
d m
/s
Vis
ual
win
d fo
rce
indi
cato
rs o
bser
ved
on b
oard
a sh
ip
Sea surface state with wind waving
Bea
ufor
t nu
mbe
rs Word description
Word description
Sea
surf
ace
stat
e
Indicators for determining actual wind force and wind waving
0 Calm 0,0-0,5 Flags are still Calm glassy 0 Like a mirror1 Light airs 0,6-1,7 Calm rippled 1
Ripples2
Light breeze1,8-3,3
Flags slightly waver in the wind
Smooth wavelets 1-2 Small wavelets, no breaking, no foam
3 Gentle breeze 3,4-5,2 Flags flap in the wind
Slight 2 Large well-defined wavelets, some breaking, glassy foam, flocks of sheep here and there
4 Moderate breeze
5,3-7,4 Small flags and a pendant stretch
Slight to Moderate 3 Small waves, breaking, flocks of sheep everywhere
5 Fresh breeze 7,5-9,8 Big flags streach Moderate 4 Moderate waves, blocks of sheep everywhere
6 Strong breeze
9,9-12,4 Wind begins to sing in the wires and rigging
Rough 5 Large waves, foam and spray
7 Near gale 12,5-15,2
Very rough 6 Sea heads up, foam in streaks
8 Gale 15,3-18,2 It is difficult to
walk a deck against the wind
Very rough 7High waves, dense foam, spray impairs visibility
9Strong gale
18,3-21,5 High
7
10Storm
21,6-25,1 Very high
8 Very high tumbling waves, surface white with foam, visibility affected
11 Violent storm 25,2-29,0 Phenomenal
9Exceptionally highwaves, sea covered in foam, air filled with spray and foam, visibility severely impaired
12
Hurricane
More 29,0
9
17

REPORT ON ACCOMPLISHMENTS NSF Cooperative Agreement
ATM-9732665, Subcontract №. S01-23286
Table 2.9.Beaufort scale to estimate wind force
Wind force
Word description
Wind speed Wind impact on ship and rigging
Sea stateM/s Km/h knots
0Calm
0-0,2(0)
0-1(0)
0-1(0)
Air is absolutely calm.Smoke is vertical. Pendant is still
Calm glassy
1 Light airs 0,3-1,5(1)
1-5(3)
1-3(2)
Light air is felt from time to time. Smoke inclines showing wind direction
Calm rippled
2Light breeze
1,6-3,3(3)
6-11(8)
4-6(5)
Continuous breeze. Flags and pendants slightly waver in the wind
Small wavelets
3 Gentlebreeze
3,4-5,4(5)
12-19(15)
7-10(8)
Flags and pendants flap in the wind. Smoke is almost horizontal
Large wavelets, some breaking, glassy foam
4Moderate breeze
5,5-7,9(7)
20-28(24)
11-16(13) Pendant
stretches
Small waves, breaking, flocks of sheep here and there
5Fresh breeze
8,0-10,7(9)
29-38(33)
17-21(19)
Big flags flap in the wind and stretch. Wind moves small objects.
Moderate well-defined waves, flocks of sheep everywhere
6Strong breeze
10,8-13,8(12)
39-49(44)
22-27(25) Wind begins to
sing in the wires and rigging
Large waves, foam and spray.
7Near gale
13,9-17,1(15)
50-61(55)
28-33(31)
Wind sings in the wires and rigging. Some difficulties in walking a deck against the wind
Sea heads up, foam in streaks
18

REPORT ON ACCOMPLISHMENTS NSF Cooperative Agreement
ATM-9732665, Subcontract №. S01-23286
8Gale
17,2-207(19)
62-64(68)
34-40(37)
Very difficult to walk a deck against the wind
Higher long waves, foam in streaks
9Strong gale
20,8-24,4(23)
75-88(81)
41-47(44)
Small damage to rigging is possible. Unfixed objects move.
High waves, dense foam, spray impairs visibility.
10Storm
24,5-28,4(27)
89-102(95)
48-55(51)
Considerable damage to rigging is possible
Very high tumbling waves, surface white with foam, visibility affected
11Violent storm
28,5-32,6(31)
103-117(110)
56-63(59) Same
Exceptionally high waves, sea covered in foam, visibility severely impaired
12Hurricane >33 >117 >63 Severe damage
Air filled with spray and foam, visibility severely impaired
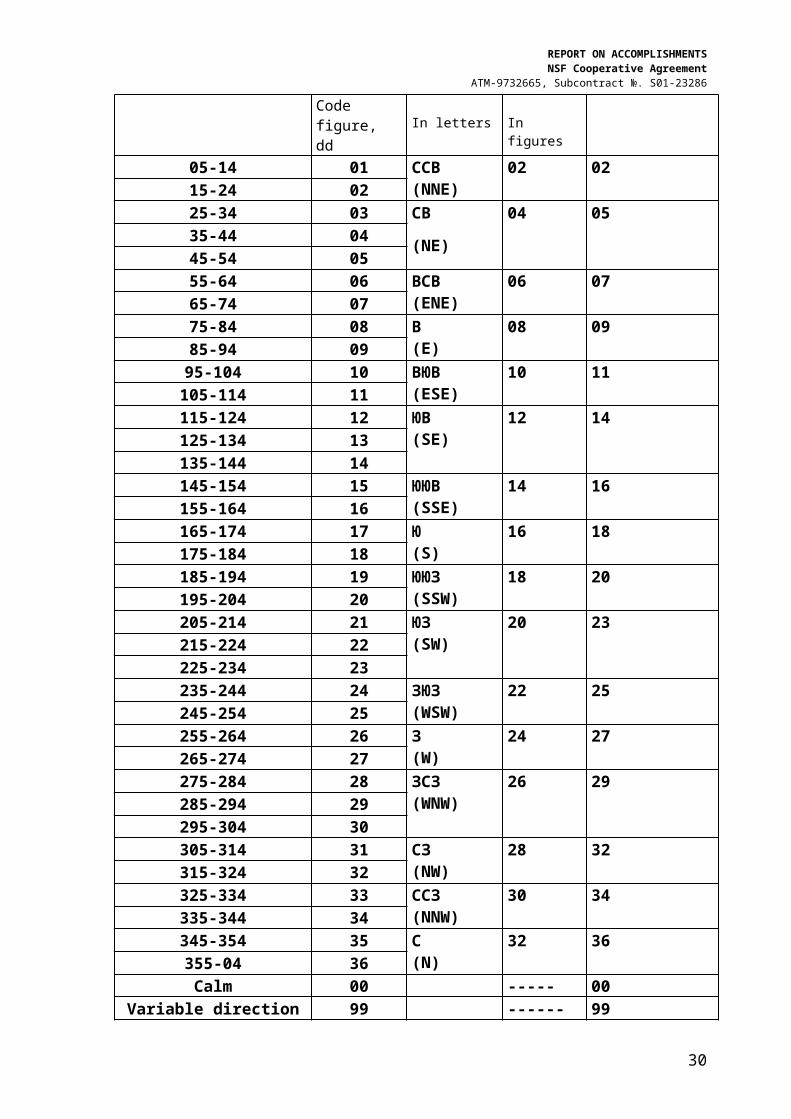
2.6. Wind direction.
In the table documents the wind direction is presented in 16 points, degrees and tens of
degrees (in figures of KN-01 code). According to the Manual on Ship Observations, the
true wind direction was assessed with a ship compass by the wind wave movement
direction. It was determined by the angle between the meridian and the direction towards
the point on the horizon from which the wind blows and reckoned from the meridian plane
to an accuracy of 50 in a clockwise direction. The wind direction was also measured by a
ship remote station (SRS), M-63M1 wave meter and KIV instrument.
The format used to record observations into the PC information base includes indicators
describing the initial values of parameters. Converting the wind direction from points to
degrees it was taken that each of 16 points covers a sector of 22.50, i.e. 11.250 on either side
of a true degree direction of a point. Figures of the code correspond to tens of degrees of
the center of each point’s degree sectors.
19

REPORT ON ACCOMPLISHMENTS NSF Cooperative Agreement
ATM-9732665, Subcontract №. S01-23286
Table 2.10.
Conversion of the wind direction from degrees as well as from points to the code figures using FM-13-IX SHIP, WMO Code Table 0877 for dd (1989 edition)Wind direction measured by a wave meter Wind direction assessed in points and in code
figures
Wind direction, degrees Code figure, dd
Wind direction, POINTS Code figure, dd
In letters In figures05-14 01 ССВ
(NNE)02 02
15-24 0225-34 03 СВ
(NE)
04 0535-44 0445-54 0555-64 06 ВСВ
(ENE)06 07
65-74 0775-84 08 В
(E)08 09
85-94 0995-104 10 ВЮВ
(ESE)10 11
105-114 11115-124 12 ЮВ
(SE)12 14
125-134 13135-144 14145-154 15 ЮЮВ
(SSE)14 16
155-164 16165-174 17 Ю
(S)16 18
175-184 18185-194 19 ЮЮЗ
(SSW)18 20
195-204 20205-214 21 ЮЗ
(SW)20 23
215-224 22225-234 23235-244 24 ЗЮЗ
(WSW)22 25
245-254 25255-264 26 З
(W)24 27
265-274 27275-284 28 ЗСЗ
(WNW)26 29
285-294 29295-304 30305-314 31 СЗ
(NW)28 32
315-324 32325-334 33 ССЗ
(NNW)30 34
335-344 34345-354 35 С
(N)32 36
355-04 36
20

REPORT ON ACCOMPLISHMENTS NSF Cooperative Agreement
ATM-9732665, Subcontract №. S01-23286
Calm 00 ----- 00Variable direction 99 ------ 99
21

REPORT ON ACCOMPLISHMENTS NSF Cooperative Agreement
ATM-9732665, Subcontract №. S01-23286
2.7. Coding of sun disc state (DS) and sky color (SC).
The sun disc state being of great importance in the observation of radiation balance
components is assessed visually as well as clouds. In the respective columns of the TM-12
tables the designations are given adopted for recording the results of actinometrical
observations in the KM-12 record book. The “sun disk state” parameter was encoded
according to Code. Table A.1.1 - Coding of sun disc state (DS), which combines the
approaches used to encode this parameter in actinometrical observations and primary data
processing made at both land stations and RVs.
One further parameter expressed in words is the “sky color”. The sky color is assessed
when the total cloud amount does not exceed 3 numbers. In the tables it is given in words
and to encode it the Code. Table A.1.2 – Coding of sky color (SC) was used.
2.8. Visibility.
The “Visibility” parameter is of great importance for sea navigation and depends heavily on
weather. In the documents it is given in different units, numbers and codes. According to
the observation techniques this parameter was assessed visually (by the sky line sharpness)
and measured by a nephelometer. Often in the tables the visibility measured at night is
given in numbers accompanied by the “N” letter, for the observations taken in the shadows
of evening the letter “E” is used.
To unify this parameter the table converting the visibility to the KN-01 code (FM-13-XI
SHIP) has been developed.
22

REPORT ON ACCOMPLISHMENTS NSF Cooperative Agreement
ATM-9732665, Subcontract №. S01-23286
Table 2.11.
Codification of the VISIBILITY (VV) Parametermiles kilometers numbers meters KH-01
codeNote
0-0,05 0 0-50 90 Very bad0,05 1 50-200 91 Very bad0,2 2 200-500 92 Very bad0,5 3 500-1000 93 Bad
0.5 1 4 1000-2000 94 Bad1 2 5 2000-4000 95 Moderate2 4 6 4000-10000 96 Moderate5 10 7 10000-20000 97 Good11 20 8 20000-50000 98 Very good27 >50 9 >50000 99 Excellent
3. TABLE DATA PC DIGITIZATION TECHNOLOGY
The tables were digitized with the dBASE DBMS in the DOS or Windows environment.
For each type of the tables an electronic form fully corresponding to the initial document
was prepared. The basic principle here is a one-to-one correspondence between a record
field name and a parameter being measured, i.e. a field name corresponding to one and the
same parameter should be the same in all forms. At the same time a field size and format as
well as dimensions of a variable corresponding to this field can be arbitrary.
With such approach the dbf files resulted from the digitization are the copies of the
corresponding tables on the computer compatible media. The dbf file header layout is
well known, therefore in the subsequent processing it is easy to extract from the files and
analyze the designated fields irrespective of their order in the initial document.
At the stage of the digitization two data sets were developed:
Meteorological data set from the ТГМ-15, ТГМ-3М tables including up to 45
parameters
Radiation data set from the TM-12 tables, including up to 50 parameters.
23

REPORT ON ACCOMPLISHMENTS NSF Cooperative Agreement
ATM-9732665, Subcontract №. S01-23286
The second data set included radiation balance components and related
meteorological observations obtained at Apparent Solar Time and referenced to basic
synoptic hours (or hourly observations).
4. TABLE DATA CONTROL AND CONVERSION TO THE UNIFORM
PRESENTATION FORMAT.
One of the most important steps in the creation of the ship actinometrical and
meteorological data base was to develop the algorithms and digitized data QC software
package and two types of the data presentation formats. In developing the marine
meteorological and actinometrical data QC software the types and criteria of QC
recommended by the WMO as well as those given in / 5, 6, 7, 8 / were taken into account.
Files resulted from the digitization were subjected to the following steps of control:
syntactic control to identify errors in the data digitization process;
logical control (to identify impermissible values of coordinates, exceeding of
limit permissible values of meteorological elements, inconsistency between elements);
The QC software makes it possible to:
put numbers of erroneous records and types of errors into files-protocols
have a detailed protocol of the QC software operation to compare digitized
and calculated values.
The QC software user interface makes various data handling much easier. Fig. 4-6 gives
samples of the forms for control, editing and conversion of meteorological and
actinometrical observations to the specified format. Digitized data were included into two
data bases. Under the Contract the final formats for presentation and transmission of
meteorological and actinometrical observations have been developed. The formats were
agreed upon with the NCAR people. They are given in Appendices 1 and 2.
4.1. Actinometrical Observations Format (AOF).
The first version of the uniform output format for actinometrical (radiation) observations
was developed. It can be found in the 2001 Final Report (Version 1. 29 August 2001). The
new format, Version 2. 05 April 2002 is given in Appendix 1.
1). Indicators for the following parameters were introduced:
24

REPORT ON ACCOMPLISHMENTS NSF Cooperative Agreement
ATM-9732665, Subcontract №. S01-23286
time (TI),
coordinates (LI),
visibility (VI),
temperature and SST measurement method (T1, SI),
cloud height (HI).
2). Quality signs were given to record elements.
If Q=1 the element is considered correct
If Q=2 the element does not agree with other parameters of a record
If Q=3 the element is considered doubtful
If Q=4 the element is considered erroneous
If Q=9 the element is considered missing
4.2. Meteorological Observations Format (MOF).
The first version of the uniform output format for marine meteorological observations was
developed. It can be found in the 2001 Final Report. (Version 1. 24 May 2001).
Version1 was discussed together with the NCAR people. Similarly to the LMR format
(COADS) it was decided to introduce into a record indicators determining methods and
tools for the measurement of specific similar variables (Version 2. 24 January 2002,
Appendix 2).
1). Indicators for the following parameters were introduced:
time (TI),
coordinates (LI),
wind direction and speed (DI, WI),
visibility (VI),
temperature and SST measurement method (T1, SI),
cloud height (HI),
swell period (SX).
2). We have excluded wind wave direction- dwdw from the Archive Format for
presentation of ship marine meteorological data, Version 2, 24 January 2002 since this
parameter is identical with true wind direction - dd.
25

REPORT ON ACCOMPLISHMENTS NSF Cooperative Agreement
ATM-9732665, Subcontract №. S01-23286
3). Each element of the observation included into the format has a quality sign (Q). Similar
to the IMMT1 format, they were added to the end of a record and have the same meaning,
in particular
If Q=1 the element is considered correct
If Q=2 the element does not agree with other parameters of a record
If Q=3 the element is considered doubtful
If Q=4 the element is considered erroneous
If Q=9 the element is considered missing
Fig. 4 The form for checking and reformatting data from various tables of
meteorological observations.
26

REPORT ON ACCOMPLISHMENTS NSF Cooperative Agreement
ATM-9732665, Subcontract №. S01-23286
Fig. 5 The form for checking and reformatting data from various tables of
actinometric observations.
Fig. 6 Viewing and editing data with the DBASE V DBMS
27

REPORT ON ACCOMPLISHMENTS NSF Cooperative Agreement
ATM-9732665, Subcontract №. S01-23286
5. RESCUED DATA SPACE-TIME DISTRIBUTION IN THE PC INFORMATION
BASE
At present 3753 documents with meteorological observations and 1125 documents with
actinometrical observations have been rescued and entered on the computer compatible
media. Fig. 7-9 give the distribution of a number of observations by documents for each
type of observations. As is seen from the plots the variation in a number of observations in
the ТМ-12, ТGМ-3 and ТGМ-15 tables is significant.
Fig.7. Variation in a number of observations per logbook documents of TGM-15.
Fig.8. Variation in a number of observations per logbook documents of TGM-3M.
28

REPORT ON ACCOMPLISHMENTS NSF Cooperative Agreement
ATM-9732665, Subcontract №. S01-23286
Fig.9. Variation in actinometrical observations per document of TM-12.
The general distribution of the digitized tables (cruises) by years is given in Fig. 10. As is
seen the smallest amount of documents was digitized for 1962, and the greatest – for 1989.
The geographical distribution of digitized observations by regions of the World Ocean is
also given. On the abscissa the numbers of the regions are plotted, on the ordinate the
amount of observations is given in units. The plot shows that the greatest amount of
observations falls on the most crowded shipping areas: the northern and tropical parts of the
Atlantic and Pacific and the Mediterranean. The table of correspondence between the
numbers of the World Ocean regions and the names is given in Appendix 2. Fig. 12
presents data sent to NCAR in 2001-2003.
29
REPORT ON ACCOMPLISHMENTS NSF Cooperative Agreement
ATM-9732665, Subcontract №. S01-23286
Fig.10. Distribution of rescued table data included into the data base by years.
Fig.11. Distribution of rescued ship meteorological and actinometrical data by areas
of the World Ocean.
30
0
50000
100000
150000
200000
250000
1931
1935
1939
1943
1947
1951
1955
1959
1963
1967
1971
1975
1979
1983
1987
1991
1995
1999
Meteorological Actinometrical

REPORT ON ACCOMPLISHMENTS NSF Cooperative Agreement
ATM-9732665, Subcontract №. S01-23286
Fig.12. Data shipped to the National Center for Atmospheric Research.
SUMMARY OF RESULTS
The work under the project №S01-23286 “DIGITIZATION OF HISTORICAL MARINE
METEOROLOGICAL AND ACTINOMETRICAL (RADIATION) OBSERVATIONS
FROM RUSSIAN RESEARCH VESSELS” was performed in accordance with the
working schedule. The following progress has been made:
1). The two versions of the formats for the digitized data storage and exchange have been
developed.
2). The work has been done to determine correlations between parameters, units of
measurements, codes and the system of designations used in the historical tables.
3) The quality control algorithms and programs to check parameters of the digitized data
sets were developed and applied.
4). By the end of 2003, 1 355 181 meteorological observations from the TGM-15 - TGM-
3M tables and 681018 observations from the TM-12 tables containing radiation balance
component data, were digitized. The total amount of the digitized data sets amounts to
2 016 199 observations (4860 files).
31

REPORT ON ACCOMPLISHMENTS NSF Cooperative Agreement
ATM-9732665, Subcontract №. S01-23286
The data set prepared under the Contract will be an important component of COADS and
other data set being developed. It will contribute to the solution of the problems related to
the information services provided to users, preparation of relevant reference manuals,
scientific and applied tasks in the field of marine climatology and study of the World
Ocean.
32

Appendix 1
1.1. Archive Format for Presentation of Ship Marine Actinometrical Data. Version 2. 05 April 2002
No Field name
Description Coding procedure Bytes Record position
1 ID Call sign 5 1-52 AAAA Year, UTC Four digits 4 6-93 MM Month, UTC 01-12, January to
December2 10-11
4 YY Day, UTC 01-31 2 12-135 GG Time of observation Tenths of hour UTC 3 14-166 GrGr True time Hours, minutes 4 17-207 TI Time indicator The same as in COADS 1 218 Q Octant of the globe WMO code table 3300 1 229 LaLaLa Latitude Tenths of degrees 3 23-2510 LoLoLo Longitude Tenths of degrees 4 26-2911 LI La/Lo indicator The same as in COADS 1 3012 vs Ship velocity 0.1 knot 3 31-3313 KS Ship course Degrees 3 34-3614 H Sun altitude 0,10 3 37-3915 DS Sun disc state Code. Table A.1.1 1 4016 SC Sky color Code. Table A.1.2 1 4117 S Direct radiation on
perpendicular surface 0,01kw/sq.m 3 42-44
18 S1 Direct radiation on horizontal surface
0,01kw/sq.m 3 45-47
19 B Total radiation balance 0,01kw/sq.m 4 48-5120 Qr Total radiation 0,01kw/sq.m 3 52-5421 D Scattered radiation 0,01kw/sq.m 3 55-5722 Rk Back-scattered radiation 0,01kw/sq.m 3 58-6023 A Albedo % 2 61-6224 Bd Long-wave balance 0,01kw/sq.m 4 63-6625 TTT Air temperature Tenths of degrees
Celsius4 67-70
26 TWTWTW Sea surface temperature Tenths of degrees Celsius
4 71-74
27 T1 Temperature indicator The same as in COADS 1 7528 SI Sea surf. temp. method
indicatorThe same as in COADS 1 76
29 N Cloud amount Octas, WMO code table 2700
1 77
30 Nh Amount of lowest clouds As reported for CL or, if no CL clouds is presented for CM, in octas; WMO code table 2700
1 78
31 CL Genus of CL cloud WMO code table 0513 1 7932 CM Genus of CM clouds WMO code table 0515 1 80

REPORT ON ACCOMPLISHMENTS NSF Cooperative Agreement
ATM-9732665, Subcontract №. S01-23286
33 Hh Height of clouds WMO code table 1600 1 8134 HI Cloud height indicator The same as in COADS 1 8235 CH Genus of CH clouds WMO code table 0509 1 8336 HWHW Height of wind waves Half-meter values 2 84-8537 MS State of sea surface Code table A.1.3 1 8638 Ww Present weather WMO code table 4677 2 87-8839 SP Atmospheric phenomenon
in observational hourCode. Table A.1.4 2 89-90
40 VV Visibility WMO code table 4377 2 91-9241 VI Visibility indicator The same as in COADS 1 9342 E Water vapor pressure Tenths of hectopascals 3 94-9643 Q1 Quality control indicator for
(H)0. – no quality control (QC) has been performed.1.QC has been performed; element appears to be correct.2. QC has been performed; element appears to be inconsistent with other elements.3. QC has been performed; element appears to be doubtful.4. QC has been performed; element appears to be erroneous.9. The value of the element missing.
1 97
44 Q2 Quality control indicator for (DS)
IDEM 1 98
45 Q3 Quality control indicator for (S)
IDEM 1 99
46 Q4 Quality control indicator for (S1)
IDEM 1 100
47 Q5 Quality control indicator for (B)
IDEM 1 101
48 Q6 Quality control indicator for (Qr)
IDEM 1 102
49 Q7 Quality control indicator for (D)
IDEM 1 103
50 Q8 Quality control indicator for (Rk)
IDEM 1 104
51 Q9 Quality control indicator for (A)
IDEM 1 105
52 Q10 Quality control indicator for (Bd)
IDEM 1 106
53 Q11 Quality control indicator for IDEM 1 107
34

REPORT ON ACCOMPLISHMENTS NSF Cooperative Agreement
ATM-9732665, Subcontract №. S01-23286
(TTT)54 Q12 Quality control indicator for
(TWTWTW)IDEM 1 108
55 Q13 Quality control indicator for (N)
IDEM 1 109
56 Q14 Quality control indicator for (Nh)
IDEM 1 110
57 Q15 Quality control indicator for (CL)
IDEM 1 111
58 Q16 Quality control indicator for (CM)
IDEM 1 112
59 Q17 Quality control indicator for (Hh)
IDEM 1 113
60 Q18 Quality control indicator for (CH)
IDEM 1 114
61 Q19 Quality control indicator for (HWHW)
IDEM 1 115
62 Q20 Quality control indicator for (MS)
IDEM 1 116
63 Q21 Quality control indicator for (Ww)
IDEM 1 117
64 Q22 Quality control indicator for (VV)
IDEM 1 118
65 Q23 Quality control indicator for (E)
IDEM 1 119
Missing values for all fields are indicated by “ blank”.
Code Table A.1.1 - Coding of sun disc state (DS)
Symbol Code Sun disc stateП 0 Sun disc is not visible through solid clouds
1 Changing cloudiness0 2 Sun shines weakly through clouds 3 Clouds are on Sun disc, shadows from objects are visible2 4 On Sun disc and within a 50 area around it traces of clouds are
not visible 5 Sun disc is covered with local objects/ 6 Observation at night or incorrect 9 Sun dick is not visible because horizon is covered
Code Table A.1.2 – Coding of sky color (SC)
35

REPORT ON ACCOMPLISHMENTS NSF Cooperative Agreement
ATM-9732665, Subcontract №. S01-23286
Code Sky color1 Dark-blue2 Blue3 Light-blue4 Whity6 Observation at night or cloudiness exceeds 3 octas
Code Table A.1.3. Sea Surface State (MS).
Number Indicators to define sea surface state (number of wave degree).
0 Sea surface is absolutely calm1 Ripple; small wave crests appear.2 Small wave crests begin to tip over, however foam,
which is generated, is not white but glassy.3 Small waves are clearly visible, crests of some of
them tip over forming here and there white foam – flocks of sheep.
4 Waves take a well-defined form, flocks of sheep are formed everywhere.
5 Crests of considerable height appear, wind begins to tear foam away from wave crests.
6 Crests outline long bars of wind waves.7 Long stripes of foam torn off by wind cover wave
slopes and in places reach wave hollows.8 Wide stripes of foam cover wave slopes making sea
surface white. Only here and there in wave troughs there are areas free of foam.
9 Sea surface is covered with a thick layer of foam, air is full of water spray, and visibility is reduced considerably.
Code Table A.1.4 – Code of atmospheric phenomenon type (SP)
Code
Atmospheric phenomenon Code Atmospheric phenomenon
00 Corona 44 Thin (see-through) fog01 Halo 45 Thick fog
02 Aurora 46 Thin ice fog03 Mirage 47 Thick ice fog
04 Forest fire smoke
36

REPORT ON ACCOMPLISHMENTS NSF Cooperative Agreement
ATM-9732665, Subcontract №. S01-23286
05 Dry fog 50 Intermittent mizzle06 Dust suspended in the air 51 Continuous mizzle07 Spray 60 Intermittent rain08 Weed 61 Continuous rain09 Sea bloom 70 Intermittent snow10 Haze 71 Continuous snow
72 Intermittent moist snow12 Sea mist 73 Continuous moist snow13 Heat lightning 76 Ice needles
14 Precipitation within sight 77 Snow grains
18 Squall 78 Separate starlike ice crystals19 Spout 79 Ice rain
20 Dew 80 Intermittent shower rain21 Hoar 81 Continuous shower rain.22 Crystal white frost 83 Intermittent moist shower snow23 Firn white frost 84 Continuous moist shower snow24 Rime 85 Intermittent shower snow30 Duststorm 86 Continuous shower snow35 Snow haze 87 Intermittent soft or small hail36 Snow transfer on ice. 88 Continuous soft or small hail37 Blizzard 89 Intermittent hail38 Ground blizzard 90 Continuous hail
39 Snow storm 95 Thunderstorm at station.40 Distant fog 96 Distant thunderstorm.42 Water fog. 97 Sea spark-type luminescence
98 Sea sheet-type luminescence99 Luminescence of separate organisms
37

REPORT ON ACCOMPLISHMENTS NSF Cooperative Agreement
ATM-9732665, Subcontract №. S01-23286
Appendix 2
2.1. Archive Format for Presentation of Ship Marine Meteorological Data.Version 2. 24 January 2002.
No Field name Description Coding procedure Bytes Record position
1 ID Call sign 5 1-52 AAAA Year, UTC Four digits 4 6-93 MM Month, UTC 01-12, January to December 2 10-114 YY Day, UTC 01-31 2 12-135 GG Time of observation Tenths of hour UTC 3 14-16
6 TI Time indicator The same as in COADS 1 177 Q Octant of the globe WMO code table 3300 1 188 LaLaLa Latitude Tenths of degrees 3 19-219 LoLoLo Longitude Tenths of degrees 4 22-25
10 LI La/Lo indicator The same as in COADS 1 2611 N Cloud amount Octas, WMO code table
27001 27
12 dd True wind direction WMO code table 0877,Tens of degrees
2 28-29
13 DI Wind direction indicator The same as in COADS 1 3014 ff Wind speed M/s 2 31-32
15 WI Wind speed indicator The same as in COADS 1 3316 VV Visibility WMO code table 4377 2 34-35
17 VI Visibility indicator The same as in COADS 1 3618 ww Present weather WMO code table 4677 2 37-3819 W1 Past weather WMO code table 4561 1 3920 W2 Past weather WMO code table 4561 1 4021 PPPP Air pressure Tenths of hectopascals 5 41-4522 TTT Air temperature Tenths of degrees
Celsius4 46-49
23 TwTwTw Sea surface temperature Tenths of degrees Celsius
4 50-53
24 T1 Temperature indicator The same as in COADS 1 5425 SI Sea surf. temp. method
indicatorThe same as in COADS 1 55
26 Nh Amount of lowest clouds As reported for CL or, if no CL clouds is presented for CM, in octas; WMO code table 2700
1 56
27 CL Genus of CL cloud WMO code table 0513 1 5728 h Height of clouds WMO code table 1600 1 58
29 HI Cloud height indicator The same as in COADS 1 5930 CM Genus of CM clouds WMO code table 0515 1 6031 CH Genus of CH clouds WMO code table 0509 1 6132 TdTdTd Dew point temperature tenths of degrees Celsius 4 62-6533 e Water vapor pressure Tenths of hectopascals 3 66-68
38

REPORT ON ACCOMPLISHMENTS NSF Cooperative Agreement
ATM-9732665, Subcontract №. S01-23286
34 U Relative humidity % 3 69-7135 TbTbTb Wet_bulb temperature Tenths of degrees
Celsius4 72-75
36 PWPW Wind wave period Whole seconds 2 76-7737 HWHW Height of wind waves Half-meter values 2 78-7938 ST Wave degree Code table 2 1 8039 MS State of sea surface Code table 3 1 8140 LW Wind wave length Meters 3 82-8441 dW1dW1 Direction of predominant
swell wavesTens of degrees 2 85-86
42 PW1PW1 Period of predominant swell waves
Whole seconds 2 87-88
43 SX Swell period indicator The same as in COADS 1 8944 HW1HW1 Height of predominant
swell wavesHalf-meter values 2 90-91
45 LW1 Length of predominant swell waves
Meters 3 92-94
46 HWMAX Maximum height of waves
Half-meter values 2 95-96
47 LLW Length of predominant wave
Meters 3 97-99
48 RRR Amount of precipitation which has fallen in the last 12 hours
0.1 Mm 3 100-102
49 tR Observational period for RRR and duration of precipitation
WMO code table 4019,FM 13-IX SHIP, 1989 edition
1 103
50 ci Concentration or arrangement of sea ice
WMO code table 0639 1 104
51 Si Stage of development WMO code table 3739 1 10552 zi Current ice situation (in
an hour of observation) and trends in conditions within three hours prior to the hour of observations
WMO code table 5239 1 106
53 Di True bearing of base ice edge
WMO code table 0739 1 107
54 bi Ice of land origin WMO code table 0439 1 10855 Q1 Quality control indicator
for (N)0. – no quality control (QC) has been performed.1.QC has been performed; element appears to be correct.2. QC has been performed; element appears to be inconsistent with other elements.
1 109
39

REPORT ON ACCOMPLISHMENTS NSF Cooperative Agreement
ATM-9732665, Subcontract №. S01-23286
3. QC has been performed; element appears to be doubtful.4. QC has been performed; element appears to be erroneous.9. The value of the element missing.
56 Q2 Quality control indicator for (dd)
IDEM 1 110
57 Q3 Quality control indicator for (ff)
IDEM 1 111
58 Q4 Quality control indicator for (VV)
IDEM 1 112
59 Q5 Quality control indicator for (ww)
IDEM 1 113
60 Q6 Quality control indicator for (W1)
IDEM 1 114
61 Q7 Quality control indicator for (W2)
IDEM 1 115
62 Q8 Quality control indicator for (PPPP)
IDEM 1 116
63 Q9 Quality control indicator for (TTT)
IDEM 1 117
64 Q10 Quality control indicator for (TwTwTw)
IDEM 1 118
65 Q11 Quality control indicator for (Nh)
IDEM 1 119
66 Q12 Quality control indicator for (CL)
IDEM 1 120
67 Q13 Quality control indicator for (h)
IDEM 1 121
68 Q14 Quality control indicator for (CM)
IDEM 1 122
69 Q15 Quality control indicator for (CH)
IDEM 1 123
70 Q16 Quality control indicator for (TdTdTd)
IDEM 1 124
71 Q17 Quality control indicator for (e)
IDEM 1 125
72 Q18 Quality control indicator for (U)
IDEM 1 126
73 Q19 Quality control indicator for (TbTbTb)
IDEM 1 127
74 Q20 Quality control indicator for (PWPW)
IDEM 1 128
75 Q21 Quality control indicator for (HWHW)
IDEM 1 129
76 Q22 Quality control indicator for (ST)
IDEM 1 130
40

REPORT ON ACCOMPLISHMENTS NSF Cooperative Agreement
ATM-9732665, Subcontract №. S01-23286
77 Q23 Quality control indicator for (MS)
IDEM 1 131
78 Q24 Quality control indicator for (LW)
IDEM 1 132
79 Q25 Quality control indicator for (dW1dW1)
IDEM 1 133
80 Q26 Quality control indicator for (PW1PW1)
IDEM 1 134
81 Q27 Quality control indicator for (HW1HW1)
IDEM 1 135
82 Q28 Quality control indicator for (LW1)
IDEM 1 136
83 Q29 Quality control indicator for (HWMAX )
IDEM 1 137
84 Q30 Quality control indicator for (LLW)
IDEM 1 138
85 Q31 Quality control indicator for (RRR)
IDEM 1 139
86 Q32 Quality control indicator for (ci )
IDEM 1 140
87 Q33 Quality control indicator for (Si)
IDEM 1 141
88 Q34 Quality control indicator for (zi)
IDEM 1 142
89 Q35 Quality control indicator for (Di)
IDEM 1 143
90 Q36 Quality control indicator for (bi)
IDEM 1 144
Missing values for all fields are indicated by “ blank”.
TABLE 2.2List of the Regions
Area name Num Area name NumArctic Ocean (high 80N) 100 Drake strait 231Beaufort Sea, Larry Bay 107 North Pacific (30N-80N) 410Greenland sea 108 Bering Sea 411Baffin Bay, Davis strait 109 Japan Sea 413North Atlantic (30N-80N) 210 Yellow Sea, Pacific (30S- 414Norwegian Sea 211 Tropical Pacific (30N-30S) 420North Sea, Irish Sea, English channel 212 South China Sea 421Baltic Sea, Kattegat strait 213 Malay archipelago Seas 422Mediterranean Sea 214 South Pacific(30S-60S) 430Hudson strait, Hudson bay 216 Red sea, Arabian Sea, Bay 510Tropical Atlantic (30N-30S) 220 Tropical Indian Ocean 520Caribbean Sea, gulf of Mexico 221 South Indian Ocean (30S- 530South Atlantic (30S- 60S) 230 Antarctic water (high 60S) 600
41

REPORT ON ACCOMPLISHMENTS NSF Cooperative Agreement
ATM-9732665, Subcontract №. S01-23286
REFERENCES
1. Code for Communication of Hydrometeorological Data from Surface and Marine
Observing Stations, КН-01 (International Form FM 12-VII SHIP). – Leningrad:
Gidrometeoizdat, 1981.-72p.
2. Manual on Preparation of the Upper Air Annuals //.Мoscow: Gidrometeoizdat,
1963. - 164 p.
3. Manual for Hydrometeorological Stations on Radiation Balance Observations. –
Leningrad, Gidrometeoizdat, 1971, 219p.
4. Manual on Control of Radiation Balance Observations. – Leningrad,
Gidrometeoizdat, 1970, 125 p.
5. RD 52.04.562-96. Manual for Hydrometeorological Stations and Posts. Iss. 5, Part
1// Moscow, Roshydromet, 1997, 222 p.
6. Methodological Guidelines on Meteorological and Actinometrical Observations
from Research Vessels. General Methodological Requirements to Establishment and
Development of Meteorological and Actinometrical Observation Subsystem. Part 1,
Leningrad: Reprint MGO, 1983, 98 p.
7. Methodological Guidelines on Meteorological and Actinometrical Observations
from Research Vessels. General Methodology of Measurements, Assessments and
Observations. Part II, Leningrad: Reprint MGO, 1983, 91 p.
8. Methodological Guidelines on Meteorological and Actinometrical Observations
from Research Vessels. Requirements to Data Preparation for PC Entry. Part 3, Leningrad:
Reprint MGO, 1986, 102 p.
9. Methodological Guidelines on Meteorological and Actinometrical Observations
from Research Vessels. Requirements to Use of Software Package for Primary Processing,
Control and Accumulation on Magnetic Tape of RV Meteorological and Actinometrical
Observations. Part 3, Leningrad: Reprint MGO, 1986, 81 p.
42