regiograph · professional geomarketing companies of all branches need to know where the best...
TRANSCRIPT

RegioGraph
customer and market analysis | sales territory planningsales controlling | location evaluation
2
Professional geomarketing
Companies of all branches need to know where the
best customers are located, the extent of their mar-
ket exploitation and whether their sales territories
are optimally structured.
The geomarketing software solution RegioGraph
provides quick and objective answers to these and
many other questions. With RegioGraph, sales and
marketing divisions can analyze their customers and
markets and plan efficient sales territories directly
on digital maps. This allows them to spot patterns,
relationships and potential that would otherwise go
unnoticed. The software also brings transparency
and reliability to location-related decisions.
RegioGraph thus provides an objective basis from
which to make more informed marketing, sales,
controlling and expansion decisions.
A tried and true software
RegioGraph is the culmination of more
than 74 years of GfK experience in
regional market optimization. This
means you can rely on the software and
the results of its analyses to guide you
toward better business decisions. With
more than 40,000 users, RegioGraph is
Germany's most popular geomarketing
software.
Use RegioGraph to determine your
regional turnover potential, plan efficient
sales territories, reach your customers
more effectively, develop sustainable
location concepts and save valuable time
and money.
Why RegioGraph?
Specially designed for sales, marketing �
and controlling
More than 20 years of market success �
User-friendly interface that requires no �
prior experience
Includes maps, data on potential and �
Tele Atlas street maps
Innovative planning and analysis tools �
for working on all regional levels, from
states to street segments
Boundless expandability options for �
your international operations
Exceptional customer support through �
free user hotline, web tutorials, ad-
ditional downloads and discounted
training courses
Sales territory planning
External sales force management
Turnover planning
Territory reporting
Cost optimization
Customer analysisBranch network optimization
Location analysis and planning
Risk analysis
Target group localization
Direct marketing
Competitor analysis
for decision-makers
RegioGraph – the premium geomarketing software solution
applications
Market analysis
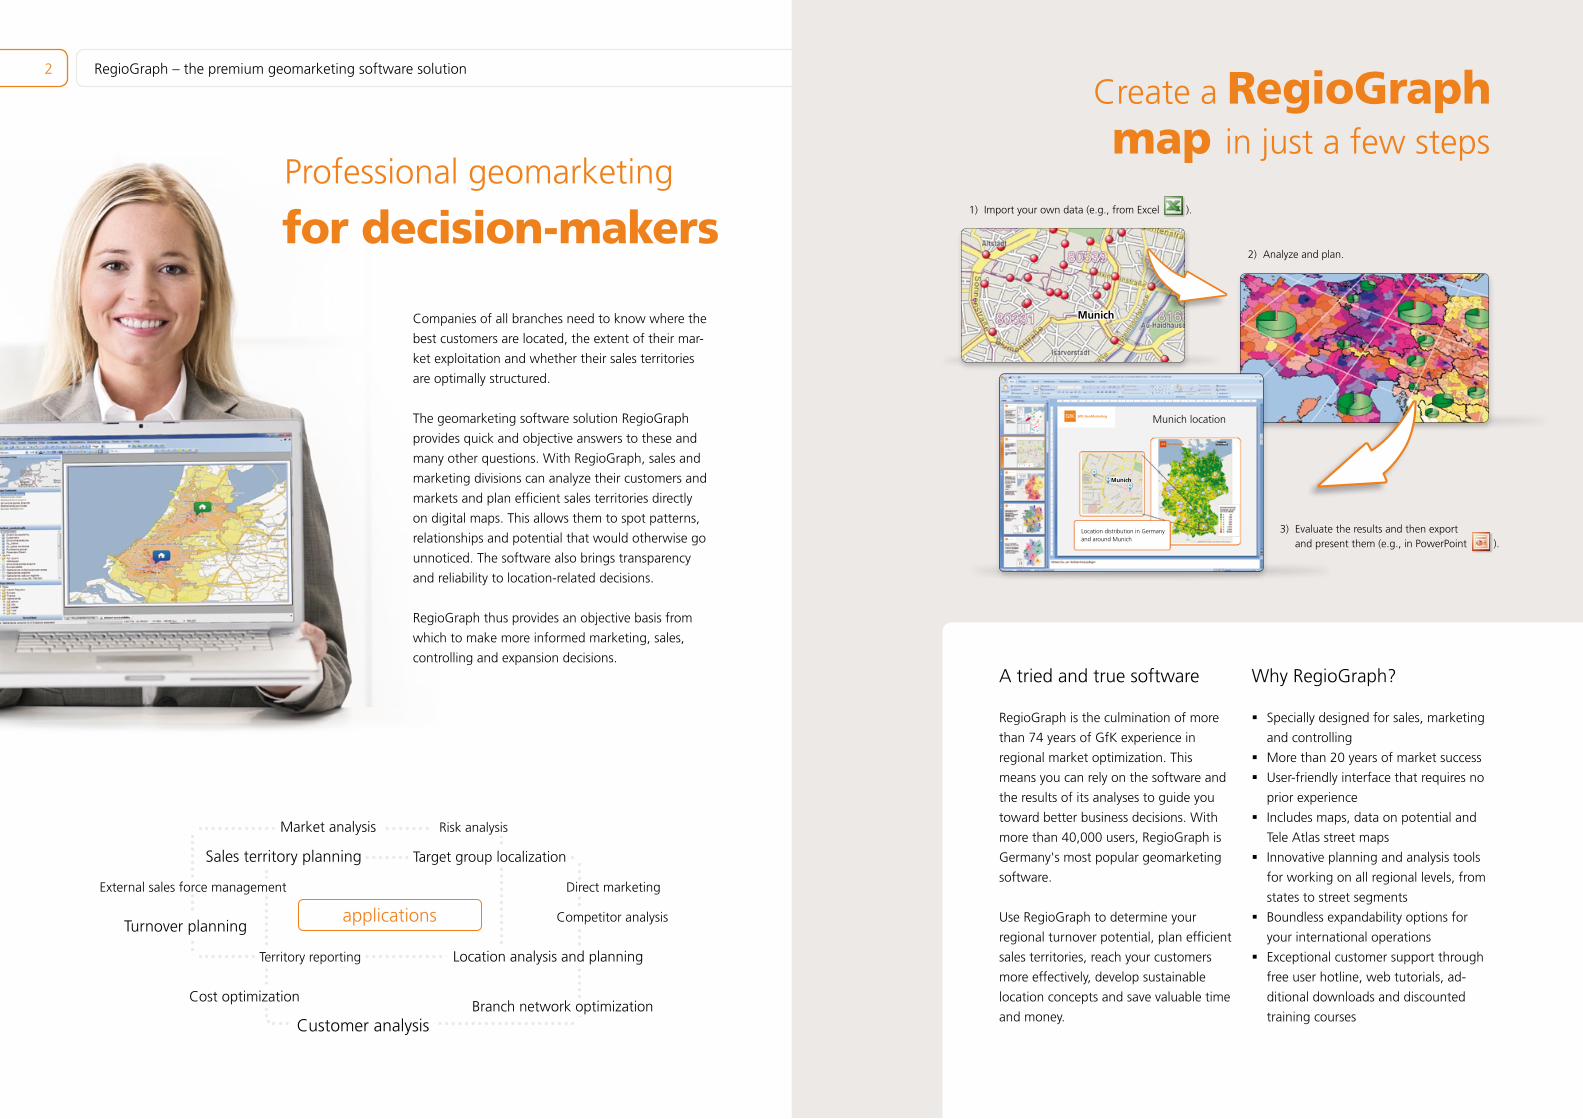
1) Import your own data (e.g., from Excel ).
2) Analyze and plan.
3) Evaluate the results and then export and present them (e.g., in PowerPoint ).
map in just a few stepsCreate a RegioGraph
GfK GeoMarketing
GfK GeoMarketing
GfK GeoMarketing
GfK GeoMarketing
GfK GeoMarketing
GfK GeoMarketing
Location distribution in Germany and around Munich
Munich location
Munich
Munich

4
RegioGraph contents
All versions of RegioGraph include the
following maps and data on potential for
Germany, Austria and Switzerland or a
European country of your choice:
GfK Purchasing Power dataDetermine your target group's consump-
tion potential for every region in your
country of operation.
GfK Inhabitants Households datasetQuickly and easily quantify your target
group in your catchment areas, sales ter-
ritories or advertising distribution zones.
The latest mapsRegioGraph includes the reliable, up-to-date
cartographic basis of GfK GeoMarketing and
Tele Atlas as well as the latest administrative,
postcode, topographic and street maps.
Analyses of potential
Custom-tailored for
What does your customer distribution look like?
Where are areas of untapped potential? What is the
extent of your market exploitation?
Regional analyses of your turnover and customer
data with RegioGraph provide a penetrating
glimpse into your company operations. Use these
analyses to see how your data breaks down for
every postcode or municipality and arrive at a bet-
ter understanding of your customer distribution,
regions with a high degree of market exploitation
and areas with untapped potential.
RegioGraph allows you to import data and carry
out detailed evaluations down to the level of street
segments. For example, use this level of detail to
find out the number of customers accessible within
5 minutes of travel time from your branch locations.
You can also plan direct marketing campaigns for
your most promising regions directly on the map.
analyses of potential
Use RegioGraph to
visualize your customer distribution �
pinpoint target groups �
analyze regional markets �
determine product potential �
evaluate turnover results �
set realistic company targets �
plan direct marketing campaigns �
optimize budgets �
To support these tasks, RegioGraph includes
comprehensive data on potential, more than 100
analysis, calculation and display options as well as
detailed reporting features.
Manuela Schlüß (sales) and Sandra Woltig (marketing), Tönsmeier
"We continue to be amazed by
RegioGraph's visualizations of our
complex business processes and
the resulting insights."
Detailed data included
A company's turnover figures can
only be understood and evaluated by
comparing them to objectively derived
market data. To this end, all three ver-
sions of RegioGraph – "Analysis",
"Planning" and "Strategy" – include
the GfK Purchasing Power and GfK
Inhabitants Households datasets for all
postcodes and municipalities of a Euro-
pean country of your choice.
The expert (German) version of the
software – "RegioGraph Strategy" –
also includes detailed data for Germany
at the level of street segments. Users can
choose from GfK data on end-consumer
potential or data on business potential
from our partner, D&B.
Upon request, we can also calculate regional target group indices for your specific products. Please contact us to learn more.
GfK Purchasing Power
Europe Index per inhabitant for the 2-digit postcodes
No values available
190
>190
160
180
170
10
150
140
130
120
110
100
90
80
70
60
50
40
30
20
European
average
6
Professional tools for sales
Sales territory planning wizard Specify how your territories should be
optimized – e.g., according to turnover,
potential, accessibility, etc. RegioGraph
then creates the ideal territory structure
based on these parameters.
Multi-level sales territory planning RegioGraph can optimize sales struc-
tures, regardless of how many levels
or product channels they contain. Plan
heads of sales regions as well as day-to-
day customer visits. Any imported data is
linked across all existing levels to provide
maximum transparency.
Compare sales territory structuresRegioGraph compares your old and new
territory structures and summarizes the
findings in a report. This allows you to
immediately identify the strengths and
weaknesses of a new structure.
Daily territory reportsReports and maps generated by Regio-
Graph keep your colleagues up-to-date.
You can import new data into an existing
sales territory structure or planning sce-
nario at any point. Territories and regions
are then automatically updated to reflect
this new information.
Sales territory planning
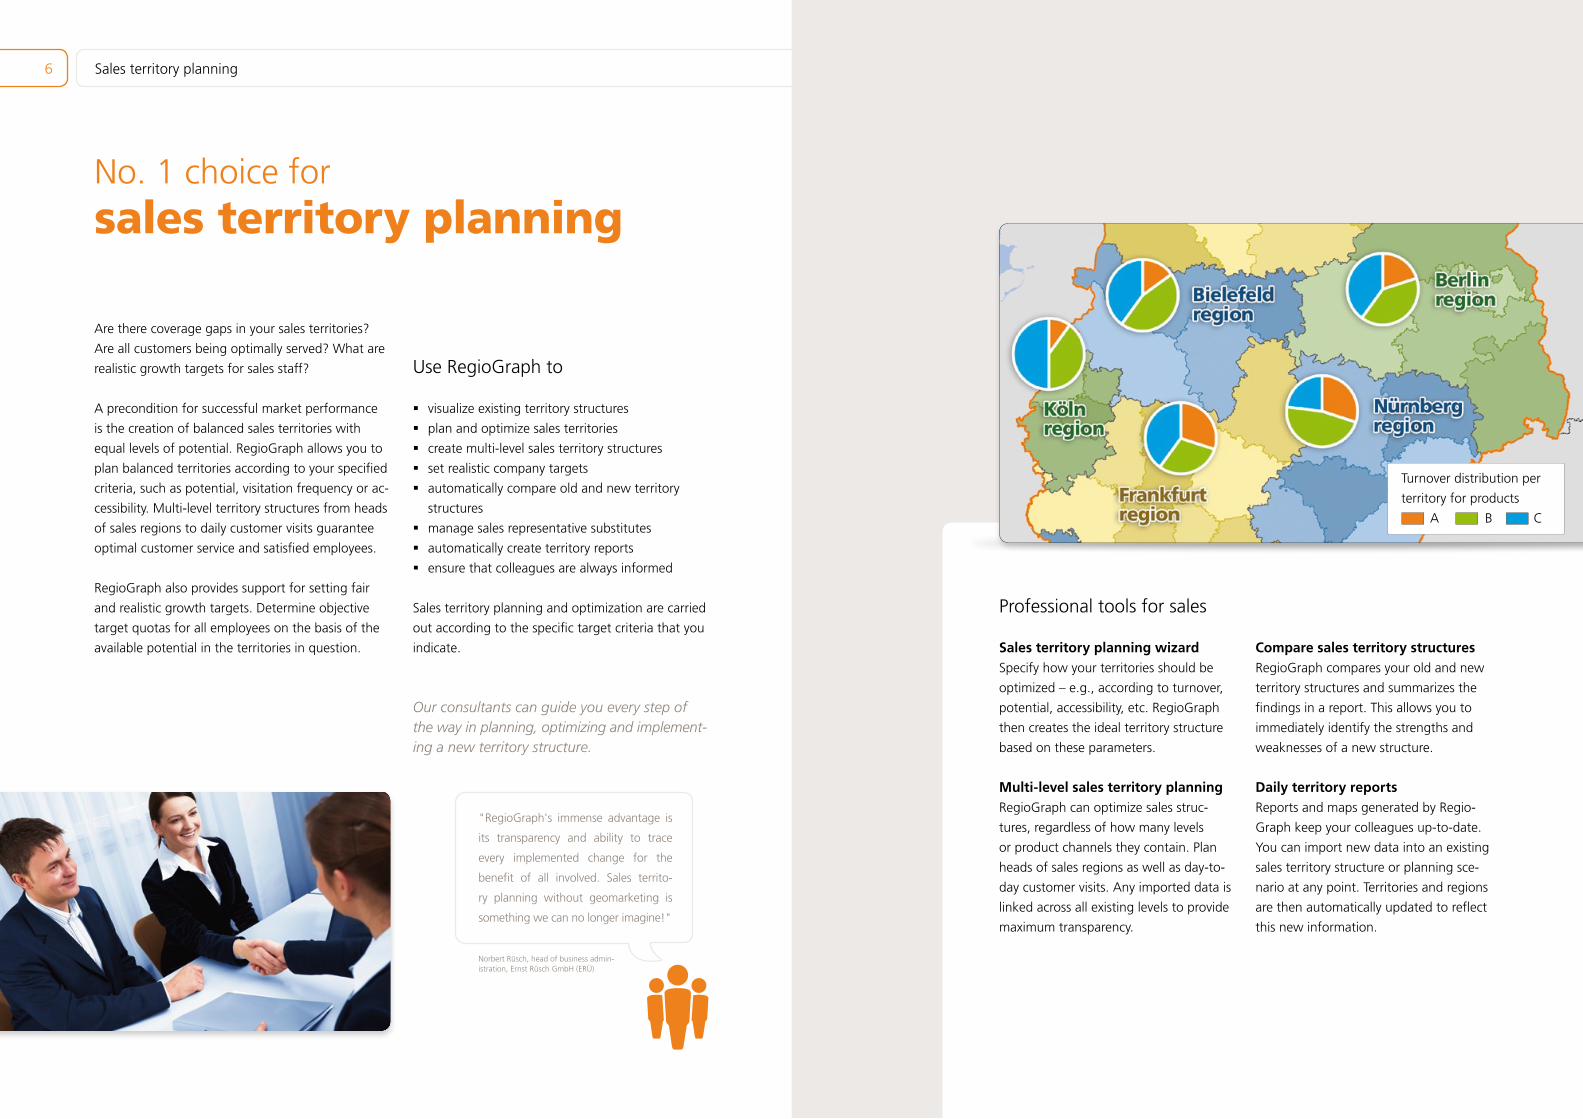
Turnover distribution per
territory for products
A B C
sales territory planning
Use RegioGraph to
visualize existing territory structures �
plan and optimize sales territories �
create multi-level sales territory structures �
set realistic company targets �
automatically compare old and new territory �
structures
manage sales representative substitutes �
automatically create territory reports �
ensure that colleagues are always informed �
Sales territory planning and optimization are carried
out according to the specific target criteria that you
indicate.
Our consultants can guide you every step of the way in planning, optimizing and implement- ing a new territory structure.
No. 1 choice for
Are there coverage gaps in your sales territories?
Are all customers being optimally served? What are
realistic growth targets for sales staff?
A precondition for successful market performance
is the creation of balanced sales territories with
equal levels of potential. RegioGraph allows you to
plan balanced territories according to your specified
criteria, such as potential, visitation frequency or ac-
cessibility. Multi-level territory structures from heads
of sales regions to daily customer visits guarantee
optimal customer service and satisfied employees.
RegioGraph also provides support for setting fair
and realistic growth targets. Determine objective
target quotas for all employees on the basis of the
available potential in the territories in question.
Norbert Rüsch, head of business admin-istration, Ernst Rüsch GmbH (ERÜ)
"RegioGraph's immense advantage is
its transparency and ability to trace
every implemented change for the
benefit of all involved. Sales territo-
ry planning without geomarketing is
something we can no longer imagine!"
8
Ideal for retail ...
Location analysis and planning RegioGraph shows the current boundar-
ies of your catchment areas, the amount
of available potential in each catchment
area and the extent to which this poten-
tial is being exploited. Regional analy-
ses produce transparent results when
expanding and streamlining your branch
network.
Gravity modelYou can use RegioGraph to dynamically
model your locations' catchment areas.
This is possible thanks to the integrated
Huff gravity model, which calculates the
drawing power of new and existing loca-
tions. We'd be happy to show you how
to calibrate the model for your location
evaluations.
... and for manufacturers
Product flow analysesRegioGraph's integrated product flow
analysis feature lets you create a volume-
based visualization of the relationship
between one or more locations. Develop
planning scenarios and gauge whether
your network can be further optimized
and streamlined.
Distance zones and matricesUsing the included Tele Atlas street data,
you can calculate distances around your
locations according to linear distance,
drive-time or pedestrian accessibility. For
example, determine the shortest street
route between two customers. You can
also view the distance relationships of all
your locations as a distance matrix in the
form of a table or map.
Location decisions
Sound and objective
What do your catchment areas look like? Where are
ideal regions for a new location? How efficient are
your supplier regions and product flows?
RegioGraph provides support for all location-related
tasks. Analyses of supplier relationships, product
flows, catchment areas and propensity to buy yield
immediate insight when visualized on maps.
Retail companies can use RegioGraph to analyze
market potential, customer and competitor dis-
tribution throughout catchment areas as well as
gaps and overlaps in branch networks. Manufac-
turers can also analyze and optimize their supplier
relationships thanks to specialized tools available
directly on the map.
Location decisions
Use RegioGraph to
analyze locations and catchment areas �
identify regions for new locations �
evaluate and optimize branch networks �
visualize product flows �
analyze supply relationships �
determine distance zones around locations �
calculate the drawing power of locations �
generate location rankings �
The integrated data on potential help you make
more informed decisions.
We can assist you with any location-related task, such as optimizing your branch network, determining market exploitation or carrying out on-site location appraisals.
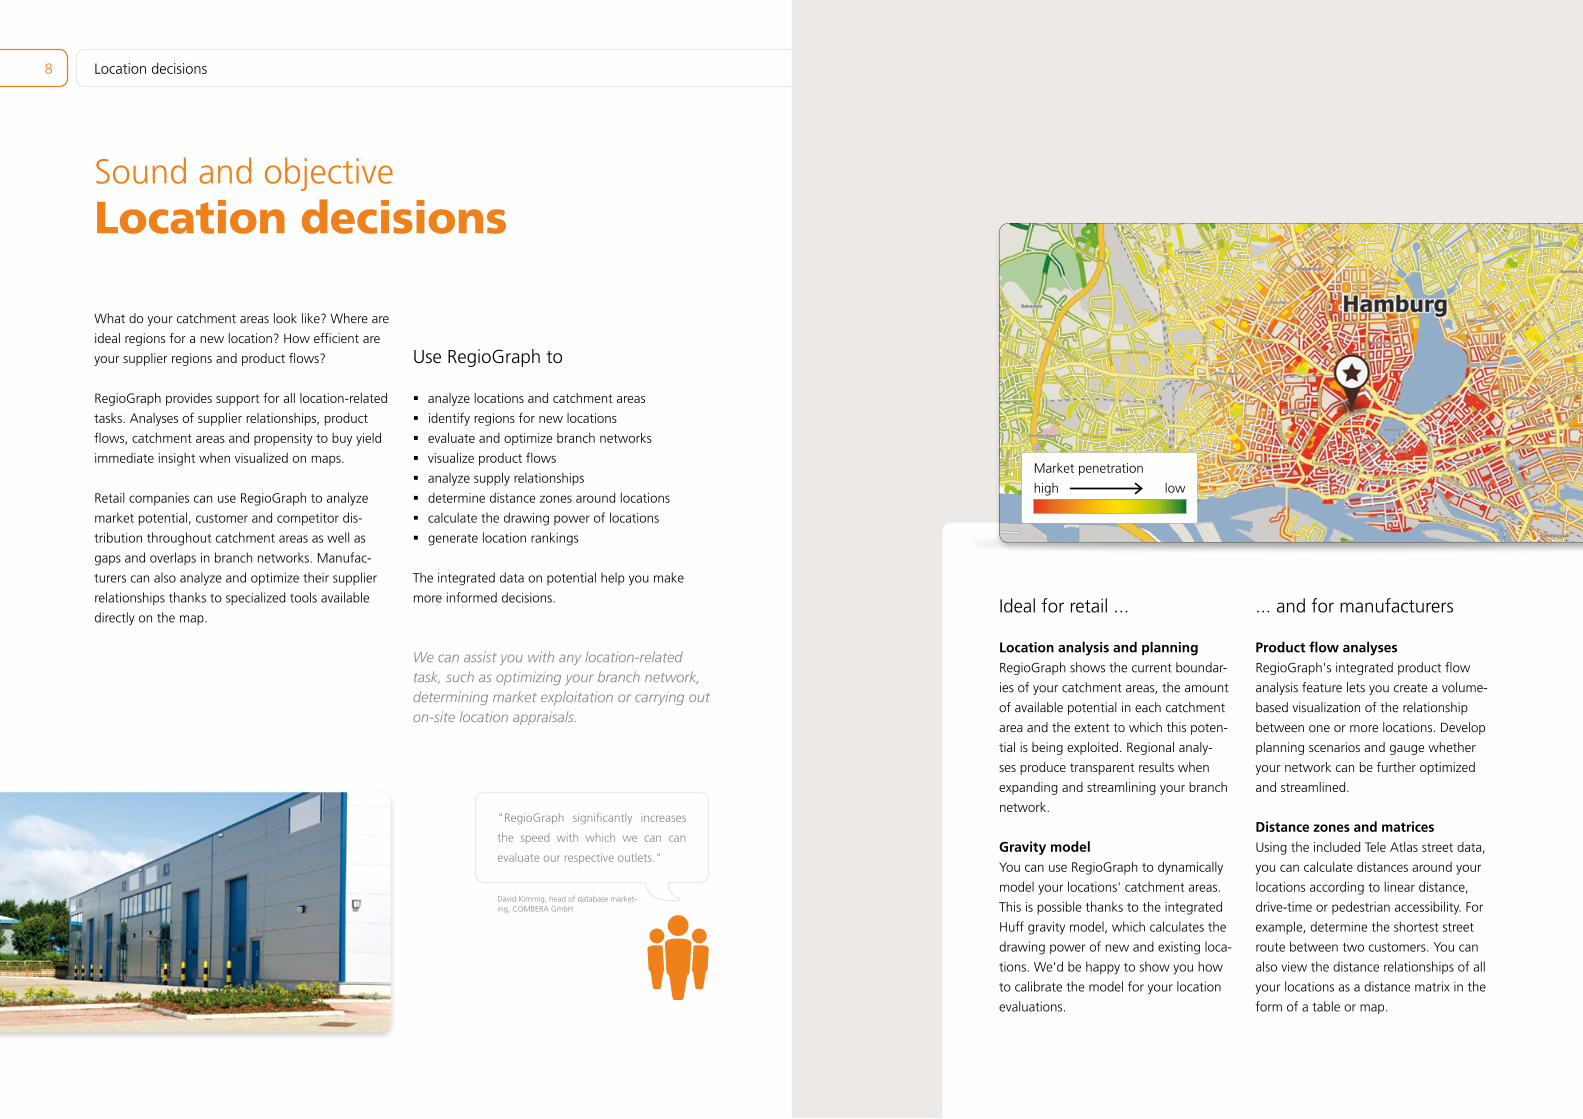
Market penetration
high low
David Kimmig, head of database market-ing, COMBERA GmbH
"RegioGraph significantly increases
the speed with which we can can
evaluate our respective outlets."

10
New robust reporting options
Territory comparisonUse RegioGraph to compare two sales
territory structures. A report shows a
before-and-after comparison of both
scenarios. Overview maps and tables
display the most important results and
reveal the strengths and weaknesses of
both structures.
Growth opportunitiesSet fair and realistic growth targets for
your sales colleagues. The software
shows the current market exploitation
in every territory and calculates growth
targets for each employee on the basis
of the existing potential in the sales terri-
tory. An overview map shows the current
degree of exploitation.
Data analysisUsing the data analysis mode, you can
evaluate large quantities of data in mere
minutes, down to the level of street seg-
ments. You can specify the query area
– for example, several streets or an entire
postcode or municipality. A report summa-
rizes the data associated with the query re-
gion according to parameters you specify.
The included data columns and charts can
be individually selected and adjusted.
Location potentialRegioGraph presents the performance
results of your five strongest and weakest
locations in the form of a report, provid-
ing an optimal basis for making more
informed location decisions.
Reporting
Optimal tool for detailed,
Use RegioGraph to
evaluate data down to the level of street segments �
query associated data at the press of a button �
export results as a map, PDF or table �
generate location rankings �
compare sales territory planning scenarios �
determine growth targets for sales �
RegioGraph can even evaluate large quantities of
data down to the level of street segments in just
minutes.
insight-generating reports
Do you want to extract the most important trends
and insights from your data? Are you looking for an
objective basis for your business decisions?
RegioGraph brings clarity to the mountains of infor-
mation contained in your data by visualizing it on a
map. RegioGraph is thus the ideal interface be-
tween your ERP and CRM system and presentations
of results to customers, employees and supervisors.
RegioGraph's reporting functions bring clarity to
your company data. Overview maps, rankings and
charts bring together the most important informa-
tion on locations, sales territories and markets.
These aspects of the software allow you to always
work with up-to-date data. RegioGraph automati-
cally updates existing data every time you import
new data.
Klaus Wartlik, CEO of marketing and sales, C. & E. FEIN GmbH
"The reliability and clear analyses facil-
iated by this approach ensure greater
transparency and confidence in our de-
cisions, which are essential qualities to
a globally active company like Fein."
Enrich your RegioGraph reports with objective GfK data on potential. We can advise you as to the specific data that will best support your needs.
ReportReport

12
RegioGraph version
Base functions Analysis Planning Strategy
Import data of all standard formats (e.g., *.xlsx, *.txt, *.mdb, *.csv) x x x
Import customers and locations at the level of street segments (geocoding) x x
Address search feature x x x
Data export (spreadsheets, HTML documents, presentations, PDFs, printing) x x x
Quick Start Menu (data import, project management, common RegioGraph tasks) x x x
Analyses (ABC, dot density, pictograms, portfolio, locations, etc.) x x x
Calculations (filter, select, distances, regions, trends, etc...) x x x
Statistical evaluations(index, % of total, % of max., deviation from average, per mille of total, etc.)
x x x
Automatically update data, map layers, analyses and territories x x x
Transfer data between territories on the basis of the road network for more realistic results x x
Layout generator for HTML pages, worksheets, printing and bookmarks x x x
Present maps in full-screen mode x x x
Map editor for professional digitization x x
Georeference raster map images and bitmap files x x
Sales territory planningSales territory planning wizard x x
Manually plan new territories x x x
Automatically plan and name new territories x x
Generate new territories according to drive-time accessibility x x
Generate new territories using specified maximum values x x
Optimize territory structures automatically and interactively x x
Create multi-level territory structures (top-down or bottom-up) x x
Plan and optimize sub-regions/territories x x
Determine optional locations within territories x x
Calculate substitutes for sales representatives x x
Generate territory reports, compare territories and identify growth opportunities x x
Location planningCalculate drive-time zones and catchment areas x x
Calculate distance matrix between locations x
Product flow analysis x
Heat map (Delaunay analysis) x
Data analysis mode (data evaluation at the street-segment level, expanded reporting options) x
Automatically determine and compare location potential x
Evaluate locations (market share zones, potential zones, catchment areas) x
Integrated data and mapsAll administrative, postcode and topographic maps* x x x
Data on inhabitants, households and purchasing power down to the level of postcodes* x x x
Customer supportFree customer support hotline x x x
Online RegioGraph tutorials x x x
Free additional downloads x x x
One-day introduction included x
* For Germany, Austria and Switzerland or a European country of your choice; more information at www.gfk-regiograph.com/europe.
Comparison of RegioGraph versions
RegioGraph Analysis RegioGraph Planning RegioGraph Strategy
for customer & market analyses for sales territory planning for location evaluations
All maps and GfK Purchasing �
Power for Germany, Austria
and Switzerland or a European
country of your choice
All maps and GfK Purchasing �
Power for Germany, Austria
and Switzerland or a European
country of your choice
All maps and GfK Purchasing �
Power for Germany, Austria
and Switzerland or a Euro-
pean country of your choice
Diverse analysis and visuali- �
zation options
Diverse analysis and visuali- �
zation options
Diverse analysis and visuali- �
zation options
Professional sales territory �
planning tools
Professional sales territory �
planning tools
Location evaluation and �
detailed data analysis
Choose your version ofRegioGraph
GfK GeoMarketing
Strategy
GfK GeoMarketing
Planning
GfK GeoMarketing
Analysis

15
Everything in one packet
RegioGraph makes it easy for users and
IT divisions to implement geomarketing.
Designed as a stand-alone solution, us-
ers can start working with the software
immediately following installation. The
purchase of expensive additional soft-
ware is unnecessary.
The data and maps included with Regio-
Graph are automatically installed along
with the software. Costly consulting
sessions and time-intensive implementa-
tion phases are completely unnecessary.
RegioGraph already contains all key
components for creating geomarketing
projects. And should questions arise,
GfK GeoMarketing provides free cus-
tomer support.
RegioGraph training courses
We offer a highly lauded training course
to facilitate your implementation of
geomarketing. You'll be a RegioGraph
professional after completing our two-day
training course led by an experienced in-
structor at our site in Bruchsal, Germany.
Learn step-by-step how you can use
your market and company data to create
insight-generating maps and plan ef-
ficient sales territories.
Our instructors can also deliver the course
at your place of business. Information on
conditions and training course dates can
be found at:
www.gfk-regiograph.com/training
For boundless planning and analyses that yield more insight
for RegioGraph
Worldwide maps
RegioGraph includes comprehensive maps for a
European country of your choice.
As the world's largest supplier of digital postcode
and administrative maps, we can offer up-to-date
maps for any country in the world in the Regio-
Graph format. All of these maps are created by our
own in-house cartographers and fit together seam-
lessly, without gaps or overlaps. After importing the
maps into RegioGraph, you can begin analyzing
and planning right away.
Get to know our map collection better by down-
loading some free samples:
www.gfk-regiograph.com/maps
Enhancements
Europe-wide market data
Extract more insight from your RegioGraph analyses
by incorporating objective GfK data on potential!
GfK GeoMarketing specializes in calculating Europe-
wide end-consumer and business potential for a
wide range of branches and products.
Our focus is on the calculation of turnover poten-
tial on the regional level - for example, for every
postcode and municipality of a given country. In
the case of Germany, GfK data is available for more
than 2.6 million street segments.
More information on our data and free samples can
be found at:
www.gfk-regiograph.com/data
A wealth of customer
Quick Start Manualincluded with the software
User hotline (Mon.-Fri., 9:00-17:00):Tel. +49 (0)7251 9295112
Support by e-mail:[email protected]
Web tutorials:www.gfk-regiograph.com
support options

16
GfK GeoMarketing GmbH | Werner-von-Siemens-Str. 9 | Gebäude 6508 | 76646 Bruchsal | Germany | [email protected] | www.gfk-regiograph.com
If you have any questions, contact us at +49 (0) 7251 9295200 or visit www.gfk-regiograph.com.
With data from With maps of Recipient of Compatible with Partner of
GfK GeoMarketing