fortumapps.fortum.fi/gallery/fortum_investor_presentation_may_2015.pdf · investor / analyst...
TRANSCRIPT
FORTUM Power and heat company in the Nordic area, Russia, Poland and the Baltics
Investor / Analyst material
May 2015
2
Disclaimer
This presentation does not constitute an invitation to underwrite, subscribe for,
or otherwise acquire or dispose of any Fortum shares.
Past performance is no guide to future performance, and persons needing
advice should consult an independent financial adviser.
Content
3
Fortum today pages 4 – 17
European and Nordic power markets pages 18 – 29
Fortum’s nuclear fleet pages 30 – 33
Russia pages 34 – 39
Capacity payments pages 37 – 38
Fortum’s investment programme page 39
Financials and outlook pages 40 – 45
Hedging pages 46
Distribution business page 47
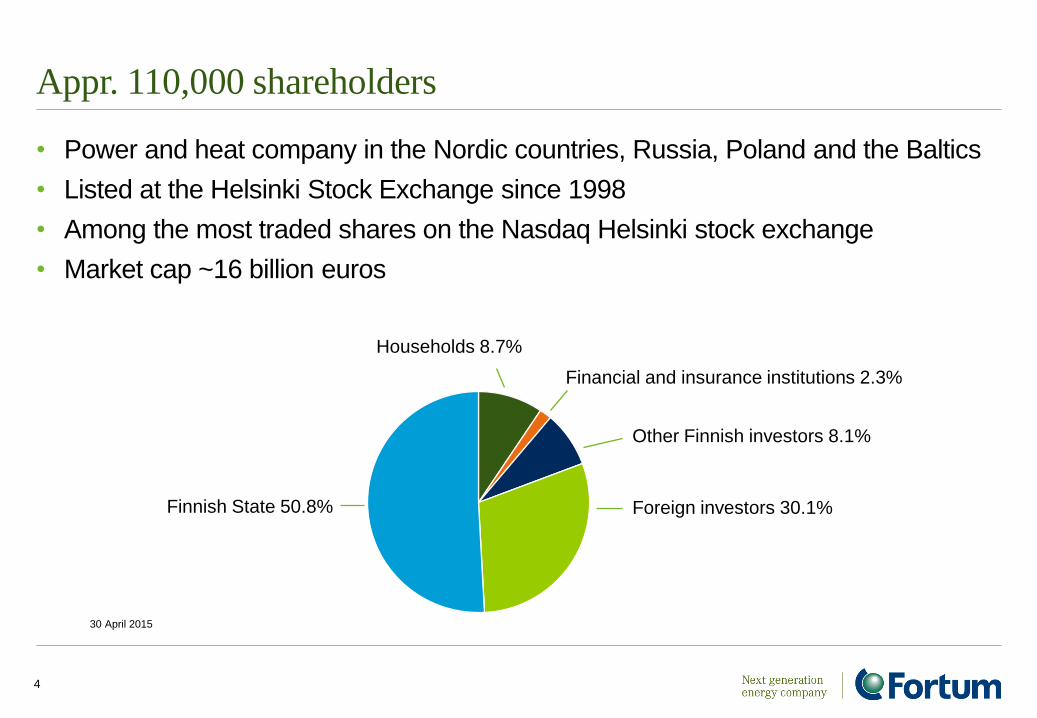
Appr. 110,000 shareholders
• Power and heat company in the Nordic countries, Russia, Poland and the Baltics
• Listed at the Helsinki Stock Exchange since 1998
• Among the most traded shares on the Nasdaq Helsinki stock exchange
• Market cap ~16 billion euros
4
30 April 2015
Foreign investors 30.1% Finnish State 50.8%
Other Finnish investors 8.1%
Households 8.7%
Financial and insurance institutions 2.3%
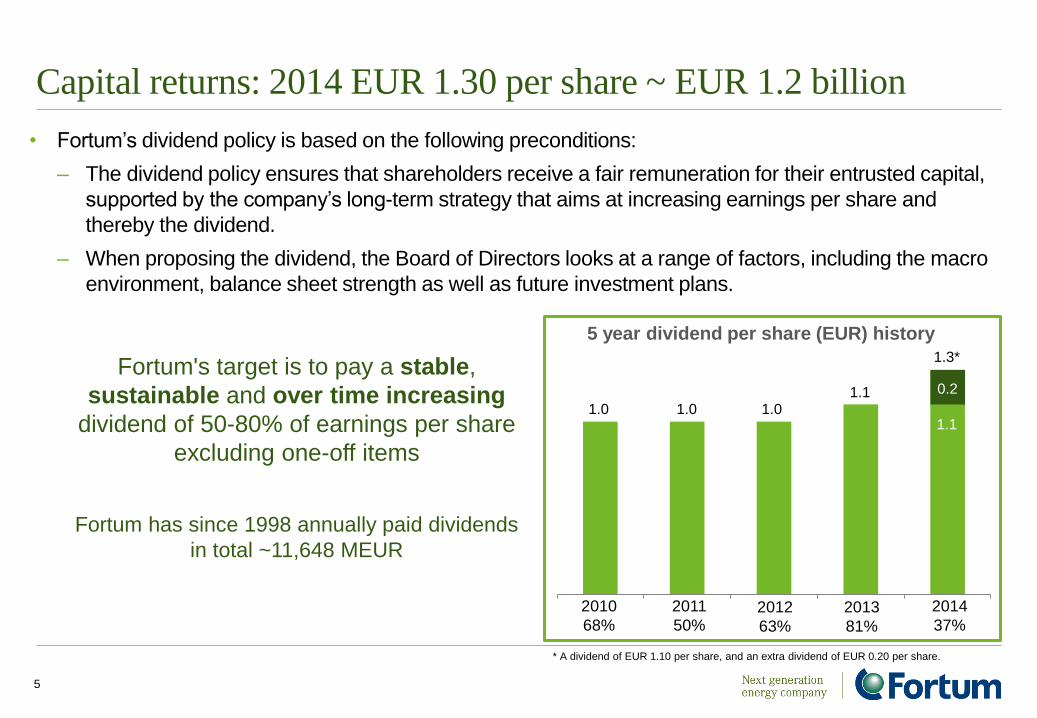
Capital returns: 2014 EUR 1.30 per share ~ EUR 1.2 billion
• Fortum’s dividend policy is based on the following preconditions:
– The dividend policy ensures that shareholders receive a fair remuneration for their entrusted capital,
supported by the company’s long-term strategy that aims at increasing earnings per share and
thereby the dividend.
– When proposing the dividend, the Board of Directors looks at a range of factors, including the macro
environment, balance sheet strength as well as future investment plans.
5
Fortum's target is to pay a stable,
sustainable and over time increasing
dividend of 50-80% of earnings per share
excluding one-off items
Fortum has since 1998 annually paid dividends
in total ~11,648 MEUR
2010
68%
2011
50% 2012
63%
2013
81%
2014
37%
1.0 1.0 1.0 1.1
1.3*
5 year dividend per share (EUR) history
0.2
1.1
* A dividend of EUR 1.10 per share, and an extra dividend of EUR 0.20 per share.
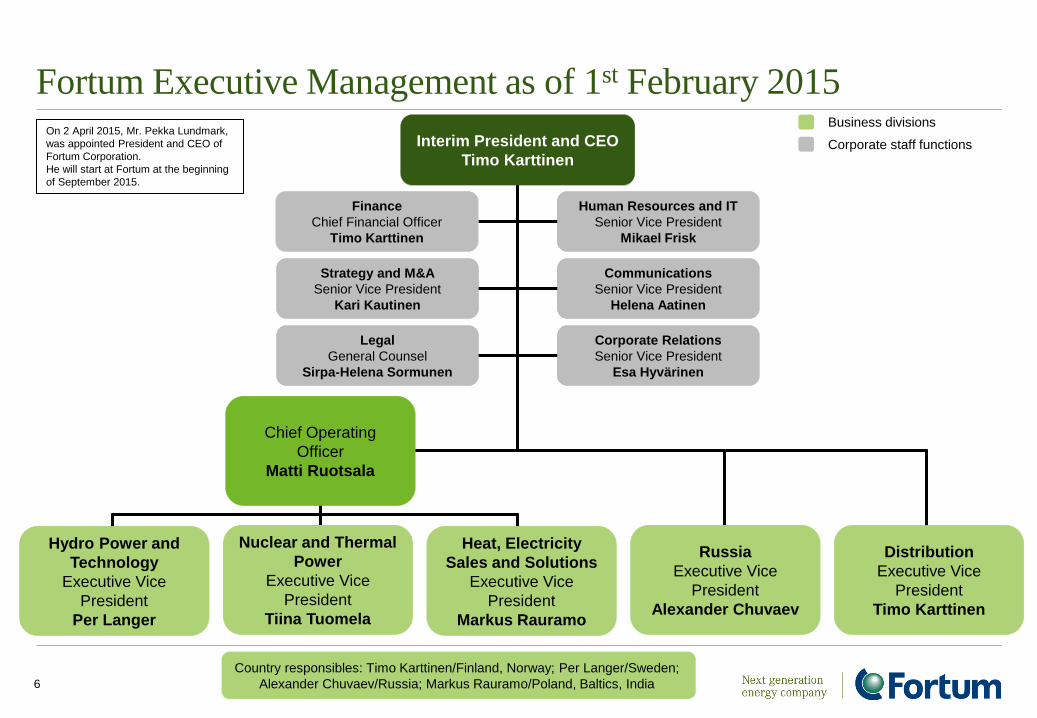
Fortum Executive Management as of 1st February 2015
6
Country responsibles: Timo Karttinen/Finland, Norway; Per Langer/Sweden;
Alexander Chuvaev/Russia; Markus Rauramo/Poland, Baltics, India
Human Resources and IT
Senior Vice President
Mikael Frisk
Finance
Chief Financial Officer
Timo Karttinen
Strategy and M&A
Senior Vice President
Kari Kautinen
Communications
Senior Vice President
Helena Aatinen
Corporate Relations
Senior Vice President
Esa Hyvärinen
Legal
General Counsel
Sirpa-Helena Sormunen
Business divisions
Corporate staff functions Interim President and CEO
Timo Karttinen
Chief Operating
Officer
Matti Ruotsala
Distribution
Executive Vice
President
Timo Karttinen
Russia
Executive Vice
President
Alexander Chuvaev
Nuclear and Thermal
Power
Executive Vice
President
Tiina Tuomela
Hydro Power and
Technology
Executive Vice
President
Per Langer
Heat, Electricity
Sales and Solutions
Executive Vice
President
Markus Rauramo
On 2 April 2015, Mr. Pekka Lundmark,
was appointed President and CEO of
Fortum Corporation.
He will start at Fortum at the beginning
of September 2015.
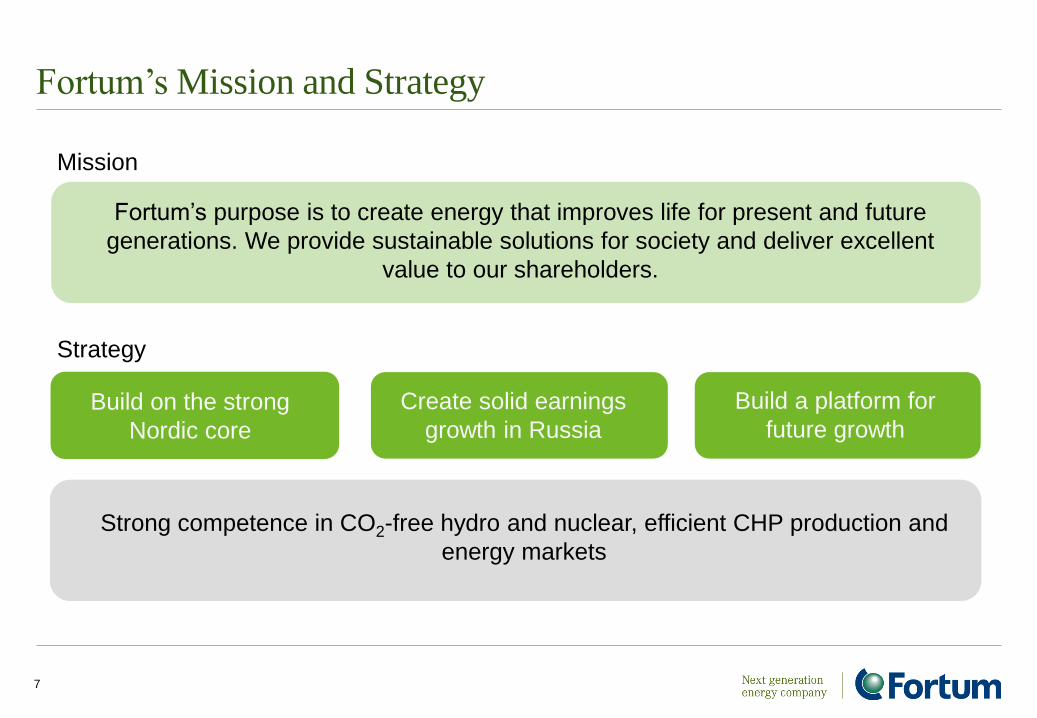
Fortum’s Mission and Strategy
7
Strategy
Fortum’s purpose is to create energy that improves life for present and future
generations. We provide sustainable solutions for society and deliver excellent
value to our shareholders.
Mission
Build on the strong
Nordic core
Create solid earnings
growth in Russia
Build a platform for
future growth
Strong competence in CO2-free hydro and nuclear, efficient CHP production and
energy markets
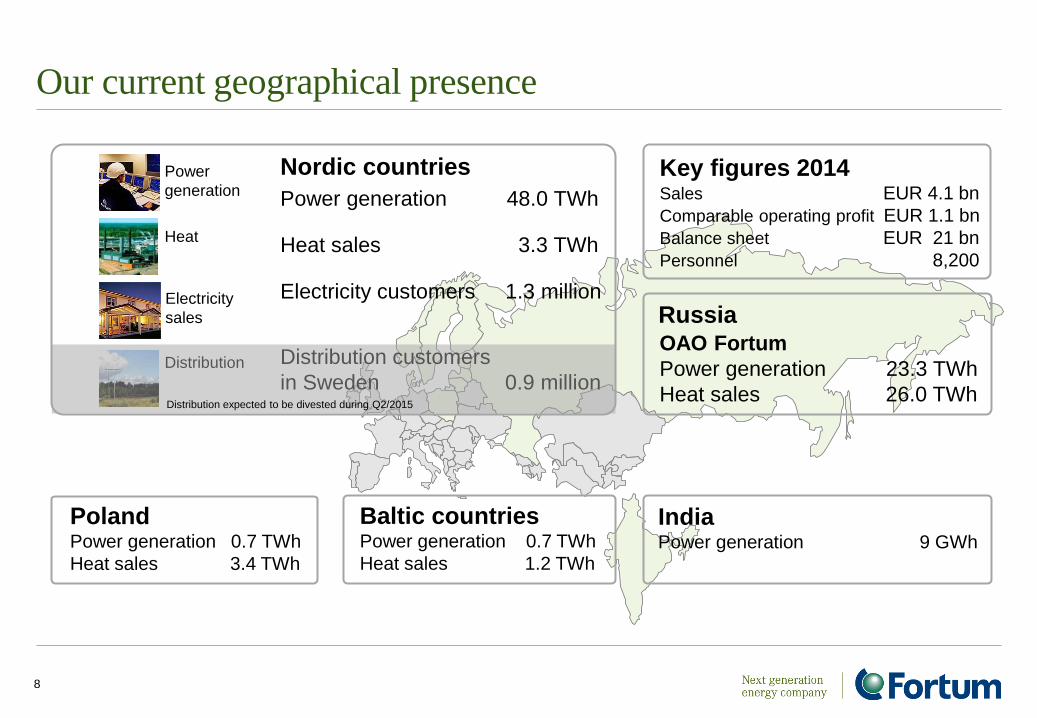
Our current geographical presence
8
Nordic countries
Power generation 48.0 TWh
Heat sales 3.3 TWh
Electricity customers 1.3 million
Distribution customers
in Sweden 0.9 million
Distribution
Power
generation
Electricity
sales
Heat
OAO Fortum
Power generation 23.3 TWh
Heat sales 26.0 TWh
Russia
Poland Power generation 0.7 TWh
Heat sales 3.4 TWh
Baltic countries Power generation 0.7 TWh
Heat sales 1.2 TWh
India Power generation 9 GWh
Key figures 2014 Sales EUR 4.1 bn
Comparable operating profit EUR 1.1 bn
Balance sheet EUR 21 bn
Personnel 8,200
Distribution expected to be divested during Q2/2015

Fortum’s reporting segments and divisions
9
Distribution
• Electricity distribution
activities
• Divestment of the business
is expected to be
concluded during H1 2015.
Russia
• Power and heat
generation and sales in
Russia
• Includes OAO Fortum
and Fortum’s slightly
over 29% holding in
TGC-1
Power and Technology
• Hydro, nuclear and
thermal power generation
• Power Solutions with
expert services
• Portfolio management and
trading
• Technology and R&D
functions
The segment incorporates
two business divisions:
• Hydro Power and
Technology
• Nuclear and Thermal
Power
Heat, Electricity Sales
and Solutions
• Combined heat and
power (CHP) production
• District heating activities
and business to business
heating solutions
• Solar business
• Electricity sales and
related customer offering
• Corporate Sustainability
10
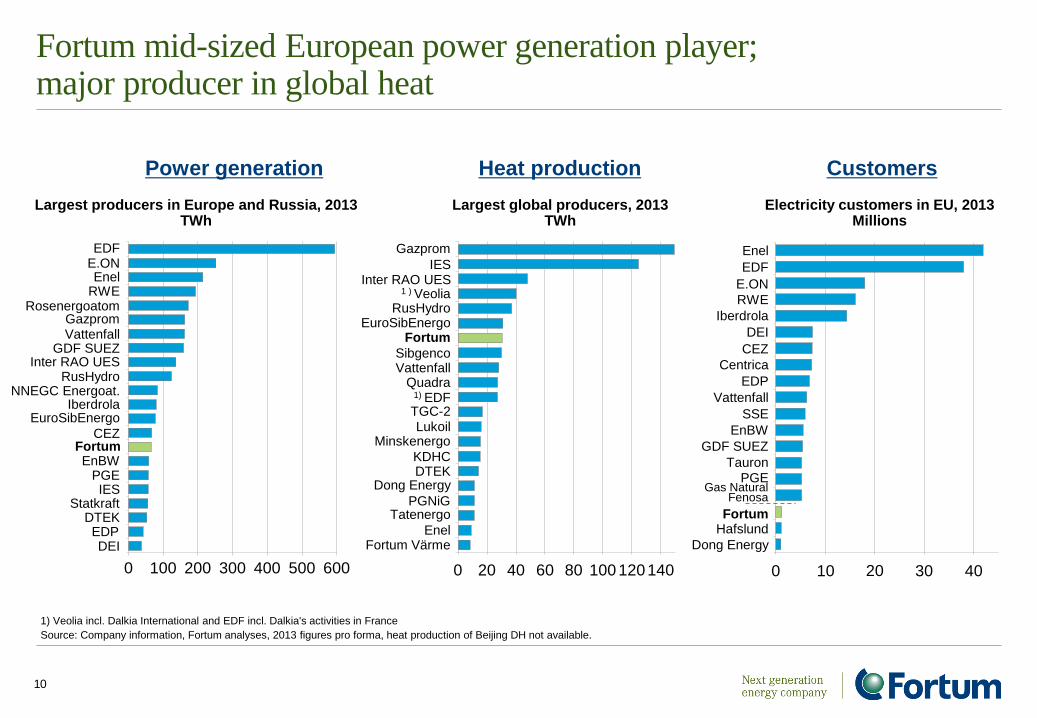
Fortum mid-sized European power generation player; major producer in global heat
1) Veolia incl. Dalkia International and EDF incl. Dalkia's activities in France
Source: Company information, Fortum analyses, 2013 figures pro forma, heat production of Beijing DH not available.
Largest global producers, 2013 TWh
Largest producers in Europe and Russia, 2013 TWh
Power generation Heat production
Electricity customers in EU, 2013 Millions
Customers
Gazprom
DEI
EuroSibEnergo Iberdrola
Fortum EnBW
Vattenfall
CEZ
RWE
IES
DTEK
PGE
Rosenergoatom
NNEGC Energoat.
Enel E.ON EDF
GDF SUEZ
Statkraft
Inter RAO UES RusHydro
EDP
0 100 200 300 400 500 600
GDF SUEZ
DEI
CEZ
Enel
Centrica
EDP
Iberdrola
SSE
EnBW
Fortum
EDF
E.ON
RWE
Gas Natural Fenosa
PGE Tauron
Hafslund
Dong Energy
0 20 40 10 30
Vattenfall
0 20 40 60 80 100 120 140
KDHC
Quadra
Tatenergo
Minskenergo
DTEK
EuroSibEnergo
TGC-2
Fortum
Dong Energy
Enel
Lukoil
Sibgenco
IES
Vattenfall
PGNiG
Inter RAO UES
1) EDF
RusHydro
1 ) Veolia
Gazprom
Fortum Värme
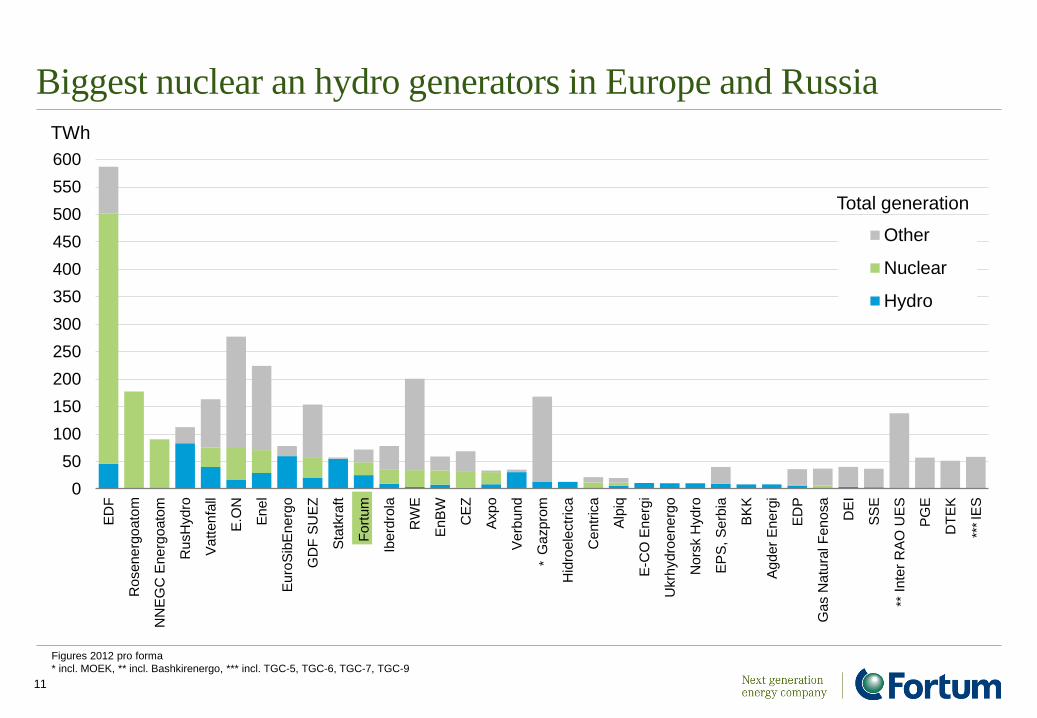
Biggest nuclear an hydro generators in Europe and Russia
11
Figures 2012 pro forma
* incl. MOEK, ** incl. Bashkirenergo, *** incl. TGC-5, TGC-6, TGC-7, TGC-9
TWh
Total generation
0
50
100
150
200
250
300
350
400
450
500
550
600
ED
F
Ro
sen
erg
oa
tom
NN
EG
C E
nerg
oato
m
Ru
sH
ydro
Vatt
enfa
ll
E.O
N
Enel
Euro
Sib
Energ
o
GD
F S
UE
Z
Sta
tkra
ft
Fo
rtum
Iberd
rola
RW
E
EnB
W
CE
Z
Axpo
Verb
und
Gazpro
m
Hid
roele
ctr
ica
Centr
ica
Alp
iq
E-C
O E
nerg
i
Ukrh
ydro
energ
o
Nors
k H
ydro
EP
S, S
erb
ia
BK
K
Agder
Energ
i
ED
P
Ga
s N
atu
ral F
en
osa
DE
I
SS
E
Inte
r R
AO
UE
S
PG
E
DT
EK
IES
Other
Nuclear
Hydro
*
***
**
Fortum a forerunner in sustainability
• Nordic Climate Disclosure Leadership Index (CDLI)
• STOXX® Global ESG Leaders indices
• oekom
• OMX GES Sustainability Finland Index
• ECPI® Indices
12

0
200
400
600
800
1 000
1 200
DE
I
RW
E
Dra
x
SS
E
CE
Z
E.O
N
Vatt
en
fall
ED
P
Enel
Edip
ow
er
EnB
W
Gas N
atu
ral F
enosa
GD
F S
UE
Z
Do
ng
En
erg
y
Fo
rtu
m to
tal
Iberd
rola
PV
O
ED
F
Verb
und
Fort
um
EU
Sta
tkra
ft
64
g CO2/kWh electricity, 2013
2014
64% of Fortum's total power generation CO2-free
94% of Fortum’s power generation in the EU CO2-free
Close to 100% of the ongoing investment programme
in the EU is CO2-free.
Average 328 g/kWh
200
Fortum's carbon exposure among the lowest in Europe
13
Note: : Fortum’s specific emissions of the power generation in 2014 in the EU were 39 g/kWh and in total 177 g/kWh.
Only European generation except “Fortum total“ which includes Russia.
Source:
PWC & Enerpresse, December 2014
Climate Change and Electricity, Fortum
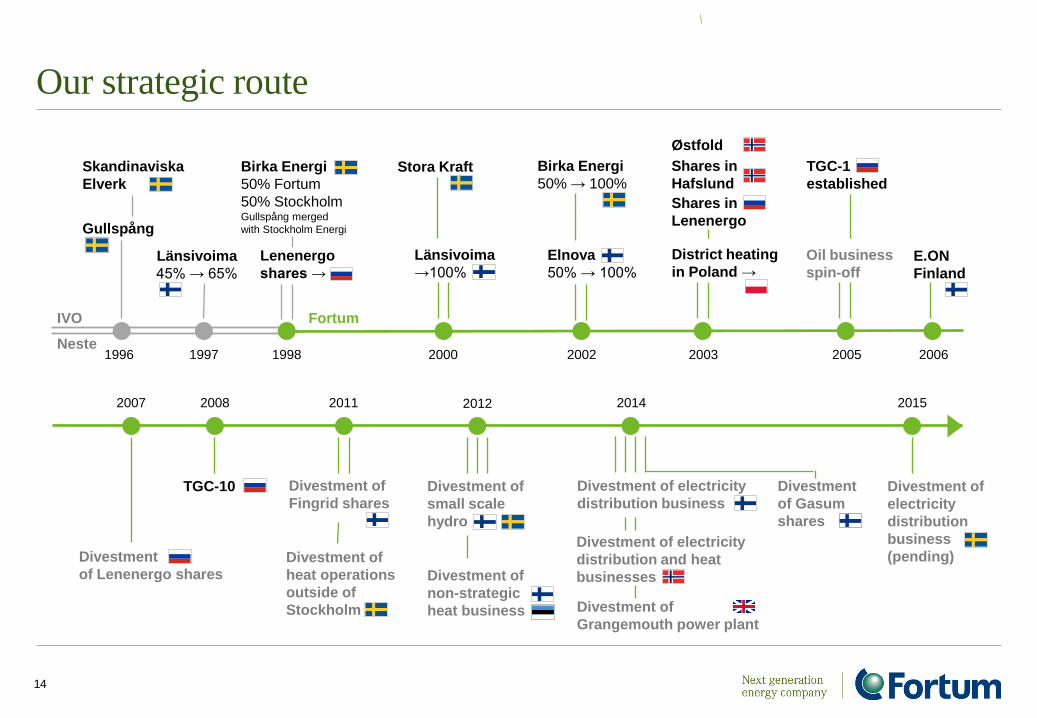
Our strategic route
14
Birka Energi
50% → 100%
Gullspång
Neste
Divestment of
non-strategic
heat business
2007
Skandinaviska
Elverk
Länsivoima
45% → 65%
Birka Energi
50% Fortum
50% Stockholm Gullspång merged
with Stockholm Energi
TGC-10 Divestment of
Fingrid shares
Divestment of
heat operations
outside of
Stockholm
Divestment
of Lenenergo shares
1996
IVO Fortum
Divestment of
small scale
hydro
2012 2008 2015
1997
Lenenergo
shares →
Stora Kraft
Länsivoima
→100%
2000
Elnova
50% → 100%
Østfold
Shares in
Lenenergo
Shares in
Hafslund
District heating
in Poland →
2003
Oil business
spin-off
TGC-1
established
2005
2011
1998 2002
Divestment of electricity
distribution and heat
businesses
Divestment of electricity
distribution business
Divestment of
Grangemouth power plant
Divestment
of Gasum
shares
2014
2006
E.ON
Finland
Divestment of
electricity
distribution
business
(pending)
15
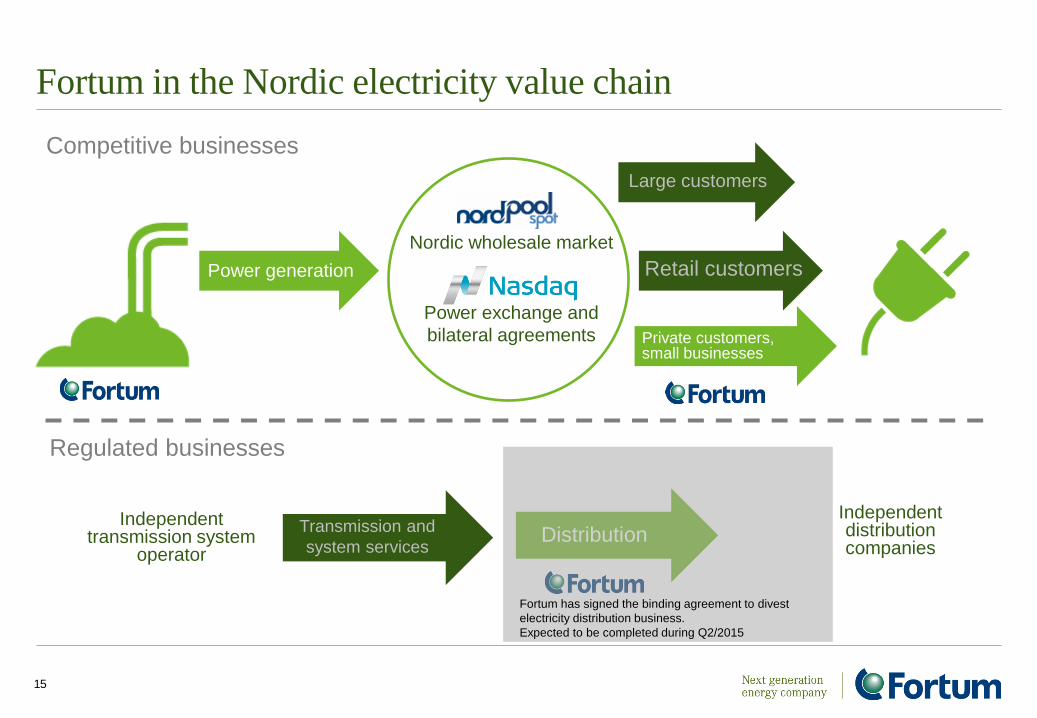
Fortum in the Nordic electricity value chain
Competitive businesses
Regulated businesses
Power generation
Nordic wholesale market
Power exchange and
bilateral agreements
Large customers
Retail customers
Private customers, small businesses
Independent transmission system
operator
Independent distribution companies
Distribution Transmission and
system services
Fortum has signed the binding agreement to divest
electricity distribution business.
Expected to be completed during Q2/2015
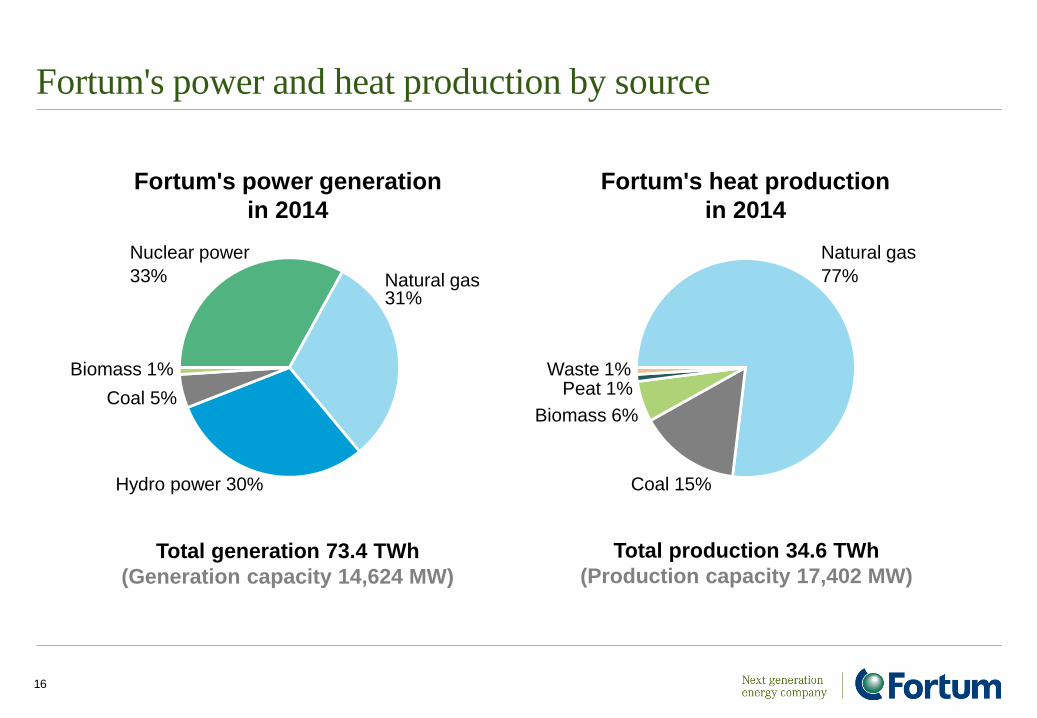
Fortum's power and heat production by source
16
Natural gas 31%
Nuclear power
33%
Coal 5%
Biomass 1%
Total generation 73.4 TWh
(Generation capacity 14,624 MW)
Hydro power 30%
Fortum's power generation
in 2014
Total production 34.6 TWh
(Production capacity 17,402 MW)
Fortum's heat production
in 2014
Peat 1% Waste 1%
Biomass 6%
Natural gas
77%
Coal 15%
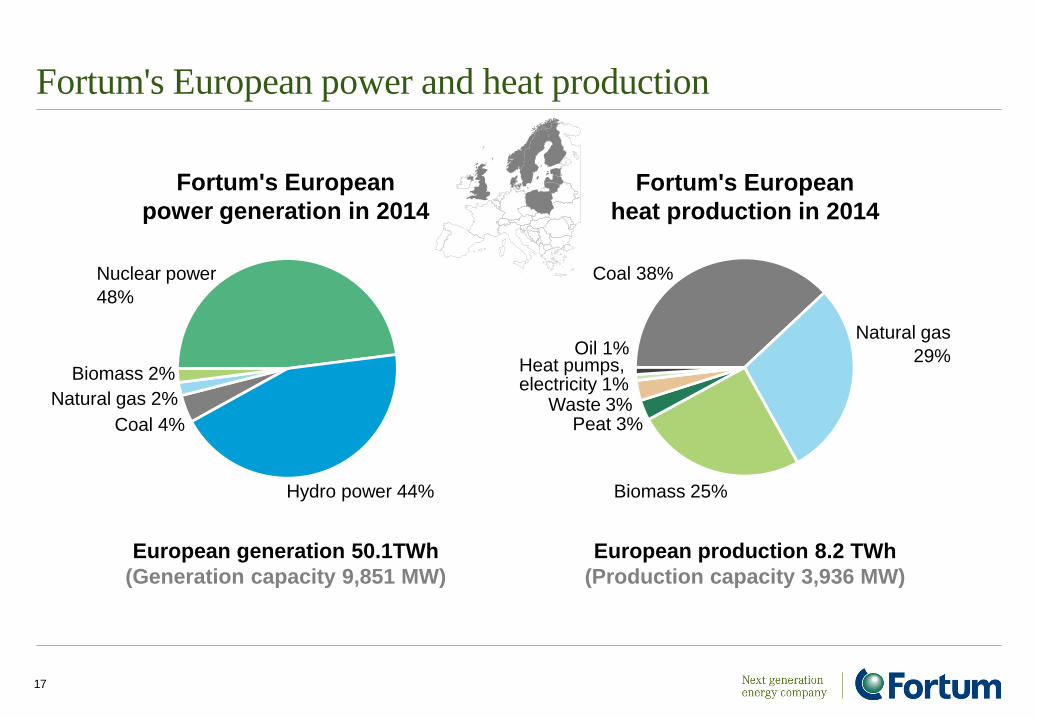
Nuclear power
48%
Coal 4%
Hydro power 44%
Natural gas 2%
European generation 50.1TWh
(Generation capacity 9,851 MW)
Fortum's European
power generation in 2014
Biomass 2%
Natural gas
29%
Fortum's European
heat production in 2014
Peat 3%
Oil 1%
Waste 3%
Biomass 25%
Heat pumps, electricity 1%
Coal 38%
European production 8.2 TWh
(Production capacity 3,936 MW)
Fortum's European power and heat production
17
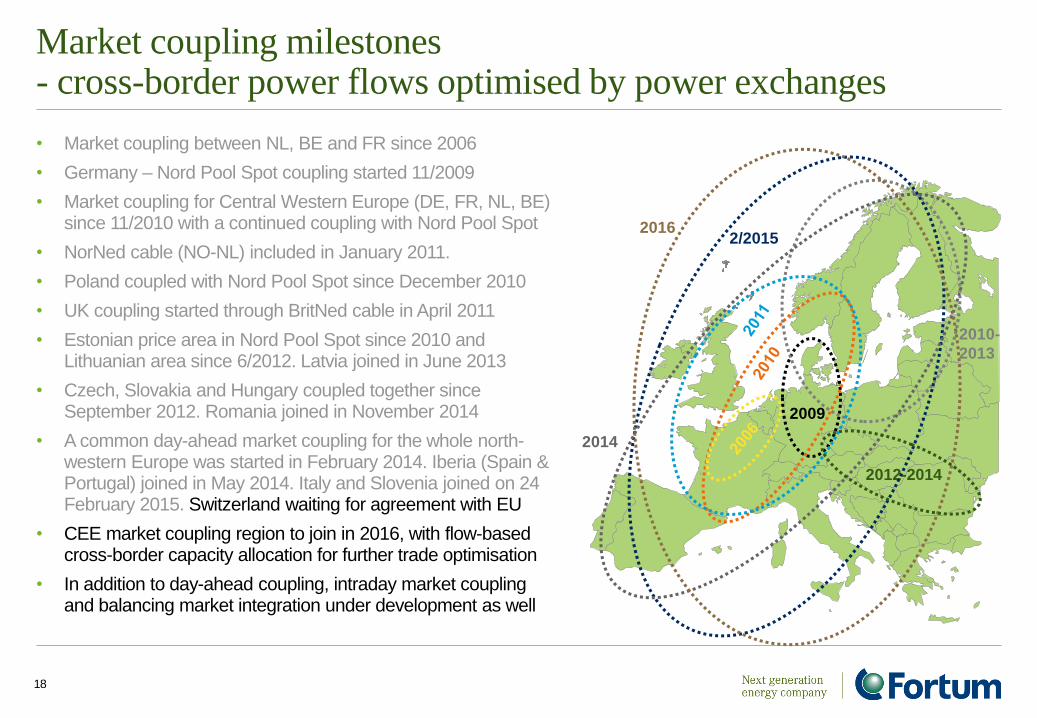
Market coupling milestones - cross-border power flows optimised by power exchanges
• Market coupling between NL, BE and FR since 2006
• Germany – Nord Pool Spot coupling started 11/2009
• Market coupling for Central Western Europe (DE, FR, NL, BE) since 11/2010 with a continued coupling with Nord Pool Spot
• NorNed cable (NO-NL) included in January 2011.
• Poland coupled with Nord Pool Spot since December 2010
• UK coupling started through BritNed cable in April 2011
• Estonian price area in Nord Pool Spot since 2010 and Lithuanian area since 6/2012. Latvia joined in June 2013
• Czech, Slovakia and Hungary coupled together since September 2012. Romania joined in November 2014
• A common day-ahead market coupling for the whole north-western Europe was started in February 2014. Iberia (Spain & Portugal) joined in May 2014. Italy and Slovenia joined on 24 February 2015. Switzerland waiting for agreement with EU
• CEE market coupling region to join in 2016, with flow-based cross-border capacity allocation for further trade optimisation
• In addition to day-ahead coupling, intraday market coupling and balancing market integration under development as well
18
2009
2/2015
2012-2014
2010-
2013
2016
2014
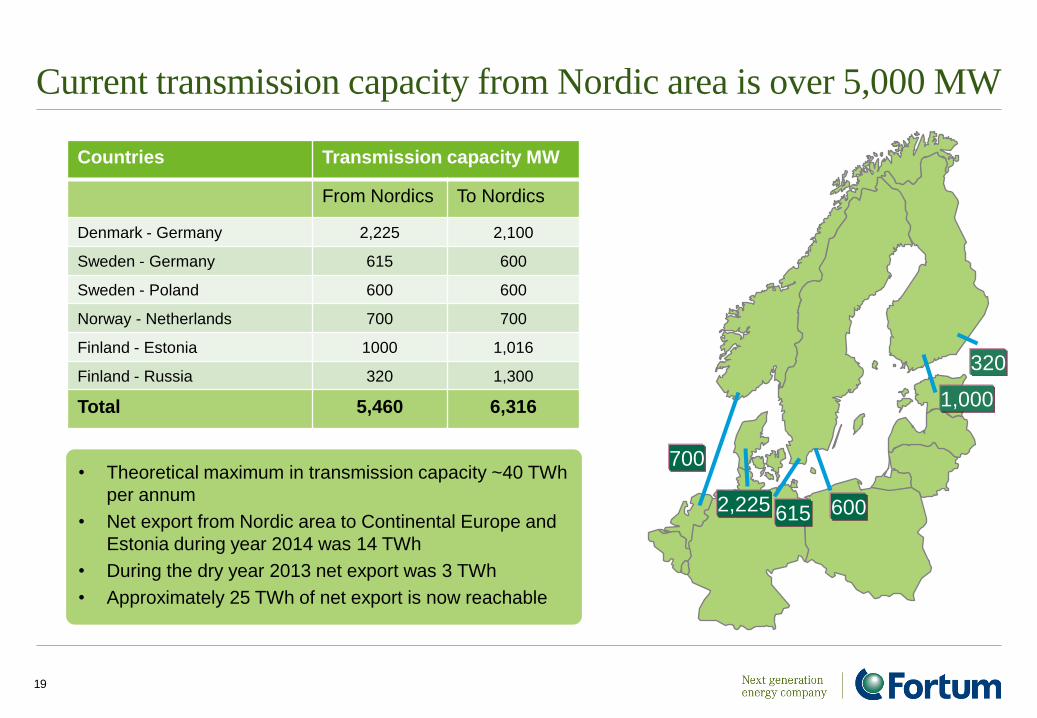
Current transmission capacity from Nordic area is over 5,000 MW
19
• Theoretical maximum in transmission capacity ~40 TWh
per annum
• Net export from Nordic area to Continental Europe and
Estonia during year 2014 was 14 TWh
• During the dry year 2013 net export was 3 TWh
• Approximately 25 TWh of net export is now reachable
Countries Transmission capacity MW
From Nordics To Nordics
Denmark - Germany 2,225 2,100
Sweden - Germany 615 600
Sweden - Poland 600 600
Norway - Netherlands 700 700
Finland - Estonia 1000 1,016
Finland - Russia 320 1,300
Total 5,460 6,316
700
2,225 615 600
1,000
320
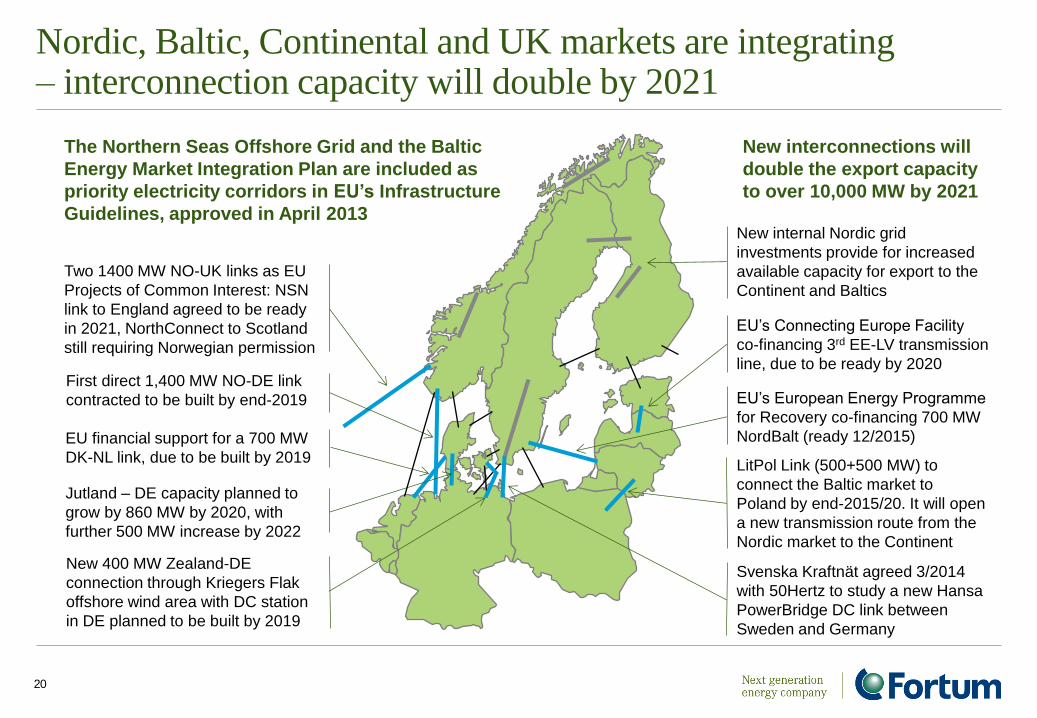
Nordic, Baltic, Continental and UK markets are integrating – interconnection capacity will double by 2021
20
Two 1400 MW NO-UK links as EU
Projects of Common Interest: NSN
link to England agreed to be ready
in 2021, NorthConnect to Scotland
still requiring Norwegian permission
First direct 1,400 MW NO-DE link
contracted to be built by end-2019
EU financial support for a 700 MW
DK-NL link, due to be built by 2019
Jutland – DE capacity planned to
grow by 860 MW by 2020, with
further 500 MW increase by 2022
Svenska Kraftnät agreed 3/2014
with 50Hertz to study a new Hansa
PowerBridge DC link between
Sweden and Germany
The Northern Seas Offshore Grid and the Baltic
Energy Market Integration Plan are included as
priority electricity corridors in EU’s Infrastructure
Guidelines, approved in April 2013
New interconnections will
double the export capacity
to over 10,000 MW by 2021
LitPol Link (500+500 MW) to
connect the Baltic market to
Poland by end-2015/20. It will open
a new transmission route from the
Nordic market to the Continent
EU’s European Energy Programme
for Recovery co-financing 700 MW
NordBalt (ready 12/2015)
New internal Nordic grid
investments provide for increased
available capacity for export to the
Continent and Baltics
EU’s Connecting Europe Facility
co-financing 3rd EE-LV transmission
line, due to be ready by 2020
New 400 MW Zealand-DE
connection through Kriegers Flak
offshore wind area with DC station
in DE planned to be built by 2019
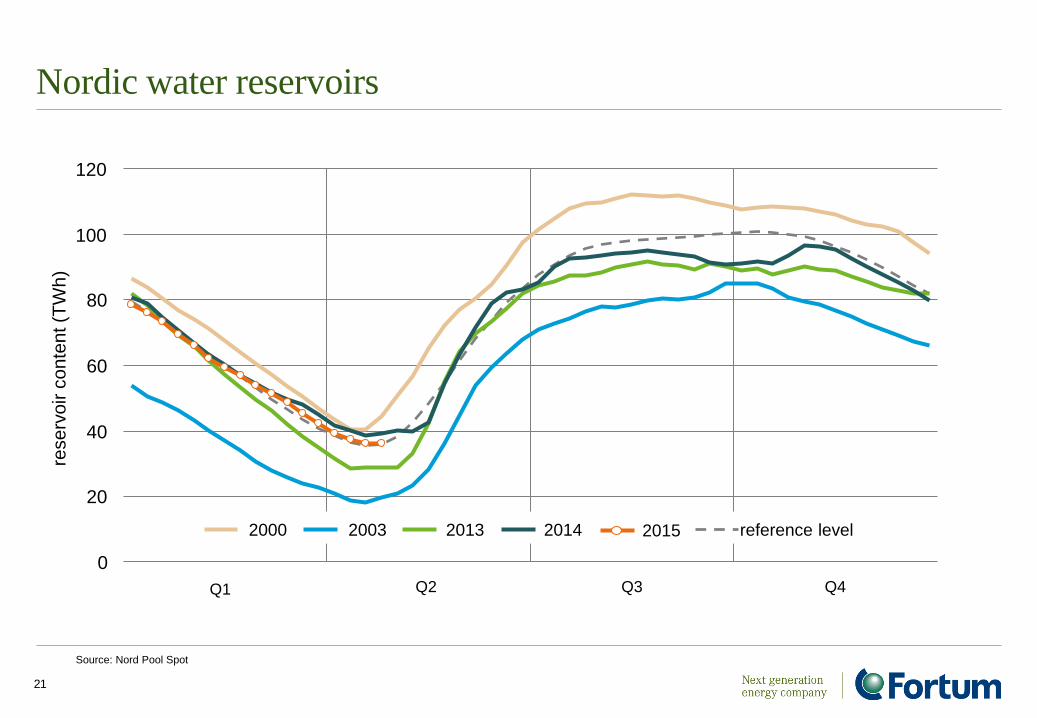
Nordic water reservoirs
21
Source: Nord Pool Spot
Q1 Q2 Q3 Q4
20
40
60
80
100
120
rese
rvo
ir c
on
ten
t (T
Wh
)
0
2000 2003 2014 2013 reference level 2015
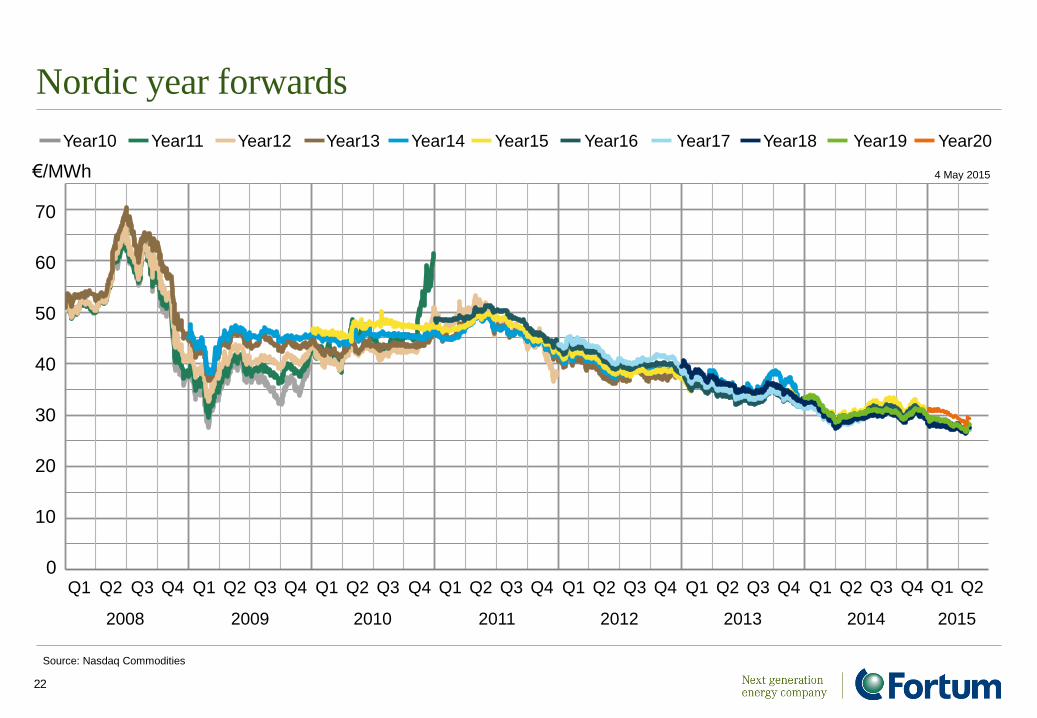
Nordic year forwards
22
Source: Nasdaq Commodities
0
10
20
30
40
50
60
70
€/MWh 4 May 2015
Year15 Year17 Year19 Year10 Year11 Year12 Year13 Year14 Year16 Year18 Year20
2014
Q1
2008
Q2 Q3 Q4 Q1
2009
Q2 Q3 Q4 Q1
2010
Q2 Q3 Q4 Q1
2011
Q2 Q3 Q4 Q1
2012
Q2 Q3 Q4 Q1
2013
Q2 Q3 Q4 Q1 Q2 Q3 Q4
2015
Q1 Q2
0
10
20
30
40
50
60
70
80
90
100
110
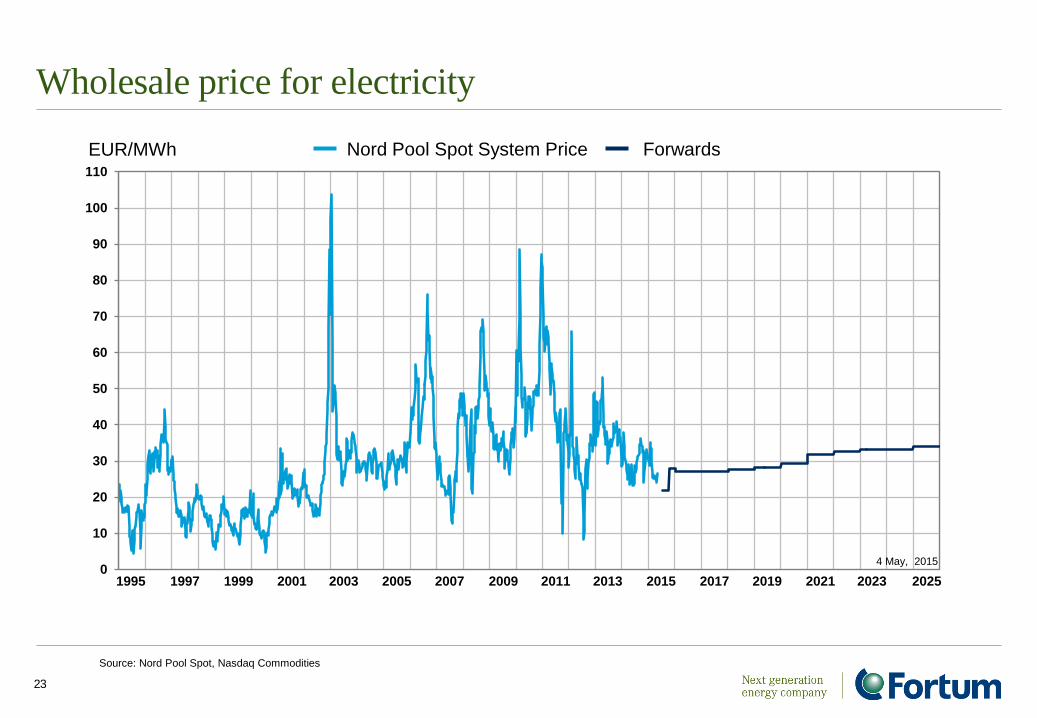
Wholesale price for electricity
23
Source: Nord Pool Spot, Nasdaq Commodities
EUR/MWh Nord Pool Spot System Price Forwards
4 May, 2015
1995 1997 1999 2001 2003 2005 2007 2009 2011 2013 2015 2017 2019 2021 2023 2025
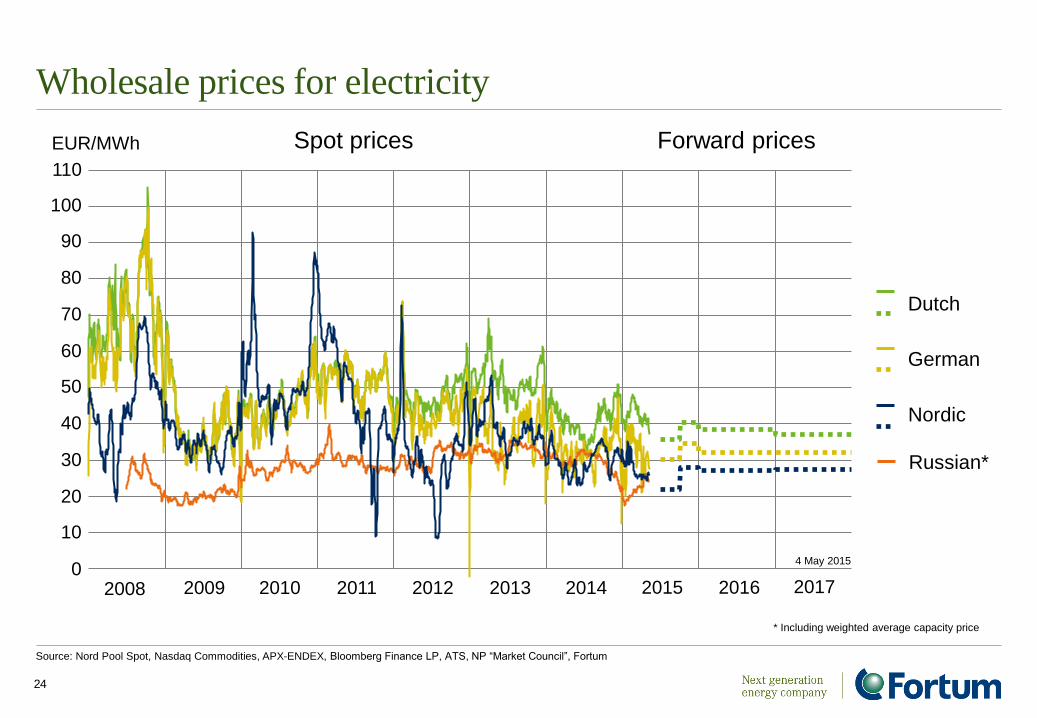
Wholesale prices for electricity
24
Source: Nord Pool Spot, Nasdaq Commodities, APX-ENDEX, Bloomberg Finance LP, ATS, NP “Market Council”, Fortum
* Including weighted average capacity price
Dutch
German
Nordic
Russian*
Spot prices Forward prices EUR/MWh
10
20
30
40
50
60
70
80
90
100
110
0 2008 2009 2010 2011 2012 2013 2014 2015 2016 2017
4 May 2015
0
30
60
90
120
150
US
D /
bb
l
Crude oil price (ICE Brent)
2007 2008 20112009 2010 20132012 2014 2015 20160
7
14
21
28
35
EU
R /
tC
O2
CO2 price (ICE ECX EUA)
2007 2008 20112009 2010 20132012 2014 2015 2016
0
50
100
150
200
250
US
D /
t
Coal price (ICE Rotterdam)
2007 2008 20112009 2010 20132012 2014 2015 20160
20
40
60
80
100
GB
p /
th
erm
Gas price (ICE NBP)
2007 2008 20112009 2010 20132012 2014 2015 2016
25
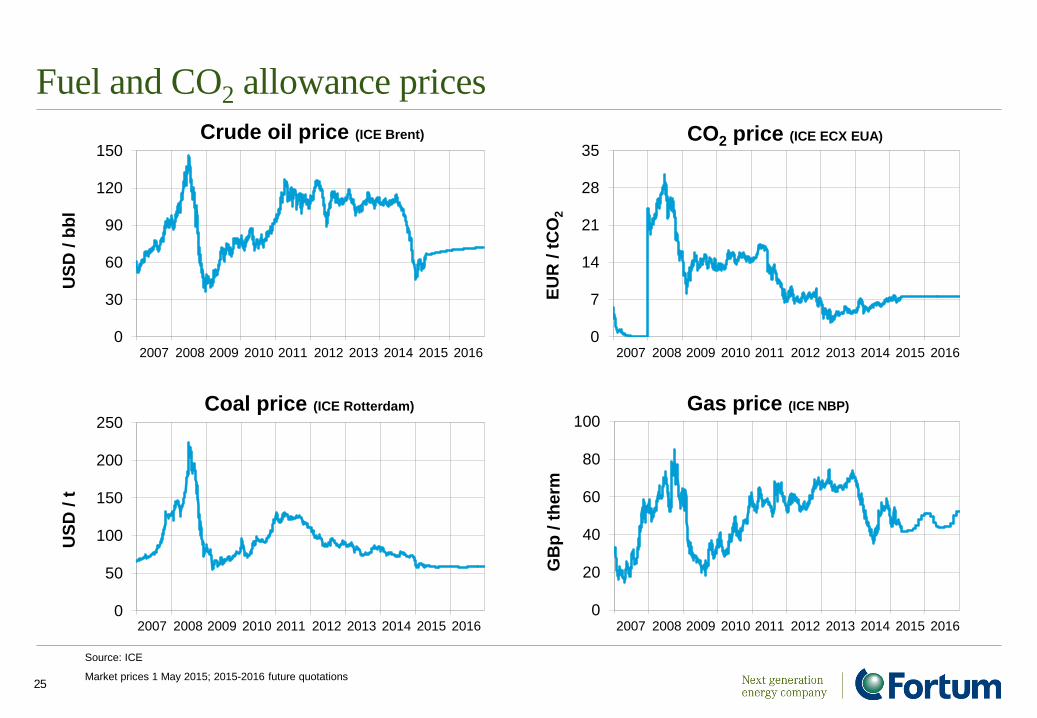
Source: ICE
Market prices 1 May 2015; 2015-2016 future quotations
Fuel and CO2 allowance prices
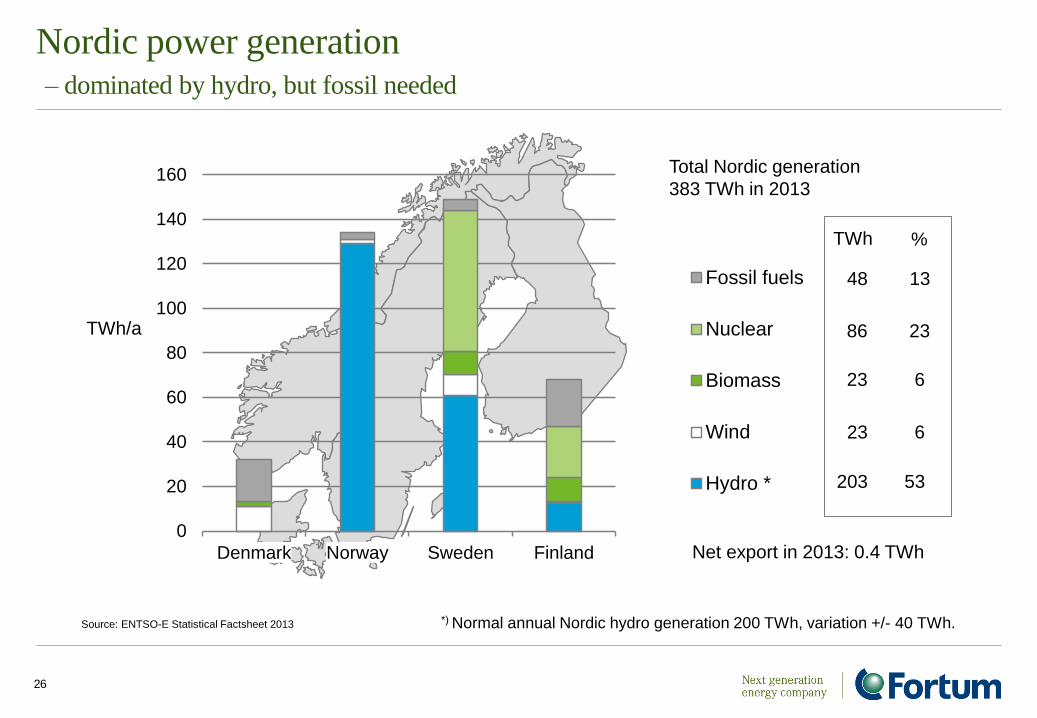
Nordic power generation – dominated by hydro, but fossil needed
26
Source: ENTSO-E Statistical Factsheet 2013 *) Normal annual Nordic hydro generation 200 TWh, variation +/- 40 TWh.
0
20
40
60
80
100
120
140
160
Denmark Norway Sweden Finland
Fossil fuels
Nuclear
Biomass
Wind
Hydro *
TWh/a
Total Nordic generation
383 TWh in 2013
Net export in 2013: 0.4 TWh
23
86
TWh %
48
203
23
6
23
13
53
6
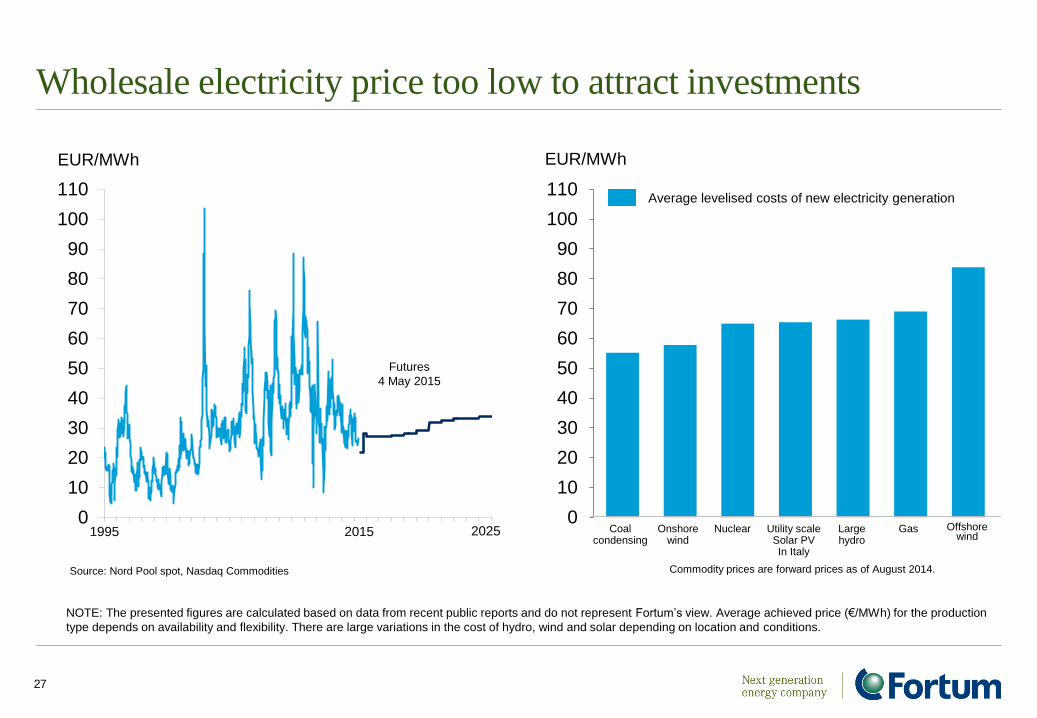
Wholesale electricity price too low to attract investments
27
NOTE: The presented figures are calculated based on data from recent public reports and do not represent Fortum’s view. Average achieved price (€/MWh) for the production
type depends on availability and flexibility. There are large variations in the cost of hydro, wind and solar depending on location and conditions.
0
10
20
30
40
50
60
70
80
90
100
110
Source: Nord Pool spot, Nasdaq Commodities
EUR/MWh
Futures
4 May 2015
1995 2015 2025 0
10
20
30
40
50
60
70
80
90
100
110
Onshore wind
Nuclear Utility scale Solar PV In Italy
Large hydro
Offshore wind
EUR/MWh
Average levelised costs of new electricity generation
Coal condensing
Gas
Commodity prices are forward prices as of August 2014.
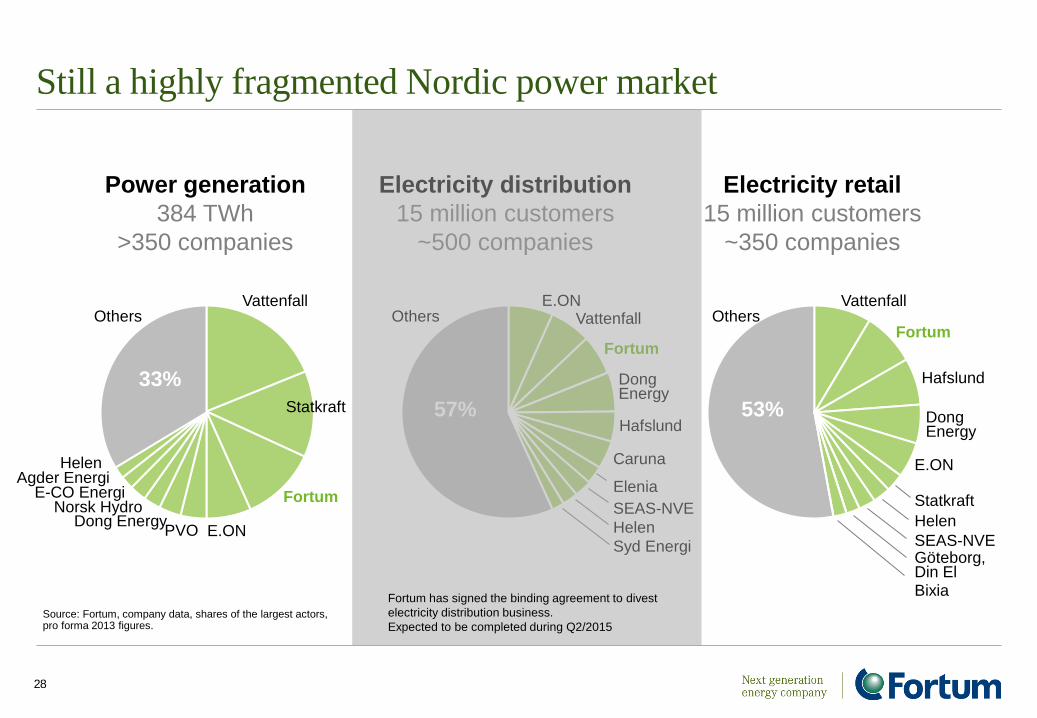
Still a highly fragmented Nordic power market
28
Power generation
384 TWh
>350 companies
Electricity distribution
15 million customers
~500 companies
Electricity retail
15 million customers
~350 companies
Vattenfall
33%
Dong Energy
Others
Fortum
E.ON PVO
E-CO Energi Agder Energi
Norsk Hydro
Helen
Statkraft
Others
53%
Vattenfall
Fortum
Dong Energy
Hafslund
E.ON
Göteborg, Din El
SEAS-NVE
Helen
Statkraft
Bixia
Caruna
Vattenfall
Fortum
Others E.ON
57%
SEAS-NVE
Hafslund
Helen
Syd Energi
Dong Energy
Elenia
Source: Fortum, company data, shares of the largest actors, pro forma 2013 figures.
Fortum has signed the binding agreement to divest
electricity distribution business.
Expected to be completed during Q2/2015
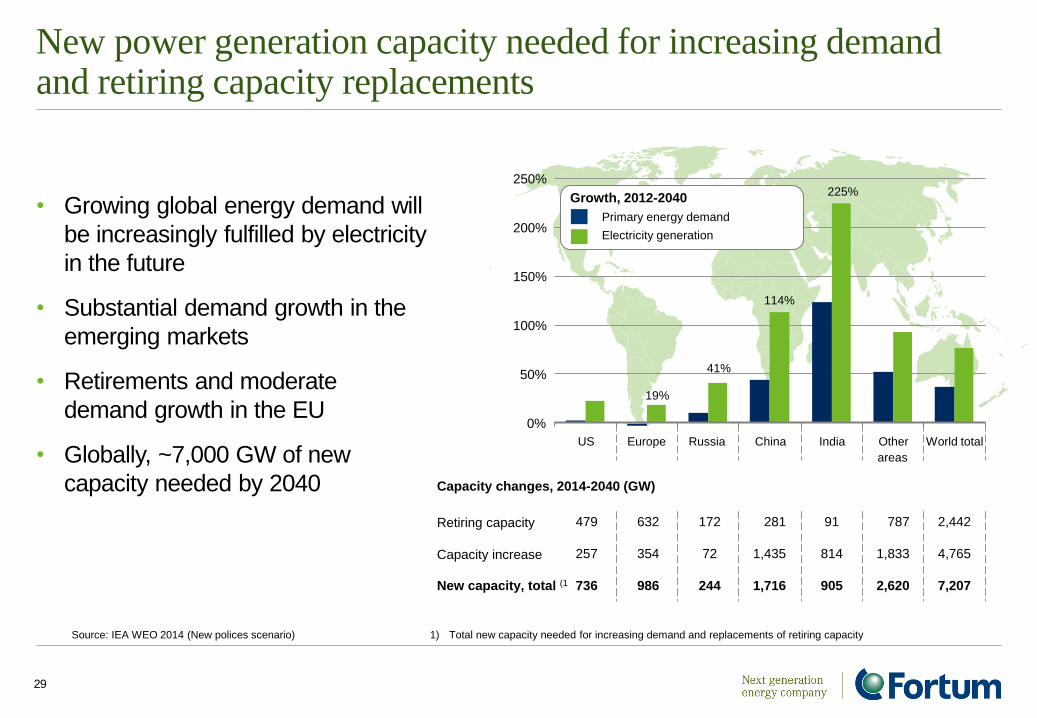
New power generation capacity needed for increasing demand and retiring capacity replacements
29
• Growing global energy demand will
be increasingly fulfilled by electricity
in the future
• Substantial demand growth in the
emerging markets
• Retirements and moderate
demand growth in the EU
• Globally, ~7,000 GW of new
capacity needed by 2040
Source: IEA WEO 2014 (New polices scenario) 1) Total new capacity needed for increasing demand and replacements of retiring capacity
479
257
736
632
354
986
172
72
244
281
1,435
1,716
91
814
905
787
1,833
2,620
2,442
4,765
7,207 New capacity, total (1
Capacity changes, 2014-2040 (GW)
Retiring capacity
Capacity increase
19%
41%
114%
225%
0%
50%
100%
150%
200%
250%
US Europe Russia China India Other
areas
World total
Growth, 2012-2040
Primary energy demand
Electricity generation

Overview of Fortum’s nuclear fleet
30
LOVIISA OLKILUOTO OSKARSHAMN FORSMARK
Commercial operation started
Unit 1: 1977
Unit 2: 1981
Unit 1: 1978
Unit 2: 1980
Unit 3: (Under construction)
Unit 1: 1972
Unit 2: 1974
Unit 3: 1985
Unit 1: 1980
Unit 2: 1981
Unit 3: 1985
Generation Capacity
Fortum’s share
Unit 1: 496 MW
Unit 2: 496 MW
Total: 992 MW
Unit 1: 880 MW
Unit 2: 880 MW
(Unit 3: 1,600 MW)
Total: 1,760 MW (3,360)
27% 468 MW
Unit 1: 473 MW
Unit 2: 638 MW
Unit 3: 1,400 MW
Total: 2,511 MW
43% 1,089 MW
Unit 1: 984 MW
Unit 2: 1,120 MW
Unit 3: 1,170 MW
Total: 3,274 MW
22% 720 MW
Yearly production
Fortum’s share of production
8 TWh
8 TWh
14 TWh
4 TWh
17 TWh
7 TWh
25 TWh
5.5 TWh
Share of Fortums Nordic production
18% 9% 16% 13%
Majority owner
Fortum’s share
Fortum
Pohjolan Voima
26.6%
E.ON
43.4%
Vattenfall
22.2%
Operated by Fortum Teollisuuden Voima (TVO)
OKG Aktiebolag Forsmarks Kraftgrupp
Responsibilities Loviisa: Fortum is the owner, licensee and operator with all the responsibilities specified in the Nuclear Energy Act, Nuclear Liability Act, and other relevant nuclear legislation
Other units: Fortum is solely an owner with none of the responsibilities assigned to the licensee in the nuclear legislation. Other responsibilities are specified in the
Companies Act and the Articles of Association and are mostly financial.
Olkiluoto
Loviisa Forsmark
Oskarshamn
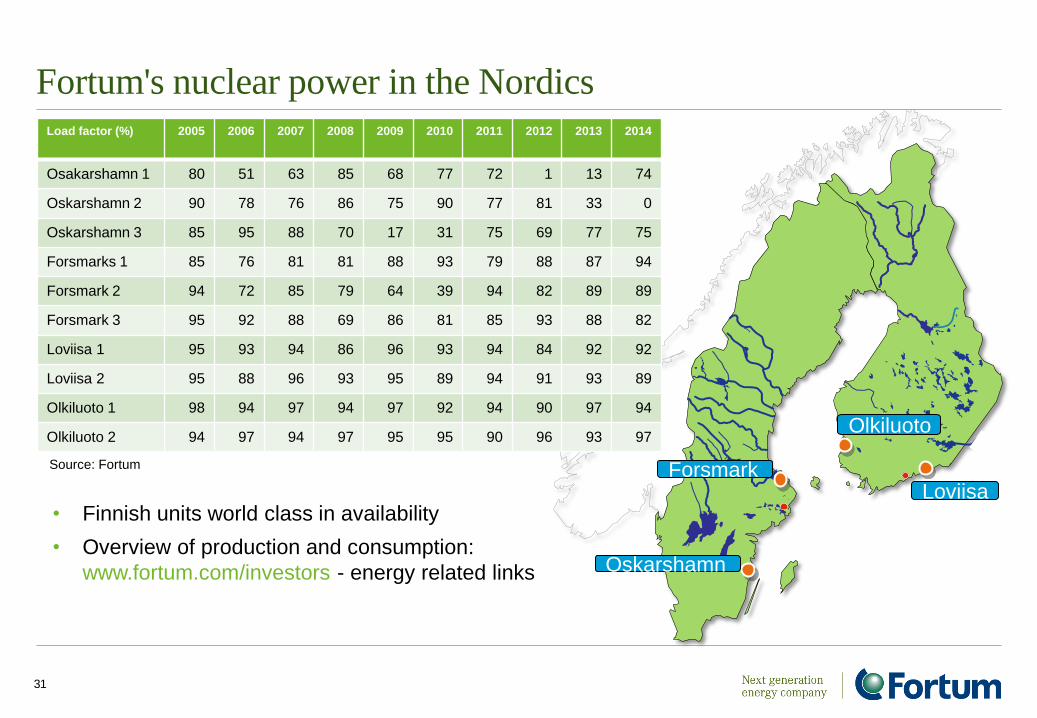
Fortum's nuclear power in the Nordics
31
• Finnish units world class in availability
• Overview of production and consumption:
www.fortum.com/investors - energy related links
Source: Fortum
Load factor (%) 2005 2006 2007 2008 2009 2010 2011 2012 2013
2014
Osakarshamn 1 80 51 63 85 68 77 72 1 13 74
Oskarshamn 2 90 78 76 86 75 90 77 81 33 0
Oskarshamn 3 85 95 88 70 17 31 75 69 77 75
Forsmarks 1 85 76 81 81 88 93 79 88 87 94
Forsmark 2 94 72 85 79 64 39 94 82 89 89
Forsmark 3 95 92 88 69 86 81 85 93 88 82
Loviisa 1 95 93 94 86 96 93 94 84 92 92
Loviisa 2 95 88 96 93 95 89 94 91 93 89
Olkiluoto 1 98 94 97 94 97 92 94 90 97 94
Olkiluoto 2 94 97 94 97 95 95 90 96 93 97
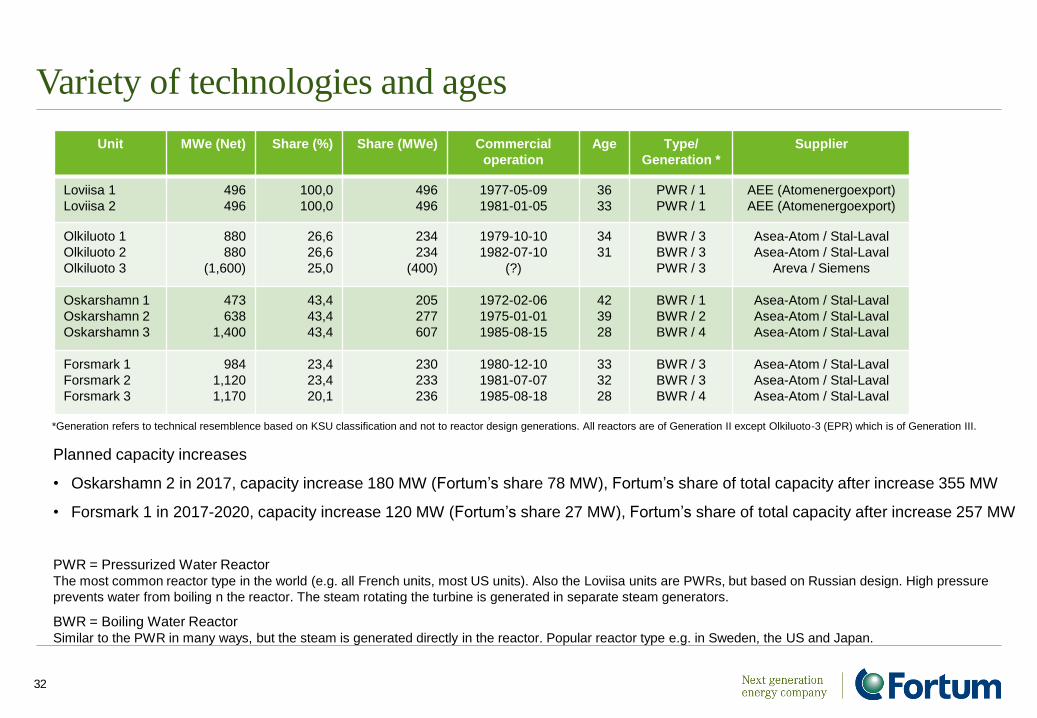
Variety of technologies and ages
32
Planned capacity increases
• Oskarshamn 2 in 2017, capacity increase 180 MW (Fortum’s share 78 MW), Fortum’s share of total capacity after increase 355 MW
• Forsmark 1 in 2017-2020, capacity increase 120 MW (Fortum’s share 27 MW), Fortum’s share of total capacity after increase 257 MW
PWR = Pressurized Water Reactor The most common reactor type in the world (e.g. all French units, most US units). Also the Loviisa units are PWRs, but based on Russian design. High pressure
prevents water from boiling n the reactor. The steam rotating the turbine is generated in separate steam generators.
BWR = Boiling Water Reactor Similar to the PWR in many ways, but the steam is generated directly in the reactor. Popular reactor type e.g. in Sweden, the US and Japan.
*Generation refers to technical resemblence based on KSU classification and not to reactor design generations. All reactors are of Generation II except Olkiluoto-3 (EPR) which is of Generation III.
Unit MWe (Net) Share (%) Share (MWe) Commercial
operation
Age Type/
Generation *
Supplier
Loviisa 1
Loviisa 2
496
496
100,0
100,0
496
496
1977-05-09
1981-01-05
36
33
PWR / 1
PWR / 1
AEE (Atomenergoexport)
AEE (Atomenergoexport)
Olkiluoto 1
Olkiluoto 2
Olkiluoto 3
880
880
(1,600)
26,6
26,6
25,0
234
234
(400)
1979-10-10
1982-07-10
(?)
34
31
BWR / 3
BWR / 3
PWR / 3
Asea-Atom / Stal-Laval
Asea-Atom / Stal-Laval
Areva / Siemens
Oskarshamn 1
Oskarshamn 2
Oskarshamn 3
473
638
1,400
43,4
43,4
43,4
205
277
607
1972-02-06
1975-01-01
1985-08-15
42
39
28
BWR / 1
BWR / 2
BWR / 4
Asea-Atom / Stal-Laval
Asea-Atom / Stal-Laval
Asea-Atom / Stal-Laval
Forsmark 1
Forsmark 2
Forsmark 3
984
1,120
1,170
23,4
23,4
20,1
230
233
236
1980-12-10
1981-07-07
1985-08-18
33
32
28
BWR / 3
BWR / 3
BWR / 4
Asea-Atom / Stal-Laval
Asea-Atom / Stal-Laval
Asea-Atom / Stal-Laval
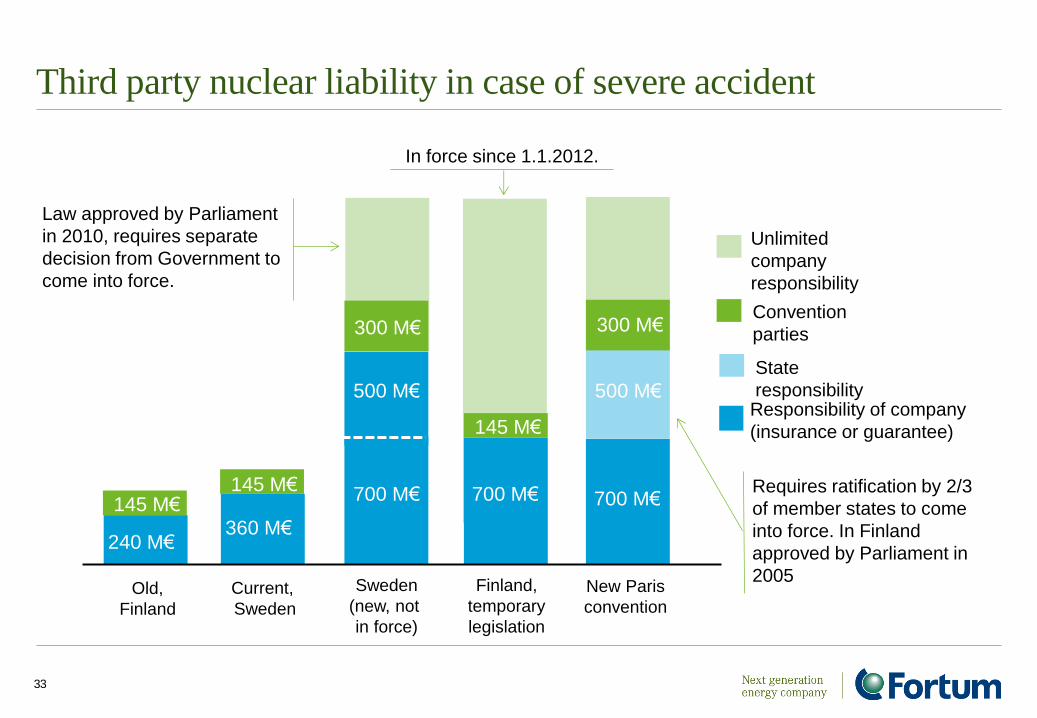
Third party nuclear liability in case of severe accident
33
Sweden
(new, not
in force)
Finland,
temporary
legislation
Current,
Sweden
700 M€
200 M€ 360 M€
500 M€ Responsibility of company
(insurance or guarantee)
Unlimited
company
responsibility
Convention
parties 300 M€
State
responsibility
300 M€
500 M€
700 M€
New Paris
convention
700 M€
145 M€
145 M€
Old,
Finland
240 M€
145 M€
In force since 1.1.2012.
Law approved by Parliament
in 2010, requires separate
decision from Government to
come into force.
Requires ratification by 2/3
of member states to come
into force. In Finland
approved by Parliament in
2005
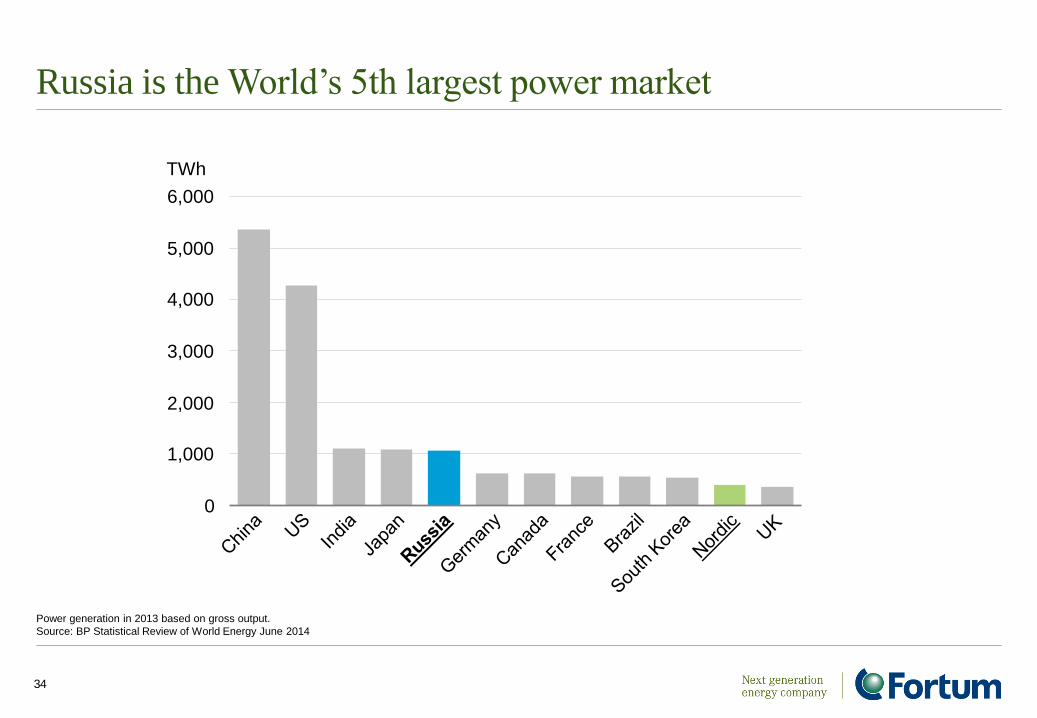
Russia is the World’s 5th largest power market
34
Power generation in 2013 based on gross output.
Source: BP Statistical Review of World Energy June 2014
0
1,000
2,000
3,000
4,000
5,000
6,000
TWh
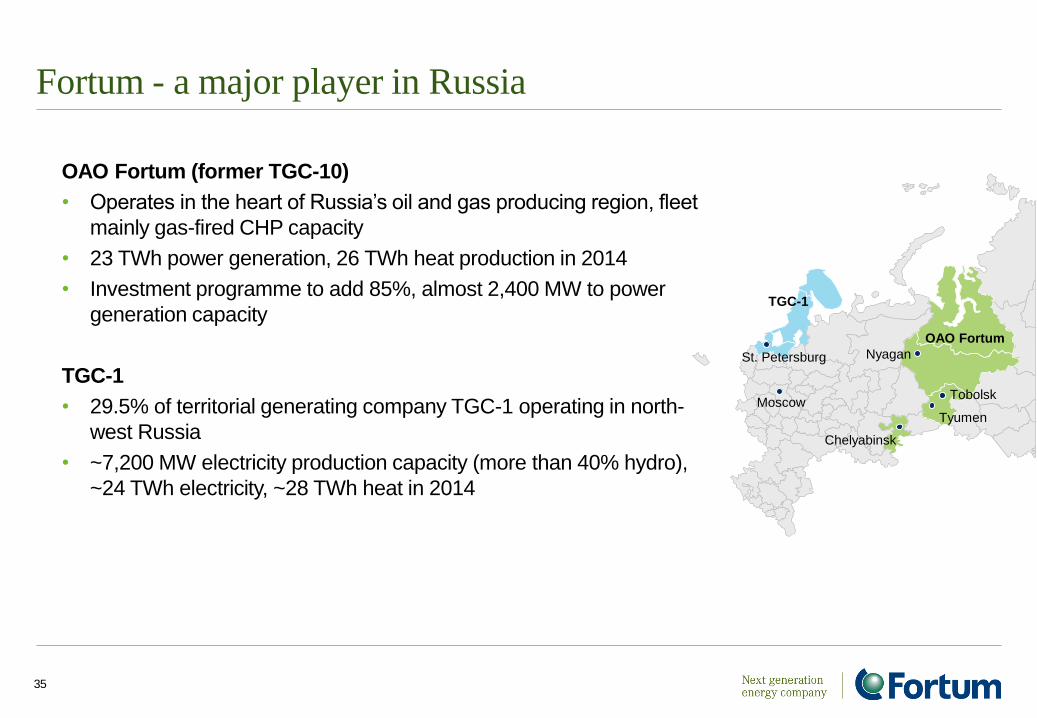
Fortum - a major player in Russia
OAO Fortum (former TGC-10)
• Operates in the heart of Russia’s oil and gas producing region, fleet
mainly gas-fired CHP capacity
• 23 TWh power generation, 26 TWh heat production in 2014
• Investment programme to add 85%, almost 2,400 MW to power
generation capacity
TGC-1
• 29.5% of territorial generating company TGC-1 operating in north-
west Russia
• ~7,200 MW electricity production capacity (more than 40% hydro),
~24 TWh electricity, ~28 TWh heat in 2014
35
OAO Fortum
Tyumen
Tobolsk
Chelyabinsk
Nyagan
TGC-1
St. Petersburg
Moscow
36
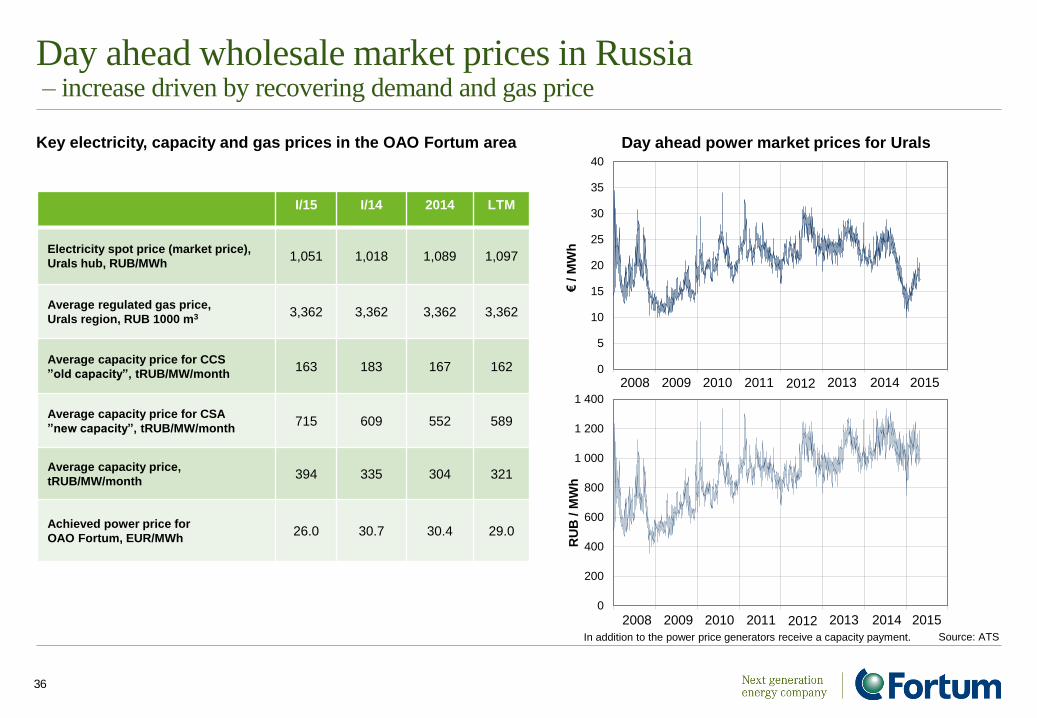
Day ahead wholesale market prices in Russia – increase driven by recovering demand and gas price
Key electricity, capacity and gas prices in the OAO Fortum area
0
200
400
600
800
1 000
1 200
1 400
RU
B / M
Wh
0
5
10
15
20
25
30
35
40
€/
MW
h
In addition to the power price generators receive a capacity payment. Source: ATS
2008 2009 2010 2011 2012 2013 2014 2015
Day ahead power market prices for Urals
2008 2009 2010 2011 2012 2013 2014 2015
I/15 I/14 2014 LTM
Electricity spot price (market price),
Urals hub, RUB/MWh 1,051 1,018 1,089 1,097
Average regulated gas price,
Urals region, RUB 1000 m3 3,362 3,362 3,362 3,362
Average capacity price for CCS
”old capacity”, tRUB/MW/month 163 183 167 162
Average capacity price for CSA
”new capacity”, tRUB/MW/month 715 609 552 589
Average capacity price,
tRUB/MW/month 394 335 304 321
Achieved power price for
OAO Fortum, EUR/MWh 26.0 30.7 30.4 29.0
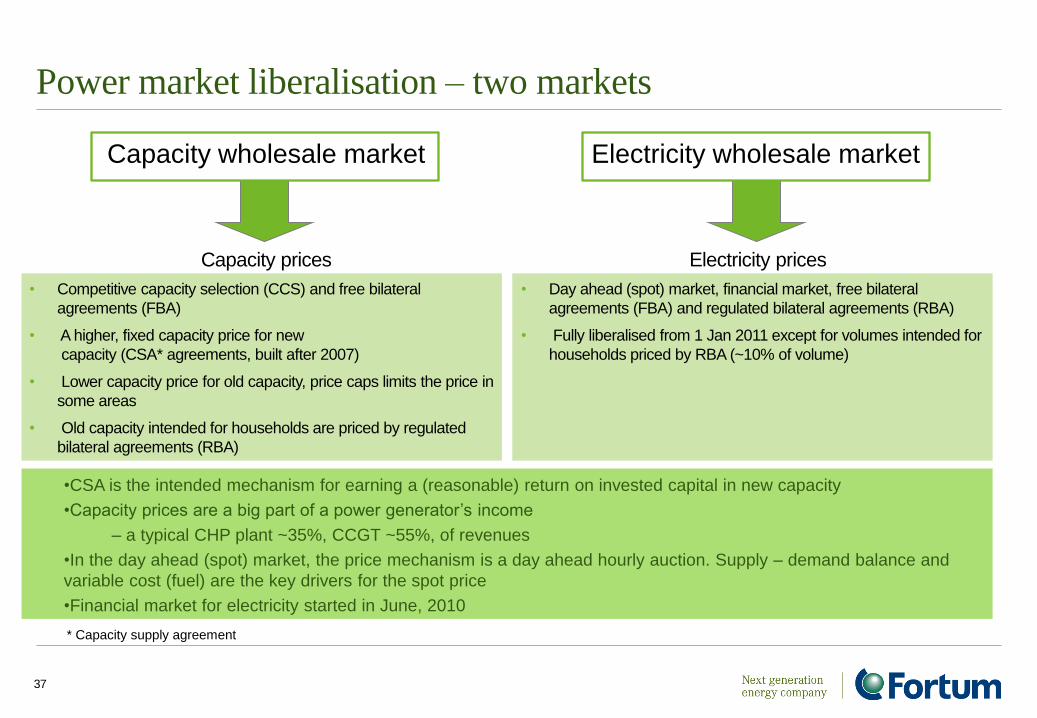
Power market liberalisation – two markets
37
Capacity wholesale market Electricity wholesale market
Capacity prices
• Competitive capacity selection (CCS) and free bilateral
agreements (FBA)
• A higher, fixed capacity price for new
capacity (CSA* agreements, built after 2007)
• Lower capacity price for old capacity, price caps limits the price in
some areas
• Old capacity intended for households are priced by regulated
bilateral agreements (RBA)
Electricity prices
• Day ahead (spot) market, financial market, free bilateral
agreements (FBA) and regulated bilateral agreements (RBA)
• Fully liberalised from 1 Jan 2011 except for volumes intended for
households priced by RBA (~10% of volume)
* Capacity supply agreement
•CSA is the intended mechanism for earning a (reasonable) return on invested capital in new capacity
•Capacity prices are a big part of a power generator’s income
– a typical CHP plant ~35%, CCGT ~55%, of revenues
•In the day ahead (spot) market, the price mechanism is a day ahead hourly auction. Supply – demand balance and
variable cost (fuel) are the key drivers for the spot price
•Financial market for electricity started in June, 2010
38
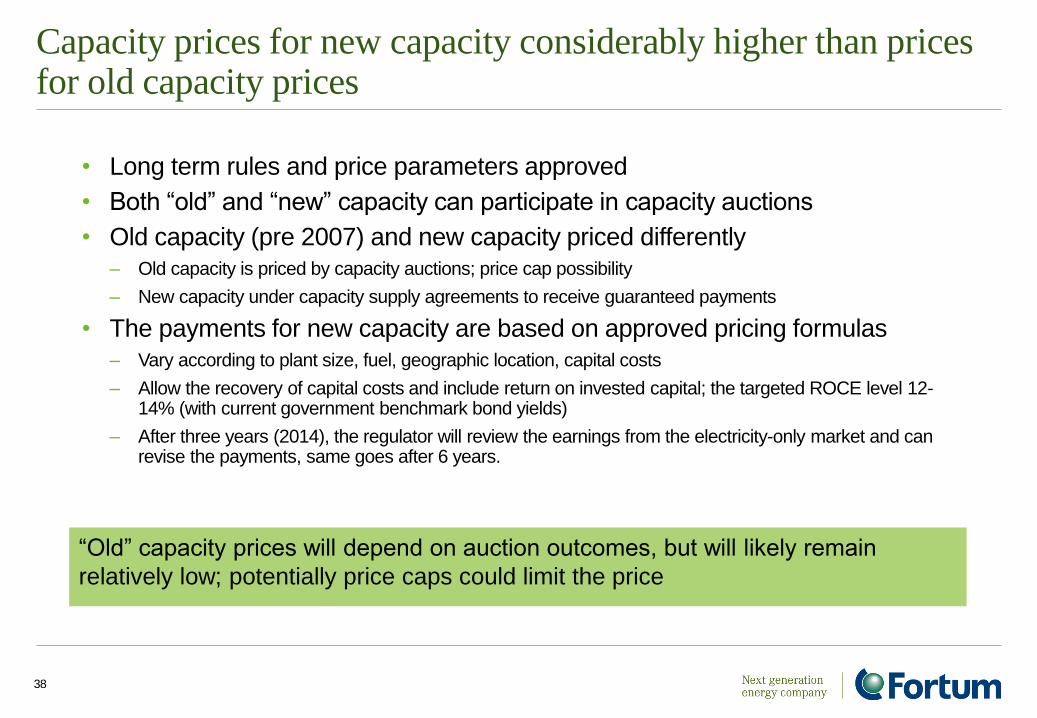
Capacity prices for new capacity considerably higher than prices for old capacity prices
• Long term rules and price parameters approved
• Both “old” and “new” capacity can participate in capacity auctions
• Old capacity (pre 2007) and new capacity priced differently – Old capacity is priced by capacity auctions; price cap possibility
– New capacity under capacity supply agreements to receive guaranteed payments
• The payments for new capacity are based on approved pricing formulas – Vary according to plant size, fuel, geographic location, capital costs
– Allow the recovery of capital costs and include return on invested capital; the targeted ROCE level 12-14% (with current government benchmark bond yields)
– After three years (2014), the regulator will review the earnings from the electricity-only market and can revise the payments, same goes after 6 years.
“Old” capacity prices will depend on auction outcomes, but will likely remain
relatively low; potentially price caps could limit the price
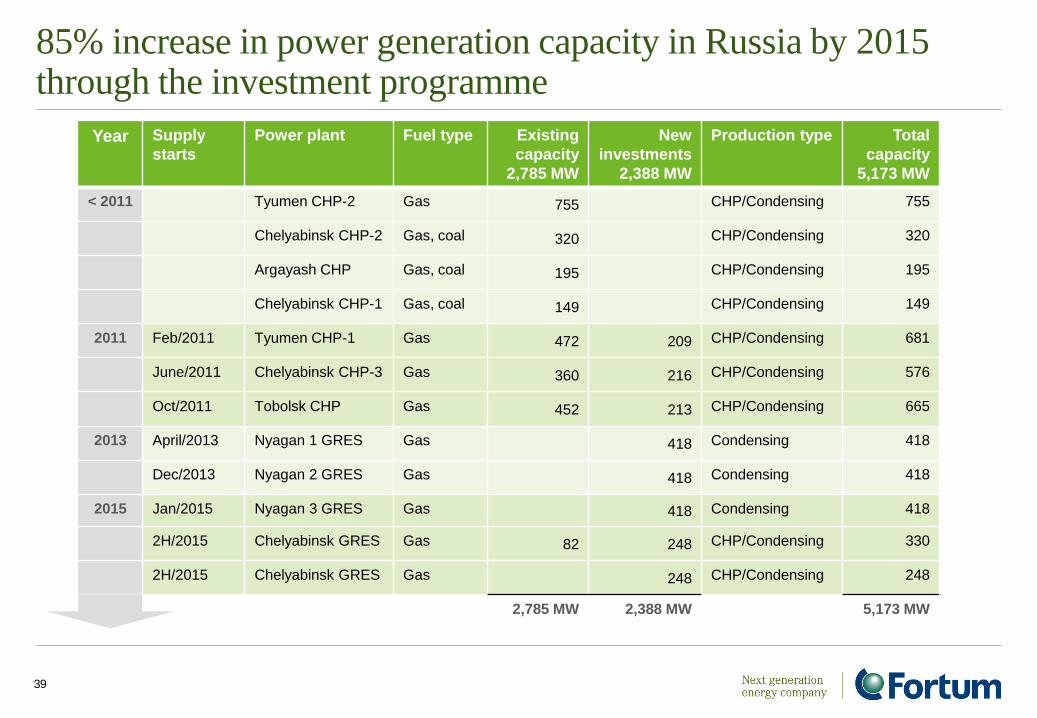
85% increase in power generation capacity in Russia by 2015 through the investment programme
39
Year Supply
starts
Power plant Fuel type Existing
capacity
2,785 MW
New
investments
2,388 MW
Production type Total
capacity
5,173 MW
< 2011 Tyumen CHP-2 Gas 755 CHP/Condensing 755
Chelyabinsk CHP-2 Gas, coal 320 CHP/Condensing 320
Argayash CHP Gas, coal 195 CHP/Condensing 195
Chelyabinsk CHP-1 Gas, coal 149 CHP/Condensing 149
2011 Feb/2011 Tyumen CHP-1 Gas 472 209 CHP/Condensing 681
June/2011 Chelyabinsk CHP-3 Gas 360 216 CHP/Condensing 576
Oct/2011 Tobolsk CHP Gas 452 213 CHP/Condensing 665
2013 April/2013 Nyagan 1 GRES Gas 418 Condensing 418
Dec/2013 Nyagan 2 GRES Gas 418 Condensing 418
2015 Jan/2015 Nyagan 3 GRES Gas 418 Condensing 418
2H/2015 Chelyabinsk GRES Gas 82 248 CHP/Condensing 330
2H/2015 Chelyabinsk GRES Gas 248 CHP/Condensing 248
2,785 MW 2,388 MW 5,173 MW
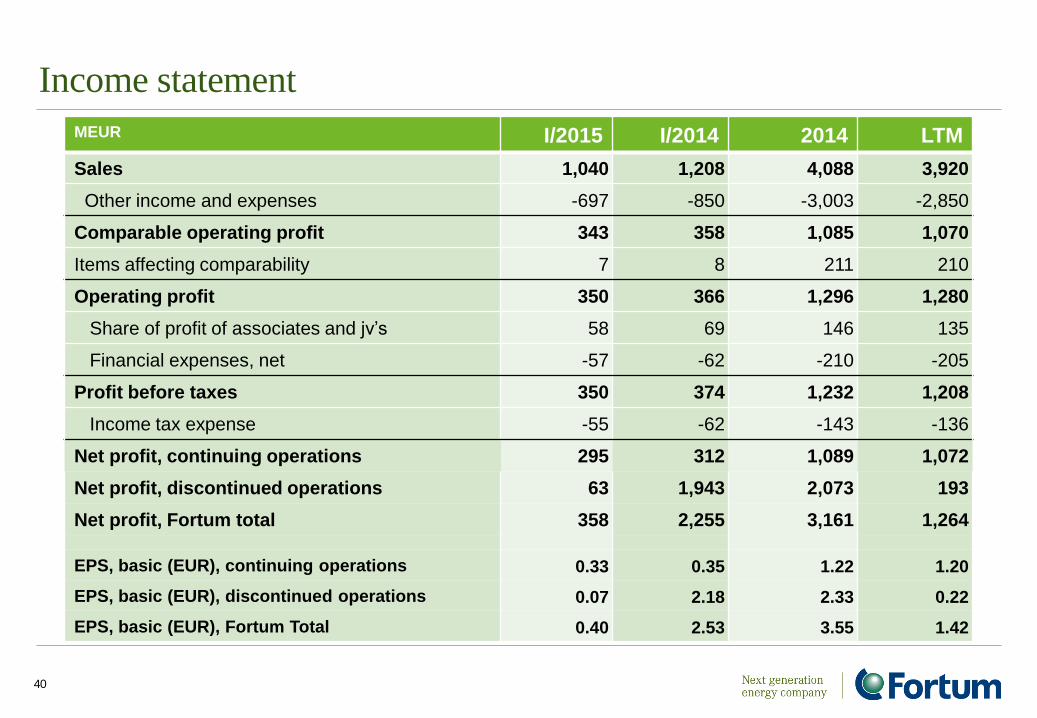
Income statement
MEUR I/2015 I/2014 2014 LTM
Sales 1,040 1,208 4,088 3,920
Other income and expenses -697 -850 -3,003 -2,850
Comparable operating profit 343 358 1,085 1,070
Items affecting comparability 7 8 211 210
Operating profit 350 366 1,296 1,280
Share of profit of associates and jv’s 58 69 146 135
Financial expenses, net -57 -62 -210 -205
Profit before taxes 350 374 1,232 1,208
Income tax expense -55 -62 -143 -136
Net profit, continuing operations 295 312 1,089 1,072
Net profit, discontinued operations 63 1,943 2,073 193
Net profit, Fortum total 358 2,255 3,161 1,264
EPS, basic (EUR), continuing operations 0.33 0.35 1.22 1.20
EPS, basic (EUR), discontinued operations 0.07 2.18 2.33 0.22
EPS, basic (EUR), Fortum Total 0.40 2.53 3.55 1.42
40
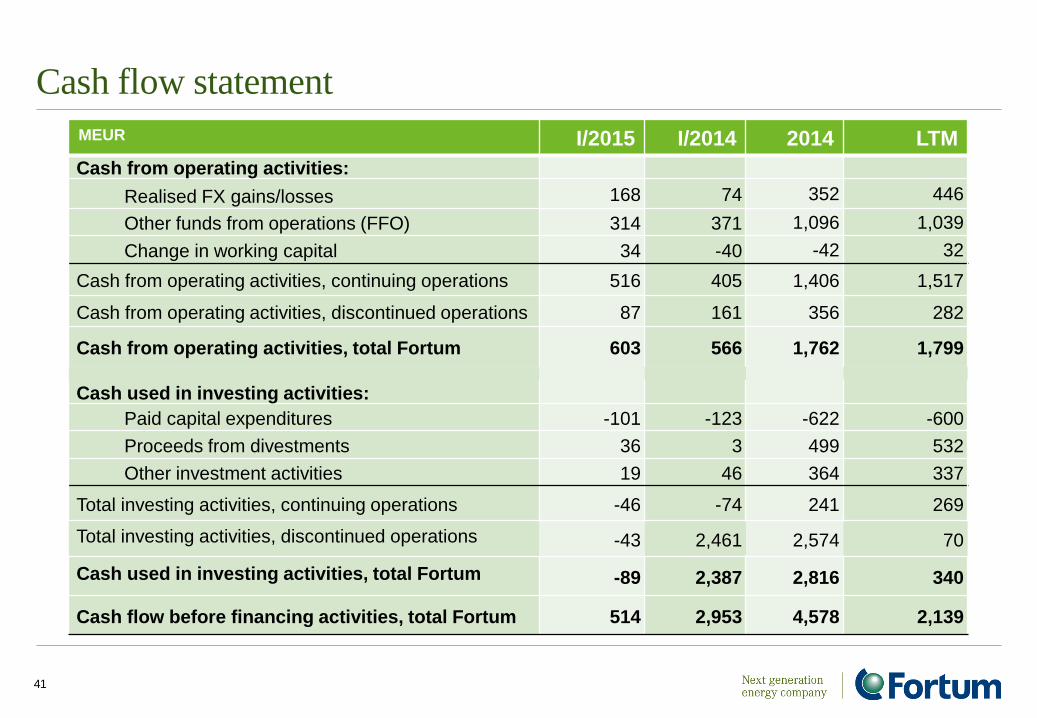
Cash flow statement
MEUR I/2015 I/2014 2014 LTM
Cash from operating activities:
Realised FX gains/losses 168 74 352 446
Other funds from operations (FFO) 314 371 1,096 1,039
Change in working capital 34 -40 -42 32
Cash from operating activities, continuing operations 516 405 1,406 1,517
Cash from operating activities, discontinued operations 87 161 356 282
Cash from operating activities, total Fortum 603 566 1,762 1,799
Cash used in investing activities:
Paid capital expenditures -101 -123 -622 -600
Proceeds from divestments 36 3 499 532
Other investment activities 19 46 364 337
Total investing activities, continuing operations -46 -74 241 269
Total investing activities, discontinued operations
-43 2,461 2,574 70
Cash used in investing activities, total Fortum
-89 2,387 2,816 340
Cash flow before financing activities, total Fortum 514 2,953 4,578 2,139
41

Key ratios
MEUR LTM 2014
Comparable EBITDA, continuing operations 1,397 1,457
Comparable EBITDA, total Fortum 1,754 1,873
Interest-bearing net debt, total Fortum 3,714 4,217
Comparable net debt/EBITDA, total Fortum 2.1 2.3
excluding Värme financing 1.8 2.0
42
ROCE % Return on capital employed, total Fortum 9.0 19.5
Good liquidity – committed credit lines total EUR 2.2 billion

Debt Maturity Profile 31 March 2015
0
250
500
750
1000
1250
1500
2015 2016 2017 2018 2019 2020 2021 2022 2023 2024 2025+
Bonds Financial institutions Other long-term debt Other short-term debt
MEUR
2015 1,036
2016 863
2017 538
2018 621
2019 821
2020 75
2021 549
2022 1,087
2023 110
2024 3
2025+ 1,279
TOTAL 6,982
43
per 31 March 2015 per 31 Dec, 2014
Average Interest Rate 4.3% 3.7%
Portion of floating / fixed debt 47 / 53% 46 / 54%
Outlook
Nordic markets
• Fortum continues to expect that the average annual electricity demand
growth will be on average approximately 0.5% in the coming years
• Electricity is expected to continue to gain share of total energy consumption
Russia
• The run-rate operating profit (EBIT) level for the Russia Segment, RUB 18.2
billion, is targeted to be reached during 2015, but the euro result level will be
volatile, due to the translation effect
Key drivers and risks
• Economic
• Political
• Currency
• Wholesale price of electricity and volumes
• demand and supply • fuels
• hydrological situation • power plant availability
• CO2 emissions allowance prices
44
Outlook
Annual capex estimate, excluding potential acquisitions
• 2015 approximately EUR 0.8 billion
Hedging
• Rest of 2015 approx. 50% hedge ratio at approx. EUR 41/MWh
• 2016 approx. 20% hedge ratio at approx. EUR 37/MWh
Taxation
• Effective tax rate for 2015 for the Group 19-21%
• The Swedish Government decided to re-propose an increase of 17%
on the tax on installed nuclear capacity to the spring budget
45
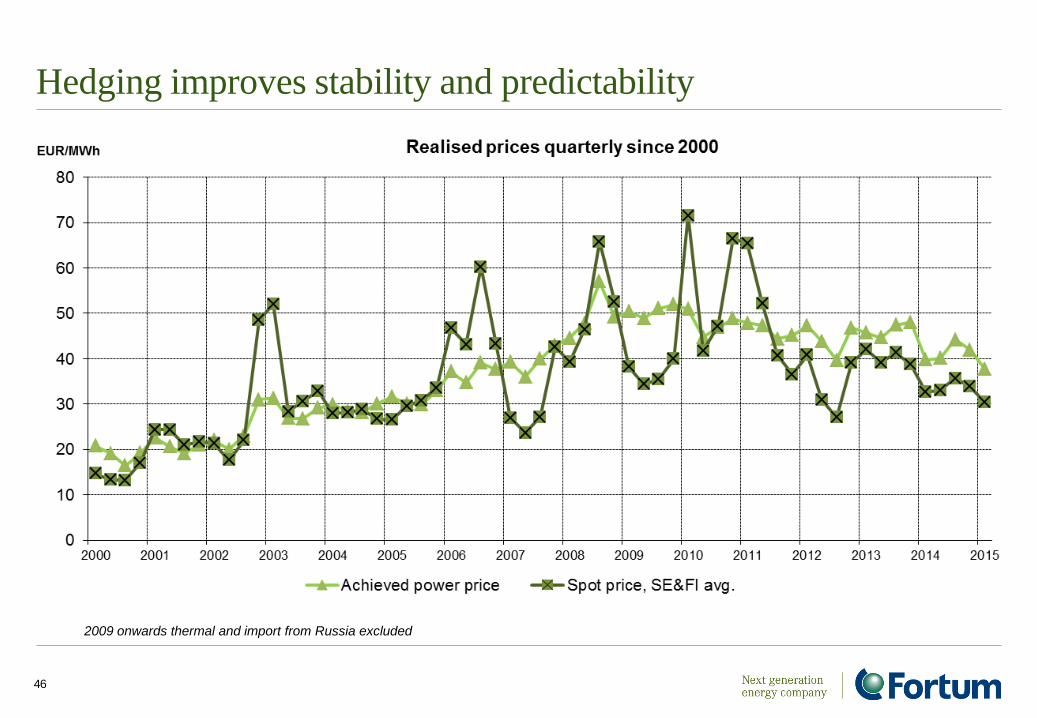
Hedging improves stability and predictability
46
2009 onwards thermal and import from Russia excluded
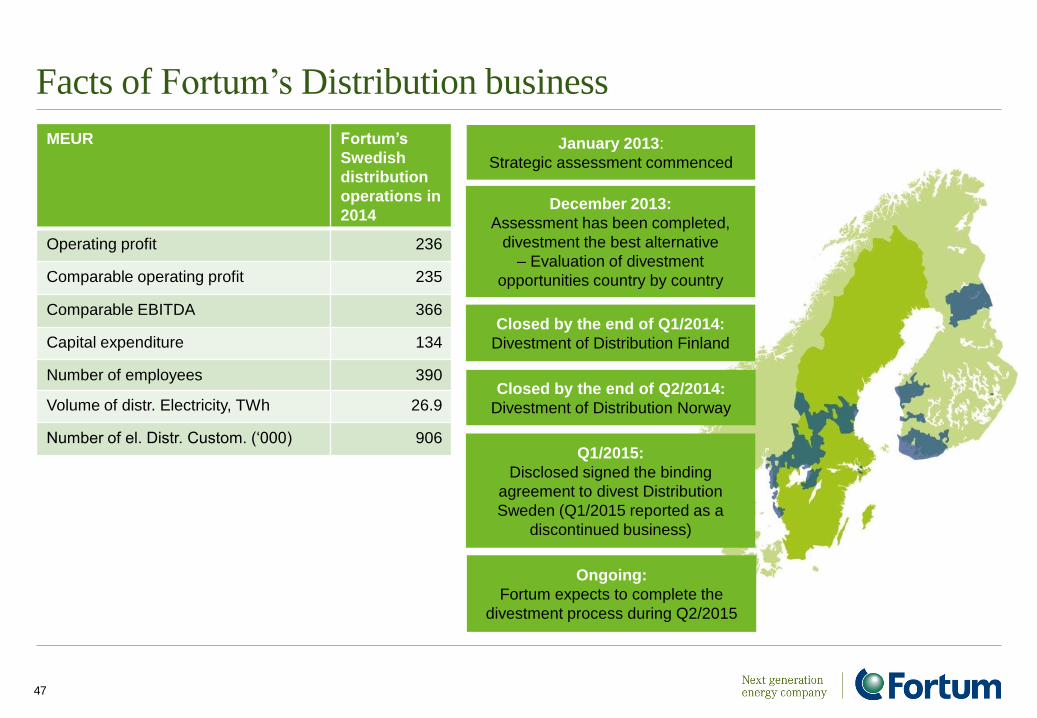
Facts of Fortum’s Distribution business
MEUR Fortum’s
Swedish
distribution
operations in
2014
Operating profit 236
Comparable operating profit 235
Comparable EBITDA 366
Capital expenditure 134
Number of employees 390
Volume of distr. Electricity, TWh 26.9
Number of el. Distr. Custom. (‘000) 906
47
January 2013:
Strategic assessment commenced
December 2013:
Assessment has been completed,
divestment the best alternative
– Evaluation of divestment
opportunities country by country
Closed by the end of Q1/2014:
Divestment of Distribution Finland
Q1/2015:
Disclosed signed the binding
agreement to divest Distribution
Sweden (Q1/2015 reported as a
discontinued business)
Closed by the end of Q2/2014:
Divestment of Distribution Norway
Ongoing:
Fortum expects to complete the
divestment process during Q2/2015
For more information, please visit www.fortum.com/investors