zillow group annual report 2018 - s24.q4cdn.com
TRANSCRIPT

Annual Report 2018
Annual Report 2018
Annual Report 2018

This annual report contains forward-looking statements within the meaning of Section 27A of the Securities Act of 1933 and Section 21E of the Securities Exchange Act of 1934 that involve risk and uncertainties, including the statements regarding our belief about our plans, objectives, expectations, strategies, intentions or other characterizations of future events or circumstances. Statements containing words such as “may,” “believe,” “anticipate,” “expect,” “intend,” “plan,” “project,” “will,” “projections,” “continue,” “business outlook,” “forecast,” “estimate,” “outlook,” “guidance,” or similar expressions constitute forward-looking statements. Di�erences in Zillow Group’s actual results from those described in these forward-looking statements may result from actions taken by us as well as from risk and uncertainties beyond our control. Factors that may contribute to such di�erences include, but are not limited to, those discussed under the heading “Risk Factors” in this Annual Report on Form 10-K for the fiscal year ended December 31, 2018, filed with the Securities and Exchange Commission, or SEC, and in our other filings with the SEC. Except as may be required by law, we do not intend, and undertake no duty, to update this information to reflect future events or circumstances.
Richard N. Barton Co-Founder and Chief Executive O�cer, Zillow Group, Inc.
Jay C. Hoag 2
General Partner,TCV
Gordon Stephenson 1, 3
Co-Founder and Managing Broker,Real Property Associates
Amy C. BohutinskyFormer Chief Operating O�cer,Zillow Group, Inc.
Gregory B. Ma�ei 1
President and Chief Executive O�cer,Liberty Media Corporation
April Underwood 2
Founding Partner,#Angels
Board Committees1 Audit Committee 2 Compensation Committee 3 Nominating and Governance Committee
Lloyd D. FrinkCo-Founder, Executive Chairmanand President, Zillow Group, Inc.
Spencer M. Rasco�Co-Founder and Former Chief Executive O�cer,Zillow Group, Inc.
Erik Blachford 1, 2, 3
Venture Partner,TCV
Richard N. BartonCo-Founder and Chief Executive O�cer
Stanley B. HumphriesChief Analytics O�cer
Jennifer A. RockChief Accounting O�cer
Dan SpauldingChief People O�cer
Jeremy WacksmanPresident, Zillow Brand
Lloyd D. FrinkCo-Founder, Executive Chairman and President
Allen W. ParkerChief Financial O�cer
Bradley D. OwensGeneral Counsel and Secretary
Aimee JohnsonChief Marketing O�cer
Dawn LyonChief Corporate Relations O�cer
Errol G. SamuelsonChief Industry Development O�cer
David A. BeitelChief Technology O�cer
Arik Y. PrawerPresident, Homes Division
Greg M. SchwartzPresident, Media and Marketplaces
Board of Directors
Executive Team
Annual Shareholder MeetingJune 4, 2019 | 9:00 a.m.O�ces of Perkins Coie LLP1201 Third Avenue49th FloorSeattle, Washington 98101
Transfer AgentComputershareP.O. Box 505000Louisville, KY 40233(866) 641–4276
NASDAQ ListingClass A common stock symbol - ZGClass C capital stock symbol - Z
Investor [email protected]
Independent AccountantsDeloitte & Touche LLPSeattle, Washington
Corporate Headquarters1301 Second Avenue, Floor 31Seattle, Washington 98101www.zillowgroup.com
Shareholder InformationThis annual report contains forward-looking statements within the meaning of Section 27A of the Securities Act of 1933 and Section 21E of the Securities Exchange Act of 1934 that involve risk and uncertainties, including the statements regarding our belief about our plans, objectives, expectations, strategies, intentions or other characterizations of future events or circumstances. Statements containing words such as “may,” “believe,” “anticipate,” “expect,” “intend,” “plan,” “project,” “will,” “projections,” “continue,” “business outlook,” “forecast,” “estimate,” “outlook,” “guidance,” or similar expressions constitute forward-looking statements. Di�erences in Zillow Group’s actual results from those described in these forward-looking statements may result from actions taken by us as well as from risk and uncertainties beyond our control. Factors that may contribute to such di�erences include, but are not limited to, those discussed under the heading “Risk Factors” in this Annual Report on Form 10-K for the fiscal year ended December 31, 2018, filed with the Securities and Exchange Commission, or SEC, and in our other filings with the SEC. Except as may be required by law, we do not intend, and undertake no duty, to update this information to reflect future events or circumstances.
Richard N. Barton Co-Founder and Chief Executive O�cer, Zillow Group, Inc.
Jay C. Hoag 2
General Partner,TCV
Gordon Stephenson 1, 3
Co-Founder and Managing Broker,Real Property Associates
Amy C. BohutinskyFormer Chief Operating O�cer,Zillow Group, Inc.
Gregory B. Ma�ei 1
President and Chief Executive O�cer,Liberty Media Corporation
April Underwood 2
Founding Partner,#Angels
Board Committees1 Audit Committee 2 Compensation Committee 3 Nominating and Governance Committee
Lloyd D. FrinkCo-Founder, Executive Chairmanand President, Zillow Group, Inc.
Spencer M. Rasco�Co-Founder and Former Chief Executive O�cer,Zillow Group, Inc.
Erik Blachford 1, 2, 3
Venture Partner,TCV
Richard N. BartonCo-Founder and Chief Executive O�cer
Stanley B. HumphriesChief Analytics O�cer
Jennifer A. RockChief Accounting O�cer
Dan SpauldingChief People O�cer
Jeremy WacksmanPresident, Zillow Brand
Lloyd D. FrinkCo-Founder, Executive Chairman and President
Allen W. ParkerChief Financial O�cer
Bradley D. OwensGeneral Counsel and Secretary
Aimee JohnsonChief Marketing O�cer
Dawn LyonChief Corporate Relations O�cer
Errol G. SamuelsonChief Industry Development O�cer
David A. BeitelChief Technology O�cer
Arik Y. PrawerPresident, Homes Division
Greg M. SchwartzPresident, Media and Marketplaces
Board of Directors
Executive Team
Annual Shareholder MeetingJune 4, 2019 | 9:00 a.m.O�ces of Perkins Coie LLP1201 Third Avenue49th FloorSeattle, Washington 98101
Transfer AgentComputershareP.O. Box 505000Louisville, KY 40233(866) 641–4276
NASDAQ ListingClass A common stock symbol - ZGClass C capital stock symbol - Z
Investor [email protected]
Independent AccountantsDeloitte & Touche LLPSeattle, Washington
Corporate Headquarters1301 Second Avenue, Floor 31Seattle, Washington 98101www.zillowgroup.com
Shareholder Information

April 16, 2019
Dear Fellow Shareholders,
I am excited to return as CEO of Zillow Group at such a transformative time. The tides are shifting inreal estate. Our world is being driven by “uberized,” on-demand consumers who have grown to expectmagic happens with the simple push of a button. We’ve seen this in travel, ride hailing, car buying,shopping, streaming video, etc. The time for real estate is now and Zillow Group is leading the way.
In 2018, we made some bold moves to dramatically expand our business to meet these evolvingconsumer expectations. We are moving from an advertising-based online real estate marketplace forresearch and facilitating connections to one that also drives transactions. The successful execution ofthis transformation will substantially enhance the value we deliver to consumers and professionalsthroughout the entire home shopping life cycle, while dramatically expanding our market opportunity.Highlights from 2018 include:
• We launched Zillow Offers™, a fast-growing service in which we buy homes directly fromconsumers and then resell them on the open market. Consumer demand for this easy,low-hassle transaction is exceeding our expectations and, as I write this letter, Zillow Offers islive in nine markets, with plans to be in at least 14 by the end of 2019.
• We acquired Mortgage Lenders of America (MLOA), which has since been rebranded asZillow Home Loans1, marking our entry into home loan originations and an important steptoward delivering an integrated payments platform for Zillow Offers as a complement to ourexisting mortgage marketplace.
• We began transitioning our Premier Agent marketplace from a lead generation model to onethat creates live on-demand connections designed to improve consumer satisfaction anddeliver higher conversion rates for our Premier Agents. While we had some bumps in rollingthis out initially, we made quick corrections and I am pleased to report our Premier Agentmarketplace is normalizing. We also began testing new pricing programs designed to betteralign incentives and rewards with our agent and broker partners that we continue to evaluate.
• We made sizable investments to rewire the highly fragmented rental marketplace throughtechnology and product innovation to make it easier for renters to search, tour, apply and payrent for leased properties. At the same time, we are automating administrative services forproperty managers and landlords to make the entire property management process moreefficient.
You will find more details about our financial performance in our Annual Report on Form 10-K. For myfirst letter since returning as CEO, I want to focus on our market expansion, near-term strategies, andlong-term opportunity.
“Unsticking” Movers Ready for Real Estate 2.0
We launched Zillow.com with the Zestimate® in 2006 because we wanted to empower consumers withinformation and radically improve the way people buy and sell homes. While one of our earliest ideasfor Zillow involved auction-based home sales, we quickly realized the pre-smartphone world wasn’tquite ready for real estate e-commerce. The Zestimate became the backbone of our marketplace andlaunched us down the road of an advertising-based business model. Since then, we have built trusted
1 Zillow Home Loans is operated by Zillow Home Loans, LLC (NMLS #10287, an Equal Housing Lender)

brands with high awareness, grown the largest audience in the online real estate category2, designedpowerful products and services, and earned revenue by connecting consumers with our strong networkof industry professionals to guide them through their home shopping process. While we have madegreat strides in empowering and assisting consumers in this “search and find” era to create dreamersand would-be movers, this is only part of the equation. In today’s on-demand world, we must alsoradically streamline the real estate transaction. Consumers want this; and Zillow Group is sharplyfocused on leading them there.
It’s no surprise the norms of traditional real estate can actually stifle moving. The process can bedaunting, complex, fragmented, and expensive. Case in point, nearly 180 million unique users visitZillow Group’s mobile apps and websites each month3, and in 2018, 32 million Americans indicatedthat they intended to buy a home in the next 12 months4 yet only about six million homes werepurchased last year and another 10 million people entered into lease agreements.5 That means thereare still a lot of frustrated potential movers out there. It shouldn’t be that way. This pent-up moverdemand gap is Zillow Group’s opportunity.
Real Estate 2.0 is about building on the transparency and progress over the past decade and removingthe historical friction to make transactions more seamless and “unstick” ready-to-move dreamers. Withconsumers as our north star, as they have always been, our purpose in this 2.0 world is to simply helppeople find a home they love and can afford, enabling moving as quickly and efficiently as possible.
The Power of the Zillow Group End-to-End Offering
Zillow turned 13 in February, and since our initial launch, we have amassed significant competitiveadvantages to remove the traditional friction points of buying, selling, renting and financing. We’releveraging our industry leadership, the power of the entire Zillow Group brand portfolio, our proprietarydata and technology, our industry partnerships and our culture of innovation to nurture and grow ournew and existing businesses. At the same time, we are partnering and evolving our relationships withPremier Agents and Brokers to delight our consumers, share in successes and set the stage for ournext wave of mutual growth.
This evolution is designed to place Zillow Group at nearly every major point of the home shopping andtransaction funnel to help consumers wherever they are in their mover lifecycle, enabling seamlesstransitions across our different business segments. We will continue to help dreamers search and findtheir next home, but now Zillow can also more directly help them buy, sell, rent and borrow, on theirterms.
In Real Estate 2.0, moving will be easier. For renters, Zillow makes it easy to search and get into theirnew home faster through stored rental applications, credit and background checks and automatedpayments to get the attention of property managers and landlords quickly. For sellers, Zillow Offersaddresses the uncertainty and hassle that can come with readying a home for sale by offering a fast,competitive price with a predictable close, eliminating the time and cost of appraisals, as well as thestress of living through home repairs and open houses. At the same time, this seller can now getpre-approved through Zillow Home Loans to help them simultaneously sell and buy, and get into theirnew home faster. They can also choose to buy their new home directly through Zillow or with theassistance of a Premier Agent. You can expect our future innovations will also address title and escrowto further reduce friction, increase speed and expedite more seamless transactions. Due to theend-to-end ease of working with Zillow and our network of agents and brokers, the next time aconsumer — and their friends and family — are ready to move, we expect Zillow will be their first stop.
2 Comscore Media Metrix® Multi-Platform, Real Estate, Total Audience, March 2019, U.S.3 Zillow Group internal, full year 2018 monthly average4 The Conference Board, Consumer Confidence Index, 20185 U.S. Census Bureau and National Association of REALTORS ® 2018; Zillow Group internal

2019 Imperatives Underpin Long-Term Targets
While 2018 was about pouring the foundation for our transformation toward transactions, in 2019 weare continuing the construction, making more investments to expand and grow our new and existingbusinesses. As we look ahead, you will see us sharply focused on execution, concentrating on a fewkey imperatives:
• Accelerate Zillow Offers. We have piloted and refined our playbook, and are now seeingconsumer demand for fast, easy home selling dramatically exceeding our expectations.Already, we receive one seller request every five minutes, and we are gaining efficienciesalong the way.
• Build Zillow Home Loans as Zillow Offers Payment Platform. We are deploying ZillowHome Loans as the featured payment option through Zillow Offers, driven by an experiencedteam who are working to significantly increase our loan origination volume and Zillow Offersattach rates over the next few years.
• Evolve Premier Agent and Rentals to End-to-End, Success-Based Service Offering. Aswe evolve Real Estate 2.0, we plan to continue to evolve the relationships we have with realestate agents, brokers, property managers and landlords from an advertising-based leadgeneration model to success-based partnerships in which incentives and rewards are betteraligned in servicing and delighting our shared on-demand consumers through streamlinedprocesses. We’ve already started in rentals and will continue to test alternate success-basedpricing models with agents and brokers in select markets. This transition will take time, andwe are not anticipating any meaningful revenue from this evolution until 2020 at the earliest.
These three imperatives will be supported by three core operating fundamentals:
• Build World-Class Operations. Moving from a media model to building success-basedmodels to facilitating transactions and running end-to-end operations requires new muscles,talent and discipline. We have been making investments in building internal systems andinfrastructure to operate these new businesses at scale, while also welcoming several keyexecutive and team hires over the past year from places like Amazon, Google, Starbucks,Microsoft, and Invitation Homes.
• Invest in Brand, Audience and Engagement. We know that brands matter and Zillow nowhas more than 50 percent unaided awareness in the U.S.6 We expect to leverage our largeaudience to keep our customer acquisition costs low and better serve consumers, helpingthem seamlessly navigate the home-related transaction process.
• Invest in Culture of Innovation and Performance. A long-standing competitive advantageat Zillow Group is attracting and retaining top talent with our inclusive culture that is frequentlyrecognized by third parties. As we scale and invest in our existing and new businesses, wedon’t just want to maintain our great culture, we strive to make it world class, perpetuatinginnovation and driving results across our businesses to never stand still.
Through the successful execution of these imperatives and our long-term growth strategy, we believewe can achieve the following targets within three to five years:
Homes Segment
• Purchase 5,000 homes per month through Zillow Offers, generating annualized revenue ofapproximately $20 billion, up from 686 homes purchased in 2018, which generated$52 million in revenue.
6 Zillow Group internal, December 2018
Mortgages Segment
• Zillow Home Loans achieves a 33 percent attach rate to Zillow Offers, up from zero in 2018.
• Zillow Home Loans originates more than 3,000 loans per month, up from nearly 4,000 MLOAloan originations in all of 2018.
Internet, Media & Technology Segment
• Achieve more than $2 billion in annual revenue, nearly doubling from 2018 results.
• Generate approximately $600 million in annual Adjusted EBITDA7, or 30 percent of revenue.
While some might see these targets as significant, we believe these are within our reach.
Our Expansion, Your Investment
As a shareholder, you made an investment in Zillow Group, and I know we changed some of ourfundamentals in 2018 that diluted our high-margin advertising business with lower-margin, capital-intensive transaction-based businesses. As your fellow shareholder, I understand this has beenunsettling. It was for us as well, initially.
In his first-ever Amazon shareholder letter, Jeff Bezos shared his management and decision-makingapproach with investors saying, “We will make bold rather than timid investment decisions where wesee a sufficient probability of gaining market leadership advantages.” While we probably haven’tarticulated this as clearly, we operate under the same philosophy. I also realize that we can improve inour investor and shareholder communication to ensure you understand our rationale and thoughtprocesses behind the bold moves we are making and you will see us direct more attention here in2019 and beyond. As a step in this direction, the longer-term targets we shared are intended to helpyou better understand what we see as the much bigger market opportunity. We understand the effectsof our 2018 investments will take some time to materialize, but I believe we are absolutely moving inthe right direction.
Consumers are already headed to Real Estate 2.0 and Zillow Group is uniquely positioned to leadthem, leveraging our team, audience and portfolio to capitalize on this rising demand. During our first13 years as a company, we captured nearly 10 percent of the total $17 billion addressable market(TAM) for real estate advertising.8 Now that we are transforming how people buy, sell and rent homesas we move our focus to driving more transactions, our TAM is expanding to the more than $1 trillion inannual transaction value.9 Today we are capturing less than 1 percent of this opportunity.
If we execute on our strategy as we have done since our inception, the opportunity available to us isquite large. While some industry leaders, or incumbents, can become complacent, at Zillow Group wehave been at the forefront of innovation since our inception and are rediscovering our revolutionarymindset. The seeds of our new businesses we planted in 2018 are taking root. There is an energy andexcitement in the halls of Zillow Group that comes from operating like a start-up again, but with the
7 Adjusted EBITDA is a non-GAAP financial measure; it is not calculated or presented in accordance with U.S. generallyaccepted accounting principles, or GAAP, and should not be considered in isolation or as a substitute for our financialresults as reported under GAAP. Zillow Group has not provided a quantitative reconciliation of forecasted segment AdjustedEBITDA to forecasted segment GAAP income (loss) before income taxes because the company is unable, without makingunreasonable efforts, to calculate certain reconciling items with confidence. For additional important information, please referto Exhibit 99.2 to our Current Report on Form 8-K filed with the Securities and Exchange Commission on February 21, 2019and available on the Zillow Group Investor Relations website at https://investors.zillowgroup.com/financials/sec-filings/default.aspx.
8 Borrell Associates 2018; Total spent on online and offline residential real estate advertising.9 Zillow Group internal estimate: $900 billion home transaction value + $87 billion agent commissions + $45 billion property
management spending + $44 billion mortgage origination fees.

stability of size, scale and wisdom that comes with experience. I have never been more excited aboutour opportunities ahead and am personally energized to lead as CEO through this transformationalperiod.
On behalf of the entire team at Zillow Group — who are your fellow shareholders — and our board ofdirectors, thank you for your continued support and feedback, and for joining us on this journey toremove friction in real estate and ultimately help more consumers find a home they love.
Sincerely,
Rich Barton
Co-founder & Chief Executive Officer

UNITED STATESSECURITIES AND EXCHANGE COMMISSION
Washington, D.C. 20549
Form 10-KÈ ANNUAL REPORT PURSUANT TO SECTION 13 OR 15(d) OF THE SECURITIES EXCHANGE
ACT OF 1934For the fiscal year ended December 31, 2018
OR‘ TRANSITION REPORT PURSUANT TO SECTION 13 OR 15(d) OF THE SECURITIES
EXCHANGE ACT OF 1934Commission File Number 001-36853
ZILLOW GROUP, INC.(Exact name of registrant as specified in its charter)
Washington 47-1645716(State or other jurisdiction of
incorporation or organization)(IRS Employer
Identification No.)
1301 Second Avenue, Floor 31,Seattle, Washington 98101
(Address of principal executive offices) (Zip code)
(206) 470-7000@ZillowGroup
(Registrant’s telephone number, including area code)
Securities registered pursuant to Section 12(b) of the Act:Class A Common Stock, par value $0.0001 per share The Nasdaq Global Select MarketClass C Capital Stock, par value $0.0001 per share The Nasdaq Global Select Market
(Title of each class) (Name of each exchange on which registered)
Securities registered pursuant to Section 12(g) of the Act:None
Indicate by check mark whether the registrant is a well-known seasoned issuer, as defined in Rule 405 of the SecuritiesAct: Yes È No ‘
Indicate by check mark whether the registrant is not required to file reports pursuant to Section 13 or 15(d) of theAct: Yes ‘ No È
Indicate by check mark whether the registrant (1) has filed all reports required to be filed by Section 13 or 15(d) of theSecurities Exchange Act of 1934 during the preceding 12 months (or for such shorter period that the registrant was required tofile such reports), and (2) has been subject to such filing requirements for the past 90 days. Yes È No ‘
Indicate by check mark whether the registrant has submitted electronically every Interactive Data File required to besubmitted pursuant to Rule 405 of Regulation S-T during the preceding 12 months (or for such shorter period that theregistrant was required to submit such files). Yes È No ‘
Indicate by check mark if disclosure of delinquent filers pursuant to Item 405 of Regulation S-K is not contained herein,and will not be contained, to the best of registrant’s knowledge, in definitive proxy or information statements incorporated byreference in Part III of this Form 10-K or any amendment to this Form 10-K. ‘
Indicate by check mark whether the registrant is a large accelerated filer, an accelerated filer, a non-accelerated filer, asmaller reporting company, or an emerging growth company. See the definitions of “large accelerated filer,” “acceleratedfiler”, “smaller reporting company” and “emerging growth company” in Rule 12b-2 of the Exchange Act. (Check one):Large accelerated filer È Accelerated filer ‘Non-accelerated filer ‘ Smaller reporting company ‘
Emerging growth company ‘
If an emerging growth company, indicate by check mark if the registrant has elected not to use the extended transitionperiod for complying with any new or revised financial accounting standards provided pursuant to Section 13(a) of theExchange Act. ‘
Indicate by check mark whether the registrant is a shell company (as defined in Rule 12b-2 of theAct): Yes ‘ No È
As of June 30, 2018, the last business day of the Registrant’s most recently completed second fiscal quarter, theaggregate market value of the Registrant’s Class A common stock and Class C capital stock held by non-affiliates based uponthe closing price of such shares on The Nasdaq Global Select Market on such date was $10,442,769,057.
As of February 15, 2019, 58,111,740 shares of the Registrant’s Class A common stock, 6,217,447 shares of Class Bcommon stock and 140,268,416 shares of Class C capital stock were outstanding.
DOCUMENTS INCORPORATED BY REFERENCEThe information required by Part III of this Report, to the extent not set forth herein, is incorporated in this Report by
reference to the Registrant’s definitive proxy statement relating to the 2019 annual meeting of shareholders. The definitiveproxy statement will be filed with the Securities and Exchange Commission within 120 days after the end of the 2018 fiscalyear.

ZILLOW GROUP, INC.
Annual Report on Form 10-K
for the Fiscal Year Ended December 31, 2018
TABLE OF CONTENTS
Page
PART I
Item 1. Business 3
Item 1A. Risk Factors 18
Item 1B. Unresolved Staff Comments 38
Item 2. Properties 38
Item 3. Legal Proceedings 39
Item 4. Mine Safety Disclosures 39
PART II
Item 5. Market for Registrant’s Common Equity, Related Stockholder Matters and Issuer Purchases of Equity
Securities 40
Item 6. Selected Financial Data 41
Item 7. Management’s Discussion and Analysis of Financial Condition and Results of Operations 44
Item 7A. Quantitative and Qualitative Disclosures About Market Risk 82
Item 8. Financial Statements and Supplementary Data 84
Item 9. Changes in and Disagreements with Accountants on Accounting and Financial Disclosure 133
Item 9A. Controls and Procedures 134
Item 9B. Other Information 136
PART III
Item 10. Directors, Executive Officers and Corporate Governance 137
Item 11. Executive Compensation 137
Item 12. Security Ownership of Certain Beneficial Owners and Management and Related Stockholder Matters 137
Item 13. Certain Relationships and Related Transactions, and Director Independence 137
Item 14. Principal Accountant Fees and Services 137
PART IV
Item 15. Exhibits, Financial Statement Schedules 138
Item 16. Form 10-K Summary 144
Signatures 145

2
As used in this Annual Report on Form 10-K, the terms “Zillow Group,” “the Company,” “we,” “us” and “our” refer to
Zillow Group, Inc., unless the context indicates otherwise.
NOTE REGARDING FORWARD-LOOKING STATEMENTS
This Annual Report on Form 10-K, including the sections entitled “Management’s Discussion and Analysis of Financial
Condition and Results of Operations,” “Risk Factors” and “Business,” contains forward-looking statements based on our
management’s beliefs and assumptions and on information currently available to our management. Forward-looking statements
include all statements that are not historical facts and generally may be identified by terms such as “believe,” “may,” “will,”
“estimate,” “continue,” “anticipate,” “intend,” “could,” “would,” “project,” “plan,” “expect” or the negative or plural of these
words or similar expressions.
These forward-looking statements are subject to a number of risks, uncertainties and assumptions, including those risks,
uncertainties and assumptions described in Part I, Item 1A (Risk Factors) of this report. Moreover, we operate in a very
competitive and rapidly changing environment. New risks emerge from time to time. It is not possible for our management to
predict all risks, nor can we assess the effect of all factors on our business or the extent to which any factor, or combination of
factors, may cause actual results to differ materially from those contained in any forward-looking statements we may make. In
light of these risks, uncertainties and assumptions, the forward-looking events and circumstances discussed in this report may
not occur and actual results could differ materially and adversely from those anticipated or implied in the forward-looking
statements.
You should not rely on forward-looking statements as predictions of future events. Although we believe that the
expectations reflected in the forward-looking statements are reasonable, we cannot guarantee that the future results, levels of
activity, performance or events and circumstances reflected in the forward-looking statements will be achieved or occur.
Moreover, except as required by law, neither we nor any other person assumes responsibility for the accuracy and completeness
of the forward-looking statements, and we undertake no obligation to update publicly any forward-looking statements for any
reason after the date of this report to conform these statements to actual results or to changes in our expectations.
3
PART I
Item 1. Business.
Mission
Our mission is to build the largest, most trusted and vibrant home-related marketplace in the world.
Overview
Zillow Group, Inc. operates the largest portfolio of real estate and home-related brands on mobile and the web which
focus on all stages of the home lifecycle: renting, buying, selling and financing. Zillow Group is committed to empowering
consumers with unparalleled data, inspiration and knowledge around homes and connecting them with great real estate
professionals. The Zillow Group portfolio of consumer brands includes Zillow, Trulia, Mortgage Lenders of America,
StreetEasy, HotPads, Naked Apartments, RealEstate.com and Out East. In addition, Zillow Group provides a comprehensive
suite of marketing software and technology solutions to help real estate, rental, and mortgage professionals maximize business
opportunities and connect with millions of consumers. Beginning in April 2018, Zillow Offers provides homeowners in certain
metropolitan areas with the opportunity to receive offers to purchase their home from Zillow. When Zillow buys a home, it
makes certain repairs and lists the home for resale on the open market. In October 2018, we completed the acquisition of
Mortgage Lenders of America, L.L.C. (“MLOA”), a licensed mortgage lender, through which we originate residential
mortgages to consumers. Zillow Group operates a number of business brands for real estate, rental and mortgage professionals,
including Mortech, dotloop, Bridge Interactive and New Home Feed. Zillow, Inc. was incorporated as a Washington
corporation in December 2004, and we launched the initial version of our website, Zillow.com, in February 2006. Zillow
Group, Inc. was incorporated as a Washington corporation in July 2014 in connection with our acquisition of Trulia. Upon the
closing of the Trulia acquisition in February 2015, each of Zillow and Trulia became wholly owned subsidiaries of Zillow
Group.
Our living database of approximately 110 million U.S. homes, including homes for sale, homes for rent and homes not
currently on the market, attracts an active and vibrant community of users. Individuals and businesses that use Zillow’s mobile
applications and websites have updated information on more than 80 million homes, creating exclusive home profiles not
available anywhere else. These profiles include detailed information about homes, including property facts, listing information
and purchase and sale data. We provide this information to our users where, when and how they want it, through our industry-
leading mobile applications and websites. Using complex, proprietary automated valuation models, we provide current home
value estimates, or Zestimates, and current rental price estimates, or Rent Zestimates, on approximately 100 million U.S.
homes.
For the year ended December 31, 2018, we generated revenue of $1,333.6 million, as compared to $1,076.8 million for
the year ended December 31, 2017, an increase of 24%. We generate revenue from the sale of advertising services and our suite
of marketing software and technology solutions to businesses and professionals primarily associated with the residential real
estate, rental and mortgage industries. We also generate revenue through the resale of homes on the open market through our
Zillow Offers program which was announced in April of 2018, as well as through mortgage originations through our October
2018 acquisition of MLOA, a licensed mortgage lender.
As of the second quarter of 2018, Zillow Group had two reportable segments: the Internet, Media & Technology (“IMT”)
segment, our historical operating and reportable segment, and the Homes segment. In our IMT segment, we generate revenue
from the sale of advertising services and our suite of marketing software and technology solutions to businesses and
professionals primarily associated with the residential real estate, rental and mortgage industries. These professionals include
real estate, rental and mortgage professionals and brand advertisers. The four revenue categories within our IMT segment are
Premier Agent, Rentals, Mortgages and Other.
Premier Agent revenue is generated by the sale of advertising under our Premier Agent and Premier Broker programs,
which offer a suite of marketing and business technology products and services to help real estate agents and brokers achieve

4
their advertising goals, while growing and managing their businesses and brands. We primarily offer our Premier Agent and
Premier Broker advertising products on a cost per impression basis. Impressions are delivered when a sold advertisement
appears on pages viewed by users of our mobile applications and websites. Rentals revenue primarily includes advertising sold
to property managers and other rental professionals on a cost per lead, cost per click, cost per impression or cost per lease
generated basis, and beginning in 2018, it includes revenue generated through our rental applications product. Rentals revenue
also includes revenue generated through our StreetEasy products and services, which is primarily generated on a cost per listing
basis. Mortgages revenue primarily includes advertising sold to mortgage lenders and other mortgage professionals on a cost
per lead basis, including our Connect (formerly known as Long Form) and Custom Quote services, as well as revenue
generated by Mortech, which provides subscription-based mortgage software solutions, including a product and pricing engine
and lead management platform. Beginning in the fourth quarter of 2018, mortgages revenue also includes revenue generated
from mortgage originations and the sale of mortgages on the secondary market through our acquisition of MLOA. Other
revenue primarily includes revenue generated by new construction and display, as well as revenue from the sale of various
other advertising and business software solutions and services and technology solutions for real estate professionals, including
dotloop. New construction revenue primarily includes advertising services sold to home builders on a cost per residential
community basis. Display revenue primarily consists of graphical mobile and web advertising sold to advertisers promoting
their brands on our mobile applications and websites.
In our Homes segment, we generate revenue from the resale of homes on the open market through our Zillow Offers
program. We began buying homes through the Zillow Offers program in April of 2018. We began selling homes in July of
2018.
On October 31, 2018, we completed the acquisition of MLOA, a licensed mortgage lender. This acquisition is consistent
with our strategy of moving further down funnel and closer to the real estate transaction to create better consumer experiences.
The total purchase price for the acquisition of MLOA was approximately $66.7 million in cash.
Beginning with the Quarterly Report on Form 10-Q for the quarterly period ending March 31, 2019, Zillow Group
expects to report financial results for three reportable segments: the IMT segment, the Homes segment and the Mortgages
segment. The IMT segment will include the financial results for the Premier Agent, Rentals and new construction marketplaces,
as well as dotloop, display and other advertising and business software solutions. The Homes segment will include the financial
results from Zillow Group’s buying and selling of homes directly. The Mortgages segment will include the financial results for
advertising sold to mortgage lenders and other mortgage professionals, mortgage originations through MLOA and the sale of
mortgages on the secondary market, as well as Mortech mortgage software solutions. We expect the Mortgages segment, with
the inclusion of MLOA, to have a material impact on our consolidated balance sheets, statements of operations and cash flows
in 2019.
Portions of our business may be affected by seasonal fluctuations in the residential real estate market, advertising
spending, and other factors. We believe our rapid growth may be masking the underlying seasonality of our business. As we
continue to expand our Zillow Offers service, we expect seasonal variances may become more pronounced, causing our
operating results to fluctuate. For example, costs and expenses typically peak in the three months ended June 30th, primarily
attributable to increases in sales and marketing expenses which are, in turn, primarily attributable to increased investment in
marketing and advertising initiatives to attract consumers across online and offline channels during peak seasons for home sales
activity. For the year ended December 31, 2018, costs and expenses peaked in the three months ended September 30th,
primarily attributable to the addition of our Homes business. In addition, the average number of unique users and visits have
historically peaked during the three months ended June 30th or September 30th, also consistent with peak residential real estate
activity in the spring and summer months. Because the number of unique users and visits may impact impression inventory,
leads to real estate professionals, and graphical display inventory that we monetize, this trend in the average number of unique
users and visits may result in seasonality of revenue. Also, as our Homes business revenue depends in part on users accessing
our mobile applications and websites to engage in the sale and purchase of homes with Zillow Group on the open market, the
impact of increased real estate activity in the spring and summer months may result in seasonality of revenue.
5
Industry Dynamics
The Importance of Homes
Homes are the center of peoples’ lives, the focus of some of their most important decisions and often their most valuable
assets. In addition to whether to buy, sell or rent, consumers frequently make many other important home-related decisions,
including decisions relating to home financing and home equity loans. Residential real estate is one of the largest sectors of the
U.S. economy and supports millions of professionals that provide services related to home purchases and sales, rentals and
home financings.
Large Market Opportunities
Based on external and internal assessments, we believe our current addressable markets include the following:
Purchase and Sale—In the United States, there are 212.8 million people residing in owner-occupied housing, according
to data published by the U.S. Census Bureau in November 2018. Approximately 34% of movers in 2018, or 10.9 million
people, were homeowners, according to the U.S. Census Bureau migration data published in November 2018.
Sales of approximately 5.4 million existing and over 600 thousand new homes in the United States in 2018 had an
aggregate transaction value of approximately $1.8 trillion, according to data published in 2018 by the U.S. Census Bureau and
in 2019 by the National Association of REALTORS®. Estimated real estate commission revenue was approximately $87 billion
in 2018, according to data from REAL Trends in 2017, and data published in 2018 by the U.S. Census Bureau, and in 2019 by
the National Association of REALTORS®. In an effort to acquire new client relationships and sell homes, U.S. real estate
agents and brokers will spend an estimated $8.3 billion on residential advertising in 2019, based on the most recent forecast
from Borrell Associates released in 2019. In addition, U.S. real estate developers will spend an estimated $715 million on
residential advertising in 2019, also based on the most recent forecast from Borrell Associates released in 2019.
Based on current purchase criteria, which considers home value, square footage, year built and other parameters, if
Zillow Offers were available in the top 200 metro areas in the U.S., sellers of nearly half of the existing homes sold in 2018
across the entire nation, or approximately 2.7 million homes, would have been eligible to receive offers from Zillow to buy
their home.
Home Financing—According to a forecast from the Mortgage Bankers Association published in January 2019,
approximately 4.2 million U.S. residential mortgage purchase originations occurred in 2018 for a total value of $1.2 trillion.
Based on quarterly performance data released by the Mortgage Bankers Association, estimated annual production revenue by
purchase loan originators was approximately $44 billion in 2018. U.S. residential mortgage providers will spend approximately
$7.1 billion in 2019 marketing their services and loan products to mortgage borrowers, based on the most recent forecast from
Borrell Associates released in 2019.
Rentals—In the United States, there are 106.5 million people residing in rental housing units, according to data published
by the U.S. Census Bureau in 2018. Approximately 66% of movers in 2018, or 21.4 million people, were renters, according to
the U.S. Census Bureau migration data published in November 2018.
In the third quarter of 2018, there were approximately 46.8 million rental housing units in the United States, with a
national vacancy rate of 7.1%, according to data published by the U.S. Census Bureau in October 2018. According to data
published by the U.S. Census Bureau from the 2015 Rental Housing Finance Survey, approximately:
• 26.8% of rental units (12.5 million) are located in buildings with 50 or more units;
• 8.6% of rental units (4.0 million) are located in buildings with 25 to 49 units;
• 10.4% of rental units (4.9 million) are located in buildings with 5 to 24 units;
• 13.7% of rental units (6.4 million) are located in small multi-family structures of 2-4 units;
• 40.6% of rental units (19.0 million) are 1-unit structures.
6
According to an IBISWorld industry report on property management in the United States published in 2018, residential
landlords spend an estimated $44.0 billion on property management services annually. Based on the most recent forecast from
Borrell Associates released in 2019, U.S. rental property managers will spend an estimated $2.7 billion on advertising in 2019,
which excludes lease concessions.
Highly Fragmented, Local and Complex Market
The market for residential real estate transactions and home-related services is highly fragmented, local and complex.
Each home has unique characteristics, including location, value, size, style, age and condition. Each consumer approaches
home-related transactions with a personal set of objectives, priorities and values. Real estate professionals generally operate in
local markets, often as independent contractors with different experiences and skills. These conditions create challenges for
consumers and real estate, rental and mortgage professionals alike. Consumers are challenged to find information about homes
and to find real estate, rental and mortgage professionals who fit their individual needs. Real estate, rental and mortgage
professionals are challenged to efficiently advertise their services and identify new clients, nurture those clients through to
transactions, and to measure the effectiveness of their marketing efforts.
Preeminent Role of Mobile Devices in Lives of Consumers
Consumers are increasingly turning to mobile devices to access real estate information and services via the internet, as
well as to complete transactions. With the widespread adoption of mobile and location-based technologies, consumers
increasingly expect home-related information and the ability to transact to be available via their mobile devices where, when
and how they want it. According to Comscore data published in December 2018, Zillow Group brands represent nearly three
quarters of market share of all mobile exclusive visitors to the real estate category. More than two-thirds of our flagship brand
Zillow’s usage occurs on a mobile device. We believe that the technological platform shift from desktop computers to mobile
devices benefits technology leaders like Zillow Group that are quick to innovate.
Competitive Advantages
We believe we have the following competitive advantages:
• Powerful Brand and Scale. We have established a powerful brand identity that includes a portfolio of the largest and
most vibrant brands, and we have built a large user community. The majority of our traffic comes direct, not dependent
on search engines, with demonstrated consumer intent to visit Zillow Group’s brands. Traffic to Zillow Group brands’
mobile applications and websites reached a seasonal peak of more than 195 million monthly unique users in July 2018,
an increase of 4% year over year. Visits to Zillow Group brands’ mobile applications and websites, including Zillow,
Trulia, StreetEasy and RealEstate.com, increased 14% to 7,182.1 million for the year ended December 31, 2018
compared to the year ended December 31, 2017. For additional information regarding unique users and visits, see
“Unique Users” and “Visits” in “Management’s Discussion and Analysis of Financial Condition and Results of
Operations.”
• Inimitable Database of Homes. Our living database of homes is the result of years of substantial investment,
sophisticated economic and statistical analysis, complex data aggregation and millions of user contributions. Our
dynamic and comprehensive living database includes detailed information on more than 110 million U.S. homes, and
includes homes for sale by third party sellers, homes for sale owned by Zillow, homes for rent and recently sold, as
well as properties not currently on the market. This database is central to the value we provide to consumers and real
estate, rental and mortgage professionals. It contains extensive information that users can search, through an easy-to-
use interface, to identify, analyze and compare homes. Our database is relevant to a broad range of users, including
buyers, sellers, renters, homeowners, real estate agents and other real estate professionals. It includes information such
as:
• Property facts: Zestimate and its corresponding value range, number of bedrooms, number of bathrooms,
square footage, lot size, assessed tax value and property type such as single-family, condominium, apartment,
multifamily, manufactured home or land.
7
• Listing information: price, price history and reductions, dollars per square foot, days on the market, listing
type (such as for sale by agent, for sale by owner, pre-market inventory, which includes foreclosure, pre-
foreclosure, Coming Soon and Make Me Move listings, new construction and rental homes), open houses,
property photos and estimated monthly mortgage payment.
• Purchase and sale data: prior sales information and recent sales nearby.
We synthesize data from hundreds of automated feeds, representing information from tens of thousands of public and
private sources. Applying extensive computer analytics to the data, we transform it into information that is accessible,
understandable and useful.
We refer to the database as “living” because the information is continually updated by the combination of our
proprietary algorithms, synthesis of third-party data from hundreds of sources, and through improvements by us and,
importantly, by our community of users. User-generated content from owners, agents and others enriches our database
with photos, videos, and additional property information. Individuals and businesses that use Zillow’s mobile
applications and websites have updated information on more than 80 million homes in our database, creating exclusive
home profiles not available anywhere else. Our inimitable database enables us to create content, products and services
not available anywhere else, and attracts an active, vibrant community of users. As of December 31, 2018, we had
published more than 4.4 million reviews, including more than 3.7 million reviews of local real estate agents and
approximately 649,000 reviews of mortgage professionals submitted by our users on Zillow.
• Zestimates and Rent Zestimates. We have developed industry-leading automated home valuation models that use
advanced statistical methods and complex, proprietary algorithms. We use these models to provide current home value
estimates, or Zestimates, and current rental price estimates, or Rent Zestimates, on approximately 100 million U.S.
homes. Based on our Zestimates, we produce Zillow Home Value Indexes at the neighborhood, zip code, city,
metropolitan statistical area, county and national levels. Our Zillow Home Value Indexes have been cited by
government entities such as the Federal Reserve Bank and the Congressional Oversight Panel, university studies and
respected national publications. For historical comparisons, we provide up to 15 years of Zestimate history on each
home and valuable information about property and real estate market trends. Our Zestimates, Rent Zestimates and
Zillow Home Value Indexes allow consumers to evaluate homes and neighborhoods, and to easily evaluate historical
trends, as they contemplate critical home-related decisions.
• Mobile Leadership and Monetization. We have developed and operate the most popular suite of mobile real estate
applications across all major platforms. For example, on our flagship Zillow brand, during December 2018, nearly
880 million homes, or 328 homes per second, were viewed on a mobile device. More than two-thirds of our flagship
brand Zillow’s usage occurs on a mobile device. We operate one of the most popular suites of mobile real estate
applications with more than fifty applications across all major mobile platforms. We monetize our marketplace
business on our mobile platform in the same way we do on our web platform.
• Independent Market Positions and Consumer Focus. Zillow Group has been built independent of any real estate
industry group. We maintain an unwavering commitment to giving consumers free access to as much useful
information as possible. We provide information, products and services, designed to empower consumers to make
informed decisions about homes and the residential real estate market. We believe our independence enables us to
create compelling products and services with broad consumer appeal.
• Multiple Robust Home-Related Marketplaces. We have created trusted and transparent marketplaces in real estate,
rentals and mortgages where consumers can identify and connect with local professionals that are best suited to meet
their needs. Our living database of homes provides a foundation on which we can build new consumer and
professional marketplaces in other home-related categories.
• Technology Solutions for Professionals. We offer a suite of marketing and technology solutions to help real estate,
rental and mortgage professionals grow their businesses and personal brands including our Premier Agent app that
8
allows real estate professionals to manage their business from wherever they are, dotloop that has digitized the real
estate transaction, and Bridge Interactive which has streamlined listing data management.
• Consumer-Oriented Mortgage Marketplace. Unlike other sources of mortgage rate quotes, consumers can
anonymously submit mortgage loan information requests and receive an unlimited number of personalized mortgage
quotes directly from hundreds of consumer-rated lenders, including MLOA, through which we originate mortgages.
Because we operate this marketplace as part of our real estate home shopping experience, we can efficiently attract
motivated users to the marketplace and prioritize the consumer’s experience. For the year ended December 31, 2018,
there were approximately 25.4 million mortgage loan information requests submitted on Zillow Group platforms by
consumers.
• Personalized Experience. We present homebuyers and sellers and real estate, rental and mortgage professionals with
many opportunities to personalize their Zillow Group experience, leading to more informed home shopping and
financing decisions. As immediacy is paramount in the home search experience, all Zillow Group mobile applications
and websites empower users by allowing them to set the criteria that matters most to them, while we take on the action
of alerting them when a home or rental that matches their criteria hits the market.
• Proven Management Team. We believe the broad experience and depth of our management team are distinct
competitive advantages in the complex and evolving industry in which we compete. The Zillow Group management
team has a mix of extensive experience building successful consumer internet companies and real estate and
mortgages businesses. We believe the collective skills and experiences of our executives provide our management
team with immense strategic insight and ability.
Growth Strategies
Our growth strategies are:
• Improve the Home-Related Transaction Experience for the Consumer. Maintain our unwavering focus on empowering
consumers with information and products and services that they love to use to make home-related decisions. Develop
seamless end-to-end technology offerings that meet the ever-changing expectations of today’s consumers in an on-
demand economy, with a goal of earning consumers’ preference for Zillow Group products and services across all
stages of the home lifecycle.
• Grow our Audience and Increase Engagement Across all Brands. Expand our targeted marketing and advertising
programs, public relations, social media initiatives and content distribution to efficiently increase consumer awareness
across all brands in our portfolio. Increase footprint via international expansion, as well as into local markets with new
products and services. Launch new brands, products and services that target specific demographics or geographies.
• Continuously Provide Growth Opportunities for Residential Real Estate Agents and Brokers, Home Builders, Rental
Property Managers, and Mortgage Lenders. Provide real estate, rental and mortgage professionals participating in our
marketplaces continuous opportunities to grow their respective businesses and increase transactions by creating
opportunities for high-quality consumer-initiated connections. Support participating professionals by developing a
broad variety of marketing software, technology solutions, productivity tools and other support services to help those
professionals manage and grow their businesses and personal brands.
• Deepen and Expand Our Marketplaces Across the Lifecycle of Homes. Deepen and expand our platform beyond
advertising services for real estate, rental and mortgage professionals through direct market participation, by
purchasing homes from, selling homes to, and originating mortgages for consumers. In the future, develop other
ancillary products and services to address friction in residential real estate transactions for consumers and industry
professionals. Also, pursue commercial relationships and acquisitions to strengthen our market position, enhance our
technology offerings and accelerate our growth.
• Leverage our Data Advantage. Enhance the information in our database of more than 110 million homes, and use it as
the foundation for new analyses, insights and tools that inform strategic decisions. Our living database of homes

9
provides a foundation on which we can build new consumer and professional marketplaces in other home-related
categories. Our unmatched audience size and traffic pattern data also provides us with a competitive advantage.
Real Estate Products and Services
We provide advertising products and services for real estate, rental and mortgage professionals that enable them to create
and promote useful content for consumers. Additionally, in 2018 we introduced new services to enable consumers to directly
buy and sell homes through our Zillow Offers program and to help consumers finance real estate transactions through our
acquisition of MLOA.
Premier Agent and Premier Broker Programs
Our Premier Agent and Premier Broker programs offer a suite of marketing and business technology products and
services to help real estate agents and brokers achieve their advertising goals, while growing and managing their businesses and
brands. All Premier Agents and Premier Brokers receive access to a dashboard portal on our mobile application or website that
provides individualized program performance analytics, our customer relationship management, or CRM, tool that captures
detailed information about each contact made with a Premier Agent or Premier Broker through our mobile and web platforms
and our account management tools.
We primarily offer our Premier Agent and Premier Broker advertising products on a cost per impression basis. Payment is
received prior to the delivery of impressions. Impressions are delivered when a sold advertisement appears on pages viewed by
users of our mobile applications and websites. We determine the cost per impression delivered in each zip code using an
auction-based pricing method in consideration of the total amount spent by Premier Agents and Premier Brokers to purchase
impressions in the zip code during the month. A Premier Agent’s or Premier Broker’s share of voice in a zip code is determined
by their proportional monthly budgeted spend in that zip code as a percentage of the total monthly budgeted spend of all
Premier Agents and Premier Brokers in that zip code. The cost per impression that we charge is dynamic - as demand for
impressions in a zip code increases or decreases, the cost per impression in that zip code may be increased or decreased
accordingly.
In April 2018, we began testing a new form of lead validation and distribution related to our auction-based pricing model
whereby the share of voice purchased by Premier Agents and Premier Brokers represents both the share of impressions
delivered as advertisements appearing on pages viewed by users of our mobile applications and websites, as well as the
proportion of validated consumer connections a Premier Agent or Premier Broker receives. When consumers who are interested
in connecting with a real estate professional do not select a specific Premier Agent or Premier Broker advertisement on one of
Zillow Group’s mobile applications or websites, the validated consumer leads will be distributed to Premier Agents and
Premier Brokers in proportion to their share of voice. We believe distributing validated consumer connection leads on the basis
of share of voice creates better experiences for consumers and further strengthens our partnerships with real estate
professionals. We substantially completed the nationwide adoption of this new lead distribution model in the fourth quarter of
2018.
In October 2018, we began testing a new Flex Pricing model for Premier Broker and Premier Agent advertising services
in limited markets. With the Flex Pricing model, Premier Brokers and Premier Agents are provided with validated leads at no
upfront cost, and they pay a performance advertising fee only when a real estate transaction is closed with one of their leads.
Zillow Group Rentals
Zillow Group continues to develop its rental marketplace across mobile applications and websites, that serve both
consumers and rental professionals. Zillow Group Rentals is the largest rental network on the internet and includes listing
distribution across Zillow, Trulia and HotPads, reaching millions of rental shoppers each month. Zillow Group Rentals
advertisers gain access to the leading technology and marketing platform that connects rental properties with consumer contacts
and, beginning in 2018, to tools to effectively convert contacts into tenants, including through a rental applications product.
10
Mortgages
We offer two mortgage advertising products – Connect (formerly known as “Long Form”) and Custom Quotes. In Zillow
Group’s Connect platform, consumers answer a series of questions to find a local lender, and mortgage professionals receive
contacts based on data such as location and customer reviews. In our Custom Quotes mortgage marketing platform, lending
institutions display their mortgage rates directly to consumers who are shopping for refinance and purchase rates. In Custom
Quotes, consumers request free, personalized quotes in response to their submission of limited anonymous data, such as
specific loan amount, zip code, purchase price or estimated home value, and credit score. Consumers decide if and when to
contact the mortgage professionals who provide quotes. For the year ended December 31, 2018, there were approximately 25.4
million mortgage loan information requests submitted on Zillow Group platforms by consumers through Connect and Custom
Quotes. User-generated ratings and reviews of mortgage professionals are provided as a powerful tool to help consumers shop
for their loans. Our Connect and Custom Quote services are operated by our wholly owned subsidiary, Zillow Group
Marketplace, Inc. (formerly Zillow Group Mortgages, Inc.), a licensed mortgage broker, pursuant to a support services
agreement.
In October 2018, we completed the acquisition of MLOA, a licensed mortgage lender. This acquisition is consistent with
our strategy of moving further down funnel and closer to the real estate transaction to create better consumer experiences. Thus,
beginning in the fourth quarter of 2018, Zillow’s suite of products now includes mortgage originations. This acquisition will
allow Zillow to streamline and shorten the home-buying process for consumers who purchase homes through Zillow Offers.
Zillow Group New Construction
Zillow Group’s new construction marketing platform, Promoted Communities, allows home builders to showcase their
available inventory to our millions of in-market home shoppers across the web. Promoted Communities continues to drive
discoverability for home builders through dynamic listings of their available lots, plans, spec homes, and community details
pages, while our Builder Boost products with Precision Targeting let home builders enhance their community’s presence on
Zillow, Trulia and Facebook®. Zillow Group marketing partners also receive exclusive access to robust data and consumer
insights to help them make informed marketing decisions.
Zillow Offers
In 2017, we began testing the Zillow Instant Offers marketplace, a way for homeowners to sell their homes quickly by
providing them with offers from investors and a comparative market analysis from a local real estate agent as an estimate for
what the home might fetch on the open market. Beginning in April 2018, Zillow discontinued the Instant Offers marketplace
and launched the Zillow Offers service, which allows homeowners to either sell their home directly to Zillow or have Zillow
connect them with a Premier Agent to assist in the sale of their home through a traditional listed transaction. If a homeowner
accepts an offer from Zillow Offers, Zillow buys the house, makes certain repairs and updates, and then lists it for sale on the
open market. The Zillow Offers service provides sellers with certainty, control, and convenience, allowing them to avoid the
many complexities of a traditional residential sale process. As of December 31, 2018, Zillow Offers was buying and selling
homes in 5 metropolitan areas across the U.S.
Information Products and Services
We provide consumers with information products and services to enable them to make intelligent decisions about homes.
Zestimates and Rent Zestimates
Our Zestimate and Rent Zestimate valuations are computed using complex, proprietary algorithms we have developed
and refined through years of statistical analysis and technological development.

11
A Zestimate is our estimated current market value of a home. We generate Zestimates using a variety of information,
including:
• Physical attributes: location, lot size, square footage, number of bedrooms and bathrooms and many other details.
• Tax assessments: property tax information, actual property taxes paid, exceptions to tax assessments and other
information provided in the tax assessors’ records.
• Prior and current transactions: actual sale prices over time of the home itself and comparable recent sales of nearby
homes.
• User data: data provided directly by millions of users of our mobile applications and websites.
We use proprietary automated valuation models that apply advanced algorithms to analyze our data to identify
relationships within a specific geographic area between home-related data and actual sales prices. We provide current home
value estimates, or Zestimates, on approximately 100 million U.S. homes. Home characteristics, such as square footage,
location or the number of bathrooms, are given different weights according to their influence on home sale prices in each
specific geographic area over a specific period of time, resulting in a set of valuation rules, or models, that are applied to
generate each home’s Zestimate.
To improve the accuracy of our Zestimates, our algorithms automatically remove or reconcile data that would otherwise
inappropriately skew the valuation rules. In addition, our algorithms will automatically generate a new set of valuation rules
based on the constantly changing universe of data included in our database. This allows us to provide timely home value
information on a massive scale, updated daily. In 2017, we announced Zillow Prize, a machine learning competition to improve
Zestimate accuracy, with a grand prize of up to $1 million to the person or team who submits the most improved Zestimate
algorithm model, and in January 2019, we awarded the $1 million prize to the winning team, which beat the Zillow benchmark
model by approximately 13%.
We publicly disclose the accuracy of our Zestimates to further empower consumers in assessing a home’s value. The
accuracy may be impacted by a variety of factors, including the amount of data about homes we have for a particular
geographic area.
A Rent Zestimate is our estimated current monthly rental price of a home, computed using automated valuation models,
similar to our Zestimates, which we have designed to address the unique attributes of a rental home. We estimate rental prices
on approximately 100 million homes, including apartments, single-family homes, condominiums and townhomes. Our Rent
Zestimates are updated daily.
12
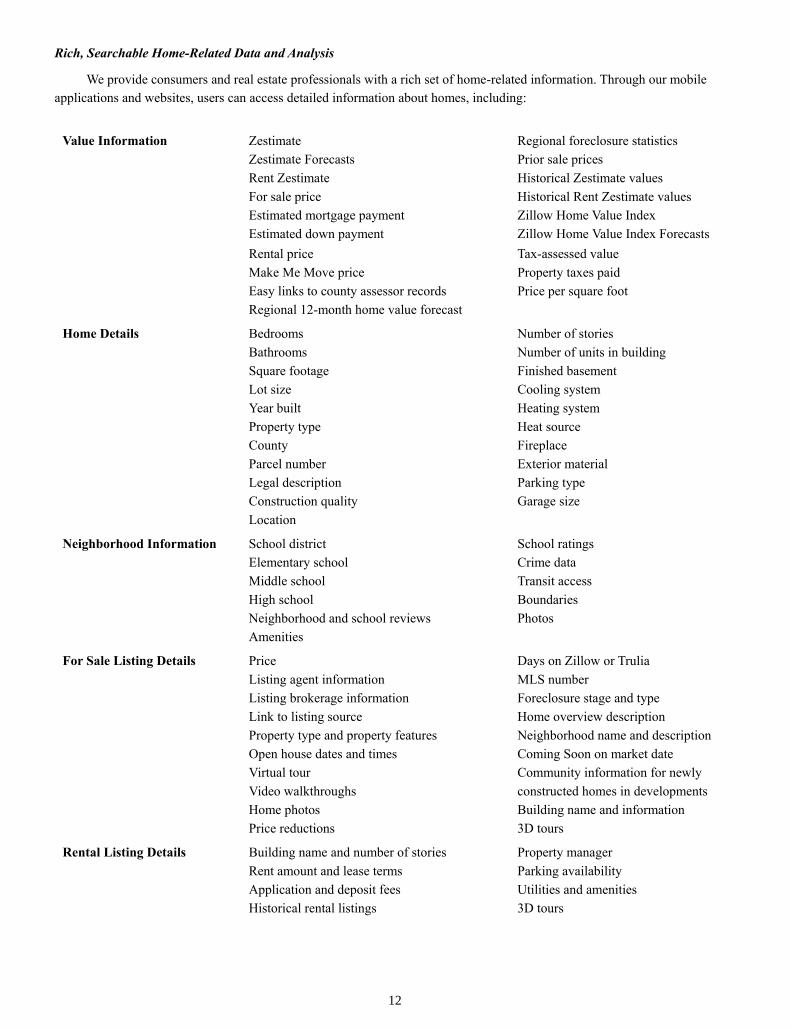
Rich, Searchable Home-Related Data and Analysis
We provide consumers and real estate professionals with a rich set of home-related information. Through our mobile
applications and websites, users can access detailed information about homes, including:
Value Information Zestimate Regional foreclosure statistics
Zestimate Forecasts Prior sale prices
Rent Zestimate Historical Zestimate values
For sale price Historical Rent Zestimate values
Estimated mortgage payment Zillow Home Value Index
Estimated down payment Zillow Home Value Index Forecasts
Rental price Tax-assessed value
Make Me Move price Property taxes paid
Easy links to county assessor records Price per square foot
Regional 12-month home value forecast
Home Details Bedrooms Number of stories
Bathrooms Number of units in building
Square footage Finished basement
Lot size Cooling system
Year built Heating system
Property type Heat source
County Fireplace
Parcel number Exterior material
Legal description Parking type
Construction quality Garage size
Location
Neighborhood Information School district School ratings
Elementary school Crime data
Middle school Transit access
High school Boundaries
Neighborhood and school reviews Photos
Amenities
For Sale Listing Details Price Days on Zillow or Trulia
Listing agent information MLS number
Listing brokerage information Foreclosure stage and type
Link to listing source Home overview description
Property type and property features Neighborhood name and description
Open house dates and times Coming Soon on market date
Virtual tour Community information for newly
Video walkthroughs constructed homes in developments
Home photos Building name and information
Price reductions 3D tours
Rental Listing Details Building name and number of stories Property manager
Rent amount and lease terms Parking availability
Application and deposit fees Utilities and amenities
Historical rental listings 3D tours

13
Consumers and real estate professionals can update property information by, for example, adding home photos and
personalized information regarding the neighborhood or school district, creating exclusive home profiles not available
anywhere else.
Our map-based user interface enables our users to search, navigate and zoom to areas of interest and find and compare
home information quickly and efficiently from a variety of different perspectives across homes, neighborhoods, cities, counties
and other geographic regions. Our consumer search experience supports complex search queries and filters across our data set
of homes, allowing consumers to customize their searches and gain actionable insights.
Our team of economists and statisticians generates unbiased local and national real estate data and analysis on 933
metropolitan areas and approximately 15,000 individual neighborhoods that we provide to consumers and real estate, rental and
mortgage professionals at no cost. This gives our users access to local market trends and data, such as home price cuts, list to
sale price ratio and foreclosure data that was historically not easily obtained, if available at all. Users can compare these metrics
across neighborhoods and different time periods using our real-time charting and filtering.
For Sale and Rental Listings
We provide comprehensive for sale and rental listings through relationships with real estate brokerages, real estate
listings aggregators, multiple listing services, apartment management companies, home builders, and other third parties. In
addition, we provide consumers with access to exclusive home listings, such as our Make Me Move listings, which are a
homeowner’s posted price at which they would be willing to move. We also show listings that may not be available on other
sources, including for sale by owner, pre-market inventory, including our Coming Soon listings, New Construction listings and
rental listings as well as listings that are owned by Zillow through the Zillow Offers program and which are available for sale.
Marketplace of Real Estate Agents
We present consumers with ratings and contact information for the listing agent and local buyer’s agents alongside home
profiles and listings for homes to assist them in evaluating and selecting the real estate agent best suited for them. We enhance
this offering by providing an online professional directory for consumers to search and contact real estate professionals that
they might wish to engage. Our directory includes rich profiles of real estate professionals, including more than 3.7 million
ratings and reviews provided by our users, allowing consumers to evaluate these agents based on a number of criteria, including
neighborhood specialization and number of listings.
Marketplace of Mortgage Professionals
In our mortgages marketplace, consumers can answer a series of questions to find a local lender, and mortgage
professionals receive contacts based on data such as location and customer reviews, or consumers can anonymously request
free, personalized mortgage quotes from consumer-rated-and-reviewed mortgage professionals. Consumers can then choose to
contact those mortgage professionals at their discretion. For the year ended December 31, 2018, there were approximately
25.4 million mortgage loan information requests submitted on Zillow Group platforms by consumers. More than half of
consumers who submit a loan information request do so on a mobile device. As of December 31, 2018, we had published
approximately 649,000 reviews of mortgage professionals submitted by our consumers.
Mobile Access
We operate one of the most popular suites of mobile real estate applications with more than fifty applications across all
major mobile platforms. Our mobile real estate applications provide consumers and real estate, rental and mortgage
professionals with location-based access to many of our products and services, including Zestimates, Rent Zestimates, for sale
and rental listings and extensive home-related data. Through our mobile applications, for example, a consumer can learn about
the home’s for-sale price, Zestimate, number of bedrooms, square footage and past sales, as well as similar information about
surrounding homes. The consumer can connect with a real estate professional through our mobile applications to get more

14
information or schedule a showing. For example, on our flagship Zillow brand, during December 2018, nearly 880 million
homes were viewed on a mobile device, which equates to 328 homes per second.
Marketing
We believe Zillow Group has considerable opportunity to increase brand awareness and grow traffic through product
development, targeted advertising programs and strategic partnerships. As such, we opportunistically advertise to consumers
and professionals in various online and offline channels that have tested well for us and pursue strategic partnerships that drive
traffic and brand awareness for Zillow Group.
At Zillow Group, marketing begins with effective product development, which then becomes amplified by impactful
brand advertising and marketing communications. We create immersive consumer products that people want to use frequently,
talk about and share. More recently, we also began creating products that alleviate the stress of activities like selling or buying a
home, such as Zillow Offers. The engaging nature of our products enables us to execute compelling advertising campaigns
integrated with our robust and viral communications program, which together comprise the primary drivers of our brand
awareness and traffic acquisition efforts.
The communications team for our flagship Zillow brand includes former journalists who have established Zillow Group
as an authoritative source for information on a broad range of home and real estate-related subjects. A typical week includes
commentary from our real estate experts across dozens of national print and broadcast media outlets, guest opinion pieces or
blog posts by our chief economists, and wide-ranging national and local media coverage of Zillow Group products, including
Zillow Offers, listings, data and consumer tips.
In September 2018, we released the third annual Zillow Group Report on Consumer Housing Trends, which highlights
our latest consumer research. The report has garnered the attention of media outlets such as the Wall Street Journal, New York
Times, Fox Business, Associated Press and Money Magazine and serves to establish Zillow Group as the authority on
residential real estate consumers and their needs, aspirations and challenges.
We focus substantial public relations effort around the marketing of our Zillow Real Estate Market Reports, which are in-
depth reports produced by our economics and analytics bureau for 909 U.S. markets. Data is released on a monthly and
quarterly basis, and the data is widely used by government entities such as the Federal Reserve and Congressional Oversight
Panel, as well as regularly featured in respected media outlets such as the Wall Street Journal, New York Times, Bloomberg,
Reuters and across numerous national network and cable news shows including CNBC, CNN, Fox News and Bloomberg. We
believe the considerable effort we have spent on public relations and social media has allowed us to build large and credible
brands.
Our living database of homes creates significant opportunities for home-ownership lifecycle marketing. A typical person
will at various times in life be a renter, buyer, homeowner, mortgage refinancer or seller, and this presents opportunities to
communicate with consumers over many years before, during and after a transaction. We actively communicate with our users
through email and social media channels.
Sales, Consumer Care and Customer Support
Our sales teams are responsible for generating customers across our mobile applications and websites.
Our largest sales teams sell our Premier Agent and Premier Broker products to real estate agents, and are located in
Seattle, Washington, Denver, Colorado, Irvine, California, and New York, New York. We also have sales teams in Seattle,
Washington, Denver, Colorado, New York, New York, and Irvine, California that sell our rental products to rental professionals.
In addition, we have sales teams in Seattle, Washington and Lincoln, Nebraska that support sales in our mortgage marketplaces.
We also have sales teams in Seattle, Washington, Denver, Colorado, and San Francisco, California that sell our new
construction marketing solutions. We attract customers through a combination of outbound calling and inbound customer
requests generated from our websites and event marketing activities. We also maintain field sales teams in San Francisco,

15
California and New York, New York to specifically target larger advertising customers in the real estate and related content
categories, such as real estate brokerages, home builders, lenders and home service providers, as well as advertisers in the
telecommunications, automotive, insurance and other industries. Beginning in October 2018, as a result of our acquisition of
MLOA, we maintain a team of loan origination officers in Overland Park, Kansas that support sales of mortgage originations.
We believe that consumer care and customer support are important to our success. Our consumer care and customer
support teams are located in Seattle, Washington and Denver, Colorado. Our customer support team responds to commercial
and technical issues from our advertisers, and our consumer care team responds to consumer issues from our user community.
In addition, our Zillow Offers consumer care team works with consumers during the home selling process as the main point of
contact for consumers, helping coordinate a transaction between the consumer and the local agent representing Zillow, or
providing Premier Agents with listing appointment opportunities. The Zillow Offers consumer care teams are located in Seattle,
Washington, Denver, Colorado, Atlanta, Georgia, and Dallas, Texas.
Technology and Infrastructure
Zillow Group is a data- and technology-driven company. Our technical infrastructure, mobile applications and websites
are built to provide consumers and real estate, rental and mortgage professionals with access to rich real estate data and
powerful online tools to help them accomplish their home-related goals. Our success depends on our ability to innovate and
enhance our products and services, adapt to changes in technology, and support new devices and operating systems.
Research and development costs are expensed as incurred and are recorded in technology and development expenses. For
the years ended December 31, 2018, 2017 and 2016, expenses attributable to research and development for our business totaled
$298.1 million, $193.0 million and $170.1 million, respectively. We expect to continue making significant investments in
research and development as we explore new ways to deliver greater value to our consumer users and advertiser customers. For
information about our research and development costs, see Note 2 of the accompanying notes to our consolidated financial
statements included within this annual report.
Many of our services are available through real-time web-based application programming interfaces that allow our
information to be easily integrated into third-party websites. We provide HTML and JavaScript-based widgets to allow easy
integration of Zillow Group information onto other websites, with little custom programming. Our technology platform is built
using industry-leading third-party and internally developed software as well as open source technologies. This combination
allows for rapid development and release of high-performance software in a cost-effective and scalable manner. Our mobile
applications and websites are designed to have high availability, from the internet connectivity providers we choose, to the
servers, databases and networking hardware that we deploy. We design our systems so that the failure of any individual
component is not expected to affect the overall availability of our platform. We also leverage content delivery networks and use
other third-party cloud computing services, including map-related and ad serving services, to ensure fast and local access to
content. We employ a host of encryption, antivirus, firewall, monitoring, and patch-management technology to protect and
maintain our systems.
To deliver web and mobile Zillow Group brand content while ensuring scalability and redundancy, we utilize both third-
party web services for cloud computing and storage and shared data centers in Seattle, Washington and Santa Clara, California.
Intellectual Property
We protect our intellectual property through a combination of trademarks, trade dress, domain names, copyrights, trade
secrets and patents, as well as contractual provisions and restrictions on access to our proprietary technology.
Our trademarks registered in the United States and several other jurisdictions include, but are not limited to, “Zillow,”
“Trulia,” “Zestimate,” “Premier Agent,” “Make Me Move,” “Mortech,” “Marksman,” “Hotpads,” “StreetEasy,” “dotloop,”
“Find Your Way Home,” “Naked Apartments,” “New Home Feed,” the Z in a house logo, the Trulia marker logo, as well as
logos that correspond with several of our other trademarks. We also have filed other trademark applications, including an
16
application for “Zillow Offers,” in the United States and certain other jurisdictions and will pursue additional trademark
registrations to the extent we believe it will be beneficial and cost-effective.
We are the registered holder of a variety of domestic and international domain names that include, but are not limited to,
“Zillowgroup.com,” “Zillow.com,” “Trulia.com,” “RealEstate.com,” “Mortech.com,” “HotPads.com,” “Streeteasy.com,”
“DotLoop.com,” “Retsly.com,” “NakedApartments.com,” “BridgeInteractive.com,” “NewHomeFeed.com,”
“Mortgagelendersofamerica.com,” and other similar variations. We view the strength of brand awareness and loyalty with
respect to both our consumer- and business-facing brands as a key differentiator. As a result, our ability to protect these
intellectual property assets is very important to our business.
We have 28 patents of varying lengths issued in the United States and internationally. These patents cover proprietary
techniques that relate to determining a current value for a real estate property, performing summarization of geographic data
points in response to zoom selection, the incorporation of individual aerial images and incorporating visual information into a
master planar image, the collection, storage and display of home attribute values, providing for a multi-faceted search, and
other proprietary techniques relevant to our products and services. Our Zestimate home valuation, for example, which we
consider to be a significant competitive advantage with respect to consumer engagement, is currently protected by a patent. We
have 47 patent applications pending in the United States and internationally, which seek to cover proprietary techniques
relevant to our products and services. We intend to pursue additional patent protection to the extent we believe it will be
beneficial and cost-effective.
In addition to the protection provided by our intellectual property rights, we enter into confidentiality and proprietary
rights agreements with our employees, consultants, contractors and business partners. Our employees and contractors are also
subject to invention assignment provisions. We further control the use of our proprietary technology and intellectual property
through provisions in both our general and product-specific terms of use on our mobile applications and websites.
Competition
We face competition to attract consumers to our mobile applications, websites, and services and to attract advertisers to
purchase our advertising products and services.
Competition for Consumers
Our business model depends on our ability to attract consumers to our mobile applications, websites, and services and
enhance their engagement with our products and services in a cost-effective manner. New entrants join the categories in which
we operate at a rapid pace. Our competitors include companies that provide, or could develop, technology, products and
services for real estate, rental, new construction and mortgage professionals and other residential real estate market participants,
including operators of mobile applications and websites. We also compete with companies and individuals purchasing and
selling homes in the metropolitan areas where we offer our Zillow Offers service and with companies originating mortgage
loans in the states in which MLOA is a licensed lender. We compete for consumers primarily on the basis of the quality of the
consumer experience, the utility of the data and services we provide, the breadth, depth and accuracy of information, brand
awareness and reputation, and the value we offer to home buyers and sellers. We believe we compete favorably on these
factors.
Competition for Advertisers
We face intense competition from traditional and online or mobile media sources to attract advertisers. Online and on
mobile, we compete with website operators dedicated to providing real estate, rental, new construction, and mortgage
information and services to real estate professionals and consumers, local brokerage sites and major internet portals, general
search engines, e-commerce, and social media sites, as well as other technology and media companies. We also compete for a
share of advertisers’ overall marketing budgets with traditional media such as television, magazines, newspapers and
home/apartment guide publications, particularly with respect to advertising dollars spent at the local level by real estate
professionals to advertise their qualifications and listings. We compete for advertising revenue based on perceived return on
investment and perceived transaction readiness and overall quality of consumer leads, the effectiveness and relevance of our
17
advertising products, pricing structure and our ability to effectively deliver types of ads to targeted demographics. We believe
we compete favorably on these factors.
Government Regulation
We operate in an increasingly complex legal and regulatory environment. Our business and the products and services that
we offer are affected by a continually expanding and evolving range of local, state, federal, and international laws and
regulations.
Our IMT segment, which includes the provision of advertising services, marketing software, and technology solutions to
businesses and professionals primarily associated with the residential real estate, rental and mortgages industries, is subject to a
variety of laws and regulations relating to the collection, use, and disclosure of data collected from our users, including those
promulgated and enforced by the U.S. Federal Trade Commission and certain states, such as the California Consumer Privacy
Act of 2018, which we expect to come into effect on January 1, 2020. Additionally, laws, regulations, and standards covering
marketing and advertising activities conducted by telephone, email, mobile devices, and the internet, may be applicable to our
business, such as the Telephone Consumer Protection Act, the Telemarketing Sales Rule, the CAN-SPAM Act, and similar state
consumer protection laws.
By providing a medium through which users can post content and communicate with one another, we may also be subject
to laws governing intellectual property ownership, obscenity, libel, and privacy, among other issues. In addition, the real estate
agents, mortgage professionals, banks, property managers, rental agents and certain of our other customers and advertisers are
subject to various state and federal laws and regulations, including, but not limited to those relating to real estate, rentals and
mortgages, which may impact their use of our mobile applications and websites. We endeavor to ensure that any content
created by Zillow Group is consistent with such laws and regulations by obtaining assurances of compliance from our
advertisers and consumers for their activities through, and the content they provide on, our mobile applications and websites.
Certain of our mortgage marketing products are operated by our wholly owned subsidiary, Zillow Group Marketplace,
Inc. (formerly Zillow Group Mortgages, Inc.), a licensed mortgage broker, and in October 2018 we completed the acquisition
of MLOA, a licensed mortgage lender, through which we originate residential mortgages. Mortgage products are regulated at
the state level by licensing authorities and administrative agencies, with additional oversight from the Bureau of Consumer
Financial Protection (“BCFP”) and other federal agencies. Zillow Group Marketplace, Inc. and MLOA are subject to stringent
state and federal laws and regulations and to the scrutiny of state and federal government agencies as a licensed mortgage
broker and licensed mortgage lender, respectively, including numerous consumer protection laws.
As a buyer and seller of residential real estate through our Zillow Offers business, we may be subject to additional local,
state and federal laws and regulations governing such transactions, including those administered by the BCFP, the Department
of Housing and Urban Development, and the states and municipalities in which we transact.
The real estate, mortgages, and rentals industries in which we operate and provide services are subject to significant state,
local and federal laws and regulation, and certain of our activities may be deemed to be covered by these industry-specific laws
and regulations. Since the laws and regulations governing real estate, rentals and mortgages are constantly evolving and
striving to keep pace with innovations in technology and media, it is possible that we may have to materially alter the way we
conduct some parts of our business activities or be prohibited from conducting such activities altogether at some point in the
future. See “Risk Factors” for a discussion of our regulatory risks.
Employees
As of December 31, 2018, we had 4,336 full-time employees.
18
Where You Can Find More Information
Our filings with the Securities and Exchange Commission, or SEC, including our annual reports on Form 10-K, quarterly
reports on Form 10-Q, current reports on Form 8-K, and amendments to those reports, are available on the “Investors” section
of our website at www.zillowgroup.com, free of charge, as soon as reasonably practicable after the electronic filing of these
reports with the SEC. The information contained on our website is not a part of this Annual Report on Form 10-K or any other
document we file with the SEC.
Investors and others should note that Zillow Group announces material financial information to its investors using its
press releases, SEC filings and public conference calls and webcasts. Zillow Group intends to also use the following channels
as a means of disclosing information about Zillow Group, its services and other matters and for complying with its disclosure
obligations under Regulation FD:
• Zillow Group Investor Relations Webpage (http://investors.zillowgroup.com)
• Zillow Group Investor Relations Blog (http://www.zillowgroup.com/ir-blog)
• Zillow Group Twitter Account (https://twitter.com/zillowgroup)
The information Zillow Group posts through these channels may be deemed material. Accordingly, investors should
monitor these channels, in addition to following Zillow Group’s press releases, SEC filings and public conference calls and
webcasts. This list may be updated from time to time. The information we post through these channels is not a part of this
Annual Report on Form 10-K or any other document we file with the SEC, and the inclusion of our website addresses and
Twitter account are as inactive textual references only.
Item 1A. Risk Factors.
Our business is subject to numerous risks. You should carefully consider the following risk factors, as any of these risks
could harm our business, results of operations, and future financial performance. Recovery pursuant to our insurance policies
may not be available due to policy definitions of covered losses or other factors, and available insurance may be insufficient to
compensate for damages, expenses, fines, penalties, and other losses we may incur as a result of these and other risks. In
addition, risks and uncertainties not currently known to us or that we currently deem to be immaterial may materially adversely
affect our business, financial condition and operating results. If any of these risks occur, the trading price of our common and
capital stock could decline, and you could lose all or part of your investment.
Risks Related to Our Business and Industry
If Real Estate, Rental and Mortgage Professionals, Home Builders or Other Advertisers Reduce or End Their Advertising
Spending With Us or if We Are Unable to Effectively Manage Advertising Inventory or Pricing, Our Business Would Be
Harmed.
Our current financial model depends in due part on revenue generated primarily through sales of advertising products and
services to real estate agents and brokerages, rental professionals, mortgage professionals, home builders, and other advertisers
in categories relevant to real estate. Our ability to attract and retain advertisers, and ultimately to generate advertising revenue,
depends on a number of factors, including how successfully we can:
• increase the number of consumers who use our products and services, provide them with tools to promote engagement
between real estate market participants, and enhance their user experience so we can retain them;
• offer an attractive return on investment to our advertisers for their advertising spending with us;
• continue to develop our advertising products and services to increase adoption by and engagement with advertising
customers;
• keep pace with and anticipate changes in technology to provide industry-leading products and services to advertisers
and consumers; and
• compete effectively for advertising dollars with other online media companies.
19
Premier Agent revenue, derived from our flagship Premier Agent program and Premier Broker program, accounted for
67% of total revenue for the year ended December 31, 2018. This level of revenue concentration suggests that even modest
decreases in individual agent advertiser spending across the advertiser population, caused by actual or perceived decreases to
return on investment, preference for a competitive service, or other factors, could have a significant negative impact on our
results of operations. We do not have long-term contracts with most of our advertisers. Our advertisers could choose to modify
or discontinue their relationships with us with little or no advance notice. For example, our auction-based account interface for
Premier Agent advertisers allows agent advertisers to independently control the duration of their advertising commitments. We
may not succeed in retaining existing advertisers’ spending or capturing a greater share of such spending if we are unable to
convince advertisers of the effectiveness or superiority of our products as compared to alternatives, including traditional offline
advertising media such as television and newspapers. In addition, we continually evaluate and utilize various pricing and value
delivery strategies in order to better align our revenue opportunities with the growth in usage of our mobile and web platforms.
In 2016, for example, we implemented a new auction-based pricing method for our Premier Agent products, and in the second
quarter of 2018, we began testing a new form of lead validation and distribution related to our auction-based pricing model
whereby the share of voice purchased by Premier Agents and Premier Brokers represents both the share of impressions
delivered as advertisements appearing on pages viewed by users of our mobile applications and websites, as well as the
proportion of validated consumer connections a Premier Agent or Premier Broker receives. These changes combined with other
market factors led to an increase in cost-per-lead and a decrease in leads delivered to certain advertisers in the third quarter of
2018, which resulted in higher than expected advertiser churn. Future changes to our pricing or lead delivery methodologies for
advertising services or product offerings may cause advertisers to reduce or end their advertising with us or negatively impact
our ability to manage revenue opportunities. If advertisers reduce or end their advertising spending with us, or if we are unable
to effectively manage inventory and pricing, our advertising revenue and business, results of operations and financial condition
would be harmed.
If We Do Not Innovate or Provide High-Quality Products and Services on Mobile and the Web That Are Attractive to Our
Users and to Our Advertisers, Our Business Could Be Harmed.
Our success depends on our continued innovation to provide new, and improve upon existing, products and services that
make our mobile applications, websites and other products and services useful for consumers and real estate, rental and
mortgage professionals, and attractive to our advertisers. As a result, we must continually invest significant resources in
research and development to improve the attractiveness and comprehensiveness of our products and services, adapt to changes
in technology, and support new devices and operating systems. If we are unable to provide products and services that users,
including real estate professionals, want to use, on the devices they prefer, then users may become dissatisfied and use
competitors’ mobile applications, websites, products and services. If consumers begin to access real estate information and
services through other media and we fail to innovate, our business may be negatively impacted. If we are unable to continue
offering high-quality, innovative products and services, we may be unable to attract additional users and advertisers or retain
our current users and advertisers, which could harm our business, results of operations and financial condition.
We Face Competition for Consumers in the Real Estate Category, Which Could Impair Our Ability to Attract Users of Our
Mobile Applications, Websites and Other Products and Services, Which Would Harm Our Business, Results of Operations
and Financial Condition.
Our business model depends on our ability to continue to attract consumers to our mobile applications, websites and other
services and enhance their engagement with our products and services in a cost-effective manner. New entrants continue to join
the category at a rapid pace. Our existing and potential competitors include companies that operate, or could develop, national
and local real estate, rental, new construction and mortgage mobile applications and websites. Such competitors range from
companies offering traditional offline advertising media, like newspapers, to new mobile- or web-only technology companies.
These companies could devote greater financial, technical and other resources than we have available to sales, advertising, or
research and development, have a more accelerated time frame for deployment, or leverage their existing user bases and
proprietary technologies to provide products and services that consumers might view as superior to our offerings. Any of our
future or existing competitors may introduce different solutions that attract consumers or provide solutions similar to our own
but with better branding or marketing resources. If we are not able to continue to attract consumers to our mobile applications,
websites and other services, our business, results of operations and financial condition would be harmed.
20
We May Not Be Able to Compete Successfully Against Our Existing or Future Competitors in Attracting Advertisers, Which
Could Harm Our Business, Results of Operations and Financial Condition.
We face intense competition from traditional and online or mobile media sources to attract advertisers. Online and on
mobile, we compete against websites dedicated to providing real estate, rental, new construction, and mortgage information and
services to real estate professionals and consumers, major internet portals, general search engines, e-commerce, and social
media sites, as well as other technology and media companies. We also compete for a share of advertisers’ overall marketing
budgets with traditional media such as television, magazines, newspapers and home/apartment guide publications, particularly
with respect to advertising dollars spent at the local level by real estate professionals to advertise their qualifications and
listings. Large companies with significant brand recognition have large numbers of direct sales personnel and substantial
proprietary advertising inventory and web traffic, which may provide a competitive advantage. To compete successfully for
advertisers against future and existing competitors, we must continue to invest resources in developing our advertising platform
and proving the effectiveness and relevance of our advertising products and services. Pressure from competitors seeking to
acquire a greater share of our advertisers’ overall marketing budget could adversely affect our pricing and margins, lower our
revenue, and increase our research and development and marketing expenses. If we are unable to compete successfully against
our existing or future competitors, our business, results of operations or financial condition would be harmed.
We Compete in a Dynamic Industry, and We May Invest Significant Resources to Pursue Strategies and Develop New
Products and Services That Do Not Prove Effective.
The industry for residential real estate technology, information marketplaces, services, and advertising is dynamic, and
the expectations and behaviors of consumers and professionals shift constantly and rapidly. We continue to learn a great deal
about the behaviors and objectives of residential real estate market participants as the industry evolves and are investing
significant resources to develop, test, and launch products and services to address the needs of the market and improve the
homebuying, selling, financing, building, and renting experience. Changes or additions to our products and services may not
attract or engage our users, and may reduce confidence in our products and services, negatively impact the quality of our
brands, upset other industry participants, expose us to increased market or legal risks, subject us to new laws and regulations, or
otherwise harm our business. For example, our Zillow Offers service, which allows home sellers to request an offer from
Zillow to purchase their home, may not engage home sellers as we think it will. Further, if we do not realize the benefits we
expect from strategic relationships we enter into, including for example, the generation of additional advertising revenue
opportunities, our business could be harmed. We may not successfully anticipate or keep pace with industry changes, and we
may invest considerable financial, personnel, and other resources to pursue strategies that do not, ultimately, prove effective
such that our results of operations and financial condition may be harmed.
Zillow Offers Could Fail to Achieve Expected Results and Cause Harm to Our Financial Results, Operations, and
Reputation.
Beginning in April 2018, Zillow purchases homes, makes certain repairs and updates, and attempts to sell the homes back
into the market through its Zillow Offers service (the “Homes business”). This initiative may expose us to a variety of financial,
legal, and reputational risks. The success of the Homes business depends in part on our ability to efficiently acquire, renovate,
and sell properties. In determining whether to purchase a property, we may make assumptions, including the estimated time
from purchase to sale, update costs, market conditions and potential resale proceeds, closing costs, and holding costs. These
assumptions may be inaccurate. Our estimates of what homes are worth may not be accurate, and we may pay more for homes
than the price at which we are able to resell them. In addition, we may not timely discover latent home construction or
environmental hazards or other issues which may decrease the value of properties we own. As a result, we may not be able to
resell them for the price we anticipated or at all. Further, homes we purchase may suffer decreases in value due to natural
disasters, catastrophic events, or other forces outside of our control. The homes we own may not be insured against all damages
and losses.
We may compete with other purchasers for the acquisition of properties, and some of those competitors may be willing to
pay more for such homes than we are or have greater financial or other resources than we do. Competition for the purchase of
homes may result in our purchase of fewer properties, higher purchase prices, and lower margins - or losses - realized on the
sale of our homes.
21
The supply of and demand for homes, and the amounts prospective homebuyers are willing to pay for properties, are
impacted by the strength of the overall economy, employment levels, availability of credit, tax or other governmental incentives
that encourage homeownership, and regulation of mortgage interest rates, among other factors. Changes to these factors may
negatively impact our ability to purchase a sufficient number of properties to realize benefits of scale and sell properties at the
amounts we anticipated, if at all.
The actual or perceived quality of the homes we sell may be poor due to factors both within and beyond our control, such
as our decision to make certain upgrades but not others and latent defects in properties of which we are not aware. Properties
may experience unsafe conditions while we own them or soon after we resell them, which may cause harm to person or
property. We may be subject to new legal, regulatory, local ordinance, and other requirements, as well as disputes with
consumers, service providers, and others arising from our purchase, renovation, or resale of properties. These and other factors
may reduce consumer confidence in our services and negatively impact our business reputation.
We use local and national third-party vendors and service providers to make upgrades to and perform maintenance on
homes, and we can provide no assurances that we will have uninterrupted or unlimited access to their services or that we will
be able to effectively control the timing and costs of their projects. If we do not select and maintain appropriate third parties to
provide these services, our reputation and financial results may suffer.
We attempt to ensure that our properties are adequately insured to cover casualty losses while we hold them. However,
there are certain losses, including losses from floods, fires, earthquakes, wind, pollution, certain environmental hazards,
security breaches, and others for which we may not be insured because it may not be deemed economically feasible or prudent
to do so, among other reasons. Any losses resulting from lack of insurance coverage could cause our financial results to suffer.
We have limited experience purchasing, upgrading, and selling homes, and our forecasts of financial results for this new
business segment may vary significantly from our actual results. The accounting treatment, operational demands, and other
aspects of the Homes business are very different from our Internet, Media, and Technology (“IMT”) business and may impact
our overall results in ways that are difficult to predict.
Our Entry into the Mortgage Lending Business Could Fail to Achieve Expected Results and Cause Harm to Our Financial
Results, Operations, and Reputation.
In October 2018, we completed the acquisition of Mortgage Lenders of America, L.L.C. (“MLOA”), a licensed mortgage
lender. This acquisition and our operation of a mortgage lending business may expose us to a variety of financial, legal, and
reputational risks. MLOA has historically funded its lending operations using its warehouse credit facilities, intending to sell all
loans and corresponding servicing rights to third-party financial institutions after a holding period. Sales of loans to third
parties are subject to origination quality standards, investor guidelines, and applicable laws, and these institutions still retain
contractual and other rights to reject the loans after they are sold. If MLOA is unable to sell its loans or is required to
repurchase the loans from third parties due to representation and warranty or other claims, MLOA may be required to hold the
loans for investment or sell them at a discount.
Additionally, for residential mortgage loans that we originate, MLOA is required to comply with complex mortgage
regulations, laws, and third-party guidelines. Borrowers may allege that the origination of the loans did not comply with
applicable laws or regulations in one or more respects and assert such violation as an affirmative defense to payment or in an
action seeking statutory and other damages in connection with such violation. If we are not successful in demonstrating that the
loans in dispute were originated in accordance with applicable statutes and regulations, we could become subject to monetary
damages and other civil penalties. Similarly, the third-party financial institutions to whom we sell the loans may claim that the
origination of the loans did not comply with the terms of our agreements or applicable guidelines, laws or regulations, and may
require MLOA to repurchase loans upon discovery of a breach. In addition, the government sponsored entities that insure some
of the loans that MLOA originates may allege that the loans do not comply with the terms of their programs or applicable
guidelines, laws or regulations, and may require MLOA to indemnify them for losses incurred in connection with such loans.
22
Historically, MLOA has offered a limited number of mortgage products to consumers under conventional and
government guaranteed loan programs. If these programs do not meet the financing needs of our consumers, and we do not
adapt to market changes and consumer preferences, consumers may opt to obtain financing from other lenders who offer
different or more competitive loan products, including second mortgages, reverse mortgages, home equity lines of credit, or
higher priced mortgage loans. Similarly, if any of the government sponsored entities amend the terms of an existing loan
program, cease offering the program, limit our ability to use the program in connection with our Zillow Offers business, or
revoke the authority of MLOA to offer such programs, we may have to make changes to or discontinue the mortgage products
that we offer, which may negatively affect our business.
We may use derivatives and other instruments to hedge our mortgage lending interest rate risk. We may not hedge all of
our risk, and we may not be successful in hedging any of the risk. Hedging is a complex process, requiring sophisticated
models and constant monitoring. We may hedge our interest rate risk by utilizing forward loan sale commitments which may
not adequately mitigate the impact of changes in interest rates. We could incur losses from our hedging activities. There may be
periods where we elect not to use derivatives and other instruments to hedge mortgage lending interest rate risk.
Our recent entry into the mortgage lending business may also cause a negative reaction within the mortgage industry,
including among some of our mortgage advertisers, which could harm our reputation, results of operations and financial
condition.
We Depend on the Real Estate Industry, and Changes to That Industry, Including to Supply and Demand in the Real Estate
Market or Mortgage Lending Regulation, Could Reduce the Demand for, or Restrict Our Ability to Provide, Our Products
and Services.
Our financial results significantly depend on real estate market participants using our products and services. Real estate
shopping patterns depend on the overall health of the real estate market. Changes to the regulation of the real estate industry,
including mortgage lending, may negatively impact the prevalence of home ownership, the amount home buyers are willing
and able to spend, and the ability of market participants to close transactions.
Changes to the real estate industry, including to supply and demand in the real estate market, regulation of rental
properties, or mortgage interest rates, could reduce demand for our services. In addition, real estate, rental, and mortgage
professionals are subject to comprehensive, and rapidly evolving, federal, state, and local laws and regulations which may
cause them to significantly alter, decrease, or terminate their purchase of our products and services. Seasonality, micro- and
macroeconomic factors, government regulation, tax laws, and other factors may decrease consumer usage as well as sales to
our advertisers and other customers, which could harm our results of operations and financial condition.
Certain of our mortgage marketing products are operated by our wholly owned subsidiary, Zillow Group Marketplace,
Inc. (formerly Zillow Group Mortgages, Inc.), a licensed mortgage broker, and in October 2018 we completed the acquisition
of MLOA, a licensed mortgage lender, through which we originate residential mortgages. Zillow Group Marketplace, Inc. and
MLOA are subject to stringent state and federal laws and regulations and to the scrutiny of state and federal government
agencies as a licensed mortgage broker and licensed mortgage lender, respectively. Further, due to the geographic scope of our
operations and the nature of the services we provide, we maintain real estate brokerage, mortgage broker, and mortgage lender
licenses in certain states in which we operate, including in connection with Zillow Offers. In connection with such licenses, we
are required to designate individual licensed brokers of record, qualified individuals and control persons. We cannot assure you
that we, or our licensed personnel, are and will remain at all times, in full compliance with state and federal real estate and
mortgage licensing laws and regulations and we may be subject to fines or penalties in the event of any non-compliance. If in
the future a state agency were to determine that we are required to obtain additional licenses in that state in order to operate our
business, or if we lose or do not renew an existing license or are otherwise found to be in violation of a law or regulation, we
may be subject to fines or legal penalties, lawsuits, enforcement actions, or our business operations in that state may be
suspended or prohibited. Compliance with these laws and regulations is complicated and costly and may inhibit our ability to
innovate or grow. Any failure to comply with applicable laws and regulations may limit our ability to expand into new markets,
offer new products or continue to operate in one or more of our current markets.

23
Natural Disasters and Catastrophic Events May Disrupt Real Estate Markets and our Business.
The occurrence of a significant natural disaster or other catastrophic event, such as earthquake, hurricane, fire, flood,
terrorist attack or other similar event, may damage or disrupt our operations, local and regional real estate markets or
economies, and negatively impact our business, results of operations and financial condition. Our largest offices are located in
Seattle, Washington, Denver, Colorado, and San Francisco, California, and our mortgage origination business is located in
Overland Park, Kansas; an earthquake or other natural disaster in any of these cities could disrupt our engineering, sales and/or
mortgage origination teams and equipment critical to the operation of our business. Similarly, a significant natural disaster or
other catastrophic event in any major U.S. city could negatively impact a large number of our advertisers and users, and cause a
decrease in our revenue or traffic. For example, in connection with the hurricanes and wildfires that occurred during the second
half of 2017, we worked closely with our Premier Agents and other advertisers in affected areas to help manage their
advertising budgets, and we provided relief initiatives, which included billing credits and other forms of advertiser assistance.
We also experienced a temporary decline in traffic to our mobile applications and websites from consumers in impacted areas
during September 2017. Though our relief initiatives and the temporary decline in traffic did not have a material impact on our
results of operations and financial condition for 2017, our results of operations and financial condition may be negatively
affected by natural disasters in the future. In addition, through Zillow Offers, Zillow purchases, updates and sells homes in
certain metropolitan areas, and through MLOA, we originate loans in over 40 states. The occurrence of a natural disaster or
other catastrophic event in any of these localities could have a significant negative impact on those real estate markets and the
success of our Homes and mortgage origination businesses in the affected regions.
We May Not Be Able to Maintain or Establish Relationships With Real Estate Brokerages, Real Estate Listing Aggregators,
Multiple Listing Services, Property Management Companies, Home Builders and Other Third-Party Listing Providers,
Which Could Limit the Information We Are Able to Provide to Our Users.
Our ability to attract users to our mobile applications, websites and other tools depends to some degree on providing
timely access to comprehensive and accurate for-sale, new construction and rental listings. To provide these listings, we
maintain relationships with real estate brokerages, real estate listing aggregators, multiple listing services (“MLSs”), property
management companies, home builders, other third-party listing providers, and homeowners and their real estate agents to
include listing data in our services. Many of our agreements with real estate listing providers are short-term agreements that
may be terminated with limited notice. Many of our competitors and other real estate websites have similar access to MLSs and
listing data, and may be able to source real estate information faster or more efficiently than we can. Another industry
participant or group could create a new listings data service, which could impact the relative quality or quantity of information
of our listing providers. The loss of existing relationships with MLSs and other listing providers, whether due to termination of
agreements or otherwise, changes to our rights to use or timely access listing data, or an inability to continue to add new listing
providers or changes to the way real estate information is shared, may negatively impact our listing data quality. This could
reduce user confidence in the sale and rental data we provide and make us less popular with consumers, which could harm our
business, results of operations and financial condition.
We May Not Be Able to Maintain or Establish Relationships With Data Providers, Which Could Limit the Information We
Are Able to Provide to Our Users and Impair Our Ability to Attract or Retain Users.
We obtain real estate data, such as transaction history, property descriptions, tax-assessed value and property taxes paid,
under licenses from third-party data providers. We use this data to enable the development, maintenance and improvement of
our marketplace and information services, including Zestimates, Rent Zestimates and our living database of homes. We have
invested significant time and resources to develop proprietary algorithms, valuation models, software and practices to use and
improve on this specific data. We may be unable to renew our licenses with these data providers, enter into new data license
agreements, or we may be able to do so only on terms that are less favorable to us, which could harm our ability to continue to
develop, maintain and improve these information services and could harm our business, results of operations and financial
condition.

24
If Our Data Integrity Suffers Real or Perceived Harm, Consumers and Advertisers May Decrease Use or Cease Using Our
Products and Services, and We May Be Subject to Legal Liability.
Because homes represent significant investments, and many consumer decisions regarding homes are data-driven, our
ability to attract and retain users and advertisers to our information products and services is dependent upon our ability to
publish, and reputation for publishing, accurate and complete residential real estate information through our mobile
applications and websites. As discussed above, a significant amount of the data we publish on our mobile applications and
websites are licensed from third parties, and we have limited ability to control the quality of the information we receive from
them. We also publish a significant amount of user-generated content, and our tools and processes designed to ensure the
accuracy, quality, and legality of such content may not always be effective. Data we generate independently are subject to error,
unauthorized modification by way of third-party viruses, and other factors. As the volume of data we publish increases, and
potential threats to data quality become more complex, the risk of harm to our data integrity also increases. If our data integrity
suffers real or perceived harm, we may be subject to legal liability, and consumers and advertisers may decrease their use or
cease using our products and services, which would harm our results of operations and financial condition.
Our Dedication to Making Decisions Based Primarily on the Best Interests of Consumers May Cause Us to Forgo Short-
Term Gains.
Our guiding principle is to build our business by making decisions based primarily on the best interests of consumers,
which we believe has been essential to our success in increasing our user growth rate and engagement and has served the long-
term interests of our company and our shareholders. In the past, we have forgone, and we will in the future forgo, certain
expansion or short-term revenue opportunities that we do not believe are in the best interests of consumers, even if such
decisions negatively impact our short-term results of operations. In addition, our philosophy of putting consumers first may
negatively impact our relationships with our existing or prospective advertisers. This could result in a loss of advertisers, which
could harm our revenue and results of operations. For example, we believe that some real estate agents have chosen not to
purchase our Premier Agent advertising product because we display a Zestimate on their for-sale listings. We believe, however,
that it is valuable to consumers to have access to a valuation starting point on all homes and so we display a Zestimate on every
home in the Zillow database for which we have sufficient data to produce the Zestimate. Our consumer focus may also
negatively impact our relationships with real estate brokerages, MLSs, and other industry participants on whom we rely for
listings information. Our Zillow Offers product and our acquisition of MLOA, for example, may be perceived as impinging
upon the business models of real estate agents, brokerages and lenders, which may cause them to terminate their listings
agreements with us or, with respect to brokerages and lenders, cease advertising with us. Such risks could have a materially
negative impact on our results of operations. Our principle of making decisions based primarily on the best interests of
consumers may not result in the long-term benefits that we expect, in which case our user traffic and engagement, business and
results of operations could be harmed.
We Are Subject to Disputes Regarding the Accuracy or Display of Our Zestimates and Rent Zestimates.
We provide our users with Zestimate and Rent Zestimate home and rental valuations. Zestimates are our estimated
current market values of a home based on our proprietary automated valuation models that apply advanced algorithms to
analyze our data; they are not appraisals. A Rent Zestimate is our estimated current monthly rental price of a home, using
similar automated valuation models that we have designed to address the unique attributes of rental homes. We are, from time
to time, involved in disputes with property owners and others who disagree with the accuracy or display of a Zestimate or Rent
Zestimate, and such disputes may result in costly litigation in the future. Further, revisions to our automated valuation models,
or the algorithms that underlie them, poor data quality, or other factors may cause certain Zestimates or Rent Zestimates to vary
from expectations for those Zestimates or Rent Zestimates. Any such dispute or variation in Zestimates or Rent Zestimates
could result in distraction from our business or potentially harm our reputation and financial condition.
We Rely on Internet Search Engines and Mobile Application Marketplaces to Connect with Consumers.
We rely on organic traffic generated from search engines like Google to attract users to our websites. This organic traffic
is dependent in part upon the way in which links to and information from our websites are featured on search engine result
pages. The ranking and other display features of links to and information from our websites is impacted by a variety of factors,
25
many of which are not within our control, such as a change to the search engine ranking algorithm. We devote significant time
and resources to digital marketing initiatives, such as search engine optimization, to improve our search result rankings and
increase visits to our sites. These marketing efforts may prove unsuccessful due to a variety of factors, including increased costs
to use online advertising platforms, ineffective campaigns and increased competition. We also rely on mobile application
marketplaces like Apple’s App Store and Google Play to connect users with our mobile applications. These marketplaces may
change in a way that negatively affects the prominence of or ease with which users can access our mobile applications. Such
changes to Internet search engines or mobile application marketplaces may adversely impact our ability to connect with
consumers, which could have a material negative effect on our results of operations and financial condition.
We May Be Unable to Increase Awareness of the Zillow Group Brands Cost-effectively, Which Could Harm Our Business.
We believe the Zillow Group brands, including Zillow and Trulia, are key assets of our company. Awareness and
perceived quality and differentiation of the Zillow Group brands are important aspects of our efforts to attract and expand the
number of consumers who use our mobile applications and websites. Should the competition and costs for awareness and brand
preference increase among providers of mobile or online real estate information, we may not be able to successfully maintain
or enhance the strength of our brand. We expect to continue to invest in our paid advertising to increase brand awareness and
grow traffic. Paid advertising may not continue to be successful or cost-effective. If we are unable to maintain or enhance user
and advertiser awareness of our brands cost-effectively, or if we are unable to recover our additional marketing and advertising
costs through increased usage of our products and services, our business, results of operations and financial condition could be
harmed.
If We Fail to Manage Our Growth and Multi-Brand Portfolio Effectively, Our Reputation, Results of Operations and
Business Could Be Harmed.
We have experienced rapid and significant growth in our headcount and related operations, including as a result of the
February 2015 Trulia acquisition and other acquisitions. We have also acquired or launched several new business-to-consumer
and business-to-business brands in recent years, including the October 2018 acquisition of MLOA, a consumer-facing
mortgage lending business, the April 2018 launch of Zillow Offers, the 2017 acquisition of New Home Feed, a listing
management technology company, and the launch of OutEast.com, a consumer-facing website for real estate in the Hamptons.
This growth adds complexity to business operations, including internal controls and compliance, and places substantial demand
on management and our operational infrastructure. As we continue to grow, we must effectively integrate, develop and motivate
a large number of new employees, while maintaining the beneficial aspects of our company culture, and successfully manage a
diverse portfolio of brands. If we do not manage the growth of our business and operations effectively, the quality of our
services and efficiency of our operations could suffer, which could harm our brand, results of operations and overall business.
We Rely on the Performance of Highly Skilled Personnel, and if We Are Unable to Attract, Retain and Motivate Well-
Qualified Employees, Our Business Could Be Harmed.
We believe our success has depended, and continues to depend, on the efforts and talents of our management and our
highly skilled team of employees, including our software engineers, statisticians, marketing professionals and advertising sales
staff. Our future success depends on our continuing ability to attract, develop, motivate and retain highly qualified and skilled
employees. The loss of any of our senior management or key employees could materially adversely affect our ability to build
on the efforts they have undertaken and to execute our business plan, and we may not be able to find adequate replacements.
The market for highly skilled personnel is very competitive. We cannot ensure that we will be able to retain the services of any
members of our senior management or other key employees. If we do not succeed in attracting well-qualified employees or
retaining and motivating existing employees in a cost-effective manner, our business could be harmed.
We May Make Acquisitions and Investments, Which Could Result in Operating Difficulties, Dilution and Other Harmful
Consequences.
We continue to evaluate a wide array of potential strategic opportunities, including acquisitions and investments. For
example, we acquired MLOA in October 2018, and acquired Hamptons Real Estate Online, or HREO, and New Home Feed,
and purchased an equity interest in a privately held corporation, in the year ended December 31, 2017. Any transactions that we
enter into could be material to our financial condition and results of operations. The acquisitions may not result in the intended

26
benefits to our business, and we may not successfully evaluate or utilize the acquired products, technology, or personnel, or
accurately forecast the financial impact of an acquisition transaction. The process of integrating an acquired company, business
or technology could create unforeseen operating difficulties and expenditures. The areas where we face risks include:
• diversion of management time and focus from operating our business to acquisition integration challenges;
• consumer and industry acceptance of products and services offered by the acquired company;
• implementation or remediation of controls, procedures and policies at the acquired company;
• coordination of product, engineering and sales and marketing functions;
• retention of employees from the acquired company;
• liability for activities of the acquired company before the acquisition;
• litigation or other claims arising in connection with the acquired company; and
• impairment charges associated with goodwill and other acquired intangible assets.
For example, during the year ended December 31, 2018, we recognized a non-cash impairment charge of $10.0 million
related to a June 2017 equity investment and a non-cash impairment for $69.0 million related to the indefinite-lived Trulia trade
names and trademarks intangible asset.
Our failure to address these risks or other problems encountered in connection with our past or future acquisitions and
investments could cause us to fail to realize the anticipated benefits of such acquisitions or investments, incur unanticipated
liabilities, and harm our business, results of operations and financial condition.
Our Fraud Detection Processes and Information Security Systems May Not Successfully Detect All Fraudulent Activity by
Third Parties Aimed at Our Employees or Users of Our Mobile Applications and Websites, Which Could Adversely Affect
Our Reputation and Business Results.
Third-party actors have attempted in the past, and may attempt in the future, to conduct fraudulent activity by engaging
with users of our mobile applications and websites by, for example, posting fake real estate listings on our sites and attempting
to solicit personal information or money from users, and by engaging with our employees by, for example, making fake
requests for transfer of funds. With the addition of our Zillow Offers and mortgage lending businesses, we now make a large
number of wire transfers in connection with loan and real estate closings. Though we have sophisticated fraud detection
processes and have taken other measures to identify fraudulent activity on our mobile applications, websites and internal
systems, we may not be able to detect and prevent all such activity. Similarly, the third parties we use to effectuate these
transactions may fail to maintain adequate controls or systems to detect and prevent fraudulent activity. Persistent or pervasive
fraudulent activity may cause users and advertisers to lose trust in us and decrease or terminate their usage of our products and
services, or could result in financial loss, thereby harming our business and results of operations.
We Are Subject to Multiple Risks Related to the Credit Card and Debit Card Payments We Accept.
We accept payments through credit and debit card transactions. For credit and debit card payments, we pay interchange
and other fees, which may increase over time. An increase in those fees may require us to increase the prices we charge and
would increase our operating expenses, either of which could harm our business, financial condition and results of operations.
We depend on processing vendors to complete credit and debit card transactions, both for payments owed to Zillow
Group directly and for payments to other third-parties, such as payments made by renters to landlords in our rental payments
product. If we or our processing vendors fail to maintain adequate systems for the authorization and processing of credit card
transactions, it could cause one or more of the major credit card companies to disallow our continued use of their payment
products. In addition, if these systems fail to work properly and, as a result, we do not charge our customers’ credit cards on a
timely basis or at all, our business, revenue, results of operations and financial condition could be harmed.
The payment methods that we offer also subject us to potential fraud and theft by criminals, who are becoming
increasingly more sophisticated, seeking to obtain unauthorized access to or exploit weaknesses that may exist in the payment
systems. If we fail to comply with applicable rules or requirements for the payment methods we accept, or if payment-related
data are compromised due to a breach of data, we may be liable for significant costs incurred by payment card issuing banks
and other third parties or subject to fines and higher transaction fees, or our ability to accept or facilitate certain types of
27
payments may be impaired. In addition, our customers could lose confidence in certain payment types, which may result in a
shift to other payment types or potential changes to our payment systems that may result in higher costs. If we fail to
adequately control fraudulent credit card transactions, we may face civil liability, diminished public perception of our security
measures, and significantly higher credit card-related costs, each of which could harm our business, results of operations and
financial condition.
We are also subject to payment card association operating rules, certification requirements and rules governing electronic
funds transfers, which could change or be reinterpreted to make it more difficult for us to comply. We are required to comply
with payment card industry security standards. Failing to comply with those standards may violate payment card association
operating rules, federal and state laws and regulations, and the terms of our contracts with payment processors. Any failure to
comply fully also may subject us to fines, penalties, damages and civil liability, and may result in the loss of our ability to
accept credit and debit card payments. Further, there is no guarantee that such compliance will prevent illegal or improper use
of our payment systems or the theft, loss, or misuse of data pertaining to credit and debit cards, card holders and transactions.
If we are unable to maintain our chargeback rate or refund rates at acceptable levels, our processing vendors may increase
our transaction fees or terminate their relationships with us. Any increases in our credit and debit card fees could harm our
results of operations, particularly if we elect not to raise our rates for our service to offset the increase. The termination of our
ability to process payments on any major credit or debit card would significantly impair our ability to operate our business.
Risks Related to Our Intellectual Property and Technology
If Our Security Measures or Technology Systems Are Compromised, We May Be Subject to Legal Claims and Suffer
Significant Losses, and Consumers May Curtail Use of Our Products and Services and Advertisers May Reduce Their
Advertising on Our Mobile Applications and Websites.
Our products and services involve the transmission, processing, and/or storage of users’ information, some of which may
be private or include personally identifiable information such as social security numbers, financial account information, and
credit card information. For example, our dotloop real estate transaction management software stores sensitive personal and
financial information, our Mortech mortgage product and pricing software for mortgage professionals processes social security
numbers, our rental applications product allows consumers to obtain credit and background checks containing sensitive
personal and financial information, and MLOA, our mortgage origination business, receives, handles and transmits highly
sensitive personal and financial information about its borrowers. Security breaches and administrative or technical failures
could expose us to a risk of data loss or exposure, including both consumer and customer data as well as intellectual property
and other confidential business information, which could result in potential significant liability and litigation. Like all mobile
application and website providers, our mobile applications and websites are vulnerable to computer viruses, break-ins, phishing
attacks, or other attacks, any of which could lead to loss of critical data or the unauthorized disclosure or use of personal or
other confidential information. Further, outside parties may attempt to fraudulently induce employees, officers, directors, users
or advertisers to disclose sensitive information in order to gain access to our information or our users’ or advertisers’
information, and our information technology and infrastructure may be vulnerable to attacks by hackers or breached due to user
error, malfeasance or other disruptions. If we experience compromises to our security that result in the loss or unauthorized
disclosure of confidential information, our users and advertisers may lose trust in us, users may decrease the use of our mobile
applications or websites or stop using our mobile applications, websites, or services in their entirety, advertisers may decrease
or stop advertising on our mobile applications or websites, and we may be subject to legal claims, government investigation
and additional state and federal legal requirements.
We engage a variety of vendors to process and store certain user information, some of which may be private or include
personally identifiable information. We also depend on vendors to host many of the systems and infrastructure used to provide
our products and services. If our data storage vendors fail to maintain adequate information security systems and our systems or
our users’ information is compromised, our business, results of operations and financial condition could be harmed. A security
breach at our vendor could be perceived by consumers or our customers as a breach of our systems and could result in damage
to our reputation and expose us to other losses.

28
Further, because the techniques used to obtain unauthorized access, disable or degrade service, or sabotage systems
change frequently, often are not recognized until launched against a target, and may originate from less regulated and remote
areas around the world, we may be unable to proactively address all these techniques or to implement adequate preventative
measures. Any or all of these issues could negatively impact our ability to attract new users and increase engagement by
existing users, cause existing users to curtail or stop use of our products or services or close their accounts, cause existing
advertisers to cancel their contracts, cause us to incur significant costs to notify affected individuals and upgrade our
technology, or subject us to third-party lawsuits, regulatory fines or other action or liability, thereby harming our business,
results of operations and financial condition.
Any Significant Disruption in Service on Our Mobile Applications or Websites or in Our Network Could Damage Our
Reputation and Brands, and Result in a Loss of Users of Our Products and Services and of Advertisers, Which Could Harm
Our Business, Results of Operations and Financial Condition.
Our brand, reputation and ability to attract users and advertisers depend on the reliable performance of our network
infrastructure and content delivery processes. Our mobile applications and websites are exposed to attempts to overload our
servers with denial-of-service attacks or similar disruptions from unauthorized use of our computer systems. We have
experienced minor interruptions in these systems in the past, including server failures that temporarily slowed the performance
of our mobile applications and websites, and we may experience interruptions in the future. Interruptions in these systems,
whether due to system failures, computer viruses, software errors or physical or electronic break-ins, could affect the security
or availability of our products and services on our mobile applications and websites and prevent or inhibit the ability of users to
access our services. Since our users may rely on our products and services, including our customer relationship management
tools, for important aspects of their businesses, problems with the reliability, availability or security of our systems could
damage our users’ businesses, harm our reputation, result in a loss of users of our products and services and of advertisers and
result in additional costs, any of which could harm our business, results of operations and financial condition. In October 2016,
for example, traffic to our websites zillow.com and trulia.com was impacted by a distributed denial of service attack against one
of our domain name system providers. This incident did not have a material adverse effect on our business, and there is no
indication that our internal controls were compromised. Despite the additional network detection tools and other processes we
implemented, and our continual work to install new, and upgrade existing, information technology systems and provide
employee awareness training around phishing, malware, and other cyber risks, we cannot ensure that we will not experience
similar incidents in the future.
To deliver web and mobile Zillow Group brand content while ensuring scalability and redundancy, we utilize both third-
party web services for cloud computing and storage and shared data centers in Seattle, Washington and Santa Clara, California.
We do not own or control the operation of certain of these facilities. Our systems and operations are vulnerable to damage
or interruption from fire, flood, power loss, telecommunications failure, terrorist attacks, acts of war, electronic and physical
break-ins, computer viruses, earthquakes and similar events. The occurrence of any of the foregoing events could result in
damage to our systems and hardware or could cause them to fail completely, and our insurance may not cover such events or
may be insufficient to compensate us for losses that may occur.
A failure of our systems at one site could result in reduced functionality for our users, and a total failure of our systems
could cause our mobile applications or websites to be inaccessible. Problems faced by our third-party web-hosting providers
with the telecommunications network providers with which they contract or with the systems by which they allocate capacity
among their customers, including us, could adversely affect the experience of our users. Our third-party web-hosting providers
could decide to close their facilities without adequate notice. Any financial difficulties, such as bankruptcy reorganization,
faced by our third-party web-hosting providers or any of the service providers with whom they contract may have negative
effects on our business, the nature and extent of which are difficult to predict. If our third-party web-hosting providers are
unable to keep up with our growing needs for capacity, our business could be harmed. In addition, if distribution channels for
our mobile applications experience disruptions, such disruptions could adversely affect the ability of users and potential users
to access or update our mobile applications, which could harm our business.
29
We do not carry business interruption insurance sufficient to compensate us for the potentially significant losses,
including the potential harm to the future growth of our business, which may result from interruptions in our service as a result
of system failures. Any errors, defects, disruptions or other performance problems with our services could harm our reputation,
business, results of operations and financial condition.
We Rely Upon Certain Third-Party Services to Support Critical Functions of Our Business and Any Disruption of or
Interference with our Use of those Third -Party Services Could Adversely Impact Our Operations and Our Business.
A limited number of third-party services support essential functions of our business, including Amazon Web Services
(“AWS”) and certain other Software-as-a-Service technologies hosted by third parties (“SaaS Services”). AWS provides us with
a distributed computing infrastructure platform for business operations, which is commonly referred to as a “cloud” computing
service. Certain of our computer systems utilize data processing, storage capabilities and other services provided by AWS, and
we currently run the vast majority of computing to power our mobile applications, websites, and other technology products and
services on AWS. In addition, we use SaaS Services to support important functions of our business, including enterprise
resource planning and customer relationship management. We store a significant amount of information about our users,
customers, employees, and business on AWS and in the SaaS Services, and we rely on these third-party service providers to
provide services on a timely and effective basis. Their failure to perform as expected or as required by contract could result in
significant disruptions and costs to our operations. In light of our reliance on AWS and SaaS Services, coupled with the
complexity of obtaining replacement services, any disruption of or interference with our use of these third-party services could
adversely impact our operations and business.
We May Be Unable to Adequately Protect Our Intellectual Property, Which Could Harm the Value of Our Brands and Our
Business.
We regard our intellectual property as critical to our success, and we rely on trademark, copyright and patent law, trade
secret protection and contracts to protect our proprietary rights. If we are not successful in protecting our intellectual property,
the value of our brands and our business, results of operations and financial condition could be harmed.
While we believe that our issued patents and pending patent applications help to protect our business, we cannot ensure
that our operations do not, or will not, infringe valid, enforceable patents of third parties or that competitors will not devise new
methods of competing with us that are not covered by our patents or patent applications. We cannot ensure that our patent
applications will be approved, that any patents issued will adequately protect our intellectual property, that such patents will not
be challenged by third parties or found to be invalid or unenforceable, or that our patents will be effective in preventing third
parties from utilizing a “copycat” business model to offer the same products or services. Our Zestimate home valuation, for
example, which we consider to be a key competitive advantage with respect to consumer engagement, is currently protected by
a patent, the loss of which could benefit comparable services provided by our competitors and result in decreased user traffic
and engagement with our mobile applications and websites, thereby harming our results of operations and financial condition.
Effective trademark, service mark, copyright and trade secret protection may not be available in every country in which
our products and services may be provided. The laws of certain countries do not protect proprietary rights to the same extent as
the laws of the United States and, therefore, in certain jurisdictions, we may be unable to protect intellectual property and our
proprietary technology adequately against unauthorized third-party copying or use, which could harm our competitive position.
We have licensed in the past, and expect to license in the future, certain of our proprietary rights, such as trademarks or
copyrighted material, to third parties. These licensees may take actions that might diminish the value of our proprietary rights
or harm our reputation, even if we have agreements prohibiting such activity. Though certain of these third parties are obligated
to indemnify us for breaches of our intellectual property rights, they may be unable to meet these obligations. In addition, we
rely on intellectual property and technology developed or licensed by third parties, and we may not be able to obtain licenses
and technologies from these third parties on reasonable terms or at all. Any of these events could harm our business, results of
operations or financial condition.
In addition, we may actively pursue entities that infringe our intellectual property, including through legal action. Taking
such action may be costly, and we cannot ensure that such actions will be successful. Any increase in the unauthorized use of

30
our intellectual property could make it more expensive for us to do business and harm our results of operations or financial
condition.
Intellectual Property Disputes Are Costly to Defend and Could Harm Our Business, Results of Operations, Financial
Condition and Reputation.
From time to time, we face allegations that we have infringed the trademarks, copyrights, patents and other intellectual
property rights of third parties. We are currently subject to intellectual property infringement claims. These claims allege,
among other things, that aspects of our technology infringe upon the plaintiffs’ intellectual property. If we are not successful in
defending ourselves against these claims, we may be required to pay damages and may be subject to injunctions, each of which
could harm our business, results of operations, financial condition and reputation. As we grow our business and expand our
operations, we expect that we will continue to be subject to intellectual property claims and allegations. Patent and other
intellectual property disputes or litigation may be protracted and expensive, and the results are difficult to predict and may
require us to stop offering certain products, services or features, purchase licenses that may be expensive to procure, or modify
our products or services. In addition, patent or other intellectual property disputes or litigation may result in significant
settlement costs. Any of these events could harm our business, results of operations, financial condition and reputation.
In addition, we use open source software in our services and will continue to use open source software in the future. From
time to time, we may be subject to claims brought against companies that incorporate open source software into their products
or services, claiming ownership of, or demanding release of, the source code, the open source software and/or derivative works
that were developed using such software, or otherwise seeking to enforce the terms of the applicable open source license. These
claims could also result in litigation, and we may be required to purchase a costly license or remove open source software,
devote additional research and development resources to changing our products or services, make generally available the
source code for our proprietary technology, or waive certain of our intellectual property rights, any of which would have a
negative effect on our business and results of operations.
Even if these matters do not result in litigation or are resolved in our favor or without significant cash settlements, the
time and resources necessary to resolve them could harm our business, results of operations, financial condition and reputation.
We May Be Unable to Continue to Use the Domain Names That We Use in Our Business, or Prevent Third Parties From
Acquiring and Using Domain Names That Infringe on, Are Similar to, or Otherwise Decrease the Value of Our Brand or
Our Trademarks or Service Marks.
We have registered domain names for our websites that we use in our business. If we lose the ability to use a domain
name, we may incur significant expenses to market our products and services under a new domain name, which could harm our
business. In addition, our competitors could attempt to capitalize on our brand recognition by using domain names similar to
ours. Domain names similar to ours have been registered in the United States and elsewhere. We may be unable to prevent third
parties from acquiring and using domain names that infringe on, are similar to, or otherwise decrease the value of our brand or
our trademarks or service marks. Protecting and enforcing our rights in our domain names and determining the rights of others
may require litigation, which could result in substantial costs and diversion of management’s attention.
Confidentiality Agreements With Employees and Others May Not Adequately Prevent Disclosure of Trade Secrets and Other
Proprietary Information.
In order to protect our technologies and strategic business and operations information, we rely in part on confidentiality
agreements with our employees, independent contractors, vendors, licensees, and other third parties. These agreements may not
effectively prevent disclosure of confidential information, including trade secrets, and may not provide an adequate remedy in
the event of unauthorized disclosure of confidential information. The loss of trade secret protection could make it easier for
third parties to compete with our products by copying functionality. Others may independently discover our trade secrets and
proprietary information, and in such cases, we could not assert any trade secret rights against such parties. Further, if our
employees, contractors or other third parties with whom we do business use intellectual property owned by others in their work
for us, disputes may arise as to the rights in related or resulting know-how and inventions. Any changes in, or unfavorable
interpretations of, intellectual property laws may compromise our ability to enforce our trade secret and intellectual property
31
rights. Costly and time-consuming litigation could be necessary to enforce and determine the scope of our proprietary rights,
and failure to obtain or maintain protection of our trade secrets or other proprietary information could harm our business,
results of operations, reputation and competitive position.
We May Not Be Able to Halt the Operations of Websites That Aggregate or Misappropriate Our Data.
From time to time, third parties have misappropriated our data through website scraping, robots or other means, and
aggregated this data on their websites with data from other companies. In addition, copycat websites have misappropriated data
on our network and attempted to imitate our brand or the functionality of our websites. When we have become aware of such
websites, we have employed technological or legal measures in an attempt to halt their operations. We may not be able,
however, to detect all such websites in a timely manner and, even if we could, technological and legal measures may be
insufficient to halt their operations. In some cases, particularly in the case of websites operating outside of the United States,
our available remedies may not be adequate to protect us against the impact of the operation of such websites. In addition, if
such activity creates confusion among consumers or advertisers, our brands and business could be harmed. Regardless of
whether we can successfully enforce our rights against the operators of these websites, any measures that we may take could
require us to expend significant financial or other resources, which could harm our business, results of operations or financial
condition.
Risks Related to Regulatory Compliance and Legal Matters
We Are, and May in the Future Become, Subject to a Variety of International, Federal, State, and Local Laws, Many of
Which Are Unsettled and Still Developing and Which Could Subject Us to Claims or Otherwise Harm Our Business.
With offices and owned properties located throughout the United States and an office in Vancouver, British Columbia, we
are currently subject to a variety of, and may in the future become subject to additional, international, federal, state, and local
laws that are continuously evolving and developing, including laws regarding the real estate, rental and mortgage industries,
mobile- and internet-based businesses and other businesses that rely on advertising, as well as privacy and consumer protection
laws, including the Telephone Consumer Protection Act, the Telemarketing Sales Rule, the CAN-SPAM Act, the Fair Credit
Reporting Act, the Canadian Anti-Spam Law, the Personal Information Protection and Electronic Documents Act, along with
employment laws, including those governing wage and hour requirements; in connection with Zillow Offers, laws addressing
the purchase, upgrade, and sale of homes, including those governing hazardous substances; and in connection with Mortgage
Lenders of America, laws and regulations governing mortgage loan origination activities. These laws are complex and can be
costly to comply with, require significant management time and effort, and subject us to claims, government enforcement
actions, civil and criminal liability or other remedies, including suspension of business operations. These laws may conflict
with each other, and if we comply with the laws of one jurisdiction, we may find that we are violating laws of another
jurisdiction.
If we are unable to comply with these laws or regulations in a cost-effective manner, we may modify impacted products
and services, which could require a substantial investment and loss of revenue, or cease providing the impacted product or
service altogether. If we are found to have violated laws or regulations, we may be subject to significant fines, penalties, and
other losses.
We assist with the processing of customer credit card transactions and consumer credit report requests, originate
mortgage loans, buy and sell homes, and provide other product offerings, which results in us receiving or facilitating
transmission of personally identifiable information. This information is increasingly subject to legislation and regulation in the
United States. These laws and regulations are generally intended to protect the privacy and security of personal information,
including credit card information that is collected, processed and transmitted. For example, the recently enacted California
Consumer Privacy Act, which will become effective on January 1, 2020, will impose restrictions on companies’ use of personal
data. We could be adversely affected if government regulations require us to significantly change our business practices with
respect to this type of information or if the third-parties that we engage with to provide processing and screening services
violate applicable laws and regulations.
32
We are From Time to Time Involved In, or May In the Future be Subject to, Claims, Suits, Government Investigations, and
Other Proceedings That May Result In Adverse Outcomes.
We are from time to time involved in, or may in the future be subject to, claims, suits, government investigations, and
proceedings arising from our business, including actions with respect to intellectual property, privacy, consumer protection,
information security, mortgage lending, real estate, environmental, data protection or law enforcement matters, tax matters,
labor and employment, and commercial claims, as well as actions involving content generated by our users, shareholder
derivative actions, purported class action lawsuits, and other matters, including those matters described in Part II, Item 8 in
Note 19 under the subsection titled “Legal Proceedings” in our Notes to Consolidated Financial Statements in this Annual
Report on Form 10-K. Such claims, suits, government investigations, and proceedings are inherently uncertain, and their results
cannot be predicted with certainty. Regardless of the outcome, any such legal proceedings can have an adverse impact on us
because of legal costs, diversion of management and other personnel, and other factors. In addition, it is possible that a
resolution of one or more such proceedings could result in reputational harm, liability, penalties, or sanctions, as well as
judgments, consent decrees, or orders preventing us from offering certain features, functionalities, products, or services, or
requiring a change in our business practices, products or technologies, which could in the future materially and adversely affect
our business, operating results and financial condition.
In some instances, third parties may have an obligation to indemnify us for liabilities related to litigation or governmental
investigations, and they may be unable to, or fail to, fulfill such obligations. If such third parties failed to indemnify us, we
would be financially responsible, which could adversely affect our financial condition and cash flow. For example, on October
31, 2018, Zillow Group’s wholly owned subsidiary, ZGM Holdco, Inc., acquired MLOA by way of purchase of the then-
outstanding equity of MLOA. Prior to the acquisition, on February 2, 2018, a former MLOA employee, Beau Charbonneau,
filed a complaint against MLOA in United States District Court for the District of Kansas. The complaint alleges, among other
things, that MLOA improperly classified its team leader roles as exempt from the overtime provisions of the Fair Labor
Standards Act and that it failed to pay its loan officers for all hours worked in excess of 40 hours in any work week. The
complaint also asserts wage-related claims under the Kansas Wage Payment Act and under Kansas common law. On December
6, 2018, the court issued an order conditionally certifying the case as a collective action under the Fair Labor Standards Act and
authorized the plaintiff’s attorneys to send notice of the case to impacted team leaders and loan officers advising them of the
case and their opportunity to join as a plaintiff. The court has not made any determinations regarding the merits of the claims
asserted in the complaint, nor has it found that the matter should be tried as a collective or class action. Zillow Group and its
affiliates are indemnified for losses incurred in connection with this matter by certain of the prior stockholders of MLOA.
Additionally, in accordance with the equity purchase agreement governing the acquisition of MLOA, any costs incurred related
to this matter will be paid directly by those same certain prior stockholders of MLOA. Although we do not believe a loss to
Zillow Group is probable, should the sellers of MLOA fail to indemnify us for losses related to this matter, our financial
condition may be negatively impacted.
The Requirements of Being a Public Company May Strain Our Resources and Distract Our Management, Which Could
Make It Difficult to Manage Our Business.
We are required to comply with various regulatory and reporting requirements, including those required by the SEC.
Complying with these reporting and other regulatory requirements can be time-consuming and results in increased costs to us
and could harm our business, results of operations and financial condition.
As a public company, we are subject to the reporting requirements of the Securities Exchange Act of 1934, as amended,
or the Exchange Act. These requirements could strain our systems and resources. The Exchange Act also requires that we file
annual, quarterly and current reports with respect to our business and financial condition. The Exchange Act requires that we
maintain effective disclosure controls and procedures and internal control over financial reporting. To maintain and improve the
effectiveness of our disclosure controls and procedures and internal control over financial reporting, we have committed
significant resources, hired additional staff and provided additional management oversight. We have implemented additional
procedures and processes for the purpose of addressing the standards and requirements applicable to public companies. For
example, new revenue recognition guidance was issued by the Financial Accounting Standards Board (“FASB”), which we
adopted on January 1, 2018, requiring additional personnel time and other costs to implement. In addition, we are investing

33
additional personnel time and other costs to implement new guidance on leases, which we adopted on January 1, 2019.
Sustaining our growth will require us to commit additional management, operational and financial resources to identify new
professionals to join us and to maintain appropriate operational and financial systems to adequately support expansion. These
activities may divert management’s attention from other business concerns and could make it difficult to manage our business,
which could harm our business, results of operations, financial condition and cash flows. In addition, if we identify any
material weaknesses in our internal controls, we could lose investor confidence in the accuracy and completeness of our
financial reports, which would cause the market price of our capital stock to decline.
Risks Related to Our Financial Statements
We Incurred Significant Operating Losses in the Past and We May Not Be Able to Generate Sufficient Revenue to Be
Profitable Over the Long Term.
We have incurred significant net operating losses in the past and, as of December 31, 2018, we had an accumulated
deficit of $671.8 million. Although we have experienced significant growth in revenue, our revenue growth rate may decline in
the future as the result of a variety of factors, including the maturation of our business. At the same time, we also expect our
costs to increase in future periods as we continue to expend substantial financial resources to develop and expand our business,
including with respect to:
• expansion of Zillow Offers
• expansion of our mortgage origination business
• product development;
• sales and marketing;
• technology infrastructure;
• strategic opportunities, including commercial relationships and acquisitions; and
• general and administrative expenses, including legal and accounting expenses related to being a public company.
These investments may not result in increased revenue or growth in our business. If we fail to continue to grow our
revenue and overall business and to manage our expenses, we may incur significant losses in the future and not be able to
achieve or maintain profitability.
Servicing Our Debt Requires a Significant Amount of Cash, and We May Not Have Sufficient Cash Flow From Our
Business to Pay Our Substantial Debt.
Our ability to make scheduled payments of the principal of, to pay interest on or to refinance our indebtedness, including
the remaining outstanding $9.6 million aggregate principal under Trulia’s Convertible Senior Notes due in 2020 (the “2020
Notes”), the $460.0 million aggregate principal under our Convertible Senior Notes due in 2021 (the “2021 Notes”), and the
$373.8 million aggregate principal amount under our Convertible Senior Notes due in 2023 (the “2023 Notes”), depends on our
future performance, which is subject to economic, industry, competitive and other factors beyond our control. Our business
may not continue to generate cash flow from operations in the future sufficient to service our debt and make necessary capital
expenditures. If we are unable to generate such cash flow, we may be required to adopt one or more alternatives, such as selling
assets, restructuring debt or obtaining additional equity capital on terms that may be onerous or highly dilutive. Our ability to
refinance our indebtedness will depend on the capital markets and our financial condition at such time. We may not be able to
engage in any of these activities or engage in these activities on desirable terms, which could result in a default on our debt
obligations.
We May Need to Raise Additional Capital to Grow Our Business and We May Not Be Able to Raise Additional Capital on
Terms Acceptable to Us, or At All.
Growing and operating our business, including through the development of new and enhanced products and services,
may require significant cash outlays, liquidity reserves and capital expenditures. If cash on hand, cash generated from
operations and cash equivalents and investment balances are not sufficient to meet our cash and liquidity needs, we may need
to seek additional capital and we may not be able to raise the necessary cash on terms acceptable to us, or at all. For example,

34
our Homes business will require significant cash to acquire, update and sell homes. We entered into two revolving credit
facilities, one in July 2018 and another in January 2019, to support operations of the Homes business. In addition, our mortgage
lending business will require significant cash to originate mortgages Our acquisition of MLOA in October 2018 also includes
the assumption of warehouse facilities to finance its mortgage origination activities. Financing arrangements we pursue or
assume may require us to grant certain rights, take certain actions, or agree to certain restrictions, that could negatively impact
our business. If additional capital is not available to us on terms acceptable to us or at all, we may need to modify our business
plans, which would harm our ability to grow our operations.
We Rely on Assumptions, Estimates, and Business Data to Calculate our Key Performance Indicators and Other Business
Metrics, and Real or Perceived Inaccuracies in These Metrics May Harm our Reputation and Negatively Affect our
Business.
Certain of our performance metrics are calculated using third party applications or internal company data that have not
been independently verified. While these numbers are based on what we believe to be reasonable calculations for the applicable
period of measurement, there are inherent challenges in measuring such information. For example, our measurement of unique
users and visits may be affected by applications that automatically contact our servers to access our mobile applications and
websites with no user action involved, and this activity can cause our system to count the user associated with such a device as
a unique user or as a visit on the day such contact occurs.
We regularly review and may adjust our processes for calculating our performance metrics to improve accuracy. Our
measure of certain metrics may differ from estimates published by third parties or from similarly-titled metrics of our
competitors due to differences in methodology. If real estate professionals, advertisers or investors do not perceive our unique
users or visits to be an accurate representation of our user engagement, or if we discover material inaccuracies in our unique
users or visits, our reputation may be harmed, and real estate professionals and advertisers may be less willing to allocate their
resources to our products and services, which could negatively affect our business and operating results.
We Expect Our Results of Operations to Fluctuate on a Quarterly and Annual Basis.
Our revenue and results of operations could vary significantly from period to period and may fail to match expectations
as a result of a variety of factors, some of which are outside our control. The other risk factors discussed in this “Risk Factors”
section may contribute to the variability of our quarterly and annual results. In addition, our results may fluctuate as a result of
fluctuations in the quantity of, and the price at which we are able to sell, our remnant advertising, seasonal variances of home
sales, which historically peak in the spring and summer seasons, and the size and seasonal variability of our advertisers’
marketing budgets. The seasonal variance and cyclical nature of home sales may contribute to the variability of our revenue and
results of operations for the Homes and mortgage lending businesses, in particular. As a result of the potential variations in our
revenue and results of operations, period-to-period comparisons may not be meaningful and the results of any one period
should not be relied on as an indication of future performance. In addition, our results of operations may not meet the
expectations of investors or public market analysts who follow us, which may adversely affect our stock price.
We Could Be Subject to Additional Income Tax Liabilities and Our Ability to Use Our Net Operating Loss Carryforwards
and Certain Other Tax Attributes May Be Limited.
We are subject to federal and state income taxes in the United States and in Canada. Tax laws, regulations, and
administrative practices in various jurisdictions may be subject to significant change, with or without notice, due to economic,
political, and other conditions, and significant judgment is required in evaluating and estimating these taxes. Our effective tax
rates could be affected by numerous factors, such as entry into new businesses and geographies, changes to our existing
business and operations, acquisitions and investments and how they are financed, changes in our stock price, changes in our
deferred tax assets and liabilities and their valuation, and changes in the relevant tax, accounting, and other laws, regulations,
administrative practices, principles, and interpretations. For example, On December 22, 2017, the U.S. government enacted
comprehensive tax legislation under the Tax Cuts and Jobs Act (the “Tax Act”). The Tax Act makes broad and complex changes
to the U.S. tax code, including but not limited to: (1) reducing the U.S. federal corporate tax rate from 35 percent to 21 percent;
(2) requiring companies to pay a one-time transition tax on certain untaxed earnings of foreign subsidiaries; (3) generally
eliminating U.S. federal income taxes on dividends from foreign subsidiaries; (4) eliminating the corporate alternative
35
minimum tax (“AMT”) and how AMT credits are utilized; and (5) the additional limitations on deducting executive
compensation under IRC section 162(m); and (6) changing rules related to uses and limitations of net operating loss
carryforwards created in tax years beginning after December 31, 2017.
The Tax Act significantly changes how the U.S. taxes corporations. The Tax Act requires complex computations to be
performed that were not previously required in U.S. tax law, significant judgments to be made in interpretation of the
provisions of the Tax Act and significant estimates in calculations, and the preparation and analysis of information not
previously relevant or regularly produced. The U.S. Treasury Department, the IRS, and other standard-setting bodies have not
implemented all relevant regulations or issued substantive guidance to-date and could interpret or issue guidance on how
provisions of the Tax Act will be applied or otherwise administered that is different from our current interpretation.
As of December 31, 2018, we had federal net operating loss carryforwards of approximately $1,081.7 million, state net
operating loss carryforwards of approximately $32.5 million (tax effected), and net tax credit carryforwards of approximately
$48.8 million. Under Sections 382 and 383 of the Internal Revenue Code, if a corporation undergoes an ownership change, the
corporation’s ability to use its pre-change net operating loss carryforwards and other pre-change tax attributes, such as research
tax credits, to offset its post-change income or income tax liability may be limited. In connection with our August 2013 public
offering of our Class A Common stock, we experienced an ownership change that triggered Sections 382 and 383, which may
limit our ability to utilize net operating loss and tax credit carryforwards. In connection with our February 2015 acquisition of
Trulia, Trulia experienced an ownership change that triggered Section 382 and 383, which may limit Zillow Group’s ability to
utilize Trulia’s net operating loss and tax credit carryforwards.
Risks Related to Ownership of Our Common and Capital Stock and Debt Instruments
Our Class A Common Stock and Class C Capital Stock Prices May Be Volatile, and the Value of an Investment in Our
Class A Common Stock and Class C Capital Stock May Decline.
An active, liquid and orderly market for our Class A common stock and Class C capital stock may not be sustained,
which could depress the trading price of our Class A common stock and Class C capital stock. The trading price of our Class A
common stock and Class C capital stock has at times experienced price volatility and may continue to be volatile. For example,
since shares of our Class A common stock began trading in February 2015, the closing price of our Class A common stock has
ranged from $17.06 per share to $65.21 per share (adjusted for the August 2015 stock split effected in the form of a dividend)
through December 31, 2018. Since shares of our Class C capital stock began trading in August 2015, the closing price of our
Class C capital stock has ranged from $16.01 per share to $65.57 per share through December 31, 2018. The market price of
our Class A common stock and Class C capital stock could be subject to wide fluctuations in response to many of the risk
factors discussed in this Annual Report on Form 10-K and others beyond our control, including:
• actual or anticipated fluctuations in our financial condition and results of operations;
• changes in projected operational and financial results;
• addition or loss of significant customers;
• actual or anticipated changes in our growth rate relative to that of our competitors;
• announcements by us or our competitors of significant acquisitions, strategic partnerships, joint ventures or capital-
raising activities or commitments;
• announcements of technological innovations or new offerings by us or our competitors;
• additions or departures of key personnel;
• changes in laws or regulations applicable to our services;
• fluctuations in the valuation of companies perceived by investors to be comparable to us;
• the inclusion, exclusion, or deletion of our Class A common stock and Class C capital stock from any trading indices,
such as the S&P 500 Index;
• issuance of new or updated research or reports by securities analysts;
• sales of our Class A common stock and Class C capital stock by us or our shareholders;

36
• issuances of our Class A common stock upon conversion of the 2020 Notes and issuances of our Class C capital stock
upon conversion of our 2021 Notes;
• stock price and volume fluctuations attributable to inconsistent trading volume levels of our shares; and
• general economic and market conditions.
Furthermore, the stock markets in recent years have experienced extreme price and volume fluctuations that have affected
and continue to affect the market prices of the equity securities of many companies. These fluctuations often have been
unrelated or disproportionate to the operating performance of those companies. These broad market and industry fluctuations,
as well as general economic, political and market conditions such as recessions, interest rate changes or international currency
fluctuations, may negatively impact the market price of our Class A common stock and Class C capital stock. In the past,
companies that have experienced volatility in the market price of their stock have been subject to securities class action
litigation. We have in the past been and are currently the target of this type of litigation, and we may continue to be the target of
this type of litigation in the future. Past, current, and future securities litigation against us could result in substantial costs and
divert management’s attention from other business concerns, which could harm our business, results of operations or financial
condition.
The Structure of Our Capital Stock as Contained in Our Charter Documents Has the Effect of Concentrating Voting
Control With Our Founders, and Limits Your Ability to Influence Corporate Matters.
Since Zillow Group’s inception, our capital structure has included authorized Class A common stock and authorized
Class B common stock. Our Class A common stock entitles its holder to one vote per share, and our Class B common stock
entitles its holder to 10 votes per share. All shares of Class B common stock have been and are held or controlled by our
founders, Richard Barton and Lloyd Frink. As of December 31, 2018, Mr. Barton’s holdings and Mr. Frink’s holdings
represented approximately 31.5% and 20.5%, respectively, of the voting power of our outstanding capital stock.
For the foreseeable future, Mr. Barton and Mr. Frink will therefore have significant control over our management and
affairs and will be able to control most matters requiring shareholder approval, including the election or removal (with or
without cause) of directors and the approval of any significant corporate transaction, such as a merger or other sale of us or our
assets. In addition, because our Class C capital stock carries no voting rights (except as required by applicable law or as
expressly provided in our amended and restated articles of incorporation), the issuance of Class C capital stock (instead of
Class A common stock) could prolong the duration of Mr. Barton’s and Mr. Frink’s relative ownership of our voting power.
This concentrated control could delay, defer or prevent a change of control, merger, consolidation, takeover, or other business
combination involving us that you, as a shareholder, may otherwise support. This concentrated control could also discourage a
potential investor from acquiring our Class A common stock or Class C capital stock due to the limited voting power of such
stock relative to the Class B common stock and might harm the market price of our Class A common stock and Class C capital
stock.
Future Sales of Our Stock in the Public Market Could Cause Our Stock Price to Decline.
Our Class A common stock began trading on The Nasdaq Global Select Market on February 18, 2015, and our Class C
capital stock began trading on The Nasdaq Global Select Market on August 17, 2015. We cannot predict the effect, if any, that
market sales of shares or the availability of shares for sale will have on the prevailing trading price of our Class A common
stock and Class C capital stock from time to time. There is currently no contractual restriction on our ability to issue additional
shares, and all of our outstanding shares are generally freely tradable, except for shares held by our “affiliates” as defined in
Rule 144 under the Securities Act, which may be sold in compliance with the volume restrictions of Rule 144. Sales of a
substantial number of shares of our Class A common stock and Class C capital stock could cause our stock price to decline. In
addition, we may in the future issue shares of Class C capital stock for financings, acquisitions or equity incentives. If we issue
shares of Class C capital stock in the future, such issuances would have a dilutive effect on the economic interest of our Class A
common stock.
37
If Securities or Industry Analysts Do Not Publish Research or Publish Inaccurate or Unfavorable Research About Our
Business, Our Class A Common Stock and Class C Capital Stock Price and Trading Volume Could Decline.
The trading market for our Class A common stock and Class C capital stock depends in part on the research and reports
that securities or industry analysts publish about our company. If few or no securities or industry analysts cover our company,
the market price of our publicly-traded stock could be negatively impacted. If securities or industry analysts cover us and if one
or more of such analysts downgrade our stock or publish inaccurate or unfavorable research about our business, our stock price
would likely decline. If one or more of the analysts covering us fail to publish reports on us regularly, demand for our stock
could decline, which could cause our stock price and trading volume to decline.
If We Issue Additional Equity Securities or Issue Additional Convertible Debt to Raise Capital, It May Have a Dilutive
Effect on Shareholders’ Investment.
If we raise additional capital through further issuances of equity or convertible debt securities, our existing shareholders
could suffer significant dilution in their percentage ownership of us. Moreover, any new equity securities we issue could have
rights, preferences and privileges senior to those of holders of our common stock.
The Capped Call Transactions May Affect the Value of Our 2021 Notes, Our 2023 Notes, and Our Class C Capital Stock.
In connection with the pricing of each of the 2021 Notes and 2023 Notes, we entered into capped call transactions with
certain financial institutions (the “option counterparties”). The capped call transactions are expected generally to reduce the
potential dilution upon conversion of the 2021 Notes or 2023 Notes and/or offset any cash payments we are required to make in
excess of the principal amount of converted notes, as the case may be.
The option counterparties or their respective affiliates may modify their hedge positions by entering into or unwinding
various derivative transactions with respect to our Class C capital stock and/or purchasing or selling our Class C capital stock
or other securities of ours in secondary market transactions prior to the maturity of each of the 2021 Notes and 2023 Notes (and
are likely to do so during any observation period related to a conversion of 2021 Notes or 2023 Notes or in connection with any
repurchase of 2021 Notes or 2023 Notes by us). This activity could cause or avoid an increase or a decrease in the market price
of our Class C capital stock, the 2021 Notes or the 2023 Notes.
Anti-Takeover Provisions in Our Charter Documents and Under Washington Law Could Make an Acquisition of Us More
Difficult, Limit Attempts by Shareholders to Replace or Remove Our Management and Affect the Market Price of Our
Stock.
Provisions in our articles of incorporation and bylaws, as amended and restated, may have the effect of delaying or
preventing a change of control or changes in our management. Our amended and restated articles of incorporation or amended
and restated bylaws include provisions, some of which will become effective only after the date, which we refer to as the
threshold date, on which the Class B common stock controlled by our founders represents less than 7% of the aggregate
number of shares of our outstanding Class A common stock and Class B common stock, that:
• set forth the structure of our capital stock, which concentrates voting control of matters submitted to a vote of our
shareholders with the holders of our Class B common stock, which is held or controlled by our founders;
• authorize our board of directors to issue, without further action by our shareholders, up to 30,000,000 shares of
undesignated preferred stock, subject, prior to the threshold date, to the approval rights of the holders of our Class B
common stock;
• establish that our board of directors will be divided into three classes, Class I, Class II and Class III, with each class
serving three-year staggered terms;
• prohibit cumulative voting in the election of directors;
• provide that, after the threshold date, our directors may be removed only for cause;
• provide that, after the threshold date, vacancies on our board of directors may be filled only by the affirmative vote of
a majority of directors then in office or by the sole remaining director;
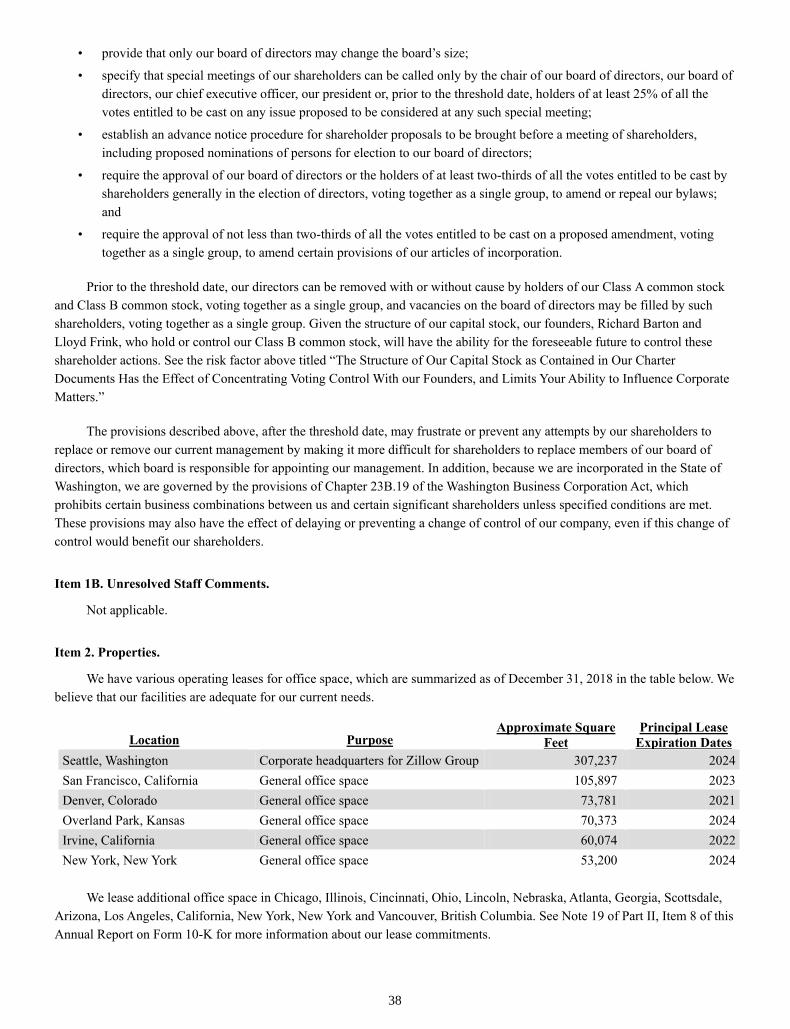
38
• provide that only our board of directors may change the board’s size;
• specify that special meetings of our shareholders can be called only by the chair of our board of directors, our board of
directors, our chief executive officer, our president or, prior to the threshold date, holders of at least 25% of all the
votes entitled to be cast on any issue proposed to be considered at any such special meeting;
• establish an advance notice procedure for shareholder proposals to be brought before a meeting of shareholders,
including proposed nominations of persons for election to our board of directors;
• require the approval of our board of directors or the holders of at least two-thirds of all the votes entitled to be cast by
shareholders generally in the election of directors, voting together as a single group, to amend or repeal our bylaws;
and
• require the approval of not less than two-thirds of all the votes entitled to be cast on a proposed amendment, voting
together as a single group, to amend certain provisions of our articles of incorporation.
Prior to the threshold date, our directors can be removed with or without cause by holders of our Class A common stock
and Class B common stock, voting together as a single group, and vacancies on the board of directors may be filled by such
shareholders, voting together as a single group. Given the structure of our capital stock, our founders, Richard Barton and
Lloyd Frink, who hold or control our Class B common stock, will have the ability for the foreseeable future to control these
shareholder actions. See the risk factor above titled “The Structure of Our Capital Stock as Contained in Our Charter
Documents Has the Effect of Concentrating Voting Control With our Founders, and Limits Your Ability to Influence Corporate
Matters.”
The provisions described above, after the threshold date, may frustrate or prevent any attempts by our shareholders to
replace or remove our current management by making it more difficult for shareholders to replace members of our board of
directors, which board is responsible for appointing our management. In addition, because we are incorporated in the State of
Washington, we are governed by the provisions of Chapter 23B.19 of the Washington Business Corporation Act, which
prohibits certain business combinations between us and certain significant shareholders unless specified conditions are met.
These provisions may also have the effect of delaying or preventing a change of control of our company, even if this change of
control would benefit our shareholders.
Item 1B. Unresolved Staff Comments.
Not applicable.
Item 2. Properties.
We have various operating leases for office space, which are summarized as of December 31, 2018 in the table below. We
believe that our facilities are adequate for our current needs.
Location Purpose Approximate Square
Feet Principal Lease
Expiration Dates
Seattle, Washington Corporate headquarters for Zillow Group 307,237 2024
San Francisco, California General office space 105,897 2023
Denver, Colorado General office space 73,781 2021
Overland Park, Kansas General office space 70,373 2024
Irvine, California General office space 60,074 2022
New York, New York General office space 53,200 2024
We lease additional office space in Chicago, Illinois, Cincinnati, Ohio, Lincoln, Nebraska, Atlanta, Georgia, Scottsdale,
Arizona, Los Angeles, California, New York, New York and Vancouver, British Columbia. See Note 19 of Part II, Item 8 of this
Annual Report on Form 10-K for more information about our lease commitments.

39
Item 3. Legal Proceedings.
For information regarding legal proceedings in which we are involved, see Note 19 under the subsection titled “Legal
Proceedings” in our Notes to Consolidated Financial Statements in Part II, Item 8 of this Annual Report on Form 10-K.
Item 4. Mine Safety Disclosures.
Not applicable.
40
PART II
Item 5. Market for Registrant’s Common Equity, Related Stockholder Matters and Issuer Purchases of Equity
Securities.
Market Information and Holders
Our Class A common stock has traded on The Nasdaq Global Select Market under the symbol “ZG” since August 17,
2015 and under the symbol “Z” from July 20, 2011 through August 14, 2015.
Our Class B common stock is not listed and there is no established public trading market.
Our Class C capital stock has traded on The Nasdaq Global Select Market under the symbol “Z” since August 17, 2015.
Prior to that time, there was no public market for our Class C capital stock.
Holders of Record
As of February 15, 2019, there were 90, three, and 134 holders of record of our Class A common stock, our Class B
common stock, and our Class C capital stock, respectively.
Dividends
We have never declared or paid a cash dividend on our common or capital stock and we intend to retain all available
funds and any future earnings to fund the development and growth of our business. We therefore do not anticipate paying any
cash dividends on our common or capital stock in the foreseeable future. Any future determinations to pay dividends on our
common or capital stock would depend on our results of operations, our financial condition and liquidity requirements,
restrictions that may be imposed by applicable law or our contracts, and any other factors that our board of directors may
consider relevant.
Recent Sales of Unregistered Securities and Use of Proceeds from Registered Securities
Recent Sales of Unregistered Securities
There were no sales of unregistered securities during the year ended December 31, 2018.
Purchases of Equity Securities by the Issuer
None.
Performance Graph
The following graph compares our cumulative total shareholder return on Zillow Group’s common and capital stock with
the Nasdaq Composite Index and the RDG Internet Composite Index.
For our Class A common stock, this graph covers the period from December 31, 2013 through December 31, 2018. This
graph assumes that the value of the investment in Zillow Group’s Class A common stock and each index (including
reinvestment of dividends) was $100 on December 31, 2013.
For our Class C capital stock, this graph covers the period from August 3, 2015, using the closing price for the first day of
trading during the when-issued trading period prior to the August 2015 stock split effected in the form of a dividend through
December 31, 2018. This graph assumes that the value of the investment in Zillow Group’s Class C capital stock (including
reinvestment of dividends) was $100 on August 3, 2015.

41
The information contained in the graph is based on historical data and is not intended to forecast possible future
performance.
Item 6. Selected Financial Data.
The selected financial data set forth below should be read in conjunction with the information under “Management’s
Discussion and Analysis of Financial Condition and Results of Operations” and our consolidated financial statements and
related notes included elsewhere in this Annual Report on Form 10-K and our previously audited financial statements that are
not included herein. We have included Trulia, Inc. in Zillow Group’s results of operations prospectively after February 17,
2015, the date of acquisition. We have given retroactive effect to prior period share and per share amounts in our consolidated
statements of operations for the August 2015 stock split effected in the form of a dividend so that prior periods are comparable
to current period presentation. Our historical results are not necessarily indicative of our results to be expected in any future
period.

42
Year Ended December 31,
2018 2017 2016 2015 2014
(in thousands, except per share data)
Statement of Operations Data:
Revenue:
IMT $ 1,281,189 $ 1,076,794 $ 846,589 $ 644,677 $ 325,893
Homes 52,365 — — — —
Total revenue 1,333,554 1,076,794 846,589 644,677 325,893
Cost of revenue (exclusive of amortization) (1)(2):
IMT 104,330 85,203 69,262 60,127 29,461
Homes 49,260 — — — —
Total cost of revenue 153,590 85,203 69,262 60,127 29,461
Sales and marketing (1) 552,621 448,201 382,419 308,125 169,462
Technology and development (1) 410,818 319,985 255,583 184,477 84,669
General and administrative (1) 262,153 210,816 332,007 184,984 65,503
Impairment and restructuring costs (1) 79,000 174,000 — 35,551 —
Acquisition-related costs 2,332 463 1,423 16,576 21,493
Integration costs 2,015 — — — —
Loss (gain) on divestiture of businesses — — (1,251 ) 4,368 —
Total costs and expenses 1,462,529 1,238,668 1,039,443 794,208 370,588
Loss from operations (128,975 ) (161,874 ) (192,854 ) (149,531 ) (44,695 )
Loss on debt extinguishment — — (22,757 ) — —
Other income 19,270 5,385 2,711 1,501 1,085
Interest expense (41,255 ) (27,517 ) (7,408 ) (5,489 ) —
Loss before income taxes (150,960 ) (184,006 ) (220,308 ) (153,519 ) (43,610 )
Income tax benefit (expense) 31,102 89,586 (130 ) 4,645 —
Net loss $ (119,858 ) $ (94,420 ) $ (220,438 ) $ (148,874 ) $ (43,610 )
Net loss per share—basic and diluted $ (0.61 ) $ (0.51 ) $ (1.22 ) $ (0.88 ) $ (0.36 )
Weighted average shares outstanding—basic and
diluted 197,944
186,453
180,149
169,767
120,027
(1) Includes share-based compensation as follows:
Cost of revenue $ 4,127 $ 3,884 $ 3,550 $ 2,384 $ 1,844
Sales and marketing 22,942 22,735 23,320 25,391 7,320
Technology and development 56,673 39,938 31,466 26,849 11,681
General and administrative 65,342 47,014 48,582 50,590 13,240
Impairment and restructuring costs — — — 14,859 —
Total $ 149,084 $ 113,571 $ 106,918 $ 120,073 $ 34,085
(2) Amortization of website development costs and
intangible assets included in technology and
development $ 79,309
$ 94,349
$ 87,060
$ 63,189
$ 29,487

43
At December 31,
2018 2017 2016 2015 2014
(in thousands)
Balance Sheet Data:
Cash, cash equivalents and investments $ 1,554,925 $ 762,539 $ 507,515 $ 520,289 $ 455,920
Working capital 1,605,200 723,138 485,617 493,672 352,141
Property and equipment, net 135,172 112,271 98,288 85,523 41,600
Total assets 4,291,116 3,230,517 3,149,677 3,135,700 649,730
Long-term debt 699,020 385,416 367,404 230,000 —
Deferred tax liabilities and other long-term liabilities 17,474 44,561 136,146 132,482 —
Total shareholders’ equity 3,267,179 2,660,823 2,533,587 2,679,053 588,779
44
Item 7. Management’s Discussion and Analysis of Financial Condition and Results of Operations.
The following discussion of our financial condition and results of operations should be read in conjunction with our
audited consolidated financial statements and the related notes included elsewhere in this Annual Report on Form 10-K. In
addition to historical financial information, the following discussion contains forward-looking statements that reflect our plans,
estimates and beliefs. Our actual results may differ materially from those described in or implied by any forward-looking
statements. Factors that could cause or contribute to these differences include those discussed below and elsewhere in this
Annual Report on Form 10-K, particularly in the section titled “Risk Factors”.
Overview of our Business
Zillow Group, Inc. operates the largest portfolio of real estate and home-related brands on mobile and the web which
focus on all stages of the home lifecycle: renting, buying, selling and financing. Zillow Group is committed to empowering
consumers with unparalleled data, inspiration and knowledge around homes and connecting them with great real estate
professionals. The Zillow Group portfolio of consumer brands includes Zillow, Trulia, Mortgage Lenders of America,
StreetEasy, HotPads, Naked Apartments, RealEstate.com and Out East. Beginning in April 2018, the Zillow Offers service
provides homeowners in select metropolitan areas with the opportunity to receive offers to purchase their homes from Zillow.
When Zillow buys a home, it makes certain repairs and lists the home for resale on the open market. In addition, Zillow Group
provides a comprehensive suite of marketing software and technology solutions to help real estate professionals maximize
business opportunities and connect with millions of consumers. Zillow Group also operates a number of business brands for
real estate, rental and mortgage professionals, including Mortech, dotloop, Bridge Interactive and New Home Feed.
Reportable Segments and Revenue Overview
As of the second quarter of 2018, Zillow Group has two reportable segments: the Internet, Media & Technology (“IMT”)
segment, our historical operating and reportable segment, and the Homes segment. In connection with our IMT segment, we
generate revenue from the sale of advertising services and our suite of marketing software and technology solutions to
businesses and professionals primarily associated with the residential real estate, rental and mortgage industries. These
professionals include real estate, rental and mortgage professionals and brand advertisers. Our four primary revenue categories
within our IMT segment are Premier Agent, Rentals, Mortgages and Other.
Premier Agent revenue is generated by the sale of advertising services, as well as marketing and technology products and
services, to help real estate agents and brokers grow and manage their businesses. We offer these products and services through
our Premier Agent and Premier Broker programs. Premier Agent and Premier Broker advertising products are primarily sold on
a cost per impression basis. Impressions are delivered when a sold advertisement of a Premier Agent or Premier Broker appears
on pages viewed by users of our mobile applications and websites.
Rentals revenue primarily includes advertising sold to property managers and other rental professionals on a cost per lead,
cost per click or cost per lease generated basis. Beginning in 2018, rentals revenue also includes revenue generated through our
rental applications product, whereby potential renters can submit applications to multiple properties over a 30-day period for a
flat service fee.
Mortgages revenue primarily includes advertising sold to mortgage lenders and other mortgage professionals on a cost per
lead basis, including our Connect (formerly known as Long Form) and Custom Quote services, as well as revenue generated by
Mortech, which provides subscription-based mortgage software solutions, including a product and pricing engine and lead
management platform. Beginning in October 2018, following our acquisition of Mortgage Lenders of America, L.L.C.
(“MLOA”), mortgages revenue also includes revenue generated through mortgage originations and the sale of mortgages on the
secondary market.
On October 31, 2018, we completed the acquisition of MLOA, a licensed mortgage lender. This acquisition is consistent
with our strategy of providing services closer to real estate transactions to create better consumer experiences. The total

45
purchase price for the acquisition of MLOA is approximately $66.7 million in cash. For additional information about the
acquisition of MLOA, see Note 9 to our consolidated financial statements.
Other revenue primarily includes revenue generated by new construction and display advertising, as well as revenue from
the sale of various other advertising and business technology solutions for real estate professionals, including dotloop. New
construction revenue primarily includes advertising services sold to home builders on a cost per residential community basis.
Display revenue primarily consists of graphical mobile and web advertising sold to advertisers promoting their brands on our
mobile applications and websites.
In our Homes segment, we generate revenue from the resale of homes on the open market through our Zillow Offers
service. We began buying homes through the Zillow Offers service in April 2018, and we began selling homes in July 2018
Beginning with the Quarterly Report on Form 10-Q for the quarterly period ending March 31, 2019, Zillow Group
expects to report financial results for three reportable segments: the IMT segment, the Homes segment and the Mortgages
segment. The IMT segment will include the financial results for the Premier Agent, Rentals and new construction marketplaces,
as well as dotloop, display and other advertising and business software solutions. The Homes segment will include the financial
results from Zillow Group’s buying and selling of homes directly through the Zillow Offers service. The Mortgages segment
will include the financial results for advertising sold to mortgage lenders and other mortgage professionals, mortgage
originations through MLOA and Mortech mortgage software solutions. We expect the Mortgages segment, with the inclusion of
MLOA, to have a material impact on our consolidated balance sheets, statements of operations and cash flows in 2019.
Overview of Significant Milestones and Results
The following is a summary of certain of our significant milestones for the year ended December 31, 2018:
• In January, we launched Out East™, a new Hamptons-focused real estate brand. Out East replaces Hamptons Real
Estate Online (HREO.com), which Zillow Group acquired in January 2017.
• In February, we launched a new national advertising campaign, “Many Ways Home”, with three national TV spots
illustrating the diversity of the housing market today and the many different paths people take to find a new home.
• In March, we announced the top three teams from round one of our Zillow Prize competition, a machine learning
competition to improve Zestimate accuracy, with a grand prize of up to $1 million to the person or team who
submits the most improved Zestimate algorithm model. In January 2019, we awarded the $1 million prize to the
winning team, which beat the Zillow benchmark model by approximately 13%.
• In March, we launched the “My Agent” feature, which creates an exclusive relationship between a Premier Agent
and a home shopper on Zillow Group’s mobile applications and websites.
• In April, we announced the launch of our Homes business, Zillow Offers. We believe the Zillow Offers service
offers transparency, convenience and more choice for home sellers, and gives them certainty over their property
sale price and timing of their move. As of December 31, 2018, the Zillow Offers service is available in Phoenix,
Las Vegas, Atlanta, Denver, and Charlotte.
• In the second half of 2018, we made important changes to the Premier Agent and Premier Broker programs. For
example, and as discussed in greater detail below, we implemented a new form of consumer lead validation and
distribution to our Premier Agent and Premier Broker advertisers in an effort to deliver higher quality leads, which
resulted in a decrease in the total number of leads received by some advertisers. The initial changes resulted in
advertiser churn at a rate higher than we expected. Based on feedback from our Premier Agents and Premier
Brokers, we subsequently made further adjustments to these processes, for example, by decreasing the number of
screening questions posed to consumers as part of consumer lead validation, in an effort to return to prior lead
volumes. We also implemented pricing caps in certain high-demand zip codes to help ease pressure on cost-per-lead

46
increases resulting from growing demand in our auction-based pricing model. Beginning in the fourth quarter of
2018, we introduced Premier Agent and Premier Broker Flex Pricing products in a limited number of markets. With
the Flex Pricing products, Premier Agents and Premier Brokers are provided validated consumer leads at no upfront
cost and pay a performance advertising fee only when a real estate transaction is closed with one of their leads. We
plan to expand this pricing model further in 2019.
• In June, we announced that we entered into an agreement to receive a direct listing feed from CENTURY 21
Canada to enable Zillow Group to feature Canadian listings on Zillow.com. We entered into additional listing
agreements and marketing partnerships with other Canadian real estate enterprises throughout the year.
• In July, we introduced new tools for renters and landlords. Renters can apply for multiple rental units with one
application, including background and credit reports and pay their rent through new features on Zillow.
• In July, we issued $373.8 million aggregate principal amount of 1.50% Convertible Senior Notes due 2023 (the
“2023 Notes”), which includes $48.8 million principal amount of 2023 Notes sold pursuant to the underwriters’
option to purchase additional notes. We received net proceeds of $364.0 million after deducting underwriting
discounts and commissions and offering expenses payable by us. We used approximately $29.4 million of the net
proceeds from the issuance of the 2023 Notes to pay the cost of the Capped Call Confirmations. For additional
information regarding the 2023 Notes, see Note 14 to our consolidated financial statements.
• In July, we issued and sold 6,557,017 shares (of which 855,263 shares were related to the exercise of the
underwriters’ option to purchase additional shares) of our Class C capital stock at a public offering price
of $57.00 per share. We received net proceeds of $360.3 million after deducting underwriting discounts and
commissions and offering expenses payable by us. For additional information regarding the issuance, see Note 16
to our consolidated financial statements.
• In August, the company announced its entrance into a revolving credit agreement with Credit Suisse AG, Cayman
Islands Branch, as the directing lender, and certain other parties thereto (the “Revolving Credit Facility”). The
agreement provided for a maximum borrowing capacity of $250.0 million with an initial borrowing capacity of
$20.0 million. On December 31, 2018 we increased the maximum borrowing capacity related to the Revolving
Credit Facility to $500.0 million. As of December 31, 2018, the Revolving Credit Facility had a current borrowing
capacity of $126.7 million.
• In October, we acquired MLOA, a licensed mortgage lender headquartered in Overland Park, Kansas.
• In October, we announced the “Best of Zillow” program, a data-driven program based on consumer feedback that
will highlight real estate agent advertisers who provide exceptional customer service and reward them with
additional marketing benefits such as designations as “Best of Zillow” or “Best of Trulia”.
For the years ended December 31, 2018, 2017, and 2016, we generated revenue of $1,333.6 million, $1,076.8 million and
$846.6 million, respectively, representing year-over-year growth of 24%, 27% and 31%, respectively. The increases in total
revenue were primarily driven by growth in our Premier Agent program, which generated revenue of $898.3 million, $761.6
million, and $604.3 million, respectively, for the years ended December 31, 2018, 2017 and 2016. We believe we were able to
achieve these levels of revenue growth because of user traffic to and engagement with our mobile applications and websites,
which create monetization opportunities for us through the sale of advertising and other products and services. The average
number of monthly unique users for the three months ended December 31, 2018, 2017 and 2016 were 157.2 million,
151.6 million and 140.1 million, respectively, representing year-over-year growth of 4%, 8% and 13%, respectively. Visits for
the years ended December 31, 2018, 2017 and 2016 were 7,182.1 million, 6,314.4 million and 5,323.2 million, respectively,
representing year-over-year growth of 14%, 19% and 33%, respectively. This increase in visits increased the number of
impressions we could monetize in our Premier Agent marketplace. Premier Agent revenue per visit for the years ended
December 31, 2018, 2017 and 2016 was $0.125, $0.121 and $0.114, respectively, representing year-over-year growth of 4%,
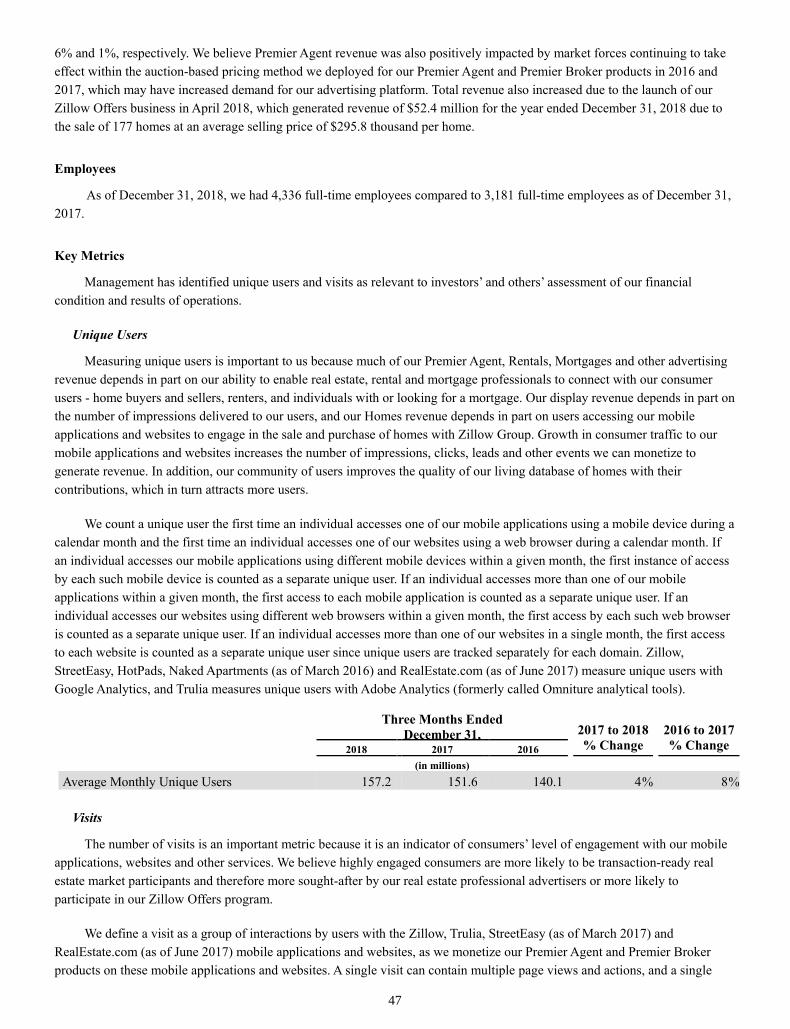
47
6% and 1%, respectively. We believe Premier Agent revenue was also positively impacted by market forces continuing to take
effect within the auction-based pricing method we deployed for our Premier Agent and Premier Broker products in 2016 and
2017, which may have increased demand for our advertising platform. Total revenue also increased due to the launch of our
Zillow Offers business in April 2018, which generated revenue of $52.4 million for the year ended December 31, 2018 due to
the sale of 177 homes at an average selling price of $295.8 thousand per home.
Employees
As of December 31, 2018, we had 4,336 full-time employees compared to 3,181 full-time employees as of December 31,
2017.
Key Metrics
Management has identified unique users and visits as relevant to investors’ and others’ assessment of our financial
condition and results of operations.
Unique Users
Measuring unique users is important to us because much of our Premier Agent, Rentals, Mortgages and other advertising
revenue depends in part on our ability to enable real estate, rental and mortgage professionals to connect with our consumer
users - home buyers and sellers, renters, and individuals with or looking for a mortgage. Our display revenue depends in part on
the number of impressions delivered to our users, and our Homes revenue depends in part on users accessing our mobile
applications and websites to engage in the sale and purchase of homes with Zillow Group. Growth in consumer traffic to our
mobile applications and websites increases the number of impressions, clicks, leads and other events we can monetize to
generate revenue. In addition, our community of users improves the quality of our living database of homes with their
contributions, which in turn attracts more users.
We count a unique user the first time an individual accesses one of our mobile applications using a mobile device during a
calendar month and the first time an individual accesses one of our websites using a web browser during a calendar month. If
an individual accesses our mobile applications using different mobile devices within a given month, the first instance of access
by each such mobile device is counted as a separate unique user. If an individual accesses more than one of our mobile
applications within a given month, the first access to each mobile application is counted as a separate unique user. If an
individual accesses our websites using different web browsers within a given month, the first access by each such web browser
is counted as a separate unique user. If an individual accesses more than one of our websites in a single month, the first access
to each website is counted as a separate unique user since unique users are tracked separately for each domain. Zillow,
StreetEasy, HotPads, Naked Apartments (as of March 2016) and RealEstate.com (as of June 2017) measure unique users with
Google Analytics, and Trulia measures unique users with Adobe Analytics (formerly called Omniture analytical tools).
Three Months Ended
December 31, 2017 to 2018
% Change
2016 to 2017
% Change 2018 2017 2016
(in millions) Average Monthly Unique Users 157.2 151.6 140.1 4 % 8 %
Visits
The number of visits is an important metric because it is an indicator of consumers’ level of engagement with our mobile
applications, websites and other services. We believe highly engaged consumers are more likely to be transaction-ready real
estate market participants and therefore more sought-after by our real estate professional advertisers or more likely to
participate in our Zillow Offers program.
We define a visit as a group of interactions by users with the Zillow, Trulia, StreetEasy (as of March 2017) and
RealEstate.com (as of June 2017) mobile applications and websites, as we monetize our Premier Agent and Premier Broker
products on these mobile applications and websites. A single visit can contain multiple page views and actions, and a single

48
user can open multiple visits across domains, web browsers, desktop or mobile devices. Visits can occur on the same day, or
over several days, weeks or months.
Zillow, StreetEasy and RealEstate.com measure visits with Google Analytics, and Trulia measures visits with Adobe
Analytics. Visits to Trulia end after thirty minutes of user inactivity. Visits to Zillow, StreetEasy and RealEstate.com end either:
(i) after thirty minutes of user inactivity or at midnight; or (ii) through a campaign change. A visit ends through a campaign
change if a visitor arrives via one campaign or source (for example, via a search engine or referring link on a third-party
website), leaves the mobile application or website, and then returns via another campaign or source.
Year Ended December 31, 2017 to 2018
% Change
2016 to 2017
% Change 2018 2017 2016
(in millions) Visits 7,182.1 6,314.4 5,323.2 14 % 19 %
49
Basis of Presentation
Revenue
We recognize revenue when (or as) we satisfy our performance obligations by transferring control of promised products
or services to our customers in an amount that reflects the consideration to which we expect to be entitled in exchange for those
products or services.
In our IMT segment, we generate revenue from the sale of advertising services and our suite of marketing software and
technology solutions to businesses and professionals primarily associated with the residential real estate, rental and mortgage
industries. These professionals include real estate, rental and mortgage professionals and brand advertisers. Our four primary
revenue categories within our IMT segment are Premier Agent, Rentals, Mortgages and Other.
In our Homes segment, we generate revenue from the resale of homes on the open market through our Zillow Offers
program.
Premier Agent Revenue. Premier Agent revenue is derived from our Premier Agent and Premier Broker programs. Our
Premier Agent and Premier Broker programs offer a suite of marketing and business technology products and services to help
real estate agents and brokers achieve their advertising goals, while growing and managing their businesses and brands. All
Premier Agents and Premier Brokers receive access to a dashboard portal on our mobile application or website that provides
individualized program performance analytics, our customer relationship management, or CRM, tool that captures detailed
information about each contact made with a Premier Agent or Premier Broker through our mobile and web platforms and our
account management tools. We have concluded that the marketing and business technology products and services promised to
Premier Agents and Premier Brokers represent distinct performance obligations.
We primarily offer our Premier Agent and Premier Broker advertising products on a cost per impression basis. Payment is
received prior to the delivery of impressions. Impressions are delivered when a sold advertisement appears on pages viewed by
users of our mobile applications and websites. We determine the cost per impression delivered in each zip code using an
auction-based pricing method in consideration of the total amount spent by Premier Agents and Premier Brokers to purchase
impressions in the zip code during the month. A Premier Agent’s or Premier Broker’s share of voice in a zip code is determined
by their proportional monthly budgeted spend in that zip code as a percentage of the total monthly budgeted spend of all
Premier Agents and Premier Brokers in that zip code. The cost per impression that we charge is dynamic - as demand for
impressions in a zip code increases or decreases, the cost per impression in that zip code may be increased or decreased
accordingly. The price paid for each impression is representative of the price at which we would sell an impression separately
to a customer, or the stand-alone selling price.
We have not allocated the transaction price to each performance obligation as the amounts recognized would be the same
irrespective of any allocation. As such, we recognize revenue related to the Premier Agent and Premier Broker products and
services based on the contractual spend recognized on a straight-line basis during the contractual period over which the
products and services are provided. This methodology best depicts how we satisfy our performance obligations to customers, as
we continuously transfer control of the performance obligations to the customer throughout the contractual period.
In October 2018, we began testing a new Flex Pricing model for Premier Broker and Premier Agent advertising services
in limited markets. With the Flex Pricing model, Premier Brokers and Premier Agents are provided with validated leads at no
upfront cost, and they pay a performance advertising fee only when a real estate transaction is closed with one of their leads.
With this pricing model, the transaction price represents variable consideration, as the amount to which we expect to be entitled
varies based on the number of validated leads that convert into real estate transactions. As the amount of consideration is
dependent upon factors outside our influence and our experience with this pricing model is limited, we fully constrain the
estimated variable consideration. When a real estate transaction is closed with a Flex Pricing lead and payment is made, the
uncertainty is resolved, and revenue is recognized in the period for the satisfied performance obligations.
50
Rentals Revenue. Rentals revenue includes the sale of advertising in our rentals information marketplace, as well as the
sale of our suite of tools for rental professionals. Rentals revenue primarily includes revenue generated by advertising sold to
property managers and other rental professionals on a cost per lead, cost per click or cost per lease generated basis. We
recognize revenue as leads or clicks are provided to rental professionals, which is the amount for which we have the right to
invoice. The number of leases generated through our rentals marketplace during the period is accounted for as variable
consideration, and we estimate these amounts based on the expected number of qualified leases secured during the period. We
do not believe that a significant reversal in the amount of cumulative revenue recognized will occur once the uncertainty related
to the number of leases secured is subsequently resolved.
Beginning in 2018, rentals revenue also includes revenue generated from our rental applications product through which
potential renters can submit applications to multiple rental properties over a 30-day period for a flat service fee. We recognize
revenue for the rental applications product on a straight-line basis during the contractual period over which the customer has
the right to access and submit the rental application.
Mortgages Revenue. Mortgages revenue primarily includes marketing products sold to mortgage professionals on a cost
per lead basis, including our Custom Quote and a portion of our Connect services, and on a subscription basis, including a
portion of our Connect service. Zillow Group operates Custom Quote and Connect through its wholly owned subsidiary, Zillow
Group Marketplace, Inc., a licensed mortgage broker. For our Connect and Custom Quote cost per lead mortgage marketing
products, participating qualified mortgage professionals typically make a prepayment to gain access to consumers interested in
connecting with mortgage professionals. Mortgage professionals who exhaust their initial prepayment prepay additional funds
to continue to participate in the marketplace. For our Connect subscription mortgage marketing product, participating qualified
mortgage professionals generally prepay a monthly subscription fee, which they then allocate to desired geographic counties. In
Zillow Group’s Connect platform, consumers answer a series of questions to find a local lender, and mortgage professionals
receive consumer contact information, or leads, when the consumer chooses to share their information with a lender.
Consumers who request rates for mortgage loans in Custom Quotes are presented with customized quotes from participating
mortgage professionals.
For our cost per lead mortgages products, we recognize revenue when a user contacts a mortgage professional through
our mortgages platform, which is the amount for which we have the right to invoice. For our subscription product, the
opportunity to receive a consumer contact is based on the mortgage professional’s relative share of voice in a geographic
county. When a consumer submits a contact, we contact a group of subscription mortgage professionals via text message, and
the first mortgage professional to respond receives the consumer contact information. We recognize revenue based on the
contractual spend recognized on a straight-line basis during the contractual period over which the service is provided. This
methodology best depicts how we satisfy our performance obligation to subscription customers, as we continuously transfer
control of the performance obligation to the customer throughout the contractual period.
Mortgages revenue also includes revenue generated by Mortech, which provides subscription-based mortgage software
solutions, including a product and pricing engine and lead management platform, for which we recognize revenue on a straight-
line basis during the contractual period over which the services are provided.
Beginning in the fourth quarter of 2018, mortgages revenue also includes revenue generated by our mortgage originations
business. We elect the fair value option for our mortgage loans held for sale, which are initially recorded at fair value based on
either sale commitments or current market quotes and are adjusted for subsequent changes in fair value until the loans are
closed. Net origination costs and fees associated with mortgage loans are recognized as incurred at the time of origination. We
sell substantially all of the mortgages we originate and the related servicing rights to third-party purchasers.
Other Revenue. Other revenue primarily includes revenue generated by new construction and display, as well as revenue
from the sale of various other marketing and business products and services to real estate professionals. Our new construction
marketing solutions allow home builders to showcase their available inventory to home shoppers. New construction revenue
primarily includes revenue generated by advertising sold to builders on a cost per residential community basis, and revenue is
recognized on a straight-line basis during the contractual period over which the communities are advertised on our mobile
applications and websites. Consideration is billed in arrears. Display revenue primarily consists of graphical mobile and web
51
advertising sold on a cost per thousand impressions or cost per click basis to advertisers promoting their brands on our mobile
applications and websites. We recognize display revenue as clicks occur or as impressions are delivered to users interacting
with our mobile applications or websites, which is the amount for which we have the right to invoice.
Homes Revenue. Homes revenue is derived from the resale of homes on the open market through our Zillow Offers
program. Homes revenue is recognized at the time of the closing of the home sale when title to and possession of the property
are transferred to the buyer. The amount of revenue recognized for each home sale is equal to the full sale price of the home
and does not reflect real estate agent commissions, closing or other costs associated with the transaction.
Costs and Expenses
Cost of Revenue. For our IMT segment, our cost of revenue consists of expenses related to operating our mobile
applications and websites, including associated headcount expenses, such as salaries, benefits, bonuses, and share-based
compensation expense, as well as credit card fees, ad serving costs paid to third parties, revenue-sharing costs related to our
commercial business relationships, depreciation expense and costs associated with the operation of our data center and mobile
applications and websites. Cost of revenue also includes expenses related to lead acquisition, systems directly used to originate
mortgages and fees and processing costs incurred to originate mortgages.
For our Homes segment, our cost of revenue consists of the amount we pay to purchase each property, the costs of
renovation we conduct on each property, associated headcount expenses, such as salaries, benefits, bonuses, and share-based
compensation expense, as well as associated overhead costs.
Sales and Marketing. Sales and marketing expenses consist of advertising costs and other sales expenses related to
promotional and marketing activities. Sales and marketing expenses also include headcount expenses, including salaries,
commissions, benefits, share-based compensation expense and bonuses for sales, sales support, customer support, marketing
and public relations employees, and for loan officers and specialists related to our mortgage originations business, and
depreciation expense.
For our Homes segment, sales and marketing expenses also consist of selling costs, such as real estate agent commissions,
escrow and title fees, and staging costs, as well as holding costs, including utilities, taxes and maintenance.
Technology and Development. Technology and development expenses consist of headcount expenses, including salaries,
benefits, share-based compensation expense and bonuses for salaried employees and contractors engaged in the design,
development and testing of our mobile applications and websites and the tools and applications that support our products.
Technology and development expenses also include equipment and maintenance costs. Technology and development expenses
also include amortization costs related to capitalized website and development activities, amortization of software, amortization
of certain intangibles and other data agreement costs related to the purchase of data used to populate our mobile applications
and websites, and amortization of intangible assets recorded in connection with acquisitions, including developed technology
and customer relationships, amongst others. Technology and development expenses also include depreciation expense.
General and Administrative. General and administrative expenses consist of headcount expenses, including salaries,
benefits, share-based compensation expense and bonuses for executive, finance, accounting, legal, human resources, recruiting,
corporate information technology costs and other administrative support. General and administrative expenses also include
legal settlement costs, legal, accounting and other third-party professional service fees, rent expense, depreciation expense and
bad debt expense.
Impairment Costs. Impairment costs for the year ended December 31, 2018 consist of a $10.0 million non-cash
impairment related to our June 2017 equity investment and a $69.0 million non-cash impairment related to the indefinite-lived
Trulia trade names and trademarks intangible asset. For additional information about the impairments, see Note 9 and Note 11
to our consolidated financial statements.
Acquisition-related Costs. Acquisition-related costs consist of investment banking, legal, accounting, tax, and regulatory
filing fees associated with acquisitions.

52
Integration Costs. Integration costs consist of expenses incurred to incorporate operations, systems, technology, and
rights and responsibilities of acquired companies, during both pre-closing and post-closing periods, into Zillow Group’s
business. For the year ended December 31, 2018, integration costs primarily include consulting-related expenses incurred in
connection with the acquisition of MLOA.
Gain on Divestiture of Business. The gain on divestiture of business recorded for the year ended December 31, 2016
consists of the gain recognized in connection with our August 2016 sale of our Diverse Solutions business.
Loss on Debt Extinguishment
The loss on debt extinguishment recorded for the year ended December 31, 2016 relates to the partial repurchase of
Trulia’s Convertible Senior Notes due in 2020 (the “2020 Notes”) in December 2016.
Other Income
Other income consists primarily of interest income earned on our cash, cash equivalents and short-term investments.
Interest Expense
Interest expense consists of interest on the 2020 Notes we guaranteed in connection with our February 2015 acquisition of
Trulia, interest on the Convertible Senior Notes due in 2021 (the “2021 Notes”) we issued in December 2016 and interest on
the 2023 Notes we issued in July 2018. Interest is payable on the 2020 Notes at the rate of 2.75% semi-annually on June 15 and
December 15 of each year. Interest is payable on the 2021 Notes at the rate of 2.00% semi-annually on June 1 and December 1
of each year. Interest is payable on the 2023 Notes at the rate of 1.50% semi-annually on January 1 and July 1 of each year.
Beginning in August 2018, interest expense includes interest on borrowings, funding fees and other fees, including the
amortization of deferred issuance costs, on our revolving credit agreement with Credit Suisse AG, Cayman Islands Branch (the
“Revolving Credit Facility”) related to our Zillow Offers business. Borrowings on our Revolving Credit Facility bear interest at
a floating rate based on LIBOR plus an applicable margin, as defined in the credit agreement governing the Revolving Credit
Facility.
Beginning in October 2018, interest expense also includes interest on warehouse lines of credit acquired as part of the
acquisition of MLOA. Each line of credit provides for a current and maximum borrowing capacity of $50.0 million, or $100.0
million in total. Borrowings on the lines of credit bear interest at either the one-month LIBOR rate plus an applicable margin,
as defined in the credit agreement governing the line of credit, or the daily adjusting LIBOR rate plus an applicable margin, as
defined in the credit agreement governing the warehouse line of credit.
Income Taxes
We are subject to federal and state income taxes in the United States and in Canada. As of December 31, 2018 and
December 31, 2017, we have provided a valuation allowance against our net deferred tax assets that we believe, based on the
weight of available evidence, are not more likely than not to be realized. Therefore, no material current tax liability or expense
has been recorded in the consolidated financial statements. We have accumulated federal tax losses of approximately $1,081.7
million as of December 31, 2018, which are available to reduce future taxable income. We have accumulated state tax losses of
approximately $32.5 million (tax effected) as of December 31, 2018.
We recorded an income tax benefit of $31.1 million for the year ended December 31, 2018. Approximately $15.4 million
of the income tax benefit relates to a $69.0 million non-cash impairment we recorded during the year ended December 31, 2018
related to the indefinite-lived Trulia trade names and trademarks intangible asset. For additional information about the non-cash
impairment, see Note 11 to our consolidated financial statements. The remaining portion of our income tax benefit is primarily
the result of net operating losses generated after December 31, 2017 with an indefinite carryforward period due to the Tax Cuts
and Jobs Act of 2017 (“the Tax Act”). Current year net operating losses can now offset against the indefinite-lived deferred tax
liabilities which resulted in a release of the valuation allowance and a resulting income tax benefit.

53
During the year ended December 31, 2018, we completed our accounting for the income tax effects related to the
deduction limitations on compensation under the Tax Act. The Internal Revenue Service provided further guidance in applying
the written binding contracts requirement under the Tax Act, and we believe certain of our executive compensation previously
eligible to be deductible for tax purposes under Section 162(m) of the Internal Revenue Code will be considered grandfathered
and, therefore, will continue to be deductible. Based on the clarification of these rules, the accounting related to the Section
162(m) limitation of the Internal Revenue Code is considered complete and as a result we recorded a $5.9 million tax benefit
for the year ended December 31, 2018.
We recorded an income tax benefit of $89.6 million for the year ended December 31, 2017. Approximately $66.0 million
of the income tax benefit relates to a $174.0 million non-cash impairment we recorded during the year ended December 31,
2017 related to the $351.0 million indefinite-lived intangible asset that we recorded in connection with our February 2015
acquisition of Trulia for Trulia’s trade names and trademarks. For additional information about the non-cash impairment, see
Note 11 to our consolidated financial statements. The remaining $23.6 million of the income tax benefit primarily relates to our
initial analysis of the impact of the rate decrease included in the Tax Act for the impact of the reduction in our net deferred tax
liability related to our indefinite-lived intangible asset.

54
Results of Operations
The following tables present our results of operations for the periods indicated and as a percentage of total revenue:
Year Ended December 31,
2018 2017 2016
(in thousands, except per share data)
Statements of Operations Data:
Revenue:
IMT $ 1,281,189 $ 1,076,794 $ 846,589
Homes 52,365 — —
Total revenue 1,333,554 1,076,794 846,589
Cost of revenue (exclusive of amortization) (1)(2):
IMT 104,330 85,203 69,262
Homes 49,260 — —
Total cost of revenue 153,590 85,203 69,262
Sales and marketing (1) 552,621 448,201 382,419
Technology and development (1) 410,818 319,985 255,583
General and administrative (1) 262,153 210,816 332,007
Impairment costs 79,000 174,000 —
Acquisition-related costs 2,332 463 1,423
Integration costs 2,015 — —
Gain on divestiture of business — — (1,251 )
Total costs and expenses 1,462,529 1,238,668 1,039,443
Loss from operations (128,975 ) (161,874 ) (192,854 )
Loss on debt extinguishment — — (22,757 )
Other income 19,270 5,385 2,711
Interest expense (41,255 ) (27,517 ) (7,408 )
Loss before income taxes (150,960 ) (184,006 ) (220,308 )
Income tax benefit (expense) 31,102 89,586 (130 )
Net loss $ (119,858 ) $ (94,420 ) $ (220,438 )
Net loss per share—basic and diluted $ (0.61 ) $ (0.51 ) $ (1.22 )
Weighted-average shares outstanding—basic and diluted 197,944 186,453 180,149
Other Financial Data:
Adjusted EBITDA (unaudited) (3)
___________
$ 200,832 $ 236,315 $ 14,826
(1) Includes share-based compensation as follows:
Cost of revenue $ 4,127 $ 3,884 $ 3,550
Sales and marketing 22,942 22,735 23,320
Technology and development 56,673 39,938 31,466
General and administrative 65,342 47,014 48,582
Total $ 149,084 $ 113,571 $ 106,918
(2) Amortization of website development costs and intangible assets
included in technology and development $ 79,309 $ 94,349
$ 87,060
(3) Adjusted EBITDA is a non-GAAP financial measure; it is not calculated or presented in accordance with U.S. generally
accepted accounting principles, or GAAP. See “Adjusted EBITDA” below for more information and for a reconciliation
of Adjusted EBITDA to net loss, the most directly comparable financial measure calculated and presented in accordance
with GAAP. Adjusted EBITDA for the year ended December 31, 2016 includes the impact of the settlement of a lawsuit
in June 2016 whereby the Company paid $130.0 million in connection with a release of all claims.

55
Year Ended December 31,
2018 2017 2016
Percentage of Revenue:
Revenue
IMT 96 % 100 % 100 %
Homes 4 0 0
Total revenue 100 100 100
Cost of revenue (exclusive of amortization):
IMT 8 8 8
Homes 4 0 0
Total cost of revenue 12 8 8
Sales and marketing 41 42 45
Technology and development 31 30 30
General and administrative 20 20 39
Impairment costs 6 16 0
Acquisition-related costs — — —
Integration costs — 0 0
Gain on divestiture of business 0 0 —
Total costs and expenses 110 115 123
Loss from operations (10 ) (15 ) (23 )
Loss on debt extinguishment 0 0 (3 )
Other income 1 1 —
Interest expense (3 ) (3 ) (1 )
Loss before income taxes (11 ) (17 ) (26 )
Income tax benefit (expense) 2 8 —
Net loss (9 )% (9 )% (26 )%
Adjusted EBITDA
To provide investors with additional information regarding our financial results, we have disclosed Adjusted EBITDA
within this Annual Report on Form 10-K, a non-GAAP financial measure. We have provided a reconciliation below of Adjusted
EBITDA to net loss, the most directly comparable GAAP financial measure.
We have included Adjusted EBITDA in this Annual Report on Form 10-K as it is a key metric used by our management
and board of directors to measure operating performance and trends and to prepare and approve our annual budget. In
particular, the exclusion of certain expenses in calculating Adjusted EBITDA facilitates operating performance comparisons on
a period-to-period basis.
Our use of Adjusted EBITDA has limitations as an analytical tool, and you should not consider it in isolation or as a
substitute for analysis of our results as reported under GAAP. Some of these limitations are:
• Adjusted EBITDA does not reflect our cash expenditures or future requirements for capital expenditures or contractual
commitments;
• Adjusted EBITDA does not reflect changes in, or cash requirements for, our working capital needs;
• Adjusted EBITDA does not consider the potentially dilutive impact of share-based compensation;
• Although depreciation and amortization are non-cash charges, the assets being depreciated and amortized may have to
be replaced in the future, and Adjusted EBITDA does not reflect cash capital expenditure requirements for such
replacements or for new capital expenditure requirements;
• Adjusted EBITDA does not reflect impairment costs;
• Adjusted EBITDA does not reflect acquisition-related costs;

56
• Adjusted EBITDA does not reflect the gain on divestiture of business;
• Adjusted EBITDA does not reflect interest expense or other income;
• Adjusted EBITDA does not reflect the loss on debt extinguishment;
• Adjusted EBITDA does not reflect income taxes; and
• Other companies, including companies in our own industry, may calculate Adjusted EBITDA differently than we do,
limiting its usefulness as a comparative measure.
Because of these limitations, you should consider Adjusted EBITDA alongside other financial performance measures,
including various cash flow metrics, net loss and our other GAAP results.
The following table presents a reconciliation of Adjusted EBITDA to net loss for each of the periods presented:
Year Ended December 31,
2018 2017 2016
(in thousands, unaudited)
Reconciliation of Adjusted EBITDA to Net Loss:
Net loss $ (119,858 ) $ (94,420 ) $ (220,438 )
Other income (19,270 ) (5,385 ) (2,711 )
Depreciation and amortization expense 99,391 110,155 100,590
Share-based compensation expense 149,084 113,571 106,918
Impairment costs 79,000 174,000 —
Acquisition-related costs 2,332 463 1,423
Gain on divestiture of business — — (1,251 )
Interest expense 41,255 27,517 7,408
Loss on debt extinguishment — — 22,757
Income tax (benefit) expense (31,102 ) (89,586 ) 130
Adjusted EBITDA (1) $ 200,832 $ 236,315 $ 14,826
______________________
(1) Adjusted EBITDA for the year ended December 31, 2016 includes the impact of the settlement of a lawsuit in June
2016 whereby the Company paid $130.0 million in connection with a release of all claims.
Year Ended December 31, 2018 Compared to Year Ended December 31, 2017
Revenue
The following table presents Zillow Group’s revenue by category for the periods presented:
Year Ended December 31, 2017 to 2018
% Change 2018 2017
(in thousands) Premier Agent $ 898,332 $ 761,594 18 %
Rentals 134,587 102,544 31 %
Mortgages 80,046 80,591 (1 )%
Other 168,224 132,065 27 %
Homes 52,365 — N/A
Total revenue $ 1,333,554 $ 1,076,794 24 %
The following table presents Zillow Group’s revenue categories as percentages of total revenue for the periods presented:
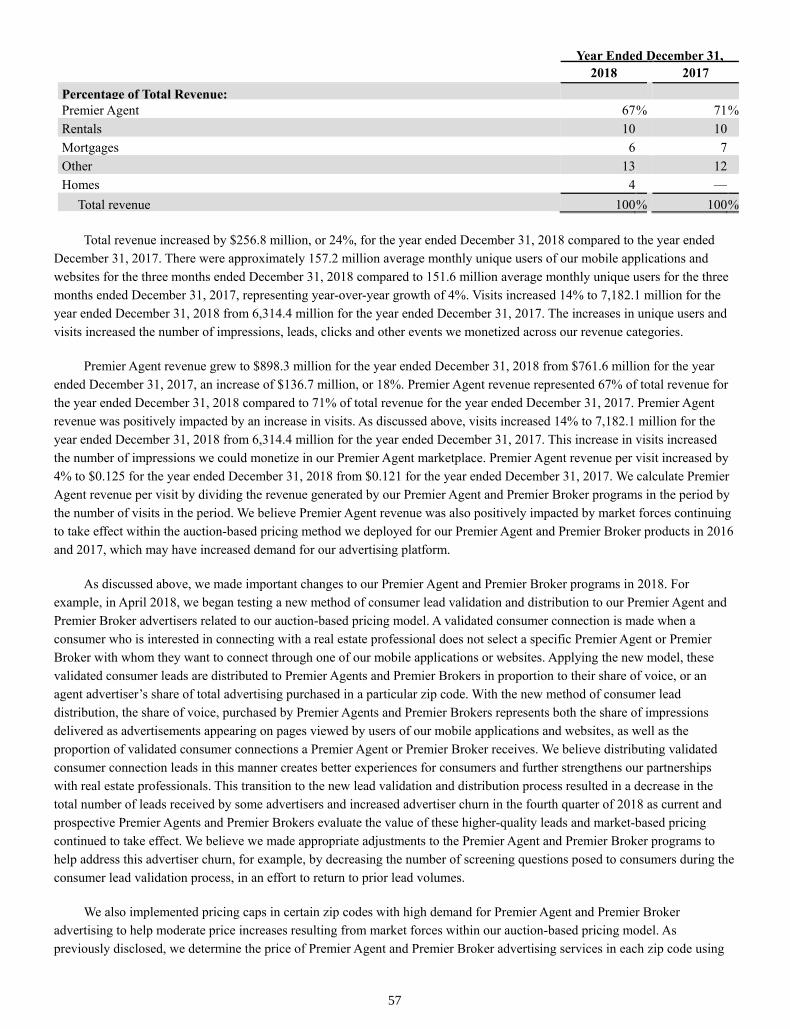
57
Year Ended December 31,
2018 2017
Percentage of Total Revenue:
Premier Agent 67 % 71 %
Rentals 10 10
Mortgages 6 7
Other 13 12
Homes 4 —
Total revenue 100 % 100 %
Total revenue increased by $256.8 million, or 24%, for the year ended December 31, 2018 compared to the year ended
December 31, 2017. There were approximately 157.2 million average monthly unique users of our mobile applications and
websites for the three months ended December 31, 2018 compared to 151.6 million average monthly unique users for the three
months ended December 31, 2017, representing year-over-year growth of 4%. Visits increased 14% to 7,182.1 million for the
year ended December 31, 2018 from 6,314.4 million for the year ended December 31, 2017. The increases in unique users and
visits increased the number of impressions, leads, clicks and other events we monetized across our revenue categories.
Premier Agent revenue grew to $898.3 million for the year ended December 31, 2018 from $761.6 million for the year
ended December 31, 2017, an increase of $136.7 million, or 18%. Premier Agent revenue represented 67% of total revenue for
the year ended December 31, 2018 compared to 71% of total revenue for the year ended December 31, 2017. Premier Agent
revenue was positively impacted by an increase in visits. As discussed above, visits increased 14% to 7,182.1 million for the
year ended December 31, 2018 from 6,314.4 million for the year ended December 31, 2017. This increase in visits increased
the number of impressions we could monetize in our Premier Agent marketplace. Premier Agent revenue per visit increased by
4% to $0.125 for the year ended December 31, 2018 from $0.121 for the year ended December 31, 2017. We calculate Premier
Agent revenue per visit by dividing the revenue generated by our Premier Agent and Premier Broker programs in the period by
the number of visits in the period. We believe Premier Agent revenue was also positively impacted by market forces continuing
to take effect within the auction-based pricing method we deployed for our Premier Agent and Premier Broker products in 2016
and 2017, which may have increased demand for our advertising platform.
As discussed above, we made important changes to our Premier Agent and Premier Broker programs in 2018. For
example, in April 2018, we began testing a new method of consumer lead validation and distribution to our Premier Agent and
Premier Broker advertisers related to our auction-based pricing model. A validated consumer connection is made when a
consumer who is interested in connecting with a real estate professional does not select a specific Premier Agent or Premier
Broker with whom they want to connect through one of our mobile applications or websites. Applying the new model, these
validated consumer leads are distributed to Premier Agents and Premier Brokers in proportion to their share of voice, or an
agent advertiser’s share of total advertising purchased in a particular zip code. With the new method of consumer lead
distribution, the share of voice, purchased by Premier Agents and Premier Brokers represents both the share of impressions
delivered as advertisements appearing on pages viewed by users of our mobile applications and websites, as well as the
proportion of validated consumer connections a Premier Agent or Premier Broker receives. We believe distributing validated
consumer connection leads in this manner creates better experiences for consumers and further strengthens our partnerships
with real estate professionals. This transition to the new lead validation and distribution process resulted in a decrease in the
total number of leads received by some advertisers and increased advertiser churn in the fourth quarter of 2018 as current and
prospective Premier Agents and Premier Brokers evaluate the value of these higher-quality leads and market-based pricing
continued to take effect. We believe we made appropriate adjustments to the Premier Agent and Premier Broker programs to
help address this advertiser churn, for example, by decreasing the number of screening questions posed to consumers during the
consumer lead validation process, in an effort to return to prior lead volumes.
We also implemented pricing caps in certain zip codes with high demand for Premier Agent and Premier Broker
advertising to help moderate price increases resulting from market forces within our auction-based pricing model. As
previously disclosed, we determine the price of Premier Agent and Premier Broker advertising services in each zip code using
58
an auction-based pricing method. The price we charge is dynamic - as advertiser demand for impressions in a zip code
increases or decreases, the cost per impression we charge in that zip code may be increased or decreased accordingly.
In the fourth quarter of 2018, Premier Agent revenue also included an immaterial amount of revenue generated from our
initial testing of a new Flex Pricing model for Premier Broker and Premier Agent advertisers in limited markets. With the Flex
Pricing model, Premier Brokers and Premiers Agents are provided with validated leads at no upfront cost, and they pay a
performance advertising fee only when a real estate transaction is closed with one of their leads. We expect to continue testing
this pricing model in additional regions and may implement it more broadly in the future.
Advertiser response to these changes may negatively impact Premier Agent revenue in 2019. We are not able to predict
whether these changes will have a material impact on our results in 2019 and beyond.
Rentals revenue was $134.6 million for the year ended December 31, 2018 compared to $102.5 million for the year
ended December 31, 2017, an increase of $32.0 million, or 31%. The increase in rentals revenue was primarily attributable to
an increase in the number of average monthly rental listings on our mobile applications and websites, which increased 48% to
38,816 average monthly rental listings for the year ended December 31, 2018 from 26,315 average monthly rental listings for
the year ended December 31, 2017. Average monthly rental listings include the average monthly monetized, deduplicated rental
listings for the period, which are displayed across all of our mobile applications and websites. An increase in rental listings on
our mobile applications and websites increases the likelihood that a consumer will contact a rental professional, which in turn
increases the likelihood of a lead, click, lease or other event that we monetize. The increase in average monthly rental listings
was primarily a result of our monetization of rental listings on our StreetEasy brand mobile application and website beginning
in the third quarter of 2017. The quarterly revenue per average monthly rental listing decreased 11% to approximately $867 for
the year ended December 31, 2018 from approximately $974 for the year ended December 31, 2017, due primarily to the
monetization of rental listings on StreetEasy beginning in the third quarter of 2017, which typically generate less revenue per
listing than larger rental properties. We calculate quarterly revenue per average monthly rental listing by dividing total rentals
revenue for the period by the average monthly deduplicated rental listings for the period and then dividing by the number of
quarters in the period. The increase in rentals revenue was also driven in part by the 14% increase in visits to 7,182.1 million
for the year ended December 31, 2018, which similarly increases the likelihood a consumer will contact a rental professional,
which in turn increases the likelihood of a lead, click, lease or other event that we monetize.
Mortgages revenue was $80.0 million for the year ended December 31, 2018 compared to $80.6 million for the year
ended December 31, 2017, a decrease of $0.5 million, or 1%. The decrease in mortgages revenue was primarily a result of
decreased revenue generated by our Connect and Custom Quote services. In the first half of 2018, we began testing and
implementation of a new consumer lead distribution model in select markets. Following full implementation of the new lead
distribution model in 2018, we delivered more transaction-ready consumer connections to our advertising lenders, which we
believe resulted in a more efficient experience for all participants. This change also resulted in certain advertising lenders
receiving fewer consumer connections. We believe the decrease in revenue generated by our Connect service was primarily a
result of the fewer consumer leads delivered in connection with our testing and initial implementation of the new consumer lead
distribution model in select markets, as well as other product iterations across our sites which also led to a decrease in leads.
In addition, we believe rising mortgage interest rates in the United States have contributed to a decrease in monetization
events within our lender advertising programs, primarily for our Custom Quote service, where we experienced lower refinance
volumes than expected. We are uncertain how interest rates will impact mortgages revenue in future periods. The number of
mortgage loan information requests submitted by consumers increased 12% to 25.4 million for the year ended December 31,
2018 from 22.7 million mortgage loan information requests submitted by consumers for the year ended December 31, 2017.
This resulted in a 18% decrease in our average revenue per loan information request for the year ended December 31,
2018 compared to the year ended December 31, 2017. The growth in loan information requests submitted by consumers
increases the likelihood of a monetization event, but there is not a direct correlation between the number of loan information
requests and mortgage revenue because loan information requests do not always result in revenue recognition.
Beginning in the fourth quarter of 2018, mortgages revenue also included an immaterial amount of revenue generated
from our mortgage originations business as a result of our acquisition of MLOA.
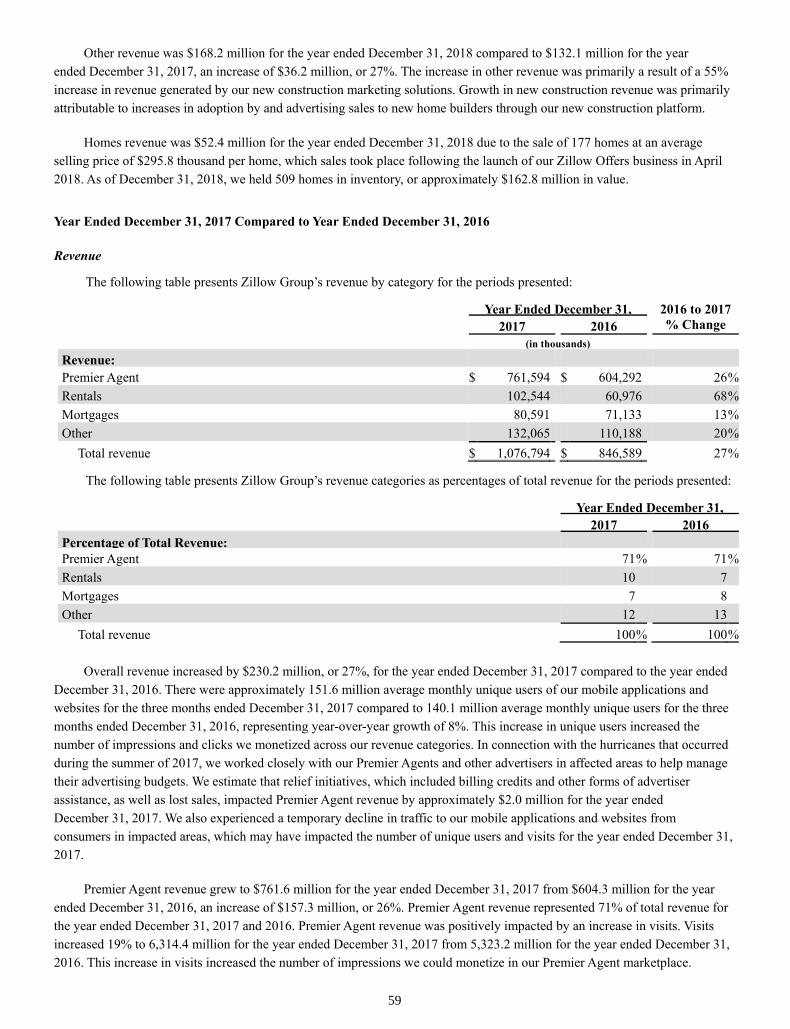
59
Other revenue was $168.2 million for the year ended December 31, 2018 compared to $132.1 million for the year
ended December 31, 2017, an increase of $36.2 million, or 27%. The increase in other revenue was primarily a result of a 55%
increase in revenue generated by our new construction marketing solutions. Growth in new construction revenue was primarily
attributable to increases in adoption by and advertising sales to new home builders through our new construction platform.
Homes revenue was $52.4 million for the year ended December 31, 2018 due to the sale of 177 homes at an average
selling price of $295.8 thousand per home, which sales took place following the launch of our Zillow Offers business in April
2018. As of December 31, 2018, we held 509 homes in inventory, or approximately $162.8 million in value.
Year Ended December 31, 2017 Compared to Year Ended December 31, 2016
Revenue
The following table presents Zillow Group’s revenue by category for the periods presented:
Year Ended December 31, 2016 to 2017
% Change 2017 2016
(in thousands) Revenue:
Premier Agent $ 761,594 $ 604,292 26 %
Rentals 102,544 60,976 68 %
Mortgages 80,591 71,133 13 %
Other 132,065 110,188 20 %
Total revenue $ 1,076,794 $ 846,589 27 %
The following table presents Zillow Group’s revenue categories as percentages of total revenue for the periods presented:
Year Ended December 31,
2017 2016
Percentage of Total Revenue:
Premier Agent 71 % 71 %
Rentals 10 7
Mortgages 7 8
Other 12 13
Total revenue 100 % 100 %
Overall revenue increased by $230.2 million, or 27%, for the year ended December 31, 2017 compared to the year ended
December 31, 2016. There were approximately 151.6 million average monthly unique users of our mobile applications and
websites for the three months ended December 31, 2017 compared to 140.1 million average monthly unique users for the three
months ended December 31, 2016, representing year-over-year growth of 8%. This increase in unique users increased the
number of impressions and clicks we monetized across our revenue categories. In connection with the hurricanes that occurred
during the summer of 2017, we worked closely with our Premier Agents and other advertisers in affected areas to help manage
their advertising budgets. We estimate that relief initiatives, which included billing credits and other forms of advertiser
assistance, as well as lost sales, impacted Premier Agent revenue by approximately $2.0 million for the year ended
December 31, 2017. We also experienced a temporary decline in traffic to our mobile applications and websites from
consumers in impacted areas, which may have impacted the number of unique users and visits for the year ended December 31,
2017.
Premier Agent revenue grew to $761.6 million for the year ended December 31, 2017 from $604.3 million for the year
ended December 31, 2016, an increase of $157.3 million, or 26%. Premier Agent revenue represented 71% of total revenue for
the year ended December 31, 2017 and 2016. Premier Agent revenue was positively impacted by an increase in visits. Visits
increased 19% to 6,314.4 million for the year ended December 31, 2017 from 5,323.2 million for the year ended December 31,
2016. This increase in visits increased the number of impressions we could monetize in our Premier Agent marketplace.

60
Premier Agent revenue per visit increased by 6% to $0.121 for the year ended December 31, 2017 from $0.114 for the year
ended December 31, 2016. We believe Premier Agent revenue was also positively impacted by the full implementation of the
auction-based pricing method we deployed for our Premier Agent and Premier Broker products in 2016 and 2017, which may
have increased demand for our advertising platform. During the year ended December 31, 2016, we began meaningful testing
and implementation of a new auction-based pricing method for our Premier Agent product, our flagship advertising product, by
which we determine the cost per impression delivered in each zip code in a dynamic way based on demand for impressions in
that zip code. In the fourth quarter of 2016, we implemented this method broadly for all existing and new agent advertisers,
including brokerages and other teams. We believe the increase in Premier Agent revenue was also due in part to increased
advertising sales to current Premier Agents, including brokerages and other teams.
Rentals revenue was $102.5 million for the year ended December 31, 2017 compared to $61.0 million for the year
ended December 31, 2016, an increase of $41.6 million, or 68%. The increase in rentals revenue was partially attributable to an
increase in the number of average monthly rental listings on our mobile applications and websites, which increased 62% to
26,315 average monthly rental listings for the year ended December 31, 2017 from 16,285 average monthly rental listings for
the year ended December 31, 2016. The increase in average monthly rental listings was primarily driven by increases in our
cost per lead and cost per click products. The revenue per average monthly rental listing increased 4% to approximately $974
for the year ended December 31, 2017 from approximately $936 for the year ended December 31, 2016.
Mortgages revenue was $80.6 million for the year ended December 31, 2017 compared to $71.1 million for the year
ended December 31, 2016, an increase in 9.5 million, or 13%. The increase in mortgages revenue was primarily a result of a
54% increase in our average revenue per loan information request for the year ended December 31, 2017 compared to the year
ended December 31, 2016. The increase in average revenue per loan information request was primarily a result of our flagship
mortgage advertising platform, Long Form (now known as Connect), which yields higher revenue than our other mortgage
advertising products, and increased consumer adoption of this platform, which was driven by product enhancements that allow
us to monetize our mortgages products more efficiently. There were approximately 22.7 million mortgage loan information
requests submitted on Zillow Group platforms by consumers for the year ended December 31, 2017 compared to 30.8 million
mortgage loan information requests submitted on Zillow Group platforms by consumers for the year ended December 31, 2016,
a decrease of 26%. We believe the decrease in the number of loan information requests submitted by consumers is due to our
strategic decision to improve loan information request quality by requiring consumers to provide more information before a
loan information request is submitted. We believe our mortgage product feature change creates a better experience for
consumers and more valuable loan information requests for our lender advertisers.
Other revenue was $132.1 million for the year ended December 31, 2017 compared to $110.2 million for the year
ended December 31, 2016, an increase of $21.9 million, or 20%. The increase in other revenue was primarily a result of a 67%
increase in revenue generated by our new construction marketing solutions. Growth in new construction revenue was primarily
attributable to increases in adoption by and advertising sales to new home builders through our new construction platform.
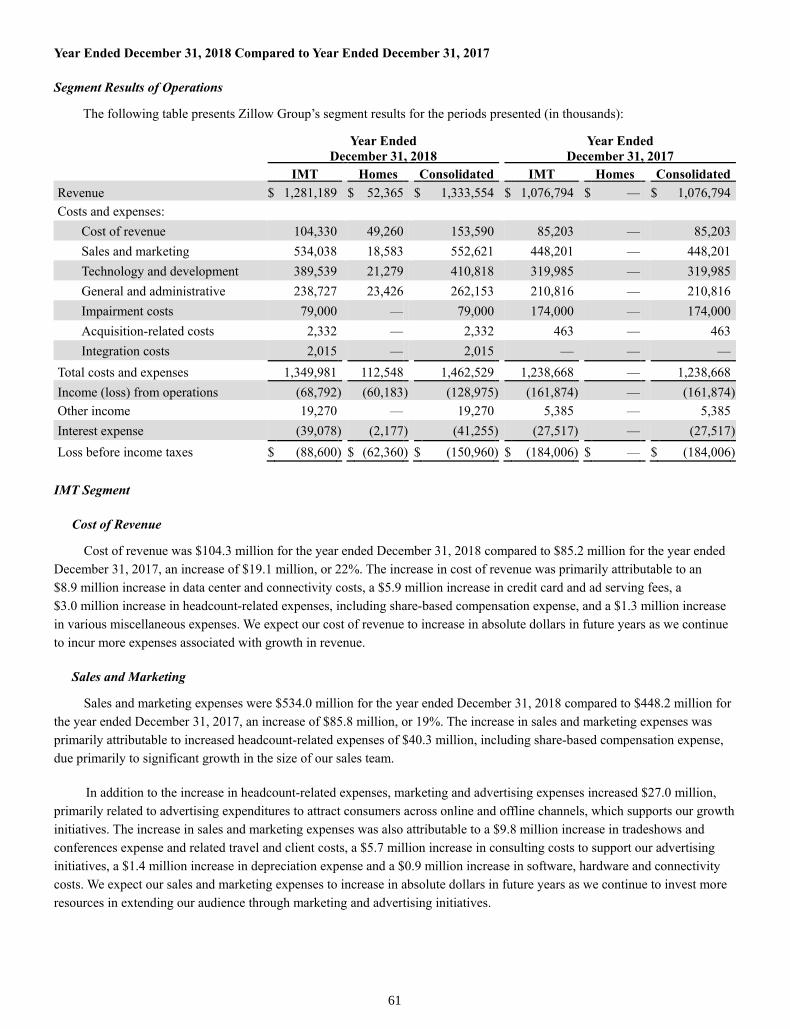
61
Year Ended December 31, 2018 Compared to Year Ended December 31, 2017
Segment Results of Operations
The following table presents Zillow Group’s segment results for the periods presented (in thousands):
Year Ended
December 31, 2018 Year Ended
December 31, 2017
IMT Homes Consolidated IMT Homes Consolidated
Revenue $ 1,281,189 $ 52,365 $ 1,333,554 $ 1,076,794 $ — $ 1,076,794
Costs and expenses:
Cost of revenue 104,330 49,260 153,590 85,203 — 85,203
Sales and marketing 534,038 18,583 552,621 448,201 — 448,201
Technology and development 389,539 21,279 410,818 319,985 — 319,985
General and administrative 238,727 23,426 262,153 210,816 — 210,816
Impairment costs 79,000 — 79,000 174,000 — 174,000
Acquisition-related costs 2,332 — 2,332 463 — 463
Integration costs 2,015 — 2,015 — — —
Total costs and expenses 1,349,981 112,548 1,462,529 1,238,668 — 1,238,668
Income (loss) from operations (68,792 ) (60,183 ) (128,975 ) (161,874 ) — (161,874 )
Other income 19,270 — 19,270 5,385 — 5,385
Interest expense (39,078 ) (2,177 ) (41,255 ) (27,517 ) — (27,517 )
Loss before income taxes $ (88,600 ) $ (62,360 ) $ (150,960 ) $ (184,006 ) $ — $ (184,006 )
IMT Segment
Cost of Revenue
Cost of revenue was $104.3 million for the year ended December 31, 2018 compared to $85.2 million for the year ended
December 31, 2017, an increase of $19.1 million, or 22%. The increase in cost of revenue was primarily attributable to an
$8.9 million increase in data center and connectivity costs, a $5.9 million increase in credit card and ad serving fees, a
$3.0 million increase in headcount-related expenses, including share-based compensation expense, and a $1.3 million increase
in various miscellaneous expenses. We expect our cost of revenue to increase in absolute dollars in future years as we continue
to incur more expenses associated with growth in revenue.
Sales and Marketing
Sales and marketing expenses were $534.0 million for the year ended December 31, 2018 compared to $448.2 million for
the year ended December 31, 2017, an increase of $85.8 million, or 19%. The increase in sales and marketing expenses was
primarily attributable to increased headcount-related expenses of $40.3 million, including share-based compensation expense,
due primarily to significant growth in the size of our sales team.
In addition to the increase in headcount-related expenses, marketing and advertising expenses increased $27.0 million,
primarily related to advertising expenditures to attract consumers across online and offline channels, which supports our growth
initiatives. The increase in sales and marketing expenses was also attributable to a $9.8 million increase in tradeshows and
conferences expense and related travel and client costs, a $5.7 million increase in consulting costs to support our advertising
initiatives, a $1.4 million increase in depreciation expense and a $0.9 million increase in software, hardware and connectivity
costs. We expect our sales and marketing expenses to increase in absolute dollars in future years as we continue to invest more
resources in extending our audience through marketing and advertising initiatives.
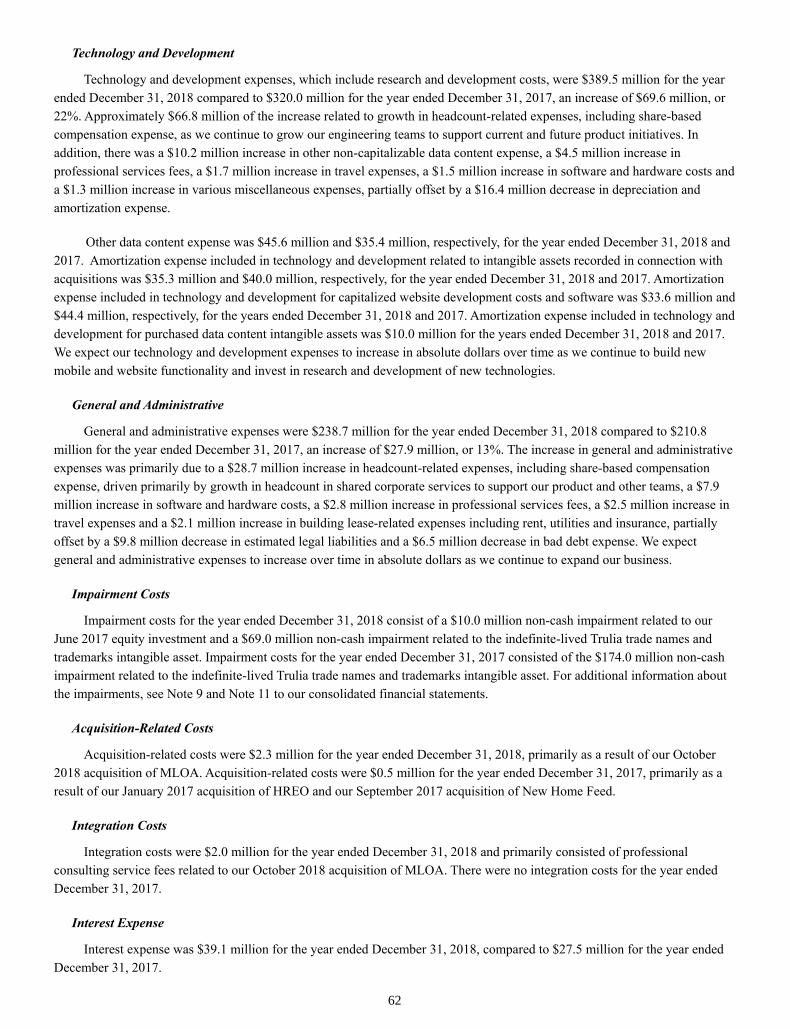
62
Technology and Development
Technology and development expenses, which include research and development costs, were $389.5 million for the year
ended December 31, 2018 compared to $320.0 million for the year ended December 31, 2017, an increase of $69.6 million, or
22%. Approximately $66.8 million of the increase related to growth in headcount-related expenses, including share-based
compensation expense, as we continue to grow our engineering teams to support current and future product initiatives. In
addition, there was a $10.2 million increase in other non-capitalizable data content expense, a $4.5 million increase in
professional services fees, a $1.7 million increase in travel expenses, a $1.5 million increase in software and hardware costs and
a $1.3 million increase in various miscellaneous expenses, partially offset by a $16.4 million decrease in depreciation and
amortization expense.
Other data content expense was $45.6 million and $35.4 million, respectively, for the year ended December 31, 2018 and
2017. Amortization expense included in technology and development related to intangible assets recorded in connection with
acquisitions was $35.3 million and $40.0 million, respectively, for the year ended December 31, 2018 and 2017. Amortization
expense included in technology and development for capitalized website development costs and software was $33.6 million and
$44.4 million, respectively, for the years ended December 31, 2018 and 2017. Amortization expense included in technology and
development for purchased data content intangible assets was $10.0 million for the years ended December 31, 2018 and 2017.
We expect our technology and development expenses to increase in absolute dollars over time as we continue to build new
mobile and website functionality and invest in research and development of new technologies.
General and Administrative
General and administrative expenses were $238.7 million for the year ended December 31, 2018 compared to $210.8
million for the year ended December 31, 2017, an increase of $27.9 million, or 13%. The increase in general and administrative
expenses was primarily due to a $28.7 million increase in headcount-related expenses, including share-based compensation
expense, driven primarily by growth in headcount in shared corporate services to support our product and other teams, a $7.9
million increase in software and hardware costs, a $2.8 million increase in professional services fees, a $2.5 million increase in
travel expenses and a $2.1 million increase in building lease-related expenses including rent, utilities and insurance, partially
offset by a $9.8 million decrease in estimated legal liabilities and a $6.5 million decrease in bad debt expense. We expect
general and administrative expenses to increase over time in absolute dollars as we continue to expand our business.
Impairment Costs
Impairment costs for the year ended December 31, 2018 consist of a $10.0 million non-cash impairment related to our
June 2017 equity investment and a $69.0 million non-cash impairment related to the indefinite-lived Trulia trade names and
trademarks intangible asset. Impairment costs for the year ended December 31, 2017 consisted of the $174.0 million non-cash
impairment related to the indefinite-lived Trulia trade names and trademarks intangible asset. For additional information about
the impairments, see Note 9 and Note 11 to our consolidated financial statements.
Acquisition-Related Costs
Acquisition-related costs were $2.3 million for the year ended December 31, 2018, primarily as a result of our October
2018 acquisition of MLOA. Acquisition-related costs were $0.5 million for the year ended December 31, 2017, primarily as a
result of our January 2017 acquisition of HREO and our September 2017 acquisition of New Home Feed.
Integration Costs
Integration costs were $2.0 million for the year ended December 31, 2018 and primarily consisted of professional
consulting service fees related to our October 2018 acquisition of MLOA. There were no integration costs for the year ended
December 31, 2017.
Interest Expense
Interest expense was $39.1 million for the year ended December 31, 2018, compared to $27.5 million for the year ended
December 31, 2017.

63
For the year ended December 31, 2018, interest expense primarily related to the 2021 Notes and the 2023 Notes, as well
as interest on both the acquired MLOA warehouse lines of credit. As a result of the issuance of the 2023 Notes on July 3, 2018,
we expect that our interest expense for the IMT segment will increase in future periods related to the contractual coupon
interest and amortization of debt discount and debt issuance costs that will be recognized in interest expense. We also expect
interest expense to increase in future periods in line with the expansion of our mortgage originations business.
For the year ended December 31, 2017, interest expense primarily related to the 2021 Notes that were issued on
December 12, 2016. For additional information regarding the 2021 Notes and the 2023 Notes, see Note 14 to our consolidated
financial statements.
Homes Segment
Cost of Revenue
Cost of revenue was $49.3 million for the year ended December 31, 2018. Cost of revenue was primarily attributable to
home acquisition and renovation costs related to the 177 homes that we sold during the year. We expect cost of revenue to
increase in absolute dollars in future years as we continue to incur more expenses associated with growth in revenue and
expansion of Zillow Offers into new geographic markets.
Sales and Marketing
Sales and marketing expenses were $18.6 million for the year ended December 31, 2018. Sales and marketing expenses
were primarily attributable to $10.9 million in headcount-related expenses, including share-based compensation expense, $2.3
million of selling expenses directly attributable to the resale of homes, $1.9 million of holding costs, $1.3 million of marketing
and advertising expenses, $1.0 million in tradeshows and conferences expense and related travel costs and $1.2 million in
miscellaneous expenses. We expect our sales and marketing expenses to increase in absolute dollars in future periods as we
continue to expand the Homes segment.
Technology and Development
Technology and development expenses were $21.3 million for the year ended December 31, 2018. Technology and
development expenses were primarily due to $19.8 million in headcount-related expenses, including share-based compensation
expense and $1.5 million in miscellaneous expenses, as we continue to grow our teams to support the Homes segment. We
expect our technology and development expenses to increase in absolute dollars in future periods as we continue to build new
website functionality and other technologies that will facilitate the purchasing and sales processes related to our Homes
segment.
General and Administrative
General and administrative expenses were $23.4 million for the year ended December 31, 2018. General and
administrative expenses were primarily due to $18.0 million in headcount-related expenses, including share-based
compensation expense, as we continue to grow our teams to support the Homes segment. In addition, we incurred $2.5 million
in building lease-related expenses including rent, utilities and insurance, $0.9 million in professional services fees, $0.8 million
in software and hardware costs and $1.2 million in miscellaneous expenses. We expect general and administrative expenses to
increase in absolute dollars in future periods as we continue to expand our Homes business.

64
Year Ended December 31, 2017 Compared to Year Ended December 31, 2016
Segment Results of Operations
The following table presents Zillow Group’s segment results for the periods presented (in thousands):
Year Ended
December 31, 2017 Year Ended
December 31, 2016
IMT Homes Consolidated IMT Homes Consolidated
Revenue $ 1,076,794 $ — $ 1,076,794 $ 846,589 $ — $ 846,589
Costs and expenses:
Cost of revenue 85,203 — 85,203 69,262 — 69,262
Sales and marketing 448,201 — 448,201 382,419 — 382,419
Technology and development 319,985 — 319,985 255,583 — 255,583
General and administrative 210,816 — 210,816 332,007 — 332,007
Impairment costs 174,000 — 174,000 — — —
Acquisition-related costs 463 — 463 1,423 — 1,423
Gain on divestiture of business — — — (1,251 ) (1,251 )
Total costs and expenses 1,238,668 — 1,238,668 1,039,443 — 1,039,443
Loss from operations (161,874 ) — (161,874 ) (192,854 ) — (192,854 )
Loss on debt extinguishment — — — (22,757 ) — (22,757 )
Other income 5,385 — 5,385 2,711 — 2,711
Interest expense (27,517 ) — (27,517 ) (7,408 ) — (7,408 )
Loss before income taxes $ (184,006 ) $ — $ (184,006 ) $ (220,308 ) $ — $ (220,308 )
IMT Segment
Cost of Revenue
Cost of revenue was $85.2 million for the year ended December 31, 2017 compared to $69.3 million for the year ended
December 31, 2016, an increase of $15.9 million, or 23%. The increase in cost of revenue was primarily attributable to a
$7.9 million increase in revenue share costs, a $4.8 million increase in data center and connectivity costs, a $1.0 million
increase in headcount-related expenses, including share-based compensation expense, a $0.8 million increase in credit card and
ad serving fees and a $1.4 million increase in various miscellaneous expenses.
Sales and Marketing
Sales and marketing expenses were $448.2 million for the year ended December 31, 2017 compared to $382.4 million for
the year ended December 31, 2016, an increase of $65.8 million, or 17%. The increase in sales and marketing expenses was
primarily attributable to increased marketing and advertising expenses of $34.2 million, primarily related to advertising spend
to attract consumers across online and offline channels, which supports our growth initiatives.
In addition to the increases in marketing and advertising, headcount-related expenses increased $20.5 million, including
share-based compensation expense, due primarily to significant growth in the size of our sales team. The increase in sales and
marketing expenses was also attributable to a $6.0 million increase in tradeshows and conferences expense and related travel
costs, a $2.5 million increase in consulting costs to support our advertising initiatives, a $1.1 million increase in software,
hardware and connectivity costs, and a $1.5 million increase in various miscellaneous expenses.

65
Technology and Development
Technology and development expenses, which include research and development costs, were $320.0 million for the year
ended December 31, 2017 compared to $255.6 million for the year ended December 31, 2016, an increase of $64.4 million, or
25%. Approximately $44.3 million of the increase related to growth in headcount-related expenses, including share-based
compensation expense, as we continue to grow our engineering teams to support current and future product initiatives. In
addition, there was a $10.0 million increase in other non-capitalizable data content expense, a $5.4 million increase in the
amortization of purchased data content intangible assets, a $1.3 million increase in amortization of acquired intangible assets, a
$1.1 million increase in software and hardware costs, and a $2.3 million increase in various miscellaneous expenses.
Amortization expense included in technology and development for capitalized website development costs and software
was $44.4 million and $43.8 million, respectively, for the year ended December 31, 2017 and 2016. Amortization expense
included in technology and development related to intangible assets recorded in connection with acquisitions was
$40.0 million and $38.7 million, respectively, for the year ended December 31, 2017 and 2016. Other data content expense was
$35.4 million and $25.5 million, respectively, for the year ended December 31, 2017 and 2016. Amortization expense included
in technology and development for purchased data content intangible assets was $10.0 million and $4.6 million, respectively,
for the year ended December 31, 2017 and 2016.
General and Administrative
General and administrative expenses were $210.8 million for the year ended December 31, 2017 compared to $332.0
million for the year ended December 31, 2016, a decrease of $121.2 million, or 37%. The decrease in general and
administrative expenses was primarily a result of the settlement of a lawsuit with Move, Inc. and certain related entities
(collectively, “Move”) in June 2016 whereby the Company paid $130.0 million in connection with a release of all claims. In
addition, there was a $31.1 million decrease in professional services fees, primarily as a result of our settlement of litigation
with Move, as we incurred $28.8 million in legal costs related to our litigation with Move for the year ended December 31,
2016. These decreases were partially offset by a $10.9 million increase in headcount-related expenses, including share-based
compensation expense, driven primarily by growth in headcount in shared corporate services to support our engineering and
other teams, a $7.5 million increase in building lease-related expenses including rent, utilities and insurance, a
$6.0 million increase in estimated legal liabilities, a $4.7 million increase in bad debt expense, a $3.7 million increase in city
and state taxes, a $2.9 million increase in software and hardware costs, a $2.0 million increase in the loss on disposal of assets,
a $1.0 million increase in travel expenses, and a $1.2 million increase in miscellaneous general and administrative expenses.
Impairment Costs
Impairment costs for the year ended December 31, 2017 consist of the $174.0 million non-cash impairment related to
the $351.0 million indefinite-lived intangible asset that we recorded in connection with our February 2015 acquisition of Trulia
for Trulia’s trade names and trademarks. For additional information about the impairment, see Note 11 to our consolidated
financial statements. There were no impairment costs for the year ended December 31, 2016.
Acquisition-Related Costs
Acquisition-related costs were $0.5 million for the year ended December 31, 2017, primarily as a result of our January
2017 acquisition of HREO and our September 2017 acquisition of New Home Feed. Acquisition-related costs were $1.4
million for the year ended December 31, 2016 as a result of our February 2016 acquisition of Naked Apartments and our
August 2016 acquisition of Bridge Interactive.
Gain on Divestiture of Business
There was no gain on divestiture of business for the year ended December 31, 2017. The gain on divestiture of business of
$1.3 million for the year ended December 31, 2016 related to the August 2016 sale of our Diverse Solutions business.

66
Loss on Debt Extinguishment
There was no loss on debt extinguishment for the year ended December 31, 2017. The loss on debt extinguishment was
$22.8 million for the year ended December 31, 2016 and related to the partial repurchase of the 2020 Notes in December 2016.
Interest Expense
Interest expense was $27.5 million for the year ended December 31, 2017, compared to $7.4 million for the year ended
December 31, 2016. For the year ended December 31, 2017, interest expense primarily related to the 2021 Notes that were
issued on December 12, 2016. For the year ended December 31, 2016, interest expense primarily related to the 2020 Notes that
we guaranteed in connection with the February 2015 acquisition of Trulia. For additional information regarding the 2020 Notes
and the 2021 Notes, see Note 14 to our consolidated financial statements.
Homes Segment
We have not presented details for the Homes segment for the years ended December 31, 2017 and 2016 as we had only
one operating and reportable segment prior to 2018.
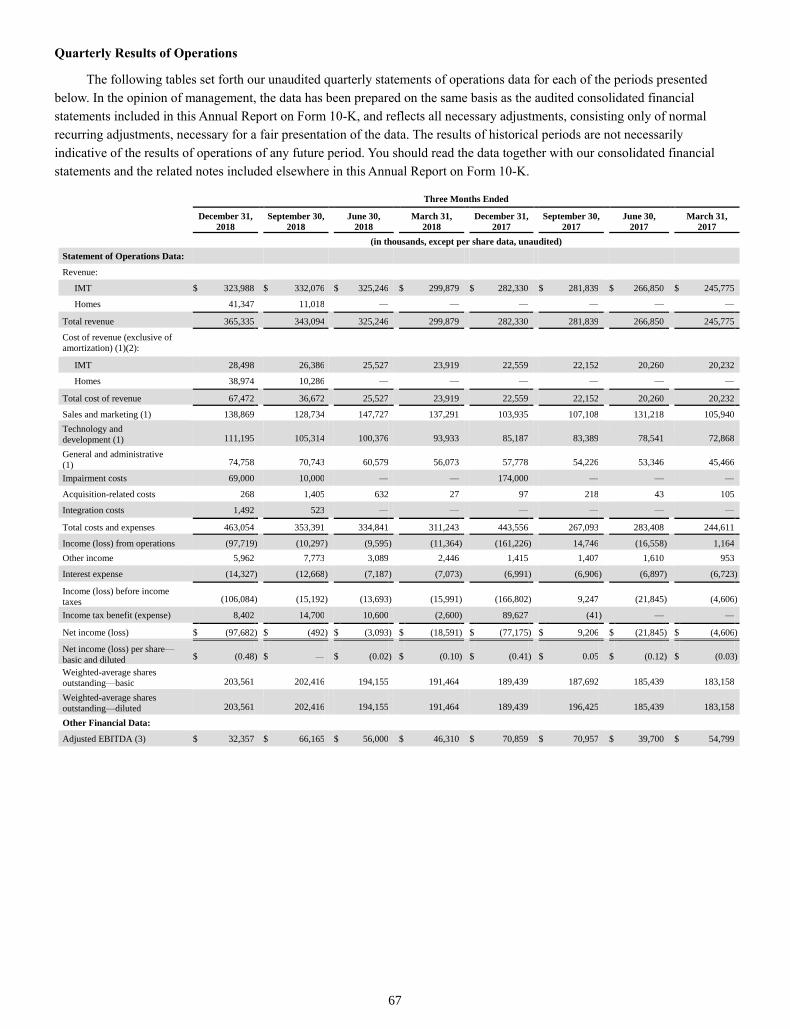
67
Quarterly Results of Operations
The following tables set forth our unaudited quarterly statements of operations data for each of the periods presented
below. In the opinion of management, the data has been prepared on the same basis as the audited consolidated financial
statements included in this Annual Report on Form 10-K, and reflects all necessary adjustments, consisting only of normal
recurring adjustments, necessary for a fair presentation of the data. The results of historical periods are not necessarily
indicative of the results of operations of any future period. You should read the data together with our consolidated financial
statements and the related notes included elsewhere in this Annual Report on Form 10-K.
Three Months Ended
December 31,
2018 September 30,
2018 June 30,
2018 March 31,
2018 December 31,
2017 September 30,
2017 June 30,
2017 March 31,
2017
(in thousands, except per share data, unaudited)
Statement of Operations Data: Revenue:
IMT $ 323,988 $ 332,076 $ 325,246 $ 299,879 $ 282,330 $ 281,839 $ 266,850 $ 245,775 Homes 41,347 11,018 — — — — — —
Total revenue 365,335 343,094 325,246 299,879 282,330 281,839 266,850 245,775 Cost of revenue (exclusive of
amortization) (1)(2):
IMT 28,498 26,386 25,527 23,919 22,559 22,152 20,260 20,232 Homes 38,974 10,286 — — — — — —
Total cost of revenue 67,472 36,672 25,527 23,919 22,559 22,152 20,260 20,232 Sales and marketing (1) 138,869 128,734 147,727 137,291 103,935 107,108 131,218 105,940 Technology and
development (1) 111,195 105,314
100,376
93,933
85,187
83,389
78,541
72,868
General and administrative
(1) 74,758 70,743
60,579 56,073
57,778 54,226
53,346 45,466
Impairment costs 69,000 10,000 — — 174,000 — — — Acquisition-related costs 268 1,405 632 27 97 218 43 105 Integration costs 1,492 523 — — — — — —
Total costs and expenses 463,054 353,391 334,841 311,243 443,556 267,093 283,408 244,611 Income (loss) from operations (97,719 ) (10,297 ) (9,595 ) (11,364 ) (161,226 ) 14,746 (16,558 ) 1,164 Other income 5,962 7,773 3,089 2,446 1,415 1,407 1,610 953 Interest expense (14,327 ) (12,668 ) (7,187 ) (7,073 ) (6,991 ) (6,906 ) (6,897 ) (6,723 )
Income (loss) before income
taxes (106,084 ) (15,192 ) (13,693 ) (15,991 ) (166,802 ) 9,247 (21,845 ) (4,606 )
Income tax benefit (expense) 8,402 14,700 10,600 (2,600 ) 89,627 (41 ) — —
Net income (loss) $ (97,682 ) $ (492 ) $ (3,093 ) $ (18,591 ) $ (77,175 ) $ 9,206 $ (21,845 ) $ (4,606 )
Net income (loss) per share—
basic and diluted $ (0.48 ) $ — $ (0.02 ) $ (0.10 ) $ (0.41 ) $ 0.05
$ (0.12 ) $ (0.03 )
Weighted-average shares
outstanding—basic 203,561 202,416
194,155
191,464
189,439
187,692
185,439
183,158
Weighted-average shares
outstanding—diluted 203,561 202,416
194,155
191,464
189,439
196,425
185,439
183,158
Other Financial Data: Adjusted EBITDA (3) $ 32,357 $ 66,165 $ 56,000 $ 46,310 $ 70,859 $ 70,957 $ 39,700 $ 54,799
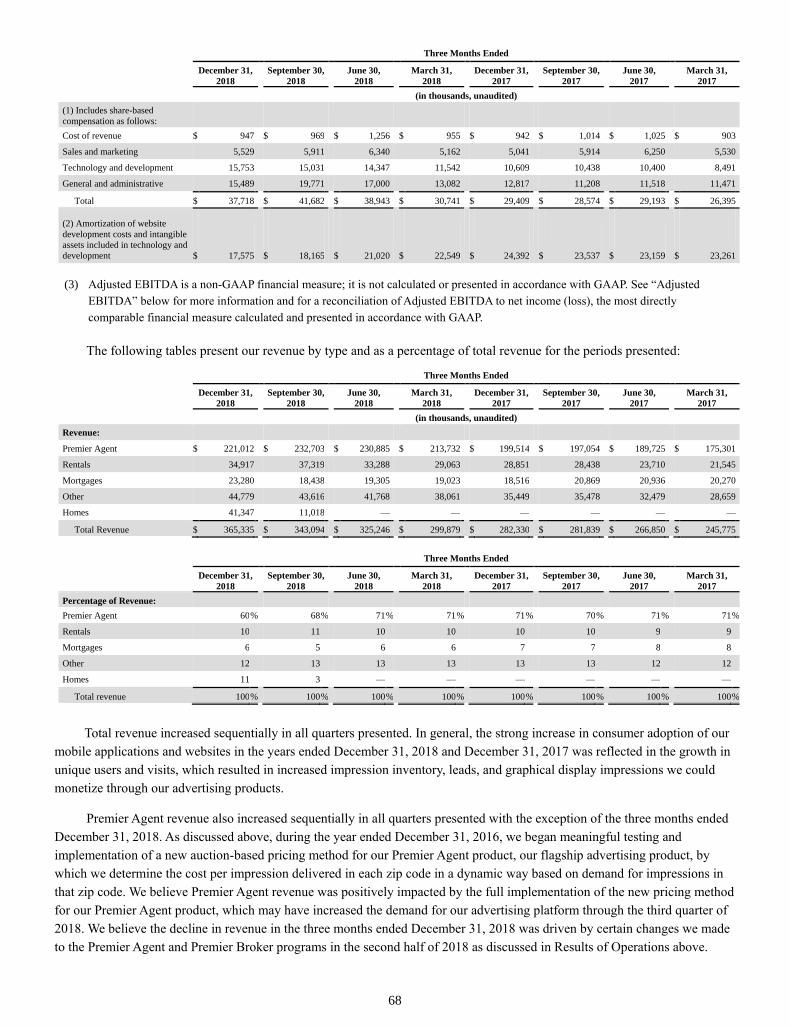
68
Three Months Ended
December 31,
2018 September 30,
2018 June 30,
2018 March 31,
2018 December 31,
2017 September 30,
2017 June 30,
2017 March 31,
2017
(in thousands, unaudited)
(1) Includes share-based
compensation as follows:
Cost of revenue $ 947 $ 969 $ 1,256 $ 955 $ 942 $ 1,014 $ 1,025 $ 903 Sales and marketing 5,529 5,911 6,340 5,162 5,041 5,914 6,250 5,530 Technology and development 15,753 15,031 14,347 11,542 10,609 10,438 10,400 8,491 General and administrative 15,489 19,771 17,000 13,082 12,817 11,208 11,518 11,471
Total $ 37,718 $ 41,682 $ 38,943 $ 30,741 $ 29,409 $ 28,574 $ 29,193 $ 26,395
(2) Amortization of website
development costs and intangible
assets included in technology and
development $ 17,575
$ 18,165
$ 21,020
$ 22,549
$ 24,392
$ 23,537
$ 23,159
$ 23,261
(3) Adjusted EBITDA is a non-GAAP financial measure; it is not calculated or presented in accordance with GAAP. See “Adjusted
EBITDA” below for more information and for a reconciliation of Adjusted EBITDA to net income (loss), the most directly
comparable financial measure calculated and presented in accordance with GAAP.
The following tables present our revenue by type and as a percentage of total revenue for the periods presented:
Three Months Ended
December 31,
2018 September 30,
2018 June 30,
2018 March 31,
2018 December 31,
2017 September 30,
2017 June 30,
2017 March 31,
2017
(in thousands, unaudited)
Revenue: Premier Agent $ 221,012 $ 232,703 $ 230,885 $ 213,732 $ 199,514 $ 197,054 $ 189,725 $ 175,301 Rentals 34,917 37,319 33,288 29,063 28,851 28,438 23,710 21,545 Mortgages 23,280 18,438 19,305 19,023 18,516 20,869 20,936 20,270 Other 44,779 43,616 41,768 38,061 35,449 35,478 32,479 28,659 Homes 41,347 11,018 — — — — — —
Total Revenue $ 365,335 $ 343,094 $ 325,246 $ 299,879 $ 282,330 $ 281,839 $ 266,850 $ 245,775
Three Months Ended
December 31,
2018 September 30,
2018 June 30,
2018 March 31,
2018 December 31,
2017 September 30,
2017 June 30,
2017 March 31,
2017
Percentage of Revenue: Premier Agent 60 % 68 % 71 % 71 % 71 % 70 % 71 % 71 %
Rentals 10 11 10 10 10 10 9 9 Mortgages 6 5 6 6 7 7 8 8 Other 12 13 13 13 13 13 12 12 Homes 11 3 — — — — — —
Total revenue 100 % 100 % 100 % 100 % 100 % 100 % 100 % 100 %
Total revenue increased sequentially in all quarters presented. In general, the strong increase in consumer adoption of our
mobile applications and websites in the years ended December 31, 2018 and December 31, 2017 was reflected in the growth in
unique users and visits, which resulted in increased impression inventory, leads, and graphical display impressions we could
monetize through our advertising products.
Premier Agent revenue also increased sequentially in all quarters presented with the exception of the three months ended
December 31, 2018. As discussed above, during the year ended December 31, 2016, we began meaningful testing and
implementation of a new auction-based pricing method for our Premier Agent product, our flagship advertising product, by
which we determine the cost per impression delivered in each zip code in a dynamic way based on demand for impressions in
that zip code. We believe Premier Agent revenue was positively impacted by the full implementation of the new pricing method
for our Premier Agent product, which may have increased the demand for our advertising platform through the third quarter of
2018. We believe the decline in revenue in the three months ended December 31, 2018 was driven by certain changes we made
to the Premier Agent and Premier Broker programs in the second half of 2018 as discussed in Results of Operations above.
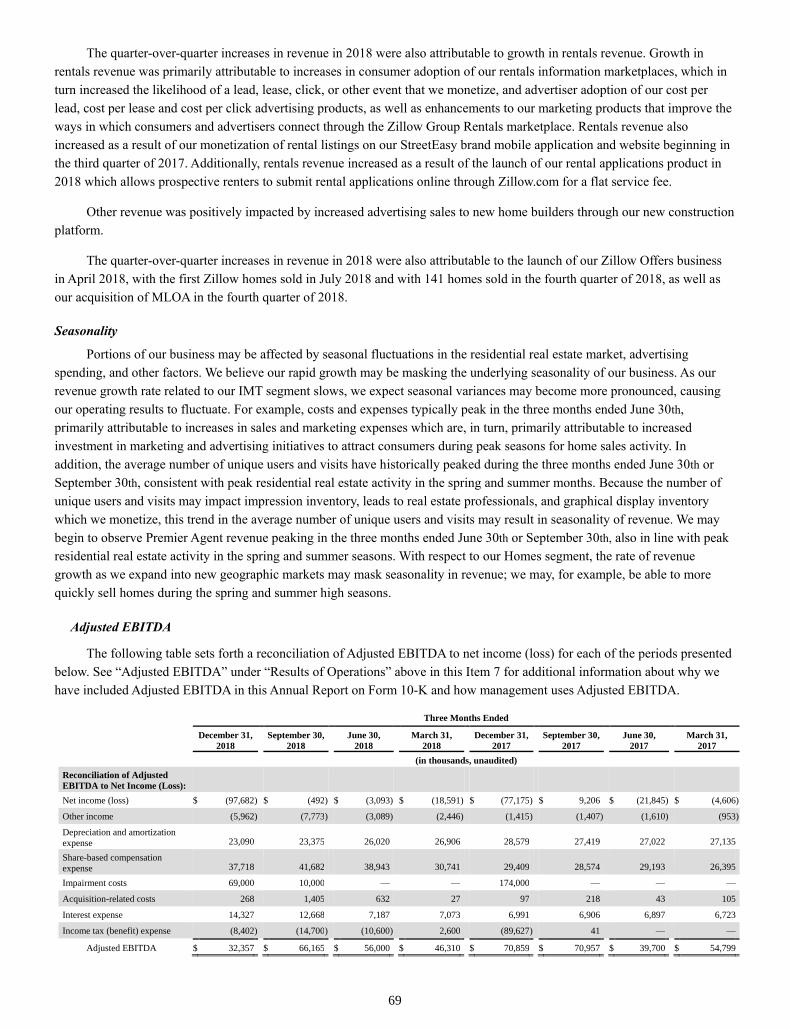
69
The quarter-over-quarter increases in revenue in 2018 were also attributable to growth in rentals revenue. Growth in
rentals revenue was primarily attributable to increases in consumer adoption of our rentals information marketplaces, which in
turn increased the likelihood of a lead, lease, click, or other event that we monetize, and advertiser adoption of our cost per
lead, cost per lease and cost per click advertising products, as well as enhancements to our marketing products that improve the
ways in which consumers and advertisers connect through the Zillow Group Rentals marketplace. Rentals revenue also
increased as a result of our monetization of rental listings on our StreetEasy brand mobile application and website beginning in
the third quarter of 2017. Additionally, rentals revenue increased as a result of the launch of our rental applications product in
2018 which allows prospective renters to submit rental applications online through Zillow.com for a flat service fee.
Other revenue was positively impacted by increased advertising sales to new home builders through our new construction
platform.
The quarter-over-quarter increases in revenue in 2018 were also attributable to the launch of our Zillow Offers business
in April 2018, with the first Zillow homes sold in July 2018 and with 141 homes sold in the fourth quarter of 2018, as well as
our acquisition of MLOA in the fourth quarter of 2018.
Seasonality
Portions of our business may be affected by seasonal fluctuations in the residential real estate market, advertising
spending, and other factors. We believe our rapid growth may be masking the underlying seasonality of our business. As our
revenue growth rate related to our IMT segment slows, we expect seasonal variances may become more pronounced, causing
our operating results to fluctuate. For example, costs and expenses typically peak in the three months ended June 30th,
primarily attributable to increases in sales and marketing expenses which are, in turn, primarily attributable to increased
investment in marketing and advertising initiatives to attract consumers during peak seasons for home sales activity. In
addition, the average number of unique users and visits have historically peaked during the three months ended June 30th or
September 30th, consistent with peak residential real estate activity in the spring and summer months. Because the number of
unique users and visits may impact impression inventory, leads to real estate professionals, and graphical display inventory
which we monetize, this trend in the average number of unique users and visits may result in seasonality of revenue. We may
begin to observe Premier Agent revenue peaking in the three months ended June 30th or September 30th, also in line with peak
residential real estate activity in the spring and summer seasons. With respect to our Homes segment, the rate of revenue
growth as we expand into new geographic markets may mask seasonality in revenue; we may, for example, be able to more
quickly sell homes during the spring and summer high seasons.
Adjusted EBITDA
The following table sets forth a reconciliation of Adjusted EBITDA to net income (loss) for each of the periods presented
below. See “Adjusted EBITDA” under “Results of Operations” above in this Item 7 for additional information about why we
have included Adjusted EBITDA in this Annual Report on Form 10-K and how management uses Adjusted EBITDA.
Three Months Ended
December 31,
2018 September 30,
2018 June 30,
2018 March 31,
2018 December 31,
2017 September 30,
2017 June 30,
2017 March 31,
2017
(in thousands, unaudited)
Reconciliation of Adjusted
EBITDA to Net Income (Loss):
Net income (loss) $ (97,682 ) $ (492 ) $ (3,093 ) $ (18,591 ) $ (77,175 ) $ 9,206 $ (21,845 ) $ (4,606 )
Other income (5,962 ) (7,773 ) (3,089 ) (2,446 ) (1,415 ) (1,407 ) (1,610 ) (953 )
Depreciation and amortization
expense 23,090 23,375
26,020
26,906
28,579
27,419
27,022
27,135
Share-based compensation
expense 37,718 41,682
38,943
30,741
29,409
28,574
29,193
26,395
Impairment costs 69,000 10,000 — — 174,000 — — — Acquisition-related costs 268 1,405 632 27 97 218 43 105 Interest expense 14,327 12,668 7,187 7,073 6,991 6,906 6,897 6,723 Income tax (benefit) expense (8,402 ) (14,700 ) (10,600 ) 2,600 (89,627 ) 41 — —
Adjusted EBITDA $ 32,357 $ 66,165 $ 56,000 $ 46,310 $ 70,859 $ 70,957 $ 39,700 $ 54,799
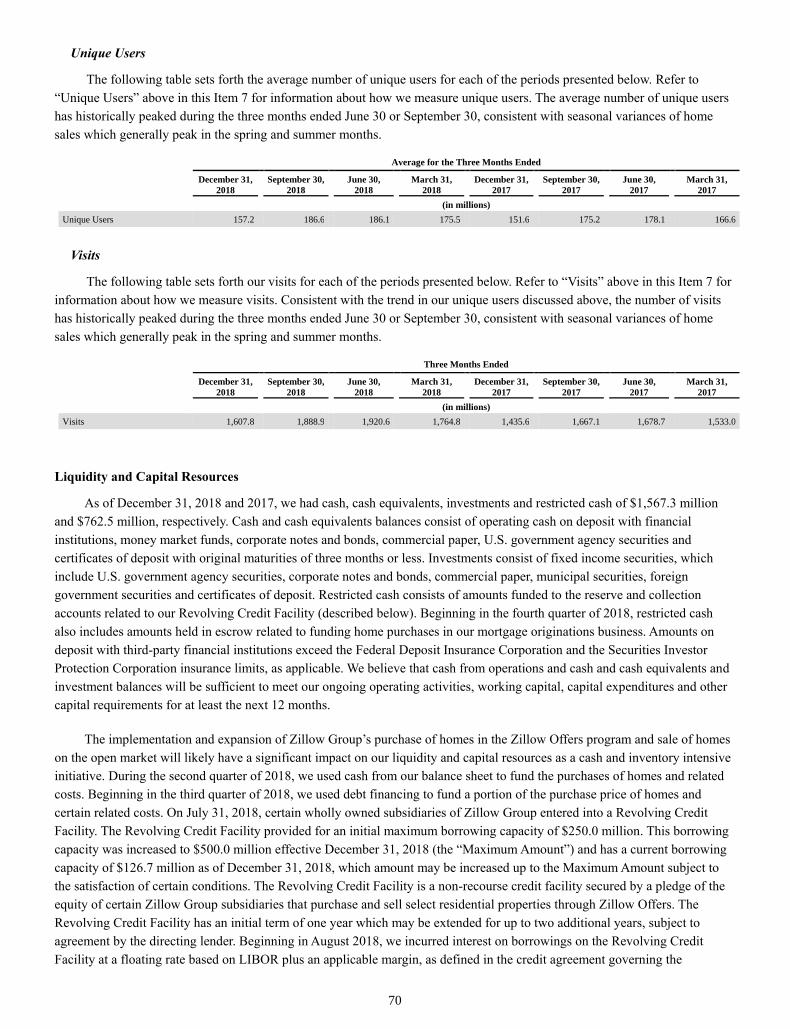
70
Unique Users
The following table sets forth the average number of unique users for each of the periods presented below. Refer to
“Unique Users” above in this Item 7 for information about how we measure unique users. The average number of unique users
has historically peaked during the three months ended June 30 or September 30, consistent with seasonal variances of home
sales which generally peak in the spring and summer months.
Average for the Three Months Ended
December 31,
2018 September 30,
2018 June 30,
2018 March 31,
2018 December 31,
2017 September 30,
2017 June 30,
2017 March 31,
2017
(in millions)
Unique Users 157.2 186.6 186.1 175.5 151.6 175.2 178.1 166.6
Visits
The following table sets forth our visits for each of the periods presented below. Refer to “Visits” above in this Item 7 for
information about how we measure visits. Consistent with the trend in our unique users discussed above, the number of visits
has historically peaked during the three months ended June 30 or September 30, consistent with seasonal variances of home
sales which generally peak in the spring and summer months.
Three Months Ended
December 31,
2018 September 30,
2018 June 30,
2018 March 31,
2018 December 31,
2017 September 30,
2017 June 30,
2017 March 31,
2017
(in millions)
Visits 1,607.8 1,888.9 1,920.6 1,764.8 1,435.6 1,667.1 1,678.7 1,533.0
Liquidity and Capital Resources
As of December 31, 2018 and 2017, we had cash, cash equivalents, investments and restricted cash of $1,567.3 million
and $762.5 million, respectively. Cash and cash equivalents balances consist of operating cash on deposit with financial
institutions, money market funds, corporate notes and bonds, commercial paper, U.S. government agency securities and
certificates of deposit with original maturities of three months or less. Investments consist of fixed income securities, which
include U.S. government agency securities, corporate notes and bonds, commercial paper, municipal securities, foreign
government securities and certificates of deposit. Restricted cash consists of amounts funded to the reserve and collection
accounts related to our Revolving Credit Facility (described below). Beginning in the fourth quarter of 2018, restricted cash
also includes amounts held in escrow related to funding home purchases in our mortgage originations business. Amounts on
deposit with third-party financial institutions exceed the Federal Deposit Insurance Corporation and the Securities Investor
Protection Corporation insurance limits, as applicable. We believe that cash from operations and cash and cash equivalents and
investment balances will be sufficient to meet our ongoing operating activities, working capital, capital expenditures and other
capital requirements for at least the next 12 months.
The implementation and expansion of Zillow Group’s purchase of homes in the Zillow Offers program and sale of homes
on the open market will likely have a significant impact on our liquidity and capital resources as a cash and inventory intensive
initiative. During the second quarter of 2018, we used cash from our balance sheet to fund the purchases of homes and related
costs. Beginning in the third quarter of 2018, we used debt financing to fund a portion of the purchase price of homes and
certain related costs. On July 31, 2018, certain wholly owned subsidiaries of Zillow Group entered into a Revolving Credit
Facility. The Revolving Credit Facility provided for an initial maximum borrowing capacity of $250.0 million. This borrowing
capacity was increased to $500.0 million effective December 31, 2018 (the “Maximum Amount”) and has a current borrowing
capacity of $126.7 million as of December 31, 2018, which amount may be increased up to the Maximum Amount subject to
the satisfaction of certain conditions. The Revolving Credit Facility is a non-recourse credit facility secured by a pledge of the
equity of certain Zillow Group subsidiaries that purchase and sell select residential properties through Zillow Offers. The
Revolving Credit Facility has an initial term of one year which may be extended for up to two additional years, subject to
agreement by the directing lender. Beginning in August 2018, we incurred interest on borrowings on the Revolving Credit
Facility at a floating rate based on LIBOR plus an applicable margin, as defined in the credit agreement governing the

71
Revolving Credit Facility. The Revolving Credit Facility includes customary representations and warranties, covenants
(including financial covenants applicable to the Company), and provisions regarding events of default. For additional
information regarding the Revolving Credit Facility, see Note 14 to our consolidated financial statements.
The October 31, 2018 acquisition of MLOA will likely have a significant impact on our liquidity and capital resources as
a cash intensive business as it relates to funding mortgage loans originated for resale in the secondary market. In conjunction
with the acquisition of MLOA, we acquired two non-recourse warehouse lines of credit which we use to fund a portion of
mortgage loans originated. The borrowing capacity of the first line of credit is $50.0 million as of December 31, 2018 and
accrues interest at a floating rate based on LIBOR plus an applicable margin, as defined in the credit agreement governing the
warehouse line of credit. The borrowing capacity on the second line of credit is $50.0 million and accrues interest at a floating
rate based on LIBOR plus an applicable margin, as defined in the credit agreement governing the warehouse line of credit. Both
warehouse lines of credit include customary representations and warranties, covenants and provisions regarding events of
default. For additional information regarding these warehouse lines of credit, see Note 14 to our consolidated financial
statements.
In anticipation of the expected phaseout of LIBOR in 2021, we have performed an initial analysis of the impact the
phaseout will have on the company, in particular with respect to the Revolving Credit Facility and warehouse lines of credit
associated with MLOA. We do not believe the phaseout will have a material impact on the company, in part because the
Revolving Credit Facility includes a mechanism for the parties thereto to select an alternative index, and the warehouse lines of
credit are typically renewed annually, providing several opportunities for the parties thereto to select an alternative reference
index before the LIBOR phaseout.
We have outstanding $9.6 million aggregate principal of 2020 Notes as of December 31, 2018. The 2020 Notes were
guaranteed by Zillow Group in connection with our February 2015 acquisition of Trulia, Inc. The aggregate principal amount of
the 2020 Notes is due on December 15, 2020 if not earlier converted or redeemed. The 2020 Notes are convertible into shares
of Zillow Group Class A common stock. Interest is payable on the 2020 Notes at the rate of 2.75% semi-annually on June 15
and December 15 of each year. Holders of the 2020 Notes may convert all or any portion of their notes, in multiples of $1,000
principal amount, at their option at any time prior to the close of business on the business day immediately preceding the
maturity date. The 2020 Notes are redeemable, at our option, in whole or in part as of December 20, 2018, under certain
circumstances. For additional information regarding the 2020 Notes, see Note 14 to our consolidated financial statements.
In December 2016, Zillow Group issued $460.0 million aggregate principal amount of 2021 Notes. The 2021 Notes bear
interest at a fixed rate of 2.00% per year, payable semi-annually in arrears on June 1 and December 1 of each year. The 2021
Notes are convertible into cash, shares of our Class C capital stock or a combination thereof, at the Company’s election. The
2021 Notes will mature on December 1, 2021, unless earlier repurchased, redeemed, or converted in accordance with their
terms. Prior to the close of business on the business day immediately preceding September 1, 2021, the 2021 Notes are
convertible at the option of the holders of the 2021 Notes only under certain conditions, none of which conditions have been
satisfied as of December 31, 2018. On or after September 1, 2021, until the close of business on the second scheduled trading
day immediately preceding the maturity date, holders of the 2021 Notes may convert their 2021 Notes at their option at the
conversion rate then in effect, irrespective of these conditions. The Company will settle conversions of the 2021 Notes by
paying or delivering, as the case may be, cash, shares of Class C capital stock, or a combination of cash and shares of Class C
capital stock, at its election. The conversion rate will initially be 19.0985 shares of Class C capital stock per $1,000 principal
amount of 2021 Notes (equivalent to an initial conversion price of approximately $52.36 per share of Class C capital stock).
The conversion rate is subject to customary adjustments upon the occurrence of certain events. The Company may redeem for
cash all or part of the 2021 Notes, at its option, on or after December 6, 2019, under certain circumstances at a redemption price
equal to 100% of the principal amount of the 2021 Notes to be redeemed, plus accrued and unpaid interest to, but excluding,
the redemption date (as defined in the indenture governing the 2021 Notes). For additional information regarding the 2021
Notes, see Note 14 to our consolidated financial statements.
On July 3, 2018, we closed underwritten public offerings of (1) 6,557,017 shares of Class C capital stock of Zillow
Group, which includes 855,263 shares sold pursuant to the underwriters’ option to purchase additional shares; and (2) $373.8

72
million aggregate principal amount of Convertible Senior Notes due 2023 (the “2023 Notes”), which includes $48.8 million
principal amount of 2023 Notes sold pursuant to the underwriters’ option to purchase additional 2023 Notes. The net proceeds
from the offering of Class C capital stock and the issuance of the 2023 Notes were $360.3 million and $364.0 million,
respectively, after deducting underwriting discounts and commissions and offering expenses payable by Zillow Group. We used
$29.4 million of the net proceeds from the issuance of the 2023 Notes to pay the cost of capped call confirmations. We intend to
use the remainder of the net proceeds for general corporate purposes, which may include general and administrative matters
and capital expenditures. Additionally, we may choose to use a portion of the net proceeds to expand our current business
through acquisitions of, or investments in, other businesses, products or technologies.
The 2023 Notes bear interest at a fixed rate of 1.50% per year, payable semi-annually in arrears on January 1 and July 1
of each year, beginning on January 1, 2019. Beginning in July 2018, interest expense included interest on the 2023 Notes. The
2023 Notes are convertible into cash, shares of Class C capital stock or a combination thereof, at the Company’s election. The
2023 Notes will mature on July 1, 2023, unless earlier repurchased, redeemed, or converted in accordance with their terms.
Prior to the close of business on the business day immediately preceding April 1, 2023, the 2023 Notes are convertible at the
option of the holders only under certain conditions. On or after April 1, 2023, until the close of business on the second
scheduled trading day immediately preceding the maturity date, holders may convert their 2023 Notes at their option at the
conversion rate then in effect, irrespective of these conditions. The Company will settle conversions of the 2023 Notes by
paying or delivering, as the case may be, cash, shares of the Company’s Class C capital stock, or a combination of cash and
shares of Class C capital stock, at its election. The conversion rate will initially be 12.7592 shares of Class C capital stock per
$1,000 principal amount of 2023 Notes (equivalent to an initial conversion price of approximately $78.37 per share of Class C
capital stock). The conversion rate is subject to customary adjustments upon the occurrence of certain events. The Company
may redeem for cash all or part of the 2023 Notes, at its option, on or after July 6, 2021, under certain circumstances at a
redemption price equal to 100% of the principal amount of the 2023 Notes to be redeemed, plus accrued and unpaid interest to,
but excluding, the redemption date (as defined in the indenture governing the 2023 Notes). For additional information
regarding the 2023 Notes, see Note 14 to our consolidated financial statements.
The following table presents selected cash flow data for the periods presented:
Year Ended December 31,
2018 2017 2016
(in thousands)
Cash Flow Data:
Net cash provided by operating activities $ 3,850 $ 258,191 $ 8,645
Net cash used in investing activities (622,639 ) (247,394 ) (65,719 )
Net cash provided by financing activities 930,137 97,706 71,528
Cash Flows Provided By Operating Activities
Our operating cash flows result primarily from cash received from real estate professionals, rental professionals,
mortgage professionals and brand advertisers. Our primary uses of cash from operating activities include payments for
marketing and advertising activities, homes purchased through Zillow Offers, mortgages funded through our mortgage
originations business and employee compensation and benefits. Additionally, uses of cash from operating activities include
costs associated with operating our mobile applications and websites and other general corporate expenditures.
For the year ended December 31, 2018, net cash provided by operating activities was $3.9 million. This was primarily
driven by a net loss of $119.9 million, adjusted by share-based compensation expense of $149.1 million, depreciation and
amortization expense of $99.4 million, non-cash impairment charges totaling $79.0 million, amortization of contract cost assets
of $36.0 million, a non-cash change in our deferred income taxes of $31.1 million, amortization of the discount and issuance
costs on the 2023 Notes and 2021 Notes of $26.7 million, accretion of bond discount of $4.3 million, a loss on disposal of
property and equipment of $3.6 million and a change in deferred rent of $2.0 million. Changes in operating assets and liabilities
decreased cash provided by operating activities by $233.5 million. The changes in operating assets and liabilities are primarily
due to a $162.8 million increase in inventory due to the purchase of homes through Zillow Offers, a $41.5 million increase in
73
contract cost assets due primarily to the capitalization of sales commissions, a $34.1 million increase in prepaid expenses and
other assets driven primarily by the timing of payments, a $12.6 million increase in accounts receivable due primarily to an
increase in revenue and a $11.3 million increase in accrued compensation and benefits driven primarily by the timing of
payments.
For the year ended December 31, 2017, net cash provided by operating activities was $258.2 million. This was primarily
driven by a net loss of $94.4 million, adjusted by a non-cash impairment charge of $174.0 million, depreciation and
amortization expense of $110.2 million, share-based compensation expense of $113.6 million, an $89.6 million non-
cash change in our net deferred tax asset and valuation allowance as a result of the non-cash impairment charge and the rate
decrease included in the Tax Cuts and Jobs Act, amortization of the discount and issuance costs on the 2021 Notes of $18.0
million, an increase in bad debt expense of $7.3 million, a change in deferred rent of $7.1 million and a loss on disposal of
property and equipment of $5.7 million. Changes in operating assets and liabilities increased cash provided by operating
activities by $5.9 million. The changes in operating assets and liabilities are primarily due to a $21.2 million increase in
accounts receivable driven by an increase in revenue, a $19.0 million increase in accrued expenses and other current liabilities
due to growth in our business, partially offset by a $10.8 million decrease in prepaid expenses and other assets driven primarily
by the timing of payments.
For the year ended December 31, 2016, net cash provided by operating activities was $8.6 million. This was driven by a
net loss of $220.4 million, including the impact of the settlement of a lawsuit for $130.0 million in June 2016, adjusted by
share-based compensation expense of $106.9 million, depreciation and amortization expense of $100.6 million, a loss on debt
extinguishment of $22.8 million, a loss on disposal of property and equipment of $3.7 million, an increase in bad debt expense
of $2.7 million, an increase in the balance of deferred rent of $1.7 million, amortization of bond premium of $1.5 million, a
$1.4 million gain on the divestiture of a business, a $1.4 million non-cash change in the valuation allowance related to a
deferred tax liability generated in connection with our February 2016 acquisition of Naked Apartments, and amortization of the
discount and issuance costs on the 2021 Notes of $0.9 million. Changes in operating assets and liabilities decreased cash
provided by operating activities by $8.9 million. The decrease in operating assets and liabilities is primarily due to a $13.3
million decrease in accounts receivable driven by the timing of payments received, a $13.3 million decrease in prepaid
expenses and other assets driven by the timing of payments made, and a $12.5 million increase in accrued compensation and
benefits due primarily to an increase in sales commissions driven by increased sales as well as the timing of payroll.
Cash Flows Used In Investing Activities
Our primary investing activities include the purchase and sale or maturity of investments, the purchase of property and
equipment and intangible assets, the purchase of equity investments, net cash paid in connection with acquisitions and proceeds
from divestiture of businesses.
For the year ended December 31, 2018, net cash used in investing activities was $622.6 million. This was primarily the
result of $489.0 million of net purchases of investments in connection with investment of a portion of the net proceeds from our
July 2018 public offerings of Class C capital stock and 2023 Notes, $78.5 million of purchases for property and equipment and
intangible assets and $55.1 million of net cash paid for acquisitions, related to the October 2018 acquisition of MLOA.
For the year ended December 31, 2017, net cash used in investing activities was $247.4 million. This was primarily the
result of $147.8 million of net purchases of investments, $78.6 million of purchases for property and equipment and intangible
assets, $11.5 million paid in connection with acquisitions, and approximately $10.0 million related to the purchase of an equity
investment, partially offset by $0.6 million in proceeds from our August 2016 sale of our Diverse Solutions business.
For the year ended December 31, 2016, net cash used in investing activities was $65.7 million. This was primarily the
result of $71.7 million of purchases for property and equipment and intangible assets, $16.3 million paid in connection with our
February 2016 acquisition of Naked Apartments and our August 2016 acquisition of Bridge Interactive, $10.0 million related to
the purchase of an equity investment, partially offset by $29.1 million of net maturities and sales of investments and $3.2
million in proceeds from the divestiture of a business.

74
The increases in capital expenditures and intangible assets during all three periods reflect our continued investments in
support of business growth. We expect to continue to make significant investments in our business to provide for the continued
innovation in our products and services in 2019 and thereafter.
Cash Flows Provided By Financing Activities
For the year ended December 31, 2018, cash flows provided by financing activities includes $364.0 million of net
proceeds from the issuance of the 2023 Notes and $360.3 million of net proceeds from our Class C capital stock public
offering, partially offset by $29.4 million of premiums paid for Capped Call Confirmations. It also includes $120.1 million in
proceeds from the exercise of option awards, $116.7 million of proceeds from borrowing on the Revolving Credit Facility and
$0.5 million of proceeds from borrowing on the warehouse lines of credit associated with our October 2018 acquisition of
MLOA, partially offset by $2.0 million of contingent consideration related to prior period acquisitions.
For the year ended December 31, 2017, our financing activities primarily related to the exercise of employee option
awards. The proceeds from the exercise of option awards for the year ended December 31, 2017 were $98.1 million.
For the year ended December 31, 2016, the proceeds from the issuance of the 2021 Notes, net of issuance costs, were
$447.8 million. The Company also paid approximately $36.6 million in premiums for certain Capped Call Confirmations in
December 2016. The Company used approximately $370.2 million of the net proceeds from the issuance of the 2021 Notes to
repurchase $219.9 million aggregate principal of the 2020 Notes in privately negotiated transactions. The proceeds from the
exercise of option awards for the year ended December 31, 2016 were $31.2 million.
Off-Balance Sheet Arrangements
We did not have any off-balance sheet arrangements other than outstanding surety bonds issued for our benefit of
approximately $8.9 million and $3.7 million, respectively, as of December 31, 2018 and 2017. We do not believe that the surety
bonds will have a material effect on our liquidity, capital resources, market risk support or credit risk support. For additional
information regarding the surety bonds, see Note 19 to our consolidated financial statements under the subsection titled “Surety
Bonds”.
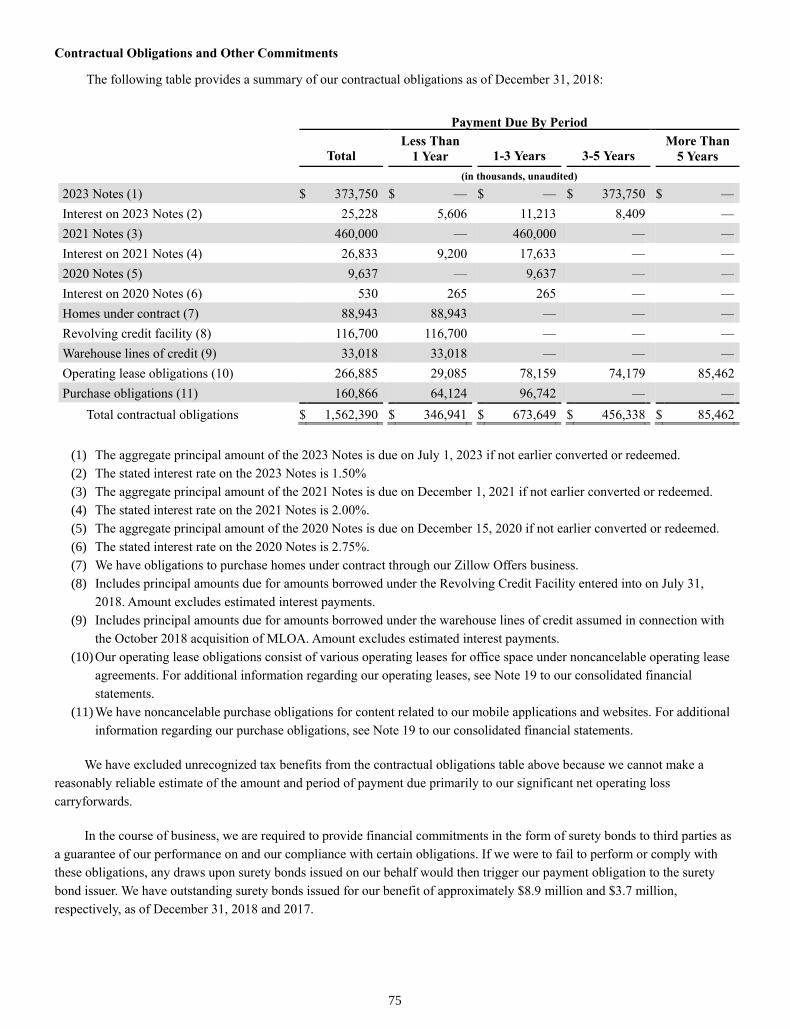
75
Contractual Obligations and Other Commitments
The following table provides a summary of our contractual obligations as of December 31, 2018:
Payment Due By Period
Total Less Than
1 Year 1-3 Years 3-5 Years More Than
5 Years
(in thousands, unaudited)
2023 Notes (1) $ 373,750 $ — $ — $ 373,750 $ —
Interest on 2023 Notes (2) 25,228 5,606 11,213 8,409 —
2021 Notes (3) 460,000 — 460,000 — —
Interest on 2021 Notes (4) 26,833 9,200 17,633 — —
2020 Notes (5) 9,637 — 9,637 — —
Interest on 2020 Notes (6) 530 265 265 — —
Homes under contract (7) 88,943 88,943 — — —
Revolving credit facility (8) 116,700 116,700 — — —
Warehouse lines of credit (9) 33,018 33,018 — — —
Operating lease obligations (10) 266,885 29,085 78,159 74,179 85,462
Purchase obligations (11) 160,866 64,124 96,742 — —
Total contractual obligations $ 1,562,390 $ 346,941 $ 673,649 $ 456,338 $ 85,462
(1) The aggregate principal amount of the 2023 Notes is due on July 1, 2023 if not earlier converted or redeemed.
(2) The stated interest rate on the 2023 Notes is 1.50%
(3) The aggregate principal amount of the 2021 Notes is due on December 1, 2021 if not earlier converted or redeemed.
(4) The stated interest rate on the 2021 Notes is 2.00%.
(5) The aggregate principal amount of the 2020 Notes is due on December 15, 2020 if not earlier converted or redeemed.
(6) The stated interest rate on the 2020 Notes is 2.75%.
(7) We have obligations to purchase homes under contract through our Zillow Offers business.
(8) Includes principal amounts due for amounts borrowed under the Revolving Credit Facility entered into on July 31,
2018. Amount excludes estimated interest payments.
(9) Includes principal amounts due for amounts borrowed under the warehouse lines of credit assumed in connection with
the October 2018 acquisition of MLOA. Amount excludes estimated interest payments.
(10) Our operating lease obligations consist of various operating leases for office space under noncancelable operating lease
agreements. For additional information regarding our operating leases, see Note 19 to our consolidated financial
statements.
(11) We have noncancelable purchase obligations for content related to our mobile applications and websites. For additional
information regarding our purchase obligations, see Note 19 to our consolidated financial statements.
We have excluded unrecognized tax benefits from the contractual obligations table above because we cannot make a
reasonably reliable estimate of the amount and period of payment due primarily to our significant net operating loss
carryforwards.
In the course of business, we are required to provide financial commitments in the form of surety bonds to third parties as
a guarantee of our performance on and our compliance with certain obligations. If we were to fail to perform or comply with
these obligations, any draws upon surety bonds issued on our behalf would then trigger our payment obligation to the surety
bond issuer. We have outstanding surety bonds issued for our benefit of approximately $8.9 million and $3.7 million,
respectively, as of December 31, 2018 and 2017.

76
Critical Accounting Policies and Estimates
Our consolidated financial statements are prepared in accordance with GAAP. The preparation of these consolidated
financial statements requires us to make estimates and assumptions that affect the reported amounts of assets, liabilities,
revenue, expenses and related disclosures. We evaluate our estimates and assumptions on an ongoing basis. Our estimates are
based on historical experience and various other assumptions that we believe to be reasonable under the circumstances. Our
actual results could differ from these estimates.
We believe that the assumptions and estimates associated with revenue recognition, the net realizable value of inventory,
amortization period and recoverability of contract cost assets, website and software development costs, recoverability of long-
lived assets and intangible assets with definite lives, share-based compensation, income taxes, and the recoverability of
goodwill and indefinite-lived intangible assets, have the greatest potential impact on our consolidated financial statements.
Therefore, we consider these to be our critical accounting policies and estimates.
Revenue Recognition
We recognize revenue when (or as) we satisfy our performance obligations by transferring control of the promised
products or services to our customers in an amount that reflects the consideration to which we expect to be entitled in exchange
for those products or services.
As a practical expedient, we do not adjust the promised amount of consideration for the effects of a significant financing
component as the period between our transfer of a promised product or service to a customer and when the customer pays for
that product or service is one year or less.
We do not disclose the transaction price related to remaining performance obligations for (i) contracts with an original
expected duration of one year or less and (ii) contracts for which we recognize revenue at the amount to which we have the
right to invoice for performance completed to date.
In our IMT segment, we generate revenue from the sale of advertising services and our suite of marketing software and
technology solutions to businesses and professionals primarily associated with the residential real estate, rental and mortgage
industries. These professionals include real estate, rental and mortgage professionals and brand advertisers. Our four primary
revenue categories within our IMT segment are Premier Agent, Rentals, Mortgages and Other.
In our Homes segment, we generate revenue from the resale of homes on the open market through our Zillow Offers
program.
Premier Agent Revenue. Premier Agent revenue is derived from our Premier Agent and Premier Broker programs. Our
Premier Agent and Premier Broker programs offer a suite of marketing and business technology products and services to help
real estate agents and brokers achieve their advertising goals, while growing and managing their businesses and brands. All
Premier Agents and Premier Brokers receive access to a dashboard portal on our mobile application or website that provides
individualized program performance analytics, our customer relationship management, or CRM, tool that captures detailed
information about each contact made with a Premier Agent or Premier Broker through our mobile and web platforms and our
account management tools. We have concluded that the marketing and business technology products and services promised to
Premier Agents and Premier Brokers represent distinct performance obligations.
We primarily offer our Premier Agent and Premier Broker advertising products on a cost per impression basis.
Impressions are delivered when a sold advertisement appears on pages viewed by users of our mobile applications and
websites. We determine the cost per impression delivered in each zip code using an auction-based pricing method in
consideration of the total amount spent by Premier Agents and Premier Brokers to purchase impressions in the zip code during
the month. A Premier Agent’s or Premier Broker’s share of voice in a zip code is determined by their proportional monthly
budgeted spend in that zip code as a percentage of the total monthly budgeted spend of all Premier Agents and Premier Brokers
in that zip code. The cost per impression that we charge is dynamic - as demand for impressions in a zip code increases or
77
decreases, the cost per impression in that zip code may be increased or decreased accordingly. The price paid for each
impression is representative of the price at which we would sell an impression separately to a customer, or the stand-alone
selling price.
We have not allocated the transaction price to each performance obligation as the amounts recognized would be the same
irrespective of any allocation. As such, we recognize revenue related to the Premier Agent and Premier Broker products and
services based on the contractual spend recognized on a straight-line basis during the contractual period over which the
products and services are provided.
In April 2018, we began testing a new form of lead validation and distribution related to our auction-based pricing model
whereby the share of voice purchased by Premier Agents and Premier Brokers will represent both the share of impressions
delivered as advertisements appearing on pages viewed by users of our mobile applications and websites, as well as the
proportion of validated consumer connections a Premier Agent or Premier Broker receives. When consumers who are interested
in connecting with a real estate professional do not select a specific Premier Agent or Premier Broker advertisement on one of
Zillow Group’s mobile applications or websites, the validated consumer leads will be distributed to Premier Agents and Premier
Brokers in proportion to their share of voice. We believe distributing validated consumer connection leads on the basis of share
of voice creates better experiences for consumers and further strengthens our partnerships with real estate professionals. We
substantially completed the nationwide adoption of this new lead distribution model in the fourth quarter of 2018. We are
unable to predict whether this change will have a material impact on revenue or other results of operations.
In October 2018, we began testing a new Flex Pricing model for Premier Broker and Premier Agent advertising services
in limited markets. With the Flex Pricing model, Premier Brokers and Premier Agents are provided with validated leads at no
upfront cost, and they pay a performance advertising fee only when a real estate transaction is closed with one of their leads.
With this pricing model, the transaction price represents variable consideration as the amount to which we expect to be entitled
varies based on the number of validated leads that convert into real estate transactions. As the amount of consideration is
dependent upon factors outside our influence and our experience with this pricing model is limited, we fully constrain the
estimated variable consideration. When a real estate transaction is closed with a Flex Pricing lead and payment is made, the
uncertainty is resolved and revenue is recognized in the period for the satisfied performance obligations.
Rentals Revenue. Rentals revenue includes our rentals marketplace and suite of tools for rental professionals. Rentals
revenue primarily includes revenue generated by advertising sold to property managers and other rental professionals on a cost
per lead, cost per click or cost per lease generated basis. We recognize revenue as leads or clicks are provided to rental
professionals, which is the amount for which we have the right to invoice. The number of leases generated through our rentals
marketplace during the period is accounted for as variable consideration, and we estimate these amounts based on the expected
number of qualified leases secured during the period. We do not believe that a significant reversal in the amount of cumulative
revenue recognized will occur once the uncertainty related to the number of leases secured is subsequently resolved.
Beginning in 2018, rentals revenue also includes revenue generated from Zillow’s rental applications product. We
recognize revenue for the rental applications product on a straight-line basis during the contractual period over which the
customer has the right to access and submit a rental application.
Mortgages Revenue. Mortgages revenue primarily includes marketing products sold to mortgage professionals on a cost
per lead basis, including our Custom Quote and a portion of our Connect services, and on a subscription basis, including a
portion of our Connect service. For our Connect and Custom Quote cost per lead mortgage marketing products, participating
qualified mortgage professionals typically make a prepayment to gain access to consumers interested in connecting with
mortgage professionals. Mortgage professionals who exhaust their initial prepayment prepay additional funds to continue to
participate in the marketplace. For our Connect subscription mortgage marketing product, participating qualified mortgage
professionals generally prepay a monthly subscription fee, which they then allocate to desired geographic counties. In Zillow
Group’s Connect platform, consumers answer a series of questions to find a local lender, and mortgage professionals receive
consumer contact information, or leads, when the consumer chooses to share their information with a lender. Consumers who
request rates for mortgage loans in Custom Quotes are presented with customized quotes from participating mortgage
professionals.

78
For our cost per lead mortgages products, we recognize revenue when a user contacts a mortgage professional through
Zillow Group’s mortgages platform, which is the amount for which we have the right to invoice. For our Connect subscription
product, the opportunity to receive a consumer contact is based on the mortgage professional’s relative share of voice in a
geographic county. When a consumer submits a contact, Zillow Group contacts a group of subscription mortgage professionals
via text message, and the first mortgage professional to respond receives the consumer contact information. We recognize
revenue based on the contractual spend recognized on a straight-line basis during the contractual period over which the service
is provided. This methodology best depicts how we satisfy our performance obligation to subscription customers, as we
continuously transfer control of the performance obligation to the customer throughout the contractual period.
Beginning in the fourth quarter of 2018, mortgages revenue also includes revenue generated by our mortgage originations
business. Revenue from loan originations is recognized at the time the related real estate transactions are completed, usually
upon the close of escrow and when we fund mortgage loans. These loans are then held for sale. Mortgage loans held for sale are
initially recorded at fair value based on either sale commitments or current market quotes and are adjusted for subsequent
changes in fair value until the loan is sold. Net origination costs and fees associated with mortgage loans are recognized as
incurred at the time of origination. We sell substantially all of the mortgages we originate and the related servicing rights to
third-party purchasers.
Mortgages revenue also includes revenue generated by Mortech, which provides subscription-based mortgage software
solutions, including a product and pricing engine and lead management platform, for which we recognize revenue on a straight-
line basis during the contractual period over which the services are provided.
Other Revenue. Other revenue primarily includes revenue generated by new construction and display, as well as revenue
from the sale of various other marketing and business products and services to real estate professionals. Our new construction
marketing solutions allow home builders to showcase their available inventory to home shoppers. New construction revenue
primarily includes revenue generated by advertising sold to builders on a cost per residential community basis, and revenue is
recognized on a straight-line basis during the contractual period over which the communities are advertised on our mobile
applications and websites. Display revenue primarily consists of graphical mobile and web advertising sold on a cost per
thousand impressions or cost per click basis to advertisers promoting their brands on our mobile applications and websites. We
recognize display revenue as clicks occur or as impressions are delivered to users interacting with our mobile applications or
websites, which is the amount for which we have the right to invoice.
Homes Revenue. Homes revenue is derived from the resale of homes on the open market through our Zillow Offers
program. Homes revenue is recognized at the time of the closing of the home sale when title to and possession of the property
are transferred to the buyer.
Inventory
Inventory is comprised of homes acquired through our Zillow Offers program and is stated at the lower of cost or net
realizable value. Homes are removed from inventory on a specific identification basis when they are resold. Stated cost
includes consideration paid to acquire and update each home including associated allocated overhead costs. Work-in-progress
inventory includes homes undergoing updates and finished goods inventory includes homes ready for resale. Unallocated
overhead costs are expensed as incurred and included in cost of revenue. Selling costs, including commissions, escrow and title
fees, staging, and holding costs, including utilities, taxes and maintenance, are expensed as incurred and included in sales and
marketing expenses.
Each quarter we review the value of homes held in inventory for indicators that net realizable value is lower than cost.
When evidence exists that the net realizable value of inventory is lower than its cost, the difference is recognized in cost of
revenue.
Contract Cost Assets
We capitalize certain incremental costs of obtaining contracts with customers that we expect to recover. These costs relate
to commissions paid to sales personnel, primarily for our Premier Agent and Premier Broker programs. As a practical
79
expedient, we recognize the incremental costs of obtaining a contract as an expense when incurred if the amortization period of
the asset that we otherwise would have recognized is one year or less. Capitalized commission costs are recorded as contract
cost assets in our consolidated balance sheets. Contract cost assets are amortized to expense on a straight-line basis over a
period that is consistent with the transfer to the customer of the products or services to which the asset relates, generally the
estimated life of the customer relationship. Amortization expense related to contract cost assets is included in sales and
marketing expenses in our consolidated statements of operations. Our determination of the estimated life of the customer
relationship involves significant judgment. In determining the estimated life of our customer relationships, we consider
quantitative and qualitative data, including, but not limited to, historical customer data, recent changes or expected changes in
product or service offerings, and changes in how we monetize our products and services. The amortization period for our
Premier Agent and Premier Broker programs ranges from two to three years.
Website and Software Development Costs
The costs incurred in the preliminary stages of development are expensed as incurred. Once an application has reached
the development stage, internal and external costs, if direct and incremental and deemed by management to be significant, are
capitalized in property and equipment and amortized on a straight-line basis over their estimated useful lives. Maintenance and
enhancement costs, including those costs in the post-implementation stages, are typically expensed as incurred, unless such
costs relate to substantial upgrades and enhancements to the website or software that result in added functionality, in which case
the costs are capitalized and amortized on a straight-line basis over the estimated useful lives. Amortization expense related to
capitalized website and software development costs is included in technology and development expense.
Capitalized development activities placed in service are amortized over the expected useful lives of those releases,
currently estimated at one to three years. The estimated useful lives of website and software development activities are
reviewed frequently and adjusted as appropriate to reflect upcoming development activities that may include significant
upgrades and/or enhancements to the existing functionality.
We exercise judgment in determining the point at which various projects may be capitalized, in assessing the ongoing
value of the capitalized costs, and in determining the estimated useful lives over which the costs are amortized. To the extent
that we change the manner in which we develop and test new features and functionalities related to our mobile applications and
websites, assess the ongoing value of capitalized assets, or determine the estimated useful lives over which the costs are
amortized, the amount of website and software development costs we capitalize and amortize could change in future periods.
Recoverability of Intangible Assets with Definite Lives and Other Long-Lived Assets
We evaluate intangible assets and other long-lived assets for impairment whenever events or circumstances indicate that
they may not be recoverable. Recoverability is measured by comparing the carrying amount of an asset group to future
undiscounted net cash flows expected to be generated. We group assets for purposes of such review at the lowest level for
which identifiable cash flows of the asset group are largely independent of the cash flows of the other groups of assets and
liabilities. If this comparison indicates impairment, the amount of impairment to be recognized is calculated as the difference
between the carrying value and the fair value of the asset group.
Unforeseen events, changes in circumstances and market conditions and material differences in estimates of future cash
flows could adversely affect the fair value of our assets and could result in an impairment charge. Fair value can be estimated
utilizing a number of techniques including quoted market prices, prices for comparable assets, or other valuation processes
involving estimates of cash flows, multiples of earnings or revenues, and we may make various assumptions and estimates
when performing our impairment assessments, particularly as it relates to cash flow projections. Cash flow estimates are by
their nature subjective and include assumptions regarding factors such as recent and forecasted operating performance, revenue
trends and operating margins. These estimates could also be adversely impacted by changes in federal, state, or local
regulations, economic downturns or developments, or other market conditions affecting our industry.
80
Share-Based Compensation
We measure compensation expense for all share-based awards at fair value on the date of grant and recognize
compensation expense over the service period for awards expected to vest. We use the Black-Scholes-Merton option-pricing
model to determine the fair value for option awards and recognize compensation expense on a straight-line basis over the
option awards’ vesting period. For restricted stock units and restricted units, we use the market value of our Class A common
stock and Class C capital stock, as applicable, on the date of grant to determine the fair value of the award, and we recognize
compensation expense on a straight-line basis over the awards’ vesting period.
Determining the fair value of option awards at the grant date requires judgment. If any of the assumptions used in the
Black-Scholes-Merton model changes significantly, share-based compensation expense for future option awards may differ
materially compared with the awards granted previously. In valuing our option awards, we make assumptions about risk-free
interest rates, dividend yields, volatility, and weighted-average expected lives. In addition, through December 31, 2016 we
made assumptions about estimated forfeiture rates. Beginning on January 1, 2017, we elected to account for forfeitures as they
occur.
Risk-free interest rate. Risk-free interest rates are derived from U.S. Treasury securities as of the option award’s grant
date.
Expected dividend yields. Expected dividend yields are based on our historical dividend payments, which have been zero
to date.
Volatility. The expected volatility for our Class A common stock and Class C capital stock is estimated using our
historical volatility.
Expected term. The weighted-average expected life of the option awards is estimated based on our historical exercise
data.
Forfeiture rate. Prior to January 1, 2017, forfeiture rates were estimated using historical actual forfeiture trends as well as
our judgment of future forfeitures. These rates were evaluated at least quarterly and any change in share-based compensation
expense was recognized in the period of the change. We considered many factors when estimating expected forfeitures,
including employee class and historical experience.
We will continue to use judgment in evaluating the expected volatility and expected terms utilized for our share-based
compensation expense calculations on a prospective basis. Actual results, and future changes in estimates, may differ
substantially from management’s current estimates. As we continue to accumulate additional data related to our Class A
common stock and Class C capital stock, we may have refinements to the estimates of our expected volatility and expected
terms, which could materially impact our future share-based compensation expense. In future periods, we expect our share-
based compensation expense to increase as a result of our existing, unrecognized share-based compensation that will be
recognized as the awards vest, and as we grant additional share-based awards to attract and retain employees.
Income Taxes
We use the asset and liability approach for accounting and reporting income taxes, which requires the recognition of
deferred tax assets and liabilities for the expected future tax consequences of temporary differences between the financial
statement and tax bases of assets and liabilities at the applicable enacted tax rates. A valuation allowance against deferred tax
assets would be established if, based on the weight of available evidence, it is more likely than not (a likelihood of more than
50%) that some or all of the deferred tax assets are not expected to be realized.
Our assumptions, judgments, and estimates relative to the value of our deferred tax assets take into account predictions of
the amount and category of future taxable income, such as income from operations or capital gains income. Actual operating
results and the underlying amount and category of income in future years could render our current assumptions, judgments, and
estimates of recoverable net deferred taxes inaccurate. Any of the assumptions, judgments, and estimates mentioned above
81
could cause our actual income tax obligations to differ from our estimates, thus materially impacting our financial position and
results of operations.
Since inception, we have typically incurred annual operating losses, and accordingly, we have generally not recorded a
material current provision for income taxes, though we have historically in certain instances recorded income tax benefits in
connection with acquisitions. However, as part of the Tax Act, net operating losses generated after December 31, 2017 create a
tax benefit because they can be offset against our indefinite lived deferred tax liabilities and release that related portion of our
valuation allowance.
We establish reserves for tax-related uncertainties based on estimates of whether, and the extent to which, additional taxes
will be due. We adjust these reserves in light of changing facts and circumstances, such as the closing of a tax audit, new tax
legislation or the change of an estimate. To the extent that the final tax outcome of these matters is different than the amounts
recorded, such differences will affect the provision for income taxes in the period in which such determination is made.
Recoverability of Goodwill and Indefinite-Lived Intangible Assets
Goodwill represents the excess of the cost of an acquired business over the fair value of the assets acquired at the date of
acquisition, and is not amortized. We assess the impairment of goodwill on an annual basis, in our fourth quarter, or whenever
events or changes in circumstances indicate that goodwill may be impaired. Typically, we choose to forgo the initial qualitative
assessment and perform a quantitative analysis to assist in our annual evaluation. If impairment exists, the carrying value of the
goodwill is reduced to fair value through an impairment charge recorded in our statements of operations.
Our indefinite-lived intangible asset is not amortized, and we assess the asset for impairment on an annual basis, in our
fourth quarter, or whenever events or changes in circumstances indicate that the asset may be impaired. On an interim basis, we
consider if there are any events and circumstances that could affect the significant inputs used to determine the fair value of the
indefinite-lived intangible asset, including, but not limited to, costs that could have a negative effect on future expected
earnings and cash flows, changes in certain key performance metrics, and changes in management, key personnel, strategy or
customers. In our evaluation of our trade names and trademarks indefinite-lived intangible asset, we typically first perform a
qualitative assessment to determine whether the fair value of the indefinite-lived intangible asset is more likely than not
impaired. If so, we perform a quantitative assessment and an impairment charge is recorded in our statements of operations for
the excess of the carrying value of the indefinite-lived intangible assets over their fair value.
During the year ended December 31, 2018, we recognized a non-cash impairment charge of $69.0 million related to our
indefinite-lived Trulia trade names and trademarks intangible asset. The impairment charge is included in Impairment costs
within our IMT segment. In connection with our annual budgeting process that was substantially completed during the three
months ended December 31, 2018, we identified factors that led us to conclude it was more likely than not that the
$177.0 million carrying value of the asset exceeded its fair value. The most significant of such factors was a shortfall in
projected revenue related to the Trulia brand compared to projections at the time the intangible asset was remeasured as of
October 1, 2017. Accordingly, with the assistance of a third-party valuation specialist, we performed a quantitative analysis to
determine the fair value of the intangible asset and concluded that our best estimate of its fair value was $108.0 million. The
valuation was prepared using an income approach based on the relief-from-royalty method and relied on inputs with
unobservable market prices including the assumed revenue growth rates, royalty rate, discount rate, and estimated tax rate, and
therefore is considered a Level 3 measurement under the fair value hierarchy. In connection with this impairment analysis, we
evaluated our planned future use of the Trulia trade names and trademarks intangible asset and concluded that it remains
appropriate to consider this asset to have an indefinite life.
To the extent there is a shortfall in actual revenue attributable to the Trulia brand as compared to our estimated projections
as of December 2018, the date of our interim impairment test, additional impairment could be recorded in future periods.
Recently Adopted Accounting Standards and Recently Issued Accounting Standards Not Yet Adopted
For information about our recently adopted accounting standards and recently issued accounting standards not yet
adopted, see Note 2 of the accompanying notes to our consolidated financial statements included within this annual report.
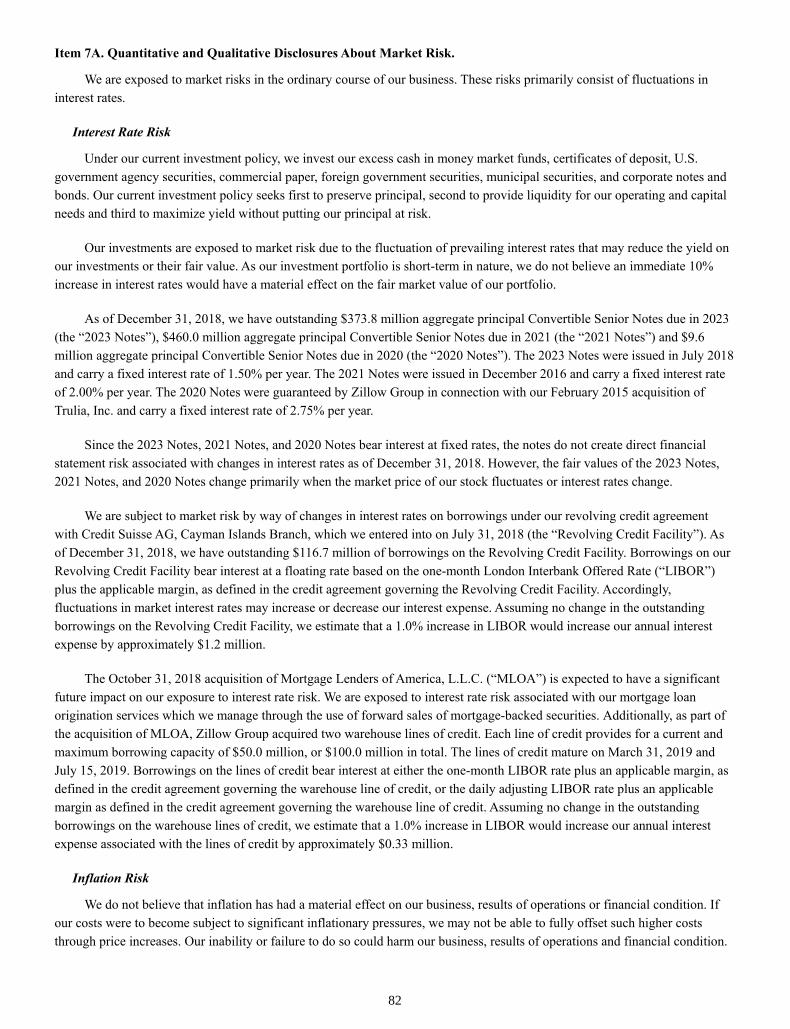
82
Item 7A. Quantitative and Qualitative Disclosures About Market Risk.
We are exposed to market risks in the ordinary course of our business. These risks primarily consist of fluctuations in
interest rates.
Interest Rate Risk
Under our current investment policy, we invest our excess cash in money market funds, certificates of deposit, U.S.
government agency securities, commercial paper, foreign government securities, municipal securities, and corporate notes and
bonds. Our current investment policy seeks first to preserve principal, second to provide liquidity for our operating and capital
needs and third to maximize yield without putting our principal at risk.
Our investments are exposed to market risk due to the fluctuation of prevailing interest rates that may reduce the yield on
our investments or their fair value. As our investment portfolio is short-term in nature, we do not believe an immediate 10%
increase in interest rates would have a material effect on the fair market value of our portfolio.
As of December 31, 2018, we have outstanding $373.8 million aggregate principal Convertible Senior Notes due in 2023
(the “2023 Notes”), $460.0 million aggregate principal Convertible Senior Notes due in 2021 (the “2021 Notes”) and $9.6
million aggregate principal Convertible Senior Notes due in 2020 (the “2020 Notes”). The 2023 Notes were issued in July 2018
and carry a fixed interest rate of 1.50% per year. The 2021 Notes were issued in December 2016 and carry a fixed interest rate
of 2.00% per year. The 2020 Notes were guaranteed by Zillow Group in connection with our February 2015 acquisition of
Trulia, Inc. and carry a fixed interest rate of 2.75% per year.
Since the 2023 Notes, 2021 Notes, and 2020 Notes bear interest at fixed rates, the notes do not create direct financial
statement risk associated with changes in interest rates as of December 31, 2018. However, the fair values of the 2023 Notes,
2021 Notes, and 2020 Notes change primarily when the market price of our stock fluctuates or interest rates change.
We are subject to market risk by way of changes in interest rates on borrowings under our revolving credit agreement
with Credit Suisse AG, Cayman Islands Branch, which we entered into on July 31, 2018 (the “Revolving Credit Facility”). As
of December 31, 2018, we have outstanding $116.7 million of borrowings on the Revolving Credit Facility. Borrowings on our
Revolving Credit Facility bear interest at a floating rate based on the one-month London Interbank Offered Rate (“LIBOR”)
plus the applicable margin, as defined in the credit agreement governing the Revolving Credit Facility. Accordingly,
fluctuations in market interest rates may increase or decrease our interest expense. Assuming no change in the outstanding
borrowings on the Revolving Credit Facility, we estimate that a 1.0% increase in LIBOR would increase our annual interest
expense by approximately $1.2 million.
The October 31, 2018 acquisition of Mortgage Lenders of America, L.L.C. (“MLOA”) is expected to have a significant
future impact on our exposure to interest rate risk. We are exposed to interest rate risk associated with our mortgage loan
origination services which we manage through the use of forward sales of mortgage-backed securities. Additionally, as part of
the acquisition of MLOA, Zillow Group acquired two warehouse lines of credit. Each line of credit provides for a current and
maximum borrowing capacity of $50.0 million, or $100.0 million in total. The lines of credit mature on March 31, 2019 and
July 15, 2019. Borrowings on the lines of credit bear interest at either the one-month LIBOR rate plus an applicable margin, as
defined in the credit agreement governing the warehouse line of credit, or the daily adjusting LIBOR rate plus an applicable
margin as defined in the credit agreement governing the warehouse line of credit. Assuming no change in the outstanding
borrowings on the warehouse lines of credit, we estimate that a 1.0% increase in LIBOR would increase our annual interest
expense associated with the lines of credit by approximately $0.33 million.
Inflation Risk
We do not believe that inflation has had a material effect on our business, results of operations or financial condition. If
our costs were to become subject to significant inflationary pressures, we may not be able to fully offset such higher costs
through price increases. Our inability or failure to do so could harm our business, results of operations and financial condition.

83
Foreign Currency Exchange Risk
We do not believe that foreign currency exchange risk has had a material effect on our business, results of operations or
financial condition. As we do not maintain a significant balance of foreign currency, we do not believe an immediate 10%
increase or decrease in foreign currency exchange rates relative to the U.S. dollar would have a material effect on our business,
results of operations or financial condition.

84
Item 8. Financial Statements and Supplementary Data.
Index to Consolidated Financial Statements
Page
Report of Deloitte & Touche LLP, Independent Registered Public Accounting Firm 85
Report of Ernst & Young LLP, Independent Registered Public Accounting Firm 86
Consolidated Balance Sheets 87
Consolidated Statements of Operations 88
Consolidated Statements of Comprehensive Loss 89
Consolidated Statements of Shareholders’ Equity 90
Consolidated Statements of Cash Flows 91
Notes to Consolidated Financial Statements 93
The supplementary financial information required by this Item 8 is included in Item 7 under the caption “Quarterly
Results of Operations.”

85
REPORT OF DELOITTE & TOUCHE LLP, INDEPENDENT REGISTERED PUBLIC ACCOUNTING FIRM
The Board of Directors and Shareholders of Zillow Group, Inc.
Opinion on the Financial Statements
We have audited the accompanying consolidated balance sheets of Zillow Group, Inc. (the “Company”) as of December 31,
2018 and 2017, and the related consolidated statements of operations, comprehensive loss, shareholders’ equity, and cash flows
for each of the two years in the period ended December 31, 2018 and the related notes (collectively referred to as the “financial
statements”). In our opinion, the financial statements present fairly, in all material respects, the financial position of the
Company as of December 31, 2018 and 2017, and the results of its operations and its cash flows for each of the two years
ended December 31, 2018, in conformity with accounting principles generally accepted in the United States of America.
We have also audited, in accordance with the standards of the Public Company Accounting Oversight Board (United States)
(PCAOB), the Company’s internal control over financial reporting as of December 31, 2018, based on the criteria established
in Internal Control - Integrated Framework (2013) issued by the Committee of Sponsoring Organizations of the Treadway
Commission and our report dated February 21, 2019 expressed an unqualified opinion on the Company’s internal control over
financial reporting.
Change in Accounting Principle
As discussed in Note 2 to the financial statements, the Company changed its method of accounting for costs to obtain customer
contracts during the year ended December 31, 2018 due to the adoption of the new revenue standard. The Company adopted the
new revenue standard using the modified retrospective approach.
Basis for Opinion
These financial statements are the responsibility of the Company’s management. Our responsibility is to express an opinion on
these financial statements based on our audit. We are a public accounting firm registered with the PCAOB and are required to
be independent with respect to the Company in accordance with the U.S. federal securities law and the applicable rules and
regulations of the Securities and Exchange Commission and the PCAOB.
We conducted our audit in accordance with the standards of the PCAOB. Those standards require that we plan and perform the
audit to obtain reasonable assurance about whether the financial statements are free of material misstatement, whether due to
error or fraud. Our audit included performing procedures to assess the risks of material misstatement of the financial
statements, whether due to error or fraud, and performing procedures that respond to those risks. Such procedures included
examining, on a test basis, evidence regarding the amounts and disclosures in the financial statements. Our audit also included
evaluating the accounting principles used and significant estimates made by management, as well as evaluating the overall
presentation of the financial statements. We believe that our audit provides a reasonable basis for our opinion.
/s/ DELOITTE & TOUCHE LLP
Seattle, Washington
February 21, 2019
We have served as the Company’s auditor since 2016.

86
REPORT OF ERNST & YOUNG LLP, INDEPENDENT REGISTERED PUBLIC ACCOUNTING FIRM
The Board of Directors and Shareholders of Zillow Group, Inc.
We have audited the accompanying consolidated statements of operations, comprehensive loss, shareholders’ equity and cash
flows of Zillow Group, Inc. for the year ended December 31, 2016. These consolidated financial statements are the
responsibility of the Company’s management. Our responsibility is to express an opinion on these consolidated financial
statements based on our audit.
We conducted our audit in accordance with the standards of the Public Company Accounting Oversight Board (United States).
Those standards require that we plan and perform the audit to obtain reasonable assurance about whether the financial
statements are free of material misstatement. An audit includes examining, on a test basis, evidence supporting the amounts and
disclosures in the financial statements. An audit also includes assessing the accounting principles used and significant estimates
made by management, as well as evaluating the overall financial statement presentation. We believe that our audit provides a
reasonable basis for our opinion.
In our opinion, the financial statements referred to above present fairly, in all material respects, the consolidated results of
operations and cash flows of Zillow Group, Inc. for the year ended December 31, 2016, in conformity with U.S. generally
accepted accounting principles.
/s/ ERNST & YOUNG LLP
Seattle, Washington
February 7, 2017

87
ZILLOW GROUP, INC.
CONSOLIDATED BALANCE SHEETS
(in thousands, except share data)
December 31,
2018 2017
Assets
Current assets:
Cash and cash equivalents $ 651,058 $ 352,095
Short-term investments 903,867 410,444
Accounts receivable, net of allowance for doubtful accounts of $4,838 and $5,341 at December 31, 2018 and
2017, respectively 66,083
54,396
Inventory 162,829 —
Mortgage loans held for sale 35,409 —
Prepaid expenses and other current assets 61,067 24,590
Restricted cash 12,385 —
Total current assets 1,892,698 841,525
Contract cost assets 45,819 —
Property and equipment, net 135,172 112,271
Goodwill 1,984,907 1,931,076
Intangible assets, net 215,904 319,711
Other assets 16,616 25,934
Total assets $ 4,291,116 $ 3,230,517
Liabilities and shareholders’ equity
Current liabilities:
Accounts payable $ 7,471 $ 3,587
Accrued expenses and other current liabilities 63,101 61,373
Accrued compensation and benefits 31,388 19,109
Revolving credit facility 116,700 —
Warehouse lines of credit 33,018 —
Deferred revenue 34,080 31,918
Deferred rent, current portion 1,740 2,400
Total current liabilities 287,498 118,387
Deferred rent, net of current portion 19,945 21,330
Long-term debt 699,020 385,416
Deferred tax liabilities and other long-term liabilities 17,474
44,561
Total liabilities 1,023,937 569,694
Commitments and contingencies (Note 19)
Shareholders’ equity:
Preferred stock, $0.0001 par value; 30,000,000 shares authorized; no shares issued and outstanding — —
Class A common stock, $0.0001 par value; 1,245,000,000 shares authorized; 58,051,448 and 56,629,103 shares
issued and outstanding as of December 31, 2018 and 2017, respectively 6
6
Class B common stock, $0.0001 par value; 15,000,000 shares authorized; 6,217,447 shares issued and
outstanding as of December 31, 2018 and 2017 1
1
Class C capital stock, $0.0001 par value; 600,000,000 shares authorized; 139,635,370 and 127,268,598 shares
issued and outstanding as of December 31, 2018 and 2017, respectively 14
13
Additional paid-in capital 3,939,842 3,254,146
Accumulated other comprehensive loss (905 ) (1,100 )
Accumulated deficit (671,779 ) (592,243 )
Total shareholders’ equity 3,267,179 2,660,823
Total liabilities and shareholders’ equity $ 4,291,116 $ 3,230,517
See accompanying notes to consolidated financial statements.

88
ZILLOW GROUP, INC.
CONSOLIDATED STATEMENTS OF OPERATIONS
(in thousands, except per share data)
Year Ended December 31,
2018 2017 2016
Revenue:
IMT $ 1,281,189 $ 1,076,794 $ 846,589
Homes 52,365 — —
Total revenue 1,333,554 1,076,794 846,589
Cost of revenue (exclusive of amortization) (1):
IMT 104,330 85,203 69,262
Homes 49,260 — —
Total cost of revenue 153,590 85,203 69,262
Sales and marketing 552,621 448,201 382,419
Technology and development 410,818 319,985 255,583
General and administrative 262,153 210,816 332,007
Impairment costs 79,000 174,000 —
Acquisition-related costs 2,332 463 1,423
Integration costs 2,015 — —
Gain on divestiture of business — — (1,251 )
Total costs and expenses 1,462,529 1,238,668 1,039,443
Loss from operations (128,975 ) (161,874 ) (192,854 )
Loss on debt extinguishment — — (22,757 )
Other income 19,270 5,385 2,711
Interest expense (41,255 ) (27,517 ) (7,408 )
Loss before income taxes (150,960 ) (184,006 ) (220,308 )
Income tax benefit (expense) 31,102 89,586 (130 )
Net loss $ (119,858 ) $ (94,420 ) $ (220,438 )
Net loss per share — basic and diluted $ (0.61 ) $ (0.51 ) $ (1.22 )
Weighted-average shares outstanding — basic and diluted 197,944 186,453 180,149
(1) Amortization of website development costs and intangible assets
included in technology and development $ 79,309
$ 94,349
$ 87,060
See accompanying notes to consolidated financial statements.
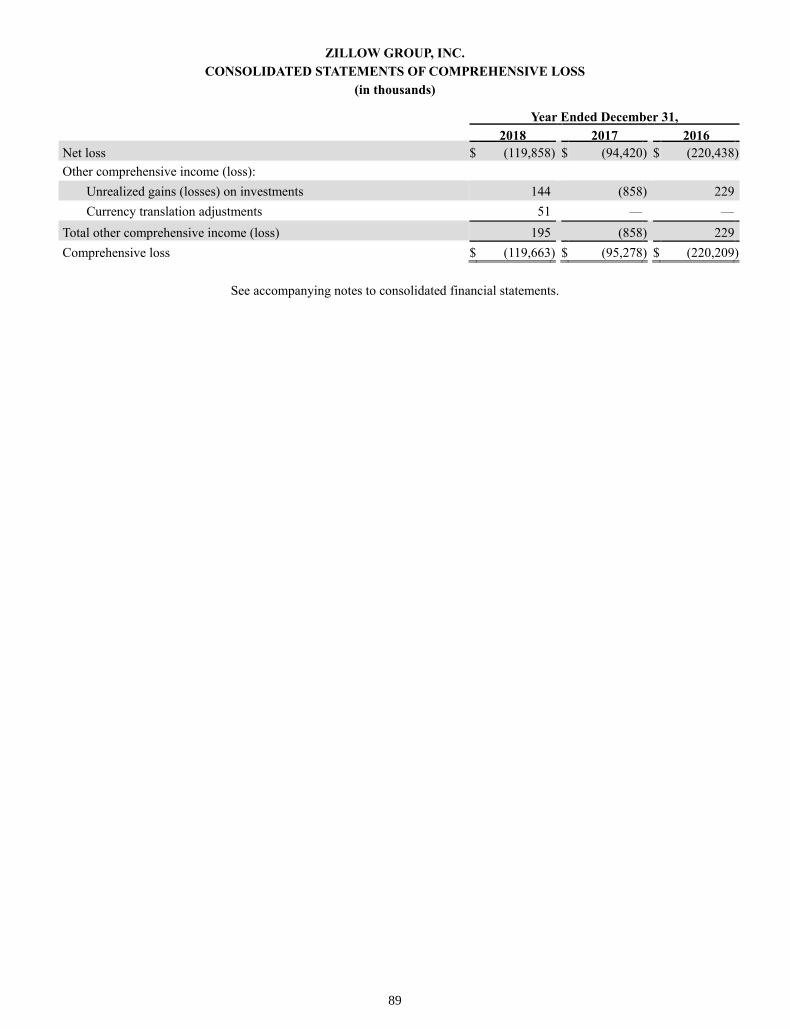
89
ZILLOW GROUP, INC.
CONSOLIDATED STATEMENTS OF COMPREHENSIVE LOSS
(in thousands)
Year Ended December 31,
2018 2017 2016
Net loss $ (119,858 ) $ (94,420 ) $ (220,438 )
Other comprehensive income (loss):
Unrealized gains (losses) on investments 144 (858 ) 229
Currency translation adjustments 51 — —
Total other comprehensive income (loss) 195 (858 ) 229
Comprehensive loss $ (119,663 ) $ (95,278 ) $ (220,209 )
See accompanying notes to consolidated financial statements.
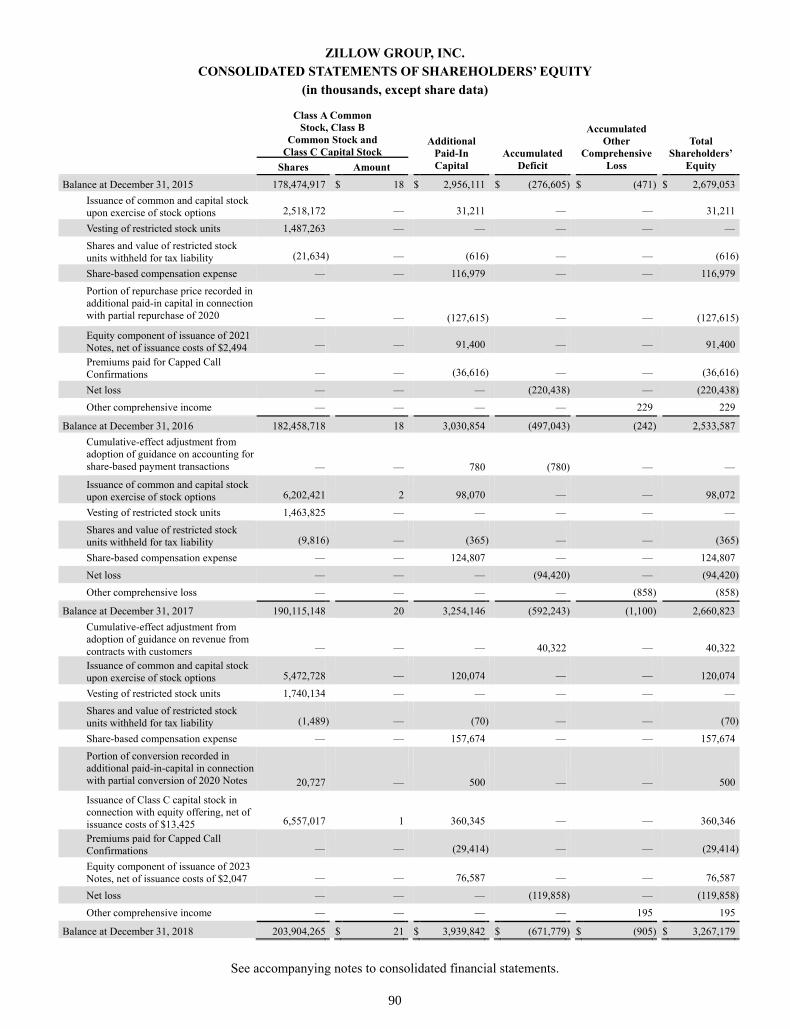
90
ZILLOW GROUP, INC.
CONSOLIDATED STATEMENTS OF SHAREHOLDERS’ EQUITY
(in thousands, except share data)
Class A Common
Stock, Class B
Common Stock and
Class C Capital Stock Additional
Paid-In
Capital Accumulated
Deficit
Accumulated
Other
Comprehensive
Loss
Total
Shareholders’
Equity Shares Amount Balance at December 31, 2015 178,474,917 $ 18 $ 2,956,111 $ (276,605 ) $ (471 ) $ 2,679,053
Issuance of common and capital stock
upon exercise of stock options 2,518,172 —
31,211
—
—
31,211
Vesting of restricted stock units 1,487,263 — — — — —
Shares and value of restricted stock
units withheld for tax liability (21,634 ) — (616 ) —
—
(616 )
Share-based compensation expense — — 116,979 — — 116,979
Portion of repurchase price recorded in
additional paid-in capital in connection
with partial repurchase of 2020 —
—
(127,615 ) —
—
(127,615 )
Equity component of issuance of 2021
Notes, net of issuance costs of $2,494 — —
91,400
—
—
91,400
Premiums paid for Capped Call
Confirmations — —
(36,616 ) —
—
(36,616 )
Net loss — — — (220,438 ) — (220,438 )
Other comprehensive income — — — — 229 229
Balance at December 31, 2016 182,458,718 18 3,030,854 (497,043 ) (242 ) 2,533,587
Cumulative-effect adjustment from
adoption of guidance on accounting for
share-based payment transactions —
—
780
(780 ) —
—
Issuance of common and capital stock
upon exercise of stock options 6,202,421 2
98,070
—
—
98,072
Vesting of restricted stock units 1,463,825 — — — — —
Shares and value of restricted stock
units withheld for tax liability (9,816 ) — (365 ) —
—
(365 )
Share-based compensation expense — — 124,807 — — 124,807
Net loss — — — (94,420 ) — (94,420 )
Other comprehensive loss — — — — (858 ) (858 )
Balance at December 31, 2017 190,115,148 20 3,254,146 (592,243 ) (1,100 ) 2,660,823
Cumulative-effect adjustment from
adoption of guidance on revenue from
contracts with customers —
—
—
40,322
—
40,322
Issuance of common and capital stock
upon exercise of stock options 5,472,728 —
120,074
—
—
120,074
Vesting of restricted stock units 1,740,134 — — — — —
Shares and value of restricted stock
units withheld for tax liability (1,489 ) — (70 ) —
—
(70 )
Share-based compensation expense — — 157,674 — — 157,674
Portion of conversion recorded in
additional paid-in-capital in connection
with partial conversion of 2020 Notes 20,727
—
500
—
—
500
Issuance of Class C capital stock in
connection with equity offering, net of
issuance costs of $13,425 6,557,017
1
360,345
—
—
360,346
Premiums paid for Capped Call
Confirmations — —
(29,414 ) —
—
(29,414 )
Equity component of issuance of 2023
Notes, net of issuance costs of $2,047 — —
76,587
—
—
76,587
Net loss — — — (119,858 ) — (119,858 )
Other comprehensive income — — — — 195 195
Balance at December 31, 2018 203,904,265 $ 21 $ 3,939,842 $ (671,779 ) $ (905 ) $ 3,267,179
See accompanying notes to consolidated financial statements.
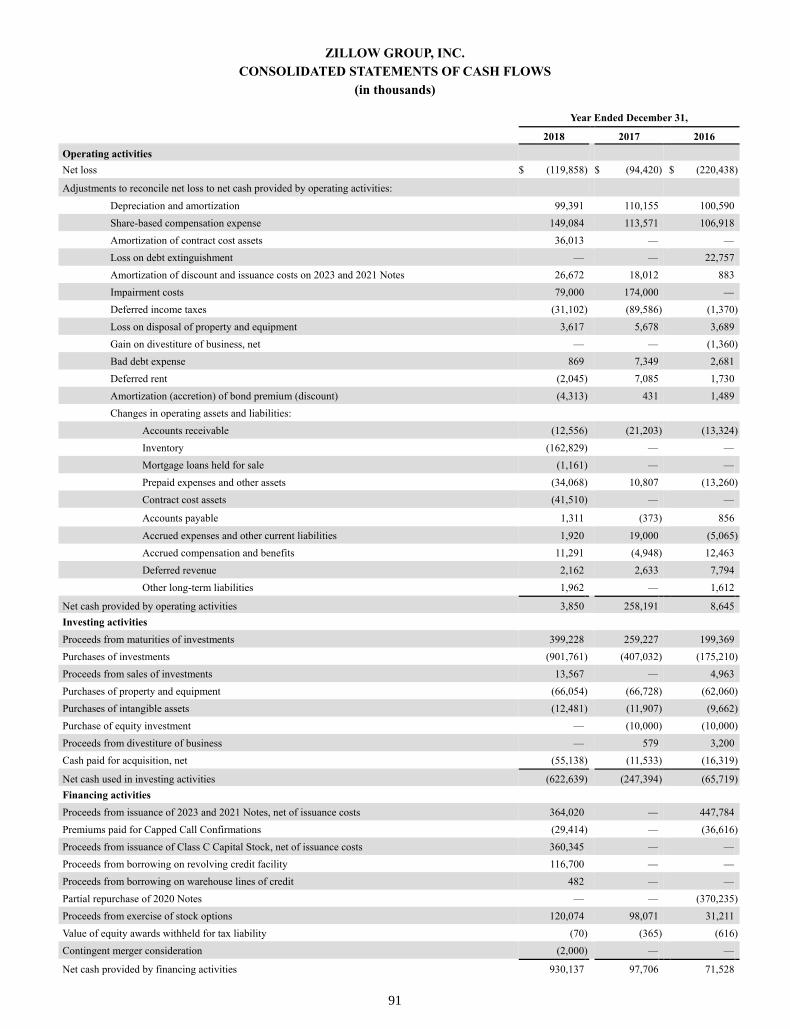
91
ZILLOW GROUP, INC.
CONSOLIDATED STATEMENTS OF CASH FLOWS
(in thousands)
Year Ended December 31,
2018 2017 2016
Operating activities
Net loss $ (119,858 ) $ (94,420 ) $ (220,438 )
Adjustments to reconcile net loss to net cash provided by operating activities:
Depreciation and amortization 99,391 110,155 100,590
Share-based compensation expense 149,084 113,571 106,918
Amortization of contract cost assets 36,013 — —
Loss on debt extinguishment — — 22,757
Amortization of discount and issuance costs on 2023 and 2021 Notes 26,672 18,012 883
Impairment costs 79,000 174,000 —
Deferred income taxes (31,102 ) (89,586 ) (1,370 )
Loss on disposal of property and equipment 3,617 5,678 3,689
Gain on divestiture of business, net — — (1,360 )
Bad debt expense 869 7,349 2,681
Deferred rent (2,045 ) 7,085 1,730
Amortization (accretion) of bond premium (discount) (4,313 ) 431 1,489
Changes in operating assets and liabilities:
Accounts receivable (12,556 ) (21,203 ) (13,324 )
Inventory (162,829 ) — —
Mortgage loans held for sale (1,161 ) — —
Prepaid expenses and other assets (34,068 ) 10,807 (13,260 )
Contract cost assets (41,510 ) — —
Accounts payable 1,311 (373 ) 856
Accrued expenses and other current liabilities 1,920 19,000 (5,065 )
Accrued compensation and benefits 11,291 (4,948 ) 12,463
Deferred revenue 2,162 2,633 7,794
Other long-term liabilities 1,962 — 1,612
Net cash provided by operating activities 3,850 258,191 8,645
Investing activities
Proceeds from maturities of investments 399,228 259,227 199,369
Purchases of investments (901,761 ) (407,032 ) (175,210 )
Proceeds from sales of investments 13,567 — 4,963
Purchases of property and equipment (66,054 ) (66,728 ) (62,060 )
Purchases of intangible assets (12,481 ) (11,907 ) (9,662 )
Purchase of equity investment — (10,000 ) (10,000 )
Proceeds from divestiture of business — 579 3,200
Cash paid for acquisition, net (55,138 ) (11,533 ) (16,319 )
Net cash used in investing activities (622,639 ) (247,394 ) (65,719 )
Financing activities
Proceeds from issuance of 2023 and 2021 Notes, net of issuance costs 364,020 — 447,784
Premiums paid for Capped Call Confirmations (29,414 ) — (36,616 )
Proceeds from issuance of Class C Capital Stock, net of issuance costs 360,345 — —
Proceeds from borrowing on revolving credit facility 116,700 — —
Proceeds from borrowing on warehouse lines of credit 482 — —
Partial repurchase of 2020 Notes — — (370,235 )
Proceeds from exercise of stock options 120,074 98,071 31,211
Value of equity awards withheld for tax liability (70 ) (365 ) (616 )
Contingent merger consideration (2,000 ) — —
Net cash provided by financing activities 930,137 97,706 71,528

92
Net increase in cash, cash equivalents and restricted cash during period 311,348 108,503 14,454
Cash, cash equivalents and restricted cash at beginning of period 352,095 243,592 229,138
Cash, cash equivalents and restricted cash at end of period $ 663,443 $ 352,095 $ 243,592
Supplemental disclosures of cash flow information
Cash paid for interest $ 15,473 $ 9,198 $ 6,325
Noncash transactions:
Capitalized share-based compensation $ 8,590 $ 11,236 $ 10,061
Write-off of fully depreciated property and equipment $ 22,364 $ 15,004 $ 14,564
Write-off of fully amortized intangible assets $ 12,999 $ 5,473 $ 9,293
See accompanying notes to consolidated financial statements.

93
ZILLOW GROUP, INC.
NOTES TO CONSOLIDATED FINANCIAL STATEMENTS
Note 1. Organization and Description of Business
Zillow Group, Inc. operates the largest portfolio of real estate and home-related brands on mobile and the web which
focus on all stages of the home lifecycle: renting, buying, selling and financing. Zillow Group is committed to empowering
consumers with unparalleled data, inspiration and knowledge around homes and connecting them with great real estate
professionals. The Zillow Group portfolio of consumer brands includes Zillow, Trulia, Mortgage Lenders of America, L.L.C.
(“MLOA”), StreetEasy, HotPads, Naked Apartments, RealEstate.com and Out East. In addition, Zillow Group provides a
comprehensive suite of marketing software and technology solutions to help real estate professionals maximize business
opportunities and connect with millions of consumers. Beginning in April 2018, Zillow Offers provides homeowners in certain
metropolitan areas with the opportunity to receive offers to purchase their home from Zillow. When Zillow buys a home, it
makes certain repairs and lists the home for resale on the open market. Beginning in October 2018, Zillow also provides
consumers with the opportunity to receive mortgage financing through MLOA, a licensed mortgage lender. Zillow Group
operates a number of business brands for real estate, rental and mortgage professionals, including Mortech, dotloop, Bridge
Interactive and New Home Feed. Zillow, Inc. was incorporated as a Washington corporation in December 2004, and we
launched the initial version of our website, Zillow.com, in February 2006. Zillow Group, Inc. was incorporated as a Washington
corporation in July 2014 in connection with our acquisition of Trulia, Inc. (“Trulia”). Upon the closing of the Trulia acquisition
in February 2015, each of Zillow, Inc. and Trulia became wholly owned subsidiaries of Zillow Group.
Certain Significant Risks and Uncertainties
We operate in a dynamic industry and, accordingly, can be affected by a variety of factors. For example, we believe that
changes in any of the following areas could have a significant negative effect on us in terms of our future financial position,
results of operations or cash flows: rates of revenue growth; our ability to manage advertising inventory or pricing; engagement
and usage of our products; our investment of resources to pursue strategies that may not prove effective; competition in our
market; the stability of the residential real estate market and the impact of interest rate changes; changes in government
regulation affecting our business; outcomes of legal proceedings; natural disasters and catastrophic events; scaling and
adaptation of existing technology and network infrastructure; management of our growth; our ability to attract and retain
qualified employees and key personnel; our ability to successfully integrate and realize the benefits of our past or future
strategic acquisitions or investments; protection of customers’ information and other privacy concerns; protection of our brand
and intellectual property; and intellectual property infringement and other claims, among other things.
Note 2. Summary of Significant Accounting Policies
Basis of Presentation
The accompanying consolidated financial statements include Zillow Group, Inc. and its wholly-owned subsidiaries. All
intercompany balances and transactions have been eliminated in consolidation. These consolidated financial statements have
been prepared in conformity with U.S. generally accepted accounting principles (“GAAP”).
Use of Estimates
The preparation of financial statements in conformity with GAAP requires management to make certain estimates,
judgments and assumptions that affect the reported amounts of assets and liabilities and the related disclosures at the date of the
financial statements, as well as the reported amounts of revenue and expenses during the periods presented. On an ongoing
basis, we evaluate our estimates, including those related to the net realizable value of inventory, amortization period and
recoverability of contract cost assets, website and software development costs, recoverability of long-lived assets and intangible
assets with definite lives, share-based compensation, income taxes, business combinations, and the recoverability of goodwill
and indefinite-lived intangible assets, among others. To the extent there are material differences between these estimates,
judgments, or assumptions and actual results, our financial statements will be affected.
94
Concentrations of Credit Risk
Financial instruments, which potentially subject us to concentrations of credit risk, consist primarily of cash and cash
equivalents, investments, accounts receivable and mortgage loans held for sale. We place cash and cash equivalents and
investments with major financial institutions, which management assesses to be of high credit quality, in order to limit exposure
of our investments.
Credit risk with respect to accounts receivable is dispersed due to the large number of customers. There were no
customers that comprised 10% or more of our total accounts receivable as of December 31, 2018 and 2017. Further, our credit
risk on accounts receivable is mitigated by the relatively short payment terms that we offer. Collateral is not required for
accounts receivable. We maintain an allowance for doubtful accounts such that receivables are stated at net realizable value.
Similarly, our credit risk on mortgage loans held for sale is dispersed due to a large number of customers. Further, our
credit risk on mortgage loans held for sale is mitigated by the fact that we typically sell mortgages on the secondary market
within a relatively short period of time after the loan is originated.
Cash and Cash Equivalents
Cash includes demand deposits with banks or financial institutions. Cash equivalents include short-term, highly liquid
investments that are both readily convertible to known amounts of cash, and so near their maturity that they present minimal
risk of changes in value because of changes in interest rates. Our cash equivalents include only investments with original
maturities of three months or less. We regularly maintain cash in excess of federally insured limits at financial institutions.
Short-term Investments
Our investments consist of fixed income securities, which include U.S. and foreign government agency securities,
corporate notes and bonds, commercial paper, municipal securities and certificates of deposit, and are classified as available-
for-sale securities. As the investments are available to support current operations, our available-for-sale securities are classified
as short-term investments. Available-for-sale securities are carried at fair value with unrealized gains and losses reported as a
component of accumulated other comprehensive loss in shareholders’ equity, while realized gains and losses and other-than-
temporary impairments are reported as a component of net loss based on specific identification. An impairment charge is
recorded in the consolidated statements of operations for declines in fair value below the cost of an individual investment that
are deemed to be other than temporary. We assess whether a decline in value is temporary based on the length of time that the
fair market value has been below cost, the severity of the decline and the intent and ability to hold or sell the investment. We
did not identify any investments as other-than-temporarily impaired as of December 31, 2018 or 2017.
Restricted Cash
Restricted cash consists of amounts funded to the reserve and collection accounts related to our Revolving Credit Facility
(see Note 14) and amounts held in escrow related to funding home purchases in our mortgage originations business.
Accounts Receivable and Allowance for Doubtful Accounts
Accounts receivable represent our unconditional right to consideration. Accounts receivable are generally due within 30
days and are recorded net of the allowance for doubtful accounts. We consider accounts outstanding longer than the contractual
terms past due. We review accounts receivable on a regular basis and estimate an amount of losses for uncollectible accounts
based on our historical collections experience, age of the receivable, knowledge of the customer and the condition of the
general economy and industry as a whole. We record changes in our estimate to the allowance for doubtful accounts through
bad debt expense and relieve the allowance when accounts are ultimately determined to be uncollectible. Bad debt expense is
included in general and administrative expenses.
Mortgage Loans Held for Sale
Mortgage loans held for sale includes residential mortgages originated for sale in the secondary market in connection with
our October 2018 acquisition of MLOA. We have elected the fair value option for all mortgage loans held for sale as election of

95
this option allows for a better offset of the changes in fair values of the loans and the derivative instruments used to
economically hedge them without having to apply complex hedge accounting provisions. Mortgage loans held for sale are
initially recorded at fair value based on either sale commitments or current market quotes and are adjusted for subsequent
changes in fair value until the loans are sold. Net origination costs and fees associated with mortgage loans are recognized at
the time of origination. We sell substantially all of the mortgages we originate and the related servicing rights to third-party
purchasers. Interest income is earned from the date a mortgage loan is originated until the loan is sold and is classified within
other income in the consolidated statements of operations.
Substantially all of the mortgage loans originated are sold within a short period of time in the secondary mortgage market
on a servicing released, nonrecourse basis, which limits exposure to nonperformance by loan buyer counterparties although we
remain liable for certain limited representations and warranties related to loan sales, such as non-compliance with defined loan
origination or documentation standards, including misstatement in the loan documents, early payoff or default on payments.
Mortgage investors could seek to have us buy back loans or compensate them for losses incurred on mortgages we have sold
based on claims that we breached our limited representations and warranties. We have established reserves for probable losses.
Loan Commitments and Related Derivatives
We are party to interest rate lock commitments (“IRLCs”), which are extended to borrowers who have applied for loan
funding and meet defined credit and underwriting criteria in connection with our October 2018 acquisition of MLOA. IRLCs
are accounted for as derivative instruments recorded at fair value with gains and losses recognized in revenue in the
consolidated statements of operations. We manage our interest rate risk related to IRLCs and mortgage loans held for sale
through the use of derivative instruments, generally forward contracts on mortgage-backed securities (“MBS”), which are
commitments to either purchase or sell a specified financial instrument at a specified future date for a specified price, and
mandatory loan commitments, which are an obligation by an investor to buy loans at a specified price within a specified time
period. We do not enter into or hold derivatives for trading or speculative purposes and our derivatives are not designated as
hedging instruments. Changes in the fair value of our derivative financial instruments are recognized in revenues in our
consolidated statements of operations, and the fair values are reflected in other assets or other liabilities, as applicable. The net
change in fair value was not significant for the year ended December 31, 2018.
There are no credit-risk-related contingent features within our derivative agreements, and counterparty risk is considered
minimal. Gains and losses on IRLCs are substantially offset by corresponding gains or losses on forward contracts on
mortgage-backed securities and mandatory loan commitments. We are generally not exposed to variability in cash flows of
derivative instruments for more than approximately 90 days.
Inventory
Inventory is comprised of homes acquired through our Zillow Offers program and is stated at the lower of cost or net
realizable value. Homes are removed from inventory on a specific identification basis when they are resold. Stated cost
includes consideration paid to acquire and update each home including associated allocated overhead costs. Work-in-progress
inventory includes homes undergoing updates and finished goods inventory includes homes ready for resale. Unallocated
overhead costs are expensed as incurred and included in cost of revenue. Selling costs, including commissions, escrow and title
fees, staging, and holding costs, including utilities, taxes and maintenance, are expensed as incurred and included in sales and
marketing expenses.
Each quarter we review the value of homes held in inventory for indicators that net realizable value is lower than cost.
When evidence exists that the net realizable value of inventory is lower than its cost, the difference is recognized in cost of
revenue.
Contract Cost Assets
We capitalize certain incremental costs of obtaining contracts with customers which we expect to recover. These costs
relate to commissions paid to sales personnel, primarily for our Premier Agent and Premier Broker programs. As a practical
expedient, we recognize the incremental costs of obtaining a contract as an expense when incurred if the amortization period of
the asset that we otherwise would have recognized is one year or less. Capitalized commission costs are recorded as contract
96
cost assets in our consolidated balance sheets. Contract cost assets are amortized to expense on a straight-line basis over a
period that is consistent with the transfer to the customer of the products or services to which the asset relates, generally the
estimated life of the customer relationship. Amortization expense related to contract cost assets is included in sales and
marketing expenses in our consolidated statements of operations. In determining the estimated life of our customer
relationships, we consider quantitative and qualitative data, including, but not limited to, historical customer data, recent
changes or expected changes in product or service offerings, and changes in how we monetize our products and services. The
amortization period for capitalized contract costs related to our Premier Agent and Premier Broker programs ranges from two
to three years.
Property and Equipment
Property and equipment is recorded at cost and depreciated using the straight-line method over the estimated useful lives
of the related assets. The useful lives are as follows:
Computer equipment 2 to 3 years
Office equipment, furniture and fixtures 5 to 7 years
Leasehold improvements Shorter of expected useful life or lease term
Maintenance and repair costs are charged to expense as incurred. Major improvements, which extend the useful life of the
related asset, are capitalized. Upon disposal of a fixed asset, we record a gain or loss based on the difference between the
proceeds received and the net book value of the disposed asset.
Website and Software Development Costs
The costs incurred in the preliminary stages of development are expensed as incurred. Once an application has reached
the development stage, internal and external costs, if direct and incremental and deemed by management to be significant, are
capitalized in property and equipment and amortized on a straight-line basis over their estimated useful lives. Maintenance and
enhancement costs, including those costs in the post-implementation stages, are typically expensed as incurred, unless such
costs relate to substantial upgrades and enhancements to the website or software that result in added functionality, in which case
the costs are capitalized and amortized on a straight-line basis over the estimated useful lives. Amortization expense related to
capitalized website and software development costs is included in technology and development expense.
Capitalized development activities placed in service are amortized over the expected useful lives of those releases,
currently estimated at one to three years. The estimated useful lives of website and software development activities are
reviewed frequently and adjusted as appropriate to reflect upcoming development activities that may include significant
upgrades and/or enhancements to the existing functionality.
Construction-in-progress primarily consists of website development costs that are capitalizable, but for which the
associated applications had not been placed in service.
Recoverability of Goodwill and Indefinite-Lived Intangible Assets
Goodwill represents the excess of the cost of an acquired business over the fair value of the assets acquired at the date of
acquisition, and is not amortized. We assess the impairment of goodwill on an annual basis, in our fourth quarter, or whenever
events or changes in circumstances indicate that goodwill may be impaired. Typically, we choose to forgo the initial qualitative
assessment and perform a quantitative analysis to assist in our annual evaluation. If impairment exists, the carrying value of the
goodwill is reduced to fair value through an impairment charge recorded in our statements of operations.
Our indefinite-lived intangible asset is not amortized, and we assess the asset for impairment on an annual basis, in our
fourth quarter, or whenever events or changes in circumstances indicate that the asset may be impaired. On an interim basis we
consider if there are any events and circumstances that could affect the significant inputs used to determine the fair value of the
indefinite-lived intangible asset, including, but not limited to, costs that could have a negative effect on future expected
earnings and cash flows, changes in certain key performance metrics, and changes in management, key personnel, strategy or

97
customers. In our evaluation of our trade names and trademarks indefinite-lived intangible asset, we typically first perform a
qualitative assessment to determine whether the fair value of the indefinite-lived intangible asset is more likely than not
impaired. If so, we perform a quantitative assessment and an impairment charge is recorded in our statements of operations for
the excess of the carrying value of the indefinite-lived intangible asset over its fair value.
During the years ended December 31, 2018 and December 31, 2017, we recorded non-cash impairments for $69.0 million
and $174.0 million related to the indefinite-lived Trulia trade names and trademarks intangible asset. For additional information
about the non-cash impairments, see Note 11 to our consolidated financial statements.
Intangible Assets
We purchase and license data content from multiple data providers. This data content consists of U.S. county data about
home details (e.g., the number of bedrooms, bathrooms, square footage) and other information relating to the purchase price of
homes, both current and historical, as well as imagery, mapping and parcel data that is displayed on our mobile applications and
websites. Our home details data not only provides information about a home and its related transactions which is displayed on
our mobile applications and websites, but is also used in our proprietary valuation algorithms to produce Zestimates, Rent
Zestimates and Zillow Home Value Indexes. License agreement terms vary by vendor. In some instances, we retain perpetual
rights to this information after the contract ends; in other instances, the information and data are licensed only during the fixed
term of the agreement. Additionally, certain data license agreements provide for uneven payment amounts throughout the
contract term.
We capitalize payments made to third parties for data licenses that we expect to provide future economic benefit through
the recovery of the costs of these arrangements via the generation of our revenue and margins. For data license contracts that
include uneven payment amounts, we capitalize the payments as they are made as an intangible asset and the total contract
value is typically amortized on a straight-line basis over the term of the contract, which is equivalent to the estimated useful life
of the asset. We evaluate data content contracts for potential capitalization at the inception of the arrangement as well as each
time periodic payments to third parties are made.
The amortization period for the capitalized purchased content is based on our best estimate of the useful life of the asset,
which is approximately five years. The determination of the useful life includes consideration of a variety of factors including,
but not limited to, our assessment of the expected use of the asset and contractual provisions that may limit the useful life, as
well as an assessment of when the data is expected to become obsolete based on our estimates of the diminishing value of the
data over time. We evaluate the useful life of the capitalized purchased data content each reporting period to determine whether
events and circumstances warrant a revision to the remaining useful life. If we determine the estimate of the asset’s useful life
requires modification, the carrying amount of the asset is amortized prospectively over the revised useful life. The capitalized
purchased data content is amortized on a straight-line basis as the pattern of delivery of the economic benefits of the data
cannot reliably be determined because we do not have the ability to reliably predict future traffic to our mobile applications and
websites.
Under certain other data agreements, the underlying data is obtained on a subscription basis with consistent monthly or
quarterly recurring payment terms over the contractual period. Upon the expiration of such arrangements, we no longer have
the right to access the related data, and therefore, the costs incurred under such contracts are not capitalized and are expensed as
payments are made. We would immediately lose rights to data under these arrangements if we were to cancel the subscription
and/or cease making payments under the subscription arrangements.
We also capitalize costs related to the license of certain internal-use software from third parties, including certain licenses
of software in cloud computing arrangements. Additionally, we capitalize costs incurred during the application development
stage related to the development of internal-use software and enterprise cloud computing services. We expense costs as
incurred related to the planning and post-implementation phases of development. Capitalized internal-use software costs are
amortized over the estimated useful life of the asset, which is currently one to 3 years, on a straight-line basis.

98
Intangibles-in-progress consist of purchased content and software that are capitalizable but have not been placed in
service.
We also have intangible assets for developed technology, customer relationships, trade names and trademarks and
advertising relationships which we recorded in connection with acquisitions. Purchased intangible assets with a determinable
economic life are carried at cost, less accumulated amortization. These intangible assets are amortized over the estimated useful
life of the asset on a straight-line basis.
Recoverability of Intangible Assets with Definite Lives and Other Long-Lived Assets
We evaluate intangible assets and other long-lived assets for impairment whenever events or circumstances indicate that
they may not be recoverable. Recoverability is measured by comparing the carrying amount of an asset group to future
undiscounted net cash flows expected to be generated. We group assets for purposes of such review at the lowest level for
which identifiable cash flows of the asset group are largely independent of the cash flows of the other groups of assets and
liabilities. If this comparison indicates impairment, the amount of impairment to be recognized is calculated as the difference
between the carrying value and the fair value of the asset group.
Deferred Revenue
Deferred revenue consists of prepaid advertising fees received or billed in advance of satisfying our performance
obligations and prepaid but unrecognized subscription revenue. Deferred revenue is recognized when or as we satisfy our
obligations under contracts with customers.
Deferred Rent
For our operating leases, we recognize rent expense on a straight-line basis over the terms of the leases and, accordingly,
we record the difference between cash rent payments and the recognition of rent expense as a deferred rent liability. For office
space under an operating lease that is subleased to a third party for which we intend to reoccupy the space at a future date, rent
expense is recognized net of sublease income. Landlord-funded leasehold improvements are also recorded as deferred rent
liabilities and are amortized as a reduction of rent expense over the non-cancelable term of the related operating lease.
Business Combinations
We recognize identifiable assets acquired and liabilities assumed at their acquisition date fair values. Goodwill as of the
acquisition date is measured as the excess of consideration transferred over the net of the acquisition date fair values of the
assets acquired and the liabilities assumed. While we use our best estimates and assumptions for the purchase price allocation
process to value assets acquired and liabilities assumed at the acquisition date, our estimates are inherently uncertain and
subject to refinement. As a result, during the measurement period, which may be up to one year from the acquisition date, we
record adjustments to the assets acquired and liabilities assumed, with the corresponding offset to goodwill to the extent that we
identify adjustments to the preliminary purchase price allocation. Upon the conclusion of the measurement period or final
determination of the values of assets acquired or liabilities assumed, whichever comes first, any subsequent adjustments are
recorded to our consolidated statements of operations. We recognize adjustments to provisional amounts that are identified
during the measurement period in the reporting period in which the adjustment amounts are determined.
Revenue Recognition
We recognize revenue when (or as) we satisfy our performance obligations by transferring control of the promised
products or services to our customers in an amount that reflects the consideration to which we expect to be entitled in exchange
for those products or services.
As a practical expedient, we do not adjust the promised amount of consideration for the effects of a significant financing
component as the period between our transfer of a promised product or service to a customer and when the customer pays for
that product or service is one year or less.
99
We do not disclose the transaction price related to remaining performance obligations for (i) contracts with an original
expected duration of one year or less and (ii) contracts for which we recognize revenue at the amount to which we have the
right to invoice for performance completed to date. The remaining duration of our performance obligations is generally less
than one year.
In our Internet, Media & Technology (“IMT”) segment, we generate revenue from the sale of advertising services and our
suite of marketing software and technology solutions to businesses and professionals primarily associated with the residential
real estate, rental and mortgage industries. These professionals include real estate, rental and mortgage professionals and brand
advertisers. Our four primary revenue categories within our IMT segment are Premier Agent, Rentals, Mortgages and Other.
In our Homes segment, we generate revenue from the resale of homes on the open market through our Zillow Offers
program.
Premier Agent Revenue. Premier Agent revenue is derived from our Premier Agent and Premier Broker programs. Our
Premier Agent and Premier Broker programs offer a suite of marketing and business technology products and services to help
real estate agents and brokers achieve their advertising goals, while growing and managing their businesses and brands. All
Premier Agents and Premier Brokers receive access to a dashboard portal on our mobile application or website that provides
individualized program performance analytics, our customer relationship management, or CRM, tool that captures detailed
information about each contact made with a Premier Agent or Premier Broker through our mobile and web platforms and our
account management tools. We have concluded that the marketing and business technology products and services promised to
Premier Agents and Premier Brokers represent distinct performance obligations.
We primarily offer our Premier Agent and Premier Broker advertising products on a cost per impression basis. Payment is
received prior to the delivery of impressions. Impressions are delivered when a sold advertisement appears on pages viewed by
users of our mobile applications and websites. We determine the cost per impression delivered in each zip code using an
auction-based pricing method in consideration of the total amount spent by Premier Agents and Premier Brokers to purchase
impressions in the zip code during the month. A Premier Agent’s or Premier Broker’s share of voice in a zip code is determined
by their proportional monthly budgeted spend in that zip code as a percentage of the total monthly budgeted spend of all
Premier Agents and Premier Brokers in that zip code. The cost per impression that we charge is dynamic - as demand for
impressions in a zip code increases or decreases, the cost per impression in that zip code may be increased or decreased
accordingly. The price paid for each impression is representative of the price at which we would sell an impression separately
to a customer, or the stand-alone selling price.
We have not allocated the transaction price to each performance obligation as the amounts recognized would be the same
irrespective of any allocation. As such, we recognize revenue related to the Premier Agent and Premier Broker products and
services based on the contractual spend recognized on a straight-line basis during the contractual period over which the
products and services are provided. This methodology best depicts how we satisfy our performance obligations to customers, as
we continuously transfer control of the performance obligations to the customer throughout the contractual period.
In October 2018, we began testing a new Flex Pricing model for Premier Broker and Premier Agent advertising services
in limited markets. With the Flex Pricing model, Premier Brokers and Premier Agents are provided with validated leads at no
upfront cost, and they pay a performance advertising fee only when a real estate transaction is closed with one of their leads.
With this pricing model, the transaction price represents variable consideration as the amount to which we expect to be entitled
varies based on the number of validated leads that convert into real estate transactions.
Rentals Revenue. Rentals revenue includes our rentals marketplace and suite of tools for rental professionals. Rentals
revenue primarily includes revenue generated by advertising sold to property managers and other rental professionals on a cost
per lead, cost per click or cost per lease generated basis. We recognize revenue as leads or clicks are provided to rental
professionals, which is the amount for which we have the right to invoice. The number of leases generated through our rentals
marketplace during the period is accounted for as variable consideration, and we estimate these amounts based on the expected
number of qualified leases secured during the period. We do not believe that a significant reversal in the amount of cumulative
revenue recognized will occur once the uncertainty related to the number of leases secured is subsequently resolved.

100
Beginning in 2018, rentals revenue also includes revenue generated from Zillow’s rental applications product through
which potential renters can submit applications to multiple rental properties over a 30-day period for a flat service fee. We
recognize revenue for the rental applications product on a straight-line basis during the contractual period over which the
customer has the right to access and submit the rental application.
Mortgages Revenue. Mortgages revenue primarily includes marketing products sold to mortgage professionals on a cost
per lead basis, including our Custom Quote and a portion of our Connect (formerly known as Long Form) services, and on a
subscription basis, including a portion of our Connect service. For our Connect and Custom Quote cost per lead mortgage
marketing products, participating qualified mortgage professionals typically make a prepayment to gain access to consumers
interested in connecting with mortgage professionals. Mortgage professionals who exhaust their initial prepayment prepay
additional funds to continue to participate in the marketplace. For our Connect subscription mortgage marketing product,
participating qualified mortgage professionals generally prepay a monthly subscription fee, which they then allocate to desired
geographic counties. In Zillow Group’s Connect platform, consumers answer a series of questions to find a local lender, and
mortgage professionals receive consumer contact information, or leads, when the consumer chooses to share their information
with a lender. Consumers who request rates for mortgage loans in Custom Quotes are presented with customized quotes from
participating mortgage professionals.
For our cost per lead mortgages products, we recognize revenue when a user contacts a mortgage professional through
Zillow Group’s mortgages platform, which is the amount for which we have the right to invoice. For our Connect subscription
product, the opportunity to receive a consumer contact is based on the mortgage professional’s relative share of voice in a
geographic county. When a consumer submits a contact, Zillow Group contacts a group of subscription mortgage professionals
via text message, and the first mortgage professional to respond receives the consumer contact information. We recognize
revenue based on the contractual spend recognized on a straight-line basis during the contractual period over which the service
is provided. This methodology best depicts how we satisfy our performance obligation to subscription customers, as we
continuously transfer control of the performance obligation to the customer throughout the contractual period.
Beginning in October 2018, mortgages revenue also includes revenue generated from our mortgage originations business.
We elect the fair value option for our mortgage loans held for sale, which are initially recorded at fair value based on either sale
commitments or current market quotes and are adjusted for subsequent changes in fair value until the loans are closed.
Mortgages revenue also includes revenue generated by Mortech, which provides subscription-based mortgage software
solutions, including a product and pricing engine and lead management platform, for which we recognize revenue on a straight-
line basis during the contractual period over which the services are provided.
Other Revenue. Other revenue primarily includes revenue generated by new construction and display, as well as revenue
from the sale of various other marketing and business products and services to real estate professionals. Our new construction
marketing solutions allow home builders to showcase their available inventory to home shoppers. New construction revenue
primarily includes revenue generated by advertising sold to builders on a cost per residential community basis, and revenue is
recognized on a straight-line basis during the contractual period over which the communities are advertised on our mobile
applications and websites. Consideration is billed in arrears. Display revenue primarily consists of graphical mobile and web
advertising sold on a cost per thousand impressions or cost per click basis to advertisers promoting their brands on our mobile
applications and websites. We recognize display revenue as clicks occur or as impressions are delivered to users interacting
with our mobile applications or websites, which is the amount for which we have the right to invoice.
Homes Revenue. Homes revenue is derived from the resale of homes on the open market through our Zillow Offers
program. Homes revenue is recognized at the time of the closing of the home sale when title to and possession of the property
are transferred to the buyer.
There were no customers that generated 10% or more of our total revenue in the years ended December 31, 2018, 2017 or
2016.
101
Cost of Revenue
For our IMT segment, our cost of revenue consists of expenses related to operating our mobile applications and websites,
including associated headcount expenses, such as salaries and benefits and share-based compensation expense and bonuses, as
well as credit card fees, ad serving costs paid to third parties, revenue-sharing costs related to our commercial business
relationships, depreciation expense and costs associated with the operation of our data center and mobile applications and
websites. Beginning in the fourth quarter of 2018, cost of revenue within the IMT segment also includes expenses associated
with our mortgage originations business, such as origination costs and fees, lead acquisition costs and expenses related to
systems used directly in the origination of mortgages. For our Homes segment, our cost of revenue also consists of the
consideration paid to acquire and make necessary updates to each home including associated overhead costs.
Technology and Development
Technology and development expenses consist of headcount expenses, including salaries, benefits, share-based
compensation expense and bonuses for salaried employees and contractors engaged in the design, development and testing of
our mobile applications and websites and the tools and applications that support our products, and equipment and maintenance
costs. Technology and development expenses also include amortization costs related to capitalized website and development
activities, amortization of software, amortization of certain intangibles and other data agreement costs related to the purchase of
data used to populate our mobile applications and websites, amortization of intangible assets recorded in connection with
acquisitions, including developed technology and customer relationships, amongst others, and depreciation expense.
Research and development costs are expensed as incurred and are recorded in technology and development expenses. For
the years ended December 31, 2018, 2017 and 2016, expenses attributable to research and development for our business totaled
$298.1 million, $193.0 million and $170.1 million, respectively.
Share-Based Compensation
We measure compensation expense for all share-based awards at fair value on the date of grant and recognize
compensation expense over the service period on a straight-line basis for awards expected to vest.
We use the Black-Scholes-Merton option-pricing model to determine the fair value for option awards. In valuing our
option awards, we make assumptions about risk-free interest rates, dividend yields, volatility, and weighted-average expected
lives. In addition, through December 31, 2016, we made assumptions about estimated forfeiture rates. Beginning on January 1,
2017, we elected to account for forfeitures as they occur. Risk-free interest rates are derived from U.S. Treasury securities as of
the option award grant date. Expected dividend yield is based on our historical cash dividend payments, which have been zero
to date. The expected volatility for our Class A common stock and Class C capital stock is estimated using our historical
volatility. The weighted-average expected life of the option awards is estimated based on our historical exercise data. Prior to
January 1, 2017, forfeiture rates were estimated using historical actual forfeiture trends as well as our judgment of future
forfeitures. These rates were evaluated at least quarterly and any change in share-based compensation expense was recognized
in the period of the change. We considered many factors when estimating expected forfeitures, including employee class and
historical experience.
For issuances of restricted stock units and restricted units, we determine the fair value of the award based on the market
value of our Class A common stock or Class C capital stock, as applicable, at the date of grant.
Advertising Costs
Advertising costs are expensed as incurred. For the years ended December 31, 2018, 2017 and 2016, expenses attributable
to advertising totaled $177.3 million, $156.5 million and $120.2 million, respectively. Advertising costs are recorded in sales
and marketing expenses.
Income Taxes
We use the asset and liability approach for accounting and reporting income taxes, which requires the recognition of
deferred tax assets and liabilities for the expected future tax consequences of temporary differences between the financial

102
statement and tax bases of assets and liabilities at the applicable enacted tax rates. A valuation allowance against deferred tax
assets would be established if, based on the weight of available evidence, it is more likely than not (a likelihood of more than
50%) that some or all of the deferred tax assets are not expected to be realized.
We establish reserves for tax-related uncertainties based on estimates of whether, and the extent to which, additional taxes
will be due. We adjust these reserves in light of changing facts and circumstances, such as the closing of a tax audit, new tax
legislation or the change of an estimate. To the extent that the final tax outcome of these matters is different than the amounts
recorded, such differences will affect the provision for income taxes in the period in which such determination is made. Interest
and penalties related to unrecognized tax benefits are recorded as income tax expense.
On December 22, 2017, the U.S. government enacted comprehensive tax legislation under the Tax Cuts and Jobs Act (the
“Tax Act”). The Tax Act makes broad and complex changes to the U.S. tax code, including but not limited to: (1) reducing the
U.S. federal corporate tax rate from 35 percent to 21 percent; (2) requiring companies to pay a one-time transition tax on
certain unrepatriated earnings of foreign subsidiaries; (3) generally eliminating U.S. federal income taxes on dividends from
foreign subsidiaries; (4) eliminating the corporate alternative minimum tax (“AMT”) and how AMT credits are utilized; (5) the
additional limitations on deducting executive compensation under IRC Section 162(m); and (6) changing rules related to uses
and limitations of net operating loss carryforwards created in tax years beginning after December 31, 2017. Shortly after
enactment, implementation guidance was released by the Securities and Exchange Commission that requires a company to
reflect the income tax effects of those aspects of the Tax Act for which the accounting under the accounting rules is complete.
To the extent that a company’s accounting for certain income tax effects of the Tax Act is incomplete but the company is able to
determine a reasonable estimate, it should record a provisional estimate in the financial statements. Further, the implementation
guidance also provides for a measurement period that should not extend beyond one year from the Tax Act enactment date for
companies to complete their accounting pursuant to the accounting rules.
Recently Adopted Accounting Standards
In December 2016, the Financial Accounting Standards Board (“FASB”) issued guidance to narrow the definition of a
business. This guidance assists entities with evaluating when a set of transferred assets and activities is a business. This
guidance is effective for interim and annual reporting periods beginning after December 15, 2017, and early adoption is
permitted. This guidance must be applied prospectively to transactions occurring within the period of adoption. We adopted this
guidance on January 1, 2018. The adoption of this guidance did not have an impact on our financial position, results of
operations or cash flows.
In January 2016, the FASB issued guidance on the recognition and measurement of financial instruments. This guidance
generally requires equity investments, except those accounted for under the equity method of accounting or those that result in
consolidation of the investee, to be measured at fair value with changes in fair value recognized in net income (loss). An entity
may elect to measure equity securities that do not have readily determinable fair values and do not qualify for the net asset
value per share practical expedient at cost minus impairment, if any, plus or minus changes resulting from observable price
changes in orderly transactions for the identical or a similar investment of the same issuer. The guidance also requires the
separate presentation of financial assets and financial liabilities by measurement category and form of financial asset on the
balance sheet or the accompanying notes to the financial statements. This guidance is effective for interim and annual reporting
periods beginning after December 15, 2017, early adoption is permitted, and the guidance must be applied prospectively to
equity investments that exist as of the adoption date. We adopted this guidance, and the February 2018 amendment to this
guidance, effective January 1, 2018. The adoption of this guidance did not have any impact on our financial position, results of
operations or cash flows.
In May 2014, the FASB issued guidance on revenue from contracts with customers. The guidance states that an entity
should recognize revenue to depict the transfer of promised goods or services to customers in an amount that reflects the
consideration to which the entity expects to be entitled in exchange for those products or services. It also states that an entity
should recognize as an asset the incremental costs of obtaining a contract that the entity expects to recover and amortize the
costs consistent with the transfer to the customer of the products or services to which the asset relates. The guidance requires
more detailed disclosures to enable users of financial statements to understand the nature, amount, timing, and uncertainty of

103
revenue and cash flows arising from contracts with customers. We adopted this guidance effective January 1, 2018 using the
modified retrospective transition approach applied to all contracts at the date of initial application. We recorded an adjustment
of $40.3 million to decrease accumulated deficit as of January 1, 2018 related to the accounting for the cost of sales
commissions, primarily related to sales commissions for our Premier Agent and Premier Broker advertising products.
Historically, we expensed these sales commission costs as incurred, but under the new guidance, the cost of certain sales
commissions is recorded as a contract cost asset and recognized as an operating expense over the period that we expect to
recover the costs.
The amount by which each financial statement line item is affected by the application of this guidance as of and for the
year ended December 31, 2018 is as follows (in thousands, except per share data):
New
Guidance Prior
Guidance Change
Consolidated Statement of Operations:
Sales and marketing $ 552,621 $ 558,118 $ (5,497 )
Total costs and expenses 1,462,529 1,468,026 (5,497 )
Loss from operations (128,975 ) (134,472 ) 5,497
Loss before income taxes (150,960 ) (156,457 ) 5,497
Income tax benefit 31,102 32,024 (922 )
Net loss (119,858 ) (124,433 ) 4,575
Net loss per share — basic and diluted (0.61 ) (0.63 ) 0.02
Consolidated Balance Sheet:
Contract cost assets 45,819 — 45,819
Total assets 4,291,116 4,245,297 45,819
Deferred tax liabilities and other long-term liabilities 17,474 16,552 922
Total liabilities 1,023,937 1,023,015 922
Accumulated deficit (671,779 ) (716,676 ) 44,897
Total shareholders’ equity 3,267,179 3,222,282 44,897
Total liabilities and shareholders’ equity $ 4,291,116 $ 4,245,297 $ 45,819
Recently Issued Accounting Standards Not Yet Adopted
In August 2018, the FASB issued guidance related to a customer’s accounting for implementation costs incurred in
hosting arrangements. The guidance aligns the requirements for capitalizing implementation costs incurred in cloud computing
arrangements with the requirements for capitalizing costs to develop or obtain internal-use software. This guidance is effective
for interim and annual reporting periods beginning after December 15, 2019, and early adoption is permitted. This guidance
may be applied either retrospectively or prospectively. We expect to adopt this guidance on January 1, 2020. We have not yet
determined the impact the adoption of this guidance will have on our financial position, results of operations or cash flows.
In August 2018, the FASB issued guidance related to disclosure requirements for fair value measurements. This guidance
removes, modifies and adds disclosures related to fair value measurements. This guidance is effective for interim and annual
periods beginning after December 15, 2019, and early adoption is permitted. The amendments on changes in unrealized gains
and losses, the range and weighted average of significant unobservable inputs used to develop Level 3 fair value measurements
and the narrative description of measurement uncertainty should be applied prospectively for only the most recent interim and
annual period presented in the initial fiscal year of adoption. All other amendments should be applied retrospectively to all
periods presented upon their effective date. We expect to adopt this guidance on January 1, 2020. We have not yet determined
the impact the adoption of this guidance will have on our financial statement disclosures.
104
In June 2018, the FASB issued guidance related to contributions received and made. This guidance assists entities with
evaluating whether a transfer of assets is considered a contribution or an exchange transaction. This guidance is effective for
interim and annual reporting periods beginning after June 15, 2018 for contributions received and after December 15, 2018 for
contributions made, and early adoption is permitted. The guidance should be applied on a modified prospective basis, though
retrospective application is permitted. We adopted this guidance on January 1, 2019. The adoption of this guidance is not
expected to have a material impact on our financial position, results of operations or cash flows.
In February 2018, the FASB issued guidance on income tax accounting related to the Tax Act. This guidance permits a
reclassification from accumulated other comprehensive income (loss) to accumulated deficit for the adjustment of deferred
taxes due to the reduction of the historical corporate income tax rate to the newly enacted corporate income tax rate under the
Tax Act. It also requires certain disclosures regarding these reclassifications. The guidance is effective for interim and annual
reporting periods beginning after December 15, 2018, and early adoption is permitted. This guidance must be applied either on
a prospective basis in the period of adoption or retrospectively to each period in which the effect of the change in the corporate
income tax rate is recognized. We adopted this guidance on January 1, 2019. The adoption of this guidance is not expected to
have a material impact on our financial position, results of operations or cash flows.
In March 2017, the FASB issued guidance related to the premium amortization on purchased callable debt securities. This
guidance shortens the amortization period for certain callable debt securities purchased at a premium by requiring that the
premium be amortized to the earliest call date. This guidance is effective for interim and annual reporting periods beginning
after December 15, 2018, and early adoption is permitted. This guidance must be applied on a modified retrospective basis
through a cumulative-effect adjustment directly to retained earnings as of the beginning of the period of adoption. We adopted
this guidance on January 1, 2019. The adoption of this guidance is not expected to have a material impact on our financial
position, results of operations or cash flows.
In June 2016, the FASB issued guidance on the measurement of credit losses on financial instruments. This guidance
requires the use of an expected loss impairment model for instruments measured at amortized cost. For available-for-sale debt
securities, an entity is required to recognize credit losses through an allowance for credit losses rather than as a write-down.
This guidance is effective for interim and annual reporting periods beginning after December 15, 2019, and early adoption is
permitted for interim and annual reporting periods beginning after December 15, 2018. The adoption of this guidance requires a
cumulative-effect adjustment to retained earnings as of the beginning of the first reporting period in which the guidance is
effective. We expect to adopt this guidance on January 1, 2020. We have not yet determined the impact the adoption of this
guidance will have on our financial position, results of operations or cash flows.
In February 2016, the FASB issued guidance on leases. This guidance requires the recognition of a right-of-use asset and
lease liability on the balance sheet for all leases. This guidance also requires more detailed disclosures to enable users of
financial statements to understand the amount, timing, and uncertainty of cash flows arising from leases. This guidance is
effective for interim and annual reporting periods beginning after December 15, 2018. In July 2018, the FASB issued certain
targeted improvements to the accounting and disclosure requirements for leases, including an additional optional transition
method that allows entities to initially apply the new standard at the adoption date and recognize a cumulative-effect adjustment
to the opening balance of retained earnings in the period of adoption without restating prior periods. When adopting the lease
guidance, an entity may elect a practical expedient package, under which it need not reassess (a) whether any expired or
existing contracts are or contain leases; (b) the lease classification for any expired or existing leases; and (c) initial direct costs
for any existing leases. These three practical expedients must be elected as a package and must be consistently applied to all
existing leases at the date of adoption. We adopted the new guidance on leases on January 1, 2019 using the optional transition
method and electing to adopt the practical expedient package. Under this approach, we will not restate the prior financial
statements presented. Based on our lease portfolio as of December 31, 2018, we anticipate recording on our consolidated
balance sheet right-of-use assets of approximately $90 million as well as operating lease liabilities of approximately $115
million with no material impact to our consolidated statements of operations or cash flows.

105
Note 3. Fair Value Measurements
Accounting standards define fair value as the price that would be received to sell an asset or paid to transfer a liability (an
exit price) in the principal or most advantageous market in an orderly transaction between market participants on the
measurement date. The standards also establish a fair value hierarchy, which requires an entity to maximize the use of
observable inputs and minimize the use of unobservable inputs when measuring fair value. There are three levels of inputs that
may be used to measure fair value:
• Level 1—Quoted prices in active markets for identical assets or liabilities.
• Level 2—Assets and liabilities valued based on observable market data for similar instruments, such as quoted prices
for similar assets or liabilities.
• Level 3—Unobservable inputs that are supported by little or no market activity; instruments valued based on the best
available data, some of which is internally developed, and considers risk premiums that a market participant would
require.
We applied the following methods and assumptions in estimating our fair value measurements:
Cash equivalents—The fair value measurement of money market funds is based on quoted market prices in active
markets. The fair value measurement of corporate notes and bonds, commercial paper, U.S. government agency securities and
certificates of deposit is based on observable market-based inputs or inputs that are derived principally from or corroborated by
observable market data by correlation or other means.
Short-term investments—The fair value measurement of our short-term investments is based on observable market-based
inputs or inputs that are derived principally from or corroborated by observable market data by correlation or other means.
Restricted cash—The carrying value of restricted cash approximates fair value due to the short period of time amounts
borrowed on the Revolving Credit Facility (see Note 14) are outstanding. Further, the carrying value of restricted cash related
to escrow amounts held as part of the mortgage originations business also approximates fair value due to the short period of
time amounts are held in escrow before they are transferred to the appropriate party, typically a home seller or bank.
Mortgage loans held for sale—The fair value of mortgage loans held for sale is generally calculated by reference to
quoted prices in secondary markets for commitments to sell mortgage loans with similar characteristics.
Interest rate lock commitments—The fair value of interest rate lock commitments is calculated by reference to quoted
prices in secondary markets for commitments to sell mortgage loans with similar characteristics. Any expired commitments are
excluded from the fair value measurement. We generally only issue IRLCs for products that meet specific purchaser guidelines.
Since not all IRLCs will become closed loans, we adjust our fair value measurements for the estimated amount of IRLCs that
will not close.
Forward contracts—The fair value of mandatory loan sales commitments and derivative instruments such as forward
sales of MBS that are utilized as hedging instruments are calculated by reference to quoted prices for similar assets.

106
The following tables present the balances of assets measured at fair value on a recurring basis, by level within the fair
value hierarchy, as of the dates presented (in thousands):
December 31, 2018
Total Level 1 Level 2
Cash equivalents:
Money market funds $ 541,575 $ 541,575 $ —
Commercial paper 3,999 — 3,999
Short-term investments:
U.S. government agency securities 646,496 — 646,496
Corporate notes and bonds 112,933 — 112,933
Commercial paper 85,506 — 85,506
Municipal securities 39,306 — 39,306
Foreign government securities 14,915 — 14,915
Certificates of deposit 4,711 — 4,711
Mortgage origination-related:
Mortgage loans held for sale 35,409 — 35,409
Interest rate lock commitments 847 — 847
Forward contracts (125 ) — (125 )
Total $ 1,485,572 $ 541,575 $ 943,997
December 31, 2017
Total Level 1 Level 2
Cash equivalents:
Money market funds $ 233,508 $ 233,508 $ —
Corporate notes and bonds 6,199 — 6,199
Commercial paper 3,987 — 3,987
U.S. government agency securities 1,748 — 1,748
Certificates of deposit 249 — 249
Short-term investments:
U.S. government agency securities 298,758 — 298,758
Corporate notes and bonds 44,607 — 44,607
Commercial paper 39,325 — 39,325
Municipal securities 11,459 — 11,459
Certificates of deposit 10,297 — 10,297
Foreign government securities 5,998 — 5,998
Total $ 656,135 $ 233,508 $ 422,627
At December 31, 2018, the notional amounts of the hedging instruments related to our mortgage loans held for sale
were $26.7 million and $28.8 million for our interest rate lock commitments and forward contracts, respectively.
See Note 14 for the carrying amount and estimated fair value of the Company’s Convertible Senior Notes due in 2023,
Convertible Senior Notes due in 2021 and Trulia’s Convertible Senior Notes due in 2020.
We did not have any Level 3 assets as of December 31, 2018 or 2017. There were no material liabilities measured at fair
value as of December 31, 2018 or 2017.

107
Note 4. Cash and Cash Equivalents, Short-term Investments and Restricted Cash
The following tables present the amortized cost, gross unrealized gains and losses and estimated fair market value of our
cash and cash equivalents, available-for-sale investments and restricted cash as of the dates presented (in thousands):
December 31, 2018
Amortized
Cost
Gross
Unrealized
Gains
Gross
Unrealized
Losses
Estimated
Fair
Market
Value
Cash $ 105,484 $ — $ — $ 105,484
Cash equivalents:
Money market funds 541,575 — — 541,575
Commercial paper 3,999 — — 3,999
Short-term investments:
U.S. government agency securities 647,266 51 (821 ) 646,496
Corporate notes and bonds 113,109 1 (177 ) 112,933
Commercial paper 85,506 — — 85,506
Municipal securities 39,316 23 (33 ) 39,306
Foreign government securities 14,929 — (14 ) 14,915
Certificates of deposit 4,711 1 (1 ) 4,711
Restricted cash 12,385 — — 12,385
Total $ 1,568,280 $ 76 $ (1,046 ) $ 1,567,310
December 31, 2017
Amortized
Cost
Gross
Unrealized
Gains
Gross
Unrealized
Losses
Estimated
Fair
Market
Value
Cash $ 106,404 $ — $ — $ 106,404
Cash equivalents:
Money market funds 233,508 — — 233,508
Corporate notes and bonds 6,200 — (1 ) 6,199
Commercial paper 3,987 — — 3,987
U.S. government agency securities 1,748 — — 1,748
Certificates of deposit 249 — — 249
Short-term investments:
U.S. government agency securities 299,814 — (1,056 ) 298,758
Corporate notes and bonds 44,661 1 (55 ) 44,607
Commercial paper 39,325 — — 39,325
Municipal securities 11,494 — (35 ) 11,459
Certificates of deposit 10,296 2 (1 ) 10,297
Foreign government securities 6,000 — (2 ) 5,998
Total $ 763,686 $ 3 $ (1,150 ) $ 762,539
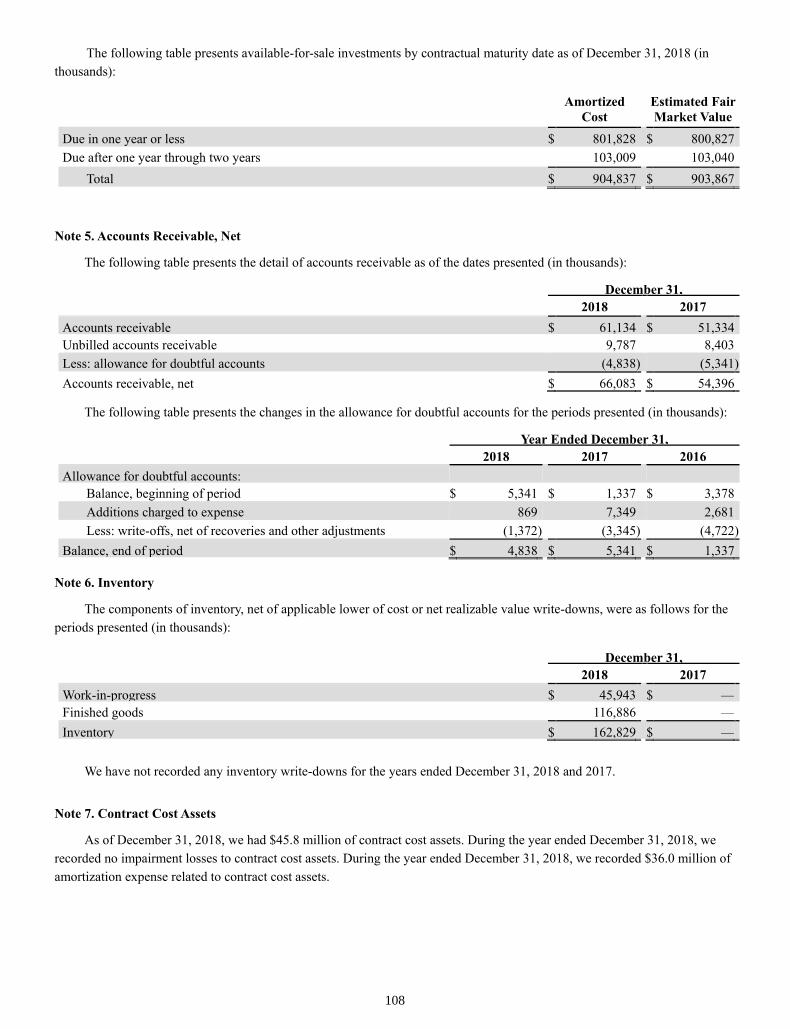
108
The following table presents available-for-sale investments by contractual maturity date as of December 31, 2018 (in
thousands):
Amortized
Cost
Estimated Fair
Market Value
Due in one year or less $ 801,828 $ 800,827
Due after one year through two years 103,009 103,040
Total $ 904,837 $ 903,867
Note 5. Accounts Receivable, Net
The following table presents the detail of accounts receivable as of the dates presented (in thousands):
December 31,
2018 2017
Accounts receivable $ 61,134 $ 51,334
Unbilled accounts receivable 9,787 8,403
Less: allowance for doubtful accounts (4,838 ) (5,341 )
Accounts receivable, net $ 66,083 $ 54,396
The following table presents the changes in the allowance for doubtful accounts for the periods presented (in thousands):
Year Ended December 31,
2018 2017 2016
Allowance for doubtful accounts:
Balance, beginning of period $ 5,341 $ 1,337 $ 3,378
Additions charged to expense 869 7,349 2,681
Less: write-offs, net of recoveries and other adjustments (1,372 ) (3,345 ) (4,722 )
Balance, end of period $ 4,838 $ 5,341 $ 1,337
Note 6. Inventory
The components of inventory, net of applicable lower of cost or net realizable value write-downs, were as follows for the
periods presented (in thousands):
December 31,
2018 2017
Work-in-progress $ 45,943 $ —
Finished goods 116,886 —
Inventory $ 162,829 $ —
We have not recorded any inventory write-downs for the years ended December 31, 2018 and 2017.
Note 7. Contract Cost Assets
As of December 31, 2018, we had $45.8 million of contract cost assets. During the year ended December 31, 2018, we
recorded no impairment losses to contract cost assets. During the year ended December 31, 2018, we recorded $36.0 million of
amortization expense related to contract cost assets.

109
Note 8. Property and Equipment, Net
The following table presents the detail of property and equipment as of the dates presented (in thousands):
December 31,
2018 2017
Website development costs $ 149,891 $ 130,072
Computer equipment 22,477 30,071
Leasehold improvements 65,012 47,321
Construction-in-progress 29,037 28,150
Office equipment, furniture and fixtures 39,510 22,887
Property and equipment 305,927 258,501
Less: accumulated amortization and depreciation (170,755 ) (146,230 )
Property and equipment, net $ 135,172 $ 112,271
We recorded depreciation expense related to property and equipment (other than website development costs) of
$19.5 million, $15.6 million and $13.5 million, respectively, during the years ended December 31, 2018, 2017 and 2016.
We capitalized $34.1 million, $49.9 million and $49.5 million, respectively, in website development costs during the
years ended December 31, 2018, 2017 and 2016. Amortization expense for website development costs included in technology
and development expenses was $28.6 million, $40.0 million and $40.0 million, respectively, for the years ended December 31,
2018, 2017 and 2016.
Note 9. Acquisitions and Equity Investments
Acquisition of Mortgage Lenders of America
On October 31, 2018, Zillow Group’s wholly owned subsidiary, ZGM Holdco, Inc., acquired the outstanding equity of
Mortgage Lenders of America, L.L.C., a national mortgage lender headquartered in Overland Park, Kansas for approximately
$66.7 million in cash.
Our acquisition of MLOA has been accounted for as a business combination, and assets acquired and liabilities assumed
were recorded at their estimated fair values as of October 31, 2018. Goodwill, which represents the expected synergies from
combining the acquired assets and the operations of the acquirer, as well as intangible assets that do not qualify for separate
recognition, is measured as of the acquisition date as the excess of consideration transferred, which is also measured at fair
value, and the net of the fair values of the assets acquired and the liabilities assumed as of the acquisition date. The goodwill
recognized in conjunction with this business combination has been allocated to our IMT segment.
The total purchase price has been allocated to the assets acquired and liabilities assumed, including identifiable intangible
assets, based on their respective fair values at the acquisition date. Based upon the fair values determined by us, in which we
considered or relied in part upon a valuation report of a third-party expert, the total purchase price was allocated as follows (in
thousands):

110
Cash and cash equivalents $ 10,796
Restricted cash 753
Mortgage loans available for sale 34,248
Property, plant and equipment 1,315
Intangible assets 2,600
Goodwill 53,831
Other acquired assets 3,079
Accounts payable (1,953 )
Accrued expenses (2,591 )
Warehouse lines of credit (32,536 )
Other assumed liabilities (2,855 )
Total purchase price $ 66,687
Acquisition-related costs incurred, which primarily included legal, accounting, regulatory and other external costs directly
related to the acquisition, are included within Acquisition-related costs within our consolidated statements of operations and
were expensed as incurred.
The results of operations related to the acquisition of MLOA have been included in our consolidated financial statements
since the date of acquisition, and are not significant. On an unaudited pro forma basis, revenue would have been approximately
3.0% higher for the year ended December 31, 2018 and 5.0% higher for the year-ended December 31, 2017 if the acquisition
would have been consummated as of January 1, 2017. Unaudited pro forma earnings information has not been presented as the
effects were not material to our consolidated financial statements.
Acquisition of New Home Feed
On September 6, 2017, Zillow, Inc. acquired New Home Feed, Inc. (formerly known as Graphic Language, Inc.), a
California corporation which operates the New Home Feed business, pursuant to an Agreement and Plan of Merger for an
immaterial amount. New Home Feed is a listing management technology that allows builders to input, manage and syndicate
their listings across Zillow Group and partner sites. Our acquisition of New Home Feed has been accounted for as a business
combination, and assets acquired and liabilities assumed were recorded at their estimated fair values as of September 6, 2017.
We acquired goodwill of $3.6 million and an identifiable intangible asset of $1.9 million.
Acquisition-related costs incurred related to the acquisition of New Home Feed, which primarily included legal and
accounting fees and other external costs directly related to the acquisition, were expensed as incurred and were not material.
The results of operations related to the acquisition of New Home Feed have been included in our consolidated financial
statements since the date of acquisition and are not significant. Pro forma financial information for the acquisition accounted
for as a business combination has not been presented, as the effects were not material to our consolidated financial statements.
Acquisition of Hamptons Real Estate Online
On January 11, 2017, Zillow, Inc. acquired substantially all of the operating assets of RealNet Solutions, Inc., a New York
corporation, RealNetDB, LLC, a New York limited liability company, Hamptons Real Estate Online, Inc., a New York
corporation, and HREO.com, LLC, a New York limited liability company (collectively, “HREO”), pursuant to an Asset
Purchase Agreement entered into by Zillow, Inc., HREO, each of the equity owners of HREO, and an individual acting as
representative of the HREO equity holders. HREO is a Hamptons-focused real estate portal which provides buyers and renters
with a specialized search experience and access to the area’s most comprehensive for-sale, for-rent, and vacant land listings.
HREO’s listing entry and distribution software, RealNet and Open RealNet Exchange, provides real estate professionals with
tools to manage and market their listings. Our acquisition of HREO has been accounted for as a business combination, and
assets acquired and liabilities assumed were recorded at their estimated fair values as of January 11, 2017. We acquired
goodwill of $4.0 million, identifiable intangible assets of $2.1 million and net liabilities of approximately $0.1 million.
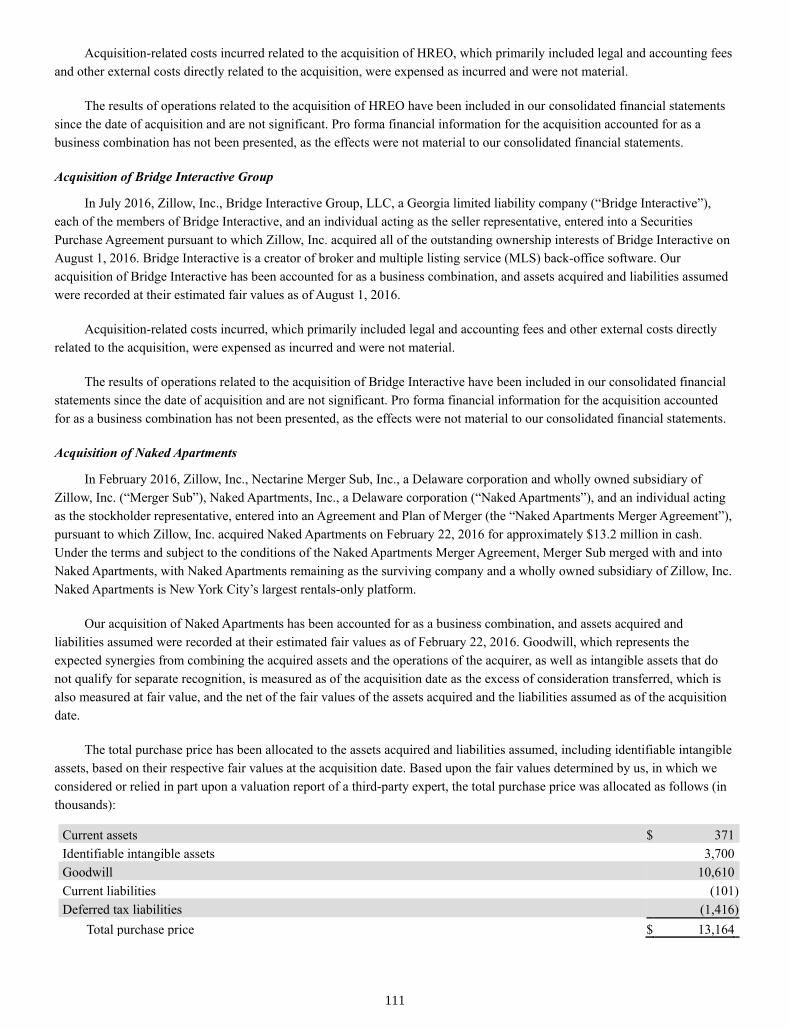
111
Acquisition-related costs incurred related to the acquisition of HREO, which primarily included legal and accounting fees
and other external costs directly related to the acquisition, were expensed as incurred and were not material.
The results of operations related to the acquisition of HREO have been included in our consolidated financial statements
since the date of acquisition and are not significant. Pro forma financial information for the acquisition accounted for as a
business combination has not been presented, as the effects were not material to our consolidated financial statements.
Acquisition of Bridge Interactive Group
In July 2016, Zillow, Inc., Bridge Interactive Group, LLC, a Georgia limited liability company (“Bridge Interactive”),
each of the members of Bridge Interactive, and an individual acting as the seller representative, entered into a Securities
Purchase Agreement pursuant to which Zillow, Inc. acquired all of the outstanding ownership interests of Bridge Interactive on
August 1, 2016. Bridge Interactive is a creator of broker and multiple listing service (MLS) back-office software. Our
acquisition of Bridge Interactive has been accounted for as a business combination, and assets acquired and liabilities assumed
were recorded at their estimated fair values as of August 1, 2016.
Acquisition-related costs incurred, which primarily included legal and accounting fees and other external costs directly
related to the acquisition, were expensed as incurred and were not material.
The results of operations related to the acquisition of Bridge Interactive have been included in our consolidated financial
statements since the date of acquisition and are not significant. Pro forma financial information for the acquisition accounted
for as a business combination has not been presented, as the effects were not material to our consolidated financial statements.
Acquisition of Naked Apartments
In February 2016, Zillow, Inc., Nectarine Merger Sub, Inc., a Delaware corporation and wholly owned subsidiary of
Zillow, Inc. (“Merger Sub”), Naked Apartments, Inc., a Delaware corporation (“Naked Apartments”), and an individual acting
as the stockholder representative, entered into an Agreement and Plan of Merger (the “Naked Apartments Merger Agreement”),
pursuant to which Zillow, Inc. acquired Naked Apartments on February 22, 2016 for approximately $13.2 million in cash.
Under the terms and subject to the conditions of the Naked Apartments Merger Agreement, Merger Sub merged with and into
Naked Apartments, with Naked Apartments remaining as the surviving company and a wholly owned subsidiary of Zillow, Inc.
Naked Apartments is New York City’s largest rentals-only platform.
Our acquisition of Naked Apartments has been accounted for as a business combination, and assets acquired and
liabilities assumed were recorded at their estimated fair values as of February 22, 2016. Goodwill, which represents the
expected synergies from combining the acquired assets and the operations of the acquirer, as well as intangible assets that do
not qualify for separate recognition, is measured as of the acquisition date as the excess of consideration transferred, which is
also measured at fair value, and the net of the fair values of the assets acquired and the liabilities assumed as of the acquisition
date.
The total purchase price has been allocated to the assets acquired and liabilities assumed, including identifiable intangible
assets, based on their respective fair values at the acquisition date. Based upon the fair values determined by us, in which we
considered or relied in part upon a valuation report of a third-party expert, the total purchase price was allocated as follows (in
thousands):
Current assets $ 371
Identifiable intangible assets 3,700
Goodwill 10,610
Current liabilities (101 )
Deferred tax liabilities (1,416 )
Total purchase price $ 13,164

112
Acquisition-related costs incurred, which primarily included legal and accounting fees and other external costs directly
related to the acquisition, were expensed as incurred and were not material.
The results of operations related to the acquisition of Naked Apartments have been included in our consolidated financial
statements since the date of acquisition and are not significant. Pro forma financial information for the acquisition accounted
for as a business combination has not been presented, as the effects were not material to our consolidated financial statements.
Equity Investments
In June 2017, we purchased an equity interest in a privately held corporation for approximately $10.0 million.
In October 2016, we purchased a 10% equity interest in a privately held variable interest entity within the real estate
industry for $10.0 million. The entity is financed through its business operations. We are not the primary beneficiary of the
entity, as we do not direct the activities that most significantly impact the entity’s economic performance. Therefore, we do not
consolidate the entity. Our maximum exposure to loss is $10.0 million, the carrying amount of the investment as of
December 31, 2018.
These investments are equity securities without readily determinable fair values which we account for at cost minus any
impairment, plus or minus changes resulting from observable price changes in orderly transactions for identical or similar
investments of the same issuer. During the year ended December 31, 2018, we recognized a non-cash impairment charge of
$10.0 million related to our June 2017 investment. The impairment charge is included in Impairment costs within our
consolidated statements of operations. During the third quarter of 2018, in connection with our quarterly qualitative assessment
of this investment for impairment indicators, we identified factors that led us to conclude that the investment was impaired and
the fair value of the investment was less than the carrying value. The most significant of such factors was related to the
business prospects of the investee. Accordingly, we performed an analysis to determine the fair value of the investment and
concluded that our best estimate of its fair value was $0.0 million. This is considered a Level 3 measurement under the fair
value hierarchy.
There has been no impairment or upward or downward adjustments for our October 2016 equity investment as of
December 31, 2018 that would impact the carrying amount of the investment. The October 2016 investment is classified within
other assets in the consolidated balance sheet.
Note 10. Goodwill
The goodwill balance as of December 31, 2018 and 2017 is fully attributable to our IMT segment. The following table
presents the change in goodwill from December 31, 2017 through December 31, 2018 (in thousands):
Balance as of December 31, 2017 $ 1,931,076
Goodwill recorded in connection with acquisition of MLOA 53,831
Balance as of December 31, 2018 $ 1,984,907
The goodwill recorded in connection with the acquisition of MLOA, which includes intangible assets that do not qualify
for separate recognition, is not deductible for tax purposes.
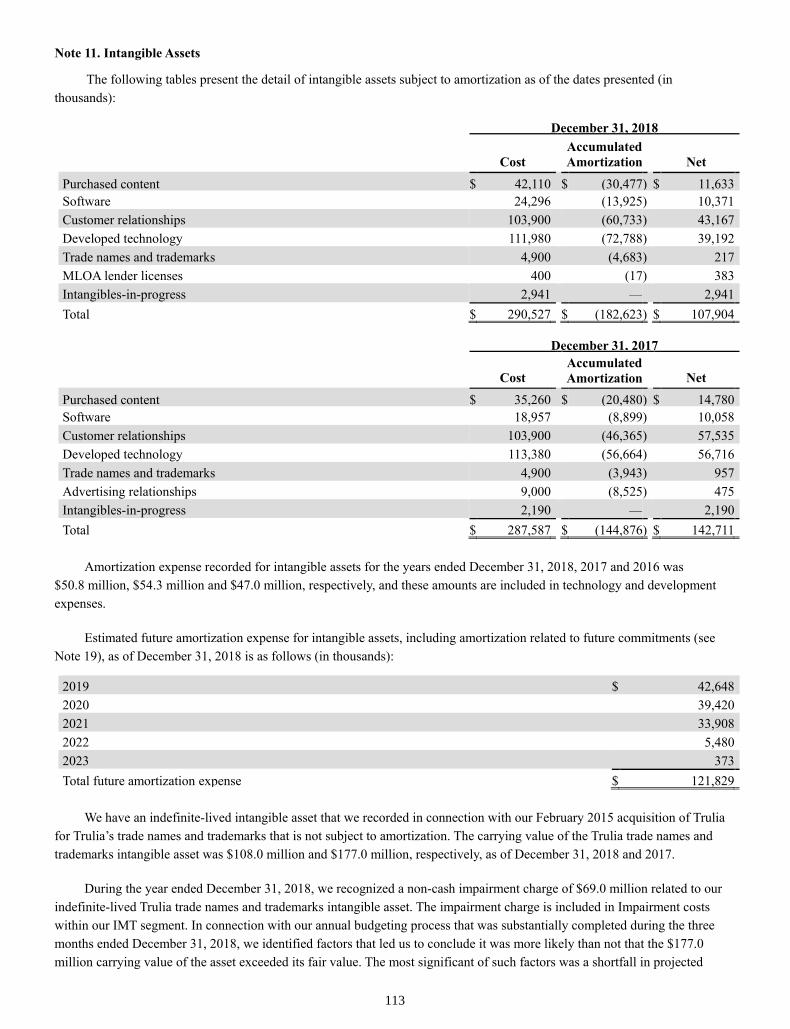
113
Note 11. Intangible Assets
The following tables present the detail of intangible assets subject to amortization as of the dates presented (in
thousands):
December 31, 2018
Cost
Accumulated
Amortization Net
Purchased content $ 42,110 $ (30,477 ) $ 11,633
Software 24,296 (13,925 ) 10,371
Customer relationships 103,900 (60,733 ) 43,167
Developed technology 111,980 (72,788 ) 39,192
Trade names and trademarks 4,900 (4,683 ) 217
MLOA lender licenses 400 (17 ) 383
Intangibles-in-progress 2,941 — 2,941
Total $ 290,527 $ (182,623 ) $ 107,904
December 31, 2017
Cost Accumulated
Amortization Net
Purchased content $ 35,260 $ (20,480 ) $ 14,780
Software 18,957 (8,899 ) 10,058
Customer relationships 103,900 (46,365 ) 57,535
Developed technology 113,380 (56,664 ) 56,716
Trade names and trademarks 4,900 (3,943 ) 957
Advertising relationships 9,000 (8,525 ) 475
Intangibles-in-progress 2,190 — 2,190
Total $ 287,587 $ (144,876 ) $ 142,711
Amortization expense recorded for intangible assets for the years ended December 31, 2018, 2017 and 2016 was
$50.8 million, $54.3 million and $47.0 million, respectively, and these amounts are included in technology and development
expenses.
Estimated future amortization expense for intangible assets, including amortization related to future commitments (see
Note 19), as of December 31, 2018 is as follows (in thousands):
2019 $ 42,648
2020 39,420
2021 33,908
2022 5,480
2023 373
Total future amortization expense $ 121,829
We have an indefinite-lived intangible asset that we recorded in connection with our February 2015 acquisition of Trulia
for Trulia’s trade names and trademarks that is not subject to amortization. The carrying value of the Trulia trade names and
trademarks intangible asset was $108.0 million and $177.0 million, respectively, as of December 31, 2018 and 2017.
During the year ended December 31, 2018, we recognized a non-cash impairment charge of $69.0 million related to our
indefinite-lived Trulia trade names and trademarks intangible asset. The impairment charge is included in Impairment costs
within our IMT segment. In connection with our annual budgeting process that was substantially completed during the three
months ended December 31, 2018, we identified factors that led us to conclude it was more likely than not that the $177.0
million carrying value of the asset exceeded its fair value. The most significant of such factors was a shortfall in projected
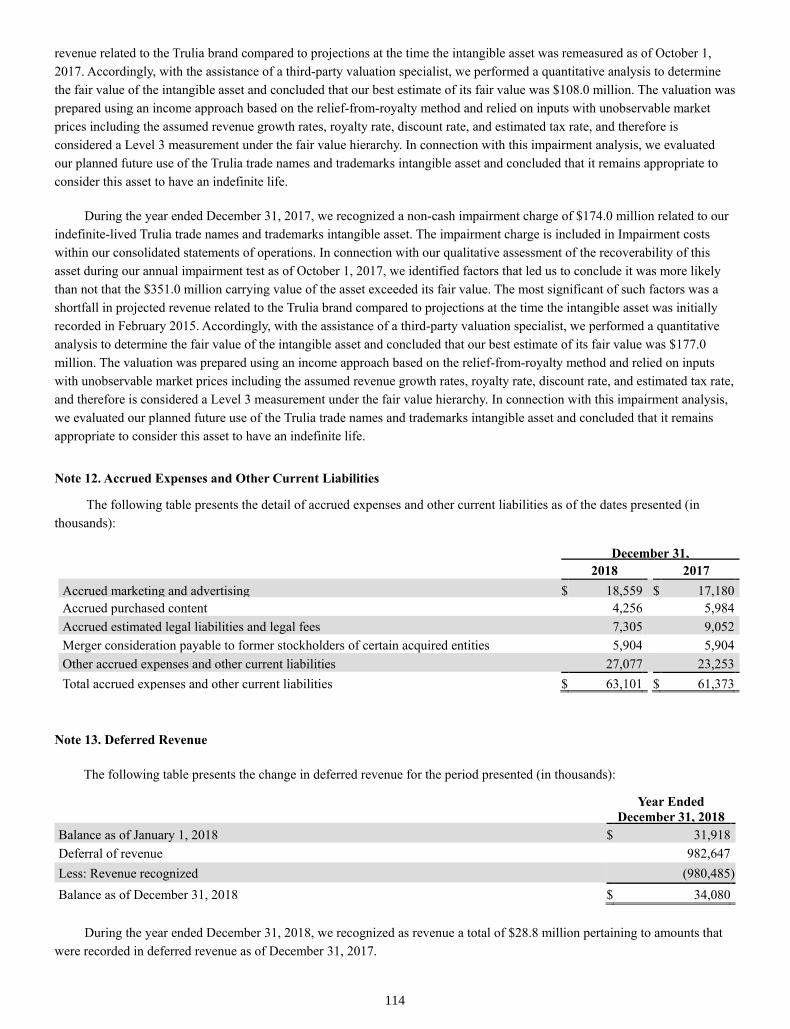
114
revenue related to the Trulia brand compared to projections at the time the intangible asset was remeasured as of October 1,
2017. Accordingly, with the assistance of a third-party valuation specialist, we performed a quantitative analysis to determine
the fair value of the intangible asset and concluded that our best estimate of its fair value was $108.0 million. The valuation was
prepared using an income approach based on the relief-from-royalty method and relied on inputs with unobservable market
prices including the assumed revenue growth rates, royalty rate, discount rate, and estimated tax rate, and therefore is
considered a Level 3 measurement under the fair value hierarchy. In connection with this impairment analysis, we evaluated
our planned future use of the Trulia trade names and trademarks intangible asset and concluded that it remains appropriate to
consider this asset to have an indefinite life.
During the year ended December 31, 2017, we recognized a non-cash impairment charge of $174.0 million related to our
indefinite-lived Trulia trade names and trademarks intangible asset. The impairment charge is included in Impairment costs
within our consolidated statements of operations. In connection with our qualitative assessment of the recoverability of this
asset during our annual impairment test as of October 1, 2017, we identified factors that led us to conclude it was more likely
than not that the $351.0 million carrying value of the asset exceeded its fair value. The most significant of such factors was a
shortfall in projected revenue related to the Trulia brand compared to projections at the time the intangible asset was initially
recorded in February 2015. Accordingly, with the assistance of a third-party valuation specialist, we performed a quantitative
analysis to determine the fair value of the intangible asset and concluded that our best estimate of its fair value was $177.0
million. The valuation was prepared using an income approach based on the relief-from-royalty method and relied on inputs
with unobservable market prices including the assumed revenue growth rates, royalty rate, discount rate, and estimated tax rate,
and therefore is considered a Level 3 measurement under the fair value hierarchy. In connection with this impairment analysis,
we evaluated our planned future use of the Trulia trade names and trademarks intangible asset and concluded that it remains
appropriate to consider this asset to have an indefinite life.
Note 12. Accrued Expenses and Other Current Liabilities
The following table presents the detail of accrued expenses and other current liabilities as of the dates presented (in
thousands):
December 31,
2018 2017
Accrued marketing and advertising $ 18,559 $ 17,180
Accrued purchased content 4,256 5,984
Accrued estimated legal liabilities and legal fees 7,305 9,052
Merger consideration payable to former stockholders of certain acquired entities 5,904 5,904
Other accrued expenses and other current liabilities 27,077 23,253
Total accrued expenses and other current liabilities $ 63,101 $ 61,373
Note 13. Deferred Revenue
The following table presents the change in deferred revenue for the period presented (in thousands):
Year Ended
December 31, 2018
Balance as of January 1, 2018 $ 31,918
Deferral of revenue 982,647
Less: Revenue recognized (980,485 )
Balance as of December 31, 2018 $ 34,080
During the year ended December 31, 2018, we recognized as revenue a total of $28.8 million pertaining to amounts that
were recorded in deferred revenue as of December 31, 2017.

115
Note 14. Debt
Revolving Credit Facility
On July 31, 2018, certain wholly owned subsidiaries of Zillow Group entered into a revolving credit agreement with
Credit Suisse AG, Cayman Islands Branch, as the directing lender, and certain other parties thereto (the “Revolving Credit
Facility”). The Revolving Credit Facility initially provided for a maximum borrowing capacity of $250.0 million, and this
borrowing capacity was increased to $500.0 million effective December 31, 2018 (the “Maximum Amount”) and has a current
borrowing capacity of $126.7 million as of December 31, 2018, which amount may be increased up to the Maximum Amount
subject to the satisfaction of certain conditions, through a non-recourse credit facility secured by a pledge of the equity of
certain Zillow Group subsidiaries that purchase and sell select residential properties through Zillow Offers. In certain
circumstances Zillow Group may be obligated to fund some or all of the payment obligations under the Revolving Credit
Facility. Zillow Group formed certain special purpose entities to effectuate the transactions contemplated by the agreement
underlying the Revolving Credit Facility. Each special purpose entity is a wholly owned subsidiary of Zillow Group and a
separate legal entity, and neither the assets nor credit of any such entity are available to satisfy the debts and other obligations
of any affiliate or other entity.
The Revolving Credit Facility has an initial term of one year which may be extended for up to two additional years
subject to agreement by the directing lender. The Revolving Credit Facility includes customary representations and warranties,
covenants (including financial covenants applicable to Zillow Group), and provisions regarding events of default. As of
December 31, 2018, Zillow Group was in compliance with all financial covenants and no event of default had occurred.
Availability of funds under the Revolving Credit Facility is limited by a formula equal to the lower of 85% of the aggregate
acquisition cost of financed residential properties or 85% of the aggregate market value, which for each residential property is
the sum of the value established by an independent broker-pricing opinion and renovation costs paid.
Pursuant to the terms of the Revolving Credit Facility, we are required to establish, maintain, and in certain circumstances
fund, certain specified reserve accounts. These reserve accounts include, but are not limited to, interest reserves, insurance, tax
reserves, renovation cost reserves and special reserves. The credit facility reserve accounts and the collection account into
which funds are deposited upon the resale of financed residential properties, which funds are used to repay amounts borrowed
on the Revolving Credit Facility, are under the sole control of Credit Suisse AG, New York Branch, as defined in the agreement
governing the Revolving Credit Facility. Amounts funded to these reserve accounts and the collection account have been
classified within our consolidated balance sheets as restricted cash. Borrowings on our Revolving Credit Facility bear interest
at the one-month London Interbank Offered Rate (“LIBOR”) plus the applicable margin, as defined in the credit agreement
governing the Revolving Credit Facility. We are also required to pay a funding fee for each financed residential property and
certain other fees to certain other parties to the agreement. Interest, funding fees and other fees, including the amortization of
deferred issuance costs, are classified within interest expense in our consolidated statements of operations.
As of December 31, 2018, we have outstanding $116.7 million of borrowings on the Revolving Credit Facility. The
facility has a maximum borrowing capacity of $500.0 million with a current borrowing capacity of $126.7 million.
Approximately $383.3 million is available for future borrowings. The weighted average interest rate related to the Revolving
Credit Facility from July 31, 2018 through December 31, 2018 was 5.86%.
Warehouse Lines of Credit
As part of the acquisition of MLOA, Zillow Group acquired two warehouse lines of credit. Each line of credit provides
for a current and maximum borrowing capacity of $50.0 million, or $100.0 million in total. The lines of credit mature on July
15, 2019 and March 31, 2019 and include customary representations and warranties, covenants and provisions regarding events
of default. As of December 31, 2018, Zillow Group was in compliance with all financial covenants and no event of default had
occurred. Availability under the lines of credit is limited depending on the types of loans originated. Borrowings on the lines of
credit bear interest at either the one-month LIBOR or the daily adjusting LIBOR, plus an applicable margin, as defined in the
credit agreements governing the warehouse lines of credit. The weighted average interest rates on each of the lines of credit
from the acquisition of MLOA through December 31, 2018 were 4.88% and 4.73%.
116
Convertible Senior Notes due in 2023
On July 3, 2018, Zillow Group issued $373.8 million aggregate principal amount of Convertible Senior Notes due 2023
(the “2023 Notes”), which includes $48.8 million principal amount of 2023 Notes sold pursuant to the underwriters’ option to
purchase additional 2023 Notes. The 2023 Notes bear interest at a fixed rate of 1.50% per year, payable semi-annually in
arrears on January 1 and July 1 of each year, beginning on January 1, 2019. The 2023 Notes are convertible into cash, shares of
Class C capital stock or a combination thereof, at our election. The 2023 Notes will mature on July 1, 2023, unless earlier
repurchased, redeemed, or converted in accordance with their terms.
The net proceeds from the issuance of the 2023 Notes were approximately $364.0 million, after deducting underwriting
discounts and commissions and offering expenses payable by the Company. We used approximately $29.4 million of the net
proceeds from the issuance of the 2023 Notes to pay the cost of the Capped Call Confirmations described below. The Company
intends to use the remainder of the net proceeds for general corporate purposes.
Prior to the close of business on the business day immediately preceding April 1, 2023, the 2023 Notes are convertible at
the option of the holders only under certain conditions. On or after April 1, 2023, until the close of business on the second
scheduled trading day immediately preceding the maturity date, holders may convert their 2023 Notes at their option at the
conversion rate then in effect, irrespective of these conditions. The Company may settle conversions of the 2023 Notes by
paying or delivering, as the case may be, cash, shares of the Company’s Class C capital stock, or a combination of cash and
shares of Class C capital stock, at its election. The conversion rate will initially be 12.7592 shares of Class C capital stock per
$1,000 principal amount of 2023 Notes (equivalent to an initial conversion price of approximately $78.37 per share of Class C
capital stock). The conversion rate is subject to customary adjustments upon the occurrence of certain events. The Company
may redeem for cash all or part of the 2023 Notes, at its option, on or after July 6, 2021, under certain circumstances at a
redemption price equal to 100% of the principal amount of the 2023 Notes to be redeemed, plus accrued and unpaid interest to,
but excluding, the redemption date (as defined in the indenture governing the 2023 Notes). The conversion option does not
meet the criteria for separate accounting as a derivative as it is indexed to our own stock.
If the Company undergoes a fundamental change (as defined in the indenture governing the 2023 Notes), holders may
require the Company to repurchase for cash all or part of their 2023 Notes at a repurchase price equal to 100% of the principal
amount of the 2023 Notes to be repurchased, plus accrued and unpaid interest to, but excluding, the fundamental change
repurchase date (as defined in the indenture governing the 2023 Notes). In addition, if certain fundamental changes occur, the
Company may be required in certain circumstances to increase the conversion rate for any Notes converted in connection with
such fundamental changes by a specified number of shares of its Class C capital stock. Certain events are also considered
“Events of Default,” which may result in the acceleration of the maturity of the 2023 Notes, as described in the indenture
governing the 2023 Notes. There are no financial covenants associated with the 2023 Notes.
We may not redeem the 2023 Notes prior to July 6, 2021. We may redeem for cash all or any portion of the 2023 Notes, at
our option, in whole or in part on or after July 6, 2021 if the last reported sale price per share of our Class C capital stock has
been at least 130% of the conversion price then in effect for at least 20 trading days (whether or not consecutive) during any 30
consecutive trading day period.
In accounting for the issuance of the 2023 Notes, the Company separated the 2023 Notes into liability and equity
components. The carrying amount of the liability component was calculated by measuring the fair value of a similar liability
that does not have an associated convertible feature. The carrying amount of the equity component, representing the conversion
option, was determined by deducting the fair value of the liability component from the par value of the 2023 Notes. The
difference between the principal amount of the 2023 Notes and the liability component represents the debt discount, which is
recorded as a direct deduction from the related debt liability in the consolidated balance sheet and amortized to interest expense
using the effective interest method over the term of the 2023 Notes. The equity component of the 2023 Notes of approximately
$78.6 million is included in additional paid-in capital in the consolidated balance sheet and is not remeasured as long as it
continues to meet the conditions for equity classification.
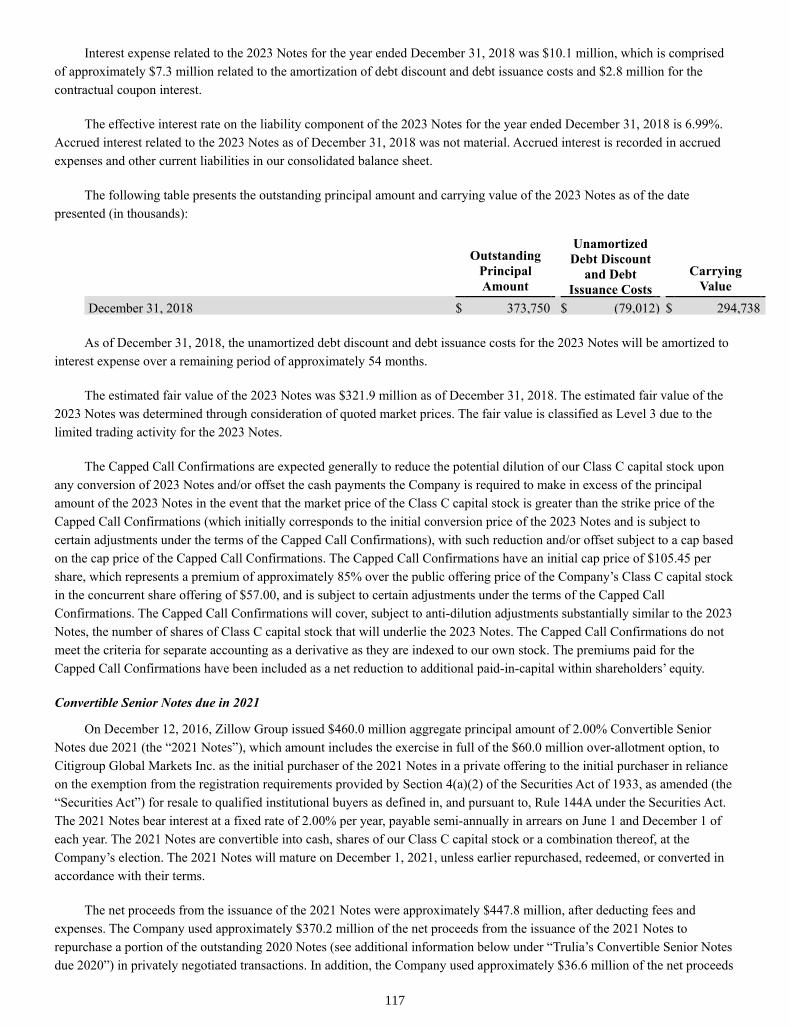
117
Interest expense related to the 2023 Notes for the year ended December 31, 2018 was $10.1 million, which is comprised
of approximately $7.3 million related to the amortization of debt discount and debt issuance costs and $2.8 million for the
contractual coupon interest.
The effective interest rate on the liability component of the 2023 Notes for the year ended December 31, 2018 is 6.99%.
Accrued interest related to the 2023 Notes as of December 31, 2018 was not material. Accrued interest is recorded in accrued
expenses and other current liabilities in our consolidated balance sheet.
The following table presents the outstanding principal amount and carrying value of the 2023 Notes as of the date
presented (in thousands):
Outstanding
Principal
Amount
Unamortized
Debt Discount
and Debt
Issuance Costs
Carrying
Value
December 31, 2018 $ 373,750 $ (79,012 ) $ 294,738
As of December 31, 2018, the unamortized debt discount and debt issuance costs for the 2023 Notes will be amortized to
interest expense over a remaining period of approximately 54 months.
The estimated fair value of the 2023 Notes was $321.9 million as of December 31, 2018. The estimated fair value of the
2023 Notes was determined through consideration of quoted market prices. The fair value is classified as Level 3 due to the
limited trading activity for the 2023 Notes.
The Capped Call Confirmations are expected generally to reduce the potential dilution of our Class C capital stock upon
any conversion of 2023 Notes and/or offset the cash payments the Company is required to make in excess of the principal
amount of the 2023 Notes in the event that the market price of the Class C capital stock is greater than the strike price of the
Capped Call Confirmations (which initially corresponds to the initial conversion price of the 2023 Notes and is subject to
certain adjustments under the terms of the Capped Call Confirmations), with such reduction and/or offset subject to a cap based
on the cap price of the Capped Call Confirmations. The Capped Call Confirmations have an initial cap price of $105.45 per
share, which represents a premium of approximately 85% over the public offering price of the Company’s Class C capital stock
in the concurrent share offering of $57.00, and is subject to certain adjustments under the terms of the Capped Call
Confirmations. The Capped Call Confirmations will cover, subject to anti-dilution adjustments substantially similar to the 2023
Notes, the number of shares of Class C capital stock that will underlie the 2023 Notes. The Capped Call Confirmations do not
meet the criteria for separate accounting as a derivative as they are indexed to our own stock. The premiums paid for the
Capped Call Confirmations have been included as a net reduction to additional paid-in-capital within shareholders’ equity.
Convertible Senior Notes due in 2021
On December 12, 2016, Zillow Group issued $460.0 million aggregate principal amount of 2.00% Convertible Senior
Notes due 2021 (the “2021 Notes”), which amount includes the exercise in full of the $60.0 million over-allotment option, to
Citigroup Global Markets Inc. as the initial purchaser of the 2021 Notes in a private offering to the initial purchaser in reliance
on the exemption from the registration requirements provided by Section 4(a)(2) of the Securities Act of 1933, as amended (the
“Securities Act”) for resale to qualified institutional buyers as defined in, and pursuant to, Rule 144A under the Securities Act.
The 2021 Notes bear interest at a fixed rate of 2.00% per year, payable semi-annually in arrears on June 1 and December 1 of
each year. The 2021 Notes are convertible into cash, shares of our Class C capital stock or a combination thereof, at the
Company’s election. The 2021 Notes will mature on December 1, 2021, unless earlier repurchased, redeemed, or converted in
accordance with their terms.
The net proceeds from the issuance of the 2021 Notes were approximately $447.8 million, after deducting fees and
expenses. The Company used approximately $370.2 million of the net proceeds from the issuance of the 2021 Notes to
repurchase a portion of the outstanding 2020 Notes (see additional information below under “Trulia’s Convertible Senior Notes
due 2020”) in privately negotiated transactions. In addition, the Company used approximately $36.6 million of the net proceeds
118
from the issuance of the 2021 Notes to pay the cost of the capped call transactions with the initial purchaser of the 2021 Notes
and two additional financial institutions (“Capped Call Confirmations”) as discussed further below. The Company used the
remainder of the net proceeds for general corporate purposes.
Prior to the close of business on the business day immediately preceding September 1, 2021, the 2021 Notes are
convertible at the option of the holders of the 2021 Notes only under certain conditions, none of which conditions have been
satisfied as of December 31, 2018. On or after September 1, 2021, until the close of business on the second scheduled trading
day immediately preceding the maturity date, holders of the 2021 Notes may convert their 2021 Notes at their option at the
conversion rate then in effect, irrespective of these conditions. The Company may settle conversions of the 2021 Notes by
paying or delivering, as the case may be, cash, shares of Class C capital stock, or a combination of cash and shares of Class C
capital stock, at its election. The conversion rate will initially be 19.0985 shares of Class C capital stock per $1,000 principal
amount of 2021 Notes (equivalent to an initial conversion price of approximately $52.36 per share of Class C capital stock).
The conversion rate is subject to customary adjustments upon the occurrence of certain events. The Company may redeem for
cash all or part of the 2021 Notes, at its option, on or after December 6, 2019, under certain circumstances at a redemption price
equal to 100% of the principal amount of the 2021 Notes to be redeemed, plus accrued and unpaid interest to, but excluding,
the redemption date (as defined in the indenture governing the 2021 Notes). The conversion option does not meet the criteria
for separate accounting as a derivative as it is indexed to our own stock.
If the Company undergoes a fundamental change (as defined in the indenture governing the 2021 Notes), holders of the
2021 Notes may require the Company to repurchase for cash all or part of their 2021 Notes at a repurchase price equal to 100%
of the principal amount of the 2021 Notes to be repurchased, plus accrued and unpaid interest to, but excluding, the
fundamental change repurchase date (as defined in the indenture governing the 2021 Notes). In addition, if certain fundamental
changes occur, the Company may be required in certain circumstances to increase the conversion rate for any 2021 Notes
converted in connection with such fundamental changes by a specified number of shares of its Class C capital stock. Certain
events are also considered “Events of Default,” which may result in the acceleration of the maturity of the 2021 Notes, as
described in the indenture governing the notes. There are no financial covenants associated with the 2021 Notes.
We may not redeem the 2021 Notes prior to December 6, 2019. We may redeem the 2021 Notes for cash, at our option, in
whole or in part on or after December 6, 2019, if the last reported sale price per share of our Class C capital stock has been at
least 130% of the conversion price then in effect for at least 20 trading days (whether or not consecutive) during any 30
consecutive trading day period.
In accounting for the issuance of the 2021 Notes, the Company separated the 2021 Notes into liability and equity
components. The carrying amount of the liability component was calculated by measuring the fair value of a similar liability
that does not have an associated conversion feature. The carrying amount of the equity component, representing the conversion
option, was determined by deducting the fair value of the liability component from the par value of the 2021 Notes. The
difference between the principal amount of the 2021 Notes and the liability component represents the debt discount, which is
recorded as a direct deduction from the related debt liability in the consolidated balance sheet and amortized to interest expense
using the effective interest method over the term of the 2021 Notes. The equity component of the 2021 Notes of approximately
$91.4 million is included in additional paid-in capital in the consolidated balance sheet and is not remeasured as long as it
continues to meet the conditions for equity classification.
The Company incurred transaction costs of approximately $12.2 million related to the issuance of the 2021 Notes,
including approximately $11.5 million in fees to the initial purchaser, which amount was paid out of the gross proceeds from
the note offering. In accounting for the transaction costs, the Company allocated the total amount incurred to the liability and
equity components using the same proportions as the proceeds from the 2021 Notes. Transaction costs attributable to the
liability component were recorded as a direct deduction from the related debt liability in the consolidated balance sheet and
amortized to interest expense over the term of the 2021 Notes, and transaction costs attributable to the equity component were
netted with the equity component in shareholders’ equity.
Interest expense related to the 2021 Notes for the year ended December 31, 2018 was $28.6 million, which is comprised
of approximately $19.4 million related to the amortization of debt discount and debt issuance costs and $9.2 million for the
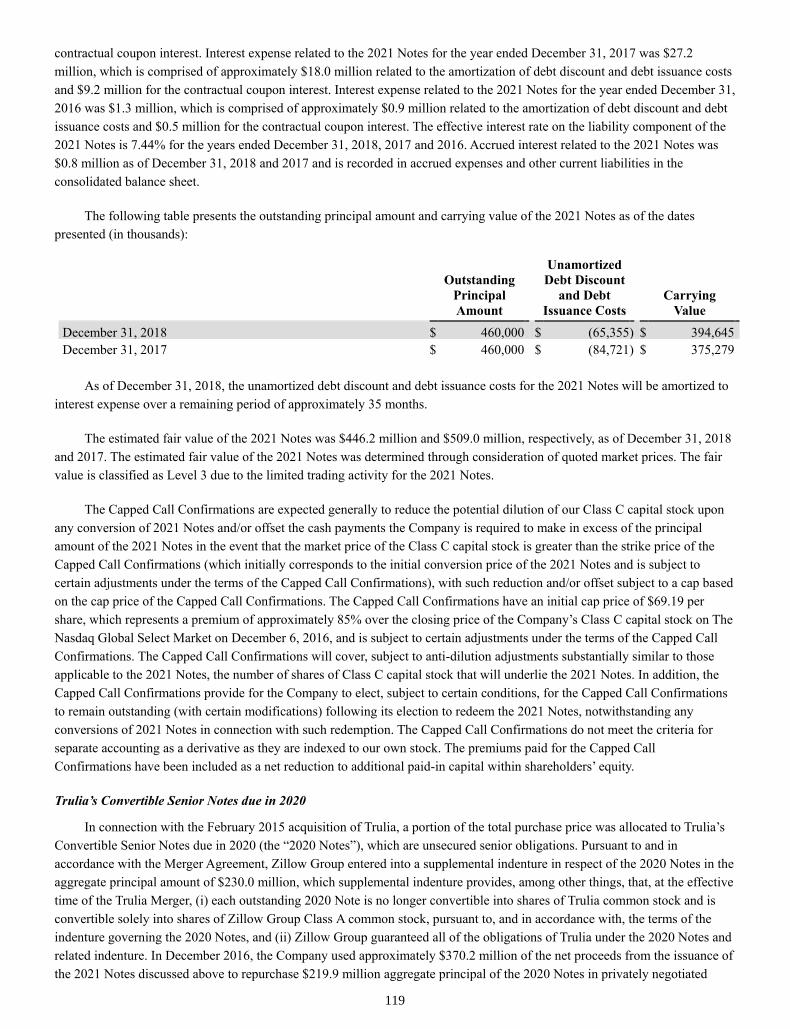
119
contractual coupon interest. Interest expense related to the 2021 Notes for the year ended December 31, 2017 was $27.2
million, which is comprised of approximately $18.0 million related to the amortization of debt discount and debt issuance costs
and $9.2 million for the contractual coupon interest. Interest expense related to the 2021 Notes for the year ended December 31,
2016 was $1.3 million, which is comprised of approximately $0.9 million related to the amortization of debt discount and debt
issuance costs and $0.5 million for the contractual coupon interest. The effective interest rate on the liability component of the
2021 Notes is 7.44% for the years ended December 31, 2018, 2017 and 2016. Accrued interest related to the 2021 Notes was
$0.8 million as of December 31, 2018 and 2017 and is recorded in accrued expenses and other current liabilities in the
consolidated balance sheet.
The following table presents the outstanding principal amount and carrying value of the 2021 Notes as of the dates
presented (in thousands):
Outstanding
Principal
Amount
Unamortized
Debt Discount
and Debt
Issuance Costs
Carrying
Value
December 31, 2018 $ 460,000 $ (65,355 ) $ 394,645
December 31, 2017 $ 460,000 $ (84,721 ) $ 375,279
As of December 31, 2018, the unamortized debt discount and debt issuance costs for the 2021 Notes will be amortized to
interest expense over a remaining period of approximately 35 months.
The estimated fair value of the 2021 Notes was $446.2 million and $509.0 million, respectively, as of December 31, 2018
and 2017. The estimated fair value of the 2021 Notes was determined through consideration of quoted market prices. The fair
value is classified as Level 3 due to the limited trading activity for the 2021 Notes.
The Capped Call Confirmations are expected generally to reduce the potential dilution of our Class C capital stock upon
any conversion of 2021 Notes and/or offset the cash payments the Company is required to make in excess of the principal
amount of the 2021 Notes in the event that the market price of the Class C capital stock is greater than the strike price of the
Capped Call Confirmations (which initially corresponds to the initial conversion price of the 2021 Notes and is subject to
certain adjustments under the terms of the Capped Call Confirmations), with such reduction and/or offset subject to a cap based
on the cap price of the Capped Call Confirmations. The Capped Call Confirmations have an initial cap price of $69.19 per
share, which represents a premium of approximately 85% over the closing price of the Company’s Class C capital stock on The
Nasdaq Global Select Market on December 6, 2016, and is subject to certain adjustments under the terms of the Capped Call
Confirmations. The Capped Call Confirmations will cover, subject to anti-dilution adjustments substantially similar to those
applicable to the 2021 Notes, the number of shares of Class C capital stock that will underlie the 2021 Notes. In addition, the
Capped Call Confirmations provide for the Company to elect, subject to certain conditions, for the Capped Call Confirmations
to remain outstanding (with certain modifications) following its election to redeem the 2021 Notes, notwithstanding any
conversions of 2021 Notes in connection with such redemption. The Capped Call Confirmations do not meet the criteria for
separate accounting as a derivative as they are indexed to our own stock. The premiums paid for the Capped Call
Confirmations have been included as a net reduction to additional paid-in capital within shareholders’ equity.
Trulia’s Convertible Senior Notes due in 2020
In connection with the February 2015 acquisition of Trulia, a portion of the total purchase price was allocated to Trulia’s
Convertible Senior Notes due in 2020 (the “2020 Notes”), which are unsecured senior obligations. Pursuant to and in
accordance with the Merger Agreement, Zillow Group entered into a supplemental indenture in respect of the 2020 Notes in the
aggregate principal amount of $230.0 million, which supplemental indenture provides, among other things, that, at the effective
time of the Trulia Merger, (i) each outstanding 2020 Note is no longer convertible into shares of Trulia common stock and is
convertible solely into shares of Zillow Group Class A common stock, pursuant to, and in accordance with, the terms of the
indenture governing the 2020 Notes, and (ii) Zillow Group guaranteed all of the obligations of Trulia under the 2020 Notes and
related indenture. In December 2016, the Company used approximately $370.2 million of the net proceeds from the issuance of
the 2021 Notes discussed above to repurchase $219.9 million aggregate principal of the 2020 Notes in privately negotiated

120
transactions. The aggregate principal amount of the 2020 Notes is due on December 15, 2020 if not earlier converted or
redeemed. Interest is payable on the 2020 Notes at the rate of 2.75% semi-annually on June 15 and December 15 of each year.
Holders of the 2020 Notes may convert all or any portion of their notes, in multiples of $1,000 principal amount, at their
option at any time prior to the close of business on the business day immediately preceding the maturity date. Regarding the
supplemental indenture in respect of the 2020 Notes, the conversion ratio immediately prior to the effective time of the Trulia
Merger of 27.8303 shares of Trulia common stock per $1,000 principal amount of notes was adjusted to 12.3567 shares of our
Class A common stock per $1,000 principal amount of notes based on the exchange ratio of 0.444 per the Merger Agreement.
This was equivalent to an initial conversion price of approximately $80.93 per share of our Class A common stock. Regarding
the August 2015 distribution of shares of our Class C capital stock as a dividend to our Class A and Class B common
shareholders, the conversion ratio has been further adjusted to 41.4550 shares of Class A common stock per $1,000 principal
amount of notes, which is equivalent to a conversion price of approximately $24.12 per share of our Class A common stock.
The conversion ratio will be adjusted for certain dilutive events and will be increased in the case of corporate events that
constitute a “Make-Whole Fundamental Change” (as defined in the indenture governing the notes). The conversion option of
the 2020 Notes has no cash settlement provisions. The conversion option does not meet the criteria for separate accounting as a
derivative as it is indexed to our own stock.
The holders of the 2020 Notes will have the ability to require us to repurchase the notes in whole or in part upon the
occurrence of an event that constitutes a “Fundamental Change” (as defined in the indenture governing the notes, including
such events as a “change in control” or “termination of trading”, subject to certain exceptions). In such case, the repurchase
price would be 100% of the principal amount of the 2020 Notes plus accrued and unpaid interest, if any, to, but excluding, the
Fundamental Change repurchase date. Certain events are also considered “Events of Default,” which may result in the
acceleration of the maturity of the 2020 Notes, as described in the indenture governing the notes. There are no financial
covenants associated with the 2020 Notes.
The 2020 Notes are redeemable, at our option, in whole or in part as of December 20, 2018, if the last reported sale price
per share of our Class A common stock has been at least 130% of the conversion price then in effect for at least 20 trading days
(whether or not consecutive) during any 30 consecutive trading day period.
Interest expense related to the 2020 Notes for the years ended December 31, 2018 and 2017 was $0.3 million, and for the
year ended December 31, 2016 was $6.1 million. Accrued interest related to the 2020 Notes as of December 31, 2018 and 2017
was not material. Accrued interest is recorded in accrued expenses and other current liabilities in our consolidated balance
sheet.
The carrying value of the 2020 Notes was $9.6 million and $10.1 million, respectively, as of December 31, 2018 and
2017. The estimated fair value of the 2020 Notes was $16.7 million and $17.6 million, respectively, as of December 31, 2018
and 2017. The estimated fair value of the 2020 Notes was determined through consideration of quoted market prices. The fair
value is classified as Level 3 due to the limited trading activity for the 2020 Notes.
Note 15. Income Taxes
We are subject to federal and state income taxes in the United States and in Canada. For the years ended December 31,
2018, 2017 and 2016, we did not have a material amount of current taxable income.
We recorded an income tax benefit of $31.1 million for the year ended December 31, 2018. Approximately $15.4 million
of the income tax benefit relates to a $69.0 million non-cash impairment we recorded during the year ended December 31, 2018
related to the indefinite-lived Trulia trade names and trademarks intangible asset. The remaining portion of our income tax
benefit is primarily the result of net operating losses generated after December 31, 2017 with an indefinite carryforward period
due to the Tax Act. Current year net operating losses can now offset against the indefinite-lived deferred tax liabilities which
resulted in a release of the valuation allowance and a resulting income tax benefit.

121
During the year ended December 31, 2018, we completed our accounting for the income tax effects related to the
deduction limitations on compensation under the Tax Act. The Internal Revenue Service provided further guidance in applying
the written binding contracts requirement under the Tax Act, and we believe certain of our executive compensation previously
eligible to be deductible for tax purposes under Section 162(m) of the Internal Revenue Code will be considered grandfathered
and, therefore, will continue to be deductible. Based on the clarification of these rules, the accounting related to the Section
162(m) limitation of the Internal Revenue Code is considered complete and as a result we recorded a $5.9 million tax benefit
for the year ended December 31, 2018.
We recorded an income tax benefit of $89.6 million for the year ended December 31, 2017. Approximately $66.0 million
of the income tax benefit relates to a $174.0 million non-cash impairment we recorded during the year ended December 31,
2017 related to the $351.0 million indefinite-lived intangible asset that we recorded in connection with our February 2015
acquisition of Trulia for Trulia’s trade names and trademarks. For additional information about the non-cash impairment, see
Note 11 to our consolidated financial statements. The remaining $23.6 million of the income tax benefit primarily relates to our
initial analysis of the impact of the rate decrease included in the Tax Act for the impact of the reduction in our net deferred tax
liability related to our indefinite-lived intangible asset.
The following table summarizes the components of our income tax (benefit) expense for the periods presented (in
thousands):
Year Ended December 31,
2018 2017 2016
Current income tax expense
Foreign $ 161 $ — $ —
Total current income tax expense 161 — —
Deferred income tax (benefit) expense
Federal (28,502 ) (84,238 ) (1,248 )
State (2,441 ) (5,348 ) 1,378
Foreign (320 ) — —
Total deferred income tax (benefit) expense (31,263 ) (89,586 ) 130
Total income tax (benefit) expense $ (31,102 ) $ (89,586 ) $ 130
The following table presents a reconciliation of the federal statutory rate and our effective tax rate for the periods
presented:
Year Ended December 31,
2018 2017 2016
Tax expense at federal statutory rate (21.0 )% (35.0 )% (35.0 )%
State income taxes, net of federal tax benefit (5.9 ) (4.4 ) (1.9 )
Nondeductible expenses — 0.8 4.9
Share-based compensation (16.5 ) (20.6 ) (0.2 )
IRC section 162(m) 1.0 — —
Research and development credits (8.4 ) (6.3 ) (1.5 )
Meals and entertainment 1.8 — —
Return to provision adjustments (4.2 ) — —
Enactment of Tax Act (1.9 ) (13.1 ) —
Other 0.4 2.2 (0.9 )
Valuation allowance 34.0 27.7 34.7
Effective tax rate (20.7 )% (48.7 )% 0.1 %
Deferred federal, state and foreign income taxes reflect the net tax impact of temporary differences between the carrying
amounts of assets and liabilities for financial reporting purposes and such amounts for tax purposes. The following table
presents the significant components of our deferred tax assets and liabilities as of the dates presented (in thousands):

122
December 31,
2018 2017
Deferred tax assets:
Federal and state net operating loss carryforwards $ 259,629 $ 234,316
Share-based compensation 55,280 47,655
Start-up and organizational costs 99 146
Research and development credits 48,805 35,793
Other tax credits 910 910
Accruals and reserves 3,000 2,729
Deferred rent 4,842 5,484
Other deferred tax assets 14,267 8,342
Total deferred tax assets 386,832 335,375
Deferred tax liabilities:
Website and software development costs (14,685 ) (13,202 )
Goodwill (598 ) (688 )
Intangible assets (45,035 ) (69,241 )
Discount on 2021 Notes and 2023 Notes not deductible for tax (31,450 ) (19,374 )
Depreciation and amortization (888 ) (2,425 )
Total deferred tax liabilities (92,656 ) (104,930 )
Net deferred tax assets before valuation allowance 294,176 230,445
Less: valuation allowance (307,599 ) (274,810 )
Net deferred tax liabilities $ (13,423 ) $ (44,365 )
Realization of deferred tax assets is dependent upon the generation of future taxable income, if any, the timing and
amount of which are uncertain. We have provided a full valuation allowance against the net deferred tax assets as of
December 31, 2018 and 2017 because, based on the weight of available evidence, it is more likely than not (a likelihood of
more than 50%) that some or all of the deferred tax assets will not be realized. The valuation allowance increased by
$32.8 million and $57.5 million, respectively, during the years ended December 31, 2018 and 2017.
We have accumulated federal tax losses of approximately $1,081.7 million and $1,014.0 million, respectively, as of
December 31, 2018 and 2017, which are available to reduce future taxable income. We have accumulated state tax losses of
approximately $32.5 million and $21.4 million (tax effected), respectively, as of December 31, 2018 and 2017. Additionally, we
have net research and development credit carryforwards of $48.8 million and $35.8 million, respectively, as of December 31,
2018 and 2017, which are available to reduce future tax liabilities. The tax loss and research and development credit
carryforwards begin to expire in 2025. Under Sections 382 and 383 of the Internal Revenue Code, if a corporation undergoes an
ownership change, the corporation’s ability to use its pre-change net operating loss carryforwards and other pre-change tax
attributes, such as research tax credits, to offset its post-change income or income tax liability may be limited. In connection
with our August 2013 public offering of our Class A Common stock, we experienced an ownership change that triggered
Sections 382 and 383, which may limit our ability to utilize net operating loss and tax credit carryforwards. In connection with
our February 2015 acquisition of Trulia, Trulia experienced an ownership change that triggered Section 382 and 383, which
may limit Zillow Group’s ability to utilize Trulia’s net operating loss and tax credit carryforwards.
We are currently not under audit in any tax jurisdiction. Tax years from 2015 through 2018 are currently open for audit by
federal and state taxing authorities.
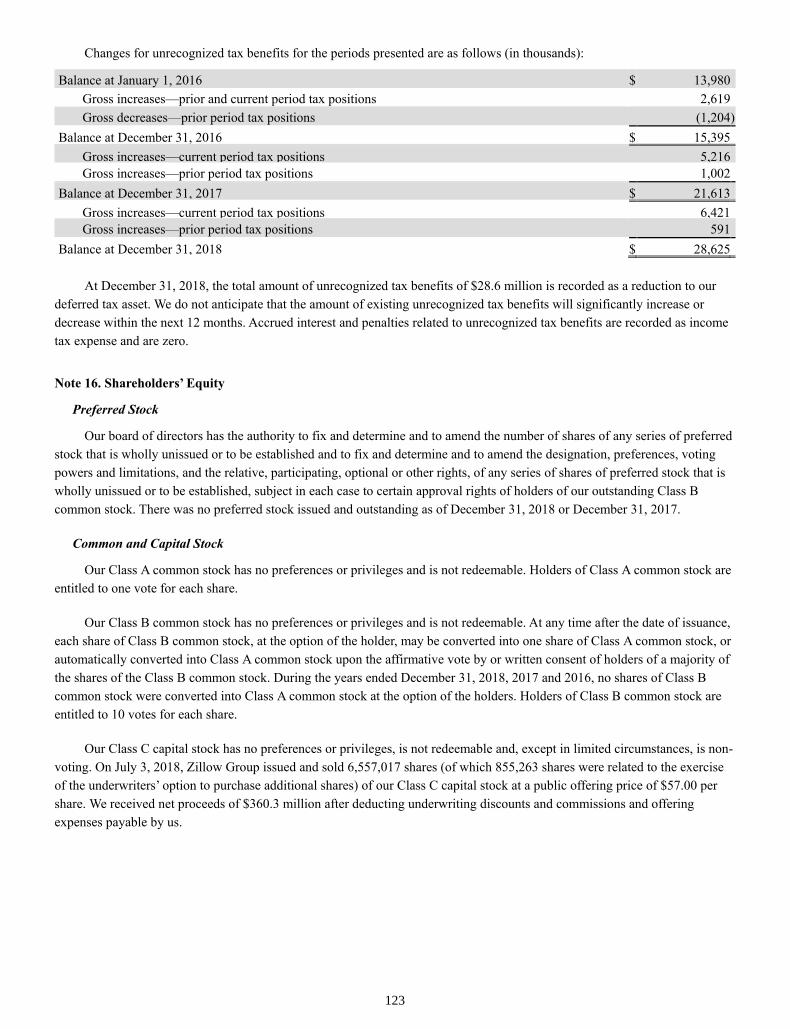
123
Changes for unrecognized tax benefits for the periods presented are as follows (in thousands):
Balance at January 1, 2016 $ 13,980
Gross increases—prior and current period tax positions 2,619
Gross decreases—prior period tax positions (1,204 )
Balance at December 31, 2016 $ 15,395
Gross increases—current period tax positions 5,216
Gross increases—prior period tax positions 1,002
Balance at December 31, 2017 $ 21,613
Gross increases—current period tax positions 6,421
Gross increases—prior period tax positions 591
Balance at December 31, 2018 $ 28,625
At December 31, 2018, the total amount of unrecognized tax benefits of $28.6 million is recorded as a reduction to our
deferred tax asset. We do not anticipate that the amount of existing unrecognized tax benefits will significantly increase or
decrease within the next 12 months. Accrued interest and penalties related to unrecognized tax benefits are recorded as income
tax expense and are zero.
Note 16. Shareholders’ Equity
Preferred Stock
Our board of directors has the authority to fix and determine and to amend the number of shares of any series of preferred
stock that is wholly unissued or to be established and to fix and determine and to amend the designation, preferences, voting
powers and limitations, and the relative, participating, optional or other rights, of any series of shares of preferred stock that is
wholly unissued or to be established, subject in each case to certain approval rights of holders of our outstanding Class B
common stock. There was no preferred stock issued and outstanding as of December 31, 2018 or December 31, 2017.
Common and Capital Stock
Our Class A common stock has no preferences or privileges and is not redeemable. Holders of Class A common stock are
entitled to one vote for each share.
Our Class B common stock has no preferences or privileges and is not redeemable. At any time after the date of issuance,
each share of Class B common stock, at the option of the holder, may be converted into one share of Class A common stock, or
automatically converted into Class A common stock upon the affirmative vote by or written consent of holders of a majority of
the shares of the Class B common stock. During the years ended December 31, 2018, 2017 and 2016, no shares of Class B
common stock were converted into Class A common stock at the option of the holders. Holders of Class B common stock are
entitled to 10 votes for each share.
Our Class C capital stock has no preferences or privileges, is not redeemable and, except in limited circumstances, is non-
voting. On July 3, 2018, Zillow Group issued and sold 6,557,017 shares (of which 855,263 shares were related to the exercise
of the underwriters’ option to purchase additional shares) of our Class C capital stock at a public offering price of $57.00 per
share. We received net proceeds of $360.3 million after deducting underwriting discounts and commissions and offering
expenses payable by us.

124
The following shares of common and capital stock have been reserved for future issuance as of the dates presented:
December 31,
2018 December 31,
2017
Option awards outstanding 27,310,110 26,645,206
Restricted stock units outstanding 5,266,324 4,016,405
Class A common stock and Class C capital stock available for grant under 2011 Plan 3,675,082 5,076,898
Shares issuable upon conversion of outstanding Class B common stock 6,217,447 6,217,447
Total 42,468,963 41,955,956
Note 17. Share-Based Awards
In connection with our February 2015 acquisition of Trulia, we assumed the obligations of Zillow and Trulia outstanding
under pre-existing stock plans. We intend that future equity grants will be made under Zillow Group’s 2011 Amended and
Restated Incentive Plan (as amended and/or restated from time to time, the “2011 Plan”) only (or a successor thereto).
Zillow Group, Inc. Amended and Restated 2011 Incentive Plan
On July 19, 2011, the 2011 Plan became effective. In addition to the share reserve of 18,400,000 shares, the number of
shares available for issuance under the 2011 Plan automatically increases on the first day of each of our fiscal years by a
number of shares equal to the least of (a) 3.5% of our outstanding Class A common stock, Class B common stock, and Class C
capital stock on a fully diluted basis as of the end of our immediately preceding fiscal year, (b) 10,500,000 shares, and (c) a
lesser amount determined by our board of directors; provided, however, that any shares from any increases in previous years
that are not actually issued will continue to be available for issuance under the 2011 Plan. In addition, shares previously
available for grant under Zillow, Inc.’s 2005 Equity Incentive Plan (the “2005 Plan”), but not issued or subject to outstanding
awards under the 2005 Plan as of July 19, 2011, and shares subject to outstanding awards under the 2005 Plan that
subsequently cease to be subject to such awards (other than by reason of exercise of the awards) are available for grant under
the 2011 Plan. The 2011 Plan is administered by the compensation committee of the board of directors. Under the terms of the
2011 Plan, the compensation committee may grant equity awards, including incentive stock options, nonqualified stock
options, restricted stock, restricted stock units or restricted units to employees, officers, directors, consultants, agents, advisers
and independent contractors. The board of directors has also authorized certain senior executive officers to grant equity awards
under the 2011 Plan, within limits prescribed by our board of directors. The 2011 Plan provides that in the event of a stock
dividend, stock split or similar event, the maximum number and kind of securities available for issuance under the plan will be
proportionally adjusted.
Options under the 2011 Plan are granted with an exercise price per share not less than 100% of the fair market value of
our stock on the date of grant, with the exception of substituted option awards granted in connection with acquisitions, and are
exercisable at such times and under such conditions as determined by the compensation committee. Any portion of an option
that is not vested and exercisable on the date of a participant’s termination of service expires on such date. Employees generally
forfeit their rights to exercise vested options 3 months following their termination of employment or 12 months following
termination by reason of death, disability or retirement. Options granted under the 2011 Plan typically expire seven or ten years
from the grant date and typically vest either 25% after 12 months and ratably thereafter over the next 36 months or quarterly
over a period of four years, though certain options have been granted with alternative vesting schedules.
Restricted stock units granted under the 2011 Plan typically vest either 25% after 12 months and quarterly thereafter over
the next three years, quarterly over a period of four years, or 12.5% after 6 months and quarterly thereafter for the next 3.5
years. Any portion of a restricted stock unit that is not vested on the date of a participant’s termination of service expires on
such date.
In March 2016, Zillow Group established an equity choice program pursuant to which Zillow Group grants restricted
stock units and option awards to acquire shares of Class C capital stock to certain employees to retain and recognize their
efforts on behalf of Zillow Group.

125
Trulia 2005 Stock Incentive Plan
Trulia granted options under its 2005 Stock Incentive Plan (as amended, “the 2005 Plan”) until September 2012 when the
2005 Plan was terminated. Stock options issued prior to the plan termination remained outstanding in accordance with their
terms. Under the terms of the 2005 Plan, Trulia had the ability to grant incentive and nonqualified stock options, stock
appreciation rights, restricted stock awards and restricted stock units. Options granted under the 2005 Plan generally vest at a
rate of 25% after 12 months and ratably thereafter over the next 36 months and expire 10 years from the grant date. Certain
options vest monthly over two to four years.
Trulia 2012 Equity Incentive Plan, as Amended and Restated
On September 19, 2012, Trulia’s 2012 Equity Incentive Plan (the “2012 Plan”) became effective. The 2012 Plan provides
for the grant of incentive and nonqualified stock options, restricted stock, restricted stock units, stock appreciation rights,
performance units and performance shares to employees, directors and consultants. Under the 2012 Plan, stock options are
granted at a price per share not less than 100% of the fair market value per share of the underlying stock at the grant date. The
plan administrator determines the vesting period for each option award on the grant date, and the options generally expire 10
years from the grant date or such shorter term as may be determined for the options. As noted above, we intend that future
equity grants will be made under the 2011 Plan only.
Option Awards
The following table summarizes option award activity for the year ended December 31, 2018:
Number
of Shares
Subject to
Existing
Options
Weighted-
Average
Exercise
Price Per
Share
Weighted-
Average
Remaining
Contractual
Life (Years)
Aggregate
Intrinsic
Value
(in
thousands)
Outstanding at January 1, 2018 26,645,206 $ 27.70 5.72 $ 355,739
Granted 6,963,320 48.95
Exercised (5,472,728 ) 21.94
Forfeited or cancelled (825,688 ) 35.32
Outstanding at December 31, 2018 27,310,110 34.04 6.23 97,941
Vested and exercisable at December 31, 2018 15,287,932 29.73 4.72 75,867
The fair value of options granted is estimated at the date of grant using the Black-Scholes-Merton option-pricing model,
assuming no dividends and with the following assumptions for the periods presented:
Year Ended December 31,
2018 2017 2016
Expected volatility 42% – 45% 45% – 49% 49% – 51%
Expected dividend yield — — —
Risk-free interest rate 2.52% – 2.84% 1.67% – 2.06% 0.89% – 1.89%
Weighted-average expected life 4.50 – 5.00 years 4.25 – 4.75 years 3.75 – 4.25 years
Weighted-average fair value of options granted $19.11 $14.51 $9.42
As of December 31, 2018, there was a total of $176.7 million in unrecognized compensation cost related to unvested
stock options, which is expected to be recognized over a weighted-average period of 2.7 years.
The total intrinsic value of options exercised during the years ended December 31, 2018, 2017 and 2016 was $161.4
million, $156.1 million and $51.7 million, respectively. The fair value of options vested for the years ended December 31,
2018, 2017 and 2016 was $87.7 million, $84.8 million and $87.9 million, respectively.

126
Restricted Stock Units
The following table summarizes activity for restricted stock units for the year ended December 31, 2018:
Restricted
Stock Units
Weighted-
Average Grant-
Date Fair
Value
Unvested outstanding at January 1, 2018 4,016,405 $ 33.22
Granted 3,725,726 48.26
Vested (1,740,134 ) 35.63
Forfeited or cancelled (735,673 ) 39.59
Unvested outstanding at December 31, 2018 5,266,324 42.19
The total fair value of vested restricted stock units was $62.0 million, $43.7 million and $46.5 million, respectively, for
the years ended December 31, 2018, 2017 and 2016.
The fair value of the outstanding restricted stock units will be recorded as share-based compensation expense over the
vesting period. As of December 31, 2018, there was $204.9 million of total unrecognized compensation cost related to
restricted stock units, which is expected to be recognized over a weighted-average period of 2.9 years.
Share-Based Compensation Expense
The following table presents the effects of share-based compensation expense in our consolidated statements of
operations during the periods presented (in thousands):
Year Ended December 31,
2018 2017 2016
Cost of revenue $ 4,127 $ 3,884 $ 3,550
Sales and marketing 22,942 22,735 23,320
Technology and development 56,673 39,938 31,466
General and administrative 65,342 47,014 48,582
$ 149,084 $ 113,571 $ 106,918
Note 18. Net Loss Per Share
Basic net loss per share is computed by dividing net loss by the weighted-average number of shares (including Class A
common stock, Class B common stock and Class C capital stock) outstanding during the period. In the calculation of basic net
loss per share, undistributed earnings are allocated assuming all earnings during the period were distributed.
Diluted net loss per share is computed by dividing net loss by the weighted-average number of shares (including Class A
common stock, Class B common stock and Class C capital stock) outstanding during the period and potentially dilutive Class A
common stock and Class C capital stock equivalents, except in cases where the effect of the Class A common stock or Class C
capital stock equivalent would be antidilutive. Potential Class A common stock and Class C capital stock equivalents consist of
Class A common stock and Class C capital stock issuable upon exercise of stock options and Class A common stock and
Class C capital stock underlying unvested restricted stock awards and unvested restricted stock units using the treasury stock
method. Potential Class A common stock equivalents also include Class A common stock issuable upon conversion of the 2020
Notes using the if-converted method.
Since the Company expects to settle the principal amount of the outstanding 2021 Notes and 2023 Notes in cash, the
Company uses the treasury stock method for calculating any potential dilutive effect of the conversion spread on diluted net
income per share, if applicable. For the 2021 Notes, the conversion spread of approximately 8.8 million shares has a dilutive
impact on diluted net income per share when the market price of the Company’s Class C capital stock at the end of a period
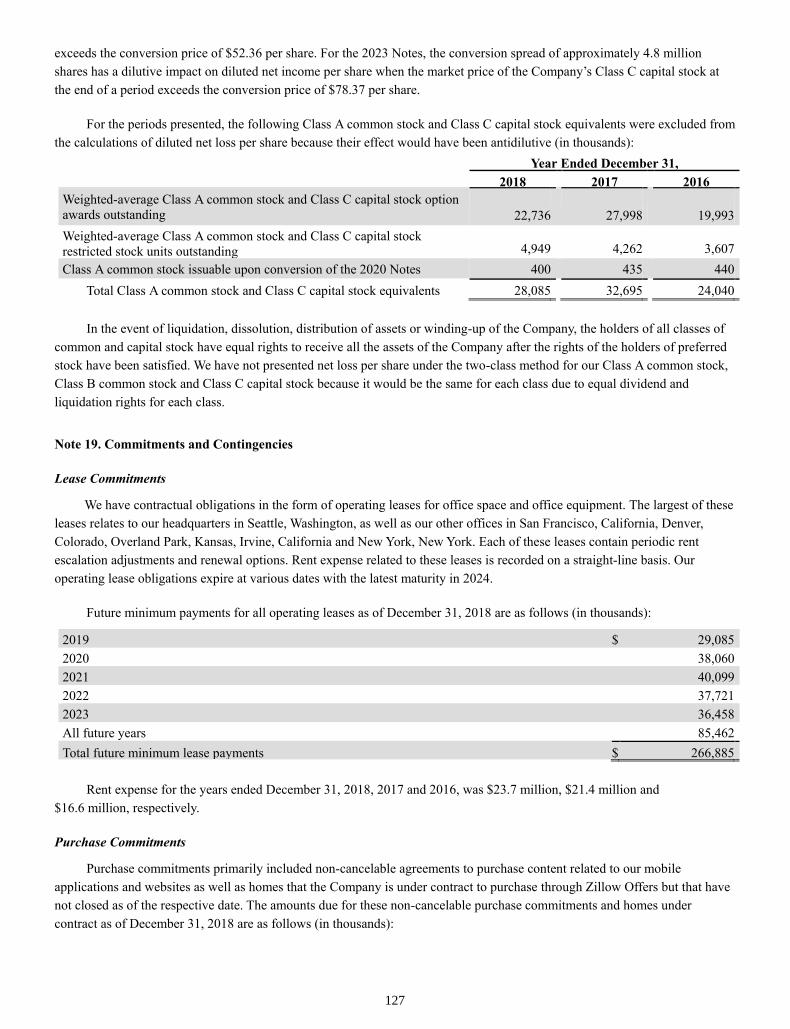
127
exceeds the conversion price of $52.36 per share. For the 2023 Notes, the conversion spread of approximately 4.8 million
shares has a dilutive impact on diluted net income per share when the market price of the Company’s Class C capital stock at
the end of a period exceeds the conversion price of $78.37 per share.
For the periods presented, the following Class A common stock and Class C capital stock equivalents were excluded from
the calculations of diluted net loss per share because their effect would have been antidilutive (in thousands):
Year Ended December 31,
2018 2017 2016
Weighted-average Class A common stock and Class C capital stock option
awards outstanding 22,736
27,998
19,993
Weighted-average Class A common stock and Class C capital stock
restricted stock units outstanding 4,949
4,262
3,607
Class A common stock issuable upon conversion of the 2020 Notes 400 435 440
Total Class A common stock and Class C capital stock equivalents 28,085 32,695 24,040
In the event of liquidation, dissolution, distribution of assets or winding-up of the Company, the holders of all classes of
common and capital stock have equal rights to receive all the assets of the Company after the rights of the holders of preferred
stock have been satisfied. We have not presented net loss per share under the two-class method for our Class A common stock,
Class B common stock and Class C capital stock because it would be the same for each class due to equal dividend and
liquidation rights for each class.
Note 19. Commitments and Contingencies
Lease Commitments
We have contractual obligations in the form of operating leases for office space and office equipment. The largest of these
leases relates to our headquarters in Seattle, Washington, as well as our other offices in San Francisco, California, Denver,
Colorado, Overland Park, Kansas, Irvine, California and New York, New York. Each of these leases contain periodic rent
escalation adjustments and renewal options. Rent expense related to these leases is recorded on a straight-line basis. Our
operating lease obligations expire at various dates with the latest maturity in 2024.
Future minimum payments for all operating leases as of December 31, 2018 are as follows (in thousands):
2019 $ 29,085
2020 38,060
2021 40,099
2022 37,721
2023 36,458
All future years 85,462
Total future minimum lease payments $ 266,885
Rent expense for the years ended December 31, 2018, 2017 and 2016, was $23.7 million, $21.4 million and
$16.6 million, respectively.
Purchase Commitments
Purchase commitments primarily included non-cancelable agreements to purchase content related to our mobile
applications and websites as well as homes that the Company is under contract to purchase through Zillow Offers but that have
not closed as of the respective date. The amounts due for these non-cancelable purchase commitments and homes under
contract as of December 31, 2018 are as follows (in thousands):

128
Purchase Obligations Homes Under Contract
2019 $ 64,124 $ 88,943
2020 64,007 —
2021 32,735 —
Total future purchase commitments $ 160,866 $ 88,943
Surety Bonds
In the course of business, we are required to provide financial commitments in the form of surety bonds to third parties as
a guarantee of our performance on and our compliance with certain obligations. If we were to fail to perform or comply with
these obligations, any draws upon surety bonds issued on our behalf would then trigger our payment obligation to the surety
bond issuer. We have outstanding surety bonds issued for our benefit of approximately $8.9 million and $3.7 million as of
December 31, 2018 and 2017, respectively.
Legal Proceedings
We are involved in a number of legal proceedings concerning matters arising in connection with the conduct of our
business activities, some of which are at preliminary stages and some of which seek an indeterminate amount of damages. We
regularly evaluate the status of legal proceedings in which we are involved to assess whether a loss is probable or there is a
reasonable possibility that a loss or additional loss may have been incurred to determine if accruals are appropriate. We further
evaluate each legal proceeding to assess whether an estimate of possible loss or range of loss can be made if accruals are not
appropriate. For certain cases described below, management is unable to provide a meaningful estimate of the possible loss or
range of possible loss because, among other reasons, (i) the proceedings are in preliminary stages; (ii) specific damages have
not been sought; (iii) damages sought are, in our view, unsupported and/or exaggerated; (iv) there is uncertainty as to the
outcome of pending appeals or motions; (v) there are significant factual issues to be resolved; and/or (vi) there are novel legal
issues or unsettled legal theories presented. For these cases, however, management does not believe, based on currently
available information, that the outcomes of these proceedings will have a material effect on our financial position, results of
operations or cash flow.
In July 2015, VHT, Inc. (“VHT”) filed a complaint against us in the U.S. District Court for the Western District of
Washington alleging copyright infringement of VHT’s images on the Zillow Digs site. In January 2016, VHT filed an amended
complaint alleging copyright infringement of VHT’s images on the Zillow Digs site as well as the Zillow listing site. In
December 2016, the court granted a motion for partial summary judgment that dismissed VHT’s claims with respect to the
Zillow listing site. A federal jury trial began on January 23, 2017, and on February 9, 2017, the jury returned a verdict finding
that the Company had infringed VHT’s copyrights in images displayed or saved to the Digs site. The jury awarded VHT
$79,875 in actual damages and approximately $8.2 million in statutory damages. In March 2017, the Company filed motions in
the district court seeking judgment for the Company on certain claims that are the subject of the verdict, and for a new trial on
others. On June 20, 2017, the judge ruled and granted in part our motions, finding that VHT failed to present sufficient
evidence to prove direct copyright infringement for a portion of the images, reducing the total damages to approximately $4.1
million. On October 26, 2017, the Company filed an appeal with the Ninth Circuit Court of Appeals seeking review of the final
judgment and certain prior rulings entered by the district court. The oral hearing for the appeal took place on August 28, 2018.
We have recorded an estimated liability for approximately $4.1 million as of December 31, 2018 and December 31, 2017. We
do not believe there is a reasonable possibility that a material loss in excess of amounts accrued may be incurred.
In August and September 2017, two purported class action lawsuits were filed against us and certain of our executive
officers, alleging, among other things, violations of federal securities laws on behalf of a class of those who purchased our
common stock between February 12, 2016 and August 8, 2017. One of those purported class actions, captioned Vargosko v.
Zillow Group, Inc. et al, was brought in the U.S. District Court for the Central District of California. The other purported class
action lawsuit, captioned Shotwell v. Zillow Group, Inc. et al, was brought in the U.S. District Court for the Western District of
Washington. The complaints allege, among other things, that during the period between February 12, 2016 and August 8, 2017,
we issued materially false and misleading statements regarding our business practices. The complaints seek to recover, among
other things, alleged damages sustained by the purported class members as a result of the alleged misconduct. In November
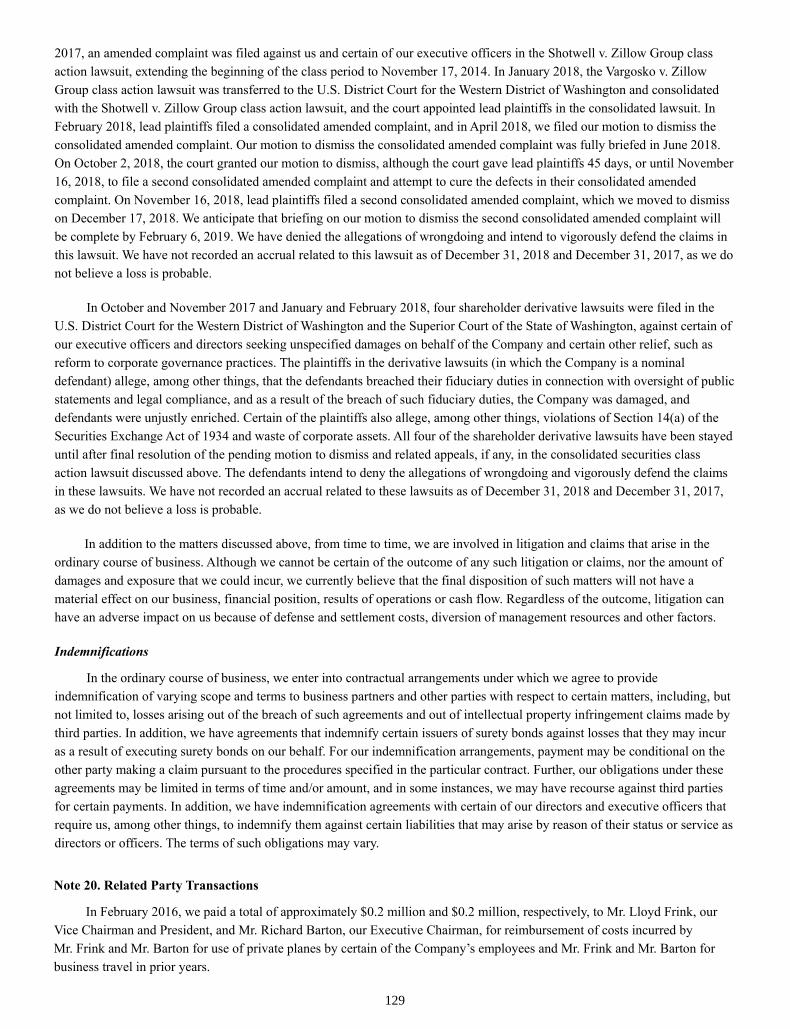
129
2017, an amended complaint was filed against us and certain of our executive officers in the Shotwell v. Zillow Group class
action lawsuit, extending the beginning of the class period to November 17, 2014. In January 2018, the Vargosko v. Zillow
Group class action lawsuit was transferred to the U.S. District Court for the Western District of Washington and consolidated
with the Shotwell v. Zillow Group class action lawsuit, and the court appointed lead plaintiffs in the consolidated lawsuit. In
February 2018, lead plaintiffs filed a consolidated amended complaint, and in April 2018, we filed our motion to dismiss the
consolidated amended complaint. Our motion to dismiss the consolidated amended complaint was fully briefed in June 2018.
On October 2, 2018, the court granted our motion to dismiss, although the court gave lead plaintiffs 45 days, or until November
16, 2018, to file a second consolidated amended complaint and attempt to cure the defects in their consolidated amended
complaint. On November 16, 2018, lead plaintiffs filed a second consolidated amended complaint, which we moved to dismiss
on December 17, 2018. We anticipate that briefing on our motion to dismiss the second consolidated amended complaint will
be complete by February 6, 2019. We have denied the allegations of wrongdoing and intend to vigorously defend the claims in
this lawsuit. We have not recorded an accrual related to this lawsuit as of December 31, 2018 and December 31, 2017, as we do
not believe a loss is probable.
In October and November 2017 and January and February 2018, four shareholder derivative lawsuits were filed in the
U.S. District Court for the Western District of Washington and the Superior Court of the State of Washington, against certain of
our executive officers and directors seeking unspecified damages on behalf of the Company and certain other relief, such as
reform to corporate governance practices. The plaintiffs in the derivative lawsuits (in which the Company is a nominal
defendant) allege, among other things, that the defendants breached their fiduciary duties in connection with oversight of public
statements and legal compliance, and as a result of the breach of such fiduciary duties, the Company was damaged, and
defendants were unjustly enriched. Certain of the plaintiffs also allege, among other things, violations of Section 14(a) of the
Securities Exchange Act of 1934 and waste of corporate assets. All four of the shareholder derivative lawsuits have been stayed
until after final resolution of the pending motion to dismiss and related appeals, if any, in the consolidated securities class
action lawsuit discussed above. The defendants intend to deny the allegations of wrongdoing and vigorously defend the claims
in these lawsuits. We have not recorded an accrual related to these lawsuits as of December 31, 2018 and December 31, 2017,
as we do not believe a loss is probable.
In addition to the matters discussed above, from time to time, we are involved in litigation and claims that arise in the
ordinary course of business. Although we cannot be certain of the outcome of any such litigation or claims, nor the amount of
damages and exposure that we could incur, we currently believe that the final disposition of such matters will not have a
material effect on our business, financial position, results of operations or cash flow. Regardless of the outcome, litigation can
have an adverse impact on us because of defense and settlement costs, diversion of management resources and other factors.
Indemnifications
In the ordinary course of business, we enter into contractual arrangements under which we agree to provide
indemnification of varying scope and terms to business partners and other parties with respect to certain matters, including, but
not limited to, losses arising out of the breach of such agreements and out of intellectual property infringement claims made by
third parties. In addition, we have agreements that indemnify certain issuers of surety bonds against losses that they may incur
as a result of executing surety bonds on our behalf. For our indemnification arrangements, payment may be conditional on the
other party making a claim pursuant to the procedures specified in the particular contract. Further, our obligations under these
agreements may be limited in terms of time and/or amount, and in some instances, we may have recourse against third parties
for certain payments. In addition, we have indemnification agreements with certain of our directors and executive officers that
require us, among other things, to indemnify them against certain liabilities that may arise by reason of their status or service as
directors or officers. The terms of such obligations may vary.
Note 20. Related Party Transactions
In February 2016, we paid a total of approximately $0.2 million and $0.2 million, respectively, to Mr. Lloyd Frink, our
Vice Chairman and President, and Mr. Richard Barton, our Executive Chairman, for reimbursement of costs incurred by
Mr. Frink and Mr. Barton for use of private planes by certain of the Company’s employees and Mr. Frink and Mr. Barton for
business travel in prior years.

130
In April 2016, we paid approximately $0.1 million for a tax “gross-up” payment to Mr. Richard Barton, our Executive
Chairman, to cover the imputed income associated with a 2015 Federal Trade Commission filing made on behalf of Mr. Barton
under the Hart-Scott-Rodino Antitrust Improvements Act of 1976, which filing was required due to Mr. Barton’s ownership of
Zillow, Inc.’s common stock.
Note 21. Self-Insurance
We are self-insured for medical benefits, and beginning on January 1, 2018 for dental benefits, for all qualifying Zillow
Group employees. The medical plan carries a stop-loss policy which will protect when cumulative medical claims exceed 125%
of expected claims for the plan year with a limit of $1.0 million and from individual claims during the plan year exceeding
$150,000. We record estimates of the total costs of claims incurred based on an analysis of historical data and independent
estimates. Our liability for self-insured claims is included within accrued compensation and benefits in our consolidated
balance sheet and was $3.9 million and $2.0 million, respectively, as of December 31, 2018 and 2017.
Note 22. Employee Benefit Plan
We have a defined contribution 401(k) retirement plan covering Zillow Group employees who have met certain eligibility
requirements (the “Zillow Group 401(k) Plan”). Eligible employees may contribute pretax compensation up to a maximum
amount allowable under the Internal Revenue Service limitations. Employee contributions and earnings thereon vest
immediately. We currently match up to 4% of employee contributions under the Zillow Group 401(k) Plan. The total expense
related to the Zillow Group 401(k) Plan was $16.0 million, $12.3 million and $10.1 million, respectively, for the years ended
December 31, 2018, 2017 and 2016.
Note 23. Segment Information and Revenue
Beginning in the second quarter of 2018, we have two operating and reportable segments, which have been identified
based on the way in which our chief operating decision-maker manages our business, makes operating decisions and evaluates
operating performance. Our chief executive officer acts as the chief operating decision-maker and reviews financial and
operational information of the IMT and Homes segments.
The IMT segment includes the financial results for the Premier Agent, Rentals, Mortgages and new construction
marketplaces, dotloop, and display, as well as revenue from the sale of various other marketing and business products and
services to real estate professionals. The Homes segment includes the financial results from Zillow Group’s buying and selling
of homes directly.
Revenue and costs are generally directly attributed to our segments. However, due to the integrated structure of our
business, certain costs incurred by one segment may benefit the other segment. These costs are generally headcount-related and
are allocated to each segment based on the estimated effort attributable to each segment.

131
Our chief executive officer reviews information about our revenue categories as well as statement of operations data
inclusive of loss before income taxes by segment. This information is included in the following table for the period presented
(in thousands):
Year Ended December 31, 2018
IMT Homes Consolidated
Revenue:
Premier Agent $ 898,332 $ — $ 898,332
Rentals 134,587 — 134,587
Mortgages 80,046 — 80,046
Other 168,224 — 168,224
Homes — 52,365 52,365
Total revenue 1,281,189 52,365 1,333,554
Costs and expenses:
Cost of revenue 104,330 49,260 153,590
Sales and marketing 534,038 18,583 552,621
Technology and development 389,539 21,279 410,818
General and administrative 238,727 23,426 262,153
Impairment costs 79,000 — 79,000
Acquisition-related costs 2,332 — 2,332
Integration costs 2,015 — 2,015
Total costs and expenses 1,349,981 112,548 1,462,529
Income (loss) from operations (68,792 ) (60,183 ) (128,975 )
Other income 19,270 — 19,270
Interest expense (39,078 ) (2,177 ) (41,255 )
Loss before income taxes $ (88,600 ) $ (62,360 ) $ (150,960 )
We have not presented the comparable 2017 or 2016 periods in the table above because we had one operating and
reportable segment prior to 2018.
Note 24. Subsequent Events
Entry into Revolving Credit Agreement
On January 31, 2019, certain of Zillow Group’s wholly owned subsidiaries entered into a revolving credit agreement with
Citibank, N.A., as the directing lender, and certain other parties thereto (the “Credit Agreement”). The Credit Agreement
provides for a maximum borrowing capacity of $500.0 million (the “Maximum Amount”) with an initial borrowing capacity
of $50.0 million, which amount may be increased up to the Maximum Amount subject to the satisfaction of certain conditions,
through a non-recourse credit facility secured by a pledge of the equity of certain subsidiaries that purchase and sell select
residential properties through Zillow Offers. The Credit Agreement has an initial term of two years which may be extended for
up to one year, subject to the satisfaction of certain conditions. The Credit Agreement includes customary representations and
warranties, covenants (including financial covenants applicable to the Company), and provisions regarding events of default.
Appointment of CEO; Compensatory Arrangements
On February 21, 2019, Zillow Group announced the appointment of Richard N. Barton as Zillow Group’s Chief
Executive Officer, effective February 21, 2019. Mr. Barton will succeed Spencer Rascoff, who has served as Zillow Group’s
Chief Executive Officer since 2010 and who will remain a member of Zillow Group’s board of directors. Mr. Barton also will
remain a member of Zillow Group’s board of directors. In connection with Mr. Rascoff’s resignation as Chief Executive
Officer, which occurred on February 21, 2019, Zillow Group entered into an Executive Departure Agreement and Release (the

132
“Agreement”) with Mr. Rascoff. Pursuant to the Agreement, Mr. Rascoff will remain a full-time employee of Zillow Group at
his current level of compensation and benefits until March 22, 2019 (the “Departure Date”) in order to provide transition
services until such date. Mr. Rascoff will remain a member of Zillow Group’s board of directors.
Pursuant to the Agreement, Mr. Rascoff will be eligible to receive, among other things, accelerated vesting of outstanding
stock options held by Mr. Rascoff as of the Departure Date by an additional eighteen months from the Departure Date. Options
not vested as of the Departure Date, taking into account the foregoing vesting acceleration, will terminate. Each of Mr.
Rascoff’s vested stock options that are outstanding as of the Departure Date will remain exercisable until, except for any later
date contemplated by the following proviso, the later of (x) the third anniversary of the Departure Date and (y) the latest day
upon which the option would have expired by its original terms under any circumstances (the “Option Expiration Outside
Date”); provided, however, that the options will remain exercisable for so long as Mr. Rascoff serves on Zillow Group’s board
of directors (but not later than any applicable Option Expiration Outside Date), and if Mr. Rascoff ceases to serve on Zillow
Group’s board of directors on or after the third anniversary of the Departure Date, each option will remain exercisable until the
earlier of (i) ninety days from the final date of Mr. Rascoff’s service on Zillow Group’s board of directors and (ii) the
applicable Option Expiration Outside Date. The vesting acceleration pursuant to the Agreement will be accounted for as a
modification, and we expect to record a material amount of share-based compensation expense associated with this
modification in the three months ended March 31, 2019.
133
Item 9. Changes in and Disagreements with Accountants on Accounting and Financial Disclosure.
(a) The Audit Committee (the “Audit Committee”) of the Board of Directors of the Company conducted a
comprehensive, competitive process to determine the Company’s independent registered public accounting firm for the
Company’s fiscal year ending December 31, 2017. As a result of this process, the Audit Committee approved the dismissal of
Ernst & Young LLP (“EY”), effective upon issuance by EY of its reports on the Company’s consolidated financial statements
as of and for the year ended December 31, 2016 and the effectiveness of internal control over financial reporting as of
December 31, 2016 included in the filing of the Company’s Annual Report on Form 10-K for the fiscal year ended
December 31, 2016 (“2016 Annual Report”). The 2016 Annual Report was filed on February 7, 2017, and therefore, the
effective date of EY’s dismissal was February 7, 2017.
The reports of EY on the Company’s consolidated financial statements for the years ended December 31, 2016 did not
contain an adverse opinion or a disclaimer of opinion, and were not qualified or modified as to uncertainty, audit scope, or
accounting principle.
During the fiscal year ended December 31, 2016 and during the subsequent interim period through February 7, 2017,
there were no disagreements (as that term is defined in Item 304(a)(1)(iv) of Regulation S-K) between the Company and EY on
any matter of accounting principles or practices, financial statement disclosure, or auditing scope or procedure, which
disagreements, if not resolved to the satisfaction of EY, would have caused EY to make reference to the subject matter of the
disagreements in connection with EY’s report on the Company’s consolidated financial statements for such fiscal years. During
the fiscal year ended December 31, 2016 and during the subsequent interim period through February 7, 2017, there were no
reportable events (as defined in Item 304(a)(1)(v) of Regulation S-K).
The Company provided EY with the statements made by the Company in response to Item 304(a) of Regulation S-K
prior to its filing with the Securities and Exchange Commission (“SEC”) and requested that EY provide the Company with
letters addressed to the SEC stating whether EY agrees with the statements made by the Company in response to Item 304(a) of
Regulation S-K. A copy of these letters, dated August 4, 2016 and February 7, 2017, furnished by EY in response to the
Company’s request, are filed as Exhibit 16.1 and Exhibit 16.2 to this report, respectively.
(b) On August 3, 2016, the Audit Committee approved the engagement of Deloitte & Touche LLP (“Deloitte”) as the
Company’s independent registered public accounting firm for the Company’s fiscal year ending December 31, 2017. During
the fiscal years ended December 31, 2015 and 2016 and during the subsequent period through the date of the engagement of
Deloitte, neither the Company nor anyone acting on its behalf has consulted with Deloitte regarding:
(i) The application of accounting principles to a specified transaction, either completed or proposed, or
(ii) The type of audit opinion that might be rendered on the Company’s financial statements, and either a written report was
provided to the Company or oral advice was provided that Deloitte concluded was an important factor considered by
the Company in reaching a decision as to an accounting, auditing or financial reporting issue; or
(iii) Any matter that was either the subject of a disagreement or a reportable event, as each term is defined in Items
304(a)(1)(iv) or (v) of Regulation S-K, respectively.
There were no disagreements with Deloitte on accounting and financial disclosure matters from the date of the
engagement of Deloitte through the year ended December 31, 2018, or in any period subsequent to such date, through the date
of this report.
134
Item 9A. Controls and Procedures.
Evaluation of Disclosure Controls and Procedures
The Company carried out an evaluation, with the participation of our management, and under the supervision of our
Chief Executive Officer and Chief Financial Officer, of the effectiveness of our disclosure controls and procedures (as defined
under Rule 13a-15(e) and Rule 15d-15(e) under the Exchange Act) as of the end of the period covered by this report. Based
upon that evaluation, our Chief Executive Officer and Chief Financial Officer concluded that our disclosure controls and
procedures were effective as of December 31, 2018.
Management’s Report on Internal Control Over Financial Reporting
Our management is responsible for establishing and maintaining adequate internal control over financial reporting, as
such term is defined under Rule 13a-15(f) under the Exchange Act. Under the supervision and with the participation of our
management, including our Chief Executive Officer and Chief Financial Officer, we conducted an evaluation of the
effectiveness of our internal control over financial reporting based on the framework in Internal Control – Integrated
Framework issued by the Committee of Sponsoring Organizations of the Treadway Commission (2013 framework). Based on
our evaluation, our management concluded that our internal control over financial reporting was effective as of December 31,
2018.
We intend to regularly review and evaluate the design and effectiveness of our disclosure controls and procedures and
internal control over financial reporting on an ongoing basis and to improve these controls and procedures over time and to
correct any deficiencies that we may discover in the future. While we believe the present design of our disclosure controls and
procedures and internal control over financial reporting are effective, future events affecting our business may cause us to
modify our controls and procedures.
The Company’s independent registered public accounting firm has issued an attestation report regarding its assessment of
the effectiveness of the Company’s internal control over financial reporting as of December 31, 2018.
Changes in Internal Control over Financial Reporting
Except for the implementation of certain internal controls related to our January 1, 2018 adoption of guidance issued by
the Financial Accounting Standards Board on revenue from contracts with customers, there were no other changes in our
internal control over financial reporting identified in connection with the evaluation required by Rule 13a-15(d) and 15d-15(d)
of the Exchange Act that occurred during the year ended December 31, 2018 that have materially affected, or are reasonably
likely to materially affect, our internal control over financial reporting. There were no changes in our internal control over
financial reporting identified in connection with the evaluation required by Rule 13a-15(d) and 15d-15(d) of the Exchange Act
that occurred during the three months ended December 31, 2018 that have materially affected, or are reasonably likely to
materially affect, our internal control over financial reporting.

135
REPORT OF INDEPENDENT REGISTERED PUBLIC ACCOUNTING FIRM
The Board of Directors and Shareholders of Zillow Group, Inc.
Opinion on Internal Control over Financial Reporting
We have audited the internal control over financial reporting of Zillow Group, Inc. (the “Company”) as of December 31, 2018,
based on criteria established in Internal Control - Integrated Framework (2013) issued by the Committee of Sponsoring
Organizations of the Treadway Commission (COSO). In our opinion, the Company maintained, in all material respects,
effective internal control over financial reporting as of December 31, 2018, based on criteria established in Internal Control -
Integrated Framework (2013) issued by COSO.
We have also audited, in accordance with the standards of the Public Company Accounting Oversight Board (United States)
(PCAOB), the consolidated financial statements of the Company as of and for the year ended December 31, 2018, and our
report dated February 21, 2019 expressed an unqualified opinion on those financial statements and included an explanatory
paragraph related to the Company’s change in method of accounting for costs to obtain customer contracts during the year
ended December 31, 2018 due to the adoption of the new revenue standard.
Basis for Opinion
The Company’s management is responsible for maintaining effective internal control over financial reporting and for its
assessment of the effectiveness of internal control over financial reporting, included in the accompanying Management’s
Report on Internal Control over Financial Reporting. Our responsibility is to express an opinion on the Company’s internal
control over financial reporting based on our audit. We are a public accounting firm registered with the PCAOB and are
required to be independent with respect to the Company in accordance with the U.S. federal securities laws and the applicable
rules and regulations of the Securities and Exchange Commission and the PCAOB.
We conducted our audit in accordance with the standards of the PCAOB. Those standards require that we plan and perform the
audit to obtain reasonable assurance about whether effective internal control over financial reporting was maintained in all
material respects. Our audit included obtaining an understanding of internal control over financial reporting, assessing the risk
that a material weakness exists, testing and evaluating the design and operating effectiveness of internal control based on the
assessed risk, and performing such other procedures as we considered necessary in the circumstances. We believe that our audit
provides a reasonable basis for our opinion.
Definition and Limitations of Internal Control over Financial Reporting
A company’s internal control over financial reporting is a process designed to provide reasonable assurance regarding the
reliability of financial reporting and the preparation of financial statements for external purposes in accordance with generally
accepted accounting principles. A company’s internal control over financial reporting includes those policies and procedures
that (1) pertain to the maintenance of records that, in reasonable detail, accurately and fairly reflect the transactions and
dispositions of the assets of the company; (2) provide reasonable assurance that transactions are recorded as necessary to permit
preparation of financial statements in accordance with generally accepted accounting principles, and that receipts and
expenditures of the company are being made only in accordance with authorizations of management and directors of the
company; and (3) provide reasonable assurance regarding prevention or timely detection of unauthorized acquisition, use, or
disposition of the company’s assets that could have a material effect on the financial statements.
Because of its inherent limitations, internal control over financial reporting may not prevent or detect misstatements. Also,
projections of any evaluation of effectiveness to future periods are subject to the risk that controls may become inadequate
because of changes in conditions, or that the degree of compliance with the policies or procedures may deteriorate.
Seattle, Washington /s/ DELOITTE & TOUCHE LLP
February 21, 2019

136
Item 9B. Other Information.
None.

137
PART III
Item 10. Directors, Executive Officers and Corporate Governance.
The information required by this item is incorporated by reference to the Company’s definitive proxy statement relating
to the 2019 annual meeting of shareholders. The definitive proxy statement will be filed with the Securities and Exchange
Commission within 120 days after the end of the 2018 fiscal year.
We have adopted a Code of Ethics that applies to our Chief Executive Officer, Chief Financial Officer, Chief Accounting
Officer, controller and persons performing similar functions. The Code of Ethics is posted on our website at
http://investors.zillowgroup.com/corporate-governance.cfm. We intend to satisfy the disclosure requirements under Item 5.05
of Form 8-K regarding an amendment to, or waiver from, a provision of the Code of Ethics by posting such information on our
website at the address specified above.
Item 11. Executive Compensation.
The information required by this item is incorporated by reference to the Company’s definitive proxy statement relating
to the 2019 annual meeting of shareholders. The definitive proxy statement will be filed with the Securities and Exchange
Commission within 120 days after the end of the 2018 fiscal year.
Item 12. Security Ownership of Certain Beneficial Owners and Management and Related Stockholder Matters.
The information required by this item is incorporated by reference to the Company’s definitive proxy statement relating
to the 2019 annual meeting of shareholders. The definitive proxy statement will be filed with the Securities and Exchange
Commission within 120 days after the end of the 2018 fiscal year.
Item 13. Certain Relationships and Related Transactions, and Director Independence.
The information required by this item is incorporated by reference to the Company’s definitive proxy statement relating
to the 2019 annual meeting of shareholders. The definitive proxy statement will be filed with the Securities and Exchange
Commission within 120 days after the end of the 2018 fiscal year.
Item 14. Principal Accountant Fees and Services.
The information required by this item is incorporated by reference to the Company’s definitive proxy statement relating
to the 2019 annual meeting of shareholders. The definitive proxy statement will be filed with the Securities and Exchange
Commission within 120 days after the end of the 2018 fiscal year.
138
PART IV
Item 15. Exhibits, Financial Statement Schedules.
(a)(1) Financial Statements
We have filed the financial statements listed in the Index to Consolidated Financial Statements as a part of this Annual
Report on Form 10-K.
(a)(2) Financial Statement Schedules
All financial statement schedules have been omitted because they are not applicable, not material or the required
information is presented in the financial statements or the notes thereto.
(a)(3) Exhibits
Certain of the following exhibits have heretofore been filed with the Securities and Exchange Commission and are
incorporated by reference from the documents described in parentheses. Certain others are filed herewith. The exhibits are
numbered in accordance with Item 601 of Regulation S-K. In reviewing the agreements included as exhibits to this Annual
Report on Form 10-K, please remember that they are included to provide you with information regarding their terms and are
not intended to provide any other factual or disclosure information about the Company or the other parties to the agreement.
The agreements may contain representations and warranties by each of the parties to the applicable agreement. These
representations and warranties have been made solely for the benefit of the other party or parties to the applicable agreement
and (i) should not be treated as categorical statements of fact, but rather as a means of allocating the risk to one of the parties if
those statements prove to be inaccurate; (ii) may have been qualified by disclosures that were made to the other party or parties
in connection with the negotiation of the applicable agreement, which disclosures are not necessarily reflected in the
agreement; (iii) may apply standards of materiality in a manner that is different from what may be viewed as material to you or
other investors; and (iv) were made only as of the date of the applicable agreement or other date or dates that may be specified
in the agreement and are subject to more recent developments. Accordingly, these representations and warranties may not
describe the actual state of affairs as of the date they were made or at any other time. Additional information about the
Company may be found elsewhere in this Annual Report on Form 10-K and the Company’s other public filings, which are
available without charge through the SEC’s website at http://www.sec.gov.
Exhibit
Number Description
2.1+
Agreement and Plan of Merger, dated August 16, 2013, by and among Zillow, Inc., NMD Interactive, Inc.,
d/b/a StreetEasy, Strawberry Acquisition, Inc. and Shareholder Representative Services LLC (Filed as
Exhibit 2.1 to Zillow, Inc.’s Current Report on Form 8-K filed with the Securities and Exchange Commission
on August 19, 2013, and incorporated herein by reference).
3.1
Amended and Restated Articles of Incorporation of Zillow Group, Inc. (Filed as Exhibit 3.1 to Registrant’s
Current Report on Form 8-K filed with the Securities and Exchange Commission on February 17, 2015, and
incorporated herein by reference).
3.2
Amended and Restated Bylaws of Zillow Group, Inc. (Filed as Exhibit 3.2 to Registrant’s Current Report on
Form 8-K filed with the Securities and Exchange Commission on February 17, 2015, and incorporated herein
by reference).
4.1
Specimen of Class A Common Stock Certificate (Filed as Exhibit 4.1 to Registrant’s Quarterly Report on
Form 10-Q filed on May 12, 2015, and incorporated herein by reference).
4.2
Specimen of Class C Capital Stock Certificate (Filed as Exhibit 4.1 Registrant’s Form 8-A filed with the
Securities and Exchange Commission on July 29, 2015, and incorporated herein by reference).

139
Exhibit
Number Description
4.3
Indenture, dated as of December 17, 2013, between Trulia, Inc. and Wells Fargo Bank, National Association,
as trustee (Filed as Exhibit 4.1 to Trulia, Inc.’s Current Report on Form 8-K filed with the Securities and
Exchange Commission (File No. 001-35650) on December 17, 2013, and incorporated herein by reference).
4.4
Form of Note for Trulia, Inc.’s 2.75% Convertible Senior Notes due 2020 (incorporated by reference to
Exhibit 4.1 hereto).
4.5
Supplemental Indenture, dated as of February 17, 2015, among Zillow Group, Inc., Trulia, Inc. and Wells
Fargo Bank, National Association, as trustee (Filed as Exhibit 4.2 to Registrant’s Current Report on Form 8-
K12B filed with the Securities and Exchange Commission on February 17, 2015, and incorporated herein by
reference).
4.6
Second Supplemental Indenture, dated as of December 30, 2015, among Zillow Group, Inc., Trulia, Inc. and
Wells Fargo Bank, National Association, as trustee (Filed as Exhibit 4.1 to Registrant’s Current Report on
Form 8-K filed with the Securities and Exchange Commission on December 30, 2015, and incorporated
herein by reference).
4.7
Transfer Restriction Agreement and Amendment to Noncompetition Agreement, dated July 20, 2015, among
Zillow Group, Inc., Zillow, Inc., Richard Barton and the other holders signatory thereto (Filed as Exhibit
10.1 to Registrant’s Current Report on Form 8-K filed with the Securities and Exchange Commission on
July 21, 2015, and incorporated herein by reference).
4.8
Transfer Restriction Agreement and Amendment to Noncompetition Agreement, dated July 20, 2015, among
Zillow Group, Inc., Zillow, Inc., Lloyd Frink and the other holders signatory thereto (Filed as Exhibit 10.2 to
Registrant’s Current Report on Form 8-K filed with the Securities and Exchange Commission on July 21,
2015, and incorporated herein by reference).
4.9
Indenture, dated as of December 12, 2016, by and between Zillow Group, Inc. and The Bank of New York
Mellon Trust Company, National Association, as trustee (Filed as Exhibit 4.1 to Registrant’s Current Report
on Form 8-K filed with the Securities and Exchange Commission on December 12, 2016, and incorporated
herein by reference).
4.10
Form of Note for Zillow Group, Inc.’s 2.00% Convertible Senior Notes due 2021 (incorporated by reference
from Exhibit A to Exhibit 4.3 hereto).
4.11
Indenture, dated as of July 3, 2018, by and between Zillow Group, Inc. and The Bank of New York Mellon
Trust Company, N.A., as trustee (Filed as Exhibit 4.1 to Zillow Group, Inc.’s Current Report on Form 8-K
filed with the Securities and Exchange Commission on July 3, 2018, and incorporated herein by reference).
4.12
Form of 1.50% Convertible Senior Note due 2023 (included in Exhibit 4.1 to Zillow Group, Inc.’s Current
Report on Form 8-K filed with the Securities and Exchange Commission on July 3, 2018, and incorporated
herein by reference).
10.1*
Zillow, Inc. Amended and Restated 2005 Equity Incentive Plan (Filed as Exhibit 10.5 to Zillow, Inc.’s
Amendment No. 3 to Registration Statement on Form S-1 filed with the Securities and Exchange
Commission (SEC File No. 333-173570) on June 20, 2011, and incorporated herein by reference).
10.2*
Form of Stock Option Grant Notice and Stock Option Agreement under the Zillow, Inc. Amended and
Restated 2005 Equity Incentive Plan (Filed as Exhibit 10.6 to Zillow, Inc.’s Registration Statement on Form
S-1 filed with the Securities and Exchange Commission (SEC File No. 333-173570) filed on April 18, 2011,
and incorporated herein by reference).
10.3*
Market Leader, Inc. Amended and Restated 2004 Equity Incentive Plan (Filed as Appendix A to Market
Leader, Inc.’s Definitive Proxy Statement on Schedule 14A filed with the Securities Exchange Commission
(SEC File No. 000- 51032) on April 10, 2009, and incorporated herein by reference).
10.4*
Trulia, Inc. 2005 Stock Incentive Plan, as amended, and form of Stock Option Agreement and form of Stock
Option Grant Notice thereunder (Filed as Exhibit 10.2 to Trulia, Inc.’s Form S-1 filed with the Securities and
Exchange Commission (SEC File No. 333-183364) on August17, 2012, and incorporated herein by
reference).
10.5*
Zillow, Inc. Amended and Restated 2011 Equity Incentive Plan (Filed as Appendix A to Zillow, Inc.’s
Definitive Proxy Statement filed with the Securities and Exchange Commission (SEC File No. 001-35237)
on April 17, 2012, and incorporated herein by reference).

140
Exhibit
Number Description
10.6*
Amendment No. 1 to the Zillow, Inc. Amended and Restated 2011 Incentive Plan (Filed as Appendix A to
Zillow, Inc.’s Definitive Proxy Statement filed with the Securities and Exchange Commission (SEC File No.
001-35237) on April 16, 2013, and incorporated herein by reference).
10.7*
Form of Stock Option Grant Notice and Stock Option Agreement under the Zillow, Inc. 2011 Incentive Plan
(Filed as Exhibit 10.3 to Zillow, Inc.’s Amendment No. 3 to Registration Statement on Form S-1 filed with
the Securities and Exchange Commission (SEC File No. 333-173570) on June 20, 2011, and incorporated
herein by reference).
10.8*
Form of Restricted Stock Unit Award Notice and Restricted Stock Unit Award Agreement under the Zillow,
Inc. Amended and Restated 2011 Incentive Plan (Filed as Exhibit 10.2 to Zillow, Inc.’s Form 10-Q filed with
the Securities and Exchange Commission on May 8, 2014, and incorporated herein by reference).
10.9*
Form of Restricted Unit Award Notice and Restricted Unit Award Agreement under the Zillow, Inc. Amended
and Restated 2011 Incentive Plan (Filed as Exhibit 10.3 to Zillow, Inc.’s Form 10-Q filed with the Securities
and Exchange Commission on May 8, 2014, and incorporated herein by reference).
10.10*
Amended and Restated Stock Option Grant Program for Nonemployee Directors under the Zillow, Inc.
Amended and Restated 2011 Incentive Plan (Filed as Exhibit 10.11 to Registrant’s Quarterly Report on Form
10-Q filed on May 12, 2015, and incorporated herein by reference).
10.11*
Amended and Restated Stock Option Grant Program for Nonemployee Directors under the Zillow Group,
Inc. Amended and Restated 2011 Incentive Plan (Filed as Exhibit 10.1 to Registrant’s Quarterly Report on
Form 10-Q filed on May 4, 2016, and incorporated herein by reference).
10.12*
Amended and Restated Stock Option Grant Program for Nonemployee Directors under the Zillow Group,
Inc. Amended and Restated 2011 Incentive Plan (Filed as Exhibit 10.1 to Registrant’s Current Report on
Form 8-K filed with the Securities and Exchange Commission on February 13, 2017, and incorporated herein
by reference).
10.13*
Form of Stock Option Grant Notice and Stock Option Agreement under the Zillow, Inc. Amended and
Restated 2011 Incentive Plan (Assumed by Registrant; Filed as Exhibit 10.12 to Registrant’s Quarterly
Report on Form 10-Q filed on May 12, 2015, and incorporated herein by reference).
10.14*
Form of Restricted Stock Unit Award Notice and Restricted Stock Unit Award Agreement under the Zillow,
Inc. Amended and Restated 2011 Incentive Plan (Assumed by Registrant; Filed as Exhibit 10.13 to
Registrant’s Quarterly Report on Form 10-Q filed on May 12, 2015, and incorporated herein by reference).
10.15*
Trulia, Inc. 2012 Equity Incentive Plan, as amended and restated (Filed as Exhibit 10.1 to Trulia, Inc.’s Form
10-Q filed with the Securities and Exchange Commission (File No. 001-35650) on August 12, 2013, and
incorporated herein by reference).
10.16*
Form of Nonqualified Stock Option Grant Notice and Stock Option Agreement under the Trulia, Inc. 2012
Equity Incentive Plan (Assumed by Registrant; Filed as Exhibit 10.15 to Registrant’s Quarterly Report on
Form 10-Q filed on May 12, 2015, and incorporated herein by reference).
10.17*
Form of Restricted Stock Unit Award Notice and Restricted Stock Unit Award Agreement under the Trulia,
Inc. 2012 Equity Incentive Plan (Assumed by Registrant; Filed as Exhibit 10.16 to Registrant’s Quarterly
Report on Form 10-Q filed on May12, 2015, and incorporated herein by reference).
10.18*
Executive Employment Agreement by and between Spencer M. Rascoff and Zillow, Inc. (Filed as Exhibit
10.14 to Zillow, Inc.’s Amendment No. 1 to Registration Statement on Form S-1 filed with the Securities and
Exchange Commission (SEC File No. 333-173570) on May 23, 2011, and incorporated herein by reference).
10.19*
Executive Employment Agreement by and between Kathleen Philips and Zillow, Inc. (Filed as Exhibit 10.16
to Zillow, Inc.’s Amendment No. 1 to Registration Statement on Form S-1 filed with the Securities and
Exchange Commission (SEC File No. 333-173570) on May 23, 2011, and incorporated herein by reference).
10.20*
Amended and Restated Executive Employment Agreement by and between Errol Samuelson and Zillow, Inc.
(Filed as Exhibit 10.1 to Zillow, Inc.’s Quarterly Report on Form 10-Q filed with the Securities and
Exchange Commission on May 8, 2014, and incorporated herein by reference).

141
Exhibit
Number Description
10.21*
Amendment No. 1 to the Amended and Restated Executive Employment Agreement, dated March 25, 2016,
by and between Errol Samuelson and Zillow, Inc. (Filed as Exhibit 10.3 to Zillow, Inc.’s Quarterly Report on
Form 10-Q filed with the Securities and Exchange Commission on May 4, 2016, and incorporated herein by
reference).
10.22*
Letter Agreement dated April 23, 2015 by and between Zillow Group, Inc. and Greg M. Schwartz (Filed as
Exhibit 10.1 to Registrant’s Current Report on Form 8-K filed with the Securities and Exchange Commission
on April 28, 2015, and incorporated herein by reference).
10.23*
Amended and Restated Letter Agreement dated August 3, 2015, by and between Zillow Group, Inc. and Greg
M. Schwartz (Filed as Exhibit 10.1 to Registrant’s Current Report on Form 8-K filed with the Securities and
Exchange Commission on August 3, 2015, and incorporated herein by reference).
10.24*
Letter Agreement dated February 24, 2016 by and between Zillow Group, Inc. and Greg M. Schwartz (Filed
as Exhibit 10.1 to Registrant’s Current Report on Form 8-K filed with the Securities and Exchange
Commission on February 29, 2016, and incorporated herein by reference).
10.25*
Letter Agreement dated March 6, 2017 by and between Zillow Group, Inc. and Greg M. Schwartz (Filed as
Exhibit 10.1 to Registrant’s Current Report on Form 8-K filed with the Securities and Exchange Commission
on March 8, 2017, and incorporated herein by reference).
10.26*
Form of Confidential Information, Inventions, and Nonsolicitation Agreement for certain officers of Zillow,
Inc. (Filed as Exhibit 10.4 to Zillow, Inc.’s Quarterly Report on Form 10-Q filed with the Securities and
Exchange Commission on May 8, 2014, and incorporated herein by reference).
10.27*
Forms of Confidential Information, Inventions, Nonsolicitation and Noncompetition Agreement for the
Officers of Zillow Group, Inc. (Filed as Exhibit 10.29 to Registrant’s Quarterly Report on Form 10-Q filed
on May 12, 2015, and incorporated herein by reference).
10.28*
Form of Indemnification Agreement between Zillow Group, Inc. and each of its directors and executive
officers (Filed as Exhibit 10.9 to Registrant’s Current Report on Form 8-K12B filed with the Securities and
Exchange Commission on February 17, 2015, and incorporated herein by reference).
10.29*
Zillow Group, Inc. Amended and Restated 2011 Incentive Plan (Filed as Exhibit 10.3 to Registrant’s
Quarterly Report on Form 10-Q filed with the Securities and Exchange Commission on August 5, 2016, and
incorporated herein by reference).
10.30*
Form of Stock Option Grant Notice and Stock Option Agreement under the Zillow Group, Inc. Amended and
Restated 2011 Incentive Plan (Filed as Exhibit 10.2 to Registrant’s Quarterly Report on Form 10-Q filed on
August 5, 2015, and incorporated herein by reference).
10.31*
Form of Restricted Stock Unit Award Notice and Restricted Stock Unit Award Agreement under the Zillow
Group, Inc. Amended and Restated 2011 Incentive Plan (Filed as Exhibit 10.3 to Registrant’s Quarterly
Report on Form 10-Q filed on August 5, 2015, and incorporated herein by reference).
10.32
Office Lease between The Northwestern Mutual Life Insurance Company and Zillow, Inc. dated March 22,
2011 (Filed as Exhibit 10.10 to Zillow, Inc.’s Registration Statement on Form S-1 (SEC File No. 333-
173570) filed on April 18, 2011, and incorporated herein by reference).
10.33
Amendment to Office Lease by and between FSP-RIC LLC and Zillow, Inc., dated as of June 27, 2012 (Filed
as Exhibit 10.1 to Zillow, Inc.’s Current Report on Form 8-K filed with the Securities and Exchange
Commission on June 29, 2012, and incorporated herein by reference).
10.34
Second Amendment to Lease by and between FSP-RIC, LLC and Zillow, Inc., dated as of April 16, 2013
(Filed as Exhibit 10.1 to Zillow, Inc.’s Current Report on Form 8-K filed with the Securities and Exchange
Commission on April 22, 2013, and incorporated herein by reference).
10.35
Third Amendment to Lease by and between FSP-RIC, LLC and Zillow, Inc., dated as of January 10, 2014
(Filed as Exhibit 10.10 to Zillow, Inc.’s Form 10-K filed with the Securities and Exchange Commission on
February 18, 2014, and incorporated herein by reference).
10.36
Fourth Amendment to Lease by and between FSP-RIC, LLC and Zillow, Inc., dated as of May 2, 2014 (Filed
as Exhibit 10.1 to Zillow, Inc.’s Quarterly Report on Form 10-Q filed with the Securities and Exchange
Commission on August 6, 2014, and incorporated herein by reference).
142
Exhibit
Number Description
10.37
Fifth Amendment to Lease by and between FSP-RIC, LLC and Zillow, Inc., dated as of November 19, 2014
(Filed as Exhibit 10.1 to Zillow, Inc.’s Current Report on Form 8-K filed with the Securities and Exchange
Commission on November 24, 2014, and incorporated herein by reference).
10.38
Sixth Amendment to Lease by and between FSP-RIC, LLC and Zillow, Inc., dated as of June 21, 2016 (Filed
as Exhibit 10.1 to Registrant’s Quarterly Report on Form 10-Q filed with the Securities and Exchange
Commission on August 5, 2016, and incorporated herein by reference).
10.39
Lease, dated March 10, 2014, between Trulia and BXP Mission 535 LLC (Filed as Exhibit 10.1 to Trulia,
Inc.’s Quarterly Report on Form 10-Q filed with the Securities and Exchange Commission on May 2, 2014,
and incorporated herein by reference).
10.40
Amendment to Office Lease, dated July 25, 2014, between Trulia and BXP Mission 535 LLC (Filed as
Exhibit 10.1 to Trulia, Inc.’s Form 10-Q filed with the Securities and Exchange Commission on August 8,
2014, and incorporated herein by reference).
10.41
Settlement Agreement and Release, dated as of June 6, 2016, among Move, Inc., Real Select, Inc., Top
Producer Systems Company, National Association of Realtors, Realtors Information Network, Inc., Zillow,
Inc., Errol Samuelson, and Curt Beardsley (Filed as Exhibit 10.1 to Registrant’s Current Report on Form 8-K
filed with the Securities and Exchange Commission on June 6, 2016, and incorporated herein by reference).
10.42
Base Capped Call Confirmation, dated December 6, 2016, between Zillow Group, Inc. and Citigroup Global
Markets Inc. (Filed as Exhibit 10.1 to Registrant’s Current Report on Form 8-K filed with the Securities and
Exchange Commission on December 12, 2016, and incorporated herein by reference).
10.43
Base Capped Call Confirmation, dated December 6, 2016, between Zillow Group, Inc. and Goldman, Sachs
& Co. (Filed as Exhibit 10.2 to Registrant’s Current Report on Form 8-K filed with the Securities and
Exchange Commission on December 12, 2016, and incorporated herein by reference).
10.44
Base Capped Call Confirmation, dated December 6, 2016, between Zillow Group, Inc. and Bank of America,
N.A. (Filed as Exhibit 10.3 to Registrant’s Current Report on Form 8-K filed with the Securities and
Exchange Commission on December 12, 2016, and incorporated herein by reference).
10.45
Additional Capped Call Confirmation, dated December 8, 2016, between Zillow Group, Inc. and Citigroup
Global Markets Inc. (Filed as Exhibit 10.4 to Registrant’s Current Report on Form 8-K filed with the
Securities and Exchange Commission on December 12, 2016, and incorporated herein by reference).
10.46
Additional Capped Call Confirmation, dated December 8, 2016, between Zillow Group, Inc. and Goldman,
Sachs & Co. (Filed as Exhibit 10.5 to Registrant’s Current Report on Form 8-K filed with the Securities and
Exchange Commission on December 12, 2016, and incorporated herein by reference).
10.47
Additional Capped Call Confirmation, dated December 8, 2016, between Zillow Group, Inc. and Bank of
America, N.A. (Filed as Exhibit 10.6 to Registrant’s Current Report on Form 8-K filed with the Securities
and Exchange Commission on December 12, 2016, and incorporated herein by reference).
10.48 Zillow, Inc. Proprietary Rights Agreement (Filed as Exhibit 10.1 to Zillow, Inc.’s Form 10-Q filed with the
Securities and Exchange Commission on May 8, 2018, and incorporated herein by reference).
10.49
Base Capped Call Confirmation, dated June 28, 2018, between Zillow Group, Inc. and Goldman Sachs &
Co. LLC (Filed as Exhibit 10.1 to Zillow Group, Inc.’s Current Report on Form 8-K filed with the Securities
and Exchange Commission on July 3, 2018, and incorporated herein by reference).
10.50
Base Capped Call Confirmation, dated June 28, 2018, between Zillow Group, Inc. and Citibank, N.A. (Filed
as Exhibit 10.2 to Zillow Group, Inc.’s Current Report on Form 8-K filed with the Securities and Exchange
Commission on July 3, 2018, and incorporated herein by reference).
10.51
Base Capped Call Confirmation, dated June 28, 2018, between Zillow Group, Inc. and Royal Bank of
Canada, represented by RBC Capital Markets, LLC as its agent (Filed as Exhibit 10.3 to Zillow Group, Inc.’s
Current Report on Form 8-K filed with the Securities and Exchange Commission on July 3, 2018, and
incorporated herein by reference).
10.52
Base Capped Call Confirmation, dated June 28, 2018, between Zillow Group, Inc. and Bank of America
N.A. (Filed as Exhibit 10.4 to Zillow Group, Inc.’s Current Report on Form 8-K filed with the Securities and
Exchange Commission on July 3, 2018, and incorporated herein by reference).

143
Exhibit
Number Description
10.53
Additional Capped Call Confirmation, dated July 2, 2018, between Zillow Group, Inc. and Goldman
Sachs & Co. LLC (Filed as Exhibit 10.5 to Zillow Group, Inc.’s Current Report on Form 8-K filed with the
Securities and Exchange Commission on July 3, 2018, and incorporated herein by reference).
10.54
Additional Capped Call Confirmation, dated July 2, 2018, between Zillow Group, Inc. and Citibank, N.A.
(Filed as Exhibit 10.6 to Zillow Group, Inc.’s Current Report on Form 8-K filed with the Securities and
Exchange Commission on July 3, 2018, and incorporated herein by reference).
10.55
Additional Capped Call Confirmation, dated July 2, 2018, between Zillow Group, Inc. and Royal Bank of
Canada, represented by RBC Capital Markets, LLC as its agent (Filed as Exhibit 10.7 to Zillow Group, Inc.’s
Current Report on Form 8-K filed with the Securities and Exchange Commission on July 3, 2018, and
incorporated herein by reference).
10.56
Additional Capped Call Confirmation, dated July 2, 2018, between Zillow Group, Inc. and Bank of America,
N.A. (Filed as Exhibit 10.8 to Zillow Group, Inc.’s Current Report on Form 8-K filed with the Securities and
Exchange Commission on July 3, 2018, and incorporated herein by reference).
10.57*
Executive Employment and Retirement Agreement and Release, dated May 3, 2018, between Zillow Group,
Inc. and Kathleen Philips (Filed as Exhibit 10.2 to Zillow Group, Inc.’s Current Report on Form 8-K filed
with the Securities and Exchange Commission on May 7, 2018, and incorporated herein by reference).
10.58*
Executive Severance Agreement and Release, dated October 16, 2018, between Zillow Group, Inc. and Amy
Bohutinsky (Filed as Exhibit 10.1 to Zillow Group, Inc.’s Current Report on Form 8-K filed with the
Securities and Exchange Commission on October 17, 2018, and incorporated herein by reference).
10.59*
Executive Employment Agreement, dated November 6, 2018, between Zillow Group, Inc. and Allen Parker
(Filed as Exhibit 10.1 to Zillow Group, Inc.’s Current Report on Form 8-K filed with the Securities and
Exchange Commission on November 6, 2018, and incorporated herein by reference).
10.60*
Amended and Restated Executive Employment Agreement, dated November 13, 2018, between Zillow
Group, Inc. and Allen Parker (Filed as Exhibit 10.1 to Zillow Group, Inc.’s Current Report on Form 8-K filed
with the Securities and Exchange Commission on November 14, 2018, and incorporated herein by
reference).
16.1
Letter of Ernst & Young LLP, dated August 4, 2016 (Filed as Exhibit 16.1 to Registrant’s Current Report on
Form 8-K filed with the Securities and Exchange Commission on August 4, 2016, and incorporated herein by
reference).
16.2
Letter of Ernst & Young LLP, dated February 7, 2017 (Filed as Exhibit 16.1 to Registrant’s Current Report
on Form 8-K/A filed with the Securities and Exchange Commission on February 10, 2017, and incorporated
herein by reference).
21.1 Subsidiaries of Zillow Group, Inc.
23.1 Consent of independent registered public accounting firm.
23.2 Consent of Ernst & Young LLP, independent registered public accounting firm.
31.1
Certification of Chief Executive Officer pursuant to Rule 13-14(a) of the Securities Exchange Act of 1934 as
adopted pursuant to Section 302 of the Sarbanes-Oxley Act of 2002.
31.2
Certification of Chief Financial Officer pursuant to Rule 13-14(a) of the Securities Exchange Act of 1934 as
adopted pursuant to Section 302 of the Sarbanes-Oxley Act of 2002.
32.1
Certification of Chief Executive Officer Pursuant to 18 U.S.C. Section 1350 as adopted pursuant to
Section 906 of the Sarbanes-Oxley Act of 2002.
32.2
Certification of Chief Financial Officer Pursuant to 18 U.S.C. Section 1350 as adopted pursuant to
Section 906 of the Sarbanes-Oxley Act of 2002.
101.INS XBRL Instance Document.
101.SCH XBRL Taxonomy Extension Schema Document.
101.CAL XBRL Taxonomy Extension Calculation Linkbase Document.
101.DEF XBRL Taxonomy Extension Definition Linkbase Document.

144
Exhibit
Number Description
101.LAB XBRL Taxonomy Extension Label Linkbase Document.
101.PRE
XBRL Taxonomy Extension Presentation Linkbase Document.
* Indicates a management contract or compensatory plan or arrangement.
+
Schedules omitted pursuant to Item 601(b)(2) of Regulation S-K. Zillow Group agrees to furnish a supplemental copy of any omitted
schedule to the Securities and Exchange Commission upon request.
Item 16. Form 10-K Summary.
None.

145
SIGNATURES
Pursuant to the requirements of Section 13 or 15(d) of the Securities Exchange Act of 1934, the registrant has duly caused
this report to be signed on its behalf by the undersigned, thereunto duly authorized.
ZILLOW GROUP, INC.
Date: February 21, 2019 By: /s/ JENNIFER ROCK
Name: Jennifer Rock
Title: Chief Accounting Officer
Pursuant to the requirements of the Securities Exchange Act of 1934, this report has been signed below by the following
persons on behalf of the registrant and in the capacities indicated below on February 21, 2019.
Signature Title
/s/ SPENCER M. RASCOFF Chief Executive Officer (Principal Executive Officer) and
Director Spencer M. Rascoff
/s/ ALLEN PARKER Chief Financial Officer (Principal Financial Officer)
Allen Parker
/s/ JENNIFER ROCK Chief Accounting Officer (Principal Accounting Officer)
Jennifer Rock
/s/ RICHARD BARTON Executive Chairman and Director
Richard Barton
/s/ LLOYD D. FRINK Vice Chairman, President and Director
Lloyd D. Frink
/s/ ERIK BLACHFORD Director
Erik Blachford
/s/ APRIL UNDERWOOD Director
April Underwood
/s/ JAY C. HOAG Director
Jay C. Hoag
/s/ GREGORY B. MAFFEI Director
Gregory B. Maffei
/s/ GORDON STEPHENSON Director
Gordon Stephenson
/s/ AMY BOHUTINSKY Director
Amy Bohutinsky

This annual report contains forward-looking statements within the meaning of Section 27A of the Securities Act of 1933 and Section 21E of the Securities Exchange Act of 1934 that involve risk and uncertainties, including the statements regarding our belief about our plans, objectives, expectations, strategies, intentions or other characterizations of future events or circumstances. Statements containing words such as “may,” “believe,” “anticipate,” “expect,” “intend,” “plan,” “project,” “will,” “projections,” “continue,” “business outlook,” “forecast,” “estimate,” “outlook,” “guidance,” or similar expressions constitute forward-looking statements. Di�erences in Zillow Group’s actual results from those described in these forward-looking statements may result from actions taken by us as well as from risk and uncertainties beyond our control. Factors that may contribute to such di�erences include, but are not limited to, those discussed under the heading “Risk Factors” in this Annual Report on Form 10-K for the fiscal year ended December 31, 2018, filed with the Securities and Exchange Commission, or SEC, and in our other filings with the SEC. Except as may be required by law, we do not intend, and undertake no duty, to update this information to reflect future events or circumstances.
Richard N. Barton Co-Founder and Chief Executive O�cer, Zillow Group, Inc.
Jay C. Hoag 2
General Partner,TCV
Gordon Stephenson 1, 3
Co-Founder and Managing Broker,Real Property Associates
Amy C. BohutinskyFormer Chief Operating O�cer,Zillow Group, Inc.
Gregory B. Ma�ei 1
President and Chief Executive O�cer,Liberty Media Corporation
April Underwood 2
Founding Partner,#Angels
Board Committees1 Audit Committee 2 Compensation Committee 3 Nominating and Governance Committee
Lloyd D. FrinkCo-Founder, Executive Chairmanand President, Zillow Group, Inc.
Spencer M. Rasco�Co-Founder and Former Chief Executive O�cer,Zillow Group, Inc.
Erik Blachford 1, 2, 3
Venture Partner,TCV
Richard N. BartonCo-Founder and Chief Executive O�cer
Stanley B. HumphriesChief Analytics O�cer
Jennifer A. RockChief Accounting O�cer
Dan SpauldingChief People O�cer
Jeremy WacksmanPresident, Zillow Brand
Lloyd D. FrinkCo-Founder, Executive Chairman and President
Allen W. ParkerChief Financial O�cer
Bradley D. OwensGeneral Counsel and Secretary
Aimee JohnsonChief Marketing O�cer
Dawn LyonChief Corporate Relations O�cer
Errol G. SamuelsonChief Industry Development O�cer
David A. BeitelChief Technology O�cer
Arik Y. PrawerPresident, Homes Division
Greg M. SchwartzPresident, Media and Marketplaces
Board of Directors
Executive Team
Annual Shareholder MeetingJune 4, 2019 | 9:00 a.m.O�ces of Perkins Coie LLP1201 Third Avenue49th FloorSeattle, Washington 98101
Transfer AgentComputershareP.O. Box 505000Louisville, KY 40233(866) 641–4276
NASDAQ ListingClass A common stock symbol - ZGClass C capital stock symbol - Z
Investor [email protected]
Independent AccountantsDeloitte & Touche LLPSeattle, Washington
Corporate Headquarters1301 Second Avenue, Floor 31Seattle, Washington 98101www.zillowgroup.com
Shareholder InformationThis annual report contains forward-looking statements within the meaning of Section 27A of the Securities Act of 1933 and Section 21E of the Securities Exchange Act of 1934 that involve risk and uncertainties, including the statements regarding our belief about our plans, objectives, expectations, strategies, intentions or other characterizations of future events or circumstances. Statements containing words such as “may,” “believe,” “anticipate,” “expect,” “intend,” “plan,” “project,” “will,” “projections,” “continue,” “business outlook,” “forecast,” “estimate,” “outlook,” “guidance,” or similar expressions constitute forward-looking statements. Di�erences in Zillow Group’s actual results from those described in these forward-looking statements may result from actions taken by us as well as from risk and uncertainties beyond our control. Factors that may contribute to such di�erences include, but are not limited to, those discussed under the heading “Risk Factors” in this Annual Report on Form 10-K for the fiscal year ended December 31, 2018, filed with the Securities and Exchange Commission, or SEC, and in our other filings with the SEC. Except as may be required by law, we do not intend, and undertake no duty, to update this information to reflect future events or circumstances.
Richard N. Barton Co-Founder and Chief Executive O�cer, Zillow Group, Inc.
Jay C. Hoag 2
General Partner,TCV
Gordon Stephenson 1, 3
Co-Founder and Managing Broker,Real Property Associates
Amy C. BohutinskyFormer Chief Operating O�cer,Zillow Group, Inc.
Gregory B. Ma�ei 1
President and Chief Executive O�cer,Liberty Media Corporation
April Underwood 2
Founding Partner,#Angels
Board Committees1 Audit Committee 2 Compensation Committee 3 Nominating and Governance Committee
Lloyd D. FrinkCo-Founder, Executive Chairmanand President, Zillow Group, Inc.
Spencer M. Rasco�Co-Founder and Former Chief Executive O�cer,Zillow Group, Inc.
Erik Blachford 1, 2, 3
Venture Partner,TCV
Richard N. BartonCo-Founder and Chief Executive O�cer
Stanley B. HumphriesChief Analytics O�cer
Jennifer A. RockChief Accounting O�cer
Dan SpauldingChief People O�cer
Jeremy WacksmanPresident, Zillow Brand
Lloyd D. FrinkCo-Founder, Executive Chairman and President
Allen W. ParkerChief Financial O�cer
Bradley D. OwensGeneral Counsel and Secretary
Aimee JohnsonChief Marketing O�cer
Dawn LyonChief Corporate Relations O�cer
Errol G. SamuelsonChief Industry Development O�cer
David A. BeitelChief Technology O�cer
Arik Y. PrawerPresident, Homes Division
Greg M. SchwartzPresident, Media and Marketplaces
Board of Directors
Executive Team
Annual Shareholder MeetingJune 4, 2019 | 9:00 a.m.O�ces of Perkins Coie LLP1201 Third Avenue49th FloorSeattle, Washington 98101
Transfer AgentComputershareP.O. Box 505000Louisville, KY 40233(866) 641–4276
NASDAQ ListingClass A common stock symbol - ZGClass C capital stock symbol - Z
Investor [email protected]
Independent AccountantsDeloitte & Touche LLPSeattle, Washington
Corporate Headquarters1301 Second Avenue, Floor 31Seattle, Washington 98101www.zillowgroup.com
Shareholder Information

Annual Report 2018
Annual Report 2018
Annual Report 2018