zigbee based wireless data acquisition using labview for implementing smart driving skill evaluation...
DESCRIPTION
The Smart Driving Skill Evaluation (SDSE) System presented in this paper expedite the testing of candidates aspiring for a driving license in a more efficient and transparent manner, as compared to the present manual testing procedure existing in most parts of Asia and Pacific region. The manual test procedure is also subjected to multiple limitations like time consuming, costly and heavily controlled by the experience of examiner in conducting the test. This technological solution is developed by customizing 8051 controller based embedded system and LabVIEW based virtual instrument. The controller module senses the motion of the test vehicle on the test track referred to as zero rpm measurement and the LabVIEW based virtual instrument provides a Graphical User Interface for remote end monitoring of the sensors embedded on the test track. The proposed technological solution for the automation of existing manual test process enables the elimination of human intervention and improves the driving test accuracy while going paperless with Driving Skill Evaluation System. As a contribution to the society this technological solution can reduce the number of road accidents because most accidents results from lack of planning, anticipation and control which are highly dependent on driving skill.TRANSCRIPT

International Journal of Instrumentation and Control Systems (IJICS) Vol.3, No.3, July 2013
DOI : 10.5121/ijics.2013.3301 1
ZIGBEE BASED WIRELESS DATA ACQUISITION
USING LABVIEW FOR IMPLEMENTING SMART
DRIVING SKILL EVALUATION SYSTEM
Mohit John1 and Arun Joseph
2
Department of Applied Electronics and Instrumentation Engineering,
St. Joseph College of Engineering and Technology
Palai, Kerala, India [email protected]
ABSTRACT
The Smart Driving Skill Evaluation (SDSE) System presented in this paper expedite the testing of
candidates aspiring for a driving license in a more efficient and transparent manner, as compared to the
present manual testing procedure existing in most parts of Asia and Pacific region. The manual test
procedure is also subjected to multiple limitations like time consuming, costly and heavily controlled by the
experience of examiner in conducting the test. This technological solution is developed by customizing 8051
controller based embedded system and LabVIEW based virtual instrument. The controller module senses
the motion of the test vehicle on the test track referred to as zero rpm measurement and the LabVIEW based
virtual instrument provides a Graphical User Interface for remote end monitoring of the sensors embedded
on the test track. The proposed technological solution for the automation of existing manual test process
enables the elimination of human intervention and improves the driving test accuracy while going
paperless with Driving Skill Evaluation System. As a contribution to the society this technological solution
can reduce the number of road accidents because most accidents results from lack of planning, anticipation
and control which are highly dependent on driving skill.
KEYWORDS
LabVIEW, Microcontroller, ZigBee, Data Acquisition , Sensors, E-application, GUI & Driving Skill.
1. BACKGROUND
Despite continued efforts made by the different state governments in India, various international
and national organizations continue to highlight the fatalities on the roads caused by inconsistent
process of issuing driving licenses across India. The study conducted by the International Finance
Corporation (IFC) indicates that the process of obtaining driving license in India is a distorted
bureaucratic one. The independent survey conducted shows that close to 60 percent of license
holders did not even have to take the driving license test and 54 percent of them were untrained
todrive [1]. The study conducted by IFC also shows that the driving license is in that category of
public services that involves corruption of a direct demand and supply of bribes between citizens
and bureaucrats. The study also indicates that the corruption is focused on agents that work as
intermediaries between the officials and citizens. This practice of agent-usage promotes
corruption and subsequently results in higher payment for licenses, reduces driving test quality
and this eventually results in unskilled drivers on road [1-2]. According to recent studies
conducted in the US and UK have shown that about 95 percent of the road accidents are due to
poor driving skills [3-4]. Hence the only solution for this problem is to implement an efficient,
transparent and cost effective driver testing system.

International Journal of Instrumentation and Control Systems (IJICS) Vol.3, No.3, July 2013
2
2. EXISTING TEST APPROACH
In the present scenario, the candidates who have applied for driving license have to appear for a
theoretical examination and a practical examination. The theoretical examination evaluates the
candidate knowledge on different traffic signs, traffic regulation and also the basic understanding
of simple safety check before using a vehicle. Different ways are adopted for the conduct of
theoretical examination. These are oral examination, question paper or computer based
examination. Theoretical examination is conducted before the practical examination [5]. A pass
inthe theoretical examination is a prerequisite for the practical examination.
The practical examination comprises of two tests namely off-road test and on-road test. The off-
road test is for examining the candidate’s ability in controlling the vehicle. The on-road test is
conducted in light traffic on normal road [3-5]. Normally, the on-road test is carried out after
completing off-road test. The off-road test is performed on specially designed track, which are
shown below.
Figure 1. Types of off-road test track
The off-road test tracks are of three types – H, S and 8 shaped tracks. In India, the test track
adopted for off-road test purpose varies from state to state. For example, the state of Kerala
performs the off-road test using H- shaped track whereas the state of Karnataka performs off-
road test using 8-shaped track. In most cases the evaluation of off-road test is done by human
intervention. Hence the test result will be highly dependent on the subjective opinion of the
examiner which is inconsistent. Hence to make the driving skill evaluation more transparent,
consistent and efficient, the paper proposes a smart and automated system for driving skill
evaluation.
3. SDSE SYSTEM SIGNIFICANCE AND FEATURES
The existing manual driving test procedure has got several limitations which demand the need for
automated and smart driving skill testing system. The drawbacks of manual driving skill test are
that the multiple examiners at locations evaluate the candidate’s driving on subjective assessment,
which leaves a scope for manipulation and negotiation [5]. Secondly the test results are paper
documented, requiring storage space. These drawbacks can be eliminated with the SDSE system
presented in this paper. The SDSE system also offers several advantages like total transparency,
the consistency in test process, ensures selection only on merit and also prevents untrained drivers
from getting into the system.
International Journal of Instrumentation and Control Systems (IJICS) Vol.3, No.3, July 2013
3
The SDSE is designed with a number of features like special tracks with sensors embedded in the
track, real data transfer to central monitoring and result issuance system and on completion of the
test, the results are printed and handed over to candidate immediately.
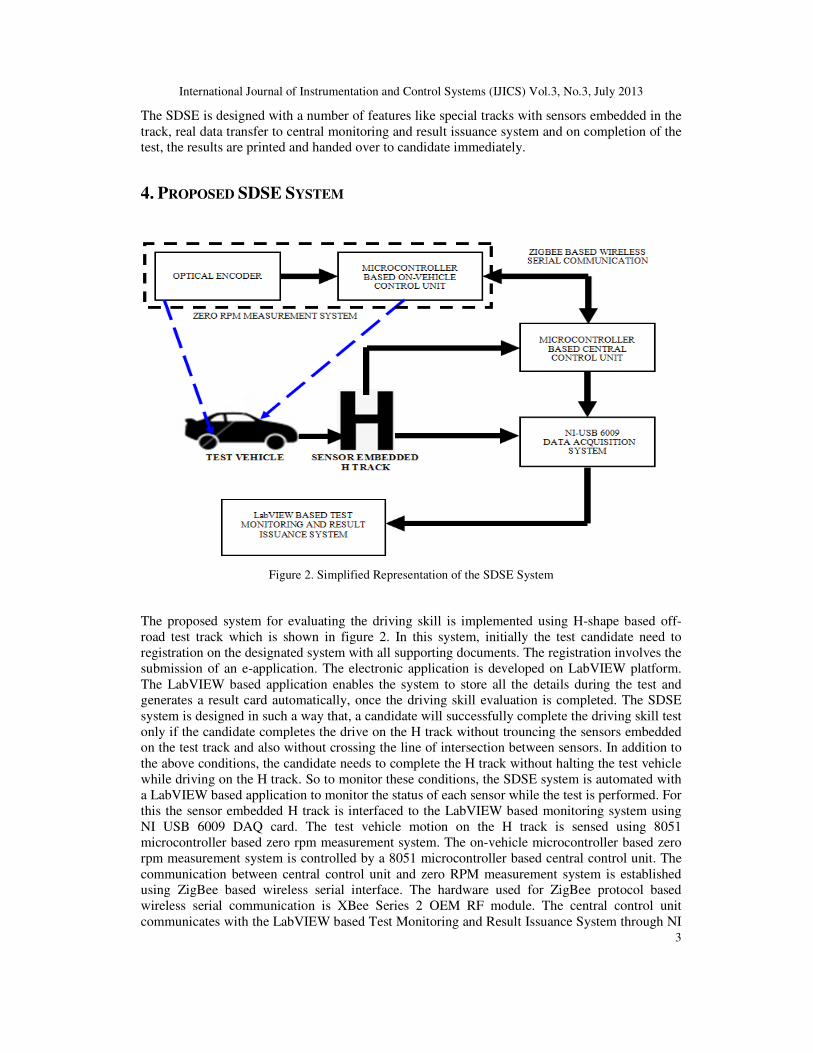
4. PROPOSED SDSE SYSTEM
Figure 2. Simplified Representation of the SDSE System
The proposed system for evaluating the driving skill is implemented using H-shape based off-
road test track which is shown in figure 2. In this system, initially the test candidate need to
registration on the designated system with all supporting documents. The registration involves the
submission of an e-application. The electronic application is developed on LabVIEW platform.
The LabVIEW based application enables the system to store all the details during the test and
generates a result card automatically, once the driving skill evaluation is completed. The SDSE
system is designed in such a way that, a candidate will successfully complete the driving skill test
only if the candidate completes the drive on the H track without trouncing the sensors embedded
on the test track and also without crossing the line of intersection between sensors. In addition to
the above conditions, the candidate needs to complete the H track without halting the test vehicle
while driving on the H track. So to monitor these conditions, the SDSE system is automated with
a LabVIEW based application to monitor the status of each sensor while the test is performed. For
this the sensor embedded H track is interfaced to the LabVIEW based monitoring system using
NI USB 6009 DAQ card. The test vehicle motion on the H track is sensed using 8051
microcontroller based zero rpm measurement system. The on-vehicle microcontroller based zero
rpm measurement system is controlled by a 8051 microcontroller based central control unit. The
communication between central control unit and zero RPM measurement system is established
using ZigBee based wireless serial interface. The hardware used for ZigBee protocol based
wireless serial communication is XBee Series 2 OEM RF module. The central control unit
communicates with the LabVIEW based Test Monitoring and Result Issuance System through NI

International Journal of Instrumentation and Control Systems (IJICS) Vol.3, No.3, July 2013
4
USB 6009 DAQ card. In this application NI USB 6009 DAQ card digital I/O lines are used.
Among the twelve digital I/O lines available in the DAQ card, eight I/O lines are used for
interfacing eight sensor pairs (T1-R1 to T8-R8) embedded in the H track and one I/O line for
interfacing with the central control unit.
4.1. Sensor Embedded H Track
The H track for the off-road test is monitored using the LabVIEW based remote system by
embedding photo sensors on to the H track with the following measurement shown in figure 3.
Figure 3. H track Layout
The drive on the H track is said to be complete only when the test candidate takes all the paths –
1, 2, 3 and 4 as shown in figure 3. The sensor embedded H track is implemented using Rif50
photo sensors. Rif50 photo sensors are referred to as synchronized, self-aligning photocells. Self-
aligning feature makes the sensor pairs free from centering problem. Synchronism feature allows
the installation of two pairs of very close photocells, without the problem of interference with one
another. It is also unaffected by the interference of sunlight and has shockproof polycarbonate
body.
Table 1. Rif50 Specification
Parameter Value
Dimension 89x55x24 mm
Optical Range 25m
Power Supply 12 – 24 Vdc
Signal Modulated infrared 833 Hz, λ = 950nm
Relay Contact 1 A max 30 Vdc
Absorption TX 20mA RX 25mA
Operating Temperature -20oC / +60 oC

International Journal of Instrumentation and Control Systems (IJICS) Vol.3, No.3, July 2013
5
The photo sensors are used as pairs where each pair consists of a transmitter and a receiver. The
Rif50 photo sensors can be also referred to as a long range IR transmitter receiver pair. The Rif50
photo sensors are mounted on to yardstick for embedding on the H track. A yard stick mounted
with the photo sensor is shown in figure 4.
Figure 4. Rif50 photo sensor mounted yard stick
The layout for the photo sensor mounted yard stick embedded on the H track is shown in figure 5.
Figure 5. Layout for sensor embedded H track
Sensor embedded H track is implemented using twelve pairs of Rif50 photo sensors. Among the
twelve sensor pairs, the eight sensor pairs labelled as T1-R1 to T8-R8 are for detecting the
trouncing of sensor mounted yardstick or the crossing of line intersection between the sensor
International Journal of Instrumentation and Control Systems (IJICS) Vol.3, No.3, July 2013
6
pairs. These sensors are interfaced to LabVIEW based Test Monitoring and Result Issuance
system using NI USB 6009 DAQ card. The function of the four sensor pairs labelled as T9-R9 to
T12-R12 is to enable or disable of zero rpm measurement system. These sensors are interfaced to
the microcontroller based central control unit. When either of these sensor pairs makes a high to
low transition, the microcontroller based central control unit enables or disables the
microcontroller based on-vehicle control unit for monitoring the vehicle motion. The on-vehicle
control unit for zero rpm measurement is designed to perform the measurement only when the
vehicle is inside the sensor embedded H track. In other words, the on-vehicle control unit for zero
rpm measurement is enabled only when the test vehicle is inside the H track and it is disabled
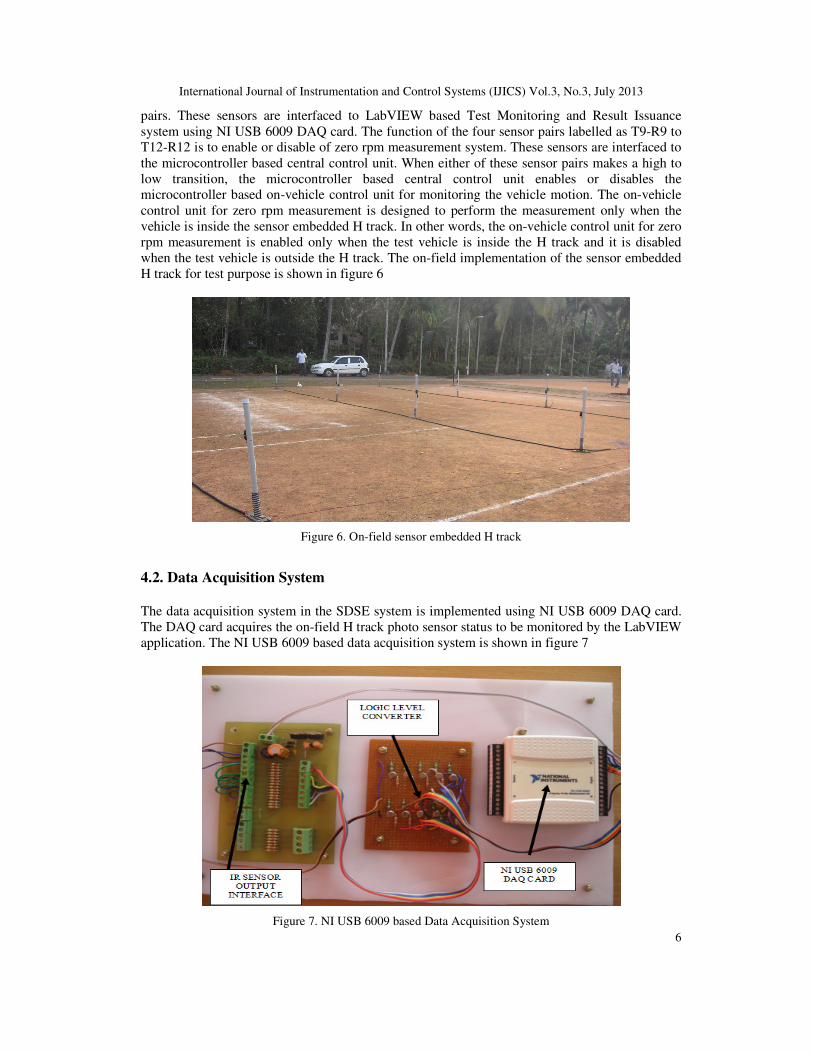
when the test vehicle is outside the H track. The on-field implementation of the sensor embedded
H track for test purpose is shown in figure 6
Figure 6. On-field sensor embedded H track
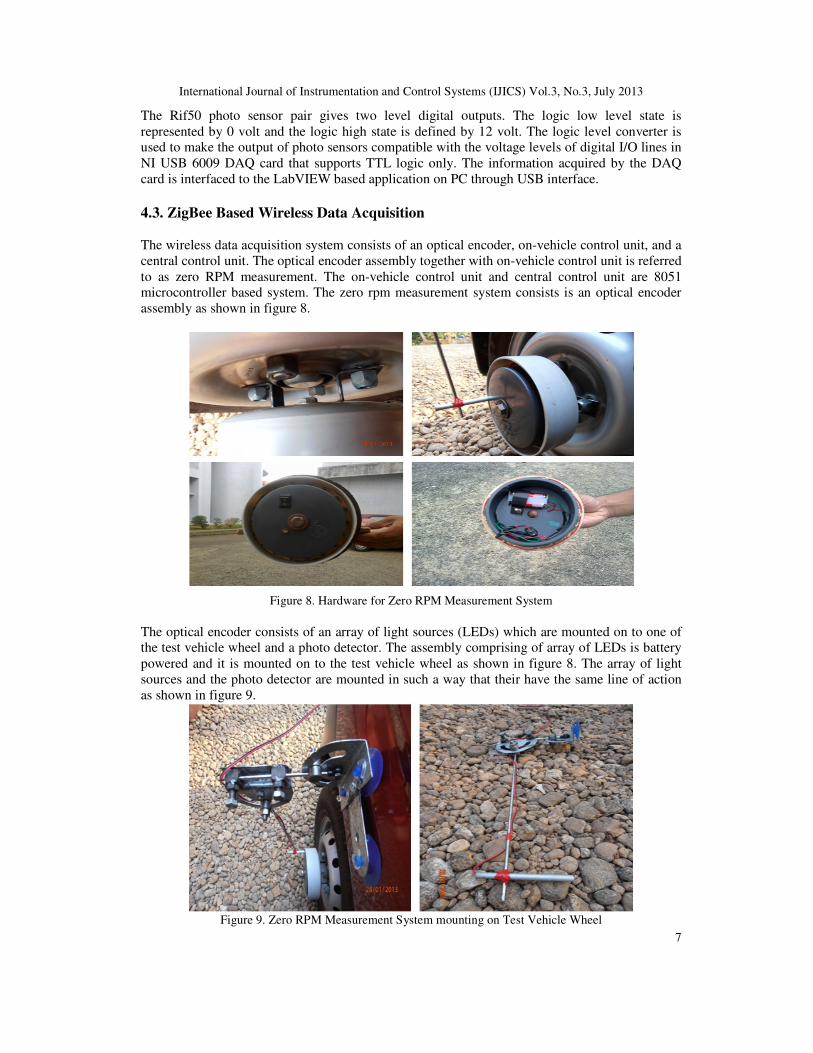
4.2. Data Acquisition System
The data acquisition system in the SDSE system is implemented using NI USB 6009 DAQ card.
The DAQ card acquires the on-field H track photo sensor status to be monitored by the LabVIEW
application. The NI USB 6009 based data acquisition system is shown in figure 7
Figure 7. NI USB 6009 based Data Acquisition System
International Journal of Instrumentation and Control Systems (IJICS) Vol.3, No.3, July 2013
7
The Rif50 photo sensor pair gives two level digital outputs. The logic low level state is
represented by 0 volt and the logic high state is defined by 12 volt. The logic level converter is
used to make the output of photo sensors compatible with the voltage levels of digital I/O lines in
NI USB 6009 DAQ card that supports TTL logic only. The information acquired by the DAQ
card is interfaced to the LabVIEW based application on PC through USB interface.
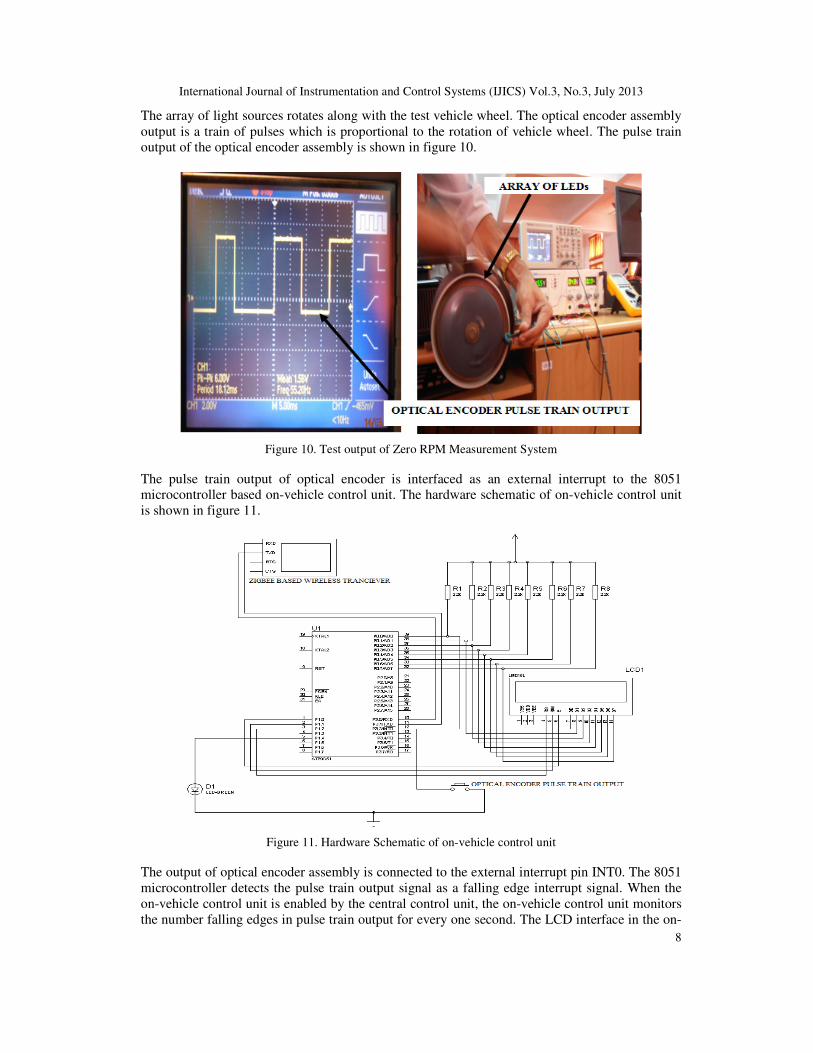
4.3. ZigBee Based Wireless Data Acquisition
The wireless data acquisition system consists of an optical encoder, on-vehicle control unit, and a
central control unit. The optical encoder assembly together with on-vehicle control unit is referred
to as zero RPM measurement. The on-vehicle control unit and central control unit are 8051
microcontroller based system. The zero rpm measurement system consists is an optical encoder
assembly as shown in figure 8.
Figure 8. Hardware for Zero RPM Measurement System
The optical encoder consists of an array of light sources (LEDs) which are mounted on to one of
the test vehicle wheel and a photo detector. The assembly comprising of array of LEDs is battery
powered and it is mounted on to the test vehicle wheel as shown in figure 8. The array of light
sources and the photo detector are mounted in such a way that their have the same line of action
as shown in figure 9.
Figure 9. Zero RPM Measurement System mounting on Test Vehicle Wheel
International Journal of Instrumentation and Control Systems (IJICS) Vol.3, No.3, July 2013
8
The array of light sources rotates along with the test vehicle wheel. The optical encoder assembly
output is a train of pulses which is proportional to the rotation of vehicle wheel. The pulse train
output of the optical encoder assembly is shown in figure 10.
Figure 10. Test output of Zero RPM Measurement System
The pulse train output of optical encoder is interfaced as an external interrupt to the 8051
microcontroller based on-vehicle control unit. The hardware schematic of on-vehicle control unit
is shown in figure 11.
Figure 11. Hardware Schematic of on-vehicle control unit
The output of optical encoder assembly is connected to the external interrupt pin INT0. The 8051
microcontroller detects the pulse train output signal as a falling edge interrupt signal. When the
on-vehicle control unit is enabled by the central control unit, the on-vehicle control unit monitors
the number falling edges in pulse train output for every one second. The LCD interface in the on-

International Journal of Instrumentation and Control Systems (IJICS) Vol.3, No.3, July 2013
9
vehicle control unit displays the enabling/disabling signal send by central control unit. The central
control unit enables the on-vehicle control unit by sending the character ‘E’ and disables by
sending the character ‘D’ through ZigBee based Wireless serial interface [6-9]. The information
send by central control unit to enable/disable the on-vehicle control unit will be displayed on to
the LCD interface available in the on-vehicle control unit as shown in figure 12.
Figure 12. Information displayed on vehicle control unit LCD
The number of falling edges in the pulse train output of optical encoder is proportional to the
rotational speed of the test vehicle wheel. Hence when the test vehicle wheel is stationary there
will be no pulse train output from the optical encoder assembly and hence the number of falling
edges detected will be zero. The on-vehicle control unit is designed to signal the central control
unit through the ZigBee based wireless serial interface [8] when no falling edge is detected in one
second. The hardware schematic of central control unit is shown in figure 13.
Figure 12. Hardware Schematic of central control unit
The communication between the central control unit and on-vehicle control unit is bidirectional
wireless serial communication using ZigBee protocol [8-11]. The central control unit also
monitors the four photo sensor pairs T9-R9 to T12-R12 to determine the presence of the test
vehicle on the H track. The microcontroller based system determines the presence of the test
vehicle by counting the number of High to Low transition output signal of photo sensor pairs (T9-
R9 to T12-R12). These four photo sensor pairs are connected to INT1 pin of 8051 microcontroller
using a logical OR gate circuit. The central control unit communicates with the on-vehicle
control unit for enabling or disabling the zero RPM measurement. Zero RPM measurement is
enabled only when the test vehicle is inside the H track. From figures 3 and 4, it can be said that
International Journal of Instrumentation and Control Systems (IJICS) Vol.3, No.3, July 2013
10
initially the test vehicle takes the path1 by crossing the line of action of the photo sensor pair T9-
R9. Now this photo sensor pair output makes a High to Low transition, which will be taken as a
falling edge interrupt signal – INT1 by the 8051 microcontroller. This High to Low transition
output in the T9-R9 photo sensor pair will be count one for the microcontroller. At the end of
path1, the test vehicle crosses the line of action of T10-R10 photo sensor pair. Now this photo
sensor pair output makes High to Low transition, which will be taken as a falling edge interrupt
signal – INT1 by the microcontroller and the internal count becomes two. Crossing the line of
action of the photo sensor pairs – T9-R9 and T10-R10, the test vehicle is said to complete path1.
Now the test vehicle takes the path2, by first crossing the line of action of the photo sensor pair
T10-R10, thereby producing a High to Low transition which will be taken as another falling edge
interrupt signal and now the internal count becomes three. The test vehicle completes path2, by
crossing the line of action of the photo sensor pair T12 – R12 and now the count becomes four.
Once the path2 is completed, the test vehicle starts with path3 by crossing the line of action of
photo sensor pair T12-R12. Now the internal count of the microcontroller becomes five. The
path3 is completed by crossing the line of action of photo sensor pair T11-R11 and thereby
changing the internal count value to six. Finally the test vehicle takes the path4 by first crossing
the line of action of T11-R11, which changes the count value to seven. The path4 is completed by
the test vehicle by crossing the line of action of photo sensor pair T12-R12 and thereby finally
making the count value to eight. From the above algorithm description, it is clear that when the
count value is one, three, five and seven, the vehicle is inside the H track. For these count values
the central control unit enables zero RPM measurement system by sending serially the character
E to the on-vehicle control unit. For the count values two, four, six, eight the test vehicle is said to
be outside the H track. Hence for these count values the central control unit disables the zero
RPM measurement system by sending serially the character D to the on-vehicle control unit.
During the enabled state of the on-vehicle control unit, if a zero falling edge signal is detected for
more than one second, then the on-vehicle control unit signals the central unit and the same will
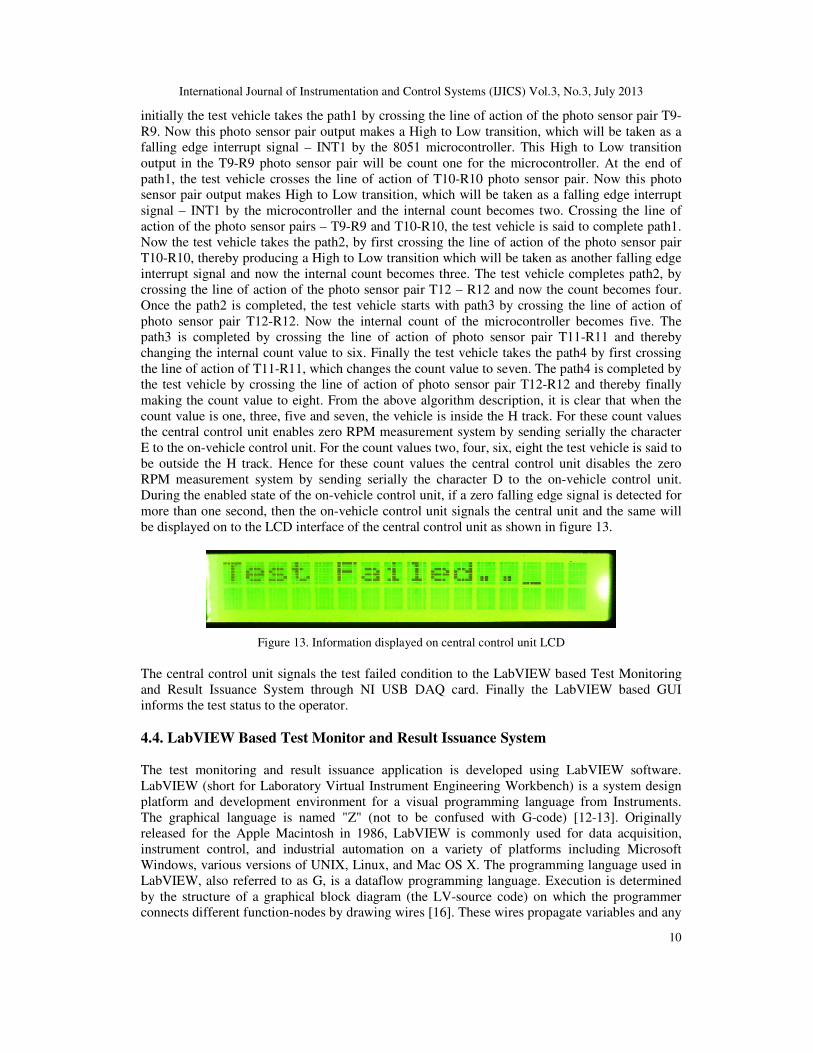
be displayed on to the LCD interface of the central control unit as shown in figure 13.
Figure 13. Information displayed on central control unit LCD
The central control unit signals the test failed condition to the LabVIEW based Test Monitoring
and Result Issuance System through NI USB DAQ card. Finally the LabVIEW based GUI
informs the test status to the operator.
4.4. LabVIEW Based Test Monitor and Result Issuance System
The test monitoring and result issuance application is developed using LabVIEW software.
LabVIEW (short for Laboratory Virtual Instrument Engineering Workbench) is a system design
platform and development environment for a visual programming language from Instruments.
The graphical language is named "Z" (not to be confused with G-code) [12-13]. Originally
released for the Apple Macintosh in 1986, LabVIEW is commonly used for data acquisition,
instrument control, and industrial automation on a variety of platforms including Microsoft
Windows, various versions of UNIX, Linux, and Mac OS X. The programming language used in
LabVIEW, also referred to as G, is a dataflow programming language. Execution is determined
by the structure of a graphical block diagram (the LV-source code) on which the programmer
connects different function-nodes by drawing wires [16]. These wires propagate variables and any
International Journal of Instrumentation and Control Systems (IJICS) Vol.3, No.3, July 2013
11
node can execute as soon as all its input data become available. Since this might be the case for
multiple nodes simultaneously, G is inherently capable of parallel execution. The LabVIEW
based test monitoring and result issuance application consist of two GUI. The first GUI is
designed for monitoring the status of photo sensor on the H track. This GUI monitors whether the
sensors are aligned or misaligned. The second LabVIEW based GUI is the e-application which
acquires test candidate’s details for generating the test result card soon after the test. The
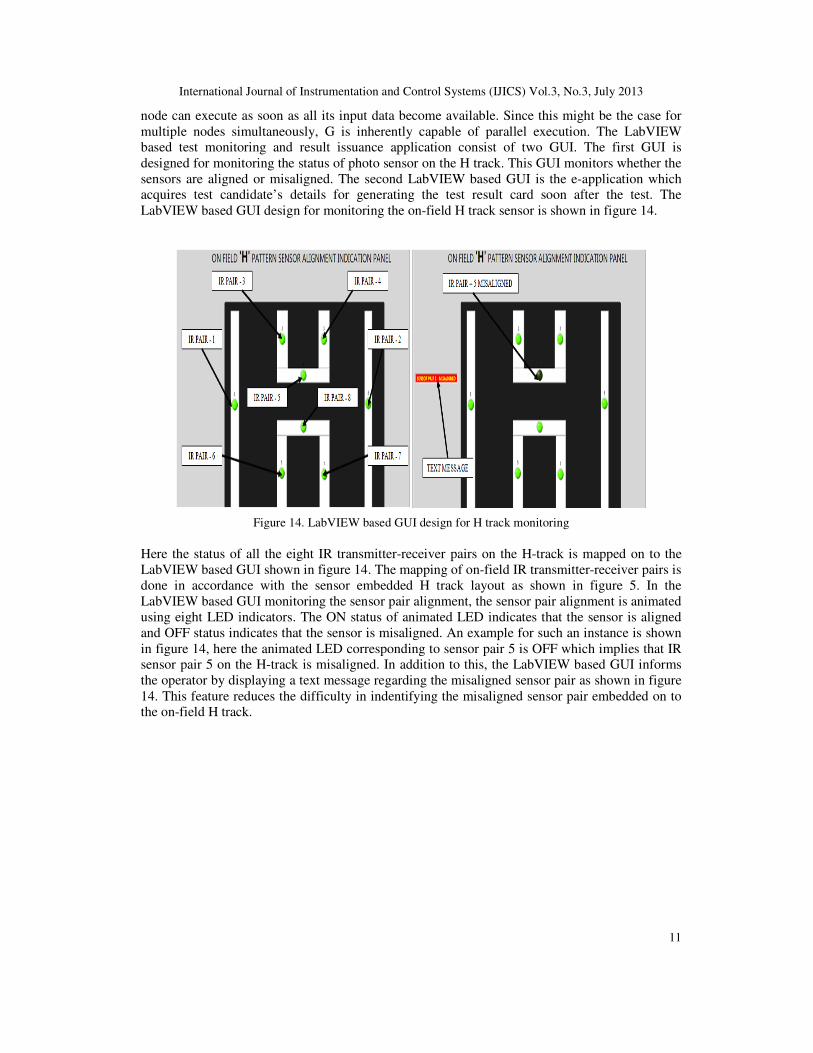
LabVIEW based GUI design for monitoring the on-field H track sensor is shown in figure 14.
Figure 14. LabVIEW based GUI design for H track monitoring
Here the status of all the eight IR transmitter-receiver pairs on the H-track is mapped on to the
LabVIEW based GUI shown in figure 14. The mapping of on-field IR transmitter-receiver pairs is
done in accordance with the sensor embedded H track layout as shown in figure 5. In the
LabVIEW based GUI monitoring the sensor pair alignment, the sensor pair alignment is animated
using eight LED indicators. The ON status of animated LED indicates that the sensor is aligned
and OFF status indicates that the sensor is misaligned. An example for such an instance is shown
in figure 14, here the animated LED corresponding to sensor pair 5 is OFF which implies that IR
sensor pair 5 on the H-track is misaligned. In addition to this, the LabVIEW based GUI informs
the operator by displaying a text message regarding the misaligned sensor pair as shown in figure
14. This feature reduces the difficulty in indentifying the misaligned sensor pair embedded on to
the on-field H track.

International Journal of Instrumentation and Control Systems (IJICS) Vol.3, No.3, July 2013
12
Figure 15. LabVIEW based GUI design for e-application
The LabVIEW based GUI for e-application accept the test candidate’s following personal details
– first name, middle name, last name, address for communication, date of birth and the gender.
The GUI for e-application designed on LabVIEW platform is shown in figure 15. The GUI for e-
application accepts test candidate information on pressing the START button only if all the photo
sensors pairs on the H track are properly positioned. When the sensor pairs on the H track are not
properly positioned, the GUI will show the message: SYSTEM READY – SENSORS
MISALIGNED as show in figure 15. When the entire sensor pairs on the H track are properly
aligned, the LabVIEW based GUI will show the message: SYSTEM ACTIVE – FILL IN
CANDIDATE DETAILS as shown in figure 16.
Figure 16. Error(s) in submitted LabVIEW based GUI design
The LabVIEW based GUI is designed to identify error(s) in the submitted e-application. The
error(s) that are identified by the LabVIEW based e-application are blank data fields which are
mandatory, incorrect gender, incorrect date of birth and incorrect pin code. On submitting an e-
application with these incorrect information by pressing START button will generate a pop up

International Journal of Instrumentation and Control Systems (IJICS) Vol.3, No.3, July 2013
13
window as shown in figure 16. The pop up window will inform the operator about all the
incorrect information in the submitted e-application.
Figure 17. Incorrect fields cleared on pressing OK button
On pressing the OK button in the pop up window, all the incorrect fields in the LabVIEW based
GUI will be cleared while retaining the correct fields in the e-application which is shown in
figure17. To continue with the driving skill test process, the e-application should be submitted
successfully. If all the information fields in the LabVIEW based e-application is completed
correctly, then on pressing the START button another pop up window appears as shown in figure
18.
Figure 18. Successfully completed LabVIEW based e-application
With the successfully completed LabVIEW based e-application the user has to acknowledge by
pressing the OK button on the pop up window as shown in figure 18. On pressing the OK button,
the system will give an option for the user to cancel or continue further with the driving skill
evaluation process as shown in figure 19. To continue with the test process the user has to press

International Journal of Instrumentation and Control Systems (IJICS) Vol.3, No.3, July 2013
14
the SUBMIT button and to terminate the test process press the CANCEL button. When the
CANCEL button is pressed, all the fields in the e-application will be cleared for the registration of
next test candidate.
Figure 19. Submit and Cancel option with LabVIEW based e-application
On pressing the SUBMIT button, the information regarding the test candidate will be recorded
with the system for the generation of test result card, after which the candidate can move to the
test vehicle to drive on sensor embedded H-track. During the driving on the sensor embedded H
track, if the test candidate trounces any of the sensors or crosses the line of intersection between
the sensors or even stop the test vehicle while the drive on the H track is progressing then the
LabVIEW based GUI will display: TEST FAILED as shown in figure 20.
Figure 20. LabVIEW based GUI with TEST FAILED status
In addition to the failed test status, the LabVIEW based e-application also indicates the reason for
failure. If the test failure is due to trouncing of sensors or crossing the line of intersection between
the sensors, then the following message will be displayed: SENSORS MISALIGNED – TEST

International Journal of Instrumentation and Control Systems (IJICS) Vol.3, No.3, July 2013
15
FINISHED. If the test failure is due to vehicle stoppage then the following message will be
displayed: VEHICLE HALT – TEST FINISHED. Now if the test candidate has successfully
completed the drive on the sensor embedded H track, then the STOP button has to be pressed. On
pressing the STOP button, then the test status will be displayed as TEST PASSED on the
LabVIEW based GUI as shown in figure 21.
Figure 21. LabVIEW based GUI with TEST PASSED status
As soon as the test status is displayed on the LabVIEW based GUI, another pop window appears
asking for test report generation. If the test result card needs to be generated then the YES button
has to be pressed and if not then the STOP button has to be pressed. On pressing the YES button,
the system will ask the operator for saving the test report as a MS word document with file
extension .doc and the location where the file has to be saved as shown in figure 22.
Figure 22. Saving the Test Report
Once the test report is saved the system automatically initializes and makes the LabVIEW based
e-application ready for the registration of next test candidate. If the NO button is pressed then the
International Journal of Instrumentation and Control Systems (IJICS) Vol.3, No.3, July 2013
16
system will not save the test report and instead directly makes the LabVIEW based e-application
ready for the next test candidate. During the initialization it clears all the fields of e-application
and checks whether all the sensors in the automated H-field is aligned or not. The screen shot of
saved driving test result card is shown in figure 23. The test result card shows the date and time of
the test process, the test status whether passed or failed and finally shows all the personal details
of the test candidate given in the e-application during the registration process.
Figure 23. Screen shot of LabVIEW generated test result card
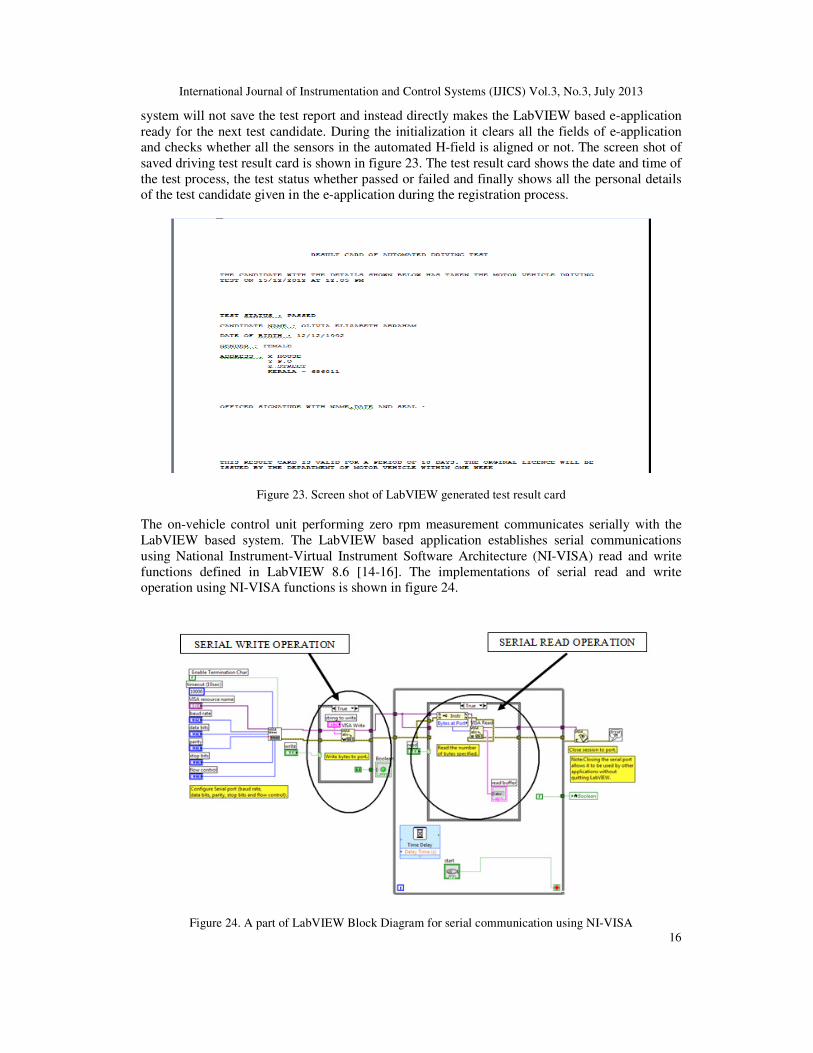
The on-vehicle control unit performing zero rpm measurement communicates serially with the
LabVIEW based system. The LabVIEW based application establishes serial communications
using National Instrument-Virtual Instrument Software Architecture (NI-VISA) read and write
functions defined in LabVIEW 8.6 [14-16]. The implementations of serial read and write
operation using NI-VISA functions is shown in figure 24.
Figure 24. A part of LabVIEW Block Diagram for serial communication using NI-VISA

International Journal of Instrumentation and Control Systems (IJICS) Vol.3, No.3, July 2013
17
The LabVIEW Block Diagram implementation for the GUI monitoring the sensor status on the
H-track is shown in figure 25.
Figure 25. A part of LabVIEW Block Diagram for monitoring sensor embedded H track
The LabVIEW Block Diagram implementation for the e-application GUI is shown in figure 26.
Figure 26. A part of LabVIEW Block Diagram for e-application

International Journal of Instrumentation and Control Systems (IJICS) Vol.3, No.3, July 2013
18
5. CONCLUSIONS
A Smart Driving Skill Evaluation (SDSE) system using ZigBee based wireless acquisition is
discussed. The usage of LabVIEW based technology for skill assessment in the automated driving
test process eliminates human intervention leaving no scope for manipulation and negotiation.
Hence we can say that the SDSE system increases the level of transparency in the driving skill
test process and decreases the rate of corruption in the process of issuing the driving license.
ACKNOWLEDGEMENTS
The authors would like to thank Mr. Babu Sanker S, Asst. Professor of the Mechanical
Engineering department, St. Joseph College of Engineering and Technology, Kerala for his ideas
in implementing this work.
REFERENCES
[1] Marianne Bertrand, Simeon Djankov, Remma Hanna and Sendhil Mullainathan, “Obtaining a
Driver’s License in India: An Experimental Approach to Studying Corruption”, The Quarterly
Journal of Economics (2007) 122 (4): 1639-1676.
[2] “Driver errors cause most road deaths in India”.The Times of India on the web. 2010 – 07-04.
[3] Government of India. Ministry of Road Transport and Highways. Road accidents in India:
2009,2011-08-23.
[4] India suffers from highest number of road accidents: WHO”. The Financial Express on the web.
2011-05-05.
[5] Mondal, P, Abhishek Kumar, U. D. Bhangale, and Dinesh Tyagi. “A Silent Tsunami on IndianRoad:
A Comprehensive Analysis of Epidemiological Aspects of Road Traffic Accidents”.British Journal
of Medicine & Medical Research: 1(1): 14-23, 2011. 2011-09-26.
[6] ShizhuangLin; JingyuLiu; YanjunFang; Wuhan Univ., Wuhan" ZigBee Based Wireless Sensor
Networks and Its Applications in Industrial”IEEE International Conference on Automation and
Logistics, 200718-21Aug.2007page(s):1979-1983Location:Jinan
[7] ZigBee Specification v1.0, ZigBee Alliance, December 14th, 2004.
[8] Xiuping Zhang; Guangjie Han; Changping Zhu; Yan Dou; Jianfeng Tao;” Research of
WirelessSensor Networks based on ZigBee for Miner Position”, [J] International Symposium on
Computer,Communication, Control and Automation, IEEE. 29 July 2010Pg1 – 5.
[9] Dunfan Ye, Daoli Gong, Wei Wang,“Application of Wireless Sensor Networks in
EnvironmentalMonitoring”2nd International Conference on Power Electronics and Intelligent
TransportationSystemIEEE2009pg 2563-2567
[10] Chen, B., Wu, M., Yao, S., & Binbin, N. (2006). ZigBee technology and its application on wireless
meter reading system. Industrial Informatics, 2006 IEEE International Conference on, August 2006,
1257-1260.
[11] Michal VARCHOLA, Milos DRUTAROVSK, “ZigBee based Home Automation Wireless
Network”, Acta Electrotechnica Informatica No.4 Vol.7, 2007. ISSN 1335-8243.
[12] Wells, Lisa & Jeffery Travis, “LabVIEW for Everyone”, Prentice-Hall, New Jersey, 1996.
[13] K D Schierbaum, M Cherradi and M Bouchtaoui, “Computer-control of surface science experiments
with LabVIEW”, International Journal of Computer Applications 3(4):1–8, June 2010.
[14] du Preez, S.J. Sinha, S. Hutton, M. Nat. Instrum., Midrand “A LabVIEW courseware customized for
precollege learners”, AFRICON 2007 , On page(s): 1 – 6, ISBN: 978-1-4244-0987-7, Digital Object
Identifier: 10.1109/AFRCON.2007.4401571, 26-28 Sept. 2007.
[15] Vento, J.A., “Application of LabVIEW in higher education laboratories”, Frontiers in Education
Conference, Digital Object Identifier: 10.1109/FIE.1988.35023, Austin, TX, USA, July 08, 2002.
[16] Rick Bitter, Taqi Mohiuddin, Matt Nawrocki, “LabVIEW Advanced Proagramming Technique”,
CRC Press, 2001.

International Journal of Instrumentation and Control Systems (IJICS) Vol.3, No.3, July 2013
19
Authors
Mohit John received his B.Tech degree in Electronics and Instrumentation
Engineering from College of Engineering Kidangoor affiliated to Cochin University of
Science and Technology Kerala, India and his M.Tech degree in Embedded Systems
from DOEACC – Calicut, affiliated to University of Calicut, India. Currently he is
working as an Assistant Professor in the department of Applied Electronics and
Instrumentation Engineering in St. Joseph College of Engineering and Technology
Kerala, India. His research interest includes Embedded System, RTOS, Power
Electronics, Automation and Digital System Design.
Arun Joaeph received his B.Tech degree in Applied Electronics and
Instrumentation Engineering from Rajagiri School of Engineering and Technology
Kakkanad affiliated to Mahatma Gandhi University Kerala, India and his M.E
degree in Control and Instrumentation from Karunya University, India. Currently he
is working as an Assistant Professor in the department of Applied Electronics and
Instrumentation Engineering in St. Joseph College of Engineering and Technology
Kerala, India. His research interest includes Process Control and Instrumentation,
Computer Aided Process Control, Data Acquisition, Virtual Instrumentation,
Automation and Control System