zheng han - comparison study of two disk brake systems used in motorcyles
TRANSCRIPT
COMPARISON STUDY OF TWO DISK BRAKE SYSTEMS USED IN
MOTORCYCLES
SUBMITTED BY
ZHENG HAN
DEPARTMENT OF MECHANICAL ENGINEERING
NATIONAL UNIVERSITY OF SINGAPORE
SESSION 2005/2006
Summary
SUMMARY
The objective of this final year project was to study and compare the mechanical
performances of a conventional brake-disk system and a newly designed Perimetral
brake-disk system using the finite element method (FEM).
Finite element (FE) models of the brake-disks were created using Pro-E and
simulated using ANSYS which is based on the finite element method (FEM). The
brake-disks were simulated under three different loading conditions: two static tests
(torsional and lateral strength simulation) and one thermal analysis (residual stress
simulation). Particular attention was given to the residual stress simulation for the
Perimetral brake-disk where a potential problem may arise due to its design.
Three-dimensional modelling and meshing using the simulation program ANSYS
were successfully implemented in this project, allowing for greater flexibility and
accuracy in the results achieved.
For the two static tests, the maximum stresses (weak points) were found to be at the
mounting holes for Perimetral brake-disk. Overall, the Perimetral brake-disk showed
good performance under the static tests, with stress values close to or lower than
those of the conventional brake-disk.
i
Summary
For the residual stress simulation, the maximum stresses concentrated at the piercing
holes for both brake-disks. For the Perimetral brake-disk, maximum stress values
were significantly higher than those found in the conventional brake-disk. These
maximum stresses occurred at its inner piercing holes (weak points). At these weak
points, there is the danger of yielding or crack initiation under repeat residual stresses.
Compared to the conventional brake-disk, the numbers of areas with localized stress
concentration were much higher in the Perimetral brake-disk. This indicated that the
number of potential points for crack initiation is higher for the Perimetral brake-disk
resulting in a higher risk of failure. It was also observed that high stress
concentrations occur at the piercing holes in-between the mounting holes, whereas
the piercing holes located directly below the mounting holes experienced much lower
stresses.
To counter the potential problem of failure under residual stress, several
countermeasures were proposed, modelled and analysed. Among them,
countermeasures 1, 3 and 5 were recommended to improve on the original design of
the Perimetral brake-disk.
In order to achieve more accurate results and better understanding of the Perimetral
brake-disk’s performance, the entire Perimetral brake system (including the rim and
tyres) should be incorporated for simulation.
ii
Acknowledgement
ACKNOWLEDGEMENT
I would like thank my parents, for without them, all these would not have been
possible. I would also like to thank Jaslyn for all her support and encouragement
during the course of this project.
I would like to express my sincere appreciation to all who helped in any way in the
preparation and completion of this final year project, especially the R&D engineers
from Sunstar Logistic Singapore Pte Ltd and his supervisor Associate Professor G. R.
Liu.
Special thanks must also be extended to Dr. Cai Chao from IHPC for his help and
guidance in the course of the project.
iii
Table of Contents
TABLE OF CONTENTS
SUMMARY……………………………………………………………………….. i
ACKNOWLEDGEMENT……………………………………………………….. iii
TABLE OF CONTENTS……………………………………………………….... iv
LIST OF FIGURES………………………………………………………………. vii
LIST OF TABLES………………………………………………………………... ix
LIST OF SYMBOLS……………………………………………………………... x
Chapter 1 Introduction……………………………………………………………1
1.1 Purpose……………………………………………………………………... 1
1.2 The Problem………………………………………………………………... 1
1.3 Scope……………………………………………………………………….. 4
1.4 Literature Survey…………………………………………………………....6
Chapter 2 Theory………………………………………………………………..... 10
2.1 Three-Dimensional Meshing………………………………………………..10
2.2 Techniques of 3D Meshing………………………………………………… 12
2.3 Stress Analysis Methods…………………………………………………… 13
Chapter 3 Experimental Procedures…………………………………………... 16
3.1 Pro-E Modelling…………………………………………………………….16
3.2 Simulation by ANSYS……………………………………………………... 17
3.3 Simulation Procedures……………………………………………………... 18
iv

Table of Contents
(a) Static Test – Torsional Strength Simulation……………………………. 18
Purpose of Test…………………………………………………….. 18
Assumptions………………………………………………………... 19
(b) Static Test – Lateral Strength Simulation……………………………… 20
Purpose of Test…………………………………………………….. 20
Assumptions………………………………………………………... 20
(c) Thermal Analysis – Residual Stress Simulation……………………….. 21
Purpose of Test…………………………………………………….. 21
Assumptions………………………………………………………... 22
Chapter 4 Experimental Results………………………………………………….24
4.1 Mesh Results……………………………………………………………….. 24
4.2 Simulation Results in ANSYS……………………………………………... 26
(a) Static Test – Torsional Strength Simulation…………………………… 26
(b) Static Test – Lateral Strength Simulation……………………………… 27
(c) Thermal Analysis – Residual Stress Simulation……………………….. 28
Chapter 5 Discussion……………………………………………………………... 30
(a) Static Test – Torsional Strength Simulation…………………………… 30
(b) Static Test – Lateral Strength Simulation……………………………… 32
(c) Thermal Analysis – Residual Stress Simulation……………………….. 33
Chapter 6 Final Analysis……………………………………………………….... 37
6.1 Proposed Countermeasure Designs…………………………………………38
(a) Changing the Width of the Brake-Disk: Countermeasures 1 and 2……. 38
(b) Changing the Shape of the Piercing Holes: Countermeasures 3 and 4.... 39
v
Table of Contents
(c) Joining the Piercing Holes: Countermeasures 5 and 6…………………. 40
6.2 Results of Countermeasures………………………………………………... 40
6.3 Interpretation of Results……………………………………………………. 42
Chapter 7 Conclusion………………………………...………………………….. 43
Chapter 8 Recommendations…………………………………………………….. 46
List of References…………………………………………………………………. 47
APPENDICES…………………………………………………………………….. 48
Appendix 1: Details of Design of Perimetral Brake-Disk System and its
Material Properties…………………………………………… 48
Appendix 2: Comparison of Braking Force………………………………... 50
Appendix 3: ANSYS Meshing Procedure…………………………………. 53
Appendix 4: Calculation of Maximum Torsional Force Experienced
During Hard Braking………………………………………….55
Appendix 5: ANSYS Procedure for Torsional Strength Simulation………. 58
Appendix 6: ANSYS Procedure for Lateral Strength Simulation…………. 59
Appendix 7: Calculation of Maximum Temperature in Brake-Disk………. 60
Appendix 8: Temperature Distribution Profiles and Source Codes………... 62
Appendix 9: ANSYS Procedure for Residual Stress Simulation…………... 66
Appendix 10: Details of Simulation Results ………………………………. 68
Appendix 11: Stress Concentrations in Circular and Elliptical Holes……... 86
Appendix 12: Results for Residual Stress Simulation for Countermeasures. 87
vi

List of Figures
LIST OF FIGURES
Figure 1: Conventional Brake System
Figure 2: Perimetral Brake System
Figure 3: Pro-E Drawing of Perimetral Brake-Disk
Figure 4: Pro-E Drawing of Entire Perimetral Brake System
Figure 5: Pro-E drawing of Chosen Conventional Brake-Disk
Figure 6: Pro-E Drawing of Rotor of Chosen Conventional Brake-Disk
Figure 7: Model of Entire Meshed Perimetral Brake-Disk
Figure 8: Close-Up of Meshing of Perimetral Brake-Disk
Figure 9: Model of Entire Meshed Conventional Brake-Disk
Figure 10: Close-Up of Meshing at Outer Diameter of Conventional Brake-Disk
Figures 11 (a) and (b): First Principal Stress – Close-Up on Area of Maximum Stress
Figures 12 (a) and (b): Von Mises Stress – Close-Up on Area of Maximum Stress
Figures 13 (a) and (b): First Principal Stress – Close-Up on Area of Maximum Stress
Figures 14 (a) and (b): Von Mises Stress – Close-Up on Area of Maximum Stress
Figures 15 (a) and (b): First Principal Stress – Close-Up on Area of Maximum Stress
Figures 16 (a) and (b): Von Mises Stress – Close-Up on Area of Maximum Stress
Figures 17 (a) and (b): Maximum Von Mises Stresses for Torsional Strength
Simulation
Figures 18 (a) and (b): Maximum Von Mises Stresses for Lateral Strength Simulation
vii
List of Figures
Figures 19 (a) and (b): Maximum First Principal Stresses for Residual Stress
Simulation
Figure 20: Areas of Localized Stress Concentrations
Figure 21: First Principal Stress Distributions on Perimetral Brake-Disk
Figure 22: Pro-E Drawing of Countermeasure 1
Figure 23: Pro-E Drawing of Countermeasure 2
Figure 24: Pro-E Drawing of Countermeasure 3
Figure 25: Pro-E Drawing of Countermeasure 4
Figure 26: Pro-E Drawing of Countermeasure 5
Figure 27: Pro-E Drawing of Countermeasure 6
viii
List of Tables
LIST OF TABLES
Table 1: Summary of Results
Table 2: Summary of Residual Stress Simulation Results for Countermeasures
Table 3: Design Factors to be Considered
ix
List of Symbols
LIST OF SYMBOLS
a deceleration, m/s2
c Specific heat capacity of brake-disks, kJ/kg.k
f maximum torsional force, N
F braking force, N
g gravity, m/s2
mp weight of Perimetral brake-disk, kg
mc weight of Conventional brake-disk, kg
M maximum motorcycle weight, kg
r disk effective radius, mm
R tyre half radius, mm
W motorcycle force, N
μ friction coefficient, dimensionless
σ1,2,3 principal stresses, N/mm2
σnom nominal stress, N/mm2
σuc ultimate compressive strength, N/mm2
σut ultimate tensile strength, N/mm2
σv Von Mises Stress, N/mm2
σy Yield Stress, N/mm2
x
Chapter 1 Introduction
Chapter 1 Introduction
1.1 Purpose
This final year project is an industrial collaborative project with Sunstar Logistic
Singapore Pte Ltd. The objective of the project is to study and compare the
mechanical performances of a conventional brake-disk system and a newly designed
Perimetral brake-disk system using the finite element method (FEM). Based on the
study of their mechanical performances, further improvements will be recommended
to the design of the new Perimetral brake-disk system.
1.2 The Problem
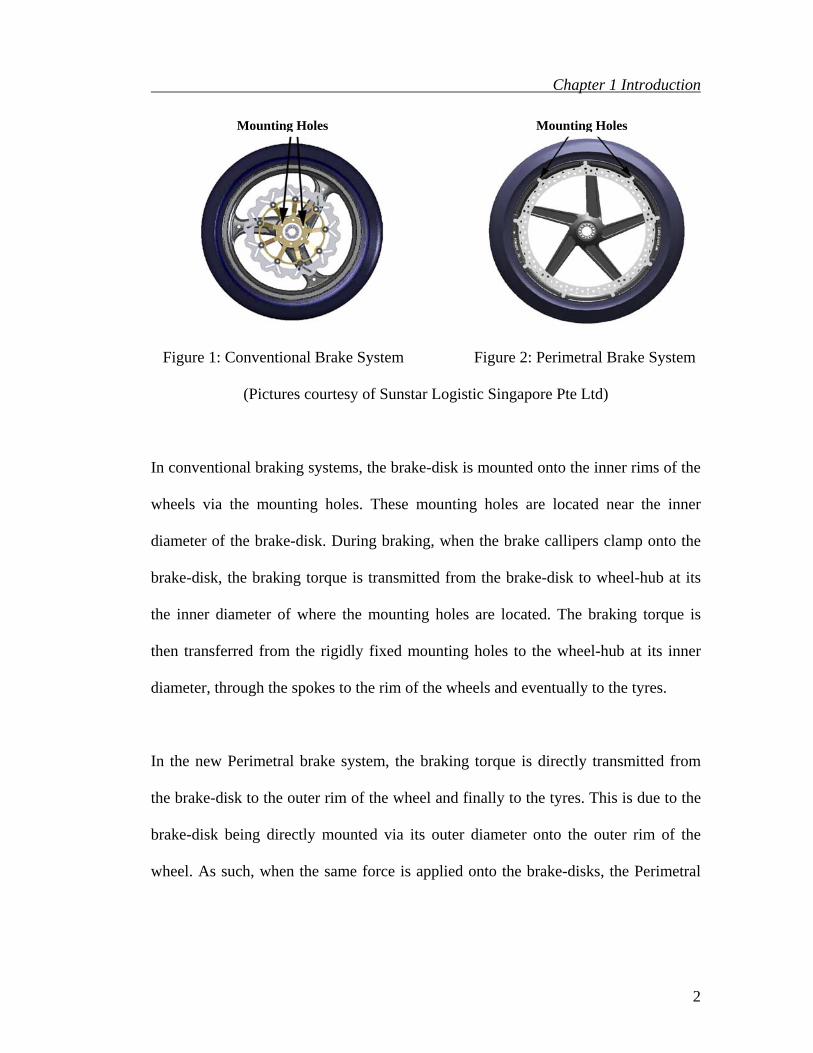
Traditionally, the brake-disk of a motorcycle braking system is mounted on the inner
rim of the wheels as shown in Figure 1. A new Perimetral brake-disk has recently
been developed by Sunstar. As shown in Figure 2, this new Perimetral brake system
works by mounting the brake-disk onto the outer rim of the wheel. The details of the
design specifications of the Perimetral brake-disk and its material properties can be
found in Appendix 1.
1
Chapter 1 Introduction
Mounting Holes Mounting Holes
Figure 1: Conventional Brake System Figure 2: Perimetral Brake System
(Pictures courtesy of Sunstar Logistic Singapore Pte Ltd)
In conventional braking systems, the brake-disk is mounted onto the inner rims of the
wheels via the mounting holes. These mounting holes are located near the inner
diameter of the brake-disk. During braking, when the brake callipers clamp onto the
brake-disk, the braking torque is transmitted from the brake-disk to wheel-hub at its
the inner diameter of where the mounting holes are located. The braking torque is
then transferred from the rigidly fixed mounting holes to the wheel-hub at its inner
diameter, through the spokes to the rim of the wheels and eventually to the tyres.
In the new Perimetral brake system, the braking torque is directly transmitted from
the brake-disk to the outer rim of the wheel and finally to the tyres. This is due to the
brake-disk being directly mounted via its outer diameter onto the outer rim of the
wheel. As such, when the same force is applied onto the brake-disks, the Perimetral
2

Chapter 1 Introduction
brake system is able to produce a larger braking torque due to its larger diameter as
compared to a conventional brake-disk (refer to Appendix 2 for details).
In the Perimetral brake system, the braking torque is transferred directly to the outer
rim, thus the braking stresses are eliminated from the spokes. Therefore, the rim can
be lighter as it only needs to withstand the normal riding forces associated with the
motorcycle. With the Perimetral brake system’s unique design, it allows better
utilisation of braking force and a light weight design for the wheel; thus showing
great potential to replace the conventional braking system. However, more analysis
and studies have to be done to verify its feasibility for mass industrial production and
use on the road.
At the initial stage, the research was focused on investigating the market potential of
this new brake-disk while exploring possible problems and advantages. Looking at
Buell, an American Company, which is currently adopting a similar brake-disk
system for its motorbikes, it was found that the selling points of this brake system are
mainly due to its light weight which is important for rough roads (street riding) and
its aesthetic values. Next, together with the engineers from Sunstar, the potential
problems and advantages that the Perimetral brake-disk may face, including both
design and technical issues, were studied. This brought to focus specific problems
and areas to be further investigated during the later stage of analysis.
3
Chapter 1 Introduction
Motorcycle brake-disks are subjected to a variety of forces during the operation of a
motorcycle. These forces include: braking forces (torsional forces) that are generated
in the wheel when the brakes are applied to stop the motorcycle, lateral forces in the
form of projectiles (such as stones) or impact during usage or riding, and residual
stress build-up due to repeated heating and cooling of the brake-disk during braking.
Simulations have to be done in order to ensure that the Perimetral brake-disk can
perform well under these conditions and loadings.
In particular, special attention has to be given to residual stress analysis. Due to the
Perimetral brake-disk’s unique design, the brake-disk’s allowance for expansion is
constricted by the rim (by the mounting holes at the outer diameter of the brake-disk).
In the course of riding, the brake-disk undergoes repeated heating and cooling due to
braking. This results in repeated expansion and contraction of the brake-disk. Due to
the constraints at its outer diameter, problems of warping or stress concentrations
may occur. In contrast, there is more allowance for expansion and contraction of the
conventional brake-disk, as the brake-disk is only fixed to the rim at its inner
diameter.
1.3 Scope
In this project, the mechanical behaviour and performance of the Perimetral brake-
disk under certain loading conditions will be studied. This shall be done by
simulating the loading conditions the brake-disk is predicted to undergo and
4
Chapter 1 Introduction
analysing the results. The primary focus of this project is to simulate the
performances of the brake-disk using ANSYS.
Braking systems can be divided into mono (one disk) or duo (two disks) brake-disk
systems; representing the number of brake-disks used. In this study, mono-disk
systems from a conventional brake-disk and a Perimetral brake-disk will be modelled,
tested and then analysed. As the braking power of the front brake-disk is more
important than the rear disk during hard braking and stops, only the front brake-disk
of each system would be studied.
The analysis and comparison study will be done through modelling and simulation
using the respective software; Pro-E and ANSYS. After building a finite element (FE)
model of the brake-disks in Pro-E, the models would be simulated using ANSYS.
The brake-disks will be simulated under three different loading conditions: two static
tests and one thermal analysis. The two static cases are torsional strength simulation
and lateral strength simulation. For thermal analysis, residual stress simulation will
be performed.
In order to obtain accurate and reliable results for the simulations, the meshing of the
brake-disks must be properly carried out. In ANSYS, simulation tests can be either
carried out in two or three dimensions. At Sunstar, the conventional method has
always been to use the less complex two-dimensional simulation. However, there are
limitations in using this simple method such as the difficulty in meshing large
5
Chapter 1 Introduction
complicated parts. In this project, three-dimensional simulation techniques shall be
studied and used to carry out the various tests in attempt to achieve more accurate
results. Various simulation methods, such as techniques to input load conditions and
thermal profiles will also be studied and improved. These will enable a more accurate
simulation of the “real-life” conditions that the brake-disks actually experience.
After the various tests are carried out, the performance of the conventional and
Perimetral brake-disks will be compared and analysed. The ability of the Perimetral
brake-disk to withstand these loading conditions would be examined, and their
weaknesses and strengths will be discussed. Particular attention will be paid to
residual strength simulation for the Perimetral brake-disk where a potential problem
may arise. Recommendations will be suggested to change various aspects of its
design. These changes will be modelled and simulated to test if there are any
improvements in its performance.
1.4 Literature Survey
In this project, the design of a new Perimetral brake-disk is modelled and simulated
to evaluate its mechanical performance. The use of simulations to analyse possible
designs is a common practice in the automobile industry where there is a continuing
demand for reduction in product development time and cost to maintain profitability
and competitiveness. Therefore, different ways to make product development more
efficient have been developed. Advancements in the entire spectrum of computer-
6

Chapter 1 Introduction
aided design, manufacturing, and engineering (CAD, CAM, CAE) tools in particular
have automated many design, engineering, and analysis tasks to shorten development
cycles, mostly as labour savings to minimize overhead costs [1].
As the studies done in this project are preliminary, the ANSYS simulations are not
expected to be the most accurate. In fact, most loads, boundary conditions, material
properties, and other data are not fully defined or even known due to the lack of
actual experimental data. The main objective of using simulations in this project is to
compare the possible advantages and disadvantages the Perimetral brake-disk may
have over the conventional brake-disk. Furthermore, based on the present design of
the Perimetral brake-disk, it is hoped that possible design flaws may be discovered
and eliminated without going into actual production of the prototype.
Computational simulation techniques require solving the complex differential or
partial differential equations that govern these phenomena. There are many types of
methods being used to solve these complex partial differential equations. In this
project, the simulation software, ANSYS, uses the finite element method (FEM) to
solve these equations [2]. Other common, numerical methods are boundary element
methods, finite difference methods, finite volume methods, and spectral methods. In
these methods, the spatial domain where the partial differential governing equations
are defined is often discretized into meshes. In recent years, element-free or meshfree
methods have emerged as a developed class of numerical methods [3].
7
Chapter 1 Introduction
The FEM is a general numerical method seeking an approximated solution of the
distribution of field variables in the problem domain that is difficult to obtain
analytically. It is a member of a set of methods called Weighted Residual Methods
and can be used in many different applications. The FEM was first used to solve
problems of stress analysis and has since been applied to many other problems such
as thermal analysis, fluid flow analysis and piezoelectric analysis [4].
The modern development of the finite element method began in the 1940s. Since the
finite element equations are usually cumbersome to solve by hand, the method
became popular only with the advent of the digital computer in the early 1950s. Since
the early 1960s, a large amount of research has been devoted to the technique. FEM is
the dominating method in engineering analysis because of its generality and
numerical efficiency [5]. Although other methods retain advantages in certain niche
applications, they are difficult or impossible to apply to other types of analysis. At the
same time, FEM can be applied to almost any type of analysis, handling complex
geometry and varying boundary conditions well. Thus the versatility and efficiency of
the FEM has resulted in its dominance in the market of commercial analysis software.
For decades, finite element analysis (FEA) has been a preferred method of analysis in
the motorcycle industry to simulate problems involving rotor temperature rise and
thermal cracks. ANSYS is a general purpose finite element analysis (FEA) package
used widely in the industry for simulating the response to the loading of a wide
variety of physical problems, including static and dynamic structural analysis (both
8

Chapter 1 Introduction
linear and nonlinear), heat transfer, computational fluid dynamics, as well as acoustic
and electromagnetic problems [6]. ANSYS uses the finite element method (FEM) to
numerically solve the underlying governing equations subjected to the boundary
conditions associated to the problem. Therefore, the ANSYS package is suitable for
use in this project which requires structural and thermal analysis of the brake-disk.
9
Chapter 2 Theory
Chapter 2 Theory
2.1 Three-Dimensional Meshing
The primary focus of this project is to simulate the performances of the brake-disks
using ANSYS which is developed based on the finite element method (FEM). In
order to obtain accurate and reliable results for the simulations, the meshing of the
brake-disks must be properly carried out. Meshing is performed to discretize the
geometry created into small pieces called elements. By using a properly predefined
mesh and by applying a proper principle, complex differential or partial differential
governing equations can be approximated by a set of algebraic equations for the mesh.
Assembling sets of algebraic equations for all the meshes can form the system of
algebraic equations for the whole problem domain [7].
In Sunstar, there is an established procedure for carrying out the meshing of the
brake-disks for simulation. Sunstar has always used 2D (two-dimensional) meshing
and simulation in ANSYS for the testing of its brake-disks. However in this project,
3D (three-dimensional) modelling and meshing will be used for more comprehensive
and accurate results.
10
Chapter 2 Theory
By using 3D elements, it is more demanding on computer resources, and geometry
creation and meshing may be tedious. However, 3D meshing is the preferred choice
here as it has the following advantages:
• In 3D meshing, 3D solids can be used for structures in 3D space that has neither a
constant cross section nor an axis of symmetry [8]. It allows for more flexibility
as it enables the meshing of different types of brake-disk shapes.
• It allows easier incorporation of other system parts, such as pins and brake
callipers, in the simulations. With 3D meshing, it is even possible to incorporate
the whole wheel assembly for analysis in the future.
In 3D meshing, the two general types of solid elements to be used are tetrahedron
shaped elements and hexahedron shaped elements. In this project, the majority of the
meshing will be carried out using hexahedron shaped elements as it has a better
aspect ratio, better accuracy and is easier to control in terms of size as compared to
tetrahedron shaped elements. The eight-node hexahedral element is linear (p = 1),
with a linear strain variation displacement mode [8]. Tetrahedral elements are also
linear, but can have more discretization errors because they have a constant strain.
Meshes comprised of hexahedrons are also easier to visualize than meshes comprised
of tetrahedrons. In addition, the reaction of hexahedral elements to the application of
body loads corresponds to loads under real world conditions more precisely. The
11

Chapter 2 Theory
eight-node hexahedral elements are therefore superior to tetrahedral elements for
finite element analysis.
2.2 Techniques of 3D Meshing
Meshing can be done manually or automatically. For manual mesh, the analyst
manually defines the nodes and elements. For automatic meshing, there is free and
mapped meshing. A free mesh has no restrictions in terms of element shapes, and has
no specified pattern applied to it. It usually works with triangle elements for 2D or
tetrahedral elements for 3D. Compared to a free mesh, a mapped mesh is restricted in
terms of the element shape it contains and the pattern of the mesh. For 3D meshing, a
mapped volume mesh contains only hexahedron elements. Mapped meshing is
normally done for symmetrical and uniformly shaped bodies; it may be too restrictive
for complex geometry but usually produces good mesh quality (well-shaped elements)
when they work [5].
The main technique used in this project’s simulation is mapped meshing. This is
because the model of the brake-disk is relatively uniform and symmetrical; hence by
using mapped meshing, well-shaped elements can be obtained. Volume sweep
meshing is then used to map the entire model. Using volume sweeping, an existing
unmeshed volume is filled with elements by sweeping the mesh from a bounding area
(also referred to as the "source area") throughout the volume. Since the source area
mesh (done by meshing the area) consists of quadrilateral elements, the volume is
12

Chapter 2 Theory
filled with hexahedral elements. The swept mesh is fully associated with the volume.
Unlike other methods for extruding a meshed area into a meshed volume, volume
sweeping is intended for use in existing unmeshed volumes. Thus it is particularly
useful in these situations [8]:
• Importing a solid model that was created in another program and meshing it in
ANSYS, which is precisely the case in this project as the model is created in Pro-
E and subsequently exported to ANSYS.
• If the source area is unmeshed prior to volume sweeping, ANSYS meshes it
automatically when the volume sweeper is invoked. The other extrusion methods
require the area to be meshed manually before invoking them.
2.3 Stress Analysis Methods
Failure analysis in brake-disks can be divided into two parts; ductile failure and
brittle failure. It is useful to adopt the view point that facture and yielding are separate
events and that either one may occur first depending on the combination of material
or stress states involve.
Ductile failure would predict the yielding or deformation of the brake-disk. For
ductile failure, the Von Mises Stress (Octahedral Shear Stress Yield) criterion is used.
Finite element analysis results are typically presented as Von Mises stresses. It is
13
Chapter 2 Theory
calculated by combining stresses in two or three dimensions, with the result
compared to the tensile strength of the material loaded in one dimension. Stress is in
general a symmetric 3×3 matrix. Von Mises stress reduces this to a single number (a
scalar) for the purposes of calculating yield criteria.
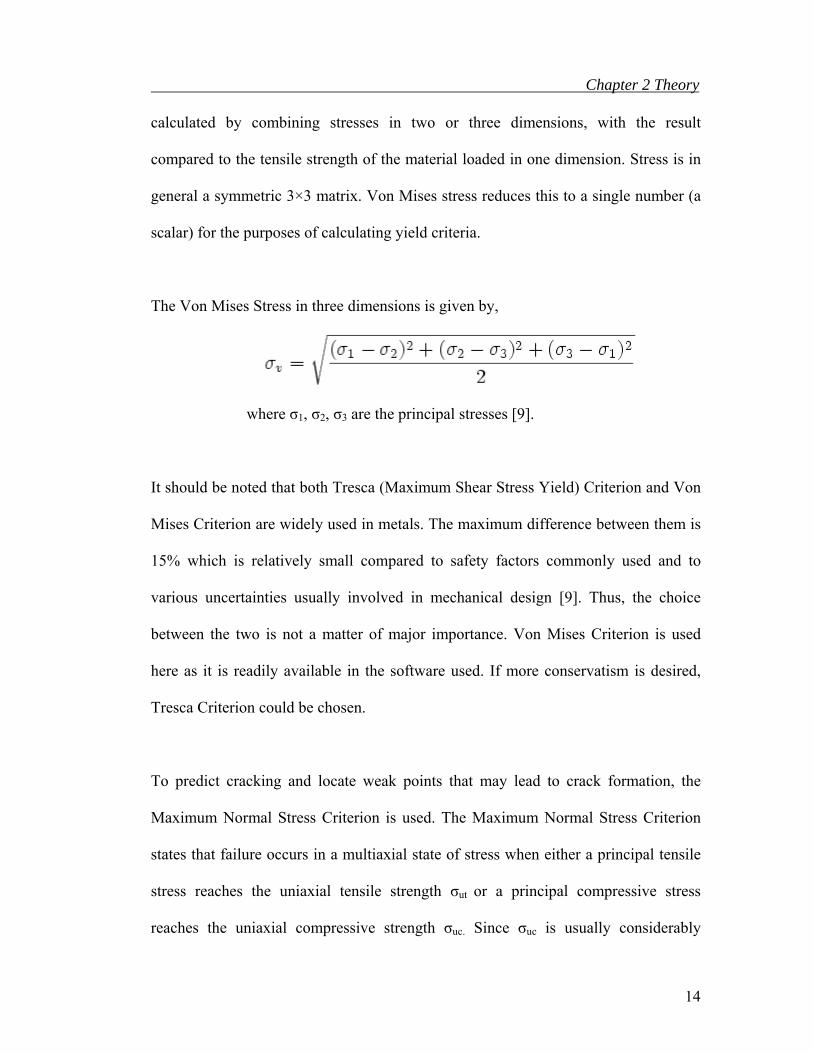
The Von Mises Stress in three dimensions is given by,
where σ1, σ2, σ3 are the principal stresses [9].
It should be noted that both Tresca (Maximum Shear Stress Yield) Criterion and Von
Mises Criterion are widely used in metals. The maximum difference between them is
15% which is relatively small compared to safety factors commonly used and to
various uncertainties usually involved in mechanical design [9]. Thus, the choice
between the two is not a matter of major importance. Von Mises Criterion is used
here as it is readily available in the software used. If more conservatism is desired,
Tresca Criterion could be chosen.
To predict cracking and locate weak points that may lead to crack formation, the
Maximum Normal Stress Criterion is used. The Maximum Normal Stress Criterion
states that failure occurs in a multiaxial state of stress when either a principal tensile
stress reaches the uniaxial tensile strength σut or a principal compressive stress
reaches the uniaxial compressive strength σuc. Since σuc is usually considerably
14
Chapter 2 Theory
greater than σut, σut is used. For a more conservative analysis in this project, the yield
stress is used as a comparison instead of ultimate tensile strength.
σut = MAX | σ1 , σ1 , σ1 |
where σ1, σ2, σ3 are the principal stresses [9].
Both Von Mises and Maximum Normal Stress Criterion are used in this project as a
relative gauge to predict the performances of the brake-disk in ductile and brittle
failure respectively.
15

Chapter 3 Experimental Procedures
Chapter 3 Experimental Procedures
3.1 Pro-E Modelling
Before any simulations or tests can be carried out, it is important to first draw an
accurate model of the brake-disks. The Pro-E model of the Perimetral brake-disk is
shown below:
Figure 3: Pro-E Drawing of Perimetral
Brake-Disk Figure 4: Pro-E Drawing of Entire
Perimetral Brake System
(Pictures courtesy of Sunstar Logistic Singapore Pte Ltd)
A few models of motorcycles which the Perimetral brake system is suitable for use
were narrowed down by Sunstar. The Perimetral brake system is supposed to be able
to replace these conventional brake systems to operate efficiently in these
motorcycles. The most suitable brake-disk for comparison was then chosen and
modelled as shown in Figure 5.
16

Chapter 3 Experimental Procedures
Figure 5: Pro-E Drawing of Chosen
Conventional Brake-Disk
Figure 6: Pro-E Drawing of Rotor of
Chosen Conventional Brake-Disk
3.2 Simulation by ANSYS
After modelling the brake-disks in Pro-E, the models are then exported to ANSYS in
the form of IGES files. In ANSYS, the models are allocated their material properties
and then meshed (refer to Appendix 3 for ANSYS meshing procedure). The material
properties for both brake-disks are the same, as both are made from SUS410DB
Stainless Steel. By applying appropriate loading conditions, simulations are then
carried out using ANSYS to study the performance of the different designs.
For conventional brake-disk simulations, it is only necessary to carry out the
simulation on the rotor (outer-most portion) of the brake-disk. The pins and hub of
the brake-disk can be excluded as they are rarely prone to failure. The rotor is the area
which comes into contact with the brake-pads, and is subjected to the highest
17
Chapter 3 Experimental Procedures
temperatures and loadings. For these reasons, failure often occurs first at the rotor
rather than at the hub or pins. Thus, by only simulating the rotor, it allows the model
to be less complicated and the reduction of computation time.
There are three important simulations carried out to investigate the performance of
the brake-disks and their mechanical behaviour. They are static tests: torsional and
lateral strength simulation. For thermal analysis, residual stress simulation is carried
out. It is important to note that as much of the final design and specifications of the
Perimetral brake system are not yet finalized, some assumptions have had to be made
about the design in order to carry out the tests.
3.3 Simulation Procedures
(a) Static Test - Torsional Strength Simulation
Purpose of Test
In this simulation, a torsional force is exerted on the brake-disk, simulating the
torsional force that a brake-disk experiences during hard braking. This is similar to
actual braking conditions, when the rider comes to an emergency stop while
travelling at high speed. It is important to ensure that the brake-disk is able to
withstand the high torsional stress generated due to the brake-pads clamping down on
the spinning brake-disk. In this test, it is important to check for any distortions,
18

Chapter 3 Experimental Procedures
especially near holes (mounting or piercing holes), where there might be stress
concentrations during braking.
Assumptions
1) The maximum torque is concentrated on a single brake pad that is in contact with
the brake-disk.
2) The maximum weight of the motorcycle is the same for the Perimetral brake-disk
and the conventional brake-disk: which is equal to the total weight of the
motorcycle, the rider and luggage.
3) Maximum friction coefficient between the wheels and the ground is assumed to
be 0.8.
A torsional force is simulated on the surface of the brake-disks. The nodes within a
rectangular shape on the surface of the brake-disk are chosen, simulating the
dimensions of a brake pad. In this way, the torsional force is simulated to be applied
from the brake pad onto the disk. A torisonal force of 5365N and 7283N is applied on
the Perimetral and conventional brake-disk (onto the chosen nodes) respectively. This
value of torsional force is calculated based on the maximum deceleration that the
motorcycle would experience during hard braking (refer to Appendix 4 for details).
The mountings holes are then constrained to give zero displacement and the solution
is then obtained (refer to Appendix 5 for exact ANSYS procedures).
19

Chapter 3 Experimental Procedures
(b) Static Test - Lateral Strength Simulation
Purpose of Test
In this simulation, a lateral force is exerted on the disk to check for any distortions or
warping in the disk. This test studies the behaviour of the brake-disk when it
encounters lateral loading during usage, for example a person kicking the disk, stones
or other similar materials coming into contact with the brake-disk during riding. If it
is distorted, the contact area between the brake pad and brake-disk will become
uneven, which may result in vibrations that affect the performance of the brake-disk.
Assumptions
1. The lateral load is exerted onto the brake-disk through the brake pad.
2. A force of 1000N/mm2 is enough to test the behaviour of the brake-disk under
lateral loading. (The same value is used in industry standard tests.)
3. The force is purely transmitted in the lateral direction.
A lateral force is simulated on the surface of the brake-disks. The nodes within a
rectangular shape on the surface of the brake-disk are chosen, simulating the
dimensions of a brake pad. In this way, the lateral force is simulated to be applied
from the brake pad onto the brake-disk. A total force of 1000N is applied in the z-
direction on the nodes. The mountings holes are then constrained to give zero
20

Chapter 3 Experimental Procedures
displacement and the solution is then obtained (refer to Appendix 6 for exact ANSYS
procedures).
(c) Thermal Analysis - Residual Stress Simulation
Purpose of Test
The main challenge of this project is to study the behaviour of the Perimetral brake-
disk under residual stress, and compare it to the conventional brake-disk. Special
attention has to be given to this test as the Perimetral brake-disk is constrained by the
rim (by the mounting holes at the outer diameter of the brake-disk). Hence during the
expansion and contraction of the brake-disk, there may be problems of warping or
stress concentrations due to constraints at its outer diameter. In conventional brake-
disk systems, there is more allowance for expansion and contraction of the brake-disk,
as the brake-disk is only fixed to the rim at its inner diameter. The severe thermal
distortion of a brake-disk can affect important brake system characteristics such as
system response and brake judder propensity [6].
A temperature profile of the brake-disk during hard braking is simulated. By
subjecting the brake-disk to cool to room temperature from this temperature profile,
residual stress can be simulated in the brake-disks. In order to perform residual stress
analysis on the brake-disk, a reasonable approximation of the temperature distribution
on the brake-disk is necessary. The maximum temperature reached will be
21

Chapter 3 Experimental Procedures
approximated using basic conservation of energy principals [10] (refer to Appendix 7
for calculation of the maximum temperature in the brake-disks during braking).
Assumptions
1) All heat generated by the contact of the brake pad and the brake-disk goes to the
rotor.
2) All the kinetic energy at maximum velocity is converted to heat energy.
3) The maximum weight of the motorcycle is the same for the Perimetral brake-disk
and the conventional brake-disk: which is equal to the total weight of the
motorcycle, the rider and luggage.
A thermal profile of the brake-disk during hard braking is assumed: with a maximum
temperature of about 550°C to a minimum temperature of about 300°C (refer to
Appendix 8 for details of temperature profile). One additional advantage of using 3D
meshing is that the brake-disks can be meshed such that the nodes can be positioned
in the middle of the brake-disk (in z-direction). Thus, the nodes of the brake-disk will
be basically divided into three layers; the top surface, the bottom surface, and the
middle section. This allows the surface of the middle section to be given a
temperature of 30°C lower then the two outer surfaces to simulate the temperature
difference within the brake-disk.
22
Chapter 3 Experimental Procedures
Zero degree of freedom constraints are then given to the mounting holes. The brake-
disk is then simulated to cool from its temperature during hard braking to about room
temperature of 20°C. Effects of warping or stress concentrations which may cause
cracking are observed and possible weak points are identified. The thickness of the
brake-disk is given a slight displacement at the inner diameter to simulate
manufacturing defects and to help study the effects of warping (refer to Appendix 9
for exact ANSYS procedures).
23
Chapter 4 Experimental Results
Chapter 4 Experimental Results
4.1 Mesh Results
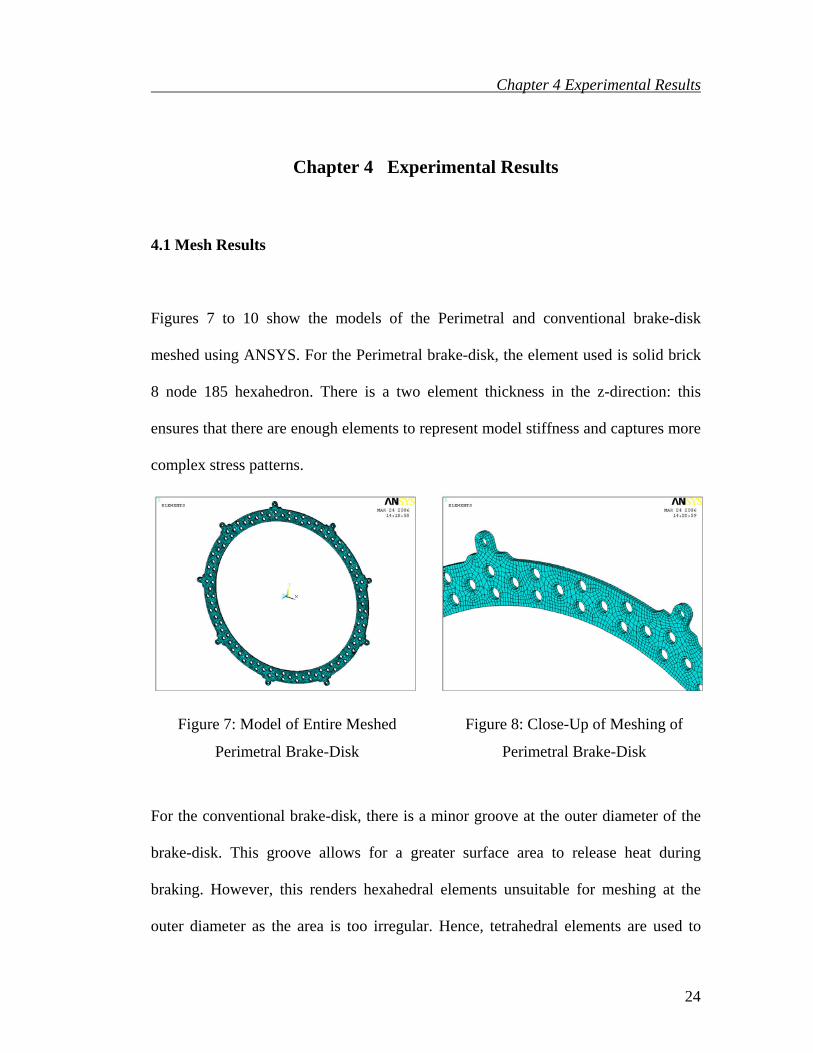
Figures 7 to 10 show the models of the Perimetral and conventional brake-disk
meshed using ANSYS. For the Perimetral brake-disk, the element used is solid brick
8 node 185 hexahedron. There is a two element thickness in the z-direction: this
ensures that there are enough elements to represent model stiffness and captures more
complex stress patterns.
Figure 7: Model of Entire Meshed
Perimetral Brake-Disk
Figure 8: Close-Up of Meshing of
Perimetral Brake-Disk
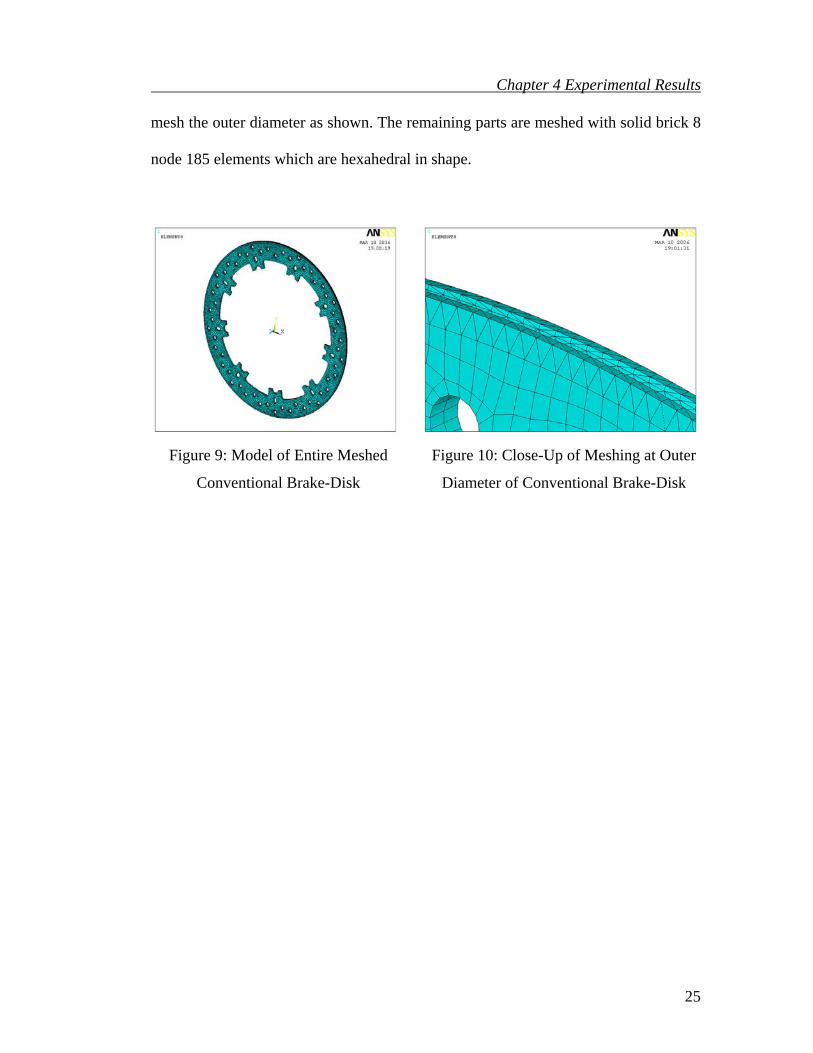
For the conventional brake-disk, there is a minor groove at the outer diameter of the
brake-disk. This groove allows for a greater surface area to release heat during
braking. However, this renders hexahedral elements unsuitable for meshing at the
outer diameter as the area is too irregular. Hence, tetrahedral elements are used to
24
Chapter 4 Experimental Results
mesh the outer diameter as shown. The remaining parts are meshed with solid brick 8
node 185 elements which are hexahedral in shape.
Figure 9: Model of Entire Meshed
Conventional Brake-Disk
Figure 10: Close-Up of Meshing at Outer
Diameter of Conventional Brake-Disk
25

Chapter 4 Experimental Results
4.2 Simulation Results in ANSYS
(Refer to Appendix 10 for details of results)
(a) Static Test - Torsional Strength Simulation
Figures 11 (a) and (b): First Principal Stress – Close-Up on Area of Maximum Stress
(a) Conventional Brake-Disk (b) Perimetral Brake-Disk
Figures 12 (a) and (b): Von Mises Stress – Close-Up on Area of Maximum Stress
(a) Conventional Brake-Disk (b) Perimetral Brake-Disk
26

Chapter 4 Experimental Results
(b) Static Test - Lateral Strength Simulation
Figures 13 (a) and (b): First Principal Stress – Close-up on Area of Maximum Stress
(a) Conventional Brake-Disk
(b) Perimetral Brake-Disk
Figure 14 (a) and (b): Von Mises Stress – Close-Up on Area of Maximum Stress
(a) Conventional Brake-Disk
(b) Perimetral Brake-Disk
27
Chapter 4 Experimental Results
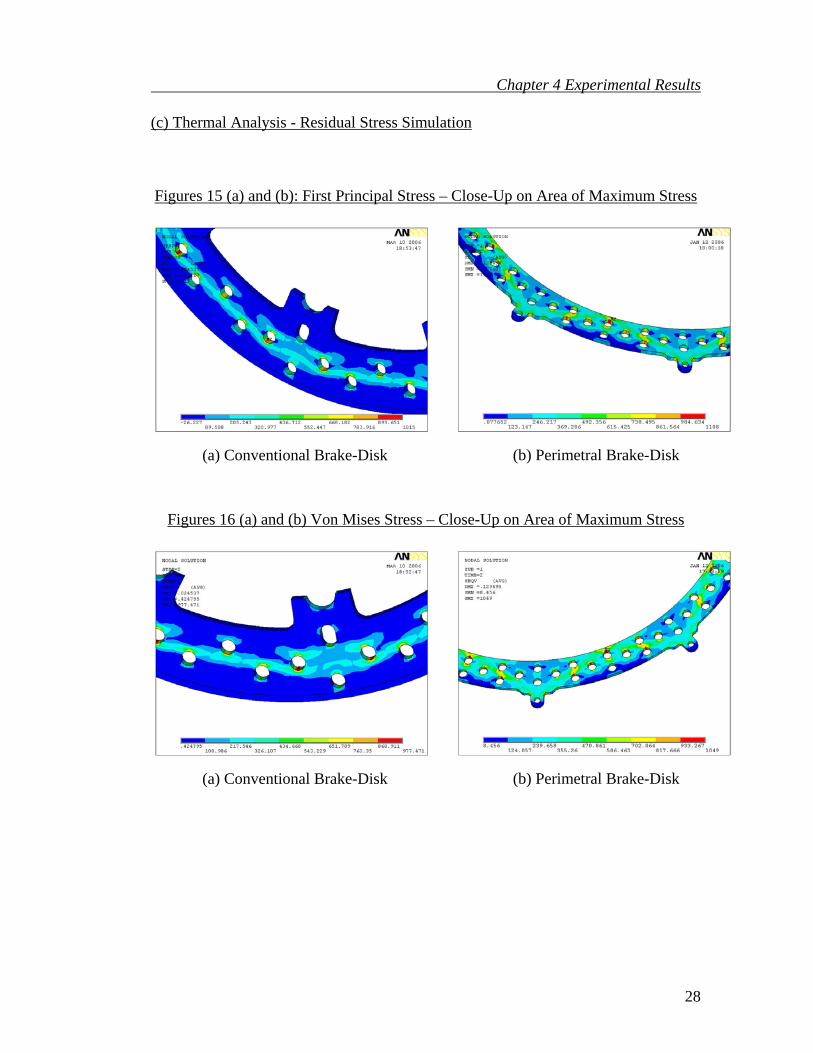
(c) Thermal Analysis - Residual Stress Simulation
Figures 15 (a) and (b): First Principal Stress – Close-Up on Area of Maximum Stress
(a) Conventional Brake-Disk
(b) Perimetral Brake-Disk
Figures 16 (a) and (b) Von Mises Stress – Close-Up on Area of Maximum Stress
(a) Conventional Brake-Disk
(b) Perimetral Brake-Disk
28
Chapter 4 Experimental Results
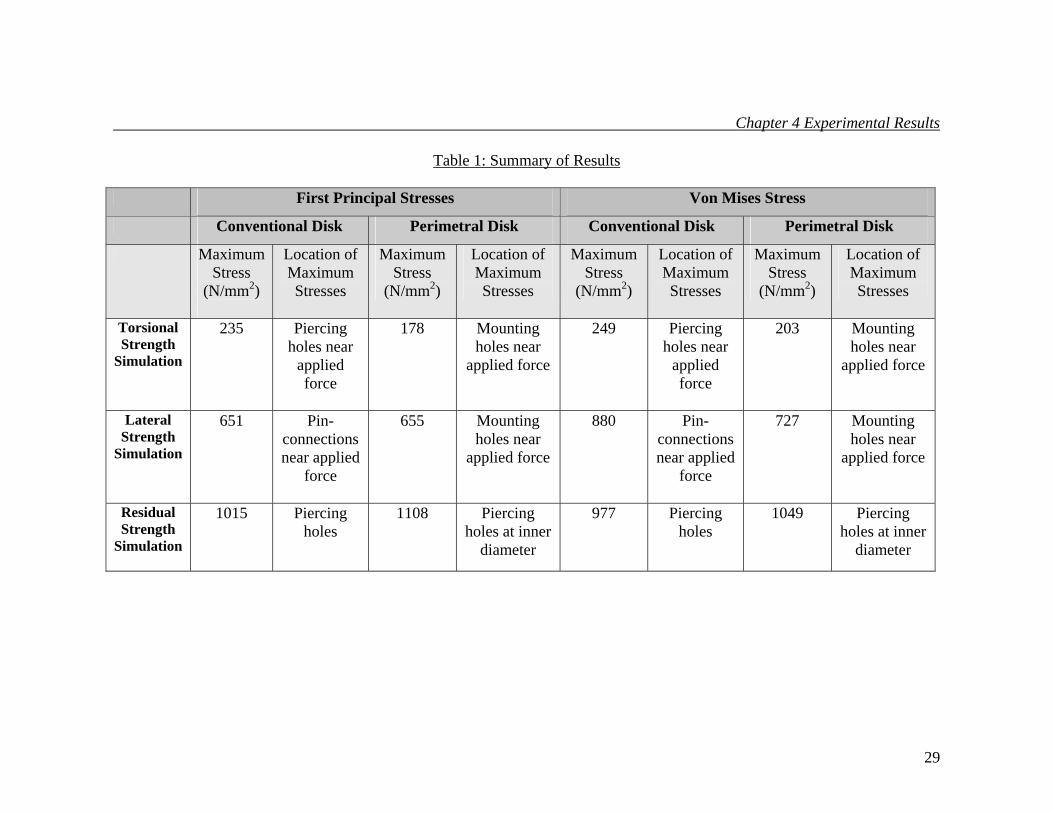
Table 1: Summary of Results First Principal Stresses Von Mises Stress
Conventional Disk Perimetral Disk Conventional Disk Perimetral Disk
Maximum Stress
(N/mm2)
Location of Maximum Stresses
Maximum Stress
(N/mm2)
Location of Maximum Stresses
Maximum Stress
(N/mm2)
Location of Maximum Stresses
Maximum Stress
(N/mm2)
Location of Maximum Stresses
Torsional Strength
Simulation
235 Piercing holes near
applied force
178 Mounting holes near
applied force
249 Piercing holes near
applied force
203 Mounting holes near
applied force
Lateral Strength
Simulation
651 Pin-connections near applied
force
655 Mounting holes near
applied force
880 Pin-connections near applied
force
727 Mounting holes near
applied force
Residual Strength
Simulation
1015 Piercing holes
1108 Piercing holes at inner
diameter
977 Piercing holes
1049 Piercing holes at inner
diameter
29

Chapter 5 Discussion
Chapter 5 Discussion
It is important to remember that the interpretation of displacement and stress results
for finite element analysis (FEA) is more of a qualitative rather than a quantitative
one. It is neither sufficient nor accurate to judge whether the brake-disk will yield or
crack by purely looking at the value of the stresses generated. In this study, the
purpose of including the modelling and simulation of the conventional brake-disk is
to act as a control for the analysis of the new Perimetral brake-disk. As the
conventional brake-disk selected for this project has been trialled and tested to be safe
for actual use, it can act as a reference for the value of stresses obtained. If the stress
values of the Perimetral brake-disk are close to or lower than those of the
conventional brake-disk, it would be reasonable to assume that failure would not
occur.
(a) Static Test - Torsional Strength Simulation
In the conventional brake-disk, the stresses concentrate near the piercing holes where
the torsional load is applied. For the Perimetral brake-disk, the stresses concentrate
around the area where the torsional load is applied; especially on the adjacent
mounting holes as shown in Figure 17(b). For the Perimetral brake-disk, maximum
values of the First Principal Stress and Von Mises Stress are significantly lower than
30
Chapter 5 Discussion
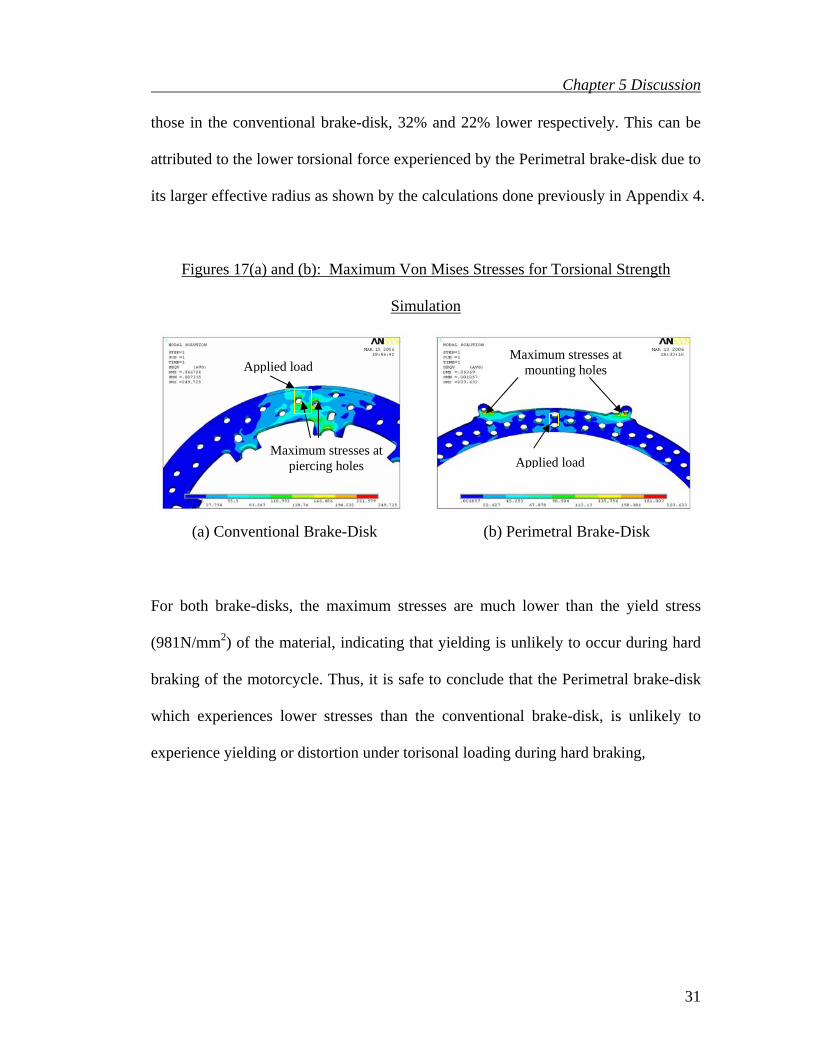
those in the conventional brake-disk, 32% and 22% lower respectively. This can be
attributed to the lower torsional force experienced by the Perimetral brake-disk due to
its larger effective radius as shown by the calculations done previously in Appendix 4.
Figures 17(a) and (b): Maximum Von Mises Stresses for Torsional Strength
Simulation
(a) Conventional Brake-Disk
Maximum stresses at mounting holes
Maximum stresses at piercing holes
Applied load
Applied load
(b) Perimetral Brake-Disk
For both brake-disks, the maximum stresses are much lower than the yield stress
(981N/mm2) of the material, indicating that yielding is unlikely to occur during hard
braking of the motorcycle. Thus, it is safe to conclude that the Perimetral brake-disk
which experiences lower stresses than the conventional brake-disk, is unlikely to
experience yielding or distortion under torisonal loading during hard braking,
31
Chapter 5 Discussion
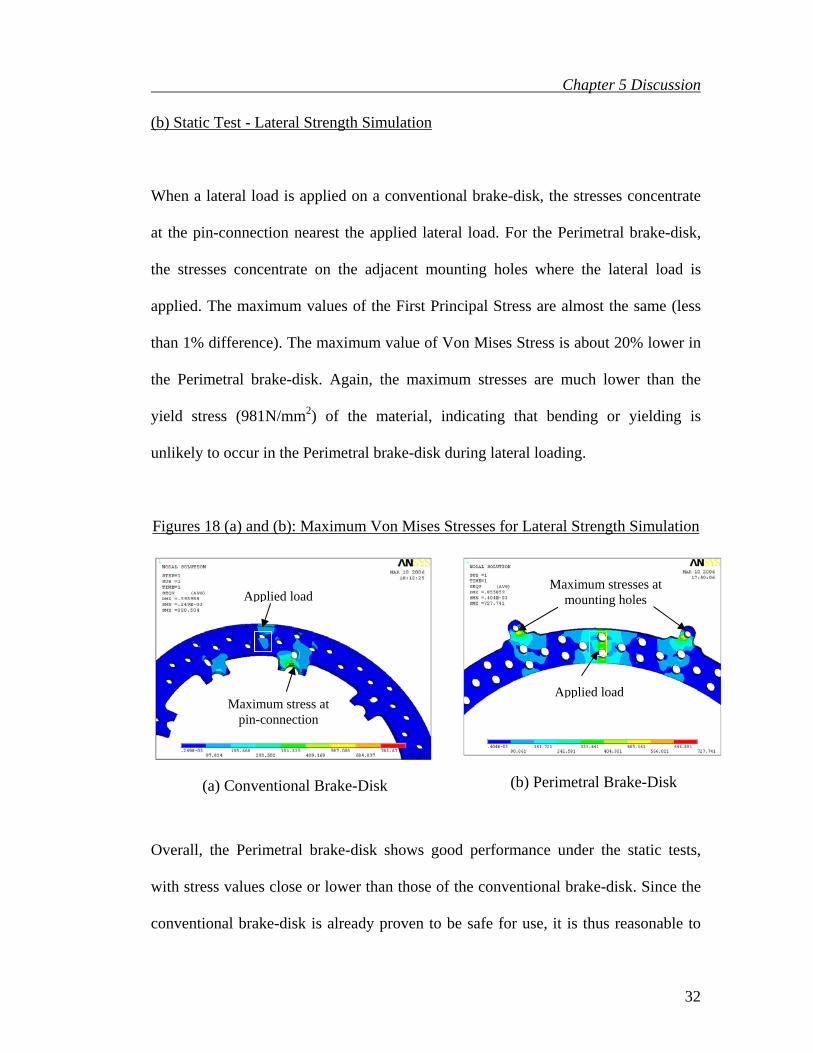
(b) Static Test - Lateral Strength Simulation
When a lateral load is applied on a conventional brake-disk, the stresses concentrate
at the pin-connection nearest the applied lateral load. For the Perimetral brake-disk,
the stresses concentrate on the adjacent mounting holes where the lateral load is
applied. The maximum values of the First Principal Stress are almost the same (less
than 1% difference). The maximum value of Von Mises Stress is about 20% lower in
the Perimetral brake-disk. Again, the maximum stresses are much lower than the
yield stress (981N/mm2) of the material, indicating that bending or yielding is
unlikely to occur in the Perimetral brake-disk during lateral loading.
Figures 18 (a) and (b): Maximum Von Mises Stresses for Lateral Strength Simulation
Maximum stresses at mounting holes Applied load
Applied load Maximum stress at
pin-connection
(b) Perimetral Brake-Disk (a) Conventional Brake-Disk
Overall, the Perimetral brake-disk shows good performance under the static tests,
with stress values close or lower than those of the conventional brake-disk. Since the
conventional brake-disk is already proven to be safe for use, it is thus reasonable to
32

Chapter 5 Discussion
conclude that the Perimetral brake-disk would perform likewise. It is also evident that
the weak points of the Perimetral brake-disk under static tests lies on its mounting
holes, thus it is important to ensure that the mounting holes are properly
manufactured. It is also recommended that the Perimetral brake-disk is properly heat-
treated for strengthening purposes.
(c) Thermal Analysis - Residual Stress Simulation
For residual stress simulation, it is important to look out for weak points in the brake-
disks that may cause cracking. Cracking is often the cause of failure in brake-disks
after being subjected to repeated heating and cooling during braking.
For both types of brake-disks, the stresses concentrate at their piercing holes. For the
Perimetral brake-disk, maximum values of the First Principal Stress and Von Mises
Stress are higher than those in the conventional brake-disk, 8% and 7% higher
respectively. This is probably due to the design of the conventional brake-disk (fixed
at its inner diameter) which gives it more allowance during expansion and contraction.
33
Chapter 5 Discussion
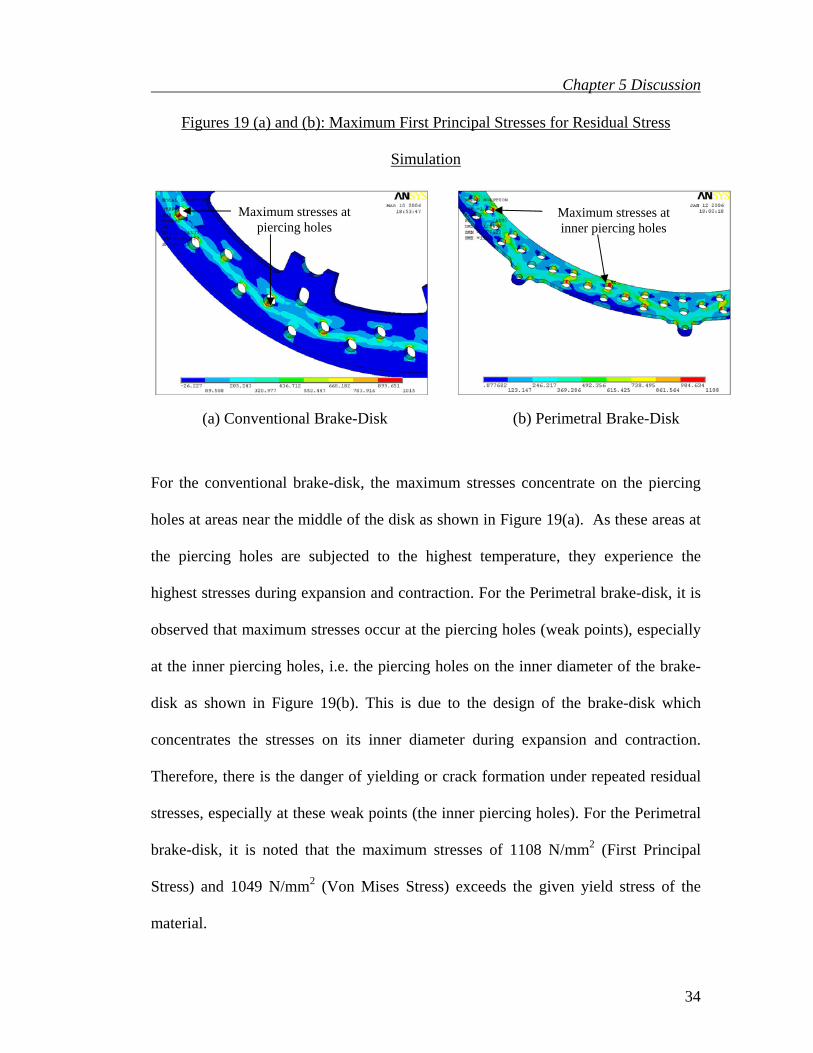
Figures 19 (a) and (b): Maximum First Principal Stresses for Residual Stress
Simulation
(a) Conventional Brake-Disk
(b) Perimetral Brake-Disk
Maximum stresses at piercing holes
Maximum stresses at inner piercing holes
For the conventional brake-disk, the maximum stresses concentrate on the piercing
holes at areas near the middle of the disk as shown in Figure 19(a). As these areas at
the piercing holes are subjected to the highest temperature, they experience the
highest stresses during expansion and contraction. For the Perimetral brake-disk, it is
observed that maximum stresses occur at the piercing holes (weak points), especially
at the inner piercing holes, i.e. the piercing holes on the inner diameter of the brake-
disk as shown in Figure 19(b). This is due to the design of the brake-disk which
concentrates the stresses on its inner diameter during expansion and contraction.
Therefore, there is the danger of yielding or crack formation under repeated residual
stresses, especially at these weak points (the inner piercing holes). For the Perimetral
brake-disk, it is noted that the maximum stresses of 1108 N/mm2 (First Principal
Stress) and 1049 N/mm2 (Von Mises Stress) exceeds the given yield stress of the
material.
34
Chapter 5 Discussion
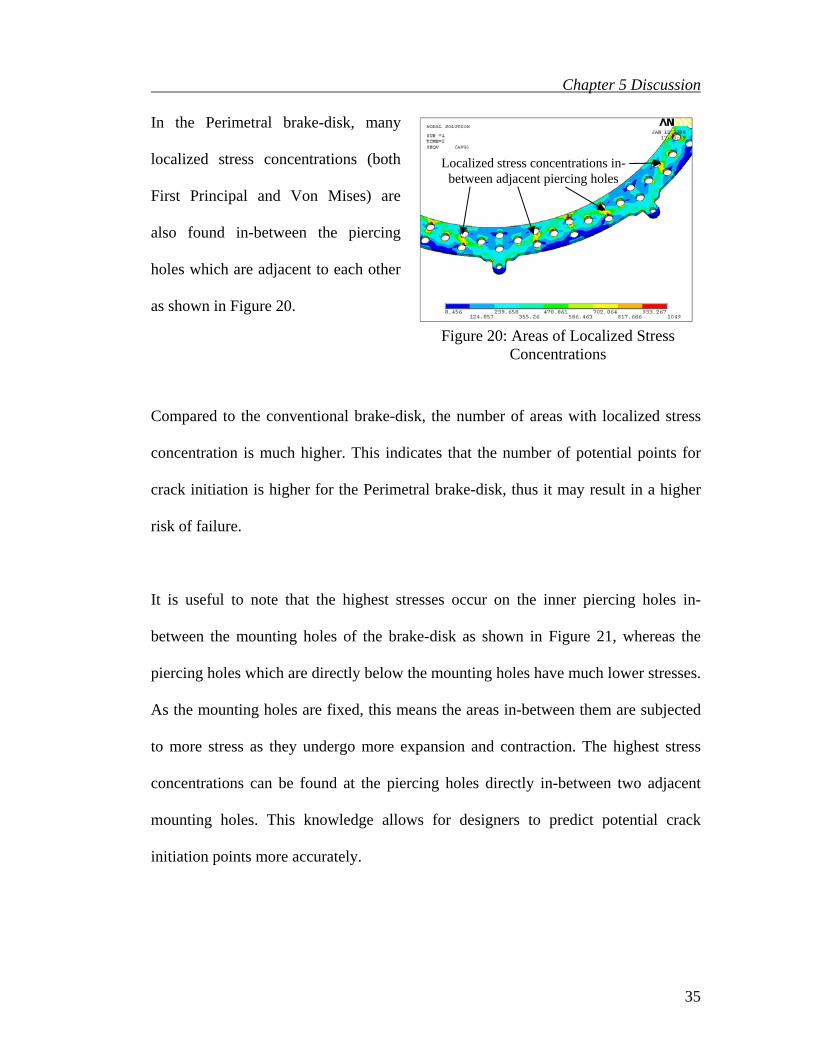
In the Perimetral brake-disk, many
localized stress concentrations (both
First Principal and Von Mises) are
also found in-between the piercing
holes which are adjacent to each other
as shown in Figure 20.
Localized stress concentrations in-between adjacent piercing holes
Figure 20: Areas of Localized Stress Concentrations
Compared to the conventional brake-disk, the number of areas with localized stress
concentration is much higher. This indicates that the number of potential points for
crack initiation is higher for the Perimetral brake-disk, thus it may result in a higher
risk of failure.
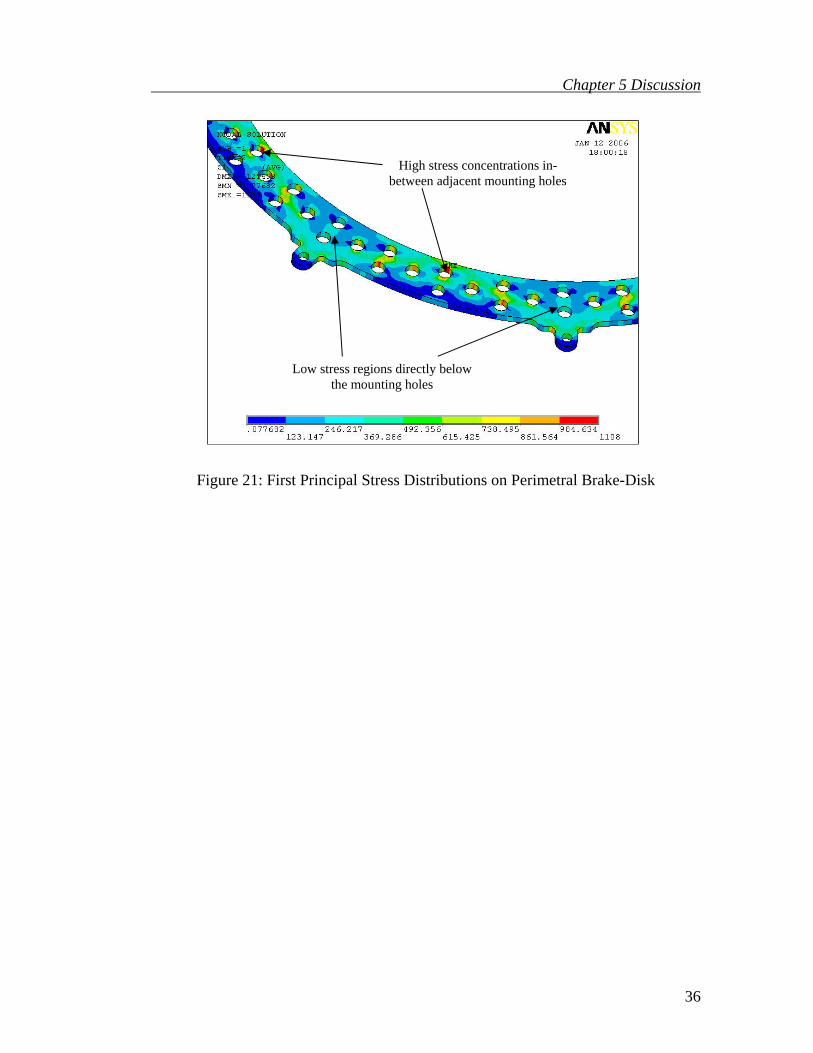
It is useful to note that the highest stresses occur on the inner piercing holes in-
between the mounting holes of the brake-disk as shown in Figure 21, whereas the
piercing holes which are directly below the mounting holes have much lower stresses.
As the mounting holes are fixed, this means the areas in-between them are subjected
to more stress as they undergo more expansion and contraction. The highest stress
concentrations can be found at the piercing holes directly in-between two adjacent
mounting holes. This knowledge allows for designers to predict potential crack
initiation points more accurately.
35
Chapter 5 Discussion
High stress concentrations in-between adjacent mounting holes
Low stress regions directly below the mounting holes
Figure 21: First Principal Stress Distributions on Perimetral Brake-Disk
36
Chapter 6 Further Analysis
Chapter 6 Further Analysis
After comparing the performances of the two brake-disks, further analysis is then
carried out to investigate if improvements can be made to the Perimetral brake-disk.
For the static tests, the maximum stresses (weak points) in the Perimetral brake-disk
are at the mounting holes. Due to the design of the brake-disk, the mounting holes are
subjected to the most stresses under lateral and torsional loads. Even though the
stresses are much lower than the yield strength of material, failure may result after
repeated loadings (fatigue failure). As the mounting holes act as stress raisers, one
possible improvement is to remove the mounting holes, thus eliminating stress
concentration points. Instead of mounting holes, the brake-disk can be fixed to the
rim using a metal plate fixed by two bolts.
A more important problem faced by the Perimetral brake-disk is the high stresses that
concentrate at the inner piercing holes under residual stress simulation. As discussed
previously, these high stresses may lead to crack formation or yielding. Theoretically
the ideal design would be to remove all the piercing holes, as this would eliminate
stress raisers. However, the piercing holes are necessary for removing of dirt and
other particles from the brake pads, to increase flexibility and for prevention of
37
Chapter 6 Further Analysis
thermal warping. Hence, other alternatives must be explored. A number of
countermeasures will be proposed, modelled and tested.
6.1 Proposed Countermeasures Designs
To improve the performance of the Perimetral brake-disk, there are three main areas
that can be targeted for change.
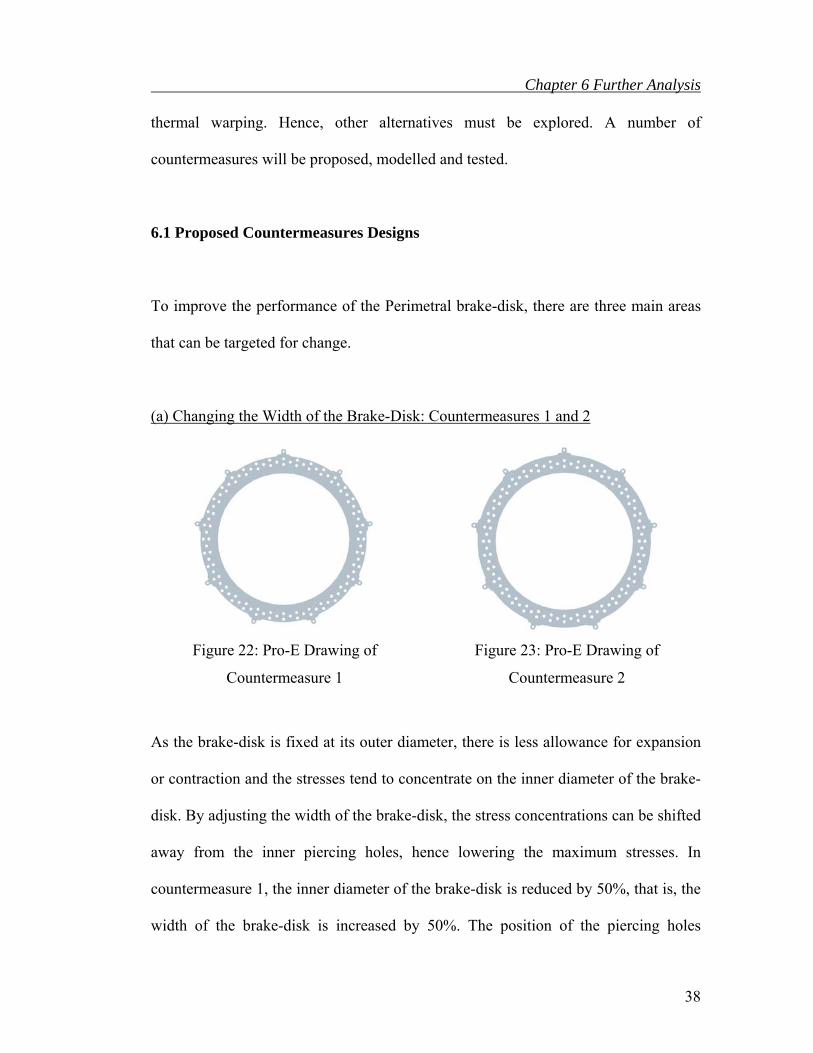
(a) Changing the Width of the Brake-Disk: Countermeasures 1 and 2
Figure 22: Pro-E Drawing of
Countermeasure 1
Figure 23: Pro-E Drawing of
Countermeasure 2
As the brake-disk is fixed at its outer diameter, there is less allowance for expansion
or contraction and the stresses tend to concentrate on the inner diameter of the brake-
disk. By adjusting the width of the brake-disk, the stress concentrations can be shifted
away from the inner piercing holes, hence lowering the maximum stresses. In
countermeasure 1, the inner diameter of the brake-disk is reduced by 50%, that is, the
width of the brake-disk is increased by 50%. The position of the piercing holes
38
Chapter 6 Further Analysis
remains the same on the outer diameter. In countermeasure 2, the inner diameter of
the brake-disk is reduced by 50%, similar to countermeasure 1. The piercing holes are
shifted accordingly to the middle of the brake-disk.
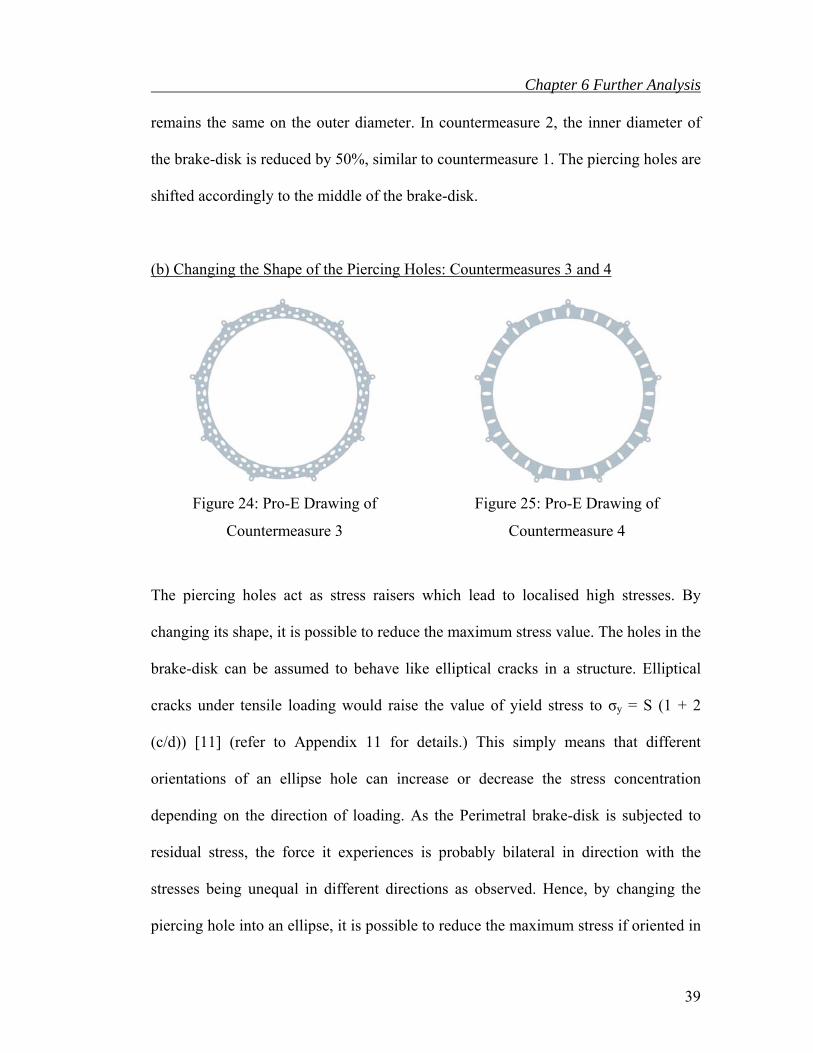
(b) Changing the Shape of the Piercing Holes: Countermeasures 3 and 4
Figure 24: Pro-E Drawing of
Countermeasure 3
Figure 25: Pro-E Drawing of
Countermeasure 4
The piercing holes act as stress raisers which lead to localised high stresses. By
changing its shape, it is possible to reduce the maximum stress value. The holes in the
brake-disk can be assumed to behave like elliptical cracks in a structure. Elliptical
cracks under tensile loading would raise the value of yield stress to σy = S (1 + 2
(c/d)) [11] (refer to Appendix 11 for details.) This simply means that different
orientations of an ellipse hole can increase or decrease the stress concentration
depending on the direction of loading. As the Perimetral brake-disk is subjected to
residual stress, the force it experiences is probably bilateral in direction with the
stresses being unequal in different directions as observed. Hence, by changing the
piercing hole into an ellipse, it is possible to reduce the maximum stress if oriented in
39
Chapter 6 Further Analysis
40
the right direction. In countermeasure 3, the inner piercing holes are replaced by
elliptical holes with its larger radius in the radial direction. In countermeasure 4,
elliptical holes are used to replace all circular holes, with the smaller radius in the
radial direction.
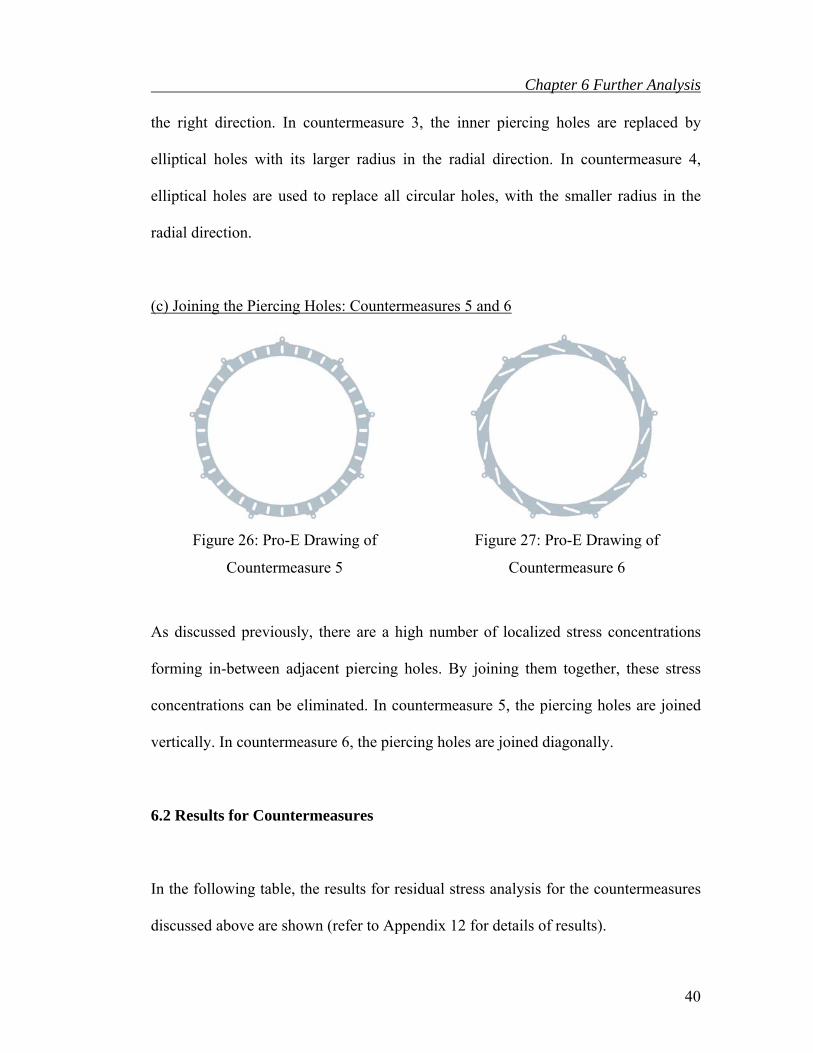
(c) Joining the Piercing Holes: Countermeasures 5 and 6
In the following table, the results for residual stress analysis for the countermeasures
discussed above are shown (refer to Appendix 12 for details of results).
6.2 Results for Countermeasures
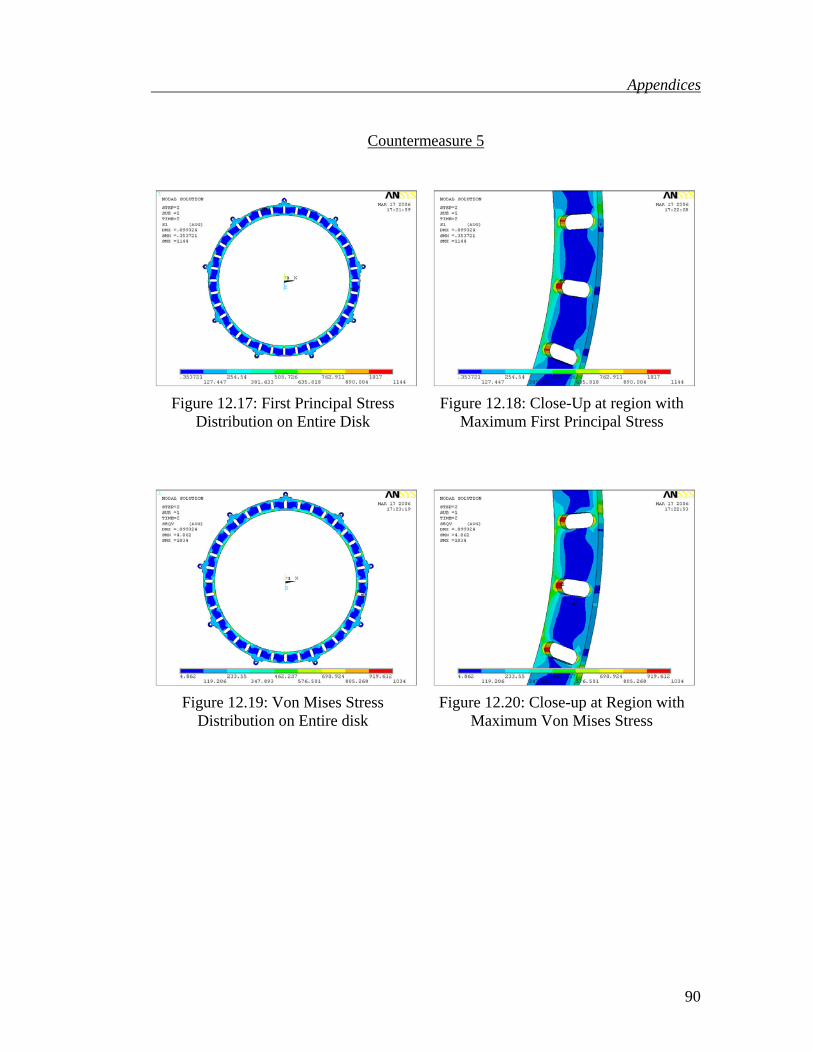
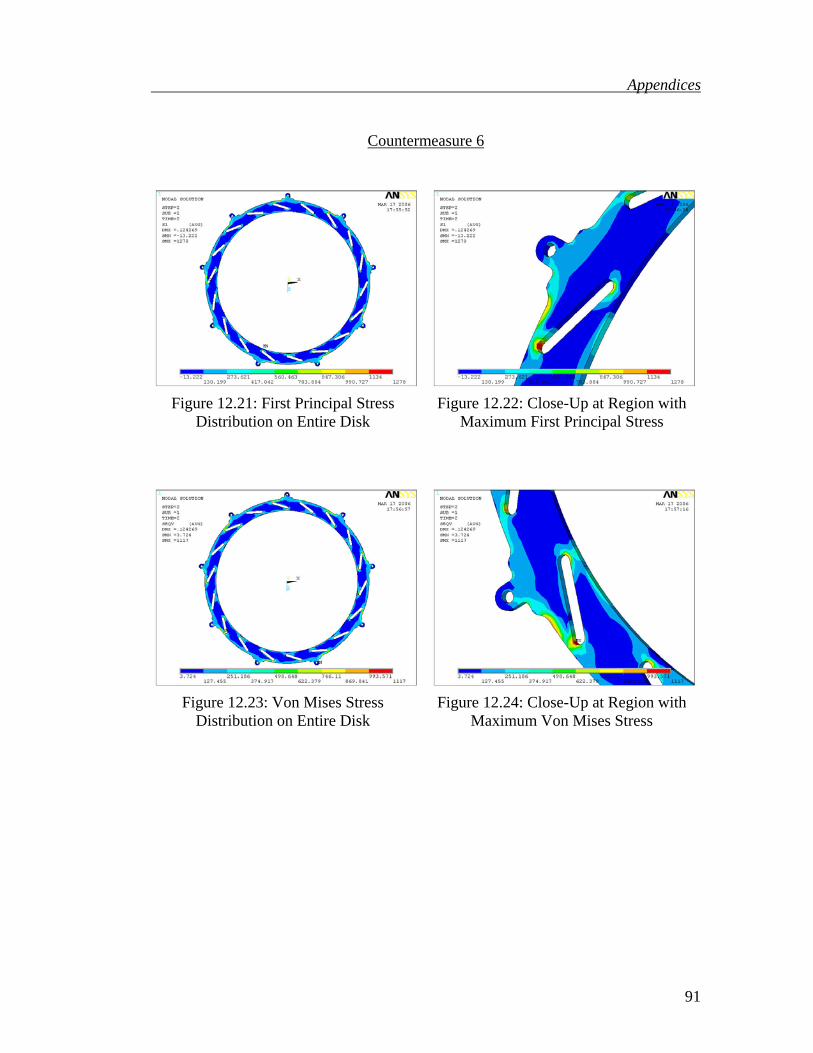
As discussed previously, there are a high number of localized stress concentrations
forming in-between adjacent piercing holes. By joining them together, these stress
concentrations can be eliminated. In countermeasure 5, the piercing holes are joined
vertically. In countermeasure 6, the piercing holes are joined diagonally.
Figure 26: Pro-E Drawing of
Countermeasure 5
Figure 27: Pro-E Drawing of
Countermeasure 6
Chapter 6 Further Analysis
41
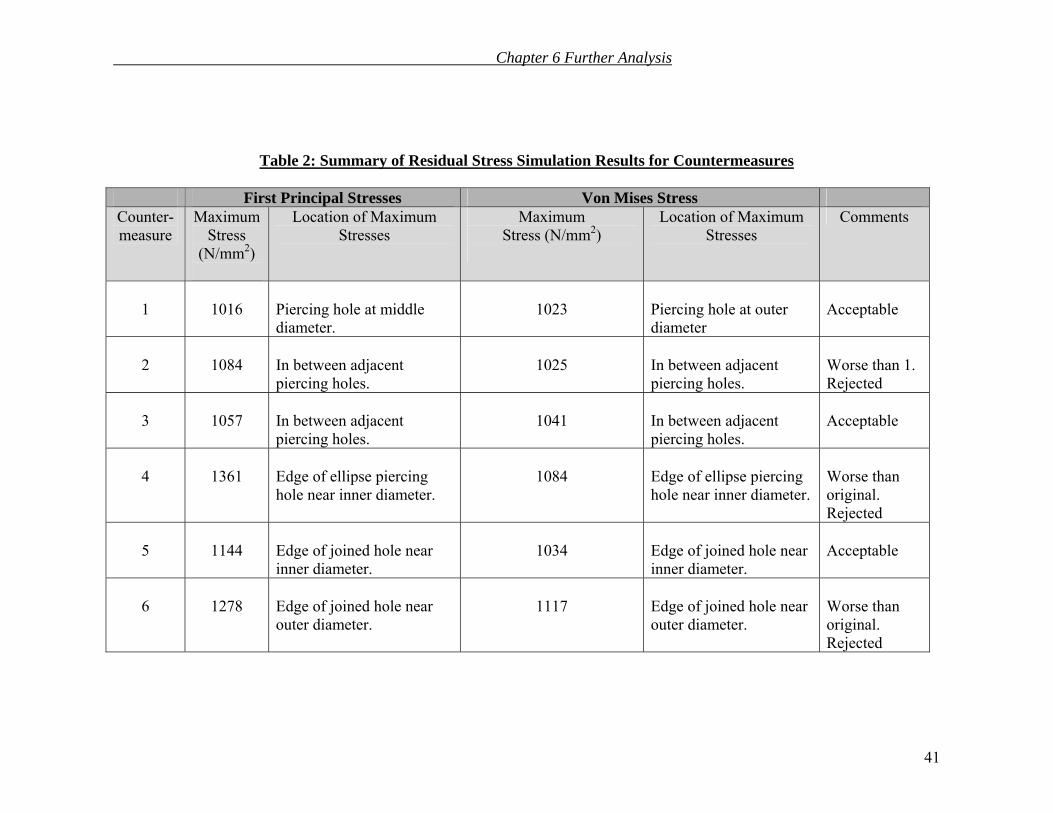
Table 2: Summary of Residual Stress Simulation Results for Countermeasures
First Principal Stresses Von Mises Stress Counter- measure
Maximum Stress
(N/mm2)
Location of Maximum Stresses
Maximum Stress (N/mm2)
Location of Maximum Stresses
Comments
1
1016
Piercing hole at middle diameter.
1023
Piercing hole at outer diameter
Acceptable
2
1084
In between adjacent piercing holes.
1025
In between adjacent piercing holes.
Worse than 1. Rejected
3
1057
In between adjacent piercing holes.
1041
In between adjacent piercing holes.
Acceptable
4
1361
Edge of ellipse piercing hole near inner diameter.
1084
Edge of ellipse piercing hole near inner diameter.
Worse than original. Rejected
5
1144
Edge of joined hole near inner diameter.
1034
Edge of joined hole near inner diameter.
Acceptable
6
1278
Edge of joined hole near outer diameter.
1117
Edge of joined hole near outer diameter.
Worse than original. Rejected

Chapter 6 Further Analysis
6.3 Interpretation of Results
As seen from Table 2, the maximum stresses experienced by countermeasures 1 and 3
during residual stress simulation are lower than that of the original Perimetral brake-
disk. Among all the designs, countermeasure 1 gives the greatest reduction in First
principal Stress (8% reduction). In countermeasure 5, although the maximum stresses
are similar to the original, the high stress concentrations previously found between
the adjacent piercing holes are eliminated. It is observed that the number of local
stress concentrations is reduced with this design.
Other than the stress level, it is also important to consider other factors like the
weight, processing cost, die-set tooling cost. The table below shows the effect of the
countermeasures and other costs or factors to be considered. The final design choice
can only be made after weighing the importance of these factors against each other.
Table 3: Design Factors to be Considered
Factors to be Considered Counter-measure
Maximum Stress level
Number of stress
concentration points
Weight
Processing / Tooling cost
1
Reduced (better than 2)
Almost the Same About 50% increase
More raw materials needed
3 Reduced Almost the Same Almost the Same
New Ellipse piercing hole die-set needed
5 Almost the same
Greatly reduced Almost the Same
New die-set needed
42

Chapter 7 Conclusion
Chapter 7 Conclusion
In this final year project, three-dimensional modelling and meshing using the
simulation program ANSYS were successfully implemented. The two-dimensional
technique previously used by Sunstar has been successfully modified and improved
to using three-dimensional techniques for modelling and simulation. This has allowed
for greater flexibility and accuracy in the results achieved.
The mechanical performances of a conventional brake-disk system and the Perimetral
brake-disk system under three different simulation environments were studied and
compared.
Under torsional strength simulation, the Perimetral brake-disk performs better with its
maximum values of First Principal Stress and Von Mises Stress being significantly
lower than those in the conventional brake-disk, 32% and 22% lower respectively.
This can be attributed to the lower torsional force experienced by the Perimetral disk
due to its larger effective radius.
Under lateral strength simulation, the Perimetral brake-disk yielded almost similar
results to that of the conventional brake-disk, with its maximum First Principal Stress
43
Chapter 7 Conclusion
being almost the same (less than 1% difference) and maximum Von Mises Stress
being about 20% lower.
For both the static tests mentioned, the maximum stresses (weak points) in the
Perimetral brake-disk occur at the mounting holes. Hence, it is important to ensure
that the mounting holes are properly manufactured. It is also recommended to be
properly heat-treated for overall strengthening purposes. On the whole, the Perimetral
brake-disk shows good performance under the static tests, with stress values lower or
close to those of the conventional brake-disk. Since the conventional brake-disk is
already proven to be safe for use, it is reasonable to conclude that the Perimetral
brake-disk would perform likewise.
For the most important test: the residual stress simulation, the maximum stresses
concentrate at the piercing holes for both brake-disks. For the Perimetral brake-disk,
maximum values of the First Principal Stress and Von Mises Stress are higher than
those in the conventional brake-disk (8% and 7% higher respectively). These
maximum stresses occur at the piercing holes (weak points), especially at the inner
piercing holes. This is due to the design of the brake-disk which concentrates the
stress on the inner diameter during expansion and contraction. At these weak points
(the inner piercing holes), there is the danger of yielding or crack initiation under
repeated residual stresses.
44
Chapter 7 Conclusion
Many localized stress concentrations (for both First Principal and Von Mises Stresses)
are also found in-between adjacent piercing holes. Compared to the conventional
brake-disk, the numbers of areas with localized stress concentration are much higher.
This indicates that the number of potential points for crack initiation is higher for the
Perimetral brake-disk, thus it may result in a higher risk of failure. These high stress
areas occur on the piercing holes directly in-between the mounting holes, whereas the
piercing holes directly below the mounting holes have much lower stresses.
Designers can use this knowledge to help them predict potential crack initiation
points more accurately.
To counter the potential problem of cracking under residual stress, several
countermeasures have been proposed, modelled and analysed. Among them,
countermeasures 1, 3 and 5 have shown improvements in their performance under
residual stress simulations. These countermeasures are recommended to improve on
the original design of the Perimetral brake-disk.
In making a final design choice, not only should the performance of the brake-disks
be of importance, the considerations of their production costs (as shown in Table 3) is
just as pertinent in the decision making process.
45
Chapter 8 Recommendations
Chapter 8 Recommendations In order to achieve a higher accuracy of results and a better understanding of the
performance of the Perimetral brake-disk, the whole Perimetral brake system
(including the rim and tyres) should be incorporated for simulation. This task will be
facilitated by the three-dimensional modelling and simulation techniques already
implemented in this project.
For a more accurate understanding of the ductile and brittle failure behaviour of the
brake-disk, the prototype of the brake-disk should be manufactured and tested. It is
only through actual experiments and testing that the yielding and cracking behaviour
of the brake-disk be better understood.
46

List of References
List of References
1. Roth, G., “Analysis in Action: The Value of Early Analysis,” SAS IP, Inc., USA, 1999.
2. Zienkiewiez, O. C., and Taylor, R. L., “The Finite Element Method,”
Butterworth Heinemann, 5th edition, 2000, pp. 1-27. 3. Liu, G.R., “Mesh Free Methods, Moving Beyond the Finite Element Method,”
CRC Press, 2002, pp. 1-25. 4. Liu, G.R. and Quek, S.S., “The Finite Element Method: A Practical Course,”
Butterworth Heinemann, 2003, pp. 199-232, 246-280. 5. Kurowski, P. M., “Finite Element Analysis for Design Engineers,” SAE
International, Warrendale, 2004, pp. 1-147. 6. Valvano, T. and Lee, K., “An Analytical Method to Predict Thermal
Distortion of a Brake Rotor,” Society of Automotive Engineers, Inc, 2000. 7. Tan, H.N., “2-D Heat Transfer Analysis Using Meshfree Methods,”
Department of Mechanical Engineering, NUS, 2002/2003, pp. 1-7. 8. ANSYS Modelling and Meshing Guide, ANSYS Release 5.6, SAS IP, Inc.,
4th edition, 1999, Chapter 7. 9. Pilkey, Walter D., “Peterson’s Stress Concentration Factors,” John Wiley and
Sons, Inc., 2nd edition, 1997, pp. 1-59. 10. Yevtushenko, A. and Ivanyk, E., “Determination of Heat and Thermal
Distortion in Braking Systems,” Wear 185, Elsevier, 1995, pp. 159-165. 11. Dowling, N. E., “Mechanical Behaviour of Materials: Engineering Methods
for Deformation, Fracture and Fatigue,” Prentice Hall, 2nd edition, 2000.
47
Appendices
APPENDICES
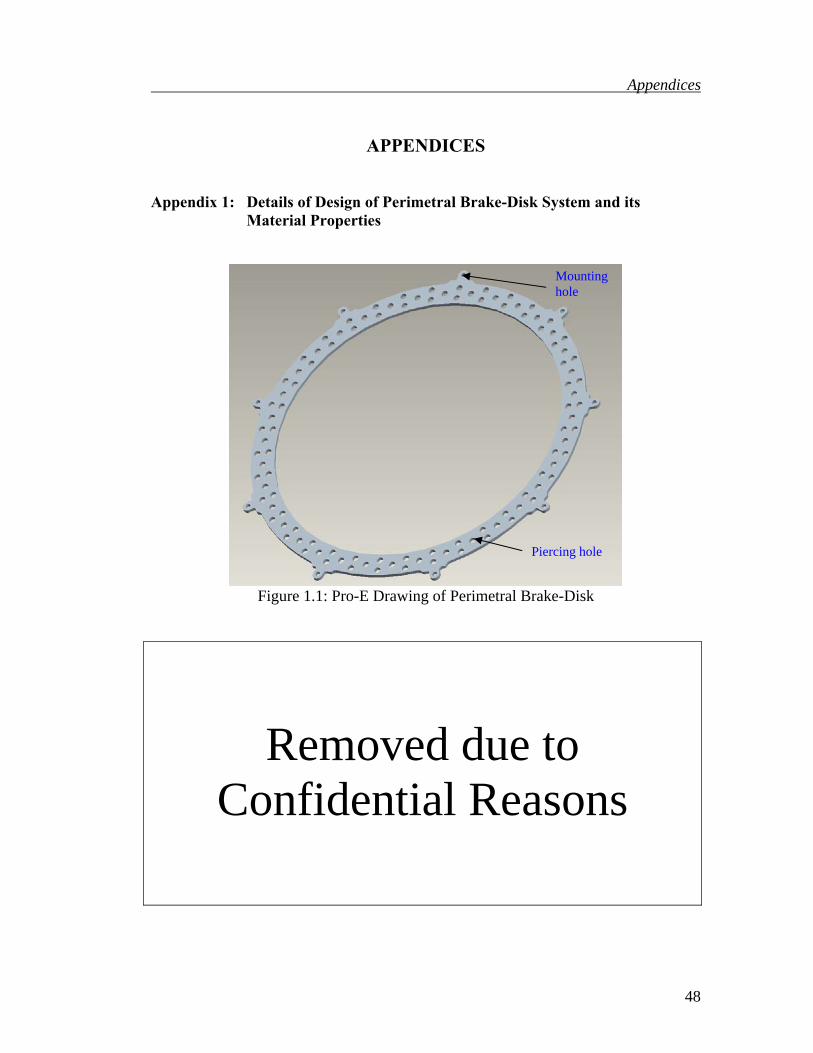
Appendix 1: Details of Design of Perimetral Brake-Disk System and its
Material Properties
Mounting hole
Piercing hole
Figure 1.1: Pro-E Drawing of Perimetral Brake-Disk
Removed due to Confidential Reasons
48
Appendices
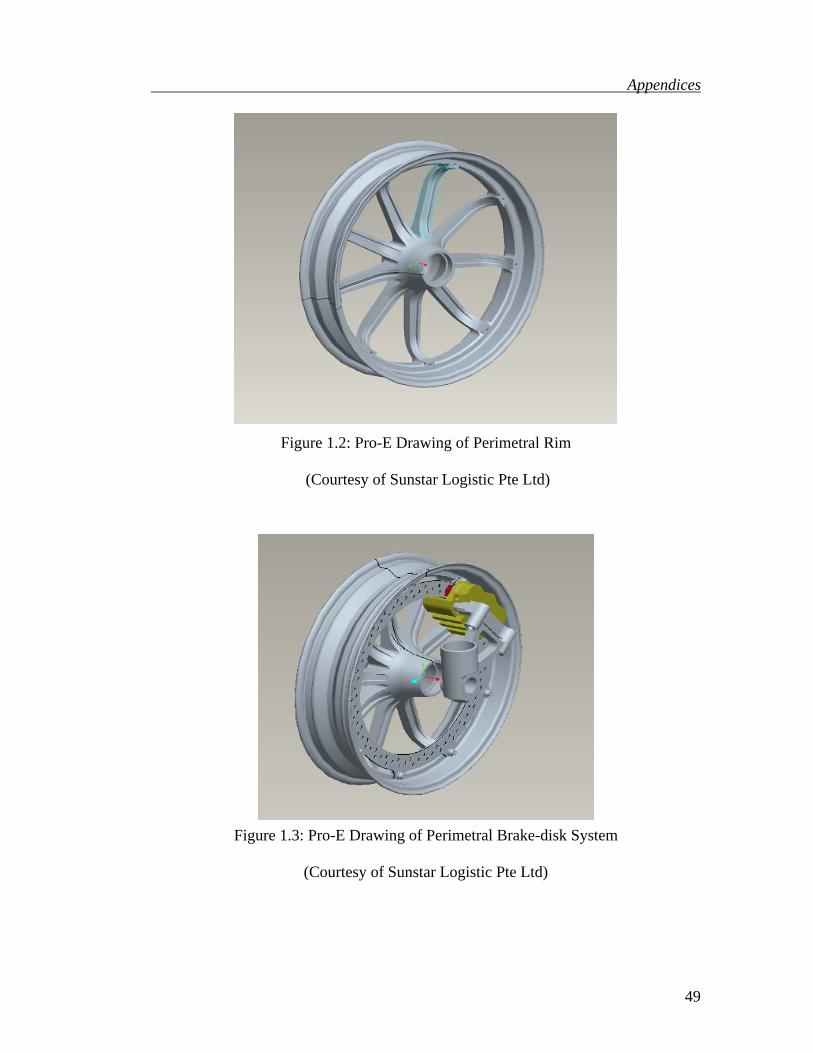
Figure 1.2: Pro-E Drawing of Perimetral Rim
(Courtesy of Sunstar Logistic Pte Ltd)
Figure 1.3: Pro-E Drawing of Perimetral Brake-disk System
(Courtesy of Sunstar Logistic Pte Ltd)
49
Appendices
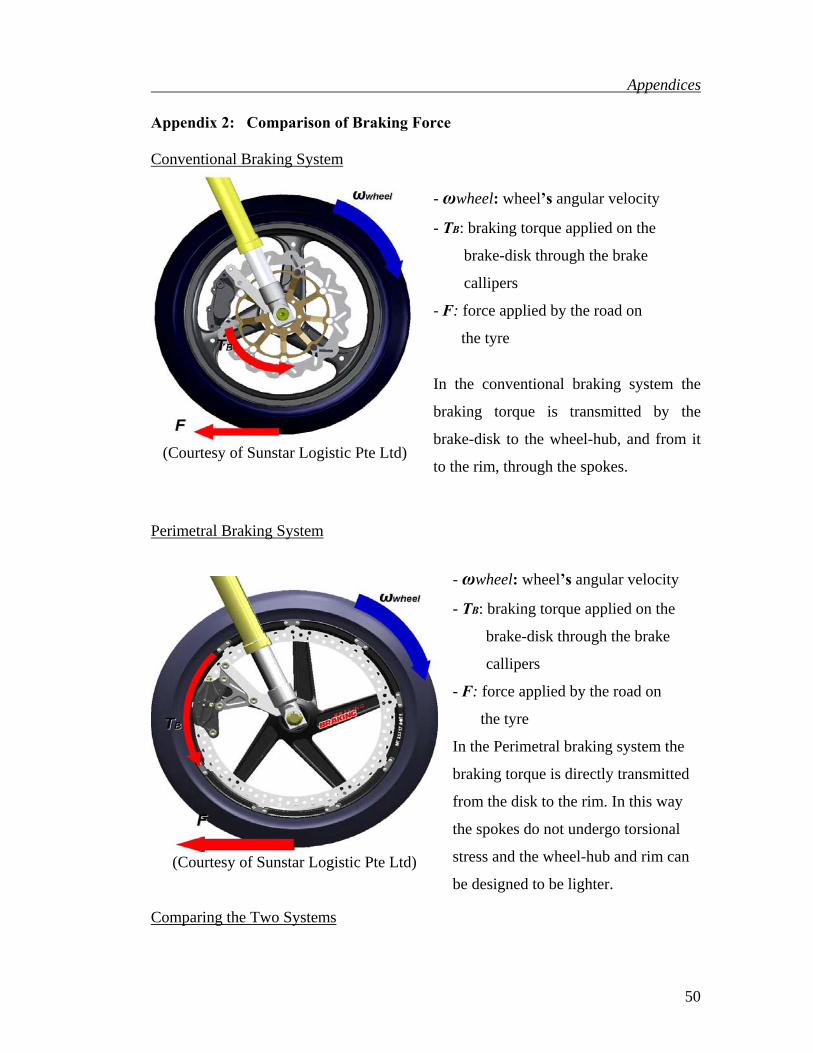
Appendix 2: Comparison of Braking Force Conventional Braking System
(Courtesy of Sunstar Logistic Pte Ltd)
- ωwheel: wheel’s angular velocity
- TB: braking torque applied on the
brake-disk through the brake
callipers
- F: force applied by the road on
the tyre
In the conventional braking system the
braking torque is transmitted by the
brake-disk to the wheel-hub, and from it
to the rim, through the spokes.
Perimetral Braking System
(Courtesy of Sunstar Logistic Pte Ltd)
- ωwheel: wheel’s angular velocity
- TB: braking torque applied on the
brake-disk through the brake
callipers
- F: force applied by the road on
the tyre
In the Perimetral braking system the
braking torque is directly transmitted
from the disk to the rim. In this way
the spokes do not undergo torsional
stress and the wheel-hub and rim can
be designed to be lighter.
Comparing the Two Systems
50
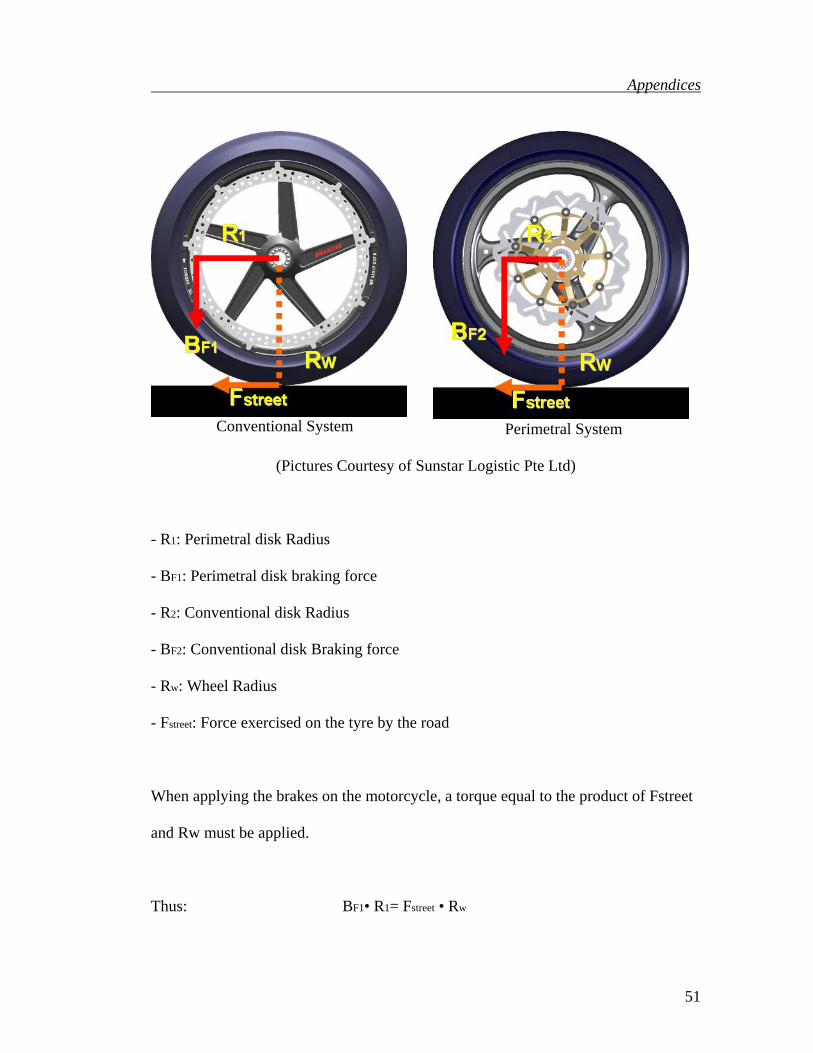
Appendices
Conventional System
Perimetral System
(Pictures Courtesy of Sunstar Logistic Pte Ltd)
- R1: Perimetral disk Radius
- BF1: Perimetral disk braking force
- R2: Conventional disk Radius
- BF2: Conventional disk Braking force
- Rw: Wheel Radius
- Fstreet: Force exercised on the tyre by the road
When applying the brakes on the motorcycle, a torque equal to the product of Fstreet
and Rw must be applied.
Thus: BF1• R1= Fstreet • Rw
51
Appendices
BF2• R2= Fstreet • Rw
So: BF1• R1= BF2• R2
Since R1is greater than R2,
BF1< BF2
Conclusion:
For the same braking power needed, the Perimetral brake system requires a lower
force to be applied, giving the same braking power with a lower force on the brake-
disk.
52
Appendices
Appendix 3: ANSYS Meshing Procedure For Perimetral Brake-Disk
Removed due to Confidential Reasons
53
Appendices
For Conventional Brake-Disk
Removed due to Confidential Reasons
54
Appendices
Appendix 4: Calculation of Maximum Torsional Force Experienced During Hard Braking
Removed due to
Confidential Reasons
55

Appendices
Removed due to
Confidential Reasons
56
Appendices
Appendix 5: ANSYS Procedure for Torsional Strength Simulation
Removed due to Confidential Reasons
57

Appendices
Appendix 6: ANSYS Procedure for Lateral Strength Simulation
Removed due to
Confidential Reasons
58
Appendices
Appendix 7: Calculation of Maximum Temperature in Brake-Disk
Removed due to
Confidential Reasons
59
Appendices
Removed due to
Confidential Reasons
60

Appendices
Appendix 8: Temperature Distribution Profiles and Source Codes
Temperature Profile for Perimetral Brake-disk during Hard Braking
Figure 8.1: Simulated Temperature Profile
during Hard Braking
Figure 8.2: Close-Up of Temperature
Profile
Temperature Profile for Conventional Brake-Disk during Hard Braking
Figure 8.3: Simulated Temperature Profile
during Hard Braking
Figure 8.4: Close-Up of Temperature
Profile
61
Appendices
ANSYS Source Codes for Temperatures Distributions on Nodes For Surface Temperature Distribution of Perimetral Brake-Disk
Removed due to
Confidential Reasons
62
Appendices
Removed due to
Confidential Reasons
63
Appendices
Removed due to
Confidential Reasons
64
Appendices
Appendix 9: ANSYS Procedure for Residual Stress Simulation
Removed due to
Confidential Reasons
65
Appendices
For Conventional Brake-Disk
Removed due to
Confidential Reasons
66

Appendices
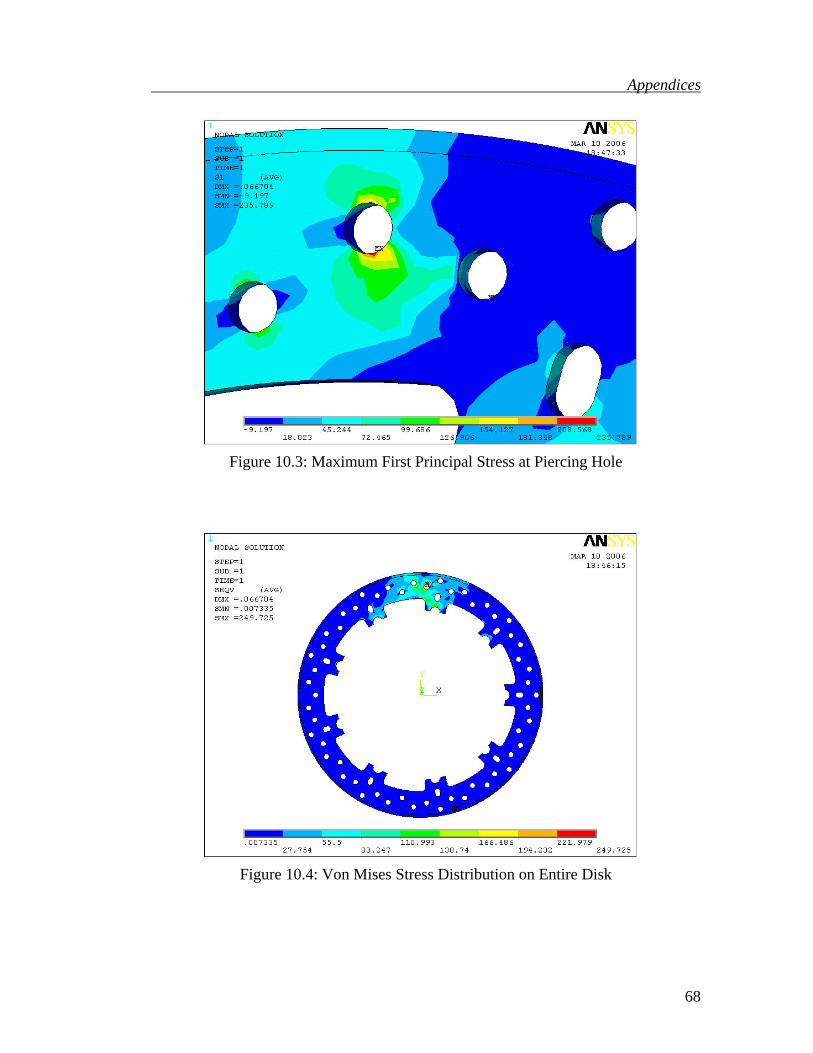
Appendix 10: Details of Simulation Results A) Results of Torsional Strength Simulations For Conventional Brake-Disk
Figure 10.1: First Principal Stress Distribution on Entire Disk
Figure 10.2: First Principal Stress Concentrations near Applied Torsional Load
67
Appendices
Figure 10.3: Maximum First Principal Stress at Piercing Hole
Figure 10.4: Von Mises Stress Distribution on Entire Disk
68
Appendices
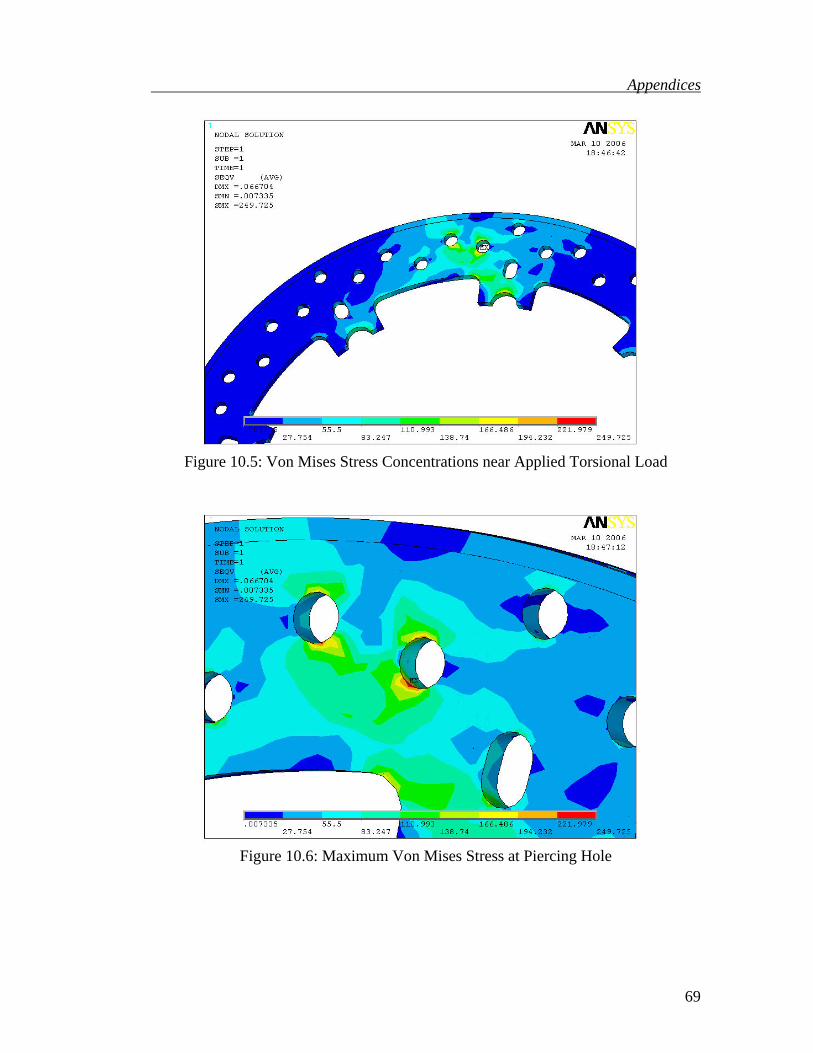
Figure 10.5: Von Mises Stress Concentrations near Applied Torsional Load
Figure 10.6: Maximum Von Mises Stress at Piercing Hole
69

Appendices
For Perimetral Brake-Disk
Figure 10.7: First Principal Stress Distribution on Entire Disk
Figure 10.8: First Principal Stress Concentrations near Applied Torsional Load
70
Appendices
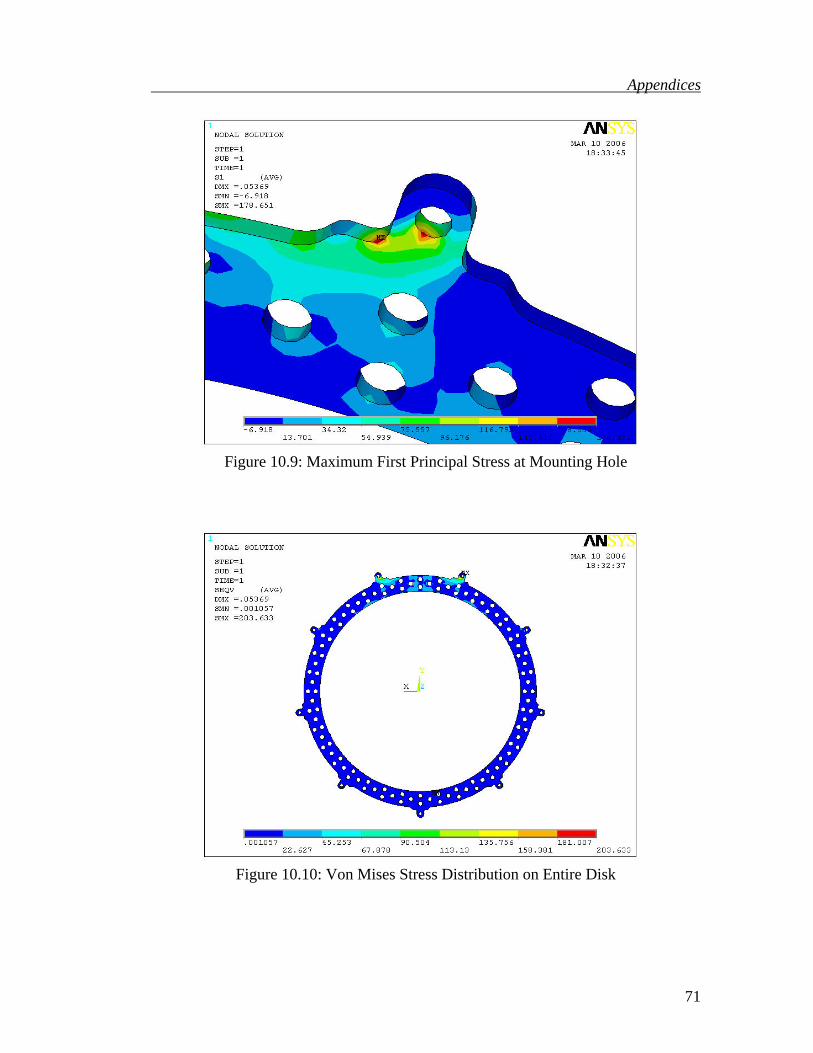
Figure 10.9: Maximum First Principal Stress at Mounting Hole
Figure 10.10: Von Mises Stress Distribution on Entire Disk
71

Appendices
Figure 10.11: Von Mises Stress Concentrations near Applied Torsional Load
Figure 10.12: Maximum Von Mises Stress at Mounting Hole
72
Appendices
B) Results of Lateral Strength Simulations For Conventional Brake-Disk
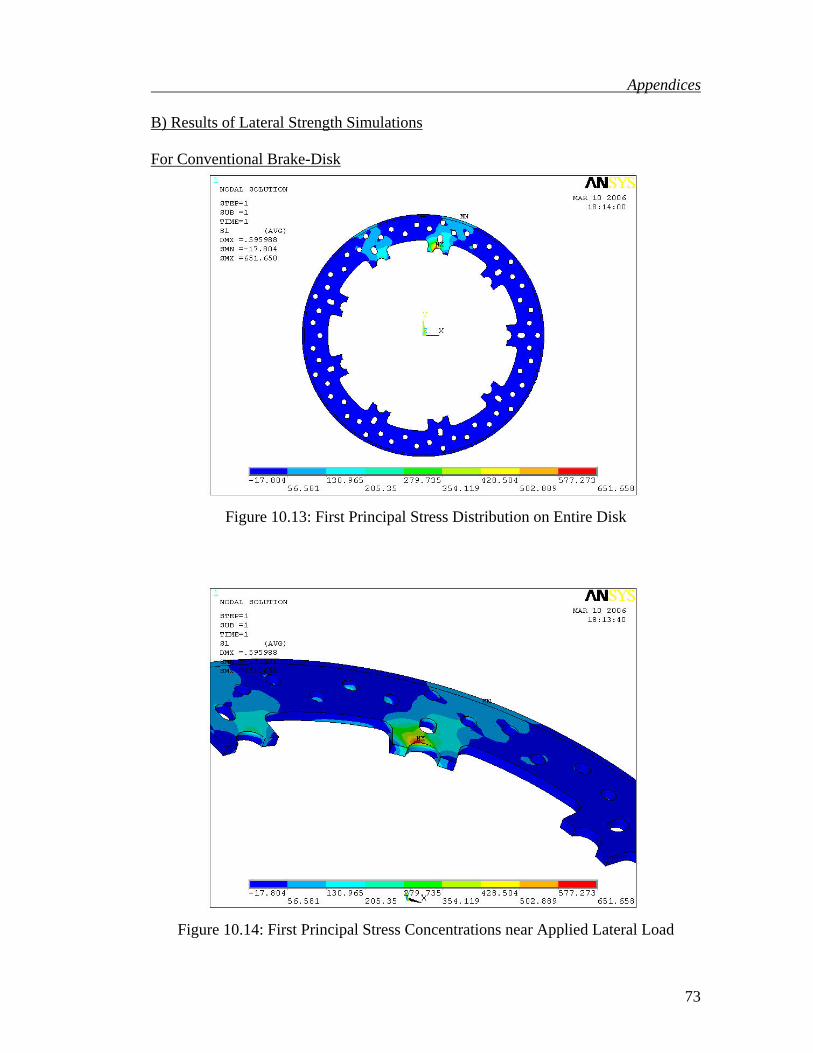
Figure 10.13: First Principal Stress Distribution on Entire Disk
Figure 10.14: First Principal Stress Concentrations near Applied Lateral Load
73

Appendices
Figure 10.15: Maximum First Principal Stress at Pin Connection
Figure 10.16: Von Mises Stress Distribution on Entire Disk
74

Appendices
Figure 10.17: Von Mises Stress Concentrations near Applied Lateral Load
Figure 10.18: Maximum Von Mises Stress at Pin Connection
75
Appendices
For Perimetral Brake-Disk
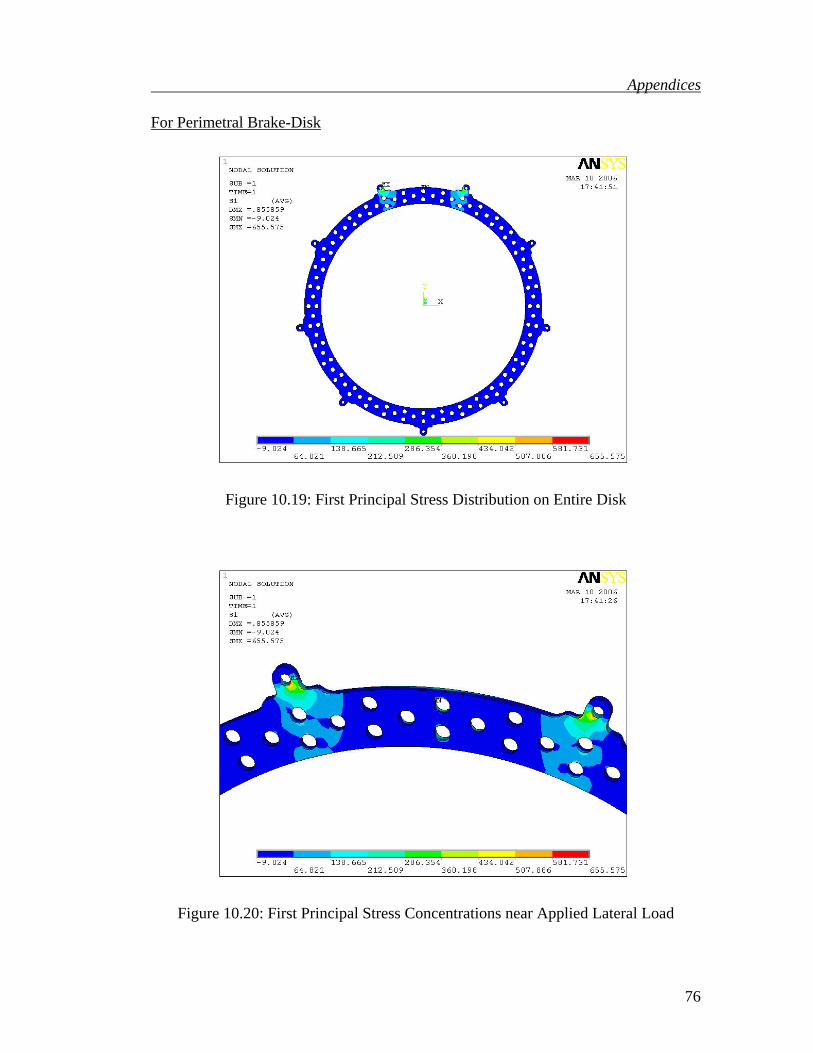
Figure 10.19: First Principal Stress Distribution on Entire Disk
Figure 10.20: First Principal Stress Concentrations near Applied Lateral Load
76
Appendices
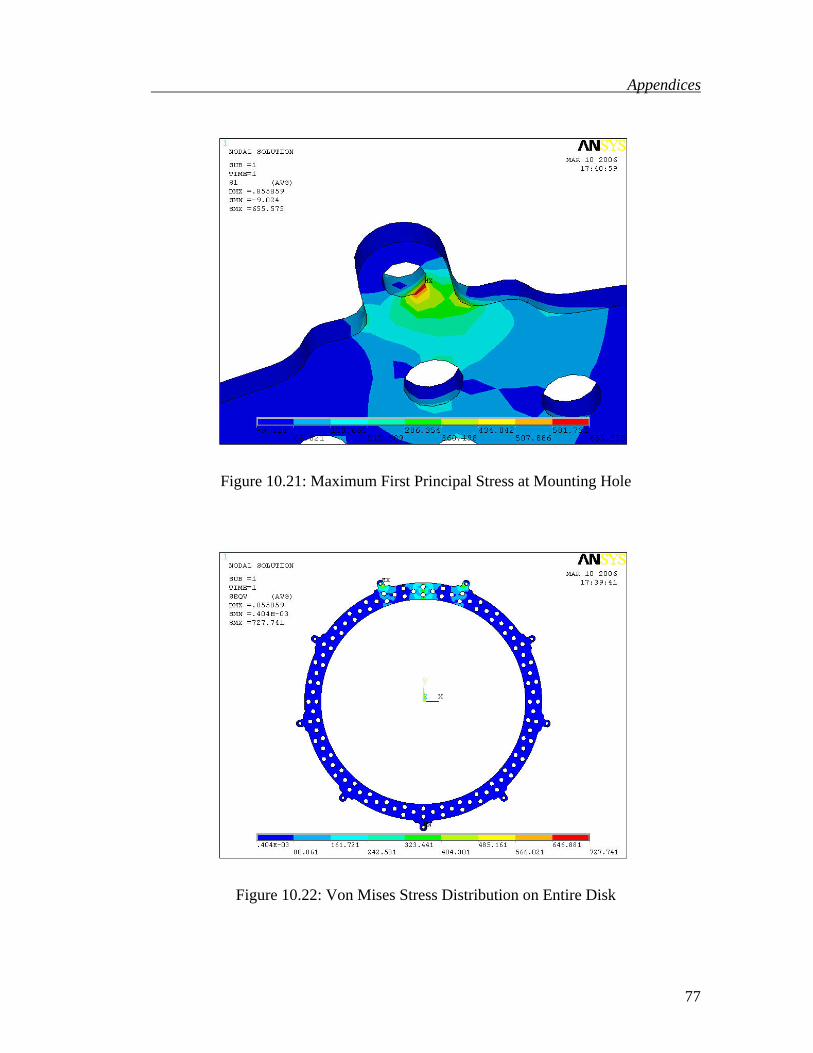
Figure 10.21: Maximum First Principal Stress at Mounting Hole
Figure 10.22: Von Mises Stress Distribution on Entire Disk
77
Appendices
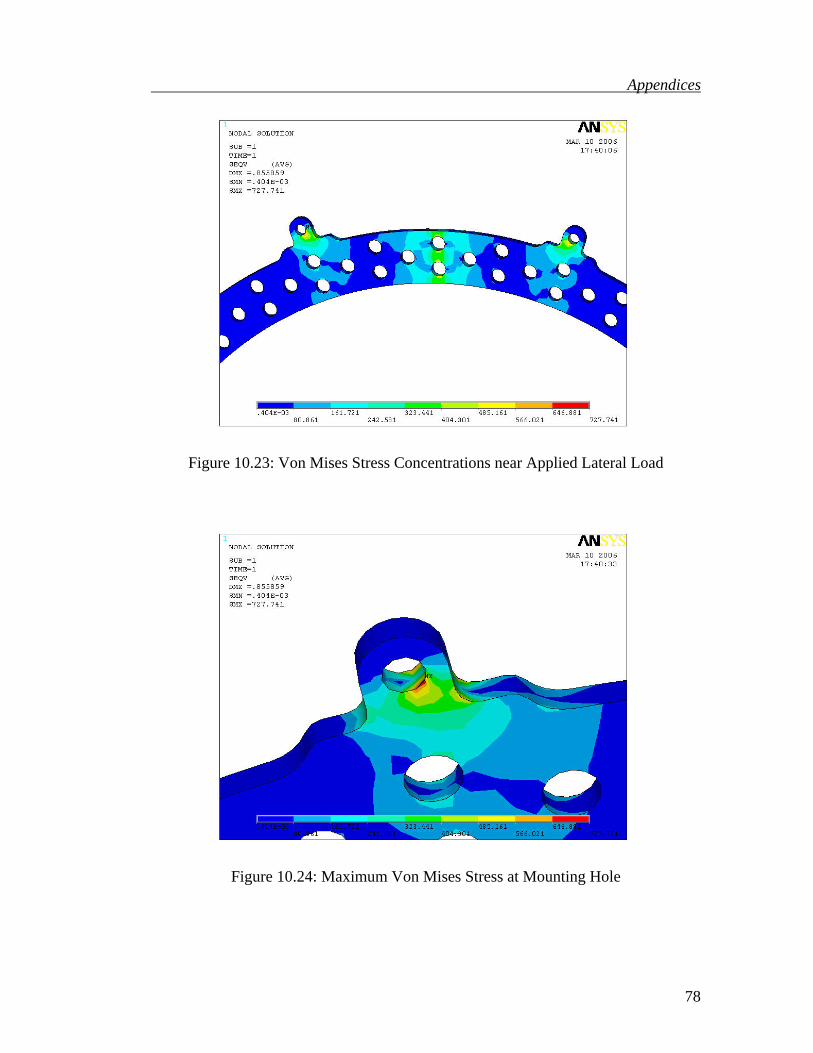
Figure 10.23: Von Mises Stress Concentrations near Applied Lateral Load
Figure 10.24: Maximum Von Mises Stress at Mounting Hole
78
Appendices
C) Results of Residual Strength Simulations For Conventional Brake-Disk
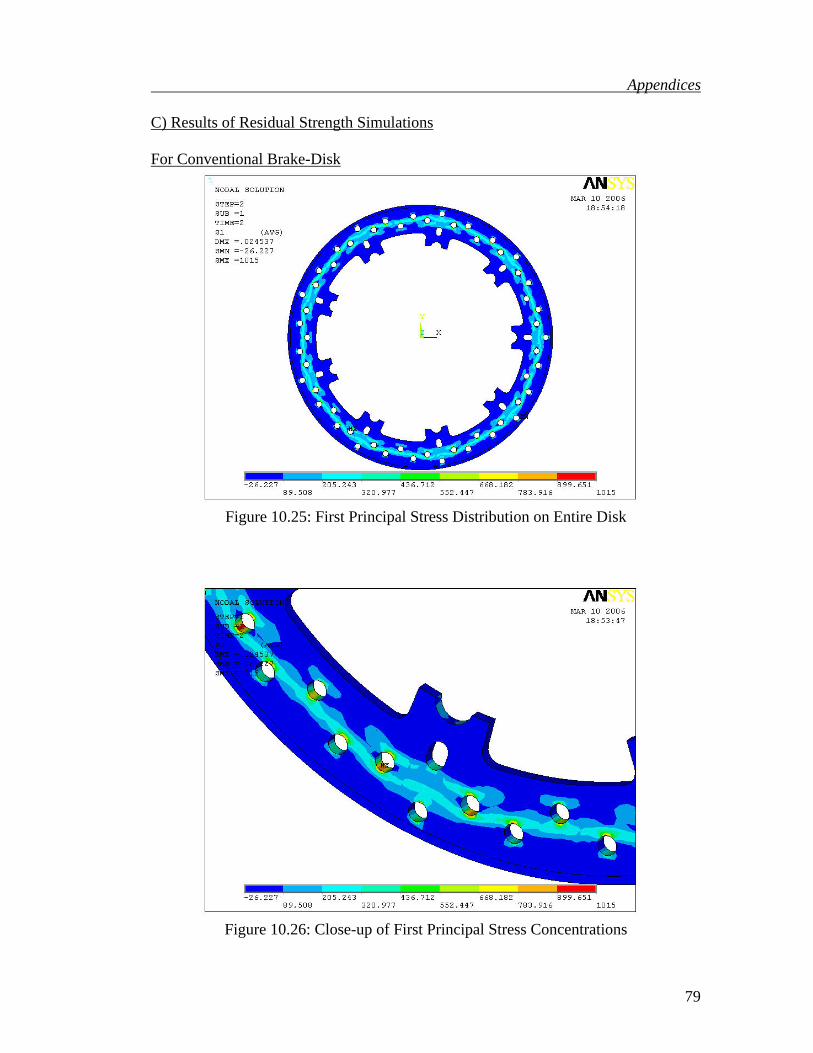
Figure 10.25: First Principal Stress Distribution on Entire Disk
Figure 10.26: Close-up of First Principal Stress Concentrations
79

Appendices
Figure 10.27: Maximum First Principal Stress at Piercing Hole
Figure 10.28: Von Mises Stress Distribution on Entire Disk
80
Appendices
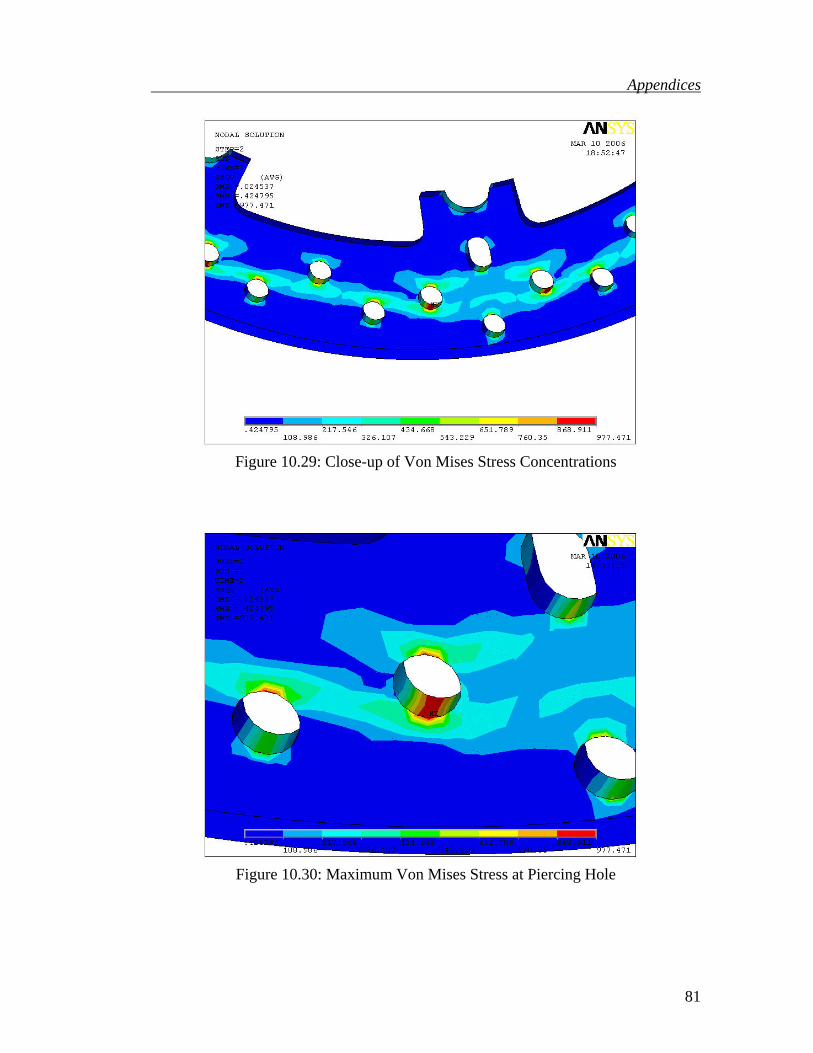
Figure 10.29: Close-up of Von Mises Stress Concentrations
Figure 10.30: Maximum Von Mises Stress at Piercing Hole
81

Appendices
For Perimetral Brake-Disk
Figure 10.31: First Principal Stress Distribution on Entire Disk
Figure 10.32: Close-up - First Principal Stress Concentrations
82
Appendices
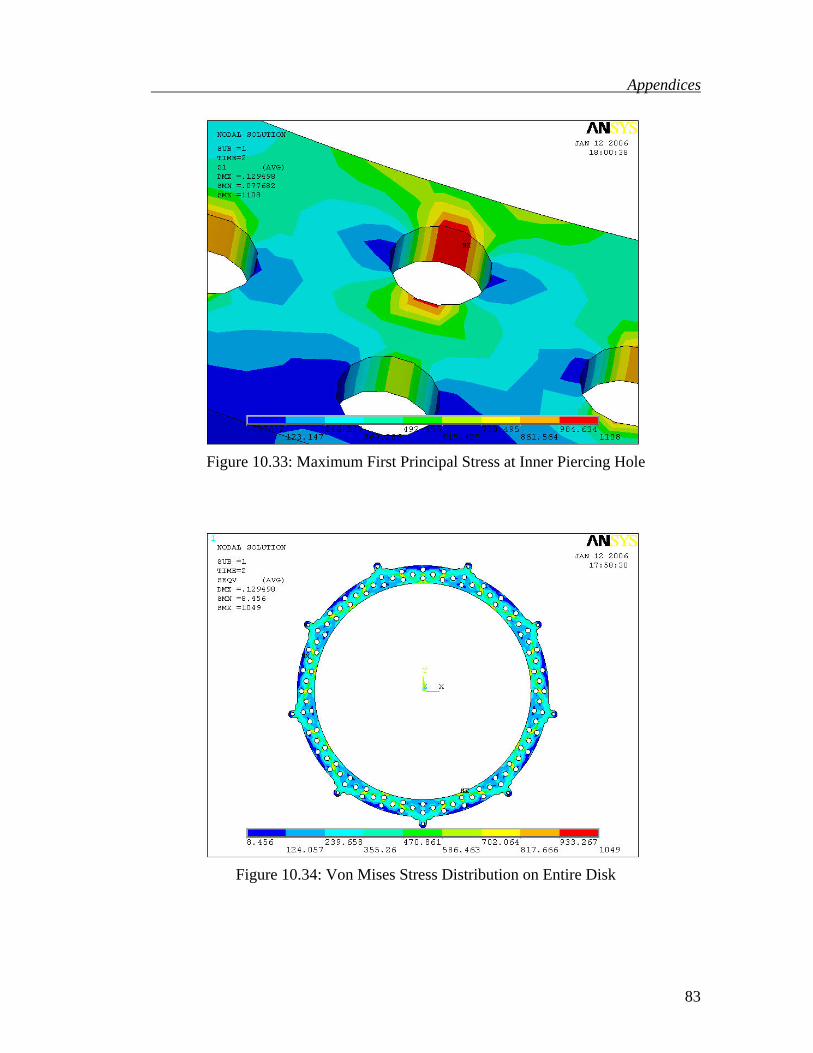
Figure 10.33: Maximum First Principal Stress at Inner Piercing Hole
Figure 10.34: Von Mises Stress Distribution on Entire Disk
83
Appendices
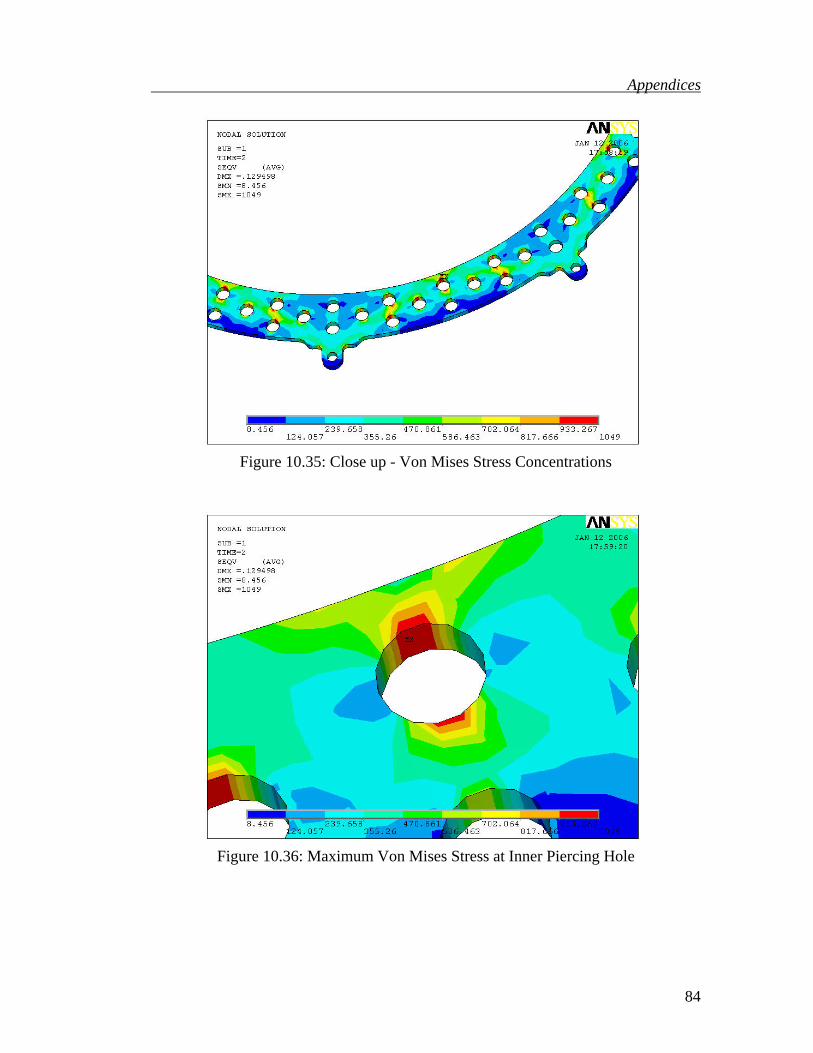
Figure 10.35: Close up - Von Mises Stress Concentrations
Figure 10.36: Maximum Von Mises Stress at Inner Piercing Hole
84
Appendices
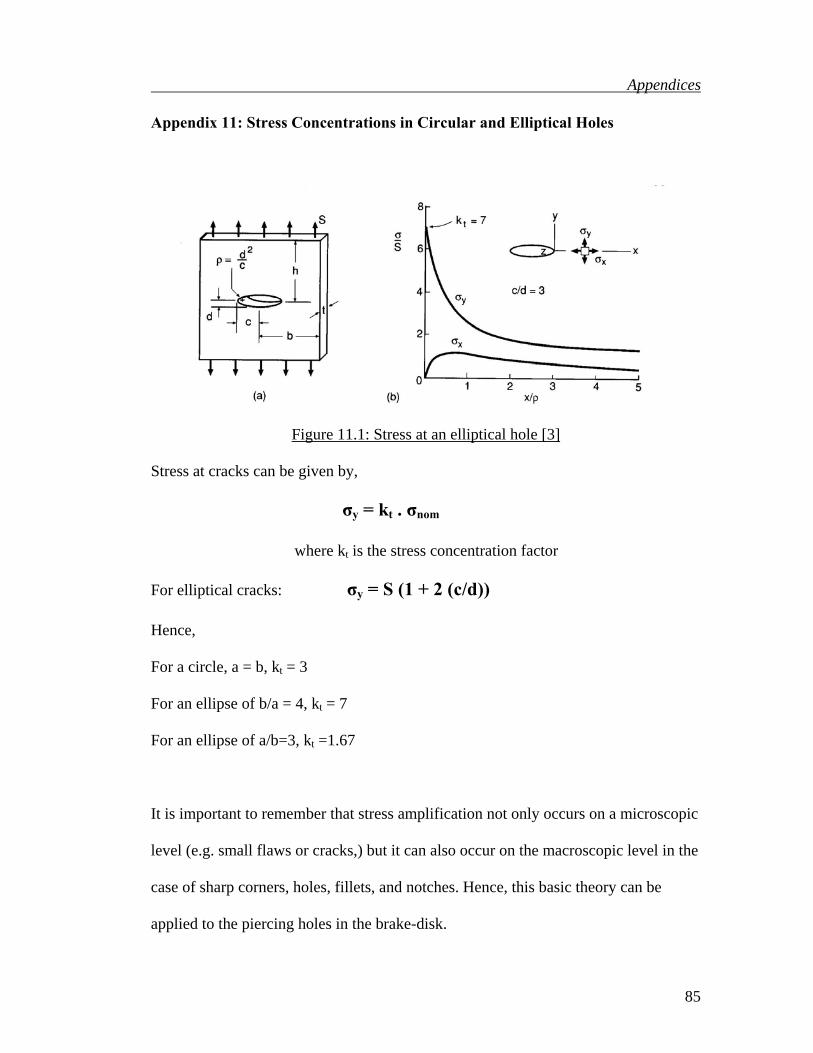
Appendix 11: Stress Concentrations in Circular and Elliptical Holes
Figure 11.1: Stress at an elliptical hole [3]
Stress at cracks can be given by,
σy = kt . σnom
where kt is the stress concentration factor
For elliptical cracks: σy = S (1 + 2 (c/d))
Hence,
For a circle, a = b, kt = 3
For an ellipse of b/a = 4, kt = 7
For an ellipse of a/b=3, kt =1.67
It is important to remember that stress amplification not only occurs on a microscopic
level (e.g. small flaws or cracks,) but it can also occur on the macroscopic level in the
case of sharp corners, holes, fillets, and notches. Hence, this basic theory can be
applied to the piercing holes in the brake-disk.
85
Appendices
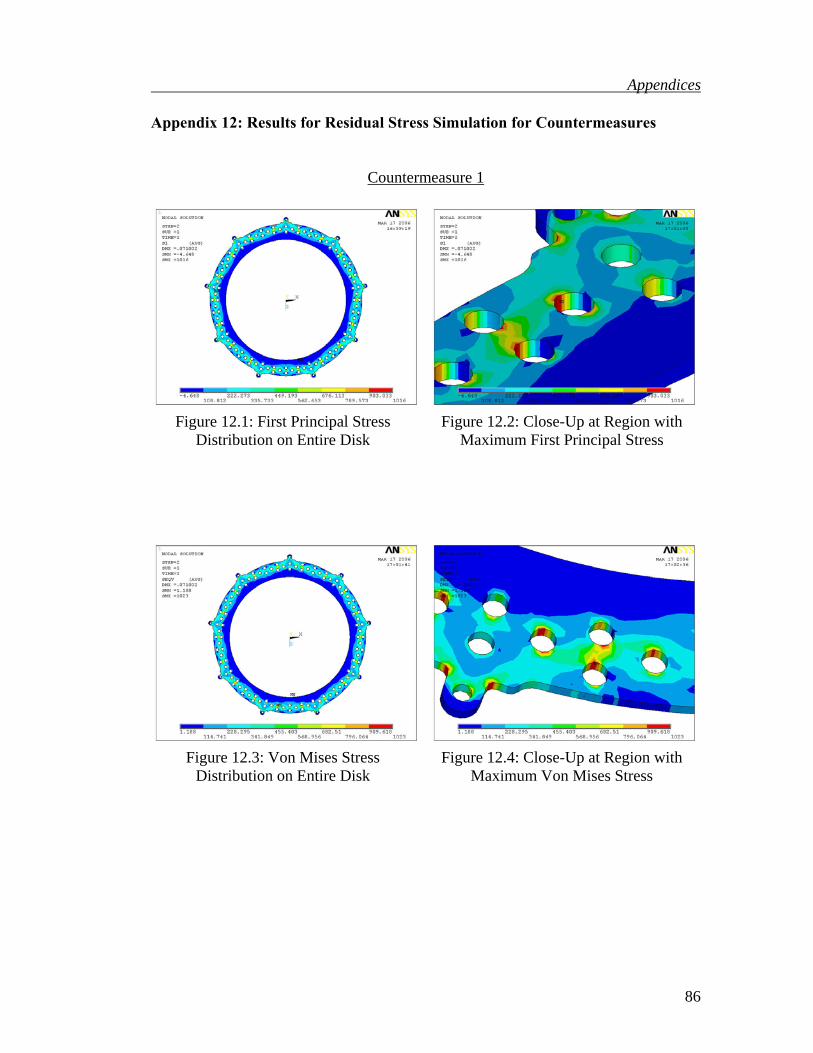
Appendix 12: Results for Residual Stress Simulation for Countermeasures
Countermeasure 1
Figure 12.1: First Principal Stress Distribution on Entire Disk
Figure 12.2: Close-Up at Region with Maximum First Principal Stress
Figure 12.3: Von Mises Stress Distribution on Entire Disk
Figure 12.4: Close-Up at Region with Maximum Von Mises Stress
86
Appendices
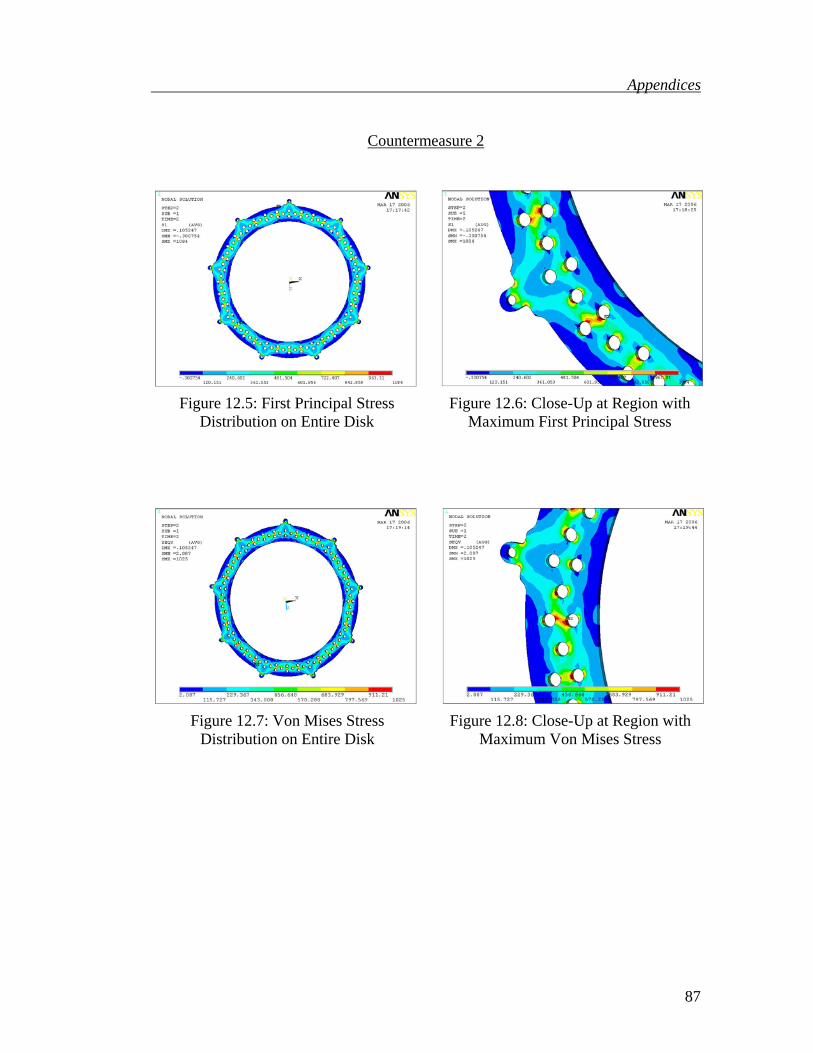
Countermeasure 2
Figure 12.5: First Principal Stress Distribution on Entire Disk
Figure 12.6: Close-Up at Region with Maximum First Principal Stress
Figure 12.7: Von Mises Stress Distribution on Entire Disk
Figure 12.8: Close-Up at Region with Maximum Von Mises Stress
87

Appendices
Countermeasure 3
Figure 12.9: First Principal Stress Distribution on Entire Disk
Figure 12.10: Close-Up at Region with Maximum First Principal Stress
Figure 12.11: Von Mises Stress Distribution on Entire Disk
Figure 12.12: Close-Up at Region with Maximum Von Mises Stress
88

Appendices
Countermeasure 4
Figure 12.13: First Principal Stress Distribution on Entire Disk
Figure 12.14: Close-Up at Region with Maximum First Principal Stress
Figure 12.15: Von Mises Stress Distribution on Entire Disk
Figure 12.16: Close-Up at Region with Maximum Von Mises Stress
89
Appendices
Countermeasure 5
Figure 12.17: First Principal Stress Distribution on Entire Disk
Figure 12.18: Close-Up at region with Maximum First Principal Stress
Figure 12.19: Von Mises Stress Distribution on Entire disk
Figure 12.20: Close-up at Region with Maximum Von Mises Stress
90
Appendices
Countermeasure 6
Figure 12.21: First Principal Stress Distribution on Entire Disk
Figure 12.22: Close-Up at Region with Maximum First Principal Stress
Figure 12.23: Von Mises Stress Distribution on Entire Disk
Figure 12.24: Close-Up at Region with Maximum Von Mises Stress
91