yum! brands - 2014 analyst meeting presentation
TRANSCRIPT


Steve Schmitt

Safe Harbor Statement
This announcement, any related announcements and the related webcast may contain “forward-looking statements” within the meaning of
Section 27A of the Securities Act of 1933 and Section 21E of the Securities Exchange Act of 1934. We intend all forward-looking statements to
be covered by the safe harbor provisions of the Private Securities Litigation Reform Act of 1995. Forward-looking statements can be identified
by the fact that they do not relate strictly to historical or current facts. Our forward-looking statements are subject to risks and uncertainties,
which may cause actual results to differ materially from those projected. Factors that can cause our actual results to differ materially include, but
are not limited to: food safety and food borne-illness issues; changes in economic conditions, consumer preferences, tax rates and laws and the
regulatory environment, as well as increased competition and other risks in China, where a significant and growing portion of our restaurants are
located; changes in economic and political conditions in the other countries outside the U.S. where we operate; the impact or threat of any
widespread illness or outbreaks of viruses or other diseases; our ability to protect the integrity and security of individually identifiable data of our
customers and employees; our ability to secure and maintain distribution and adequate supply to our restaurants; the success of our
international development strategy; commodity, labor and other operating costs; the continued viability and success of our franchise and license
operators; consumer preferences and perceptions of our brands; the impact of social media; a potential suspension of the Chinese affiliate of
our independent auditor; pending or future litigation and legal claims or proceedings; changes in or noncompliance with government regulations;
tax matters, including disagreements with taxing authorities; significant changes in global economic conditions, including consumer spending,
consumer confidence and unemployment; and competition within the retail food industry, including with respect to price and quality of food
products, new product development, advertising levels and promotional initiatives, customer service, reputation, restaurant location, and
attractiveness and maintenance of properties. You should consult our filings with the Securities and Exchange Commission (including the
information set forth under the captions “Risk Factors” and “Forward-Looking Statements” in our Annual Report on Form 10-K) for additional
detail about factors that could affect our financial and other results. Forward-looking statements are based on current expectations and
assumptions and currently available data and are neither predictions nor guarantees of future events or performance. You should not place
undue reliance on forward-looking statements, which speak only as of the date hereof. We are not undertaking to update any of these
statements.
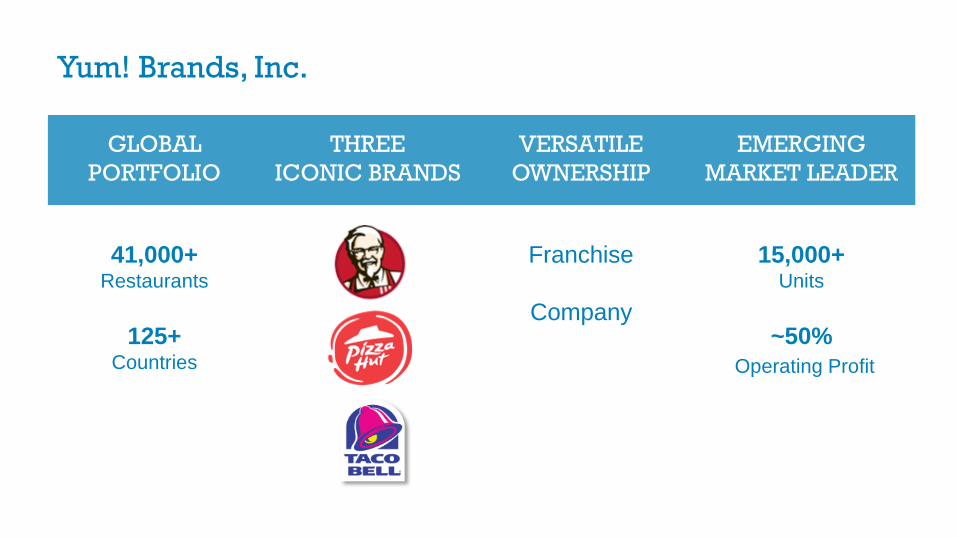
GLOBAL
PORTFOLIO
THREE
ICONIC BRANDS
VERSATILE
OWNERSHIP
EMERGING
MARKET LEADER
41,000+ Restaurants
125+ Countries
Franchise
Company
15,000+Units
~50%
Operating Profit
Yum! Brands, Inc.
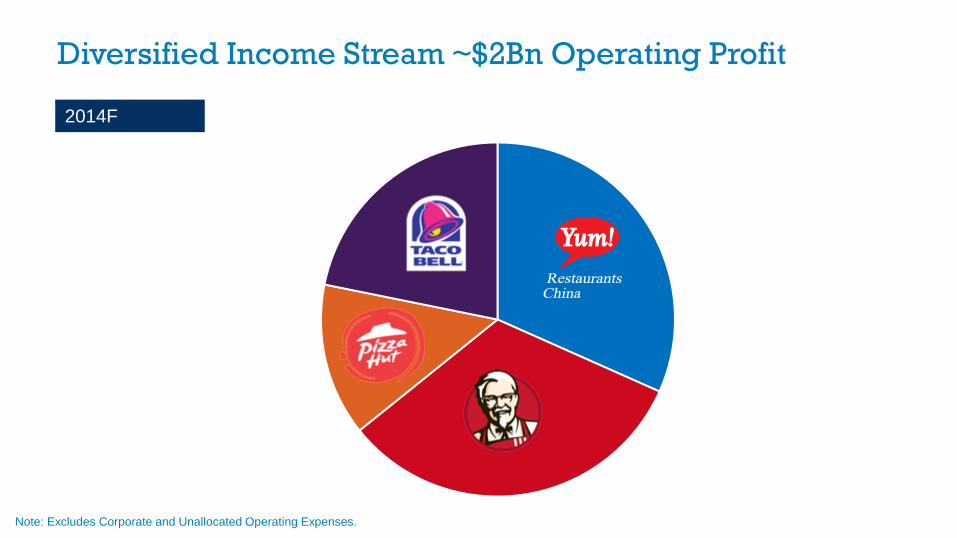
Diversified Income Stream ~$2Bn Operating Profit
Note: Excludes Corporate and Unallocated Operating Expenses.
2014F

Tremendous Growth Opportunity for Each Division
New-Unit Development, SSSG and High Returns

David Novak


13% 13%15%
13%14%
15%14%
13%
17%
14%13%
-9%
MSD
2002 2003 2004 2005 2006 2007 2008 2009 2010 2011 2012 2013 2014F
Yum! Dynasty Growth Model At Least 10% EPS EveryYear
EPS Growth, Ex Special Items
At Least
10 %
GOAL: RESTORE CONSISTENCY

#1 Priority: China Turnaround
2012 2014F Future
$1.7
$1.4
Average Unit Volumes ($’MM)
6,100+
Units
$2Bn
System
Sales~$1.7+
$600MM+ PROFIT
TREMENDOUS LEVERAGE
Note: Excludes Little Sheep, East Dawning and Pizza Hut Home Service.

The POWER of

Diversification
• Three Iconic Brands
• Strong in Developed Markets
• Lead in Emerging Markets
• Global Control

100% Focused Teams
• By Brand Centrally & Locally
• China & India (1Bn+ People)
• Yum! Added Value

Massive Scale
• Supply Chain
• Talent Magnet / Leadership Development
• Know-how Sharing
• Financial Strength

International Franchise Infrastructure
• 1,000+ Franchisees
– Goal: ~95% Franchised Outside of China/India
– 40% of Restaurants Owned By Franchisees
Who Operate More than One Brand
– Huge Advantage for Taco Bell
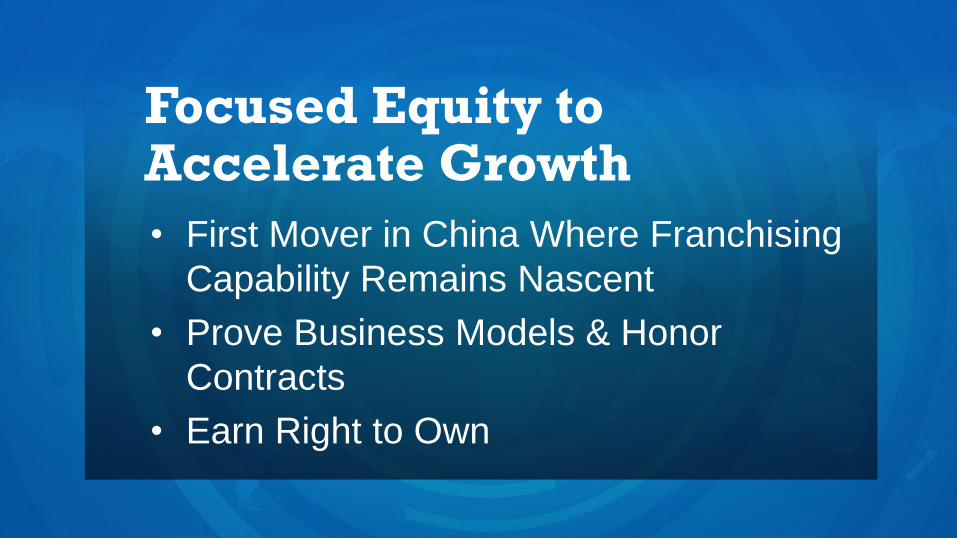
Focused Equity to Accelerate Growth
• First Mover in China Where Franchising
Capability Remains Nascent
• Prove Business Models & Honor
Contracts
• Earn Right to Own

The POWER ofDiversification
100% Focused
Teams
Massive Scale
International
Franchise
Infrastructure
Focused Equity
to Accelerate
Growth
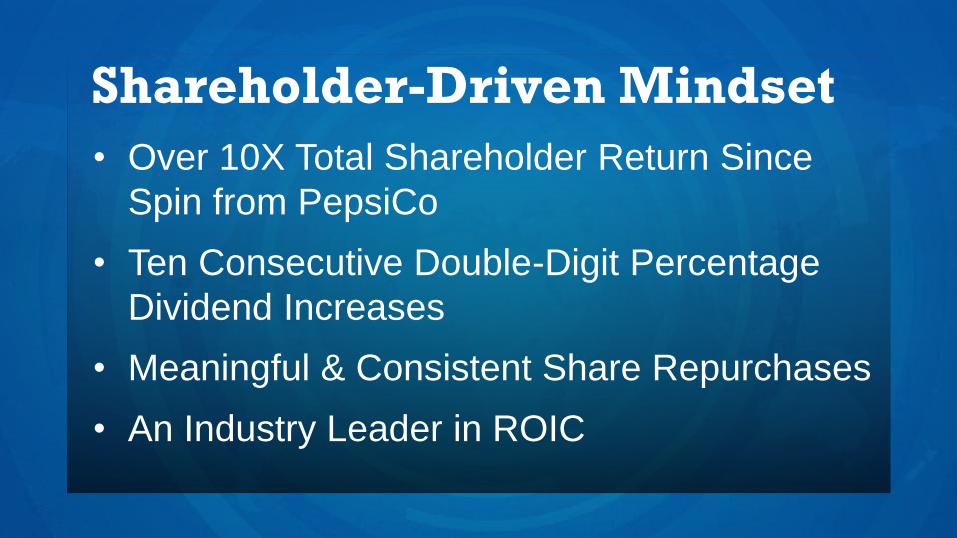
• Over 10X Total Shareholder Return Since
Spin from PepsiCo
• Ten Consecutive Double-Digit Percentage
Dividend Increases
• Meaningful & Consistent Share Repurchases
• An Industry Leader in ROIC
Shareholder-Driven Mindset

Greg CreedCEO, Yum! Brands

EVOLUTIONNOT REVOLUTION

Continuing to Win Together

Vision &
Observations
Opportunities Financial
Goals
1 2 3
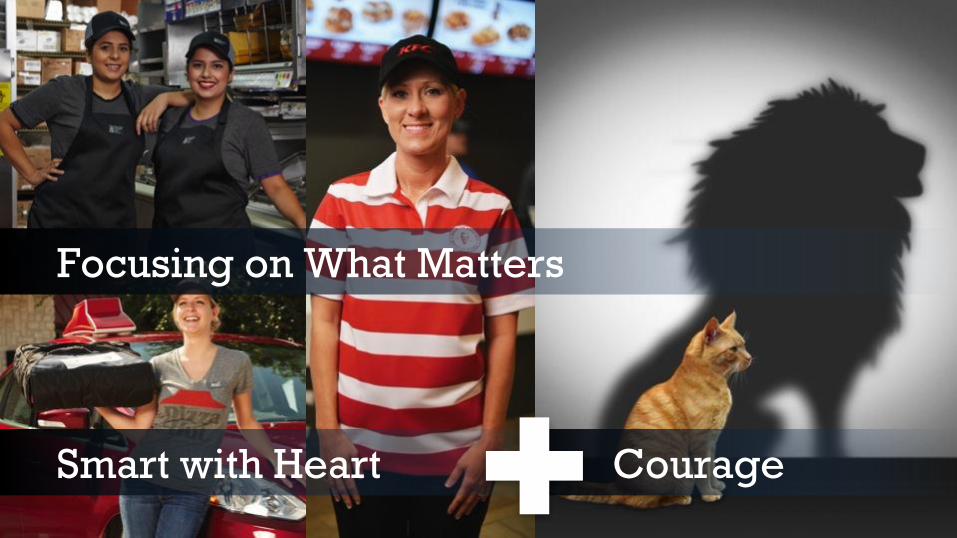
CourageSmart with Heart
Focusing on What Matters

Cultural Inspiration
Brand Evolution
Food Revolution
Focusing on What Matters
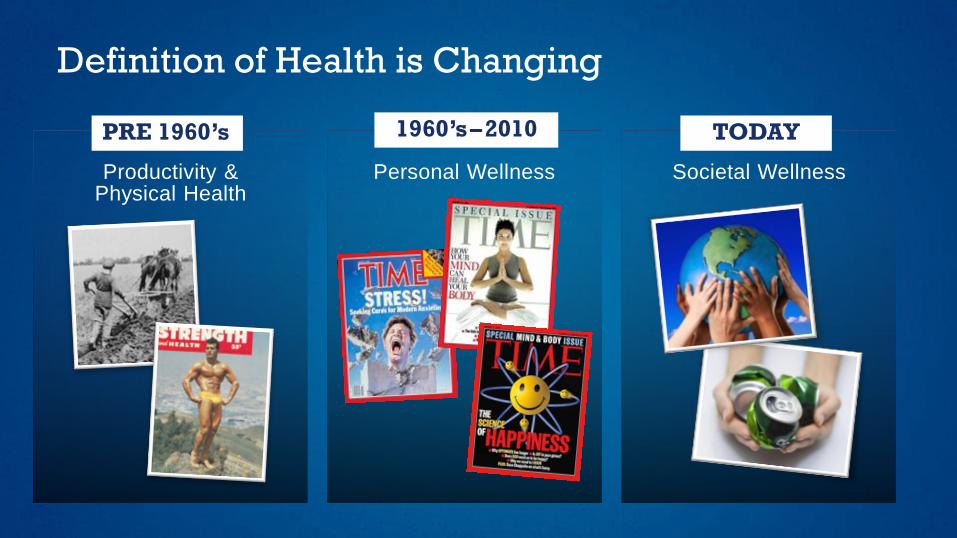
PRE 1960’s
Productivity & Physical Health
Personal Wellness Societal Wellness
Definition of Health is Changing
1960’s–2010 TODAY

Demand for Fresh & Real is on the Rise
PROCESSED FOOD PERCEPTIONS
Industrial
Predictable
Factory-made
Traditional fast food branded
Over-packaged
Difficult to replicate
REAL FOOD PERCEPTIONS
Authentic & timeless
Discovery
Local, artisan qualities
Ethnic flavors & foods
Minimally packaged
Restaurant style & quality
VISCERAL PROOF
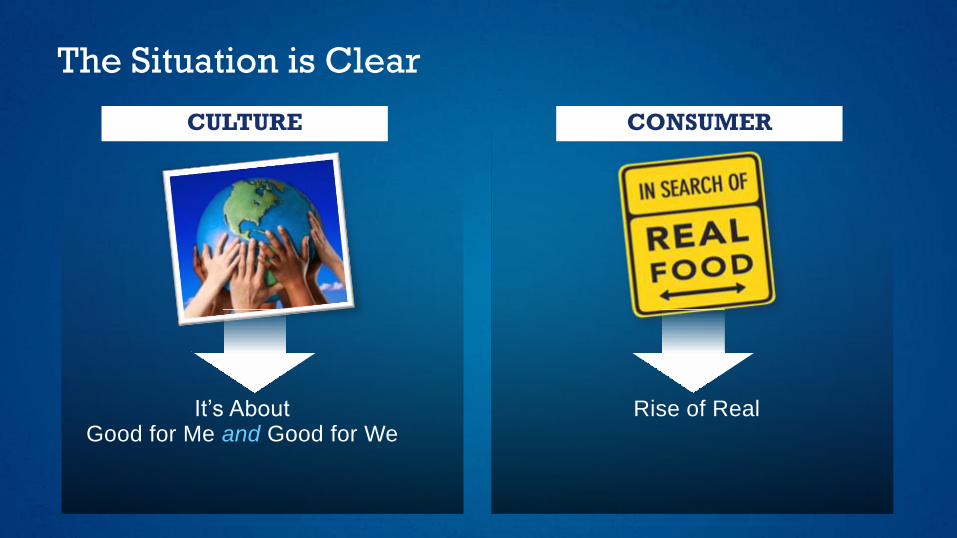
It’s About Good for Me and Good for We
Rise of Real
CULTURE CONSUMER
The Situation is Clear

We Must Shatter Category Conventions
Cheap & Unhealthy
Impersonal & Industrial
Don’t Care
Money Hungry
Real & Affordable
Relevant & Consistent
Show We Care
Good for Me & We
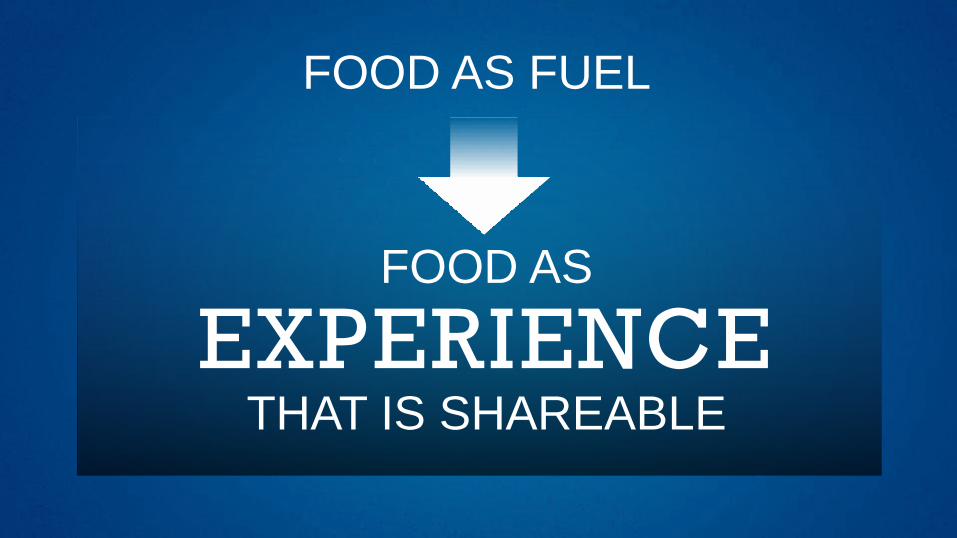
FOOD AS FUEL
FOOD AS
EXPERIENCETHAT IS SHAREABLE

If it’s not worth sharing
it’s not worth doing.

Focusing on What Matters
LEADING INNOVATION
MORE TRANSPARENCY
VARIETY & CUSTOMIZATION
UNWAVERING ON FOOD SAFETY & INTEGRITY
Focusing on What Matters
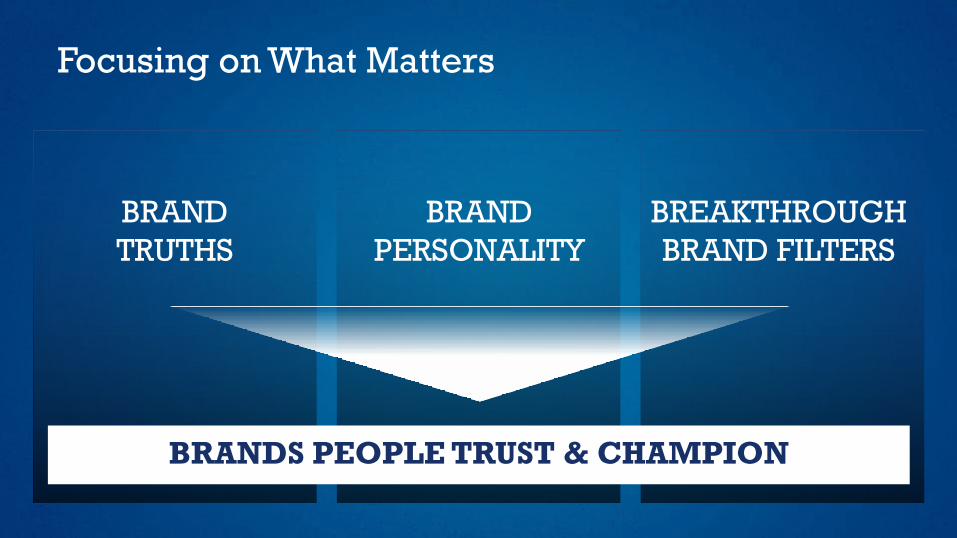
BRANDS PEOPLE TRUST & CHAMPION
BRAND
TRUTHS
BRAND
PERSONALITY
BREAKTHROUGH
BRAND FILTERS

True North Positioning

HUMAN TRUTH PRODUCT TRUTH
BRAND TRUTHS
Focusing on What Matters

How to Reach our DESTINATION:
Brands that are…
More
More
More
More
RELEVANT
ENGAGED
CONNECTED
CARING
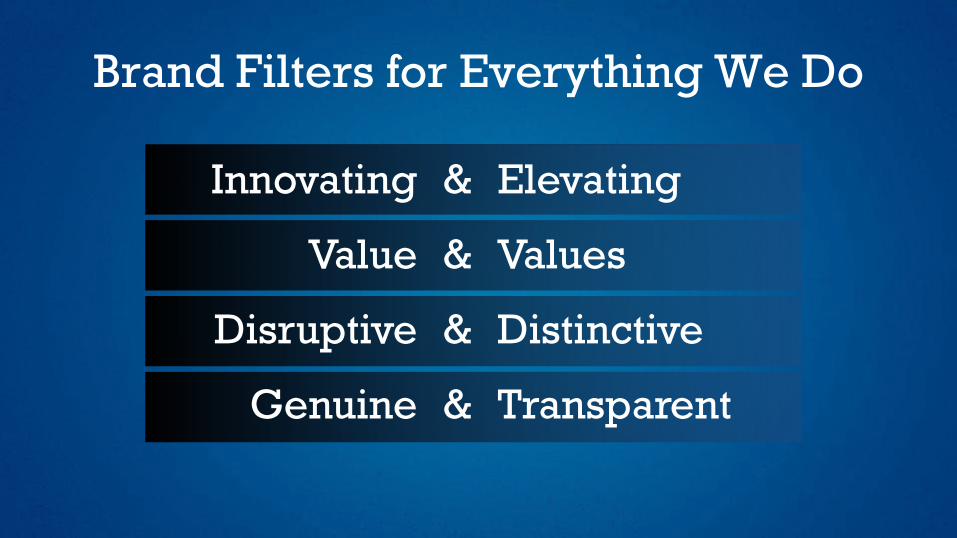
Brand Filters for Everything We Do
Innovating
Value
Disruptive
Genuine
&
&
&
&
Elevating
Values
Distinctive
Transparent

Brands People TRUST & CHAMPION

WE ARE ALL
BRAND CHAMPIONS

People Brands
1 2
Observations

World Class Leadership

Portfolio of Iconic Brands

Tremendous Growth Opportunity
New-Unit
Development
Same-Store
Sales Growth
1 2
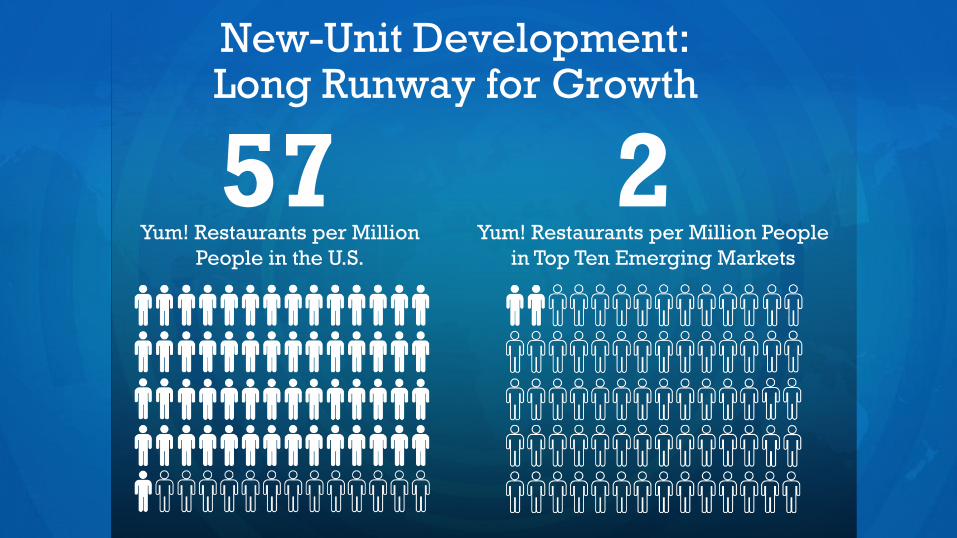
57 2Yum! Restaurants per Million
People in the U.S.
Yum! Restaurants per Million People
in Top Ten Emerging Markets
New-Unit Development: Long Runway for Growth

Huge Opportunity to Leverage Assets Globally
2013 AUVs ($MM)
*Company Reports.
Note: Taco Bell excludes License and International units.
$2.5
$1.6 $1.4 $1.4
$1.2
$0.8
$2.8 $2.6
$2.1
$2.5
$1.7
$-
$0.5
$1.0
$1.5
$2.0
$2.5
$3.0
McDonalds PH China KFC China Taco Bell KFC Pizza Hut
System AUV Top 10% system units AUV
*

CHINA: #1 OPPORTUNITY
$-
$0.2
$0.4
$0.6
$0.8
$1.0
$1.2
$1.4
$1.6
$1.8
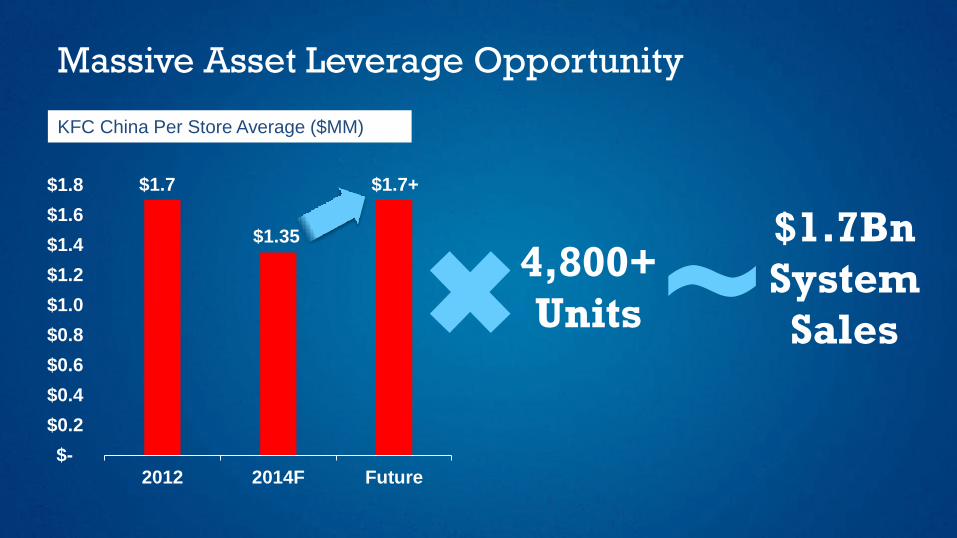
2012 2014F Future
$1.7
$1.35
Massive Asset Leverage Opportunity
KFC China Per Store Average ($MM)
4,800+
Units
$1.7Bn
System
Sales~$1.7+

DESTINATION: Build 3 Global Iconic
Brands that People Trust and Champion

At least
10% ONGOING
EPS GROWTH
Growing
DIVIDEND
AnIndustry Leader in
ROIC


Brian NiccolChief Executive Officer,Taco Bell
Note: Forecast for U.S. Units include multi-brand restaurants.
We Have Brand Clarity...
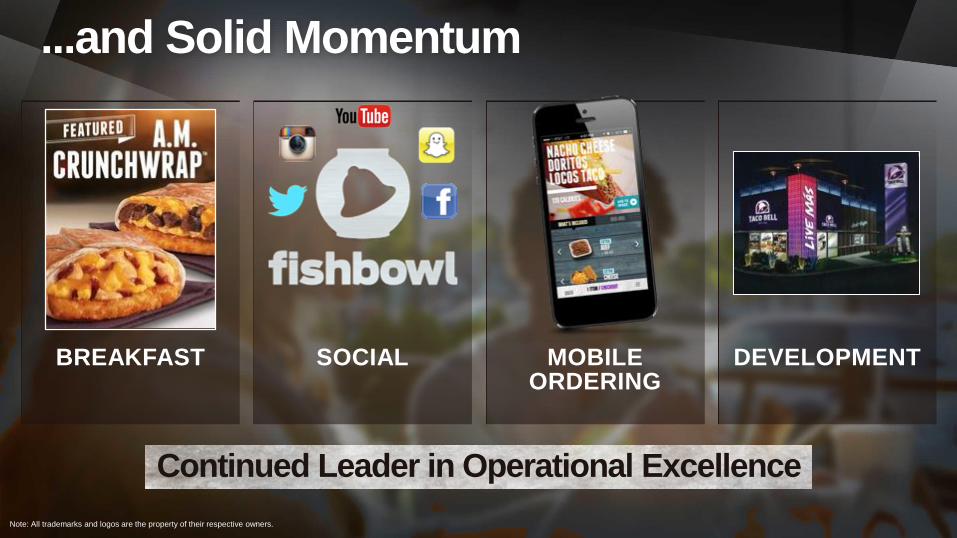
...and Solid Momentum
Continued Leader in Operational Excellence
SOCIAL DEVELOPMENTMOBILEORDERING
BREAKFAST
Note: All trademarks and logos are the property of their respective owners.
58
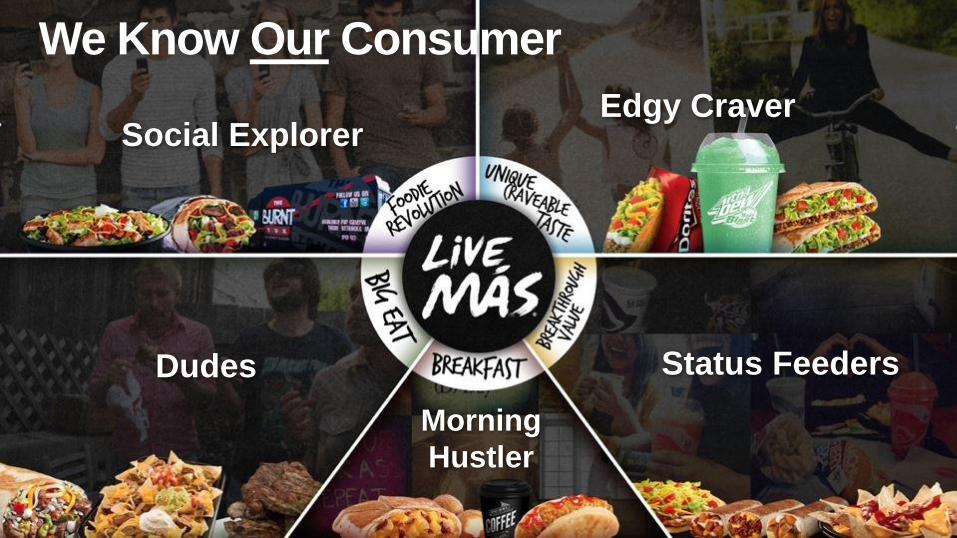
Social ExplorerEdgy Craver
Dudes Status Feeders
Morning
Hustler
We Know Our Consumer
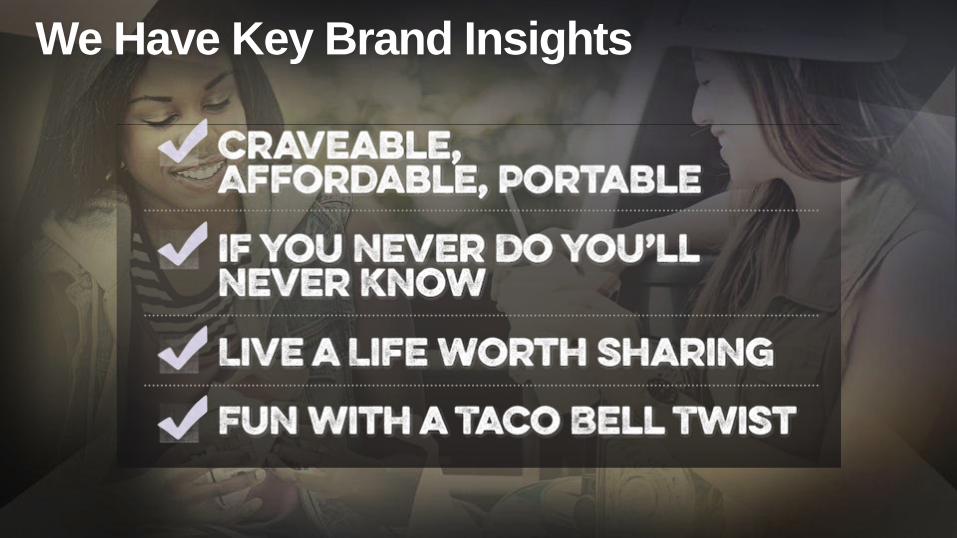
We Have Key Brand Insights

We’re Telling Deeper, Richer Stories
“SHOW WE CARE” TO INFLUENCERS
SOCIAL MEDIA LEADERSHIP
CONNECTING WITH HISPANICS
MOBILE APP GETS US CLOSER THAN
EVER TO CONSUMERS
From Marketing to PublishingNote: All trademarks and logos are the property of their respective owners.

Note: All trademarks and logos are the property of their respective owners.
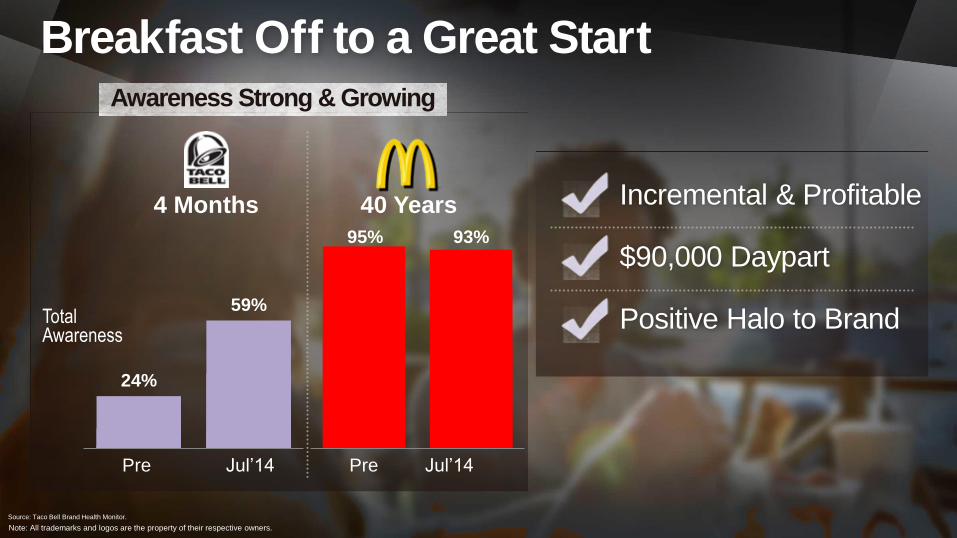
Source: Taco Bell Brand Health Monitor.
Breakfast Off to a Great StartAwareness Strong & Growing
Incremental & Profitable
$90,000 Daypart
Positive Halo to Brand
24%
59%
95% 93%
PrePre Jul’14 Jul’14
TotalAwareness
40 Years4 Months
Note: All trademarks and logos are the property of their respective owners.


Early Mobile Results Promising
By The Numbers
1,000,000 downloads so far
97% of stores have had a mobile order
4.5 star rating (out of 5) on app store
20% higher Mobile check vs. non-Mobile
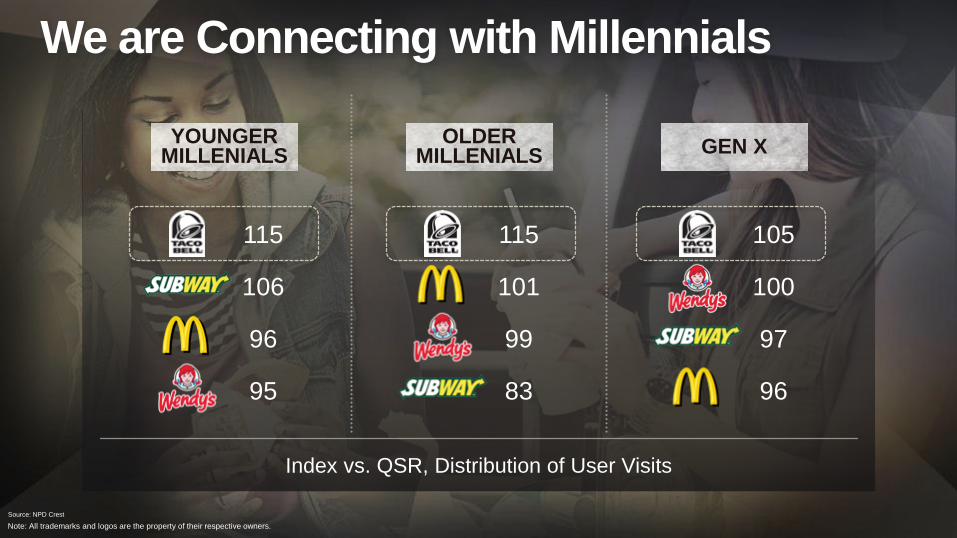
We are Connecting with Millennials
Source: NPD Crest
Index vs. QSR, Distribution of User Visits
115
106
96
95
YOUNGERMILLENIALS
OLDERMILLENIALS GEN X
115
101
99
83
105
100
97
96
Note: All trademarks and logos are the property of their respective owners.

We’re Not Standing Still
EVOLVING WITH OUR CUSTOMERS

MOVE FAST, BUT STRATEGICALLY

DEVELOPMENTINNOVATIONBREAKFAST MOBILE EDUCATION
Broadening the Brand in 2015
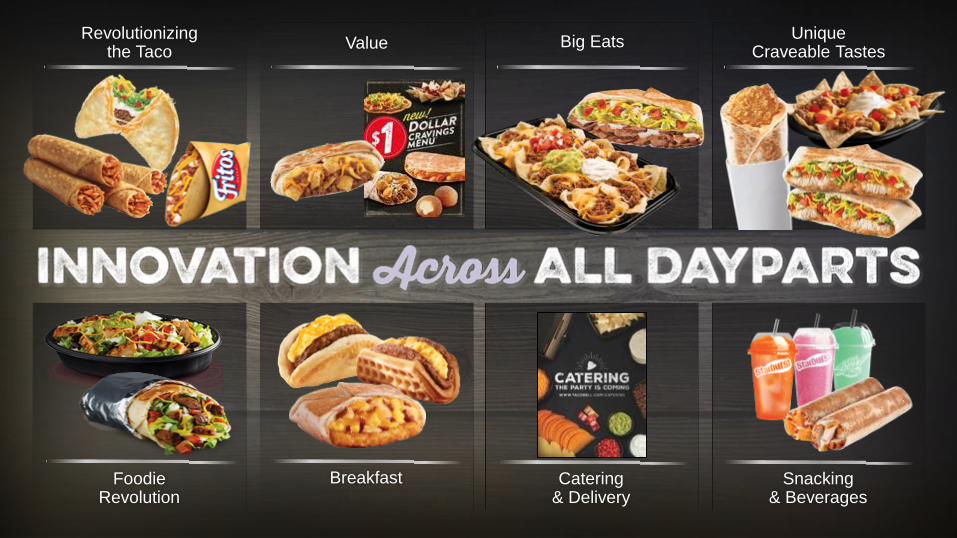
Big EatsValueRevolutionizing
the Taco
Breakfast Snacking & Beverages
Catering& Delivery
FoodieRevolution
Unique Craveable Tastes

WE SUPPORT TEENS...
Developing 21st Century Leaders
Enable
Inspire
Celebrate
WE SUPPORT TEAM MEMBERS...
WE FIGHT FOR EDUCATION

URBAN
+200 Units
RURAL
+300 Units
SUBURBAN
+500 Units
Line of Sight to 1,000 More Units in 5 Years...
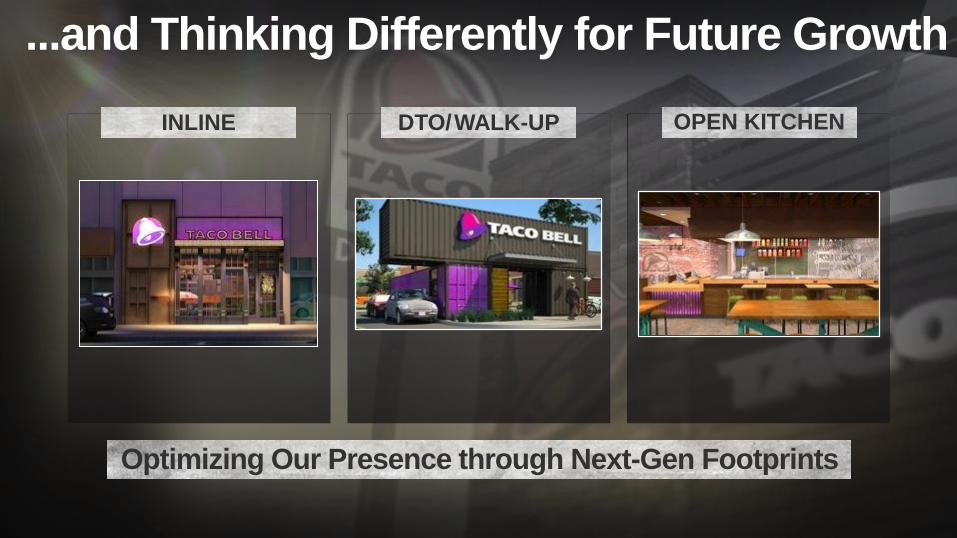
Optimizing Our Presence through Next-Gen Footprints
DTO/WALK-UP OPEN KITCHENINLINE
...and Thinking Differently for Future Growth

Just Getting Started Globally
MADRID, SPAIN SHEFFIELD, UK

On Our Way
2012
$7 Billion
2022
$14 Billion

Keep information
above this mark
Keep information
above this mark
Keep information
above this mark
Keep information
above this mark
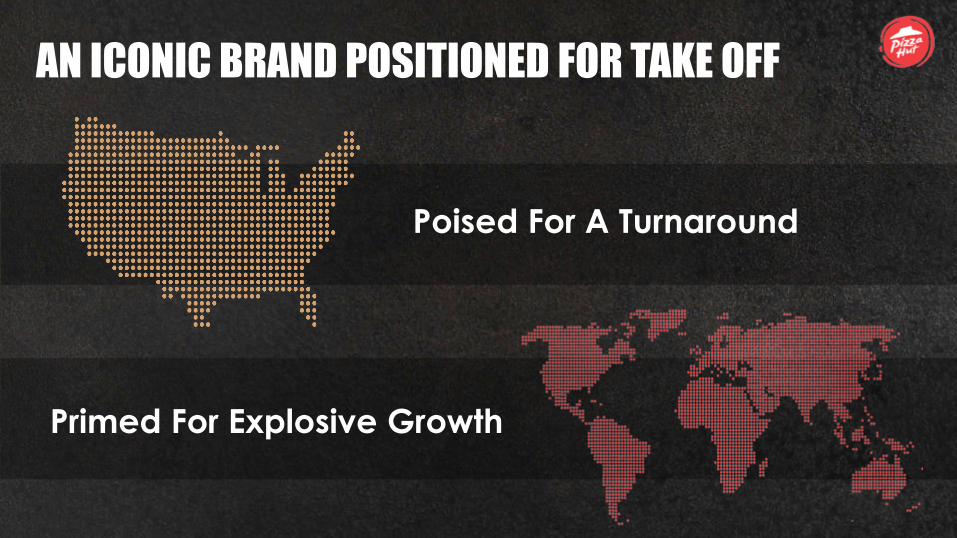
AN ICONIC BRAND POSITIONED FOR TAKE OFF
Poised For A Turnaround
Primed For Explosive Growth

Keep information
above this mark
Keep information
above this mark
BRAND

Keep information
above this mark
Keep information
above this mark IT STARTS WITH OUR HERITAGE

Keep information
above this mark
Keep information
above this mark

Keep information
above this mark
Keep information
above this mark

Keep information
above this mark
Keep information
above this mark
BRAND PROMISEPioneering The Most Flavorful
Food Experiences That Are
Share-Worthy
HUMAN TRUTHLife Is More
Flavorful
When We Share It
“BRING MORE FLAVOR TO LIFE”

Keep information
above this mark
Keep information
above this mark
OUR WINNING EQUATION

Keep information
above this mark
Keep information
above this mark
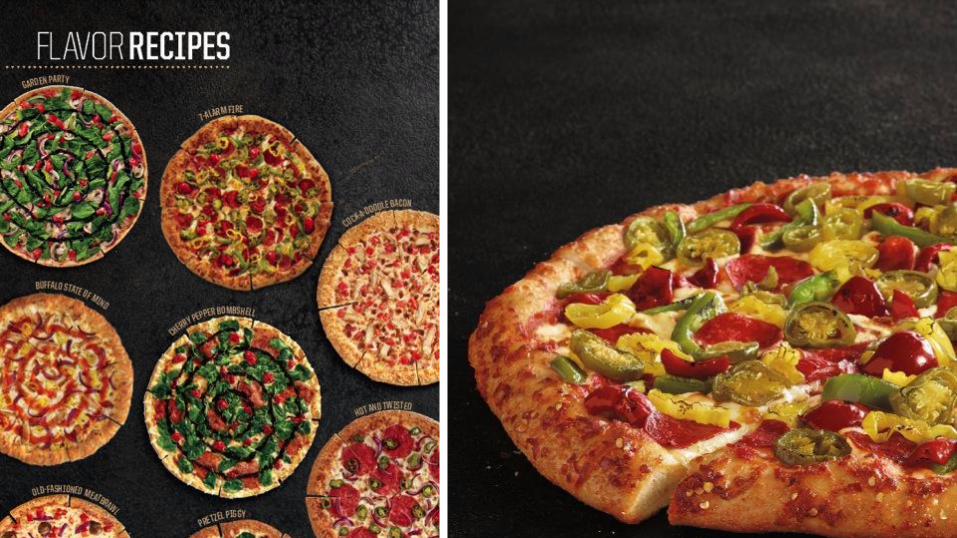
EVERYTHING WAS REFRESHED
Keep information
above this mark
Keep information
above this mark

Keep information
above this mark
Keep information
above this mark
25NEW MENU ITEMS
ADDED
CRUST FLAVORS
10
SAUCE DRIZZLES
4
NEW CREATE YOUR OWN
SAUCES
5NEW
CRUST
1
NEW INGREDIENTS
5
A RADICAL PRODUCT TRANSFORMATION!

Keep information
above this mark
Keep information
above this mark
Keep information
above this mark
Keep information
above this mark
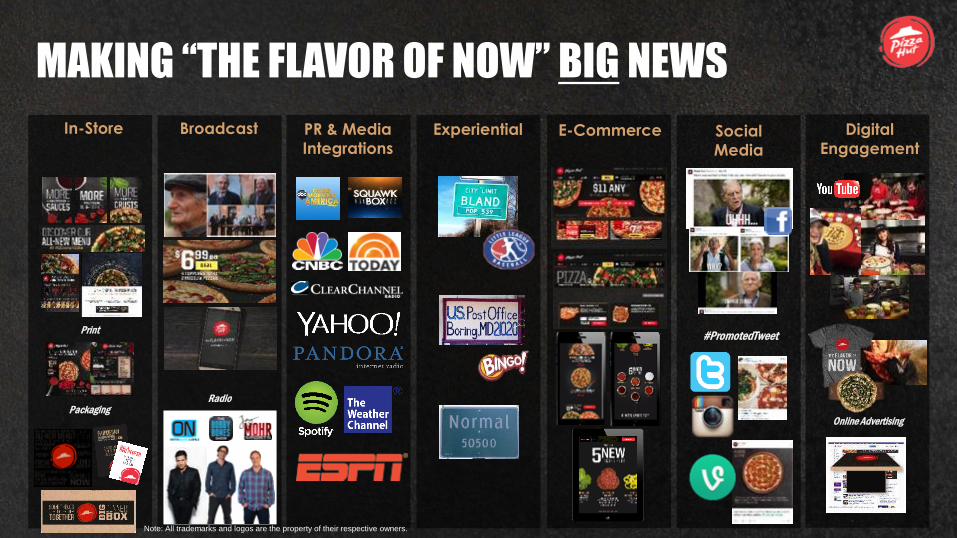
MAKING “THE FLAVOR OF NOW” BIG NEWS
In-Store
Broadcast
PackagingRadio
PR & Media
IntegrationsE-Commerce Social
Media
Digital
Engagement
Online Advertising
#PromotedTweet
Experiential
Note: All trademarks and logos are the property of their respective owners.

Keep information
above this mark
Keep information
above this mark
A MORE BALANCED APPROACH TO VALUE…
PREVIOUS CURRENT

Keep information
above this mark
Keep information
above this mark
…BROUGHT TO LIFE ONLINE

Keep information
above this mark
Keep information
above this mark
BACK IN THE GAME ON DIGITAL
25%+
40%+U.S. DIGITAL SALES %*
2013 2014 YTD
Activation Deal Website Improvements
Online Deal
* Excludes Dine-In & Express.

Keep information
above this mark
Keep information
above this mark
INVESTING IN OUR DIGITAL FUTURE
31MM Global Fans

Keep information
above this mark
Keep information
above this mark
THE CATEGORY LEADER ENTERING A NEW PHASE OF GROWTH
7,900 Units
$5.7Bn System Sales
+260 Net New Units In Last 3 Years

Keep information
above this mark
Keep information
above this mark
AN ICONIC BRAND POSITIONED FOR TAKE OFF
Poised For A Turnaround
Primed For Explosive Growth

Keep information
above this mark
Keep information
above this mark
RAPIDLY GROWING INTERNATIONAL PRESENCE
5,700 Units
$4.5Bn System Sales
+610 Net New Units In Last 3 Years
Note: Excludes U.S. & India and China Divisions

Keep information
above this mark
Keep information
above this mark 2011 2012 2013 2014F
Note: Excludes U.S. & India and China Divisions
TRIPLED INTERNATIONAL NET BUILDS
84
International Net New Units
179 183
250+

Keep information
above this mark
Keep information
above this mark
ENTERED NEW MARKETS IN 2014
South Africa
Mongolia

Keep information
above this mark
Keep information
above this mark
EXPLODING GROWTH IN EXISTING MARKETS
Vietnam
Japan
Hong Kong
Brazil
Russia
Thailand

Keep information
above this mark
Keep information
above this mark
TREMENDOUS FUTURE GROWTH OPPORTUNITY
< 4 Stores per 1MM Pop
> 20 Stores per 1MM Pop
> 4 and < 20 Stores per 1MM Pop
Yum! China & Yum! India
No Locations
Keep information
above this mark
Keep information
above this mark
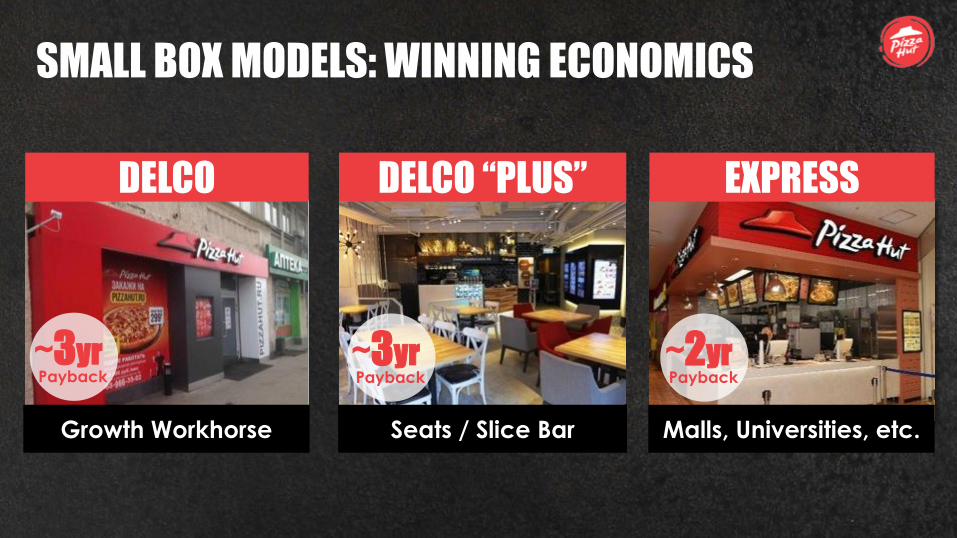
SMALL BOX MODELS: WINNING ECONOMICS
EXPRESS
Malls, Universities, etc.
Payback~2yr
DELCO “PLUS”
Seats / Slice Bar
Payback~3yr
DELCO
Growth Workhorse
Payback~3yr

Keep information
above this mark
Keep information
above this mark
MAKING RAPID PROGRESS 0N DIGITAL
~35%
~20%
International Digital Sales %*
* Excludes Dine-In & Express.
2012 2014

Keep information
above this mark
Keep information
above this mark
THE MOST LOVED AND FASTEST GROWING GLOBAL PIZZA
COMPANY IN THE WORLD!
OUR VISION:
Keep information
above this mark
Keep information
above this mark

Micky Pant
CEO
IT’S A
BRAND NEW DAYAT

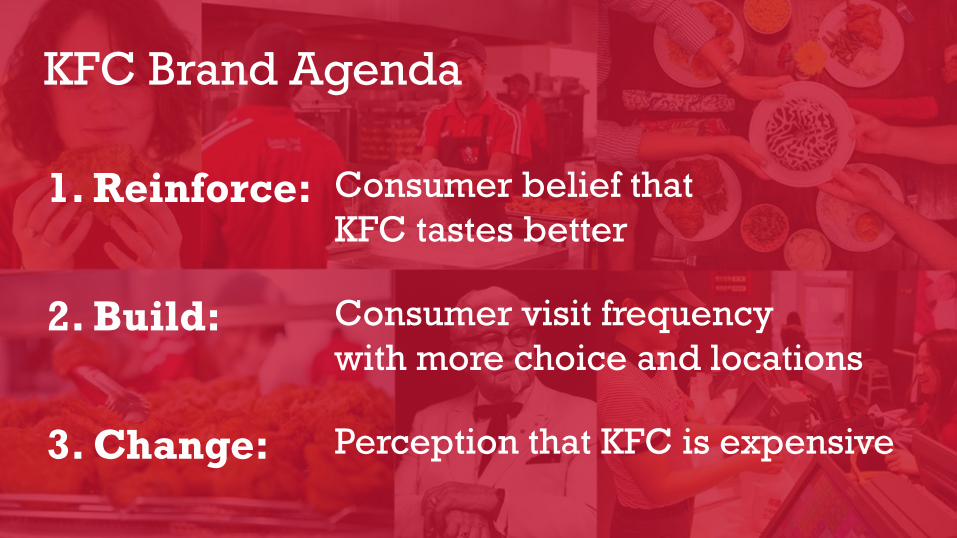
KFC Brand Agenda
1. Reinforce: Consumer belief that
KFC tastes better
2. Build: Consumer visit frequency
with more choice and locations
3. Change: Perception that KFC is expensive

Brand Split has Provided Focus
UK & Asia Box - Indonesia
New Store FormatsProduct Innovation Value
Spain, US, Australia
& Singapore

114Countries & Territories
$700+ MMOp Profit
An Iconic Global Brand
14,200+Restaurants
$17 Bn+ System Sales
Note: 2014F.

New Market Openings in 2014
Italy Uganda Paraguay

2011 2012 2013 2014F
307 324
419 ~420
2011 2012 2013 2014F
Consistent Profit and
Development Track Record
+11%
+11%
Bulgaria, Sofia-Boyanna
Net Development
Op Profit
Note: Op Profit growth calculated using 2014 FX rates. Net Development is International Only. Percentages are CAGRs.

Make an Iconic Brand
Even Stronger
Leverage Franchise-Led Model
Win in Emerging Markets
Be a Strong #2 in W. Europe, UK and Australia
Revitalize Legacy Markets
1
2
3
4

750 550
8,200
4,700
Franchise
Equity
Leverage Franchise-Led Model
5,250
Developed Markets
8,950
Emerging Markets
Note: 2014F.
90%+ Franchise Ownership
1
Store Count

Win in Emerging Markets
Indonesia
Brazil
Pakistan
Nigeria
Russia
250
200
182
174
143
Mexico
Philippines
Vietnam
Egypt
Turkey
122
98
90
82
75
Top 10 KFC Emerging Markets Represent 1.4Bn People
Source: World Bank, Company Estimates for 2013.
Only 1.2 Units/MM Today
2
Country Population (MM) Country Population (MM)

Emerging Market
Powerhouse
Emerging
Countries KFC McD
South Africa 736 197
Malaysia 579 259
Thailand 492 193
Indonesia 466 149
Russia 245 413
Egypt 138 77
Vietnam 137 1 Malaysia, SeriIskandar
Note: 2013 YE Store Count; Vietnam updated for 2014 McD opening.

19 Units/MM 14 Units/MMSouth AfricaMalaysia
Highly Penetrated Markets Deliver Significant Profits
Note: 2014F. Op Profit growth calculated using 2014 FX rates.
• 2-Year Op Profit CAGR +14%
• Profit Contribution ~55MM
• 2-Year Op Profit CAGR +15%
• Profit Contribution ~$40MM
~$40MM Op Profit
2-Year CAGR +15%~$55MM Op Profit
2-Year CAGR +11%

KFC McD*
Be a strong #2 in
Western Europe, UK and
Australia
117* Company Estimates for 2013.
$1Bn+
$20MM+
Grow Western Europe through Franchise
capital and a variety of asset formats
France & Germany
2014F Op Profit
3

Profit and Innovation Powerhouses
AustraliaUK Netherlands
+5% SSS
15% Margins
$100MM+ Profit
+3% SSS
17% Margins
$100MM+ ProfitNote: 2014F.
+9% SSS
18% Margins
$9MM Profit
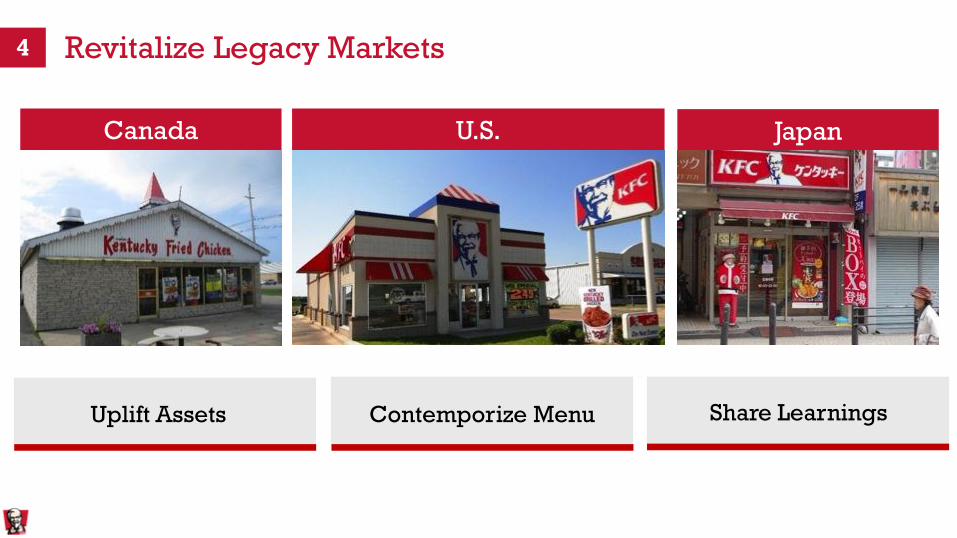
Revitalize Legacy Markets
U.S.Canada Japan
Uplift Assets Contemporize Menu Share Learnings
4

Building Company Margins to a Higher Plane
Positive Trend
Supply Chain Savings
Operations Efficiency
Managing Portfolio
Building Smarter
All Areas of the P&L
KFC Division Restaurant Margin
15%
Core
Margins
12.6%
~13%
~14%
2013 2014F 2015F
Note: Core margins represent stores that have been open for a minimum of one year.

$1.2
Significant Room to Grow Existing Business
$1.2
$2.7
System Average Top 10% of System
AUVs ($MM)
Note: 2014F.

Late NightBreakfast A.M. Coffee Happy Hour
South AfricaSouth AfricaUK Thailand
Leveraging Our Assets Across All Dayparts
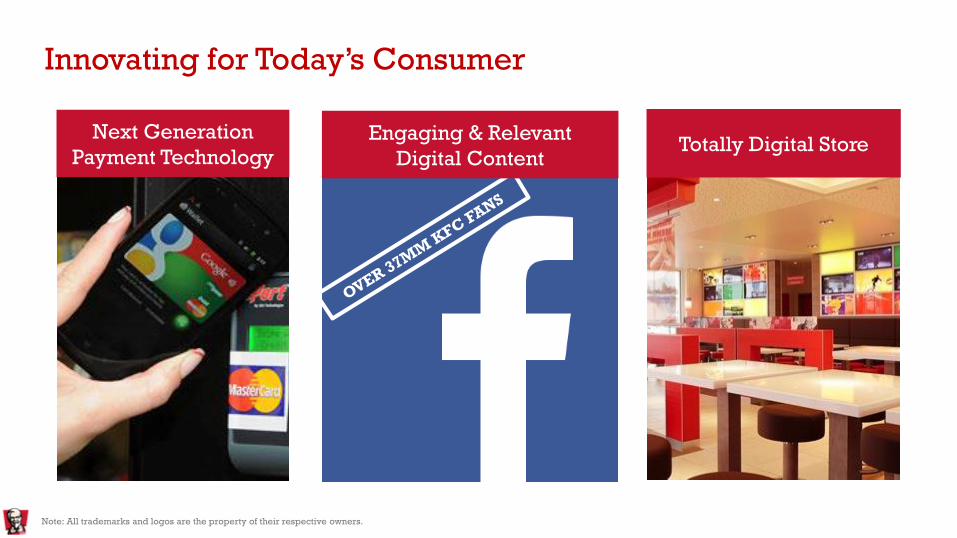
Innovating for Today’s Consumer
Next Generation
Payment TechnologyTotally Digital Store
Engaging & Relevant
Digital Content
Note: All trademarks and logos are the property of their respective owners.

Leverage Franchise-Led Model
Win in Emerging Markets
Be a Strong #2 in W. Europe, UK and Australia
Revitalize Legacy Markets
1
2
3
4
ALWAYS ORIGINAL
KFC: An Iconic Brand, Poised for Greatness

A BRAND New Day in China
Sam Su
Yum! Brands Vice Chairman & CEO Yum! China
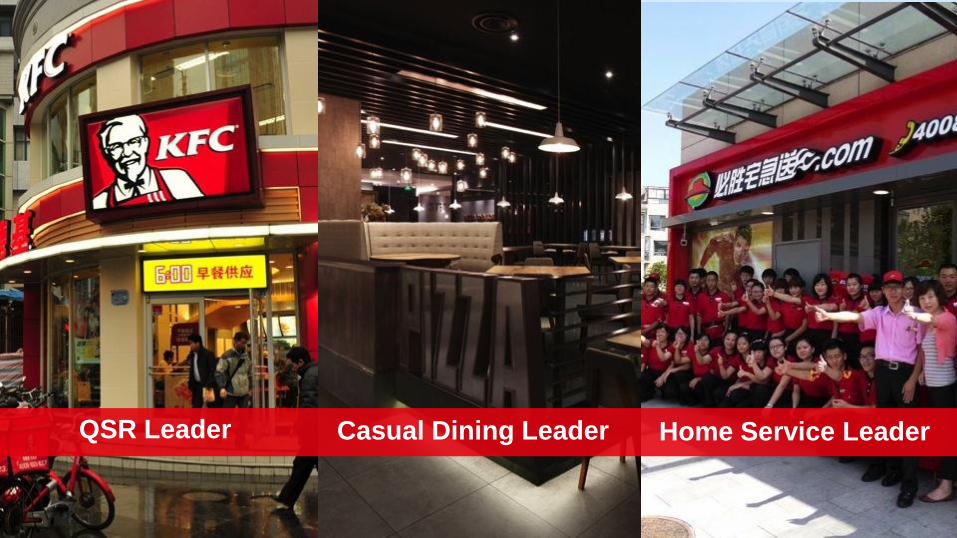
Casual Dining Leader Home Service LeaderQSR Leader

Since We Last Met
Trust Regained with ConsumersMassive Actions to Address
Upstream Vulnerabilities
Operation Thunder “I Commit” Campaign
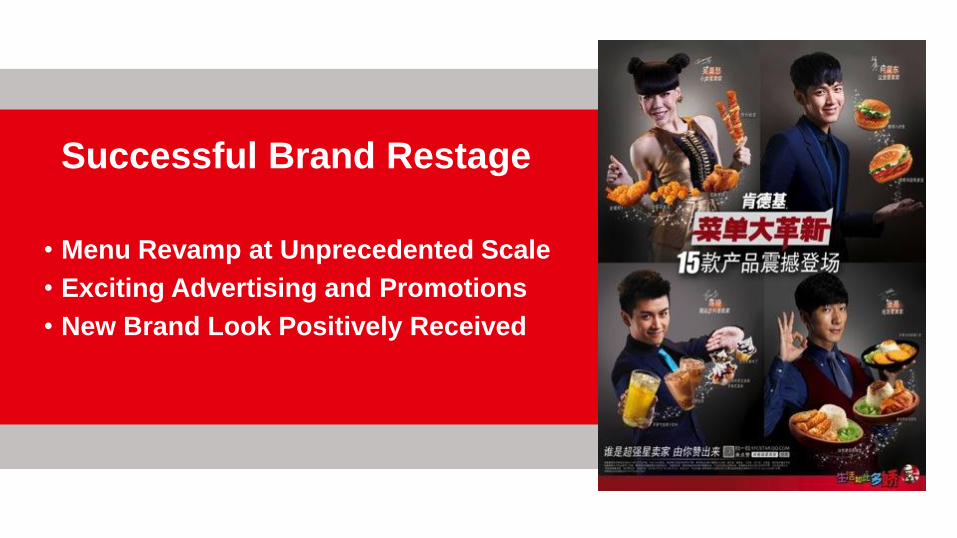
Successful Brand Restage
• Menu Revamp at Unprecedented Scale
• Exciting Advertising and Promotions
• New Brand Look Positively Received

Outstanding First-Half Performance
19.8%Restaurant
Margin
116% Operating
Profit Growth
12% Same-Store
Sales Growth

1H 2H
12%
1H 2H
19.8%
1H 2H
116%
Same-Store
Sales GrowthRestaurant Margin Operating Profit Growth
Frustrating Set Back in Second Half
Triggered by OSI Supplier Incident
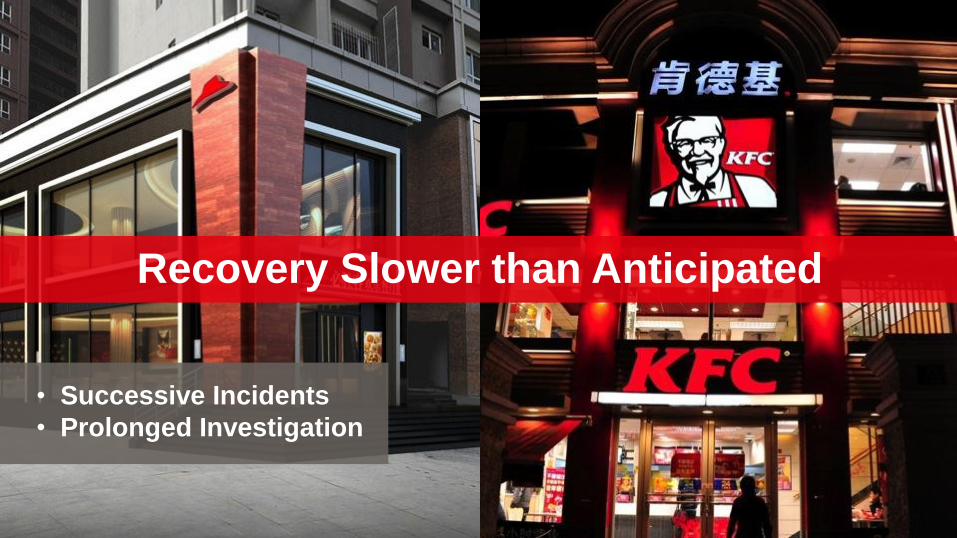
• Successive Incidents
• Prolonged Investigation
Recovery Slower than Anticipated

But, the Recovery is Happening
20%
25%
30%
35%
40%
45%
50%
55%
60%
2013 2014
KFC Reliable Brand

We Need to Earn the Right to Lead Everyday
KFC and Pizza Hut Remain the Best Options
“If KFC food is not safe, then nothing is safe in China.”
- Focus Group Consensus

Competition is Intensifying
Number of
Restaurants in Malls
1,122
30,000
2014
Number of
Shopping Malls 472
7,900
2010
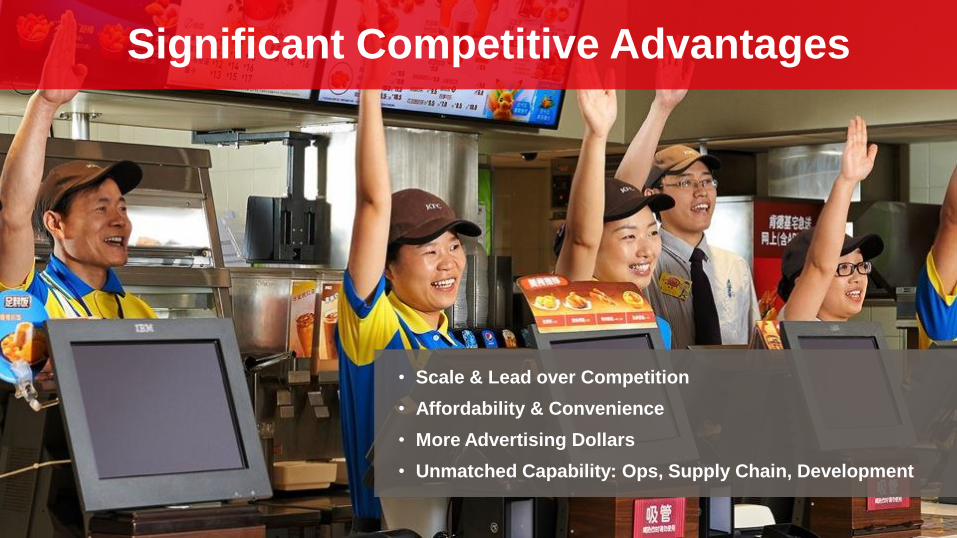
• Scale & Lead over Competition
• Affordability & Convenience
• More Advertising Dollars
• Unmatched Capability: Ops, Supply Chain, Development
Significant Competitive Advantages

Driving Faster, More Relevant Innovation
Think Big, Test Quick, Execute Fast
Maintain Value Leverage Celebrities Broaden Menu Variety
We Will Lead in Technology
• Yum! China has the ability and
leadership position to take advantage
of technology
• We will continue to make the
necessary changes
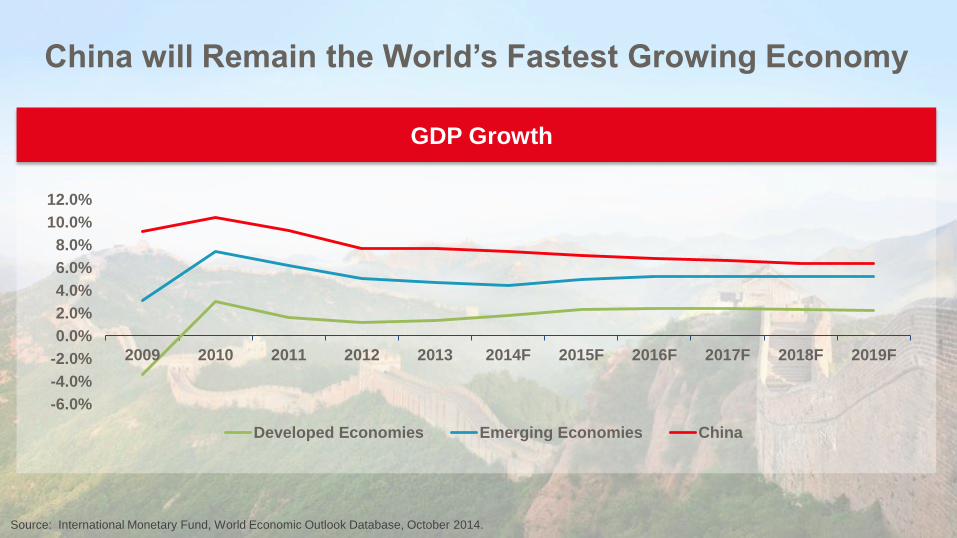
China will Remain the World’s Fastest Growing Economy
GDP Growth
-6.0%
-4.0%
-2.0%
0.0%
2.0%
4.0%
6.0%
8.0%
10.0%
12.0%
2009 2010 2011 2012 2013 2014F 2015F 2016F 2017F 2018F 2019F
Developed Economies Emerging Economies China
Source: International Monetary Fund, World Economic Outlook Database, October 2014.

Growing Consuming Class: Modern, Mainstream
Consuming Class
300 million in 2012
to
600 million by 2020
Looking Ahead
Urban Migration
+15 million per year

Tremendous Growth Opportunity Remains
1,300+
250+
3X
3X
10X
Today Potential
4,800+

Joey Wat, President KFC China
Previously:
Managing Director, Superdrug & Savers in UK
McKinsey & Company in China
Kellogg Graduate School
Fluent in English and Chinese (Mandarin, Cantonese and Fujianese)

A BRAND New Day at KFC China
Joey Wat
KFC China President

Why I Chose Yum!
Leading
China Brands
Growth
OpportunitiesGreat Team
RGM #1
Culture

KFC Will be an Even Stronger Leading Brand
• #1 Foreign Brand
• 4,800+ Units
• 1,000 Cities
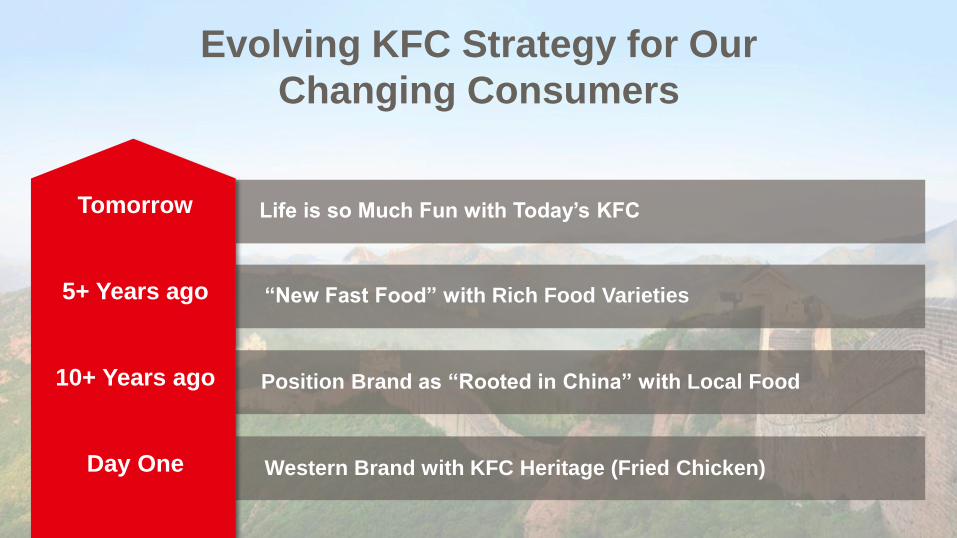
Evolving KFC Strategy for Our
Changing Consumers
“New Fast Food” with Rich Food Varieties
Tomorrow
5+ Years ago
10+ Years ago
Day One
Life is so Much Fun with Today’s KFC
Position Brand as “Rooted in China” with Local Food
Western Brand with KFC Heritage (Fried Chicken)

1. Menu
Innovation
2. Interactive Digital
Campaigns
3. Continuing
Operations Focus
4 Strategic Pillars
4. One Brand…
Multiple Models
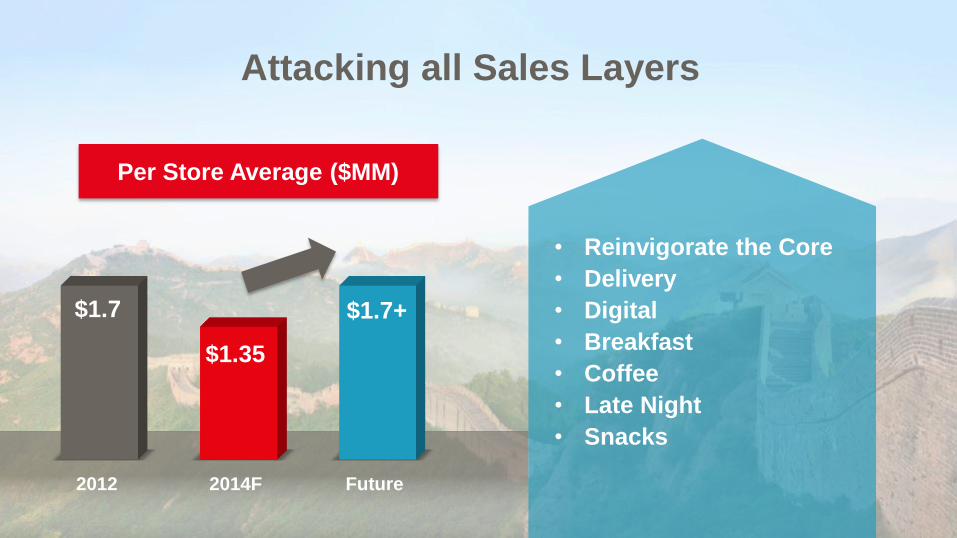
Attacking all Sales Layers
2012 2014F Future
$1.7
$1.35
$1.7+
Per Store Average ($MM)
• Reinvigorate the Core
• Delivery
• Digital
• Breakfast
• Coffee
• Late Night
• Snacks
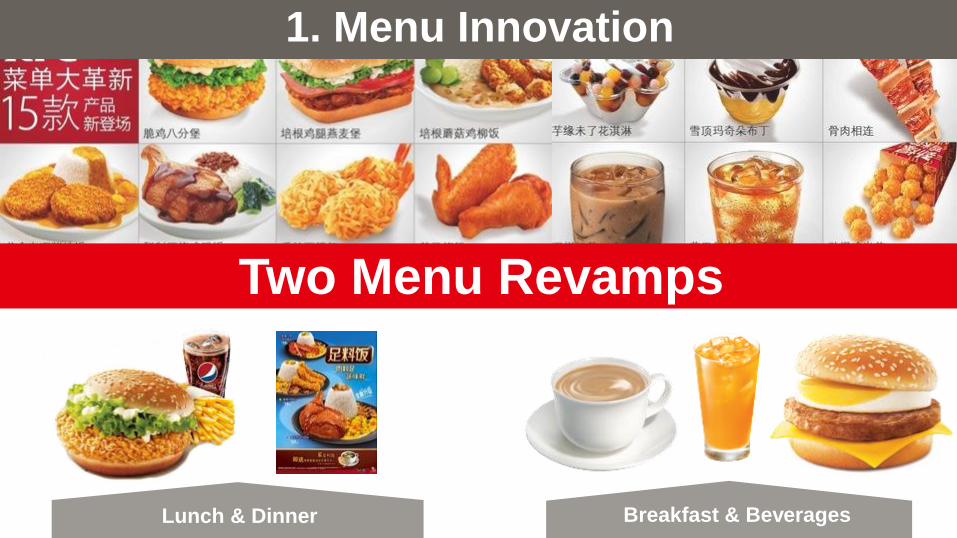
Two Menu Revamps
Breakfast & Beverages
1. Menu Innovation
Lunch & Dinner
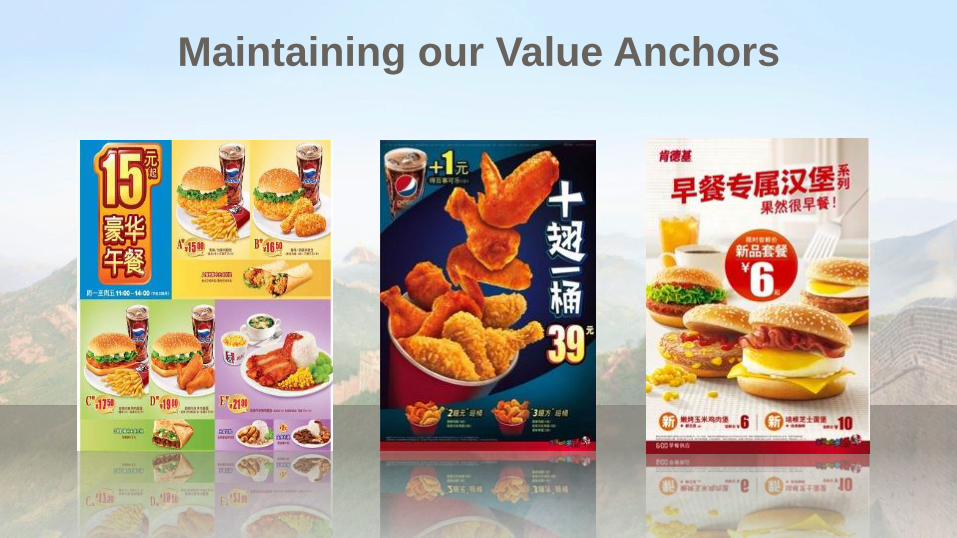
Maintaining our Value Anchors

Extending Successful Celebrity Advertising
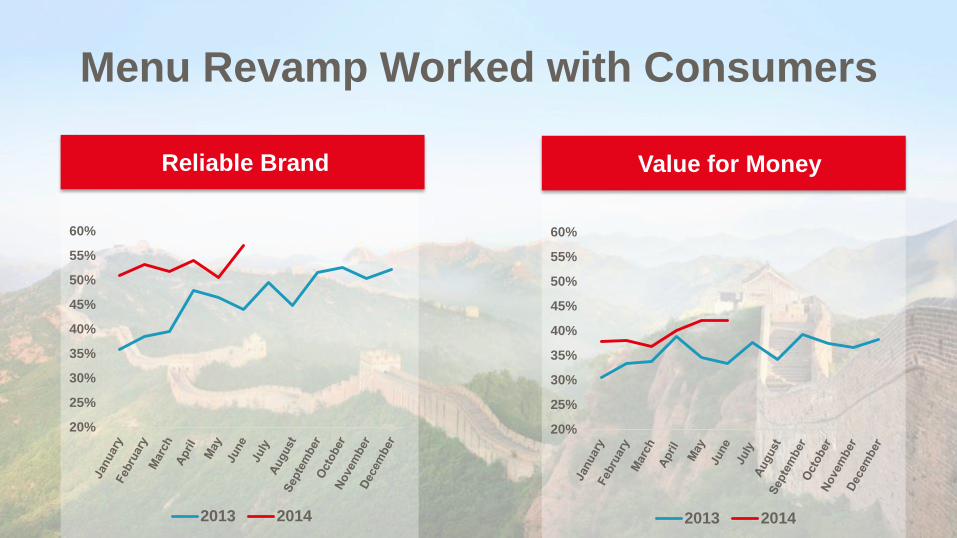
Menu Revamp Worked with Consumers
20%
25%
30%
35%
40%
45%
50%
55%
60%
2013 2014
20%
25%
30%
35%
40%
45%
50%
55%
60%
2013 2014
Reliable Brand Value for Money
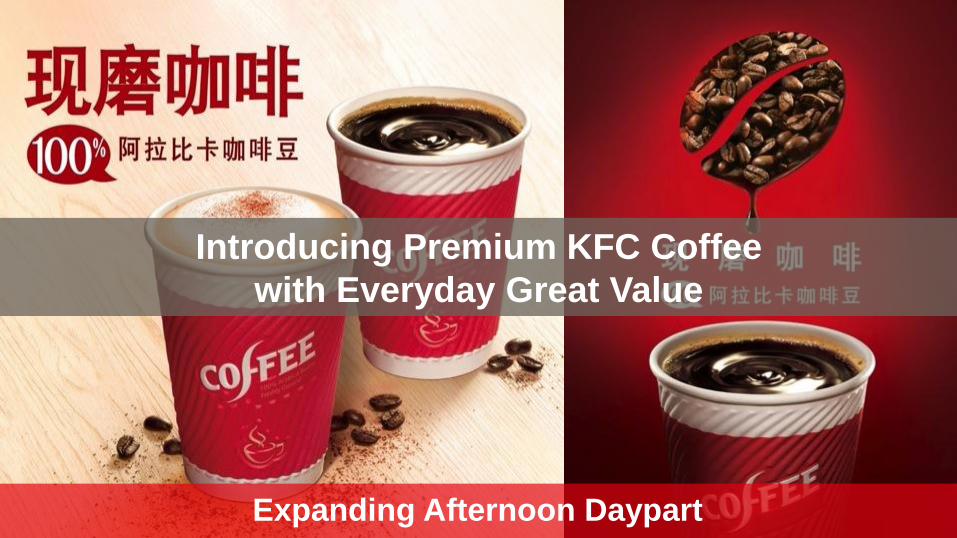
Introducing Premium KFC Coffee
with Everyday Great Value
Expanding Afternoon Daypart

2. Interactive Digital Campaigns
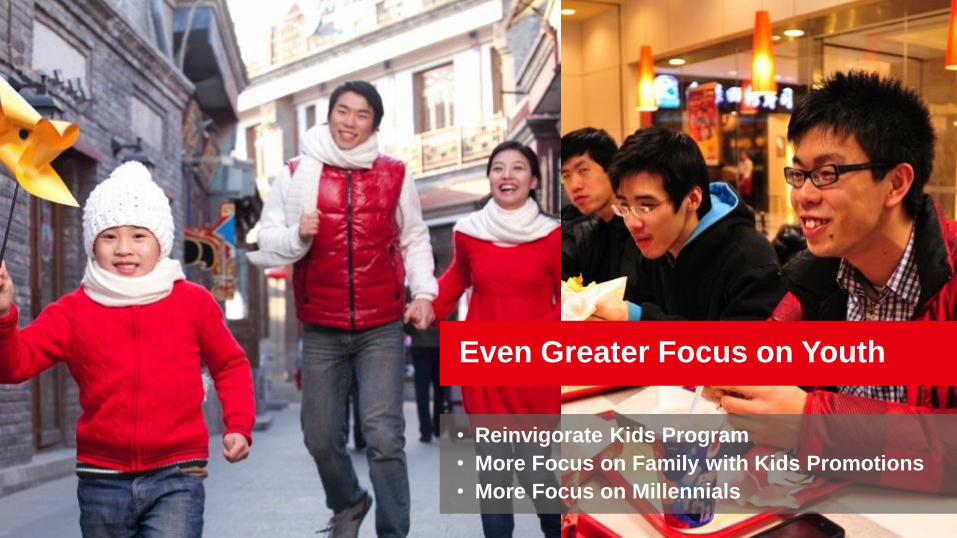
Even Greater Focus on Youth
• Reinvigorate Kids Program
• More Focus on Family with Kids Promotions
• More Focus on Millennials

1. Brand
Communication
2. e-Commerce
3. In-Store
Experience
Leading with Digital
• 10 MM Brand Apps Activated
• WIFI in T1 & T2 Cities
• Mobile Ordering Peak 43M
Daily Transactions

3. Continued Focus on Operations
Distinctive
Branded ServiceSuperior TrainingFood Safety
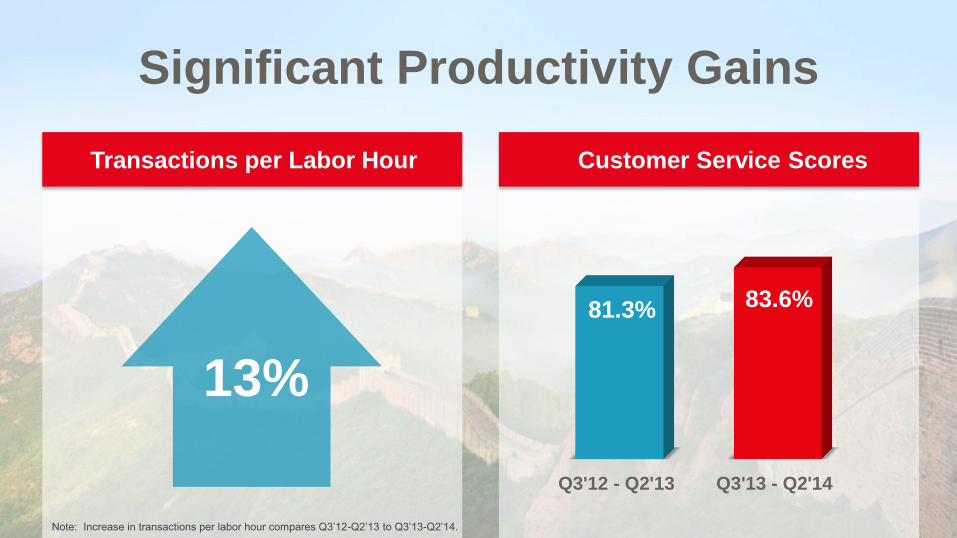
Significant Productivity Gains
Transactions per Labor Hour Customer Service Scores
Q3'12 - Q2'13 Q3'13 - Q2'14
81.3% 83.6%
Note: Increase in transactions per labor hour compares Q3’12-Q2’13 to Q3’13-Q2’14.
13%
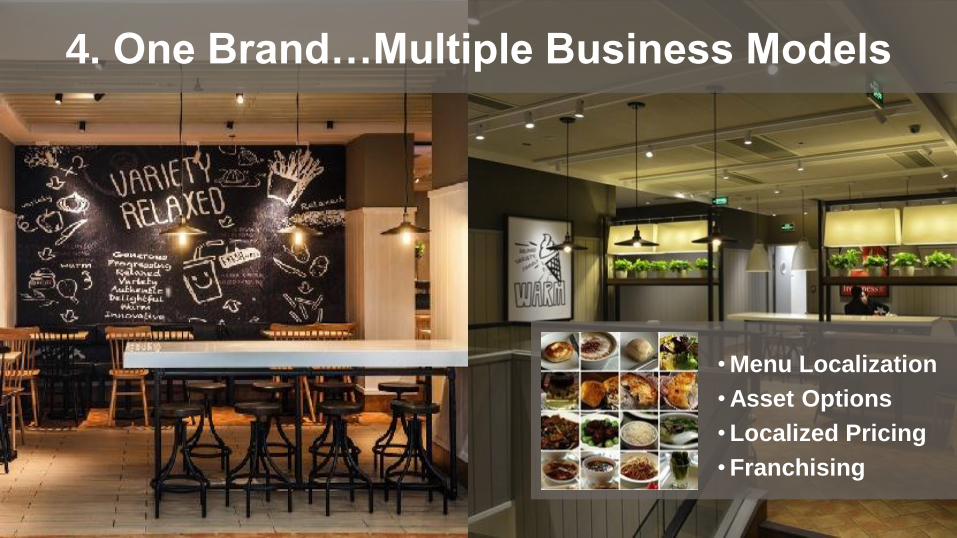
4. One Brand…Multiple Business Models
• Menu Localization
• Asset Options
• Localized Pricing
• Franchising

Re-Accelerating New Restaurants Over Time
KFC Gross New-Unit Openings
2010 2011 2012 2013 2014F
414
515
621
428360

First-Half Returns Give Us Confidence
in KFC Development
Payback 3-4 Years
Tier 1 – 2 Cities Tier 3 – 6 Cities
Average Unit Volume ($MM) $1.1 $1.0
Cash Margin 18% 18%
Cash Investment ($M) $600 $610
Note: Includes units opened August 2012 – July 2013.
2014 New Unit Economics - KFC
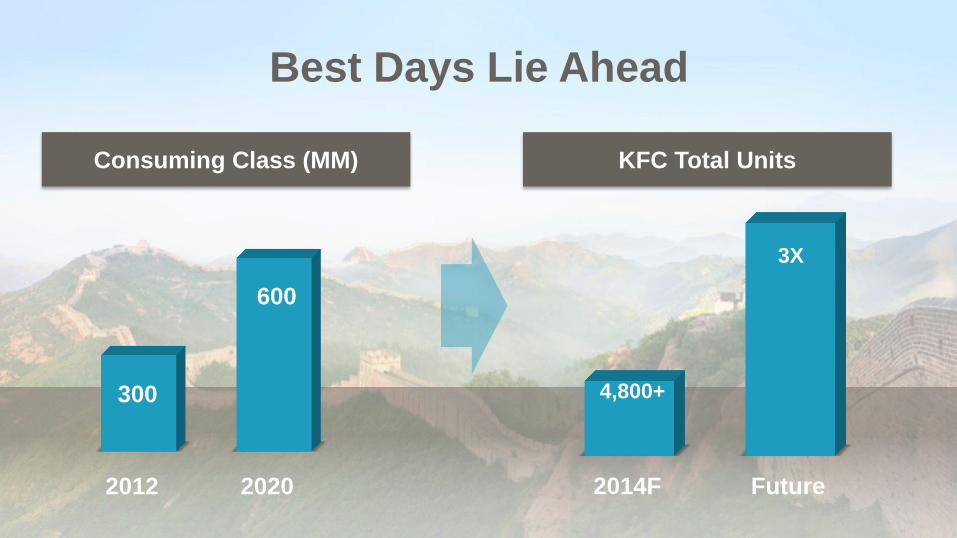
Best Days Lie Ahead
Consuming Class (MM)
2012 2020
300
600
KFC Total Units
2014F Future
4,800+
3X

Remain Confident in KFC China Growth
Disruptive
Innovation
#1 Foreign
Brand in
China
Unrivaled
Capability
Strong
Macros in a
Changing
China

A BRAND New Day at Pizza Hut China
Sam Su
Yum! Brands Vice Chairman & CEO Yum! China

China’s Casual Dining Powerhouse
• #1 Western Casual Dining Restaurant
• 1,300+ Units
• 315+ Cities
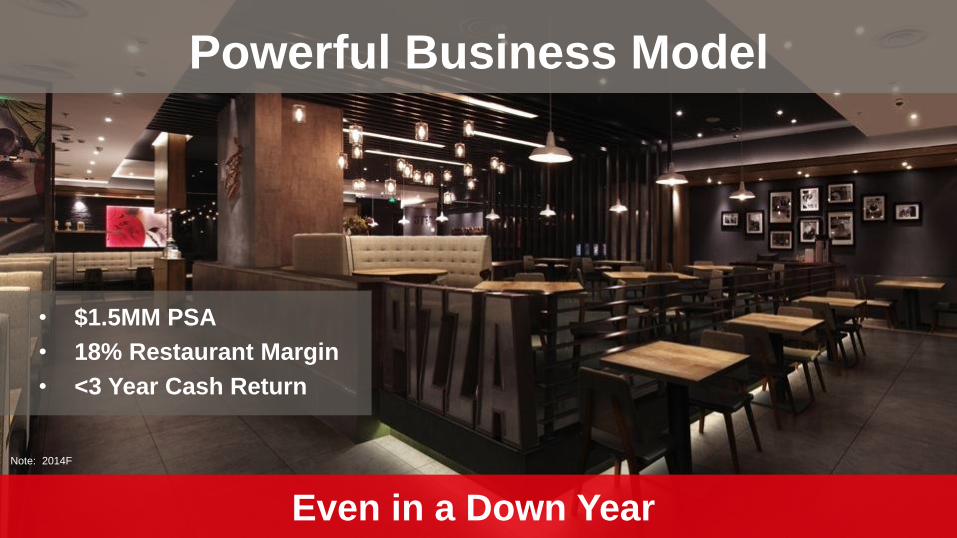
Powerful Business Model
Even in a Down Year
• $1.5MM PSA
• 18% Restaurant Margin
• <3 Year Cash Return
Note: 2014F
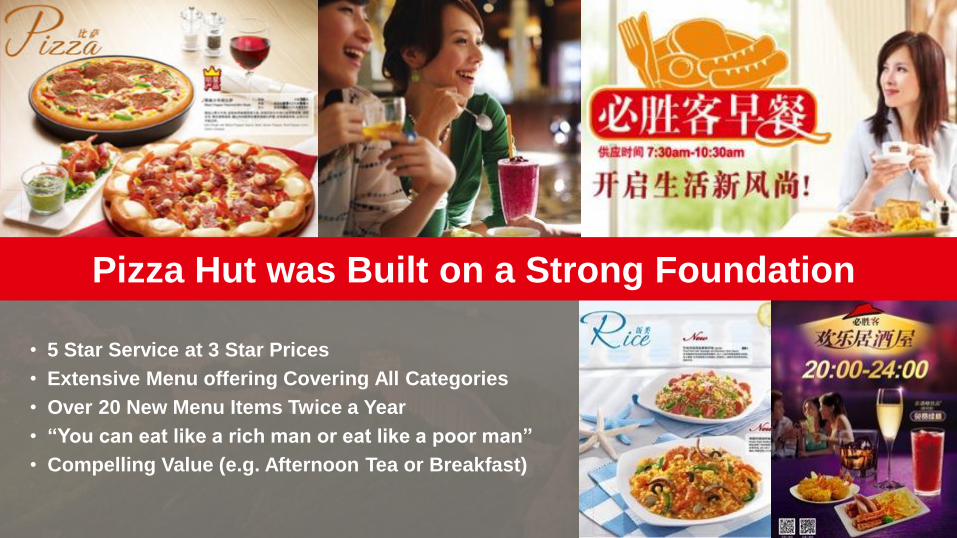
Pizza Hut was Built on a Strong Foundation
• 5 Star Service at 3 Star Prices
• Extensive Menu offering Covering All Categories
• Over 20 New Menu Items Twice a Year
• “You can eat like a rich man or eat like a poor man”
• Compelling Value (e.g. Afternoon Tea or Breakfast)
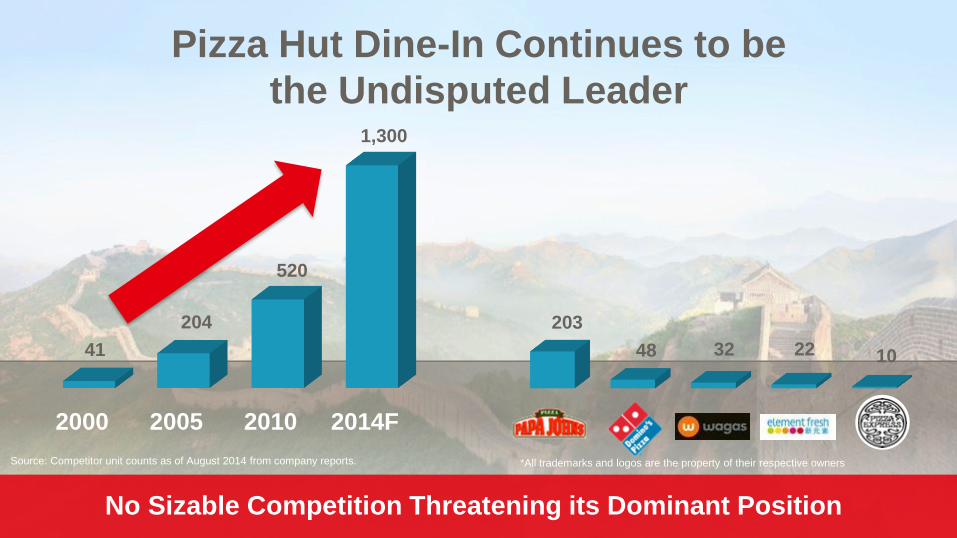
Pizza Hut Dine-In Continues to be
the Undisputed Leader
2000 2005 2010 2014F
41
204
520
1,300
203
48 32 22 10
No Sizable Competition Threatening its Dominant Position
Source: Competitor unit counts as of August 2014 from company reports. *All trademarks and logos are the property of their respective owners

*All trademarks and logos are the property of their respective owners.
Chinese Consumers’ Tastes are Rapidly Evolving

Continuing to Elevate the Brand
171
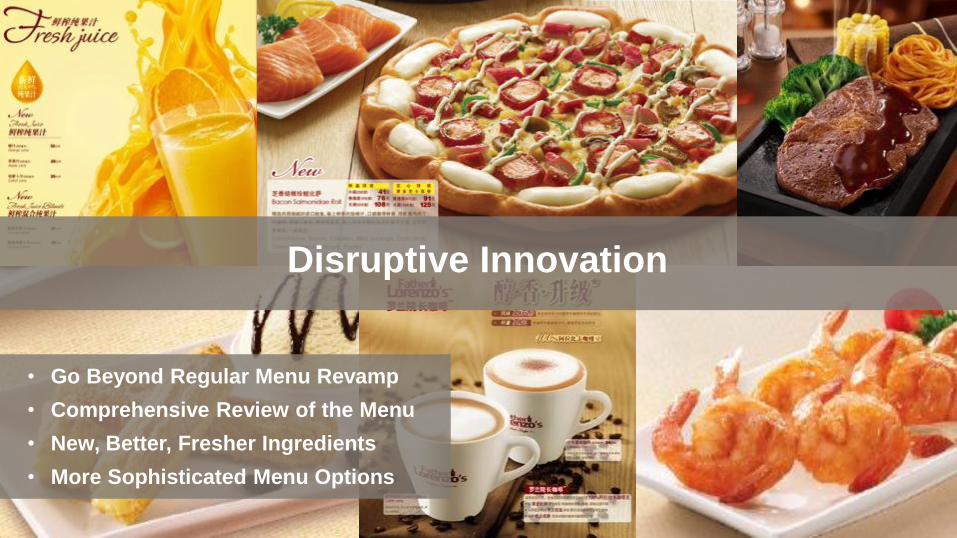
Disruptive Innovation
• Go Beyond Regular Menu Revamp
• Comprehensive Review of the Menu
• New, Better, Fresher Ingredients
• More Sophisticated Menu Options

Supported by Breakthrough
Marketing and Technology
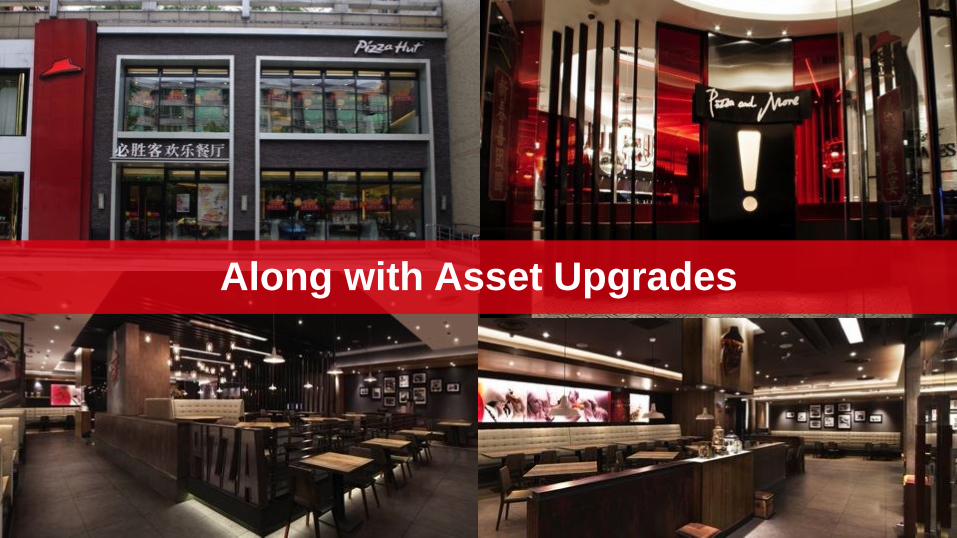
Along with Asset Upgrades
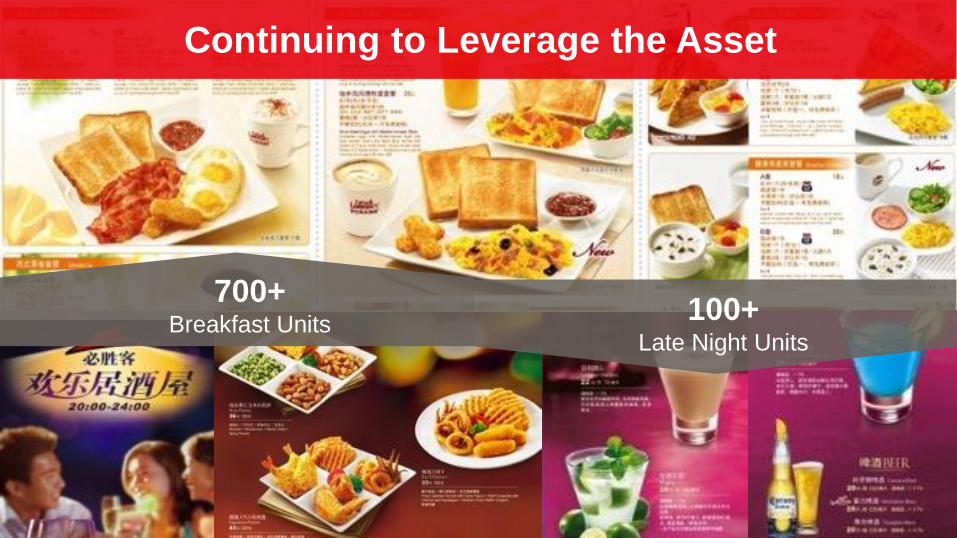
Continuing to Leverage the Asset
700+Breakfast Units
100+Late Night Units

Pizza Hut China: A Fantastic Growth Story
675
550
Net New Units Last 3 Years
95%
80%
System Sales Growth Last 3 Years
* Compares Pizza Hut Casual Dining in China to Chipotle in the U.S. from YE 2011 to YE 2014F.
Note: All trademarks and logos are the property of their respective owners.

Pizza Hut Home Service…
Leader in Delivery
• 250+ Units
• 25+ Cities

Leader in Fast Expanding China Food Delivery
2010 2014F
120
250+
Units
Delivery
Category

Time Has Come for Food Delivery
Mobile Technology is Fast Becoming the Norm
Sept. 2014Sept. 2012 Sept. 2013
Online
52%Mobile
27%
Call
Center
21%
Online
66%
Call
Center
34%
Online
70%
Call
Center
22%
Mobile
8%

Emerging Online Delivery Platforms and Expansion
of Virtual Stores Intensifies Competition
Note: All trademarks and logos are the property of their respective owners.
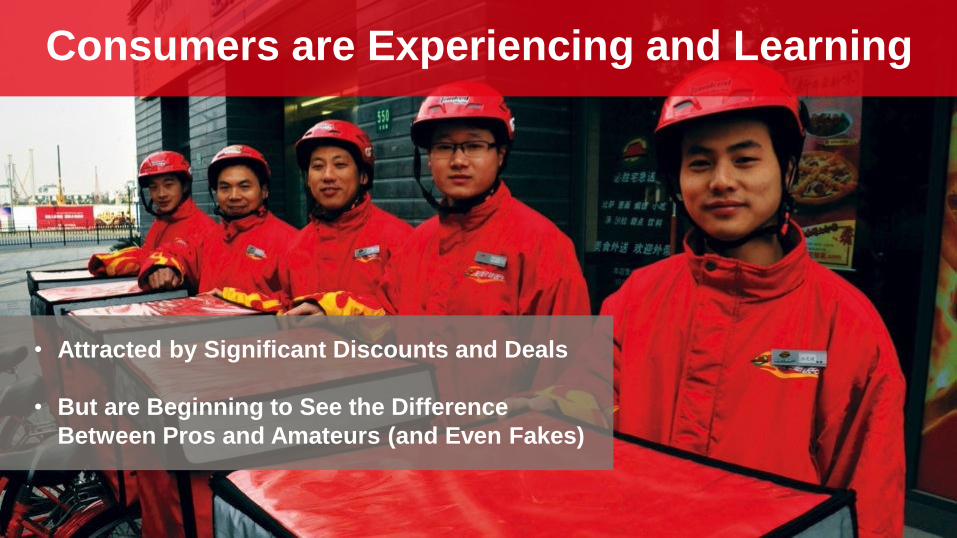
Consumers are Experiencing and Learning
• Attracted by Significant Discounts and Deals
• But are Beginning to See the Difference
Between Pros and Amateurs (and Even Fakes)

181Chinese
Diverse Menu50% Asian 50% Western
• Dedicated team
• Tech-savvy leader
• More technology
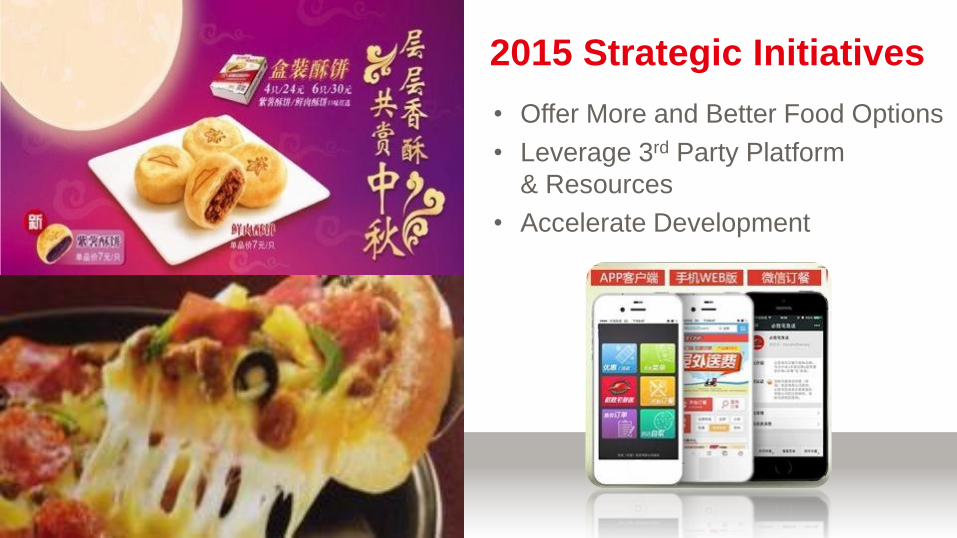
• Offer More and Better Food Options
• Leverage 3rd Party Platform
& Resources
• Accelerate Development
2015 Strategic Initiatives

Yum! China Remains the Best Restaurant Opportunity
Today Future
6,700+
ENVIABLE POSTION
China Division Units
3X
Stronger
BrandRedefine
Casual DiningThird Growth
Engine

Our Mission Stays the Same
“To become the best restaurant company, not only
in China, but in the world”
Yum Restaurants China
Team Mission Statement
At Pepsi spin off (October 1997)

A Brand New Day in India
Niren Chaudary
President, Yum! India
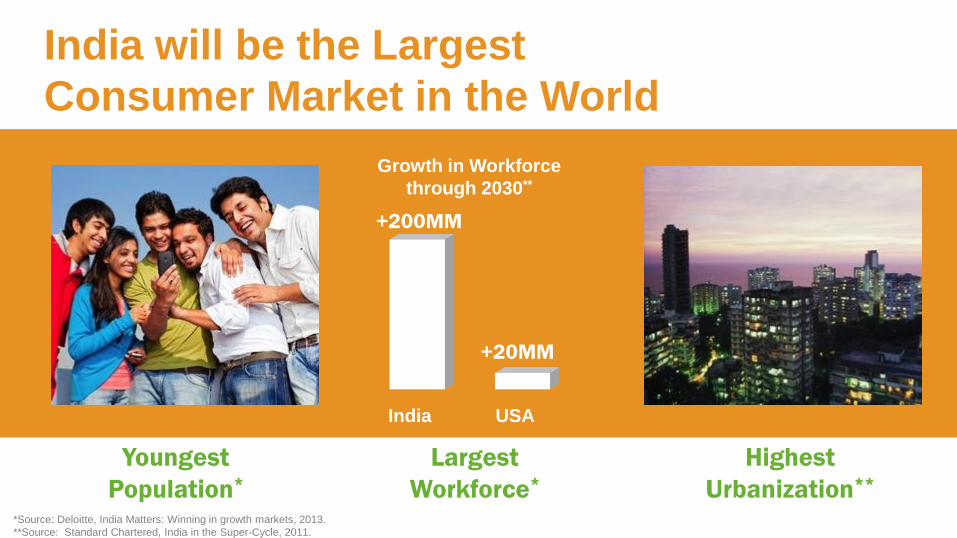
Youngest
Population*
Largest
Workforce*
India USA
+200MM
+20MM
Highest
Urbanization**
India will be the Largest
Consumer Market in the World
Growth in Workforce
through 2030**
*Source: Deloitte, India Matters: Winning in growth markets, 2013.
**Source: Standard Chartered, India in the Super-Cycle, 2011.
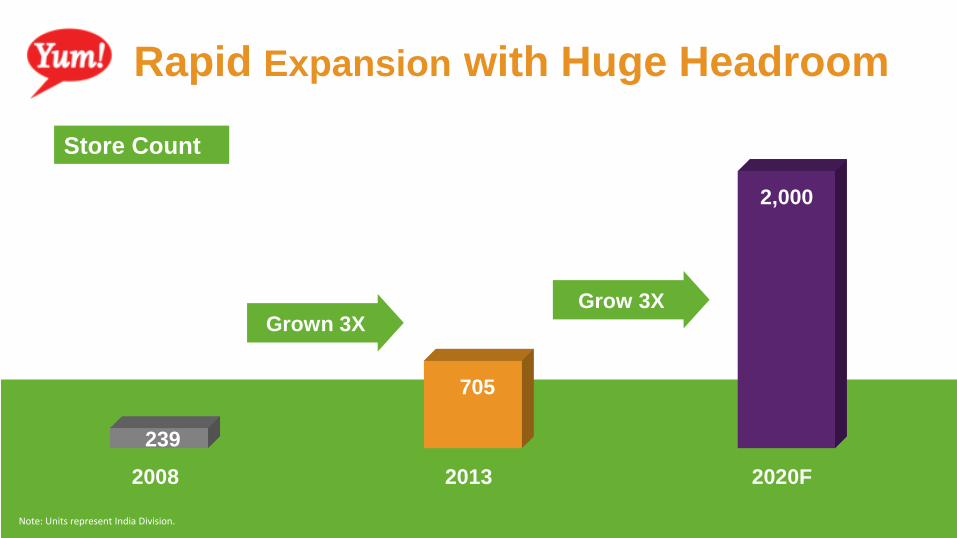
2008 2013 2020F
239
705
2,000
Rapid Expansion with Huge Headroom
Will Grow 3XGrown 3X
Note: Units represent India Division.
Grow 3X
Store Count

2014: Getting Stronger, More Relevant
Stronger
Buisness ModelsStronger
Brands

ANYONE,
ANYTIME

Established a Broad Concept
60%
Strong Core
Mix
… Accessible at Street-food Prices
8% 11% 12%7%
Krushers Oven Veg. Rice


Changing the Game with Rice
Indian
Flavored
Rice
Spicy Gravy
Chicken Popcorn
or Veg. Strips

Disruptive Innovation
to Drive Access
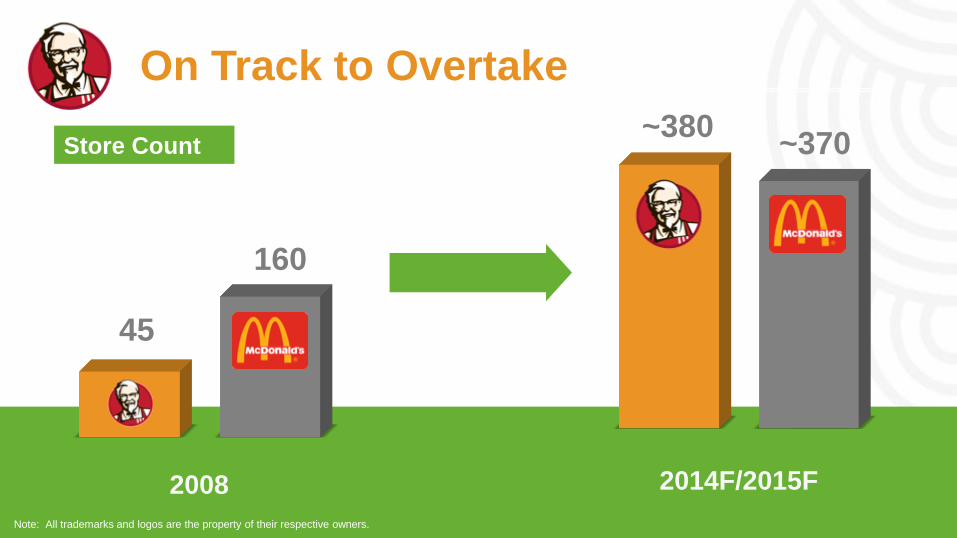
On Track to Overtake
45
160
2008 2014F/2015F
~380~370Store Count
Note: All trademarks and logos are the property of their respective owners.

Pizzas & Much More Food Delivery Expert
Most Trusted

Huge Opportunity, Gaining Ground
SSSG (YTD ‘14)
7%
-4%**
380
815*
Domino’s Market Cap $1.5Bn
* Source: Analyst Estimates. ** Source: Reported financials.
Note: All trademarks and logos are the property of their respective owners.
Store Count 2014F Same-Store Sales 2014F
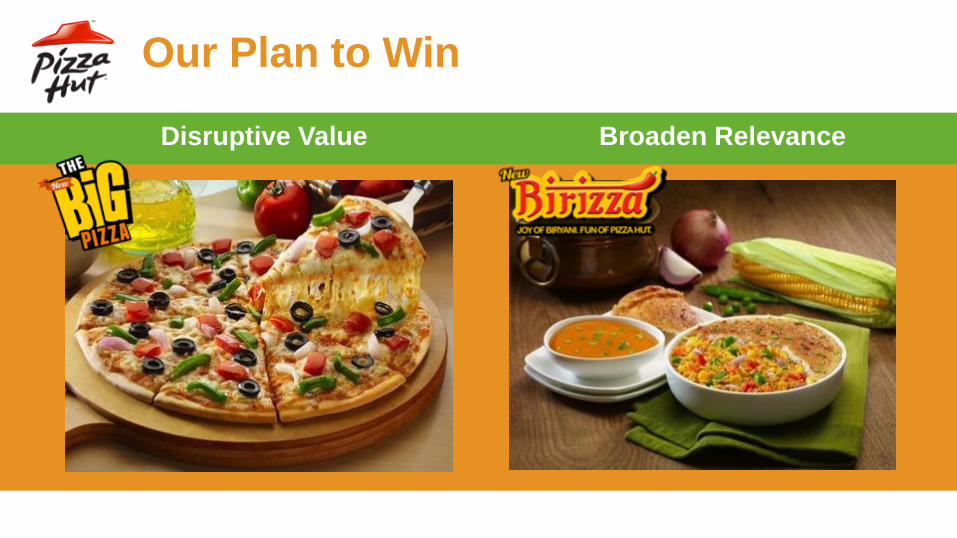
Broaden RelevanceDisruptive Value
Our Plan to Win
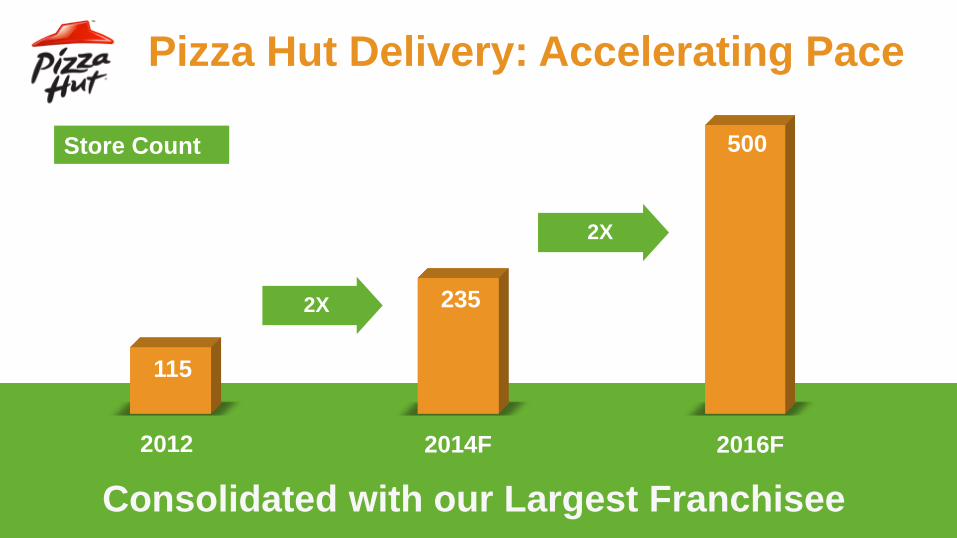
Pizza Hut Delivery: Accelerating Pace
115
235
500
2X
2012 2014F
2X
2016F
Consolidated with our Largest Franchisee
Store Count
Food
Adventure
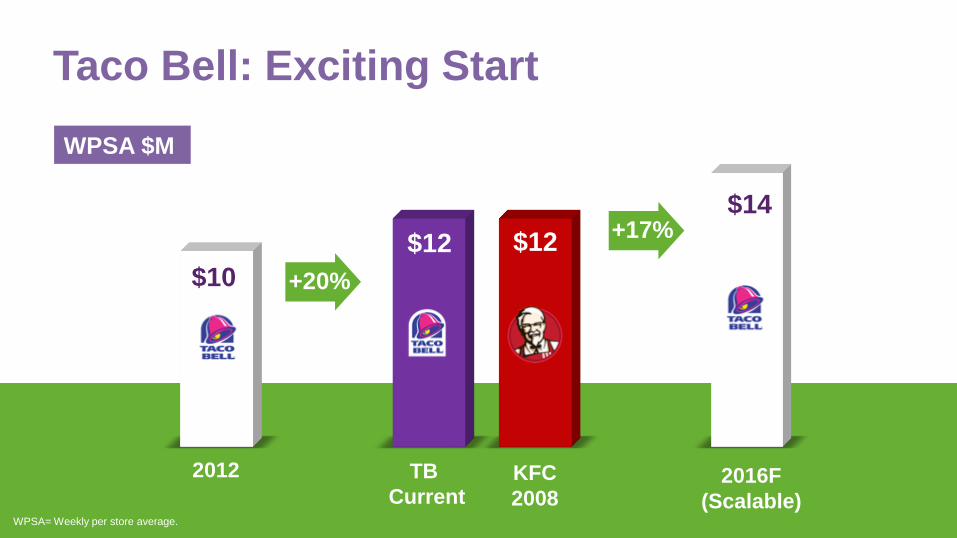
Taco Bell: Exciting Start
$10
$12 $12
$14
2012 TB
Current2016F
(Scalable)
ATL
KFC
2008
WPSA $M
+20%
+17%
WPSA= Weekly per store average.

2015F
1,000 Units
2020F
2,000 UnitsNote: Units represent India Division.
Huge Opportunity with All Brands

Pat GrismerCFO, Yum! Brands
Driving Higher ReturnsFor Our Shareholders
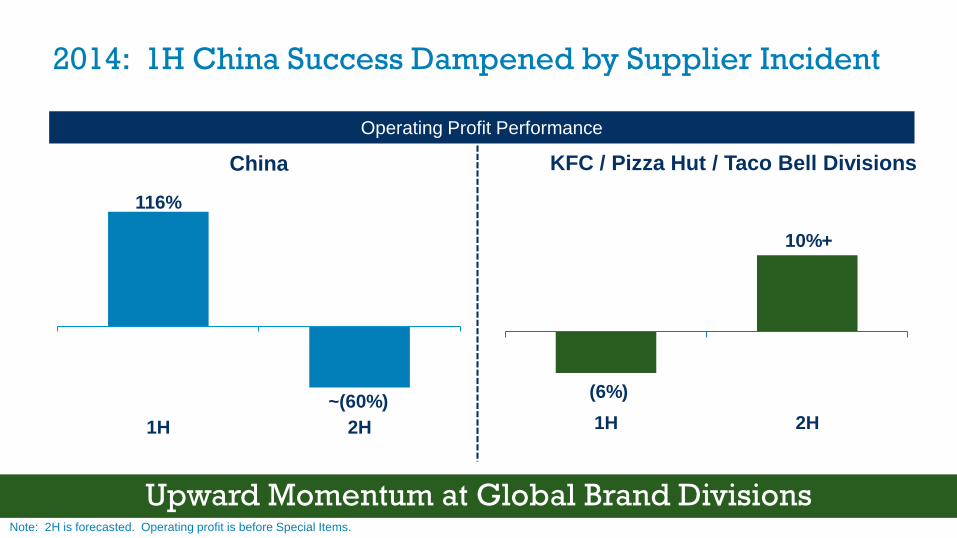
2014: 1H China Success Dampened by Supplier Incident
Operating Profit Performance
116%
~(60%)
1H 2H
(6%)
10%+
1H 2H
Upward Momentum at Global Brand Divisions
China KFC / Pizza Hut / Taco Bell Divisions
Note: 2H is forecasted. Operating profit is before Special Items.
How We Create Value for Shareholders
NEW-UNITDEVELOPMENT
SAME-STORE SALES GROWTH
HIGHRETURNS

Our Formula for High Shareholder Returns
Franchise
Led with
Purposeful
Equity
Meaningful
Cash
Returned to
Shareholders
Double-Digit
Growth
Model+ + +
Optimal
Capital
Structure

Our Formula for Higher Shareholder Returns
Even More
Franchise Led with
Purposeful
Equity
Meaningful
Cash
Returned to
Shareholders
Double-Digit
Growth
Model+ + +
Optimal
Capital
Structure

Purposeful Equity: Earning the Right to Own
Key Ownership Criteria
Financial Strategic
High Return Provide Concept Leadership
High Growth Stimulate Franchise Development
Strong Operating Capability Develop/Export Talent

Purposeful Equity in China
• Compelling Investment Returns
• Vast Growth Potential
• Unmatched Capability & Infrastructure

First-Half Returns Give Confidence in China Development
Payback
3-4 Years <3 Years
2014 New Unit Economics - KFC
Tier 1 – 2 Cities Tier 3 – 6 Cities
Average Unit
Volume ($MM) $1.1 $1.0
Cash Margin 18% 18%
Cash Investment
($M)$600 $610
Note: Includes units opened August 2012 – July 2013.
2014 New Unit Economics – Pizza Hut
Tier 1 – 2 Cities Tier 3 – 6 Cities
Average Unit
Volume ($MM) $1.2 $1.2
Cash Margin 20% 24%
Cash Investment
($M)$620 $660
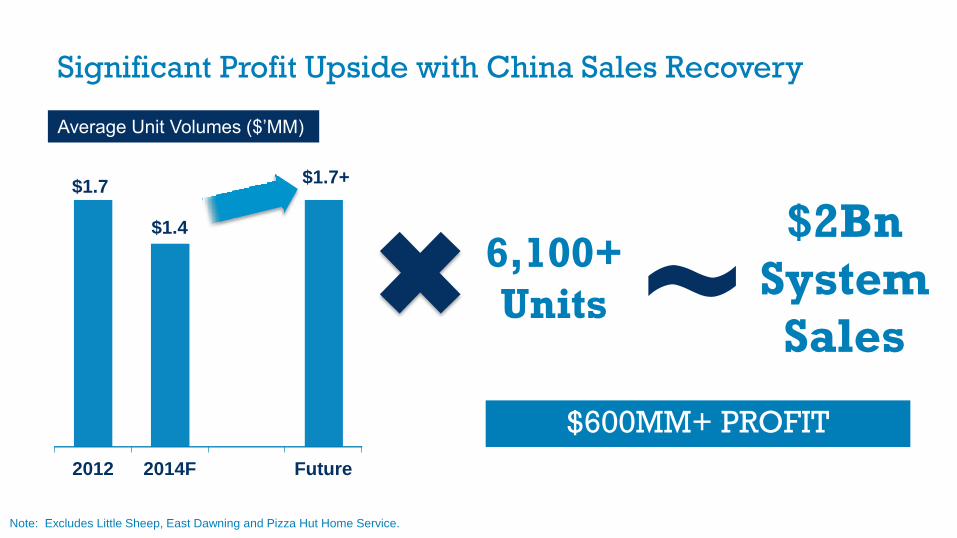
Significant Profit Upside with China Sales Recovery
2012 2014F Future
$1.7
$1.4
Average Unit Volumes ($’MM)
6,100+
Units
$2Bn
System
Sales
Note: Excludes Little Sheep, East Dawning and Pizza Hut Home Service.
~$1.7+
$600MM+ PROFIT

2013 2017F
Franchise Ownership Percentage
6%
~10%
Building Momentum on China Franchising
• Refranchising
• Franchise Development

75%
85-90%
2014F 2017F
Also Increasing Franchising in India
Franchise Ownership Percentage
• Refranchising
• Franchise Development

Over 90% Franchised Outside of China and India
90%
95%
85%
Franchise Ownership Percentage 2014F

Balanced with Purposeful Equity Positions
Franchising: A Powerful Business Model
Low Capital Low Volatility High Growth High Returns

80%
91%Mid 90s
2004 2014F By 2017F
Evolving to More Franchised Ownership
Franchise Ownership Percentage*
*Excluding China & India. Note: Ownership percentages indicate % of total units.
• Selective Refranchising
• Franchise Development

18%
24%
2010 2014F
Operating Margin for KFC, Pizza Hut, Taco Bell
Evolving to a Higher-Margin Business
Note: Excludes China & India.
by 2017F
30%+
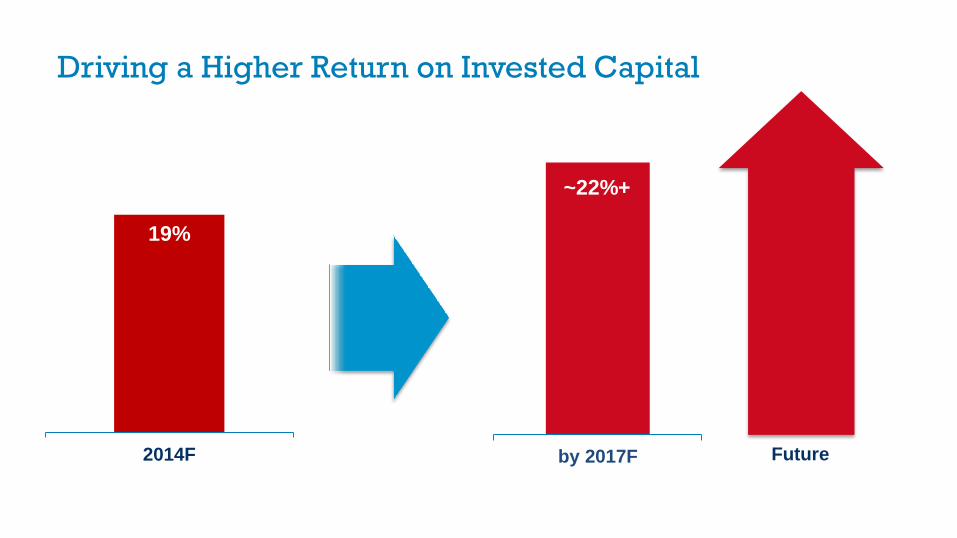
Driving a Higher Return on Invested Capital
19%
2014F by 2017F
~22%+
Future

And Sustaining Rapid Growth in Franchise Fees
2004 2009 2014F
24,600
27,700
32,900
Franchise Units
2004 2009 2014F
$1.0
$1.5
$2.0
Franchise Fees ($Bn)
Note: Franchised units include unconsolidated affiliates.
2012 2013 2014F
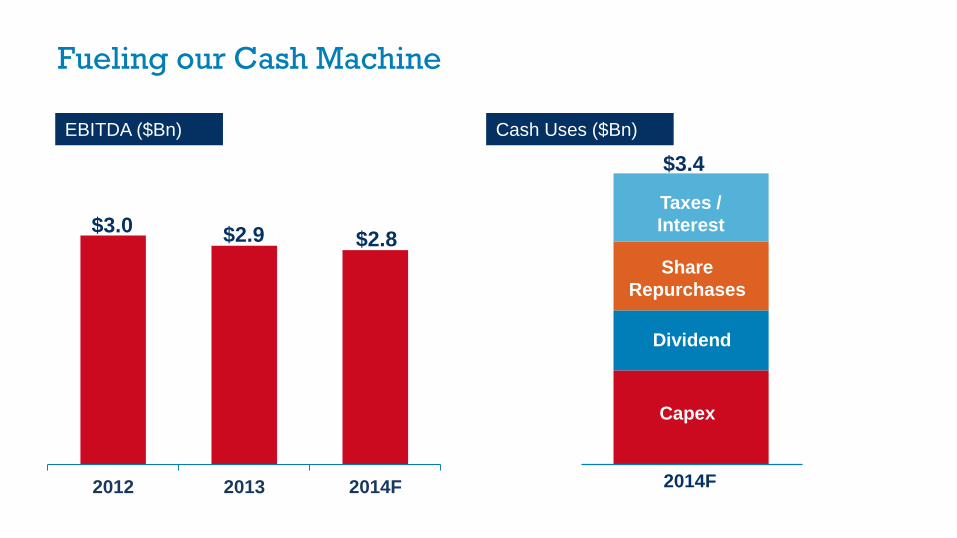
Fueling our Cash Machine
$2.8$2.9
EBITDA ($Bn) Cash Uses ($Bn)
$3.4
2014F
Capex
Share
Repurchases
Dividend
Taxes /
Interest$3.0

Sustaining High Shareholder Cash Returns
2004 2014F
Average Diluted Shares Outstanding (MM) Quarterly Dividend Per Share
$-
$0.05
$0.10
$0.15
$0.20
$0.25
$0.30
$0.35
$0.40
$0.45
2004 2014
610
450
Note: Quarterly dividend and shares are split adjusted (May 2007 2-for-1 stock split.)

Averaging 3.5% Annual Cash Return
2010 2011 2012 2013 2014F
Dividend Share Repurchases
$6.4Bn
Returned
Over Last 5
Years
$0.8
Cash Returned ($Bn)
$1.2
$1.5
$1.4
$1.5

Maintaining Investment-Grade Credit Rating
1.5x1.3x
1.1x 1.2x
'09 '11 '13 '14F
3.4x 3.3x 3.2x3.4x
'09 '11 '13 '14F
3.5x Baa3
Debt/EBITDA Ratio Moody’s Adjusted Debt/EBITDAR Ratio
3.0x Baa3
Note: 3.0x to 3.5x is Moody’s target range for companies rated Baa3.

Low Investment Grade Rating Optimizes Capital Structure
Independent Bank Reviews: Sub-IG Leverage = Higher Cost of Capital + Limited Flexibility + Modest Accretion
75%
25%
Baa Drives Lowest
WACC Across
Economic CyclesBaa
Other
% of Time Yum! WACC is Optimized
Over the Long Term

China KFC PizzaHut
TacoBell
Financial
+1%
+3%
+7%
+1% +13%
ModeledGrowth
+1%
At least
10%
Ongoing Model Delivers Double-Digit Growth
Forecasted EPS Growth Before Special Items
Op Profit
Growth+15% +10% +8% +6%

China KFC/PH/TB Financial 2015F
Potential for Outsized Year in 2015
Forecasted EPS Growth Before Special Items
+6%
+6%
+1% +13% At least
10% excluding
KFC China
growth
(Ex KFC)
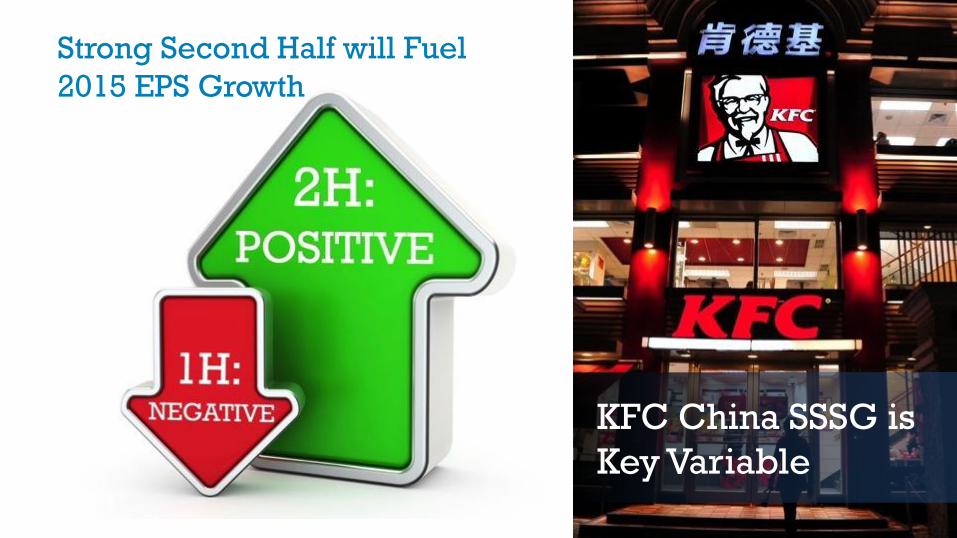
Strong Second Half will Fuel
2015 EPS Growth
KFC China SSSG is
Key Variable

2H’161H’162H’15
Yum! China: Potential for an Outsized Year in 2016 As Well
Recovery Recovered Ongoing …
1H’15
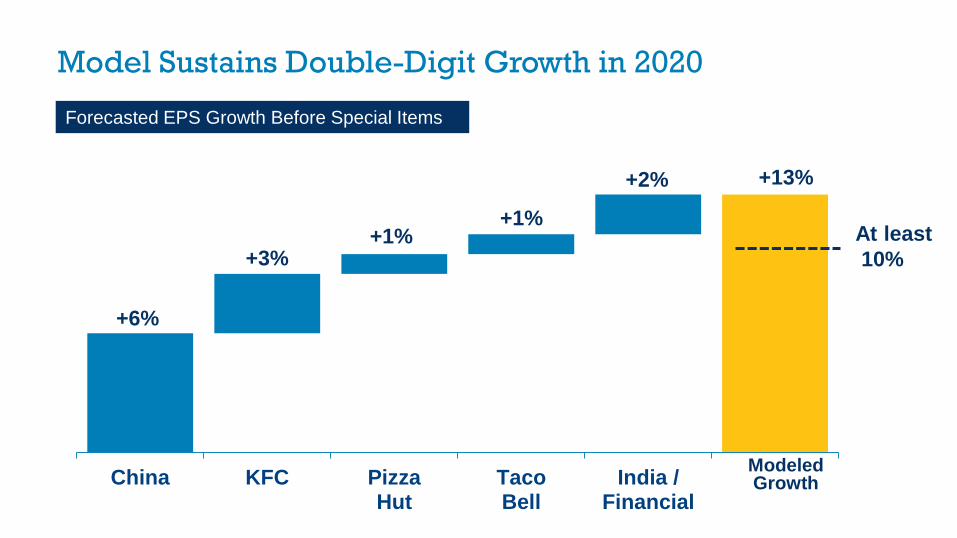
China KFC PizzaHut
TacoBell
India /Financial
ModeledGrowth
At least
10%
+1%
+3%
+6%
+2% +13%
+1%
Model Sustains Double-Digit Growth in 2020
Forecasted EPS Growth Before Special Items

Our Formula for Higher Shareholder Returns
Even More
Franchise Led with
Purposeful
Equity
Meaningful
Cash
Returned to
Shareholders
Double-Digit
Growth
Model+ + +
Optimal
Capital
Structure