youth unemployment in the eu - ifo.de · youth unemployment in european countries: some facts when...
TRANSCRIPT
3
FOCUS
CESifo Forum 2 / 2017 June Volume 18
Virginia Hernanz and Juan F. JimenoYouth Unemployment in Europe: Recent Developments and Old Problems
INTRODUCTION
High and persistent unemployment has been a recur-rent phenomenon in Europe since the early 1980s. Nowadays, despite some economic recovery from the Great Recession and the European debt crisis, it remains at levels well above those registered in the mid-2000s. Moreover, there are two new developments with potentially adverse consequences. One is the increasing divergence of unemployment rates across European countries (see Boeri and Jimeno 2016); the other is the higher likelihood of unemployment among youths, despite their declining weights in the popula-tion and in the labour force due to demographic trends. In fact, it is the concentration of unemployment among the younger population groups in some countries that explains a good deal of the increasing unemployment divergence in the EU.
Youth Unemployment in the EU
Virginia Hernanz University of Alcalá
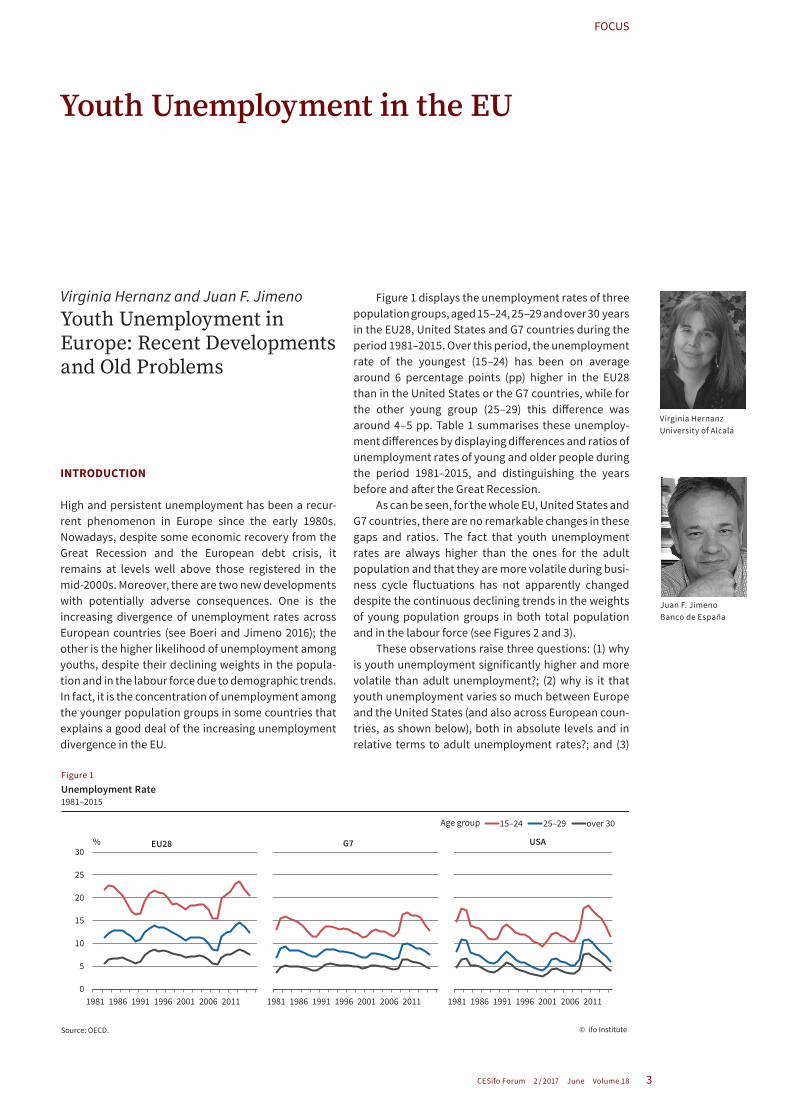
Figure 1 displays the unemployment rates of three population groups, aged 15–24, 25–29 and over 30 years in the EU28, United States and G7 countries during the period 1981–2015. Over this period, the unemployment rate of the youngest (15–24) has been on average around 6 percentage points (pp) higher in the EU28 than in the United States or the G7 countries, while for the other young group (25–29) this difference was around 4–5 pp. Table 1 summarises these unemploy-ment differences by displaying differences and ratios of unemployment rates of young and older people during the period 1981–2015, and distinguishing the years before and after the Great Recession.
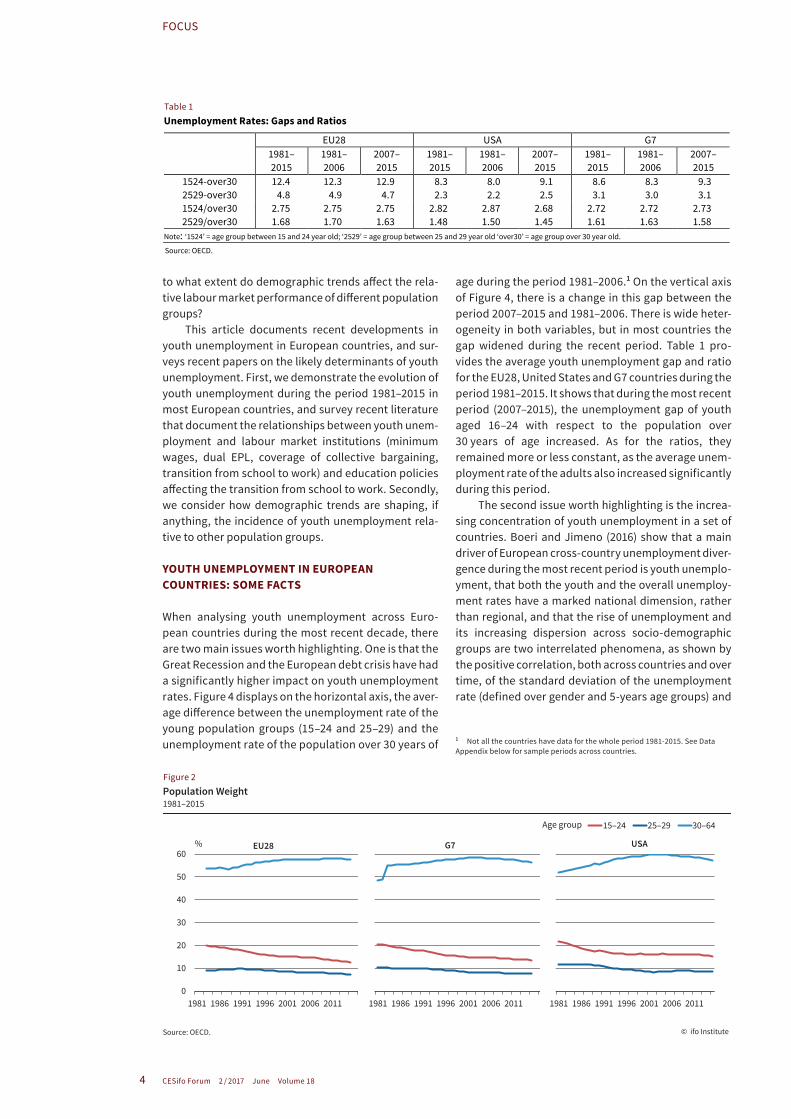
As can be seen, for the whole EU, United States and G7 countries, there are no remarkable changes in these gaps and ratios. The fact that youth unemployment rates are always higher than the ones for the adult population and that they are more volatile during busi-ness cycle fluctuations has not apparently changed despite the continuous declining trends in the weights of young population groups in both total population and in the labour force (see Figures 2 and 3).
These observations raise three questions: (1) why is youth unemployment significantly higher and more volatile than adult unemployment?; (2) why is it that youth unemployment varies so much between Europe and the United States (and also across European coun-tries, as shown below), both in absolute levels and in relative terms to adult unemployment rates?; and (3)
Juan F. Jimeno Banco de España
0
5
10
15
20
25
30
1981 1986 1991 1996 2001 2006 2011 1981 1986 1991 1996 2001 2006 2011 1981 1986 1991 1996 2001 2006 2011
15–24 25–29 over 30
Unemployment Rate1981–2015
% EU28
Source: OECD.
G7 USA
© ifo Institute
Age group
Figure 1
4
FOCUS
CESifo Forum 2 / 2017 June Volume 18
to what extent do demographic trends affect the rela-tive labour market performance of different population groups?
This article documents recent developments in youth unemployment in European countries, and sur-veys recent papers on the likely determinants of youth unemployment. First, we demonstrate the evolution of youth unemployment during the period 1981–2015 in most European countries, and survey recent literature that document the relationships between youth unem-ployment and labour market institutions (minimum wages, dual EPL, coverage of collective bargaining, transition from school to work) and education policies affecting the transition from school to work. Secondly, we consider how demographic trends are shaping, if anything, the incidence of youth unemployment rela-tive to other population groups.
YOUTH UNEMPLOYMENT IN EUROPEAN COUNTRIES: SOME FACTS
When analysing youth unemployment across Euro-pean countries during the most recent decade, there are two main issues worth highlighting. One is that the Great Recession and the European debt crisis have had a significantly higher impact on youth unemployment rates. Figure 4 displays on the horizontal axis, the aver-age difference between the unemployment rate of the young population groups (15–24 and 25–29) and the unemployment rate of the population over 30 years of
age during the period 1981–2006.1 On the vertical axis of Figure 4, there is a change in this gap between the period 2007–2015 and 1981–2006. There is wide heter-ogeneity in both variables, but in most countries the gap widened during the recent period. Table 1 pro-vides the average youth unemployment gap and ratio for the EU28, United States and G7 countries during the period 1981–2015. It shows that during the most recent period (2007–2015), the unemployment gap of youth aged 16–24 with respect to the population over 30 years of age increased. As for the ratios, they remained more or less constant, as the average unem-ployment rate of the adults also increased significantly during this period.
The second issue worth highlighting is the increa-sing concentration of youth unemployment in a set of countries. Boeri and Jimeno (2016) show that a main driver of European cross-country unemployment diver-gence during the most recent period is youth unemplo-yment, that both the youth and the overall unemploy-ment rates have a marked national dimension, rather than regional, and that the rise of unemployment and its increasing dispersion across socio-demographic groups are two interrelated phenomena, as shown by the positive correlation, both across countries and over time, of the standard deviation of the unemployment rate (defined over gender and 5-years age groups) and
1 Not all the countries have data for the whole period 1981-2015. See Data Appendix below for sample periods across countries.
Table 1
Unemployment Rates: Gaps and Ratios
EU28 USA G7 1981–2015
1981–2006
2007–2015
1981–2015
1981–2006
2007–2015
1981–2015
1981–2006
2007–2015
1524-over30 12.4 12.3 12.9 8.3 8.0 9.1 8.6 8.3 9.3 2529-over30 4.8 4.9 4.7 2.3 2.2 2.5 3.1 3.0 3.1 1524/over30 2.75 2.75 2.75 2.82 2.87 2.68 2.72 2.72 2.73 2529/over30 1.68 1.70 1.63 1.48 1.50 1.45 1.61 1.63 1.58
Note: ‘1524’ = age group between 15 and 24 year old; ‘2529’ = age group between 25 and 29 year old ‘over30’ = age group over 30 year old. Source: OECD.
Table 1
0
10
20
30
40
50
60
1981 1986 1991 1996 2001 2006 2011 1981 1986 1991 1996 2001 2006 2011 1981 1986 1991 1996 2001 2006 2011
15–24 25–29 30–64
Population Weight1981–2015
% EU28
Source: OECD.
G7 USA
© ifo Institute
Age group
Figure 2

5
FOCUS
CESifo Forum 2 / 2017 June Volume 18
the aggregate unemployment rate.2
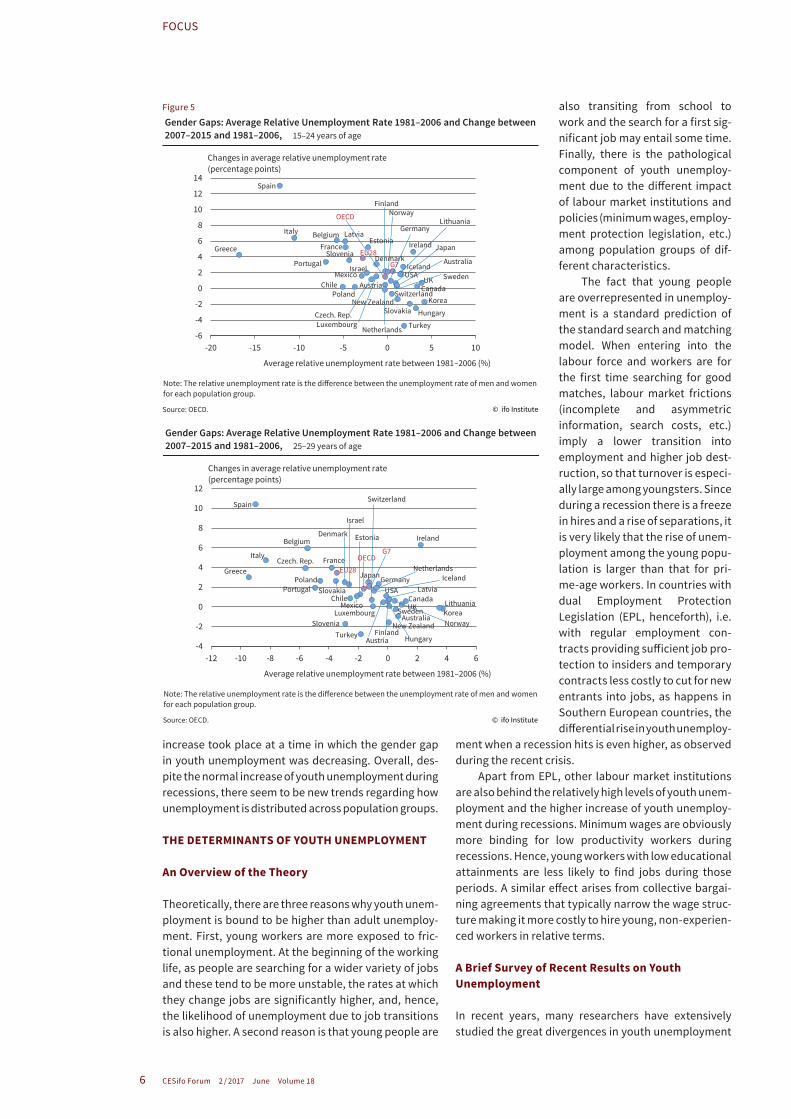
Finally, it is also worth noting that the gender gap in youth unemployment has significantly fallen, as the impact of the recent rise of unemployment was hig-her among males. Figure 5 shows that, for both youth aged 16–24 and those aged 25–29, the dif-ference between the male and the female unemployment rate decreased by most in those coun-tries where these gaps were hig-her (typically, Southern European countries).
In a nutshell, these facts sug-gest that the rise of youth unem-ployment since the start of the Great Recession was not atypical since in all countries during reces-sions it tends to increase in paral-lel with the unemployment rate of adult workers. There are however several new features that should be kept in mind. One is that in this period the youth unemployment gap (as measured by the absolute difference between the unemployment rates of youth aged 16–24 and 25–29 with respect to that of the population over 30 years of age) widened in most countries, and especially in Southern Euro-pean countries. Another is that this
2 The time series correlation between both var-iables is stronger in Eastern and Southern Europe, where unemployment differences across groups are also higher. The cross-country correlation has significantly increased since 2007.
0
10
20
30
40
50
60
70
80
1981 1986 1991 1996 2001 2006 2011 1981 1986 1991 1996 2001 2006 2011 1981 1986 1991 1996 2001 2006 2011
15–24 25–29 30–64
Labour Force Weight1981–2015
% EU28
Source: OECD.
G7 USA
© ifo Institute
Age group
Figure 3
Austria
Australia
Belgium
CanadaChile
Czech. Rep.
Denmark
Spain
Estonia
EU28
Finland
FranceG7
Germany
GreeceHungary
Iceland
Ireland
Israel
Italy
Japan
Korea
LatviaLithuania
Luxembourg
Mexico
New Zealand
Turkey
OECD
Netherlands
NorwayPoland
Portugal
USA
Slovakia
SloveniaSweden
Switzerland
UK
-10
-5
0
5
10
15
0 5 10 15
Changes in average relative unemployment rate(percentage points)
Source: OECD.
Average Relative Unemployment Rate 1981–2006 and Change between 2007–2015 and 1981–2006, 25–29 years of age
Average relative unemployment rate between 1981 and 2006 (%)
Note: The relative unemployment rate is the difference between the unemployment rate of each group and that of the population over 30 years of age.
© ifo Institute
Austria
Australia
Belgium
Canada
Chile
Czech. Rep.
Denmark
SpainEstonia
EU28
Finland
FranceG7Germany
Greece
Hungary
Iceland
Ireland
Israel
ItalyJapan
Korea
Latvia
Lithuania
Luxembourg
Mexico
New Zealand
Turkey
OECD
NetherlandsNorway
Poland
Portugal
USA
SlovakiaSlovenia
Sweden
Switzerland
UK
-15
-10
-5
0
5
10
15
0 5 10 15 20 25 30
Changes in average relative unemployment rate(percentage points)
Source: OECD.
Average Relative Unemployment Rate 1981–2006 and Change between 2007–2015 and 1981–2006, 15–24 years of age
Average relative unemployment rate between 1981 and 2006 (%)
Note: The relative unemployment rate is the difference between the unemployment rate of each group and that of the population over 30 years of age.
© ifo Institute
Figure 4
6
FOCUS
CESifo Forum 2 / 2017 June Volume 18
increase took place at a time in which the gender gap in youth unemployment was decreasing. Overall, des-pite the normal increase of youth unemployment during recessions, there seem to be new trends regarding how unemployment is distributed across population groups.
THE DETERMINANTS OF YOUTH UNEMPLOYMENT
An Overview of the Theory
Theoretically, there are three reasons why youth unem-ployment is bound to be higher than adult unemploy-ment. First, young workers are more exposed to fric-tional unemployment. At the beginning of the working life, as people are searching for a wider variety of jobs and these tend to be more unstable, the rates at which they change jobs are significantly higher, and, hence, the likelihood of unemployment due to job transitions is also higher. A second reason is that young people are
also transiting from school to work and the search for a first sig-nificant job may entail some time. Finally, there is the pathological component of youth unemploy-ment due to the different impact of labour market institutions and policies (minimum wages, employ-ment protection legislation, etc.) among population groups of dif-ferent characteristics.
The fact that young people are overrepresented in unemploy-ment is a standard prediction of the standard search and matching model. When entering into the labour force and workers are for the first time searching for good matches, labour market frictions (incomplete and asymmetric information, search costs, etc.) imply a lower transition into employment and higher job dest-ruction, so that turnover is especi-ally large among youngsters. Since during a recession there is a freeze in hires and a rise of separations, it is very likely that the rise of unem-ployment among the young popu-lation is larger than that for pri-me-age workers. In countries with dual Employment Protection Legislation (EPL, henceforth), i.e. with regular employment con-tracts providing sufficient job pro-tection to insiders and temporary contracts less costly to cut for new entrants into jobs, as happens in Southern European countries, the differential rise in youth unemploy
ment when a recession hits is even higher, as observed during the recent crisis.
Apart from EPL, other labour market institutions are also behind the relatively high levels of youth unem-ployment and the higher increase of youth unemploy-ment during recessions. Minimum wages are obviously more binding for low productivity workers during recessions. Hence, young workers with low educational attainments are less likely to find jobs during those periods. A similar effect arises from collective bargai-ning agreements that typically narrow the wage struc-ture making it more costly to hire young, non-experien-ced workers in relative terms.
A Brief Survey of Recent Results on Youth Unemployment
In recent years, many researchers have extensively studied the great divergences in youth unemployment
Austria
Australia
Belgium
CanadaChile
Czech. Rep.
Denmark
Spain
Estonia
EU28
Finland
FranceG7
GermanyGreece
Hungary
Iceland
Ireland
Israel
Italy
Japan
Korea
Latvia
LithuaniaLuxembourg
Mexico
New ZealandTurkey
OECDNetherlands
Norway
PolandPortugal USASlovakia
SloveniaSweden
Switzerland
UK
-4
-2
0
2
4
6
8
10
12
-12 -10 -8 -6 -4 -2 0 2 4 6
Changes in average relative unemployment rate(percentage points)
Source: OECD.
Gender Gaps: Average Relative Unemployment Rate 1981–2006 and Change between 2007–2015 and 1981–2006, 25–29 years of age
Average relative unemployment rate between 1981–2006 (%)
Note: The relative unemployment rate is the difference between the unemployment rate of men and women for each population group.
© ifo Institute
Austria
Australia
Belgium
CanadaChile
Czech. Rep.
Denmark
Spain
EstoniaEU28
Finland
France
G7
Germany
Greece
Hungary
Iceland
Ireland
Israel
Italy
Japan
Korea
Latvia
Lithuania
Luxembourg
Mexico
New Zealand
Turkey
OECD
Netherlands
Norway
Poland
PortugalUSA
Slovakia
Slovenia
Sweden
Switzerland
UK
-6
-4
-2
0
2
4
6
8
10
12
14
-20 -15 -10 -5 0 5 10
Changes in average relative unemployment rate(percentage points)
Source: OECD.
Gender Gaps: Average Relative Unemployment Rate 1981–2006 and Change between 2007–2015 and 1981–2006, 15–24 years of age
Average relative unemployment rate between 1981–2006 (%)
Note: The relative unemployment rate is the difference between the unemployment rate of men and women for each population group.
© ifo Institute
Figure 5
7
FOCUS
CESifo Forum 2 / 2017 June Volume 18
rates between countries and the reasons why youth unemploy-ment rates tend to be higher than adult rates in many of them. Besides, as Scarpetta et al. (2010) point out, the current crisis is exac-erbating a number of structural problems that affect this group, highlighting the urgency in the search for short-term solutions and structural reforms.
Blanchflower and Freeman (2000) and more recently OECD (2008) have confirmed that youth unemployment is more responsi-veness to business-cycle condi-tions than adult unemployment and this high-response tends to decline steadily with age. Bell and Blanchflower (2011) have pointed out some labour demand and sup-ply reasons that explain this grea-ter sensitiveness: young people have less specific human capital, some of them lack experience and they suffer a higher worker turno-ver after improving their job matches.
Furthermore, Boeri and Jimeno (2016) show that diver-gence of unemployment both across countries and among popu-lation groups arises from a triple interaction among the magnitude and nature of macroeconomic shocks and labour markets insti-tutions that conditioned the ways in which employers react to these shocks.
Dolado et al. (2015) also analyse the strong diver-gences across European youth unemployment by dis-tinguishing different groups of countries according to their ability to deal with this problem. A first group made up of Austria, Germany and Switzerland. These countries have been quite successful in keeping youth unemployment low mostly because of their efficient use of vocational training and programmes targeted at disadvantaged youth. A second group includes France, Britain and Sweden. This group has been less success-ful, mainly due to employment protection and mini-mum wages, plus a partly dysfunctional education sys-tem. Cahuc et al. (2013) show their concerns about the possibility of a ‘lost generation’ arising in France due to the strong increase in youth unemployment. They com-pare the reasons why Gemany tackles unemployment so well and France does not. They conclude that the dual apprenticeship system is a strong German asset with respect to smoothing school-to-work transitions. Furthermore, the absence of labour market segmenta-tion and national statutory minimum wage has contri-
buted to this better performance. Also the different approach of public employment service to youths has played an important role in their activation. However, unemployment rates in Sweden also exceed 20 percent and this fact has caused considerable concern among Swedish policymakers. Skans (2015) considers the seri-ousness of the situation less pessimistically in so far as the average duration of unemployment is short and to a large extent coincides with participation in educa-tion. A third group (Greece, Spain, Italy and Portugal) has been hit hardest by the crisis and has displayed the highest youth unemployment rates. Segmentation of the labour market, lack of aggregate demand and poor vocational training are among the main reasons for this surge. Also these countries have been more affected by sovereign debt crises or construction bubbles.
More specifically, for Italy, Leonardi and Pica (2015) identified three main reasons for the relative increase of youth unemployment during the crisis. First, the role of labour market institutions: fixed-term (FT) contracts are concentrated among the young and they experi-ence a lower protection against potential dismissals.
3
5
7
9
11
13
15
17
9 10 11 12 13 14 15 16
EU28 USAUnemployment rate in %
Source: OECD.
Unemployment Rates and Weights in the Labour Force25–29 years of age
Weigt in the labour force in %
1990
1985
1989
1984
1985
1991
1984
1988
1981
1986
1987
19831982
1983
19881989
1990
1991
1996
1995
1993
1994
1992
19971998
2000
2001
2001
20032002
2006
2009
2008
2010
2011
20122013
2014
2010
2012
2013
2014
2015 2009
20082007
19921993
19941997
© ifo Institute
9
11
13
15
17
19
21
23
25
9 11 13 15 17 19 21 23 25
EU28 USAUnemployment rate in %
Source: OECD.
Unemployment Rates and Weights in the Labour Force15–24 years of age
Weigt in the labour force in %
1990
1985
1989
1984
1985
1991
1984
1988
1981
19861987
19831982
19831986
1987
1988
19891990
1991
1996
1995
1993
1994
1992
19971998
19992000
2001
2001
2003
2005
2007
2009
2010
201120122013
2014
2015
20112010
2012
2013
2014
2015 2009
2008 2007
1992
19931994
19971999
© ifo Institute
Figure 6a
8
FOCUS
CESifo Forum 2 / 2017 June Volume 18
Second, Italian youth suffer a poor schooltowork transition as signalled by the high number of NEETs (‘young people not in education, employment or trai-ning’), but college graduates have also experienced long periods of unemployment perhaps due to excess supply. Finally, the number of full-time students has increased with the crisis and the authors consider that this decline in the participation of the young could mechanically increase the measured youth unemploy-ment rate.
Spain is another country where the youth unem-ployment rate reached its highest levels during the cri-sis, hitting an extremely high 55 percent. However, this greater incidence of unemployment among young peo-ple it is not a singular fact from this crisis, due to struc-tural problems in the school-to-work-transitions of
youths and rigidities in the labour market that disproportionately affect youth (Felgueroso and Jan-sen 2015) for several decades, now. In Spain the share of early school leavers is 23.6 percent, the Spanish system of vocational trai-ning is underdeveloped compared to the best-performing countries in Europe and some university stu-dies offer relatively poor employ-ment prospects. Besides, Spanish young people have also suffered a higher incidence of temporary employment and this is found (Dolado et al. 2013) to be one of the main determinants of both high worker turnover and the volatility of youth employment.
Youth unemployment tends to decline with age, but in Greece the greatest concern is for the age group 25–29 because numerically their unemployment is much lar-ger than those aged 15–19 (Bell and Blanchflower 2015), and the participation rate of youngsters below 24 years of age is very small. Also in Greece youth unemploy-ment was relatively high prior to the recession and the ratio youth/adult unemployment has even been trending even to decrease during the crisis.
DEMOGRAPHICS AND YOUTH UNEMPLOYMENT
Changes in youth unemployment rates are taking place simultane-ously with a declining weight of the young population and new patterns in participation across
population groups. Typically shiftshare analysis is used to identify the change in aggregate unemploy-ment rates due to compositional effects arising from changing weights of the several population groups into either the total population or the labour force. Results from this type of approach lead to the conclusion that in most countries population ageing is putting some brake on the rise of aggregate unemployment rates, since, as seen above, the highest rise of unemployment is taking place among youths whose weight in the total popula-tion and in the labour force is lowest. Moreover, when trends in aggregate unemployment rates are measured by common factors in worker flows of the different population groups, the impact of demographic-spe-cific components on the aggregate unemployment rate is even higher than what a standard labour force
1.3
1.4
1.5
1.6
1.7
1.8
1.9
2.0
10 11 12 13 14 15 16
EU28 USARelative unemployment ratespercentage points
Source: OECD.
Relative Unemployment Rates and Weights in the Labour Force25–29 years of age
Weigt in the labour force in %
19901985
1989
1984
1985
1991
1984
1988
1981
19861987
1983
1982
1983
1986
198719881989
1990
1991
1996
1995 1993
1994
1992
19961998
2000
2001
20082014 2007
20002004
2010
2011
2012
2003
20112009
20132014
2015
20062008
1992
1994
1995
19971998
19932003
2005
2002
© ifo Institute
Note: The relative unemployment rate is the difference between the unemployment rate of men and women for each population group.
2.0
2.2
2.4
2.6
2.8
3.0
3.2
3.4
3.6
3.8
4.0
9 11 13 15 17 19 21 23 25
EU28 USARelative unemployment ratespercentage points
Source: OECD.
Relative Unemployment Rates and Weights in the Labour Force15–24 years of age
Weigt in the labour force in %
1983
1985
1997
1984
1985
1991
1984
19891981
19861987
1982
1983
1986
1987
1998
1989
19901995
1993
1999
1992
1996
1998
2004
2007
2014
2009
2000
20082015
2013 2003
201120072012
2014
2015 2006
2008 1988
1994
2002
© ifo Institute
Note: The relative unemployment rate is the difference between the unemployment rate of men and women for each population group.
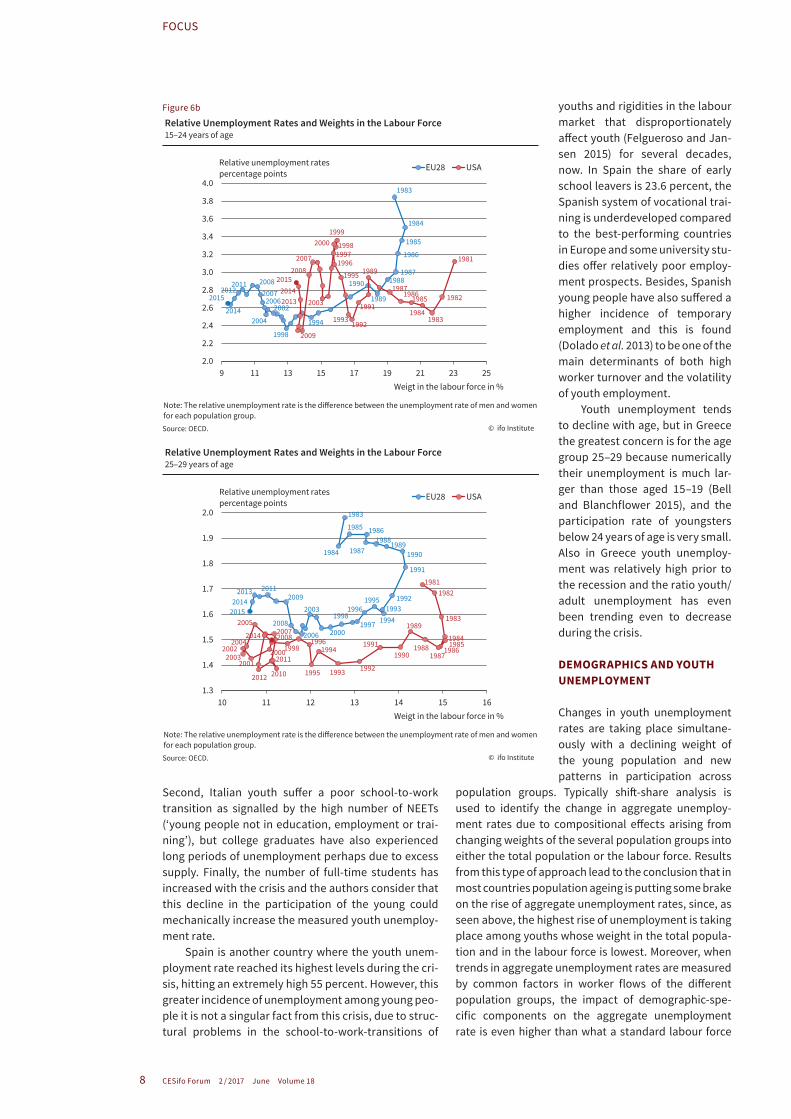
Figure 6b
9
FOCUS
CESifo Forum 2 / 2017 June Volume 18
shiftshare analysis is able to discover (Barnichon and Meesters 2016).
Another important issue regarding the relation-ship between unemployment and demographics is the extent to which changes in participation and popula-tion weights are related to changes in unemployment of specific population groups. On this, the conventio-nal wisdom is against the lump-of-labour fallacy so that changing weights should not cause changes in relative unemployment rates across population groups. An- other matter, however, is whether a recession has a different impact on the youth unemployment rate when the weight of young workers in the labour force is decreasing relative to the same impact when those weights are increasing.
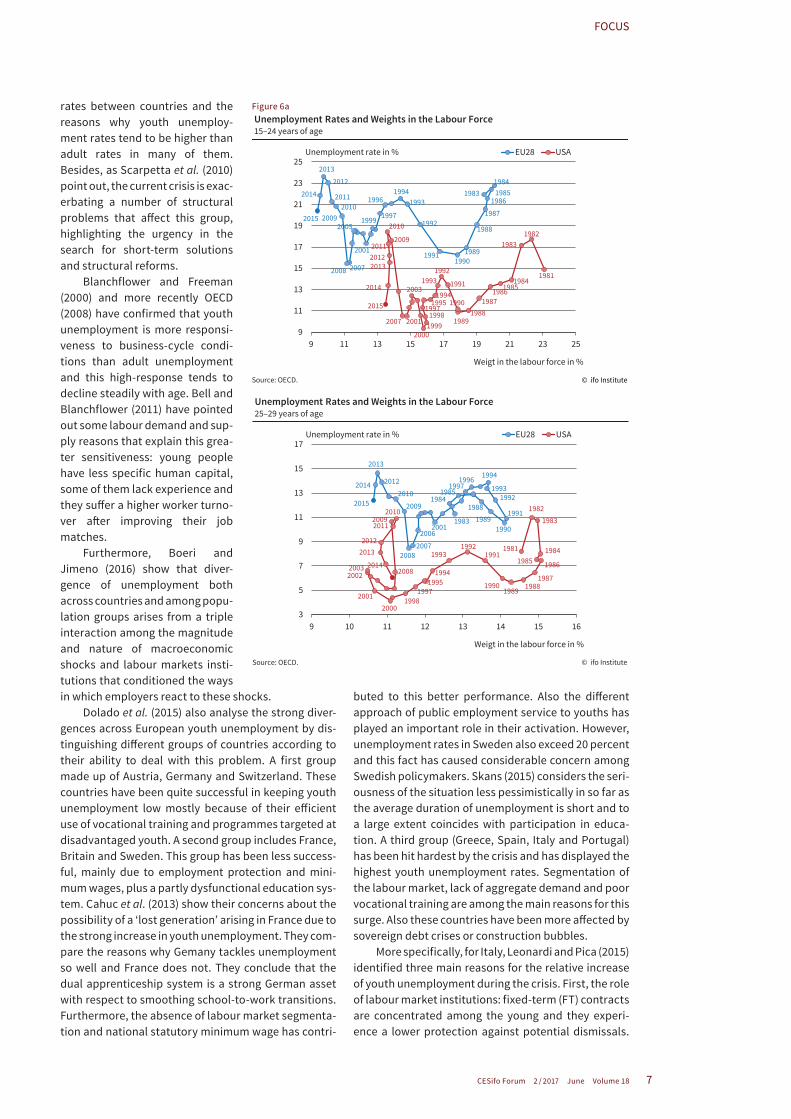
We address this question in two steps. First, Figu-res 6a and 6b provide the evolution of the youth labour force weights and unemployment rates (absolute and relative) for the EU28 and the United States during the period 1981–2015. The reduction of the labour force weight of both the population aged 15–24 and the one aged 25–29 was roughly similar in both areas (about 10 percentage points and 5 percentage points, res-pectively) while the corresponding youth unemploy-ment rates behave in a cyclical fashion that seems unrelated to the declining trend of the labour force weights. A similar finding arises when looking at rela-tive unemployment rates, although in this case the recession of the early 1980s, when the weights of the young populations in the labour force were highest, was associated to largest gaps between youth unem-
ployment rates and those of the population over 30 years of age.
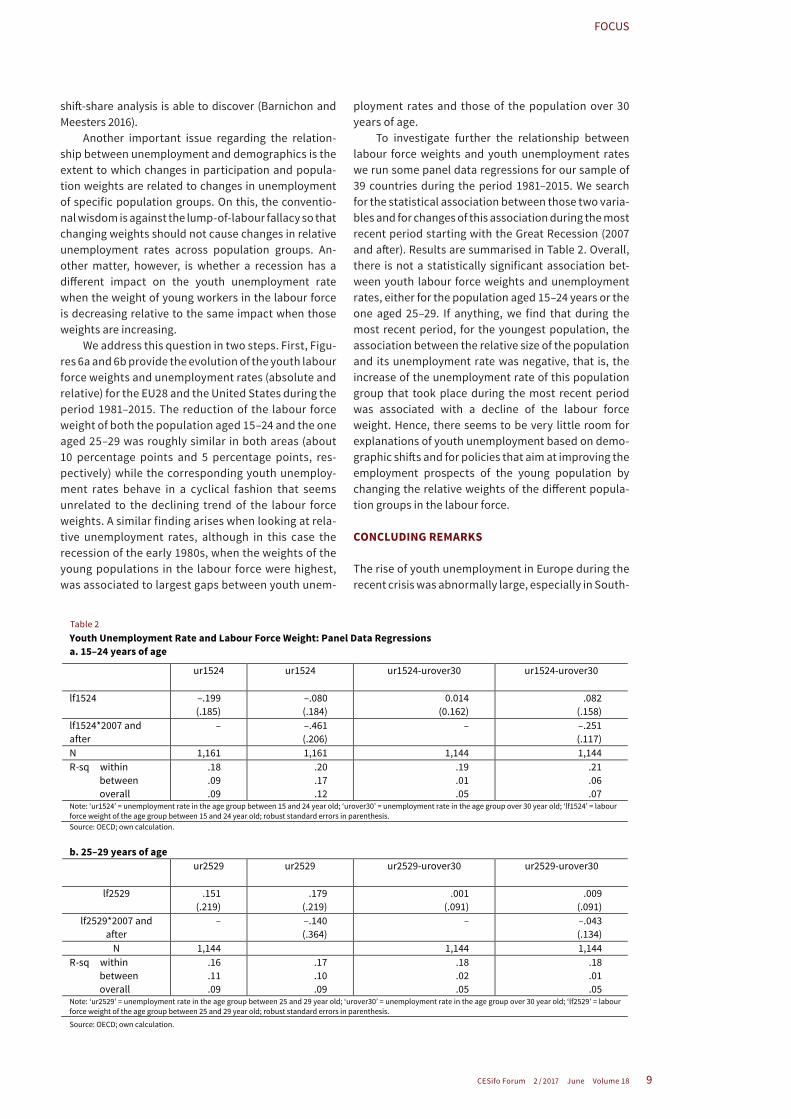
To investigate further the relationship between labour force weights and youth unemployment rates we run some panel data regressions for our sample of 39 countries during the period 1981–2015. We search for the statistical association between those two varia-bles and for changes of this association during the most recent period starting with the Great Recession (2007 and after). Results are summarised in Table 2. Overall, there is not a statistically significant association bet-ween youth labour force weights and unemployment rates, either for the population aged 15–24 years or the one aged 25–29. If anything, we find that during the most recent period, for the youngest population, the association between the relative size of the population and its unemployment rate was negative, that is, the increase of the unemployment rate of this population group that took place during the most recent period was associated with a decline of the labour force weight. Hence, there seems to be very little room for explanations of youth unemployment based on demo-graphic shifts and for policies that aim at improving the employment prospects of the young population by changing the relative weights of the different popula-tion groups in the labour force.
CONCLUDING REMARKS
The rise of youth unemployment in Europe during the recent crisis was abnormally large, especially in South-
Table 2 Youth Unemployment Rate and Labour Force Weight: Panel Data Regressions a. 15–24 years of age
ur1524 ur1524
ur1524-urover30
ur1524-urover30
lf1524 –.199 (.185)
–.080 (.184)
0.014 (0.162)
.082 (.158)
lf1524*2007 and after
– –.461 (.206)
– –.251 (.117)
N 1,161 1,161 1,144 1,144 R-sq within between overall
.18
.09
.09
.20
.17
.12
.19
.01
.05
.21
.06
.07 Note: ‘ur1524’ = unemployment rate in the age group between 15 and 24 year old; ‘urover30’ = unemployment rate in the age group over 30 year old; ‘lf1524’ = labour force weight of the age group between 15 and 24 year old; robust standard errors in parenthesis. Source: OECD; own calculation.
b. 25–29 years of age
ur2529 ur2529
ur2529-urover30
ur2529-urover30
lf2529 .151 (.219)
.179 (.219)
.001 (.091)
.009 (.091)
lf2529*2007 and after
– –.140 (.364)
– –.043 (.134)
N 1,144 1,144 1,144 R-sq within between overall
.16
.11
.09
.17
.10
.09
.18
.02
.05
.18
.01
.05 Note: ‘ur2529’ = unemployment rate in the age group between 25 and 29 year old; ‘urover30’ = unemployment rate in the age group over 30 year old; ‘lf2529’ = labour force weight of the age group between 25 and 29 year old; robust standard errors in parenthesis.
Source: OECD; own calculation.
Table 2
10
FOCUS
CESifo Forum 2 / 2017 June Volume 18
ern European countries. Is it sufficient to trust that an economic recovery will reduce unemployment of all the population groups to normal levels? If not, what kind of policy intervention is needed to improve the labour market prospects of the European unemployed youth?
In principle, estimates of Okun’s law (that is the relationship between GDP growth and unemployment) suggest that positive shocks raising GDP tend to decrease youth unemployment in a similar fashion as for the unemployment of other population groups (van Ours 2015). If anything, the slope of the relationship between GDP growth and youth unemployment seems to have become steeper since 2007 (which is why during the last recession youth unemployment increased by more than expected). If so, future increases in econo-mic activity should go hand-in-hand with higher reduc-tions in youth unemployment.
There are, however, two reasons why high youth unemployment needs to be addressed with a specific approach. One is that unemployment during the early stage of the working career (and especially long-term youth unemployment) has a persistent negative effect on future labour outcomes. In the case of short-term youth unemployment, jumping from temporary to tem-porary jobs and not being able to capitalise on their human capital nor accumulate substantial working experience, the effect could be as large as for longterm unemployment. Thus, the socalled ‘scarring’ effects of unemployment could be especially large for this popu-lation group. The second reason is that depreciation of human capital takes place at particularly higher rates during the initial stages of the working career, and, again, this happens both for long-term unemployed youth and for young workers with very high transition rates among temporary jobs.
Under the conceptual framework and with the interpretation of the evidence presented above, there are two main policy interventions to be considered. One should be targeted to reduce the labour market frictions that make the search for a first significant job especially burdensome. This requires changes in the educational and vocational system to make the job matches of new entrants into the labour market more efficient. Thus, best practices in transitions from school to work need to be identified and implemented. However, this would not be sufficient if there are labour market institutions that preclude employment stabi-lity for young workers. Hence, a second policy inter-vention that is needed requires dismantling of entry barriers into employment and the establishment of in-work benefits, particularly for low-skilled young workers and eliminating dual EPL that is at the root of the excessively high and negative job turnover for youths. These types of interventions are somehow resisted by insiders in countries where they are most needed and, therefore, there is substantial scope for a European–wide initiative, as suggested by Boeri and Jimeno (2016).
DATA APPENDIX
The source of data is OECD_Stat (https://stats.oecd.org/). Countries included in the sample and the corresponding sample periods are:– Australia, Canada, Spain, Finland, Germany, Italy,
Portugal, Japan, Korea, Netherlands, Norway, Swe-den, USA, G7 (1981-2015)
– Belgium, Denmark, France, Greece, Luxembourg, Ireland, EU28 (1983-2015)
– Britain (1984-2015)– Israel (1985-2015)– New Zealand (1986-2015)– Turkey (1988-2015)– Iceland, Mexico, Switzerland (1991-2015)– Estonia (1990-2015)– Poland, Hungary (1992-2015)– Czech Republic (1993-2015)– Austria, Slovakia (1994-2015)– Chile (1996-2015)– Latvia, Lithuania, Slovenia (2000-2015)
REFERENCES
Barnichon, R. and G. Meesters (2016), “On the Demographic Adjustment of Unemployment”, Review of Economics and Statistics, forthcoming.
Bell, D.N. and D.G. Blanchflower (2011), “Young People and the Great Recession”, Oxford Review of Economic Policy 27, 241–267.
Bell, D.N. and D.G. Blanchflower (2015), “Youth Unemployment in Greece: Measuring the Challenge”, IZA Journal of European Labor Studies 4, 1–25.
Blanchflower, D.G. and R.B. Freeman (eds., 2017), Youth Employment and Joblessness in Advanced Countries, Chicago: University of Chicago Press.
Boeri, T. and J.F. Jimeno (2016), “Learning from the Great Divergence in Unemployment in Europe during the Crisis”, Labour Economics 41, 32–46.
Cahuc, P., S. Carcillo, U. Rinne and K.F. Zimmermann (2013), “Youth Unemployment in Old Europe: The Polar Cases of France and Germany”, IZA Journal of European Labor Studies 2, 1–23.
Dolado, J.J., M. Jansen, F. Felgueroso, A. Fuentes and A. Wölfl (2013), Youth Labour Market Performance in Spain and its Determinants: A Micro Level Perspective, OECD Economics Department Working Paper 1039.
Dolado, J.J. (ed., 2015), No Country for Young People? Youth Labour Market Problems in Europe, VoxEU, http://voxeu.org/content/no-country-young-people-youth-labour-market-problems-europe.
Leonardi, M., and G. Pica (2015), “Youth Unemployment in Italy”, in: Dolado J.J. (ed.), No Country for Young People? Youth Labour Market Prob-lems in Europe, VoxEU, http://voxeu.org/content/no-country-young-people-youth-labour-market-problems-europe.
OECD (2008), Off to a Good Start? Youth Labour Market Transitions in OECD Countries, Paris.
Scarpetta, S., A. Sonnet and T. Manfredi (2010), Rising Youth Unemploy-ment during the Crisis, OECD Social, Employment and Migration Working Papers 106.
Skans, O.N. (2015), “Swedish Youth Unemployment: Perhaps Not As Bad As It Looks?, in: Dolado J.J. (ed.), No Country for Young People? Youth Labour Market Problems in Europe, VoxEU, http://voxeu.org/content/no-country-young-people-youth-labour-market-problems-europe.
Van Ours, J. (2015), “The Great Recession Was Not So Great”, Labour Eco-nomics 34, 1–12.