17 youth unemployment
TRANSCRIPT
8/13/2019 17 Youth Unemployment
http://slidepdf.com/reader/full/17-youth-unemployment 1/5
1
YOUTH UNEMPLOYMENT
Young people have been hardest hit in the labour market during the economic crisis1. Asrecognised in the 2013 Annual Growth Survey (AGS) and related youth initiatives, there needto be strong efforts to reduce youth unemployment and to promote young people’sparticipation in the labour market. In the 2013 AGS, the Commission stressed that MemberStates should secure school-to-work transitions for young people and develop andimplement Youth Guarantee schemes whereby every young person under 25 receives anoffer of employment, continued education, an apprenticeship or a traineeship within fourmonths of becoming unemployed or leaving formal education. Such schemes can be co-financed by the European Social Fund.
1. Key statistical indicators
There are three major indicators to summarise the situation of young people in the labourmarket:
− Youth unemployment rate for those aged 15-24 varied from 7.6 % (the Netherlands) to
46.4 % (Spain) in 2011. Monthly figures (seasonally adjusted) in 2012 show a worsenedsituation, with rates ranging from 8% (Germany) to 57% (Greece) in September andJuly respectively2.
− The unemployment ratio, i.e. the share of unemployed among the population aged15-24 — instead of its labour force — varied between 4.2 % (Luxembourg) and 19 %(Spain) in 2011, the EU average standing at 9.1%.
− The third statistic is the population aged 15-24 not in employment, education ortraining (NEET). The EU average in 2011 was 12.9% and this varied between 3.8%(the Netherlands) and 22.6 % (Bulgaria).
The youth unemployment rate reached a historic high of 22.8 % in September 2012, withsome 5.5 million young people affected. Young people that have only completed lower
secondary education (early leavers from education and training) bear the highest risk ofunemployment. In Q2 2012, the EU average youth unemployment rate was 22.4 %, butreached 30.2 % for low-skilled youth.
2. Assessment of Member States’ challenges
Currently, more than one in five young people available for the labour market cannot find a job. Many may decide to prolong or return to studying and to invest in their futureemployability. But there is a large number of young people neither working nor studying.Being unemployed at a young age has a long-lasting negative impact, a 'scarring effect'.Young people might be trapped in the lower end of the labour market, with less on-the-jobtraining, lower wage levels and weaker long-term employment and career prospects,consequently experiencing long spells of joblessness and facing a high risk of exclusion.Young people aged 25-29 with higher education also find it harder to access jobs in line withtheir qualifications. Although the low-skilled overall still face the highest risk ofunemployment, the young highly skilled have suffered the biggest drop in employment.
In most Member States (17 out of 27), the youth u nemployment ra te is above 20 % (Sept2012 data for most countries): in five, the rate is over 30 % (Greece, Spain, Italy, Portugaland Ireland) and in 12, the rates range from 20 to 30 %. However, seven Member Stateshave rates between 10 and 20 % (Denmark, Malta, Slovenia, Belgium, Luxembourg, Finland
1
Youth unemployment always tends to be higher than overall employment, thus, even independentlyfrom the crisis, there is a need for targeted action for young people2 Eurostat Labour Force Statistics, (une_rt_a) and (une_rt_m)
8/13/2019 17 Youth Unemployment
http://slidepdf.com/reader/full/17-youth-unemployment 2/5
2
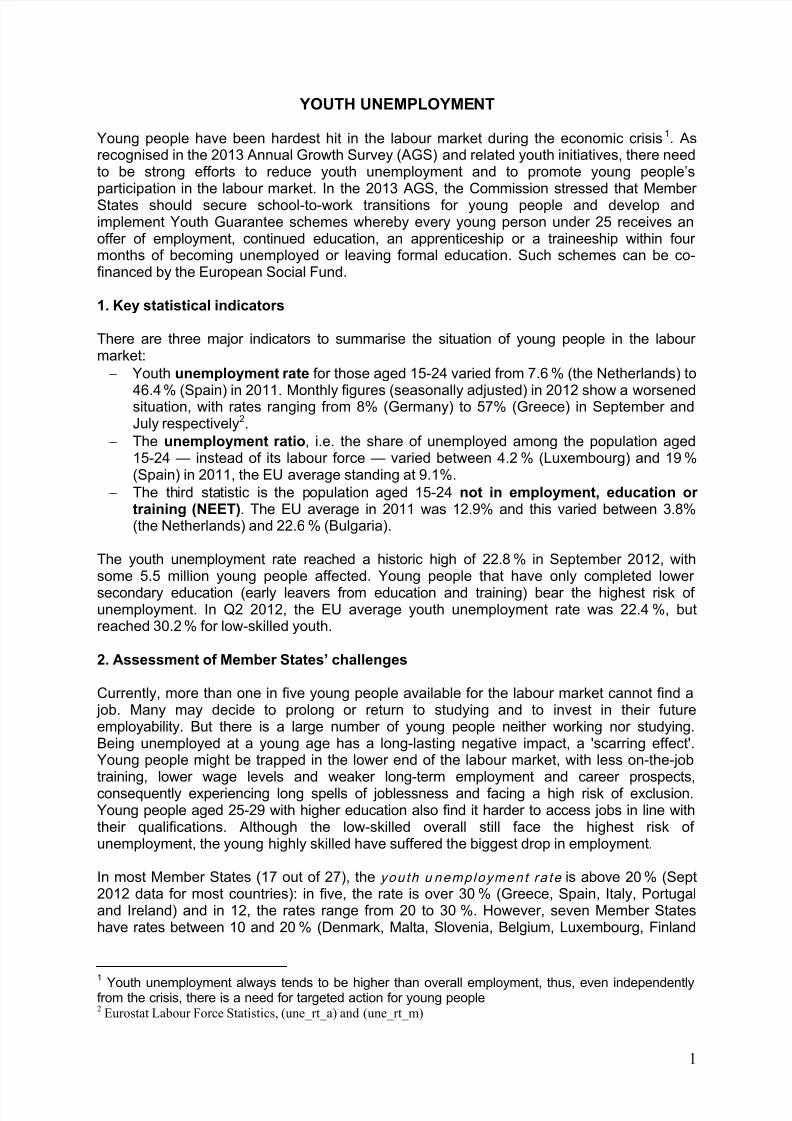
and the Czech Republic) and in three (the Netherlands, Austria and Germany) the youthunemployment rate is below 10 %.
Youth unemployment rates for the EU Member States, September 2011, March 2012 andSeptember 2012
Notes: *Data for August 2012 instead of September 2012. ** Data for June 2012 instead of September 2012.
Source: Eurostat, LFS
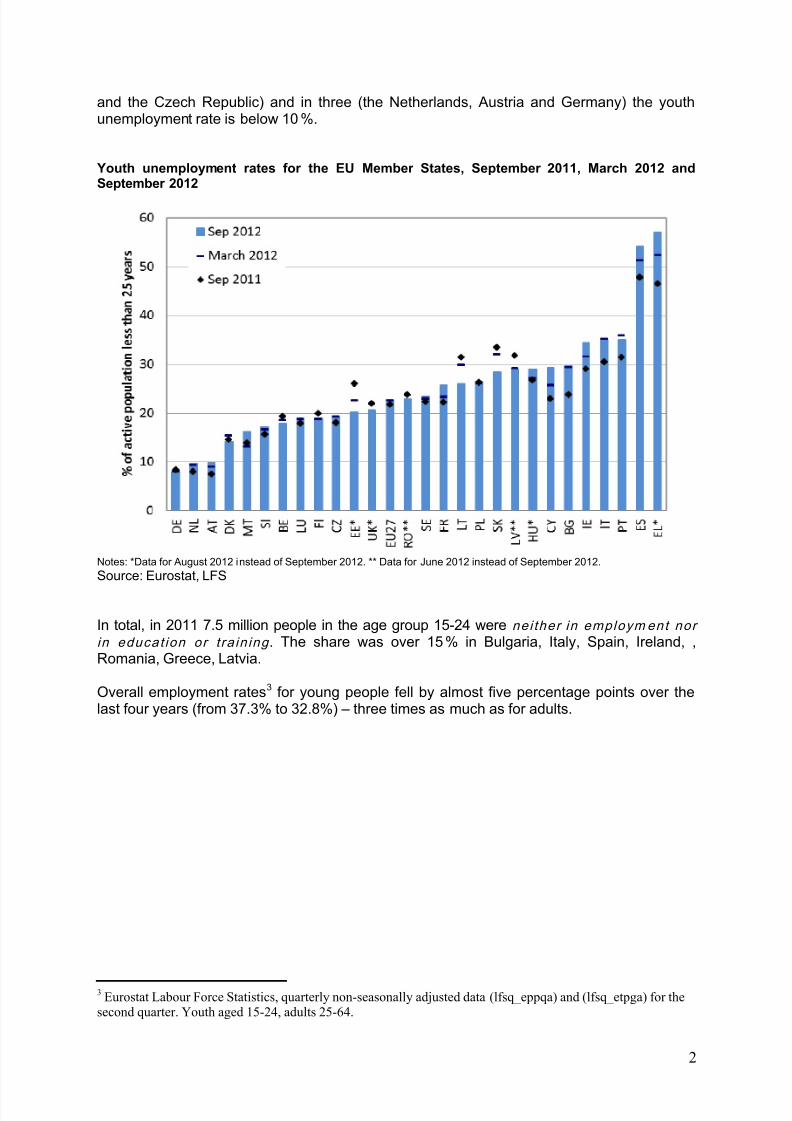
In total, in 2011 7.5 million people in the age group 15-24 were nei ther in employm ent nor
in educat ion or t ra in ing . The share was over 15 % in Bulgaria, Italy, Spain, Ireland, ,Romania, Greece, Latvia.
Overall employment rates3 for young people fell by almost five percentage points over thelast four years (from 37.3% to 32.8%) – three times as much as for adults.
3 Eurostat Labour Force Statistics, quarterly non-seasonally adjusted data (lfsq_eppqa) and (lfsq_etpga) for the
second quarter. Youth aged 15-24, adults 25-64.
8/13/2019 17 Youth Unemployment
http://slidepdf.com/reader/full/17-youth-unemployment 3/5
3
Young people not in employment, education or training (NEET) for EU Member States, 2008,2010 and 2011
Notes: NL - break in series 2010; LU - unreliable data 2010 and 2011; PT - see metada at Eurostat webapge for 2011; FI - seemetada at Eurostat webapge for 2010; SE - provisional value for all yesrs. Source:Eurostat, LFS, table: edat_lfse_20
Labour markets are segmented in a way that young people are overrepresented in temporary
jobs: in 2012, 42% of young employees are working on a temporary contract (four times asmuch as adults and accounting for nearly 30% of those in temporary employment) and 32%work part-time (nearly twice the adults' rate)4. There are fewer and fewer permanent jobs foryoung people, a trend that has persisted since 2008.
Long-term youth unemployment is on the rise: on average, 30.1 % of the young unemployedhave been jobless for more than 12 months. The long-term unemployment rate increased by3.7 percentage points (to 7.3% of the young labour force) between 2008 and 2012,compared with a 1.8 point increase for adults (to 4.3%).
Eurofound5 estimates that in 2011, the cost of young pepole's unemployment or inactivity (i.e.the costs of young people being considered to be NEET) was the equivalent of 1.21% of
GDP, i.e. an annual loss of €153 billion for the EU. The re-integration into employment of just10 % of these young people would create a yearly gain of more than € 15 bn.
4 Eurostat Labour Force Statistics, quarterly non-seasonally adjusted data (lfsq_eppqa) and (lfsq_etpga) for thesecond quarter. Youth aged 15-24, adults 25-64.5
The European Foundation for the Improvement Working and Living Conditions (2012) NEETs – Young peoplenot in employment, education or training: Characteristics, costs and policy responses in Europe, PublicationsOffice of the European Union, Luxembourg.
8/13/2019 17 Youth Unemployment
http://slidepdf.com/reader/full/17-youth-unemployment 4/5
4
ANNEX: Additional statistical indicators
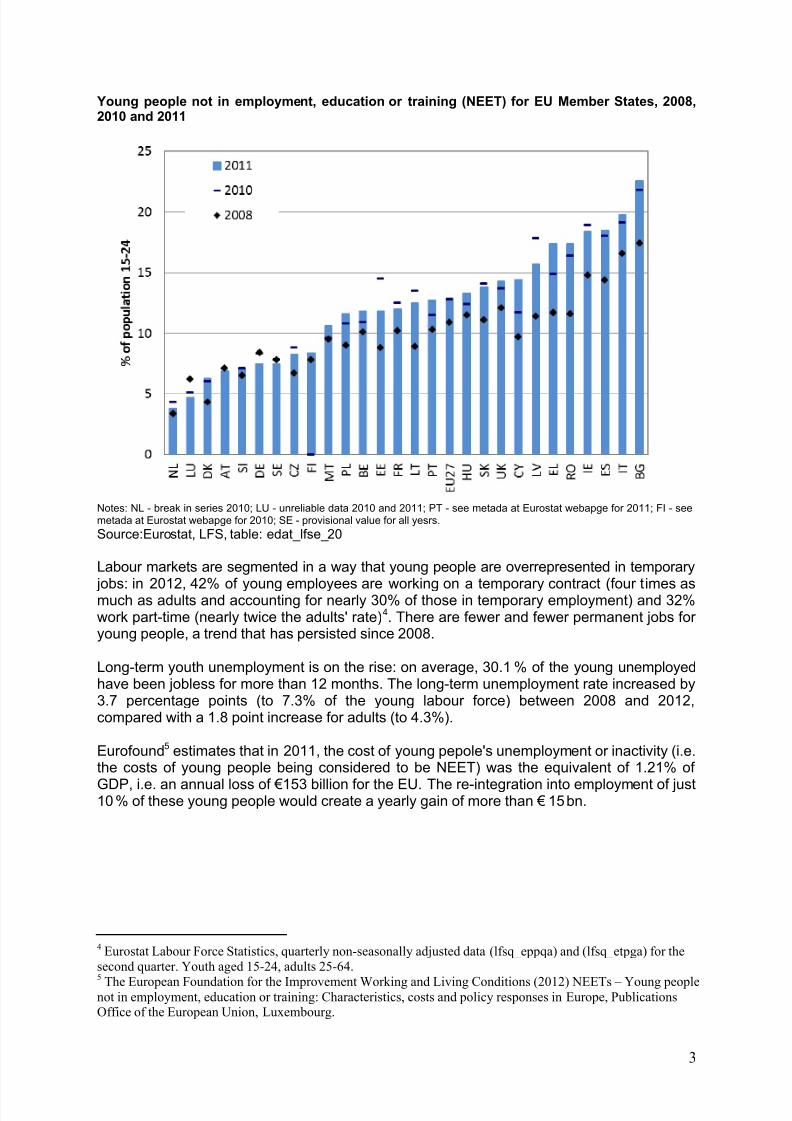
Youth unemployment rate, for population aged 15-24, in Member States, 2001 - 2011% of active population 15-24
2001 2002 2003 2004 2005 2006 2007 2008 2009 2010 2011
EU27 17,3 17,9 18,1 18,6 18,6 17,3 15,5 15,6 19,9 20,9 21,3
BE 15,3 15,7 19,0 17,5 21,5 20,5 18,8 18,0 21,9 22,4 18,7 bBG 39,3 35,6 27,1 24,5 22,3 19,5 15,1 12,7 16,2 23,2 26,6
CZ 16,3 15,4 16,8 19,9 19,2 17,5 10,7 9,9 16,6 18,3 18,0
DK 8,3 7,1 9,8 7,8 8,6 7,7 7,5 8,0 11,8 14,0 14,2
DE 7,8 9,3 11,0 13,0 15,5 13,8 11,9 10,6 11,2 9,9 8,6
EE 24,5 17,3 24,2 23,5 15,9 u 12 u 10 u 12 u 27,5 32,9 22,3
IE 6,2 7,8 8,1 8,3 8,6 8,6 9,0 12,7 24,3 27,8 29,4
EL 28,0 26,1 25,7 26,5 26,0 25,2 22,9 22,1 25,8 32,9 44,4
ES 20,7 21,6 22,3 22,4 19,7 b 17,9 18,2 24,6 37,8 41,6 46,4
FR 18,0 18,9 17,5 20,1 20,6 21,6 19,1 18,6 23,2 22,8 22,0
IT 27,8 27,1 26,8 24,6 b 24,0 21,6 20,3 21,3 25,4 27,8 29,1
CY 8,2 7,7 8,9 8,7 13,9 10,0 10,2 9,0 13,8 16,7 22,4
LV 22,9 25,6 17,5 19,3 13,6 12,2 10,7 13,1 33,6 34,5 29,1
LT 31,6 20,4 26,9 21,2 15,7 u 9,8 u 8,2 u 13,4 u 29,2 35,1 32,9
LU 6,3 u 7 u 10,9 16,9 13,7 16,2 15,2 u 17,9 u 17,2 14,2 u 16,8 u
HU 10,7 11,4 12,9 14,4 19,4 19,1 18,0 19,9 26,5 26,6 26,1
MT 17,6 15,3 17,4 18,3 16,8 15,9 13,9 12,2 14,4 13,0 13,7
NL 4,4 4,6 6,6 8,0 8,2 6,6 5,9 5,3 6,6 8,7 b 7,6
AT 6,0 7,2 7,5 11 b 10,3 9,1 8,7 8,0 10,0 8,8 8,3
PL 39,2 41,6 41,4 40,1 36,9 29,8 21,7 17,3 20,6 23,7 25,8
PT 8,9 10,4 13,4 14,0 16,1 16,3 16,6 16,4 20,0 22,4 30,1 b
RO 17,6 22,2 b 19,5 22,3 20,2 21,4 20,1 18,6 20,8 22,1 23,7
SI 15,7 14,8 15,3 14,0 15,9 13,9 10,1 10,4 13,6 14,7 15,7
SK 38,9 37,7 32,9 32,8 30,1 26,6 20,3 19,0 27,3 33,6 33,2
FI 26,6 28,2 27,8 27,5 20,1 18,7 16,5 16,5 21,5 21,4 20,1
SE 11,7 12,9 14,3 18,5 22,8 b 21,5 19,3 20,2 25,0 25,2 22,9
UK 10,3 10,9 11,4 10,7 12,8 14,0 14,3 15,0 19,1 19,6 21,1 Note: b break in series; u unreliable dataSource: Eurostat, EU Labour Force Survey, Eurostat table: lfsa_urgan
Youth unemployment ratio, for population aged 15-24, in Member States, 2001 - 2011
% of population 15-242001 2002 2003 2004 2005 2006 2007 2008 2009 2010 2011
EU27 8,1 8,3 8,2 8,2 8,2 7,6 6,8 6,9 8,7 9,0 9,1
BE 6,1 6,3 7,6 7,5 7,5 7,1 6,4 6,0 7,1 7,3 6,0
BG 13,4 11,5 8,1 7,5 6,2 5,6 4,4 3,8 4,8 6,7 7,3
CZ 7,3 6,5 6,8 7,4 6,5 5,9 3,4 3,1 5,3 5,7 5,4
DK 5,7 5,1 6,0 5,6 5,9 5,4 5,3 5,8 8,4 9,4 9,6
DE 4,2 5,0 5,8 6,0 7,7 b 6,9 6,1 5,5 5,8 5,1 4,5
EE 8,5 6,0 7,6 7,5 5,5 4,3 3,8 5,0 11,0 12,6 9,1
IE 3,8 4,4 4,8 4,7 4,6 4,7 5,0 6,7 11,5 11,8 11,7
EL 10,3 9,7 9,3 9,9 8,8 8,2 7,1 6,7 8,0 10,0 13,0
ES 9,1 9,7 10,1 9,9 9,4 b 8,6 8,7 11,7 17,1 17,8 19,0
FR 6,6 7,0 7,0 7,6 7,8 8,2 7,3 7,1 9,2 8,9 8,4
IT 10,3 9,7 9,4 8,5 b 8,1 7,0 6,3 6,6 7,4 7,9 8,0
CY 3,4 3,2 3,7 4,9 5,9 4,1 4,2 3,8 5,7 6,8 8,5
LV 8,2 8,1 6,9 6,8 5,1 5,0 4,6 5,6 14,0 13,9 11,2LT 10,4 7,1 7,5 5,9 3,9 2,6 2,2 4,1 8,9 10,4 9,6
LU 2,2 2,6 3,3 4,7 3,9 4,5 4,0 5,2 5,5 3,5 4,2
HU 3,9 4,1 4,1 4,3 5,2 5,1 4,6 5,0 6,5 6,6 6,4
MT 8,5 8,3 9,3 9,2 9,1 8,4 7,4 6,4 7,4 6,7 7,1
NL 3,4 3,7 4,6 5,7 5,8 4,6 4,3 3,9 4,8 6 b 5,3
AT 3,1 3,4 3,9 5,6 b 6,1 5,4 5,3 4,9 6,0 5,2 5,0
PL 15,7 16,1 15,2 14,2 13,2 10,2 7,1 5,7 7,0 8,2 8,7 b
PT 4,4 5,5 6,6 6,7 6,9 6,9 6,9 6,8 7,9 8,2 11,7
RO 7,5 8,7 b 6,5 7,8 6,3 6,6 6,1 5,7 6,4 6,9 7,4
SI 6,6 6,1 6,1 6,5 6,5 5,6 4,2 4,5 5,6 5,9 5,9
SK 17,8 16,3 13,7 13,0 11,0 9,4 7,0 6,2 8,6 10,4 10,0
FI 10,3 10,8 11,0 10,3 10,2 9,7 8,8 8,8 10,9 10,6 10,1
SE 5,9 6,3 6,5 8,0 11,5 11,0 10,1 10,7 12,8 13,0 12,0
UK 7,6 7,7 7,8 7,6 8,0 8,7 8,8 9,2 11,4 11,6 12,4 Note: b break in seriesSource: Eurostat, EU Labour Force Survey, Eurostat table: edat_lfse_20
8/13/2019 17 Youth Unemployment
http://slidepdf.com/reader/full/17-youth-unemployment 5/5
5
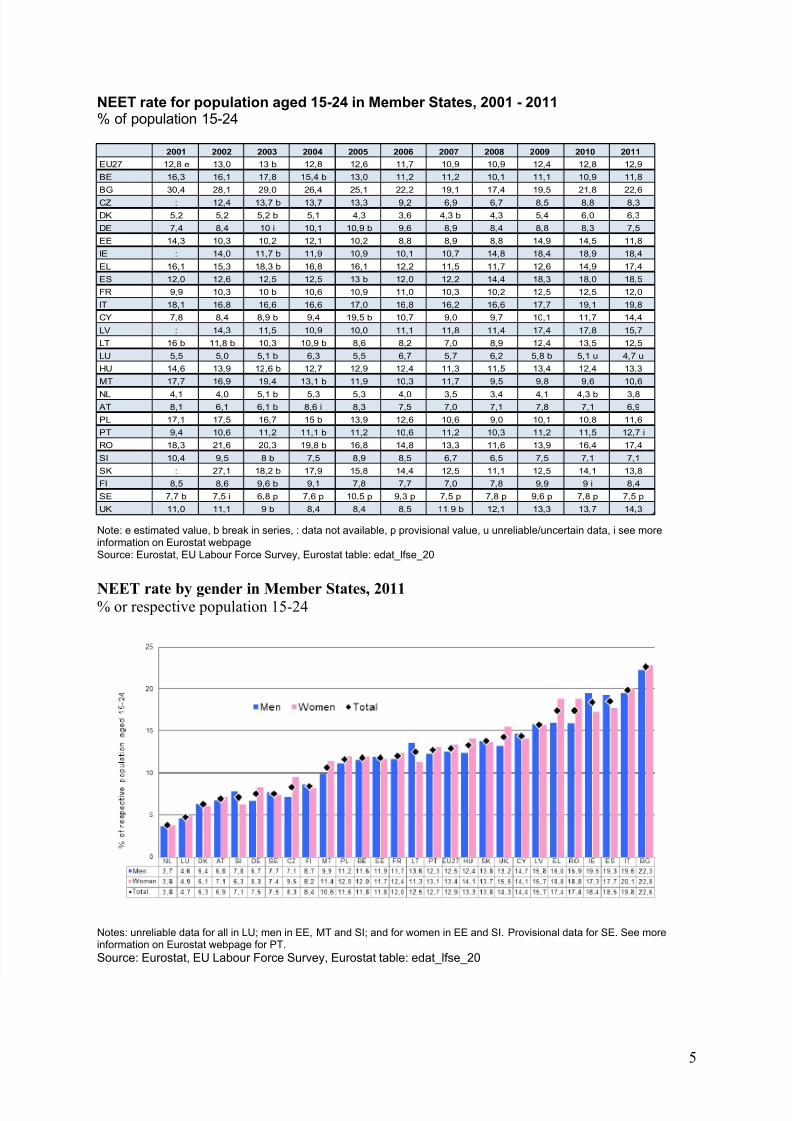
NEET rate for population aged 15-24 in Member States, 2001 - 2011% of population 15-24
2001 2002 2003 2004 2005 2006 2007 2008 2009 2010 2011
EU27 12,8 e 13,0 13 b 12,8 12,6 11,7 10,9 10,9 12,4 12,8 12,9
BE 16,3 16,1 17,8 15,4 b 13,0 11,2 11,2 10,1 11,1 10,9 11,8
BG 30,4 28,1 29,0 26,4 25,1 22,2 19,1 17,4 19,5 21,8 22,6
CZ : 12,4 13,7 b 13,7 13,3 9,2 6,9 6,7 8,5 8,8 8,3
DK 5,2 5,2 5,2 b 5,1 4,3 3,6 4,3 b 4,3 5,4 6,0 6,3
DE 7,4 8,4 10 i 10,1 10,9 b 9,6 8,9 8,4 8,8 8,3 7,5
EE 14,3 10,3 10,2 12,1 10,2 8,8 8,9 8,8 14,9 14,5 11,8
IE : 14,0 11,7 b 11,9 10,9 10,1 10,7 14,8 18,4 18,9 18,4
EL 16,1 15,3 18,3 b 16,8 16,1 12,2 11,5 11,7 12,6 14,9 17,4
ES 12,0 12,6 12,5 12,5 13 b 12,0 12,2 14,4 18,3 18,0 18,5
FR 9,9 10,3 10 b 10,6 10,9 11,0 10,3 10,2 12,5 12,5 12,0
IT 18,1 16,8 16,6 16,6 17,0 16,8 16,2 16,6 17,7 19,1 19,8
CY 7,8 8,4 8,9 b 9,4 19,5 b 10,7 9,0 9,7 10,1 11,7 14,4
LV : 14,3 11,5 10,9 10,0 11,1 11,8 11,4 17,4 17,8 15,7
LT 16 b 11,8 b 10,3 10,9 b 8,6 8,2 7,0 8,9 12,4 13,5 12,5
LU 5,5 5,0 5,1 b 6,3 5,5 6,7 5,7 6,2 5,8 b 5,1 u 4,7 u
HU 14,6 13,9 12,6 b 12,7 12,9 12,4 11,3 11,5 13,4 12,4 13,3
MT 17,7 16,9 19,4 13,1 b 11,9 10,3 11,7 9,5 9,8 9,6 10,6
NL 4,1 4,0 5,1 b 5,3 5,3 4,0 3,5 3,4 4,1 4,3 b 3,8
AT 8,1 6,1 6,1 b 8,6 i 8,3 7,5 7,0 7,1 7,8 7,1 6,9
PL 17,1 17,5 16,7 15 b 13,9 12,6 10,6 9,0 10,1 10,8 11,6
PT 9,4 10,6 11,2 11,1 b 11,2 10,6 11,2 10,3 11,2 11,5 12,7 i
RO 18,3 21,6 20,3 19,8 b 16,8 14,8 13,3 11,6 13,9 16,4 17,4
SI 10,4 9,5 8 b 7,5 8,9 8,5 6,7 6,5 7,5 7,1 7,1
SK : 27,1 18,2 b 17,9 15,8 14,4 12,5 11,1 12,5 14,1 13,8
FI 8,5 8,6 9,6 b 9,1 7,8 7,7 7,0 7,8 9,9 9 i 8,4
SE 7,7 b 7,5 i 6,8 p 7,6 p 10,5 p 9,3 p 7,5 p 7,8 p 9,6 p 7,8 p 7,5 p
UK 11,0 11,1 9 b 8,4 8,4 8,5 11,9 b 12,1 13,3 13,7 14,3 Note: e estimated value, b break in series, : data not available, p provisional value, u unreliable/uncertain data, i see moreinformation on Eurostat webpageSource: Eurostat, EU Labour Force Survey, Eurostat table: edat_lfse_20
NEET rate by gender in Member States, 2011% or respective population 15-24
Notes: unreliable data for all in LU; men in EE, MT and SI; and for women in EE and SI. Provisional data for SE. See moreinformation on Eurostat webpage for PT.
Source: Eurostat, EU Labour Force Survey, Eurostat table: edat_lfse_20