youth master plan survey report joint city council school board meting february 24, 2014
TRANSCRIPT

Youth Master Plan Survey Report
Joint City Council School Board MetingFebruary 24, 2014

The Youth Master Plan Survey
>Created by local organizations: >Flintridge Institute, Day One, Boys
and Girls Club, City of Pasadena Human Services and Recreation and Public Health Departments
>Designed and implemented by area youth and conducted in the Pasadena Unified School District service area.
2

The Youth Master Plan Survey
>Eligible students from ages 11 to 18, living or going to school in the cities of Pasadena, Altadena, Sierra Madre and parts of La Canada Flintridge were selected to voluntarily respond to the YMPS.
>Both public and private school students were part of this sample.
3

Demographics
Distribution of Student Respondents by Grade
6 7 8 9 10 11 12
3.6
7.1
16.8 16.1
22.1 21.1
13.2
Grade
%
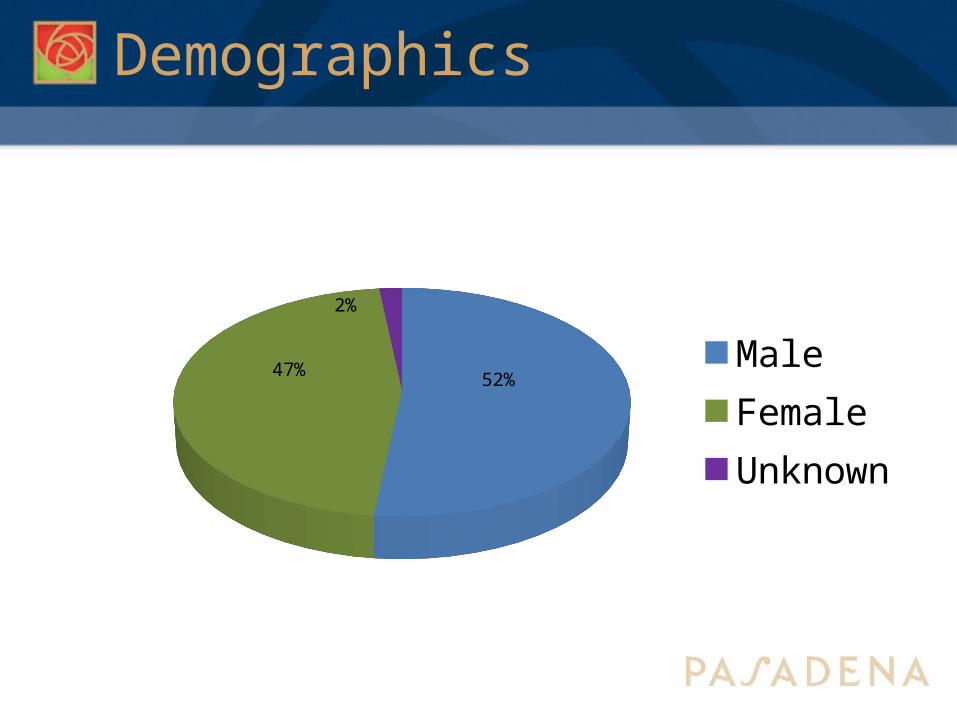
Demographics
52%47%
2%
MaleFemaleUnknown

Demographics
Racial and Ethnic Mix
6
White
Hisp/La
t.
Black/A
A
Native
/AK N
at.
Armen
ian
Pac. Is
lander
Asian
Other
7.4
66.9
16.1
0.42.1 1.2 2.5 3.3
PUSD
YMPS
%

Demographics
Self-Identified Sexual Orientation
7
% 95% CI
Heterosexual/Straight 90.9 87.5 - 94.3
Homosexual (Gay/Lesbian) 2.2 0.5 - 3.9
Bisexual 2.9 0.9 - 4.9

Home Life
8
%† 95% CI
Percent of students with someone in the home that has gone to college
70.2 66.7 - 77.3
Percent of students who reported having divorced or separated parents
44.5 38.6 - 50.4

Home Life
9
Percent of students who live with their parents 92.3 89.1 - 95.5 Percent of students who feel their family is 89.1 85.2 - 92.8supportive Percent in overcrowded housing* 24.6 19.8 - 29.4

Health and Wellness
10
8%
25%
68%
Self-Reported Overall HealthPoor/Fair Good Very Good/Excellent

Health and Wellness
% 95% CIPercent of students who ate vegetables at least twice daily 44.2 38.1 - 50.3
Percent of students who ate fruit at least twice daily 62.7 56.7 - 68.7
Percent of students who ate fast food at least once daily 43.3 36.9 - 49.3
Percent who did not eat fast food daily
56.7 50.5 - 62.9

Health and Wellness
12
0.010.020.030.040.050.060.070.080.090.0
100.0
27.8
2.8 3.27.2
13.49.2
Percent of Students Who Have Tried:
%

Health and Wellness
13
Cost/Money GPA Transportation Not Enough Spaces
No Parental Support
1st
2nd
3rd 3rd
5th
Reasons Students Could Not Participate In Sports (Rank 1-5)

Violence and Safety
14
% 95% CIPercent who felt racial discrimination from youth^ 9.3 5.8 - 12.8
Percent who felt racial discrimination from adults^^ 9.8 6.2 - 13.4
Percent who witnessed fights at least monthly 39.3 33.4 - 45.2

Violence and Safety
15
% 95% CI
Percent who reported having carried a gun in the last 30 days 6.3 3.4 - 9.2
Percent who have been threatened by a weapon on school property
10.0 6.4 - 13.6
Percent who have been in a physical fight on school property 31.9 26.3 - 37.5

Violence and Safety
16
Very True Somewhat True
Mostly False Very False0%
5%
10%
15%
20%
25%
30%
35%
40%
45%
50%
29%
46%
17%8%
There are Certain Parts of Pasadena/Altadena that are Unsafe to Go:
% o
f Res
pond
ents

Violence and Safety
17
Rarely/Never A Few Times per Year
Monthly Weekly Daily0%
5%
10%
15%
20%
25%
30%
35%31%
30%
18%
12% 9%
How Often Do You Witness Fights?
% o
f R
esp
on
den
ts

Violence and Safety
18
Gender
Neighborhood
Other*
Kids Who Like School vs. Don't
Gay-Straight
Gang Affiliation
Race/Ethnicity
7th
6th
5th
4th
3rd
2nd
1st
Rank of Which of Issues Cause the Most Conflict at School.

Violence and Safety
19
80%
12%
6%2%
During the last school year, how often were you bullied?
Never
Sometimes
Regularly
Every Day

Violence and Safety
20

Transportation
21
No
Yes
No
Yes
43%
57%
69%
31%
% of Respondents
Want more pub-lic transportation options?
Missed class due to lack of trans-portation?

Employment Status
33%
55%
12%
Do you have a job?
Yes
No, but I want one
No, but I am not looking

Trusted Adults
23

Questions?