your voice matters: patient experience with primary care...
TRANSCRIPT

Your Voice Matters: Patient Experience with Primary Care Providers in the Puget Sound Region2014 Community Checkup Overview
www.WACommunityCheckup.org

Your Voice Matters is an initiative of the Washington Health Alliance (formerly known as the Puget Sound Health Alliance) to understand patients’ experience with their primary health care providers. While many medical groups take steps periodically to assess their patients’ level of satisfaction or experience using a variety of survey tools, this initiative produces publicly available comparable results for 46 medical groups with clinics in 185 locations across a five-county Puget Sound region (King, Kitsap, Pierce, Snohomish, and Thurston counties). This is the only report of its kind in the Puget Sound area. Both medical group and clinic results are available on the Alliance’s Community Checkup website: www.WAcommunitycheckup.org
This is the second time that the Washington Health Alliance has administered this nationally developed and standardized patient experience survey. Between September and November 2013, surveys were mailed to approximately 120,000 people in the Puget Sound area, a 33% increase from the first survey in 2011 (results reported in 2012). The survey asked patients to report their experiences with their health care provider and the provider’s office staff over the last 12 months. We are very pleased to have achieved an overall 29% response rate that enables robust reporting. This rate of response is typical for this type of patient experience survey.
Through this effort, we are striving to:• Send clear signals for expected performance by measuring and publicly
reporting patient experience in a standardized manner across medical groups and clinics with comparisons to both the regional average and the regional 90th percentile performance;
• Support learning opportunities with actionable information for primary care practices to improve patient experience; and
• Activate consumers to better understand and expect excellence in patient experience.
This year, for the first time, we were able to include individuals in the survey who are insured through the Washington State Medicaid program, thus enabling results for more of the community health centers and other safety net clinics serving this population.
We would like to extend our very sincere thanks to the six health plans—Cigna, Group Health, Premera Blue Cross, Regence Blue Shield, UnitedHealthcare, and the Washington State Health Care Authority (Medicaid)—that recognized the importance of this effort and enabled the survey by providing the patient sample for the survey. We would also like to thank The Center for the Study of Services (CSS), the vendor who fielded the survey on behalf of the Washington Health Alliance and provided expert assistance throughout the process.
For more information, please contact Susie Dade at the Washington Health Alliance: [email protected]
www.wacommunitycheckup.org

Summary of 2013–2014 Patient Experience Survey ResultsConsiderable detail is included in this report and on the Alliance’s Community Checkup website (www.wacommunitycheckup.org) with both medical group and clinic level results included for four measures of patient experience. A high level overview of the 2013–2014 results is shown below. Results include the “top box” scores or the best performance for each measure.
GETTING TIMELY APPOINTMENTS, CARE AND INFORMATION (Scores reflect the % of patients that responded “always”)
Puget Sound Regional Average 54.1%
Puget Sound 90th Percentile Performance 62.8%
National 90th Percentile Performance1 77%
Range of Performance within the Region (from lowest scoring to highest scoring medical group)
36.6% – 70.1%
HOW WELL PROVIDERS COMMUNICATE WITH PATIENTS(Scores reflect the % of patients that responded “always”)
Puget Sound Regional Average 79.2%
Puget Sound 90th Percentile Performance 85%
National 90th Percentile Performance1 92%
Range of Performance within the Region (from lowest scoring to highest scoring medical group)
61.6% – 90.8%
HELPFUL, COURTEOUS AND RESPECTFUL OFFICE STAFF(Scores reflect the % of patients that responded “always”)
Puget Sound Regional Average 73.2%
Puget Sound 90th Percentile Performance 81.3%
National 90th Percentile Performance1 90%
Range of Performance within the Region (from lowest scoring to highest scoring medical group)
52.6% – 91.2%
PATIENT’S OVERALL RATING OF THE PROVIDER(Scores reflect the % of patients that responded 9 or 10 on a scale of 0–10)
Puget Sound Regional Average 73.8%
Puget Sound 90th Percentile Performance 82%
National 90th Percentile Performance1 91%
Range of Performance within the Region (from lowest scoring to highest scoring medical group)
56.1% – 88.0%
1 Based on the most recent 12-month period of data available through the CAHPS database which is for Calendar Year 2012; Source: CAHPS Database
1

How Do the Most Recent Overall Scores Compare to Scores from the 2011–2012 SurveyThe news is mixed, unfortunately. We were able to analyze the scores for the 154 clinics that participated in both the 2011 and the 2013 surveys to provide a more comparable analysis of Puget Sound averages on each of the four measures across the two years.
Overall, regional performance, based on the regional average, improved for one measure:
• Helpful, Courteous and Respectful Office Staff
Overall, regional performance, based on the regional average, declined for two measures:
• How Well Providers Communicate with Patients
• Patient’s Rating of the Provider
The details are shown below. The changes are statistically significant at the 95% confidence level.
HELPFUL, COURTEOUS
AND RESPECTFUL OFFICE STAFF
HOW WELL PROVIDERS
COMMUNICATE WITH PATIENTS
PATIENT’S RATING OF THE
PROVIDER
IMPROVED DECLINED DECLINED
2013 Puget Sound Regional Average
73.9% (n = 23,664)
80.1% (n = 23,677)
74.6% (n = 23,521)
2011 Puget Sound Regional Average
71.9% (n = 26,025)
80.9% (n = 26,135)
75.4% (n = 25,943)
* Note: These regional scores differ from other regional scores included in this report because they are based on a subset of the 154 clinics that participated during both survey years.
Overall, regional performance, based on the regional average, did not change for one of the measures:
• Getting Timely Appointments, Care and Information
The comparison of results for this fourth measure (54.9% in 2013 and 55.5% in 2011) was not statistically significant at the 95% confidence level.
2

What Do We Mean By Patient Experience?
3

“Patient experience” refers to what happens to a person when they are interacting with the health care system and trying to have their needs met; it is also the patient’s perceptions of those interactions. A patient’s experience typically begins with a phone call or secure email to their primary care provider’s office. It includes the patient’s experience in making an appointment for routine or urgent care and how easy it is to be seen at a time that the patient feels is needed. It includes the time a patient is at the provider’s office and any follow-up contact that happens after. Effective communication between provider and patient is the most critical element of the patient’s experience. Patients need easy-to-understand explanations about their health concerns and clear instructions about what they need to do following their visit to their health care provider. Patient experience is about creating trust, laying the foundation for improving the health and well-being of the patient.
A patient’s experience is heavily influenced by how well their provider knows important information about their medical history and how well their provider listens to what they have to say. Patients want their provider to explain things in a way they can understand and show respect for their concerns and questions. Patients want their primary care providers to be informed and up-to-date about the care they received from specialists.
4

2 Institute for Healthcare Communication
Why is Patient Experience Important?#1 Experience matters to patients and their families. Excellent patient experience during care is an outcome unto itself, and one highly valued by patients. Patients want to be respected, feel heard, get the care they feel they need when they need it, and understand their health conditions.
#2 Patient care experience is linked to clinical quality. “Patient-centeredness” is now widely accepted as a core dimension of health care quality. The Institute of Medicine (IOM) includes patient-centered care as one of six domains of quality. The term may seem like jargon, but it refers to important, basic ideas, such as:
• Physicians and other members of the health care team encourage the engagement and active involvement of patients and their families in decision-making.
• Care focuses on the “whole person” with consideration for personal preferences and values, family situation, social circumstances and lifestyle choices.
• Communication is two-way and sensitive to the needs of the patient and his or her ability to understand.
• Care is well coordinated with and for the patient, so that as patients move between different providers and settings of care, important care elements are remembered, communicated and tracked.
#3 Patient-centered care, patient experience and quality all go hand-in-hand. “Research evidence indicates that there are strong positive relationships between a healthcare team member’s communication skills and a patient’s capacity to follow through with medical recommendations, self-manage a chronic medical condition, and adopt preventive health behaviors. Studies show that the clinician’s ability to explain, listen and empathize can have a profound effect on biological and functional health outcomes as well as patient satisfaction and experience of care.”2
#4 Patient experience is good for business. There is heightened market focus on patient experience. Both nationally and here in Washington, more and more attention is being given to the development of Accountable Care Organizations (ACOs) and Accountable Collaboratives for Health (ACHs). Strong, effective primary care, delivered through patient-centered medical homes or health homes, is recognized as foundational to cost-effective health care over the longer term. As both public and private health care payers move toward payment for value, not just the volume of care provided, patient experience will, no doubt, be a key metric in evaluating performance.
In addition, relationship quality is a major predictor of patient loyalty. Patients often act in response to their experience of care, responding either by staying or by “voting with their feet.” Further, patient experience is inversely correlated to complaints and medical malpractice risk, meaning that as patient experience improves, the risk of complaints goes down.
The Results of Excellent Patient Experience and Effective Patient Communication
INTERMEDIATE OUTCOMES
• Increased patient knowledge
• Increased patient feeling of empowerment
• Better independent decision-making and self-care
• Increased adherence to provider recommendations for care and for use of medications
• Reduced medical errors and adverse events
LONG TERM OUTCOMES
• Improved clinical outcomes (biometric indicators like blood pressure or cholesterol levels)
• Improved quality of life, functional status and well-being
• Reduced disparities in care
• Reduced cost of care (less non value-added or duplicative care)
• Improved survival
5

Why Measure Patient Experience Using a Standardized Survey?The use of surveys to ask patients about their experience in the health care setting is the best and often only way to know (and to measure) whether the experiences deemed essential for high quality, patient-centered care actually take place. If you want to know about patient experience, you have to ask patients. And if you want to be able to see results across primary care practices and share those results with consumers, you have to use the same survey in a standardized way to get comparable results.
Is Patient Experience the Same Thing as Patient Satisfaction?Patient experience is different from patient satisfaction in some very important ways.
Surveys designed to measure patient experience include satisfaction measures but go beyond simple ratings of satisfaction to focus on the interactions patients should ideally experience during their health care encounters. Patient experience surveys ask patients whether or not, or how often, certain events or behaviors actually occurred. Patient experience survey questions focus on the dimensions of care that are most important to patients AND that are linked to improved health outcomes for patients. For example, these are two questions that patients are uniquely qualified to answer:
• How often does the patient have the ability to get the information they need in response to questions about their health concerns?
• How often does the patient feel listened to and do they understand explanations about their health issues and important instructions about recommended care?
Because patient experience surveys ask patients whether or not, or how often, certain events or behaviors happen, the results can be useful in highlighting specific, actionable areas that providers can focus on for improvement in the practice setting.
In contrast, many patient surveys are based exclusively on the respondent’s satisfaction ratings of their health care provider and other aspects of care. These patient satisfaction surveys use ratings, for example, from excellent to poor, to reflect the patient’s expectations and feelings, which can be very subjective. Unfortunately, even though they have been more widely used, patient satisfaction surveys are less helpful in understanding what can be done to improve performance. More importantly, patient satisfaction alone is not strongly linked to improved health outcomes in any meaningful way.
Understanding the Most Important Patient Experience Drivers of Overall Rating of ProvidersWith heightened attention focused on patient experience as a key measure of performance, more and more medical groups are doing work to understand what elements of the patient experience most highly correlate with the overall rating of care. In other words, which patient experience measures distinguish clinics that are highly rated overall from clinics that receive lower ratings overall?
We conducted a “Key Driver Analysis.” Using correlation analysis and the data from this patient experience survey, we identified nine variables that explain 82% of the variation in the overall provider ratings among all the surveyed clinics across the Puget Sound region. Interestingly, eight of the nine variables concern different aspects of effective provider communication.
6
Impo
rtanc
e (C
orre
latio
n) to
Rat
ing
of P
rovi
der
Low
er
Hig
her
3 Questions from the CG-CAHPS Survey4 Reflects % of patients reporting “Always” in response to the question noted 5 For more information, see: http://www.calquality.org/
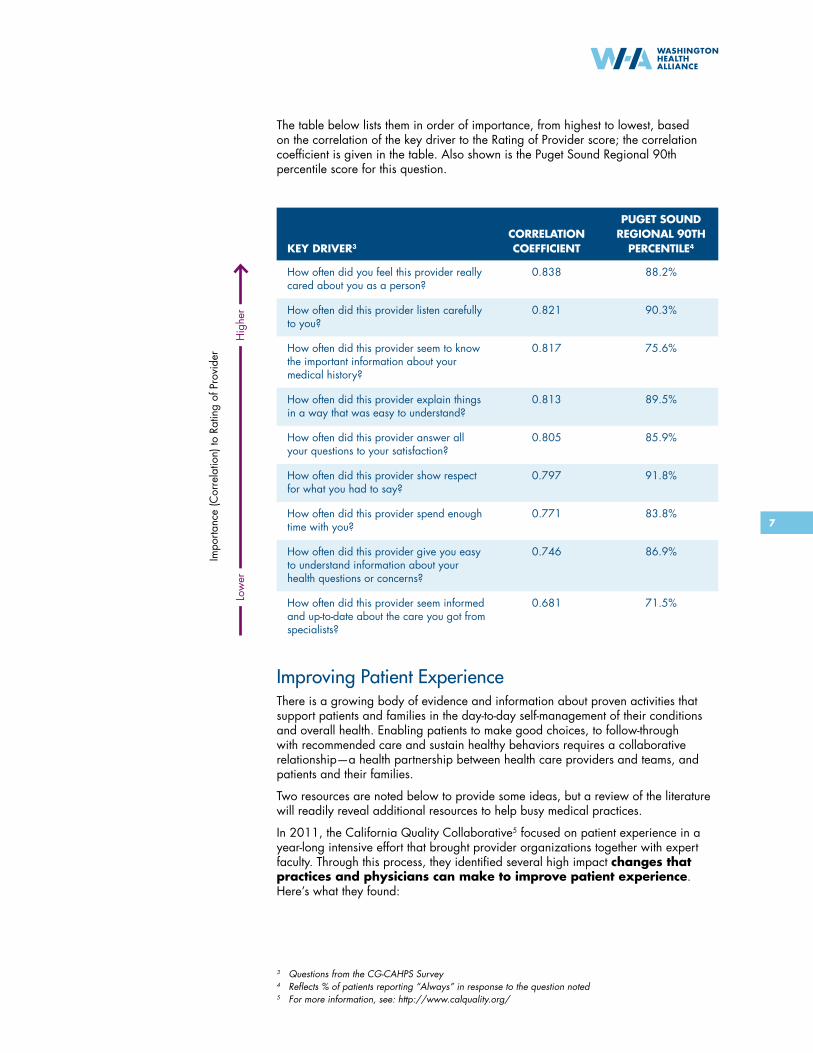
The table below lists them in order of importance, from highest to lowest, based on the correlation of the key driver to the Rating of Provider score; the correlation coefficient is given in the table. Also shown is the Puget Sound Regional 90th percentile score for this question.
KEY DRIVER3
CORRELATION COEFFICIENT
PUGET SOUND REGIONAL 90TH
PERCENTILE4
How often did you feel this provider really cared about you as a person?
0.838 88.2%
How often did this provider listen carefully to you?
0.821 90.3%
How often did this provider seem to know the important information about your medical history?
0.817 75.6%
How often did this provider explain things in a way that was easy to understand?
0.813 89.5%
How often did this provider answer all your questions to your satisfaction?
0.805 85.9%
How often did this provider show respect for what you had to say?
0.797 91.8%
How often did this provider spend enough time with you?
0.771 83.8%
How often did this provider give you easy to understand information about your health questions or concerns?
0.746 86.9%
How often did this provider seem informed and up-to-date about the care you got from specialists?
0.681 71.5%
Improving Patient ExperienceThere is a growing body of evidence and information about proven activities that support patients and families in the day-to-day self-management of their conditions and overall health. Enabling patients to make good choices, to follow-through with recommended care and sustain healthy behaviors requires a collaborative relationship—a health partnership between health care providers and teams, and patients and their families.
Two resources are noted below to provide some ideas, but a review of the literature will readily reveal additional resources to help busy medical practices.
In 2011, the California Quality Collaborative5 focused on patient experience in a year-long intensive effort that brought provider organizations together with expert faculty. Through this process, they identified several high impact changes that practices and physicians can make to improve patient experience. Here’s what they found:
7

• Negotiate the agenda with the patient at the start of each visit
• Make a personal connection and demonstrate empathy through eye contact and empathic statements
• Provide closure by summarizing next steps and an action plan for the patient
• Notify patients of all test results right away, whether positive or negative
• Review the patient chart prior to the visit
• Handle more than one medical problem during the visit and extend (lengthen) return intervals when appropriate
• Open same-day appointment slots
• Implement office “huddles” to monitor and manage patient flow on a daily basis
In May 2013, Minnesota Community Measurement6 published “A Guide for Transforming the Patient Experience through Improved Communication.” This guide relies upon patient stories and case studies to illustrate, ultimately offering several recommendations for improvement that are summarized below. You’ll note the similarities to the ideas shared above.
Pre-Visit
• Establish systems within the practice that make it easy for the health care team to gather clinical information prior to the visit.
• Have schedulers ask (or messages in your automated scheduling system asking) patients to bring questions, concerns, medications and health monitoring information to their appointment.
• On a daily basis hold seven-minute “office huddles” to rapidly identify areas for bottlenecks and inefficiencies to occur and address immediately.
During-the-Visit
• Collaboratively develop a visit agenda with the patient and family, handling as many concerns as possible, and plan return visits as appropriate.
• Engage the entire practice team in supporting patients, using “warm handoff” introductions and explain team member roles to patients.
• Ask about patient goals to improve their health and help them make action plans that build confidence in their ability to reach these goals.
• Use “teach-back” (or ask-tell-ask) to provide just the right information at just the right time and “close the loop” to ensure patients understand and know how to use the information.
Post-Visit
• Provide a written care plan or visit summary that includes goals and action plans to ensure patients and families know what to do when they leave the visit.
• Use group medical appointments, peer-led support groups, or patient education classes to provide opportunities for patients to share experiences and support one another.
• Organize follow-up support to help patients sustain healthy behaviors between visits.
• Extend care into the community by linking patients to community program.
6 For more information, see: http://www.mncm.org/
8

The SurveyInstrument
9

The Washington Health Alliance Patient Experience Survey is based on the Consumer Assessment of Healthcare Providers and Systems (CAHPS ®) Clinician & Group 12-Month Survey, also known as the CG-CAHPS Survey. Introduced by the U.S. Agency for Healthcare Research and Quality (AHRQ) in the mid-1990s, the CAHPS program encompasses a range of standardized surveys that ask consumers and patients to report on and evaluate their experiences with health care. CAHPS surveys are the most widely used surveys for assessing patient experience of care in the U.S., and have undergone rigorous scientific development and testing to ensure validity and reliability.
The survey content is shaped by input from patients and other key stakeholders, including health care providers, health plans and purchasers of care. The CG-CAHPS survey includes 52 questions, asking patients to report their experiences with the health care provider and the provider’s office staff over the last 12 months. The CG-CAHPS was endorsed by the National Quality Forum (NQF) in 2007.
By using a nationally developed, standardized survey, we will not only be able to compare our results locally but also benchmark those results against national best practices.
A detailed description of the survey protocol and analysis plan may be found at the end of this report.
10

What Patient Experience Measures Are Included in this Report?We are using four measures that summarize the results of the survey. Three of these four measures are composite measures. Composite measures are used because they efficiently summarize what would otherwise be a large amount of data generated by a 52-question survey. The three composite measures are:
1. Getting Timely Appointments, Care and Information (Composite of 5 survey questions)
2. How Well Providers Communicate with Patients (Composite of 6 survey questions)
3. Helpful, Courteous and Respectful Office Staff (Composite of 2 survey questions)
The fourth measure is not a composite, but rather reflects patient responses to a single question:
4. Patient’s Overall Rating of the Provider
What follows in this report are results for 46 medical groups located across the Puget Sound region for these measures. In addition, results on the same four measures are being reported for 185 clinic locations. Results are also available on the Alliance’s Community Checkup website: www.wacommunitycheckup.org
Performance results reflect the “top box” rate. The reported rate is the percentage of patients whose responses indicated high performance for a given measure. To illustrate, the following response categories indicate a high level of performance or the “top box”:
• Questions that ask about how often something happens: ALWAYS (out of a 4-point scale: Always, Usually, Sometimes, Never)
• Questions that ask whether something happened: YES or YES, DEFINITELY (based on Yes/No choice or Yes, definitely/Yes, somewhat/No choice )
• Question that asks for a rating of the provider: 9 and 10 combined (scale of 0–10)
We are reporting the top box rate (rather than the average) for two important reasons:
First, here in Washington, we aspire to excellent (90th percentile) performance and to be among the best in the country. By reporting top box results for each medical group and clinic, we aim to establish excellence as the standard.
Second, top box rates are easier to explain. Focus group testing indicates that consumers understand what the results mean. Top box reporting is more effective in helping consumers to identify providers with whom patients most often have the best patient experience.
11

Summary of Respondent Characteristics Across Puget SoundPatient Reported Characteristics
AGE
18 – 24 years 2%
25 – 34 years 8%
35 – 44 years 11%
45 – 54 years 19%
55 – 64 years 30%
65 – 74 years 19%
75 or older 11%
GENDER
Male 36%
Female 64%
GENERAL HEALTH
Excellent 14%
Very Good 36%
Good 32%
Fair 14%
Poor 4%
EDUCATION
8th grade or less 1%
Some high school, but did not graduate 3%
High school graduate or GED 16%
Some college or 2-year degree 33%
4-year graduate 19%
More than 4-year college degree 27%
RACE*
White 85%
Black or African-American 4%
Asian 7%
Native Hawaiian or other Pacific Islander 1%
American Indian or Alaskan Native 2%
Other/Multiple 3%
ETHNICITY
Hispanic or Latino 3%
* Percentage may not add up to 100% because respondents could choose more than one category.
12

Medical Group Results for the Puget Sound Region
On the following pages, you’ll find results for 46 medical groups in the Puget Sound area on four measures of patient experience. On all four measures, the Puget Sound’s 90th percentile score is at least seven percentage points below the national 90th percentile score for the most recent year that data is available.
13

The Polyclinic
HealthPoint
EvergreenHealth Women's Care
Hall Health Center @ UW
Bastyr Center for Natural Health
Eastside Internal Medicine PLLC
Familycare of Kent
Virginia Mason Medical Centers
Paci�c Medical Centers
Swedish Medical Group
UW Neighborhood Clinics
The Doctors Clinic
Northwest Physicians Network
Overlake Internal Medicine Associates, P.S.
University of Washington Medical Center
Lakeshore Clinics
Interlake Medical Center
Puget Sound Family Physicians
St. Peter Family Practice
Providence Physicians Group
Overlake Medical Clinics
The Everett Clinic
Country Doctor Community Health Centers
Valley Medical Center
MultiCare Health System
EvergreenHealth Medical Group
Group Health Cooperative
Bellevue Family Medicine Associates
Neighborcare Health
Swedish Minor and James
Summit View Clinic
Richmond Internal Medicine
South Hill General Medical Clinic
Olympia Family Medicine & Internal Medicine
Peninsula Community Health Services
Franciscan Medical Group
Southlake Clinic
Community Health Center of Snohomish County
Eastside Family Medicine Clinic
Yelm Family Medicine
Harborview Medical Center
Women's & Family Health Specialists
International Community Health Services
Cascade Skagit Health Alliance
Sound Family Medicine
Sea Mar Community Health Center
Better
Better
Better
Better
Better
Better
Better
Better
Better
Better
Better
Average
Average
Average
Average
Average
Average
Average
Average
Average
Average
Average
Average
Average
Average
Average
Average
Average
Average
Average
Average
Average
Average
Average
Below
Below
Below
Below
Below
Below
Below
Below
Below
Below
Below
Below
Medical Group Score Score vs. Average
70.1 %
70.0 %
63.8 %
62.7 %
62.1 %
60.4 %
58.1 %
57.9 %
57.9 %
57.7 %
56.8 %
57.1 %
57.0 %
57.0 %
56.6 %
56.5 %
56.4 %
56.1 %
55.8 %
55.7 %
55.4 %
54.9 %
54.7 %
54.3 %
54.1 %
53.9 %
52.3 %
51.9 %
51.8 %
50.9 %
50.0 %
50.0 %
49.1 %
48.0 %
49.9 %
49.5 %
49.1 %
48.2 %
47.6 %
46.1 %
45.4 %
45.3 %
42.3 %
41.5 %
41.3 %
36.6 %
5-County Regional Average 54.1 %
Getting Timely Appointments, Care and Information
As was true in 2011–2012, this area is where the region has the most room for improvement. Overall, only 54.1% of patients report that they “always” get timely appointments, care and information. On a national level, top 10% performers are achieving scores of 77% or higher, whereas the Puget Sound 90th percentile score is 62.8%.
Having timely access to care and information that patients can rely upon is important for several reasons:
• Patients are more likely to identify health problems early and prevent them from becoming worse.
• Patients are less likely to make unnecessary and costly trips to the emergency room or experience potentially preventable hospitalizations.
• Knowing that they can get what they need when they need it is critical for patients to build trust with their primary care team.
Here are some ways that providers and medical groups can improve the timeliness of care for patients:
• Provide open access scheduling for routine and urgent care appointments.
• Provide access to secure email for clinical advice, test results and follow-up with primary care team members.
• Utilize all the members of the health care team efficiently and to the maximum extent of their license.
All statistical tests are conducted at the 95% confidence level. Statistically significant differences are marked as being “Below” or “Better” than the Puget Sound Average. Scores that are not statistically significantly different are marked as “Average.”
Medical Group Results for the Puget Sound RegionMedical Group Score Compared to the Puget Sound Average
Better Below% of Patients Responding “Always” Average
14

EvergreenHealth Women's Care
Hall Health Center @ UW
Bastyr Center for Natural Health
Eastside Internal Medicine PLLC
The Polyclinic
Familycare of Kent
Virginia Mason Medical Centers
Paci�c Medical Centers
Swedish Medical Group
UW Neighborhood Clinics
Northwest Physicians Network
Overlake Internal Medicine Associates, P.S.
University of Washington Medical Center
The Doctors Clinic
Lakeshore Clinics
Interlake Medical Center
Puget Sound Family Physicians
St. Peter Family Practice
Providence Physicians Group
Overlake Medical Clinics
The Everett Clinic
Country Doctor Community Health Centers
Valley Medical Center
MultiCare Health System
EvergreenHealth Medical Group
Group Health Cooperative
Bellevue Family Medicine Associates
Neighborcare Health
Swedish Minor and James
Summit View Clinic
Richmond Internal Medicine
South Hill General Medical Clinic
Franciscan Medical Group
HealthPoint
Olympia Family Medicine & Internal Medicine
Southlake Clinic
Community Health Center of Snohomish County
Peninsula Community Health Services
Eastside Family Medicine Clinic
Yelm Family Medicine
Harborview Medical Center
Women's & Family Health Specialists
International Community Health Services
Cascade Skagit Health Alliance
Sound Family Medicine
Sea Mar Community Health Center
70.1%
70%
63.8%
62.7%
62.1%
60.4%
58.1%
57.9%
57.9%
57.7%
57.1%
57%
57%
56.8%
56.6%
56.5%
56.4%
56.1%
55.8%
55.7%
55.4%
54.9%
54.7%
54.3%
54.1%
53.9%
52.3%
51.9%
51.8%
50.9%
50%
50%
49.9%
49.5%
49.1%
49.1%
48.2%
48%
47.6%
46.1%
45.4%
45.3%
42.3%
41.5%
41.3%
36.6%
0 10 20 30 40 50 80 9060 70 100Medical Group %
5-County Regional Average 54.1%
90th Percentile Performance
In the Puget Sound region, three medical groups score at or above the regional 90th percentile in Getting Timely Appointments, Care and Information.
CONGRATULATIONS to these medical groups and thanks for leading the way to excellence!
• EvergreenHealth Women’s Care
• Hall Health Center @ UW
• Bastyr Center for Natural Health
Getting Timely Appointments, Care and Information
Getting to ExcellenceComparison of Medical Group and 90th Percentile Performance in the Puget Sound Region
% of Patients Responding “Always” Regional 90th Percentile Score
15

Familycare of Kent
EvergreenHealth Women's Care
Northwest Physicians Network
Lakeshore Clinics
Bastyr Center for Natural Health
Eastside Family Medicine Clinic
Eastside Internal Medicine PLLC
Hall Health Center @ UW
Puget Sound Family Physicians
The Polyclinic
Providence Physicians Group
University of Washington Medical Center
UW Neighborhood Clinics
Swedish Medical Group
Overlake Medical Clinics
Country Doctor Community Health Centers
Women's & Family Health Specialists
EvergreenHealth Medical Group
Olympia Family Medicine & Internal Medicine
Harborview Medical Center
Bellevue Family Medicine Associates
The Doctors Clinic
Sound Family Medicine
St. Peter Family Practice
Virginia Mason Medical Centers
Neighborcare Health
Paci�c Medical Centers
Summit View Clinic
The Everett Clinic
Valley Medical Center
MultiCare Health System
Swedish Minor and James
Yelm Family Medicine
Group Health Cooperative
HealthPoint
Franciscan Medical Group
Southlake Clinic
Interlake Medical Center
Overlake Internal Medicine Associates, P.S.
Richmond Internal Medicine
Community Health Center of Snohomish County
South Hill General Medical Clinic
Sea Mar Community Health Center
International Community Health Services
Cascade Skagit Health Alliance
Peninsula Community Health Services
Better
Better
Better
Better
Better
Better
Better
Better
Better
Better
Better
Better
Better
Better
Average
Average
Average
Average
Average
Average
Average
Average
Average
Average
Average
Average
Average
Average
Average
Average
Average
Average
Average
Below
Below
Below
Below
Below
Below
Below
Below
Below
Below
Below
Below
Below
Medical Group Score Score vs. Average
90.8 %
88.8 %
86.8 %
85.9 %
85.5 %
84.5 %
84.2 %
84.0 %
82.7 %
82.7 %
82.2 %
82.1 %
81.6 %
81.2 %
83.6 %
83.1 %
82.2 %
81.2 %
81.2 %
80.7 %
80.3 %
80.2 %
79.4 %
79.4 %
79.4 %
79.2 %
79.2 %
79.1 %
79.0 %
79.0 %
78.5 %
78.0 %
77.3 %
77.5 %
76.1 %
76.0 %
73.8 %
73.5 %
73.4 %
72.5 %
70.9 %
69.9 %
68.1 %
66.2 %
66.0 %
61.6 %
5-County Regional Average 79.2 %
How Well Providers Communicate with Patients
This is arguably the most important aspect of patient experience as demonstrated in the Key Driver Analysis. Fortunately, this area is where the region performs the best overall with a regional average of 79.2% of patients reporting “always” on the composite measure.
It is well established that effective provider-patient communication has important beneficial effects, such as improving patient adherence to medical advice and use of prescribed medications, improving diagnostic accuracy, improving health outcomes, and reducing malpractice risk. Effective provider-patient communication is about:
• Listening carefully to patients.
• Knowing important medical history information about the patient at the time of the visit.
• Explaining things in a way that patients can easily understand.
• Showing respect for what the patient says and their role in decision-making about their care.
• Enhancing patients’ perception of time spent with them by improving the quality of the time.
On a national level, the top 10% of performers are achieving scores of 92% or better on this composite measure. Here in the Puget Sound region, our 90th percentile score is 85%. So while the region is doing pretty well overall, there’s still room for improvement.
All statistical tests are conducted at the 95% confidence level. Statistically significant differences are marked as being “Below” or “Better” than the Puget Sound Average. Scores that are not statistically significantly different are marked as “Average.”
Medical Group Results for the Puget Sound RegionMedical Group Score Compared to the Puget Sound Average
Better Below% of Patients Responding “Always” Average
16

Familycare of Kent
EvergreenHealth Women's Care
Northwest Physicians Network
Lakeshore Clinics
Bastyr Center for Natural Health
Eastside Family Medicine Clinic
Eastside Internal Medicine PLLC
Hall Health Center @ UW
Overlake Medical Clinics
Country Doctor Community Health Centers
Puget Sound Family Physicians
The Polyclinic
Providence Physicians Group
Women's & Family Health Specialists
University of Washington Medical Center
UW Neighborhood Clinics
EvergreenHealth Medical Group
Olympia Family Medicine & Internal Medicine
Swedish Medical Group
Harborview Medical Center
Bellevue Family Medicine Associates
The Doctors Clinic
Sound Family Medicine
St. Peter Family Practice
Virginia Mason Medical Centers
Neighborcare Health
Paci�c Medical Centers
Summit View Clinic
The Everett Clinic
Valley Medical Center
MultiCare Health System
Swedish Minor and James
Group Health Cooperative
Yelm Family Medicine
HealthPoint
Franciscan Medical Group
Southlake Clinic
Interlake Medical Center
Overlake Internal Medicine Associates, P.S.
Richmond Internal Medicine
Community Health Center of Snohomish County
South Hill General Medical Clinic
Sea Mar Community Health Center
International Community Health Services
Cascade Skagit Health Alliance
Peninsula Community Health Services
90.8%
88.8%
86.8%
85.9%
85.5%
84.5%
84.2%
84%
83.6%
83.1%
82.7%
82.7%
82.2%
82.2%
82.1%
81.6%
81.2%
81.2%
81.2%
80.7%
80.3%
80.2%
79.4%
79.4%
79.4%
79.2%
79.2%
79.1%
79%
79%
78.5%
78%
77.5%
77.3%
76.1%
76%
73.8%
73.5%
73.4%
72.5%
70.9%
69.9%
68.1%
66.2%
66%
61.6%
5-County Regional Average 79.2%
90th Percentile Performance
0 10 20 30 40 50 80 9060 70 100Medical Group %
In the Puget Sound region, five medical groups score at or above the regional 90th percentile in How Well Providers Communicate with Patients.
CONGRATULATIONS to these medical groups and thanks for leading the way to excellence!
• Familycare of Kent
• EvergreenHealth Women’s Care
• Northwest Physicians Network
• Lakeshore Clinics
• Bastyr Center for Natural Health
How Well Providers Communicate with Patients
Getting to ExcellenceComparison of Medical Group and 90th Percentile Performance in the Puget Sound Region
% of Patients Responding “Always” Regional 90th Percentile Score
17

Familycare of Kent
Bellevue Family Medicine Associates
EvergreenHealth Women's Care
Bastyr Center for Natural Health
Hall Health Center @ UW
University of Washington Medical Center
Northwest Physicians Network
Summit View Clinic
The Polyclinic
Virginia Mason Medical Centers
Puget Sound Family Physicians
The Doctors Clinic
The Everett Clinic
UW Neighborhood Clinics
MultiCare Health System
Overlake Medical Clinics
Country Doctor Community Health Centers
Lakeshore Clinics
Harborview Medical Center
Cascade Skagit Health Alliance
EvergreenHealth Medical Group
Swedish Medical Group
St. Peter Family Practice
Group Health Cooperative
Valley Medical Center
Paci�c Medical Centers
Providence Physicians Group
Olympia Family Medicine & Internal Medicine
Community Health Center of Snohomish County
Yelm Family Medicine
Eastside Internal Medicine PLLC
Sound Family Medicine
Overlake Internal Medicine Associates, P.S.
Swedish Minor and James
Peninsula Community Health Services
HealthPoint
Neighborcare Health
Franciscan Medical Group
Sea Mar Community Health Center
South Hill General Medical Clinic
Eastside Family Medicine Clinic
Women's & Family Health Specialists
Richmond Internal Medicine
Southlake Clinic
Interlake Medical Center
International Community Health Services
Better
Better
Better
Better
Better
Better
Better
Better
Better
Better
Better
Better
Better
Better
Better
Average
Average
Average
Average
Average
Average
Average
Average
Average
Average
Average
Average
Average
Average
Average
Average
Average
Average
Average
Average
Below
Below
Below
Below
Below
Below
Below
Below
Below
Below
Below
Medical Group Score Score vs. Average
91.2 %
85.8 %
84.9 %
84.8 %
82.7 %
81.8 %
80.5 %
79.9 %
79.0 %
77.8 %
77.6 %
76.5 %
75.9 %
75.7 %
75.4 %
77.7 %
77.6 %
75.9 %
75.0 %
74.5 %
74.5 %
73.8 %
73.6 %
73.3 %
73.2 %
72.3 %
72.3 %
71.3 %
70.8 %
70.7 %
70.6 %
70.1 %
69.3 %
68.6 %
66.6 %
68.3 %
66.8 %
66.4 %
65.2 %
63.2 %
60.7 %
59.3 %
58.1 %
58.1 %
56.5 %
52.6 %
5-County Regional Average 73.2 %
Helpful, Courteous and Respectful Office Staff
A medical group’s office staff is the face of the practice, with front office staff often being the first people that patients come into contact with each time they interact with the practice, whether it by phone or in person. Trust is built and continually reinforced when patients are routinely met with courtesy and respect, and when the office staff is always helpful in meeting patients’ needs for appointments, care and information.
The Puget Sound regional average on this composite measure is 73.2% of patients reporting that the office staff is “always” helpful, courteous and respectful, and the Puget Sound’s 90th percentile score is 81.3%. On a national level, the top 10% of performers are achieving scores of 90% or higher. This measure is the only one of the four where we saw improvement overall for the Puget Sound region compared to results from 2011–2012. So, while we are doing better, there’s still work to do here.
Complaints that the office staff is not as helpful can stem from many sources. Here are some common examples given by patients:
• Not being given clear instructions about how to get to the practice or about how to follow through with the provider’s advice (e.g., where to go for a test).
• Not being able to get an appointment when they need it.
• Being told to expect a call back and then not receiving one.
• Being put on hold in the middle of a telephone conversation.
• Lack of eye contact and/or pleasant demeanor when being greeted.
• Real rudeness and disrespect during a visit or on the phone.
All statistical tests are conducted at the 95% confidence level. Statistically significant differences are marked as being “Below” or “Better” than the Puget Sound Average. Scores that are not statistically significantly different are marked as “Average.”
Medical Group Results for the Puget Sound RegionMedical Group Score Compared to the Puget Sound Average
Better Below% of Patients Responding “Always” Average
18

Familycare of Kent
Bellevue Family Medicine Associates
EvergreenHealth Women's Care
Bastyr Center for Natural Health
Hall Health Center @ UW
University of Washington Medical Center
Northwest Physicians Network
Summit View Clinic
The Polyclinic
Virginia Mason Medical Centers
Overlake Medical Clinics
Country Doctor Community Health Centers
Puget Sound Family Physicians
The Doctors Clinic
Lakeshore Clinics
The Everett Clinic
UW Neighborhood Clinics
MultiCare Health System
Harborview Medical Center
Cascade Skagit Health Alliance
EvergreenHealth Medical Group
Swedish Medical Group
St. Peter Family Practice
Group Health Cooperative
Valley Medical Center
Paci�c Medical Centers
Providence Physicians Group
Olympia Family Medicine & Internal Medicine
Community Health Center of Snohomish County
Yelm Family Medicine
Eastside Internal Medicine PLLC
Sound Family Medicine
Overlake Internal Medicine Associates, P.S.
Swedish Minor and James
HealthPoint
Neighborcare Health
Peninsula Community Health Services
Franciscan Medical Group
Sea Mar Community Health Center
South Hill General Medical Clinic
Eastside Family Medicine Clinic
Women's & Family Health Specialists
Richmond Internal Medicine
Southlake Clinic
Interlake Medical Center
International Community Health Services
91.2%
85.8%
84.9%
84.8%
82.7%
81.8%
80.5%
79.9%
79%
77.8%
77.7%
77.6%
77.6%
76.5%
75.9%
75.9%
75.7%
75.4%
75%
74.5%
74.5%
73.8%
73.6%
73.3%
73.2%
72.3%
72.3%
71.3%
70.8%
70.7%
70.6%
70.1%
69.3%
68.6%
68.3%
66.8%
66.6%
66.4%
65.2%
63.2%
60.7%
59.3%
58.1%
58.1%
56.5%
52.6%
5-County Regional Average 73.2%
90th Percentile Performance
0 10 20 30 40 50 80 9060 70 100Medical Group %
In the Puget Sound region, six medical groups score at or above the regional 90th percentile in Helpful, Courteous and Respectful Office Staff.
CONGRATULATIONS to these medical groups and thanks for leading the way to excellence!
• Familycare of Kent
• Bellevue Family Medicine Associates
• EvergreenHealth Women’s Care
• Bastyr Center for Natural Health
• Hall Health Center @ UW
• University of Washington Medical Center
It is worth special mention that Familycare of Kent scores above the national 90th percentile on this measure!
Helpful, Courteous and Respectful Office Staff
Getting to ExcellenceComparison of Medical Group and 90th Percentile Performance in the Puget Sound Region
% of Patients Responding “Always” Regional 90th Percentile Score
19

Familycare of Kent
EvergreenHealth Women's Care
Lakeshore Clinics
Bastyr Center for Natural Health
Northwest Physicians Network
Country Doctor Community Health Centers
Puget Sound Family Physicians
The Polyclinic
University of Washington Medical Center
Providence Physicians Group
UW Neighborhood Clinics
Swedish Medical Group
Eastside Internal Medicine PLLC
Women's & Family Health Specialists
Eastside Family Medicine Clinic
Olympia Family Medicine & Internal Medicine
Virginia Mason Medical Centers
Hall Health Center @ UW
Summit View Clinic
EvergreenHealth Medical Group
Neighborcare Health
Paci�c Medical Centers
MultiCare Health System
Group Health Cooperative
HealthPoint
The Doctors Clinic
Valley Medical Center
Swedish Minor and James
St. Peter Family Practice
The Everett Clinic
Sound Family Medicine
Harborview Medical Center
Yelm Family Medicine
Bellevue Family Medicine Associates
Southlake Clinic
Community Health Center of Snohomish County
Overlake Internal Medicine Associates, P.S.
International Community Health Services
Franciscan Medical Group
Richmond Internal Medicine
Cascade Skagit Health Alliance
Interlake Medical Center
Sea Mar Community Health Center
South Hill General Medical Clinic
Peninsula Community Health Services
Better
Better
Better
Better
Better
Better
Better
Better
Better
Better
Better
Better
Average
Average
Average
Average
Average
Average
Average
Average
Average
Average
Average
Average
Average
Average
Average
Average
Average
Average
Average
Average
Average
Average
Average
Average
Average
Average
Below
Below
Below
Below
Below
Below
Below
Medical Group Score Score vs. Average
88.0 %
86.6 %
82.9 %
82.8 %
82.8 %
80.3 %
78.2 %
78.1 %
78.1 %
77.5 %
76.5 %
76.0 %
79.1 %
78.2 %
77.8 %
77.7 %
76.0 %
75.8 %
75.5 %
75.0 %
75.0 %
74.8 %
73.5 %
73.4 %
73.4 %
73.4 %
73.4 %
73.2 %
72.6 %
72.6 %
71.8 %
71.3 %
70.9 %
70.5 %
70.5 %
68.6 %
67.9 %
66.9 %
69.5 %
61.6 %
60.7 %
58.9 %
58.0 %
57.1 %
56.1 %
5-County Regional Average 73.8 %
Overall Rating of the Provider
All statistical tests are conducted at the 95% confidence level. Statistically significant differences are marked as being “Below” or “Better” than the Puget Sound Average. Scores that are not statistically significantly different are marked as “Average.”
Medical Group Results for the Puget Sound RegionMedical Group Score Compared to the Puget Sound Average
The rating of the provider is a measure of the patient’s overall satisfaction and is driven by the patient’s experiences during the care process. As we learned in the Key Driver Analysis, nine variables explain 82% of the variation in overall provider ratings among all the surveyed clinics across the Puget Sound region—and eight of the nine variables concern different aspects of effective provider communication!
Patients who feel that their providers are “the best” are more likely to continue with their providers, turning to them for the care and advice they need to get and stay healthy. A strong commitment from patients to work with their provider is essential for achieving positive health outcomes. This type of loyalty is especially needed for patients with chronic conditions or other serious health issues that require trust and focused management over time.
The Puget Sound regional average on this measure is 73.8% of patients rating their provider a 9 or 10 (on a scale of 0–10), and the Puget Sound’s 90th percentile score is 82%. On a national level, the top 10% of performers are achieving scores of 91% or higher.
Better Below% of Patients Responding “9” or “10” Average
20

Familycare of Kent
EvergreenHealth Women's Care
Lakeshore Clinics
Bastyr Center for Natural Health
Northwest Physicians Network
Country Doctor Community Health Centers
Eastside Internal Medicine PLLC
Puget Sound Family Physicians
Women's & Family Health Specialists
The Polyclinic
University of Washington Medical Center
Eastside Family Medicine Clinic
Olympia Family Medicine & Internal Medicine
Providence Physicians Group
UW Neighborhood Clinics
Swedish Medical Group
Virginia Mason Medical Centers
Hall Health Center @ UW
Summit View Clinic
EvergreenHealth Medical Group
Neighborcare Health
Paci�c Medical Centers
MultiCare Health System
Group Health Cooperative
HealthPoint
The Doctors Clinic
Valley Medical Center
Swedish Minor and James
St. Peter Family Practice
The Everett Clinic
Sound Family Medicine
Harborview Medical Center
Yelm Family Medicine
Bellevue Family Medicine Associates
Southlake Clinic
Franciscan Medical Group
Community Health Center of Snohomish County
Overlake Internal Medicine Associates, P.S.
International Community Health Services
Richmond Internal Medicine
Cascade Skagit Health Alliance
Interlake Medical Center
Sea Mar Community Health Center
South Hill General Medical Clinic
Peninsula Community Health Services
88%
86.6%
82.9%
82.8%
82.8%
80.3%
79.1%
78.2%
78.2%
78.1%
78.1%
77.8%
77.7%
77.5%
76.5%
76%
76%
75.8%
75.5%
75%
75%
74.8%
73.5%
73.4%
73.4%
73.4%
73.4%
73.2%
72.6%
72.6%
71.8%
71.3%
70.9%
70.5%
70.5%
69.5%
68.6%
67.9%
66.9%
61.6%
60.7%
58.9%
58%
57.1%
56.1%
5-County Regional Average 73.8%
90th Percentile Performance
0 10 20 30 40 50 80 9060 70 100Medical Group %
Getting to ExcellenceComparison of Medical Group and 90th Percentile Performance in the Puget Sound Region
In the Puget Sound region, five medical groups score at or above the regional 90th percentile for Overall Rating of the Provider.
CONGRATULATIONS to these medical groups and thanks for leading the way to excellence!
• Familycare of Kent
• EvergreenHealth Women’s Care
• Lakeshore Clinics
• Bastyr Center for Natural Health
• Northwest Physicians Network
Overall Rating of the Provider % of Patients Responding “9” or “10” Regional 90th Percentile Score
21

EvergreenHealth Women's Care
Hall Health Center @ UW
Bastyr Center for Natural Health
Eastside Internal Medicine PLLC
The Polyclinic
Familycare of Kent
Virginia Mason Medical Centers
Paci�c Medical Centers
Swedish Medical Group
UW Neighborhood Clinics
The Doctors Clinic
Northwest Physicians Network
Overlake Internal Medicine Associates, P.S.
University of Washington Medical Center
Lakeshore Clinics
Interlake Medical Center
Puget Sound Family Physicians
St. Peter Family Practice
Providence Physicians Group
Overlake Medical Clinics
The Everett Clinic
Country Doctor Community Health Centers
Valley Medical Center
MultiCare Health System
EvergreenHealth Medical Group
Group Health Cooperative
Bellevue Family Medicine Associates
Neighborcare Health
Swedish Minor and James
Summit View Clinic
Richmond Internal Medicine
South Hill General Medical Clinic
Olympia Family Medicine & Internal Medicine
Peninsula Community Health Services
Franciscan Medical Group
HealthPoint
Southlake Clinic
Community Health Center of Snohomish County
Eastside Family Medicine Clinic
Yelm Family Medicine
Harborview Medical Center
Women's & Family Health Specialists
International Community Health Services
Cascade Skagit Health Alliance
Sound Family Medicine
Sea Mar Community Health Center
# of Publicly Reported Measures
Medical Group 0 1 2 3 4
2013–2014 Patient Experience – Overview of Medical Group Results(Source: Washington Health Alliance)
The graph to the right is intended to provide a snapshot of the overall performance on the four measures for the medical groups. It starts with those medical groups that report the highest number of above-regional-average scores from the patient experience survey. In clusters where multiple medical groups have the same number of above-average scores, those groups whose other scores are average are ranked first, in alphabetical order.
Better Average Below
Summary of Medical Group Results
22

Results for Clinics in the Puget Sound Region
The following pages include the results for individual clinics in the region. The survey response rate for each clinic determines the number of measures for which the clinic has publicly reported results. As with the medical group results, the clinic results highlight the variation in our region, the successes and the opportunities for improvement.
23

Allenmore Family Medicine MultiCare
Auburn MultiCare Clinic
Auburn MultiCare Clinic Medical Ofce
Bastyr Center for Natural Health
Bellevue Family Medicine Associates
Carolyn Downs Family Medical Center
Cascade Skagit Health Alliance
Community Health Center of Snohomish County - Everett 112th Street Clinic
Community Health Center of Snohomish County - Everett Broadway Clinic
Country Doctor Community Clinic
Covington MultiCare Clinic
Eastside Family Medicine Clinic
Eastside Internal Medicine PLLC
Edmonds Family Medicine Clinic - Puget Sound Family Physicians
EvergreenHealth Primary Care, Canyon Park
EvergreenHealth Primary Care, Duvall
EvergreenHealth Primary Care, Kenmore
EvergreenHealth Primary Care, Redmond
EvergreenHealth Primary Care, Woodinville
EvergreenHealth Senior Services
EvergreenHealth Women's Care
Familycare of Kent
Franciscan Medical Clinic - Des Moines
Franciscan Medical Clinic - Enumclaw
Franciscan Medical Clinic - Federal Way
Franciscan Medical Clinic - Gig Harbor
Franciscan Medical Clinic - Highline
Franciscan Medical Clinic - Lakewood
Franciscan Medical Clinic - Milton
Franciscan Medical Clinic - Port Orchard
Franciscan Medical Clinic - Seahurst
Franciscan Medical Clinic - University Place
Franciscan Medical Clinic - Vashon Island
Franciscan Medical Clinic - West Seattle
Franciscan Medical Clinic - Westwood
Franciscan Medical Clinic @ St. Francis
Franciscan Medical Clinic @ St. Joseph
Better
Average
Average
Better
Average
Average
Below
Average
Below
Average
Average
Below
Better
Average
Below
Better
Average
Average
Average
Average
Better
Better
Average
Below
Average
Below
Average
Average
Below
Average
Average
Below
Below
Average
Average
Average
Below
Average
Average
Average
Better
Average
Average
Below
Average
N/A
Average
Average
Better
Better
Average
Average
Average
Better
Average
Average
Average
Better
Better
Average
Average
Average
Below
Below
Below
Average
Average
Below
Better
Average
Average
N/A
Below
Average
Better
Average
Average
Better
Better
Average
Average
Average
N/A
Average
Average
Below
Average
Better
Average
Average
Average
Average
Below
Better
Better
Better
Average
Below
Average
Average
Average
Average
Below
Below
Below
Average
Below
Below
N/A
Average
Below
Better
Average
Average
Better
Average
N/A
Below
N/A
N/A
Average
Average
Average
Average
Average
Average
N/A
Better
Average
Average
N/A
Better
Better
Average
Average
Average
Below
Below
Average
Average
Average
N/A
Better
Average
Average
N/A
Below
Average
Clinic (in alphabetical order)
Regional Average 54% 79% 73% 74%
Timely Care and Info
Provider Communication
HelpfulOf�ce Staff
OverallProvider Rating
All statistical tests are conducted at the 95% confidence level. Statistically significant differences are marked as being “Below” or “Better” than the Puget Sound Average. Scores that are not statistically significantly different are marked as “Average.”
N/A = Scores did not reach 0.7 reliability and therefore are not publicly reported.
Results for Clinics in the Puget Sound Region
Better Average Below
24

Franciscan Medical Clinic on Pt. Fosdick
Gig Harbor MultiCare Clinic
Group Health Bellevue Medical Center
Average
Average
Average
Below
Better
Average
Average
Better
Below
Average
Average
Average
Timely Care and Info
Provider Communication
HelpfulOf�ce Staff
OverallProvider Rating
Group Health Burien Medical Center
Group Health Capitol Hill Medical Center
Group Health Downtown Medical Center
Group Health Everett Medical Center
Group Health Factoria Medical Center
Group Health Federal Way Medical Center
Group Health Kent Medical Center
Group Health Lynnwood Medical Center
Group Health Northgate Medical Center
Group Health Northshore Medical Center
Group Health Olympia Medical Center
Group Health Port Orchard Medical Center
Group Health Poulsbo Medical Center
Group Health Puyallup Medical Center
Group Health Rainier Medical Center
Group Health Redmond Medical Center
Group Health Renton Medical Center
Group Health Silverdale Medical Center
Group Health Tacoma Medical Center
Group Health Tacoma South Medical Center
Hall Health Center @ UW
Harborview Adult Medicine Clinic
Harborview Family Medicine Clinic
HealthPoint Auburn Medical Center
HealthPoint Bothell-Kenmore Medical Center
HealthPoint Federal Way Medical Center
HealthPoint Kent Medical Center
HealthPoint Renton Medical Center
HealthPoint SeaTac Medical Center
Holly Park Medical & Dental Clinic
Interlake Medical Center
International District Medical & Dental Clinic
Kent MultiCare Clinic
Key Medical Center
Lakeshore Clinics - Bothell Clinic
Lakeshore Clinics - Totem Lake
Lakewood MultiCare Clinic
Maple Valley MultiCare Clinic
Average
Better
Better
Average
Better
Average
Average
Average
Average
Average
Average
Below
Average
Below
Average
Average
Average
Average
Average
Average
Better
Below
Below
Average
Average
Average
Below
Average
Average
Below
Average
Below
Average
Better
Average
Average
Average
Below
Average
Average
Average
Average
Average
Average
Below
Average
Average
Average
Average
Average
Better
Below
Average
Average
Below
Average
Average
Average
Better
Average
Average
Average
Average
Average
Below
Average
Average
N/A
Below
Below
Average
Better
Better
Better
Average
Average
Average
Average
Better
Average
Average
Average
Average
Average
Average
Better
Average
Average
Average
Average
Below
Average
Average
Average
Average
Average
Better
Average
Average
Below
Average
Average
Below
Average
Average
N/A
Below
Below
Average
Better
Average
Average
Average
Average
Better
Average
Average
Average
Average
Average
Average
Average
Average
Average
Average
Average
Better
Average
Average
Average
Below
Average
Average
Average
Average
Average
Average
Below
N/A
Better
Below
Better
Average
N/A
Below
Below
Below
Better
Better
Average
Average
Average
Clinic (in alphabetical order)
All statistical tests are conducted at the 95% confidence level. Statistically significant differences are marked as being “Below” or “Better” than the Puget Sound Average. Scores that are not statistically significantly different are marked as “Average.”
N/A = Scores did not reach 0.7 reliability and therefore are not publicly reported.
Results for Clinics in the Puget Sound Region
Better Average Below
25

MultiCare Allenmore Internal Medicine
MultiCare Family Medicine Center
Better
Average
Average
Average
Better
Average
Average
Average
MultiCare Good Samaritan Family Medicine - Puyallup
MultiCare Good Samaritan Family Medicine - South Hill
MultiCare Tacoma Central Family Medicine
MultiCare Tacoma Central Internal Medicine
Neighborcare 45th St. Medical Clinic
Neighborcare High Point Medical Clinic
Neighborcare Pike Market Medical Clinic
Neighborcare Rainier Beach Medical Clinic
Neighborcare Rainier Park Medical Clinic
Northshore MultiCare Clinic
Olympia Family Medicine & Internal Medicine
Overlake Internal Medicine Associates, P.S.
Overlake Medical Clinics
Paci�c Medical Centers - Beacon Hill
Paci�c Medical Centers - First Hill
Paci�c Medical Centers - Lynnwood
Paci�c Medical Centers - Northgate
Paci�c Medical Centers - Renton
Paci�c Medical Centers - Totem Lake
Peninsula Community Health Services
Peninsula Family Medical Center
Providence Harbour Pointe Clinic
Providence Marysville Clinic
Providence Mill Creek Family Medicine
Providence Mill Creek Internal Medicine
Providence Monroe Family Practice
Richmond Internal Medicine
Sea Mar Community Health Burien Clinic
Sea Mar Community Health Marysville Clinic
Sea Mar Community Health Olympia Clinic
Sea Mar Community Health Puyallup Clinic
Sea Mar Community Health Tacoma Clinic
Sea Mar Community Health Tillicum Clinic
Snohomish Family Medicine - Puget Sound Family Physicians
Sound Family Medicine Bonney Lake
Sound Family Medicine Puyallup
Sound Family Medicine Sunrise
Southlake Clinic Kent
Southlake Clinic Renton
Better
Average
Average
Below
Average
Average
Average
Average
Average
Average
Average
Average
Average
Average
Better
Average
Average
Average
Better
Average
Average
Below
Average
Average
Better
Average
Average
Below
Below
Below
Below
Below
Below
Average
Below
Below
Below
Average
Below
Average
Average
Average
Below
Average
N/A
Average
Average
Average
Average
Average
Below
Average
Average
Average
Below
Average
Average
Average
Below
Better
Average
Average
Average
Better
Better
Below
Average
Below
Average
Below
N/A
N/A
Average
Average
Average
Average
Average
Below
Better
Average
Average
Below
Average
N/A
Average
Below
Average
Average
Average
Average
Average
Average
Average
Average
Below
Better
Average
Average
Average
Average
Average
Average
Better
Average
Below
Average
Average
Below
Average
N/A
N/A
Better
Average
Average
Average
Below
Below
Average
Average
Better
Average
Average
N/A
Average
Average
N/A
Average
Average
Average
N/A
Better
Average
Average
Average
Average
Average
Below
Better
Average
N/A
Average
Better
Better
Below
N/A
N/A
Average
N/A
N/A
N/A
Average
Average
Average
Average
Average
Average
Clinic (in alphabetical order)
Timely Care and Info
Provider Communication
HelpfulOf�ce Staff
OverallProvider Rating
All statistical tests are conducted at the 95% confidence level. Statistically significant differences are marked as being “Below” or “Better” than the Puget Sound Average. Scores that are not statistically significantly different are marked as “Average.”
N/A = Scores did not reach 0.7 reliability and therefore are not publicly reported.
Results for Clinics in the Puget Sound Region
Better Average Below
26

St. Peter Family Practice Average Average Average Average
Summit View Clinic
Sumner MultiCare Clinic
Swedish Ballard Primary Care
Swedish Central Seattle Primary Care
Swedish Downtown Seattle Primary Care
Swedish Edmonds Birth and Family Clinic
Swedish Factoria Primary Care
Swedish Greenlake Primary Care
Swedish Issaquah Primary Care
Swedish Magnolia Primary Care
Swedish Minor and James
Swedish Pine Lake Primary Care
Swedish Queen Anne Primary Care
Swedish Redmond Primary Care
Swedish South Lake Union Primary Care
Swedish West Seattle Primary Care
Tacoma Family Medicine MultiCare
The Doctors Clinic Bainbridge Island
The Doctors Clinic East Bremerton
The Doctors Clinic Poulsbo
The Doctors Clinic Silverdale
The Everett Clinic Founders Building
The Everett Clinic Harbour Pointe
The Everett Clinic Lake Stevens
The Everett Clinic Marysville
The Everett Clinic Mill Creek
The Everett Clinic Silver Lake
The Everett Clinic Snohomish
The Everett Clinic Stanwood
The Polyclinic Ballard
The Polyclinic Downtown
The Polyclinic Family Medicine Sand Point
The Polyclinic Madison Center
The Polyclinic Northgate
University of Washington Medical Center
University of Washington Medical Center Roosevelt I
University of Washington Medical Center Roosevelt II
University Place MultiCare Clinic
UW Neighborhood Belltown Clinic
UW Neighborhood Factoria Clinic
Average
Better
Better
Average
Better
Average
Average
Better
Better
Average
Average
Average
Average
Average
Average
Average
Average
Average
Average
Average
Average
Average
Better
Average
Average
Average
Average
Average
Average
Better
Average
Below
Better
Better
Better
Better
Average
Below
Average
Average
Average
N/A
Average
Better
Better
Average
Average
Average
Average
Better
Average
Better
Average
Average
Average
Average
Average
Better
Below
Average
Better
Average
Better
Below
Average
Average
Average
Average
Average
Average
Average
Better
Average
Better
Better
Average
Average
Average
Better
Average
Better
N/A
Better
Average
Better
Average
Below
Average
Average
Below
Average
Better
Average
Better
Average
Average
Average
Average
Average
Average
Better
Average
Better
Average
Average
Better
Average
Average
Average
Better
Better
Average
Better
Better
Better
Better
Better
Average
Better
Below
Average
N/A
Average
Better
Better
N/A
Average
Better
Average
Better
Average
Better
Average
Average
Average
Average
N/A
Average
Below
Average
Average
Below
Better
Below
Better
Average
Average
Average
Average
Average
Better
Average
Better
Average
Better
Average
Average
Average
Better
Average
Clinic (in alphabetical order)
Timely Care and Info
Provider Communication
HelpfulOf�ce Staff
OverallProvider Rating
All statistical tests are conducted at the 95% confidence level. Statistically significant differences are marked as being “Below” or “Better” than the Puget Sound Average. Scores that are not statistically significantly different are marked as “Average.”
N/A = Scores did not reach 0.7 reliability and therefore are not publicly reported.
Results for Clinics in the Puget Sound Region
Better Average Below
27

UW Neighborhood Federal Way Clinic
UW Neighborhood Issaquah Clinic
UW Neighborhood Kent/Des Moines Clinic
UW Neighborhood Northgate Clinic
UW Neighborhood Ravenna Clinic
UW Neighborhood Shoreline Clinic
UW Neighborhood Woodinville Clinic
Valley Medical Cascade Primary Care
Valley Medical Center Covington Primary Care
Valley Medical Fairwood Primary Care
Valley Medical Kent Primary Care
Valley Medical Lake Sawyer Primary Care
Valley Medical Newcastle Primary Care
Valley Medical Renton Highlands Primary Care
Valley Medical Valley Family Medicine
Virginia Mason Bainbridge Island Medical Center
Virginia Mason Bellevue Medical Center
Virginia Mason Federal Way Medical Center
Virginia Mason Hospital and Seattle Medical Center
Virginia Mason Issaquah Medical Center
Virginia Mason Kirkland Medical Center
Virginia Mason Lynnwood Medical Center
Women's & Family Health Specialists
Woodinville Primary Care
Yelm Family Medicine
Average
Average
Average
Better
Better
Below
Better
Average
Average
Average
Average
Average
Average
Better
Average
Average
Average
Average
Better
Better
Better
Average
Below
Average
Below
Better
Average
Average
Average
Average
Average
Better
Below
Average
Average
Average
Better
Below
Better
Average
Average
Average
Average
Better
Average
Average
Average
Average
Better
Average
Average
Average
Average
Better
Better
Average
Average
Average
Average
Average
Below
Average
Average
Average
Average
Average
Average
Average
Better
Better
Better
Better
Below
Average
Average
Average
Average
Average
Average
Average
Average
Better
Average
Average
Average
Average
Better
Average
Average
Average
Average
Average
Average
Average
Average
Better
Average
Average
Better
Average
Clinic (in alphabetical order)
Timely Care and Info
Provider Communication
HelpfulOf�ce Staff
OverallProvider Rating
All statistical tests are conducted at the 95% confidence level. Statistically significant differences are marked as being “Below” or “Better” than the Puget Sound Average. Scores that are not statistically significantly different are marked as “Average.”
N/A = Scores did not reach 0.7 reliability and therefore are not publicly reported.
Results for Clinics in the Puget Sound Region
Better Average Below
28

Detailed Description of Survey Protocol and Analysis Plan
The Center for the Study of Services (CSS) administered the survey on behalf of the Washington Health Alliance. The following pages provide information about the survey sample, survey materials and how they were fielded, and details of how the survey results were analyzed.
29

SampleThe list of clinics and providers eligible to be included in the survey was compiled by the Alliance. Medical groups and clinics were included if (1) they had three or more primary care providers; (2) are located within the five-county Puget Sound area including King, Kitsap, Pierce, Snohomish, and Thurston counties; and (3) were included in the Alliance provider roster. Primary care providers include both physicians and mid-level providers with credentials in the following areas: family medicine, general internal medicine, preventive medicine, geriatrics, osteopathy, and naturopathy.
Sample frames included plan members 18 years of age and older with a qualifying visit between July 1, 2012 and June 30, 2013. Sample frames were provided by six participating health plans: Cigna, Group Health Cooperative, Premera Blue Cross, Regence Blue Shield, UnitedHealthcare and Washington State Health Care Authority (Medicaid).
Plan-provided sample frames were pooled across plans at the provider level, and subsequently, the clinic level. Samples were randomly drawn at the clinic level. The sample size for each clinic was determined by the number of providers at the clinic. The greater the number of providers, the greater the sample size. From each clinic’s list of visits, a random sample was drawn. Patients were asked specifically about their experience with the provider visited (no visit date was referenced). No individual person could be sampled more than once. Up to two people from the same household could be sampled.
A total of 196 clinics initially participated in the project. After two waves of survey mailing, a small number of clinics had an insufficient number of sample members in order to be publicly reported. Additional sample members were drawn for these clinics (if available) and surveys were mailed to these new sample members.
MaterialsThe survey fielded was the core Clinician Group CAHPS Survey (CG-CAHPS) with some supplemental CAHPS questions added by the Alliance. The survey instrument was designed as a four page 8.5 inch by 14 inch booklet. The provider name was printed in Question 1 on each survey. The survey was accompanied by a cover letter which explained the survey to the sample member. The cover letter carried the logos of the Alliance and of the patient’s health plan. The letter was signed by the Executive Director of the Alliance. All survey packages included a pre-paid business reply envelope addressed to the Center for the Study of Services. A random selection of over 83,000 sample members also received an education insert about the Choosing Wisely ® campaign that helps patients talk to their health care providers about getting the treatments appropriate to them. A copy of the survey instrument and education insert is available upon request. Please contact Susie Dade at [email protected]
FieldingWave one surveys were mailed on September 3, 2013 to randomly selected patients with a qualifying visit between July 2012 and June 2013. Sample members who did not respond to wave one were sent a second survey mailing on September 27, 2013. It was planned to send a third mailing to clinics that had an insufficient number of responses after wave two of the survey in order to increase the number
30
of clinics with publicly reportable survey results. Through an analysis conducted in October 2013, it was projected that 55 clinics may have an insufficient number of responses for public reporting. Out of the 55 clinics, 32 did not have a sufficient number of eligible patients to draw additional sample. Three clinics had unusually low response rates from the first two waves of the survey and were determined to be too far from the target number of completes to reasonably achieve reportable results. Therefore, additional sample members were drawn for the remaining 20 clinics and surveys were mailed to these sample members on November 4, 2013. Data collection was closed for all sample members on December 2, 2013.
AnalysisIn order to be included in the survey analysis, a respondent was required to answer “Yes” to question 1 (“Your health plan’s records show that you got care from the provider named below in the last 12 months. Is that right?”) and “1 time” or more to question 4 (“In the last 12 months, how many times did you visit this provider to get care for yourself?”).
There are three composite scores included in the reporting results. Composites are a combination of individual questions that address similar content areas. The three composites on the survey are:
• Getting Timely Appointments, Care, and Information (Q6, Q14, Q16, Q18, Q19)
• How Well Providers Communicate With Patients (Q20, Q21, Q24, Q33, Q34, Q35)
• Helpful, Courteous, and Respectful Office Staff (Q43 and Q44)
All question and composites scores are reported as “top box” proportions—the number of respondents that provided a specific (favorable) answer to a question divided by the total number of respondents that answered the question.
The relationship between patient characteristics and patient responses to the CG-CAHPS survey has been well documented. Individuals in better health and older individuals tend to give higher ratings, whereas individuals with higher education and women tend to give lower ratings. It is not uncommon to have substantial differences in these patient characteristics across clinics. Case-mix adjustment is a way to control for differences in patient characteristics when comparing clinics so that differences in scores reflect differences in quality rather than patient characteristic differences. Scores were case-mix adjusted for age, education, gender, and health status. Patient characteristics were collected from respondents as a part of the survey.
The Alliance is publicly reporting the three composite scores and the score for the Rating of Provider. The clinic’s score on a question will not be publicly reported unless the clinic’s number of responses on that measure meets a certain threshold. We have used the reliability statistic to decide that threshold. Reliability can range from 0 to 1. The Alliance will not publicly report a score for a clinic where the number of survey responses is below a number that would yield a reliability of 0.7.
The reliability statistic takes into account three characteristics of a set of survey responses for clinics. First, how much variation is there in the responses each clinic’s patients provide about their providers? The more a clinic’s patients tend to agree about their providers (i.e. lower within-clinic variance), the higher the reliability statistic. Second, how much variation is there from clinic to clinic in ratings? The
31
larger the differences from clinic to clinic (i.e. higher between-clinic variance), the higher the reliability statistic. Third, how large is the number of respondents for each clinic? Larger numbers of responses produce a higher reliability statistic. Where within-clinic variance is low, between-clinic variance is high, and number of responses is high, the reliability statistic tends to be high, and one’s confidence in distinguishing among clinics can be relatively high.
This report includes a Puget Sound Average for comparison purposes. The Puget Sound Average is the average rate for all patients included in the survey. Clinic results were compared to the Puget Sound Average using a t-test at the 95% confidence level.
The Washington Health Alliance and its staff did not have access to any patient identifiable information at any time during this process. Any and all protected health information received by CSS to implement this survey was used only for the survey and for no other purpose. All of CSS’s guidelines for data security adhere to HIPAA (Health Insurance Portability and Accountability Act) and the HITECH (Health Information Technology for Economic and Clinical Health) Act. CSS has successfully completed a SAS 70 Type II review during which their privacy and security policies, their data management systems, and their IT infrastructure were tested by an independent external auditor.
32

More Information about the Washington Health Alliance
Your Voice Matters is an initiative of the Washington Health Alliance. The Alliance, formerly known as the Puget Sound Health Alliance, is a nonprofit organization where the people who get, provide and pay for health care come together to improve health care quality and affordability.
33

The Alliance’s Mission:The Alliance mission is to build and maintain a strong alliance among purchasers, providers, health plans, consumer and others to promote health and improve the quality and affordability of the health care system by reducing overuse, underuse and misuse of health care services.
Alliance 5-Year Vision:By 2017, our vision is that physicians, other providers and hospitals in Washington will have achieved top 10% performance in the nation in the delivery of equitable, high quality, evidence-based care and in the reduction of unwarranted variation, resulting in a significant reduction in the rate of medical cost trend.
Alliance Guiding Principles:• Reduce unwarranted variation in the price and delivery of care among
providers and delivery systems; reward performance that is consistently characterized by high quality and efficiency at a lower overall price.
• Improve the quality of health care services, particularly in the effective management of chronic disease and prevention; support the revitalization of primary care as the foundation for cost-effective, accountable care.
• Strengthen the partnership between patients and providers to manage personal health.
• Increase evidence-based decision-making and slow the rate of health care price increases by reducing unnecessary and/or non-evidence based care.
• Promote collaboration and avoid duplication and/or conflicting market signals among organizations and individuals working toward the same or similar goals.
The Alliance’s areas of focus are:• Performance Measurement: Measuring variation in quality and cost of care
• Reporting: Making variation across providers and health plans more transparent
• Performance Improvement: Using reports to change results and improve value
• Purchaser and Consumer Engagement: Helping purchasers and consumers make informed decisions
• Payment Reform: Promoting payment methods that link payment incentives to value, not volume
The Alliance includes more than 175 leading employers and union trusts, health plans, hospitals and physician groups, government agencies, educational institutions, pharmaceutical companies and individuals. Since our founding in 2004 as an independent 501(c)3 non-profit, non-partisan organization, the Alliance has grown such that Alliance participants now represent approximately 3 million covered individuals.
In 2013, the decision was made to expand the Alliance beyond the five-county Puget Sound region to become statewide. This expansion will happen over time and will begin with the 2014 Community Checkup including results for medical groups and clinics in three new areas, including Whatcom, Skagit and Spokane counties.
For more information: www.wahealthalliance.org
34

More Information about the Center for the Study of Services (CSS)
Through a competitive process in 2011, the Alliance selected The Center for the Study of Services (CSS) as its survey vendor for the first patient experience survey. Because CSS did such excellent work for us in 2011–2012, we chose to use them again for this current survey. We chose to use a single centralized vendor to assure standardization of sampling and data collection protocols that in turn optimized the reliability and comparability of results among medical groups and clinics.
35

Founded in 1974, CSS has over 30 years of health care survey research. CSS has extensive experience working with CAHPS surveys and has served as the survey vendor for the largest publicly reported fieldings of the CG-CAHPS survey in states such as Massachusetts, California and Minnesota. CSS has been a National Committee for Quality Assurance (NCQA) certified vendor since the certification program began. CSS has administered CAHPS surveys for both private and public payers since 1999.
The Alliance was very concerned about data security and protecting personal health information. CSS has passed a SAS 70 Type II audit, one of the most stringent data security evaluations available. For more information: http://cssresearch.org/
36

37

For more about the Alliance: www.WashingtonHealthAlliance.org
For the Community Checkup report: www.WACommunityCheckup.org