your choice for air travel - sas group
TRANSCRIPT

Your choice for air travelSAS Group Annual Report & Sustainability Report 2007
Strategy 2011
In 2007 the SAS Group launched a strategic plan, Strategy 2011, aimed at strengthening the SAS Group’s
customer focus, profitability and position in Northern Europe. p. 6 -12
Financial targets
In connection with the launch of Strategy 2011 the SAS Group introduced revised financial targets. The Group’s
financial target is an EBT margin of 7%, which corresponds to a CFROI of at least 25%. Revised financial targets
have also been introduced at a company level. p. 6 & 10
The market and analysis of competitors
The SAS Group’s home market is Northern Europe. The SAS Group has a market share of 40% in the Nordic and
Baltic countries. For a more detailed analysis of competitors, see p. 15
Flight safety
Flight safety has been and will continue to be the top priority in the SAS Group. Following the accidents with the
Q400 at Scandinavian Airlines, a decision was made to ground these aircraft out of concern for customers, em-
ployees and the brand. Scandinavian Airlines’ risk index rose on account of the accidents in 2007, but otherwise
showed a stable, declining trend. p. 16
Environmental strategy
Responsible and sustainable traffic growth with a reduced environmental impact is discussed on p. 18
Employees
The SAS Group has 25,516 employees. In 2007 several structural changes were implemented requiring
adjustments from employees. Employee surveys on life at SAS show continued satisfaction, despite the
profound structural transformations the airline industry is undergoing. p. 106
Earnings performance
In 2007 the SAS Group’s income before tax from continuing operations improved by MSEK 515 over the previous
year, amounting to MSEK 1,242 (727). For a ten-year overview of earnings performance and operational key
figures plus detailed statements of income for the business areas, see p. 43-51
Contents
The SAS Group 1
The SAS Group in brief 2
The companies in brief 3
Important events by quarter 4
President’s comments 5
Strategy 2011 6
Cultural turnaround 7
Focus and concentration 8
Harmonizing and developing 8
Competitiveness 10
Profitable growth 11
Policy framework for civil aviation 14
Analysis of competitors 15
Flight safety 16
Aviation security and quality processes 17
A new environmental strategy for the SAS Group 18
The capital market 20
The share 21
Share data 22
External factors, cycles, seasonal variations and risks 23
Aircraft fleet 26
Financing, investment, liquidity & capital employed 27
Business areas 29
SAS Scandinavian Airlines 30
Scandinavian Airlines Norge 31
Scandinavian Airlines Danmark 32
Scandinavian Airlines Sverige 33
Scandinavian Airlines International 34
SAS Individually Branded Airlines 35
Widerøe 36
Blue1 37
airBaltic 38
Estonian Air 38
SAS Aviation Services 39
SAS Ground Services 40
SAS Technical Services 41
SAS Cargo 42
Facts, key figures and traffic data information 43
Annual Report 52
Report by the Board of Directors 52
The SAS Group
Statement of income, incl. comments 57
Statement of income, quarterly breakdown 58
Balance sheet, incl. comments 59
Changes in shareholders’ equity 60
Cash flow statement, incl. comments 61
Notes to the financial reports 62
Parent Company, SAS AB 83
Auditors’ Report 85
Corporate governance 86
Chairman’s comments 86
Corporate Governance Report 86
Areas of responsibility, Legal structure &
Labor union structure within Scandinavia 91
Board & auditors 92
Group Management 93
Sustainability Report 94
Examined by the Group’s external auditors.
President’s comments 95
Our world - our stakeholders 96
New goals and strategies 98
Responsibility for sustainable development 99
Reducing environmental impact 101
Organization and management 103
Results for the year 104
Business areas 111
Assurance report 114
Facts 115
Star Alliance & partners 115
Aircraft fleet & route network 116
Definitions & concepts Back flap
SAS retrospective Back cover
Quick guide to important facts
Company informationReports
All reports are available in English and Swedish and
can be ordered from: SAS, SE-195 87 Stockholm,
tel. +46 8 797 17 88 or: www.sasgroup.net
Direct further questions to SAS Group Investor Rela-
tions, Vice President - Head of SAS Group Investor
Relations, Sture Stølen, tel. +46 8 797 14 51 or:
Annual General Shareholders’ Meeting
The SAS Group’s Annual General Shareholders’
Meeting will be held on April 9 at 3:00 p.m. Venues:
Copenhagen: Radisson SAS Falconer, Falkoner Allé 9
Solna: The SAS Group head office, Frösundaviks Allé 1
Oslo: Radisson SAS Plaza Hotel, Sonja Henies plass 3.
Financial calendar
Interim Report 1 (Jan-Mar), Apr. 29, 2008
Interim Report 2 (Jan-Jun), Aug. 14, 2008
Interim Report 3 (Jan-Sep), Nov. 5, 2008
Year-end Report 2008, Feb 2009
Annual Report & Sustainability Report 2008,
March 2009
The SAS Group’s monthly traffic & capacity data and
most recently updated financial calendar are available
under Investor Relations at www.sasgroup.net

1SAS Group Annual Report 2007
Flexible and value-for-money air travel
SAS is the leading airline group in Northern Europe.
31.2 million passengers flew with SAS in 2007
to 152 destinations in 34 countries.

2 SAS Group Annual Report 2007
Full-year 2008The year 2007 was characterized by very positive growth and favorable market conditions in the SAS Group’s
home market in Northern Europe. General economic growth is expected to be lower in SAS’s home markets in
2008 compared with 2007. Official forecasts have gradually been revised downwards, especially during the
recent period, and we will probably see signs of an economic downturn in the not too distant future. As a result
of this, the market’s passenger growth is expected to be lower in 2008. In addition, there is uncertainty relating
to the price trend for fuel, for which the degree of compensation could become a growing challenge if demand
declines and the oil price continues to rise.
The year 2008 will be favorably impacted by the fact that the ECA agreement has now expired, at the same time
as the negative earnings effect of the Q400 is expected to amount to about MSEK 700-800 for full-year 2008.
The SAS Group in brief
Income and key ratios
Group 2007 2006
Revenue, MSEK 52,251 50,152
Number of passengers, million 31.2 30.3
EBITDAR, MSEK 5,311 5,099
EBT before nonrecurring items, MSEK 1,242 727
EBT margin before nonrecurring items 2.4% 1.4%
CFROI 14% 15%
EBT from continuing anddiscontinued operations, MSEK 1 929 4 936
Earnings per share, SEK 3.87 28.10
Market price at year-end, SEK 83.0 116.5
Dividend (proposed for 2007), SEK 0.0 0.0
Adjusted equity/assets ratio 24% 22%
Adjusted debt/equity ratio 1.42 1.68
Financial preparedness, % of operating revenue 24% 22%
Financial net debt, MSEK 1,231 4,134
Investment related to continuingoperations, MSEK 2,511 1,812
1 Spanair and Aerolineas de Baleares are reported as discontinued operations in 2006-2007.
Sustainability 2 2007 2006
Average no. of employees 25,516 25,323of which women 41% 40%of which men 59% 60%
Sick leave 6.4% 6.1%
Carbon dioxide (CO2), 000 tonnes 6,295 6,213
Nitrogen oxides (NOX), 000 tonnes 25.6 25.2
2 Including Spanair.
Definitions and concepts, back flap Traffic figures, p. 43-51
Results for the year
Revenue for the year amounted to MSEK 52,251
(50,152), up 4.2% over the previous year.
The number of passengers rose by 2.9% to 31.2 million.
Spanair is reported as a discontinuing operation and
goodwill impairment of MSEK 300 was recognized.
Income before nonrecurring items in continuing
operations was MSEK 1,242 (727).
EBT margin before nonrecurring items amounted to
2.4% (1.4%); the target is 7%.
In 2007 the SAS Group’s passenger load factor
amounted to 72.5%, a decline of 0.2 percentage points.
Cost savings totaling SEK 2.8 billion are currently
being implemented.
The Board of Directors proposes to the Annual General
Shareholders’ Meeting that no dividend be paid to SAS
AB shareholders for fiscal year 2007.
2007 was the SAS Group’s best year ever in terms of
environmental performance.
Passengers carriedMillion
27.50
28.75
30.00
31.25
2007 Dec.2007
20062005
EBT before nonrecurring items, quarterly rollingMSEK
–1,500
–1,000
–500
0
500
1,000
1,500
2,000
200720062005
SAS Individually Branded Airlines
Widerøe
airBaltic
Strategic affiliated company: Estonian Air
SAS Aviation Services
SAS Ground Services
SAS Scandinavian Airlines
Scandinavian Airlines Danmark
Scandinavian Airlines Norge
Scandinavian Airlines Sverige
Scandinavian Airlines International
SAS Cargo
SAS Technical ServicesBlue1
Spanair *
* Reported as a discontinued operation in 2006 and 2007.
However, Spanair is included in all sustainability-related
figures and in the SAS Group’s balance sheet.
The SAS Group’s earnings improved steadily from 2005 up until the third quarter of 2007. In the fourth quarter of 2007 SAS suffered the adverse impact of the Q400 and of the threat of strikes at SGS, which explains the decline.
The airline market was favorable in 2005-07, providing the SAS Group with good growth. SAS carried 1.8 million more passen-gers in 2007 than in 2005.
SAS Norge
SAS Danmark
SAS Sverige
SAS International
Widerøe
Blue1
airBaltic
SAS Ground Services
SAS Technical Services
SAS Cargo
9.0%3.7%
7.7% 9.0%
0.6% 9.0%
7.1% 9.0%
7.0%5.8%
1.1% 9.0%
9.0%5.6%
Change from the previous year
–2.3% 4.0%
1.0% 4.0%
–7.6% 5.0%
Earnings and degree of target achievement, EBIT%
Income before tax and nonrecurring items%
–2.5
0
2.5
5.0
7.0
200720062005200420032002
EBT margin 7%
Gap 4.6 pts.
The EBT margin is the SAS Group’s most important earnings target. The requirement is a margin of 7%. In 2007 the SAS Group attained earnings corresponding to an EBIT margin of 2.4%.

3SAS Group Annual Report 2007
The companies in brief
EBIT, SAS Scandinavian Airlines%
TargetScandinavian Airlines NorgeScandinavian Airlines DanmarkScandinavian Airlines SverigeScandinavian Airlines International
2007200620052004
–6
–4
–2
0
2
4
6
8
10
EBIT, SAS Individually Branded Airlines%
Target Blue1, airBalticTarget Widerøe
WiderøeBlue1airBaltic
2007200620052004
–8
–6
–4
–2
0
2
4
6
8
10
Target STSTarget SGS,SAS Cargo
EBIT, SAS Aviation Services%
SAS Ground ServicesSAS Technical ServicesSAS Cargo
2007200620052004
–8
–6
–4
–2
0
2
4
6
SAS Scandinavian Airlines
Main markets are Scandinavia, Europe, North America
and Asia. Customers are primarily frequent travelers in the
leisure and business segments. Competitors and return
requirements, see each company.
Key figures 2007 2006
Revenue, MSEK 40,155 38,631
EBIT before nonrecurring items, MSEK 1,999 1,919
EBIT margin 5.0% 5.0%
EBT before nonrecurring items, MSEK 1,765 1,252
Number of passengers, mill. 25.4 25.1
Average number of employees 7,598 7,588
Carbon dioxide (CO2), 000 tonnes 4,019 4,069
Nitrogen oxides (NOX), 000 tonnes 16.9 17.3
Scandinavian Airlines Norge is Norway’s leading air-
line, carrying 9.7 million passengers to 43 destinations
in 2007. The airline has a market share of around 60%
of Norwegian domestic. Revenue amounted to MSEK
13,411, an increase of 7% over the previous year. Scan-
dinavian Airlines Norge has 2,465 employees, of whom
44% are women. p. 31
Scandinavian Airlines Danmark flies to/from Denmark,
where the airline has a market share of around 45%. The
airline carried 8.1 million passengers to 51 destinations
in 2007. Revenue amounted to MSEK 11,659, which was
an increase of 7% over the previous year. Scandinavian
Airlines Danmark has 2,188 employees, of whom 57%
are women. p. 32
Scandinavian Airlines Sverige bolstered its position in
Sweden in 2007, carrying 6.2 million passengers to 57
destinations in 2007. The airline has a market share of
around 49%. Revenue increased by 6%, totaling MSEK
8,779. Scandinavian Airlines Danmark has 1,704 em-
ployees, of whom 61% are women. p. 33
Scandinavian Airlines International accounts for
Scandinavian Airlines’ intercontinental flights and sales
organization outside the Nordic region. The airline carried
1.3 million passengers between 10 destinations in 2007.
Revenue amounted to MSEK 7,625, a decline of 2%.
Scandinavian Airlines International has 782 employees,
of whom 44% are women. p. 34
SAS Individually Branded Airlines
Main markets are Norway, Finland and the Baltics. Cus-
tomers are primarily frequent travelers in the leisure and
business segments. Competitors and return requirements,
see each company.
Key figures 2007 2006
Revenue, MSEK 7,190 6,532
EBIT before nonrecurring items, MSEK 379 151
EBIT margin 5.3% 2.3%
EBT before nonrecurring items, MSEK 383 142
Number of passengers, mill. 5.8 5.2
Average number of employees 2,884 2,769
Carbon dioxide (CO2), 000 tonnes 1 2,267 2,123
Nitrogen oxides (NOX), 000 tonnes 1 8.8 8.0
1 Including Spanair.
Widerøe is Norway’s leading regional airline, carrying 2.0
million passengers to 43 destinations, 7 of which inter-
national, in 2007. Revenue amounted to MSEK 3,051, an
increase of 4% over the previous year. Widerøe has 1,358
employees, of whom 35% are women. p. 36
Blue1 is Finland’s second-biggest airline, carrying 1.8
million passengers to 27 destinations, 19 of which in-
ternational, in 2007. The airline’s revenue amounted to
MSEK 2,019, unchanged from the previous year. Blue1
has 506 employees, of whom 52% are women. p. 37
airBaltic is the Baltics’ leading and the Group’s fastest-
growing airline, with hubs in Riga and Vilnius. The airline
carried 2.0 million passengers to 56 destinations in 2007.
Total revenue amounted to MSEK 2,097, an increase of
35%. airBaltic has 917 employees, of whom 54% are
women. p. 38
Estonian Air is Estonia’s leading airline and a strategic
affiliated company in the SAS Group. The airline car-
ried 0.8 million passengers to 19 destinations in 2007.
Revenue amounted to MSEK 812. Estonian Air has 439
employees, of whom 53% are women. p. 38
Spanair is reported as a discontinued operation.
SAS Aviation Services
Main markets are Scandinavia, the Nordic region and the
Baltics. Customers are the SAS Group as well as external
airlines. Competitors and return requirements, see each
company.
Key figures 2007 2006
Revenue, MSEK 14,192 14,308
EBIT before nonrecurring items, MSEK –457 –47
EBIT margin –3.2% –0.3%
EBT before nonrecurring items, MSEK –623 –150
Average number of employees 10,651 10,565
SAS Ground Services is the Nordic region’s leading
ground handling company, handling 78.8 million pas-
sengers and in 2007 was represented at 76 airports, also
outside the Nordic region. Revenue rose by 3% in 2007,
amounting to MSEK 6,055, 20% of which from external
customers. SAS Ground Services has 6,873 employees,
of whom 39% are women. p. 40
SAS Technical Services is the SAS Group’s primary pro-
vider of technical maintenance for the Group’s aircraft at 13
airports, also outside the Nordic region. Revenue was level
with the previous year, amounting to MSEK 4,874, 14%
of which from external customers. SAS Technical Services
has 2,422 employees, of whom 7% are women. p. 41
SAS Cargo offers air freight solutions and cargo capacity
on passenger aircraft and purely cargo aircraft as well as
cargo handling. Revenue amounted to MSEK 3,336, a
decline of 8%. SAS Cargo has 1 356 employees, of whom
21% are women. p. 42
In 2007 the SAS Group sold Flight Academy. Comparison
figures in the business area’s statement of income for
2006 have been adjusted for this.

4 SAS Group Annual Report 2007
Important events
First quarter 2007Mats Jansson assumed the position of President
and CEO on January 1, 2007.
The SAS Group changed the seasonal adapta-
tion of its intercontinental operations. The
Stockholm-Beijing route was launched in
March. The Shanghai route was discontinued
from April 2007.
The SAS Group introduced product and service
innovations for its largest customer group -
frequent flyers.
The SAS Group sold SAS Flight Academy for
MSEK 550 to STAR Capital Partners.
Scandinavian Airlines Sverige announced the
launch of 11 new direct routes during the first
half of 2007.
The SAS Group began offering passengers
the opportunity to offset carbon dioxide emis-
sions.
Second quarter 2007
At SAS AB’s Annual General Shareholders’
Meeting, the Board of Directors was reelected
and it was resolved not to pay a dividend.
Danish cabin crew engaged in wildcat strikes.
Swedish cabin crew engaged in strikes in May
2007.
The SAS Group sold its remaining stake in
Rezidor to Carlson Companies.
The SAS Group launched its new strategic plan
- Strategy 2011.
The SAS Group acquired a further 5% of the
shares in Spanair from Teinver.
Third quarter 2007Four Danish unions declared their support for
Strategy 2011 and further stated that they, in
an active and positive spirit, will work to achieve
a complete no-strike rule after the collective
agreements for 2007 have been signed and for
the period to which they apply.
Standard & Poor’s initiated coverage of SAS AB
with a BB credit rating with stable outlook.
Scandinavian Airlines Norge launched a special
focus aimed at leisure travelers in Norway.
During a flight from Copenhagen to Aalborg, the
landing gear of a Dash 8 Q400 aircraft collapsed
on landing. A near-identical incident occurred
three days later on a flight from Copenhagen to
Palanga, but landing in Vilnius.
The Swedish public prosecutor launched a pre-
liminary inquiry in conjunction with the incidents
in Aalborg and Vilnius. The Accident Investigation
Board’s preliminary report indicated deficiencies
in the manufacturer’s maintenance directive.
The SAS Group sold the Spanish ground handling
company Newco to Teinver.
SAS exercised options on two Boeing 737-800
aircraft with delivery in 2009.
Fourth quarter 2007
Scandinavian Airlines Norway was found guilty
of using sensitive business information from its
competitor Norwegian.
The Board of SAS decided to permanently
ground its fleet of 27 Dash 8 Q400s after yet
another accident involving the landing gear.
SAS launched the Stockholm-Bangkok and
Copenhagen-Dubai routes.
Standard & Poor’s credit rating for SAS AB
emained BB with negative outlook.
SAS received a Statement of Objections from
the European Commission regarding suspi-
cions of collusion in the air cargo business.
2008
The SAS Group decided to purchase six MD-87
and two Boeing 737-600 aircraft from other
carriers as replacements for the Q400, partly as
an interim solution and partly as a permanent
solution.
The Danish Civil Aviation Administration an-
nounced that a design flaw had been found on
the Q400. SAS cannot be held responsible for
not discovering the problem.
SAS took over delivery positions on three Boeing
737-800 aircraft with delivery in 2008.
For SGS an internal solution was decided on,
giving SGS 18 months to carry out MSEK 400
in cost reductions as well as a quality program.
Otherwise an external solution will be sought.
SAS won a dispute in the Labor Court in the
matter of whether collective agreements
and codetermination agreements had been
breached when the Danish and Swedish short-
haul pilots were transferred from the SAS Con-
sortium. It was determined that no collective
agreement or codetermination agreement ex-
isted in the manner claimed by the pilot unions
and their claim for MSEK 15 in damages was
rejected.
At the Annual General Shareholders’ Meeting on
April 9, 2008, the nomination committee of SAS
AB will recommend that Fritz H. Schur be elected
the new Chairman of the Board of SAS AB. He is
proposed to replace the current Chairman, Egil
Myklebust, who wishes to step down from his
directorship. The nomination committee recom-
mends that Dag Mejdell, the CEO of Posten Norge
AS, fill the vacancy on the Board.
5SAS Group Annual Report 2007
President’s comments
We launched a new strategic plan, Strategy 2011,
which was well received both internally and by the
outside world. We also bolstered what we offer
customers both on the ground and in the air to
ensure our competitiveness. Still, for various
reasons I am concerned about delays in certain
structural decisions.
2007 in brief
Group earnings for 2007 came to just over SEK
1.2 billion. These results were attainable thanks
to the positive performance of the first three quar-
ters, with favorable demand. However, the last
quarter of the year was very weak, chiefly because
of the Q400 incidents. Full-year earnings were
negatively impacted in the amount of around SEK
0.7 billion by the Q400 situation and SEK 0.7 bil-
lion by the ECA collaboration between SAS, bmi
and Lufthansa. Beyond this, earnings were affect-
ed by a net SEK –0.2 billion by a number of strikes.
It is good news that with the exception of inter-
continental operations, the Group’s core business,
its airlines, all improved their earnings compared
with 2006. Widerøe and Blue1 posted the best
results in the companies’ history, while airBaltic’s
earnings were dragged down by robust expansion
and extensive competition in the Baltic market.
Unfortunately, the companies in SAS Aviation
Services (SGS, STS and SAS Cargo) posted lower
earnings than in 2006.
The Q400
At an airline an accident is the very worst that can
happen. Thanks to the professionalism of our
crews, no passengers were injured in the acci-
dents involving the Q400, and I am tremendously
grateful for this. The authorities’ preliminary find-
ings cleared SAS of blame for two of the incidents.
No conclusions have been reached on the third
incident. Even so, they triggered a decision unique
in the airline industry, whereby in consideration of
our customers, employees and brand, we perma-
nently grounded the Group’s Q400 aircraft.
A settlement with Bombardier and affected
parties is in its concluding phase, and we hope to
be able to report more on this in March.
Strategy 2011
Of course, the year’s most important proactive
initiative was the June launch of a new strategic
plan for the Group - Strategy 2011.
The strategy, aimed at ensuring profitable
growth for SAS, rests on five pillars: focus on airline
operations, concentration on our geographic posi-
tion in Northern Europe, harmonization and devel-
opment of our products and service to our custom-
ers, being able to implement a cultural turnaround
with greater attention to customer needs and a
deeper commitment from our employees and
competitiveness in all parts of our operations.
The new strategic direction was very favorably
received by owners, personnel, unions, the media
and the financial markets.
Our customers
Early in 2007 we improved several key parts of
what we offer customers, such as more attractive
fares, two classes in Scandinavia, Internet book-
ing, Fast Track, etc. We also added a number of
new routes to our intercontinental schedule. All
this, along with greater attention to punctuality
and regularity, is to ensure that we can recapture
and retain customer confidence and strengthen
our brand.
Part of the efforts to improve customer relations
is also a number of meetings at the CEO level with
some of the Group’s by far biggest customers
that I myself along with the rest of management
and some of our Board members organized at
the beginning of the year. These have been very
fruitful.
Relations with our labor organizations
One of my top priorities within the framework of
Strategy 2011 has been to change and improve
relations with union representatives.
Part of this process was a four-day seminar in
Sigtuna at which management and labor arrived
at a new cooperation model, based on creating
shared values and target scenarios.
Unfortunately, the new cooperation model
received a serious blow when threats of conflict
influenced management and the Board’s decision
on the future of the operation in SAS Ground Serv-
ices. An absolute must for succeeding with the
necessary structural changes and cost-cutting
program in Strategy 2011, aimed at ensuring
future profitability, growth and independence for
the SAS Group, is progress in our “cultural turn-
around.”
Climate and the environment
Sustainable development efforts are increasingly
vital. The climate issue is a global issue. That is
why we have adopted an ambitious environmental
strategy where the vision for Group companies is
to emit 20 percent less CO2 than today by 2020,
while maintaining traffic growth.
My first year as President of SAS was more challenging and eventful than anyone could foresee. Unfortunately we will
remember the year primarily for a number of adverse events, such as strikes in both Denmark and Sweden, but above all
for the three accidents involving Q400 aircraft.
Our future performance
We are taking the downturn being predicted with
utmost seriousness. The airline industry is labor-
and capital-intensive, cyclical and volatile. This
poses particular challenges and will demand
further action. In addition we have cultural prob-
lems regarding our cost-cutting program and
structural measures. My focus will be to continue
in 2008, with full force and greater speed, to imple-
ment Strategy 2011 to make SAS a more easily
managed and more flexible company.
SAS is a fine company with outstanding people
and great potential. Together we shall work toward
being the obvious choice for our customers.
Stockholm, March 3, 2008
Mats Jansson
President & CEO

6 SAS Group Annual Report 2007
Background and strategic direction
2001-2004 was the worst period for airlines in
the history of the industry. The SAS Group has
survived thanks to the sale of assets along with the
implementation of tough cost-cutting measures.
Since 2001 the SAS Group has lost nearly SEK
6 billion.
In 2006 the SAS Group posted MSEK 727 in
income before nonrecurring items and for 2007
earnings amounted to MSEK 1,242. This is not
enough to enable the Group to grow in the long-
term.
New competitors have entered the market while
at the same time many European airlines have
gone bankrupt or undergone major restructuring.
Despite the tough times in the airline industry, the
SAS Group has made a concerted effort to reduce
costs and improve its customer offerings.
The restructuring of the SAS Group is not over
and against this backdrop the SAS Group and
its employees are now working to complete this
process under the Group’s Strategy 2011 plan.
The strategy was formed in the spring of 2007
following talks with more than 2,000 employees
and in-depth interviews with around 100 manag-
ers, board members and union representatives.
The guiding principle in Strategy 2011 is SAS
Group customers. All changes will be made with
the same starting point: How can SAS deliver even
better services to its over 31 million passengers
and achieve the company’s growth target of
approximately 20% more passengers in 2011?
Strategy 2011The SAS Group’s strategic plan, Strategy 2011, was launched in June 2007. The strategy has a clear customer
and employee focus for meeting the challenge of creating a future SAS that is stronger and less complex.
GoalsThe SAS Group’s overall goal is to create
value for its owners.
The Group’s financial target is a 7% EBT margin,
equivalent to a CFROI of at least 25% or earn-
ings of approximately SEK 4 billion.
For more information, see p. 10
StrategyThe SAS Group’s strategy is aimed at re-
ducing complexity and creating profitable
growth on the basis of these key elements:
Cultural turnaround
Focusing on airline operations
Concentration on Northern Europe
Harmonization and development of
customer offerings
Competitiveness in all parts of the
business
Business conceptThrough cooperating airlines the SAS Group will
offer flexible and value-for-money air travel with
great freedom of choice to both business
and leisure travelers in Northern Europe.
VisionThe obvious choice.
Concentration on Northern
Europe
The foundation for profitable growth
Harm
on
izationand development of custo
mer
offe
rin
gs
Focusing on airline operations
Cultural turnaround
Com
petitiveness in all parts of th
e
busin
ess
SAS Strategy 2011 in brief
SAS will carry out a cultural turnaround character-
ized by a stronger customer orientation, clearer
management and greater commitment among all
our employees. p. 7
We are focusing on airline operations. This is where
we create the greatest value for our customers and
where we can be unique. p. 8
We are concentrating on air travel to, from and
within Northern Europe. p. 8
We are harmonizing and developing our offerings.
Our customers shall see distinct, uniform, flexible
and value-for-money offerings regardless of which
of our airlines they fly with. p. 8
We have to become competitive in all parts of our
business and continue to reduce our costs. More-
over, we also have to regain world-class punctuality
and regularity. p. 10
Profitable growth. The target is for the Group to
have 20% more passengers in 2011 compared with
2007, with higher resource utilization and less com-
plexity in business operations. p. 11
The friendly airlines

7SAS Group Annual Report 2007
Cultural turnaroundWork must start from the inside
It is important to create a culture within the SAS
Group of committed and motivated employees so
that it is possible to avoid conflicts through dialog.
Strikes must not be used as a means for achieving
goals. It is essential to ensure an organization that
can quickly react to changes in external factors
while remaining centered on the customer.
The SAS Group’s cultural turnaround consequently
has four focus areas:
Cooperation with unions
Incentive with customer focus
Management development
Organizational development
Cooperation with unions
In the business SAS operates it is natural and
necessary to enter into agreements with unions on
employment terms and conditions. Unfortunately,
cooperation with unions has not been friction-
free for many years and has instead led to many
conflicts that have inconvenienced our custom-
ers. This is completely unacceptable and for this
reason the SAS Group together with the unions
will focus on creating a new cooperation model
- a model based on mutual understanding of the
company’s strategies and goals.
Sigtuna meeting
Work on the new cooperation model began in
November 2007 at a four-day seminar in Sigtuna
attended by the management and the largest un-
ions in the Group’s Scandinavian business units.
At the meeting, the participants expressed their
shared understanding of the company’s situation,
vision and goals. The management and unions also
agreed on the principles for the new cooperation
model (the Sigtuna model), and that constructive
solutions, forms of cooperation and negotiations
are essential for relations with our customers and,
ultimately, the success of the SAS Group.
Employees and commitment
To foster a joint commitment to the success of the
SAS Group a project has been initiated that will
lead to a profit-sharing and part-ownership pro-
gram for all employees at an appropriate time.
Besides the work on the profit-sharing and part-
ownership program the Group will to a greater
extent than before integrate the company’s com-
prehensive strategy into its daily activities through
performance management. This will be accom-
plished through the implementation of intermediate
goals and execution of performance appraisal
interviews, and also include a clear link to the focus
on the customer in the incentive program.
Management development
The SAS Group needs clearer management that is
open and honest. A substantial part of SAS’s cul-
tural turnaround accordingly involves bolstering the
skills of managers throughout the company. One
of the ways this will be accomplished is through
basic management training with a clear focus on
management communications. Overall, com-
munication will be strengthened through training,
communications tools and improved dialog. Not
least, this applies to listening and giving feedback.
The Group is focusing on creating stronger man-
agement teams through new meeting structures,
management development and optimal use of
internal management resources.
Organizational development
A competitive company is one that quickly reacts
to changes in the world around it. A customer-
oriented culture requires an organization focused
on future resource needs and characterized by
simplicity. The customer orientation applies to all
parts of the SAS Group’s activities and focuses
on overall efficiency and profitability. The focus in
developing the organization will therefore be to
ensure efficient, customer-guided processes and
management throughout the Group’s operations.
Within SAS the annual cost of collaborating
with the unions is estimated at approximately
SEK 130 million, and the group management is
currently working together with the unions on
streamlining these processes as part of reducing
complexity.
Since employees are in daily contact with cus-
tomers, it is important to nurture and encourage
the creativity and ideas of employees for improving
customer relations. Greater attention will also be
paid to development and recruitment of future
competencies.
To become an attractive employer to new
employees the SAS Group also has to ensure its
attractiveness among current and potential em-
ployees, a concept known as employer branding.
Sigtuna 2007 – new cooperation model with unions
Values
SAS’s overarching shared values underlie our
actions.
Consideration
We care about our customers and employees
and acknowledge our social and environmental
responsibilities.
Reliability
Safe, trustworthy and consistent in word and deed.
Value creation
A professional businesslike approach and innova-
tion will create value for our owners.
Openness
Open and honest management focused on clarity
for all stakeholder groups.

8 SAS Group Annual Report 2007
60%
40%
20%
50%
45%
30%
50%
Focusing and concentration
Focusing on airline operations
The SAS Group is sharpening its focus on its core
business - airlines. Airline operations accounted
for the largest portion of the Group’s profits and
operating revenue in 2007. This is where the
greatest value for customers is created and this is
where SAS can be unique.
Well functioning support functions are impor-
tant for customers and, ultimately, for the SAS
Group. Each element has to be improved in order
to offer the customer the best possible services.
Operations in these areas compete in markets that
are rapidly changing. Specialized global players,
not just airlines, are increasingly found in these
markets. The future role of support businesses in
Aviation Services was under review for that reason.
Concentration on Northern Europe
The SAS Group’s home market is the Nordic and
Baltic countries, a market with more than 30 million
people. SAS’s new strategy builds on its position
as Northern Europe’s leading airline and the con-
centration on its home market and the airlines that
operate there.
SAS is in the process of selling Spanair and also
intends to sell its interests in bmi and Air Greenland
airlines. At the same time the company’s goal is to
become majority owner of airBaltic and Estonian
Air. This will bolster SAS Group’s position in North-
ern Europe.
The SAS Group will develop its overall air services
with the goal of capturing a bigger share of airline
passengers to, from and within the company’s home
markets. With smooth connections between the
company’s hubs, SAS will become more attractive to
customers.
The situation in March 2008
In September 2007 the Spanish ground handling
company Newco was sold to Teinver. The divest-
ment process for Spanair is in progress and is
expected to be completed during the second quarter
of 2008.
An internal solution was approved for SGS. The
company will be retained provided it implements cost
reductions of MSEK 400 and a quality-improvement
program by the summer of 2009. Otherwise, an
external solution will be sought.
The process of selling the bmi shares will con-
tinue in 2008. Discussions are taking place with
the main owners with regard to the acquisition of a
majority stake in airBaltic and Estonian Air.
Harmonization and development Commercial positioning with
better offerings for customers
Business and leisure travel is becoming increas-
ingly integrated. A business traveler to London
may be a leisure traveler to Malaga the next day.
In the past, a demand for great flexibility and a
high service level was mainly associated with busi-
ness travelers, while price was the main concern of
leisure travelers. Today, both business and leisure
travelers make the same demands. The SAS
Group’s ambition is to offer Northern Europe’s
most attractive flight schedule featuring more non-
stop routes and more departures to both business
and leisure destinations. Moreover, air services
will be enhanced through Star Alliance and other
strategic cooperation.
The SAS Group shall offer the market’s most
sought-after products. Its offerings are based on
giving customers flexible, value-for-money air
travel with great freedom of choice - completely
depending on the customer’s need for flexibility
and comfort. Prices shall be the most competitive
in the market and be set on the basis of one-way
fares. Fare levels shall vary in step with demand
and pricing shall be logical, with a good balance
between price and value.
The SAS Group will streamline distribution
and sales. Its goal is to get a higher percentage
of customers to choose electronic channels. The
Group will also increase its focus on its most loyal
customers. Its ambition is for EuroBonus to be
the market’s leading and most attractive loyalty
program bar none.
SAS intends to harmonize its offerings to an
even greater extent throughout the Group. Custom-
ers are to feel at home regardless of which Group
airline they fly with. Harmonization will take place
in the flight schedule, products, fares/distribution
and brands.
The commercial harmonization process will be
handled by a newly created collaboration forum
called the SAS Commercial Board, whose mem-
bers include representatives from all the Group’s
airlines and CEO.
For sale• bmi• Air Greenland• Spanair• Spirit
Keep• Scandinavian Airlines Danmark• Scandinavian Airlines Norge• Scandinavian Airlines Sverige• Scandinavian Airlines International• Widerøe• Blue1• SAS Ground Services*• SAS Technical Services
Sold• Newco
Core business Non-corebusiness
Changes in the corporate structure
Seek majority stake• airBaltic• Estonian Air
* Requires implementation of MSEK 400 worth of cost reduc-tions within 18 months plus the achievement of certain quality goals.
In the fall of 2007 the future roles of SAS Ground Services, SAS Technical Services and Spirit, SAS Cargo’s terminal handling company, were reviewed. On February 5, 2008, the board of SAS decided to outsource heavy maintenance of the Boeing 737 from STS. The decision was also made to sell Spirit.
For analysis of market shares p. 15
Market shares
Schedule for important activities in Strategy 2011
Sale of Newco Implemented
Decision on STS and SAS Cargo Implemented
Decision on SGS Implemented 1
Sale of Spanair In progress 2
Decision on new fleet strategy 1st half of 2008
Cost program implemented 2009
Majority stake in airBaltic - 3
Sale of bmi 2008-2009
Majority stake in Estonian Air - 3
1 Will be kept provided goals and conditions are met.2 Great interest shown and indicative bids have been received.3 As soon as possible during the strategy period, depending on
the decision of the main owners.
SAS Scandinavian Airlines passenger breakdown 2007
Business travelers 55-60%
Leisure travelers 35-40%
Charter travelers 5%
This aggressive strategy requires strong growth in the lei-sure segment. The goal is for leisure travelers to account for at least half of passengers, as opposed to 35-40% today.

9SAS Group Annual Report 2007
Commercial positioning - new concept & products
Simple check-in by cell phone
For EuroBonus members and Travel Pass custom-
ers check-in is now offered via text message or Cell
Phone Voice Control.
Customers traveling
with luggage check-in
by cell phone and the
bag is checked in at the
self-service machine at
the airport.
The bag is left at Bag-
gage Drop. For those
traveling with a book-
ing reference or paper
ticket, the self-service
machine also dispenses
boarding cards needed to get through security
and board the plane. Customers traveling by card
do not need a boarding card.
Checking in via the mobile portal to and from the
following SAS destinations:
Within Scandinavia and Finland
From Scandinavia to Europe and the rest of
the world
To Scandinavia from: Amsterdam, Athens,
Bergen, Brussels, Edinburgh, Dublin, Geneva,
Helsinki, Copenhagen, London, Malaga,
Manchester, Milan, Nice, Oslo, Palma, Paris,
Prague, Reykjavik, Rome, Trondheim, Bangkok,
Beijing, Chicago, New York, Seattle, Tokyo and
Washington, D.C.
IP telephony and wireless networks in lounges
SAS is the first airline to offer its passengers free
IP telephony via Skype in its lounges. It also offers
quick broadband connection and wireless Inter-
net at no charge to all passengers with access to
lounges.
Service benefits - on the customer’s terms
SAS customers can personally customize their
booking according to their desires and needs.
SAS has a number of alternative offerings and
ancillary products:
Three ticket classes: Business, Economy Extra
and Economy
Food & beverages and special meals
Business Sleeper, intercontinental
Movies on board, Europe and intercontinental
Access to lounge, etc.
New Fast Track at Arlanda and Gardermoen
Fast Track offers faster passage through security.
Scandinavian Airlines or Blue1 Business or Econ-
omy Extra passengers and EuroBonus Gold mem-
bers are offered Fast Track at most major airports.
New intercontinental routes
The SAS Group sees potential in
the intercontinental area and will
start this year with a route network
more clearly adjusted to seasonal
demand including routes from
Stockholm to Bangkok and from
Copenhagen to Dubai. Passen-
gers rank SAS intercontinental
traffic the third best airline of the
airlines that fly across the North
Atlantic.
Biometrics
The SAS Group is working on biometric solutions
that save both time and resources.
For security reasons passengers who check in a
piece of luggage for a flight must also be physically
onboard the same flight. Scandinavian Airlines
has introduced a biometric system for self-service
customers.
Instead of being ID’ed when they check in a
bag, passengers now leave a fingerprint on a spe-
cial reader. When boarding the passengers again
leave their fingerprint to verify that they are the
same person. The stored fingerprints are deleted
at the end of the flight. The system is in place at
most Swedish domestic airports and is scheduled
for installation in Norway and Denmark in 2008.
In the future, biometric passports will afford fur-
ther simplification of the travel flow process.

10 SAS Group Annual Report 2007
Brand positioning
The SAS Group has a joint master brand with the
same core values
All companies are to be positioned jointly with
the same positioning statement.
All companies shall have the same design
strategy and visual identity.
The SAS Group shall maximize the value of its
brands and meet competition with distinct brands.
The Group’s portfolio strategy consists of two
brand strategies:
Master brand + descriptor strategy
SAS’s master brand strategy covers Scandina-
vian Airlines’ four airlines and shares the same
brand platform, identity and design.
Endorsement strategy
The SAS Group’s other airlines have their own
brands and identities. The Corporate affiliation
of the majority-owned airlines is visualized
through endorsement, in other words by the
application of “SAS Group Company” to the
fuselage and other places.
CompetitivenessIncreased competitiveness ensures
the SAS Group’s future
Since 2002 the SAS Group has carried out cost
reductions equivalent to slightly more than SEK 16
billion. This has reduced the unit cost by over 30%
during the same period. To maintain its position
as Northern Europe’s largest airline group, SAS, in
the face of the prevailing intensified competition,
initiated cost savings of SEK 2.8 billion in 2007.
The measures cover administration, purchasing,
distribution, productivity etc. These are to be fully
executed in 2009. The bulk of the earnings effects
will occur in 2008 and 2009. As of December 31,
2007, 25% of the measures had been implement-
ed. The plan was for 33% of the measures to be
implemented in the corresponding period. In 2007
the central administration was reduced by approxi-
mately 20% and one project for centralizing Group
purchasing now in progress is expected to cut costs
by approximately MSEK 400. Several projects for
Shared Services units have been started and are
expected to yield effects in 2008 and 2009.
In the subsidiaries SEK 2.1 billion worth of
efficiency enhancements will be implemented.
Approximately SEK 0.6 billion concerns efficiency
enhancements in the administration and sales
organization, including a new distribution solu-
tion. The remainder of the measures pertain to
productivity improvements relating to the existing
operating conditions and rules set by the authori-
ties. Of the measures approximately SEK 1 billion
is related to collective bargaining agreements. The
collective bargaining negotiations in 2007 did not
lead to any breakthrough regarding higher pro-
ductivity or other improvements. The implementa-
tion of all parts of the SEK 2.8 billion cost program
is the foundation of the planned profitable growth.
Restructuring costs are expected to arise as the
result of the efficiency gains. In 2007 restructuring
costs amounted to MSEK 216, primarily attribut-
able to employees idled under notice.
Airline operations, punctuality and regularity
Defined as everything from delays to canceled
flights, air traffic interruptions adversely impact
customers and impose extra costs on the airline.
Reasons may vary from computer glitches and
technical problems for aircraft to difficult ground
and weather conditions, which affect all airlines.
Other problems can be airport capacity limits
(takeoff/landing times, terminals/gates, etc.),
ATC etc.
Punctuality and regularity are very important
from a competitive standpoint. One of the most
basic customer requirements is that SAS Group
airlines fly at the scheduled time. Punctuality is
also an important requirement for being able to
refine SAS’s customer offerings.
Value of the brand
ConsiderationSAS shows consideration in all that it does by accommodat-ing its customers in a professional and cordial manner. SAS does what it can to make all customers feel appreciated.
SimplicitySAS strives for clarity and simplicity in its communication and in everything else it does. SAS does its utmost so that customer contact and travel with SAS airlines are per-ceived as flexible and efficient.
ReliabilitySAS is reliable in all that it does. SAS keeps its promises - customers, co-workers, partners and owners are to rely on the SAS Group. SAS offers safe, punctual and predict-able travel.
In December 2007, 25% of SEK 2.8 billion had been im-plemented. The plan was for 33% of the measures to be implemented.
PurchasingSEK 0.4 billion
Central administrationSEK 0.3-0.4 billion
Subsidiaries SEK 2.1 billion
The cost program amounts to SEK 2.8 billion
2007SAS Group financial targets Target Outcome
Adjusted equity/assets ratio > 35% 24%
Adjusted debt/equity ratio < 100% 142%
Financial preparedness, % of operating revenue 20% 24%
The Group’s profitability targets
EarningsSEK 4 billion
EBTmargin
7%
CFROI25%
Subsidiaries’ profitability requirementsOperating margin
Widerøe STS SGS,SAS Cargo
Blue1,airBaltic
Scandinavian Airlines
9%7%
5% 4%
9%
Excluding Spanair
The SAS Group’s goal is an EBT margin of 7%. This is equivalent to a CFROI of 25%. The profitability requirement for subsidiaries is expressed as an operating margin (EBIT %).
Brand positioning
Market leader in Sweden, Norway and Denmark. Growing presence in Finland and the Baltic countries and increased sea-sonal adaptation of intercontinental routes.
Market leader in the Nordic and Baltic countries.
Market leader in Scandinavia but also represented at 76 airports in 20 countries.
Leader in Northern Europe but broad network to and from Asia and the U.S.
No. 1 on regional routes in Norway.
Strong No. 2 position in Finland.
Market leader in Latvia and Lithuania.
Market leader in Estonia.

11SAS Group Annual Report 2007
The strategic focus on punctuality and regularity
is based on:
Establishing interdisciplinary cooperation
between the operating activities.
Ensuring a long-term and sustainable improve-
ment of the most important quality parameters.
The work will be carried out within the framework
for Group airline operating functions for aircraft
and crew scheduling, operations management
and control and in cooperation with suppliers of
technical maintenance and station handling.
Vigorous improvement plans are being put
in place for punctuality and regularity so that the
Group’s quality goals are achieved within the
framework of Strategy 2011.
Below are examples of measures carried out in
station and technical activities.
Improvements implemented in station activities:
Security Fast Track minimizes arriving too late
at the gate.
Greater use of self-service check-in cuts time
spent standing in line.
Establishment of coordinator service, which
monitors departures with many transit passen-
gers.
Improvements implemented in technical activities:
Maintenance of high focus on delivery quality.
Increased level of service on component sup-
plies to STS production units.
The level of service on consumables for STS
production units is substantially higher.
Implementation of material kits for all types of
checks has contributed to the streamlining of
production.
The Turnaround project in Copenhagen has giv-
en rise to a substantial reduction of Unscheduled
Downtime (UDT) locally through improvements
in all key processes such as planning, material
supply, resource utilization and production
shutdowns. In 2007 the program was contin-
ued at bases in Oslo and Stockholm.
Delays of over 15 minutes due to maintenance
planning have been substantially reduced on
intercontinental routes.
Profitable growthThe goal of SAS Group’s strategy is to enable prof-
itable growth. The goal is that the Group is to have
20% more passengers in 2011 compared with
2007 and higher resource utilization.
The SAS Group’s proactive growth strategy
requires a rapid increase in leisure travel too. In
Norway 14 new routes offering lower fares were
opened in 2007.
The ambition is that leisure travelers are to
account for at least 50% of the SAS Group’s share
of passengers compared with 40% today.
The market and external factors
In terms of volume, passenger transportation by
air shows a stronger long-term growth than GDP.
From 1986-2007 the number of revenue passen-
ger kilometers (RPK) climbed by an average of 6%
in Europe, which is approximately 2.5 times more
than the OECD’s growth during the same period.
This is a reflection of the general increase in pros-
perity along with continuing productivity increases
in the airline industry.
According to Airbus and Boeing forecasts,
the number of revenue passenger kilometers is
expected to grow by approximately 5% until 2026.
The biggest jump in the next 15 years is expected
in the markets to, from and within Asia, with up
to 9% growth expected in China. Within Europe,
which is a more mature market, the SAS Group
expects growth to be slower on short hauls for
environmental reasons and increasing competition
from high-speed trains. On longer distances air
transportation will continue to be the first option.
Given the expected technological advancements
for the next generation of aircraft, traffic growth
need not entail an increase in overall emissions.
SAS Group management parameters
EBITmargin
Motivatedemployees
PULS
Competitiveunit cost
Productivityof flight staffSelling costs
Administration
Efficientresource utilization
Passenger load factorPercentage of profitable round trips
Sickness absenteeismEnvironmental index
Highdelivery quality
PunctualityRegularity
Satisfied customersCSI
Management of subsidiaries is complemented with goals for a number of management parameters.
Current budget/business planning process replaced by:Targets (full-year value) for EBIT margin and management parameters are set in dialog with subsidiary.Focus on activities to achieve the targets.Follow-up is done compared to previous year, outcome of 12-month rolling period and “Rest-of-Year”.
SAS Group’s management process
Goals to companies
Follow-up
Reporting
Financial activity plan 2008
Strategy 2011
Dialog
Level for goals and activitiesfor reaching them
Revision of goals2x/year
Contains simulationof earnings
Full-year value
A similar process forrespective activities takes
place in companies.
Traditional management using full-year budgets is oflimited value. SAS has therefore introduced a newmanagement process focusing on management byobjectives and activities.
SAS Group punctuality Outcome(within 15 minutes) Target 2007
Scandinavian Airlines Norge 90% 81.4%
Scandinavian Airlines Danmark 90% 76.8%
Scandinavian Airlines Sverige 90% 79.6%
Scandinavian Airlines International 90% 74.7%
Widerøe 90% 87.2%
Blue1 90% 84.1%
airBaltic 90% 82.5%
OutcomeSAS Group regularity Target 2007
Scandinavian Airlines Norge 98,5% 98.6%
Scandinavian Airlines Danmark 98,5% 96.7%
Scandinavian Airlines Sverige 98,5% 97.0%
Scandinavian Airlines International 98,5% 98.6%
Widerøe 98.5% 96.7%
Blue1 98.5% 98.9%
airBaltic 98.5% 99.6%
Comparison of punctuality, 2007SAS company Competitor
Blue1 84.1% Finnair 1 80.4%
Scandinavian Airlines Norge 2 78.4% Norwegian 2 69.8%
Scandinavian Airlines 3 80.1% AEA-average 3 78.9%
1 Pertains to arrivals.2 Oslo Gardermoen monthly average.3 International departures within Europe. Source: AEA
12 SAS Group Annual Report 2007
Stockholm-New YorkTicket price:
Norway
Ticket prices compared with consumer price indexIndex SEK
SwedenDenmarkConsumer price index:
0
200
400
600
800
1,000
1,200
0
2,000
4,000
6,000
8,000
10,000
12,000
200720001990198019701960
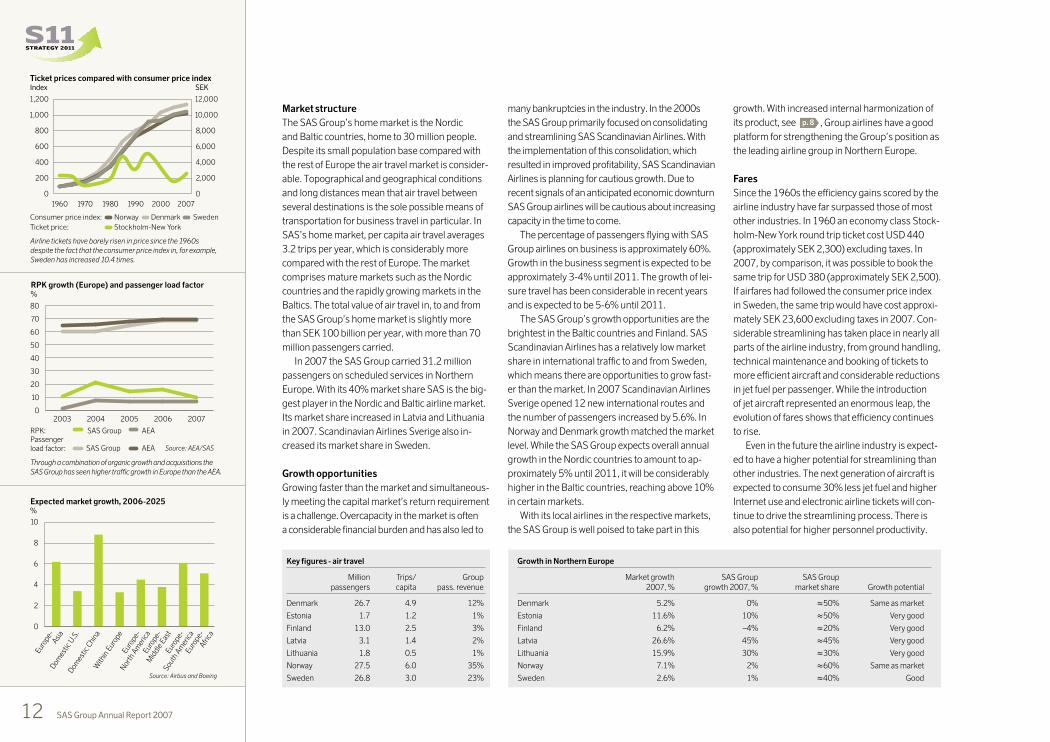
Through a combination of organic growth and acquisitions the SAS Group has seen higher traffic growth in Europe than the AEA.
RPK growth (Europe) and passenger load factor%
0
10
20
30
40
50
60
70
80
20072006200520042003
Passengerload factor:
RPK:
SAS Group AEA
SAS Group AEA
Source: AEA/SAS
Growth in Northern Europe
Market growth SAS Group SAS Group2007, % growth 2007, % market share Growth potential
Denmark 5.2% 0% 50% Same as market
Estonia 11.6% 10% 50% Very good
Finland 6.2% –4% 20% Very good
Latvia 26.6% 45% 45% Very good
Lithuania 15.9% 30% 30% Very good
Norway 7.1% 2% 60% Same as market
Sweden 2.6% 1% 40% Good
Expected market growth, 2006-2025%
Source: Airbus and Boeing
Afric
a
South
Amer
ica
Mid
dle
East
Nor
th A
mer
ica
Euro
pe-
Euro
pe-
Euro
pe-
Euro
pe-
With
inEu
rope
Dom
estic
China
Dom
estic
U.S
.
Asia
Euro
pe-
0
2
4
6
8
10
Airline tickets have barely risen in price since the 1960s despite the fact that the consumer price index in, for example, Sweden has increased 10.4 times.
Key figures - air travel
Million Trips/ Grouppassengers capita pass. revenue
Denmark 26.7 4.9 12%
Estonia 1.7 1.2 1%
Finland 13.0 2.5 3%
Latvia 3.1 1.4 2%
Lithuania 1.8 0.5 1%
Norway 27.5 6.0 35%
Sweden 26.8 3.0 23%
Market structure
The SAS Group’s home market is the Nordic
and Baltic countries, home to 30 million people.
Despite its small population base compared with
the rest of Europe the air travel market is consider-
able. Topographical and geographical conditions
and long distances mean that air travel between
several destinations is the sole possible means of
transportation for business travel in particular. In
SAS’s home market, per capita air travel averages
3.2 trips per year, which is considerably more
compared with the rest of Europe. The market
comprises mature markets such as the Nordic
countries and the rapidly growing markets in the
Baltics. The total value of air travel in, to and from
the SAS Group’s home market is slightly more
than SEK 100 billion per year, with more than 70
million passengers carried.
In 2007 the SAS Group carried 31.2 million
passengers on scheduled services in Northern
Europe. With its 40% market share SAS is the big-
gest player in the Nordic and Baltic airline market.
Its market share increased in Latvia and Lithuania
in 2007. Scandinavian Airlines Sverige also in-
creased its market share in Sweden.
Growth opportunities
Growing faster than the market and simultaneous-
ly meeting the capital market’s return requirement
is a challenge. Overcapacity in the market is often
a considerable financial burden and has also led to
many bankruptcies in the industry. In the 2000s
the SAS Group primarily focused on consolidating
and streamlining SAS Scandinavian Airlines. With
the implementation of this consolidation, which
resulted in improved profitability, SAS Scandinavian
Airlines is planning for cautious growth. Due to
recent signals of an anticipated economic downturn
SAS Group airlines will be cautious about increasing
capacity in the time to come.
The percentage of passengers flying with SAS
Group airlines on business is approximately 60%.
Growth in the business segment is expected to be
approximately 3-4% until 2011. The growth of lei-
sure travel has been considerable in recent years
and is expected to be 5-6% until 2011.
The SAS Group’s growth opportunities are the
brightest in the Baltic countries and Finland. SAS
Scandinavian Airlines has a relatively low market
share in international traffic to and from Sweden,
which means there are opportunities to grow fast-
er than the market. In 2007 Scandinavian Airlines
Sverige opened 12 new international routes and
the number of passengers increased by 5.6%. In
Norway and Denmark growth matched the market
level. While the SAS Group expects overall annual
growth in the Nordic countries to amount to ap-
proximately 5% until 2011, it will be considerably
higher in the Baltic countries, reaching above 10%
in certain markets.
With its local airlines in the respective markets,
the SAS Group is well poised to take part in this
growth. With increased internal harmonization of
its product, see p. 8 , Group airlines have a good
platform for strengthening the Group’s position as
the leading airline group in Northern Europe.
Fares
Since the 1960s the efficiency gains scored by the
airline industry have far surpassed those of most
other industries. In 1960 an economy class Stock-
holm-New York round trip ticket cost USD 440
(approximately SEK 2,300) excluding taxes. In
2007, by comparison, it was possible to book the
same trip for USD 380 (approximately SEK 2,500).
If airfares had followed the consumer price index
in Sweden, the same trip would have cost approxi-
mately SEK 23,600 excluding taxes in 2007. Con-
siderable streamlining has taken place in nearly all
parts of the airline industry, from ground handling,
technical maintenance and booking of tickets to
more efficient aircraft and considerable reductions
in jet fuel per passenger. While the introduction
of jet aircraft represented an enormous leap, the
evolution of fares shows that efficiency continues
to rise.
Even in the future the airline industry is expect-
ed to have a higher potential for streamlining than
other industries. The next generation of aircraft is
expected to consume 30% less jet fuel and higher
Internet use and electronic airline tickets will con-
tinue to drive the streamlining process. There is
also potential for higher personnel productivity.

13SAS Group Annual Report 2007
Strategy 2011 has a clear customer
and employee focus for meeting
the challenge of creating a future
SAS that is stronger and less complex

14 SAS Group Annual Report 2007
SAS Group airlines operate primarily in a free and deregulated market. However, certain segments of the aviation
industry are still protected by a legal framework in part based on bilateral agreements.
Policy framework for civil aviation
Regulations
National government influence over civil aviation
in the EU is shrinking in general, in step with new
EU laws and directives. This applies in areas such
as the environment, infrastructure, safety, pas-
senger security and passenger rights. Outside of
the EU/EEA, civil aviation is regulated by bilateral
agreements that contain requirements for national
majority ownership and control, which are incom-
patible with the EU’s right of free establishment.
The EU’s aim is for the bilateral markets reserved
for flag carriers to be opened to all EU airlines.
Tax on air travel
In accordance with an ICAO policy from the 1950s,
jet fuel for international aviation is untaxed. The Eu-
ropean Parliament and some parts of the European
Commission regard this as unsatisfactory. For that
reason, the Commission has worked within the ICAO
toward introducing a global carbon tax on jet fuel.
This has not had any concrete result so far. Unlike
other modes of transportation, aviation as an indus-
try is charged for the cost of its entire infrastructure.
Norway is the only country in the world that lev-
ies both a carbon tax and a tax on NOx on aviation.
In all these taxes amounted to MSEK 177 for the
SAS Group’s Norwegian domestic traffic in 2007.
Consumer protection
In the EU there are clear consumer protection rules
in the area of air travel. A recurring issue is compen-
sation for overbooking or canceled flights. Over-
booking is used by all airlines that offer a full refund
if a customer does not show up for his flight. Certain
airlines, it turns out, are not good at keeping their
promises in the event of overbooking. The EU has
given the industry more time to show consistent
compliance, otherwise new and stricter legislation
is threatened.
Infrastructure
Major European hubs have largely reached their
limits for expansion. The possibility of constructing
new major airports in densely populated regions is
very slight, not least for environmental reasons. The
lead time from idea to completed project is at least
10-15 years, and there are no known major plans for
expansion or new construction in Europe. However,
big projects are under way in China and India.
The lack of capacity makes it difficult for new
airlines to enter the market, resulting in a scarcity
of attractive takeoff and landing times, called slots.
Business travelers largely demand outward flights
in the morning and homeward in the evening, while
leisure travelers can often fly at other times. The air-
lines’ production and pricing reflect these patterns.
In several European countries, secondary air-
ports are used that are located outside the major
cities. They are often able to offer low takeoff and
landing fees. Airport operators are in charge of allo-
cating slots. There are ongoing discussions of how
slots might be transferred to the airlines. It is clear
that an airline’s holding of slots may be significant
for its value in the market.
Air traffic control services as well as airports
have a near-monopoly vis-à-vis the airlines, which
they exploit in deficiencies in overhauls and control.
During this decade’s crisis for airlines, they have
compensated themselves through price increases
in a way that would have been impossible in an
open market with free entry and exit. Fees that are
charged to our customers as well as Group airlines
and that are paid to airports and authorities, such as
Eurocontrol and the Swedish Luftfartsverket came
to around SEK 9.8 billion in 2007.
Conditions in the value chain
Despite the robust growth in passenger transpor-
tation, the airline industry has historically been less
profitable than other players in the value chain. This
is in part because the industry is exposed to exter-
nal factors often beyond an airline’s control and
in part because airlines have difficulty matching
capacity to demand.
Distributors and other players have traditionally
provided their owners with high operating mar-
gins (see diagram). Airports are being increasingly
privatized, which means that state and municipal
monopolies are being replaced by private monopo-
lies with tougher profit requirements. The right to
operate ground services at airports is partly regu-
lated, hampering competition.
Airways
In Scandinavia, new, simpler airways have been in-
troduced, and increased coordination of air traffic
has begun. This collaboration will now be expand-
ed to cover the countries surrounding the Baltic
Sea. The benefits will be lower fuel consumption,
shorter waiting times in the air and on the ground
and less noise on approach and takeoff.
Similar efforts are under way within the frame-
work of Eurocontrol. The aim is a Single European
Sky. According to AEA estimates, this would result
in a reduction of fuel consumption and thus emis-
sions, of 10-15%. Progress on the Single European
Sky is slow due to national considerations and the
fact that each country protects its own air space.
Ground servicesPassenger and
baggage handlingMenzies Aviation, Novia,
Servisair, SGS
Aircraft manufacturersBoeing, Airbus,
Regional jet manufacturers
Aviation industry value chain
Network airlines presssuppliers tolower costs
AirportsCopenhagen
AirportViennaAirport
Technicalmaintenance
Aircraft maint., LH Technics,
SR Technics,STS
Aircraftleasing companies
GECASILFC
Distri-butors
Travel agenciesGDS/CRS
Internetservices
ROIC, 2001-2004%
–8
–4
0
4
8
12
Source: IATA
Freightcompanies
CRSAirlinesLeasingcompanies
Aircraftmanu-
facturers
The return on invested capital (ROIC) among the various play-ers along the value chain has historically been inequitably dis-tributed in favor of global distributors (CRS), freight companies and airports. The airlines are now working to ensure that the connection between risk and return is reflected in returns to shareholders from now on.
The SAS Group operates in three segments along the value chain: airlines, ground services and technical maintenance.
To achieve balance in the value chain IATA has listed the following focus areas:
States must permit an increasing degree of deregulation.
Better balance between risk and return.
Improved cost-effectiveness and productivity among airlines and optimal resource utilization.
The SAS Group has taken important actions to more dynami-cally match capacity with demand and works systematically to reduce the imbalances in the value chain.

15SAS Group Annual Report 2007
Analysis of competitors
Domestic/Europe
The booming economy has simultaneously resulted
in good growth, while pushing up the cost of leasing
aircraft. The number of new aircraft on order in
Northern Europe indicates an increase in capac-
ity moving forward, which may pose a challenge
to the industry if growth becomes weaker than
expected.
Currently around 150 aircraft are on order by
competitors in the Baltic Sea area. In the summer
of 2007, one of the SAS Group’s competitors,
Norwegian, decided on an investment in 42 air-
craft, with an option on 42 more. The SAS Group
is considering regional jets as replacements for
the Q400s.
Intercontinental
Competition stiffened in 2007 in the interconti-
nental airline market. Several U.S. carriers continued
to move capacity from U.S. domestic routes to
routes over the North Atlantic. As a result, traffic
on European airlines increased by only 4.4% in
2007 and the passenger load factor declined by
0.3 percentage points.
In the Asian market the growth in capacity is tak-
ing place among airlines in the Middle East, a factor
primarily affecting airlines in Central Europe.
New airlines have entered the market, but nearly all of them have challenges in reaching their profitability targets.
Despite a lot of competition, the SAS Group has enjoyed a relatively stable position in recent years.
SAS Group Main competitors in the home market Main competitors in Europe/Globally
Scandinavian Norwegian, Sterling Norwegian, Air France/KLM, British Airways, RyanairAirlines Norge
Scandinavian Sterling, Cimber Air Sterling, Air France/KLM, British Airways, AirBerlinAirlines Danmark
Scandinavian FlyNordic (Norwegian), Malmö Aviation, Finnair, Air France/KLM, British Airways, RyanairAirlines Sverige Sterling
Scandinavian Finnair Finnair, Air France/KLM, British Airways, Continental, Airlines International Delta
Widerøe Norwegian, Coast Air (bankrupt in 2008)
airBaltic Ryanair, Easyjet Ryanair, Easyjet, Finnair
Estonian Air Finnair, Easyjet
SGS Novia, Nordic Aero, Norport, Menzies Swissport, Servisair, Menzies, BBA, WFS, Aviapartner
STS Essential Aircraft Maintenance Service, SR Technics group, Iberia, Air France IndustriesPriority Aero Maintenance
SAS Cargo DHL, TNT, UPS, Posten British Airways World Cargo, DHL, TNT
Sweden
GDP 2.7%Pass. 2.6%
Finland
GDP 3.8%Pass. 6%
Estonia
GDP 7.2%Pass. 12%
Latvia
GDP 10.9%Pass. 27%
Lithuania
GDP 9.1%Pass. >25%
Norway
GDP 5.6%Pass. 7.1%
Denmark
GDP 1.7%Pass. 4.2%
SwedenNumber of aircraft
836*
Fly NordicScandinavian AirlinesSverige
9
MalmöAviation
25
62
NorwegianScandinavian AirlinesNorge
NorwayNumber of aircraft
1121
EstonianAirBaltic
Baltic countriesNumber of aircraft
1365
Blue1Finnair
FinlandNumber of aircraft
29**42
SterlingScandinavian Airlines
Danmark
DenmarkNumber of aircraft
GermanyNumber ofaircraft
121
Air Berlin
* Including 1 wet lease
** Some of these fly in Norway and Sweden
Scandinavian Airlines’ figures stated excluding Q400 aircraft
Sources: Number of aircraft: airline websitesGDP growth: Nordea Economic Outlook
Competitors in SAS’s home market
Number of aircraft in operation 2007, GDP and passenger growth
Total number of passengers, million
Air France/KLM 74.7
Lufthansa 62.9
Ryanair 49.0
Easyjet 38.2
British Airways 33.1
SAS Group 31.2
Air Berlin 27.9
Iberia 26.9
Finnair Group 8.7
Norwegian 6.4
0 20 40 60 80
Excluding Spanair, the SAS Group is Europe’s sixth largest airline measured in passenger volume.
Market share, Nordic and Baltic countries
SAS Group 40%
SAS Scandinavian
Airlines 30%
Finnair 11%
Norwegian * 8%
Ryanair 8%
Sterling 7%
airBaltic 5%
Air France/KLM 3%
Blue1 3%
Widerøe 2%
British Airways 2%
0 10 20 30 40 50
Market share based on production data (ASK) for 2007.
* Including FlyNordic
Source: APG
Owing to accidents involving the Dash 8 Q400 and threat of strikes, the SAS Group’s EBIT margin did not improve in 2007.
EBIT margin of competitors%
SAS GroupNorwegianFinnair
–15
–12
–9
–6
–3
0
3
6
9
20072006200520042003

16 SAS Group Annual Report 2007
Flight safety
All SAS Group airlines are IOSA-certified. IOSA
certification may be viewed as the airline industry’s
answer to ISO 9000 certification. In 2007 the SAS
Group was affected by three accidents involving the
Q400 that required emergency landing. The acci-
dents had similar causes, the right main landing gear
did not work the way it was supposed to. As a conse-
quence of this and several years of quality problems
with the Q400 aircraft, the SAS Group Board decided
to permanently ground this aircraft type.
Maintenance
The SAS Group’s maintenance is largely per-
formed by SAS Technical Services (STS). Along
with the airlines they perform quality work that is
analyzed and evaluated on the basis of reported
incidents, inspections and audits. Other suppliers’
maintenance is performed under similar contract
terms, which are checked and monitored separately.
Maintenance programs, agreements and
related issues are approved by the authorities. All
maintenance is performed according to strict rules
and a strict system of inspections that ensures
airworthy aircraft.
On the basis of experience and new require-
ments there is a particular focus on quality control
in maintenance work, changes and improvements.
Scandinavian Operations Management (SOM) has
an action plan intended to improve the management
in accordance with the airworthiness directive. The
action plan was approved by the OPS Committee*
at its meeting in February and was implemented in
2007.
All three accidents are still under investigation
by the accident investigation board concerned.
Accidents in 2007 involving the Q400
September 9
SK1209
Copenhagen-Aalborg
During landing the aircraft veered to the right when
the right landing gear collapsed. Passengers and
crew evacuated the aircraft. The preliminary inves-
tigation from the Danish Accident Investigation
Board points to a design flaw in the main landing
gear mechanism, leading to corrosion fatigue.
September 11
SK2748
Copenhagen-Palanga
The aircraft’s right main landing gear collapsed so
that the fuselage plowed into the runway and came
to a stop. Passengers and crew evacuated the air-
craft unharmed. The preliminary investigation from
the Lithuanian Accident Investigation Board points
to a design flaw in the main landing gear mecha-
nism, leading to corrosion fatigue.
October 27
SK2867
Bergen-Copenhagen
During the approach to Copenhagen the right main
landing gear could not be extended completely.
Passengers and crew evacuated the aircraft un-
harmed. The preliminary investigation from the
Danish Accident Investigation Board indicates that
an O-ring came loose from a component in the
hydraulic system and became lodged in the main
landing gear’s mechanism.
Number of reported incidents in 2007
R1 R2 R3 R4 R5
Flight operations 0 0 35 501 981
Ground operations 0 0 11 292 1,668
Technical operations 3 1 16 400 94
Aviation Security 0 0 0 61 528
Total 3 1 62 1,254 3,271
R1: High risk.
R2: Elevated risk under all circumstances.
R3: Elevated risk under adverse circumstances.
R4: Non-elevated or elevated risk only under extreme circumstances.
R5: Non-elevated risk, since the incident is not safety-related.
The SAS Group follows up on and reports incidents in internal risk categories (R1-R5) as above to improve quality and decide on corrective actions. The SAS Group reports to the civil aviation authorities in Scandinavia according to ICAO regulations. Owing to a change in classification routines, the number of R5s for Flight Operations rose compared with the previous year.
The three R1 incidents in the table refer to the accidents reported above involving the Q400. In terms of both cause and impact these incidents are by their very nature to be considered extra-ordinary and extremely unusual in the airline industry. The other reported incidents are, seen relative to current industry standards, to be considered normal and at a level with other operators.
* Denmark’s, Norway’s and Sweden’s civil aviation authorities’ cooperation committee, primarily tasked with coordinating national regulations and oversight responsibility regarding the airline operations conducted by the SAS Consortium.
Performance
Cooperation
Human/machine
Equipment
Procedure
Management/control
External factors
Cause
Once the fundamental cause is established,a decision is made on corrective actions.Actions are followed up to check on the result.
Actions
Every reported incident is analyzed andclassified according to criteria in RAMS (Risk Assessment Method in SAS).All incidents are investigated.
Analysis
Technicaloperations
Operations
Planning
Materials
Service
Production
Groundequipment
Groundoperationsincident
Aviation security
Load control
Passengerhandling
Clearance
Hazardousgoods
Abnormalsituations
Flightoperationsincident
Authority
Planning
Communication
Navigation
Monitoring
Cabin safety
SAS flight safety processes
SAS Scandinavian Airlines’ Risk Index, 2003-2007
0.5
1.0
1.5
2.0
2.5
3.0
20072006200520042003
+
–
Risk
SAS’s risk index fell, indicating that air travel as a means of transportation is constantly becoming safer. Globally, 2007 was the best year ever in terms of flight safety.
Measures relating to the Q400 aircraft
On October 28, following the three accidents involving land-
ing gear, the Board of Directors of the SAS Group decided to
permanently ground its entire fleet of 27 Q400 aircraft.
The aircraft were used on Swedish domestic, Danish
domestic and international routes, as well as by the sub-
sidiary Widerøe in Norway. This affects a total of 27 of the
Group’s aircraft, an estimated 5% of the total capacity in
terms of the number of seats. At year-end, nearly 100% of
this capacity had been replaced by wet lease capacity.
The direct earnings effect for the Group of the Q400 is
approximately MSEK 700 for the full year. This includes wet
lease contracts and operating costs, as well as initial direct
loss of earnings. A negative earnings effect of MSEK 700-
800 is anticipated for full-year 2008.
In 2007 the SAS Group had three accidents, and preliminary findings indicate design flaws in two of them,
with one accident still under investigation.
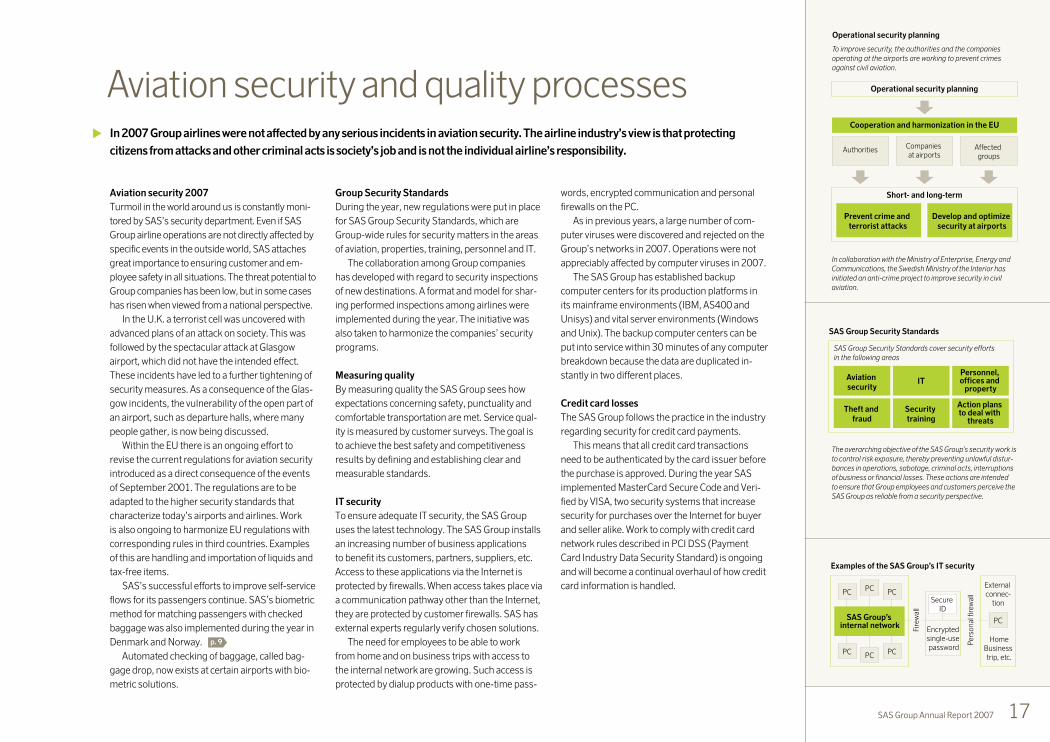
17SAS Group Annual Report 2007
Aviation security and quality processes
Aviation security 2007
Turmoil in the world around us is constantly moni-
tored by SAS’s security department. Even if SAS
Group airline operations are not directly affected by
specific events in the outside world, SAS attaches
great importance to ensuring customer and em-
ployee safety in all situations. The threat potential to
Group companies has been low, but in some cases
has risen when viewed from a national perspective.
In the U.K. a terrorist cell was uncovered with
advanced plans of an attack on society. This was
followed by the spectacular attack at Glasgow
airport, which did not have the intended effect.
These incidents have led to a further tightening of
security measures. As a consequence of the Glas-
gow incidents, the vulnerability of the open part of
an airport, such as departure halls, where many
people gather, is now being discussed.
Within the EU there is an ongoing effort to
revise the current regulations for aviation security
introduced as a direct consequence of the events
of September 2001. The regulations are to be
adapted to the higher security standards that
characterize today’s airports and airlines. Work
is also ongoing to harmonize EU regulations with
corresponding rules in third countries. Examples
of this are handling and importation of liquids and
tax-free items.
SAS’s successful efforts to improve self-service
flows for its passengers continue. SAS’s biometric
method for matching passengers with checked
baggage was also implemented during the year in
Denmark and Norway. p. 9
Automated checking of baggage, called bag-
gage drop, now exists at certain airports with bio-
metric solutions.
Group Security Standards
During the year, new regulations were put in place
for SAS Group Security Standards, which are
Group-wide rules for security matters in the areas
of aviation, properties, training, personnel and IT.
The collaboration among Group companies
has developed with regard to security inspections
of new destinations. A format and model for shar-
ing performed inspections among airlines were
implemented during the year. The initiative was
also taken to harmonize the companies’ security
programs.
Measuring quality
By measuring quality the SAS Group sees how
expectations concerning safety, punctuality and
comfortable transportation are met. Service qual-
ity is measured by customer surveys. The goal is
to achieve the best safety and competitiveness
results by defining and establishing clear and
measurable standards.
IT security
To ensure adequate IT security, the SAS Group
uses the latest technology. The SAS Group installs
an increasing number of business applications
to benefit its customers, partners, suppliers, etc.
Access to these applications via the Internet is
protected by firewalls. When access takes place via
a communication pathway other than the Internet,
they are protected by customer firewalls. SAS has
external experts regularly verify chosen solutions.
The need for employees to be able to work
from home and on business trips with access to
the internal network are growing. Such access is
protected by dialup products with one-time pass-
words, encrypted communication and personal
firewalls on the PC.
As in previous years, a large number of com-
puter viruses were discovered and rejected on the
Group’s networks in 2007. Operations were not
appreciably affected by computer viruses in 2007.
The SAS Group has established backup
computer centers for its production platforms in
its mainframe environments (IBM, AS400 and
Unisys) and vital server environments (Windows
and Unix). The backup computer centers can be
put into service within 30 minutes of any computer
breakdown because the data are duplicated in-
stantly in two different places.
Credit card losses
The SAS Group follows the practice in the industry
regarding security for credit card payments.
This means that all credit card transactions
need to be authenticated by the card issuer before
the purchase is approved. During the year SAS
implemented MasterCard Secure Code and Veri-
fied by VISA, two security systems that increase
security for purchases over the Internet for buyer
and seller alike. Work to comply with credit card
network rules described in PCI DSS (Payment
Card Industry Data Security Standard) is ongoing
and will become a continual overhaul of how credit
card information is handled.
In 2007 Group airlines were not affected by any serious incidents in aviation security. The airline industry’s view is that protecting
citizens from attacks and other criminal acts is society’s job and is not the individual airline’s responsibility.
Operational security planning
Short- and long-term
Operational security planning
Prevent crime andterrorist attacks
Cooperation and harmonization in the EU
Authorities Affectedgroups
Companiesat airports
To improve security, the authorities and the companiesoperating at the airports are working to prevent crimesagainst civil aviation.
Develop and optimizesecurity at airports
In collaboration with the Ministry of Enterprise, Energy and Communications, the Swedish Ministry of the Interior has initiated an anti-crime project to improve security in civil aviation.
Theft andfraud
Action plansto deal with
threats
Securitytraining
Aviationsecurity
Personnel, offices and
propertyIT
SAS Group Security Standards
SAS Group Security Standards cover security effortsin the following areas
The overarching objective of the SAS Group’s security work is to control risk exposure, thereby preventing unlawful distur-bances in operations, sabotage, criminal acts, interruptions of business or financial losses. These actions are intended to ensure that Group employees and customers perceive the SAS Group as reliable from a security perspective.
PCPCPC
PCPCPC
SAS Group’sinternal network
Examples of the SAS Group’s IT security
Per
son
al f
irew
all
Fire
wal
l
Encryptedsingle-usepassword
SecureID
HomeBusinesstrip, etc.
Externalconnec-
tion
PC

18 SAS Group Annual Report 2007
A new environmental strategy for the SAS Group
Responsible and sustainable traffic growth with reduced environmental impact p. 94-114
The climate issue
The climate issue is a reality that policymakers,
business and industry and society have placed on
the global agenda. SAS took its social responsibility
early on in a world where more and more fossil fuel
is used, with adverse environmental impacts. Along
with many other industries aviation faces big chal-
lenges that require a strategy at the company level
and a well-developed and coordinated political will
to ensure a responsible balance between society’s
need for aviation and environmental concerns.
SAS endorses the conclusions of the IPCC re-
port, which shows that aviation accounts for 2-3%
of greenhouse emissions. SAS accepts that the
polluter should pay for its impact and use the eco-
nomically best available technology. The Group
intends to take responsibility for its own carbon
dioxide emissions and considers emissions trad-
ing to be an economically and environmentally
effective way to reach its targets.
While the Group acknowledges aviation’s con-
tribution to the climate problem, it is vital that the
debate on the magnitude of this impact be based
on objective and well-documented findings.
Carbon dioxide emissions from aviation impact
the environment to the same extent as emis-
sions from other sources. In addition, the latest
research indicates that aviation’s other emissions,
such as nitrogen oxides and water vapor, have a
clear climate impact. The most recent findings in-
dicate a total climate impact that may be 1.2 to 1.8
times greater than the impact of carbon dioxide.
Research and development (R&D)
The objective of ACARE (Advisory Council for
Aeronautics Research in Europe) is to reduce
emissions of carbon dioxide by 50% and nitrogen
oxides by 80% and cut noise in half before 2020.
Alternative fuel
In 2008 tests will be conducted of bio-based fuel.
SAS takes an active interest in and intends to
make use of developments in this area.
An intention agreement will be signed in 2008
with aircraft and engine manufacturers and sup-
pliers of jet fuel, to ensure that SAS is able to be an
early adopter of alternative fuels.
Climate index
SAS reports a climate index for CO2 and NOX
emissions. The climate index measures the
Group’s total climate impact relative to produc-
tion measured in RPK. For 2007 the lowest
emissions ever per unit produced were reported.
Environmental strategy
At the end of 2007/beginning of 2008 the SAS
Group laid out a new strategy with appurtenant
action plan for how the Group intends to actively
contribute to sustainable development.
SAS will
Create a culture among employees based on in-
terest in and commitment to environmental work.
Actively influence political decision-making
to counteract distortion of competition both
within and between various sectors.
Have a documented sustainability appraisal as
a basis for all decisions.
Engage in strategic environmental communi-
cation.
Promote tomorrow’s solutions, build alliances
and support relevant R&D projects.
Principal strategic targets
20% lower emissions by 2020 with traffic
growth included.
50% lower emissions per unit produced by 2020.
Zero greenhouse emissions by 2050.
Relative environmental impact and the SAS/IATAvision of zero emissionsIndex
2050
Next g
ene-
ratio
nairc
raft
ATM
2000 2020 2025 2030
Altern
ative
fuel
Tech
nological
le
ap
ACARE
1,0
0,8
0,6
0,4
0,2
0,0
SAS/IATA
visio
n =0 em
issio
ns
Instruments for reducing environmental impact
To reach its targets SAS’s environmental work
rests on four main pillars, Technology develop-
ment, Infrastructure, Operational measures and
Economic instruments.
Technology refers to the composition of the
aircraft fleet, more efficient engines, improved
aerodynamics, lower weight and development of
alternative fuels.
Environmental aspects play a key role in proc-
esses for future fleet planning for SAS.
Infrastructure largely includes cooperation
with the authorities and airport operators. Opera-
tional measures are aimed at management issues
such as the fuel saving program and the like.
Economic instruments consist of taxes and
charges, which largely do not foster sustainable
development, and emissions trading, which, on the
other hand, can be an effective way to reach the tar-
gets without distorting the competition with other
modes of transportation and among airlines.
Technologydevelopment
Infrastructure Operationalmeasures
Economicinstruments
ACARENew technology
Alternativefuels
Improved aerodynamics
Single SkyNUAC + FABCoordinated
ATC
Fuel savingprogramGreen
approaches
EmissionstradingTaxes,
charges,regulations
Instruments for reducing environmental impact
The IATA and SAS’s common vision for air transportation is zero environmental impact by 2050. This vision is to be realized through a number of measures.

19SAS Group Annual Report 2007
The SAS Group is taking the climate issue
very seriously and has in place an ambitious
environmental strategy

20 SAS Group Annual Report 2007
Profitability targets
The SAS Group’s overall objective is to create value
for its shareholders. The SAS Group’s profitability
target is an EBT margin of 7%, which corresponds
to a CFROI of at least 25%. This is equivalent to
income before tax of about SEK 4 billion.
Financial strategies
Capital market and risk management
Financial flexibility is maintained through high
liquidity, adequate access to funding and an
active dialog with the capital market.
The job of finance operations is to identify, man-
age and handle the SAS Group’s financial risks.
Since the aircraft fleet is regarded as a financial
asset, optimization of fleet financing is achieved
by taking operating efficiency requirements, tax
effects, financing costs, capital employed, and
market value into consideration.
IR/information policy
The SAS Group has an IR/information policy, set
by the Board of SAS AB. To ensure sound and fair
provision of information to the market, the infor-
mation policy was updated in 2007.
Investors and capital market players are to be
provided with prompt, relevant and timely informa-
tion on the company’s performance with a focus on
enhancing shareholder value and describing how
sustainability-related issues help to create that
value. The complete policy can be found at www.
sasgroup.net under Investor Relations.
Investor Relations activities
Since the introduction of a single share in 2001,
the SAS Group has been working to increase
interest and liquidity in the share. High liquidity is
vital for major institutional investors to consider
investing in it.
A key part of the communication with the capital
market is the continual reporting of earnings, such
as the Annual Report, interim reports and monthly
traffic figures.
In 2007 the SAS Group Annual Report won first
prize for large listed companies in Sweden. The
competition was organized by the Nordic Exchange
in Stockholm. The Annual Report was also awarded
the Farmandpris in Norway. The interim reports
were changed during the year in order to communi-
cate better and simplify the analysis of the Group. In
connection with quarterly reports SAS Group holds
press and telephone conferences along with ana-
lysts’ meetings in Scandinavia and London.
The Group also takes part in various airline
industry conferences and has held a large number
of investor meetings and presentations for invest-
ment clubs.
Dividend policy
The SAS Group’s annual dividend is determined by
taking into account the Group’s earnings, financial
position, capital requirements and relevant mac-
roeconomic conditions. Over a business cycle the
dividend is to be in the region of 30-40% of the
Group’s income after standard tax. To protect the
Group’s financial position, no dividend is paid as a
rule in the event of a loss.
Dividend
The Board is proposing to the Annual General
Shareholders’ Meeting that no dividend be paid
to SAS AB’s shareholders for the 2007 fiscal year.
This is at odds with the Group’s dividend policy,
whereby 30-40% of income after tax is to be dis-
tributed to the shareholders. This is motivated by
the SAS Group’s financial position, where financial
flexibility will be of major importance in managing
future restructuring measures and investment.
The capital marketThe SAS Group’s share is primarily listed on the Stockholm Stock Exchange and secondarily listed on the exchanges in Copenhagen and Oslo. At the end of 2007 the
Group’s total market capitalization was MSEK 13,654. The number of SAS shares traded was at a record high in 2007, rising by 46%. The SAS Group’s adjusted
equity/assets ratio increased from 22% to 24%.
0
10
20
30
40
Incidents involving Q400,
strike threats and general
stock market decline
Cost reductions in
Turnaround 2005
began to produce results
0
50
100
150
200
20072006200520042003
Trading volume per month. Aggregate trading on the Copenhagen, Oslo and Stockholm exchanges.
Closing (daily) price in SEK
Source: Reuters and the SAS Group.
SAS Group’s share price performance and trading volume, 2003-2007Price, SEK Number of shares traded/month, million
Positive cyclical and
yield performanceSAS Group profitable
after measures
implemented
Launch of
Strategy 2011
Special offer to shareholders
To strengthen the relationship between private
shareholders and the Group’s operations, since
2006 the SAS Group has offered private share-
holders the opportunity to buy one-way and
round-trip airline tickets to various destinations
via a service on the website www.sasgroup.net
under Shareholder Service. Over 1,000 trips by
air have been taken on this special offer.
Capital market activities
2002 2003 2004 2005 2006 2007
Meetings with analysts 6 6 7 6 8 5Teleconferences 2 3 6 5 6 5Group presentations 16 21 17 20 29 12Personal meetings 42 59 72 74 67 80

21SAS Group Annual Report 2007
Since 2001 the SAS Group has been listed
through its parent company SAS AB on the Nordic
Exchange in Stockholm, with secondary listings
in Copenhagen and Oslo. Before 2001 the SAS
Group was listed through parent companies in
Sweden, Norway and Denmark.
In 2007 the SAS share performed very strongly
in the first half of the year thanks to a strong yield,
good earnings performance and the positive re-
ception given the Group’s new strategy, Strategy
2011. During the second half of the year the SAS
share was negatively affected by the accidents in-
volving the Q400, record-high fuel prices and eco-
nomic turmoil. In 2007 the SAS share performed
12 percentage points below a weighted average
of its competitors. Since 2005 the SAS share has
trailed the index by 17 percentage points, largely
due to the economic downturn in 2007.
Share return
Since December 31, 1995, the SAS Group’s share
has yielded an annual return, including reinvested
dividends, of 4.5%. This means that an investment
of SEK 100 in 1995 would have grown to SEK 159
as of December 31, 2007. Measured since Decem-
ber 31, 2002 the corresponding annual return has
been 7.5%.
Share liquidity and index
During 2007 the number of shares traded in-
creased by 45.7%, with a total of 223.8 (153.6)
million shares traded. Since the introduction of the
Nordic Exchange, trading has been concentrated
in Stockholm, where the number of shares traded
surged by 111%. The volume in Copenhagen
decreased by 5% and in Oslo by 34%. Of the total
volume, 66% (46%) was traded in Stockholm,
31% (48%) in Copenhagen and 3% (7%) in Oslo.
Total trading in 2007 amounted to SEK 19.0
(13.9) billion, an increase of 37%. This makes the
SAS share the ninth most traded airline stock in
Europe.
Besides indexes in Nordic trading centers, the
SAS share is included in around 100 stock market
and sustainability stock indexes. Examples of
indexes are the Dow Jones STOXX Index, Morgan
Stanley International and S&P/Citigroup BMI. The
Group is included in some environmental indexes,
such as Ethibel and EIRIS, which evaluate the abil-
ity of companies to successfully combine business
activities with environmental work.
Shareholders
The SAS Group had 29,053 (24,256) sharehold-
ers on December 31, 2007. A list of the biggest
shareholders is shown in the table on p. 22
The total institutional holding is 35-40%, while
the portion held by private individuals is approxi-
mately 10-15%. Holdings in the Nordic countries
amount to approximately 85%, with Sweden
accounting for 42%, Denmark 27% and Norway
16%. Holdings outside the EEA are approximately
5%, of which 4% are in the U.S. In 2007, U.S. hold-
ings increased marginally.
Monitoring of the SAS Group by analysts
The SAS Group is monitored by approximately 20
share analysts, 12 of whom are in Scandinavia and
maintain continuous contact with the company.
The SAS Group is also continuously monitored by
analysts in the sustainability sector.
The share
With a price rise of 36%, SAS Group shareholders saw a healthy return in the first half of 2007.
In the second half of the year the share was negatively impacted by the Q400 accidents,
record-high fuel prices and economic turmoil, which sent the share down 28.8% for the year.
SAS and the stock market
Excerpts from external analyses
”Management plans are sensible, if they
can be implemented. The performance
of core-SAS is creditable. Spanair’s sale could
help returns on capital. But, with more bad news
to crystallise, it looks too early to buy.
We have waited some time since the results
before publishing. This partly reflects the major
surgery required to the financial model but also
reflects a finely balanced decision on the recom-
mendation. We are sticking at Hold. SAS is much
closer to the perfect storm than other more
vociferous companies and in general we think
you should buy companies when they are awash
with bad news. Progress at the core SAS airline
has been decent and management has broadly
sensible plans. However, we think the risk of
further disappointments is rather greater than the
risk of missing out on material positive catalysts
that might give the share price some upward
momentum.
Andrew Lobbenberg, ABN Amro
February 13, 2008
”The postponement of the divestment of
SAS Ground handling has been broadly
viewed as a defeat for management. However,
we regard the postponement as timely because
the catalyst for increasing SAS profitability is not
blue-collar cost cutting; rather, we think cost-
cutting will be in the hands of its pilots. SAS’s future
success is linked closely to the block-hour utili-
sation of pilots and cabin crew. During the SARS
crisis, the pilots increased utilisation and other
unions followed suit; however since 2005, there
has been a standstill despite rapid changes in
the competitive landscape. Pilots and cabin crew
utilisation are still some 30% and 20% off the
mark compared with the initial goal set out in the
‘Turnaround 2005’ strategy.
Steven Brooker, Enskilda Securities
February 8, 2008
Share analysts who monitor the SAS Group
Scandinavian analysts Contact
ABG Sundal Collier Lars Heindorff
Carnegie Mikael Löfdahl
Danske Equities Johannes Möller
DnB Nor Markets Martin Huseby Karlsen
Enskilda Securities Steven Brooker
First Securities Hans Erik Jacobsen
Glitnir Mats Hyttinge
HSH Gudme Raaschou Bank Stig Nymann
Orion Securities Alexander Solovjov
Jyske Bank Michael Nielsen
Standard&Poor’s Finn Bjarke Petersen
Sydbank Jacob Pedersen
International analysts
ABN Amro Andrew Lobbenberg
Citigroup Andrew Light
Davy Stockbrokers Stephen Furlong
Dresdner Kleinworth Andrew Evans
Goldman Sachs Hugo Scott Gall
JP Morgan Chris Avery
Merrill Lynch Samanta Glieve
Morgan Stanley Penelope Butcher
Sustainability analysts
Storebrand Kapital Hege Haugen
Robur Anna Nilsson
GES Investment Services Martin Persson
SiRi Company Loubana Ait-si-ahmed

22 SAS Group Annual Report 2007
Share data
Top 15 shareholders in the SAS Group*
Dec. 31, 2007 Number of shares Holding
Swedish government 35,250,000 21.4%Danish government 23,500,000 14.3%Norwegian government 23,500,000 14.3%Knut and Alice Wallenberg Foundation 12,427,980 7.6%Unionen 2,917,600 1.8%SEB Funds 2,830,520 1.7%Första AP-fonden 2,678,459 1.6%National Bank of Denmark 2,289,294 1.4%Goldman Sachs International Ltd, W8IMY 2,219,370 1.3%Andra AP-fonden 2,102,764 1.3%Nordea Funds 1,677,718 1.0%Handelsbanken Funds 1,442,518 0.9%Livförsäkrings AB Skandia 1,340,100 0.8%SSB CL Omnibus OM07 1,318,057 0.8%Gamla Livförsäkrings- aktiebolaget 860,200 0.5%Other shareholders 48,145,420 29.3%
Total 164,500,000 100.0%
* Under Danish law, disclosure is permitted only when the stake
exceeds 5%.
Trading codes - share distributionISIN code SE0000805574
ShareReuters Bloomberg distrib.
SAS AB,Copenhagen SAS.CO SAS DC 55 mill.Oslo SASNOK.OL SAS NO 26 mill.Stockholm SAS.ST SAS SS 83 mill.
Number of Total number Par value/ NominalChange in share capital* Event new shares of shares shares SEK share capital
2001-05 Company registration 50,000 50,000 10 500,0002001-07 Non-cash issue 155,272,395 155,322,395 10 1,553,223,9502001-08 Non-cash issue 6,494,001 161,816,396 10 1,618,163,9602002-05 New share issue 2,683,604 164,500,000 10 1,645,000,000
* Before SAS AB was formed in May 2001 the SAS Group was listed through SAS Danmark A/S, SAS Norge ASA and SAS Sverige AB.
Key data per share, SEK 2007 2006 2005 2004 2003
Market capitalization, mill. 13,654 19,164 17,190 9,870 11,234No. of shares traded, mill. 223.8 153.6 150.0 100.8 71.7No. of shares, mill. 164.5 164.5 164.5 164.5 164.5Net income for the year after tax 3.87 28.10 1.06 –10.70 –9.63Cash flow from operating activities 17.42 12.78 9.16 –8.75 –7.09Dividend 0.00 0.00 0.00 0.00 0.00Dividend as % of earnings after tax 0% 0% 0% 0% 0%Book equity 104.13 99.49 69.93 67.09 78.40Share price at year-end 83.0 116.5 104.5 60.0 68.0Highest share price during the year 167.5 116.5 104.5 79.5 75.0Lowest share price during the year 83.0 72.25 62.5 48.4 27.4Average price 131.4 96.1 75.6 61.7 51.3Share price/equity at year-end 80% 117% 142% 88% 85%Dividend yield, average price 0.0% 0.0% 0.0% 0.0% 0.0%P/E ratio, average 34 3 71 neg negP/CE ratio, average 8 8 8 neg neg
Shareholders per exchange 2007 2006 2005
Copenhagen 22,586 17,891 17,355Oslo 1,597 1,572 1,239Stockholm 4,870 4,793 4,227
Total 29,053 24,256 22,821
No. of shares traded on respectivestock exchange (million) 2007 2006 Difference
Stockholm SE 147.5 70.1 111%Copenhagen SE 69.6 73.3 –5%Oslo SE 6.7 10.2 –34%
Source: Reuters
Share price performanceThe SAS share and a European industry average 2007Index = 100
The SAS share Index for market capitalization of European airlines, industry average Source: Reuters
60
70
80
90
100
110
120
130
140
150
DecNovOctSepAugJulJunMayAprMarFebJan
The SAS Group held over 100 meetings with investors, owners and analysts in 2007.
0
20
40
60
80
20072006200520042003
Personal meetings
Teleconferences
Group presentations
Analyst meetings
SAS Group’s level of activity in the capital market2003-2007Number of meetings
Average annual effective return for 1995-2007 was 4.5%.
The SAS share’s percentage of total trading on the Stockholm Stock Exchange increased sharply in 2007.
Sources: Stockholm Stock Exchange and the SAS Group.
0.00
0.05
0.10
0.15
0.20
0.25
0.30
20072006200520042003
Share of total trading, in Swedish kronor, of SAS Group shares on the Stockholm Stock Exchange, 2003-2007%
–40
0
40
80
07060504030201009998979695
Annual total return on SAS Group share%Distribution of shares Dec. 31, 2007 No. of shareholders No. of votes % of share capital % of all shareholders
1-500 20,012 3,849,748 2.3% 68.9%501-1,000 4,488 3,443,113 2.1% 15.4%1,001-10,000 4,127 10,883,488 6.6% 14.2%10,001-50,000 280 5,949,757 3.6% 1.0%50,001-100,000 61 4,364,135 2.7% 0.2%100,001- 85 131,572,394 80.0% 0.3%Unknown owners 4,437,365 2.7%
Total 29,053 164,500,000 100.0% 100.0%

23SAS Group Annual Report 2007
External factors, cycles, seasonal variations and risks
The SAS Group closely follows economic trends,
capacity trends, jet fuel prices and other conceiv-
able risks in order to quickly adapt its operations
and take advantage of the opportunities external
changes can provide. Passenger growth is nor-
mally approximately 2.5 times the growth rate of
global GDP and approximately 1.5 times that of
mature markets such as the Nordic countries.
The SAS Group has prepared routines covering
a range of events that the Group cannot control for
the purpose of minimizing the negative economic
effects.
The SAS Group monitors major macroeconomic
factors such as future growth forecasts, export
forecasts and consumer consumption forecasts in
its main market.
Forecasts and capacity changes
A major profitability factor that the airline industry
can affect is the seat capacity available in the
market.
Globally, approximately 1,100 aircraft were de-
livered in 2007 while 400 were taken out of service.
This is equivalent to a net increase of 3.4% of the
world’s total aircraft fleet, which is lower than the
anticipated 5% growth in global traffic.
In 2008-2011 net deliveries of aircraft are
expected to increase 3.9% annually. The capacity
increase in the number of available seat kilometers
will be somewhat higher, 5.4% during the period,
because the number of seats per aircraft is in-
creasing, primarily as a result of the introduction of
the Airbus A380.
Airports with capacity problems will be served
to a greater extent by the new Airbus A380. The
Airbus A380 is not expected to serve the Nordic
and Baltic countries. Instead, major airports in
Europe, which are approaching their maximum
capacity regarding total air transport movements
(takeoffs and landings), can solve their problems
by introducing these large aircraft.
The net addition in capacity will result in new
routes and more frequencies. Thanks to the huge
demand in Asia and the south Pacific region the
value of aircraft deliveries for these markets is
expected to exceed the corresponding value for
North America in the next 20 years. The growth of
new airlines has also changed the structure of the
European airlines. In the last 10 years, the number
of new nonstop routes in Europe has increased
by about 100%. Moving forward, direct connec-
tions from Europe to above all Asia are expected
to increase.
Seasonal variations and capacity management
The airline industry is increasingly adjusting its
capacity and flight schedules in line with seasonal
swings in demand. In general, demand is low in
SAS Group markets from December to February
and high from April to June and September to
November.
Demand can also deviate from the normal sea-
sonal pattern and vary between different markets.
The SAS Group has gradually developed sophisti-
cated methods to dynamically adjust capacity to
demand on a monthly and weekly basis, for exam-
ple in connection with major holidays.
Demand on intercontinental traffic flows also
varies. The number of passengers on U.S. routes
doubles from April to September. In 2007 the SAS
Group introduced a new strategy for capacity allo-
cation on intercontinental routes. As a result of the
new strategy, three new intercontinental routes,
of which two are seasonal, were opened. For
example, Dubai and Bangkok are winter program
destinations.
The capacity adjustments have made a major
contribution to higher profitability. The SAS Group
will continue to develop its dynamic adjustment of
capacity.
Risks
The SAS Group is working strategically to improve
its management of risks. Risk management com-
prises both sudden risks and known risks such as
changes in the price of oil or exchange rates. While
the Group monitors and manages the comprehen-
sive risks centrally, some risk management rests
with the subsidiaries and involves identification,
action plans and policies.
Since the airline industry is exposed to ex-
ternal factors such as acts of terrorism, war and
epidemics, great flexibility in the cost structure
is strategically important for handling declines in
demand. Greater flexibility will be ensured through
an even distribution of aircraft leases, alternative
production models (wet lease instead of in-house
production for expansion), flexible agreements
with personnel, improved planning processes and
volume-variable agreements. The SAS Group is
also exposed to risks in IT security and payment
security, see p. 17 and public confidence risks
relating to safety and the environment on p. 110
The airline industry is directly and indirectly affected by a large number of different external factors.
The SAS Group is working proactively to prepare and adapt its operations to deal with various external risks.
The number of passengers on SAS’s U.S. routes rises by over 100% from March to September, while the high season on the Asian routes is from November to December.
Seasonal variations on SAS’s U.S. and Asian routes%
U.S. Asia
0
20
40
60
80
100
120
DecNovOctSepAugJulJunMayAprMarFebJan
The SAS Group has worked strategically on adjusting its capacity more dynamically to demand. Together with com-mercial initiatives such as the introduction of one-way fares, the Group has succeeded structurally in increasing the pas-senger load factor by approximately 6 percentage points, to more than 72%.
SAS Group’s passenger load factor%
60
62
64
66
68
70
72
74
76
78
80
SepMayJan2007
SepMayJan2006
SepMayJan2005
Deliveries of aircraft - worldwide 1998-2011Number
Net deliveriesDeliveries Phased out
Forecast
0
300
600
900
1,200
1,500
1110090807060504030201009998

24 SAS Group Annual Report 2007
Geographic exposure
The Group is active in several markets and is
therefore affected by different economic cycles,
mitigating the Group’s exposure. On the other
hand, exposure to major global trends and events
does not change. Economic growth in 2007 was
still good in the countries where the SAS Group is
primarily exposed. The Group follows anticipated
developments and adjusts its production to ensure
the correct capacity in the market.
Jet fuel
The SAS Group’s policy is to hedge 40-60% of
its anticipated consumption of fuel in the coming
12-month period. In 2007 jet fuel accounted for
slightly more than 17% of the Group’s operating
costs compared with barely 9% in 1999. The SAS
Group’s exposure to changes in jet fuel prices has
increased in line with the rise in the world market
price due to lower other operating costs and focus
on airline operations.
For the entire airline industry jet fuel costs
now account for approximately 25% of operating
costs. The Group’s outlay for jet fuel amounted
to MSEK 8,104 (7,953). Adjusted for positive
currency effects owing to a weaker USD, fuel
costs rose by MSEK 811 due to higher prices
and increased volume. By hedging jet fuel, the
SAS Group was able to conduct its operations
with more predictability and avoid sudden price
movements.
Of its planned consumption in 2008 the SAS
Group has hedged 42%. Most of the hedging was
implemented through options and swaps.
The Group’s fuel strategy
Based on the SAS Group’s hedging of jet fuel in
December 2007 jet fuel costs may vary. To the
left is a table with different assumptions. The SAS
Group’s strategy for handling higher jet fuel prices
is based on three measures:
Hedging of jet fuel.
Yield management.
Price adjustments.
In 2006-2007 it was possible to neutralize most
of the cost increase through the above measures,
but should demand weaken in 2008 it will become
increasingly challenging to handle fuel cost in-
creases through yield management and/or price
adjustments.
Currency exposure
The Group is active internationally and is thus
exposed to different currencies. Transaction risk
arises during exchange rate fluctuations that af-
fect the amount of commercial revenues as well
as costs, thereby impacting the Group’s operating
income. Currency exposure is managed by hedging
on an ongoing basis 60-90% of the Group’s surplus
and deficit currencies based on a 12-month rolling
liquidity forecast.
The Group has a net deficit, mainly in USD
and DKK (see diagram below). In 2007 the USD
weakened against the Group’s largest surplus cur-
rencies: SEK, NOK and EUR. The SAS Group has
hedged approximately 68% of the USD deficit with
forward contracts and options in 2008.
Liquidity
To guarantee adequate payment capacity, finan-
cial preparedness shall be equivalent to 20% of the
SAS Group’s annual operating revenue. Credit risks
are divided among many players and to minimize
them transactions may be signed only with coun-
terparties with high creditworthiness, defined as
category A3/P-1 or better according to Moody’s.
For further information, see Note 29 p. 76
In 1999 jet fuel accounted for 9% of the SAS Group’s costs. The corresponding figure today is over 17%.
0
2
4
6
8
10
070605040302010099
Jet fuel costs vs. jet fuel prices SEK billion USD/tonne
0
200
400
600
800
1,000
Jet fuel cost (SEK) Jet fuel price (USD)
SAS Group’s jet fuel costs% of the Group’s costs
0
5
10
15
20
200720062005200420032002200120001999
Detailed overview of jet fuel hedging 2008
Q1 Q2 Q3 Q4
Options * 20% 14% 22% 30%Redemption price (USD/tonne) 664 713 881 827Swaps 7% 8% 10% 13%Price (USD/tonne) 708 706 702 8293-way ** 16% 16% 5%Price (USD/tonne) 723 781 800
Estimated jet fuel cost 2008 * SEK billion
6.5 6.75 7SEK/USD SEK/USD SEK/USD
600 USD/tonne 7.1 7.4 7.7800 USD/tonne 8.8 9.1 9.51000 USD/tonne 10.2 10.7 11.0
* Pertains to the full-year values for SEK/USD and the jet fuel price per tonne. The SAS Group’s hedging of jet fuel at Decem-ber 31, 2007, was taken into consideration.
The SAS Group’s largest deficit currency is USD because major expenses such as jet fuel and leasing charges are paid in USD. The most important surplus currencies are NOK and EUR.* Includes Spanair.
Currency breakdown in the SAS Group 2007*MSEK
Revenue Net, MSEKCosts
–20,000
–15,000
–10,000
–5,000
0
5,000
10,000
15,000
20,000
OtherLVLGBPSEKEURNOKDKKUSD
–14,100
–900
5,900 5,6002,100
2,2001,200 800
Surplus currenciesDeficit currencies
* Excluding premium.** 3-Way Option has a hedging ceiling of 800-900 tonnes/USD.

25SAS Group Annual Report 2007
Insurance coverage
The SAS Group’s airline insurance contracts are
of the all risks type and cover the aircraft fleet,
spare parts and other technical equipment as
well as liability exposure associated with airline
operations. Airline insurance costs fell in 2007 by
slightly more than 20% and amounted to approxi-
mately MUSD 27 (35).
Comments on the Group’s sensitivity analysis
Airline operations
A 1% increase in passenger traffic represents
approximately MSEK 310 in increased operating
revenue for the SAS Group. In general a 1% in-
crease of the passenger load factor is worth more
for profitability if the yield drops by 1% at the same
time. A 1% change in the yield, all else being equal,
affects earnings by approximately MSEK 390.
Net currency effect and interest rate sensitivity:
The SAS Group’s largest deficit currency is USD
due to aircraft leasing and jet fuel costs. A 1% ap-
preciation of USD would negatively impact the SAS
Group’s earnings by MSEK 140 per year before
currency hedging. Because a USD gain often leads
to higher fares the net effect is limited.
Reporting of pension plans
The SAS Group has applied IAS 19 for reporting
the Group’s defined benefit pension plans since
1996. The reporting of the size of the pension
commitments is based on set parameters regard-
ing interest, inflation, salary increases, etc.
Any actuarial gains and losses are amortized
according to the remaining earning period, 15
years, in the pension plans. Due to changes in
market assumptions the decision was made to
lower the assumptions regarding the rate of return
beginning January 1, 2007, by 1 percentage point
in Sweden and Denmark and 1.5 percentage
points in Norway. Overfunding exists in several
of the SAS Group’s pension plans, which means
that as of December 31, 2007, the SAS Group
had a positive difference of MSEK 1,516 between
funded assets and commitments. For detailed
information see Note 18 on p. 73
Taxes
The SAS Group has approximately MSEK 4,300
in unutilized tax loss carryforwards in continu-
ing operations. This means that the SAS Group
will not have tax payable until these loss carry-
forwards have been utilized, which will have a
positive impact on cash flow in future periods.
Deferred tax receivables have been recognized for
approximately 83% of the accumulated loss carry-
forwards.
F.A.Q
- Frequently asked questions
”Why does the SAS Group have so
many different types of airplanes?
The SAS Group serves markets with widely
fluctuating traffic volumes. To be able to offer
more frequencies different sizes of aircraft
are necessary. If SAS were to use only one
type of aircraft many destinations could not
be served. Alternatively, the number of fre-
quencies would be reduced and/or capacity
utilization measured as passenger load factor
would decline, resulting in higher costs and
higher fares. The SAS Group attempts to bal-
ance the need for a broad selection of routes
with a smaller number of aircraft types. This is
part of the Group’s fleet strategy.
”Why must the SAS Group reach
earnings of SEK 4 billion?
Enabling the SAS Group to finance future
capital expenditures on the aircraft fleet,
customer offerings and employees and pro-
vide a reasonable return to its shareholders
requires annual earnings of approximately
SEK 4 billion. This is equivalent to an EBT
margin of 7%.
”How will the SAS Group achieve its
20% growth target by 2011?
The growth rate is equivalent to 5% per year,
which is only slightly higher than the an-
ticipated market growth rate. Growth will be
achieved through a combination of new air-
craft orders and short and long-term aircraft
leasing. However, the growth must be profit-
able and requires the SAS Group to recapture
market share.
SAS Group’s sensitivity analysis
Approximate relations between main operational key figures for Scandinavian Airlines and the SAS Group’s financial and environmen-tal result. While the impact on earnings cannot be totaled it illustrates the earnings sensitivity (excl. hedging of currency and fuel) for Scandinavian Airlines and the Group, respectively, in the current situation.
SAS Scandinavian GroupAirline operations, annual effects Airlines total
Passenger traffic 1% change in RPK, MSEK 260 310
Passenger load factor 1 percentage point change in passenger load factor, MSEK 350 430
Unit revenue (Yield) 1% change in passenger revenue per passenger km, MSEK 330 390
Unit cost 1% change in airline operations’ unit cost, MSEK 290 340
Jet fuel 1% change in the price of jet fuel, MSEK 70 80
1% change in consumption of jet fuel, equivalent tonnes of CO2 (000) 41 62
Aircraft
1 short and medium-haul aircraft out of service, earnings impact per day, MSEK –0.25
1 long-haul aircraft out of service, earnings impact per day, MSEK –1.0
Net currency effect and interest rate sensitivity, MSEK
Revenues and 1% weakening of SEK against USD –140expenses 1% weakening of SEK against NOK 60
1% weakening of SEK against DKK –10
1% weakening of SEK against EUR 55
1% weakening of SEK against LVL 10
1 percentage point decline in average interest rate 14

26 SAS Group Annual Report 2007
SAS Group’s fleet by airline
Scandinavian AirlinesInternational
Airbus A340/A330
Widerøe
deHavilland Q100/300
Scandinavian AirlinesDanmark
Airbus A321/A319
Boeing MD-80
Scandinavian Airlines Sverige
Boeing 737
Boeing MD-80
Scandinavian Airlines Norge
Boeing 737
Fokker F50
Blue1
Avro RJ
MD-90
airBaltic
Boeing 737
Fokker F50
The aircraft fleet
Q400 taken out of service
On October 28 the SAS board decided to per-
manently ground the Q400. For the time being
Scandinavian Airlines Danmark and Scandinavian
Airlines Sverige have replaced Q400-capacity with
flight schedule changes and wet leased aircraft
from other airlines. Over the next few years the
majority of the Q400s that previously served Scan-
dinavian Airlines Danmark should be replaced by
other aircraft. Scandinavian Airlines Sverige will re-
place its Q400s primarily with Boeing 737s and an
amended route structure. Widerøe will likely phase
the new generation Q400 into its fleet.
The Q400s previously operated by Scandinavi-
an Airlines and Widerøe are currently undergoing
upgrading, and will be sold to operators outside
the SAS Group as the aircraft are finished.
Renewal of SAS’s aircraft fleet
Estimates, which do not take economies of scale
into consideration, show that the MD-80 has
MSEK 5-10 higher profitability than aircraft pro-
duced today. The capital cost is MSEK 20 lower for
the MD-80, while fuel and maintenance costs are
MSEK 10-15 higher. The lower capital cost also
provides a cost advantage when matching produc-
tion to seasonal demand.
The MD-80 and Boeing 737 Classic have no
technical limitations. The MD-80 fleet has a long
remaining useful life of 10-15 years. The MD-80
is a very well-designed, highly reliable aircraft but
has certain limitations in meeting today’s strict-
est noise requirements. Hush kits are now on the
market, and SAS is testing them.
With respect to fuel consumption, the fuel price
can double without the seat cost for the aircraft
becoming more expensive than what it is for newly
manufactured aircraft in the same size class.
More than a third of Scandinavian Airlines MD-80
fleet has been phased out since 2001. Economic
trends, environmental considerations and techno-
logical development will determine the pace of the
phase-out.
The research and technological developments
taking place at aircraft and engine manufacturers
indicate that a new generation of short- and
medium-haul aircraft featuring approximately
20% lower fuel consumption compared with
today’s best aircraft may be ready before 2015.
After investing approximately SEK 36 million in
new aircraft from 1998 to 2004 the Group is in the
midst of a period of low expenditure. At the end of
2007 the SAS Group had firm orders for aircraft
valued at MUSD 176 (MUSD 109).
The number of aircraft in the SAS Group increased in 2007 from 255 to 260. Three new Boeing 737s will
be delivered in 2008 at the same time as the replacement of the already phased out Q400s will start.
Average age of the SAS Group’s total MD-80 fleet is 18.4 years. However, the cost per seat is lower than for Boeing 737s since low capital costs will offset somewhat higher fuel and mainte-nance costs
Cost comparison per seat,Boeing 737 vs. MD-82
Capital cost
Ground handling
Landing fees
Navigation fees
Cabin crew
Pilots
Fuel
Maintenance
Boeing 737-700(141 seats)
MD-82(150 seats)
SAS Group’s total aircraft fleet, December 2007.For technical information about the fleet p. 116
Average age Owned Leased Wet leased Total Leased out Order
Airbus A330/A340 5.6 5 6 11
Airbus A321/A320/A319 4.0 4 8 12
Boeing 737-series 10.2 20 70 90 4 5
McDonnell Douglas MD-80-series 18.4 13 44 57 13
McDonnell Douglas MD-90 10.9 8 8 3
BAE Systems Avro RJ-70/85/100 8.6 9 4 13
Fokker 50 18.1 14 14
Bombardier Q-series* 9.9 17 34 51
Bombardier CRJ200 7.5 4 4
Total 11.6 67 185 8 260 20 5
By airline
SAS Scandinavian Airlines 11.3 198 20 5
Widerøe 12.5 28
Blue1 6.2 13
airBaltic 15.5 21
Total 11.6 260 20 5
* Includes 27 deHavilland Q400s taken out of service.The wet leased aircraft include only the aircraft leased for a longer period of time.

27SAS Group Annual Report 2007
Financing, investment, liquidity & capital employed
Financing
The SAS Group uses commercial paper, bank loans,
bond issues, subordinated loans and leasing as
sources of financing. No new borrowing took place
in 2007. Aircraft-related sale and leaseback trans-
actions brought in a total of MSEK 1,407.
At the opening of 2007 the SAS Group had
MSEK 5,336 in unutilized credit facilities. In the
first quarter of 2007 a MUSD 156 loan was rene-
gotiated to a credit facility maturing in 2011. Fur-
thermore, a one-year credit facility of MSEK 500
was renegotiated to a three-year MSEK 250 facil-
ity. At the end of 2007 the Group had contracted
credit facilities of MSEK 6,345, of which MSEK
6,098 (5,336) was unutilized.
At the end of 2007 the SAS Group’s interest-
bearing debt amounted to MSEK 12,042 (16,478),
of which approximately MSEK 4,600 matures
in 2008. In addition to planned amortization of
MSEK 1,940, loans equivalent to MSEK 2,760
were amortized in advance. Approximately MSEK
1,000 of the early amortization pertains to repur-
chases of bond issues maturing in 2008. The rest
of the change in interest-bearing liabilities is pri-
marily attributable to exchange-rate fluctuations.
Fixed rate period
On December 31, 2007, the SAS Group’s financial
net debt amounted to MSEK 1,231. The fixed rate
period of the net debt is kept between one and six
years. Various types of derivative instruments such
as long-term interest rate swaps, FRAs and futures
are used to adjust fixed rate terms. The average
interest rate maturity varied during the year, but
was an average of approximately 3.9 years.
Creditworthiness
The SAS Group shall maintain a level of indebted-
ness that over the long term permits the Group to
be viewed as an attractive borrower. The goal is to
have an “Investment Grade” credit rating. The SAS
Group has financial targets for equity/assets and
debt/equity ratios. The adjusted equity/assets
ratio improved in 2007, amounting at year-end to
24% (22%).
The financial net debt of MSEK 1,231 decreased
by MSEK 2,903 during the year. At the end of
2007 the SAS Group’s lease-adjusted financial net
debt (7 x annual leasing costs) relative to share-
holders’ equity was 142% (168%).
Standard & Poor’s has been rating the SAS
Group’s credit since September 2007. SAS was
assigned a long-term rating of BB with stable out-
look. At the end of October Standard & Poor’s
revised its outlook for the Group’s creditworthi-
ness from stable to negative. Moody’s did not
revise its assessment of the SAS Group’s credit-
worthiness in 2007; its rating is still B1 with stable
outlook. The Japanese rating institute Rating and
Investment Information Inc. also rates the SAS
Group’s credit, which during 2007 had a long-
term rating of BB+.
Investment and investment needs
Investment for the year amounted to MSEK 2,683
(2,299), of which aircraft, other flight equipment
and prepayments accounted for MSEK 1,730.
During 2007 the SAS Group purchased three
Boeing 737s, two A319s and one A321. Five of
these aircraft were later included in sale and lease-
back transactions.
Expenditures will increase in the future, primarily
due to the replacement of the Q400 fleet. In the
slightly longer term expenditures will also increase
when the MD-80 and Boeing 737 are replaced.
Environmental investment
During 2007 the SAS Group’s environment-re-
lated expenditures amounted to MSEK 39 (66).
Most of these are attributed to an investment of
MSEK 24 in winglets for 5 aircraft and MSEK 15 for
GPS equipment.
Operating lease commitments
The capital market uses a multiple of seven in calcu-
lations of relevant key figures, including in regard to
debt/equity ratios. In the loan market, the present
value calculation is more relevant since it measures
contracted leasing commitments. At the end of
The SAS Group’s financial key figures were strengthened in 2007 thanks to a positive cash flow and continued releasing of
capital. The airline industry is capital intensive and financing is an important part of the SAS Group’s operations.
In 2007 the Group amortized MSEK 4,700. Early amortization amounted to MSEK 2,760 and planned amortization totaled MSEK 1,940 during the year.
Amortization of interest-bearing liabilities, Dec. 31, 2007MSEK
0
1,000
2,000
3,000
4,000
5,000
>20161514131211100908
4,600
500
2,700
900
400100100
1,100900
The SAS Group’s financial key figures continued to improve in 2007.
Debt/equity ratio and adjusted equity/assets ratio% %
Adjusted equity/assets ratio (right)
Debt/equity ratio (left)
Adjusted financial net debt (x7)/equity (left)
0
50
100
150
200
250
300
350
0
5
10
15
20
25
30
35
200720062005200420032002
The SAS Group’s cash flow from operating activities improved further in 2007 by MSEK 764, but has to increase even more in the future to enable the Group to undertake new investment.
Cash flow from operating activities, 1998-2007MSEK
–2,000
–1,000
0
1,000
2,000
3,000
4,000
07060504030201009998
Rating in the airline industryMoody’s Standard & Poor’s
Southwest Airlines Baa1 A–
Qantas Baa1 BBB+
Lufthansa Baa3 BBB
British Airways Baa3 BBB–
Japan Airlines B+
All Nippon Airways Baa3 BB+
SAS Group B1 BB
Northwest Airlines B1 B+
Delta Air Lines B2 B
Continental B2 B
American Airlines B
United Airlines B
US Airways B3 B–
Air Canada C B

28 SAS Group Annual Report 2007
2007, the Group’s capitalized leasing cost (x 7) was
MSEK 24,304 (24,682) and the present value of
the leasing contracts was MSEK 12,496 (12,748).
Distribution of owned and leased aircraft
At December 31, 2007, the market value of the
SAS Group’s owned and leased aircraft amounted
to approximately SEK 39.4 (39.4) billion. The SAS
Group has prepared guidelines concerning the
composition of owned and leased aircraft. The
most important criteria are assessments of capital
costs, residual value risk and operational flexibility.
An airline can carry out the same operations with
an aircraft fleet consisting solely of owned aircraft,
solely of leased aircraft, or a mixture. The SAS
Group decides to own or lease aircraft on the basis
of a number of parameters, which are defined in a
fleet policy:
Operational flexibility. The norm is that 75% of
the fleet is to be leased, and that it should be
possible to sell 10% of the fleet each year.
Market value risks. Owned aircraft should have
an expected high residual value and be readily
leased or sold. The norm is to own aircraft val-
ued at under MSEK 25,000.
Interest risks, management of floating and fixed
interest rates. A 1% interest rate increase must
not yield increased annual leasing costs of
more than MSEK 135.
Foreign exchange risks arise through the owner-
ship of aircraft, since these assets are valued in
USD, while their book value is in SEK. By borrow-
ing in USD this asset base is protected from unfa-
vorable exchange rate movements. The Group’s
norm is to maintain a level of USD indebtedness
equivalent to 50% of the book value of the aircraft
fleet.
Financial preparedness
The SAS Group has chosen to maintain a high
level of financial preparedness in the form of liquid
assets and contracted unutilized credit facilities
since its risk of exposure to external events is high.
The goal is for financial preparedness to amount to
a minimum of 20% of the SAS Group’s operating
revenue, of which at least half is to be held in liquid
assets. On December 31, 2007, financial prepared-
ness amounted to MSEK 15,091, with liquid assets
amounting to MSEK 8,993 and unutilized credit
facilities totaling MSEK 6,098. This provides a finan-
cial preparedness level of 24%. The SAS Group’s
liquid assets shall be held in instruments with ad-
equate liquidity or short maturity with a credit rating
of no lower than A3/P-1 according to Moody’s.
Releasing capital
Moving forward the SAS Group will focus mainly
on strategic divestments. In 2007 the SAS Flight
Academy and Newco companies were sold. The
remaining shares in Rezidor Hotel Group were
also divested and these sales boosted the Group’s
cash flow by approximately MSEK 1,300. Sale and
leaseback transactions for three Boeing 737s, one
Airbus A321 and two Airbus A319s were imple-
mented at a total sale price of MSEK 1,407. Five of
these aircraft were acquired in 2007. One Dash 8
Q100 was also sold in 2007 for MSEK 46.
In 2006, 26 aircraft were sold and the Rezidor
Hotel Group was divested. These transactions
represent a financial contribution of MSEK 8,552.
Cash flow and working capital
2007’s cash flow from operating activities
amounted to MSEK 2,866. MSEK 2,177 consists
of cash flow from operating activities and MSEK
689 from the reduction in tied-up working capital.
The SAS Group has a positive working capital,
the net value of which amounted to approximately
SEK 9.2 (7.5) billion as of December 2007. Work-
ing capital improved in 2007 by MSEK 1,400
mainly owing to efforts to achieve efficient man-
agement of working capital.
From 1998 to 2004 the SAS Group made large capital expenditures on aircraft. In 2006 the Group sold Rezidor Hotel Group, which explains the sales value.
Total investment and divestments, 1997-2007MSEK
Total investmentTotal divestments
0
4,000
8,000
12,000
0706050403020100999897
Operational flexibility, lease maturityNumber %
Operational flexibility, number
Operational flexibility, %
0
22.5
45.0
67.5
90.0
0
7.5
15.0
22.5
30.0
2014<201320122011201020092008
A high percentage of leased aircraft with an even maturity profile in combination with owned aircraft that can be readily disposed of decreases business risk. It also provides an op-portunity to quickly adjust the size of the fleet to new operat-ing conditions.
The SAS Group’s norm is that 75% of the fleet is to be leased, and that it should be possible to sell 10% of the fleet each year.
Market valueleased aircraftSEK 29.3 billion
Market valueowned aircraftSEK 10.1 billion
Breakdown of the SAS Group’s total aircraft fleetAs of December 31, 2007
Existing committed credit facilities for the SAS Group at December 31, 2007
MSEK Total Utilized Unutilized Maturity
Revolving credit facility, MEUR 366 3,467 - 3,467 2010
Revolving credit facility, MNOK 98 116 - 116 2011
Revolving credit facility, MUSD 156 1,008 - 1,008 2011
Bilateral bank facilities 500 - 500 2011
Bilateral bank facilities 500 - 500 2009
Bilateral bank facilities 250 - 250 2010
Other facilities 504 247 257 2008-2009
Total 6,345 247 6,098
Aircraft on firm order Total 2008 2009 2010
CAPEX (MUSD) 176 120 56 0
Number of aircraft 5 3 2 0
Leasing, MSEK 2007
Capitalized leasing costs (x 7) 24,304
Leasing costs (NPV) 12,496

29SAS Group Annual Report 2007
We’re proud of our customer offerings, and now we’re becoming even better
The offerings are based of giving the customers flexible and
value-for-money air travel with great freedom of choice between different products
- completely depending on the customer’s need for flexibility and comfort.

30 SAS Group Annual Report 2007
SAS Scandinavian Airlines
The business area comprises Scandinavian
Airlines Norge, Scandinavian Airlines Danmark,
Scandinavian Airlines Sverige and Scandinavian
Airlines International. SAS Scandinavian Air-
lines System was founded in 1946 with the first
intercontinental flight to New York. In 2004 the
operations in Denmark, Norway and Sweden
were incorporated, while interncontinental flights
were organized in the business unit Scandinavian
Airlines International. Scandinavian Airlines was
a founding member of Star Alliance in 1997 and
cooperates with several other partners to offer the
best possible network.
In 2007 25.4 million passengers flew with
Scandinavian Airlines. Business area airlines serve
126 destinations in Scandinavia, the rest of Europe,
North America and Asia. The business area is the
Group’s largest, with 65% of gross revenue in
2007.
Customers and loyalty program
SAS Scandinavian Airlines has designed product
concepts to give both business and leisure travel-
ers the most freedom of choice. In 2007 several
new services were introduced that improved our
customer offerings, such as Fast Track, improved
service onboard, more frequent flights and better
matching of capacity to demand. In 2008 several
new destinations, tailored primarily to leisure
travel, will be opened.
EuroBonus is SAS Scandinavian Airlines’ loyalty
program and had 2.7 million members at year-
end. During the year the number of members
increased by 1.9%. In 2007 new agreements were
signed with Shanghai Airlines, which joined Star
Alliance in December 2007. An agreement was
also signed with SIXT car rental.
Owing to the incidents involving the Q400 the
quality of the survey of customer satisfaction could
not be assured, which is why this will be reported
later this year.
SAS has already taken actions primarily to deal
with the gap between customer-perceived punc-
tuality and actual punctuality.
Traffic results
SAS Scandinavian Airlines’ overall traffic fell 0.7%
in 2007. Since capacity fell by 0.3% at the same
time, this resulted in somewhat lower utilization
and passenger load factor, which amounted to
74.1%. The yield was very strong during the first
half of 2007, stabilizing in the second half. In all the
yield increased by 6.5%. During the year, Scan-
dinavian Airlines opened 18 new routes, of which
three were intercontinental.
Punctuality and regularity
Scandinavian Airlines’ goal is to be Europe’s most
punctual airline. In 2007 the targets for punc-
tuality or regularity could not be met. This was
primarily due to labor conflicts in March-June and
to logistics problems involving technical mainte-
nance as well as the accidents involving the Q400.
Punctuality within 15 minutes amounted to 79.3%
(78.1%). The target for punctuality is an average
of 90%. Punctuality on arrival was 80.6 (78.4)%.
The target for regularity, the percentage of non-
canceled flights, is 99% in the summer months
and 98% in the winter months. In 2007 an average
regularity of 97.6% (97.8%) was attained.
Sustainability
During the year the positive trend was amplified
that characterized the business area’s sustainabil-
ity work during the entire 2000s. Fuel efficiency
was the best in the history of the operation. This
means that the carbon dioxide emissions con-
nected with this fell further compared with the
previous year.
Business area
The carriers making up SAS Scandinavian Airlines are aimed at both business and leisure travelers. The product concepts have
been designed to offer the most freedom of choice. All together the airlines in the business area had 185 aircraft and flew to
126 destinations with an average of 822 daily departures in 2007.
Intra-Scandinavian 3.5 (1.2%)
Danishdomestic 0.8 (–3.8%)
Intercont. 1.3 (–4.7%)
Norwegiandomestic 7.4 (3.2%)
Swedishdomestic 3.2 (0.9%)
Europe 9.2 (1.1%)
Scandinavian Airlines traffic breakdown in 2007,million passengers and change from 2006
The largest percentage of passengers is carried on short and medium-haul routes in Europe.
Responsible for the business area:
Deputy CEO & COO
John S. Dueholm
Summary statement
of income, MSEK 2007 2006 2005
Passenger revenue 33,031 31,603 29,810
Revenue 40,155 38,631 36,859
EBIT before nonrecur. items 1,999 1,919 279
EBIT margin before nonrecurring items 5.0% 5.0% 0.8%
EBT before nonrecur. items 1,765 1,252 –374
Detailed statement of income and more key figures p. 45
E-ticket Self-service and Internet check-in
E-ticket, % Self-service and Internet check-in, %
0
20
40
60
80
100
30
40
50
60
SepMayJan2007
SepMayJan2006
Block hours 2007 2006 2005
Scandinavian Airlines Norge Pilots 583 560 550 Cabin 599 604 584
Scandinavian Airlines Danmark Pilots 549 536 533 Cabin 627 628 611
Scandinavian Airlines Sverige Pilots 562 581 544 Cabin 620 679 701
Scandinavian Airlines International Pilots 586 574 600 Cabin - - -

31SAS Group Annual Report 2007
Naples
Brussels
Stockholm
Rome
Nice
Zurich
London
Haugesund
Lisbon
Oslo
Amsterdam
Dublin
Milan
Manchester
Kirkenes
Tromsø
Bodø
Bergen
Aberdeen
Alta
Barcelona
Alicante
Palma deMallorca
Malaga
Berlin
FrankfurtParis
Düsseldorf
Stavanger
Longyearbyen
Ålesund
Trondheim
Kristiansand
MoldeKristiansund
Harstad/Narvik
Bardufoss
Sandefjord
Reykjavik
Athens
Chania
Gran Canaria
Lakselv
Madrid
Copenhagen
Tenerife
GdanskBristol
Seville
Venice
Lyon
Cagliari
Palermo
Valencia
Bilbao
Malta
Madeira Ibiza
Scandinavian Airlines Norge
Important events in 2007
SAS Braathens changed its name to Scandina-
vian Airlines Norge.
New routes were opened between Oslo-London
City and Ålesund-London Gatwick.
The Norwegian Data Inspectorate gave its
permission to use biometrics to check whether
passengers who check in baggage also board
their flight. Biometrics were introduced on all
Norwegian domestic routes in November.
A leisure market product featuring low fares to
vacation destinations in Europe was launched.
So far, the decision has been made to open 14
new routes in 2008.
Scandinavian Airlines Norway was found guilty
of using sensitive business information from its
competitor Norwegian.
Scandinavian Airlines Norge has been a wholly
owned subsidiary in the SAS Group since 2004.
The result of the merger of Braathens and Scan-
dinavian Airlines in Norway, Scandinavian Airlines
Norge is the market leader in domestic routes in
Norway and is also a significant operator in busi-
ness destinations in Europe and leisure destina-
tions in Southern Europe. Starting January 2008
Scandinavian Airlines Norge will be responsible
for approximately 50% of the flights between
Oslo and Copenhagen. The airline coordinates the
Group’s sales operations in Norway. The company
has 2,465 FTEs and operates 340 flights daily.
Targets
The Group’s profitability requirement is an EBIT
margin of at least 9%.
The environmental target for 2011 is an index
of 87. p. 111
Market performance
Scandinavian Airlines Norge’s earnings in 2007
were a distinct improvement compared with the
preceding year and the company was not far from
meeting the Group’s profitability requirement.
The positive trend was primarily driven by a strong
economy, which was apparent in the number of
passengers and increased business travel. The
domestic market remains favorable, with good
growth. To meet the demand for leisure travel,
Scandinavian Airlines Norge has so far launched
14 new selected destinations in this segment. At
the same time unprofitable routes were consoli-
dated and adjusted to a certain extent.
Traffic and earnings
Scandinavian Airlines Norge’s total traffic in-
creased by 0.1% in 2007 with passenger volume
up by 1.8%, primarily because of the expansion
of Norwegian domestic traffic, which saw the
number of passengers increase by 3.2%. Total
capacity decreased during the year by 1.1% after
some less profitable routes were closed, a move
that brought the passenger load factor up by 0.8
percentage points to 69.6%.
Revenue increased in 2007 by 6.6%, totaling
MSEK 13,411. The increase is due to more pas-
sengers and a 6.5% rise in the yield. Operating
expenses amounted to MSEK 11,366, an increase
of 1.8%, which was due to higher technical main-
tenance and pension costs. The unit cost rose by
2.3%. Though Scandinavian Airlines Norge has no
Q400s it was adversely affected by the realloca-
tion of aircraft to Scandinavian Airlines Sverige and
Scandinavian Airlines Danmark.
Market outlook
Norway’s overall market grew 7% in 2007. Though
the strong growth is expected to continue, the
pace will be somewhat slower in 2008, with the
European routes noting the biggest increases. Stiff
competition and pressure on prices look set to con-
tinue. In Norway a total annual market growth rate
of 3-4% is anticipated for the next few years.
Scandinavian Airlines Norge carried 10.2 million passengers in 2007, of which 0.5 million traveled by charter.
The company flies to 43 destinations. Scandinavian Airlines Norge’s aircraft fleet consists of 54 Boeing 737s
and six Fokker F50s.
EBIT margin
Outcome Profitability target
7.7% 9.0%
Scandinavian AirlinesNorge 21.3%
Share of Group revenue
Internet 37%
Telephone 10%
Agents 53%
Booking channels in 2007
New route in 2008
CEO Ola H. Strand
www.sas.no
Key figures, MSEK 2007 2006 2005
SAS Group’s holding 100% 100% 100%
Share of the home market 60% 61% 65%
Average no. of employees (of which 44% women) 2,465 2,604 2,840
Revenue 13,411 12,579 12,258
EBIT before nonrecur. items 1,038 396 621
EBIT margin before nonrecurring items 7.7% 3.1% 5.1%
EBT before nonrecur. items 1,057 404 630
Environmental index 91 93 100
More key figures p. 45

32 SAS Group Annual Report 2007
Lyon
Palanga
Brussels
Stockholm
Rome
Nice
Munich
Stuttgart
Zurich
Tampere
HanoverLondon
Birmingham
St. Petersburg
Gdansk
Aalborg
Århus
Bologna
Athens
Oslo
Amsterdam
Dublin
Milan
Warsaw
Helsinki
Manchester
Bergen
Aberdeen
Madrid
Copenhagen
FrankfurtParis
Düsseldorf
Geneva
Stavanger
HamburgPoznan
Kristiansand
Venice
Arvidsjaur
Luxembourg
Cologne
Nuremberg
Moscow
Gothenburg
Kangerlussuaq
Turku
Pristina
Prague
Vienna
Ålesund
Kiev
Bucharest
Berlin
EBIT margin
Outcome Profitability target
9.0%3.7%
Internet 35%
Telephone 5%
Agents 60%
Booking channels in 2007
Scandinavian AirlinesDanmark 18.5%
Share of Group revenue
Scandinavian Airlines Danmark
Important events in 2007
Blizzards in February resulted in four days of
major traffic problems, leading to 469 canceled
departures.
Wildcat strikes among cabin crew resulted in
98 canceled departures on March 21 and 702
canceled departures on April 24-27.
In August the Board of the SAS Group decided
to move half of the production on the Oslo-
Copenhagen route to Scandinavian Airlines
Norge, to guarantee reliable service to custom-
ers.
In September-October three Q400 aircraft
crash-landed owing to problems with the land-
ing gear. No one was injured in the accidents.
New routes to Greenland opened on a seasonal
basis.
In October the Group Board decided to per-
manently ground the Q400s, and 16 of Scan-
dinavian Airlines' 50 aircraft were withdrawn
from service.
Scandinavian Airlines Danmark has been a wholly
owned subsidiary in the SAS Group since 2004.
The airline leads the market in traffic to, from and
within Denmark. All sales in Denmark for all Group
airlines are coordinated by Scandinavian Airlines
Danmark. The airline will develop Copenhagen as
a hub for traffic between Northern Europe and the
rest of the world.
Scandinavian Airlines Danmark has 2,188
FTEs and operates 271 flights daily. In 2007 the
airline carried 8.1 million passengers in scheduled
service (8.7 million including charter) with a fleet
numbering 43 aircraft, including wet lease.
Targets
The Group’s profitability requirement is an EBIT
margin of at least 9%.
The environmental target for 2011 is an index
of 87. p. 111
Market performance
In 2007 Scandinavian Airlines Danmark showed
very strong underlying earnings improvement.
Despite the accidents involving the Q400 the
improvement was considerable compared with
the previous year and is explained by a higher yield
and expanded charter activity, resulting in higher
traffic revenue. The expanded charter operation
is enabled by greater aircraft utilization, which
also helped to boost productivity for the pilots.
The company is working continuously on other
productivity improvements and well-balanced
revenue control.
Traffic and earnings
In 2007 Scandinavian Airlines Danmark's pas-
senger traffic fell by 1.4% and the number of
passengers by 1.6%. At the same time capacity
rose by 1.5% owing to the opening of two new sub-
stantially longer routes to Greenland and Pristina.
The passenger load factor deteriorated by 2.1 per-
centage points to 70.0%. Traffic rose during the
year on Danish domestic by 9% thanks to the new
seasonal route to and from Greenland.
Revenue increased in 2007 by 6.7%, totaling
MSEK 11,659. Operating expenses amounted
to MSEK 10,505, an increase of 5.6%, owing to
higher jet fuel prices and higher capacity.
The unit cost fell by 4.5%. Earnings include
MSEK 116 in compensation from the Confedera-
tion of Swedish Enterprise for the pilots’ conflict in
2006. The Q400 situation had a profoundly nega-
tive impact on earnings in 2007.
Market outlook
The overall market in Denmark grew by 5% in
2007. The increase pertained to local traffic, while
transfer passenger volume shrank. The market
outlook for air travel is still favorable, and Scandi-
navian Airlines Danmark is expected to grow and
bolster its market position.
Scandinavian Airlines Danmark carried 8.7 million passengers in 2007, 0.6 million of whom traveled by charter. The airline flies
to 51 destinations. Scandinavian Airlines Danmark's aircraft fleet consists of 12 Airbus A321/319s and 26 MD-80s.
New route in 2008
CEO Susanne Larsen
www.sas.dk
Key figures, MSEK 2007 2006 2005
SAS Group’s holding 100% 100% 100%
Share of the home market 45% 47% 49%
Average no. of employees (of which 57% women) 2,188 1,983 1,628
Revenue 11,659 10,924 10,263
EBIT before nonrecur. items 433 186 –618
EBIT margin before nonrecurring items 3.7% 1.7% –6.0%
EBT before nonrecur. items 459 182 –615
Environmental index 94 98 100
More key figures p. 45

33SAS Group Annual Report 2007
Tromsø
Budapest
Riga
Munich
Bristol
Reykjavik
Malaga
Glasgow
Gothenburg
Trondheim
Bergen
Moscow
Tallinn
Brussels
Stockholm
Rome
Nice
Zurich
St. Petersburg
Kiruna
Luleå
UmeåÖrnsköldsvik
Östersund
ÄngelholmHelsingborg
Athens
Prague
Oslo
Amsterdam
Dublin
Milan
Helsinki
ManchesterCopenhagen
Berlin
FrankfurtParis
Düsseldorf
Geneva
RonnebyMalmö
KalmarEdinburgh
Växjö
Skellefteå
Hamburg
Sundsvall
Istanbul
London
Palma deMallorca
Vienna
Barcelona
Stavanger
Split
Zagreb
Scandinavian Airlines Sverige
Important events in 2007
In 2007 nine new nonstop routes started
to/from Arlanda and three new nonstop routes
to/from Gothenburg.
SAS renewed a general agreement with the
Swedish government on all routes.
Scandinavian Airlines Sverige’s cabin crew
went on strike in May, causing a standstill for
five days on all routes.
On October 28, SAS decided to withdraw the
Q400 aircraft from production, seven of which
were operated by Scandinavian Airlines Sverige.
In November it was decided to enlarge the fleet
with two Boeing 737-800s in 2008.
Scandinavian Airlines Sverige has been a wholly
owned subsidiary in the SAS Group since 2004.
The airline operates air service to/from and within
Sweden and coordinates the Group’s sales activi-
ties in that country. Scandinavian Airlines Sverige
is a market leader on domestic routes in Sweden.
Scandinavian Airlines Sverige has 1,704 FTEs
and operates 193 flights daily. In 2007 the airline
carried 6.2 million passengers in scheduled serv-
ice with a fleet numbering 36 aircraft, including
wet lease and excluding Q400s.
Target
The Group’s profitability target is an EBIT margin
of at least 9%.
The environmental target for 2011 is an index
of 89. p. 112
Market performance
Scandinavian Airlines Sverige showed an im-
provement in earnings in 2007. During the year
progress continued on “Nya Inrikesflyget” and
“Nya Europaflyget” for domestic and European
destinations, respectively. The earnings improve-
ment is explained by a positive performance of
the passenger load factor and good cost control,
despite higher fuel prices.
In 2007, capacity was reallocated from charter
to scheduled operations. For its international
service Scandinavian Airlines Sverige launched 12
new nonstop routes, which were well received and
bolstered the airline’s competitiveness.
Traffic and earnings
In 2007 Scandinavian Airlines Sverige’s passenger
traffic rose by 10.2% and the number of passen-
gers by 5.6%. Capacity increased by 9% because
of the new international routes, and the load factor
improved by 0.8 percentage points to 70.7%. The
earlier marked overcapacity in the Swedish market
diminished somewhat in 2007, and Scandinavian
Airlines Sverige increased its market share during
the year. On European routes, traffic was up 15%.
Revenue in 2007 was up 6.1%, amounting to
MSEK 8,779, owing to increased traffic and more
passengers. Operating expenses amounted to
MSEK 7,621, an increase of 7.8%, owing to higher
capacity and higher jet fuel prices. The Q400 situ-
ation had a profoundly negative impact on earn-
ings in 2007.
Market outlook
In 2007 the overall Swedish market grew 2.6%,
and Scandinavian Airlines Sverige captured mar-
ket share. Growth is expected to continue in 2008
and will be highest on international routes.
Competition is assumed to be stiff during the
period, and Scandinavian Airlines Sverige will con-
tinue its efficiency-enhancing measures.
Scandinavian Airlines Sverige carried 6.5 million passengers in 2007, 0.3 million of whom traveled by charter. The airline
flies to 57 destinations. Scandinavian Airlines Sverige’s aircraft fleet consists of 19 Boeing 737s and 16 MD-80s.
EBIT margin
Outcome Profitability target
7.1% 9.0%
Scandinavian AirlinesSverige 14.0%
Share of Group revenue
Internet 34%
Telephone 6%
Agents 60%
Booking channels in 2007
New route in 2008High summer route
CEO Anders Ehrling
www.sas.se
Key figures, MSEK 2007 2006 2005
SAS Group’s holding 100% 100% 100%
Share of the home market 49% 48% 55%
Average no. of employees (of which 61% women) 1,704 1,615 1,468
Revenue 8,779 8,273 7,777
EBIT before nonrecur. items 622 525 –311
EBIT margin before nonrecurring items 7.1% 6.3% –4.0%
EBT before nonrecur. items 625 504 –338
Environmental index 95 95 100
More key figures p. 45

34 SAS Group Annual Report 2007
Seattle
Chicago
New York
Tokyo
Beijing
Dubai
Bangkok
Washington, D.C.
Stockholm
Copenhagen
Scandinavian Airlines International
Important events in 2007
New routes opened between Stockholm
and both Bangkok and Beijing, and between
Copenhagen and Dubai.
A new closer partnership with Air China was
introduced, including several code-share desti-
nations in China.
A new, more flexible fare structure was intro-
duced.
SAS Business Sleepers are now installed on all
aircraft.
Scandinavian Airlines International, which was
founded in 2004, is a business unit in the SAS
Consortium with two main activities:
Intercontinental air routes.
Sales activities in Asia and North America as
well as in Europe outside the Nordic countries
for all SAS Group airlines.
Scandinavian Airlines International has 782 FTEs
and operates 18 flights daily. In 2007, the unit car-
ried 1.3 million passengers with a fleet consisting
of 11 aircraft.
Targets
The Group’s profitability requirement is an EBIT
margin of at least 9%.
The environmental target for 2011 is an index
of 98. p. 112
Market performance
Competition, above all over the North Atlantic,
continued to stiffen in 2007. Despite a reduction
in Scandinavian Airlines International’s capacity,
passenger flows from Scandinavia increased.
The airline was adversely affected by strikes in
other SAS Group companies, disruptions in heavy
maintenance and also the Q400 through less
transfer traffic, leading to weaker earnings than for
2006. In addition to the weak passenger revenue
trend, the company was impacted by reduced
cargo revenue.
Traffic and earnings
In 2007 Scandinavian Airlines International’s pas-
senger traffic fell by 5.6% and the number of pas-
sengers by 4.7%. Capacity was reduced by 5.7%,
due in part to increased technical maintenance
and reconfiguration and in part to reduced capac-
ity to Asia. The Copenhagen-Shanghai route was
closed and replaced by the shorter Stockholm-
Beijing route. The passenger load factor improved
by 0.1 percentage points to 82.9%.
Revenue fell in 2007 by 2.3%, totaling MSEK
7,625. This is due to reduced capacity and lower
freight revenue. Operating revenue amounted to
MSEK 6,923, the same level as the previous year
despite higher jet fuel prices. The unit cost rose by
4.3%. The Q400 situation had a profoundly nega-
tive impact on Scandinavian Airlines International
owing to fewer transit passengers.
Market outlook
The number of passengers in the airline’s markets
are expected to show continued robust growth.
Copenhagen’s and Stockholm’s favorable geo-
graphical locations make them natural hubs for
intercontinental service between Northern Europe
and Asia/ North America. International traffic is ex-
pected to grow by 5-6% between Europe and North
America. Between Europe and Asia, expectations
are 5-9%. Competition is expected to stiffen further
through an increase in capacity over the North
Atlantic and between Europe and Asia. Scandina-
vian Airlines International plans to continue to open
new intercontinental routes in 2008/2009.
Scandinavian Airlines International carried 1.3 million passengers in 2007. The airline flies from Stockholm and
Copenhagen to eight destinations: four in the U.S., three in Asia and one in the Middle East. The aircraft fleet consists
of seven Airbus A340-300s and four Airbus A330-300s.
EBIT margin
Outcome Profitability target
0.6% 9.0%
Internet 12%
Telephone 8%
Agents 80%
Booking channels in 2007
Scandinavian AirlinesInternational 12.1%
Share of Group revenue
Seasonal route
CEO Lars Sandahl Sørensen
www.flysas.com
Key figures, MSEK 2007 2006 2005
SAS Group’s holding 100% 100% 100%
Share of traffic to the U.S. 31% 25-30% 30-35%
Share of traffic to Asia 15% 15% 15-20%
Average no. of employees (of which 44% women) 782 650 671
Revenue 7,625 7,805 7,736
EBIT before nonrecur. items 43 169 –74
EBIT margin before nonrecurring items 0.6% 2.2% –1.0%
EBT before nonrecur. items 54 169 –48
Environmental index 106 103 100
More key figures p. 45

35SAS Group Annual Report 2007
SAS Individually Branded Airlines
Formed in 2001, the SAS Individually Branded
Airlines business area comprises the airlines
Widerøe’s, Blue1 and airBaltic. It also includes the
strategic affiliated company Estonian Air, as well
as the affiliated companies Air Greenland, British
Midland (bmi) and Skyways.
Widerøe operates both regional air service in
Norway and regional international routes. Blue1
provides air service within and to/from Finland.
Operating from its Riga and Vilnius hubs, airBal-
tic is the leading airline in the Baltics. Blue1 is a
member of Star Alliance™. The affiliated company
Estonian Air operates from its Tallinn hub.
Customers and loyalty program
In line with Strategy 2011 product offerings will be
harmonized more with Scandinavian Airlines.
Blue1, Widerøe, airBaltic and Estonian Air are
linked to the SAS Group’s loyalty program. The
SAS Group is growing in Finland and the Baltics. At
the end of 2007 the number of EuroBonus mem-
bers in Finland and the Baltic countries totaled
250,400, which is 9.8% more than the previous
year. Of these, just under 2.3% were EuroBonus
gold members, most of whom were in Finland. The
total number of members rose in all countries in
2007.
Traffic results
In 2007, the number of passengers in the busi-
ness area rose 11.2% to 5.8 million. In all, the busi-
ness area’s traffic rose by 22.3% and accounted
for 13,8% of the Group’s total traffic. The passen-
ger load factor improved by 1.8 percentage points
to 64%, owing to capacity management at Blue1
and Widerøe in particular.
Traffic growth was highest in the Baltics, where
airBaltic’s traffic was up 50.4%. airBaltic’s traffic
rose by 56.6% to/from its Riga hub and by 37.7%
at its Vilnius hub. During the year Blue1 reduced
its capacity between Finland and Scandinavia,
but increased capacity on Finnish domestic. The
number of passengers on Finnish domestic rose
by 6.7%, with Blue1 capturing market share.
Widerøe’s saw positive traffic performance and
succeeded in raising the number of passengers car-
ried by 2.5% despite cutting capacity. Performance
was particularly strong on Norwegian domestic
routes.
Punctuality and regularity
The airlines are working to meet punctuality and
regularity targets set on the basis of their market
assumptions. In 2007, 84.1% of Blue1’s flights
departed within 15 minutes of scheduled depar-
ture times, and 98.9% of scheduled flights were
completed. Although Widerøe was affected by
the grounding of the Q400s, it still managed to
improve its regularity further to 96.7%, with punc-
tuality at 87.2% (87.1%). airBaltic’s punctuality was
82.5% (85.3%) during the year.
Sustainability
The carriers in SAS Individually Branded Airlines
work continuously to improve environmental per-
formance. In 2007 the environmental index im-
proved for most companies in the business area.
Business area
The airlines in the business area offer travel in both the leisure and business segments, with business
models tailored to their particular markets. All together the consolidated airlines in the business area had
62 aircraft and flew to 92 destinations with an average of 438 daily departures in 2007.
Responsible for the business area:
President & CEO
Mats Jansson
Summary statement of
income, MSEK 2007 2006 2005 1
Passenger revenue 5,570 5,137 9,536
Revenue 7,190 6,532 14,352
EBIT before nonrecur. items 379 151 415 2
EBIT margin before nonrecurring items 5.3% 2.3% 2.9%
EBT before nonrecur. items 383 142 264
1 Including Spanair, Aerolineas de Baleares and Newco.2 Including capital gains.
Detailed statement of income and more key figures p. 46
SAS Individually Branded traffic breakdown in2007, million passengers and change from 2006
1.8 (–2.7%)
2.0 (40.8%)
2.0 (2.5%)
Blue1
airBaltic
Widerøe
E-ticket, %
SepMayJan2007
SepMayJan2006
airBalticBlue1Widerøe
0
20
40
60
80
100
Block hours 2007 2006 2005
Widerøe Pilots 436 449 478 Cabin 411 434 436
Blue1 Pilots 658 635 693 Cabin 696 638 696
airBaltic Pilots 805 820 786 Cabin 789 757 751
Estonian Air Pilots 666 607 708 Cabin 663 622 721
Customer satisfaction 2007 2006 2005
Widerøe 60 63 62Blue1 69 70 74airBaltic 63 66 -Estonian Air 61 65 -

36 SAS Group Annual Report 2007
Oslo
Tromsø
Bodø
Bergen
Aberdeen
Alta
Copenhagen
Stavanger
Trondheim
Sandefjord
VisbyGothenburg
Newcastle
Vardø
Vadsø
BåtsfjordBerlevåg
MehamnHonningsvåg
LakselvHammerfest
HasvikSørkjosen
Svolvær
Stokmarknes
Leknes
Mo i Rana
Brønnøysund
Sandnessjøen Mosjøen
Rørvik
Namsos
Sandane
Ørsta/Volda
Førde
Sogndal
Harstad/Narvik
Edinburgh
Narvik
Bornholm
Andenes
Kirkenes
Murmansk
Widerøe
Important events in 2007
In April Widerøe opened a new route to Finnmark
after winning the Norwegian government’s
competitive bidding process for air services to
and from the region. The contract covers two
aircraft and runs for three years. Widerøe also
won a competitive bidding process for air serv-
ices to Andenes, a route it had taken over after
Coast Air withdrew.
In the wake of the accidents involving the Q400
in Denmark and Lithuania, the SAS Group
permanently grounded the entire Q400 fleet.
Widerøe’s four Q400 aircraft accounted for 30%
of its daily seat capacity and have been tempo-
rarily replaced by Dash 8 Q300s and wet leases.
Widerøe is the largest regional airline in the Nordic
countries, with operating revenue of SEK 3 billion
and 1,358 employees. Widerøes Flyveselskap AS
was started by five entrepreneurs in 1934. One of
them was Viggo Widerøe. Based outside Oslo at
that time, Widerøe operated air taxi and ambulance
services along with a flight school and an aerial
photography business. In the 1950’s its business
expanded to seaplane routes in northern Norway.
These were replaced by land air routes after the
authorities established short runway airports in
the region and put air operations out to bid. In 1970
Widerøe was reorganized to enable it to assume the
leading role in developing air routes.
Widerøe has 264 daily departures to 43 do-
mestic and international destinations, with ap-
proximately 2 million passengers annually.
Targets
The Group’s profitability requirement is an EBIT
margin of at least 7%.
The environmental target for 2011 is an index
of 82. p. 112
Market performance
Widerøe’s earnings are the best in the company’s
history. Despite the accidents involving the Q400,
Widerøe exceeded its preceding year’s earnings
by a large margin. The company has handled the
Q400 accidents by optimizing traffic and technical
planning, and through wet leases. A strong econ-
omy and an improved concept resulted in more
passengers and a higher yield. Additionally, the
unit cost was also reduced. The company still has
certain challenges in terms of its cost program,
but has succeeded well in obtaining favorable
agreements for its domestic operations.
Traffic and earnings
Widerøe’s passenger traffic increased by 0.9% in
2007 and the number of passengers rose by 2.5%
thanks to the rapid rise in Norwegian domestic
traffic. Its capacity was reduced during the year by
4.6% as the result of the closure of some unprofit-
able international routes and capacity adjust-
ments. The passenger load factor improved by 3.3
percentage points to 60.3%. Widerøe’s traffic on
Norwegian domestic routes increased 6.1% dur-
ing the year. Its positive traffic performance is a
result of yield management, capacity adjustments
and market activities.
Revenue increased in 2007 by 3.7%, totaling
MSEK 3,051. The increase is attributed to more
passengers and stable yield. Operating expenses
amounted to MSEK 2,625, a reduction of 0.9%,
despite the record-high jet fuel prices. The unit
cost decreased by 1.7%. Income before nonrecur-
ring items amounted to MSEK 162, an improvement
of MSEK 140 compared with 2006.
Market outlook
The Norwegian market surged by 7% in 2007,
with continued growth predicted for 2008, though
not on the same scale. Widerøe is well positioned
in the regional market and to and from Norway. In
2008 a new bidding competition will be announced
for 2009. On the commercial route network the
company is planning to replace part of the 50-seat
fleet with a new aircraft model so that growth can be
readily achieved on a number of the existing routes.
The largest regional airline in the Nordic countries, Widerøe carried two million passengers in 2007.
Its airline fleet consists of 28 turboprop aircraft serving 36 airports in Norway and seven abroad.
EBIT margin
Outcome Profitability target
5.8% 7.0%
Widerøe 4.9%
Share of Group revenue
Internet 27%
Telephone 6%
Agents 67%
Booking channels in 2007
Summer route
CEO Per Arne Watle
www.wideroe.no
Key figures, MSEK 2007 2006 2005
SAS Group’s holding 100% 100% 100%
Share of the home market 13% 13% 14%
Average no. of employees (of which 35% women) 1,358 1,393 1,331
Revenue 3,051 2,941 2,831
EBIT before nonrecur. items 177 35 89
EBIT margin before nonrecurring items 5.8% 1.2% 3.2%
EBT before nonrecur. items 162 22 60
Environmental index 92 95 100
More key figures p. 46

37SAS Group Annual Report 2007
Kittilä
Rovaniemi
Rome
Nice
Zurich
London
Athens
Warsaw
Barcelona
Paris
Turku
Tampere
Milan
Stockholm
Oslo
Amsterdam
Helsinki
Gothenburg
Copenhagen
Berlin
Oulu
Vaasa
Hamburg
Kuopio
EBIT margin
Outcome Profitability target
5.6% 9.0%
International 74%
Domestic 26%
Passenger breakdown in 2007
Blue1 3.2%
Share of Group revenue
Blue1
The airline operates SAS Group’s air service to/from and within Finland and handles sales in the Finnish market for SAS Group
airlines. Blue1 carried 1.8 million passengers in 2007. Its aircraft fleet consists of nine Avros and four MD-90s.
Important events in 2007
In the spring Blue1 launched a new business
travel product, Economy Extra, on its Scandina-
via routes, and the product was also introduced
to European routes in the fall.
The sales-on-board product Cafe1 was im-
proved, and payment options and product
range were expanded. A change of product
supplier further improved the level of service.
Seating by row was introduced on domestic
routes, with better punctuality and customer
satisfaction as a result.
A new hangar went into operation at Helsinki-
Vantaa Airport, and the technical base at
Arlanda was closed.
A wholly owned Finnish subsidiary in the SAS
Group since 1998, Blue1 flies to 24 destinations.
Its business concept is based on a basic product
at centrally-located airports, a network allowing
transfers and value-for-money supplementary
services.
Blue1 enjoys a strong position in the Finnish
market, with market share of around 30% on
Finnish domestic routes. Its total share of the
domestic market rose during the year by around
two percentage points to 17%. Blue1 has been a
member of Star Alliance since October 2004 and
has code-sharing on all its routes with all the SAS
Group’s other airlines. Blue1 has 506 FTEs and
operates 74 flights daily. During 2007 the airline
carried 1.8 million passengers with a fleet that
since the addition of a fourth MD-90 in December
2007 numbers 13 aircraft.
Targets
The Group’s profitability requirement is an EBIT
margin of at least 9%.
The environmental target for 2011 is an index
of 80. p. 112
Market performance
Blue1’s earnings improved sharply compared with
the previous year. This trend is primarily attribut-
able to improvements in terms of expenses and
weak comparative figures from 2006, when the
company had major additional costs in relation to
its expansion. During the year Blue1 continued
its work on Round Trip Management and made
capacity adjustments in all route areas.
Traffic and earnings
Blue1’s passenger traffic was up 1% in 2007,
while passenger volume was down 2.7% owing
to capacity adjustments on the routes between
Finland and Scandinavia. Capacity was increased
during the year by 0.5%, a result of the focus on
Finnish domestic service and European routes.
The passenger load factor improved by 0.4 per-
centage points to 66.9%. Blue1’s traffic on Finnish
domestic was up during the year by 8% and by
13.5% on European routes, though fell on the
routes to/from Scandinavia by 13.8%.
Revenue in 2007 was at a level with 2006, to-
taling MSEK 2,019. The yield was marginally lower,
but additional revenue per passenger was higher.
Operating expenses amounted to MSEK 1,762, a
reduction of 5.5%, despite the record-high jet fuel
prices. The unit cost was reduced by 6% owing to
lower leasing costs and the fact that nonrecurring
costs were charged to earnings the previous year
in connection with the introduction of the MD-90
in the aircraft fleet. Income before nonrecurring
items amounted to MSEK 117, an improvement of
a whopping MSEK 135.
Market outlook
In 2007 the overall Finnish market saw growth of
6%. The Finnish airline market has few players.
Despite the fact that the Finnish domestic market
is not growing, there is growth potential on long-
haul routes and winter destinations in Lapland.
The growth on nonstop routes to and from Europe
is expected to continue, and eastward traffic to
Russia is expected in the long run to open up new
opportunities for growth for Blue1.
CEO Stefan Wentjärvi
www.blue1.com
Key figures, MSEK 2007 2006 2005
SAS Group’s holding 100% 100% 100%
Share of the home market 17% 15% 12%
Average no. of employees (of which 52% women) 506 491 444
Revenue 2,019 2,018 1,704
EBIT before nonrecur. items 113 –16 60
EBIT margin before nonrecurring items 5.6% –0.8% 3.5%
EBT before nonrecur. items 117 –18 62
Environmental index 89 89 100
More key figures p. 46

38 SAS Group Annual Report 2007
Moscow
Kiev
Billund
Zurich
Munich
St. Petersburg
Brussels
Stockholm
London
Vilnius
Minsk
Oslo
Dublin
Milan
Helsinki
Vienna
Copenhagen
Berlin
Hamburg
Düsseldorf
Odessa
Istanbul
Simferopol
Liepaja
Paris
Barcelona
Kaliningrad
Bergen
BakuTbilisi
Gothenburg
Hurghada
Tel Aviv
Rome
Riga
Stavanger
Frankfurt
Dubrovnik
AlmatyTashkent
Oulu
Chisinau
Tallinn
Venice
Kuressarre
Ålesund
YerevanSochi
Athens
Kuopio
Nice
Ventspils
airBaltic Estonian Air
Important events in 2007
airBaltic opened 24 new routes from Riga,
Vilnius and Liepaja.
A substantially improved reservation system
was introduced, increasing airBaltic’s sales on
its website from 25% to 47%.
airBaltic was the first airline in Northern Europe
to introduce E-vouchers for air travel.
Founded in 1995 and consolidated since 2005 in the
SAS Group, airBaltic is owned by the Latvian state,
the SAS Group and Transaero. The leading airline in
the Baltics, with hubs in Riga, Vilnius and Liepaja,
airBaltic operates the SAS Group’s air service to/
from Latvia and Lithuania and handles sales in both
countries. airBaltic has 917 FTEs and operates 99
flights daily. In 2007 the airline carried over 2 million
passengers for the first time. In 2007 five Boeing
737s were added to the fleet, which now numbers 21
aircraft: 13 Boeing 737s and eight Fokker 50s.
Targets
The Group’s profitability requirement is an EBIT
margin of at least 9%.
The environmental target for 2011 is an index
of 76. p. 113
Market performance
Thanks to good market performance and market
initiatives, airBaltic is the Baltic countries’ leading
and the Group’s fastest-growing airline. Prima-
rily due to rapid expansion, airBaltic’s earnings
deteriorated compared with the previous year.
Earnings were affected by a falling yield, but were
compensated by good cost control and a higher
passenger load factor.
Traffic and earnings
airBaltic’s passenger traffic was up 50.4% in 2007,
with passenger volume increasing by 40.8%.
Capacity increased by 44.2% owing to new routes
and more frequent flights. The passenger load fac-
tor improved by 2.6 percentage points to 63.2%.
Revenue increased in 2007 by 35.2%, totaling
MSEK 2,097. The rise was attributable to higher
passenger volume. The yield fell by 12.2% on
account of longer routes. Operating expenses in-
creased due to higher capacity and jet fuel prices,
amounting to MSEK 1,819. Adjusted for fuel pric-
es, the unit cost declined by 4.6%. Income before
nonrecurring items was MSEK 21, a deterioration
of MSEK 28.
Market outlook
Growth in the Baltics is strong, with Riga having
gradually established itself as the major hub. The
robust growth is expected to continue in 2008, as
is the competition from the new airlines. Latvia is
expected to become a Schengen country during
2008, further bolstering Riga’s position.
Important events in 2007
New routes introduced to six destinations.
The airline’s sixth Boeing 737 went into service.
Estonian Air Regional was founded for regional
service, and a new aircraft type, the SAAB 340,
was introduced.
Estonian Air is 49% owned by the SAS Group and
offers nonstop flights to major European cities and
regional service in the Baltic Sea region from its
hub in Tallinn. Estonian Air serves 19 destinations
and provides charter service with four Boeing 737-
500s, two 737-300s and two SAAB 340s. Estonian
Air has 439 FTEs.
Market performance
The number of passengers carried was up by 8%,
totaling 746,000. At the same time, capacity was
increased by 3.9%, and the passenger load factor
amounted to 67.9%, an improvement of 2.3 per-
centage points. Revenue was up by 5.2% owing to
higher passenger volume. Operating expenses to-
taled MSEK 727. Income before tax was MSEK –32,
an improvement of MSEK 4.
Chairman Mats Jansson
Acting CEO Andrus Aljas
www.estonian-air.ee
Airlines in the Baltic countries
airBaltic 3.3%
Share of Group revenue
EBIT margin
Outcome Profitability target
1.1% 9.0%airBaltic
Key figures, MSEK 2007 2006 2005
SAS Group’s holding 49% 49% 49%
Share of the home market >43% 45% 45%
Average no. of employees (of which 53% women) 439 424 380
Revenue 812 752 678
EBIT –28 –41 29
EBIT margin –3.5% –5.4% 4.3%
Income before tax, EBT –32 –36 39
Environmental index 83 94 100
More key figures p. 46
CEO Bertolt Flick
www.airbaltic.lv
Key figures, MSEK 2007 2006 2005
SAS Group’s holding 47.2% 47.2% 47.2%
Share of the home market 45% 42% 40%
Average no. of employees (of which 54% women) 917 790 626
Revenue 2,097 1,551 1,211
EBIT before nonrecur. items 24 55 55
EBIT margin before nonrecurring items 1.1% 3.6% 5.3%
EBT before nonrecur. items 21 49 –19
Environmental index 83 89 100
More key figures p. 46
airBalticNew airBaltic route in 2008Estonian AirNew Estonian Air route in 2008

39SAS Group Annual Report 2007
SAS Aviation Services
SAS Aviation Services comprises SAS Ground
Services (SGS), SAS Technical Services (STS) and
SAS Cargo. In 2007, Flight Academy, a training
center for pilots and cabin crew, was sold in line
with the SAS Group’s focus on its core business.
STS and SGS posted very poor earnings in
2007. The reasons include the main focus being
on delivery quality, as well as delays and difficulties
in implementing the necessary cost program. A
decision was made to divest Spirit in SAS Cargo,
and to outsource heavy maintenance of the Boe-
ing 737 Classic. For now, an internal solution was
approved for SGS, whereby the company is to
implement cost reductions of MSEK 400 and a
quality-improvement program no later than within
18 months, i.e., before the summer of 2009. In
2007 the number of passengers SGS handled
increased by 3.8%. STS had approximately 120
airlines as customers of technical maintenance.
SAS Cargo’s flown tonnage decreased by 5.1%
due to large overcapacity.
Customers
SGS and STS primarily have airlines as customers,
but unlike STS, SGS has direct contact with the end
customer. In 2007, SGS signed new agreements
with, among others, Malaysia Airlines, Air France
and Turkish Airlines. All together, SGS signed
agreements with six new airlines.
STS focused during the year on business with
SAS Group airlines and consequently did not sign
any agreements during the year. SAS Cargo offers
transportation solutions primarily to business
customers.
Since its customers are mainly companies this
results in part in more individual agreement solu-
tions. Long-term agreements with large volumes
provide more advantageous terms as a rule.
Sustainability
SAS Aviation Services units work actively to reduce
their environmental impact and to promote
sustainable development. SGS has introduced
greener deicing methods and is developing a
baggage handling system that will improve the
working climate. During the year, STS worked on
finding methods to reduce the use of chemicals
and quantity of hazardous waste.
SAS Facility Management manages SAS
Group’s buildings and works continuously to
streamline waste management and reduce energy
use. SAS Cargo is ISO 14001 certified.
Trends in the support business
The ongoing streamlining of airlines will require
further streamlining in support activities. These
operations are ground handling and technical
support, along with distribution systems and
cargo. Self-service functions such as automated
baggage handling and biometrics are placing new
demands on operations.
Of SAS Scandinavian Airlines’ passengers, over
50% already check in via self-service machines and
at the end of 2007 more than 10% had checked in
via the Internet. Biometric check-in solutions are
used at Norwegian and Swedish domestic airports
and are in the process of being installed at other
airports.
In technical maintenance, competition in heavy
maintenance is increasing from low-cost countries
in Eastern Europe and Asia. Base maintenance has
not been correspondingly affected by competition
from low-cost countries. Simplified routines and
increasing demands for higher capacity utilization
of aircraft mean that streamlining is expected to
continue.
Business area
SAS Ground Services is a full-service supplier in ground handling and is represented in 21 countries at 76 airports.
SAS Technical Services supplies technical maintenance of aircraft at a large number of airports in the Nordic countries.
SAS Cargo is a leader in freight transportation to/from and in the Baltic Sea region.
Responsible for SAS
Ground Services and
SAS Cargo:
Benny Zakrisson
Summary statement of
income, MSEK 2007 2006 2005 1
Revenue 14,192 14,308 14,964
Payroll expenses –6,380 –6,197 6,462
EBIT before nonrecur. items –457 –47 603 2
EBIT margin before nonrecurring items –3.2% –0.3% 4.0%
EBT before nonrecur. items –623 –150 633
1 Including SAS Flight Academy.2 EBIT incl. nonrecurring items.
Detailed statement of income and more key figures p. 47
Responsible for SAS
Technical Services:
John S. Dueholm
Breakdown of business area operating revenue
34.2%
23.4%
42.4%
SASTechnical Services
SAS Cargo
SASGround Services
SAS Aviation Services’share 23.1%
SAS Aviation Services’ share ofGroup revenue, 2007
Income before nonrecurring items, EBTMSEK
–800
–600
–400
–200
0
200
400
600
800
2007200620052004
Due to the poor profit performance of STS and SGS, earn-ings worsened in 2007. Measures are being implemented to reverse the situation.

40 SAS Group Annual Report 2007
Haugesund
Longyearbyen
Ålesund
Kristiansand
MoldeKristiansund
Bardufoss
Gdansk
Aalborg
Århus
Poznan
Geneva
Tallinn
Brussels
Manchester
StockholmOslo
Amsterdam
Gothenburg
Copenhagen
Vaasa Kuopio
Zurich
London
Dublin
Warsaw
Paris
KirkenesTromsø
Bodø
Bergen
Aberdeen
Alta
Stavanger
Trondheim
Lakselv
Andenes
Kiruna
Luleå
UmeåÖrnsköldsvik
Östersund
Ängelholm RonnebyMalmö
KalmarVäxjö
Skellefteå
Sundsvall
Karlstad
Helsinki
OuluRovaniemi
Turku
Tampere
Evenes
Hamburg
Frankfurt
Birmingham
Milan
RomeMadrid
Palma de Mallorca
Nice
St Petersburg
SeattleChicago
Washington, D.C.
New York
Moscow
Beijing
Bangkok
Tokyo
SAS Ground Services
Important events in 2007
Continued streamlining of operations.
Increased focus on quality delivered.
Björn Alegren appointed new CEO of SGS.
New agreements were signed with Malaysia
Airlines, Air France, Turkish Airlines, KLM,
Icelandair and MyTravel Airways.
SAS Ground Services is represented at approxi-
mately 76 airports and has an average of 6,873
FTEs in 21 countries. SGS offers ground services
for passengers, baggage and aircraft. Examples
of efficient solutions are automated check-in and
boarding and centralized departure control. Serving
a total of 118 airlines during the year, SGS handled
78.8 million travelers, 499,000 departures and
309,000 tonnes of freight and mail.
SGS also includes SAS Ground Equipment,
which owns, leases, and maintains ramp as well as
radio communications equipment.
The market leader in Scandinavia, SGS has a
market share of slightly more than 55%. In com-
parison with independent handling companies in
Europe, SGS is number three based on operating
revenue.
Target
The Group’s profitability requirement is an EBIT
margin of at least 4%.
Quality objectives
SGS works systematically on quality. Safety, punc-
tuality and service are continuously tracked and
its safety goal is zero incidents. Punctuality and
service are measured, among other things, by the
percentage of delays caused by ground handling
and waiting time for check-in and baggage.
Environmental targets
The environmental target for 2011 is an index of
95. p. 113
SGS’s goal is to be a company that takes the
environment into consideration and complies with
current laws and regulations. SGS’s working en-
vironment targets are measured and followed up
in regard to sick leave, work-related injuries, how
the management is viewed by employees, and job
satisfaction.
Earnings performance
Despite higher revenues, SGS’s earnings for 2007
were down from the previous year. The revenue
increase is attributed to increased volumes, more
external customers and new products ordered by
companies in SAS Scandinavian Airlines. Its low
profitability is due to a combination of price pres-
sure in the market, unimplemented streamlining
measures in parts of its operations and a focus on
delivery quality.
The number of passengers handled increased
by 3.8% to 78.8 million and the number of flights
handled increased by 2.3% to 499,000 in 2007.
During the year SGS’s operating revenue rose
by 3.2% to MSEK 6,055. Operating expenses
increased by 4.4%, totaling MSEK 6,112. The unit
cost rose by 0.9% during the year. Measures will
be implemented to further improve efficiency.
Income before nonrecurring items declined by
MSEK 210, amounting to MSEK –167.
Market outlook
SGS’s immediate future challenge consists of
implementing MSEK 400 worth of cost reductions
along with a quality improvement program by the
summer of 2009.
With the continuing growth trend in the airline
industry, the demand for ground services will
increase. Prices for ground services are still under
pressure and profits in the industry are low.
The global market for ground services is frag-
mented. Consolidation in the market continues,
albeit at a relatively slow pace.
SAS Ground Services, SGS, is the largest full-service supplier in the Nordic countries in the ground handling
industry and other airport-related services. SGS consists of a holding company and eight subsidiaries in the
Nordic countries and the U.K. SGS operates in Europe, Asia and North America.
Airports with SGS personnel
CEO Björn Alegren
www.sasground.com
Key figures, MSEK 2007 2006 2005
SAS Group’s holding 100% 100% 100%
No. of flights handled thousands 499 488 506
Baggage quality (reports per 10,000 pass.) 104 128 88
Average no. of employees (of which 39% women) 6,873 6,622 6,952
Revenue 6,055 5,866 6,185
EBIT before nonrecur. items –141 55 241
EBIT margin before nonrecurring items –2.3% 0.9% 3.9%
EBT before nonrecur. items –167 43 228
Environmental index 101 106 100
More key figures p. 47
EBIT margin
Outcome Profitability target
–2.3% 4.0%
SAS GroundServices 9.6%
Share of Group revenue
Other 13% (18%)
Norway 25% (30%)
Finland 2% (3%)
U.K. 6% (5%)
Sweden 33% (23%)
Sales breakdown in 2007 and 2006
Denmark 21% (24%)

41SAS Group Annual Report 2007
TallinnStockholmOslo
Gothenburg
Copenhagen
Tromsø
Bergen
TrondheimUmeå
Skellefteå
Seattle
St. Petersburg
Katowice
Stavanger
SAS Technical Services
SAS Technical Services, STS, is a leading technical aircraft maintenance supplier of MRO (Maintenance, Repair
and Overhaul) services to the airline industry in the Nordic and Baltic countries. SAS has 13 maintenance bases
in Europe and one in Seattle, U.S.
Important events in 2007
A new base organization was established.
Material Management, with overall responsibil-
ity for STS material supply, was established.
An international benchmark was implemented
for identifying market price levels and perform-
ance goals for STS.
STS’s future role and ownership structure has
been set within the Strategy 2011 framework
and will be implemented in 2008.
SAS Technical Services has been engaged in
aircraft maintenance since 1946. STS was incor-
porated in 2004. Its biggest customers are SAS
Group airlines, which account for approximately
80% of revenues. Its operations are certified by
European, U.S. and other countries’ inspection
authorities. It has 2,422 employees.
The work in STS is performed by aircraft
mechanics and certified aircraft technicians where
required. Delivery quality is a focus throughout
the company and substantial improvements can
be seen at all bases: Stockholm, Oslo and Copen-
hagen. Further improvements have been made in
the service level for components and consumables.
STS offers servicing of Airbus, MD-80/90,
and Boeing 737 aircraft, as well as customized
services. The product portfolio includes Line
Maintenance, Airframe Maintenance, Engineering
Services, Engine Management, Material Manage-
ment and Technical Training.
Target
The Group’s profitability requirement is an EBIT
margin of at least 5%.
Quality objectives
The objective is to achieve operational excellence
to meet and surpass customers’ quality and deliv-
ery standards.
STS aims to be a world leader in safety, quality
and efficiency.
Environmental target
The environmental target for 2011 is an index of
90. p. 113
Earnings performance
STS’s earnings were substantially worse than in
2006. While a major effort was made during the
year to improve delivery quality, the cost-cutting
measures that were implemented did not fully
compensate for the low prices. Together with
other measures within the framework of STS’s
efficiency program, STS’s commitment to delivery
quality in combination with a more efficient pro-
duction structure will yield long-term increased
productivity and efficiency, thereby improving the
company’s competitive and profitability levels.
STS’s revenues were level with the preceding
year and amounted to MSEK 4,874. The percent-
age of external revenues decreased by 2.5 per-
centage points. Operating expenses increased
during the year by 1.9%, amounting to MSEK
5,184. Income before nonrecurring items was
down MSEK 250, amounting to MSEK –499.
Market outlook
The external market for technical maintenance
is growing but is marked by stiff competition, a
certain amount of overcapacity and pressure on
prices, particularly from companies in Eastern
Europe.
CEO Peter Möller
www.sastechnicalservices.com
Key figures, MSEK 2007 2006 2005
SAS Group’s holding 100% 100% 100%
Average no. of employees (of which 7% women) 2,422 2,509 2,678
Revenue 4,874 4,895 5,167 of which external revenue 13.7% 16.2% 19.6%
EBIT before nonrecur. items –372 –176 181
EBIT margin before nonrecurring items –7.6% –3.6% 3.5%
EBT before nonrecur. items –499 –249 93
Environmental index 93 99 100
More key figures p. 47
Line maintenanceLine & Base maintenanceLine, Base & Heavy maintenance
STS maintenance bases
Other 0.4% (0.3%)
Norway 14.8% (14.5%)
Estonia 2.0% (1.7%)
Denmark 13.7% (19.5%)
Sweden 69.1% (64.0%)
Sales breakdown in 2007 and 2006
SAS TechnicalServices 7.7%
Share of Group revenue
EBIT margin
Outcome Profitability target
–7.6% 5.0%

42 SAS Group Annual Report 2007
Kristiansand
Stockholm
Oslo
Gothenburg
Copenhagen
Tromsø
Bodø
Bergen
Stavanger
Trondheim
Malmö
Riga
Billund
New York
SAS Cargo
Important events in 2007
SAS Cargo’s freight operation, Spirit Air Cargo
Handling, signed an agreement for new cargo
terminals in Gothenburg and Stockholm
New cargo capacity was added between Scan-
dinavia and China, Dubai and Bangkok
Due to poor profits, certain All Cargo operations
were closed.
The SAS Group received a Statement of Objec-
tions from the European Commission regarding
suspicions of collusion in the air cargo business.
SAS Cargo Group A/S is a wholly owned company
in the SAS Group. Most of the company’s revenues
are derived from air cargo, airmail and cargo han-
dling for other airlines at SAS Cargo terminals in
Scandinavia.
SAS Cargo primarily utilizes the cargo capacity
existing in SAS Group airlines, particularly on the
intercontinental routes. SAS Cargo’s main mar-
kets are Asia, the U.S. and Scandinavia. In main
markets outside Scandinavia SAS Cargo is repre-
sented by its own sales offices.
Target
The Group’s profitability requirement is an EBIT
margin of at least 4%.
Quality objectives
SAS Cargo’s quality goal is “Arrived As Agreed.”
Spirit Air Cargo Handling is ISO 9001:2000 certi-
fied, and all of SAS Cargo is ISO 14001 certified.
Sustainability
In cooperation with a number of customers and
suppliers SAS Cargo has developed an on-line
system for calculating emissions in which the
customer can view the environmental impact of all
types of cargo shipments by air and road. p. 114
Earnings performance
SAS Cargo’s earnings for 2007 were worse than
for 2006, due to intense competition from several
new players in the domestic market and pres-
sure on prices. Production realignments within
Scandinavian Airlines also impacted earnings. To
create a platform for long-term profitability, SAS
Cargo has prepared a program of commercial initia-
tives, efficiency measures and structural changes.
During the first eight months of the year the cargo
market to and from Asia had far too much capac-
ity. Efficiency measures were introduced, yielding
a positive earnings effect in the fall of 2007 by
reducing costs and bolstering SAS Cargo’s com-
mercial offerings.
SAS Cargo’s revenue decreased in 2007 by
8.5%, totaling MSEK 3,336. Operating expenses
fell during the year by 6.3%, amounting to MSEK
3,349. Income before nonrecurring items was
MSEK 22.
Market outlook
SAS Cargo is carefully following market develop-
ments and will continue to adjust its capacity to
the different markets.
The bulk of SAS Cargo’s freight capacity is found in the SAS Group’s own airlines. In 2007 SAS Cargo began a transition
process toward global solutions in a world market characterized by toughening competition.
SAS Cargo’s freight terminals
SAS Cargo 5.3%
Share of Group revenue
EBIT margin
Outcome Profitability target
1.0% 4.0%
CEO Kenneth Marx
www.sascargo.com
Key figures, MSEK 2007 2006 2005
SAS Group’s holding 100% 100% 100%
Average no. of employees (of which 21% women) 1,356 1,434 1,328
Flown tonnes, thousands 279 294 287
Tonne km (million) 1,024 1,082 1,039
Cargo yield/tonne km 2.47 2.56 2.52
Revenue 3,336 3,645 3,308
EBIT before nonrecurring items 33 114 101
EBIT margin before nonrecurring items 1.0% 3.1% 3.0%
EBT before nonrecurring items 22 99 84
More key figures p. 47
Freight and mail,
tonne km (000) 2007 2006 Changes
Intercontinental 573,754 642,444 –11%
Europe 20,966 25,390 –17%
Intra-Scandinavian 2,494 4,873 –49%
Total international 597,214 672,707 –11%
Denmark 19 16 21%
Norway 777 10,703 –93%
Sweden 224 326 –31%
Total domestic 13,759 11,045 25%
All Cargo 412,001 398,249 4%
Total 1,023,994 1,082,000 –5%

43Facts • SAS Group Annual Report 2007
Facts, key figures and traffic data informationTraffic data information 44
Key figures by company 45
Group operational key figures 48
Ten-year financial overview 49
Financial key figures and return requirements 50
Star Alliance, key figures 51
Loyalty programs 51
Approvals and certifications 51

44 SAS Group Annual Report 2007 • Facts
Traffic data information and comments
Traffic, production, yield 2007 2006 Change
Total passenger traffic
No. of passengers, (000) 25,403 25,099 1.2%
Rev. pass. km (RPK), mill. 27,304 27,506 –0.7%
Avail. seat km (ASK), mill. 36,852 36,971 –0.3%
Passenger load factor 74.1% 74.4% –0.3 pts.*
Yield, currency adj., SEK 1.21 1.14 6.5%
Total unit cost incl. charter 3.9%**
Scandinavian Airlines
Norge
No. of passengers, (000) 9,726 9,554 1.8%
Rev. pass. km (RPK), mill. 6,846 6,839 0.1%
Avail. seat km (ASK), mill. 9,842 9,948 –1.1%
Passenger load factor 69.6% 68.8% +0.8 pts.*
Charter passengers, (000) 482 426 13.1%
Yield, currency adjusted 6.5%
Scandinavian Airlines
Danmark
No. of passengers, (000) 8,111 8,246 –1.6%
Rev. pass. km (RPK), mill. 5,931 6,018 –1.4%
Avail. seat km (ASK), mill. 8,474 8,351 1.5%
Passenger load factor 70.0% 72.1% –2.1 pts.*
Charter passengers, (000) 609 372 63.7%
Yield, currency adjusted 5.2%
Scandinavian Airlines
Sverige
No. of passengers, (000) 6,224 5,892 5.6%
Rev. pass. km (RPK), mill. 4,893 4,441 10.2%
Avail. seat km (ASK), mill. 6,919 6,349 9.0%
Passenger load factor 70.7% 69.9% +0.8 pts.*
Charter passengers, (000) 323 478 –32.4%
Yield, currency adjusted –2.0%
Scandinavian Airlines
International
No. of passengers, (000) 1,341 1,407 –4.7%
Rev. pass. km (RPK), mill. 9,634 10,207 –5.6%
Avail. seat km (ASK), mill. 11,616 12,323 –5.7%
Passenger load factor 82.9% 82.8% +0.1 pts.*
Yield, currency adjusted 5.7%
* Change in percentage points (pts.)
** Higher fuel costs negatively impacted the unit cost by 2.2 percentage points.
Scandinavian Airlines Norge saw a combination of positive yield and traffic performance in 2007. Capacity was dragged down early in the year on some unprofitable European routes and was reallocated to the growing Norwegian domestic traffic. Traffic in Norwegian domestic grew by 3.8%, and the pas-senger load factor rose by 1.8 percentage points to 68.4%. Performance was also positive on intra-Scandinavian routes, while traffic on European routes declined. p. 31
Scandinavian Airlines Danmark increased capacity in 2007. New routes were introduced to Greenland and Pristina. Larger aircraft were leased in in the fall of 2007 to replace the Q400s, which were permanently grounded. This had a negative impact on the pas-senger load factor, which declined by 2.1 percentage points to 70.0%. The yield performed positively, and the unit cost fell by a significant 4.5%. p. 32
Scandinavian Airlines Sverige opened 12 new routes in 2007, and total capacity rose by 9%. The new capacity was well absorbed, and the passenger load factor rose by 0.8 percentage points to 70.7%. Scandinavian Airlines Sverige saw its strongest growth on European routes, where traffic rose by 15% combined with a 1 percentage point higher passen-ger load factor. Owing to the longer routes, the yield declined by 2%. p. 33
Scandinavian Airlines International matched its capacity to seasonal variations in demand between Asia and the U.S. better than before in 2007. Two seasonal routes, Stockholm-Bangkok and Copen-hagen-Dubai, began in the winter season, and the number of frequencies to the U.S. increased in the summer season. The shorter routes and installation of SAS Business Sleepers helped reduce capacity by 5.7%. The adjustments were well received, and Scandinavian Airlines International’s passenger load factor rose by 0.1 percentage point to 82.9% and the yield rose by 5.7%. p. 34
Widerøe successfully adjusted its capacity in 2007. Despite 4.6% lower capacity, traffic increased by 0.9%, and the passenger load factor was up 3.3 percentage points to 60.3%. Above all, the trend was positive on Norwegian domestic traffic, where the number of passengers increased by 5.1%. This is the result of yield management, capacity management and marketing campaigns. p. 36
Blue1 focused on adapting capacity to demand in 2007, following the big capacity increase in 2006 when three MD-90 aircraft were phased in. Capacity fell during the year on the routes between Finland and Scandinavia but increased on Finnish domestic routesand on traffic between Finland and Europe. The pas-senger load factor rose by 0.4 percentage points to 66.9%. p. 37
airBaltic’s strong growth continued in 2007, and traf-fic rose by 50.4%. New, substantially longer routes resulted in the yield declining by 12.2%. Growth was fastest on traffic to and from the Riga hub, where traf-fic increased by 56.6%. Traffic at the Vilnius hub also rose by a substantial 37.7%. Despite the big increase in capacity, the passenger load factor rose by 2.6 per-centage points to 63.2%. p. 38
Affiliated company
Estonian Air saw no growth in passenger volume dur-ing the first half of 2007. During the second half, two SAAB 340s were phased in in the aircraft fleet, making possible increased growth and the opening of new routes. In all Estonian Air’s traffic increased in 2007 by 7.5% and the number of passengers by 8%. p. 38
SAS Scandinavian Airlines SAS Individually Branded Airlines
Traffic, production, yield 2007 2006 Change
Total passenger traffic *
No. of passengers, (000) 5,776 5,195 11.2%
Rev. pass. km (RPK), mill. 4,377 3,580 22.3%
Avail. seat km (ASK), mill. 6,843 5,758 18.8%
Passenger load factor 64.0% 62.2% +1.8 pts.
Widerøe
No. of passengers, (000) 1,964 1,916 2.5%
Rev. pass. km (RPK), mill. 614 608 0.9%
Avail. seat km (ASK), mill. 1,018 1,067 –4.6%
Passenger load factor 60.3% 57.0% +3.3 pts.
Yield, currency adjusted –0.1%
Blue1
No. of passengers, (000) 1,798 1,848 –2.7%
Rev. pass. km (RPK), mill. 1,447 1,432 1.0%
Avail. seat km (ASK), mill. 2,161 2,150 0.5%
Passenger load factor 66.9% 66.6% +0.4 pts.
Yield, currency adjusted –0.1%
airBaltic
No. of passengers, (000) 2,014 1,430 40.8%
Rev. pass. km (RPK), mill. 2,317 1,540 50.4%
Avail. seat km (ASK), mill. 3,664 2,542 44.2%
Passenger load factor 63.2% 60.6% +2.6 pts.
Yield, currency adjusted –12.2%
Affiliated company *
Estonian Air 2007 2006 Change
No. of passengers, (000) 746 690 8.1%
Rev. pass. km (RPK), mill. 1,006 936 7.5%
Avail. seat km (ASK), mill. 1,483 1,427 3.9%
Passenger load factor 67.9% 65.6% +2.3 pts.
* Affiliated companies are reported separately and are not included in the business area’s traffic data.

45Facts • SAS Group Annual Report 2007
SAS Scandinavian Airlines Statement of incomeMSEK 2007 2006 2005
Passenger revenue 33,031 31,603 29,810
Charter revenue 1,906 1,740 1,523
Other traffic revenue 2,025 2,532 2,512
Other revenue 3,193 2,757 3,014
Revenue 40,155 38,631 36,859
Payroll expenses –8,510 –7,844 –7,790
Selling costs –512 –473 –617
Jet fuel –6,936 –6,883 –5,729
Government user fees –3,608 –3,540 –3,843
Catering costs –1,262 –1,242 –1,170
Handling costs –5,046 –4,962 –5,460
Technical aircraft maintenance –3,936 –3,825 –3,942
Computer and telecommunications costs –1,505 –1,798 –1,731
Other operating expenses –3,737 –2,988 –3,142
Operating expenses –35,051 –33,554 –33,424
Income before depreciation and leasing costs, EBITDAR 5,104 5,076 3,435
Leasing costs, aircraft –2,156 –2,102 –1,927
Income before depreciation, EBITDA 2,948 2,974 1,508
Depreciation –985 –1,187 –1,346
Share of income in affiliated companies –30 58 61
Capital gains 41 58 394
Operating income, EBIT 1,974 1,903 617
Net financial items –234 –667 –656
Income before tax, EBT 1,740 1,236 –39
Income before nonrecurring items 1,765 1,252 –374
Business area
Total SAS Scandinavian Airlines Scandinavian Airlines Norge Scandinavian Airlines Danmark Scandinavian Airlines Sverige Scandinavian Airlines International
Key figures 2007 2006 2005 2007 2006 2005 2007 2006 2005 2007 2006 2005 2007 2006 2005
Passenger revenue 33,031 31,603 29,810 10,905 10,173 9,733 9,382 9,045 8,443 6,834 6,333 5,982 5,914 6,060 5,675
Other revenue 7,124 7,028 7,049 2,507 2,406 2,525 2,277 1,879 1,820 1,945 1,940 1,795 1,711 1,745 2,061
Revenue 40,155 38,631 36,859 13,411 12,579 12,258 11,659 10,924 10,263 8,779 8,273 7,777 7,625 7,805 7,736
EBIT before nonrecurring items 1,999 1,919 279 1,038 396 621 433 186 –618 622 525 –311 43 169 –74
EBIT margin before nonrecurring items 5.0% 5.0% 0.8% 7.7% 3.1% 5.1% 3.7% 1.7% –6.0% 7.1% 6.3% –4.0% 0.6% 2.2% –1.0%
Number of destinations 126 124 109 43 45 39 51 51 66 57 45 45 10 11 11
Average flight distance, scheduled, km 814 811 793 626 631 609 670 662 649 762 739 721 7,176 7,193 6,822
Number of aircraft 4 198 1 180 1 191 1 62 58 56 43 54 59 36 42 45 11 11 11
Number of daily departures (average) 822 832 882 340 340 344 271 283 304 193 190 211 18 18 20
Aircraft, block hours/day 8.0 7.9 8.0 8.1 8.4 8.2 7.5 7.2 7.3 7.1 7.0 7.2 14.6 15.3 16.3
Regularity 97.6% 97.8% 98.4% 98.6% 97.6% 98.0% 96.7% 97.2% 98.3% 97.0% 99.0% 99.3% 98.6% 98.7% 98.6%
Punctuality (% within 15 min.) 79.3% 78.1% 84.5% 81.4% 80.1% 82.8% 76.8% 69.5% 80.7% 79.6% 82.7% 87.0% 74.7% 67.0% 75.2%
Average number of employees 3 6,139 6,852 8,244 2,465 2,604 2,840 2,188 1,983 1,628 2 1,704 1,615 1,468 2 782 650 671
of which women 49% 53% 53% 44% 55% 54% 57% 53% 71% 61% 61% 72% 44% 54% 63%
Carbon dioxide (CO2), 000 tonnes 4,019 4,069 4,245 1,056 1,059 1,031 1,022 998 1,065 783 787 859 1,158 1,226 1,290
Nitrogen oxides (NOX), 000 tonnes 16.9 17.3 17.4 3.4 3.5 3.7 4.5 4.4 4.0 2.6 2.7 2.9 6.4 6.7 6.9
Environmental index - - - 91 93 100 94 98 100 95 95 100 106 103 100
1 Including aircraft being leased out. 2 Excluding pilots. 3 For other employee key figures, see Note 3, page 65. 4 Excluding aircraft under wet leases in 2005-2006.
Key figures - commentsThe carriers in SAS Scandinavian Airlines show a slight uptick in performance in 2007 regarding punc-tuality. However, due to the negative effects from the Q400 and strikes in early 2007, regularity deterio-rated marginally. All airlines are concentrating efforts on improving both punctuality and regularity.
Scandinavian Airlines Danmark and Scandinavian Airlines Sverige both improved aircraft utilization in 2007, while capacity utilization for Scandinavian Airlines Norge and Scandinavian Airlines International declined, in part because of readjustments in the route network.
The unit cost for the business area rose by 3.9% during the year, and adjusted for jet fuel costs the increase was 1.7%. The increase is due in part to ex-penses for the Q400, but also to delays in implement-ing certain cost-cutting measures.
The aircraft fleet grew in 2007 from 180 to 198 including aircraft under wet leases after the delivery of two Boeing 737s. The network expanded during the year, and SAS Scandinavian Airlines flew to a total of 126 destinations. Scandinavian Airlines Sverige opened 12 routes in 2007.
Most of the environmental key figures improved during the year.
Statement of income - commentsThe business area SAS Scandinavian Airlines showed an improved underlying earnings performance in 2007. Revenue was up during the year by 3.9%, amounting to MSEK 40,155 owing to higher passen-ger volume and a 6.5% higher yield.
During the year the business area’s operating rev-enue rose by 4.5% to MSEK 35,051. The increase was due to higher capacity and negative effects of the fact that the Q400 aircraft were permanently grounded in October and replaced by wet leasing in order to offer customers the best possible service. Leasing costs rose by 2.6% to MSEK 2,156. The ECA agreement and Q400 had a negative impact on total earnings of just under SEK 1.3 billion. The business area’s income be-fore nonrecurring items amounted to MSEK 1,765, an improvement of 41% compared with 2006.
Scandinavian Airlines Norge posted an earnings improvement of MSEK 653. Scandinavian Airlines Danmark and Scandinavian Airlines Sverige also showed improved income before nonrecurring items of MSEK 277 and MSEK 121, respectively, despite negative effects from the Q400. Scandinavian Air-lines International had poorer earnings than in 2006 due to falling freight revenue.
Scandinavian Airlines Norge’s and Scandinavian Airlines Sverige’s EBIT margin amounted to 7.7% and 7.1%, respectively, close to the target of 9%.

46 SAS Group Annual Report 2007 • Facts
SAS Individually Branded Airlines Statement of incomeMSEK 2007 2006 2005 1
Passenger revenue (scheduled) 5,570 5,137 9,536
Freight revenue 86 81 127
Charter revenue 45 33 2,758
Other traffic revenue 353 229 352
Other revenue 1,136 1,051 1,579
Revenue 7,190 6,532 14,352
Payroll expenses –1,678 –1,596 –3,007
Selling costs –181 –162 –375
Jet fuel –1,173 –1,077 –2,400
Government user fees –841 –772 –1,905
Catering costs –134 –139 –634
Handling costs –611 –595 –950
Technical aircraft maintenance –517 –471 –1,057
Computer and telecommunications costs –54 –66 –263
Other operating expenses –1,031 –983 –1,841
Operating expenses –6,220 –5,863 –12,432
Income before depreciation and leasing costs, EBITDAR 970 668 1,920
Leasing costs, aircraft –474 –412 –1,247
Income before depreciation, EBITDA 497 257 673
Depreciation –176 –174 –312
Share of income in affiliated companies 57 43 39
Capital gains 12 0 15
Operating income, EBIT 390 126 415
Net financial items 5 –11 –136
Income before tax 395 114 279
Income before nonrecurring items 383 142 264
1 Including Spanair and Aerolineas de Baleares.
Business area
Key figures - commentsThe carriers in SAS Individually Branded Airlines post-ed positive performance for the majority of key figures. In part, qualitative key figures like punctuality and regu-larity improved for Blue1 and even for Widerøe despite the fact that Widerøe was negatively impacted by the permanent grounding of the Q400 in October.
All airlines’ fleet utilization increased in 2007. Comparing capacity utilization of aircraft in the air between airlines is often not relevant owing to differ-ences in networks. An airline like Widerøe with very short flight distances cannot have its aircraft in the air as long. The number of aircraft was unchanged during the year and amounted to 62.
Total unit cost fell at Widerøe, Blue1 and airBaltic during the year, and the units improved their competi-tiveness. Blue1 showed the biggest improvement, posting a 6% lower unit cost 2007 compared with 2006.
The airlines in the business area also expanded their networks in 2007 and increased the number of desti-nations served from 84 to 92. airBaltic saw the fastest growth, opening two new destinations and more routes during the year primarily eastward from Riga.
Most of the environmental key figures improved during the year.
Statement of income - commentsThe carriers in SAS Individually Branded Airlines grew in 2007, resulting in a 10% increase in revenue to MSEK 7,190. Growth was robust at airBaltic in particu-lar, which carried 41% more passengers than in 2006. Spanair is reported as a discontinued operation for the years 2006-2007 and is not included in the business area’s statement of income for those years.
In 2007 Widerøe and Blue1 carried out cost-cutting measures, which contributed to the business area’s operating expenses rising only 6.1% and amounting to MSEK 6,220. More aircraft resulted in a 15% rise in leasing expenses to MSEK 474. The business area’s income before nonrecurring items was up sharply, amounting to MSEK 383, an improvement of MSEK 241.
Widerøe and Blue1 reported their best full-year results ever. Widerøe’s EBIT margin for 2007 amounted to 5.8%, close to the target of 7%. Blue1’s EBIT margin amounted to 5.6%. airBaltic, which is undergoing extensive expansion, was able to show a positive earnings performance. Its EBIT margin amounted to 1.1%, far from the target of 9%. The poorer earnings are due in part to the fact that jet fuel costs could not be compensated for in the same way as at the other airlines.
Total SAS Individually Not consolidatedBranded Airlines Widerøe Blue1 airBaltic Estonian Air
Key figures 2007 2006 2005 3 2007 2006 2005 2007 2006 2005 2007 2006 2005 2007 2006 2005
Passenger revenue 5,570 5,137 9,536 2,000 1,990 1,736 1,784 1,777 1,523 1,787 1,370 1,084 747 744 662
Other revenue 1,620 1,395 4,816 1,051 951 1,095 236 241 181 309 181 127 45 9 16
Revenue 7,190 6,532 14,352 3,051 2,941 2,831 2,019 2,018 1,704 2,097 1,551 1,211 812 752 678
EBIT before nonrecurring items 379 151 415 5 177 35 89 113 –16 60 24 55 28 –28 5 –41 5 29 5
EBIT margin before nonrecurring items 5.3% 2.3% 2.9% 5 5.8% 1.2% 3.2% 5.6% –0.8% 3.5% 1.1% 3.6% 5.3% –3.5% 5 –5.4% 5 4.3% 5
EBT before nonrecurring items 383 142 264 162 22 60 117 –18 62 21 49 –19 –32 –36 39
Number of destinations 92 84 101 43 41 42 27 26 14 56 54 36 19 18 14
Average flight distance, scheduled, km - - - 221 229 222 704 689 557 918 898 909 1,104 1,266 1,258
Number of aircraft 62 62 103 2 28 29 30 13 17 14 21 16 16 9 4 5
Number of daily departures (average) 438 437 638 264 270 270 74 87 90 99 80 64 25 25 23
Aircraft, block hours/day - - - 6.7 6.7 6.7 8.5 8.2 8.0 9.3 9.1 8.7 10.4 10.5 10.2
Regularity - - - 96.7% 96.2% 95.3% 98.9% 98.6% 98.4% 99.6% 99.2% 99.2% 99.7% 99.1% 99.5%
Punctuality (% within 15 min.) - - - 87.2% 87.1% 85.8% 84.1% 83.9% 91.4% 82.5% 85.3% 87.9% 80.5% 84.5% 87.4%
Average number of employees 4 2,884 2,769 5,903 1,358 1,393 1,331 506 491 444 917 790 626 439 424 380
of which women 46% 45% 48% 35% 35% 37% 52% 46% 49% 54% 57% 55% 53% 54% 54%
Carbon dioxide (CO2), 000 tonnes 2,267 3 2,123 1,928 1 125 132 129 230 249 199 338 242 195 130 127 124
Nitrogen oxides (NOX), 000 tonnes 8,8 3 8.03 7.19 1 0.38 0.40 0.38 0.77 0.77 0.51 1.13 0.77 0.67 0.44 0.44 0.45
Environmental index – - - 92 95 100 89 89 100 83 89 100 83 94 100
1 Including airBaltic. 2 Excluding airBaltic when it was consolidated as of August 2005. 3 Including Spanair and Aerolineas de Baleares. 4 For other employee key figures, see Note 3, page 65. 5 EBIT including nonrecurring items.

47Facts • SAS Group Annual Report 2007
SAS Aviation Services
Statement of incomeMSEK 2007 2006 2005 1
Revenue 14,192 14,308 14,964
Payroll expenses –6,380 –6,197 –6,462
Handling costs –985 –1,063 –1,356
Technical aircraft maintenance –2,769 –2,551 –1,447
Computer and telecommunications costs –472 –532 –589
Other operating expenses –3,910 –4,073 –4,099
Operating expenses –14,515 –14,417 –13,953
Income before depreciation, EBITDA –324 –109 1,011
Depreciation –257 –316 –419
Share of income in affiliated companies –17 –41 –23
Capital gains - - 34
Operating income, EBIT –598 –466 603
Net financial items –166 –103 –101
Income before tax –764 –570 502
Income before nonrecurring items – 623 –150 633
Business area
Total SAS Aviation Services SAS Ground Services SAS Technical Services SAS Cargo
Key figures 2007 2006 2005 1 2007 2006 2005 2007 2006 2005 2007 2006 2005
Revenue, MSEK 14,192 14,308 14,964 6,055 5,866 6,185 4,874 4,895 5,167 3,336 3,645 3,308
of which external revenue 36.6% 38.3% 37.0% 20.1% 17.5% 17.3% 13.7% 16.2% 19.6% 99.0% 98.5% 95.6%
EBIT before nonrecurring items –457 –47 603 3 –141 55 241 –372 –176 181 33 114 101
EBIT margin before nonrecurring items –3.2% –0.3% 4.0% 3 –2.3% 0.9% 3.9% –7.6% –3.6% 3.5% 1.0% 3.1% 3.0%
EBT before nonrecurring items –623 –150 633 –167 43 228 –499 –249 93 22 99 84
Average number of employees 2 10,651 10,565 10,846 6,873 6,622 6,952 2,422 2,509 2,678 1,356 1,434 1,328
of which women 29% 28% 26% 39% 37% 37% 7% 7% 8% 21% 21% 18%
Unsorted waste, tonnes 4 754 545 432 - - - - - - - - -
Energy consumption, GWh 4 191 200 193 - - - - - - - - -
Environmental index - - - 101 106 100 93 99 100 - - -
1 Including SAS Flight Academy. 2 For other employee key figures, see Note 3, page 65. 3 EBIT including nonrecurring items. 4 The environmental numbers are total figures for SAS Aviation Services and all units owned or managed by SAS Facility Management (buildings and land).
Earnings - commentsThe units in SAS Aviation Services had a challenging year with a negative earnings performance. In all, the business area’s revenue fell by 0.8% to MSEK 14,192. The decline was due to pressure on prices at SGS and lower volume at STS. SAS Cargo was affected prima-rily by substantial overcapacity at the beginning of 2007, which led to lower prices.
The business area’s income before nonrecurring items deteriorated by MSEK 473 and amounted to MSEK –623 for the full year 2007.
None of the units reached their return target of an operating margin of over 4% for SGS and SAS Cargo and 5% for STS.
The number of employees increased marginally during the year and amounted to 10,651. The rise is due to an increase at SGS because more passengers were handled compared with the previous year. STS and SAS Cargo report fewer FTEs due to lower volumes.

48 SAS Group Annual Report 2007 • Facts
1 Excluding Spanair.
2 Total production includes scheduled traffic, charter, ad hoc flights and bonus trips, etc. This means that the figures deviate from the traffic statistics of the respective airlines. 3 Refers to Scandinavian Airlines.4 Refers to all SAS Group’s airlines.5 Excludes Blue1 in 1998-2004 and Braathens in 2002-2003.
Definitions and concepts, see back flap
SAS Group 2007 1 2006 1 2005 2004 2003 2002 2001 2000 1999 1998 3
Passenger traffic-related key figures
Number of destinations served, scheduled 152 146 147 146 130 123 128 92 97 101
Number of flights, scheduled 459,922 462,970 554,838 530,597 502,145 536,768 445,584 460,496 460,749 334,693
Number of passengers carried, total (000) 2 33,420 32,416 41,033 38,253 36,399 38,775 25,103 25,310 23,990 21,699
Number of passengers carried, scheduled (000) 31,179 30,294 36,312 34,250 31,005 32,562 24,689 25,155 23,755 21,499
Available seat kilometers, total (mill.) 2 48,107 46,938 62,445 60,173 54,800 54,235 38,120 36,334 35,491 31,766
Available seat kilometers, scheduled (mill.) 43,682 42,729 53,689 51,478 47,634 47,079 36,765 34,754 33,930 31,704
Revenue passenger kilometers, total (mill.) 2 35,397 34,552 44,566 41,287 36,985 37,237 23,906 23,519 21,722 20,883
Revenue passenger kilometers, scheduled (mill.) 31,682 31,086 35,864 33,312 30,403 30,882 23,567 23,243 21,639 20,821
Passenger load factor, total (%) 2 73.6 73.6 71.4 68.6 67.5 68.7 62.7 64.7 61.2 65.7
Average passenger distance, total (km) 1,059 1,066 1,086 1,079 1,016 960 952 929 905 962
Weight-related key figures 5
Available tonne kilometers, ATK, total (mill. tonne km) 6,204 6,185 7,614 7,302 6,227 6,084 4,922 4,699 4,698 4,501
Available tonne kilometers, scheduled (mill. tonne km) 5,374 5,287 6,376 6,068 5,201 5,171 4,873 4,660 4,637 4,459
Available tonne kilometers, other (mill. tonne km) 831 898 1,238 1,233 1,026 914 49 38 61 42
Revenue tonne kilometers, RTK, scheduled (mill. tonne km) 5,727 5,676 6,157 5,393 4,544 4,523 3,320 3,269 2,957 2,680
Passengers and excess baggage (mill. tonne km) 3,474 3,390 4,298 3,844 3,234 3,312 2,295 2,237 2,076 1,877
Total load factor, scheduled (%) 92.3 91.8 80.9 73.9 73.0 74.3 67.5 69.6 62.9 59.5
Traffic revenue/RTK (SEK) 7.51 7.29 7.57 8.06 9.91 11.41 11.69 11.38 11.50 11.90
Key figures for costs and efficiency
Total unit cost 0.77 0.79 0.70 0.71 0.81 0.88 1.01 0.91 0.88 0.93
Jet fuel price paid, average (USD/tonne) 786 707 564 434 314 268 295 311 199 218
Revenue-related key figures
Passenger revenue/Revenue pass. km, scheduled, yield (SEK) 1.22 1.18 1.10 1.11 1.27 1.48 1.55 1.44 1.40 1.36
RASK, Pass. revenue/Available seat kilometers, scheduled (SEK) 0,88 0.86 0.73 0.72 0.81 0.97 1.00 0.96 0.89 0.89
Environmental key figures
CO2, gram/Revenue passenger kilometer 130 4 131 4 136 4 154 158 159 176 179 192 196
Climate index (Environmental index 3 until 2004) 92 4 94 4 100 4 76 78 78 87 88 88 96
Group operational key figuresThe key figures refer to consolidated units. airBaltic was consolidated during 2005. Spanair was consolidated in March 2002 and is included up to and including 2005. Blue1 and Widerøe have been included in the key figures since 1999.
The passenger load factor performed very favourably during 2004-2006.
RASK was affected by the passenger load factor and yield. RASK performed well in 1999-2001 primarily owing to high yields.
The yield trend from 1998 to 2002 was relatively stable and rising. From 2003 to 2005 there was a dramatic deterioration of the yield.
Yield performanceSEK per revenue passenger kilometer
1.0
1.1
1.2
1.3
1.4
1.5
1.6
1.7
07060504030201009998
Passenger load factor%, SAS Group total
60
65
70
75
80
07060504030201009998
0.6
0.7
0.8
0.9
1.0
07060504030201009998
Passenger revenueSEK per available seat kilometer (RASK)

49Facts • SAS Group Annual Report 2007
Earnings performance - a look back
The SAS Group saw weak earnings performance at the beginning of the 1990s due to the global recession and Gulf War. Drastic cost-cutting measures were implemented in 1991-1993, which resulted in the SAS Group posting its best earnings to date in 1995. Earnings declined somewhat after that on account of higher costs.
2001 opened strong, but the terrorist attacks of September 11 precipitated the biggest crisis in the airline industry since the Gulf War. Follow-ing an improvement in 2002, SARS and stiffening competition in 2003 resulted in a deterioration in earnings.
The SAS Group initiated Turnaround 2005, which resulted in a return to profitability in 2005 after four years of losses.
The positive trend continued in 2007 thanks to favorable cyclical factors and positive traffic results.
Performance in 2007The SAS Group carried more than 31 million passengers.SAS decided to permanently ground the Q400.The passenger load factor amounted to 72.5% (72.8%).Income before capital gains and nonrecurring items amounted to MSEK 1,242, despite negative earnings effects of around MSEK 700 from the Q400.
Performance of income before capital gains and nonrecurring items, 1990-2007
MSEK
–3,000
–2,000
–1,000
0
1,000
2,000
3,000
070503019997959391
SAS Group 1 2007 2 2006 2 2005 2 2004 3 2003 3, 5 2002 3, 5 2001 5 2000 5 1999 5 1998 5
Statements of income, MSEK
Revenue 52,251 50,152 55,501 58,093 57,655 64,906 51,433 47,540 43,746 40,946
Operating income before depreciation 2,733 2,618 2,548 1,779 597 3,463 743 3,710 2,731 4,101
Depreciation –1,478 –1,757 –2,170 –2,846 –3,046 –2,953 –2,443 –2,192 –2,087 –2,125
Share of income in affiliated companies 9 59 76 157 39 –409 –70 –1 77 –20
Income from the sale of shares in subsidiaries and affiliated companies - - 41 5 651 817 –24 1,033 283 1
Income from the sale of aircraft and buildings 41 85 182 113 649 –320 1,165 490 726 1,014
Income before tax 1,052 177 –246 –1,833 –1,699 –543 –1,140 2,829 1,885 2,921
Income from discontinued operations –130 4,528 577 - - - - - - -
Income before capital gains and nonrecurring items in continuing and discontinued operations 824 1,279 114 –1,701 –2,450 –829 –2,282 1,291 459 1,905
Income before capital gains and nonrecurring items in continuing operations 1,242 727 –106 - - - - - - -
Balance sheets, MSEK
Fixed assets 26,663 31,189 36,439 38,458 42,768 46,845 42,407 33,422 28,587 26,491
Current assets, excluding liquid assets 13,216 9,172 12,893 10,748 9,441 9,244 8,693 7,024 7,133 5,958
Liquid assets 8,891 10,803 8,684 8,595 9,066 10,721 11,662 8,979 8,495 8,024
Total shareholders’ equity 17,149 16,388 12,081 11,044 12,926 15,261 15,807 17,651 16,145 15,359
Long-term liabilities 11,274 17,847 23,608 25,193 25,633 27,096 24,569 14,895 12,418 11,188
Current liabilities 20,347 16,930 22,327 21,564 22,716 24,453 22,386 16,879 15,652 13,926
Total assets 48,770 51,164 58,016 57,801 61,275 66,810 62,762 49,425 44,215 40,473
Cash flow statements, MSEK
Cash flow from operating activities 2,866 2,102 1,507 –1,440 –1,167 2,138 –350 3,949 1,483 3,665
Investment –2,908 –2,299 –1,827 –3,865 –4,488 –9,919 –11,676 –9,886 –5,845 –6,112
Sale of fixed assets etc. 2,695 9,784 2,797 6,853 5,535 6,055 8,382 5,559 6,601 2,360
Cash flow before financing activities 2,653 9,587 2,477 1,548 –120 –1,726 –3,644 –378 2,239 –87
New issue - - - - - 197 - - - -
Dividend - - - - - - –754 –666 –637 –678
External financing, net –4,492 –7,438 –2,426 –2,016 –1,480 588 7,081 1,528 –1,131 –1,039
Cash flow for the year –1,839 2,149 51 –468 –1,600 –941 2,683 484 471 –1,804
Key figures
Gross profit margin, % 5.2 5.2 4.6 3.1 1.0 5.3 1.4 7.8 6.2 10.0
Return on capital employed (ROCE), % 4 6.7 18.2 5.0 –1.1 0.0 3.5 0.0 10.9 8.7 13.4
Return on book equity after tax, % 4 3.8 37.8 1.4 –14.9 –11.7 –1.4 –6.3 13.6 9.4 15.5
Equity/assets ratio, % 35 32 21 19 21 23 25 36 37 38
Ten-year financial overview Statements of income & balance sheets, cash flow and key figures
1 Pertains to the SAS Group pro forma 1998-2000. 2 Discontinued operations are reported according to IFRS 5. 3 Comparative figures for 2004 have been restated according to IFRS. Errors relating to Spanair’s accounts
have been corrected for 2002-2004. 4 Includes income from discontinued operations. 5 For 2003 and previous years SAS Group accounting was according to Swedish Financial Accounting Standards Council recommen-
dations. For differences between IFRS and previous accounting policies see the SAS Group’s 2005 Annual Report. Definitions and concepts, see back flap.

50 SAS Group Annual Report 2007 • Facts
Ten-year financial overview Financial key figures and return requirements
SAS Group 1 2007 2006 2005 2004 2 2003 2, 4 2002 2, 4 2001 4 2000 4 1999 4 1998 4
Income and capital concepts included in CFROI, MSEK
Income before depreciation, EBITDA, in continuing and discontinued operations 2,646 3,663 2,984 1,779 597 3,463 743 3,710 2,731 4,101
+ Operating lease costs, aircraft 3,472 3,527 3,133 2,689 2,935 3,747 2,425 1,898 1,346 1,027
EBITDAR 6,118 7,190 6,117 4,468 3,532 7,210 3,168 5,608 4,077 5,128
– Operating lease revenue, aircraft –174 –194 –155 –163 –145 –85 –16 –15 –66 –161
Adjusted EBITDAR in continuing and discontinued operations 5,944 6,996 5,962 4,305 3,387 7,125 3,152 5,593 4,011 4,967
Adjusted average capital employed, MSEK
+ Total shareholders’ equity 16,687 12,706 11,921 11,823 13,655 14,914 17,105 16,369 15,393 14,549
+ Surplus value, aircraft –208 371 –161 –674 167 1,318 4,638 5,420 4,911 4,073
+ Capitalized leasing costs, net (x7) 23,191 22,567 18,967 18,130 22,844 21,766 14,818 10,840 7,670 5,383
– Equity in affiliated companies –1,054 –1,132 –853 –676 –519 –803 –1,087 –895 –1,126 –1,102
+ Financial net debt 2,447 11,136 16,119 18,592 19,031 16,905 8,661 4,465 3,720 1,026
Adjusted capital employed 41,063 45,648 45,993 47,195 55,178 54,100 44,135 36,199 30,568 23,929
Cash Flow Return On Investments CFROI, % 14.5 15.3 13.0 9.1 6.1 13.2 7.1 15.5 13.1 20.8
Other financial data, MSEK
Financial income 787 585 492 357 1 096 1,150 618 518 868 634
Financial expenses –1,045 –1,367 –1,465 –1,399 –1,684 –2,291 –1,129 –729 –713 –684
Interest-bearing liabilities 12,042 16,478 26,337 27,280 28,866 29,782 26,124 14,563 11,802 10,277
Operating leasing capital 23,086 23,331 20,846 17,682 19,530 25,634 16,863 13,181 6,960 6,062
Net debt –8,265 –4,671 5,865 9,956 11,466 11,574 7,652 794 –107 484
Financial net debt 1,231 4,134 14,228 17,377 18,122 17,872 12,824 4,372 2,336 1,707
Debt/equity ratio 3 0.07 0.25 1.18 1.57 1.40 1.17 0.81 0.25 0.14 0.11
Adjusted financial net debt (NPV)/equity 0.80 1.03 2.21 2.53 2.18 2.01 1.37 0.45 0.35 0.25
Adjusted financial net debt (x7)/equity 1.42 1.68 2.90 3.17 2.91 2.85 1.89 1.00 0.73 0.58
Interest expenses/average gross debt, % 7.8 6.1 5.2 4.3 6.5 6.9 4.4 5.2 5.4 6.13
Interest coverage ratio 1.8 4.4 1.3 –0.3 0.0 0.7 0.0 5.0 3.6 5.3
1 Pertains to the SAS Group pro forma 1998-2000. 2 Comparative figures for 2004 have been restated according to IFRS. Errors relating to Spanair’s accounts have been corrected for 2002-2004. 3 Calculated on financial net debt. 4 For 2003 and previous years SAS Group accounting was according to the recommendations of the Swedish Financial Accounting Standards Council. For differences between IFRS and
previous accounting policies see the SAS Group’s 2005 Annual Report.
Definitions and concepts, see back flap.
0
5,000
10,000
15,000
20,000
07060504030201009998
Financial net debtMSEK
Performance of financial key figures
One of the SAS Group’s financial objectives is achieving a CFROI of at least 25% over a busi-ness cycle. Owing to expected increases in investment moving forward, the Group raised its target to 25% from 20% in 2007. The return target shows how well the company’s income before capital costs performs relative to the actual capital input, including off-balance sheet commitments. Off-balance sheet commitments primarily refer to aircraft leasing, which accord-ing to capital market practice is multiplied by a factor of seven. Owing to the difficult years in the early 2000s, the SAS Group did not meet its re-turn target, but did perform positively thanks to the introduction of Turnaround 2005 and other streamlining measures.
The other financial data show that the SAS Group’s Turnaround 2005 and capital release program did a great deal to improve the Group’s financial position. Interest-bearing liabilities amounted to SEK 29.8 billion in 2002, but have been gradually paid down to SEK 12.0 billion by the end of 2007.
Since 2003, financial net debt has declined by MSEK 16,891 to MSEK 1,231. The adjusted debt/equity ratio (adjusted financial net debt (x 7)/equity) has improved by 149 percentage points since 2003 to 142%.
The SAS Group’s goal is for the adjusted debt/equity ratio to be less than 100%.

51Facts • SAS Group Annual Report 2007
YearlyPassengers/ Desti- Daily RPK oper. rev.
year(mill.) nations Countries Aircraft departures (bill.) (USD bill.) Employees
Air Canada 32 174 40 335 1,354 72.5 9.3 32,000
Air New Zealand 12 49 16 96 570 24.6 2.5 10,829
ANA - All Nippon Airways 51 75 10 209 899 60.7 12.8 22,170
Asiana Airlines 14 74 17 59 256 22.0 3.6 7,867
Austrian 11 130 66 104 440 23.4 3.4 8,468
bmi 5 33 14 42 300 5.0 1.7 4,077
LOT Polish Airlines 4 61 32 53 230 6.7 0.9 3,250
Lufthansa 53 192 78 430 1,957 110.3 25.0 94,510
Scandinavian Airlines 25 126 34 185 822 27.3 5.9 7,597
Singapore Airlines 18 65 35 92 220 89.1 9.3 13,924
South African Airways 8 34 26 58 166 25.5 2.9 11,000
Spanair 10 39 10 63 283 9.4 1.6 3,415
Swiss 11 69 42 69 370 22.1 3.3 7,200
TAP 7 48 26 48 200 16.6 2.1 5,664
THAI 19 73 34 85 121 54.0 4.6 26,435
United Airlines 69 210 28 460 3,600 188.6 19.3 55,000
US Airways 36 > 225 28 358 4,000 59.7 11.6 35,995
Regional members:
Adria Airways 1 24 18 12 30 1.0 0.2 592
Blue1 2 27 11 13 74 1.4 0.3 506
Croatia Airlines 1 29 19 11 65 1.0 0.2 1,022
Alliances:
Star Alliance™ 389 883 155 2,782 15,957 821.1 120.6 351,521
SkyTeam™ 364 751 151 2,189 14,100 765.9 93.1 279,133
oneworld™ 321 688 142 2,339 9,297 711.4 68.7 263,350
Source: Airline Business magazine September 2007, alliance websites.
Key figures - world’s biggest airline alliances in 2007Percentage of world total ASK RPK Passengers Oper. rev. per year
Star Alliance™ 20.8% 19.8% 17.0% 25.2%
SkyTeam™ 15.6% 18.5% 16.0% 19.1%
oneworld™ 18.2% 17.2% 14.1% 14.1%
Total 54.6% 55.5% 47.1% 58.4%
Source: Airline Business magazine September 2007.
Star Alliance™ key figures for 2007
SAS Scandinavian AirlinesEuroBonus , thousands 2007 2006 Change
Total number of members 2,692 2,642 1.9%
in Denmark 486 462 5.2%
in Norway 855 863 –1.0%
in Sweden 708 683 3.7%
international 643 633 1.5%
Proportion of Gold members 2.6% 2.7% –0.1 pts.*
Proportion of Silver members 5.9% 6.0% –0.1 pts.*
* Change in percentage points (pts.).
SAS Individually Branded AirlinesEuroBonus , thousands 2007 2006 Change
Finland (EuroBonus) 194 181 8%
Estonia (EuroBonus) 25 21 19%
Latvia (EuroBonus) 21 18 16%
Lithuania (EuroBonus) 10 8 22%
Total 250 228 9,8%
Loyalty programs Approvals and certifications
One of six environmental objectives is for the SAS Group to have an environmental management system in accordance with ISO 14001 by 2011 at the latest. Already today SAS Group has an environmental management system based on ISO 14001.
SAS Cargo holds ISO 14001 and ISO 9001 certification.
All consolidated airlines in the Group are IOSA certified through IATA. SAS Technical Services Maintenance Organization and SAS Main-tenance Training were approved during the year as EASA Part 145 and 147 organizations, respectively. These units were previously JAA-approved.

52 SAS Group Annual Report 2007
Report by the Board of DirectorsThe Board of Directors and the President of SAS
AB hereby submit the annual report for SAS AB
and the SAS Group for fiscal year 2007.
MARKET PERFORMANCE
2007 was a good year for the entire airline industry.
Growth was very healthy, which in combination with
moderate capacity increases resulted in higher
passenger load factors and unit revenues (yields).
The SAS Group performed well during the first
three quarters of 2007, with good passenger load
factors and stable yield. The fourth quarter saw a
weakening primarily due to the problem with the
Q400 fleet. The deployment of replacement aircraft
gave rise to additional capacity in certain markets,
which led to lower passenger load factors.
CHANGE IN GROUP STRUCTURE
SAS Flight Academy was divested in February
2007 to STAR Capital Partners for MSEK 550. The
capital gain amounted to MSEK 359. The Group’s
remaining shareholding in Rezidor Hotel Group
was sold in May, whereby a gain of MSEK 513 was
realized. An agreement regarding the final pur-
chase price in the divestment of SAS Component
in 2005 was concluded during the second quarter
and was charged to earnings in the amount of
MSEK 445. At the end of June, the Group acquired
a 5.1% stake in Spanair S.A. As a result, the SAS
Group owns 100% of the shares in Spanair S.A. In
September the ground handling company Newco
was sold for MSEK 322, with a capital gain of
MSEK 169.
During the fourth quarter, preparations were
initiated to sell Spanair S.A. and Aerolineas de
Baleares. Accordingly, the companies’ assets
and liabilities are reported as assets held for sale.
Income after tax is reported among discontinued
operations. Impairment testing of goodwill was
conducted for both companies. On the basis of a
market value assessment an impairment charge of
MSEK 300 was recognized. The sale is expected to
be concluded during the second quarter of 2008.
EUROPEAN COOPERATION AGREEMENT
(ECA)
The European Cooperation Agreement was a col-
laboration between Scandinavian Airlines, Lufthansa
and British Midland International that began in
January 2000. Scandinavian Airlines’ share of any
losses is 45%. The agreement was approved by the
European Commission for a period of eight years
and expired on December 31, 2007.
With the aim of creating a competitive intra-
European traffic system, the ECA combined the
three airlines’ route networks within the EEA
(European Economic Area) to, from and via London
Heathrow and Manchester airports.
Due to continued competition and weak earn-
ings performance, the ECA’s negative impact on
SAS Group earnings continued in 2007, with MSEK
–652 (–415).
FINANCIAL RISK MANAGEMENT
The SAS Group is exposed to various types of
financial risk. All risk management is handled
centrally and in accordance with the financial policy
set by the Board. The SAS Group uses derivative
instruments as part of its risk management to
limit its currency and interest rate exposure. See
Note 29.
THE SAS SHARE
Two share classes
SAS AB has two classes of shares, common shares
and subordinated shares.
Currently, only 164,500,000 common shares
have been issued, which, all together, constitutes
a registered share capital of SEK 1,645,000,000.
Common shares give shareholders all the rights laid
down in the Companies Act and Articles of Associa-
tion.
In addition, the capacity exists to issue special
subordinated shares to safeguard the compa-
ny’s air traffic rights. Subordinated shares give
shareholders the right to participate in and vote
at the company’s shareholders’ meetings. On the
other hand, subordinated shares do not entitle
shareholders to dividends or participation in bonus
issues. If subordinated shares are redeemed or the
company is dissolved and its assets are replaced,
holders of subordinated shares receive compen-
sation equivalent only to the nominal value of the
shares plus an interest rate factor.
Protection of the Group’s air traffic rights in the
Articles of Association
For aviation policy reasons the company’s Articles
of Association authorizes, in part, the mandatory
redemption of shares by means of a reduction of
share capital and, in part, should redemption not
be possible or judged adequate, an option to issue
Annual ReportCorporate Identity Number 556606-8499
Scandinavian Airlines Danmark 18.5%
Scandinavian AirlinesSverige 14.0%
SAS Cargo 5.3%
SAS Technical Services 7.7%
SAS Ground Services 9.6%
airBaltic 3.3%
Blue1 3.2%
Widerøe 4.9%
Scandinavian AirlinesInternational 12.1%
Scandinavian Airlines Norge 21.4%
SAS Group’s revenue breakdown in 2007
SAS Group’s income before tax, 1998-2007MSEK
–2,000
–1,000
0
1,000
2,000
3,000
4,000
5,000
07060504030201009998
Handling costs 3.9%
Payroll expenses 34.9%
Other 14.8%
Computer and telecom. costs 4.5%
Technical aircraft maintenance 6.9%
Leasing costs, aircraft 5.2%
Selling costs 1.4%
Jet fuel 16.4%
Catering costs 2.8%
Governmentuser fees 9.2%
SAS Group’s breakdown of costs in 2007

53SAS Group Annual Report 2007
subordinated shares for subscription with the sup-
port of previously issued share warrants.
A precondition for both of these actions is an
assessment by the company’s board that a direct
threat exists against the air traffic rights of the
company or any of its subsidiaries when the non-
Scandinavian holding or control of the company or
any subsidiary increases, causing the company or
the subsidiary to infringe or risk infringing relevant
provisions on ownership and control in either
any bilateral aviation agreement that Denmark,
Norway or Sweden has entered into with another
country or equivalent provisions pursuant to laws
or regulations pertaining to the state of air traffic in
the EU/EEA.
In that case the Board may decide to manda-
torily redeem a sufficient number of shares not
owned by shareholders domiciled in Denmark,
Norway or Sweden along with shares that, even if
they are held by a legal entity domiciled in any of
these countries, are controlled, directly or indirect-
ly, by a person or company outside of these three
countries, so as to ensure continued Scandinavian
ownership and control. Preferably, such manda-
tory redemption of shares shall be done with
shares owned or controlled by a person or com-
pany outside the EU/EEA. Before the redemption
takes place, the shareholders shall be given the
opportunity to sell their shares voluntarily within a
prescribed period. Redemptions are made subse-
quently without refund to the shareholder.
Should the Board deem the action of redeem-
ing common shares not possible or adequate, the
Board may propose a shareholders’ meeting to de-
cide to issue subordinated shares in such number
as to safeguard continued Scandinavian ownership
and control. Such a decision must be approved by
at least half of the votes cast at the meeting. The
subordinated shares thus issued are subscribed
for with the support of previously issued share war-
rants, which currently are held by a subsidiary of
SAS AB but which the Board of SAS AB has the right
to decide to transfer to one or more appropriate legal
entities domiciled in Denmark, Norway or Sweden
as soon as this is judged necessary for aviation
policy reasons. All together, 75,000 share war-
rants have been issued, giving entitlement to new
subscriptions for all together 75,000,000 subordi-
nated shares, which would increase the company’s
share capital by a maximum of SEK 750,000,000.
As soon as the threat no longer exists the Board
shall see to it that the issued subordinated shares
are redeemed.
Furthermore, for aviation policy reasons, the
Articles of Association contain certain suitability
and qualifications requirements for Board mem-
bers to ensure that the Board will at all times
have the composition it needs to ensure that the
company and its subsidiaries will be able to retain
their air traffic rights. These requirements include
citizenship, domicile and knowledge and experi-
ence of the social, business and cultural conditions
prevailing in the Scandinavian countries. Beyond
these requirements there are no restrictions or vot-
ing rules pertaining to the appointment or removal
of Board members.
Ownership and control
Currently there are only three shareholders who
each own and control more than 10% of the voting
rights for all shares in the company. The Danish
government owns 14.3%, the Norwegian govern-
ment owns 14.3% and the Swedish government
owns 21.4%. All together, the three states own
50.0% of the shares in the company. Furthermore,
at the beginning of the year, the share of Scandina-
vian shareholders amounted to approximately 85%
and the share of non-Scandinavian shareholders
came to approximately 15% of the total number of
shareholders in SAS AB.
Apart from the requirement under the Articles
of Association that shareholders vote the entire
number of shares they own or represent by proxy,
no restrictions exist concerning the voting rights
of shareholders at shareholders’ meetings. Nor
are there any special plans, such as employee
benefit plans or the like, through which company
or Group employees own shares with restricted
voting rights.
The company has no knowledge of agreements
between shareholders that would restrict the capac-
ity of shareholders to vote at a shareholders’ meet-
ing or their right to freely transfer such shares.
Besides the aforementioned share warrants for
subordinated shares (which require the approval
of the shareholders’ meeting), the Board currently
has no authorization to decide that the company
will issue new shares or repurchase its own shares.
Effects of a public takeover bid
SAS AB is currently party to a number of loan agree-
ments in which the lending banks and financial insti-
tutions have been given certain rights and powers,
including the right to require immediate repayment
of issued loans, in the event of changes in the major-
ity stake or control of the company.
Through his employment contract, Mats Jansson,
President and CEO of SAS, is entitled to severance
pay in the event of noncontractual termination by
the company and, in certain cases, if he resigns in
response to a change in ownership or control of
SAS, in the manner described in Note 3.
CAPITAL MANAGEMENT
Profitability targets
The SAS Group’s overall objective is to create value
for its shareholders. The SAS Group’s profitability
target is an EBT margin of 7%, which corresponds
to a CFROI of at least 25%, or income after tax of
about SEK 4 billion.
Dividend policy
The SAS Group’s annual dividend is determined by
taking into account the Group’s earnings, financial
position, capital requirements and relevant macro-
economic conditions. Over a business cycle the
dividend is to be in the region of 30-40% of the
Group’s income after standard tax.

54 SAS Group Annual Report 2007
Targets for financial position
Adjusted equity/assets ratio > 35%
Adjusted debt/equity ratio < 100%
Financial preparedness 20% of operating revenue
WORK OF THE BOARD OF DIRECTORS
The Board of Directors of SAS AB consists of ten
members, of whom seven are elected by the
Annual General Shareholders’ Meeting. The three
other members plus six deputies are elected by the
employee organizations in Denmark, Norway and
Sweden.
The Board’s work is primarily governed by the
Swedish Companies Act, the Articles of Associa-
tion, the Swedish Code of Corporate Governance
and the formal work plan adopted by the Board
each year, which regulates the division of the
Board’s work between the Board and its commit-
tees and among the Board, its Chairman and the
President. This process is evaluated each year.
The Board appoints from among its own members
the members of the Board’s two committees, the
remuneration committee and the audit commit-
tee. The Board’s work follows a yearly agenda with
regular business items as well as special topics.
All Board members were reelected at the Annual
General Shareholders’ Meeting on April 17, 2007.
Egil Myklebust was elected Chairman of the Board.
The composition of the Board of Directors in 2007
appears on page 92.
At the Annual General Shareholders’ Meeting
on April 9, 2008, the nomination committee of SAS
AB will recommend that Fritz H. Schur be elected
the new Chairman of the Board of SAS AB. At the
same time the nomination committee will propose
that Dag Mejdell be elected to the Board.
Working closely with the President, the Chair-
man of the Board monitors the company’s per-
formance, plans Board meetings, and ensures that
the other members of the Board always receive
high-quality information about the Group’s finances
and performance, and that the Board evaluates its
work and that of the President each year.
In 2007 the Board held 11 meetings, of which
10 were ordinary and one extraordinary. In addi-
tion, one meeting was held per capsulam. At the
ordinary meetings the Board discussed the regular
business items presented at the respective meet-
ings, such as business and market conditions,
financial reporting and follow-up, the company’s
financial position and investment. Additionally, at
various meetings the Board discussed matters
involving flight safety work, internal control, the
work of the Board, the year-end report, interim
reports, strategy and business plan, and financial
frameworks.
Special topics discussed by the Board during
the year include the Q400 accidents, strategic plan
for 2007-2011, sale of SAS Flight Academy and
Newco, strikes and industrial disputes, environ-
mental and sustainability issues, competition law
investigations involving SAS Cargo, investment in
aircraft and continued cost-saving and streamlin-
ing measures.
On two occasions during the year, the compa-
ny’s auditor met with the Board, presenting the
program for auditing work, reporting observations
from the examination of the interim accounts as of
September 30, the audit of the annual report, and
an evaluation of internal control.
The main duty of the Board’s two committees is
to prepare business for the Board’s decision. The
remuneration committee consists of three mem-
bers elected by the shareholders’ meeting and the
audit committee of four members elected by the
shareholders’ meeting. In 2007 the audit commit-
tee held four recorded meetings, examining the
scope and performance of external and internal
auditing work, financial reporting and internal
control. During the year, the remuneration com-
mittee held eight recorded meetings in addition to
a large number of informal contacts in connection
with the determination of guidelines and principles
for remuneration and other employment terms for
the President and company executives and recruit-
ment of new Group management members.
The fees paid to Board members and remunera-
tion for serving on Board committees are reported
on page 66.
GUIDELINES FOR REMUNERATION OF
SENIOR EXECUTIVES
The principles for remuneration of Group Manage-
ment are prepared by the remuneration committee
and subsequently discussed by the Board, which
presents the proposal to the Annual General Share-
holders’ Meeting for a decision. Remuneration of
the President is to be decided by the Board within
its framework of approved policies following remu-
neration committee preparation and recommenda-
tion. Remuneration of other senior executives is to
be decided by the President within the framework
of remuneration policies and after consulting with
the remuneration committee.
The guidelines set at the 2007 Annual General
Shareholders’ Meeting are presented in Note 3
and page 89. There were no deviations from these
guideline during the year.
The guidelines to be proposed to the Annual
General Shareholders’ Meeting on April 9, 2008,
are unchanged in relation to the remuneration poli-
cies adopted at the 2007 Annual General Share-
holders’ Meeting.
SAFETY WORK
The SAS Group has a high level of flight safety
thanks to rigorous quality control routines and the
commitment of its employees and management.
All SAS Group airlines are IOSA-certified. IOSA
certification may be viewed as the airline industry’s
answer to ISO 9000 certification. The flight safety
level of the SAS Group in 2007 is considered nor-
mal in relation to current industry standards.
After three accidents with the Dash 8 Q400
on September 9, September 11 and October 27,
2007, the Board of SAS AB decided to permanently
ground the entire fleet consisting of 27 Dash 8
Q400s. Landing gear were involved in all three
cases. The preliminary investigations by the ac-
cident investigation boards, regarding the first two
accidents, point to a design flaw.
SAS Group maintenance operations are largely
performed by SAS Technical Services (STS). Along
with the airlines they perform quality work that is
analyzed and evaluated on the basis of reported
incidents, inspections and audits. Other suppliers’
maintenance is performed under similar contract
terms, which are checked and monitored separate-
ly. Maintenance programs, agreements and related
issues are approved by the authorities.
In 2007 several Group airlines reported various
types of technical deficiencies. An action program
has been initiated to correct these deficiencies.
On the basis of experience and new requirements
there is a particular focus on quality control in main-
tenance work, changes and improvements. Scandi-
navian Operations Management (SOM) has an action
plan intended to improve its management in accord-
ance with the airworthiness directive. The action plan
was approved by the OPS Committee* at its meeting
in February and was implemented in 2007.
LEGAL ISSUES
On February 14, 2006, the European Commission
and the U.S. Department of Justice each made
public investigations into possible price fixing in
the air cargo industry. SAS is one of several air
cargo carriers involved in the investigations. In
addition, a number of class-action civil lawsuits
brought against SAS and other air cargo carriers
in the United States, alleging civil damages and
seeking monetary compensation, are pending in
a consolidated civil case in New York.
* Denmark’s, Norway’s and Sweden’s civil aviation authorities’ cooperation committee, primarily tasked with coordinating national regulations and oversight responsibility regarding the airline operations conducted by the SAS Consortium.

55SAS Group Annual Report 2007
SAS is continuing to cooperate with the authori-
ties in the investigations and to defend itself in the
civil litigation. SAS also continues to conduct its
own internal review.
In the U.S., no formal charges have been filed
against SAS to date. As part of its cooperation with
the U.S. authorities, SAS is engaged in discussions
with them concerning a possible resolution of the
investigation.
In the EU, the European Commission issued a
Statement of Objections on December 20, 2007 to
a large number of air carriers, including SAS Cargo.
In the Statement of Objections, the Commission
alleges that certain investigated practices in the
air cargo sector constituted infringements of EU
competition rules. Due to the complexity of interna-
tional air transportation rules and the existence of
alliances, a full analysis and understanding of the
Commission’s allegations requires access to the
Commission’s underlying comprehensive docu-
mentation. Not until SAS has had an opportunity to
go through the documentation will SAS be able to
make further comments.
It is not possible at this time to predict the
outcomes of either investigation by the authori-
ties or of the civil lawsuits. Taking the nature of
the allegations into account, adverse outcomes
are likely to have a substantial negative financial
impact on SAS.
SAS GROUP’S CONTRIBUTION
TO SUSTAINABLE DEVELOPMENT
The SAS Group has an overarching sustainability
policy which, taking the Group’s requirement
regarding long-term financial performance into ac-
count, guides its efforts to reduce its environmental
impact and contribute to social progress. Sustain-
ing and developing the skills of its employees is
an inherent part of this. As an important indication
of this responsibility and to clarify and summarize
SAS values and policies, the Group has a Code of
Conduct covering all employees. In 2007 new envi-
ronmental targets and strategies were drawn up to
bolster SAS’s focus on environmental protection.
Since 1996 the SAS Group has measured its eco-
efficiency with an environmental index, which is the
most important tool for managing and following up
the environmental work of the Group and its compa-
nies. In 2007 this index was restructured so that all
subsidiaries have 2005 as their base year in the en-
vironmental index. In addition, a Group-wide climate
index covering the airlines’ greenhouse emissions
has been prepared. Environment targets have been
set for all subsidiaries up to 2011. In this effort, the
development of an environmental index is one of the
parameters against which subsidiaries will be evalu-
ated. The climate index for 2007 was 92 (94). This is
the first time operations have ever achieved such a
relatively low environmental impact.
The goal of the Group’s airlines is to lower their
relative fuel consumption by 6-7% by 2011. Con-
sumption fell during the year by 1-2 (0.5)%, which is
equivalent to a decrease of 60-120 tonnes of carbon
dioxide emissions and savings of MSEK 80-160.
Overall, Group companies reported an improve-
ment in the PULS employee satisfaction index
compared with the previous year. Of the Group’s
20 companies, 15 showed an improvement and
5 a deterioration compared with the previous year.
The response rate was 72 (70)%.
Corporate social responsibility
The SAS Group’s social responsibilities include
responsibility for employees and for its impact on
the surroundings and communities in which the
Group operates.
SAS Group subsidiaries report sick leave and
occupational injuries pursuant to national legisla-
tion. Efforts to reduce sick leave have priority, and
there are special projects to get employees on long-
term sick leave back to work. In 2007, the average
sick leave in the SAS Group increased to 6.4%, from
6.1% the year before. The number of occupational
injuries with subsequent absence decreased from
782 to 670 within the entire SAS Group. No serious
incidents or occupational injuries occurred during
the year. Sick leave costs in the SAS Group amount-
ed to approximately MSEK 1,100 in 2007.
SAS Group companies are working actively on
equal opportunity, based in part on the legislation
in effect in each country, and based in part on the
current situation in the respective companies. One
of the ways this is being addressed in both internal
and external recruiting for vacant positions where
the genders are unevenly represented is to encour-
age members of the underrepresented gender to
apply for the position. Women make up 23% of the
SAS Group’s top executives. As part of SAS Scan-
dinavian Airlines’ work on diversity and equal op-
portunity issues, SAS Sverige identified in 2007 a
number of focus areas for which surveys are being
conducted and action plans are being developed
to deal with issues such as working and parenting,
working conditions, harassment and victimization,
skills enhancement, advancement and pay.
With regard to human resources, the airlines
plan and conduct regular in-service training of all
certified personnel such as technicians, cabin crew
and pilots. This is done to uphold the competency
standards required by air operator certificates
(AOCs). The total training cost for the SAS Group
amounted to MSEK 370 (326) in 2007.
Following extensive dialog between Group and
company executives and union representatives in
Scandinavia, intensive work focusing on a cultural
turnaround was carried out in 2007 to strengthen
cooperation with the unions. The first half of 2007
saw some labor disputes that impacted traffic.
Scandinavian Airlines Sverige had a notified four-
day strike in May and Scandinavian Airlines Dan-
mark had two wildcat strikes in March and April.
The net estimated impact of the conflicts on the
SAS Group’s earnings is approximately MSEK 200.
Environmental responsibility
Flight operations and their use of fossil fuels account
for just over 95% of the SAS Group’s environmental
impact. Barely 5% of the impact stems from cabin
and ground operations, where energy and water
consumption and waste generation are the main
parameters.
The main environmental impact of flight opera-
tions consists of the consumption of non-renewa-
ble fuels, emissions of carbon dioxide and nitrogen
oxides, and noise. These emissions are affecting
the climate. The local and regional environmental
impact consists mainly of noise during takeoff and
landing, as well as of acidification and eutrophica-
tion of soil and water. The greatest potential for
environmental improvements lies in continuous
renewal of the aircraft fleet, which means always
choosing the best economically available technol-
ogy. Environmental aspects are a key element in
the Group’s choice of new aircraft and engines.
Commercial aviation uses aircraft internationally
type-approved according to ICAO certification stand-
ards. Environmental approval is an integral part of
national registrations of aircraft. Environmentally
based national and/or local permits, rules and
regulations provide a framework for aircraft use. The
trend is toward stricter environmental framework
conditions for the airline industry. For instance, there
is a risk that in coming years tightened emissions
and noise standards may affect the Group’s traffic to
certain airports. This may prevent the Group from uti-
lizing its aircraft fleet in the most flexible way possible
and/or lead to higher emission-based landing fees.
On January 1, 2007, Norway introduced a nitro-
gen oxides tax, which entailed a cost increase of
MSEK 12. Furthermore, the carbon tax in Norway
was increased by just over 20%, to NOK 0.65/kg
carbon dioxide, starting January 1, 2008. In 2007
the cost of the carbon tax in Norway came to MSEK
165 (160). In the U.K., the environment-related
passenger charge was nearly doubled, pushing
up costs by MSEK 80, to MSEK 154. The Danish
environment-related passenger charge was elimi-
nated in 2006. Otherwise, SAS is not aware of any
changes in operating conditions that could have
significant operational or financial consequences
for its business during the coming fiscal year.

56 SAS Group Annual Report 2007
At the end of 2006 the European Commission
announced a draft directive regarding aviation’s
entry into emissions trading. The goal is to in-
corporate aviation into the system in 2011. The
comprehensive proposal is largely in line with
SAS’s view. In 2007 the proposal was discussed by
the Parliament. In November a reworked proposal
representing a considerable tightening of the Com-
mission’s proposed directive was announced. As a
ceiling for emissions the European Parliament set
90% of the average for 2004–2006. The Parlia-
ment’s proposal also involves a multiplier whereby
aviation is to relinquish twice as many emissions
credits in relation to the amount of carbon dioxide
it emits. The system will include all traffic within, to
and from the EU. Emissions credit trading repre-
sents a cost increase which will largely be reflected
in fares. Under the original proposal it was as-
sumed the costs would average out to an increase
of 2-3% of fuel costs. Under the Parliament’s pro-
posal, the increase will be considerably higher, up
to 10–20% in relation to fuel costs.
Of the SAS Group’s operations, parts of ground
operations at Stockholm, Oslo, Copenhagen and
Stavanger airports are covered by permits pursu-
ant to national environmental laws. The permit in
Stockholm covers maintenance bases and regulates
emissions to air, chemicals and waste management
and sets target and monthly mean values for effluent
from the treatment plant. SAS Technical Services
(STS) submits an annual environmental report to
Sigtuna Municipality. The permit at Oslo Airport cov-
ers water from a treatment plant connected to hang-
ars and maintenance bases. STS submits an annual
environmental report to Ullensaker Municipality and
to the County Governor of Akershus. Copenhagen
Airport has maintenance bases and hangars requir-
ing environmental permits that primarily concern
the use of chemicals in maintenance work and
treatment plants. Here too, an annual report must
be submitted to the local environmental agencies.
SAS has an environmental permit for a treatment
plant at Stavanger Airport. All environmental per-
mits for operations conducted on the properties
that SAS Facility Management (SFM) manages
have been transferred to SFM. The terms of the
licenses remain unchanged. In general, the SAS
Group’s airline operations are totally dependent on
the licensed maintenance base, vehicle workshop
and hangar operations performed by SGS and STS
and on the respective airport owners’ licenses for
operations and glycol handling and thresholds for
atmospheric emissions and noise. Apart for local
waste management permits, SAS has no permit
requirements for airline operations in Finland, the
Baltic countries and Spain. The Group has obtained
all the necessary licenses and permits for its op-
erations in Scandinavia, none of which come up
for renewal during the coming fiscal year. On the
other hand, in 2008 Copenhagen Airport will renew
its environmental permit, which will have a major
impact on the operations of the SAS Group. During
the year the Group did not receive any injunctions
from the issuing authorities.
In 2007, aircraft operated by SAS Group airlines
sometimes deviated from local approach and
takeoff rules. In 2007 Spanair was fined on a few
occasions by the Spanish authorities. Scandinavian
Airlines Danmark and Blue1 were also fined on a
few occasions for approaches and takeoffs. The
majority of these fines are being negotiated. In
total, the fines may amount to MSEK 3-5. None of
the incidents had any major environmental conse-
quences. Airline operations has a dispensation for
using halons and submits an annual report to the
authorities on consumption and stocks. In 2007 a
few kilograms of halons leaked out. In 2006 SAS
identified two minor ground pollution incidents at
Copenhagen Airport caused by the leakage of oil
and diesel on an area covering 1,100 sq. m. In 2007
dialog continues with the airport owners and the au-
thorities on the clean-up of the site. The Group was
not involved in any environment-related disputes or
complaints and otherwise has no known major en-
vironment-related debts or provisions for ground
pollution or similar. Other parts of the annual and
sustainability report contain more complete de-
scriptions of the SAS Group’s efforts to contribute
to sustainable development.
DIVIDEND 2007
The Board is proposing to the Annual General
Shareholders’ Meeting that no dividend be paid
to SAS AB’s shareholders for the 2007 fiscal year.
This is motivated by the SAS Group’s relatively
weak financial position and cash flow, as a result
of which, financial flexibility will be of major impor-
tance in managing future restructuring measures
and investment.
DISPOSITION OF EARNINGS
The following Parent Company earnings are avail-
able for disposition by the Annual General Share-
holders’ Meeting:
MSEK
Retained earnings 10,322Group contribution received, net 19Net income for the year –752
Total nonrestricted equity 9,589
The Board of Directors proposes that the earnings
be allocated as follows:
MSEK
Amount retained by Parent Company 9,589
Total 9,589
The position of the Group and Parent Company at
year-end 2007 and the earnings of operations for
fiscal year 2007 are stated in the following state-
ment of income, balance sheet, cash flow statement,
changes in shareholders’ equity, comments on the
financial statements and notes.
SIGNIFICANT EVENTS
AFTER THE BALANCE SHEET DATE
On February 5, the Board of SAS AB made a
decision on the future structure of SAS Ground
Services, SAS Technical Services and Spirit Air
Cargo Handling. For the time being, SAS Ground
Services will remain a subsidiary in the Group,
provided it meets quality improvement and profit-
ability requirements. The changes in the opera-
tions of SAS Technical Services mean that heavy
maintenance of the Boeing 737 Classic will take
place outside Scandinavia. Spirit Air Cargo Han-
dling, part of SAS Cargo, will be sold.
FULL-YEAR 2008
The year 2007 was characterized by very positive
growth and favorable market conditions in the SAS
Group’s home market of Northern Europe. General
economic growth is expected to be lower in the
SAS Group’s home markets in 2008 compared with
2007. Official forecasts have gradually been revised
downwards, especially during the recent period, and
we will probably see signs of an economic downturn
in the not too distant future. As a result of this, the
market’s passenger growth is expected to be lower
in 2008.
In addition, there is uncertainty relating to the
price trend for fuel, for which the degree of com-
pensation could become a growing challenge if
demand declines and the oil price continues to rise.
The year 2008 will be favorably impacted by the
fact that the ECA agreement has now expired, at
the same time as the negative earnings effect of the
Q400 is expected to amount to about MSEK 700-
800 for full-year 2008.

57SAS Group Annual Report 2007
During the fourth quarter, the divestment process
commenced for Spanair S.A. and Aerolineas de
Baleares. Accordingly, the companies’ assets
and liabilities are reported as assets held for sale.
Income after tax is reported among discontinued
operations. Impairment testing of goodwill was
conducted for both companies. On the basis of a
market value assessment an impairment charge of
MSEK 300 was recognized.
SAS Flight Academy was divested in February
2007 and is reported as a discontinued operation.
The remaining 6.7% of the shares in Rezidor
Hotel Group were divested in May. An agreement
regarding the final purchase consideration in
the divestment of SAS Component in 2005 was
concluded during the second quarter and was
charged to earnings from discontinued operations
in an amount of MSEK –445. At the end of June, the
Group acquired the remaining 5.1% stake in Spanair
S.A. As a result, the SAS Group holds 100% of the
shares in Spanair S.A. In September, the ground
handling company Newco was divested.
Continuing operations
The net effect of currency fluctuations between the
January-December periods of 2006 and 2007 was
MSEK 619. The effect is MSEK –587 on revenues,
MSEK 1,193 on operating expenses and MSEK 13
on net financial items.
The SAS Group’s revenue amounted to MSEK
52,251 (50,152), an increase of MSEK 2,099 or
4.2%. Taking into account currency effects, rev-
enue increased by 5.4%. Passenger traffic (RPK)
rose by 1.9% for the Group.
The Group’s costs for jet fuel amounted to MSEK
8,104 (7,953). Adjusted for positive currency effect
owing to a weaker USD, fuel costs rose by MSEK
811 due to higher prices and increased volume. In
addition, operating expenses rose due to growth in
the number of passengers, expanded capacity and
higher costs for technical maintenance.
The earnings effect related to the ECA collabora-
tion amounted to MSEK –652 (–415) for the full
year.
Operating income before depreciation and leas-
ing costs, EBITDAR, was MSEK 5,311 (5,099).
Leasing costs and depreciation, with regard to
the currency effect, remain at the same level as
during the previous year.
The Group’s income from the sale of aircraft and
buildings amounted to MSEK 41 (85) for the full
year. During the year, a deHavilland Q100 was sold
and the sale and leaseback of three Boeing 737s
and three Airbus 319/321s was implemented.
Income from other shares and participations of
MSEK 5 (–46), comprises profit from the sale of
shares in OMX. In the preceding year, a valuation
was made at fair value of the shares in Aeroex-
change amounting to MSEK –50.
The Group’s net financial items before capital
gains amounted to MSEK –258 ( –782). Net inter-
est was MSEK –231 (–740). The currency effect was
MSEK 13 (0). Other net financial expenses were
MSEK –40 (–42).
Income before capital gains and nonrecurring
items in continuing operations amounted to MSEK
1,242 (727).
Discontinued operations
Income from discontinued operations amounted to
a total of MSEK –130 (4,528). SAS Flight Academy
was sold in February 2007 to STAR Capital Part-
ners for MSEK 550. The capital gain attributable to
SFA amounted to MSEK 359. Income after tax in
SAS Flight Academy was MSEK 5 until the date of
the sale. See Note 11.
The SAS Group’s remaining shareholding in
Rezidor Hotel Group after the stock-exchange list-
ing in 2006 was sold at the end of May, generating
a gain of MSEK 513. Additionally, a dividend of
MSEK 6 was received.
The earnings effect of an agreement on the
purchase price for the divestment of 67% of the
shares in SAS Component in 2005 amounted
to MSEK –445. In the third quarter, Newco was
divested for MSEK 322, with a capital gain of
MSEK 169. Income after tax was MSEK 22 in
Newco until the time of divestment. Income
MSEK Note 2007 2006
Revenue 2 52,251 50,152
Payroll expenses 3 –17,271 –16,229
Other operating expenses 4 –29,669 –28,824
Leasing costs for aircraft –2,578 –2,481
Depreciation, amortization and impairment 5 –1,478 –1,757
Share of income in affiliated companies 6 9 59
Income from the sale of aircraft and buildings 7 41 85
Operating income 1,305 1,005
Income from other holdings of securities 8 5 –46
Financial income 9 787 585
Financial expenses 9 –1,045 –1,367
Income before tax 1,052 177
Tax 10 –286 35
Net income for the year from continuing operations 766 212
Income from discontinued operations 11 –130 4,528
Net income for the year 636 4,740
Attributable to:
Parent Company shareholders 637 4,622
Minority interest –1 118
Earnings per share (SEK) 1 3.87 28.10
Earnings per share (SEK) from continuing operations 1 4.62 1.11
1 Earnings per share is calculated on the basis of 164,500,000 outstanding shares (IAS33).
Since the SAS Group has no options, convertibles or share programs, dilution cannot occur.
.
Income before capital gains and nonrecurring items
MSEK 2007 2006
Income before tax in continuing operations 1,052 177
Impairments 0 126
Restructuring costs 216 328
Capital gains –46 –88
Other nonrecurring items 20 184
Income before capital gains and nonrecurring items in continuing operations 1,242 727
SAS Group statement of income Comments on the statement of income

58 SAS Group Annual Report 2007
after tax and the impairment of goodwill in
Spanair and Aerolineas de Baleares amounted to
MSEK –713.
For full-year 2006, income after tax for Rezidor
Hotel Group, Norwegian Aviation College, SAS Flight
Academy, Newco and Spanair and Aerolineas de
Baleares was reported in a total of MSEK 274. Added
to this is a capital gain of MSEK 4,254 from the
stock-exchange listing of Rezidor Hotel Group.
CURRENCY EFFECTS ON
SAS GROUP’S EARNINGS
Operating revenue as well as operating expenses
and financial items are affected significantly by
exchange rate fluctuations. Only approximately
18% of operating revenue and 15% of operating
expenses are in Swedish kronor.
The aggregate effect of changed exchange rates
on the SAS Group’s operating income for 2007
compared with 2006 was MSEK 606 (30). The cur-
rency effect is mainly due to the weaker U.S. dollar.
The difference between the years in the effect of
exchange rate differences on the financial net debt
was MSEK 13 (9), plus MSEK 264 (6) in discontin-
ued operations.
Comparing 2007 with 2006, the total currency
effect on income before tax was therefore MSEK
883 (45).
ChangeMSEK 2006/07 2005/06
Revenue –587 4Payroll expenses 82 –19Other expenses 1,309 48Translation of working capital 74 152Income from hedging of commercial flows –272 –155
Operating income 606 30
Net financial items 13 9
Income before tax in continuing operations 619 39
Discontinued operations 264 6
Income before tax 883 45
Currency effects on net income for the year, MSEK 2007 2006
Translation of working capital 81 2Income from hedging of commercial flows –229 42
Operating income –148 44
Currency effect on the Group’s financial net debt 13 0
Income before tax in continuing operations –135 44
Discontinued operations –105 –41
Income before tax –240 3
Statement of income – Quarterly breakdownMSEK 2006 2007
Full year Full yearJan-Mar Apr-Jun Jul-Aug Oct-Dec Jan-Dec Jan-Mar Apr-Jun Jul-Aug Oct-Dec Jan-Dec
Revenue 10,999 13,366 12,955 12,832 50,152 11,887 13,496 13,484 13,384 52,251
Payroll expenses –4,173 –4,292 –3,812 –3,952 –16,229 –4,127 –4,304 –4,234 –4,606 –17,271
Other operating expenses –6,738 –7,493 –7,461 –7,132 –28,824 –6,750 –7,344 –7,789 –7,786 –29,669
Leasing costs for aircraft –616 –617 –624 –624 –2,481 –642 –641 –659 –636 –2,578
Depreciation, amortization and impairment –421 –465 –409 –462 –1,757 –364 –378 –371 –365 –1,478
Share of income in affiliated companies –2 19 46 –4 59 10 38 7 –46 9
Income from the sale of aircraft and buildings 27 12 16 30 85 –2 –44 20 67 41
Operating income –924 530 711 688 1,005 12 823 458 12 1,305
Income from other holdings of securities 0 1 0 –47 –46 0 0 5 0 5
Net financial items –187 –191 –219 –185 –782 –108 –84 –30 –36 –258
Income before tax –1,111 340 492 456 177 –96 739 433 –24 1,052
Tax 241 –18 –113 –75 35 55 –212 –78 –51 –286
Income from continuing operations –870 322 379 381 212 –41 527 355 –75 766
Income from discontinued operations –194 231 225 4,266 4,528 –6 80 346 –550 –130
Net income for the period –1,064 553 604 4,647 4,740 –47 607 701 –625 636
Attributable to:
Parent Company shareholders –1,034 489 559 4,608 4,622 –18 584 667 –596 637
Minority interest –30 64 45 39 118 –29 23 34 –29 –1
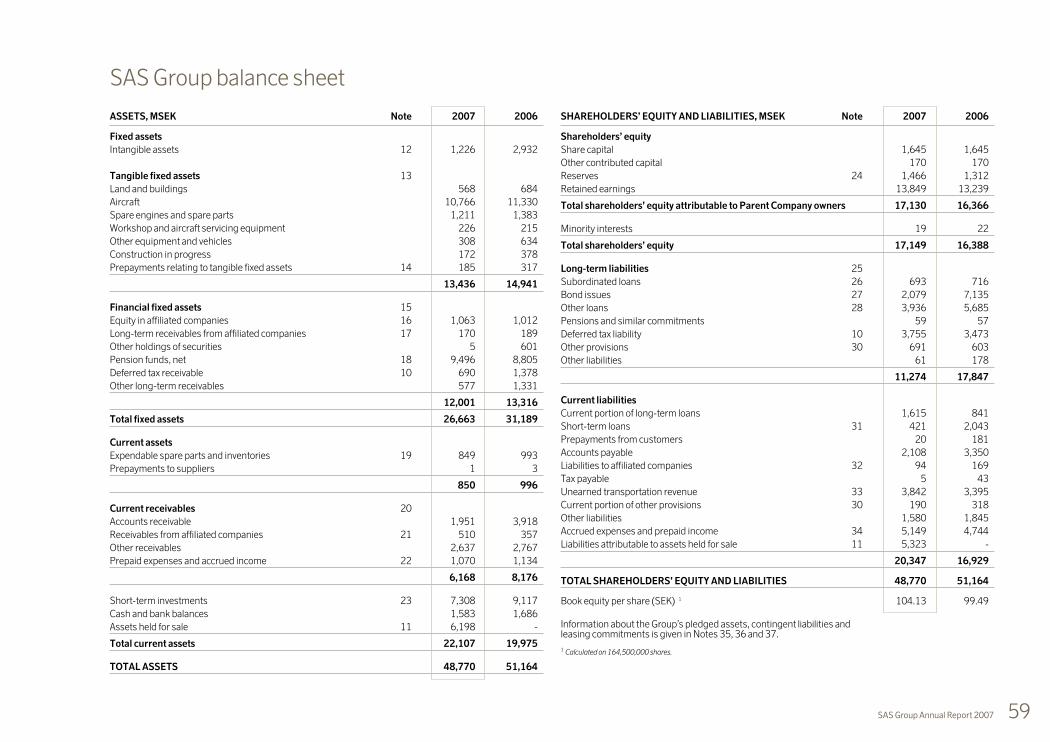
59SAS Group Annual Report 2007
ASSETS, MSEK Note 2007 2006
Fixed assets
Intangible assets 12 1,226 2,932
Tangible fixed assets 13
Land and buildings 568 684
Aircraft 10,766 11,330
Spare engines and spare parts 1,211 1,383
Workshop and aircraft servicing equipment 226 215
Other equipment and vehicles 308 634
Construction in progress 172 378
Prepayments relating to tangible fixed assets 14 185 317
13,436 14,941
Financial fixed assets 15
Equity in affiliated companies 16 1,063 1,012
Long-term receivables from affiliated companies 17 170 189
Other holdings of securities 5 601
Pension funds, net 18 9,496 8,805
Deferred tax receivable 10 690 1,378
Other long-term receivables 577 1,331
12,001 13,316
Total fixed assets 26,663 31,189
Current assets
Expendable spare parts and inventories 19 849 993
Prepayments to suppliers 1 3
850 996
Current receivables 20
Accounts receivable 1,951 3,918
Receivables from affiliated companies 21 510 357
Other receivables 2,637 2,767
Prepaid expenses and accrued income 22 1,070 1,134
6,168 8,176
Short-term investments 23 7,308 9,117
Cash and bank balances 1,583 1,686
Assets held for sale 11 6,198 -
Total current assets 22,107 19,975
TOTAL ASSETS 48,770 51,164
SAS Group balance sheet
SHAREHOLDERS’ EQUITY AND LIABILITIES, MSEK Note 2007 2006
Shareholders’ equity
Share capital 1,645 1,645
Other contributed capital 170 170
Reserves 24 1,466 1,312
Retained earnings 13,849 13,239
Total shareholders’ equity attributable to Parent Company owners 17,130 16,366
Minority interests 19 22
Total shareholders’ equity 17,149 16,388
Long-term liabilities 25
Subordinated loans 26 693 716
Bond issues 27 2,079 7,135
Other loans 28 3,936 5,685
Pensions and similar commitments 59 57
Deferred tax liability 10 3,755 3,473
Other provisions 30 691 603
Other liabilities 61 178
11,274 17,847
Current liabilities
Current portion of long-term loans 1,615 841
Short-term loans 31 421 2,043
Prepayments from customers 20 181
Accounts payable 2,108 3,350
Liabilities to affiliated companies 32 94 169
Tax payable 5 43
Unearned transportation revenue 33 3,842 3,395
Current portion of other provisions 30 190 318
Other liabilities 1,580 1,845
Accrued expenses and prepaid income 34 5,149 4,744
Liabilities attributable to assets held for sale 11 5,323 -
20,347 16,929
TOTAL SHAREHOLDERS’ EQUITY AND LIABILITIES 48,770 51,164
Book equity per share (SEK) 1 104.13 99.49
Information about the Group’s pledged assets, contingent liabilities and leasing commitments is given in Notes 35, 36 and 37.
1 Calculated on 164,500,000 shares.

60 SAS Group Annual Report 2007
In light of the classification of Spanair and Aero-
lineas de Baleares as discontinuing operations,
the assets of both companies including acquired
goodwill and liabilities are recognized on a line in
the Group’s balance sheet. See also Note 11.
Assets
The SAS Group’s total assets decreased in 2007,
from MSEK 51,164 to MSEK 48,770.
The decrease in intangible assets by MSEK 1,706
is mainly due to Spanair’s goodwill and other intan-
gible assets totaling MSEK 1,797. In addition, MSEK
124 was deducted for divested operations. Deprecia-
tion for the year amounted to MSEK 73. MSEK 127
was invested in systems development during the
year. Currency effects etc. came to MSEK 163.
The book value of aircraft decreased by MSEK
564. Investment in three Boeing 737s, two Airbus
319s and an Airbus 321 amounted to MSEK 1,310.
Utilization of prepayments to aircraft manufacturers
and modifications came to MSEK 839. Depreciation
for the year amounted to MSEK 1,111 and the re-
sidual value of sold aircraft etc. was MSEK 1,602.
Long-term prepayments to suppliers of flight
equipment decreased during the year by MSEK
132. For deliveries, MSEK 434 was utilized. Pre-
payments of MSEK 293 were made for future de-
liveries. Capitalized financial expenses amounted
to MSEK 17, and translation differences due to a
weaker USD decreased the value by MSEK 8.
Equity in affiliated companies increased by MSEK
51 to MSEK 1,063. Share of income for the year
was MSEK 9. Investments in affiliated companies
amounted to MSEK 44. In addition, equity shares
decreased, net, by MSEK 2 from positive currency
effects and deduction for dividends received.
Other holdings of securities decreased from
MSEK 601 to MSEK 5 following the divestment in
2007 of the remaining shareholding in Rezidor
Hotel Group.
For all defined benefit pension plans, the pen-
sion commitments are calculated and all funded
assets are taken into account. At December 31,
2007, book net pension funds totaled MSEK 9,496
(8,805) (see also Note 18).
At year-end, short-term liquid assets totaled
MSEK 8,891 (10,803), or 18% (21%) of total assets.
Shareholders’ equity
Equity including minority interests increased by
MSEK 761, to MSEK 17,149 (16,388), of which
MSEK 636 is the net income for the year. The
change in value of cash flow hedges amounted to
MSEK 587. Changes in accounting principles in
affiliated companies represented a negative impact
of MSEK –27. The sale of the remaining sharehold-
ing in the Rezidor Hotel Group negatively affected
equity by MSEK –508. The remaining MSEK 73
consists of translation differences in foreign sub-
sidiaries and affiliated companies. At year-end the
equity/assets ratio was 35% (32%), and the return
on book equity was 4% (38%).
Liabilities
MSEK 12,042 (16,478) of total liabilities was interest
bearing. The change is mainly because revenue from
releasing capital made early amortization possible.
The current portion of long-term loans totaled
MSEK 4,361 primarily due to the maturation of
three bond issues in 2008, see Note 27. Part of the
amount, MSEK 2,746, is recognized as a liability
attributable to assets held for sale.
At December 31, 2007, the interest-bearing net
debt amounted to MSEK 8,265 (4,671). The SAS
Group’s average net debt during the year was MSEK
–6,697 (2,537). Financial net debt excluding net
pension funds amounted to MSEK 1,231 (4,134).
The debt/equity ratio calculated on the financial net
debt at December 31, 2007, was 0.07 (0.25).
Provision for marginal costs associated with the
provision of free travel in exchange for redeemed
points in the Group’s loyalty programs amounted
to MSEK 495 (551) at December 31, 2007.
Total capital employed amounted to MSEK
29,191 (32,866) at year-end. Average capital em-
ployed during the year was MSEK 30,280 (35,185).
Return on capital employed was 7% (18%).
Comments on the balance sheet
Changes in shareholders’ equityShareholders’ equity attributable to Parent Company shareholders
Share Other contri- Retained Total equity attributed to. Minority TotalMSEK capital1 buted capital2 Reserves earnings 3 Parent Company owners interests equity
Opening equity at January 1, 2006 1,645 658 918 8,283 11,504 577 12,081
Divestment, Rezidor Hotel Group –650 –650Transition to IFRS in affiliated companies –154 –154 –154Transfer of equity –488 488Change in translation reserve for the year –1 –1 –24 –25Change in fair value reserve for the year 508 508 508Change in hedge reserve for the year –158 –158 2 –156Tax charged directly to equity 45 45 –1 44
Total changes in assets recognized directly against equity, excl. transactions with the company’s owners 0 –488 394 334 240 –673 –433
Net income for the year 4,622 4,622 118 4,740
Closing equity at Dec. 31, 2006 1,645 170 1,312 13,239 16,366 22 16,388
Changed accounting principle in affiliated companies –27 –27 –27Change in translation reserve for the year –38 –38 –2 –40Change in fair value reserve for the year –508 –508 –508Change in hedge reserve for the year 815 815 815Tax charged directly to equity –115 –115 –115
Total changes in assets recognized directly against equity, excl. transactions with the company’s owners 0 0 154 –27 127 –2 125
Net income for the year 637 637 –1 636
Closing equity at Dec. 31, 2007 1,645 170 1,466 13,849 17,130 19 17,149
1 The share capital in SAS AB is divided into 164,500,000 shares with a nominal value of 10 per share in both the opening and closing balance. 2 The entire amount consists of share premium reserves. 3 No dividends were paid in 2005 and 2006.

61SAS Group Annual Report 2007
MSEK Note 2007 2006
OPERATING ACTIVITIES
Income before tax 1,052 177
Depreciation, amortization and impairment 1,478 1,757
Income from the sale of aircraft, buildings and shares –46 –88
Income before tax in discontinued operations, excl. capital gain 11 –718 523
Depreciation and impairments in discontinued operations 11 464 389
Adjustment and impairments for items not incl. in the cash flow, etc. 38 –15 –149
Paid tax –38 –65
Cash flow from operating activities before
changes in working capital 2,177 2,544
Change in:
Expendable spare parts and inventories 11 –51
Operating receivables –397 –439
Operating liabilities 1,075 48
Cash flow from changes in working capital 689 –442
Cash flow from operating activities 2,866 2,102
INVESTING ACTIVITIES
Aircraft –1,310 –846
Spare parts –127 –71
Buildings, equipment and other facilities –782 –1,139
Shares and participations, intangible assets, etc. –171 –118
Prepayments for flight equipment –293 –125
Acquisition of subsidiaries 39 –225 -
Total investments –2,908 –2,299
Disposal of subsidiaries 40 549 5,725
Sale of aircraft, buildings and shares 2,039 4,018
Sale of other fixed assets, etc. 107 41
Cash flow from investing activities –213 7,485
FINANCING ACTIVITIES
Change in long-term loans –3,280 –7,268
Change in short-term loans –1,121 –1,058
Change in interest-bearing receivables and liabilities –91 888
Cash flow from financing activities –4,492 –7,438
Cash flow for the year –1, 839 2,149
Translation difference in liquid assets 29 –30
Liquid assets reclassified to assets held for sale –102 -
Liquid assets at beginning of the year 41 10,803 8,684
Liquid assets at year-end 41 8,891 10,803
SAS Group cash flow statement Comments on the cash flow statement
Earnings of continuing operations improved in
2007 while the earnings of discontinued opera-
tions showed a loss compared with 2006. The SAS
Group’s cash flow from operating activities before
changes in working capital therefore decreased
during the year to MSEK 2,177 (2,544). Working
capital decreased during the year by MSEK 689
(–442), largely due to increased current liabilities.
Compared with the previous year, cash flow from
operating activities improved by MSEK 764 and
amounted to MSEK 2,866 (2,102).
Total investments including prepayments to air-
craft suppliers amounted to MSEK 2,908 (2,299).
Investment in aircraft in 2007 consists of two Boe-
ing 737s, two Airbus A319s and one Airbus A321.
A Boeing 737 previously on an operating lease was
also purchased. In June, the minority owner’s five
percent holding in Spanair and Aerolineas de Bal-
eares was acquired, making the companies wholly
owned subsidiaries in the SAS Group.
In February, SAS Flight Academy was divested
and in September, the Spanish Newco Airport
Services. The total purchase price of the divested
subsidiaries amounted to MSEK 872. As a result
of the principle agreement regarding the purchase
price for the 2005 divestment of SAS Component
Group, MSEK 193 was paid out in August. Liquid
assets in the divested companies and selling costs
impacted the Group’s liquid assets by MSEK 549.
Sales of aircraft, buildings and shares gener-
ated MSEK 2,039 (4,018), of which MSEK 1,484
(3,692) refers to disposals of aircraft. Sale and
leaseback transactions were carried out for three
Boeing 737s, two Airbus A319s and one Airbus
A321 during the year and one Dash 8 Q100 was
sold. In May, SAS’s remaining shares in Rezidor
Hotel Group were divested for MSEK 584.
In all, short and long-terms loans decreased by
MSEK 4,401, which mainly consisted of amortiza-
tion and redemption of loans totaling approximately
MSEK 4,700.
Overall, the SAS Group’s liquid assets decreased
by MSEK 1,810 (–2,119). After MSEK 102 was
transferred to assets held for sale, liquid assets in
continuing operations amounted to MSEK 8,891
(10,803).

62 SAS Group Annual Report 2007
Note 1 • Significant accounting policies
General
The consolidated financial statements have been prepared in accordance
with the EU-approved International Financial Reporting Standards (IFRS) and
interpretations issued by the International Financial Reporting Interpretations
Committee (IFRIC) as of December 31, 2007. The transition date for reporting
according to IFRS was January 1, 2004, which means that the comparable fig-
ures for 2004 and since have been prepared according to the new principles.
Furthermore, the Group also applies Swedish Financial Accounting Standards
Council recommendation RR 30:06, “Supplementary Accounting Rules for
Groups,” which specifies the additions to IFRS information required under the
Swedish Annual Accounts Act.
The Parent Company’s accounting policies are the same as for the Group
with the exception of the imperative rules contained in Swedish Financial Ac-
counting Standards Council recommendation RR32:06 Accounting for Legal
Entities. The accounting policies for the Parent Company are stated under the
heading “Parent Company accounting policies.”
The Parent Company’s functional currency is the Swedish krona, which is
also the reporting currency for the Group and for the Parent Company. Unless
otherwise stated, all amounts in the financial statements are given in millions of
Swedish kronor (MSEK).
In the annual financial statements, items have been measured at cost value
except when it concerns measurement of financial assets and liabilities (includ-
ing derivative financial instruments) measured at fair value or amortized cost
depending on their classification under IAS 39. In reference to the Group’s
current assets and current liabilities, the Group’s operating cycle coincides
with 12 months.
Starting January 1, 2005, SAS began applying IAS 39, Financial Instru-
ments: Recognition and Measurement. IAS 39 has been applied prospectively,
i.e., the comparative year 2004 has not been restated. IAS 39 entailed a change
of accounting policies.
Accounting estimates in the financial statements
Preparing the financial statements in accordance with IFRS requires management
to make accounting estimates and assumptions that influence the application of
the accounting policies and the carrying amounts of assets, liabilities, revenue and
expenses. Actual outcome may differ from these estimates and assessments.
The estimates and assumptions are regularly reviewed. Changes in estimates
are reported in the period in which the change is made if the change affects only
that period, or in the period in which the change is made and future periods if the
change affects both the current and future periods.
Estimates by management related to the application of IFRS that have a signifi-
cant impact on the financial statements and estimates that may entail significant
adjustments in the financial statements of subsequent years are described in
greater detail in Note 46.
Significant accounting policies that have been applied
The accounting policies presented below have been consistently applied to all
periods presented in the Group’s financial statements, unless otherwise stated
below. Furthermore, the Group’s accounting policies have been consistently
applied by Group companies.
In addition, the comparative statement of income has been represented as
if the operation discontinued during the current year had been discontinued at
the beginning of the comparative year.
New standards and interpretations
In 2005 the International Accounting Standards Board (IASB) issued IFRS 7
Financial Instruments: Disclosures, which has been applied in the preparation
of the 2007 financial statements. The standard has only entailed changes in
the disclosure requirements regarding financial instruments. A new standard,
IFRS 8 Operating Segments, which replaces the current standard concerning
segment reporting (IAS 14), will be applied starting in 2009.
The International Financial Reporting Interpretations Committee (IFRIC) has
issued the interpretations IFRIC 8 Scope of IFRS 2, IFRIC 9 Reassessment of
Embedded Derivatives and IFRIC 10 Interim Financial Reporting and Impair-
ment, which were applied starting in 2007 but have not had any effects on the
consolidated financial statements. IFRIC 11 IFRS 2 Group and Treasury Share
Transactions and IFRIC 12 Service Concession Arrangements, and IFRIC 14
IAS 19 - The Limit on a Defined Benefit Asset, Minimum Funding Require-
ments and their Interaction, will be applied starting in 2008.
None of the above new standards or interpretations are judged as affecting
the SAS Group’s reported earnings or financial position, but will affect disclo-
sure requirements in future financial statements.
IFRIC 13 Customer Loyalty Programmes, was issued in 2007 and is effective
for annual periods beginning on or after July 1, 2008. Earlier application is per-
mitted. In the present situation this standard will not have a quantifiable effect
on the Group’s financial statements.
In addition, changes have been made in a number of standards that are to
be applied effective January 1, 2009 or later. The affected standards are IFRS
2 Share-based Payment, IAS 1 Presentation of Financial Statements, IAS 23
Borrowing Costs, IAS 32 Financial Instruments: Presentation, IFRS 3 Business
Combinations, IAS 27 Consolidated and Separate Financial Statements, IAS 28
Investments in Associates, and IAS 31 Interests in Joint Ventures.
Consolidated financial statements
The SAS Group’s accounts comprise the Parent Company SAS AB and all com-
panies in which SAS directly or indirectly owns more than 50% of the voting
rights or otherwise has a controlling influence.
Revenues and expenses in companies acquired or sold during the year are
included in the SAS Group’s statement of income only with the values relating
to the ownership period.
Holdings in affiliated companies where the SAS Group’s ownership is at
least 20% and no more than 50% or where the SAS Group has significant influ-
ence are accounted for using the equity method.
Principles of consolidation
The consolidated financial statements are prepared according to the purchase
method whereby subsidiaries’ assets and liabilities are carried at fair value
according to a prepared acquisition analysis. If the acquisition value of shares
in subsidiaries exceeds the calculated fair value of the company’s net assets
according to the acquisition analysis, the difference is reported as consoli-
dated goodwill. Accordingly, the SAS Group’s balance sheet includes equity
in acquired companies only to the extent that this has arisen after the date of
acquisition.
SAS AB’s acquisition of SAS Danmark A/S, SAS Norge AS and SAS Sverige
AB in 2001 is consolidated according to the principle for companies under joint
control. The inclusion of these three companies in the consolidated financial
statements is therefore carried out through a consolidation of all assets and
liabilities at the value at which they are stated in the respective unit.
Minority interests in non-wholly owned subsidiaries are calculated on the
basis of the subsidiaries’ shareholders’ equity as it is included in the Group and
are recognized in the consolidated balance sheet as a separate item in share-
holders’ equity.
The minority share of the net income for the year is stated on a line in the
statement of income.
All intra-Group receivables and liabilities, intra-Group sales and intra-Group
profits are eliminated entirely.
The book value of shares in affiliated companies is reported in accordance
with the equity method. This means that the SAS Group’s equity in affiliated
companies comprises its share of the shareholders’ equity of those compa-
nies, taking into account deferred tax according to the tax rates in the countries
concerned and any consolidated surplus or deficit values.
The Group’s share of the net income for the year after tax in the affiliated
company is recognized in the SAS Group’s statement of income as share of
income. Any impairments of equity are also reported as share of income from
affiliated companies.
Intra-Group profits are eliminated based on the Group’s participation in the
affiliated company.
Discontinued operations
Classification as a discontinued operation is done when a separate major line of
business has been sold or at the time the business meets the criteria for being
classified as held for sale. Said criteria include that a decision has been made
by the group management and board, an active sales process has commenced,
the price is reasonable in relation to fair value and that it is probable that the
sale will take place within one year.
Income after tax in discontinued operations as well as capital gain and, where
appropriate, impairment at fair value, are reported on a line in the statement
of income. Assets held for sale and liabilities attributable to these assets are
disclosed in the balance sheet.
Translation of financial statements of foreign subsidiaries
All of the SAS Group’s subsidiaries are classified as independent. The financial
statements of foreign subsidiaries are translated into Swedish kronor using
the current method. This means that all assets and liabilities including goodwill
of subsidiaries and other consolidated surplus or deficit values are translated
at the closing rate and all items in the statement of income are translated at the
average rate. Translation differences are recognized directly in SAS Group’s
shareholders’ equity as a translation reserve.
Notes to the financial statementsExpressed in millions of Swedish kronor (MSEK) unless otherwise stated.

63SAS Group Annual Report 2007
Hedging of net investments in foreign operations
The SAS Group hedges to a certain extent investments in foreign net assets
including goodwill. Hedging is accomplished through both foreign currency
loans and forward contracts, which are measured at the closing rate. Like ex-
change differences in translating net assets, the effective portion of exchange
differences on hedging transactions is recognized directly in shareholders’
equity. The ineffective portion of changes in value is immediately recognized in
the statement of income.
Receivables and liabilities in foreign currency
Current and long-term receivables and liabilities in currencies other than the
reporting currency (SEK) are stated in the balance sheet translated at clos-
ing rates. Both realized and unrealized foreign exchange gains and losses on
receivables and liabilities are reported in the statement of income. In those
cases where the debt in foreign currency meets the requirements for hedge
accounting and makes up part of a cash flow hedge or hedge of net investment,
the change in value is recognized in shareholders’ equity.
Exchange rates Closing rate Average rate
2007 2006 2007 2006
Denmark DKK 100 127.05 121.35 123.84 124.42
Norway NOK 100 118.75 109.45 115.02 115.63
U.S. USD 6.47 6.87 6.77 7.42
U.K. GBP 12.90 13.49 13.53 13.58
Switzerland CHF 100 569.85 563.10 562.25 590.09
Japan JPY 100 5.72 5.78 5.73 6.40
EMU countries EUR 9.47 9.05 9.23 9.28
Financial assets and liabilities
Financial instruments are stated at amortized cost or fair value depending on
their initial classification according to IAS 39. Foreign currency was translated
to SEK at the quoted rate on the closing date.
Amortized cost is calculated using the effective interest method, where any
premiums or discounts and directly attributable costs and revenues are capi-
talized over the contract period using the effective interest rate. The effective
interest rate is the rate that yields the instrument’s cost when calculating the
present value of future cash flows.
Fair value of short-term investments is set entirely by reference to official
market quotes. Official market quotes on the closing date are used when
determining fair value for derivative financial instruments and borrowings. In
those cases where there are none, the measurement is done using generally
accepted methods such as discounting future cash flows at the quoted market
rate for the respective maturity.
Long-term receivables in affiliated companies
Long-term receivables in affiliated companies, i.e., receivables with a term
longer than one year, are categorized as loans and receivables, which are
measured at amortized cost.
Other holdings of securities
Other holdings of securities are categorized as available-for-sale financial assets,
with changes in fair value recognized in shareholders’ equity. Impairment loss
due to a long-term decline in value is recognized in the statement of income.
Other long-term receivables
Other long-term receivables, i.e., receivables with a term longer than one year,
are categorized as loans and receivables, which are measured at amortized cost.
Accounts receivable
Accounts receivable are categorized as loans and receivables, with measure-
ment at amortized cost. Since the terms of accounts receivable are expected to
be short, the value of each receivable is carried at its nominal amount with no
discount, which corresponds with fair value. Doubtful accounts receivable are
assessed individually and any impairment losses are charged under operating
expenses.
Current receivables in affiliated companies
Short-term receivables in affiliated companies, i.e., receivables with a term short-
er than one year, are categorized as loans and receivables, which are measured
at amortized cost.
Liquid assets
Short-term investments are measured at fair value through the statement of
income. Deposits and blocked deposits are categorized as loans and receiva-
bles. Other investments are categorized as financial assets held for trading. The
investments have a maximum term of three months, are readily convertible to a
known amount of cash and are only subject to an insignificant risk of change in
value. Short-term investments are reported as of the settlement date.
Cash and bank balances consist of cash on hand in a financial institution and
are stated at their nominal amount, and certificates of deposit that are carried at
fair value.
Long-term borrowings
Long-term borrowings, i.e., liabilities with a term longer than one year, consist of
interest-bearing liabilities to banks and credit institutions as well as bond issues.
The liabilities are categorized as other liabilities, with recognition at amortized
cost on the settlement date. Long-term liabilities subjected to hedge accounting
according to the fair value hedge method are carried at fair value concerning the
hedged risk.
Short-term borrowings
Short-term borrowings comprise the current portion of interest-bearing long-
term borrowings, i.e., the portion of the loans that is amortized in the coming
fiscal year, as well as other current interest-bearing liabilities with a term shorter
than one year. These liabilities are categorized as other liabilities and are rec-
ognized at amortized cost. Current liabilities subjected to hedge accounting
according to the fair value hedge method are carried at fair value concerning the
hedged risk.
Accounts payable
Accounts payable are categorized as other liabilities, with recognition at am-
ortized cost. Since the terms of accounts payable are expected to be short, the
liabilities are carried at nominal amounts with no discount, which corresponds
with fair value.
Derivatives
All derivatives are carried at fair value in the balance sheet, and the reporting
of changes in value in the statement of income depends on whether or not the
derivative meets the requirements for hedge accounting. For derivatives with
positive market value long-term derivatives are reported as “Other long-term
receivables” and short-term derivatives as “Other current receivables.” For de-
rivatives with negative market value long-term derivatives are reported as “Other
long-term loans” and short-term derivatives as “Other short-term loans.”
In order for hedge accounting to be applied, its effectiveness has to be
demonstrated at inception and on a regular basis during the hedge period. A
requirement for hedging forecast flows is that it is highly likely that the forecast
event will occur.
For hedge-accounted derivatives reported according to the cash flow hedge
method, the effective portion of changes in value is recognized in shareholders’
equity pending the recognition of the hedged item in the statement of income.
The ineffective portion of the changes in value is immediately recognized in the
statement of income. The SAS Group applies cash flow hedging to currency
derivatives used to hedge forecast commercial flows and future sales of air-
craft. The SAS Group also applies cash flow hedging to interest rate derivatives
whose interest rate exposure changes from variable to fixed rate and for fuel
derivatives that hedge future purchases of fuel.
For hedge-accounted derivatives reported according to the fair value hedge
method, the change in the value of the derivative financial instrument and the
change in the value of the hedged item are netted in the statement of income.
The SAS Group applies fair value hedging to interest rate derivatives whose
interest rate exposure changes from fixed to variable rate.
For derivatives not subject to hedge accounting, all changes in value are
recognized in the statement of income. Derivatives that do not correspond
with the accounting policies used for the underlying hedged position and do
not meet the IAS 39 requirements are not subject to hedge accounting. These
derivatives are categorized as financial instruments held for trading.
Tangible fixed assets
Tangible fixed assets are carried at cost less accumulated depreciation and any
impairment. Depreciation is straight-line over the estimated useful life of the
assets beginning when the asset is ready to be put to use. For aircraft a number
of essential components have been identified. The useful life of the various
components has been determined and all components apart from engine com-
ponents have the same useful life. In accordance with official requirements,
aircraft engines must be maintained and significant engine components
changed after a specific number of takeoffs and landings and flight hours.
This maintenance occurs on average every eighth year depending on type of
aircraft. Completed maintenance is capitalized and depreciated over a relevant
period for each aircraft type.
Interest expenses on prepayments for aircraft not yet delivered are capitalized.
If a decision is made to postpone deliveries of aircraft for which prepayments
have been made, capitalization of interest expenses ceases. On commissioning
of aircraft, depreciation of the capitalized interest expenses begins, in accordance
with the main principle for aircraft.
Costs for routine aircraft maintenance as well as repair costs are expensed
as incurred. Extensive modifications and improvements to fixed assets are cap-
italized and written off together with the asset to which the work is related over
its remaining useful life. Investment in own and leased premises is amortized
Note 1, continued

64 SAS Group Annual Report 2007
over their estimated useful lives, but not over a period exceeding the remaining
leasing period for leased premises.
Income from the sale or disposal of a tangible fixed asset is calculated as the
difference between the sales value and carrying amount. The gain or loss that
arises is recognized in the statement of income.
Depreciation is based on the following estimated periods of useful life:
Assets class Depreciation
Aircraft 20 *
Reserve engines and spare parts 20 *
Engine components (average) 8
Workshop and aircraft servicing equipment 5
Other equipment and vehicles 3-5
Buildings 5-50
* Estimated residual value after a useful life of 20 years is 10%. Through 1998 the estimated
useful life was 15 years with an estimated residual value of 10%.
Leasing - Finance and Operating
As a lessee, SAS has entered into finance and operating leasing contracts.
Leasing contracts where SAS in principle takes over all the risks and benefits
of the asset are reported as finance leasing contracts. At the beginning of the
leasing period, finance leasing contracts are recognized at fair value. Assets
held under finance leases are stated in the balance sheet as a fixed asset and
the future commitment to the lessor as a liability. Assessment of leased assets’
useful life corresponds to the principles SAS applies to acquired assets.
Leasing agreements where in principle all risks and benefits remain with the
lessor are reported as operating lease contracts. The leasing cost for operating
lease contracts is expensed on an ongoing basis during the contract period.
Sale and leaseback agreements are classified according to the above-men-
tioned principles for financial and operating leasing.
For aircraft under operating leases, the contracts stipulate that the aircraft
must be in a certain specified condition when they are returned. To meet this
commitment, SAS carries out maintenance of these aircraft, both regularly and
at the expiration of the leasing period. Costs are expensed as incurred.
Intangible assets
Intangible assets comprise goodwill, capitalized costs for systems develop-
ment, and other intangible assets. The Group is not engaged in any research
and development (R&D) activity.
Intangible assets are recognized in the balance sheet when:
an identifiable, non-monetary asset exists
it is probable that the future financial advantages that can be attributable
to the asset will accrue to the company and
the cost of the asset can be calculated in a reliable manner
Goodwill is recognized in the balance sheet as an intangible asset at cost less
accumulated impairments. In regard to goodwill in acquisitions that took place
before January 1, 2004, the Group has not applied IFRS retroactively, which
means that going forward, the carrying amount on that date will constitute the
Group’s acquisition value after impairment testing. Goodwill represents the ex-
cess of the cost of an acquisition over the fair value of the Group’s share of net
identifiable assets of the acquired subsidiary at the date of acquisition. Gains
and losses on the disposal of an entity include the remaining carrying amount
of goodwill relating to the entity sold.
Goodwill is assessed as having an indefinite useful life. Goodwill is allocated
to the smallest possible cash-generating unit and the carrying amount is tested
at least once a year for any impairment. However, testing for impairment takes
place more frequently if there are indications that a loss in value has occurred
during the year.
Should an acquisition cause the fair value of acquired assets, liabilities and
contingent liabilities to exceed the acquisition value, the excess is recognized im-
mediately as revenue in the statement of income.
Development costs that do not meet the criteria specified above are ex-
pensed in the period they arise. Costs for systems development are reported
as an asset provided that they meet the criteria specified above. Capitalized
development costs are amortized on a straight-line basis over the estimated
useful life of the asset. Maximum useful life is five years. Amortization of capi-
talized development costs is included in the item depreciation in the statement
of income.
Other intangible assets with a limited useful life are amortized over their use-
ful life. Amortization of other intangible assets is included in the depreciation
item in the statement of income.
Impairment losses
At least once a year tests are performed to look for the existence of impairment
in intangible assets including goodwill with an indefinite useful life. At each bal-
ance sheet date (quarterly), a review is conducted to look for any indication that
the company’s tangible assets are impaired and if this is the case, the recover-
able amount of the individual assets (or the cash-generating unit to which they
belong) is measured to determine whether impairment exists.
The recoverable amount is defined as the higher of an asset’s fair value less
selling costs and value in use (VIU). The best indicator of an asset’s sales value
is the price in a binding arm’s length sale agreement adjusted for costs directly
attributable to the sale of the asset. A market price is applied in the absence of
such an agreement. A best estimate is used unless a binding agreement or a
market price is available.
Regarding the Group’s aircraft fleet, a recoverable amount is calculated each
quarter for the portion of the aircraft fleet owned by the Group. The principle
for calculating this recoverable amount is that the present value of the cur-
rent market leasing revenue for each aircraft is calculated, assuming that the
aircraft generates market leasing revenue until it reaches an age of 25 years.
The present value of these future leasing revenues is the value defined as the
recoverable amount for the owned portion of the aircraft fleet.
With respect to spare equipment and spare parts for aircraft, the recoverable
amount is preferably calculated by estimating the fair value at the end of each
reporting period.
In calculating value in use for other assets, the estimated cash flow is dis-
counted to a present value by applying a risk-adjusted discount rate to the
asset’s expected future pre-tax cash flow. The cash flow projection is based on
reasonable assumptions that represent management’s best estimate of the set
of economic conditions that will exist over the remaining useful life of the as-
set. The cash flow projections are based on the most recent financial plan that
management has approved. Projections beyond three years have been done
by extrapolating using a steady or declining growth rate. The projections are
based on the asset’s current use and condition and exclude any future capital
expenditure that will improve or enhance the asset in excess of its originally
assessed standard of performance.
If the recoverable amount for the asset (or the cash-generating unit) is
estimated to be lower than its book value, the book value of the asset (or the
cash-generating unit) is reduced to the recoverable amount. Recognition of
impairment in a cash-generating unit to which goodwill has been allocated is
done first to this goodwill and then to other assets on a pro-rata basis.
At each balance sheet date, a review is conducted to look for indications that
the grounds for earlier impairments of assets other than goodwill no longer
exist or have improved. When such indications exist, the recoverable amount
is recalculated. Earlier impairment losses are reversed if changes have taken
place in the assumptions used to determine the recoverable amount since the
last impairment loss. If that is the case the carrying amount is increased to the
lower of the recoverable amount and the carrying amount that the asset would
have had if the previous impairment had not taken place.
Expendable spare parts and inventories
Expendable spare parts and inventories are carried at the lower of historical
cost or net realizable value. Historical cost is calculated by application of the
first in first out (FIFO) method. Some spare parts related to aircraft are valued
lower of cost or market value principle collectively with the aircraft concerned.
Appropriate deduction is made for obsolescence.
Provisions and contingent liabilities
Provisions are reported when SAS identifies legal or informal commitments
as a result of historic events, where the outcome is probable, and where the
financial resources required to settle these commitments can be estimated
with reasonable certainty.
Provisions for restructuring costs are made when the decision is made and
announced. These costs arise primarily for employees idled under notice.
Remuneration of employees
Pensions
The SAS Group’s pension commitments are mainly secured through various
pension plans. These vary considerably due to different legislation and agree-
ments on occupational pension systems in the individual countries.
For pension plans where the employer has accepted responsibility for
defined contribution solutions, the obligation to employees ceases when the
contractual premiums have been paid.
For other pension plans where defined benefit pensions have been agreed,
the commitments do not cease until the contractual pensions have been paid.
The SAS Group calculates its pension commitments for the defined benefit
pension plans. Calculations of commitments are based on estimated future
final salary. An estimate of funded assets is made at the same time.
Pension costs for the year comprise the present value of pension earnings for
the year, plus interest on the obligation at the beginning of the year, less return on
funded assets. Amortization of actuarial gains and losses and plan amendments
is added to this total for certain pension plans. Plan amendments and deviations
between anticipated and actual results for estimated pension commitments and
funded assets are amortized over the average remaining working lives of the em-
ployees participating in the pension plan. Cumulative actuarial gains and losses of
up to 10% of the greater of pension obligations and pension assets are included in
the so-called corridor and are not amortized. When the cumulative actuarial gains
Note 1, continued

65SAS Group Annual Report 2007
and losses exceed this 10% limit, the excess amount is amortized over a 15-year
period, which corresponds to the average remaining employment period. The
Parent Company reports current pension premiums as costs.
Termination benefits
Termination benefits are payable when employment is terminated by the Group
before the normal retirement date, or whenever an employee accepts voluntary
redundancy in exchange for these benefits. The Group recognizes severance pay
when such an obligation exists according to employment contracts or for termina-
tion as a result of an offer made to encourage voluntary redundancy.
Variable salary and earnings-based salary
Variable salary and earnings-based salary paid to senior executives are reported
in Note 3 on pages 65-67. The cost of variable salary and earnings-based salary
is expensed annually and a provision for this is made in the consolidated balance
sheet.
Revenue recognition
Passenger revenue: Ticket sales are reported as traffic revenue when the air trans-
port has been carried out.
The value of tickets sold and still valid but not used by the balance sheet date is
reported as unearned transportation revenue. This item is reduced either when
SAS or another airline completes the transport or when the passenger requests a
refund. A portion of unearned transportation revenue covers tickets sold that are
expected to remain unutilized. An estimate of unutilized tickets’ expected share of
the unearned transportation liability is produced annually. This reserve is reported
as revenue the following year in accordance with established principles.
Freight revenue: SAS Cargo’s transport services are recognized as revenue
when the air transport is completed.
Other revenue: Sales of goods and other services are recognized as revenue
when the goods are delivered or the service carried out.
Loyalty program
The SAS Group makes ongoing provisions as points are earned for the variable
marginal costs associated with the provision of free travel in exchange for the
redemption of the points earned by members.
Borrowing costs
Borrowing costs that arise in operations are expensed in the period in which they
are incurred. Borrowing costs for prepayments attributable to aircraft not yet de-
livered are described in the section “Tangible fixed assets.”
Taxes
Current tax for the period is based on earnings for the period, adjusted for nontax
deductible costs and revenues not liable to tax. The current tax is calculated on the
basis of tax rates applying on the closing date.
Deferred tax is reported according to the balance sheet method whereby tem-
porary differences, differences between the reported and fiscal value of assets
or liabilities, result in a deferred tax receivable or deferred tax liability. A deferred
tax liability is reported for all temporary differences liable to tax, while a deferred
tax receivable is reported to the extent it is probable that a taxable surplus will be
created against which the deductible temporary difference can be utilized or
before the right to utilize the loss carryforward is lost.
A deferred tax liability is reported for all taxable temporary differences attrib-
utable to investments in subsidiaries and affiliated companies except in cases
where the Group can control the timing of reversal of the temporary differences,
and it is probable that such reversal will not take place in the foreseeable future.
Deferred tax is calculated based on the tax rates that are expected to apply in
the period the tax is realized. Deferred tax is reported in the statement of income.
Deferred tax receivables and deferred tax liabilities are recognized net if the
items pertain to the same tax authority.
Segment reporting
Information is provided for business areas and geographical markets. This infor-
mation is based on the SAS Group’s accounting policies and the Group’s internal
reporting to company management.
The primary segment comprises the SAS Group’s three business areas (SAS
Scandinavian Airlines, SAS Individually Branded Airlines and SAS Aviation Serv-
ices), group-wide functions and group-wide eliminations. All operations, whether
they are corporations or business units, are to have a businesslike relationship
with customers and suppliers within the Group.
The Group’s statement of income is shown by business area for operating
income, EBIT. Other items are not broken down by business area.
Business area assets comprise all assets used directly in the business area’s
operations. Equity shares in affiliated companies, however, are presented sepa-
rately. Business area liabilities and provisions comprise all commitments that are
directly attributable to the business area’s operations.
The secondary segment comprises the SAS Group’s geographical markets,
and revenues are broken down by the geographical markets where operations
are conducted.
Traffic revenue from domestic service in Denmark, Norway and Sweden is
allocated to domestic. Traffic between the three countries is allocated to intra-
Scandinavian. Other traffic revenues are allocated to the geographical area where
the destination is located.
Other revenues are allocated to a geographical area based on:
the customer’s geographical location relating, for example, to goods ex-
ported to a customer in another country
the geographical location where the service is performed
Assets broken down by geographic area do not include the Group’s aircraft
and spare parts. Since aircraft are utilized in a flexible manner across the route
network, there is no justifiable basis for allocating these assets.
Parent Company accounting policies
The Parent Company has prepared its annual financial statements according to
the Annual Accounts Act and Swedish Financial Accounting Standards Council
recommendations RR32:06 “Accounting for Legal Entities” and applicable
statements from the Council’s “Akutgruppen.” Under RR32:06, the Parent
Company, in preparing the annual financial statements for the legal entity, shall
apply all EU-approved IFRS and statements in so far as this is possible within the
framework of the Annual Accounts Act and Tryggandelagen (the Swedish law on
safeguarding pension obligations) and with respect to the connection between
accounting and taxation. The recommendations specify which exceptions and
additions are to be made from and to IFRS.
The differences between the Group’s and the Parent Company’s accounting
policies are listed below:
Pensions: Current pension premiums are recognized as an expense.
Shares in subsidiaries and affiliated companies: Stated at acquisition value.
Other shares and participations: Stated at acquisition value.
Hedging of net investments in foreign operations: Translation differences
relating to currency hedging are recognized in the statement of income.
Note 2 • Operating revenue
2007 2006
Traffic revenue:
Passenger revenue 38,601 36,740
Charter 1,951 1,772
Mail and freight 1,732 2,102
Other traffic revenue 1,539 1,684
Other operating revenue:
In-flight sales 514 493
Ground services 1,417 1,213
Technical maintenance 976 1,147
Terminal and forwarding services 1,592 1,513
Sales commissions and charges 834 820
Other operating revenue 3,095 2,668
52,251 50,152
Not 3 • Payroll expenses
Average number of employees
In 2007, the average number of employees in the SAS Group’s continuing
operations was 21,898 (21,753). A breakdown of the average number of em-
ployees by country is provided in the table below.
Average number of employees in Denmark totaled 6,105 (6,007), in Norway
6,839 (7,258), and in Sweden 5,454 (5,366).
2007 2006
Men Women Men Women
Denmark 3,812 2,294 3,985 2,022
Norway 4,511 2,328 4,506 2,752
Sweden 3,103 2,351 3,252 2,114
U.K. 261 388 148 283
Finland 385 411 404 369
Estonia 135 104 120 94
Latvia 380 346 303 331
U.S. 73 129 80 143
Other countries 300 588 278 569
Total 12,960 8,939 13,076 8,677
Total men and women 21,898 21,753
Average number of employees in divested operations totaled 4,640 (10,015).
Note 1, continued

66 SAS Group Annual Report 2007
Gender breakdown among senior executives in the Group
2007 2006
Total on of which Total on of whichclosing date men closing date men
Board members 130 72% 135 80%
President and other senior executives 116 72% 127 81%
Salaries, remuneration and social security expenses
The SAS Group’s total payroll expenses in continuing operations amounted to
16,759 (15,101), of which social security expenses comprised MSEK 1,931
(1,796) and pensions MSEK 2,124 (1,631).
2007 2006
Salaries Soc. sec. Salaries Soc. sec.& other (of which & other (of whichremun- pension remun- pensioneration cost) eration cost)
SAS AB 216 100 (46) 193 107 (55)
SAS Consortium 1,015 339 (91) 1,116 246 (–8)
Other subsidiaries 11,473 3,616 (1,987) 10,365 3,074 (1,584)
SAS Group total 12,704 4,055 (2,124) 11,674 3,427 (1,631)
* The pension cost for all CEOs and other senior executives of SAS Group companies amounted to MSEK 35 (18).
Payroll expenses in discontinued operations amounted to MSEK 1,701
(13,579), of which social security expenses comprised MSEK 278 (574) and
pensions MSEK - (53). A breakdown of the salaries and other remuneration of
Board members, CEOs, other senior executives and other employees is provided
in the table below.
2007 2006
Board, CEO Board, CEO& senior & senior
executives Other executives Other (of which vari- em- (of which vari- em-
able salary) ployees able salary) ployees
SAS AB 42 (8) 174 41 (5) 152
SAS Consortium - (-) 1,015 - (-) 1,116
SAS Scandinavian Airlines Danmark 6 (1) 1,628 15 (2) 1,334
SAS Scandinavian Airlines Sverige 15 (2) 1,014 14 (1) 771
SAS Scandinavian Airlines Norge 17 (4) 2,260 15 (2) 2,096
SAS Ground Services 64 (4) 2,879 52 (2) 2,588
SAS Technical Services 13 (1) 1,350 9 (1) 1,318
Blue1 7 (0) 216 5 (0) 213
Widerøes Flyveselskap 9 (1) 924 8 (1) 882
SAS Cargo 11 (2) 603 9 (1) 606
Other subsidiaries 30 (4) 427 17 (1) 413
SAS Group total 214 (27) 12,490 185 (16) 11,489
Sick leave in the Parent Company SAS AB
2007 2006
Total sick leave 0.9% 2.1%
Long-term sick leave >59 days 0.2% 1.5%
Sick leave for women 0.9% 1.0%
Sick leave for men 0.9% 2.9%
Sick leave employees <30 years 0.0% 0.9%
Sick leave employees 30-49 years 1.1% 2.8%
Sick leave employees >49 years 0.8% 1.7%
The total sick leave is stated as a percentage of the employees’ total working
hours. The data apply only to employees in Sweden.
Pension costs 2007 2006
Defined benefit pension plans 1,161 841
Defined contribution pension plans 963 790
Total 2,124 1,631
Remuneration and benefits paid to senior executives
The fees and other remuneration paid to Board members of SAS AB shall be
determined by the Annual General Shareholders’ Meeting, which has also
approved the principles for the remuneration of senior management.
Board of Directors
At the Annual General Shareholders’ Meeting of SAS AB on April 17, 2007, the
fees paid to directors and remuneration for serving on board committees was
set as follows:
Board chairman TSEK 600
Board vice chairman TSEK 400
Other board members (8 persons) TSEK 300 per member
Employee deputies (6 persons) TSEK 1 study fee/board meeting
TSEK 3.5 fee/board meeting
Chairman of audit committee TSEK 100
Other members of audit committee TSEK 50
Chairman of remuneration committee TSEK 75
Other members of remuneration committee TSEK 25
With the exception of the employee representatives and their deputies, no
member of the Board was employed by the SAS Group in 2007. No Board
member not employed by the SAS Group received any remuneration or benefit
from any company in the SAS Group beyond customary travel benefits and the
fees received for board duties.
Principles
The following remuneration principles have been applied in 2007 in regard to
senior executives in the SAS Group. In this connection, senior executives refers
to the President and the other five members of the SAS Group Management.
The SAS Group’s overarching remuneration policy is aimed at offering mar-
ket compensation.
The SAS Group’s overall remuneration model is based on the following four
cornerstones:
Salary setting shall be individual and differentiated
Salary setting shall be national and adapted to the market
Salary setting shall be an important management tool in reaching the
organization’s goals
Salary setting shall motivate professional and personal advancement
Total remuneration shall consist of fixed salary, variable salary, other benefits
and pension.
The SAS Group applies a remuneration model that means that salary shall
be performance-based. The division of salary into a fixed and a performance-
based variable part shall be in proportion to the responsibilities and authorities
of the position. A specific target-based variable salary is an important manage-
ment tool and is aimed at ensuring that the priorities of senior executives are
consistent with the Group’s overall goals and strategies.
The variable salary shall be maximum and never exceed 50% of the fixed
salary. At least 20% and maximum 60% of the variable salary is to be related
to the Group’s earnings. No earnings-based salary will be paid if the Group’s
earnings (EBT before nonrecurring items) are negative. The outcome of the
variable salary is based on achievement of the targets contracted between
the employee and his or her superior. On the recommendations of the remu-
neration committee the Board sets the President’s targets, degree of target
achievement and the size of the variable salary. The President annually sets the
target criteria for the people who report directly to him and decides, in consul-
tation with the remuneration committee, payment of the variable salary.
Payment of the variable salary takes place after the SAS Group’s annual
report has been adopted by the Annual General Shareholders’ Meeting.
President and CEO
Mats Jansson, who assumed the position of President and CEO on January
1, 2007, has the following remuneration components in his employment
contract:
An annual fixed base salary of TSEK 10,000 that will not be subject to sal-
ary revision from January 1, 2007 to December 31, 2011.
A variable salary comprising a maximum of 20% of his annual fixed salary.
A defined contribution pension plan where 35% of his fixed salary is paid
as premiums to an agreed pension insurance. Should Mats Jansson
remain in his position on December 31, 2011, SAS will pay a lump sum
pension premium of MSEK 8.
The notice period is six months in the event the President resigns and 12
months if the termination of employment is by SAS AB. Severance pay is pay-
able to the President in the event his employment is terminated by SAS AB for
reasons other than material breach of contract, gross neglect of his duties as
President or criminal acts against the SAS Group. The amount corresponds to
12 months of salary. Should new employment be obtained within 12 months
after his employment ended the awarded severance pay shall be reduced by
the remuneration received from the new position. No severance pay is paid if
the President resigns of his own accord, unless his resignation is occasioned
by the following circumstances:
Should SAS be bought up by any industrial or financial owners and cease
to exist as an independent company.
Note 3, continued

67SAS Group Annual Report 2007
Note 3, continued
Should any external, industrial or financial owners acquire a controlling
stake corresponding to at least 30% of the votes in SAS. External indus-
trial or financial owners means persons or groups that do not currently
own or have any controlling stake in SAS that influences the management
of the company.
Deputy Presidents
The SAS Group has two deputy presidents, Gunilla Berg, CFO, and John S.
Dueholm, deputy CEO and COO.
Gunilla Berg has the following remuneration components in her employ-
ment contract:
An annual fixed base salary of TSEK 3,700, which refers to the salary set in
June 2007 and is subject to salary revision in January of each year.
A variable salary comprising a maximum of 40% of her annual fixed base
salary.
A defined benefit pension plan which means that earnings are on a straight-
line basis until retirement age, 60 years. With fully earned entitlement, the
pension level amounts to 70% of pensionable salary up to 30 base amounts
(currently TSEK 1,200 and 35% of pensionable salary in excess of that
amount. Pensionable salary refers to the annual fixed salary with the addi-
tion of the average of the variable salary paid in the last three years.
John S. Dueholm has the following remuneration components in his employ-
ment contract:
An annual fixed base salary of TSEK 5,717, which refers to the salary set in
June 2007 and is subject to salary revision in January of each year.
A variable salary comprising a maximum of 50% of his annual fixed base
salary.
A defined contribution pension plan where 35% of salary is paid into a
chosen insurance plan. Should John Dueholm remain in his position on
June 30, 2011, SAS will pay a lump sum pension premium of MDKK 5,
equivalent to MSEK 6.4.
The notice period is six months if Gunilla Berg resigns and 12 months if the ter-
mination of employment is by SAS AB. The notice period is six months if John
Dueholm resigns and 6 months if the termination of employment is by SAS AB.
Severance pay is payable to the deputy presidents in the event their em-
ployment is terminated by SAS AB for reasons other than material breach of
contract, gross neglect of their duties as deputy president or criminal acts
against the SAS Group in an amount equivalent to 24 months’ salary, where
the reconciliation against income from another appointment or assignment
totals a maximum of one fixed annual salary.
Severance is also payable if the senior executive resigns if his or her respon-
sibilities or authorities are materially changed through ownership or organiza-
tional changes. However, severance pay in the above case is not payable if the
senior executive is offered another position in the SAS Group and the position
has the same classification level as the previous position.
Other senior executives
Of the other members of the Group Management, three persons, one has been
employed since June and two since October 2007. During the year three other
persons were members of the Group Management for part of the year, one
from January to October, one from January to September and one from Janu-
ary to May. Of the three present other members of the Group Management, all
have a defined contribution pension plan, two of which have a retirement age
of 65 and one a retirement age of 60, where 15-35% of the fixed base salary is
paid into a pension. Of the officers who were members of the Group Manage-
ment for part of the year but not as of the closing date, one is employed in Swe-
den with a defined benefit pension plan with a retirement age of 60 years. The
other two are employed in Norway, and one has a defined contribution pension
plan (premium of 21.6% of annual salary) and retirement age of 60 years and
the other has a defined benefit pension plan with a retirement age of 67 years.
In the defined benefits plans, earnings are on a straight-line basis until retire-
ment age. The pension level in Sweden with fully earned entitlement amounts
to 70% of pensionable salary up to 30 base amounts and 35% of pensionable
salary in excess of that amount and in Norway is 66% of 25G (2007 Norwegian
basic pension amount = NOK 68,812).
The notice period is 12 months if the termination of employment is by SAS
AB and six months if the employee resigns.
Severance pay for these senior executives is mainly set according to the
same principles for the two senior vice presidents, with, however, the differ-
ence that the severance pay totals an amount equivalent to one fixed annual
salary with full reconciliation against income from another appointment or
assignment.
Share price-related remuneration
Because the SAS Group does not have a share price-related incentive program,
no such benefits were allotted to any senior executives in the SAS Group.
Other
Other typical managers’ contracts in the SAS Group are based on the principles
outlined under the “Principles” heading above.
Discussion and decision-making process
The issue of the Directors’ fees is discussed by the nomination committee,
which consists of representatives elected at the Annual General Shareholders’
Meeting. The nomination committee presents its proposal concerning Direc-
tors’ fees to the Shareholders’ Meeting, which votes on it.
The primary task of the Board-created remuneration committee is to
prepare for the decision of the Board proposals pertaining to the President’s
salary and other employment terms, and to prepare and propose the main
principles and general conditions applying to the setting of salaries and other
remuneration and employment terms (including variable salary, pension and
severance pay policy) for the Group Management and other senior executives
in the SAS Group. The Board presents the proposals for the principles regard-
ing remuneration and other employment terms for the Group Management to
the Annual General Shareholders’ Meeting, which votes on them.
During the year the remuneration committee discussed and made recom-
mendations to the Board concerning overarching principles for remuneration
policies in the SAS Group that include the principles and levels of variable
salary, and also submitted recommendations regarding the President’s target
contract and variable remuneration. The Board has discussed the remunera-
tion committee’s recommendations and made decisions accordingly. Remu-
neration of other senior executives was decided by the President after consul-
tation with the remuneration committee and in accordance with the principles
approved by the Shareholders’ Meeting. The remuneration committee held
eight minuted meetings plus a number of informal discussions.
Note 4 • Other operating expenses
2007 2006
Selling costs 705 641
Jet fuel 8,104 7,953
Government user fees 4,574 4,396
Catering costs 1,399 1,388
Handling costs 1,931 1,893
Technical aircraft maintenance 3,404 3,164
Computer and telecommunications costs 2,234 2,727
Other 7,318 6,662
Total 29,669 28,824
Note 5 • Depreciation, amortization and impairment
2007 2006
Other intangible assets 43 83
Aircraft 1,045 1,216
Spare engines and spare parts 135 120
Workshop and aircraft servicing equipment 71 74
Other equipment and vehicles 95 124
Buildings and fittings 89 89
Write-downs - 51
Total 1,478 1,757
Fixed Variable remune- Other Pension Financial Nonrecurring In- Pension-base salary ration (TSEK) benefits cost instruments payments surance Total commitments 1
Name (TSEK) 2006 2007 (TSEK) (TSEK) etc. (TSEK) (TSEK) (TSEK) (TSEK)
Mats Jansson 10,000 - 3 160 2,400 - - 26 12,586 -
Gunilla Berg 3,482 1,221 3 136 2,500 - 471 6 7,816 -
John S. Dueholm 5,405 1,943 3 2 2,105 - 2,695 10 12,160 -
Other 2 11,233 4,323 288 3 485 3,035 - 321 112 19,797 -
1 All retirement benefits are insured and vested. 2 Remuneration under “Other” includes remuneration of three (3) present Group Management members and three (3) members serving only in acting capacities for part of the year.3 Variable salary for 2007 has yet to be determined for all. Payment will take place after the SAS Group’s annual report has been adopted by the Annual General Shareholders’ Meeting.
Stated amount refers to variable salary paid to previous members of Group Management.
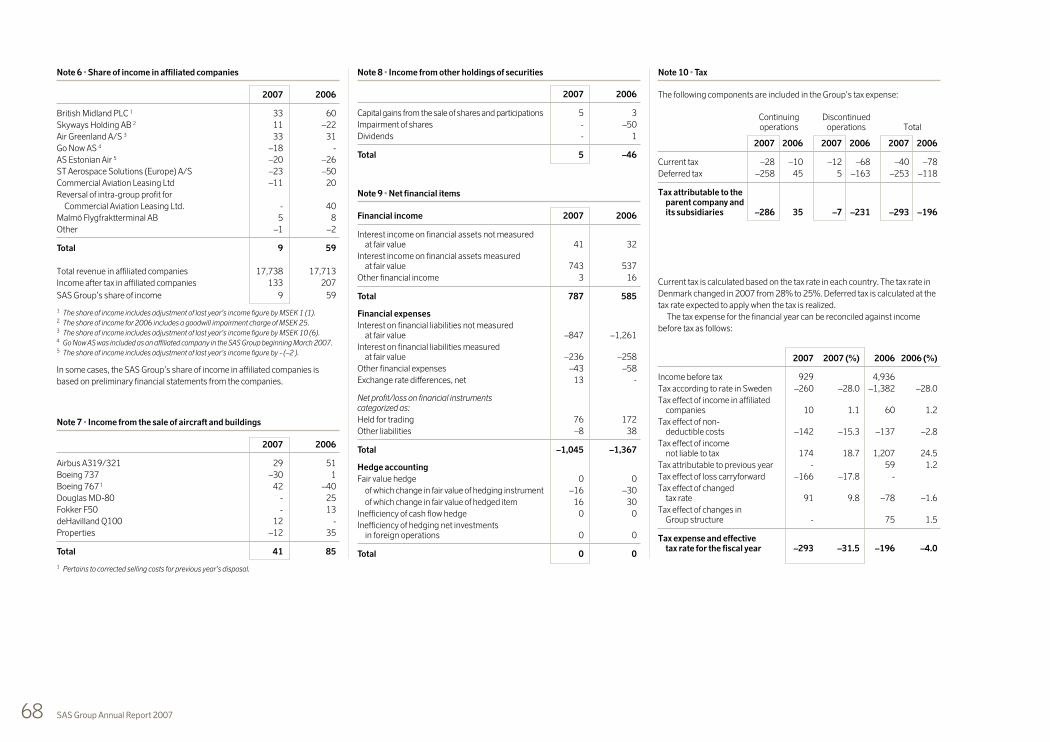
68 SAS Group Annual Report 2007
Note 6 • Share of income in affiliated companies
2007 2006
British Midland PLC 1 33 60
Skyways Holding AB 2 11 –22
Air Greenland A/S 3 33 31
Go Now AS 4 –18 -
AS Estonian Air 5 –20 –26
ST Aerospace Solutions (Europe) A/S –23 –50
Commercial Aviation Leasing Ltd –11 20
Reversal of intra-group profit for
Commercial Aviation Leasing Ltd. - 40
Malmö Flygfraktterminal AB 5 8
Other –1 –2
Total 9 59
Total revenue in affiliated companies 17,738 17,713
Income after tax in affiliated companies 133 207
SAS Group’s share of income 9 59
1 The share of income includes adjustment of last year’s income figure by MSEK 1 (1).2 The share of income for 2006 includes a goodwill impairment charge of MSEK 25.3 The share of income includes adjustment of last year’s income figure by MSEK 10 (6).4 Go Now AS was included as an affiliated company in the SAS Group beginning March 2007.5 The share of income includes adjustment of last year’s income figure by - (–2 ).
In some cases, the SAS Group’s share of income in affiliated companies is
based on preliminary financial statements from the companies.
Note 7 • Income from the sale of aircraft and buildings
2007 2006
Airbus A319/321 29 51
Boeing 737 –30 1
Boeing 767 1 42 –40
Douglas MD-80 - 25
Fokker F50 - 13
deHavilland Q100 12 -
Properties –12 35
Total 41 85
1 Pertains to corrected selling costs for previous year’s disposal.
Note 8 • Income from other holdings of securities
2007 2006
Capital gains from the sale of shares and participations 5 3
Impairment of shares - –50
Dividends - 1
Total 5 –46
Note 9 • Net financial items
Financial income 2007 2006
Interest income on financial assets not measured at fair value 41 32
Interest income on financial assets measured at fair value 743 537
Other financial income 3 16
Total 787 585
Financial expenses
Interest on financial liabilities not measured at fair value –847 –1,261
Interest on financial liabilities measured at fair value –236 –258
Other financial expenses –43 –58
Exchange rate differences, net 13 -
Net profit/loss on financial instruments categorized as:
Held for trading 76 172
Other liabilities –8 38
Total –1,045 –1,367
Hedge accounting
Fair value hedge 0 0
of which change in fair value of hedging instrument –16 –30
of which change in fair value of hedged item 16 30
Inefficiency of cash flow hedge 0 0
Inefficiency of hedging net investments in foreign operations 0 0
Total 0 0
Note 10 • Tax
The following components are included in the Group’s tax expense:
Continuing Discontinuedoperations operations Total
2007 2006 2007 2006 2007 2006
Current tax –28 –10 –12 –68 –40 –78
Deferred tax –258 45 5 –163 –253 –118
Tax attributable to the parent company and its subsidiaries –286 35 –7 –231 –293 –196
Current tax is calculated based on the tax rate in each country. The tax rate in
Denmark changed in 2007 from 28% to 25%. Deferred tax is calculated at the
tax rate expected to apply when the tax is realized.
The tax expense for the financial year can be reconciled against income
before tax as follows:
2007 2007 (%) 2006 2006 (%)
Income before tax 929 4,936
Tax according to rate in Sweden –260 –28.0 –1,382 –28.0
Tax effect of income in affiliated companies 10 1.1 60 1.2
Tax effect of non- deductible costs –142 –15.3 –137 –2.8
Tax effect of income not liable to tax 174 18.7 1,207 24.5
Tax attributable to previous year - 59 1.2
Tax effect of loss carryforward –166 –17.8 -
Tax effect of changed tax rate 91 9.8 –78 –1.6
Tax effect of changes in Group structure - 75 1.5
Tax expense and effective tax rate for the fiscal year –293 –31.5 –196 –4.0

69SAS Group Annual Report 2007
Deferred tax liability/tax receivable:
2007 2006
Deferred tax liability 3,755 3,473
Deferred tax receivable –690 –1,378
Deferred tax liability, net 3,065 2,095
The tables below show the Group’s most significant deferred tax liabilities and
tax receivables according to category and how these liabilities and receivables
changed.
Deferred tax liability in the balance sheet: 2007 2006
Fixed assets 1,955 2,222
Provisions –49 –148
Cash flow hedges 439 204
Other temporary differences 1,678 1,688
Fiscal loss carryforward –268 –493
Total 3,755 3,473
Deferred tax receivable in the balance sheet: 2007 2006
Fiscal loss carryforward 1,254 1,434
Fixed assets –25 –59
Provisions/receivables 15 3
Assets held for sale –554 -
Total 690 1,378
Reconciliation of deferred tax liability, net: 2007 2006
Opening balance 2,095 2,093
Assets held for sale 554 -
Change for the year for cash flow hedges 228 –44
Net tax liability in sold companies –35 –14
Change according to statement of income 253 118
Deferred tax recognized in equity –90 -
Exchange differences etc. 60 –58
Deferred tax liability, net, at year-end 3,065 2,095
On the closing date the Group had unutilized loss carryforwards in continuing
operations, excluding Spanair in 2007, amounting to a total of MSEK 4,289
(8,239). Based on these loss carryforwards, the Group recognizes a deferred tax
receivable of MSEK 968 (1,927). Deferred tax receivables are recognized to the
extent it is probable that there are factors indicating that taxable profits will be
created before the right to use the loss carryforwards is lost. The assessment of
the respective group company’s future profit performance is based on earnings
reported in recent years as well as improved profitability prospects. The recog-
nized tax receivables refer primarily to Blue1, SAS AB and the Group’s opera-
tions in Norway. For the loss carryforward amounting to MSEK 727 (1,318), no
deferred tax receivable is recognized due to uncertainty as regards future profit
earnings. Of the loss carryforwards, MSEK 282 expires in 2015 or earlier. There
are no expiration dates for the remaining loss carryforwards.
No provision has been made for deferred tax on temporary differences
related to non-distributed profits in subsidiaries and affiliated companies,
since these profits will not be distributed within the foreseeable future; alterna-
tively a distribution can be made without the profits being subject to tax.
Taxes recognized directly in equity regarding cash flow hedges reported
according to IAS 39 amounted to MSEK 365 (137).
Note 11 • Discontinued operations
In 2007 the SAS Flight Academy and Newco companies were sold along with
the remaining shareholding in Rezidor Hotel Group. Spanair and Aerolineas de
Baleares are in the process of being sold and are recognized as discontinued
operations. As a result of the sale of the shares in Rezidor Hotel Group, MSEK
495 was transferred from equity to the statement of income.
In the previous year the Rezidor Hotel Group was floated on the stock ex-
change, whereby SAS divested 91% of its shareholding. Norwegian Aviation
College was also divested.
Net income for the year
from discontinued operations 2007 2006
Net income for the year in discontinued operations –745 295
Income from sale of subsidiaries 609 4,233
Dividends from discontinued operations 6 -
Income from discontinued operations –130 4,528
Net income for the year in discontinued operations
Revenue 11,109 17,519
Payroll expenses –1,991 –3,981
Other operating expenses –8,133 –11,345
Leasing costs for aircraft –1,072 –1,148
Depreciation, amortization and impairment –164 –386
Share of income in affiliates - 47
Income from the sale of shares in subsidiaries and affiliated companies 59 –11*
Income from the sale of aircraft and buildings –14 3
Operating income –206 698
Income from other holdings of securities - –1
Net financial items –173 –179
Income before tax –379 518
Tax –7 –231
Net income for the year –386 287
Impairment of goodwill –300 –3
Group elimination –59 -
Net income for the year after group adjustments –745 284
* Stock flotation costs reduced the Group’s capital gain by MSEK 11.
Assets held for sale and related liabilities 2007
Goodwill 1,711
Other intangible assets 86
Tangible fixed assets 535
Financial fixed assets 1,159
Total fixed assets 3,491
Current assets 147
Current receivables 2,458
Cash and bank balances 102
Total current assets 2,707
Assets held for sale 6,198
Long-term liabilities 53
Current liabilities 5,270
Liabilities attributable to assets held for sale 5,323
Interest-bearing assets 329
Interest-bearing liabilities 3,240
Net cash flow from discontinued operations recognized as assets held for sale
2007 2006
Cash flow from operating activities –362 246
Cash flow from investing activities –173 –109
Cash flow from financing activities 526 –226
Net cash flow –9 –89
Note 10, continued

70 SAS Group Annual Report 2007
Note 12 • Intangible assets
Total
Goodwill Other assets intangible assets
2007 2006 2007 2006 2007 2006
Opening acquisition value 2,880 3,217 1,439 1,997 4,319 5,214
Investment 266 - 126 79 392 79
Sales/disposals - –27 –9 –76 –9 –103
Sales of companies 1 –116 –165 –64 –586 –180 –751
Reclassifications to assets held for sale 1 –2,103 - –260 - –2,363 -
Reclassifications 38 - 3 59 41 59
Exchange rate differences 176 –145 14 –34 190 –179
Closing accumulated acquisition value 1,141 2,880 1,249 1,439 2,390 4,319
Opening amortization –198 –235 –1,189 –1,117 –1,387 –1,352
Amortization for the year in continuing operations - - –43 –83 –43 –83
Amortization for the year in discontinued operations - - –30 –42 –30 –42
Impairments in continuing operations - - - –51 - –51
Impairments in discontinued operations –300 –20 - - –300 –20
Sales/disposals - 27 - 76 - 103
Sales of companies 1 11 28 45 23 56 51
Reclassifications to assets held for sale 1 392 - 174 - 566 -
Reclassifications - - - - - -
Exchange rate differences –15 2 –11 5 –26 7
Closing accumulated amortization –110 –198 –1,054 –1,189 –1,164 –1,387
Closing planned residual value 1,031 2,682 195 250 1,226 2,932
1 SAS Flight Academy and Newco Airport Services were sold during the year. Spanair and Aerolineas de Baleares are in the process of being sold and are recognized as discontinued operations.
In the previous year the Rezidor Hotel Group was floated on the stock exchange, whereby SAS divested 91% of its shareholding. Norwegian Aviation College was also divested.
Testing for impairment of intangible assets
Estimating the value of the Group’s goodwill items and other intangible
assets with an indefinite useful life has been done by comparison with
recoverable amount, which is the higher of market value and estimated
value in use. The calculations have consistently been based the respec-
tive cash-generating unit’s value in use and are based on the cash flows
in the respective unit’s budget and or business plan, which covers four
years.
Important parameters in business plans are volume performance,
unit revenue and operating margins. The assumption beyond the
plan period is an annual growth rate of 4% with maintained margins.
Based on historical results and forecasts in line with the above, general
reasonable assumptions have been made for the affiliated companies
whose budgets/business plans are not available.
Based on a weighted average cost of capital after tax, the forecast
cash flows have been discounted by 8% for maintenance operations,
9% for airlines, and 10% for other operations. The discount rate before
tax for the respective companies was then determined on the basis of
their nominal tax rate and amounts to 11.1% for maintenance opera-
tions, between 12.0% and 13.8% for airlines and between 13.9% and
15.4% for other operations.
For all other companies it is the management’s assessment that
reasonably likely changes in each of the assumptions in the business
plans would not have such major effects so as to reduce the recover-
able amount to a value lower than the carrying amount. To support the
impairment tests performed on goodwill in the Group, an overarching
analysis has been done of the sensitivity in the variables used in the
model. A weakening of any of the significant assumptions included in
the business plans or a weakening of the annual operating revenue
growth rate and operating margins beyond the plan period, or an in-
crease in the discount rate that, individually, is reasonably likely, shows
that a healthy margin still exists between the recoverable amount and
carrying amount. For this reason it was determined that there was no
need for impairment of goodwill and other intangible assets with indefi-
nite useful life.
In the financial statements Spanair has been reclassified because
the company will be sold in the year ahead. Its value has therefore been
impaired by MSEK 300 to the lower of acquisition value and estimated
market value.
The SAS Group is not engaged in activities relating to research and develop-
ment (R&D).
Breakdown of planned residual value:
2007 2006
Goodwill 1,031 2,682
Capitalized system development costs 195 239
Other 0 11
Total residual value 1,226 2,932
Goodwill:
2007 2006
Spanair - 1,608
SAS Scandinavian Airlines Norge 756 697
Widerøe 156 144
Newco - 103
airBaltic 65 62
Air Maintenance Estonia 25 24
Aerolineas de Baleares - 15
Blue1 14 14
SAS Cargo 15 15
Total goodwill 1,031 2,682

71SAS Group Annual Report 2007
Note 13 • Tangible fixed assets
Spare engines Workshop & aircraftBuildings & land Aircraft 1, 2 & spare parts servicing equipment
2007 2006 2007 2006 2007 2006 2007 2006
Opening acquisition value 1,717 3,046 18,358 23,157 1,755 2,306 1,310 1,369
Investment 24 46 1,310 846 127 71 97 108
Capitalized interest 3 - - - - - - - -
Sales/disposals –23 –578 –1,510 –6,021 –33 –418 –39 –108
Sales of companies 4 –35 –828 - - - - - -
Reclassifications to assets held for sale 4 –175 - –515 - –289 - –80 -
Reclassifications 17 88 877 452 181 –170 –4 -
Exchange rate differences 55 –57 146 –76 50 –34 66 –59
Closing accumulated acquisition value 1,580 1,717 18,666 18,358 1,791 1,755 1,350 1,310
Opening depreciation –1,033 –1,789 –7,028 –8,476 –372 –780 –1,095 –1,159
Depreciation for the year in continuing operations –89 –89 –1,045 –1,216 –135 –120 –71 –74
Depreciation for the year in discont. operations –10 –59 –66 –51 –15 –14 –7 –10
Sales/disposals 22 285 71 2,685 14 370 37 94
Sale of companies 4 26 585 - - - - - -
Reclassifications to assets held for sale 4 103 - 293 - 89 - 66 -
Reclassifications - 2 –17 6 –142 167 4 -
Exchange rate differences –31 32 –108 24 –19 5 –58 54
Closing accumulated depreciation –1,012 –1,033 –7,900 –7,028 –580 –372 –1,124 –1,095
Closing planned residual value 568 684 10,766 11,330 1,211 1,383 226 215
Other equipment Construction in Prepayment Total& vehicles progress fixed assets tangible assets
2007 2006 2007 2006 2007 2006 2007 2006
Opening acquisition value 3,472 4,879 378 148 317 422 27,307 35,327
Investment 293 261 368 722 293 127 2,512 2,181
Capitalized interest 3 - - - - 17 24 17 24
Sales/disposals –224 –167 - - - - –1,829 –7,292
Sales of companies 4 –1,607 –1,367 –71 –93 - –2 –1,713 –2,290
Reclassifications to assets held for sale 4 –79 - - - - - –1,138 -
Reclassifications 19 –32 –505 –398 –434 –207 151 –267
Exchange rate differences 79 –102 2 –1 –8 –47 390 –376
Closing accumulated acquisition value 1,953 3,472 172 378 185 317 25,697 27,307
Opening depreciation –2,838 –3,666 - - - - –12,366 –15,870
Depreciation for the year in continuing operations –95 –124 - - - - –1,435 –1,623
Depreciation for the year in discont. operations –36 –193 - - - - –134 –327
Sales/disposals 220 158 - - - - 364 3,592
Sales of companies 4 1,136 903 - - - - 1,162 1,488
Reclassifications to assets held for sale 4 52 - - - - - 603 -
Reclassifications –4 - - - - - –159 175
Exchange rate differences –80 84 - - - - –296 199
Closing accumulated depreciation –1,645 –2,838 - - - - –12,261 –12,366
Closing planned residual value 308 634 172 378 185 317 13,436 14,941
At the beginning of 2007, seven Boeing737s, four Airbus A321s and five
Airbus A340/340s were acquired, formally through finance lease contracts,
with original terms of 9-10 years. During the year no transactions pertaining
to finance leased aircraft were carried out.
With regard to finance-leased aircraft, the terms of the leasing contracts
(particularly pertaining to SAS’s call options during the contract period and
at the expiration of the leasing contract, as well as the economic risk SAS has
regarding the value of the aircraft) are such that the agreements, from SAS’s
point of view, are comparable to a purchase.
The 16 (16) finance-leased aircraft are recognized in the balance sheet
in the amount of MSEK 6,468 (6,745). In addition to these, owned aircraft
include 3 (12) aircraft valued at MSEK 551 (1,747) placed in financing struc-
tures wholly owned by SAS together with appurtenant indebtedness of MSEK
234 (1,349), which are to be viewed as finance-leased.
The SAS Group’s aircraft holdings can be specified as follows:
2007 2006
Owned 4,298 4,585
Finance leased 6,468 6,745
Book value 10,766 11,330
Finance leasing
The SAS Group has finance lease contracts for aircraft with remaining terms
of up to nine years.
Lease payments consist in part of minimum lease payments and in part
of contingent rents. In those cases where the lease payments are based on a
floating interest rate they are included in minimum lease payments according
to the current rate at the start of the agreement. Future changes of the inter-
est rate are included in the contingent rents. Total lease payments amounted
to MSEK 643 (804). Contingent rents impacted lease payments for the year
by MSEK 113 (158).
At the closing date leasing of finance leased assets to third parties did not occur.
Book values of finance lease assets amounted on the closing date to:
Machinery &Aircraft equipment
2007 2006 2007 2006
Acquisition value 8,656 8,575 - 57
Less accum. depreciation –2,188 –1,830 - –12
Book value of finance lease assets 6,468 6,745 - 45
1 The insured value of aircraft at December 31, 2007 amounted to MSEK 46,041. This includes the insured value of leased (operating leases) aircraft in the amount of MSEK 35,994.
2 Modifications of aircraft under operating leases is included in planned residual value in the amount of MSEK 259 (217).
3 Capitalizing of interest was done at an average interest rate of 6.0% (6.0%).4 During the year SAS Flight Academy and Newco Airport Services were divested. Spanair and
Aerolineas de Baleares are in the process of being sold and are recognized as discontinued operations. In the previous year the Rezidor Hotel Group was floated on the stock exchange, whereby SAS divested 91% of its shareholding. Norwegian Aviation College was also divested.
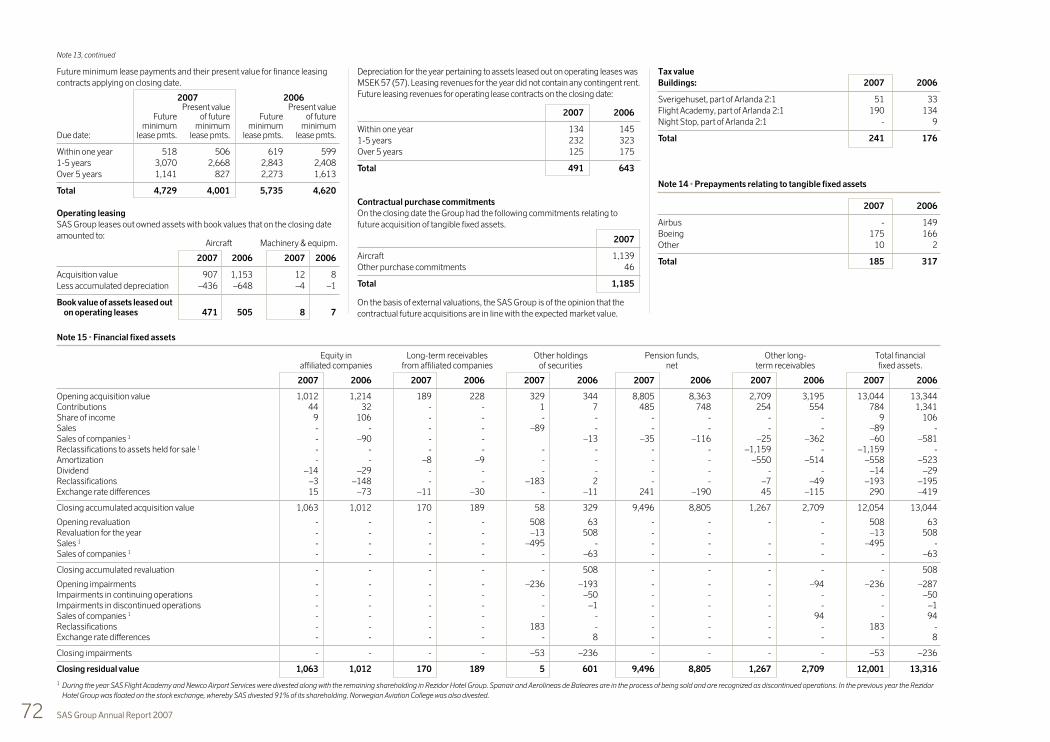
72 SAS Group Annual Report 2007
Future minimum lease payments and their present value for finance leasing
contracts applying on closing date.
2007 2006Present value Present value
Future of future Future of futureminimum minimum minimum minimum
Due date: lease pmts. lease pmts. lease pmts. lease pmts.
Within one year 518 506 619 599
1-5 years 3,070 2,668 2,843 2,408
Over 5 years 1,141 827 2,273 1,613
Total 4,729 4,001 5,735 4,620
Operating leasing
SAS Group leases out owned assets with book values that on the closing date
amounted to:Aircraft Machinery & equipm.
2007 2006 2007 2006
Acquisition value 907 1,153 12 8
Less accumulated depreciation –436 –648 –4 –1
Book value of assets leased out on operating leases 471 505 8 7
Depreciation for the year pertaining to assets leased out on operating leases was
MSEK 57 (57). Leasing revenues for the year did not contain any contingent rent.
Future leasing revenues for operating lease contracts on the closing date:
2007 2006
Within one year 134 145
1-5 years 232 323
Over 5 years 125 175
Total 491 643
Contractual purchase commitments
On the closing date the Group had the following commitments relating to
future acquisition of tangible fixed assets.
2007
Aircraft 1,139
Other purchase commitments 46
Total 1,185
On the basis of external valuations, the SAS Group is of the opinion that the
contractual future acquisitions are in line with the expected market value.
Tax value
Buildings: 2007 2006
Sverigehuset, part of Arlanda 2:1 51 33
Flight Academy, part of Arlanda 2:1 190 134
Night Stop, part of Arlanda 2:1 - 9
Total 241 176
Note 14 • Prepayments relating to tangible fixed assets
2007 2006
Airbus - 149
Boeing 175 166
Other 10 2
Total 185 317
Note 13, continued
Note 15 • Financial fixed assets
Equity in Long-term receivables Other holdings Pension funds, Other long- Total financialaffiliated companies from affiliated companies of securities net term receivables fixed assets.
2007 2006 2007 2006 2007 2006 2007 2006 2007 2006 2007 2006
Opening acquisition value 1,012 1,214 189 228 329 344 8,805 8,363 2,709 3,195 13,044 13,344Contributions 44 32 - - 1 7 485 748 254 554 784 1,341Share of income 9 106 - - - - - - - - 9 106Sales - - - - –89 - - - - - –89 -Sales of companies 1 - –90 - - –13 –35 –116 –25 –362 –60 –581Reclassifications to assets held for sale 1 - - - - - - - - –1,159 - –1,159 -Amortization - - –8 –9 - - - - –550 –514 –558 –523Dividend –14 –29 - - - - - - - - –14 –29Reclassifications –3 –148 - - –183 2 - - –7 –49 –193 –195Exchange rate differences 15 –73 –11 –30 - –11 241 –190 45 –115 290 –419
Closing accumulated acquisition value 1,063 1,012 170 189 58 329 9,496 8,805 1,267 2,709 12,054 13,044
Opening revaluation - - - - 508 63 - - - - 508 63Revaluation for the year - - - - –13 508 - - - –13 508Sales 1 - - - - –495 - - - - - –495 -Sales of companies 1 - - - - - –63 - - - - - –63
Closing accumulated revaluation - - - - - 508 - - - - - 508
Opening impairments - - - - –236 –193 - - - –94 –236 –287Impairments in continuing operations - - - - - –50 - - - - - –50Impairments in discontinued operations - - - - - –1 - - - - - –1Sales of companies 1 - - - - - - - - - 94 - 94Reclassifications - - - - 183 - - - - - 183 -Exchange rate differences - - - - - 8 - - - - - 8
Closing impairments - - - - –53 –236 - - - - –53 –236
Closing residual value 1,063 1,012 170 189 5 601 9,496 8,805 1,267 2,709 12,001 13,316
1 During the year SAS Flight Academy and Newco Airport Services were divested along with the remaining shareholding in Rezidor Hotel Group. Spanair and Aerolineas de Baleares are in the process of being sold and are recognized as discontinued operations. In the previous year the Rezidor
Hotel Group was floated on the stock exchange, whereby SAS divested 91% of its shareholding. Norwegian Aviation College was also divested.

73SAS Group Annual Report 2007
Note 16 • Equity in affiliated companies
Participations in affiliated companies are reported by the owner company
through application of the equity method. Consolidated shareholders’ equity
on the closing date, December 31, 2007, amounted to MSEK 17,130. If partici-
pations in affiliated companies had been reported according to the acquisition
cost method, consolidated shareholders’ equity would have amounted to
MSEK 17,106.
Equity in affiliated companies includes acquired surplus value of MSEK 34
(35) in British Midland PLC, MSEK 39 (39) in Skyways Holding AB, MSEK 148
(141) in AS Estonian Air, MSEK 7 (6) in Travel AS and MSEK 8 (-) in Go Now AS.
Note 17 • Long-term receivables from affiliated companies
2007 2006
Commercial Aviation Leasing Ltd 170 189
Total 170 189
Share of equity
Corporate ID No. Domicile Share of equity % 2007 2006
British Midland PLC 2107441 Derby, U.K. 20.0 95 96
Skyways Holding AB 556021-5872 Stockholm, Sweden 25.0 57 53
Air Greenland A/S 30672 Nuuk, Greenland 37.5 218 177
AS Estonian Air 10076042 Tallinn, Estonia 49.0 189 200
ST Aerospace Solutions (Europe) A/S 28501048 Copenhagen, Denmark 28.7 412 382
Commercial Aviation Leasing Ltd IE6328550R Dublin, Ireland 49.0 179 201
Elimination of intra-group profit for Commercial Aviation Leasing Ltd –119 –119
Malmö Flygfraktterminal AB 556061-7051 Malmö, Sweden 40.0 8 7
Travel AS 987096985 Fredrikstad, Norway 25.3 6 7
SIA Baltijas Kravu Centers 40003458674 Riga, Latvia 45.0 5 4
Go Now AS 989867873 Oslo, Norway 41.7 10 -
Other 3 4
Total 1,063 1,012
Total assets in affiliated companies 12,303 12,156
Total liabilities in affiliated companies 9,436 9,622
Equity in affiliated companies 2,867 2,534
SAS Group’s share of equity in affiliated companies 1,063 1,012
2007 2006
Pension funds, net, funded plans 11,441 10,367
Pension funds, net, unfunded plans –1,945 –1,562
Total 9,496 8,805
Most pension plans in Scandinavia are defined benefit. The majority are placed with insurance companies. The group pension plans for salaried employees in Sweden and for employees in Norway are secured through defined benefit pension plans with insurance companies. In Sweden, pension plans are mainly placed with Alecta and Euroben and in Norway with Vital. Employees in Den-mark have mostly defined contribution solutions.
The majority of SAS employees in Sweden are covered by ITP pension rein-
sured by Alecta (the Alecta plan). The Alecta plan is a multi-employer pension
plan and has been classified by the Swedish Financial Accounting Standards
Council as a defined benefit pension plan. SAS has signed a special and spe-
cific agreement with Alecta whereby Alecta has undertaken to supply all basic
data concerning employees and former employees (pay, age, etc.), which
supports SAS accounting according to IAS 19. Alecta has specifically certified
that the information regarding the basic data is correct and reliable. The agree-
ment with Alecta also means that SAS received written confirmation that the
surplus in the Alecta plan will benefit SAS in the form of either indirect or direct
premium reductions or through cash refunds. Based on the information SAS
receives, SAS reports its proportional share of the Alecta plan’s commitments,
plan assets and costs in accordance with IAS 19 rules regarding defined
benefit pension plans. With this support SAS can apply the main rule in IAS 19
regarding defined benefit pension plans that cover many employers.
The normal retirement age for non-flight personnel mainly follows the respec-
tive country’s rules regarding general retirement. The normal retirement age
for SAS flight personnel is 60. According to agreements with SAS pilots in
Denmark, Norway and Sweden, and with cabin crew in Norway, voluntary early
retirement with pension is allowed from the age of 55 at the earliest. SAS has
also undertaken to pay a pension up to normal retirement age, 60, to pilots who
have lost their licenses. The retirement age for cabin crew employed in Sweden
is insured at 65, but once they reach the age of 50 the retirement age is re-
duced to 60. The estimated present value of all these obligations is included in
SAS’s estimated total pension commitment.
In calculating pension commitments, the year’s pension earnings and returns,
locally set parameters are applied in the respective countries on the basis of the
local market situation and expected future trend. The following long-term eco-
nomic assumptions represent a weighted average for the SAS Group:
2007 2006 2005
Discount rate 5.8% 5.2% 5.2%
Long-term rate of return 6.2% 7.4% 7.4%
Inflation 1.7% 1.7% 1.7%
Future salary adjustments 3.2% 2.6% 2.6%
Future adjustments of current pensions 1.7% 1.7% 1.7%
The following interest parameters are used for the largest pension plans in
Sweden and Norway:
Discount rate 5.5% (5.0%) in Sweden and 6.0% (5.5%) in Norway
Long-term rate of return 6.5% (7.5%) in Sweden and 6.0% (7.5%) in Norway
According to IAS 19 the discount rate is determined by reference to the market yields on corporate bonds at the balance sheet date. Other financial assumptions are based on anticipated developments during the term of the commitments.
The discount rate is determined on the balance sheet date with reference to
corporate bonds and with regard to relevant spread whose term is compatible
with the term of the commitments. The long-term return shall correspond to a
long-term expectation of return on funded assets based on the pension insti-
tutes’ investments in equities and fixed-income securities.
The inflation assumption is 1.5% in Sweden and Denmark and 2% in Nor-
way. Future salary adjustment for Sweden and Denmark has been set at one
percentage point and, for Norway, two percentage points above the inflation
assumption for the purpose of including a real salary increase in calculations of
pension commitments.
The amortization period for actuarial gains and losses exceeding the higher
of 10% of commitments or funded assets is 15 years, which corresponds to
average remaining employment period.
Defined benefit pension plans 2007 2006
Pension earned during the year –1,008 –1,034
Interest on pension provisions –1,488 –1,340
Expected return on funded assets for the year 1,841 1,981
Amortization of actuarial gains and losses and plan amendments for year –506 –448
Impact on income for the year, net, pertaining to defined benefit pension plans in continuing operations –1,161 –841
The above cost is recognized in its entirety as a payroll expense.
Overfunding exists in several of SAS’s pension plans. This means the return on
funded assets for the year will exceed the cost of pension earnings.
In the financial statements the commitments of the SAS Group are included
Note 18 • Pension funds, net

74 SAS Group Annual Report 2007
as specified in the table below. Plan amendments are amortized over the average
remaining working lives of employees covered by the plan and actuarial gains and
losses are amortized over fifteen years when they exceed 10% of the greater of
pension obligations or pension assets.
Status at year-end 2007 2006
Funded assets 30,585 27,954
Pension commitments –29,069 –27,307
Difference between funded assets and commitments 1,516 647
Unrecognized actuarial gains and losses and plan amendments 1 7,980 8,158
Book assets 9,496 8,8051 Of which actuarial gains and losses MSEK 7,716 (7,872)
Changes in present value of commitment for defined benefit pensions 2007 2006
Commitment for defined benefit pensions at beginning of year 27,307 25,702
Pensions paid –1,250 –1,218
Cost of earning 1,008 1,034
Interest expenses 1,488 1,340
Actuarial gains and losses (–/+) –670 1,885
Effects of sold companies –67 –376
Exchange rate differences 1,252 –1,060
Commitment for defined benefit pensions at year-end 29,069 27,307
Change of plan assets’ fair value 2007 2006
Plan assets’ fair value at beginning of year 27,954 26,734
Paid-in premiums 1,535 1,484
Pensions paid –971 –883
Expected return on plan assets 1,841 1,981
Actuarial gains and losses (+/–) –433 349
Utilization of company funds in Alecta –273 –385
Effects of sold companies –102 –401
Exchange rate differences 1,034 –925
Fair value of changes at year-end 30,585 27,954
Plan assets consist of the following
Group 2007 2006
Equities 31% 35%
Fixed-income securities 57% 55%
Properties 9% 9%
Other 3% 1%
100% 100%
Only an intangible share of the plan assets is invested in SAS shares.
In some pension plans in earlier years the real return rate has been lower than
the Group’s estimated long-term return, which is reflected in the item, “Unrecog-
nized actuarial gains and losses.” The actual return on plan assets was 7.2% in
2006 and 10.2% in 2005. While the final calculations for 2007 are not yet ready,
the return is expected to be approximately 6%.
The difference between funded assets/commitments and net book assets is
shown below: Difference
Commit- funded PensionsFunded ments assets/com- funds,
assets (PBO) mitments net
Pension plans in Sweden 13,737 9,000 4,737 5,708
Pension plans in Norway 11,895 14,382 –2,487 2,759
Pension plans in other countries 4,953 5,687 –734 1,029
Total 30,585 29,069 1,516 9,496
“Pension funds, net” includes unfunded plans funded via operating income in
the amount of MSEK 328 in Sweden and MSEK 1,234 in Norway.
Pension funds, net, including pension commitments, plan assets plus un-
recognized plan amendments and actuarial gains and losses for the defined
benefit pension plans performed as follows:
2007 2006
Opening balance 8,805 8,363
Impact on income for the year in continuing and discontinued operations –1,161 –855
Paid-in premiums 1,535 1,484
Pensions paid 279 335
Utilization of company funds in Alecta –273 –385
Pension funds in divested operations –35 –116
Change in actuarial gains and losses 105 169
Currency effect 241 –190
Closing balance 9,496 8,805
Of total pension commitments of MSEK 29,069 (27,307), MSEK 25,962
(24,637) was funded and MSEK 3,107 (2,670) was unfunded.
In 2008 paid-in premiums are expected to amount to approximately MSEK
1,400.
2007 2006
Present value of defined benefit plan commitment –29,069 –27,307
Fair value of plan assets 30,585 27,954
Surplus 1,516 647
Experience-based adjustment pertaining to plan assets 289 19Experience-based adjustment pertaining to defined benefit plan commitments 610 286
Note 19 • Expendable spare parts and inventories
2007 2006
Expendable spare parts, flight equipment 610 740
Expendable spare parts, other 171 151
Inventories 68 102
Total 849 993
2007 2006
Measured at historical cost 835 982
Measured at net realizable value 14 11
Total 849 993
Not 20 • Current receivables
Impairment of accounts receivable and recovered accounts receivable, net, in
continuing operations came to MSEK 27 (64), charged against income. In dis-
continued operations the corresponding amount was MSEK 107 (–9).
Impairment of other current receivables in continuing operations came to
MSEK 1 (12), charged against income.
The Group’s combined accounts receivable amount to 3,733 (3,918) of which
1,782 (-) is recognized as assets held for sale.
Age analysis of accounts receivable
that are not impaired 2007 2006
Accounts receivable not yet due 1,613 2,791
Due < 31 days 223 472
Due 31-90 days 61 271
Due 91-180 days 29 124
Due>180 days 25 260
Total 1,951 3,918
Provision for doubtful accounts receivable 2007 2006
Provision at beginning of the year 215 143
Reclassification to assets held for sale –93 -
Provision for expected losses 33 101
Reversed provisions –13 –5
Actual losses –8 –18
Exchange rate differences 1 –6
Total 135 215
Note 21 • Current receivables from affiliated companies
2007 2006
ST Aerospace Solutions (Europe) A/S 365 234
Commercial Aviation Leasing Ltd 128 113
Skyways Holding AB 8 0
Other companies 9 10
Total 510 357
Note 22 • Prepaid expenses and accrued income
2007 2006
Prepaid expenses 548 604
Accrued income 522 530
Total 1,070 1,134
Note 18, continued
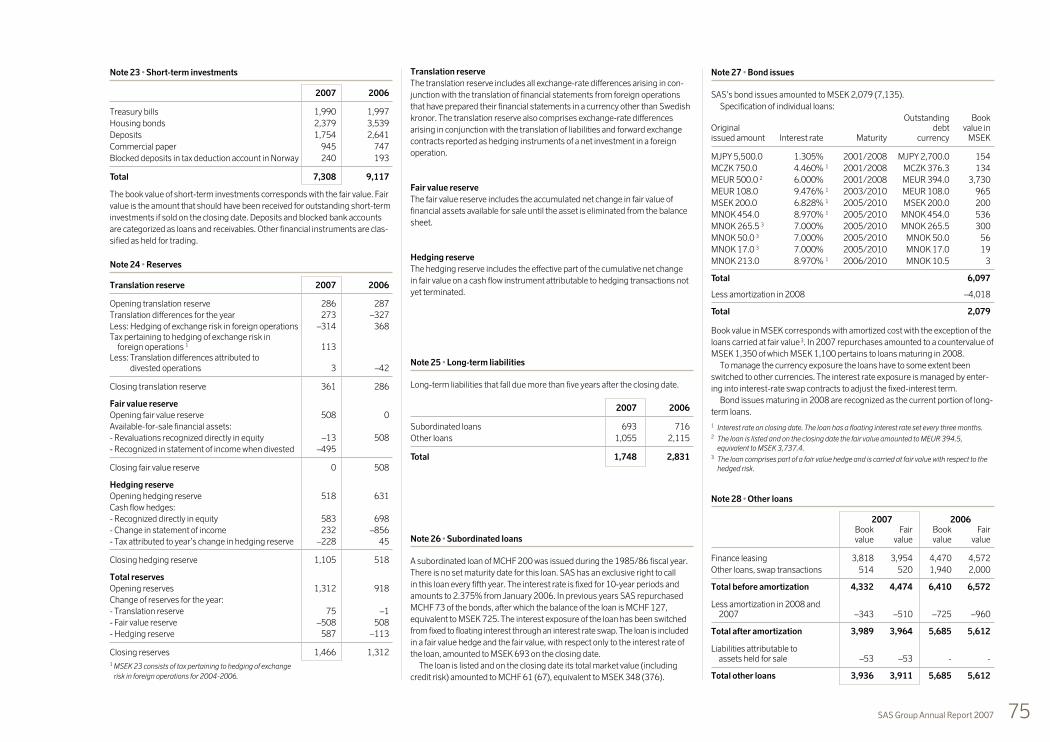
75SAS Group Annual Report 2007
Note 23 • Short-term investments
2007 2006
Treasury bills 1,990 1,997
Housing bonds 2,379 3,539
Deposits 1,754 2,641
Commercial paper 945 747
Blocked deposits in tax deduction account in Norway 240 193
Total 7,308 9,117
The book value of short-term investments corresponds with the fair value. Fair
value is the amount that should have been received for outstanding short-term
investments if sold on the closing date. Deposits and blocked bank accounts
are categorized as loans and receivables. Other financial instruments are clas-
sified as held for trading.
Note 24 • Reserves
Translation reserve 2007 2006
Opening translation reserve 286 287
Translation differences for the year 273 –327
Less: Hedging of exchange risk in foreign operations –314 368Tax pertaining to hedging of exchange risk in foreign operations 1 113Less: Translation differences attributed to
divested operations 3 –42
Closing translation reserve 361 286
Fair value reserve
Opening fair value reserve 508 0
Available-for-sale financial assets:
- Revaluations recognized directly in equity –13 508
- Recognized in statement of income when divested –495
Closing fair value reserve 0 508
Hedging reserve
Opening hedging reserve 518 631
Cash flow hedges:
- Recognized directly in equity 583 698
- Change in statement of income 232 –856
- Tax attributed to year’s change in hedging reserve –228 45
Closing hedging reserve 1,105 518
Total reserves
Opening reserves 1,312 918
Change of reserves for the year:
- Translation reserve 75 –1
- Fair value reserve –508 508
- Hedging reserve 587 –113
Closing reserves 1,466 1,3121 MSEK 23 consists of tax pertaining to hedging of exchange
risk in foreign operations for 2004-2006.
Translation reserve
The translation reserve includes all exchange-rate differences arising in con-
junction with the translation of financial statements from foreign operations
that have prepared their financial statements in a currency other than Swedish
kronor. The translation reserve also comprises exchange-rate differences
arising in conjunction with the translation of liabilities and forward exchange
contracts reported as hedging instruments of a net investment in a foreign
operation.
Fair value reserve
The fair value reserve includes the accumulated net change in fair value of
financial assets available for sale until the asset is eliminated from the balance
sheet.
Hedging reserve
The hedging reserve includes the effective part of the cumulative net change
in fair value on a cash flow instrument attributable to hedging transactions not
yet terminated.
Note 25 • Long-term liabilities
Long-term liabilities that fall due more than five years after the closing date.
2007 2006
Subordinated loans 693 716
Other loans 1,055 2,115
Total 1,748 2,831
Note 26 • Subordinated loans
A subordinated loan of MCHF 200 was issued during the 1985/86 fiscal year.
There is no set maturity date for this loan. SAS has an exclusive right to call
in this loan every fifth year. The interest rate is fixed for 10-year periods and
amounts to 2.375% from January 2006. In previous years SAS repurchased
MCHF 73 of the bonds, after which the balance of the loan is MCHF 127,
equivalent to MSEK 725. The interest exposure of the loan has been switched
from fixed to floating interest through an interest rate swap. The loan is included
in a fair value hedge and the fair value, with respect only to the interest rate of
the loan, amounted to MSEK 693 on the closing date.
The loan is listed and on the closing date its total market value (including
credit risk) amounted to MCHF 61 (67), equivalent to MSEK 348 (376).
Note 27 • Bond issues
SAS’s bond issues amounted to MSEK 2,079 (7,135).
Specification of individual loans:
Outstanding BookOriginal debt value inissued amount Interest rate Maturity currency MSEK
MJPY 5,500.0 1.305% 2001/2008 MJPY 2,700.0 154
MCZK 750.0 4.460% 1 2001/2008 MCZK 376.3 134
MEUR 500.0 2 6.000% 2001/2008 MEUR 394.0 3,730
MEUR 108.0 9.476% 1 2003/2010 MEUR 108.0 965
MSEK 200.0 6.828% 1 2005/2010 MSEK 200.0 200
MNOK 454.0 8.970% 1 2005/2010 MNOK 454.0 536
MNOK 265.5 3 7.000% 2005/2010 MNOK 265.5 300
MNOK 50.0 3 7.000% 2005/2010 MNOK 50.0 56
MNOK 17.0 3 7.000% 2005/2010 MNOK 17.0 19
MNOK 213.0 8.970% 1 2006/2010 MNOK 10.5 3
Total 6,097
Less amortization in 2008 –4,018
Total 2,079
Book value in MSEK corresponds with amortized cost with the exception of the
loans carried at fair value 3. In 2007 repurchases amounted to a countervalue of
MSEK 1,350 of which MSEK 1,100 pertains to loans maturing in 2008.
To manage the currency exposure the loans have to some extent been
switched to other currencies. The interest rate exposure is managed by enter-
ing into interest-rate swap contracts to adjust the fixed-interest term.
Bond issues maturing in 2008 are recognized as the current portion of long-
term loans.
1 Interest rate on closing date. The loan has a floating interest rate set every three months. 2 The loan is listed and on the closing date the fair value amounted to MEUR 394.5,
equivalent to MSEK 3,737.4.3 The loan comprises part of a fair value hedge and is carried at fair value with respect to the
hedged risk.
Note 28 • Other loans
2007 2006Book Fair Book Fairvalue value value value
Finance leasing 3,818 3,954 4,470 4,572
Other loans, swap transactions 514 520 1,940 2,000
Total before amortization 4,332 4,474 6,410 6,572
Less amortization in 2008 and 2007 –343 –510 –725 –960
Total after amortization 3,989 3,964 5,685 5,612
Liabilities attributable to assets held for sale –53 –53 - -
Total other loans 3,936 3,911 5,685 5,612

76 SAS Group Annual Report 2007
Maturity profile of other loans:
2008 2009 2010 2011 2012 2013> Total
Finance leases 306 364 388 836 926 998 3,818
Other loans 90 115 197 27 28 57 514
Total 396 479 585 863 954 1,055 4,332
Other loans are categorized as other liabilities, recognized at amortized cost.
Note 29 • Financial risk management and financial derivatives
The SAS Group is exposed to various types of financial risk. All risk management
is handled centrally and in accordance with the financial policy set by the
Board. The SAS Group uses derivative instruments as part of its risk manage-
ment to limit its currency and interest rate exposure.
Currency risks
The SAS Group has currency exposure to both transaction risk and translation
risk.
Transaction risk arises when flows in foreign currencies are exposed to
currency rate fluctuations. To manage the transaction risk the SAS Group is
exposed to, the projected commercial currency flows are hedged with the help
of currency derivatives and future aircraft sales are hedged by currency deriva-
tives and loans in USD. According to the financial policy, the hedge level shall
be between 60-90% of a 12-month rolling liquidity forecast and the hedge
level for future aircraft sales shall according to the policy amount to 40-60% of
the book value of the aircraft fleet.
Translation risk arises during conversion of balance sheet items in foreign
currencies due to changes in exchange rates. To limit translation risk the policy
is to keep the financial net debt mainly in the accounting currency of the re-
spective company. Furthermore, the SAS Group hedged foreign subsidiaries’
equity through borrowing and derivatives.
Interest rate risks
The SAS Group is exposed to interest rate risk when the market value of the fi-
nancial net debt (interest-bearing assets and liabilities) is affected by movements
in the yield curve (market interest rates at different maturities). To manage the
interest rate risk, interest rate derivatives are used to change the fixed-interest
term of the underlying financial net debt. The goal of current policy is for the
average fixed-interest term of the financial net debt to correspond to 3.5 years.
The average fixed-interest term during the year was approximately 3.8 (3.5)
years. At the end of 2007 the fixed-interest term was 2.5 (4.8) years.
Sensitivity analysis
Earnings EquityMarket risk Change impact MSEK impact MSEK
Market interest rates +1% –14 20
Market interest rates –1% 14 –21
Currency +10% 0 –427
Currency –10% 2 447
Fuel price +10% 0 260
Fuel price –10% 0 –305
Beyond the above effect on equity, a 10% change in currency will impact equity
by MSEK 511 of changes in value for hedges of net investments. A corre-
sponding change in value arises for net investments in foreign operations. The
net effect of the above change in value has no impact on equity. The remaining
amount consists of change in value for cash flow hedges.
In the sensitivity analysis concerning the earnings impact of interest rate
changes the simulation has been based on a 1% parallel shift in the yield curve.
The sensitivity analysis for currency is based on a 10% gain or loss for the
Swedish krona against all currencies to which SAS is exposed. In the sensitiv-
ity analysis concerning earnings impact for fuel derivatives the simulation is
based on a 10% parallel shift in the price curve for underlying fuel.
Credit risks
The Group’s financial transactions give rise to exposure to credit risk vis-à-vis
the financial counterparties. Credit risk or counterparty risk pertains to the risk
of loss if a counterparty does not fulfill his contractual obligations. The financial
policy prescribes that transactions may be signed only with counterparties
with high creditworthiness, defined as category A3/P-1 or better according to
Moody’s.
Limits are set for each counterparty and are continually revised. To further
reduce counterparty risks, ISDA agreements (netting agreements) are signed
with most counterparties. Approximately 71% of the credit-related exposure
is geographically concentrated in the Nordic countries. The breakdown of the
remaining credit exposure is 19% in the rest of Europe and 10% in the rest of
the world. The maximum credit exposure for derivative instruments is matched
by book value, see the table below under the heading financial derivatives.
For short-term investments the size of the credit risk is the book value and is
distributed as follows:
Rating (Moody’s) Book value MSEK
Aaa/P-1 1,990
Aa1/P-1 2,882
Aa2/P-1 595
Aa3/P-1 744
A1/P-1 799
A2/P-1 298
A3/P-1 0
Total 7,308
Concerning the SAS Group’s accounts receivable the credit risk is spread over
a large number of customers including private individuals and companies in
various industries. Credit information is required for credit sales with the aim of
minimizing the risk of bad debt losses and is based on intragroup information
on payment history supplemented with credit and business information from
external sources.
The maximum credit risk for the SAS Group accords with the financial assets’
book value according to the categorization table.
Liquidity and borrowing risks
Liquidity and borrowing risks refer to the risk that sufficient liquidity is not available
when required, and that refinancing of matured loans will be costly or problematic.
The goal is for financial preparedness to amount to a minimum of 20% of the
SAS Group’s revenues, of which at least half is to be held in liquid assets. At
December 31, 2007, financial preparedness amounted to MSEK 15,091, with
liquid assets amounting to MSEK 8,993 and total unutilized credit facilities
amounting to MSEK 6,098. Of the liquid assets MSEK 102 is classified as assets
held for sale. This provides a level of financial preparedness of 24%. The SAS
Group’s liquid assets shall be held in instruments with good liquidity or short
maturity with a credit rating of no lower than A3/P-1 according to Moody’s.
Contracted credit facilitiesTotal Utilized Unutilized Maturity
Facility facility facility facility date
Revolving credit facility MEUR 366 3,467 0 3,467 2010
Revolving credit facility MNOK 98 116 0 116 2011
Revolving credit facility MUSD 156 1,008 0 1,008 2011
Bilateral bank facilities 500 0 500 2011
Bilateral bank facilities 500 0 500 2009
Bilateral bank facilities 250 0 250 2010
Other facilities 504 247 257 2008-2009
Total 6,345 247 6,098
At December 31, 2007, the Group’s interest-bearing liabilities amounted to
MSEK 12,042 (16,478). 0% (0%) of the interest-bearing liabilities requires the
fulfillment of special requirements for financial key figures such as cash flow,
debt/equity and liquidity ratios. The term of the interest-bearing gross debt
amounted to approximately 2.7 (3.1) years at year-end.
Liquidity risk
December 31, 2007 Up to 3 mos. 3-12 mos. 1-5 years Over 5 years
Subordinated loans 17 0 69 794
Bond issues 15 4,359 2,343 0
Other loans 22 –8 464 63
Finance leases 108 437 3,443 1,314
Short-term loans 1 1 0 0
Interest rate swaps 89 –106 –23 9
Accounts payable 3,550 0 0 0
Total 3,802 4,683 6,296 2,180
December 31, 2006 Up to 3 mos. 3-12 mos. 1-5 years Over 5 years
Subordinated loans 17 0 68 802
Bond issues 37 538 7,801 0
Other loans 72 277 2,251 84
Finance leases 116 529 3,040 2,594
Short-term loans 1,136 0 0 0
Interest rate swaps 97 107 –37 8
Accounts payable 3,350 0 0 0
Total 4,825 1,451 13,123 3,488
Note 28, continued
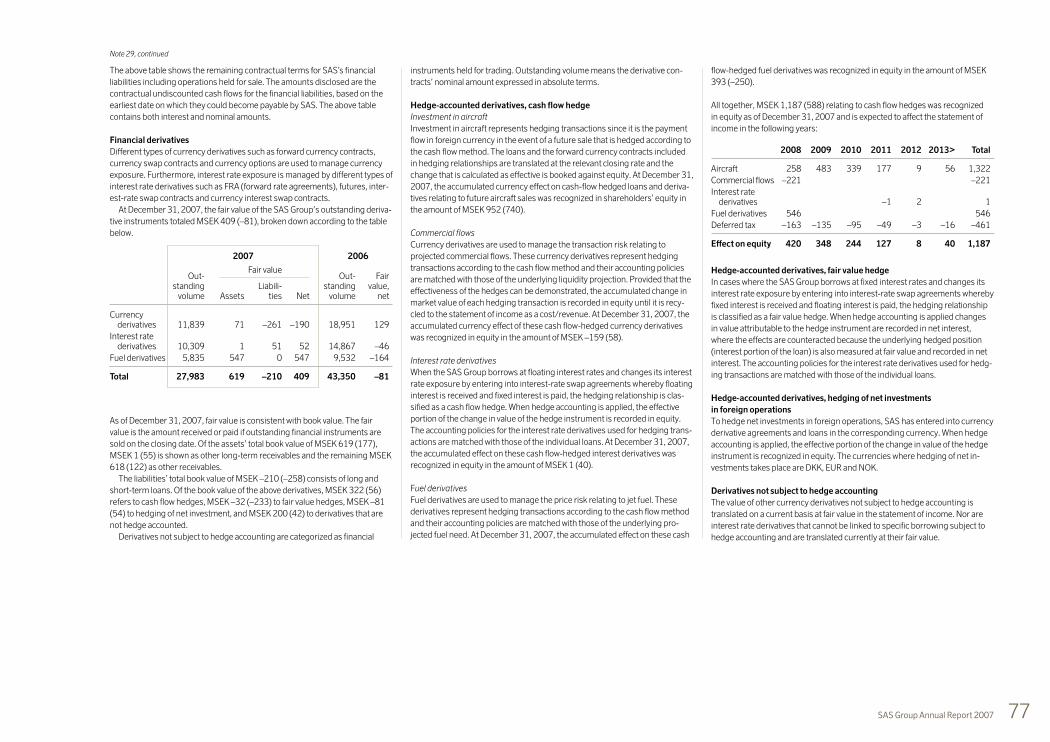
77SAS Group Annual Report 2007
The above table shows the remaining contractual terms for SAS’s financial
liabilities including operations held for sale. The amounts disclosed are the
contractual undiscounted cash flows for the financial liabilities, based on the
earliest date on which they could become payable by SAS. The above table
contains both interest and nominal amounts.
Financial derivatives
Different types of currency derivatives such as forward currency contracts,
currency swap contracts and currency options are used to manage currency
exposure. Furthermore, interest rate exposure is managed by different types of
interest rate derivatives such as FRA (forward rate agreements), futures, inter-
est-rate swap contracts and currency interest swap contracts.
At December 31, 2007, the fair value of the SAS Group’s outstanding deriva-
tive instruments totaled MSEK 409 (–81), broken down according to the table
below.
2007 2006
Out-Fair value
Out- Fairstanding Liabili- standing value,
volume Assets ties Net volume net
Currency derivatives 11,839 71 –261 –190 18,951 129
Interest rate derivatives 10,309 1 51 52 14,867 –46
Fuel derivatives 5,835 547 0 547 9,532 –164
Total 27,983 619 –210 409 43,350 –81
As of December 31, 2007, fair value is consistent with book value. The fair
value is the amount received or paid if outstanding financial instruments are
sold on the closing date. Of the assets’ total book value of MSEK 619 (177),
MSEK 1 (55) is shown as other long-term receivables and the remaining MSEK
618 (122) as other receivables.
The liabilities’ total book value of MSEK –210 (–258) consists of long and
short-term loans. Of the book value of the above derivatives, MSEK 322 (56)
refers to cash flow hedges, MSEK –32 (–233) to fair value hedges, MSEK –81
(54) to hedging of net investment, and MSEK 200 (42) to derivatives that are
not hedge accounted.
Derivatives not subject to hedge accounting are categorized as financial
instruments held for trading. Outstanding volume means the derivative con-
tracts’ nominal amount expressed in absolute terms.
Hedge-accounted derivatives, cash flow hedge
Investment in aircraft
Investment in aircraft represents hedging transactions since it is the payment
flow in foreign currency in the event of a future sale that is hedged according to
the cash flow method. The loans and the forward currency contracts included
in hedging relationships are translated at the relevant closing rate and the
change that is calculated as effective is booked against equity. At December 31,
2007, the accumulated currency effect on cash-flow hedged loans and deriva-
tives relating to future aircraft sales was recognized in shareholders’ equity in
the amount of MSEK 952 (740).
Commercial flows
Currency derivatives are used to manage the transaction risk relating to
projected commercial flows. These currency derivatives represent hedging
transactions according to the cash flow method and their accounting policies
are matched with those of the underlying liquidity projection. Provided that the
effectiveness of the hedges can be demonstrated, the accumulated change in
market value of each hedging transaction is recorded in equity until it is recy-
cled to the statement of income as a cost/revenue. At December 31, 2007, the
accumulated currency effect of these cash flow-hedged currency derivatives
was recognized in equity in the amount of MSEK –159 (58).
Interest rate derivatives
When the SAS Group borrows at floating interest rates and changes its interest
rate exposure by entering into interest-rate swap agreements whereby floating
interest is received and fixed interest is paid, the hedging relationship is clas-
sified as a cash flow hedge. When hedge accounting is applied, the effective
portion of the change in value of the hedge instrument is recorded in equity.
The accounting policies for the interest rate derivatives used for hedging trans-
actions are matched with those of the individual loans. At December 31, 2007,
the accumulated effect on these cash flow-hedged interest derivatives was
recognized in equity in the amount of MSEK 1 (40).
Fuel derivatives
Fuel derivatives are used to manage the price risk relating to jet fuel. These
derivatives represent hedging transactions according to the cash flow method
and their accounting policies are matched with those of the underlying pro-
jected fuel need. At December 31, 2007, the accumulated effect on these cash
flow-hedged fuel derivatives was recognized in equity in the amount of MSEK
393 (–250).
All together, MSEK 1,187 (588) relating to cash flow hedges was recognized
in equity as of December 31, 2007 and is expected to affect the statement of
income in the following years:
2008 2009 2010 2011 2012 2013> Total
Aircraft 258 483 339 177 9 56 1,322
Commercial flows –221 –221
Interest rate derivatives –1 2 1
Fuel derivatives 546 546
Deferred tax –163 –135 –95 –49 –3 –16 –461
Effect on equity 420 348 244 127 8 40 1,187
Hedge-accounted derivatives, fair value hedge
In cases where the SAS Group borrows at fixed interest rates and changes its
interest rate exposure by entering into interest-rate swap agreements whereby
fixed interest is received and floating interest is paid, the hedging relationship
is classified as a fair value hedge. When hedge accounting is applied changes
in value attributable to the hedge instrument are recorded in net interest,
where the effects are counteracted because the underlying hedged position
(interest portion of the loan) is also measured at fair value and recorded in net
interest. The accounting policies for the interest rate derivatives used for hedg-
ing transactions are matched with those of the individual loans.
Hedge-accounted derivatives, hedging of net investments
in foreign operations
To hedge net investments in foreign operations, SAS has entered into currency
derivative agreements and loans in the corresponding currency. When hedge
accounting is applied, the effective portion of the change in value of the hedge
instrument is recognized in equity. The currencies where hedging of net in-
vestments takes place are DKK, EUR and NOK.
Derivatives not subject to hedge accounting
The value of other currency derivatives not subject to hedge accounting is
translated on a current basis at fair value in the statement of income. Nor are
interest rate derivatives that cannot be linked to specific borrowing subject to
hedge accounting and are translated currently at their fair value.
Note 29, continued

78 SAS Group Annual Report 2007
Categorization of financial assets and liabilities Continuing operations and
operations held for sale Assets and
Loans and Financial assets Hedging Non-financial Total Total liabilities TotalDecember 31, 2007 Held for trading receivables available for sale Other liabilities instruments * items book value fair value ** held for sale book value
Fair value Amortized cost Fair value Amortized cost Fair value
ASSETS
Long-term receivables from affiliated companies 170 170 170 170
Other holdings of securities 5 5 5 5
Other long-term receivables 1,181 1 1,182 1,182 –605 577
Accounts receivable 3,733 3,733 3,733 –1,782 1,951
Receivables from affiliated companies 510 510 510 510
Other receivables 26 593 2,592 3,211 3,211 –574 2,637
Short-term investments 5,314 1,994 7,308 7,308 7,308
Cash and bank balances 1,145 540 1,685 1,685 –102 1,583
Total 6,485 8,128 5 0 594 2,592 17,804 17,804 –3,063 14,741
SHAREHOLDERS’ EQUITY AND LIABILITIES
Subordinated loans 693 693 348 693
Bond issues 1,133 946 2,079 2,086 2,079
Other loans 1,462 2,527 3,989 3,964 –53 3,936
Current portion of long-term loans 4,147 214 4,361 4,368 –2,746 1,615
Short-term loans –174 698 333 857 857 –436 421
Accounts payable 3,550 3,550 3,550 –1,442 2,108
Total –174 0 0 11,683 4,020 0 15,529 15,173 –4,677 10,852
December 31, 2006
ASSETS
Long-term receivables from affiliated companies 189 189 189
Other holdings of securities 601 601 601
Other long-term receivables 1,276 55 1,331 1,331
Accounts receivable 3,918 3,918 3,918
Receivables from affiliated companies 357 357 357
Other receivables 91 32 2,644 2,767 2,767
Short-term investments 6,283 2,834 9,117 9,117
Cash and bank balances 819 867 1,686 1,686
Total 7,193 9,441 601 0 87 2,644 19,966 19,966
SHAREHOLDERS’ EQUITY AND LIABILITIES
Subordinated loans 716 716 376
Bond issues 6,041 1,094 7,135 7,036
Other loans 3,032 2,653 5,685 5,612
Current portion of long-term loans 583 258 841 841
Short-term loans 49 1,820 174 2,043 2,040
Accounts payable 3,350 3,350 3,350
Liabilities to affiliated companies 169 169 169
Total 49 0 0 15,711 4,179 0 19,939 19,424
Note 29, continued
* Loans in foreign currency, which are dedi-cated as a hedging instrument in a hedging of net investments in foreign operations, are measured at amortized cost.
** Fair value for short-term investments, subor-dinated loans and one of the bond issues has been set entirely by the use of official price quotes. Fair value of other financial assets and liabilities has been set in part by the use of official price quotes, such as discounting of future cash flows to quoted interest rates.

79SAS Group Annual Report 2007
Note 30 • Other provisions
Restructuring Loyalty program Other provisions Total
2007 2006 2007 2006 2007 2006 2007 2006
Opening balance, January 1, 2007 162 290 551 606 208 74 921 970
Provisions 216 267 272 230 137 252 625 749
Utilized provisions –143 –383 –308 –284 –195 –112 –646 –779
Currency effect 4 –12 1 –1 –3 –6 2 –19
Liabilities attributable to assets held for sale - - –21 - - - –21 -
Closing balance, December 31, 2007 239 162 495 551 147 208 881 921
Breakdown in balance sheet: 2007 2006
Long-term liabilities 691 603
Current liabilities 190 318
881 921
Other provisions include provisions for leasing costs relating to unused
premises and maintenance costs for leased aircraft according to the leasing
contract.
Note 31 • Short-term loans
2007 2006
Issued commercial paper 0 1,108
Bank loans 7 26
Overdraft facilities, utilized portion 436 377
Accrued interest 255 309
Derivatives 159 223
Total 857 2,043
Liabilities attributable to assets held for sale –436 -
Total 421 2,043
Note 32 • Liabilities to affiliated companies
2007 2006
ST Aerospace Solutions (Europe) A/S 93 168
Other companies 1 1
Total 94 169
Note 33 • Unearned transportation revenue (net)
Unearned transportation revenue consists of tickets sold and still valid but un-
used, see Note 1, Significant accounting policies - Revenue recognition page 65.
On December 31, 2007, the estimated reserve in the unearned transporta-
tion revenue liability amounted to MSEK 482 (399).
Note 34 • Accrued expenses and prepaid income
2007 2006
Vacation pay liability 1,608 1,634
Other accrued payroll expenses 493 299
Fuel costs 577 122
Selling costs 229 245
Technical aircraft maintenance 109 80
Other accrued expenses 1,613 1,815
Prepaid income 520 549
Total 5,149 4,744
Note 35 • Pledged assets
2007 2006
Related to long-term liabilities to credit institutions:
Real estate mortgages 125 115
Aircraft mortgages 328 779
Company mortgages 26 27
Other mortgages - -
Shares in subsidiaries 0 0
Related to deposits:
Blocked bank accounts 86 70
Total 565 991
Outstanding liability at December 31, 2007, relating to aircraft mortgages was
MSEK 154 (288).
The item “Shares in subsidiaries” includes the book value of SAS shares in
SAS’s wholly owned financing structures for aircraft. For additional information
in this regard, please see Note 13.
Note 36 • Contingent liabilities
2007 2006
Contingent liabilities 137 288
Total 137 288
The SAS Group is involved in disputes, some of which will be settled in court.
Provisions are made in cases where a probable and quantifiable risk of loss is
judged to exist.
Note 37 • Leasing commitments
The different business areas in the SAS Group have entered into the following
leasing commitments, with specification of the total annual rent for:
2008 2009 2010 2011 2012 2013>
Aircraft 2,378 2,163 1,554 1,208 965 3,379
Properties 927 890 852 829 819 4,913
Machinery and equipment 53 25 20 13 11 11
Total 3,358 3,078 2,426 2,050 1,795 8,303
Leasing contracts with an annual rental cost in excess of MSEK 0.5 are in-
cluded. Total lease costs for continuing operations in 2007 amounted to MSEK
3,908 (3,942), of which MSEK 11 (10) pertains to contingent rents. Contingent
rents vary according to different factors such as operating revenue, the con-
sumer price index and short-term market interest rates. In 2007 payments
received for assets subleased to a third party amounted to MSEK 83 (103).
The value of future fixed payments for these assets subleased to a third party
amounts to MSEK 139 (252).
The above table includes the following major items:
At the end of 2007 the SAS Group aircraft fleet totaled 310 aircraft, of which
243 are leased. In 2007 sale and leaseback transactions were effected for five
aircraft, corresponding to an annual leasing cost of approximately MSEK 94.
Terms of the leases vary between two and 14 years. In December 1999 a sale
and leaseback transaction for 30 MD-80s was concluded in collaboration with
GECAS, at an annual leasing cost of approximately MSEK 280. The agreement
runs through December 2009.
SAS sold airport-related properties in December 2001. They were acquired by
Nordisk Renting and GE Capital Real Estate for a purchase price of MSEK
3,020. At the same time, SAS leased back all the buildings for 20 years via oper-
ating leases and has an option, under certain terms, to buy back all or parts of the
property portfolio after 10 years. The rent will amount to MSEK 204 in 2008.
In September and December 2003 properties in Copenhagen and Stock-
holm were sold. They were acquired by Keops and Nordisk Renting for a pur-
chase price of MSEK 2,122. The properties are being leased back by SAS via
operating leases for 10-20 years. The rent will amount to MSEK 164 in 2008.

80 SAS Group Annual Report 2007
Note 38 • Adjustment for items not included in cash flow, etc.
2007 2006
Share of income in affiliated companies –9 –106
Dividends from affiliated companies 14 29
Impairments - 51
Capitalized interest on prepayments to aircraft manufacturers –17 –24
Earnings impact from measuring financial derivatives according to IAS 39 –22 –124
Other 19 25
Total –15 –149
Note 39 • Acquisition of subsidiaries
In 2007 Teinver’s five percent holding in Spanair and Aerolineas de Baleares
was acquired, making the companies wholly owned subsidiaries in the SAS
Group.
No subsidiaries were acquired in 2006.
According to acquisition analyses the value of acquired assets and liabilities
was as follows:
2007 2006
Fixed assets - -
Current assets - -
Minority interests –38 -
Long-term liabilities - -
Current liabilities - -
Total –38 -
Goodwill 304 -
Purchase price paid 266 -
Redemption of Teinver’s loan payable to SAS –41 -
Effect on the Group’s liquid assets 225 -
Note 40 • Disposal of subsidiaries
In 2007 the SAS Flight Academy and Newco companies were sold. An adjust-
ment was also made in the purchase price regarding the 2005 divestment of
67% of the shares in SAS Component Group.
In the previous year the Rezidor Hotel Group was floated on the stock ex-
change, whereby SAS divested 91% of its shareholding. Norwegian Aviation
College was also divested.
The value of the sold assets and liabilities was the following:
2007 2006
Intangible assets 124 700
Tangible fixed assets 551 802
Financial fixed assets 40 550
Current assets 3 52
Current receivables 726 1,059
Liquid assets 141 365
Minority interests –38 –650
Long-term liabilities –241 –213
Current liabilities –742 –1,745
Total 564 920
Capital gain excluding selling costs 321 4,406
Purchase price paid 885 5,326
Purchase price paid pertaining to 2005 divestment of SAS Component, received in 2006 - 877
Selling costs –214 –173
Unpaid selling costs 19 60
Liquid assets in divested companies –141 –365
Effect on the Group’s liquid assets 549 5,725
Note 41 • Liquid assets
2007 2006
Short-term investments 7,308 9,117
Cash and bank balances 1,685 1,686
Cash and bank balances reclassified to assets held for sale –102 -
Liquid assets at year-end 8,891 10,803
Disclosure of interest paid:
During the year, interest received in continuing operations amounted to MSEK
542 (463), of which MSEK 167 (201) pertains to forward premiums for currency
derivatives. During the year, interest paid in continuing operations amounted to
MSEK 1,202 (1,533), of which MSEK 193 (235) pertains to forward premiums
for currency derivatives. In discontinued operations the interest received came to
MSEK 7 (12) and paid interest to MSEK 29 (33).
Note 42 • Auditors’ fees
An audit engagement refers to the examination of annual financial statements
and accounting records and the administration of the Board of Directors and
the President. Such services also include other duties incumbent on the com-
pany’s auditors as well as advice or other assistance prompted by observations
made while performing the audit or carrying out such duties. All other work is
classified as other services.
The following remuneration was paid by continuing operations to audit firms
for auditing and other services:
2007 2006
Deloitte
Audit services 21 20
Other services 15 8
Total Deloitte 36 28
Other audit firms
Audit services 1 1
Total 37 29
Note 43 • Transactions with affiliated companies
Revenue from sales to affiliated companies amounted to MSEK 302 (200).
Costs of purchases from affiliated companies was MSEK 1,579 (1,771).

81SAS Group Annual Report 2007
Note 44 • Segment reporting
Income by business area SAS Scandinavian SAS Individually SAS Aviation Group-wideAirlines Branded Airlines Services and eliminations SAS Group
STATEMENT OF INCOME 2007 2006 2007 2006 2007 2006 2007 2006 2007 2006
External sales 38,827 37,201 7,103 6,427 5,189 5,414 1,132 1,110 52,251 50,152Sales between business segments 1,328 1,430 87 104 9,003 8,894 –10,418 –10,428 0 0
Revenue 40,155 38,631 7,190 6,531 14,192 14,308 –9,286 –9,318 52,251 50,152
Payroll expenses –8,510 –7,844 –1,678 –1,597 –6,380 –6,197 –703 –591 –17,271 –16,229Other expenses –26,541 –25,711 –4,541 –4,266 –8,136 –8,221 9,549 9,374 –29,669 –28,824
Operating income before depreciation and leasing costs 5,104 5,076 971 668 –324 –110 –440 –535 5,311 5,099
Leasing costs for aircraft –2,156 –2,102 –474 –411 0 0 52 32 –2,578 –2,481
Operating income before depreciation 2,948 2,974 497 257 –324 –110 –388 –503 2,733 2,618
Depreciation –984 –1,187 –176 –174 –257 –316 –61 –80 –1,478 –1,757Share of income in affiliated companies –31 58 57 43 –17 –40 0 –2 9 59Capital gains 41 58 12 0 0 0 –12 27 41 85
Operating income 1,974 1,903 390 126 –598 –466 –461 –558 1,305 1,005
Unallocated income items:Income from other shares and participations 5 –46Net financial items –258 –782Tax –286 35
Net income for the year for continuing operations 766 212
OTHER DISCLOSURES SAS Scandinavian SAS Individually SAS Aviation Group-wide Total continuing DiscontinuedAirlines Branded Airlines Services and eliminations operations operations Total
2007 2006 2007 2006 2007 2006 2007 2006 2007 2006 2007 2006 2007 2006
Assets 27,071 18,351 3,720 4,677 7,429 8,216 9,487 13,396 47,707 44,640 0 5,512 47,707 50,152Equity shares 76 89 558 526 425 393 4 4 1,063 1,012 0 0 1,063 1,012
Total assets 27,147 18,440 4,278 5,203 7,854 8,609 9,491 13,400 48,770 45,652 0 5,512 48,770 51,164
Total liabilities 17,875 9,791 2,226 1,789 6,954 6,971 4,566 10,511 31,621 29,062 0 5,714 31,621 34,766Investment for the year 1,604 1,412 244 186 368 222 295 –8 2,511 1,812 438 487 2,949 2,299
Geographic breakdown Domestic Intra-Scandinavian Europe Intercontinental Total
2007 2006 2007 2006 2007 2006 2007 2006 2007 2006
Passenger revenue 12,471 11,370 4,002 3,601 9,573 9,558 12,555 12,211 38,601 36,740Freight and mail revenue 163 303 77 70 296 275 1,196 1,454 1,732 2,102Charter revenue 45 28 0 0 1,906 1,744 0 0 1,951 1,774Other traffic revenue 638 526 71 54 571 835 259 269 1,539 1,684
Total traffic revenue 13,317 12,227 4,150 3,725 12,346 12,412 14,010 13,932 43,823 42,298
Denmark Norway Sweden Europe Other Total
2007 2006 2007 2006 2007 2006 2007 2006 2007 2006 2007 2006
Other operating revenue, continuing operations 1,377 1,093 2,029 1,872 2,281 2,324 2,193 1,974 548 591 8,428 7,854Other operating revenue, discontinued operations 1 689 2 1,543 14 685 605 3,109 0 0 622 6,026
1,378 1,782 2,031 3,415 2,295 3,009 2,798 5,083 548 591 9,050 13,880
OTHER DISCLOSURES Denmark Norway Sweden Europe Other Not broken down Total
2007 2006 2007 2006 2007 2006 2007 2006 2007 2006 2007 2006 2007 2006
Assets 1 2,977 3,012 3,933 3,395 11,623 12,856 4,383 6,099 142 189 4,311 3,039 27,169 28,590Investment for the year in continuing operations 1 71 123 78 83 1,040 155 371 242 5 6 946 1,426 2,511 2,035
1 Aircraft and spare parts are not broken down, see Note 1, Significant accounting policies - Segment reporting, page 65. For a description of the activities of the different segments see page 3.

82 SAS Group Annual Report 2007
Note 45 • Subsidiaries in the SAS Group
Corporate Total owned Book Share ofDomicile ID No. shares Holding value MSEK equity
Owned by SAS AB:
SAS Sverige AB Stockholm 556042-5414 70,500,000 100 737 4,095
SAS Norge AS Bærum 811176702 47,000,000 100 628 3,555
SAS Danmark A/S Copenhagen 56994912 47,000,000 100 571 2,889
Widerøes Flyveselskap AS Bodø 917330557 364,196 100 1,440 521
Spanair Holding Palma de Mallorca B83180851 5,862,593 100 894 } –864
Spanair S.A. Palma de Mallorca EA07225154 11,122,248 100 772
SAS Ground Services AB Stockholm 556063-8255 610,000 100 716 395
SAS Technical Services AB Stockholm 556137-6764 940,000 100 650 334
Nordair A/S Tårnby 24176711 10,000 100 526 314
Linjeflyg AB Stockholm 556062-8454 2,000,000 100 237 212
airBaltic Corporation A/S Riga 40003245752 224,453 47.2 123 17
OY Nordair AB Vantaa 525.232 150 100 72 263
SAS Facility Management Sweden AB Stockholm 556663-7004 45,000 100 45 59
Aerolineas de Baleares Palma de Mallorca A07988728 60,000 100 44 28
SAS Human Resources Sweden AB Stockholm 556664-1485 30,000 100 30 18
SAS Accounting Services Sweden AB Stockholm 556664-1493 16,000 100 21 13
SAS Revenue Information Services A/S Tårnby 28098766 13,200 100 16 40
SAS Business Opportunities AB Stockholm 556657-7358 8,000 100 8 8
SAS Trading AB Stockholm 556406-9390 50,200 100 3 3
Other 0 0
7,533 11,900
Owned by SAS Danmark A/S,
SAS Norge AS, SAS Sverige AB:
SAS Consortium Solna 902001-7720 – 100 13,695 13,695
Owned by SAS Consortium:
SAS Scandinavian Airlines Norge AS Bærum 962308449 150,000 100 3,851 1,823
SAS Scandinavian Airlines Danmark A/S Tårnby 10156858 1,290,500 100 1,570 1,507
SAS Scandinavian Airlines Sverige AB Stockholm 556235-5908 710,000 100 1,010 1,694
SAS Investments A/S Copenhagen 25578104 300,000 100 488 423
Linjeflyg Leasing HB Stockholm 916644-1080 – 79 283 322
Cherrydean Ltd Dublin 310983 12,633,198 100 113 81
SAS Ejendom SOLA AS Ullensaker 971125977 145 100 102 68
SAS Investments Denmark A/S Tårnby 427110814 9,000 100 45 15
SAS Media Partner AB Stockholm 556175-9183 5,000 100 15 7
SAS Ejendom A/S Tårnby 78752513 20,000 100 11 40
SAS Capital B.V. Rotterdam 167071 501 100 8 63
Other 1 12
7,497 6,055
Owned by Nordair A/S:
SAS Cargo Group A/S Tårnby 25736443 200,500 100 255 241
Owned by SAS Investments Denmark A/S:
RampSnake A/S Copenhagen 24202941 10,500 100 0 –33
SAS Trading Denmark A/S Tårnby 42710814 700 100 1 1
1 –32
Note 46 • Significant accounting estimates
The preparation of financial statements and application of accounting poli-
cies are often based on the management’s assessments or on estimates and
assumptions deemed as reasonable. Below is an overall description of the ac-
counting policies affected by such estimates or assumptions that are expected
to have the biggest impact on the SAS Group’s reported earnings and financial
position.
Goodwill is tested for impairment annually. In order to determine if the value
of goodwill has been impaired, the cash-generating unit to which goodwill has
been allocated must be measured by discounting the unit’s cash outflows.
When applying this method, the company relies on a number of factors, includ-
ing historic results, business plans, forecasts and market data. This is further
described in Note 12 and as can be seen here, changes in the conditions for
these assumptions and estimates can significantly affect the assessed value
of goodwill.
Actuarial assumptions are important ingredients in the actuarial methods
used to measure pension commitments and they can significantly affect the
reported pension commitment and the annual pension cost. Two critical as-
sumptions - the discount rate and expected return on plan assets - are essen-
tial for the measurement of both the pension cost for the year and the present
value of the defined benefit commitments. These assumptions are reviewed
annually for each pension plan in each country. The actual outcome often dif-
fers from the actuarial assumptions for economic or other reasons.
The discount rate shall be determined by reference to market yields at the
balance sheet date on high-quality corporate bonds or, if there is no deep mar-
ket for such bonds, the market yields on government bonds. A lower discount
rate increases the present value of the pension liability and the annual pension
cost.
In order to determine the expected rate of return on plan assets, the Group
considers the current and anticipated categories of plan assets as well as his-
toric and expected returns on the various categories.
Estimates are made to determine deferred tax liabilities and assets, not least
the value of deferred tax assets. The Group then must determine the possibility
that deferred tax receivables will be utilized and offset against future taxable
profits.
Regarding the investigations of the European Commission and the U.S.
Justice Department into alleged illegal price fixing in the air cargo industry
SAS continues to cooperate with the U.S. authorities. No formal charges have
been filed. On December 20, 2007 the Commission issued a Statement of
Objections. It was accompanied by extensive documentation that requires a
complete analysis. While SAS is unable at this time to assess the outcome of
the ongoing investigations an unfavorable outcome for SAS would likely entail
a significant adverse financial effect.
Provisions are made when any probable and quantifiable risk of loss attribut-
able to disputes is judged to exist.

83SAS Group Annual Report 2007
Statement of income
MSEK Note 2007 2006
Revenue 244 246Payroll expenses 1 –326 –313Other operating expenses –306 –256
Operating income before depreciation –388 –323
Depreciation 0 0
Operating income –388 –323
Income from participations in Group companies 2 –816 6,432Income from participations in affiliated companies 2 –30 -Income from other participations 2 451 -Interest income and similar income items 209 25Interest expenses and similar income items –176 –195Exchange rate differences –128 155
Income before tax –878 6,094
Tax 3 126 89
Net income for the year –752 6,183
Balance sheet
ASSETS, MSEK Note 2007 2006
Fixed assetsIntangible assets 4 8 6Tangible fixed assetsEquipment 5 3 3Financial fixed assetsShares in subsidiaries 6 7,533 8,384Participations in affiliated companies 7 230 198Other long-term holdings of securities 8 2 138Long-term receivables from Group companies 462 464Deferred tax receivable 365 246Other long-term receivables 14 11
Total fixed assets 8,617 9,450
Current assetsCurrent receivablesAccounts receivable 2 10Receivables from Group companies 7,632 5,642Receivables from affiliated companies 13Other receivables 18 26Prepaid expenses and accrued income 3 2
7,668 5,680Cash and bank balances 258 301
Total current assets 7,926 5,981
TOTAL ASSETS 16,543 15,431
SHAREHOLDERS’ EQUITY AND LIABILITIES, MSEK 2007 2006
Shareholders’ equityRestricted equityShare capital 1,645 1,645Statutory reserve 306 306Unrestricted equityRetained earnings 10,341 4,139Net income for the period –752 6,183
Total shareholders’ equity 11,540 12,273
Long-term liabilitiesLong-term liabilities to Group companies 4,669 2,855Pensions and similar commitments 5 1Other liabilities 27 4
Total long-term liabilities 4,701 2,860
Current liabilitiesLiabilities to Group companies 65 32Accounts payable 59 31Other liabilities 75 103Accrued expenses and prepaid income 103 132
Total current liabilities 302 298
TOTAL SHAREHOLDERS’ EQUITY AND LIABILITIES 16,543 15,431
Pledged assets and contingent liabilitiesPledged assets - -Contingent liabilities 9 312 376
Cash flow statement
MSEK 2007 2006
Operating activitiesIncome before tax –886 6,094Depreciation 0 0Income from the sale of shares, etc. 408 –3,774Adjustment for items not included in the cash flow –7 –2
Cash flow from operating activities before changes in working capital –485 2,318
Change in:Operating receivables 38 69Operating liabilities –23 136
Cash flow from changes in working capital 15 205
Cash flow from operating activities –470 2,523
Investing activitiesPurchase of equipment –2 –6Purchase of shares and participations –896 –103Sale of shares 1,463 5,169
Cash flow from investing activities 565 5,060
Financing activitiesChange in long-term receivables –3 -Change in current receivables –2,187 –5,061Change in long-term loans 1,819 –2,418Change in interest-bearing liabilities 35 –10Group contribution received, net 198 206
Cash flow from financing activities –138 –7,283
Cash flow for the year –43 300Liquid assets at beginning of year 301 1
Liquid assets at year-end 258 301
Changes in shareholders’ equity
Share Restricted Unrestricted TotalMSEK capital reserves equity equity
Opening balance at Jan. 1, 2006 1,645 306 3,933 5,884Group contribution received 286 286Tax effect of group contribution –80 –80Net income for the period 6,183 6,183
Shareholders’ equity at Dec. 31, 2006 1,645 306 10,322 12,273Group contribution received 25 25Tax effect of group contribution –6 –6Net income for the period –752 –752
Shareholders’ equity at Dec. 31, 2007 1,645 306 9,589 11,540
No. of shares: 164,500,000. Quota value 10 (10). Each share is entitled to one vote and all shares own equal rights to shares in the company’s assets and profits. There were no dilutions during the year.
Parent Company, SAS AB
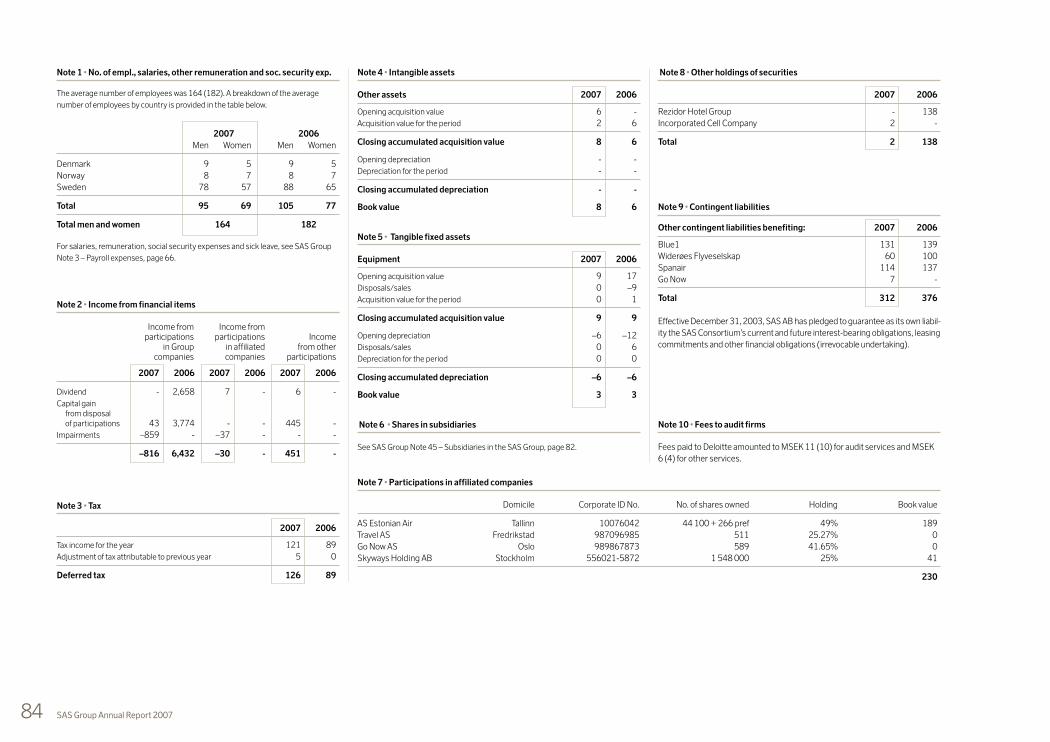
84 SAS Group Annual Report 2007
Note 1 • No. of empl., salaries, other remuneration and soc. security exp.
The average number of employees was 164 (182). A breakdown of the average
number of employees by country is provided in the table below.
2007 2006
Men Women Men Women
Denmark 9 5 9 5
Norway 8 7 8 7
Sweden 78 57 88 65
Total 95 69 105 77
Total men and women 164 182
For salaries, remuneration, social security expenses and sick leave, see SAS Group
Note 3 – Payroll expenses, page 66.
Note 2 • Income from financial items
Income from Income fromparticipations participations Income
in Group in affiliated from other companies companies participations
2007 2006 2007 2006 2007 2006
Dividend - 2,658 7 - 6 -
Capital gain from disposal of participations 43 3,774 - - 445 -
Impairments –859 - –37 - - -
–816 6,432 –30 - 451 -
Note 3 • Tax
2007 2006
Tax income for the year 121 89
Adjustment of tax attributable to previous year 5 0
Deferred tax 126 89
Note 4 • Intangible assets
Other assets 2007 2006
Opening acquisition value 6 -
Acquisition value for the period 2 6
Closing accumulated acquisition value 8 6
Opening depreciation - -
Depreciation for the period - -
Closing accumulated depreciation - -
Book value 8 6
Note 5 • Tangible fixed assets
Equipment 2007 2006
Opening acquisition value 9 17
Disposals/sales 0 –9
Acquisition value for the period 0 1
Closing accumulated acquisition value 9 9
Opening depreciation –6 –12
Disposals/sales 0 6
Depreciation for the period 0 0
Closing accumulated depreciation –6 –6
Book value 3 3
Note 6 • Shares in subsidiaries
See SAS Group Note 45 – Subsidiaries in the SAS Group, page 82.
Note 8 • Other holdings of securities
2007 2006
Rezidor Hotel Group - 138
Incorporated Cell Company 2 -
Total 2 138
Note 9 • Contingent liabilities
Other contingent liabilities benefiting: 2007 2006
Blue1 131 139
Widerøes Flyveselskap 60 100
Spanair 114 137
Go Now 7 -
Total 312 376
Effective December 31, 2003, SAS AB has pledged to guarantee as its own liabil-
ity the SAS Consortium’s current and future interest-bearing obligations, leasing
commitments and other financial obligations (irrevocable undertaking).
Note 10 • Fees to audit firms
Fees paid to Deloitte amounted to MSEK 11 (10) for audit services and MSEK
6 (4) for other services.
Note 7 • Participations in affiliated companies
Domicile Corporate ID No. No. of shares owned Holding Book value
AS Estonian Air Tallinn 10076042 44 100 + 266 pref 49% 189
Travel AS Fredrikstad 987096985 511 25.27% 0
Go Now AS Oslo 989867873 589 41.65% 0
Skyways Holding AB Stockholm 556021-5872 1 548 000 25% 41
230
85SAS Group Annual Report 2007
The Board of Directors and President hereby assure that the annual financial statements have been prepared according to the Annual Accounts Act and RR 32:06 Accounting for Legal Entities and provide a true and fair view of the company’s financial position and earnings and that the Report of Board of Directors provides a true and fair overview of the performance of the company’s opera-tions, financial position and earnings, and describes the significant risks and uncertainty factors to which the company is exposed.
The Board of Directors and President hereby assure that the consolidated financial statements have been prepared according to International Financial Reporting Standards (IFRS) as adopted by the EU, and provide a true and fair view of the Group’s financial position and earnings and that the Report by the Board of Directors for the Group provides a true and fair overview of the perform-ance of the Group’s operations, financial position and earnings, and describes the significant risks and uncertainty factors to which the companies in the Group are exposed.
Stockholm, March 3, 2008
Egil MyklebustChairman of the Board
Jacob WallenbergVice Chairman
Jens Erik ChristensenBoard Member
Anitra SteenBoard Member
Berit KjøllBoard Member
Ulla GröntvedtBoard Member
Timo PeltolaBoard Member
Olav H. LieBoard Member
Fritz H. SchurBoard Member
Verner Lundtoft JensenBoard Member
Mats JanssonPresident and CEO
As stated above, the annual financial statements and consolidated financial statements were approved for issuance by the Board of Directors on March 3, 2008. The Group’s statement of income and balance sheet and the Parent Company’s statement of income and balance sheet will be submitted for adoption to the Annual General Shareholders’ Meeting on April 9, 2008.
Our auditors’ report was submitted on March 3, 2008
Deloitte AB
Peter GustafssonAuthorized Public Accountant
We have audited the annual financial statements, the consolidated financial statements, the accounting records and the administration of the Board of Directors and the President of SAS AB for the fiscal year 2007. The company’s Annual Report is included in the printed version of this document on pages 52-85. These accounts, the administration of the company, the application of the Annual Accounts Act in preparing the annual financial statements and the application of International Financial Reporting Standards as adopted by the EU and the Annual Accounts Act in preparing the consolidated financial statements are the responsibility of the Board of Directors and the President. Our responsibility is to express an opinion on the annual financial statements, consolidated financial statements and the administration based on our audit.
We conducted our audit in accordance with generally accepted auditing standards in Sweden. Those standards require that we plan and perform the audit to obtain assurance with high but not absolute certainty that the annual financial state-ments and consolidated financial statements are free of material misstatement. An audit includes examining, on a test basis, evidence supporting the amounts and disclosures in the accounts. An audit also includes assessing the accounting principles used and their application by the Board of Directors or the President and significant estimates made by the Board of Directors and the President when preparing the annual financial statements and consolidated financial state-ments as well as evaluating the overall presentation of information in the annual financial statements and the consolidated financial statements. As a basis for our opinion concerning discharge from liability, we examined significant decisions, actions taken and circumstances of the company in order to be able to determine the liability, if any, to the company of any board member or the President. We also examined whether any board member and the President has, in any other way, acted in contravention of the Companies Act, the Annual Accounts Act or the Articles of Association. We believe that our audit provides a reasonable basis for our opinion set out below.
The annual financial statements have been prepared in accordance with the Annual Accounts Act and give a true and fair view of the Company’s financial position and results of operations in accordance with generally accepted accounting principles in Sweden. The consolidated financial statements have been prepared in accordance with International Financial Reporting Standards as adopted by the EU and the Annual Accounts Act and give a true and fair view of the Group’s earnings financial position. The Report by the Board of Directors is consistent with the other parts of the annual financial statements and the consolidated financial statements.
We recommend to the Annual General Shareholders’ Meeting that the statements of income and balance sheets of the Parent Company and the Group be adopted, that the profit in the Parent Company be dealt with in accordance with the proposal in the Report by the Board of Directors and that the members of the Board of Directors and the President be discharged from liability for the fiscal year.
Stockholm, March 3, 2008
Deloitte AB
Peter GustafssonAuthorized Public Accountant
Auditors’ ReportTo the Annual General Shareholders’ Meeting of SAS AB
Corporate Identity Number 556606-8499

86 SAS Group Annual Report 2007
Corporate Governance Report
SAS AB is a Swedish public limited company headquar-
tered in Stockholm, Sweden. The company is the parent
company in the SAS Group. Corporate governance in the
SAS Group is based on Swedish legislation, primarily the
Swedish Companies Act, the Articles of Association, the
Swedish Code of Corporate Governance, and the listing
agreement with the Nordic Exchange in Stockholm, as
well as other applicable rules and recommendations
issued by relevant Swedish and foreign organizations.
The SAS Group follows developments in the area of
corporate governance, adapting its corporate govern-
ance policies to create value for owners and other
stakeholders through providing adequate information
to shareholders, real shareholder influence, and effec-
tive management and Board work. To ensure sound
and fair provision of information to the capital market,
the SAS Group has an information/IR policy set by the
Board. In 2008 the Swedish Code of Corporate Govern-
ance will be revised, which the SAS Group will follow
and make adjustments if necessary.
Application of the Code
SAS AB applies the Swedish Code of Corporate
Governance, “the Code,” which has been a part of
the regulations of the Nordic Exchange in Stockholm
since July 1, 2005. This report, which has been pre-
pared in accordance with the provisions of the Code,
constitutes the SAS Group’s corporate governance
report for the 2007 financial year. The report has not
been examined by the company’s auditors.
Departures from the Code
The SAS Group followed the Code apart from the follow-
ing instance: Clause 1.4.3 states that the Shareholders’
Well-functioning corporate governance principles are essential for helping assure
shareholders and other stakeholders that the activities of the SAS Group are
characterized by reliability, effective management and control, openness,
clarity and good business ethics. Transparency and sustainability are key words
in the Group. The SAS Group follows the Swedish Code of Corporate Governance.
Corporate Governance, accountability and decision processThe SAS Group has 29,053 shareholders on December 31, 2007. The biggest shareholders are the three Scandinavian governments. The largest private shareholders are the Knut and Alice Wallenberg Foundation, SEB Funds, Handelsbanken Funds and the State of New Jersey Common Pension Fund.
Meetings in 2007The Board had 11 recorded meetings. The audit committee had four recorded meetings and the remuneration committee had eight recorded meetings. The nomination committee had eight recorded meetings since the 2007 Annual General Shareholders’ Meeting.
When I assumed the post of Chairman in November
2001, SAS was facing numerous challenges, the
events in the U.S. on September 11, the horrible
accident in Milan and the radically altered market
and competitive conditions due to the new busi-
ness models of low-cost airlines and changes in
travel patterns. We were also in a recession, and
as a consequence saw a substantial deterioration
in earnings. Comprehensive action plans followed
and were collected under the Turnaround 2005
program. These cost reductions, as well as sales
of assets, were vital for SAS’s survival, and I am
pleased to note that we succeeded in creating a
new platform and reducing unit costs by 30%. All
of the improvement has benefited customers in
the form of lower fares. Now that we face a possible
downturn, and earnings levels for the Group are
at just over SEK 1 billion, further cost reductions
and streamlining will regrettably be required to
ensure our continued ability to invest and capacity
to develop operations. We cannot continue to sell
off assets to stay in business, but cash flow must
be generated from operations. It is a sad fact that
cost reductions at SAS will be harder to implement.
This is because SAS’s remaining potential is largely
locked in old contractual structures. The rigidity
of agreements makes it very challenging to imple-
ment with full force the cost-cutting and streamlin-
ing measures included in Strategy 2011.
The Q400
During the year, SAS experienced a number of
negative events, in particular the Q400 incidents.
This has also raised a discussion of flight safety at
SAS and customer confidence in SAS, which we
take very seriously. While the accident investigation
boards have not released their final reports, the pre-
liminary investigations from the first two incidents
point to a design flaw in the landing gear. Flight
safety is SAS’s top priority, and SAS’s candor is vital
if our customers are to have complete confidence in
us. At this juncture I would like to commend Group
Management and all personnel involved on the way
they handled the Q400 situation.
The share and owners
The SAS Group has an ongoing dialog with the
capital market on issues concerning the Group’s
performance, strategic position and opportuni-
ties for growth. No big changes were made in the
principles of owner control in 2007. During the year
most airlines in the market have seen a substantial
decline in share value. This has hit the SAS share
in particular, which also reached its all-time high
in June but which then fell sharply like all the other
shares in the market. Trading volume in the SAS
share was substantially higher than in the previous
year, while institutional ownership remained stable.
Sustainability
In 2007 the climate debate focused increasingly on
air transport. In the past 12 years SAS has been an
airline industry leader in the environmental area and
takes its sustainability work very seriously. This effort
intensified in early 2008, when a new and ambitious
environmental strategy was adopted with a vision
of zero greenhouse emissions by 2050. The plan
contains a number of specific measures for meeting
these targets. SAS is also revising and improving its
Code of Conduct, its guidelines for ethics work.
Change
SAS has, as I said, successfully brought about big
changes, and that journey is not over. Necessary
cost-cutting measures remain, above all in SAS’s air-
line operations. It is vital to bolster competitiveness,
and numerous issues need to be resolved without
adversely affecting customer confidence in SAS. Still,
much will be required of owners, unions, the Board,
management and employees moving forward to en-
sure a strong, profitable and independent SAS.
Now that I am stepping down at the Annual
General Shareholders’ Meeting after seven years as
Chairman, I would like at this time to thank all em-
ployees and especially SAS’s owners and custom-
ers for their trust, which enables the SAS Group to
move forward and meet stiffening competition.
Stockholm, March 2008
Egil Myklebust
Chairman of the Board, SAS AB
President and CEO
Internal audit
Auditcommittee
Auditors
Appointment relationship Operational relationship
Remunerationcommittee
Nominationcommittee
Shareholders
Shareholders’ meeting
Board of Directors
Chairman’scomments

87SAS Group Annual Report 2007
Meeting is to be conducted in Swedish and that the
material presented is to be in Swedish.
Reason for the departure: Pursuant to provisions of
the Articles of Association for SAS AB, the language of
the meeting shall be Swedish, Danish or Norwegian,
and, if the Board so decides, other languages as well.
The reason for this provision of the Articles of Associa-
tion is the SAS Group’s strong Scandinavian character
with the largest number of shareholders in Denmark
and Norway, a management and Board comprising
persons from all three Scandinavian countries, and a
system for remote attendance of the Shareholders’
Meeting from Copenhagen and Oslo. Meeting delib-
erations in SAS AB are held primarily in Swedish, but
contributions and speeches are regularly made at the
meeting in Norwegian and Danish. Also, certain mate-
rial presented at the Shareholders’ Meeting of SAS
AB is in Danish or Norwegian. In view of this the Board
believes that any one of the Scandinavian languages
may be freely used at Shareholders’ meetings in the
company. It is also the Board’s view that the three
Scandinavian languages’ similarity means there is no
reason for simultaneous interpreting.
Shareholders’ Meeting
Pursuant to the Companies Act, the Shareholders’
Meeting is the company’s supreme decision-making
body. At the Shareholders’ Meeting shareholders ex-
ercise their voting rights. At the Shareholders’ Meet-
ing of SAS AB, one share is equal to one vote.
All shareholders who are recorded in the share
register as of the meeting date and have given notice
of their attendance in due time have a right to attend
the Annual General Shareholders’ Meeting and vote
their total holding of shares. Decisions at the meeting
are generally made by a simple majority. However, in
certain matters the Companies Act or SAS AB’s Articles
of Association require a motion have the support of a
higher percentage of the shares represented and votes
cast at the meeting. Decisions made at the Sharehold-
ers’ Meeting are made public immediately after the
meeting in a press release, and the minutes of the meet-
ing are published on the company’s website.
The Annual General Shareholders’ Meeting shall be
held within six months from the end of the financial
year. Among other things, the meeting decides
on the adoption of the company’s annual financial
statements, the application of the company’s profit
or coverage of its loss, and discharging the Board
and President from liability. The Annual General
Shareholders’ Meeting also elects Board members,
auditors, members of the company’s nomination
committee and decides on directors’ and audit fees
as well as guidelines for pay and other compensation
for the President and Group Management.
The Annual General Shareholders’ Meeting is held
in Stockholm or in Solna. According to a provision in
the company’s Articles of Association, shareholders
can also attend the meeting from locations in Co-
penhagen and Oslo via remote audio-video hookup.
Shareholders attending the meeting from Copenha-
gen and Oslo have the same rights, including voting
rights, as the shareholders attending in Stockholm.
Notice of an Annual General Shareholders’ Meeting
is published in daily newspapers in its entirety in
Sweden and in abbreviated format in Denmark and
Norway and is announced in a press release and
published on the company’s website. The company
sends notices to those shareholders whose ad-
dresses are known to it.
2007 Annual General Shareholders’ Meeting
In 2007 the Annual General Shareholders’ Meeting
was held on April 17, 2007, in the company’s head
office in Solna. At the 2007 Annual General Share-
holders’ Meeting the Board members were reelected.
Egil Myklebust was also reelected Chairman of the
Board. The meeting also decided on directors’ and audit
fees, remuneration for work on Board committees,
remuneration policies and other employment terms
for company management and elected members to
the nomination committee to serve until the end of
the 2008 Annual General Shareholders’ Meeting. The
meeting approved the Board’s recommendation not
to pay a dividend for 2006.
Board of Directors
The Board consists of seven members elected by
the Annual General Shareholders’ Meeting without
deputies and three employee members, each with two
personal deputies, who are elected by the SAS Group’s
employee groups in Denmark, Norway, and Sweden,
according to a special agreement. Deputies attend
Board meetings only in the absence of an ordinary
member. Except for employee representatives, no
Board member is employed by SAS AB or any other
company in the SAS Group. The members and the
composition of the Board appear on p. 92 . The aver-
age age of members is 55.5 years and two of the seven
members elected by the Annual General Shareholders’
Meeting are women. All Annual General Sharehold-
ers’ Meeting-elected members are independent of
the company and company management. Moreover,
except for Anitra Steen, all Annual General Sharehold-
ers’ Meeting-elected members are independent of the
company’s major shareholders. Thus, SAS AB meets
the Stockholm Stock Exchange Listing Requirements
and the requirements of the Code regarding board in-
dependence vis-à-vis the company, company manage-
ment, and the company’s major shareholders.
The Board’s responsibility and work
Pursuant to the Companies Act, the Board is responsi-
ble for the company’s organization and management
and proper control of its accounting, funds manage-
ment and financial situation in other respects.
The Board’s work is governed by the Swedish
Companies Act, the Articles of Association, the Code
and the formal work plan adopted by the Board each
year, which regulates the division of the Board’s work
Attendance at Board meetings in 2007
7/2 15/3 17/4 18/4 2/5 12-13/6 8/8 26/9 28/10 7/11 17/12
Egil Myklebust • • • • • • • • • • •Jacob Wallenberg • • • • • • • • •Berit Kjøll • • • • • • • • • • •Timo Peltola • • • • • • • • • • •Fritz H. Schur • • • • • • • • • • •Anitra Steen • • • • • • • • •Jens Erik Christensen • • • • • • • • • • •Verner L. Jensen • • • • • • • • • •Ulla Gröntvedt • • • • • • • • • • •Olav H. Lie • • • • • • • • • • •• Present Absent
Nomination committee
The nomination committee is to reflect the shareholder composi-
tion in the company and has the aim of helping to elect a Board of
Directors that is suitable to and representative of the shareholders
and lay the groundwork for the Annual General Shareholders’
Meeting’s decisions on various issues.
Nomination committee, eight recorded meetings
Björn Mikkelsen,
Ministry of Industry, Employment and Communications, for the
Swedish government, chairman
Peter Brixén,
Danish Ministry of Finance
Morten Kallevig,
Norwegian Ministry of Trade and Industry
Peter Wallenberg, Jr.,
Knut and Alice Wallenberg Foundation
Henrik Michael Normann,
Danske Bank
Conny Karlsson,
SEB Funds
Recommendations to be decided by the 2008 Annual
General Shareholders’ Meeting:
Chairman of the Meeting
Number of Board members
Election of Board members and Chairman
Directors’ fees, divided among the Chairman and other Board
members, and any remuneration for work on Board committees
Audit fee
Nomination committee for 2009 Annual General Share-
holders’ Meeting
The nomination committee evaluated the Board’s work, qualifi-
cations and composition. The Chairman attended some of the
nomination committee’s meetings and at them reported the
results of the Board’s own evaluation of its work. The nomination
committee’s recommendations will be published in the notice
of the Annual General Shareholders’ Meeting, on the company
website, and at the 2008 Annual General Shareholders’ Meet-
ing. Members did not receive any fees or other remuneration for
their work on the nomination committee. The nomination com-
mittee engages external advisers and consultants as needed.

88 SAS Group Annual Report 2007
between the Board and its committees and among the
Board, its Chairman and the President. The work plan
also contains provisions for meeting the Board’s needs
for information and financial reporting on an ongoing
basis and instructions for the President and the compa-
ny’s Board committees. Accordingly:
The Chairman, in close collaboration with the Presi-
dent, is to monitor the company’s performance and
plan and chair Board meetings.
The Chairman shall also be responsible for the
Board evaluating its work each year, scrutinize
his own work routines, and see to it that the Board
always receives the information necessary to do its
work effectively. The Chairman represents the com-
pany in owner matters.
The Board’s tasks are setting the overarching objec-
tives and strategies of the SAS Group, adopting a
budget and business plan, discussing and approv-
ing the year-end and interim reports, and setting
important policies and regulations.
The Board shall also follow economic developments
and ensure the quality of financial reporting and
internal control and evaluate operations on the basis
of the objectives and guidelines set by the Board.
Finally, the Board shall decide on major investments
and changes in the organization and activities of the
SAS Group.
Board work in 2007
In 2007 the Board held 11 meetings, of which 10
were ordinary and one extraordinary. In addition, one
meeting was held per capsulam. The work of the Board
during the year followed the agenda set by the Board
each year with permanent items for information and
deciding on as well as special topics. Each ordinary
meeting followed an approved agenda, and proposed
agendas and support documentation are sent to Board
prior to each Board meeting. The President and certain
other senior executives also attended Board meetings
to make presentations, and the General Counsel of the
SAS Group served as the Board’s secretary. At its meet-
ings the Board discussed the regular business items
presented at the respective meetings, such as business
and market conditions, financial reporting and follow-
up, the company’s financial position, and investment. In
fall 2007 the Board had an extraordinary meeting when
it decided to permanently remove the aircraft type Q400
from the SAS aircraft fleet after three accidents and
recurring problems with regularity. Other essential mat-
ters and business considered during the year included:
Adopting, implementing and following up the Strate-
gic Plan for 2007-2011 (Strategy 2011).
Monitoring and dealing with the antitrust investiga-
tions of SAS Cargo’s possible participation in illegal
price fixing in the air freight business.
Sale of the subsidiary SAS Flight Academy and the
Spanish ground handling company Newco,
Strikes and labor conflicts.
Settlement of the sale of SAS Component.
The Q400 accidents and flight safety work in the
SAS Group.
Investment in aircraft.
The Board also discussed sustainability-related infor-
mation of material importance and quarterly changes in
sick leave. The Board studied the annual Sustainability
Report. Additionally, at various meetings the Board
discussed matters and topics involving internal control
and follow-up of compliance activities and work of the
internal audit, evaluating the work of the Board, the
Year-end Report, interim reports, strategy, the business
plan, and the budget.
Main issues considered at Board meetings
7/2 SAS Group Year-end Report for 2006.
15/3 SAS Annual Report and notice of Annual
General Shareholders’ Meeting.
17/4 Strategy work, Strategy 2011.
18/4 Statutory meeting.
2/5 Approval of the first quarter report.
12-13/6 Adoption of Strategy 2011.
8/8 Approval of the second quarter report.
26/9 The Q400 accidents and evaluation of
Board work.
28/10 Decision to permanently withdraw the
Q400s from SAS’s aircraft fleet (Extraordi-
nary meeting).
7/11 Approval of the third quarter report and
the auditor’s review of the “hard close” and
internal control.
17/12 Review of financial plans for 2008, imple-
mentation of parts of Strategy 2011, the
SAS Cargo case and review of compliance
work as well as revising the Board’s work
plan and committee instructions.
The Chairman and other members are remuner-
ated for their work on the Board in accordance with a
decision made by the Annual General Shareholders’
Meeting p. 66
Fees decided at the 2007 Annual General Shareholders’ Meeting
Aud.- Rem.-Board com.- com.-
TSEK rem. rem. rem. Total
Egil Myklebust 600 75 675
Jacob Wallenberg 400 25 425
Berit Kjøll 300 50 350
Timo Peltola 300 100 400
Fritz H. Schur 300 25 325
Anitra Steen 300 50 350
Jens Erik Christensen 300 50 350
Verner L. Jensen 300 300
Ulla Gröntvedt 300 300
Olav H. Lie 300 300
Total 3,400 250 125 3,775
Board committees and committee work
To streamline and enhance the work of the Board on
certain issues there are two committees. The Board
appoints a remuneration committee and an audit
committee from among its own members. The main
duty of the committees is to prepare issues for the
Board’s decision. These committees, whose work is
preparatory in nature, imply no delegation of the legal
liability of the Board or its members. Reports to the
Board on issues discussed at committee meetings are
either in writing or given orally at the following Board
meeting. The work on each committee follows written
instructions and a work plan stipulated by the Board.
The General Counsel of the SAS Group serves as the
secretary to the committees. Minutes of committee
meetings are provided to all Board members. Remu-
neration was paid for work on Board committees in
2007 in accordance with the decision of the Annual
General Shareholders’ Meeting. p. 66
Auditors
Auditors in Swedish limited companies are elected
by the Annual General Shareholders’ Meeting and
tasked with scrutinizing the company’s financial
reporting and management of the company by the
Board and the President. Pursuant to the Swedish
Companies Act, the term for auditors in Swedish lim-
ited companies is four years.
The most recent election of an auditor was at the
2005 Shareholders’ Meeting, when Deloitte AB, with
Peter Gustafsson as principal auditor, was reelected
for the period until the end of the 2009 Annual Gen-
eral Shareholders’ Meeting. Peter Gustafsson (born
in 1956) has headed audit services for Deloitte since
2003. Besides SAS AB he has audit engagements for
SAAB Automobile, Ledstiernan, Nexus, Teleca, Rezi-
dor Hotel Group, Semcon, Akademiska Hus, Göte-
borgs Hamn and Göteborgs kommunala Förvaltning
AB. Peter Gustafsson was previously an auditor at
Elanders, Connex Transport, Ports of Stockholm and
Song Networks, among others.
The principal auditor met with the Board on three
occasions in 2007, presenting the program for his
Remuneration committee
The committee’s main task is to make recommendations for Board approval regarding the terms of the President’s salary, employment, and pension, and deal with issues related to the SAS Group’s overall remuneration policies for senior executives. Salary and other remuneration matters regarding supervisors reporting directly to the President are regularly cleared with the committee.
Remuneration committee, eight recorded meetings
Number of meetings attended
Egil Myklebust (chairman) 8Jacob Wallenberg 7Fritz H. Schur 8
All members are independent in relation to the company, company management, and major shareholders.
In 2007 the committee made recommendations to the Board on the previous and current President’s salary and other terms of employment and overall remuneration policies and other terms for other members of Group Management. The committee also discussed and drafted a Board resolu-tion on the President’s target contract for 2007, the previ-ous President’s fulfillment of his target contract for 2006 and discussed general matters involving guidelines and policies for compensation to SAS senior executives.The committee assisted the President in the process of recruiting new members to Group Management. Prior to the 2008 Annual General Shareholders’ Meet-ing, the committee will prepare the recommendation for remuneration policies and other terms of employment for company management that pursuant to the Companies Act and the Code the Board shall present to the Meeting for approval.

89SAS Group Annual Report 2007
auditing work, reporting his observations from audit-
ing the year-end report, examining the interim report
as of September 30, and assessing the company’s
internal control. The auditor attended all meetings of
the audit committee during the year. On one occasion
the Board met with the company’s auditor without the
President or anyone else from company management
present. Deloitte submits an audit report regarding
SAS AB, the Group, and an overwhelming majority of
subsidiaries. In the past three years, in addition to its
auditing work, Deloitte performed advising services
for SAS Group companies in auditing-related areas,
such as tax consulting, and the transition to IFRS, for
a total invoiced amount of MSEK 38, of which MSEK
15 pertains to 2007. The auditor receives a fee for his
work in accordance with a decision of the Annual Gen-
eral Shareholders’ Meeting. For information about the
auditor’s fee in 2007, Note 42 p. 80
President and Group Management
The Board appoints the President of SAS AB, who is
also Group CEO. Pursuant to the Companies Act, the
Board’s work plan and instructions to the President,
he is responsible for the day-to-day management of
the company and Group operations. The members
of Group Management as well as the heads of certain
corporate functions report to the President. In its
instructions to the President the Board has laid down
detailed rules for the President’s authority and obliga-
tions. Within the framework of the current work plan
and instructions to the President, which regulate inter
alia the relationship between the President and the
Board, Group Management is responsible for busi-
ness control, financial reporting, acquisitions and dis-
posals of companies, collaborations, financing, capital
structure, risk management, communication with
financial markets, and other matters of a Group-wide
nature. The President and CEO is Mats Jansson. Pres-
entation of the President’s background, experience,
positions, and shareholdings p. 93
The President works closely and exchanges infor-
mation with the Chairman and also meets regularly
with the Chairman to plan Board meetings. The Presi-
dent keeps the Chairman and the rest of the Board
continually apprised of the company’s and the Group’s
operations, performance and financial status. To en-
able the Board to monitor the Group’s financial position
on an ongoing basis, the President makes monthly re-
ports to the Board. In addition to the President, Group
Management currently comprises five members,
named by the President in consultation with the Board.
Composition of Group Managment p. 93
Group Management is not a corporate body in the
sense of Swedish limited company law and as a collegial
management body has no legal liability vis-à-vis the
Board and shareholders. Only the President reports to
the Board. Group Management normally has recorded
meetings every week. These meetings are chaired by
the President, who reaches decisions after consulting
with the other members of Group Management. The
General Counsel of the Group serves as the secretary
to Group Management. Group Management’s man-
agement and control of the Group’s subsidiaries and
major business units are primarily tied to active work
on the boards of the respective subsidiaries and busi-
ness units. For the Group’s business units that are
not separate legal entities, internal boards have been
established that function like the boards of directors of
the Group’s subsidiaries. The boards are often com-
posed of representatives of Group Management and
Corporate Functions, with the responsible member of
Group Management as chairman. In certain larger sub-
sidiaries and business units there are external board
members and representatives of the employees. Group
Management’s management and control of operations
are based on a number of important guidelines and
policies regarding financial management and follow-up,
communication issues, human resources, the Group’s
brands, business ethics, and environmental matters,
Remuneration policies and other terms of employ-
ment for company management
For 2007, with departures stated below, the following
guidelines adopted by the Annual General Sharehold-
ers’ Meeting for remuneration and other terms of
employment for senior executives were applied. The
company will endeavor to offer its senior executives
market remuneration that is nationally and individually
set and differentiated. Remuneration policies are to be
characterized by predictability regarding the costs to
the company as well as the benefits for the individual
concerned and be based on factors such as qualifica-
tions, experience, responsibility, and performance.
Company management means the President and CEO
and the other members of Group Management. The
remuneration comprising an individual’s total compen-
sation shall consist of the following components:
base salary, which may be reviewed annually
variable salary
pension benefits
other benefits and severance terms
The size of the variable salary is to vary depending on
the position and contract and may be no more than
50% of the relevant base salary. The variable salary
shall depend on the executive meeting quantitative
and qualitative business and personal targets set
in an annual target contract. For the President the
maximum variable salary can amount to a maximum
of 20% of his base salary and for other members of
Group Management up to 40-50%.
At least 20% and no more than 60% of the total vari-
able salary is to be related to the Group’s earnings. No
earnings-based pay will be paid if the Group’s earn-
ings are negative.
Pension benefits are to be defined-contribution,
with premiums not exceeding 35% of the base salary.
For one member of Group Management there is an
agreement entered into previously for a defined-ben-
efit pension plan, with a retirement age of 60 and with
variable salary as partially pensionable.
Pension benefits for the President are defined-
contribution (35% of the fixed base salary). One
member of Group Management has a defined-benefit
pension plan, where a fully earned pension is equal
to 70% of pensionable salary up to 30 base amounts
and 35% of pensionable salary above that. Other
members of Group Management have defined-con-
tribution pension plans, in which a fixed percentage,
15-35%, of the pensionable salary is paid into the
pension.
For the President and the rest of Group Manage-
ment, the period of notice is six months on their part
and 12 months on the company’s part.
If a senior executive is dismissed by the company,
severance pay may be paid equal to no more than
12 months’ base salary. If the executive obtains a
new position, the severance pay will be reduced by
the amount of remuneration for this new position.
Nevertheless, already concluded agreements with
two members of Group Management on a right to
severance pay equal to two years’ fixed salary and
a maximum of one year’s settlement will be respected.
Other benefits, such as a company car and health
insurance, are to be market-based.
There is no share-based incentive program in the
SAS Group.
Remuneration policies for company management
are to be presented by the remuneration committee to
the Board, which presents the proposal to the Annual
General Shareholders’ Meeting for approval.
Remuneration of the President is to be decided
within the framework of policies approved by the
Board of SAS AB and on the recommendation of the
remuneration committee established by the Board.
Remuneration of other members of Group Man-
agement is to be decided by the President within the
framework of approved remuneration policies and
after consulting with the remuneration committee.
For information about remuneration and benefits
paid to the Board, President and senior executives in
2007, see Note 3 p. 66-67
Audit committee
Chief task: to support the Board in monitoring and assessing the internal and external auditing process, be responsible for preparing the Board’s work on quality assuring the company’s financial reporting, meet regularly with the company’s auditor, and study and evaluate reports from the external auditors.
Audit committee, four recorded meetings
Number of meetings attended
Timo Peltola 4Anitra Steen 3Berit Kjøll 4Jens Erik Christensen 4
Besides the committee secretary, the SAS Group CEO and CFO, the company’s external auditor, and, depending on the nature of the business, the head of internal auditing at-tend meetings of the committee. The committee shall also
scrutinize the auditor’s independence vis-à-vis the com-pany, including the extent of the auditor’s non-audit-related engagements for the company.
The requirements of the Code regarding the number of members of the audit committee who are to be independ-ent of the company, company management, or major shareholders are met.
In 2007, in addition to the yearly recurring business regarding quality assurance of financial reporting, detailed review of the year-end report and interim report as of September 30, the committee discussed, among other matters, the accounting of the Swedish ITP pensions placed with Alecta, the work and function of internal audit-ing, special focus areas for auditing work, risk analyses, and internal control, including revised instructions for the whistleblower function in the SAS Group, as well as as-sessing the auditors’ work and follow-up of the European Cooperation Agreement.

90 SAS Group Annual Report 2007
Financial reporting
According to Clause 5.1.3 of the Code, in the corpo-
rate governance report, the company shall disclose
information about the manner in which the Board
assures the quality of financial reporting and commu-
nicates with the company’s auditor.
The audit committee is responsible for preparing
the Board’s work in quality assuring financial reporting.
This quality assurance takes place whereby the commit-
tee discusses critical auditing issues and the financial
reports that company submits. Among the issues the
committee discusses are those regarding internal con-
trol, compliance with rules, specifically identified focus
areas, uncertainty in reported values, events after the
closing date, changes in estimates and assessments, fi-
nancial and legal risks, suspected and verified irregulari-
ties, and other matters affecting the company’s financial
reporting. In 2007 the Board adopted an updated
information/IR policy aimed at ensuring sound and fair
provision of information to all capital market players.
The company’s external auditor attends all meet-
ings of the audit committee.
The Board scrutinizes and approves the company’s
year-end report and interim reports. To quality assure
the Board’s work on financial reporting and ensure the
Board’s access to and oversight and follow-up of audit-
ing work, the Board normally meets the company’s
principal auditor on at least three occasions a year. At
the Board Meeting in February, the auditor reports
his observations from auditing the year-end report. In
May the auditor presents, and the Board discusses, the
program for risk analysis work and the focus of exami-
nation for the year in question. After the “hard close”
as of September 30 the auditor reports to the Board in
November his observations from the examination and
his analysis of critical processes and risks.
Internal control - financial reporting
The SAS Group applies COSO, the internationally
most recognized and adopted framework for internal
control to describe and evaluate the Group’s control
structure. Internal control over financial reporting
is a process that involves the Board, company man-
agement and personnel and is designed to provide
assurance of reliability in external reporting. The
Group-wide control environment is described in detail
elsewhere in the corporate governance report.
Internal control over financial reporting is de-
scribed below in five areas that jointly form the basis
of a sound control structure.
Control environment
The control environment forms the basis of internal
control and includes the culture that SAS communi-
cates and operates from. The aim of the SAS Group is
for its values such as reliability and openness as well
as consideration and value creation to permeate the
organization. It is important for all actions, internal as
well as external, to reflect these basic values. In 2005
a Code of Conduct was distributed to all employees,
which describes well the desired attitudes in various
situations, including a structure for reporting devia-
tions from desired attitudes (whistleblowing).
During the past years, the SAS Group has altered
its organizational and legal structure to better har-
monize it with its business structure and to achieve
greater clarification of accountability and authority.
The management of the Group has been described in
a management document, which outlines manage-
ment philosophy, management model, roles and
responsibilities of subsidiary boards, shareholder
requirements, overarching follow-up and intra-Group
business relations. The management document has
been communicated and distributed to all manage-
ment teams in subsidiaries and other senior execu-
tives. For the SAS Group’s Board as well as for each
subsidiary there are instructions for its board and
CEO that clearly set out responsibilities and authority.
The SAS Group works continuously to ensure that
key positions centrally as well as in subsidiaries are
held by qualified persons. Beyond this there are poli-
cies in all key areas, at both the Group and subsidiary
level, that define responsibilities and authority as well
as guidelines for procedures. All policies are available
on the Group intranet.
Risk assessment
Every year, company management performs a risk as-
sessment in the spring regarding financial reporting.
The risk analysis has identified a number of critical
processes, such as the revenue process, purchasing
process, payroll handling process, financial statement
process, and IT. The analysis of risks in various major
balance sheet and income items is graded. Moreover,
company management has identified a number of
critical areas, common to all subsidiaries, where an
analysis of internal control is to be done, see below.
Beyond that, the internal audit performs an ongoing
overarching risk analysis of the SAS Group’s internal
audit function, which results in an annual audit plan,
which in turn is revised if the risk analysis is changed.
The audits performed by the internal audit are
primarily aimed at operational auditing, but also focus
on processes that impact financial reporting and risks
of irregularities, improper favoritism of another party
at company expense, and the risks of losses or em-
bezzlement. The audit plan is reviewed with the audit
committee and the SAS Group’s Board.
Control activities
The aim of the SAS Group is to have adequate activi-
ties to manage the risks affecting internal control over
financial reporting. This also includes control activities
that prevent irregularities.
Control activities cover inter alia internal control in
each Group company. In 2006 a relatively extensive
formula was prepared containing defined control
targets in the management process, financial state-
ment process, revenue process, purchasing process,
and payroll process. There are also control targets
for dealing with fixed assets and dealing with cash/
bank balances and loans. The managements of all
subsidiaries perform their own evaluations each year
regarding internal control with regard to meeting
control targets and documenting the processes of
control activities. These are also examined by the ex-
ternal auditors, who do an independent analysis of the
status and potential for improvement. When analyses
are not approved, where the judgment of the external
auditors prevails, plans of action shall be prepared
and implemented, which is followed up by the Group’s
internal audit. The evaluation done in 2007 showed
an improvement compared with the previous year
regarding most processes in all units.
In addition to this, areas for in-depth study are
focused on in the critical processes identified for most
Group subsidiaries. All of these examinations result
in a number of recommendations aimed at improving
the quality of internal control.
The audits conducted by the internal audit always
result in recommendations that are graded on the
basis of a risk perspective. During the year the internal
audit focused inter alia on internal control at Estonian
Air as well as contract management at SAS Ground
Services and SAS Cargo.
In addition, an audit was done of British Midland’s
reported results in the European Cooperation Agree-
ment.
In-depth reviews, conducted by the Group’s cen-
tral accounting unit, are done on an ongoing basis of
accounting and applying the SAS Group’s accounting
policies in subsidiaries. In 2007 a review was done
of SAS Cargo Group. Reviews are planned in 2008
for two subsidiaries. Companies were chosen on the
basis of a risk analysis.
Information and communication
The SAS Group’s ambition is for information and
communication paths regarding internal control for
financial reporting to be appropriate and known in the
Group. Policies and guidelines regarding the financial
process are communicated to all parties in the Group
affected through direct distribution via electronic mail,
but also via the intranet, where all policies and guide-
lines in the financial areas are collected in the “SAS
Group Financial Guide.”
The SAS Group’s published external reports are
based on reporting from all legal entities in accord-
ance with a standardized reporting routine. The SAS
Group’s accounting policies as well as any changes
are always communicated by direct dispatch and at
regular meetings with those responsible for financial
matters in all subsidiaries. Moreover, every month
all subsidiaries submit a report on their activities, in-
cluding their financial status and performance, to the
Board and affected corporate functions.
To ensure that the provision of external informa-
tion is correct and complete, there is an information
policy regarding disclosures to the stock exchange as
well as an Investor Relations policy that have been laid
down by the SAS Group’s Board. This policy, which
is available on the SAS Group website under Investor
Relations, states what, in what manner, and how infor-
mation is to be dealt with.
Monitoring
Follow-up and continuous assessment of compliance
with policies and guidelines as well as the follow-up of
reported deficiencies are done regularly. In connec-
tion with following up plans of action for noted defi-
ciencies in the “self assessment,” the new or modified
controls are tested.
Recommendations from the external and internal
audits and the status of measures are compiled in a
clear manner and presented to company management
and the audit committee. The external and internal
audits perform follow-up audits until all recommended
measures are implemented.

91SAS Group Annual Report 2007
1 Joint Air Operator Certificate (AOC)2 Discontinuing operation
Group Management
Board of Directors
CFOGunilla Berg
Human ResourcesHenriette Fenger Ellekrog
SAS Scandinavian Airlines
John S. Dueholm
CorporateCommunications
Claus Sonberg
SAS IndividuallyBranded Airlines
Mats Jansson
Structural Affairs& Strategy
Benny Zakrisson
President & CEO SAS Group
Mats Jansson
Corporate FunctionsCorporate Public Affairs & EnvironmentHans OllongrenSAS Group Legal AffairsMats Lönnkvist
Shared ServicesSAS Human ResourcesServicesPatric Dahlqvist-Sjöberg
Corporate FunctionsSAS Airline CommercialRobin KamarkSAS Group ITMats FagerlundCorporate IndustrialRelationsLena-Liisa TengbladScandinavian OperationsManagementTomas Linden (acting)
Corporate FunctionsCorporate Business ControlArnfinn UtneSAS Group Finance & AssetManagementJohan TörngrenCorporate AccountingUlla EdlundSAS Group PurchasingPatrik KnutssonCorporate Internal AuditPeter Toft Berg
Shared ServicesSAS Facility Management Bjørn FrivoldSAS Revenue InformationSteen WulffSAS Accounting ServicesSara Jinnerot
Corporate Investor RelationsSture Stølen
Corporate Advisory & StrategyBjörn Nordgren
Scandinavian AirlinesDanmark 1
Susanne Larsen
SAS Ground ServicesBjörn Alegren
Spanair 2
Marcus Hedblom
SAS Individually Branded AirlinesSAS Scandinavian Airlines
SAS AviationServices
Scandinavian AirlinesNorge
Ola H. Strand
SAS CargoKenneth Marx
Blue1Stefan Wentjärvi
Scandinavian AirlinesSverige 1
Anders Ehrling
Scandinavian AirlinesInternational 1
Lars Sandahl Sørensen
SAS Technical ServicesPeter Möller
WiderøePer Arne Watle
airBalticBertolt Flick
Estonian AirAndrus Aljas (acting)
ShareholdingsReporting of shareholdings in SAS AB among senior executives (including immediate families): Sture Stølen, Vice President, Head of Investor Relations, 2,200 shares. Steen Wulff, CEO, SAS Revenue Information, 1,137 shares. Kenneth Marx, CEO, SAS Cargo, 1,500 shares.
Shareholdings of Group Management, see p. 93
The SAS Group’s areas of responsibility March 3, 2008
The SAS Consortium is the SAS Group unit through which financing and aircraft leasing is carried out.
SAS Danmark A/S, SAS Norge AS and SAS Sverige AB are tax-able entities for the SAS Consortium’s results.
The SAS Consortium also holds the traffic rights for SAS Scandinavian Airlines and the Air Operator Certificate (AOC) for the airlines in Scandinavian Airlines (excluding Scandinavian Airlines Norge).
The SAS Group’s intercontinental airline operations (Scandinavian Airlines International) are a business unit in the SAS Consortium.
In the period 2001-2004, the SAS Group harmonized the legal structure with the Group’s business structure.
The most important changes in the legal structure were: February 2004: a number of subsidiaries were transferred from the SAS Consortium to SAS AB.July 2004: SAS Braathens was founded as a subsidiary of the SAS Consortium.October 2004: SAS Ground Services and SAS Technical Services were incorporated. SAS Scandinavian AirlinesSverige AB and SAS Scandinavian Airlines Danmark A/S were newly founded as subsidiaries.November 2006: Initial public offering of Rezidor Hotel Group.February 2007: SAS Flight Academy was sold.
The SAS Group’s legal structure March 3, 2008
Spanair S.A.
SAS Cargo Group
SAS Technical Services
Blue1
Widerøe's Flyveselskap AS
SAS Business Opportunities AB
Oy Blue1 AB
SAS Technical Services AB
SAS Ground Services AB
SAS Cargo Group A/S
Widerøe's Flyveselskap AS
Subsidiaries
100%
100%
100%
100%
100%
100%
100%
AS Estonian Air
Widerøe's Flyveselskap ASairBaltic Corporation A/S **
Affiliated companies
49%
47,2%SAS
Norge AS *
SAS AB
Consortium
SCANDINAVIAN AIRLINES SYSTEM
Denmark - Norway - Sweden
Subsidiaries
Blue1SAS Scandinavian Airlines Norge AS
SAS Scandinavian Airlines Danmark A/S
SAS Scandinavian Airlines Sverige AB 100%
100%
100%
SAS
Danmark A/S *
SAS
Sverige AB *
* Parent companies of the SAS Consortium and income tax entities for the SAS Consortiums’s results.
** Consolidated as a subsidiary since the SAS Group has a convertible loan.
Blue1
Widerøe's Flyveselskap AS
Skyways Holding AB
air Greenland
bmi British Midland
25%
37,5%
20%
The SAS Group’s labor union structure within Scandinavia
Norway
SAS Pilots Association, Norway, NSFNorsk Kabinforening, NKF (cabin)SNF (former BU pilots)SNK (former BU cabin)SPK (white-collar employees)PSP Parat (white-collar employees)VKL, SAS Verkstadsklubb (mechanics)NFO (aircraft engineers)FLT, Norwegian Engineers and Managers AssociationNorwegian Union of Commercial and Office Employees (white-collar employees)SMF (white-collar employees)Lederne (managers)NITOTekna
Widerøe: WFF, pilots
Sweden
Swedish Airline Pilots Association, SweALPAScandinavian Cabin Crew Association, SCCASAS TF (white-collar employees at STO)HTFSO (white-collar employees in rest of SE)SAF (SAS Akademiker) (white-collar employees)Ledarna (managers)Svenska Transportarbetareförbundet (transportation workers)
Denmark
Dansk Pilotforening, DPF (pilots)Danish Cabin Attendants Union, (CAU)LFF (white-collar employees)HK (white-collar employees)LH (white-collar employees)SALDA (white-collar employees)Prosa (white-collar employees)LFF-A (white-collar employees)Klub 537 (aircraft mechanics)Klub 222 (auto mechanics)CraftsmenOffice workers, United Fed. of Danish WorkersAircraft workers, United Fed. of Danish WorkersUnited Federation of Danish Workers, CargoSISAS (white-collar employees)Civing (white-collar employees)

92 SAS Group Annual Report 2007
Auditors: Deloitte AB
Principal auditor: Peter Gustafsson, born 1956Authorized Public AccountantElected 2003.
Other major engagements: SAAB Automobile, Ledstiernan, Nexus, Teleca, Rezidor Hotel Group, Semcon, Akademiska Hus, Göteborgs Hamn and Göteborgs kommunala Förvaltning AB. Previously auditor at Elanders, Connex Transport, Ports of Stockholm and Song Networks, among others
Corporate Secretary:Mats Lönnkvist, General Counsel, SAS Group.
Board of Directors
Employee representative
Verner Lundtoft JensenBorn 1955Employed at Scandinavian Airlines Danmark.Member of the Board of SAS AB and Board of Scandinavian Airlines Dan-mark A/S since 2005.Shareholding: 866 (close relation)Deputies:Nicolas E. Fischer, first deputy.Shareholding: 30,100.Carsten Bardrup Nielsen, second deputy.Shareholding: 0
Employee representative
Ulla GröntvedtBorn 1948Employed at Scandinavian Airlines Sverige.Member of the Board of SAS AB since 2001.Shareholding: 300Deputies:Sven-Erik Olsson, first deputy.Shareholding: 0Pär-Anders Gustafsson, second deputy.Shareholding: 0
Employee representative
Olav H. LieBorn 1963Employed at SAS Ground Services Norway.Member of the Board of SAS AB since 2005.Shareholding: 0Deputies:John Lyng, first deputy.Shareholding: 0Asbjørn Wikestad, second deputy.Shareholding: 0
Anitra SteenBorn 1949Member of the Board of SAS AB since 2001.President of Systembolaget AB.Directorships: Member of the Board of Södersjukhuset AB, Almega and Kungs-trädgården Park & Evenemang AB. Education: Cand.phil. degree with a concentration in the behavioral and social sciences, Uppsala University.Shareholding: 0
Timo PeltolaBorn 1946Member of the Board of SAS AB since 2005. Directorships: Chairman of AW Energy Oy, Neste Oil and Pension Insurance Company Ilmarinen (Supervisory Board). Vice Chairm. of Nordea, Member of the Board of TeliaSon-era and CVC Capital Partners Advisory Board. Education: MBA, Turku School of Econom-ics and Business Adm. Studied at IMI, Geneva. Honorary doctorate in economics, Swedish School of Economics and Business Adm. in Helsinki and Turku School of Eco-nomics and Business Administration.Shareholding: 0
Jens Erik ChristensenBorn 1950Member of the Board of SAS AB since 2006.Directorships: Chairman of Scandinavi-an Private Equity A/S, Dansk Merchant Capital, Tower Group A/S, Alpha Hold-ing A/S. Vice Chairman of P/F Føroya Banki. Member of the Board of Falck Holding A/S, Hugin Expert A/S, mBox A/S and member of the Danish Govern-ment’s infrastructure commission.Education: Cand. act. degree from the University of Copenhagen. Shareholding: 0
Berit KjøllBorn 1955Member of the Board of SAS AB since 2001.Directorships: Aker Holding AS, Inter-Oil Exploration and Production ASA.Education: B.A. in Travel and Tourism, Markedsøkonom degree, AMP, Insead Paris.Shareholding: 1,600
Vice Chairman
Jacob WallenbergBorn 1956Vice Chairman of the Board of SAS AB since 2001.Chairman of Investor AB.Directorships: Vice Chairman of Atlas Copco and SEB. Member of the Board of ABB Ltd, The Coca-Cola Company, the Knut and Alice Wallenberg Foundation, the Stockholm School of Economics and the Nobel Foundation.Education: B.Sc. Economics and MBA, Wharton School, University of Pennsylvania.Shareholding: 5,000
Fritz H. SchurBorn 1951Member of the Board of SAS AB since 2001.Chairman of the companies in the Fritz Schur Group.Directorships: Chairman of Post Danmark A/S, DONG Energy A/S, F. Uhrenholt Holding A/S. and Relation-Lab ApS. Vice Chairman of Brd. Klee A/S. Member of the Board of DE POST NV/LA POSTE SA, Belgium. Education: Handelshøjskolens Afgangs-eksamen (HA) business degree.Shareholding: 20,000
Chairman
Egil MyklebustBorn 1942Chairman of the Board of SAS AB since 2001.Directorships: University of Oslo and Sandvik AB.Education: Cand.jur. degreeShareholding: 3,000
All Shareholders’ Meeting-elected members of the Board are independent in relation to the company and company management. All members of the Board are independent in relation to major share-holders with the exception of Anitra Steen, owing to her position in wholly Swedish-government owned Systembolaget AB. The SAS Group has not issued any share convertibles or options.
Share convertibles and optionsThe SAS Group has not issued any share convertibles or options.

93SAS Group Annual Report 2007
Group Management
The President and CEO is in charge of the day-to-day management of the Group. In addition to the President, SAS Group Management comprises five members named by the President in consultation with the Board. Members of Group Management have divided among themselves the responsibilities for the Group’s business manage-ment.
Benny ZakrissonBorn 1959Executive Vice President, Structural Affairs & StrategyMember of SAS Group Management since June 14, 2007. Responsible for structural and strategic issues as well as for SAS Ground Services and SAS Cargo.Previously Senior Vice President Corporate Advisory SAS Group, 2003-2007, Vice President Corporate Advisory/Finance SAS Group, 1993-2003, Director Corporate Taxes, SAS Group 1990-1993. External directorships: Rezidor Hotel Group AB (publ).Education: Jur.kand. degree from Stockholm University.Shareholding: 0
Gunilla BergBorn 1960Deputy President & CFOMember of SAS Group Management since September 16, 2002. Responsible for corporate functions in the areas of accounting, and finance, asset management, purchasing and Shared Service units for Account-ing, Revenue Information and Facility Management. Formerly Vice President and CFO of Kooperativa För-bundet. Experience from various executive positions in banking and industry.External directorships: Alfa Laval AB and L E Lund-bergföretagen AB.Education: Civilekonom degree, Stockholm School of Economics.Shareholding: 1,000
Mats JanssonBorn 1951President & CEOAssumed office on January 1, 2007. Formerly President and CEO of Axfood and President and CEO of Axel John-son AB.No external directorships. Education: Studies in cultural geogra-phy, economic history and sociology at Örebro University.Shareholding: 46,000
John S. DueholmBorn 1951Deputy CEO & COOMember of SAS Group Management since Sep-tember 1, 2002. Responsible for the business area SAS Scandinavian Airlines. Previously re-sponsible for the business areas Airline Support Businesses and Airline Related Businesses, CEO of SAS Data and Senior Vice President of SAS Technical Division 1996-1998. Senior Vice President of Group4Falck 1998-2002.No external directorships.Education: Cand.merc. degree in Business Administration.Shareholding: 0
Claus SonbergBorn 1967Executive Vice President, Corporate CommunicationsMember of SAS Group Management since Novem-ber 1, 2007. Responsible for the SAS Group’s exter-nal and internal communication and the corporate function Investor Relations. Previously a journalist and responsible for media contact at TV2 in Norway. Since 1996 various posts at Burson-Marsteller, in-cluding CEO for operations in Norway, 2000-2005, and the Nordic region, 2004-2007.No external directorships.Education: B.A. from Indiana University.Shareholding: 0
Henriette Fenger Ellekrog Born 1966Executive Vice President, Corporate Human ResourcesMember of SAS Group Management since October 1, 2007. Responsible for Human Resources. Since 2000 executive positions in TDC A/C, most recently HR & Chief of Staff, Senior Executive Vice President and Tele Danmark A/S 1998-2000. Prior to that, management and other posts at Mercuri Urval A/S and Peptech (Europe) A/S. External directorships: Advisory board for women ex-ecutives and company directors for the Confederation of Danish Industries and member of the University of Copenhagen’s Kompetencepanel. Education: Cand.ling.merc. degree from Copenhagen Business School from 1992. Shareholding: 0
Share convertibles and optionsThe SAS Group has not issued any share convertibles or options.
Secretary for Group ManagementMats Lönnkvist,General Counsel, SAS Group

94 SAS Group Sustainability Report 2007
SAS aims to create responsible
and sustainable traffic growth, while
reducing environmental impact

95SAS Group Sustainability Report 2007
Sustainability ReportFor many years the SAS Group has been working systematically for sustainable development as part of its overarching strategy.
This is further highlighted in the formulation of the new strategy document, Strategy 2011, which was presented in 2007.
During the year increased attention was paid to
environmental and climate issues worldwide. The
UN Climate Change Conference in Bali in Decem-
ber saw several breakthroughs where the EU and
the U.S. both committed to far-reaching measures
above all to cut carbon emissions. It is now plain
that climate issues are on every government’s
agenda in the entire industrialized world.
The environmental and climate impact of air
transport is also increasingly debated. Despite
accounting for a relatively tiny fraction of total
climate impacts, air transport is increasingly called
into question, with calls for various forms of regu-
lation, taxes and charges. On the other hand, air
transport is a necessary part of a modern society’s
infrastructure.
At the end of 2007 the European Parliament
offered a revised draft directive to include aviation in
emissions trading, which involves a substantial tight-
ening of the European Commission proposal from
2006. Portions of the proposal are controversial, and
further consideration by EU bodies will follow in 2008.
Important events in 2007
SAS reported the lowest emissions ever per
unit produced.
SAS formulated new targets and strategies for
its performance until 2011. Sustainability
issues gain in importance and long-term
environmental targets are set for 2020.
New targets set by IATA and adopted by SAS.
All greenhouse emissions are to be eliminated
by 2050.
Disagreement in the EU on how to include avia-
tion in emissions trading. Regardless of the scope
of the decision, the costs to airlines will rise.
Oberoende granskning
SAS koncernen har en uttalad ambition att
om möjligt låta all hållbarhetsinformation
genomgå granskning av oberoende part.
För 2006 har koncernens revisorer granskat
all väsentlig hållbarhetsinformation i års- och
hållbarhetsredovisningen.
Bestyrkanderapporten finns på sid 117.
Initiatives to reduce air
transport’s climate impact
The current debate on climate change
often ignores the benefits of aviation to society
as a quick, inexpensive and efficient mode of
transportation. Instead the focus is on emis-
sions and noise.
Let me say now that a number of initiatives
are being taken by the industry and individual
airlines to reduce climate and environmental im-
pacts. They involve everything from new aircraft
types and engines to methods and operation.
The goal is IATA’s vision of zero emissions by
2050. The aim is for air transport to be a natural
and accepted part of a future sustainable society.
The SAS Group was early in highlighting
sustainability aspects of its operations, and we
are working assiduously to improve our envi-
ronmental performance in ways big and small.
That we are taking the climate issue seriously
is also clear in SAS’s new strategic focus for-
mulated in Strategy 2011. At the same time
I would like to emphasize that big changes
take a long time.
The biggest environmental effort is cur-
rently the replacement of the MD-80 fleet.
Here environmental standards will play a key
role for when and with what aircraft type this
replacement will take place.
Our goal is for SAS’s airlines to be at the
forefront of environmental and climate adapta-
tion. This is a fully reasonable demand from
ourselves and all stakeholder groups in society.
We will do our utmost to meet these demands.
Mats Jansson
President and CEO
Sustainability KPIs 2007 2006 2005
Operating revenue, MSEK 52,251 1 50,1521, 2 55,501
Income before tax, MSEK 1,052 1 1771, 2 –246
CFROI, % 14.5 1 15.31, 2 13.0
Average number of employees 25,516 4 25,3232 26,727
of which men/women, % 59/414 60/40 60/40
Sick leave, % 6.4 3,4 6.1 6.8
Carbon dioxide (CO2), emissions, 1,000 tonnes 6,295 6,213 6,193
Nitrogen oxide (NOX), emissions, 1,000 tonnes 25.6 25.3 24.6
Kg carbon dioxide (CO2)/RPK 0.130 0.131 0.136
Total fuel consumption, 1,000 tonnes 1,999 1,969 1,964
Water consumption, 1,000 m3 2082 4,269 3,442
Energy consumption, ground, GWh 209 2 832 718
Unsorted waste, 1,000 tonnes 1.0 2 13.5 13.0
External environment-related charges, MSEK 414 477 565
Number of passengers, 1 0005 44,772 43,511 41,206
1 Excluding Spanair. 2 Excluding Rezidor Hotel Group. 3 Only employees in Sweden in corporate and shared functions. 4 This information has not been examined by an independent party. 5 Including paying, bonus and charter passengers.
Independent review
The Group’s auditors have reviewed all material sustainabil-
ity information in the annual and sustainability reports for
2007. The Assurance Report is on page 114.
Sustainability information
For further information and views on the SAS Group’s sus-
tainability work, contact Niels Eirik Nertun, Director for Envi-
ronment & Sustainability: [email protected]
President and CEO
Mats Jansson
SAS Climate index
90
85
80
95
100
105
2005 2006 2007 2008 2009 2010 2011
2
2
2
SAS was one of the first airlines to offer its
customers carbon offsets.
The SAS Group’s management and labor
organizations held a joint conference to agree
on key future issues and avoid conflicts.
In a letter to management in August the SAS
Group’s Danish unions promise to work to
eliminate strikes in violation of agreements.
The SAS Group Annual Report & Sustainability
Report was named by OMX as the best annual
report and by FAR SRS as the best sustainability
report in an annual report.
Starting in 2007 SAS is reporting a climate
index, with a base year of 2005, which covers
climate impact excluding noise.
SAS Group Annual Report & Sustainability Report 2006 was published in March 2007.

96 SAS Group Sustainability Report 2007
About the SAS Sustainability Report 2007
The SAS Group Sustainability Report 2007 describes
the most essential environmental and societal aspects its
operations impact. It reports what is felt, after an ongoing
dialog, to be of interest to its main target groups: share-
holders, policymakers, financial analysts, authorities,
employees, customers, and suppliers.
Due to the growing interest in climate issues the SAS
Group has chosen to focus the report on how its operations
work to reduce emissions of CO2 and other greenhouse
gases.
Reporting principlesThe Sustainability Report is prepared on the basis of the SAS
Group’s accounting principles for sustainability reporting.
These principles are based in part on Deloitte’s “Checklist
for preparing and evaluating information about the environ-
ment, ethics, corporate social responsibility and corporate
governance, September 19, 2005.” In preparing the Sus-
tainability Report the SAS Group has also taken into consid-
eration the Global Reporting Initiative (GRI) Sustainability
Reporting Guidelines, version 3.0, and all key principles of
the UN Global Compact.
The SAS Group continuously improves its environment-
related and social KPIs. Here the aim is also to link these
indicators with the Group’s financial performance.
The Sustainability Report includes all sustainability
information in the SAS Group Annual Report & Sustai-
nability Report 2007 and the accounting principles, GRI
cross-references and stakeholder dialogs. See the
website under Sustainability. www.sasgroup.net
Material departures from GRI Sustainability Reporting
Guidelines, version 3.0, are commented on in the SAS
Group’s accounting principles for sustainability re-
porting or in GRI cross-references on SAS’s website.
The accounting principles also include the table “GRI
Application Levels.”
For financially related information in the Sustainability
Report, we are aiming for the same accounting policies
as in the financial portion of the Annual Report. In cases
where other principles are applied, this is commented
on in the SAS Group’s accounting principles for sustai-
nability reporting.
Uniform environmental and social indicators are aimed
for Group-wide. Aside from primarily national discre-
pancies regarding social data without material im-
portance for the information reported, all operations in
the Group were able to report in accordance with these
definitions for 2007.
The Sustainability Report was approved by SAS Group
Management in February 2008. The SAS Group Board
of Directors submitted the annual report in March
2008, and was informed of the sustainability report at
the same time. SAS Group Management is responsible
for organizing and integrating sustainability work with
the operations of the Group.
Our world – our stakeholders
Besides creating growth in shareholder value, the SAS Group’s sustainable development efforts are driven by expectations
and demands of key stakeholders and others. SAS tries to meet these expectations and demands through systematic efforts,
stakeholder dialog, and business intelligence. Sustainability work is thus a precondition for creating value.
Government policies and the costs of jet fuel, energy
and waste management, for example, impact airline
industry profitability. The entire industry is highly
competitive as well as cyclical.
Vision of zero emissions
One of the biggest challenges facing the world’s
airlines, just like all other sectors, is limiting the
environmental impacts of their operations. It is
primarily emissions of carbon dioxide (CO2) and
nitrogen oxides (NOx), as well as noise and water
vapor, that constitute the problems.
The growing debate on and criticism of air trans-
port and its environmental impact has recently
prompted the International Air Transport Associa-
tion (IATA) to outline a vision for zero emissions for
air transport. This vision is to be realized by no later
than 2050 through a combination of
new technology
more efficient air traffic management
new fuels
coordinated action to improve the conditions
under which air transport operates and its infra-
structure.
Similarly, ACARE (the Advisory Council for Aeronau-
tics Research in Europe) has set targets for reduc-
ing CO2 emissions by 50% per unit produced and
NOx emissions by 80% by no later than 2020. In
addition, noise levels are to be cut in half compared
with today’s. www.acare4europe.org
Impact of air transport
Today, air transport accounts for around 2–3% of
global CO2 emissions and 12% of transportation
sector emissions. The average growth of the airline
industry is estimated at 5% per year. Industry and
IPCC estimates indicate a possible reduction in
emissions of an average of 2% per year, due to
better technology and efficiency gains. This means
that air transport’s greenhouse emissions may
increase by around 3% per year, if no further
actions are taken.
Asia, China in particular, will account for most of the
expected growth. In Northern Europe growth will be
subdued somewhat, reducing emissions as a result.
SAS’s main market is the Nordic and Baltic
countries, with emphasis on travel to, from and
within Scandinavia. The Group share of total traffic
in its main market is 40%. Norwegian domestic air
transport is among the most intensive in Europe,
but it accounts for 1.7% of the nation’s CO2 emis-
sions. In relative terms, Group airlines account for
less than one tenth of a percent of total global CO2
emissions.
Environmental policies
Airline operations are highly subject to the envi-
ronmental policies set by each airport. These usu-
ally involve noise, rules for using deicing fluids and
limits on discharges into soil and water. There are
also examples of ceilings for CO2 and NOx emis-
sions, such as at Stocholm-Arlanda Airport, whose
ceiling is not relative to production but set in abso-
lute terms. Luftfartsverket has petitioned the Envi-
ronmental Court either to postpone introducing
the ceiling until 2016 – instead of 2011 as decided
– or to have the ceiling reconsidered. In 2007 the
Environmental Court rejected Arlanda’s petition.
Luftfartsverket has appealed the decision and at
the same time begun efforts to apply for a new
environmental permit. This is estimated to take
up to three years.
In 2005 the environmental permit for Copen-
hagen Airport lowered the noise limit for night
traffic from 85 to 80 dB(A). Traffic is growing, and
in a few years, the airport may reach the limit for
the highest permitted noise contour. This is the
reason the SAS Group has considered measures
to lower the noise level of its MD-80 aircraft. So far,
this attempt has not had any satisfactory results.
Due to tightened noise standards, a growing
number of airports have tougher restrictions re-
quiring aircraft to stay in designated approach and
takeoff corridors. Weather and rules in combina-
tion with navigation equipment may occasionally
complicate use of these paths. Deviations generally
result in fines on the airline.
In general, the trend is toward increased use of
environment-related charge systems and operational
limits. The twofold purpose is to reduce local environ-
mental impacts and give airlines an incentive to use
aircraft with the best available “green” technology.
The climate issue
CO2 emissions account for about two thirds of air
transport’s total impact on climate, while NOx,
water vapor and particulates are assumed to
account for most of the balance.
According to the Kyoto Protocol to the UN
Framework Convention on Climate Change, all
industrialized countries must reduce their emis-
sions by 5%, compared with 1990-levels, by 2012.
The EU has gone a bit further, pledging to reduce
the community’s total CO2 emissions 8%.
To attain this there are various proposals and

97SAS Group Sustainability Report 2007
directives, one of which requires all EU countries to
increase the proportion of energy from renewa-
bles from 6% to 12% by no later than 2010. There
are also rules to reduce buildings’ energy use by
22% by 2020. These rules affect property man-
agement in the SAS Group, which even today can
document achievement of energy reduction tar-
gets for buildings and installations in Scandinavia.
Emissions trading
In 2005 the EU introduced a trial period for emis-
sions trading. The scheme only covers fixed instal-
lations. Norway has joined the system, with cer-
tain additions, as of January 1, 2008.
Like numerous airlines, among which the SAS
was at the forefront, airline industry organizations
have long worked to include aviation in emissions
trading.
The idea behind the system is that open carbon
emissions trading will result in reducing emissions
globally. With current technology and the robust
growth forecast, aviation cannot directly help to
reach the Kyoto Protocol target. However, by pur-
chasing emission credits, aviation can help ensure
that reductions are brought about by companies
able to carry out these reductions on commercially
reasonable terms.
At the end of 2006 the European Commission
announced a draft directive regarding aviation’s
entry into emissions trading. The goal is to incor-
porate aviation into the system in 2011.
This comprehensive proposal is largely in line with
the views of the SAS Group. The system has consider-
able advantages over national taxes and charges –
measures that have so far proved virtually ineffective
at limiting aviation’s environmental impact.
The proposal includes all air traffic in the EU,
both national and international. According to the
proposal the system will also apply to traffic to and
from the EU as of 2012. A matter as yet unresolved
is how the EU should get airlines not based in the
EU but operating in the EU to participate in trading.
This is needed to prevent competition from being
distorted in favor of non-European players.
Discussions at ministerial level with the U.S. and
other countries have not been promising.
In 2007 the proposal was debated in the European
Parliament. A revised proposal was announced in
November that would involve considerable tighten-
ing of the Commission’s draft directive and thereby
also sharply raise costs for airlines. The Parliament
wants to set a ceiling of 90 % of the average for the
period 2004–2006. In its allocation of emission
credits, the Parliament wants to offer 75% to the
airlines free of charge. The remaining 25% are to
be auctioned off in ordinary emissions trading. The
system is to cover all traffic within as well as to and
from the EU. The proposal contains limits on air-
lines’ ability to purchase certified allowances.
The Parliament is also addressing emissions
other than of CO2. These mostly concern NOx, water
vapor and particulates. To compensate for aviation’s
total climate impact, the Parliament proposes in-
troducing a two-times multiplier.
Emissions trading as proposed by the Parlia-
ment and any multiplier would result in a substan-
tial increase in costs, which would largely be added
to ticket prices. In the original proposal, costs were
assumed to correspond to a 2–3% increase in fuel
costs. In the Parliament’s proposal, the increase
will be up to 10–20% of fuel costs. The costs im-
plied by the introduction of a multiplier, which are
currently difficult to estimate, come in addition.
At the end of December 2007 the proposal was
discussed by the Council of Ministers. The Council
took a more lenient stance. Nevertheless, the in-
tentions are clear. Air transport will be covered by
the emissions trading scheme even if the ceilings
proposed by the Parliament are disregarded. The
Council has dismissed for now the proposed mul-
tiplier. At the same time the EU has appointed a
commission to study aviation’s NOx emissions,
which is very likely to result in proposals for regu-
lations or taxes.
SAS’s view on emissions trading
It is the SAS Group’s view that if cost increases are
reasonable and do not put air at a competitive dis-
advantage over other modes of transportation, an
acceptably designed emissions trading scheme
can enable airlines to continue to grow.
With regard to CO2, scientists and airline indus-
try representatives are in relative agreement on
effects, magnitude, and measurement methods.
There is greater uncertainty about the significance
of other emissions, such as NOx, water vapor, and
particulates. Generally it can be said that current
estimates are that CO2 emissions account for two-
thirds of air transport’s total contribution to climate
change.
SAS considers a multiplier to be illogical, unsci-
entific and methodologically faulty. The Group
regards it as an inefficient way of dealing with the
costs of one kind of emission by paying for another.
Besides, it is systemically incorrect for lower emis-
sions of water vapor to correspond to lower emis-
sions of CO2. Other sectors in business and indus-
try in the emissions trading scheme have emissions
other than CO2, but have not been hit by any form
of multiplier.
In SAS’s judgment the current moves from the
EU will impact the Group negatively, even of the
effects of the Council of Ministers’ position are less
than if the Parliament’s proposal were to find a
hearing. In the longer term, the airline industry will
increasingly feel the impact of regulations, ceilings
and taxes.
As SAS fully endorses the “polluter pays princi-
ple” it is prepared to account for its share. This
assumes that any taxes imposed on it are based
on scientific findings and that the total climate im-
pact of competing modes of transportation is tak-
en into consideration. It is also important that EU
environmental standards do not create a situation
that puts European operators at a disadvantage to
non-European operators.
SAS endorses IATA’s vision that aviation elimi-
nate all greenhouse emissions before 2050. This
vision is to become reality through a number of
measures.
Other transport 12%
Agriculture 14%
Energy/other
Source: EEA/IPCC
72%
Air transport’ share of global carbon emissions
Air transport 2%
Air transport 12%
Shipping/rail 12%
Road transport
Source: Stern Report
76%
Air transport’s share of the transportationsector’s global carbon emissions
Energy/other 59%
Transportation 21%
Agriculture 9%
Waste
Source: EEA
3%
Industry 8%
Breakdown of carbon emissions in Europe

98 SAS Group Sustainability Report 2007
SAS’s environmental strategy targets for 2020Million tonnes C02
Theoretical trend if no actions taken
Expected performance from planned replacementof aircraft fleet
Expected performance from planned replacementof aircraft fleet and other measures
5.0
4.0
6.0
7.0
10.0
9.0
8.0
Based on 4% annual traffic growth
–20%
2006 2010 2014 2018 2020
SAS’s environmental strategy targets for 2020%
Reduction of relative environmental impact fromplanned replacement of aircraft fleet
Reduction of relative environmental impact fromplanned replacement of aircraft fleet and othermeasures
70
60
50
80
90
100
110
2006 2010 2014 2018 2020
Based on 4% annual traffic growth
SAS endorses IATA’s vision for air transport to eliminate all greenhouse emissions by 2050. This vision is to be realized through a number of measures.
Relative environmental impact and SAS/IATA’svision of zero emissions
Index
2050
Next
gene-
ratio
nairc
raft
ATM
2000 2020 2025 2030
Alte
rnativ
efu
elTe
chnolo
gy
leaps
ACARE
1.0
0.8
0.6
0.4
0.2
0.0
Zero
emiss
ions
Environmental vision
• SAS intends to be a leader in work toward sustaina-
ble development in air transport, thus contributing
to sustainable social progress
• SAS intends to have the most ambitious long-term
environmental program in the airline industry.
Environmental targets
In line with IATA’s vision, the overarching long-term
goal for SAS’ environmental work is to have zero emis-
sions. Zero emissions for air transport is to be realized
by no later than 2050.
Principal strategic targets
• 20% lower emissions by 2020 with traffic growth
included
• 50% lower emissions per unit produced by 2020
Goals for 2008–2011
SAS aims to
• be seen as the most environment-conscious airline
in Europe
• have certified environmental management systems
in accordance with ISO 14001
• have the industry’s most efficient fuel saving program
• be among the first airlines to blend in alternative fuel
when it is approved and commercially available
• have a long-term plan for its aircraft fleet that leads to
a significant reduction of greenhouse emissions
• have reached the target for SAS’s eco-efficiency index.
Strategies for sustainable development
SAS aims to
• create a culture among its employees based on
interest in and commitment to environmental work
• actively influence political decision-making to
counteract distortion of competition within as well
as between various sectors.
• have documented sustainability appraisals as a basis
for all decisions
• engage in strategic environmental communication
• promote tomorrow’s solutions, build alliances and
support relevant R&D projects.
Eco-political vision
All modes of transportation, i.e., road, rail, sea and
air, must bear their own costs for both investment
and infrastructure and for society’s other environ-
ment-related efforts according to the polluter pays
principle. This implies total competition-neutrality
regarding environmental and sustainability issues.
Environmental platform
The point of departure for SAS’s environmental and
sustainability work is its environmental platform,
intended to guide attitudes and action and lay
down routines for internal environmental efforts.
The platform contains the following positions in
which SAS:
admits that aviation has a climate impact
accepts the conclusions of IPCC assessment
reports on aviation’s climate impact
endorses the polluter pays principle
seeks the economically best available technol-
ogy (EBAT)
will assume its responsibility for CO2 emissions
like every other sector, since the Group believes
that open emissions trading is a tool for reaching
its environmental goals
will assume its responsibility for aviation’s other
greenhouse emissions in a cost-effective system
based on scientific facts
intends to engage in an open dialog on environ-
mental issues with all affected stakeholder
groups.
Environmental action plan
SAS’s environmental action plan for 2008–2011
is based on the principles of the environmental
policy. This detailed and comprehensive plan
contains measures aimed at customers and em-
ployees and at production and communication.
As an example, SAS will offer customers carbon
offsets. There will be a vehicle policy, based on the
current definition of a green vehicle. Employees
are to become more knowledgeable about envi-
ronmental and climate issues, through an update
of the SAS Environmental Education Program.
Moreover, SAS will set clear environmental stand-
ards for its purchasing process and follow up com-
pliance.
Environmental communication
The strategy for environmental communication
involves having a credible basis for all communica-
tion on environmental issues to be able in turn to
support vital commercial decisions. Among these
are laying the foundation for a constructive debate
on the environmental impact of air transport.
New goals and strategies
The overall objective of SAS’s sustainability work is to create long-term growth in
shareholder value and help the Group reach its goals. Each investment in sustainable
development should yield financial results. On this basis the Group reformulated its
goals in 2007 within the framework of the Strategy 2011 strategic plan.

99SAS Group Sustainability Report 2007
Sustainability policies for the SAS Group
Environmental responsibility • Social responsibility • Financial responsibility
SustainabilityPolicy
EnvironmentWorking environment
Quality
ShareholdersCommunication
FinanceCompliance with
the law
GovernanceManagementHuman resourcesDiversityRedundancy
ITPurchasing
SafetyInsurance
Core values
Consideration • Reliability • Value creation • Openness
SAS’s four core values cover all operations in the Group and form the ba-sis for all work on sustainability issues. On the basis of these core values, SAS has set overarching policies that along with a number of strategies govern its sustainability work. An account of all of SAS’s policies can be
found on the website. www.sasgroup.net
Sustainability policy
• To contribute to sustainable development, SAS employ-
ees must, in their day-to-day work, take the Group’s finan-
cial performance into account as well as its environmental
and social impacts on the community.
• For SAS, sustainable development means a simultaneous
focus on financial growth, environmental improvements
and social responsibility. The Group’s task, based on its
core values, is to create long-term growth in shareholder
value. This requires integrating environmental and social
responsibility into business activities. Maintaining and de-
veloping human resources is vital for the Group to reach
its goals.
Environmental policy
• SAS will contribute to sustainable development by opti-
mizing resource use and minimizing its environmental
impact in all its operations.
• SAS’s environmental goals are based on constant
improvement and on each subsidiary setting specific
targets and working to reach them.
• SAS will seek to use renewable energy.
• SAS will have an environmental program as good as or
better than leading industry competitors’ that attracts
customers and capital.
• SAS’ environmental goals and activities are to be coordi-
nated and harmonized with other production, quality
and financial targets.
Responsibility for sustainable development
For the SAS Group economically sustainable profitability is closely connected with environmental improvements
and the ability to take social responsibility characterized by ethical conduct in all business relations.
In many ways, work on sustainability issues serves
to increase shareholder value and competitiveness,
such as through more effective control of risks. The
Group is convinced that it is impossible to have eco-
nomically sustainable operations without also tak-
ing social and environmental responsibility.
SAS benefits society by being a major employer
and contractor, by maintaining crucial societal in-
frastructure, and by generating returns for its
owners. At the same time the Group, through its
airlines, engages in activities that in the present
situation contribute to an adverse environmental
impact, including through emissions of carbon
dioxide (CO2) and nitrogen oxides (NOx) and
noise, primarily close to airports.
SAS also sees that from a social, environmental,
and economic perspective, responsibility is also
largely governed by stakeholders’ views on its
activities and their performance. Stakeholder
dialog serves to identify, define and develop the
Group’s highest priority sustainability issues.
Thus, an ongoing dialog with affected stakehold-
ers is essential for work on sustainable develop-
ment. SAS takes the initiative on dialogs, and all
stakeholders seeking contact with SAS will be
given a chance to air their views.
Dialog with stakeholders
For the SAS Group, as for other companies operat-
ing globally, it is becoming increasingly important
to retain the acceptance and trust of the world
around us. To succeed requires candor about op-
erations and willingness to understand how stake-
holders view the company and its activities.
In the fight against a growing environmental
impact, the role of air transport is increasingly being
called into question. Negative opinions can help to
create a policy framework less favorable to the in-
dustry’s future growth. On the other hand, an objec-
tive and balanced debate on the benefits of aviation
over other forms of transportation should create
acceptance for competition-neutrality regarding
laws, regulations, and taxes as well as other operat-
ing conditions. It is therefore essential that the entire
industry take every opportunity in a candid dialog
with the public to discuss and point out the airlines’
positive and negative impacts on society, travel and
the environment. The aim of SAS is to play a leading
role in this dialog. The airline industry has taken the
initiative on a large-scale information campaign that
will run until 2011. www.enviro.aero
SAS’s most important relations with stakehold-
ers with regard to sustainability appear below.
SAS conducts regular interviews that help the
Group to maintain and improve relations with key
stakeholders through targeted measures. Exam-
ples of measures prompted by stakeholder dia-
logs are:
the opportunity for customers to purchase car-
bon offsets to neutralize the emissions gener-
ated by their journey
further emphasizing the description of employ-
ment conditions and relations with labor organ-
izations in financial reporting
reporting the financial consequences of the
Group’s sustainability work
the strategy whereby SAS employees are to
meet the customer on the correct terms
efforts to make SAS a more attractive employer.
Employees Employee index PULS. Development interviews. Whistleblower function. Staff meetings –for flight staff, called Base Days
Customers Customer surveys. Interviews. Customer Satisfaction Index. Image index
Contract customers CO2
Reduction Network. Direct dialog in meetings and ongoing contact with several thousandcontract customers
The traveling public Qualitative and quantitative surveys
Owners, investors and financial analysts Surveys. Teleconferences. Regular meetings
Governments International working groups. Ongoing contact with national governments and policymakers
Suppliers The SAS Group’s purchasing policy. Compliance with Global Compact principles
Partnerships and networks Star Alliance. Global Compact Nordic. CSR Sweden. Flygets miljökommitté
NGOs Cooperation with Bellona. Friends of the Earth, WWF, Save the Children
Organizations ICAO Committee on Aviation Environmental Protection. Association of European Airlines. IATA’senvironmental committee. Confederation of Swedish Enterprise. Confederation of Danish Indu-stries. Confederation of Norwegian Enterprise, etc.
Mass media Interviews. Articles and op-ed pieces
* A more detailed description of the SAS Group’s dialogs with stakeholders with in-depth information may be found at www.sasgroup.net
Stakeholders Examples of dialogs*

100 SAS Group Sustainability Report 2007
Developments in 2007 show that the Group’s rela-
tions with key stakeholder groups need to be
strengthened. The Group’s brand and image in the
market have been damaged by the strikes and
other conflicts, the problems related to the Q400
aircraft and greater political and media attention to
air transport’s adverse environmental impact.
It is management’s aim for all supervisors to
translate stakeholder relations and intelligence anal-
yses into commercial targets and for relations with
key groups to be managed in a wise and well-
thought-out way. This work is to help the Group
attain and boost profitability in all parts of its opera-
tions.
Business relations
For the airline industry, with a tradition of close
collaboration with competitors, antitrust issues are
in focus. The SAS Group has therefore developed a
special section on competition law in its Group poli-
cies and adopted a program to ensure compliance,
the “SAS Competition Law Compliance Program.”
This program, originally introduced in 2001, is con-
stantly being improved, most recently in fall 2005,
and the Group is engaged in extensive training
activities aimed at all supervisors and other affected
employees. Group policies also contain strict
prohibitions against paying or accepting bribes or
improper perquisites.
Code of Conduct
To summarize and clarify the Group’s stated
values, policies, and other regulations, the SAS
Group Board of Directors has issued a Code of
Conduct. It exists in five languages and has been
issued to all Group employees. To underscore the
Code’s importance, there are clear rules and struc-
tures for reporting and dealing with suspected
violations.
Supervisors and other managers play a key role
in implementing and following up the Code. The
follow-up for 2007 showed that all units have
introduced the Code and that no noncompliances
or violations were reported during the year. The
Code’s whistleblower function was used to a very
limited extent. Only four cases were reported. All
have been investigated and are closed.
In 2007 work began to revise and supplement
the Code. This is expected to be completed in the
first half of 2008, when it will be relaunched at the
same time as information and training efforts are
intensified.
Environmental responsibility
After the sale of the hotel business in fall 2006,
flight operations account for more than 95% of the
Group’s environmental impact. The biggest impact
is caused by the consumption of nonrenewable
energy, primarily fossil fuels. Combustion of these
fuels causes a rise in atmospheric CO2, contribut-
ing to global climate change. Aircraft noise is a
local environmental nuisance.
In various national and international contexts
SAS works actively to reduce its environmental im-
pact and acts to influence aviation’s environmental
operating framework and to develop and dissemi-
nate green technology.
The SAS Group is part of 3C, a group of 49
leading international companies committed to
initiatives from the business sector to deal with
global environmental problems.
www.combatclimatechange.org
The staff of Sustainability & Environment also
participate in national and international bodies.
Corporate social responsibility
The SAS Group’s social and societal responsibili-
ties include employees and the Group’s impact on
the surroundings and communities where it oper-
ates. Group companies give priority to issues on
the basis of the activities the particular company
engages in, see pp. 111–114. For that reason the
content of their social responsibility may vary de-
pending on time and place.
Corporate Environment & Sustainability also
participates in a number of relevant forums for
developing the Group’s social commitment.
As an employer, the SAS can help provide its
employees with a long-term high standard of living
and quality of life. The best possible physical and
psychological working environment is essential, as
are opportunities for employees to develop, both
in their professional roles and as people.
One requirement for attaining customer and
profitability targets is taking care of and fostering
employee skills and commitment. The Group also
affects a number of subcontractors, thereby contrib-
uting to economic and social welfare in the countries
and societies where its businesses operate.
By being committed to social issues and by
joining the UN Global Compact, the Group has
pledged in all its activities to defend and promote
human rights and to combat corruption, discrimi-
nation and all forms of forced labor.
www.unglobalcompact.org
Financial responsibility
The SAS Group’s primary duty is to create long-
term value growth for its owners through having
satisfied customers and motivated employees.
Sustainability work is also to help boost SAS’s
competitiveness through better resource utiliza-
tion. It is from this perspective that work on sus-
tainability issues must be viewed.
SAS has a big impact on the economy. Its direct
impact comprises salaries to employees, purchas-
es of services and materials from outside suppliers,
and direct and indirect taxes to the community.
Every employee of Group airlines generates one
additional job in other companies and industries.
With regard to cost reductions, sustainability
work primarily contributes lower fuel consump-
tion, better economizing on resources, and a lower
risk of sustainability-related disputes and com-
plaints. Sustainability work thus helps to boost
competitiveness and increase shareholder value.
SAS also helps to create added value for indi-
viduals as well as companies and society at large
by facilitating people’s travel and by furnishing
the transportation of goods.

101SAS Group Sustainability Report 2007
For the SAS Group, as for the entire airline industry, set and implicit targets pose a big challenge
moving forward. At the same time, the airlines need to take full responsibility for future developments
not being obstructed by political and media posturing.
Reducing environmental impactTechnologydevelopment
InfrastructureOperational
measuresEconomic
instruments
ACARENew technologyAlternative fuels
Improvedaerodynamics
Single skySingle Sky
NUAC + FABCoordinated ATC
Fuel savingprogram
Green approaches
Emissions tradingTaxes, chargesand regulations
Instruments for reducing environmental impact
The airline industry is committed to long-term in-
vestment in environment-related measures that
take years to carry out and are capital-intensive.
SAS’s environmental work rests on four main
pillars: Technology development, Infrastructure,
Operational measures and Economic instruments.
Together they form the overarching framework of
the Group’s efforts to limit its environmental impact.
Continued development of aircraft engine technol-
ogy is necessary for making air transport greener.
This development is propelled in part by various
industry-specific projects and joint-ventures, in
part by manufacturers and in part by individual
engine manufacturers. The aim of SAS is to play a
leading role in these contexts.
ACARE
Via AEA the SAS Group participates in the Advisory
Council for Aeronautics Research in Europe
(ACARE). ACARE comprises representatives of the
EU counties, the European Commission, research-
ers, the aviation industry, airport owners and avia-
tion industry bodies. ACARE’s target is 50% lower
CO2 emissions, 80% lower NOx emissions and
noise levels cut in half for new aircraft by 2020.
New technology
Technology development primarily involves new
aircraft types, new engines and new fuels.
On medium-haul flights SAS mainly employs
MD-80s and Boeing 737s. The most recently
delivered Boeing 737s meet today’s requirements
for best available technology regarding fuel con-
sumption, NOx and noise. Airbus A319/A320s
also meet fuel efficiency standards, and the Group
uses them on short- and medium-haul flights, and
they replace MD-80s on flights to destinations
with noise restrictions. All aircraft now being added
to the fleet are equipped with the best available
technology.
In the period 2008–2018 SAS will be faced with
replacing its MD-80 fleet totaling 44 aircraft with
an average age of 18 years. In addition, there are
17 older Boeing 737s. The MD-80s are mainly
used by Scandinavian Airlines Danmark and Scan-
dinavian Airlines Sverige. The MD-80 is a very
economical and reliable aircraft, well suited to
SAS’s domestic and European service. Its useful
life is estimated to be 25–30 years.
SAS is currently considering various alterna-
tives for this replacement. There are in reality only
two. One is to gradually begin the phase-out and
invest in a new fleet with the current best available
technology. The other is to wait until the next gen-
eration of short- and medium-haul aircraft goes
into service. Both major manufacturers, Boeing
and Airbus, have announced the plans for develop-
ing the next generation of aircraft and engines.
Boeing has indicated that its products will be avail-
able by 2015 at the earliest.
Both alternatives have advantages and draw-
backs. Early replacement of most of the oldest air-
craft in the fleet would mean 10–15% lower fuel
consumption compared with aircraft taken out of
service. However, costs will increase by MSEK 400
per year.
Waiting for the next generation of aircraft means
that SAS will forgo short-term environmental im-
provements for more extensive ones in the longer
term. The new aircraft are expected to offer fuel
savings of 30–35% compared with today’s. At the
same time, the Group will be able to consolidate its
balance sheet and probably better accommodate
financing than with a faster replacement.
In light of this, SAS’s view is to put off the
phase-out until the next generation of aircraft and
engines is on the market. Assuming that the man-
ufactures keep to the timetable known so far, this
means a postponement of at least five and at most
eight years. This should be viewed in light of the
fact that the fleet is to be used for 25–30 years.
Moreover, the new fleet will permit expansion at
least in step with market trends and help SAS
reach its long-term environmental targets.
At the end of the 1990s the SAS Group decided
to equip its newly purchased Boeing 737 fleet with
DAC engines. This meant a cost increase totaling
MSEK 250 for 50 aircraft. The decision was strate-
gic, aimed at getting the best available technology
for meeting tougher standards for NOx emissions.
The decision was also important for showing how
serious SAS takes its environmental responsibility.
SAS had hoped others in the industry would
follow suit, but only a few airlines did. For that
reason the Group’s fleet became unique, which is
rarely good for its secondhand value. The engines
use somewhat more fuel than conventional tech-
nology, meaning higher CO2 emissions, and are
more expensive to maintain. In the plus column
are lower charges at airports such as Stockholm
Arlanda, Zürich Kloten and London Heathrow, etc.,
as well for Norwegian domestic traffic. However,
these do not outweigh the higher operating costs.
But at Stockholm Arlanda, with an emission ceiling
for NOx among others, the Group’s DAC fleet has
helped ensure that the ceiling has not yet been
reached. The EU is also considering a NOx tax in
connection with the introduction of emissions
trading.
Besides fuel consumption, engine development
is important for solving the noise problem.
Like all aircraft and engines manufactured since
the 1980s, the MD-80 fleet is certified to Chapter 3
standards, and as one of the first in this category
the aircraft is relatively noisier than those in this
size class produced later.
SAS is looking into various ways to meet future
noise abatement standards, thus reducing the risk
of restrictions on the use of MD-80s. One way is to
replace the engines of the MD-80 fleet to meet
Chapter 4 standards. This is a financially unfavora-
ble solution. Another is to upgrade existing engines.
There are two available technologies that allow
upgrading of Chapter 3 aircraft to Chapter 4 in terms
of noise. SAS already tested one in 2006 and 2007
and concluded that it did not meet expectations.
Evaluation of the other technology is expected to
be completed during the first half of 2008.
Technologydevelopment
Economic instruments
Operational measures
Infrastructure
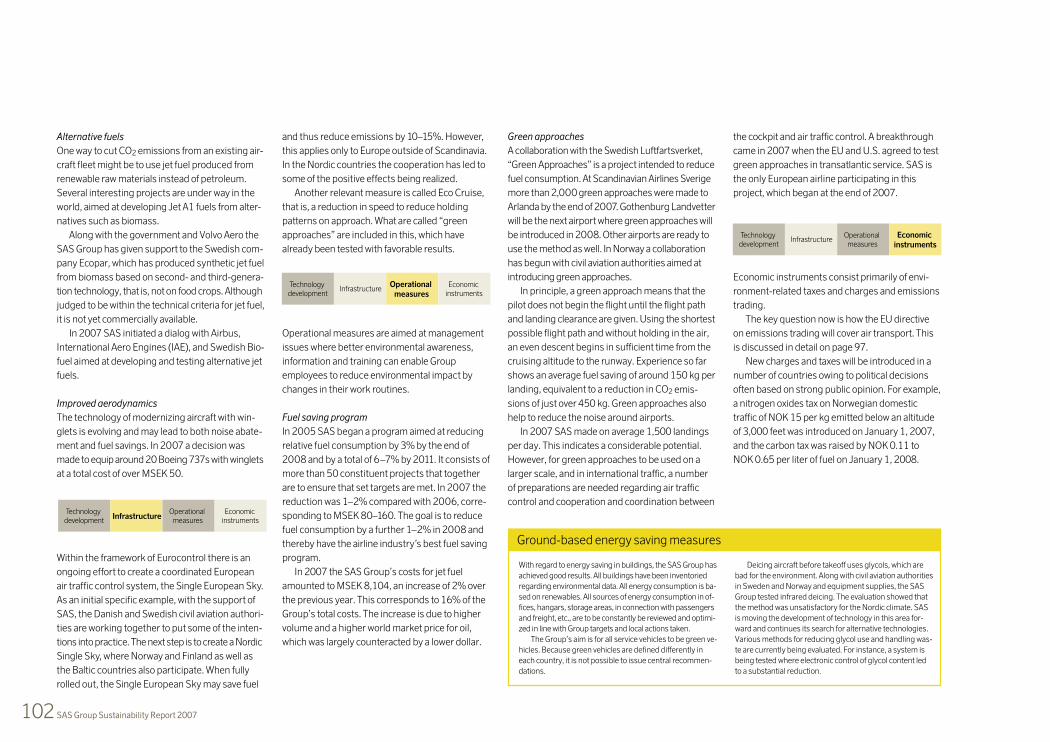
102 SAS Group Sustainability Report 2007
Alternative fuels
One way to cut CO2 emissions from an existing air-
craft fleet might be to use jet fuel produced from
renewable raw materials instead of petroleum.
Several interesting projects are under way in the
world, aimed at developing Jet A1 fuels from alter-
natives such as biomass.
Along with the government and Volvo Aero the
SAS Group has given support to the Swedish com-
pany Ecopar, which has produced synthetic jet fuel
from biomass based on second- and third-genera-
tion technology, that is, not on food crops. Although
judged to be within the technical criteria for jet fuel,
it is not yet commercially available.
In 2007 SAS initiated a dialog with Airbus,
International Aero Engines (IAE), and Swedish Bio-
fuel aimed at developing and testing alternative jet
fuels.
Improved aerodynamics
The technology of modernizing aircraft with win-
glets is evolving and may lead to both noise abate-
ment and fuel savings. In 2007 a decision was
made to equip around 20 Boeing 737s with winglets
at a total cost of over MSEK 50.
Within the framework of Eurocontrol there is an
ongoing effort to create a coordinated European
air traffic control system, the Single European Sky.
As an initial specific example, with the support of
SAS, the Danish and Swedish civil aviation authori-
ties are working together to put some of the inten-
tions into practice. The next step is to create a Nordic
Single Sky, where Norway and Finland as well as
the Baltic countries also participate. When fully
rolled out, the Single European Sky may save fuel
and thus reduce emissions by 10–15%. However,
this applies only to Europe outside of Scandinavia.
In the Nordic countries the cooperation has led to
some of the positive effects being realized.
Another relevant measure is called Eco Cruise,
that is, a reduction in speed to reduce holding
patterns on approach. What are called “green
approaches” are included in this, which have
already been tested with favorable results.
Operational measures are aimed at management
issues where better environmental awareness,
information and training can enable Group
employees to reduce environmental impact by
changes in their work routines.
Fuel saving program
In 2005 SAS began a program aimed at reducing
relative fuel consumption by 3% by the end of
2008 and by a total of 6–7% by 2011. It consists of
more than 50 constituent projects that together
are to ensure that set targets are met. In 2007 the
reduction was 1–2% compared with 2006, corre-
sponding to MSEK 80–160. The goal is to reduce
fuel consumption by a further 1–2% in 2008 and
thereby have the airline industry’s best fuel saving
program.
In 2007 the SAS Group’s costs for jet fuel
amounted to MSEK 8,104, an increase of 2% over
the previous year. This corresponds to 16% of the
Group’s total costs. The increase is due to higher
volume and a higher world market price for oil,
which was largely counteracted by a lower dollar.
Green approaches
A collaboration with the Swedish Luftfartsverket,
“Green Approaches” is a project intended to reduce
fuel consumption. At Scandinavian Airlines Sverige
more than 2,000 green approaches were made to
Arlanda by the end of 2007. Gothenburg Landvetter
will be the next airport where green approaches will
be introduced in 2008. Other airports are ready to
use the method as well. In Norway a collaboration
has begun with civil aviation authorities aimed at
introducing green approaches.
In principle, a green approach means that the
pilot does not begin the flight until the flight path
and landing clearance are given. Using the shortest
possible flight path and without holding in the air,
an even descent begins in sufficient time from the
cruising altitude to the runway. Experience so far
shows an average fuel saving of around 150 kg per
landing, equivalent to a reduction in CO2 emis-
sions of just over 450 kg. Green approaches also
help to reduce the noise around airports.
In 2007 SAS made on average 1,500 landings
per day. This indicates a considerable potential.
However, for green approaches to be used on a
larger scale, and in international traffic, a number
of preparations are needed regarding air traffic
control and cooperation and coordination between
the cockpit and air traffic control. A breakthrough
came in 2007 when the EU and U.S. agreed to test
green approaches in transatlantic service. SAS is
the only European airline participating in this
project, which began at the end of 2007.
Economic instruments consist primarily of envi-
ronment-related taxes and charges and emissions
trading.
The key question now is how the EU directive
on emissions trading will cover air transport. This
is discussed in detail on page 97.
New charges and taxes will be introduced in a
number of countries owing to political decisions
often based on strong public opinion. For example,
a nitrogen oxides tax on Norwegian domestic
traffic of NOK 15 per kg emitted below an altitude
of 3,000 feet was introduced on January 1, 2007,
and the carbon tax was raised by NOK 0.11 to
NOK 0.65 per liter of fuel on January 1, 2008.
Technology development
Economic instruments
Operational measures
Infrastructure
Technology development
Economic instruments
Operational measures
Infrastructure
Technology development
Economicinstruments
Operational measures
Infrastructure
Ground-based energy saving measures
With regard to energy saving in buildings, the SAS Group has
achieved good results. All buildings have been inventoried
regarding environmental data. All energy consumption is ba-
sed on renewables. All sources of energy consumption in of-
fices, hangars, storage areas, in connection with passengers
and freight, etc., are to be constantly be reviewed and optimi-
zed in line with Group targets and local actions taken.
The Group’s aim is for all service vehicles to be green ve-
hicles. Because green vehicles are defined differently in
each country, it is not possible to issue central recommen-
dations.
Deicing aircraft before takeoff uses glycols, which are
bad for the environment. Along with civil aviation authorities
in Sweden and Norway and equipment supplies, the SAS
Group tested infrared deicing. The evaluation showed that
the method was unsatisfactory for the Nordic climate. SAS
is moving the development of technology in this area for-
ward and continues its search for alternative technologies.
Various methods for reducing glycol use and handling was-
te are currently being evaluated. For instance, a system is
being tested where electronic control of glycol content led
to a substantial reduction.

103SAS Group Sustainability Report 2007
Organization and management
The SAS Group’s operational sustainability work is based on its sustainability policy, as well as the Group’s commitment to comply
with the principles of the UN Global Compact. The strategy for sustainability work, sustainability and environmental policies, as
well as targets and KPIs connected with them, were reformulated in the Group’s new strategic plan, Strategy 2011, and adopted
in fall 2007.
In its essentials the new strategy for sustainability
work follows the guidelines the Group has applied
for years, but with tighter environmental stand-
ards and stricter requirements for environmental
work. A key element of environmental work is an
enhanced environmental communication plan.
The SAS Group’s management philosophy is
based on decentralization and is expressed in the
Group’s policies and strategies. This also applies
to sustainability issues. The final responsibility for
these issues rests with Group Management, while
the heads of business areas and Group companies
have operational responsibility. These heads are
evaluated in how their company’s environmental
index performs. The targets for 2001 are set by
Group Management.
Management by objectives
Group companies set targets for their respective
activities and prepare action plans for their sus-
tainability work. The companies report yearly and
in writing to Group Management on achievement
of quantitative and qualitative targets, how work is
progressing, and any specific actions taken.
The SAS Group has a central, coordinating, and
advisory department for Environment & Sustaina-
bility. This department comes under the Corporate
Function Public Affairs, where the Group Director
for Environment & Sustainability is part of man-
agement. The head of Public Affairs monitors
sustainability and environment issues for Group
Management.
Sustainability work is coordinated and devel-
oped through the SAS Group Sustainability
Network, comprising sustainability coordinators
from all companies and corporate functions. They
report to the management of their respective com-
pany or unit. The network includes a total of 16
senior executives, all with sustainability work as a
key task.
Issues directly related to employees’ working
conditions are dealt with by the SAS Group HR
Management Team, which consists of nine heads
of human resources in Group companies and
units. They, too, report directly to their respective
managements. Employee issues are coordinated
by Human Resources (HR), with functions for
management development, company health serv-
ices, salary and remuneration issues, and sick
leave.
HR also plays an advisory role in the Group’s
working environment efforts, which represent an
important portion of its sustainability work. This
includes a system of recurring working environ-
ment audits. It is each company’s responsibility to
ensure a well-functioning working environment.
This work takes place in collaboration with safety
representatives, supervisors and labor-manage-
ment joint safety committees in each country.
In-house company health services
While other companies often purchase company
health services from outside providers, the SAS
Group has chosen to build up its own resources in
Scandinavia. This provides knowledge about the
conditions of the Group’s various employee
groups.
Besides medical staff, the company health
services or health, safety and environment (HSE)
department employs therapists, stress and
rehabilitation experts, and ergonomic engineers.
The department has also developed and offers
special services, including aviation medicine,
stress management, sick leave follow-up, health
profiles, ergonomics and advising in handling
chemicals.
Handling sustainability data
Environmental data are reported twice a year,
while data concerning employee sick leave and
injuries are followed up at a local level on an ongo-
ing basis. The ambition is for these data to be
reported quarterly. In addition, companies and
units are to report at least once a year on meas-
ures to improve the Group’s sustainability work.
Reporting concerns such issues as community
involvement, supplier contacts, cooperation with
internal and external stakeholders, working envi-
ronment, training and costs thereof, conflicts, key
environmental aspects, environmental targets,
nonconformances, licenses, work on the Code of
Conduct and the UN Global Compact, etc.
Responsibility for reporting rests with the
heads of each company and unit, but in practice it
is carried out by the coordinators in the SAS Group
Sustainability Network. Data are compiled by the
Group coordinating and advisory department for
Environment & Sustainability and is then reported
to Group Management.
Group Management: Sets framework in the form
of the Code of Conduct, overarching objectives, poli-
cies, and other guidelines. Initiates support activities.
Provides support functions for sustainability work
via Corporate Human Resources and Corporate
Public Affairs & Environment.
Human Resources: HR coordinates, negotiates,
administers, and develops personnel issues. HR
has several support functions, including the HSE
department in each country, which provide health
and working environment services.
Environment & Sustainability: Department of
Corporate Public Affairs & Environment that
coordinates and advises on issues concerning the
environment and sustainability/CSR vis-à-vis
Group Management and subsidiaries.
SAS Group HR Management Team: Helps improve
sustainability work through the coordination of
employee issues by personnel directors in Group
companies and units.
SAS Group Sustainability Network: Coordinator of
the sustainability work that includes representati-
ves of all companies
SAS Group subsidiaries: On the basis of their acti-
vities, set specific objectives for sustainability work,
environmental targets, social objectives, etc. Carry
out activities and follow up results.
Organization and management of the SAS
Group’s sustainability work
SAS GroupSustainability
Network
Group Management
SAS Group subsidiaries
Environment &Sustainability
HumanResources (HR)
SAS Group HR Management Team

104 SAS Group Sustainability Report 2007
Results for the year
The positive trend that has characterized the SAS Group’s sustainability work was amplified in 2007,
with emissions per unit produced the lowest ever. The PULS employee index was up despite a turbulent year.
Important events in 2007
SAS’s environmental index was restructured,
with the targets set by Group Management.
Performance of the environmental index is one
of the parameters against which subsidiaries
will be evaluated.
SAS reported a climate index with 2005 as the
base year. The trend is positive.
The SAS Group’s brand was affected by poorer
customer relations, due in part to conflicts and
problems with the Q400.
SAS was one of the first airlines to offer its cus-
tomers carbon offsets.
An IATA audit of SAS’s fuel saving program was
performed.
A nitrogen oxides tax was introduced in
Norway.
There were several court cases under way in
Norway, including on charges against SAS for
antitrust violations.
Work on getting management and employee
organizations to see more eye-to-eye on key
future issues was stepped up.
Important events in 2008
Around 20 aircraft will be modified with win-
glets at a cost of over MSEK 50, lowering fuel
consumption and reducing noise.
A revised Code of Conduct will be launched in
2008 with stepped up training efforts.
In 2007, the SAS Group’s flight operations account-
ed for approximately 95% of its overall environmental
impact. The remainder came from ground and cabin
operations.
Climate index
Starting in 2007 SAS is reporting a climate index,
which refers to weighted climate impact excluding
noise, i.e., emissions of carbon dioxide (CO2) and
nitrogen oxides (NOx). The index measures the
Group’s overall climate impact relative to produc-
tion measured in RPK and has been worked out
for the period 2005–2007. The trend is positive,
and for 2007 the lowest emissions so far per unit
produced were reported.
Environmental index
Since 1996 SAS has been measuring eco-efficiency
using an environmental index, in which environmen-
tal impact is measured relative to production. An en-
vironmental index is reported for each company, but
not for the Group as a whole. These indices are a tool
for managing and following up the Group’s environ-
mental performance.
During the year this reporting was further
formalized and is part of the evaluation of subsidi-
aries against targets set by Group Management.
Each company has individually set targets, which
with regard to the airlines are based on expected
passenger load factor.
In recent years the Group’s environmental
indices have trended positive in most units,
and in 2007 this trend was amplified.
Customer perception of SAS as a socially re-
sponsible company committed to the environment
is measured by the annual Customer Satisfaction
Index surveys. Results from 2007 showed that the
image indices for environment and social responsi-
bility fell compared with the previous year. During
the year there was an extensive debate on the role
of air transport in society and its climate impact,
which may have contributed to the deterioration.
Environmental management system
Following SAS’s overarching objectives and strate-
gies, each company or unit sets environmental tar-
gets based on the requirement for constant and
relative improvements in environmental perform-
ance. In 2007 the requirements were tightened,
and the goal is now for all companies and units to
be certified according to ISO 14001 by no later
than 2011. So far only SAS Cargo has this
certification. The remaining units have their own
environmental management systems integrated
into their management and quality processes.
Environmental permits
Airline operations have no separate licenses or envi-
ronmental permits for operation, but depend on
permits that airport owners have, such as for glycol
handling, runway deicing, and threshold values for
noise and emissions. However, an environmental ap-
proval is part of the procedure for aircraft certification
performed in the three Scandinavian countries.
Airline operations have a dispensation for halon
use and submit annual reports to the authorities
Cabin
Food and beverages
Packaging
Disposable/semi-
disposable items
Articles for sale
Newspapers
Chlorinated water
Waste
Hazardous waste
Wastewater
Sulfur dioxide (SO2)
Carbon dioxide (CO2)
Nitrogen oxides (NOX)
Hydrocarbons (HCs)
Soot and particulates
Volatile organic
compounds (VOCs)
Organic waste
Packaging
Unopened beverages
Articles for sale
Waste
Lavatory waste
Glycols
Water
Freons
Maintenance materials
Energy
Vehicle fuel
Office supplies
Chemicals
Supplies
Flight
Jet fuel
Engine oil
Halons
Carbon dioxide (CO2)
Nitrogen oxides (NOX)
Hydrocarbons (HCs)
Volatile organic
compounds (VOCs)
Oil aerosols
Jettisoned fuel
Noise
Water vapor
Sulfur dioxide (SO2)
Carbon monoxide (CO)
Halons
Ground operations
Airline operationsIN
IN OUT
Other operations 5%
The SAS Group’s total environmental impact
Airline operations 95%
OUT
Definitions
The section Results for the year reports production data
including paying, bonus and charter passengers, which
produces figures that diverge from the financial part, but
provides a truer picture of SAS’s total and relative environ-
mental impact
Environmentalresponsibility

105SAS Group Sustainability Report 2007
on use and storage. The reason for this dispensa-
tion is that there is no sufficiently safe alternative
to halons as extinguishants for aircraft engine or
cabin fires. In 2007 a few kilograms of halons
leaked. At the end of 2007, inventories of halons
amounted to just under 15 tonnes.
SAS Oil is a jet fuel purchasing company for
most Group airlines. Through SAS Oil, SAS is a
minority owner of a number of smaller companies
that handle jet fuel. The Group is satisfied that
these companies have the necessary permits,
contingency plans and insurance.
A detailed description of SAS’s licenses and
environment-related permits is found in the
Report by the Board of Directors. p. 55
Environmental incidents in 2007
Scandinavian Airlines Danmark exceeded the
noise limit on takeoff at Copenhagen Airport. A
fine is in the process of being imposed.
Blue1 violated the night takeoff and landing ban at
Charles de Gaulle Airport outside Paris on two occa-
sions, which may result in MSEK 0.37 in fines. The air-
line was charged MSEK 0.46 in fines in 2006/2007.
Spanair had repeated violations of approach
and takeoff paths, most of which at the airports in
Madrid and Barcelona.
The total amount of fines on airline operations
may amount to MSEK 3-5.
Widerøe reported two deviations from ap-
proach and takeoff paths at Copenhagen Airport.
On several occasions airBaltic exceeded night
and noise limits at Copenhagen. No fines have
been levied on Widerøe or airBaltic.
SAS Technical Services received a further com-
ment regarding pollution at ramp C29 at Copen-
hagen Airport. The cost of cleanup amounted to
MSEK 0.11.
SAS Ground Services reported a leak of 3,500
liters of deicing fluid from defective equipment at
Copenhagen Airport. A requirement by the Danish
Working Environment Authority to improve exhaust
emission control for ground vehicles at Copenhagen
Airport was appealed to a higher body.
SGS Danmark is involved in a case concerning
soil contamination at Copenhagen Airport, ramp
Grejø Syd. Although there is a cleanup plan, the
allocation of expenses is not yet resolved and the
outcome is unclear.
An oil leak was discovered in the water outside
the base in Sola, Norway. SAS has taken action to
determine if the leak stems from the base.
Carbon offsets
In March 2007 SAS launched a carbon offset pro-
gram, enabling customers to purchase CO2 reduc-
tion corresponding to emissions during the flight
concerned. SAS calculates the amount, which is
paid to SAS’s partner CarbonNeutral. From there
the amount goes to energy projects, primarily in
India, New Zealand and Mongolia. Key to SAS’s
decision to offer this to customers was that the en-
tire amount goes to projects that help to reduce
carbon emissions and that the programs are veri-
fied by outside parties. SAS was the second airline
in the world to offer carbon offsets. Since then
around 20 airlines have joined it, and both the IATA
and the AEA are preparing standardized solutions.
So far, sales of carbon offsets have not been
very successful. One reason may be that SAS not
yet launched a simple way to pay via the Internet.
Starting in 2008, all major customers will be of-
fered contractual carbon offsets. Carbon offsets
are purchased for all of SAS’s own business travel.
Purchasing
The SAS Group has numerous subcontractors, man-
ufacturers of everything from disposable articles for
onboard service to aircraft and engines. Negotia-
tions are increasingly coordinated from the Group’s
central purchasing function, through which it is en-
sured that suppliers follow the guidelines in the Code
of Conduct. Suppliers with documented environ-
mental and sustainability work are given priority.
?…that we can fly three times as far on
the same amount of fuel as 40 years
ago
?...that 80 percent of the climate impact
of air transport is related to passenger
flights longer than 1,500 km, for which
there are no realistic alternatives
?...that three-fourths of the aircraft that
will fly in 2025 have not been built yet
3
4
4
The SAS Group’s work on environmentalresponsibility
Airline operations SAS Aviation Services
SAS Med
ia
airB
altic
SASCar
go
SAS Gro
und
Servic
es
SASTe
chnic
al
S
ervic
es
Blue1
Wid
erøe
Scandin
avia
n
A
irlin
es N
orge
Spanai
r
Airlin
esD
anm
ark
Scandin
avia
n
Airlin
esSve
rige
Scandin
avia
n
Airlin
es In
tern
atio
nal
Scandin
avia
n
Corp.
F
unct.
Environmental standards for choosing suppliers
Environmental standards for choosing products
Environmental management system
Environmental policy/targets 5
5 5 5
4
4
4
3
4
4
4
4
4
1 3
4 3
3
4
2
2
2
2
3
4
4
4
3
3
4
4
5Same as 2006 Improvement compared with 2006 Same as 2006 Deterioration compared with 2006
4
4
5
5
5
4
3
3
3
4 4
4
5
5
5
5
5
5
1 = No 2 = Initiated 3 = Partly 4 = Well on the way 5 = Yes
The follow-up of the progress of the SAS Group’s environmental work during the year showed certain advances in efforts to set environme-ntal requirements in choosing suppliers and products and in developing environmental targets and environmental management systems. The ranking system will be reworked in 2008 owing to work on environmental certification.
Did you know...
?...that the aviation industry devotes up
to 15 percent of its operating revenue
to research

106 SAS Group Sustainability Report 2007
CSRGiven what the new Group Management is requir-
ing and given increasing competition, the employ-
ees’ customer focus became more and more im-
portant during the year. Group Management re-
ported on the SAS Group’s history of numerous, if
brief, strikes, above all in Copenhagen, which hit
customers unacceptably hard. It is crucial for all
employees to view the Group’s customers as its
most important asset, and deliveries must always
be reliable and predictable.
The account of the conflicts of the past ten years
led to an extensive debate, but also to soul-search-
ing. After sharp reactions from Group Management
the Danish union leadership promised to work to
prevent wildcat strikes among their members.
A cultural transformation has begun, in order to
create a more responsible attitude toward custom-
ers. A wide-ranging dialog began in late fall be-
tween company management and labor leaders in
Scandinavia. The aim was to define and agree on
the SAS Group’s and employees’ responsibilities
vis-à-vis customers and each other on the basis of
the targets and earnings requirements to be at-
tained. This effort was an important step towards
restoring customer confidence and clarifying roles
and responsibilities among management, employ-
ees and union representatives. p. 7
Restructuring
With the launch of Strategy 2011 a number of or-
ganizational and restructuring processes have
been initiated. These involve employees as well as
their union representatives in an intensive effort.
The aim is greater attention to the Group’s core
business and finding suitable forms of organization
and means of delivery for those operations that do
not help develop the SAS Group’s core activities.
The process is both complicated and resource-in-
tensive, but is needed to boost profitability. The so-
lutions involve structural measures as well as ef-
forts to reduce costs. p. 8
Employees and the working environment
The SAS Group has some categories of employee
with above-average sick leave. The problem is to be
tackled through focused efforts, at both Group level
and in the companies affected. The goal is to reduce
costs for SAS Group companies, while improving the
health and motivation of employees.
A new reporting tool was implemented during
the year to continuously follow sickness statistics
and thus also implement necessary action pro-
grams in the areas required.
Despite this, sick leave rose somewhat com-
pared to 2006 to 6.4 (6.1) %.
To work more methodically on health and work-
ing environment issues in the company, Scandina-
vian Airlines Sverige chose to better integrate its
working environment efforts into its ordinary man-
agement team work during the year.
Scandinavian Airlines Danmark is working to
establish distance workplaces for some company
administrative personnel. This will reduce wasted
time and environmental impacts from commuting
and improve working conditions and efforts for
some categories of personnel.
General agreements were signed for health in-
surance for all employees. Each company decides
for its own operations, and in 2007 all companies
in Norway and Denmark joined. The Swedish com-
panies intend to take out the insurance in 2008.
Work on diversity and gender equality
Work on fundamental value issues continued during
the year in the Scandinavian airlines. In Scandinavian
Airlines Sverige a number of focus areas have been
defined, for which surveys and action plans are be-
ing produced. These included work and parenthood,
working conditions, harassment and victimization,
human resource development and promotions and
pay surveys. This work is every manager’s responsi-
bility. The effects of the survey and action plan will
be reported on an ongoing basis.
Scandinavian Airlines Danmark is participating
in a gender equality project focused on women
managers sponsored by the Welfare Ministry.
Employee surveys
PULS, SAS’s employee survey, was conducted at
the end of the year. The response rate rose by two
percentage points to 72 %.
The overall result for the SAS Group points to an
improved index in most areas. Among them satis-
faction and motivation, management and commu-
nication, one’s own work situation, cooperation and
customer focus and working toward set objectives.
The SAS Group’s sick leave and accident statistics1
SAS Con
sort
ium
Incl
S AIn
tern
atio
nal
Co
rpo
rate
an
dsh
are
dfu
nct
ion
s
Airline operations SAS Aviation Services
SAS Med
ia
airB
altic
SASCar
go
SAS Gro
und
Servic
esSAS
Tech
nical
S
ervic
es
Blue1
Wid
erøe
Scandin
avia
n
A
irlin
es N
orge
Spanai
r
Airlin
esD
anm
ark
Scandin
avia
n
Airlin
esSve
rige
Scandin
avia
n
Average number of employees 3 676 782 2,465 2,188 1,704 3,415 1,358 506 917 6,873 2,422 1,356 37 of which women, % 57 24 44 57 61 38 35 52 54 39 7.0 21 57Total sick leave, % 3.2 1.6 9.2 7.1 8.2 3.0 5.0 8.7 4.0 8.9 4.1 4.3 0Long-term sick leave (more than 59 days), % – 0.6 – – 5.3 – – – – 4.4 2.3 – Sick leave for women, % – 1.1 – – 9.2 – – – – 9.1 5.4 – Sick leave for men, % – 1.3 – – 6.2 – – – – 8.7 4.0 – Sick leave, employees under 30, % – 0.2 – – 3.0 – – – – 6.9 2.7 – Sick leave, employees aged 30–49, % – 2.2 – – 7.7 – – – – 7.9 3.1 – Sick leave, employees aged 50 and over, % – 0.9 – – 9.1 – – – – 10.9 5.3 – Total no. of occup. injuries causing more than 1 day’s sick leave – – 33 53 8 266 – 11 – 238 34 27 0H-value4 – – 8 14 3 43 – 14 – 20 8 12 0
1 Figures may deviate from the financial report. See Accounting principles for sustainability reporting, www.sasgroup.net. 2Covers personnel employed by units in Scandinavia only. 3 Covers persons employed by Swedish units only. 4 Number of occupational injuries per million working hours.
2
2
2
2
3
3
3
3
3
3
3
3
3
3
3
3
3
3
3
3
3
3
3
3
3
3
3
3

107SAS Group Sustainability Report 2007
Executive and human resource development
The SAS Group has around 1,500 managers, of
whom under a thousand have staff with direct cus-
tomer contact. The remainder are middle manag-
ers or senior executives in the Group.
Ten persons have passed the most recent SAS
Management Trainee Program, which comprises
18 months of training with internships in various
positions Group-wide.
During the year the Group performed a Top
Manager Potential Assessment with participants
from all companies. In all, around 120 persons re-
ceived comprehensive feedback and dialog about
themselves. The aim was to better enable individu-
als to manage their careers. At the same time, the
Group obtained documentation for strategically
being able to assess the requirements for provid-
ing good management. The process was based on
a requirement profile that reflects personal at-
tributes and SAS’s business objectives. The as-
sessment focused on individual performance,
potential and ambition.
Recurring skills and occupational training was
carried out for SAS pilots, cabin crew, technicians,
station employees and sales staff in the Group’s
various airlines and support companies.
Cooperation with labor organizations
Since the incorporation, cooperation with labor
organizations has primarily taken place in the vari-
ous Group companies, including in the Group’s
Parent Company, SAS AB, where information is
given to the unions with collective bargaining
agreements with SAS AB. Cooperation takes place
on the basis of the national laws and agreements
applicable to the various Group companies.
Employee representatives from the Scandinavi-
an countries sit on the SAS Group Board. The em-
ployees can elect representatives from companies
in the Group’s Scandinavian operations.
Group Management and company manage-
ments also engaged in special dialog meetings
with labor leaders on the need for increased cus-
tomer focus and a cultural turnaround so that to-
gether they can keep promises to customers and
boost customer loyalty.
Contract negotiations and disputes
In Sweden collective bargaining agreements were
signed for three or more years in all contractual ar-
eas except pilots, for whom contract negotiations
are ongoing. The agreements are at the same level
as the rest of the labor market, i.e., a 10.2% pay
raise to 2010. The agreements for Swedish cabin
crew were preceded by a threatened strike lasting
just over four days and resulting in traffic disrup-
tions and canceled flights.
All agreements for ground staff are so-called
national agreements, where the Swedish Air
Transport Industry Employers’ Association is a
party on the employer’s side. For pilots and cabin
crew the agreements are company agreements,
where SAS is also a party.
In Norway all ground agreements will be rene-
gotiated in 2008 according to the current arrange-
ment, i.e., a new two-year agreement will be
signed for the entire Norwegian labor market for
the period 2008 – 2009.
In Denmark agreements were signed with the
ground unions in force until 2010. These three-
year agreements also include the Danish Cabin At-
tendants Union (CAU) and is within the current
framework for the rest of the Danish labor market.
The signing of the cabin agreement was preceded
by wildcat strikes in March and April, which result-
ed in extensive traffic disruptions and canceled
flights. SAS received conflict compensation from
the Swedish and Danish employers’ associations.
In January 2008 the SAS Group prevailed in the
Labor Court on the issue of violations of collective
bargaining and co-determination agreements in
connection with the transfer of Danish and Swed-
ish short-haul pilots from the SAS Consortium to
Scandinavian Airlines International and Scandina-
vian Airlines Sverige. The Court found that neither
a collective agreement nor a co-determination
agreement existed in the manner claimed by the
pilots’ unions. The pilots’ unions damages claim
for MSEK 15 was rejected by the Labor Court.
Other disputes
Sweden
SAS prevailed in court in the purser case (ap-
pointment of new pursers/cabin supervisors)
on the criteria to apply for appointment.
The case regarding the closure of the Malmö
base (cabin) has not yet been decided.
Norway
The “equal treatment case,” i.e., the working
hours to apply to cabin staff compared with pi-
lots has not yet been settled.
Denmark
A number of pilots from the now discontinued
commuter airline lost their case against SAS to
have seniority principles transferred when they
were moved to Scandinavian Airlines Danmark.
In 2007 SAS was charged with violation of pro-
visions of the Danish Aliens Act concerning the
right of Chinese and Japanese crews to work on
aircraft registered in Denmark.
Code of Conduct and the Global Compact
The Code of Conduct is also an essential part of the
cultural turnaround that SAS Group Management is
giving priority to in Strategy 2011. For that reason
the Code is being reviewed, which is expected to lead
to supplementation and a tightening of the rules to
further underscore the seriousness of SAS’s endeav-
ors to live up to the outside world’s expectations for
social responsibility and ethical behavior. The Code is
being relaunched in 2008 and followed by a compre-
hensive training program at all levels in the Group.
In the same way, all companies and units ad-
here to the ten principles of the UN Global Com-
pact, which are based on the UN Declaration on
Human Rights, the ILO’s Declaration on Funda-
mental Principles and Rights at Work, the UN Rio
Declaration on the Environment and Development
and the UN Convention against Corruption.
The SAS Group joined the Global Compact in
2003 and participates in the Global Compact’s
Nordic Network. One criterion for publishing com-
pany information on the Global Compact website
is an annual audit of material called the Communi-
cation On Progress (COP). The basis for this pub-
lishing is the SAS Group’s work on sustainability
issues, its annual report and the company’s com-
mitment to social issues. The most recent update
of SAS’s information was done in fall 2007.
Humanitarian assistance and sponsorships
The SAS Group cooperated with and sponsored
Save the Children in Scandinavia in the amount of
MSEK 6.8 during the year. This partnership has gone
on since 1998. SAS and Save the Children jointly
carry out local activities in the Scandinavian coun-
tries on the basis of the partnership and the common
values within the framework of the sponsorship
project. Most subsidiaries also have their own com-
munity-related sponsorships or partnerships.
Sponsorships and partnership agreements in
the area of sustainability will increase in impor-
tance and scope in the coming years.
Climate conference in Copenhagen in 2009
Scandinavian Airlines Danmark is deeply involved
in the preparations for the UN climate conference
to be held in Copenhagen in 2009. In connection
with the conference several Group companies will
be involved.
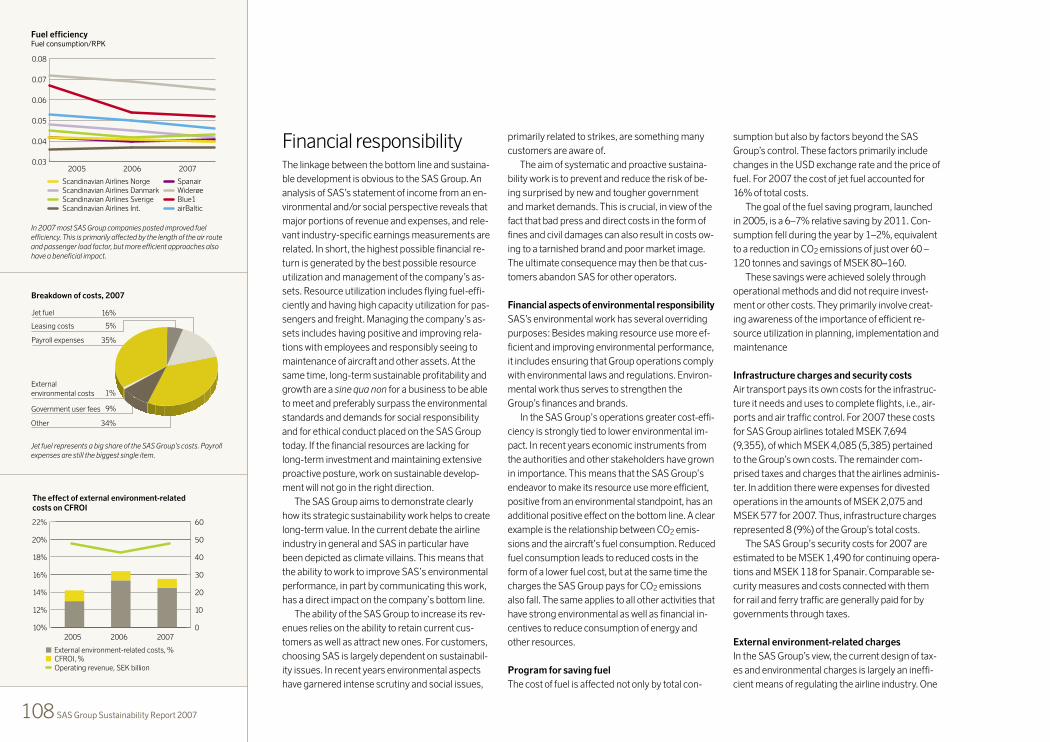
108 SAS Group Sustainability Report 2007
Financial responsibilityThe linkage between the bottom line and sustaina-
ble development is obvious to the SAS Group. An
analysis of SAS’s statement of income from an en-
vironmental and/or social perspective reveals that
major portions of revenue and expenses, and rele-
vant industry-specific earnings measurements are
related. In short, the highest possible financial re-
turn is generated by the best possible resource
utilization and management of the company’s as-
sets. Resource utilization includes flying fuel-effi-
ciently and having high capacity utilization for pas-
sengers and freight. Managing the company’s as-
sets includes having positive and improving rela-
tions with employees and responsibly seeing to
maintenance of aircraft and other assets. At the
same time, long-term sustainable profitability and
growth are a sine qua non for a business to be able
to meet and preferably surpass the environmental
standards and demands for social responsibility
and for ethical conduct placed on the SAS Group
today. If the financial resources are lacking for
long-term investment and maintaining extensive
proactive posture, work on sustainable develop-
ment will not go in the right direction.
The SAS Group aims to demonstrate clearly
how its strategic sustainability work helps to create
long-term value. In the current debate the airline
industry in general and SAS in particular have
been depicted as climate villains. This means that
the ability to work to improve SAS’s environmental
performance, in part by communicating this work,
has a direct impact on the company’s bottom line.
The ability of the SAS Group to increase its rev-
enues relies on the ability to retain current cus-
tomers as well as attract new ones. For customers,
choosing SAS is largely dependent on sustainabil-
ity issues. In recent years environmental aspects
have garnered intense scrutiny and social issues,
primarily related to strikes, are something many
customers are aware of.
The aim of systematic and proactive sustaina-
bility work is to prevent and reduce the risk of be-
ing surprised by new and tougher government
and market demands. This is crucial, in view of the
fact that bad press and direct costs in the form of
fines and civil damages can also result in costs ow-
ing to a tarnished brand and poor market image.
The ultimate consequence may then be that cus-
tomers abandon SAS for other operators.
Financial aspects of environmental responsibility
SAS’s environmental work has several overriding
purposes: Besides making resource use more ef-
ficient and improving environmental performance,
it includes ensuring that Group operations comply
with environmental laws and regulations. Environ-
mental work thus serves to strengthen the
Group’s finances and brands.
In the SAS Group’s operations greater cost-effi-
ciency is strongly tied to lower environmental im-
pact. In recent years economic instruments from
the authorities and other stakeholders have grown
in importance. This means that the SAS Group’s
endeavor to make its resource use more efficient,
positive from an environmental standpoint, has an
additional positive effect on the bottom line. A clear
example is the relationship between CO2 emis-
sions and the aircraft’s fuel consumption. Reduced
fuel consumption leads to reduced costs in the
form of a lower fuel cost, but at the same time the
charges the SAS Group pays for CO2 emissions
also fall. The same applies to all other activities that
have strong environmental as well as financial in-
centives to reduce consumption of energy and
other resources.
Program for saving fuel
The cost of fuel is affected not only by total con-
sumption but also by factors beyond the SAS
Group’s control. These factors primarily include
changes in the USD exchange rate and the price of
fuel. For 2007 the cost of jet fuel accounted for
16% of total costs.
The goal of the fuel saving program, launched
in 2005, is a 6–7% relative saving by 2011. Con-
sumption fell during the year by 1–2%, equivalent
to a reduction in CO2 emissions of just over 60 –
120 tonnes and savings of MSEK 80–160.
These savings were achieved solely through
operational methods and did not require invest-
ment or other costs. They primarily involve creat-
ing awareness of the importance of efficient re-
source utilization in planning, implementation and
maintenance
Infrastructure charges and security costs
Air transport pays its own costs for the infrastruc-
ture it needs and uses to complete flights, i.e., air-
ports and air traffic control. For 2007 these costs
for SAS Group airlines totaled MSEK 7,694
(9,355), of which MSEK 4,085 (5,385) pertained
to the Group’s own costs. The remainder com-
prised taxes and charges that the airlines adminis-
ter. In addition there were expenses for divested
operations in the amounts of MSEK 2,075 and
MSEK 577 for 2007. Thus, infrastructure charges
represented 8 (9%) of the Group’s total costs.
The SAS Group’s security costs for 2007 are
estimated to be MSEK 1,490 for continuing opera-
tions and MSEK 118 for Spanair. Comparable se-
curity measures and costs connected with them
for rail and ferry traffic are generally paid for by
governments through taxes.
External environment-related charges
In the SAS Group’s view, the current design of tax-
es and environmental charges is largely an ineffi-
cient means of regulating the airline industry. One
Scandinavian Airlines NorgeScandinavian Airlines DanmarkScandinavian Airlines SverigeScandinavian Airlines Int.
SpanairWiderøeBlue1airBaltic
Fuel efficiencyFuel consumption/RPK
0.03
0.04
0.05
0.06
0.07
0.08
200720062005
Externalenvironmental costs
Government user fees 9%
1%
Other 34%
Payroll expenses 35%
Leasing costs 5%
Breakdown of costs, 2007
Jet fuel 16%
Jet fuel represents a big share of the SAS Group’s costs. Payroll expenses are still the biggest single item.
In 2007 most SAS Group companies posted improved fuel efficiency. This is primarily affected by the length of the air route and passenger load factor, but more efficient approaches also have a beneficial impact.
External environment-related costs, %CFROI, %Operating revenue, SEK billion
The effect of external environment-relatedcosts on CFROI
10%
12%
14%
16%
18%
20%
22%
0
10
20
30
40
50
60
200720062005

109SAS Group Sustainability Report 2007
reason is that the investment in aircraft and en-
gines is high and long-term, where the lead time
from considering procurement of new equipment
to putting it into service is long. The equipment is
used for such long periods, that it is impossible to
make short-term changes when governments or
airports introduce environmental charges and tax-
es. A number of studies by the ICAO and the EU
confirm this assessment.
The SAS Group’s external environment-related
costs comprise environmental charges and environ-
ment-related charges and taxes. These amounted to
MSEK 414 (477) for 2007. Environmental charges
are meant to cover the costs of special environmen-
tal measures such as noise measurement and noise
insulation of properties near airports. These charges
are linked to the aircraft’s environmental perform-
ance and are included in the landing fee. For 2007
the Group’s environmental charges amounted to
MSEK 43.6 (49.5).
Environment-related charges, too, are often
based on the aircraft’s environmental characteris-
tics and are included in the landing fee. The inten-
tion is to create an incentive to use greener aircraft.
Environmental characteristics would then be a
competitive factor since operators with greener
fleets would have lower costs.
The SAS Group’s environment-related charges
for 2007 were MSEK 29.0 (28.6). Because of its
high proportion of Boeing 737s with low NOx en-
gines, SAS Scandinavian Airlines has lower environ-
mental charges than the majority of its competitors.
The environment-related taxes amounted to
MSEK 341 (399) in 2007. The change is primarily
due to the elimination in 2006 of the Danish pas-
senger tax of MSEK 148. However, the U.K. pas-
senger tax was more than doubled from MSEK 74
to MSEK 154.
Other environment-related costs
The SAS Group’s other environment-related costs
concern e.g., expenses for waste management, puri-
fication plants and costs for the environmental or-
ganization. For 2007 these costs came to MSEK
81.5 (86.5). The reduction is due in part to the reduc-
tion of waste management costs during the year.
Environment-related debts and contingent
liabilities
In 2006 two minor incidents of soil contamination
were identified at Copenhagen Airport attributed to
leaks of oil and diesel. In 2007 SAS was in talks with
the airport owners and the authorities on the clean-
up of the site. The Group was not involved in any en-
vironment-related disputes or complaints and oth-
erwise has no known major environment-related
debts or provisions for ground pollution or the like.
Environment-related investment
SAS has changed the definition of environment-re-
lated investment in this year’s Sustainability Report:
“Investment in assets to prevent, reduce or
repair damage to the environment connected with
business operations and/that are not profitable on
their own financial merits or intended to meet
clearly determined future tightened environmental
standards.”
The reason is the investment made by the SAS
Group in accordance with Group policies shall be
both environmentally and economically sound,
thus helping the Group to grow in value. Also in-
vestment that is not emphasized in this section
may have a positive impact on environmental per-
formance. Investments that can clearly be linked to
structured environmental work are disclosed here.
The most effective measure to improve the
fleet’s environmental performance is to renew the
equipment, investing in aircraft with fuel-efficient
engines with low noise and emissions. This renewal is
going on continuously in SAS Group airlines. Invest-
ment plans and their rationale are found on page 27.
Investment in 2007 in SAS Group airlines
amounted to MSEK 2,683 (2,299), of which MSEK
39.0 (65.7) represented sustainability-related in-
vestment. To reduce infringements of local noise
standards and fines, the SAS Group chose during
the year to invest MSEK 15 in new GPS equipment.
At a total cost of MSEK 24, airBaltic and Scandi-
navian Airlines Norge modified a total of five air-
craft with winglets, calculated to reduce fuel con-
sumption by 2–5%. Similar modifications will take
place of 12 aircraft in Scandinavian Airlines
Norge’s fleet in 2008/2009.
Research and development (R&D)
The SAS Group contributes in many ways to the
emergence of a more sustainable society. Among
them are the Group’s commitment to and support of
the development and dissemination of green tech-
nologies such as for deicing and bio-based jet fuel.
The Group engages in – and to a certain degree
pays for – technology development benefiting the
entire industry. SAS also plays a leading role inter-
nationally in drafting environment-related norms
Environment, 1996 = 100
Social responsibility, 2004 = 100
Image index, environmental and social responsibility
90
95
100
105
110
20072006*20052004
* Partial change in method and new analysis institute from 2006.
Since 1998 sustainable development work has contributed positively to the SAS Group’s image.Results from 2007 show that the image indices for environ-ment and social responsibility fell compared with the previ-ous year, while eco-efficiency and the climate index moved in a positive direction during the year.
Geographical breakdown of employees in 2007
Finland
Sweden 25%
4%
Norway 31%
Denmark 28%
Baltic countries 4%
Other 8%
?Did you know...
...that air transport generates
29 million jobs worldwideEnvironment-related investment (MSEK) 2003 2004 2005 2006 2007
Flight operations 0.0 0.0 22.2 63.3 38.9 Ground operations 8.4 14.3 0.2 2.4 0.1
Total 8.4 14.3 22.4 65.7 39.0Share of the SAS Group’s total investment in % 0.2 0.4 1.2 2.9 1.5
In the past two years investment has been primarily related to GPS systems and winglets for portions of the aircraft fleet.

110 SAS Group Sustainability Report 2007
and standards for air transport. The SAS Group is
represented on a large number of committees,
projects and working groups related to the envi-
ronment and corporate social responsibility in
such bodies as IATA, ICAO, AEA, and N-ALM. The
SAS Group participates in environmental R&D
though a directorship in the Øresund Environment
Academy, an organization for environmental re-
search and cooperation among companies, re-
searchers, and the education sector.
SAS employees are part of the steering group
of the Bodø Graduate School of Business dealing
with environmental economics and of the refer-
ence group for the environmental science pro-
gram at Linköping University. Group employees
are also often in demand as lecturers on environ-
mental and sustainability topics at universities,
colleges, and independent institutes.
Financial aspects of corporate
social responsibility
Consideration is one of the SAS’s core values. This
means that the Group and its employees are ex-
pected to care about customers and coworkers and
to take general social and environmental responsi-
bilities in all parts of operations. In addition, the
Group is to contribute to social progress wherever it
operates and be a respected corporate citizen.
Air transport helps improve labor market condi-
tions in rural Scandinavia and makes business
travel easier to the rest of Europe and to other con-
tinents. Given increasing globalization, airlines fa-
cilitate business and other contacts where efficient
transportation to, from and within the countries is
more or less a prerequisite for economic develop-
ment and progress. The airlines also contribute
expertise and transfers of technology and make
necessary investment in infrastructure.
There are direct as well as indirect financial as-
pects to corporate social responsibility. The efforts
of employees are the crucial factor for the Group’s
earnings, though product offerings and customer
treatment. Direct costs, for example, are repre-
sented by salaries, training expenses, and other
costs for employees. Direct costs also include vari-
ous taxes and charges, plus payments to subcon-
tractors for goods and services. The latter also help
create jobs for subcontracts. Among indirect costs
are the costs of sick leave as well as the taxes em-
ployees and other affected persons pay.
The SAS Group’s contribution to the economy
Airline operations are powerful engines of job crea-
tion. According to an external study, every employ-
ee of Group airlines generates about one additional
job in other industries and companies. This means
that the SAS Group’s operations directly and indi-
rectly employ between nearly 35–40,000 persons
in the Scandinavian countries. They, in turn, pay
around SEK 8 billion in taxes in the three countries.
The same study estimates that the SAS Group’s
operating revenue accounts for 0.6% of Swedish,
0.7% of Danish and 1.1% of Norwegian GDP. Like-
wise, the SAS Group’s other companies have a direct
and indirect impact on the economy in the countries
and communities where the Group operates.
In 2007 the SAS Group paid wages and salaries
totaling MSEK 16,759 (15,101) in continuing opera-
tions, of which social security expenses were MSEK
1,931 (1,796) and pensions MSEK 2,124 (1,631).
Beyond this, the corresponding costs for divested
operations were MSEK 1,701 (13,579), MSEK 278
(574) and MSEK – (53), respectively.
Human resource development
To retain and develop employee skills, extensive
training programs are carried out each year. In
2007, the SAS Group’s total costs for these pro-
grams amounted to MSEK 370 (326), corre-
sponding to around SEK 17,000 per employee.
Payroll expenses
The SAS Group’s attractiveness as an employer is
an aspect of social accountability, and relative pay
is one way to measure this attractiveness. As part
of pay reviews, in 2004 and 2006 SAS had com-
parisons done with similar companies and indus-
tries in the Scandinavian and Northern European
market. In subsequent pay negotiations the com-
pany endeavored to reduce any gaps with market
pay for affected groups.
Costs of sick leave and accidents
Sick leave is affected by a number of factors such
as illness and accidents as well as physically and
mentally stressful working environments. SAS
Group companies employ various methods to pre-
vent short-term and long-term sick leave.
To better monitor and follow up sick leave and
provide data for measures to deal with it, as of 2007
Group Management decided to introduce quarterly
reporting and evaluations of the costs of sick leave.
Reporting includes the direct costs in salaries and
wages paid for nonproductive time, i.e., illness.
On the basis of the Group’s total payroll ex-
penses for continuing operations of MSEK 16,759,
the total costs of sick leave in the SAS Group in
2007 can be estimated to be around MSEK 1,100.
The Group’s sick leave rate rose in 2007 from 6.1%
the previous year to 6.4 %. Compared with similar
industries the SAS Group continues to be above
average, and there is considerable room for im-
provement. Reducing the sick leave rate by one
percentage point would, according to the above
calculations, have a positive earnings impact of
just under MSEK 170.
Sustainability-related business opportunities
and business risks
The SAS Group’s work on sustainable development
is to help identify new business opportunities and
minimize the business risks that operations are sub-
ject to. During the year, the media, opinion makers,
and general public noted climate issues as a major
risk factor. Awareness of the problem and demands
for action may result in policymakers and decision
makers feeling the need to show decisiveness by in-
troducing regulations, taxes, and charges that im-
pose higher costs on air transport, but that do not
necessarily involve developing green solutions.
SAS is taking responsibility for its share of the
costs of its environmental impact by offering travel
on aircraft with good environmental performance
that represents the best economically available
technology. This strategy is expected to result in
the Group eventually seeing lower environment-
related costs than its competitors.
SAS has been working to expand opportunities
for customers to identify and compensate for their
environmental impacts, for example by offering
the chance to buy carbon offsets when booking
travel and with an emission calculator that since
2002 has enabled anyone to figure out their jour-
ney’s environmental impact.
Thanks to SAS’s systematic sustainability work,
the Group has benefited vis-à-vis competitors,
particularly in freight, where since the end of the
1990s SAS has been able to offer independently
examined sustainability information examined by
an independent party.
The risk exposure to terrorist acts has risen sharp-
ly in recent years. Despite the fact that Scandinavia
and SAS’s other home markets have largely been
spared such attacks, a risk still exists that the Group
takes dead seriously. By developing security routines
and systems with high reliability and low inconven-
ience, e.g., using biometric security, SAS endeavors to
offer smoother solutions than its competitors.

111SAS Group Sustainability Report 2007
Business areasSAS Scandinavian Airlines
The business area comprises Scandinavian Air-
lines Norge, Scandinavian Airlines Danmark, Scan-
dinavian Airlines Sverige and Scandinavian Airlines
International.
During the year the positive trend characteriz-
ing the business area’s sustainability work during
the entire 2000s was amplified. Fuel efficiency im-
proved from 0.041 kg/RPK to 0.040 kg/RPK, the
best in the operation’s history. This means that the
CO2 emissions related to this fell further compared
with the previous year.
Scandinavian Airlines Norge
Scandinavian Airlines Norge has 2,465 employees
and accounted for 24% of the Group’s passengers
in 2007. During the year the passenger load factor
rose from 71.9% in 2006 to 72.9%. Fuel efficiency
rose to 0.040 (0.041) kg/RPK. Production meas-
ured in RPK was up nearly 2%, while CO2 emis-
sions fell by 2,500 tonnes. The environmental in-
dex reached 91, a 2 point improvement over 2006.
The target for 2011 is 87.
The airline put two new Boeing 737-700 air-
craft into service during the year. They are
equipped with winglets and tech inserts for the
best possible environmental characteristics.
In 2007 a number of presentations were made
on the environmental impact of air transport and
SAS’s sustainability work and an environmental
conference held for major customers to which the
public and media were also invited. The coopera-
tion with the Bellona Foundation continued
through a new three-year general agreement,
which runs from 2008. The company’s social com-
mitment includes sponsorship of a wide range of
sports and a partnership with Save the Children.
The company has reached a settlement with com-
petition authorities on violations of the Competition
Act that harmed Coast Air on the Oslo-Haugesund
route. Thus, the authorities will refrain from imposing
fines and further legal action. As well as from action in
a similar case concerning the Oslo-Ålesund route.
Scandinavian Airlines Norge lost a case that
was appealed both by the company and Økokrim
concerning the misuse of information from the
carrier Norwegian in the Amadeus reservation
system. The Supreme Court imposed fines of
MSEK 4.6. Norwegian has brought a civil suit in
the district court in the Amadeus case.
Scandinavian Airlines Danmark
In 2007 Scandinavian Airlines Danmark account-
ed for 20% of the Group’s passenger volume and
had 2,188 employees.
Production measured in available tonne kilom-
eters, ATK, was up 8%, with fuel consumption up
2%. The passenger load factor fell to 74.6% from
75%. Fuel consumption was to 0.042 kg/RPK com-
pared with 0.045 kg/RPK for 2006. The environ-
mental index improved by 4 points over the previous
year, reaching 94. The target for 2011 is 87.
The problems with the Q400 were a heavy bur-
den on the airline. Poorer earning capacity and un-
certainty regarding future solutions left their mark
on the year’s efforts, affecting employee and cus-
tomers alike. The aircraft brought in as replace-
ments had more seats than needed, in turn nega-
tively impacting the passenger load factor.
During the year the company decided to join
the Ministry of Climate and Energy’s “One Tonne
Less” campaign, aimed at getting all citizens to re-
duce their CO2 emissions. SAS Danmark is also
involved in the preparations for the UN climate
conference to be held in Copenhagen in 2009.
A large number of companies are participating in
activities coordinated at ministerial level.
The company’ social involvement is growing,
Scandinavian Airlines NorgeIndex
–11target
–05 –06 –07 –08 –09 –10
–11target
–05 –06 –07 –08 –09 –10
100
95
90
85
80
100
95
90
85
80
Scandinavian Airlines Danmark Index
–11target
–05 –06 –07 –08 –09 –10
100
95
90
85
80
100
95
90
85
80
Scandinavian Airlines InternationalIndex
110
105
100
95
90
110
105
100
95
90
Estonian Air Index
100
95
90
85
80
100
95
90
85
80
Scandinavian Airlines SverigeIndex
–11target
–05 –06 –07 –08 –09 –10 –11target
–05 –06 –07 –08 –09 –10
–11target
–05 –06 –07 –08 –09 –10
100
95
90
85
80
100
95
90
85
80
Widerøe Index
100
95
90
85
80
100
95
90
85
80
Blue1Index
100
95
90
85
80
75
100
95
90
85
80
75
airBalticIndex
–11target
–05 –06 –07 –08 –09 –10
–11target
–05 –06 –07 –08 –09 –10
–11target
–05 –06 –07 –08 –09 –10
100
95
90
85
80
75
100
95
90
85
80
75
SpanairIndex
100
95
90
85
100
95
90
85
Environmental index and target scenario for airline operations
Starting in 2007 all environmental indices have
been reformulated according to a new model
with 2005 as the base year. Company targets
have been set in consultation with Group
Management. Targets will be reviews in 2008
based on performance in 2007.

112 SAS Group Sustainability Report 2007
with participation in CARE Danmark, Fonden for
Socialt Ansvar, Danish People’s Aid, the steering
group for women and leadership and the national
police chief’s efforts to prevent sexual exploitation
of children abroad.
Copenhagen Airport has noise restrictions after
11 p.m. To meet this, cut-back routines are used,
which means that the throttle is cut back right after
takeoff. Despite this, there have been infringements.
Scandinavian Airlines Sverige
In 2007 Scandinavian Airlines Sverige accounted
for 15% of Group passenger volume and had
1,704 employees.
The passenger load factor was down to 74.1%
(74.9%), and fuel consumption rose from 0.042
kg/ RPK in 2006 to 0.043 kg/RPK. The environ-
mental index was 95 (95). The target for 2011 is 89.
The airline carried out 1,250 green approaches dur-
ing the year, saving around 150 kg of fuel per flight.
Work to get employees committed to sustainabili-
ty work was stepped up in 2007 on the basis of the
SAS strategy document Strategy 2011. This involves
training and information via the SAS Portal, brochures
and the SAS Certificate. Proof of employee commit-
ment is that 150 suggestions were received in a con-
test to submit ideas for helping the environment.
The dialog with outside stakeholders continued
in a number of areas to improve the chances for suc-
ceeding in sustainable development. These include
discussions on green approaches with Luftfartsver-
ket and with major suppliers and customers.
Regarding social commitment, a number of
local activities were carried out together with Save
the Children.
Scandinavian Airlines International
In 2007 Scandinavian Airlines International ac-
counted for 3% of Group passenger volume and
had 782 employees. The passenger load factor
rose from 85.5% to 85.7%. Fuel consumption
measured in kg/RPK was 0.037, unchanged from
2006. The environmental index was 106 (103).
The target for 2011 is 98.
In December, the world’s first transatlantic green
approac h was performed with one of the unit’s Air-
bus A330s from New York to Arlanda, with big me-
dia coverage. Tests will continue in 2008 and are
expected to result in further cuts in relative fuel con-
sumption. As of 2007 all company aircraft are fitted
with the market’s lowest weight Business Sleepers,
which translates into lower fuel consumption.
For safety reasons, in August an Airbus A330/340
jettisoned 25 tonnes of fuel over the water near Den-
mark and then returned to Copenhagen Airport.
SAS Individually Branded Airlines
Spanair
Spanair had 25% of Group passenger volume and
3,415 employees in 2007.
The passenger load factor was 71.1 (72)%. Fuel
consumption measured in kg/RPK rose from
0.040 in 2006 to 0.041 kg/RPK. The airline’s envi-
ronmental index deteriorated to 98 (94%). The
target for 2011 is 93.
In 2007 Spanair had a number of infringe-
ments of local noise and takeoff rules, resulting in
fines. One noise fine has been paid.
During the year Spanair launched its own envi-
ronmental policy, which focused more on environ-
mental issues through more intensive communi-
cation with employees via the Internet. Work on
the fuel saving program continued and a number
of environmental activities began. These include a
broader energy saving program, waste sorting and
recycling and handling hazardous waste.
Spanair is committed to projects in the community,
including contributions to a number of organizations,
schools and institutions. The airline also supports
and works with the Fair Trade organization Oxfam.
Widerøe
Widerøe had 4% of Group passenger volume and
1,358 employees in 2007. The airline improved its
environmental index from 95 in 2006 to 92. The
target for 2011 is 82. The passenger load factor
rose to 59.2 (56.5)%, and fuel consumption fell to
0.065 (0.069) kg/RPK.
In 2007 the replacement of the old diesel-pow-
ered baggage conveyors with new ones with parti-
cle filters was completed, reducing the environ-
mental impact. At the same time, the diesel-pow-
ered tractors were replaced with electric ones. The
airline also began to use a more efficient system
for approaches that are expected to save fuel.
Blue1
In 2007 Blue1 accounted for 4% of Group passen-
ger volume and had 506 employees. The passenger
load factor was 65.1 (66.4)% and fuel consumption
fell to 0.052 (0.054) kg/RPK. The environmental in-
dex was 89 (89). The target for 2011 is 80.
In the fall a program began to boost fuel efficien-
cy and cut emissions based on the IATA checklist.
Twice in 2007 the airline exceeded the night
restrictions at Charles de Gaulle Airport outside
Paris. The fines have not been set, but are estimated
to total MSEK 0.37. In 2007 Blue1 received an ERA
certificate for its emergency preparedness plan.
airBaltic
Headquartered in Riga, Latvia, airBaltic is 47%-
owned by the SAS Group. The carrier accounted
for 4% of Group passenger volume and had 917
employees in 2007.
The passenger load factor for 2007 rose to 63.0
(60.4)%, while fuel consumption fell to 0.046 (0.050)
kg/RPK. The environmental index reached 83 (89).
KPIs SAS Scandinavian Airlines
Scandinavian Airlines Norge Scandinavian Airlines Danmark Scandinavian Airlines Sverige Scandinavian Airlines Intern.
2007 2006 2005 2007 2006 2005 2007 2006 2005 2007 2006 2005
RPK, mill.1 8,366 8,222 7,717 7,666 7,105 6,972 5,836 5,909 6,016 9,953 10,541 11,249
ASK, mill.1 11,482 11,443 11,013 10,276 9,475 9,947 7,872 7,891 8,448 11,616 12,323 13,079
Passenger load factor, %1 72.9 71.9 70.1 74.6 75.0 70.1 74.1 74.9 71.2 85.7 85.5 86.0
Fuel consumption, kg/RPK 0.040 0.041 0.042 0.042 0.045 0.048 0.043 0.042 0.045 0.037 0.037 0.036
Carbon dioxide (CO2), 1 000 ton 1,056 1,059 1,031 1,022 998 1,065 783 787 859 1,158 1,226 1,290
Nitrogen oxide (NOX), emissions,
1,000 tonnes 3.41 3.49 3.67 4.46 4.35 3.98 2.60 2.70 2.85 6.40 6.74 6.90
Noise impact, km2/85dB(A) at takeoff 2 1.66 1.66 1.64 2.70 2.40 2.70 2.50 2.53 2.51 4.50 4.50 4.13
Environmental index 91 93 100 94 98 100 95 95 100 106 103 100
1 Includes scheduled traffic, charter, ad-hoc flights and bonus trips, etc., which means that the figures may deviate from traffic figures from airline concerned, where only scheduled traffic is reported. 2 Weighted noise contour by number of takeoffs per day by respective aircraft type in the traffic system.

113SAS Group Sustainability Report 2007
The target for 2011 is 76. airBaltic is preparing to
perform an ISO 14001 Gap Analysis in 2008. To
reduce fuel consumption, three Boeing 737–300s
were fitted with winglets, estimated to cut fuel con-
sumption and emissions by 2–5% per aircraft.
The airline has a long-standing partnership
with Riga Technical University, providing intern-
ships for students.
Estonian Air
Based in Tallinn, Estonia, Estonian Air is 49% owned
by the SAS Group. The passenger load factor im-
proved from 62.3 to 67.7 percentage points and
fuel efficiency from 0.045 to 0.041 kg/RPK. The
environmental index improved by 11 points from
94 to 83. Environmental data is not consolidated.
SAS Aviation Services
SAS Ground Services (SGS)
Europe’s third largest provider of passenger and
ramp services on the ground and the SAS Group’s
biggest unit, with 6,873 of employees. SGS oper-
ates at 76 airports in 21 countries and is the big-
gest operator in the three Scandinavian countries.
SGS has extensive local environmental pro-
grams with continuous monitoring and follow-up.
These include water consumption and waste man-
agement and contacts with governments, airline
customers and suppliers.
SGS emphasizes training staff and finding new
solutions that can reduce the risk of injury from the
often physically strenuous work. A key issue is
improving the ergonomics of baggage handling.
In Denmark, in collaboration with Copenhagen Air-
port, FKILogistex and CPH Design, the company
developed an automated baggage handling sys-
tem, the Big Bag Box, which will improve the working
environment. A prototype was presented and has
been patented. Another key area is work clothes, of
great importance for the natural as well as the work-
ing environment. In collaboration with suppliers the
products are continuously being improved.
The Danish Working Environment Authority
has decided that emissions of harmful gases are to
be cut in the terminal area. This requirement was
to have been met by no later than October 1, 2007,
but has been appealed.
SGS measures its environmental performance
by an environmental index. The index fell to 101
(106). The target for 2011 is 95.
SAS Technical Services (STS)
STS, which provides technical aircraft mainte-
nance, has its primary operations in Scandinavia
and had 2,422 employees in 2007. The biggest
customers are Group airlines.
STS accounts for most of the operations in the
Group requiring environment-related permits. STS
is also the biggest user of chemicals and generates
the biggest share of hazardous waste. This is han-
dled by approved waste management companies.
STS’s work to develop its environmental man-
agement system is being reorganized and was not
a priority during the year. STS is part of SAS Facility
Management’s environment and energy program
for all owned and leased properties in the Group.
The company has long-standing cooperation
with suppliers and researchers to find materials
containing less harmful chemicals than those used
till now. STS also has a function primarily tasked
with systematizing and checking all products sus-
pected of being hazardous to human health. STS
measures its environmental performance by an
environmental index with a base year of 2005. The
environmental index for 2007 improved to 93
(99). The target for 2011 is 90.
KPIs SAS Aviation Services
2007 2006 2005
Energy consumption, GWh1 191 200 193
Water consumption, 1,000 m3 1 184 180 164
Unsorted waste, tonnes1 754 545 432
Hazardous waste, tonnes1 494 460 581
Fuel consumption, vehicles,
1,000 liters 3,993 4,144 3,936
Glycol consumption, m3 2,947 3,667 3,954
Total number of employees 10,651 10,565 10,846
1 Data from SAS Facility Management.
KPIs SAS Individually Branded Airlines 1
Spanair Widerøe Blue1 airBaltic
2007 2006 2005 2007 2006 2005 2007 2006 2005 2007 2006 2005
RPK, mill. 2 12,077 12,035 10,672 608 608 565 1,413 1,432 947 2,315 1,538 1,161
ASK, mill. 2 16,981 16,727 15,246 1,028 1,076 1,055 2,169 2,157 1,485 3,674 2,548 2,050
Passenger load factor, % 2 71.1 72.0 70.0 59.2 56.5 51.9 65.1 66.4 63.8 63.0 60.4 56.6
Fuel consumption, kg/RPK 0.041 0.040 0.042 0.065 0.069 0.072 0.052 0.054 0.067 0.046 0.050 0.053
Carbon dioxide (CO2), emissions, 1,000 tonnes 1,574 1,500 1,405 125 132 129 230 249 199 338 242 195
Nitrogen oxide (NOX), emissions, 1,000 tonnes 6.49 6.09 5.63 0.38 0.40 0.38 0.77 0.77 0.51 1.13 0.77 0.67
Noise impact, km2/85dB(A) at takeoff 3 3.86 4.14 4.22 0.34 0.34 0.33 2.22 1.98 1.65 1.22 1.08 1.11
Environmental Index 4 98 94 100 92 95 100 89 89 100 83 89 100
1For definitions, see Accounting principles for sustainability reporting, www.sasgroup.net 2 May include scheduled traffic, charter, ad-hoc flights, and bonus trips, etc., which means that the figures may deviate from traffic figures from airline concerned, where only scheduled traffic is reported. 3 Weighted noise contour by number of takeoffs per day by respective aircraft type in the traffic system. 4 Environmental index consists of aggregate weighted CO2, NOx, noise per RPK.
Environmental index and target scenario
for SAS Aviation Services
SGS and STS measure their environmental
performance using an environmental index
with 2005 as the base year- The companies’
environmental indices include the six most
important production parameters per
weighted landing for SGS and hours worked
for STS.
–11target
–05 –06 –07 –08 –09 –10
SAS Ground ServicesIndex
105
100
95
90
105
100
95
90
–11target
–05 –06 –07 –08 –09 –10
SAS Technical ServicesIndex
100
95
90
85
100
95
90
85

114 SAS Group Sustainability Report 2007
Assurance report To the readers of the SAS Sustainability Report 2007.
We have performed a review of information in
the SAS Sustainability Report 2007. The sus-
tainability reporting includes the SAS Annual
Report and Sustainability Report 2007 as well
as accounting principles, GRI cross reference list
and stakeholder dialogue, found on SAS website
(www.sasgroup.net under “Sustainability”). Our
review did not include the data in the table The
SAS Group’s sick leave and accident statistics
on page 106. The purpose of our review is to
express whether we have found any indications
that the Sustainability Report is not, in all ma-
terial aspects, prepared in accordance with the
stated criteria. The review has been performed in
accordance with FAR SRS standard on indepen-
dent reviews of voluntary separate sustainability
reports (RR6). The SAS Sustainability Report
was approved by SAS’s Corporate Management
in February 2008. The SAS’s Board submitted
the SAS Annual report and Sustainability Report
2007 in March 2008. It is the responsibility of
SAS Corporate Management to organize and in-
tegrate the sustainability related work in the busi-
ness and to report progress in the Sustainability
Report. Our task is to express a report on the
Sustainability Report 2007 based on our review.
The Sustainability Report 2007 is prepared
based on the SAS Principles for Sustainabi-
lity Reporting (www.sasgroup.net) as well as
relevant parts of ”Sustainability Reporting
Guidelines, version 3”, published by The Global
Reporting Initiative (GRI), which are the criteria
against which our review is performed.
The scope of our review procedures included
the following activities:
Discussions with Corporate Management
to gather information on significant events
and activities during the time period that the
Sustainability Report covers, and about the
sustainability related risks and the reporting
on these.
Review of the scope and limitations of the
content of the information in the Sustainability
Report 2007.
Review of SAS’s principles for calculation and
disclosure of sustainability related information.
Review of SAS’s systems and routines of data
registration, accounting and reporting of sus-
tainability related data.
Review of SAS’s systems and routines of data
registration, accounting and reporting of sus-
tainability related data.
Review of underlying documentation, on a
test basis, to assess whether the information
in the Sustainability Report is based on that
documentation.
Review of the external environmental costs,
other environmental costs and environmental
investments.
Review of compliance with laws, permits and
terms/conditions.
Examination of whether the contents of the
Sustainability Report, pages 95-114, contra-
dict the information in the rest of SAS Annual
Report 2007.
Based on our review procedures, nothing has
come to our attention that causes us to believe
that data and information provided in SAS Sus-
tainability Report 2007 have not, in all material
aspects, been prepared in accordance with the
stated criteria.
Stockholm, March 3, 2008
Deloitte ABSvante Forsberg Elisabeth Werneman
Authorized Public Accountant Authorized Public Accountant
SAS Cargo
SAS Cargo had 1,356 employees in 2007 and pro-
vides airfreight services using the operations of Scan-
dinavian Airlines, Blue1, and other partners. Approxi-
mately 70% capacity is in airlines in the SAS Group.
SAS Cargo is certified according to ISO 14001
and 9000, which means that the company has a
management system that addresses quality, envi-
ronmental and sustainability issues. Sustainability
work includes environmental performance, work-
ing environment, ethics and social responsibility.
Almost all personnel have received training in envi-
ronmental and social responsibility matters.
In collaboration with a number of customers and
suppliers, SAS Cargo has developed a system for cal-
culating emissions online, enabling customers to find
out the environmental impact of all kinds of freight
transportation, in the air and on land. SAS Cargo works
continuously to ensure that all activities accord with
the UN Global Compact. There is an ongoing effort to
find a suitable environmental index for SAS Cargo.
Since 2006 SAS Cargo has been the subject of
investigations of collusion. Read more about this on p. 54
SAS Media
SAS Media operates in publishing, media sales,
advertisement production, and design.
All publications are now printed on paper certi-
fied by the Forest Stewardship Council, leading to
a lower environmental impact and lower costs.
SAS Facility Management (SFM)
SAS Facility Management is a subsidiary of the
SAS Group, tasked with managing all owned and
leased properties in Scandinavia. SFM has total
operating responsibility, which also includes envi-
ronmental responsibility.
In its property management SAS Facility Man-
agement has concluded agreements to deal with
obsolete computer equipment, ensuring that it is
sent to developing countries. Facility Management
also has energy-saving campaigns together with
tenants for reduce consumption and costs.

115SAS Group Annual Report 2007
Customer benefits
By cooperating with selected airlines, the SAS
Group can offer a global route and services net-
work. The aim of Star Alliance is to create competi-
tive products for the international traveler. This
primarily takes place through coordination of ser-
vices, airport infrastructure and IT infrastructure.
Star Alliance
Star Alliance was founded in May 1997 by SAS
and four other airlines. In 2007 the SAS Group had
three airlines in the alliance: Scandinavian Airlines,
Spanair and Blue1. Air China and Shanghai Airlines
joined in December 2007. At the end of 2007 the
alliance comprised 20 airlines and three regional
carriers. In 2008 both Turkish Airlines and Egypt
Air are expected to join the alliance. Air India, too,
has been approved for membership within two
years. For key figures, see p. 51
Sustainability
Star Alliance has a partnership with three interna-
tional organizations in the environmental, scien-
tific and cultural sectors. The aim is to act on the
slogan “The airline network for Earth” by taking
responsibility and contributing to economic, social
and environmental sustainability.
Bilateral partnerships
During the year the SAS Group intensified its
cooperation with Shanghai Airlines, Air China and
South African, among others. Each partnership
is unique and is developed with the aim of giving
passengers competitive offerings in the form of
more destinations, smooth travel and the ability to
earn bonus points on a large number of airlines.
Since 1995 Scandinavian Airlines and Lufthansa
have had an extensive joint venture for traffic be-
tween Scandinavia and Germany. This partnership
also continued in 2007.
ECA, the European Cooperation Agreement,
was a joint venture between Scandinavian Airlines,
Lufthansa and the U.K. carrier bmi, in which the
airlines combined their route networks between
London Heathrow and Manchester and the rest
of Europe. The agreement expired at the end of
December 2007. The primary reason for this out-
come was the weak earnings performance of bmi.
Star Alliance & partners
Star Alliance facts
Founded in 1997.
Currently comprises 20 airlines and
three regional carriers.
Flies to 883 destinations in 155 countries.
In 2007 Star Alliance carried 389 million
passengers.

116 SAS Group Annual Report 2007
Aircraft fleet (as of December 31, 2007)
Number of aircraft,
Group total
Number of seats, max.
Max. takeoff weight, tonnes
Max. load, tonnes
Length, meters
Wingspan, meters
Cruising speed, km/h
Range, km
Fuel consumption,
l/seat kilometer
Engine
Airbus
A340-300
7
245
275.0
44.0
63.7
60.3
875
12,800
0.039
CFMI
CFM56-5C4
Airbus
A330-300
4
264
233.0
44.0
63.7
60.3
875
9,700
0.035
RR Trent 772B
Airbus
A321/A319
8/4
198/141
89.0/75.5
21.5/16.7
44.5/33.8
34.1
850
3,000/6,850
0.031/0.027
IAE V2530-A5/
IAE V2524-A5
Boeing
737-600
26
123
59.9
13.0
31.2
34.3
825
2,900
0.044
CFMI
CFM56-7B
Boeing
737-800
13
186
79.0
19.0
39.5
34.3
825
3,700
0.034
CFMI
CFM56-7B
Boeing
MD-81/82
2/34
150
63.5/67.8
14.6/17.1
45.1
32.9
825
1,600/2,700
0.043
P&W JT8D
217C/219
Boeing
MD-87
6
125
63.5
14.8
39.8
32.9
825
3,500
0.048
P&W JT8D
217C
Boeing
737-4/500
4/13
150/120
68.0/60.6
13.5
36.4/31.0
28.9
825
3,150
0.043/0.047
CFMI
CFM56-3C/3
Boeing
737-700
17
141
69.6
15.0
33.6
34.3
825
2,200
0.042
CFMI
CFM56-7B
Fokker
F50
6
50
20.8
4.9
25.3
29.0
520
1,400
0.038
P&W
PW125B
Scandinavian Airlines
Bombardier
Q300
7
50
19.5
5.9
25.7
27.4
528
1,690
0.037
P&W PW123
Bombardier
Q100
17
39
15.6
3.6
22.3
25.9
496
1,280
0.038
P&W PW121
Widerøe
Avro
RJ100/85
2/7
99/84
46.0/42.2
9.5/8.1
31.0/28.6
26.3
750
2,200/2,300
0.050/0.056
Honeywell
LF507-1F
Blue1
Boeing
MD-90
4
166
75.3
18.1
46.5
32.9
825
2,800
0.031
IAE
V2525-D5
Boeing
737-500/300
10/3
126/149
57.0/57.8
13.5/14.8
31.0/32.2
28.9/31.2
825/900
3,150/2,400
0.047/0.040
CFMI CFM56-3
Fokker
F50
8
52
20.8
4.9
25.3
29.0
520
1,400
0.038
P&W
PW125B
airBaltic
Boeing
737-500/300
4/5
113/142
52.4/62.8
49.9/52.9
31.0/33.4
28.9
825
3,150/3,900
0.033/0.028
CFMI
CFM56-3
EstonianAir
airBaltic
Destinations 56
Daily departures 99
Passengers (000) 2,014
13 737-500/300s
13 leased
8 Fokker F50s
8 leased
13 FT W :STAND CLEAR OF
airBalticFokker 50
Estonian Air
Destinations 19
Daily departures 25
Passengers (000) 746
9 737-500/300s
9 leased
Scandinavian Airlines Norge
Destinations 43
Domestic 18
Europe 25
Daily departures 340
Passengers (000) 9,726
Average number of cabin crew * 1,053
Average number of pilots 571
Revenue pass. km (RPK), mill. 6,846
Available seat km (ASK), mill. 9,842
54 737-400/-500/-600/-700/-800s
12 owned, 42 leased
6 Fokker F50s
6 leased
* Of which approx. 160 are hired out to Scandinavian Airlines International/Intercont.
Scandinavian Airlines Danmark
Destinations 51
Domestic 3
Europe 48
Daily departures 271
Passengers (000) 8,110
Average number of cabin crew * 1,231
Average number of pilots 515
Revenue pass. km (RPK), mill. 5,931
Available seat km (ASK), mill. 8,474
12 A321-200/319-100s
4 owned, 8 leased
26 MD-81/-82/-87s
4 owned, 22 leased
16 Q400s**
16 leased
* Of which approx 415 are hired out to Scandinavian Airlines International/Intercont.
** This aircraft type was permanently grounded on October 28, 2007.
Blue1
Destinations 27
Daily departures 74
Passengers (000) 1,798
9 RJ85/100s
9 leased
4 MD-90s
4 leased
FIREACCESS FIREACCESS
Group Company
Widerøe
Destinations 43
Daily departures 264
Passengers (000) 1,964
28 Q100/300/400s*
16 owned, 12 leased
1 SASScandinavian Airlines has four Bombardier CRJ200s, two Avro RJ70s andtwo Avro RJ85s on wet lease agreements. Estonian Air has two SAAB 340As onwet lease agreements. Spanair is reported as a discontinued operation. Spanair’sfleet consists of 34 MD-80s, 22 Airbus A319/A320s and 7 Boeing MD 717s.
Scandinavian Airlines International
Destinations 10
Daily departures 18
Passengers (000) 1,341
Average number of cabin crew * -
Average number of pilots 304
Revenue pass. km (RPK), mill. 9,634
Available seat km (ASK), mill. 11,616
7 A340-300s
2 owned, 5 leased
4 A330-300s
3 owned,1 leased
* Hired in from other carriers in SAS Scandinavian Airlines.
Scandinavian Airlines Sverige
Destinations 57
Domestic 14
Europe 43
Daily departures 193
Passengers (000) 6,224
Average number of cabin crew * 817
Average number of pilots 387
Revenue pass. km (RPK), mill. 4,893
Available seat km (ASK), mill. 6,919
19 737-600/-800s
8 owned, 11 leased
16 MD-81/-82s
16 leased
7 Q400s **
7 leased
* Of which approx 220 are hired out to Scandinavian Airlines International/Intercont.
** This aircraft type was permanently grounded on October 28, 2007.
The SAS Group’s total fleet numbers 260 aircraft 1. The total value of the fleet is SEK 39.4 billion. On average the SAS Group’s total number
of daily departures was 1,260 (1,269).
* This aircraft type was permanently grounded on October 28, 2007.

117
Odessa
Baku
Tbilisi
HurghadaTel Aviv
Almaty
Tashkent
Chisinau
Yerevan
Sochi
Seattle Chicago
New York
TokyoBeijing
Dubai
Bangkok
Washington, D.C.
Simferopol
Dubrovnik
Palanga
Stuttgart
Hanover
Birmingham
Aalborg
Århus
Bologna
Poznan
Arvidsjaur
Luxembourg
Cologne
Nuremberg
Kangerlussuaq
Pristina
Kiev
Bucharest
Budapest
Riga
Munich
Glasgow Moscow
Tallinn
St. Petersburg
Kiruna
Luleå
Umeå
Örnsköldsvik
Östersund
Ängelholm
Helsingborg
Prague
Geneva
Ronneby
Malmö
Kalmar
Växjö
Skellefteå
Sundsvall
Vienna
Zagreb
Istanbul
Split
Kittilä
Rovaniemi
Warsaw
Turku
Tampere
Helsinki
Oulu
Vaasa
Hamburg
Kuopio
Naples
Brussels
Stockholm
Rome
Nice
Zurich
London
Haugesund
Lisbon
Oslo
Amsterdam
Dublin
Milan
Manchester
Kirkenes
Tromsø
Bodø
Bergen
Aberdeen
Alta
Barcelona
Alicante
Palma deMallorca
Malaga
Berlin
FrankfurtParis
Düsseldorf
Stavanger
Longyearbyen
Ålesund
Trondheim
Kristiansand
Molde
Kristiansund
Bardufoss
Sandefjord
Reykjavik
Athens
Chania
Gran Canaria
Madrid
Copenhagen
Tenerife
Gdansk
Bristol
Seville
Venice
Lyon
Cagliari
Palermo
Valencia
Bilbao
Malta
Madeira Ibiza
Visby
Gothenburg
Newcastle
VardøVadsø
BåtsfjordBerlevåg
MehamnHonningsvåg
Lakselv
HammerfestHasvik
Sørkjosen
Svolvær
Stokmarknes
Leknes
Mo i Rana
Brønnøysund
SandnessjøenMosjøen
Rørvik
Namsos
SandaneØrsta/Volda
Førde
Sogndal
Harstad/Narvik
Edinburgh
Bornholm
Andenes Murmansk
Kuressarre
Minsk
Vilnius
BillundKaliningrad
Liepaja
Ventspils
SAS Group route network

Definitions & concepts
AAEA The Association of European Airlines.
Affiliated company Companies where the SAS Group’s holding amounts to at least 20% and at the most 50% or where the SAS Group has a controlling interest.
AOC Air Operator Certificate.
ASK, Available seat kilometers The total number of seats available for passengers multiplied by the number of kilom-eters which they are flown.
ATK, Available tonne kilometers The total number of tonnes of capacity available for the transportation of passen-gers, freight and mail multiplied by the number of kilometers which this capacity is flown.
AV Asset value (adjusted capital employed). Book share-holders’ equity, plus minority interests, plus surplus value in the aircraft fleet, plus 7 times the net annual cost of operat-ing leases for aircraft, plus financial net debt, minus share of equity in affiliated companies. Can also be expressed as the book value of total assets, plus surplus value in the aircraft fleet, plus 7 times the net annual cost of operating leases for aircraft, minus share of equity in affiliated companies, minus noninterest-bearing liabilities and interest-bearing assets, excluding net pension funds.
Available seat kilometers See ASK.
Available tonne kilometers See ATK.
BBlock hours Refers to the time the aircraft leaves the de-parture gate until it arrives at the destination gate.
Book equity Total shareholders’ capital attributable to Par-ent Company shareholders excluding minority interests.
Breakeven load factor The load factor that makes traffic revenue equal to operating expenses.
CCAEP Committee on Aviation Environmental Protection. Specialist group within the ICAO.
CAPEX (Capital Expenditure) Future payments for air-craft on firm order.
Capital employed Total capital according to the balance sheet minus noninterest-bearing liabilities.
Capital employed, market adjusted See AV.
Capitalized leasing costs (x7) The annual cost of operat-ing leases for aircraft multiplied by seven.
Carbon dioxide (CO2) A colorless gas formed during com-
bustion. Carbon dioxide is a greenhouse gas.
Cash flow from operations Cash flow from operating activities before changes in working capital.
CFROI Adjusted EBITDAR in relation to AV.
CO2
See Carbon dioxide.
Code-share When two or more airlines state their flight number in the timetable for one and the same flight, while only one of the airlines operates the flight.
CSI, Customer Satisfaction Index Measures how cus-tomers perceive SAS’s services. Surveys are conducted every six months.
DDebt/equity ratio Financial net debt in relation to share-holders’ equity and minority interests.
Dividend yield, average price Dividend as a percentage of the average share price during the year.
Dow Jones Sustainability Indexes, DJSI Global indexes tracking the financial performance of the leading sustainabil-ity-driven companies worldwide.
EEarnings per share (EPS) Income after tax divided by the total number of shares.
EASA European Aviation Security Agency
EBIT (including capital gains) Operating income.
EBITDA margin EBITDA divided by revenue.
EBITDA, Earnings before depreciation Income before net financial items, tax, depreciation, share of income in affili-ated companies and income from the sale of fixed assets.
EBITDAR margin EBITDAR divided by revenue.
EBITDAR, Earnings before depreciation and leasing cost Operating income before net financial items, tax, deprecia-
tion, share of income in affiliated companies, income from the sale of fixed assets and leasing costs for aircraft.
EBT Income before tax.
ECAC, European Civil Aviation Conference Forum for cooperation between and coordination of European national authorities on civil aviation matters.
EEA European Economic Area
EIRIS Ethical Investment Research Services. Independent analysis organization providing information about the social, environmental and ethical performance of companies.
Equity method Shares in affiliated companies are taken up at the SAS Group ’s share of equity, taking acquired surplus and deficit values into account.
Equity per share Book equity divided by the total number of shares.
Equity/assets ratio Book equity plus minority
interests in relation to total assets.
EV, Enterprise value Average market capitalization (mar-ket value of shareholders’ equity) plus average net debt during the year and 7 times the net annual cost of operating leases for aircraft.
EVA, Equity value added Return over and above the company’s weighted average cost of capital (WACC) times market-adjusted capital.
FFinance leasing Based on a leasing contract where the risks and rewards of ownership of the asset are transferred to the lessee. The asset is reported as a fixed asset in the balance sheet and the commitment to pay future leasing charges is entered as a liability.
Financial net debt Interest-bearing liabilities minus inter-est-bearing assets excluding net pension funds.
Financial net debt, market adjusted (x 7) Financial net debt plus capitalized leasing costs (x 7).
Financial net debt, market adjusted, NPV Financial net debt plus present value of leasing costs for aircraft, NPV.
FTE Full-time equivalent.
GGlobal Compact An appeal by former UN Secretary General Kofi Annan to business and industry to live up to ten principles regarding human rights, labor, anti-corruption and the environment as formulated by the UN.
Gross profit margin Operating income before depreciation in relation to revenue.
IIATA, International Air Transport Association A global association of more than 200 airlines.
ICAO, International Civil Aviation Organization The Unit-ed Nations’ specialized agency for international civil aviation.

Definitions & concepts, continued
Interest coverage ratio Operating income plus financial income in relation to financial expenses.
Interline revenues Ticket settlement between airlines.
IPCC, Intergovernmental Panel on Climate Change Sci-entific panel appointed by the United Nations Environmental Program, UNEP, and the World Meteorological Association, WMO, to assess what is happening to the global climate and the impact of climatic disturbances.
IRR, Internal Rate of Return Discount rate where the present value of a project’s cash flow, from investment to sales, is equal to zero.
JJAA Joint Aviation Authorities
MMarket capitalization at year-end Share price multiplied by the number of outstanding shares.
NNet debt Interest-bearing liabilities minus interest-bearing assets.
Net profit margin Income after financial items in relation to revenue.
Nitrogen oxides (NOx) Formed from all combustion in aircraft engines because the high temperature and pressure cause atmospheric nitrogen and oxygen to react.
Non revenue passengers Passengers traveling on bonus, charter, or ad hoc flights.
NOx See Nitrogen oxides.
NPV, Net present value Used to calculate capitalized future costs of operating leases for aircraft.
OOperating leasing Based on a leasing contract in which the risks and rewards of ownership remain with the lessor and is equivalent to renting. The leasing charges are expensed on a current basis in the statement of income.
PPassenger load factor Relation between RPK and ASK expressed as a percentage. Describes the capacity utilization of available seats. Also called occupancy rate.
P/CE ratio Average share price divided by cash flow per share after paid tax.
P/E ratio Average share price divided by earnings per share after standard tax.
PULS The Swedish acronym for SAS’s employee surveys. The annual survey measures how SAS’s employees perceive their working environment.
RRASK Passenger revenue/ASK.
Regularity The percentage of flights completed in relation to flights scheduled.
Return on book equity after tax Income after tax in rela-tion to average book shareholders’ equity.
Return on capital employed (ROCE) Operating income plus financial income in relation to average capital employed. Capital employed refers to total capital according to the bal-ance sheet minus non-interest-bearing liabilities.
Return on equity Net income for the period attributed to shareholders in the Parent Company in relation to average shareholders’ equity excluding minority interests.
Revenue passenger kilometers (RPK) See RPK.
Revenue tonne kilometers (RTK) See RTK.
RevPAR, Revenue per available room Revenue per available hotel room.
ROCE See Return on capital employed.
ROIC Return on invested capital.
RPK, Revenue passenger kilometers Number of pay-ing passengers multiplied by the distance they are flown in kilometers.
RTK, Revenue tonne kilometers The number of tonnes of paid traffic (passengers, freight and mail) multiplied by the distance this traffic is flown in kilometers.
Runway incursion Any occurrence in the airport runway environment involving an aircraft, vehicle, person, or object on the ground that creates a collision hazard.
SSale and leaseback Sale of an asset (aircraft, building, etc.) that is then leased back.
Sustainable development Development that meets our needs today without compromising the ability of future gen-erations to meet their needs.
TTotal load factor The relation between RTK and ATK expressed as a percentage. The proportion of total available capacity sold and flown.
Total return The sum of change in share price and divi-dends.
TSR, Total shareholder return Average total return.
UUnit cost, operational Airline operations’ total operating expenses minus non-traffic related revenue per ASK.
Unit cost, total Airline operations’ total operating expenses including the capacity cost of aircraft minus non-traffic related revenue per ASK.
Unit revenue (yield) Passenger revenue per RPK.
WWACC, Weighted average cost of capital Average cost of liabilities, shareholders’ equity and operating leases for air-craft. The sources of funds are calculated and weighted in ac-cordance with the current market value of shareholders’ equity and liabilities and the capitalized present value of operating lease costs for aircraft.
Wet lease agreement Leasing in of aircraft including crew.
YYield See Unit revenue.
Production: SAS Group and Wildeco.
Form: Wildeco.
Photographs: SAS Image bank, Vibeke Aronsson et al.
Translations: Amesto Translations AS, Oslo, Norway.
Printing: Jernström Offset.
Environmentally firendly paper: Galerie Art Matt.
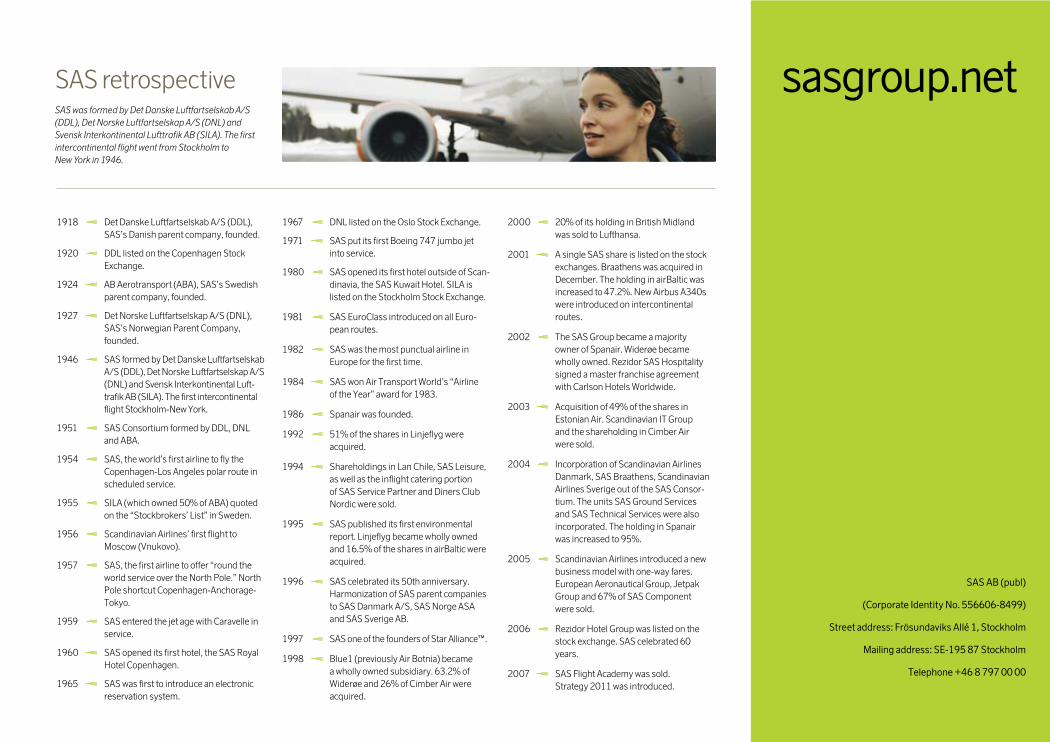
sasgroup.net
SAS AB (publ)
(Corporate Identity No. 556606-8499)
Street address: Frösundaviks Allé 1, Stockholm
Mailing address: SE-195 87 Stockholm
Telephone +46 8 797 00 00
1918 Det Danske Luftfartselskab A/S (DDL),
SAS’s Danish parent company, founded.
1920 DDL listed on the Copenhagen Stock
Exchange.
1924 AB Aerotransport (ABA), SAS’s Swedish
parent company, founded.
1927 Det Norske Luftfartselskap A/S (DNL),
SAS’s Norwegian Parent Company,
founded.
1946 SAS formed by Det Danske Luftfartselskab
A/S (DDL), Det Norske Luftfartselskap A/S
(DNL) and Svensk Interkontinental Luft-
trafik AB (SILA). The first intercontinental
flight Stockholm-New York.
1951 SAS Consortium formed by DDL, DNL
and ABA.
1954 SAS, the world’s first airline to fly the
Copenhagen-Los Angeles polar route in
scheduled service.
1955 SILA (which owned 50% of ABA) quoted
on the “Stockbrokers’ List” in Sweden.
1956 Scandinavian Airlines’ first flight to
Moscow (Vnukovo).
1957 SAS, the first airline to offer “round the
world service over the North Pole.” North
Pole shortcut Copenhagen-Anchorage-
Tokyo.
1959 SAS entered the jet age with Caravelle in
service.
1960 SAS opened its first hotel, the SAS Royal
Hotel Copenhagen.
1965 SAS was first to introduce an electronic
reservation system.
1967 DNL listed on the Oslo Stock Exchange.
1971 SAS put its first Boeing 747 jumbo jet
into service.
1980 SAS opened its first hotel outside of Scan-
dinavia, the SAS Kuwait Hotel. SILA is
listed on the Stockholm Stock Exchange.
1981 SAS EuroClass introduced on all Euro-
pean routes.
1982 SAS was the most punctual airline in
Europe for the first time.
1984 SAS won Air Transport World’s “Airline
of the Year” award for 1983.
1986 Spanair was founded.
1992 51% of the shares in Linjeflyg were
acquired.
1994 Shareholdings in Lan Chile, SAS Leisure,
as well as the inflight catering portion
of SAS Service Partner and Diners Club
Nordic were sold.
1995 SAS published its first environmental
report. Linjeflyg became wholly owned
and 16.5% of the shares in airBaltic were
acquired.
1996 SAS celebrated its 50th anniversary.
Harmonization of SAS parent companies
to SAS Danmark A/S, SAS Norge ASA
and SAS Sverige AB.
1997 SAS one of the founders of Star Alliance™.
1998 Blue1 (previously Air Botnia) became
a wholly owned subsidiary. 63.2% of
Widerøe and 26% of Cimber Air were
acquired.
2000 20% of its holding in British Midland
was sold to Lufthansa.
2001 A single SAS share is listed on the stock
exchanges. Braathens was acquired in
December. The holding in airBaltic was
increased to 47.2%. New Airbus A340s
were introduced on intercontinental
routes.
2002 The SAS Group became a majority
owner of Spanair. Widerøe became
wholly owned. Rezidor SAS Hospitality
signed a master franchise agreement
with Carlson Hotels Worldwide.
2003 Acquisition of 49% of the shares in
Estonian Air. Scandinavian IT Group
and the shareholding in Cimber Air
were sold.
2004 Incorporation of Scandinavian Airlines
Danmark, SAS Braathens, Scandinavian
Airlines Sverige out of the SAS Consor-
tium. The units SAS Ground Services
and SAS Technical Services were also
incorporated. The holding in Spanair
was increased to 95%.
2005 Scandinavian Airlines introduced a new
business model with one-way fares.
European Aeronautical Group, Jetpak
Group and 67% of SAS Component
were sold.
2006 Rezidor Hotel Group was listed on the
stock exchange. SAS celebrated 60
years.
2007 SAS Flight Academy was sold.
Strategy 2011 was introduced.
SAS retrospectiveSAS was formed by Det Danske Luftfartselskab A/S
(DDL), Det Norske Luftfartselskap A/S (DNL) and
Svensk Interkontinental Lufttrafik AB (SILA). The first
intercontinental flight went from Stockholm to
New York in 1946.