young people s reading final report
TRANSCRIPT

7/27/2019 Young People s Reading FINAL REPORT
http://slidepdf.com/reader/full/young-people-s-reading-final-report 1/60
Children’s and Young People’sReading Today
Findings from the 2011 National LiteracyTrust’s annual survey
Christina ClarkNational Literacy Trust
2012
7/27/2019 Young People s Reading FINAL REPORT
http://slidepdf.com/reader/full/young-people-s-reading-final-report 2/60
© National Literacy Trust Children’s and Young People’s Reading Today 2012
2
This report is the property of the National Literacy Trust and is protected by copyright law.
The National Literacy Trust will consider requests to use extracts or data from this publicationprovided that you:
• Acknowledge that the content is the work of the National Literacy Trust and provide
appropriate references in any publications or accompanying publicity;
•
Anonymise all data to protect the identity of any individual or organisation; • State that any views expressed are yours and not necessarily those of the National
Literacy Trust.
Suggested reference for this report is: Clark, C. (2012). Children’s and Young People’s Reading
Today. Findings from the 2011 National Literacy Trust’s annual survey. London: National
Literacy Trust.
7/27/2019 Young People s Reading FINAL REPORT
http://slidepdf.com/reader/full/young-people-s-reading-final-report 3/60
© National Literacy Trust Children’s and Young People’s Reading Today 2012
3
Acknowledgements
We would like to thank the pupils and staff at the following schools without whom this studywould not have been possible:
Aberllechau Primary School; Aldworth Science College; Armthorpe Tranmoor Primary School;
Ashton-on-Mersey School; Aston Tower Primary School; Barrowford School; BelmontCommunity School; Berry Hill Primary School; Birdwell Primary School; Boclair Academy;Boston Spa School; Brighton Avenue; Bromstone Primary School; Brookside Junior School;Cantell Maths & Computing College; Carlton Bolling College; Cawston Primary School; Christthe King Primary School; Claregate Primary School; Clavering Primary School; Connah's QuayHigh School; Cramlington Learning Village School; Cranfield VC Lower School; Dagenham ParkC of E School; Dereham Neatherd High School; Downlands Community School; Drayton ManorHigh School; East Coker Primary School; Engayne Primary School; Farnsfield St Michael'sPrimary School; Fearnhill School; Fellgate Primary School; Field Lane J I & N School; ForestersPrimary School; Fullbrook Academy; Goffs School; Gravesend Grammar School; Hall GreenSecondary School; Hall Mead School; Hallbankgate Village School; Hampton Dene PrimarySchool; Haywood Engineering College; Highfield Primary School; Hilldene Primary School;
Holloway School; Houghton Kepier Sports College; Hounsdown School; Irlam Endowed PrimarySchool; Isle of Sheppey Academy; John Henry Newman Catholic College; Landau ForteAcademy QEMS; Leiston High School; Long Sutton Primary School; Lord Grey School;Lordswood Girls' School and the Sixth Form Centre School; Lurgan High School; LutterworthHigh School; Mappleborough Green CE Primary School; Marshalls Park School; Meden School;Mile Oak Primary School; Monk's Walk School; Mount Grace School; Murray Park School;Northgate Primary School; Oakbank School; Oakfield Pupil Referral Unit; Old Palace of JohnWhitgift School; Orchard School Bristol; Our Lady of Mount Carmel Catholic Primary School;Pangbourne College; Parish Church CE Junior School; Park Junior School; Paston RidingsSchool; Penmorfa Primary School; Pirbright Village Primary School; Poole High School; QueenMargaret Academy; Queen's Drive Primary School; Rawcliffe Primary School; Richard Rose
Morton Academy School; Risedale Community College; Robert Pattinson School; SackvilleSchool; Scargill Junior School; Selby High School; Settlebeck School; Shebbear College; Sheringham Community Primary School; Shuttleworth College School; Siddal Moor SportsCollege; Sir William Stanier Community School; St Andrew's CE High School for Boys; StAnne's Academy; St Edmunds Catholic School; St Edward's Church of England school; St IvoSchool; St James Hatcham CE Primary School; St. Luke's Science & Sports College; St Mary'sCatholic School; St Patrick's Catholic Primary School; St. Peter's C of E Primary; St SwithunWells Catholic Primary School; St Whites Primary School; St. Peter's C of E Primary; St.Michael's Primary School; The Basildon Academies; The Campion School; The ColeshillSchool; The Knights Templar School; The Littlehampton Academy; The Venerable Bede C of ESchool; Thorpe St Andrew School; Tile Hill Wood School and Language College; Tolworth Girls'School; Trinity Primary School; University Academy Keighley; Victoria School Jersey; Walbottle
Campus School; West Hill Primary School; Westover Green Community School; Woking HighSchool; Worksop Priory CE Primary School & Nursery; Worle Community School; WreayChurch of England Primary School
Our sincere thanks to Slaughter and May for their generous financial contribution that enabledus to conduct this annual survey.

7/27/2019 Young People s Reading FINAL REPORT
http://slidepdf.com/reader/full/young-people-s-reading-final-report 4/60
© National Literacy Trust Children’s and Young People’s Reading Today 2012
4
Table of contents
Acknowledgements ....................................................................................................................3Tables and figures...................................................................................................................... 5Introduction ................................................................................................................................ 7Key findings................................................................................................................................ 8
A look at some key issues in 2011 .......................................................................................... 8A look at some key issues ...................................................................................................... 9
Some literacy trends........................................................................................................... 9Girls are keener readers than boys...................................................................................11The challenge – KS4 pupils .............................................................................................. 13An even bigger challenge – Teenage boys and reading.................................................... 15But let us not forget about teenage girls............................................................................ 15The link between reading and socioeconomic background............................................... 16Ethnic background and reading – The challenge for young White people......................... 17Why does it matter whether young people enjoy reading or read frequently? ................... 18Linking reading and writing ............................................................................................... 22
Children’s and Young People’s Reading Today – Data tables.................................................. 23
Young people’s enjoyment of reading ................................................................................... 24Young people’s self-reported reading ability.......................................................................... 25Types of materials read outside of class...............................................................................26Media formats young people read ........................................................................................ 29How often young people read...............................................................................................30How often young people read...............................................................................................32Young people’s attitudes towards reading............................................................................. 35
Children’s and Young People’s Reading Today – Attainment data ............................................ 43Reading attainment and young people’s enjoyment of reading............................................. 43Reading attainment and young people’s self-perceived reading ability ................................. 44Reading attainment and the length of time young people spend reading.............................. 45
Reading attainment and the length of time young people spend reading.............................. 46Reading attainment and young people’s reading choices ..................................................... 46Reading attainment and young people’s reading media ....................................................... 48Reading attainment and number of books read a month ...................................................... 49Reading attainment and young people’s attitudes towards reading ...................................... 50
Children’s and Young People’s Reading Today – Comparisons with 2010............................... 53Enjoyment of reading – Comparative analyses 2010 and 2011............................................. 53Reading frequency – Comparative analyses 2010 and 2011 ................................................ 53Reading length – Comparative analyses 2010 and 2011 ...................................................... 54Types of reading done outside of class – Comparative analyses 2010 and 2011.................. 55Attitudes towards reading – Comparative analyses 2010 and 2011 ...................................... 56
Appendix A: An introduction to the annual literacy survey ........................................................ 57
Appendix B: Methodology......................................................................................................... 58Participation rate................................................................................................................... 58
Appendix C: Sample characteristics ......................................................................................... 59
7/27/2019 Young People s Reading FINAL REPORT
http://slidepdf.com/reader/full/young-people-s-reading-final-report 5/60
© National Literacy Trust Children’s and Young People’s Reading Today 2012
5
Tables and figures
Table 1: Enjoyment of reading and reading attainment (N = 7,000).......................................... 18 Table 2: Reading frequency and reading attainment (N = 7,000).............................................. 19 Table 3: Percentage agreement and disagreement with attitudinal items and reading attainment(N = 7,000) ............................................................................................................................... 19 Table 4: Relationship between reading frequency and reading length..................................... 20 Table 5: Comparing young people who enjoy reading and those who do not in terms of theirreading frequency and self-perceived reading ability................................................................ 21 Table 6: Comparing young people who enjoy reading and those who do not in terms of someattitudes towards reading ......................................................................................................... 21 Table 7: Reading attainment and writing attainment................................................................. 22 Table 8: Enjoyment of reading in 2011 for whole sample and broken down by demographicbackground .............................................................................................................................. 24 Table 9: Self-reported reading ability in 2011 for whole sample and broken down bydemographic background......................................................................................................... 25 Table 10: Types of materials read at least once a month in 2011 for whole sample and brokendown by demographic background (Part 1) .............................................................................. 26 Table 11: Types of materials read at least once a month in 2011 for whole sample and brokendown by demographic background (Part 2) .............................................................................. 28 Table 12: Reading media in 2011 for whole sample and broken down by demographicbackground .............................................................................................................................. 29 Table 13: Reading frequency in 2011 for whole sample and broken down by demographicbackground .............................................................................................................................. 30 Table 14: Reading length in 2011 for whole sample and broken down by demographicbackground .............................................................................................................................. 32 Table 15: Number of books read in the last month in 2011 for whole sample and broken downby demographic background ....................................................................................................33 Table 16.1: Attitudes towards reading in 2011 for whole sample and broken down by
demographic background – The more I read, the better I become............................................ 35
Table 16.2: Attitudes towards reading in 2011 for whole sample and broken down bydemographic background – I prefer watching TV to reading..................................................... 36 Table 16.3: Attitudes towards reading in 2011 for whole sample and broken down bydemographic background – Reading is cool ............................................................................. 37 Table 16.4: Attitudes towards reading in 2011 for whole sample and broken down bydemographic background – I don’t read as well as other pupils in my class ............................. 38 Table 16.5: Attitudes towards reading in 2011 for whole sample and broken down bydemographic background – I only read when I have to............................................................. 39 Table 16.6: Attitudes towards reading in 2011 for whole sample and broken down bydemographic background – I cannot find things to read that interest me.................................. 40 Table 16.7: Attitudes towards reading in 2011 for whole sample and broken down by
demographic background – I would be embarrassed if my friends saw me read ...................... 41 Table 16.8: Attitudes towards reading in 2011 for whole sample and broken down bydemographic background – Reading is more for girls than boys............................................... 42 Table 17: Enjoyment of reading and reading attainment (N = 7,000)........................................ 43 Table 18: Reading attainment and enjoyment of reading (N = 7,000) ....................................... 44 Table 19: Self-perceived reading ability and reading attainment (N = 7,000) ............................ 44 Table 20: Reading attainment and self-perceived reading ability (N = 7,000) ........................... 44 Table 21: Reading frequency and reading attainment (N = 7,000)............................................ 45 Table 22: Reading attainment and reading frequency (N = 7,000)............................................ 45 Table 23: Reading length and reading attainment (N = 7,000).................................................. 46 Table 24: Reading attainment and reading length (N = 7,000).................................................. 46 Table 25: Types of materials read outside of class at least once a month and reading attainment
(N = 7,000) ............................................................................................................................... 47 Table 26: Reading attainment and types of materials read outside of class at least once a month(N = 7,000) ............................................................................................................................... 48
7/27/2019 Young People s Reading FINAL REPORT
http://slidepdf.com/reader/full/young-people-s-reading-final-report 6/60
© National Literacy Trust Children’s and Young People’s Reading Today 2012
6
Table 27: Reading media and reading achievement (N = 7,000) .............................................. 48 Table 28: Reading attainment and reading media (N = 7,000).................................................. 49 Table 29: Number of books read a month and reading attainment (N = 7,000)......................... 49 Table 30: Reading attainment and number of books read a month (N = 7,000)........................ 50 Table 31: Percentage agreement and disagreement with attitudinal items and readingattainment (N = 7,000)..............................................................................................................51 Table 32: Reading attainment and attitudes towards reading (N = 7,000)................................. 52 Table 32 continued...................................................................................................................52 Table C1: Sample age.............................................................................................................. 59 Table C2: Ethnic background ...................................................................................................59
Figure 1: Proportion of young people who enjoy reading either very much or quite a lot 2005 to2011........................................................................................................................................... 9 Figure 2: Proportion of young people who read daily 2005 to 2011 .......................................... 10 Figure 3: Proportion of young people reading different reading materials outside of class in 2005and 2011.................................................................................................................................. 10 Figure 4: Proportion of boys and girls who enjoy reading either very much or quite a lot in 2010and 2011 (with reference to 2005 data too) .............................................................................. 11 Figure 5: Proportion of boys and girls who read daily 2010 and 2011 (with reference to 2005data too)................................................................................................................................... 12 Figure 6: Proportion of pupils from each key stage who enjoy reading either very much or quitea lot in 2010 and 2011.............................................................................................................. 13 Figure 7: Access to technology by key stage............................................................................ 14 Figure 8: Enjoying reading either very much or quite a lot by FSM uptake in 2010 and 2011(with reference to 2005 data too).............................................................................................. 16 Figure 9: Daily reading by FSM uptake in 2010 and 2011 (with reference to 2005 data too) .... 17 Figure 10: Model of influence, with bolder paths indicating stronger relationships .................... 22 Figure 11: Reading enjoyment in 2010 and 2011 ..................................................................... 53 Figure 12: Reading frequency in 2010 and 2011...................................................................... 54 Figure 13: Reading length in 2010 and 2011............................................................................ 54 Figure 14: Types of materials read outside of class at least once a month in 2010 and 2011... 55 Figure 15: Attitudes towards reading in 2010 and 2011............................................................ 56
7/27/2019 Young People s Reading FINAL REPORT
http://slidepdf.com/reader/full/young-people-s-reading-final-report 7/60
© National Literacy Trust Children’s and Young People’s Reading Today 2012
7
Introduction
This research was funded by law firm Slaughter and May and carried out with 21,000 childrenand young people across the UK. One of its key findings is that children and young people arereading less as their lives get more crowded.
In 2005 we found that four young people in 10 read daily outside of class. This research carriedout at the end of 2011 found that only three young people in 10 now read daily in their own time.However, the number of children and young people who enjoy reading very much or quite a lothas remained static since 2005 (50% today vs 51% in 2005). These findings together suggest aclear issue with children’s and young people’s leisure time with many children and young peopleenjoying reading but pushing it out in favour of other activities. The research found that:
• More than a fifth of children and young people (22%) rarely or never read in their owntime
• More than half (54%) prefer watching TV to reading• Nearly a fifth (17%) would be embarrassed if their friends saw them reading
• 77% of children and young people read magazines in 2005 now just 57% do, comicreading has dropped from 64% to 50%, reading on websites from 64% to 50%
We believe it is essential to make the time for children and young people to read as theresearch also shows a clear link between reading outside of class and their achievement. Itfound that young people who read outside of class daily were 13 times more likely to readabove the expected level for their age.
We hope this research will increase interest in children’s and young people’s reading habits andencourage government, families and those working with children and young people to helpmake reading part of a young person’s daily activities.
7/27/2019 Young People s Reading FINAL REPORT
http://slidepdf.com/reader/full/young-people-s-reading-final-report 8/60
© National Literacy Trust Children’s and Young People’s Reading Today 2012
8
Key findings
This report outlines findings about young people’s reading from our second annual literacysurvey1 conducted in November/December 2011. Nearly 21,000 young people aged 8 to 16participated. Download last year’s survey here:http://www.literacytrust.org.uk/assets/0001/1393/Omnibus_reading_2010.pdf
A look at some key issues in 2011
1For more information about our annual literacy survey see Appendix A, p. 58.
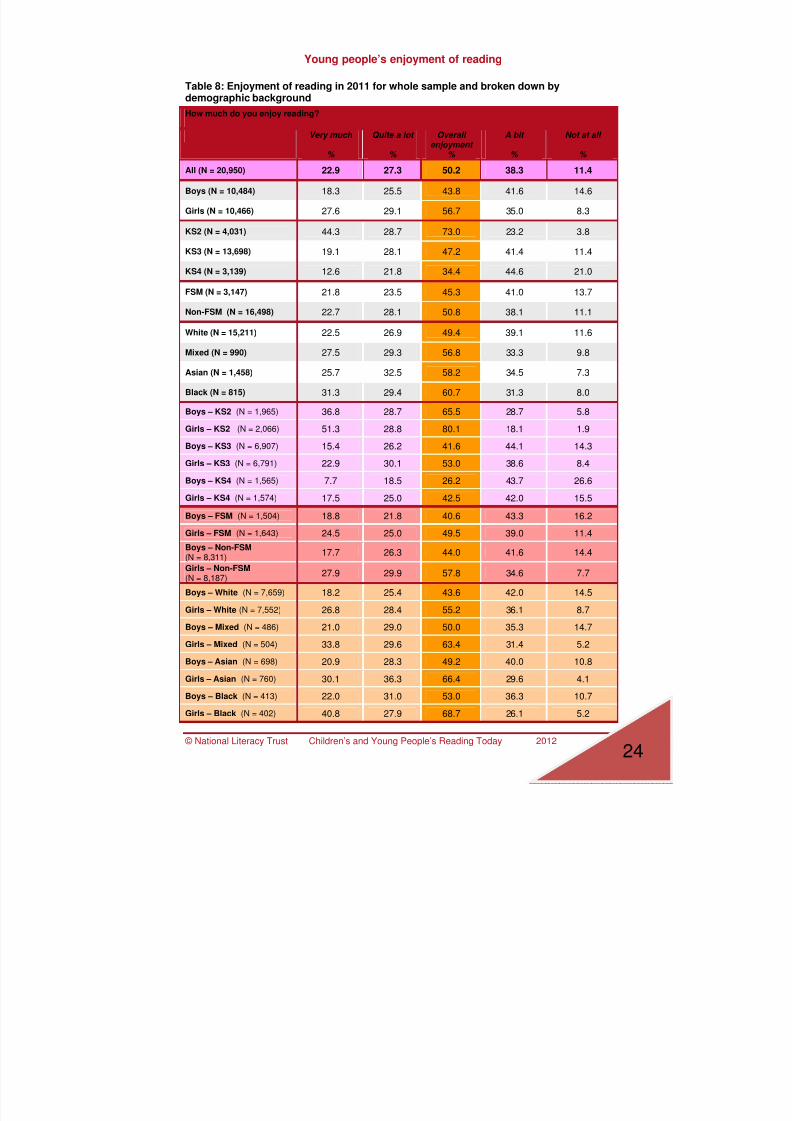
• 50% of young people enjoy reading either “very much” or “quite a lot”; 10% ofyoung people do not enjoy reading at all and 38% only enjoy reading “a bit” (see
Table 8, p. 24).
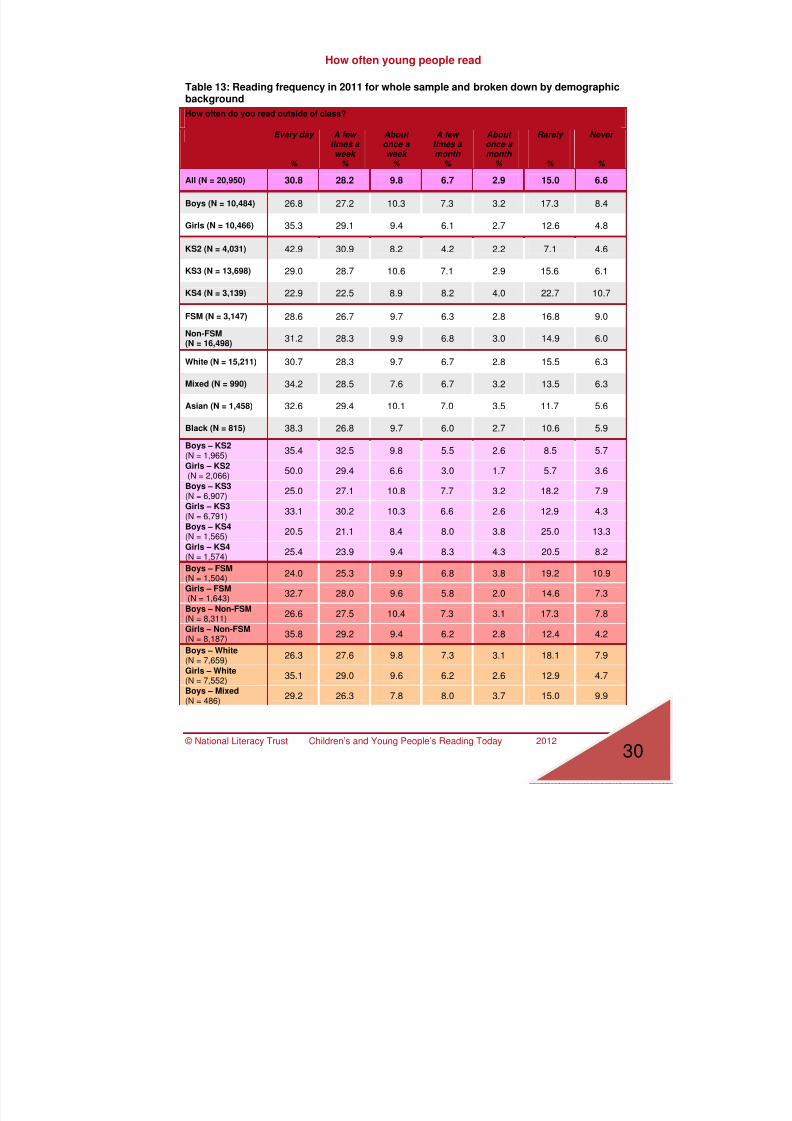
• 30.8% of young people read outside of class every day, with another 28.2%reading a few times a week. However, 21.6% of young people say that they rarelyor never read outside of class (see Table 13, p. 30).
• In 2005 77% of children read magazines, now just 57% do, comic readingdropped from 64% to 50% and reading on websites dropped from 64% to 50%(see Figure 3, p.10).
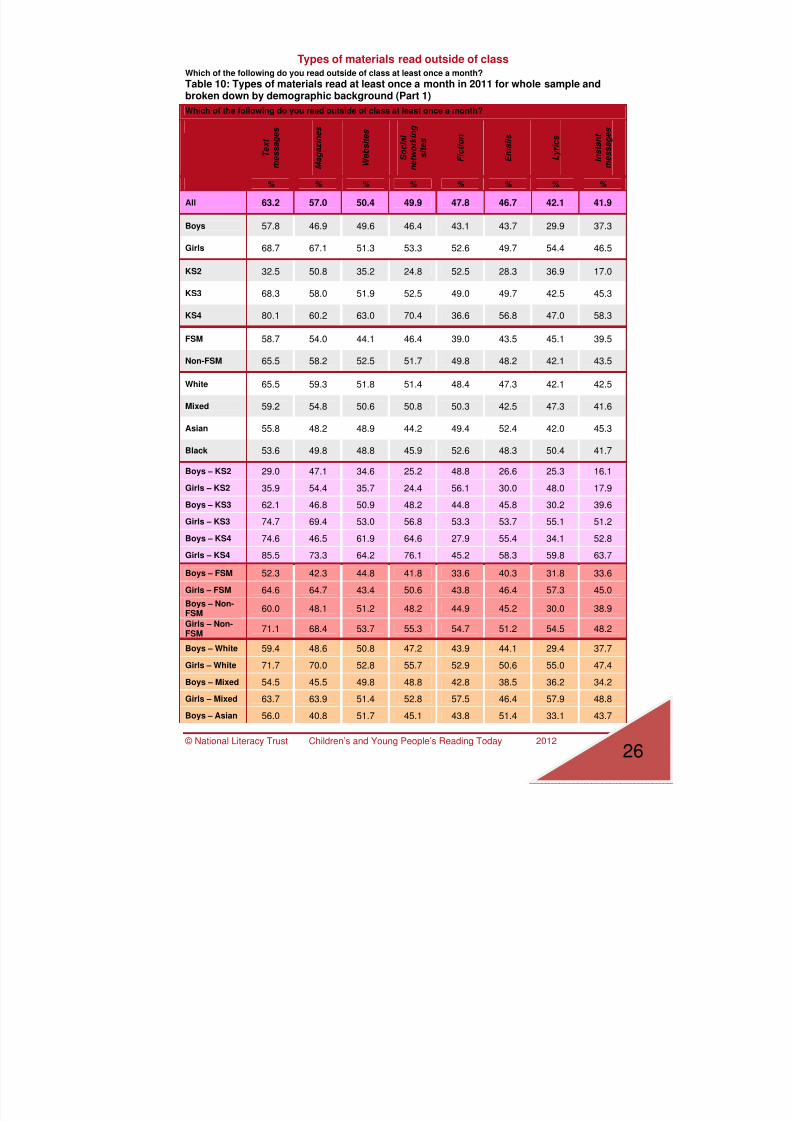
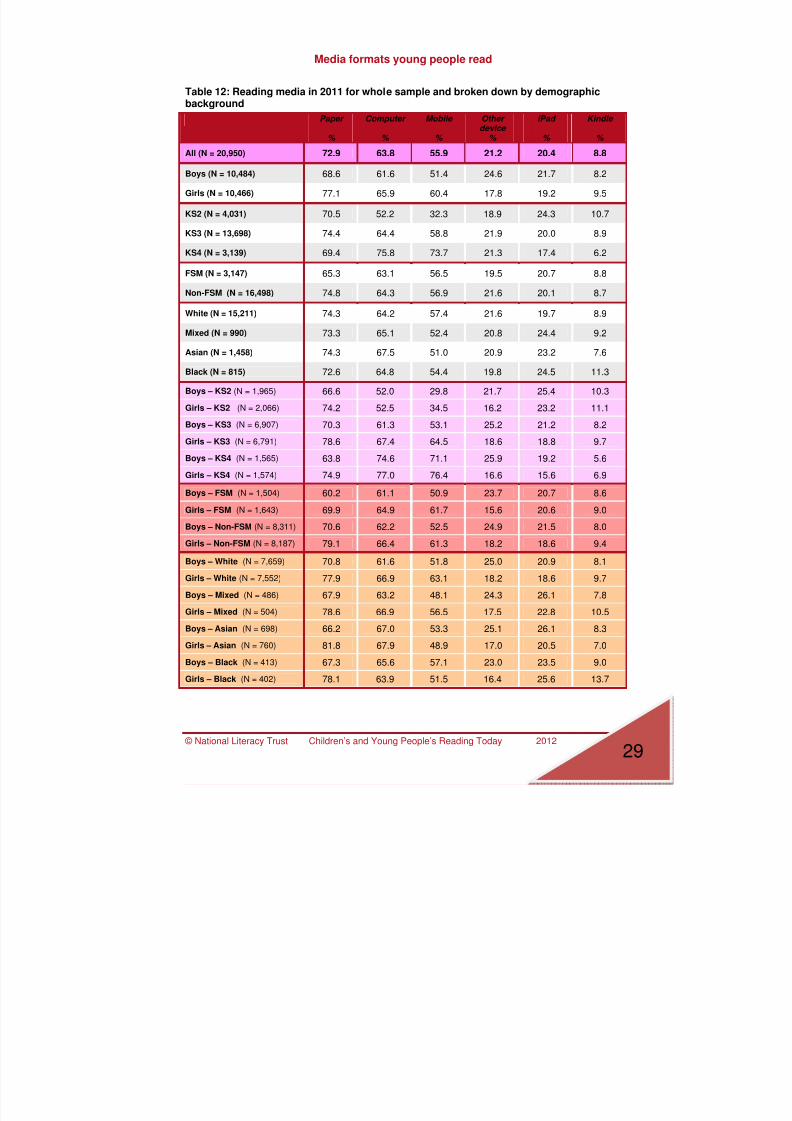
• Technology-based formats, such as text messages (63.2%), websites (50.4%)and messages on social networking sites (49.9%) are most commonly readmaterials outside of class at least once a month. Magazines (57.0%) and fiction(47.8%) are the most common non-technology reading choices (see Table 10, p. 26).
• 72.9% of young people read paper-based materials, while 63.8% read using acomputer and 55.9% read on their mobile phone. 20.4% of young people say thatthey read using an iPad, while 21.1% read using other electronic devices. Only8.8% of young people say that they read using a Kindle (see Table 12, p. 29). Mostyoung people (62%) say that they read paper-based materials as well as at leastone technology-based medium. Only 17.8% say that they just read paper-based
texts, while a fifth (20.2%) say that they do not read any paper-based texts at all.
• Young people who read outside of class daily are 13 times more likely to readabove the expected level for their age (see Table 2, p. 19).
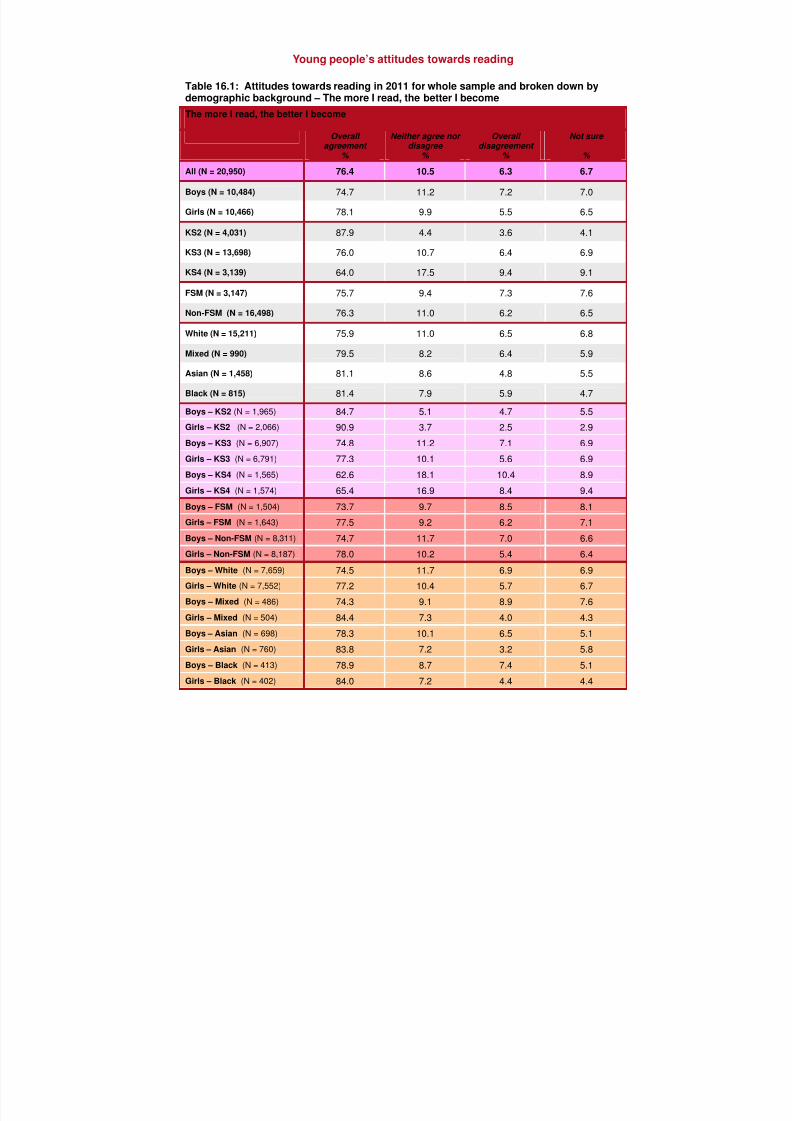
• Many young people thought positively about reading (see Tables 16.1 to 16.8, pp. 36).76.4% agree that “the more I read, the better I become”, and 33.5% agree that“reading is cool”. However 27.2% agree that “I don’t read as well as other pupilsin my class”, 26.5% of young people agree that “I only read when I have to” and26.5% agree that “I find things to read that interest me”. 17.4% of young peopleagree that “I would be embarrassed if friends saw me read”. However, more than
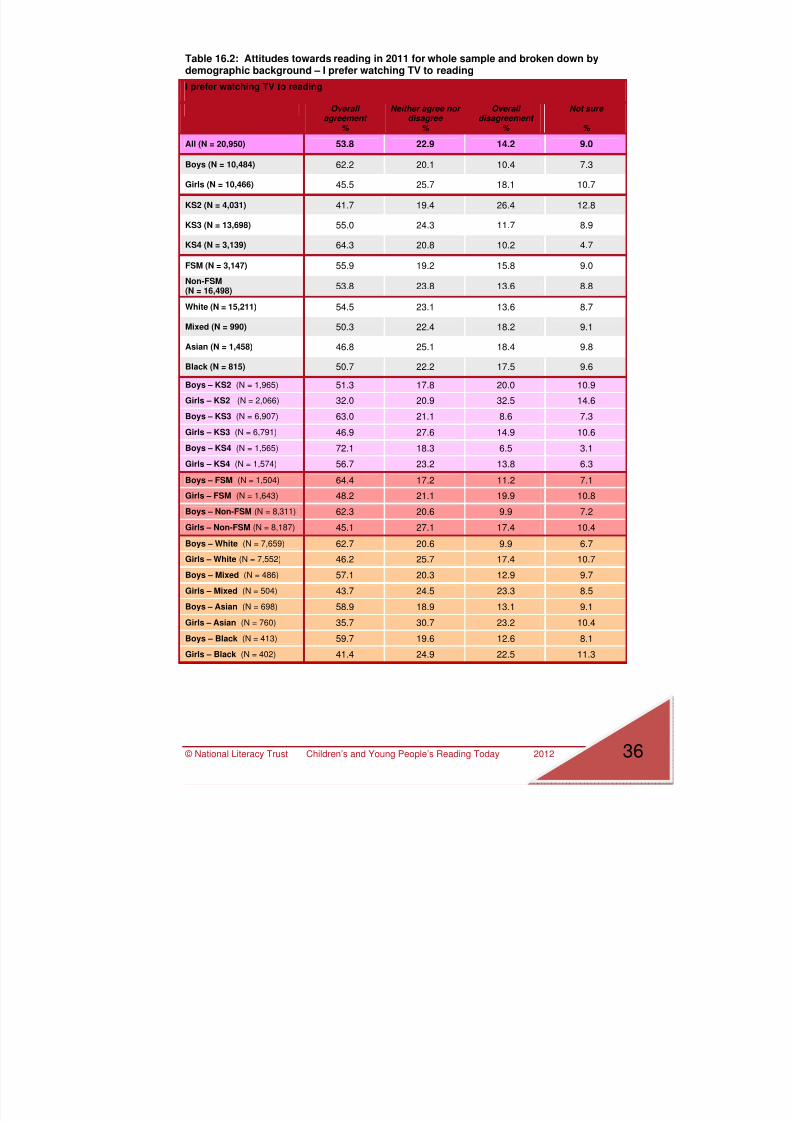
half of young people (53.8%) agree that “I prefer watching TV to reading”.
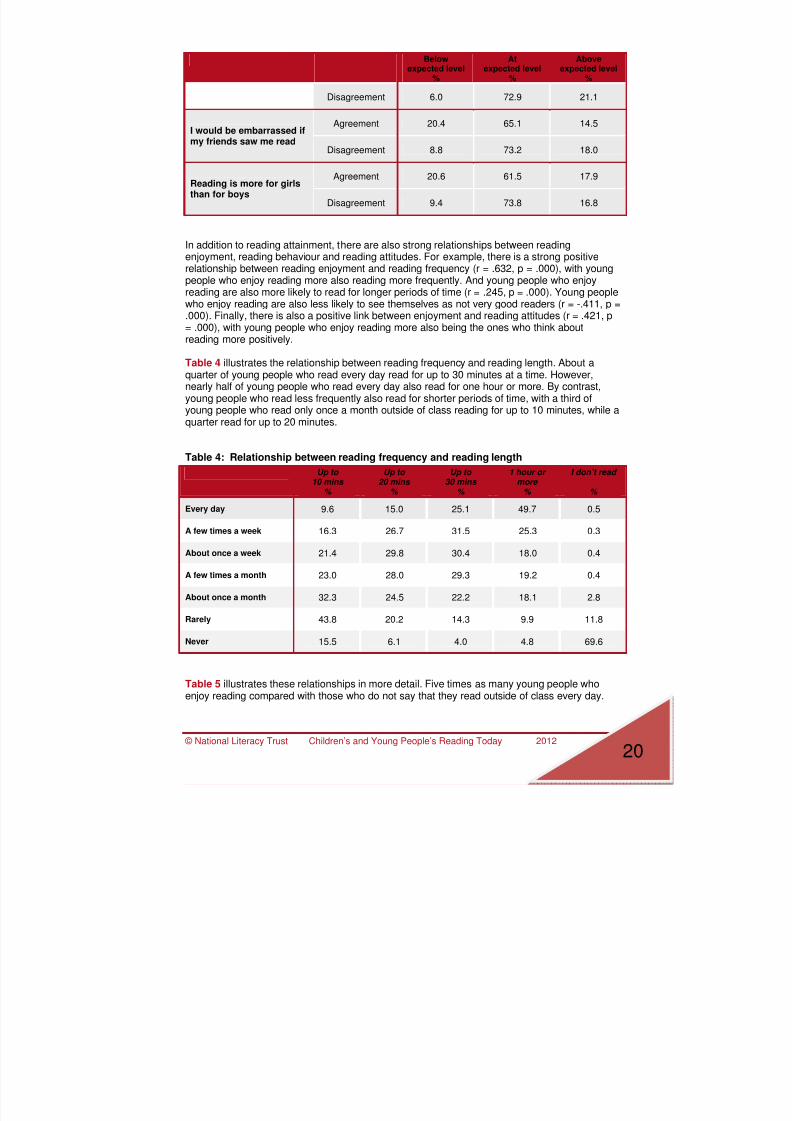
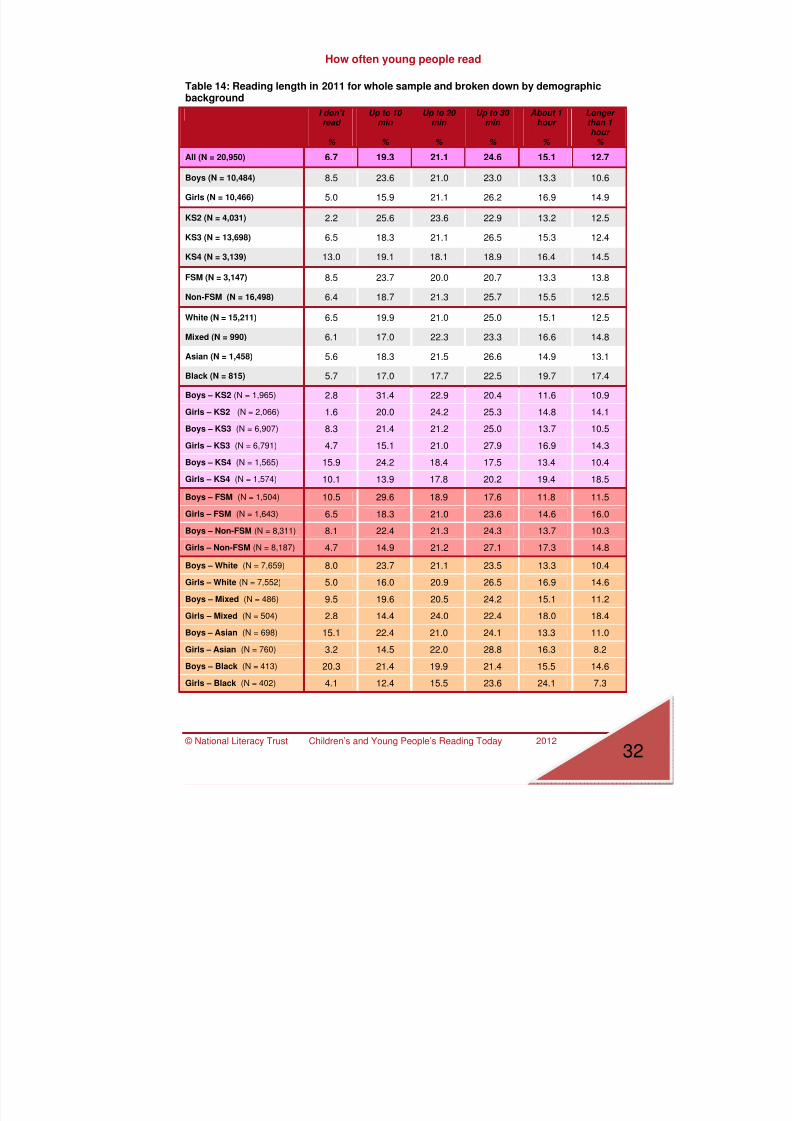
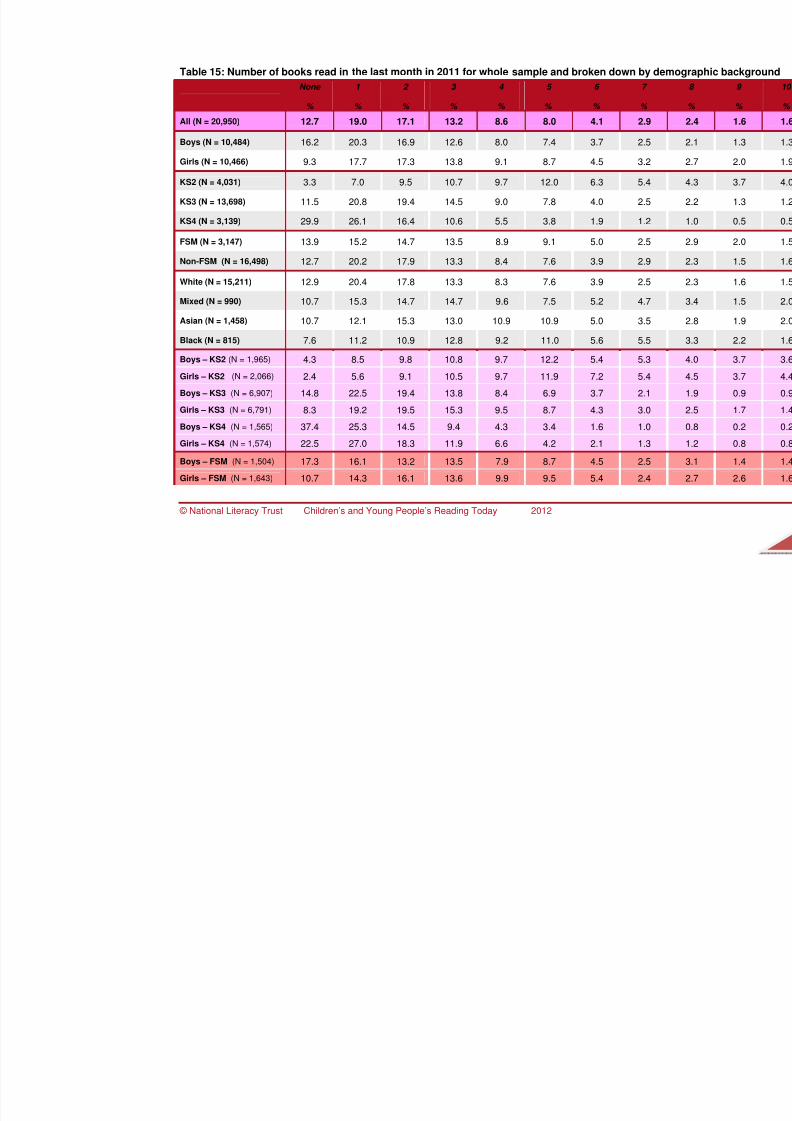
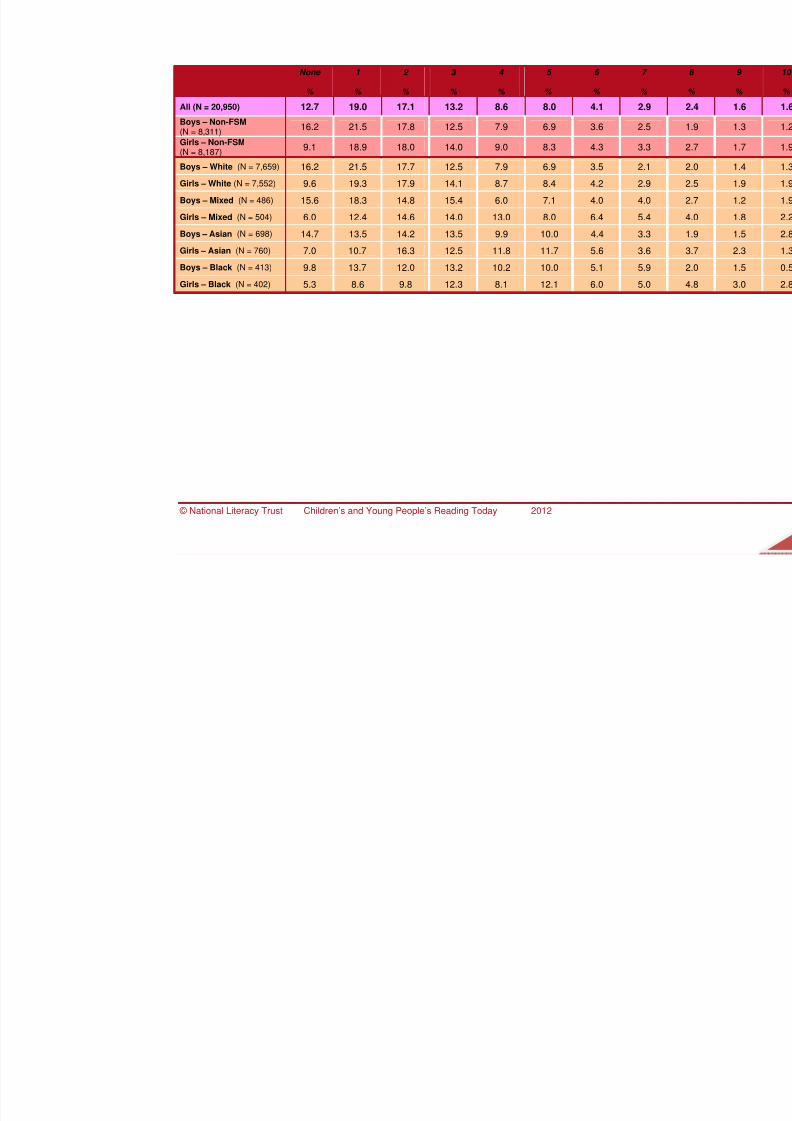
• When young people read about a quarter (24.6%) read for up to 30 minutes.21.1% read for up to 20 minutes, while 19.3% read for up to 10 minutes.However, a sixth of young people (15.1%) read for about one hour while aneighth (12.7%) read for longer than one hour (see Table 14, p. 32).
For relationships with reading attainment see Tables 17 to 32, pp. 44 and for comparisons ofthese headline findings with data from 2010 see Figures 11 to 15 pp. 54.

7/27/2019 Young People s Reading FINAL REPORT
http://slidepdf.com/reader/full/young-people-s-reading-final-report 9/60
7/27/2019 Young People s Reading FINAL REPORT
http://slidepdf.com/reader/full/young-people-s-reading-final-report 10/60
© National Literacy Trust Children’s and Young People’s Reading Today 2012
10
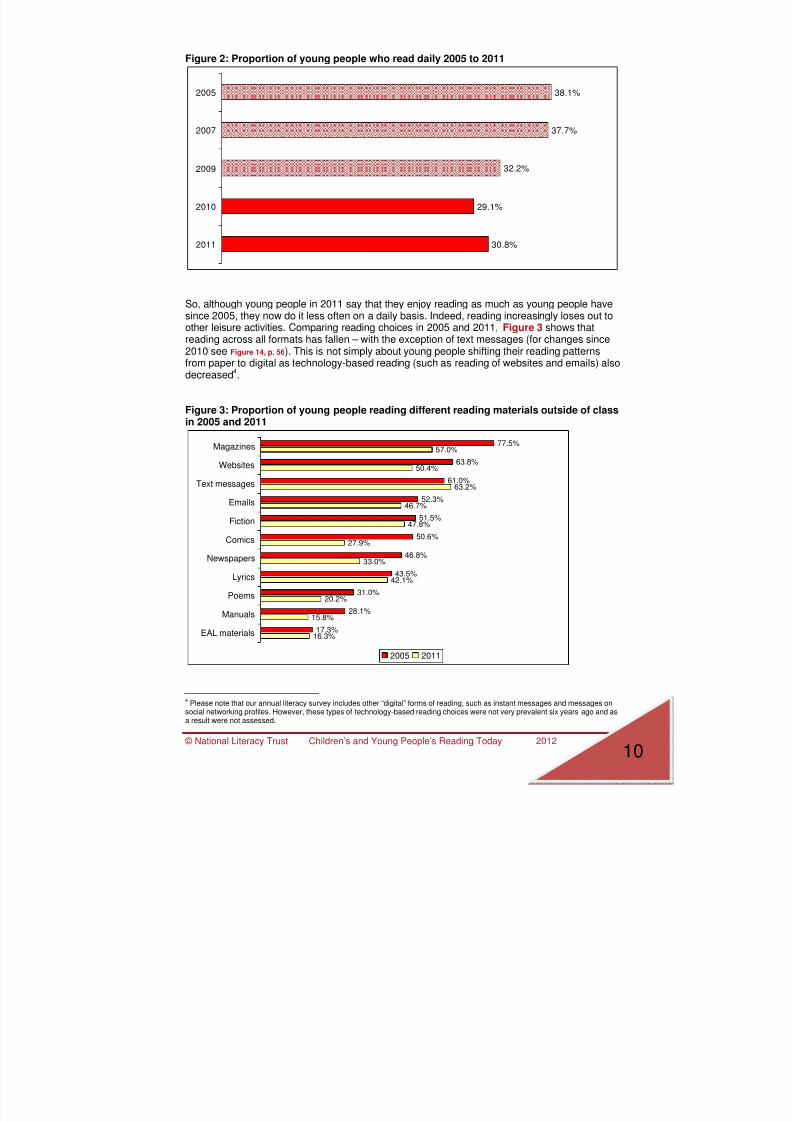
Figure 2: Proportion of young people who read daily 2005 to 2011
38.1%
37.7%
32.2%
29.1%
30.8%
2005
2007
2009
2010
2011
So, although young people in 2011 say that they enjoy reading as much as young people havesince 2005, they now do it less often on a daily basis. Indeed, reading increasingly loses out toother leisure activities. Comparing reading choices in 2005 and 2011, Figure 3 shows thatreading across all formats has fallen – with the exception of text messages (for changes since2010 see Figure 14, p. 56). This is not simply about young people shifting their reading patternsfrom paper to digital as technology-based reading (such as reading of websites and emails) alsodecreased4.
Figure 3: Proportion of young people reading different reading materials outside of classin 2005 and 2011
77.5%
63.8%
61.0%
52.3%
51.5%
50.6%
46.8%
43.5%
31.0%
28.1%
17.3%
57.0%
50.4%
63.2%
46.7%
47.8%
27.9%
33.0%
42.1%
20.2%
15.8%
16.3%
Magazines
Websites
Text messages
Emails
Fiction
Comics
Newspapers
Lyrics
Poems
Manuals
EAL materials
2005 2011
4Please note that our annual literacy survey includes other “digital” forms of reading, such as instant messages and messages on
social networking profiles. However, these types of technology-based reading choices were not very prevalent six years ago and asa result were not assessed.
7/27/2019 Young People s Reading FINAL REPORT
http://slidepdf.com/reader/full/young-people-s-reading-final-report 11/60
© National Literacy Trust Children’s and Young People’s Reading Today 2012
11
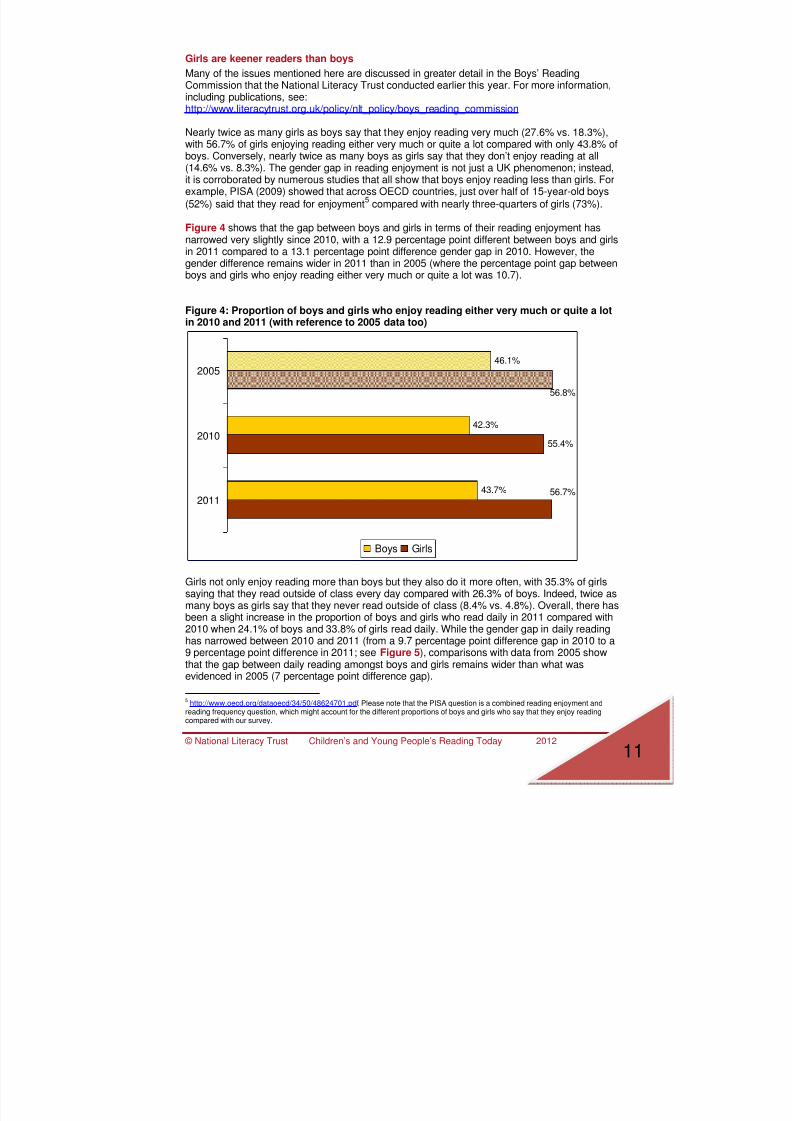
Girls are keener readers than boys
Many of the issues mentioned here are discussed in greater detail in the Boys’ ReadingCommission that the National Literacy Trust conducted earlier this year. For more information,including publications, see:http://www.literacytrust.org.uk/policy/nlt_policy/boys_reading_commission
Nearly twice as many girls as boys say that they enjoy reading very much (27.6% vs. 18.3%),with 56.7% of girls enjoying reading either very much or quite a lot compared with only 43.8% ofboys. Conversely, nearly twice as many boys as girls say that they don’t enjoy reading at all(14.6% vs. 8.3%). The gender gap in reading enjoyment is not just a UK phenomenon; instead,it is corroborated by numerous studies that all show that boys enjoy reading less than girls. Forexample, PISA (2009) showed that across OECD countries, just over half of 15-year-old boys
(52%) said that they read for enjoyment5
compared with nearly three-quarters of girls (73%).
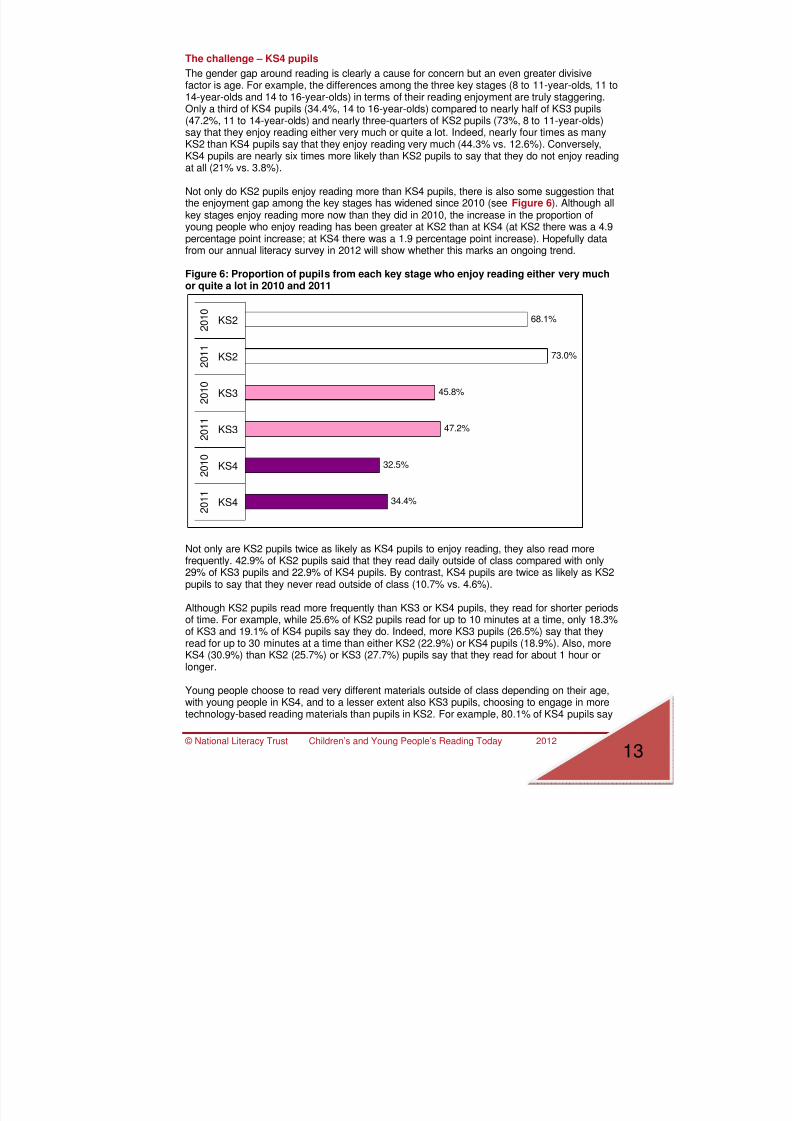
Figure 4 shows that the gap between boys and girls in terms of their reading enjoyment hasnarrowed very slightly since 2010, with a 12.9 percentage point different between boys and girlsin 2011 compared to a 13.1 percentage point difference gender gap in 2010. However, thegender difference remains wider in 2011 than in 2005 (where the percentage point gap between
boys and girls who enjoy reading either very much or quite a lot was 10.7).
Figure 4: Proportion of boys and girls who enjoy reading either very much or quite a lotin 2010 and 2011 (with reference to 2005 data too)
46.1%
42.3%
43.7%
55.4%
56.7%
56.8%
2005
2010
2011
Boys Girls
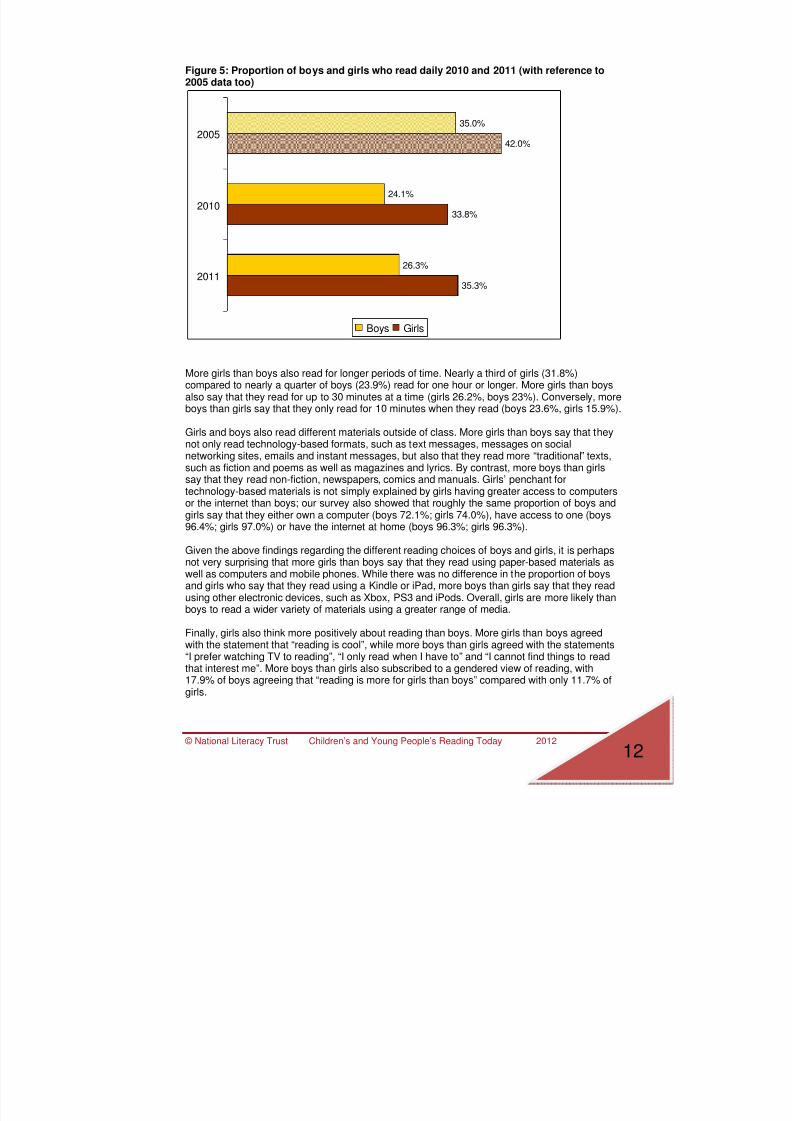
Girls not only enjoy reading more than boys but they also do it more often, with 35.3% of girlssaying that they read outside of class every day compared with 26.3% of boys. Indeed, twice asmany boys as girls say that they never read outside of class (8.4% vs. 4.8%). Overall, there hasbeen a slight increase in the proportion of boys and girls who read daily in 2011 compared with2010 when 24.1% of boys and 33.8% of girls read daily. While the gender gap in daily readinghas narrowed between 2010 and 2011 (from a 9.7 percentage point difference gap in 2010 to a9 percentage point difference in 2011; see Figure 5), comparisons with data from 2005 showthat the gap between daily reading amongst boys and girls remains wider than what wasevidenced in 2005 (7 percentage point difference gap).
5 http://www.oecd.org/dataoecd/34/50/48624701.pdf. Please note that the PISA question is a combined reading enjoyment and
reading frequency question, which might account for the different proportions of boys and girls who say that they enjoy readingcompared with our survey.
7/27/2019 Young People s Reading FINAL REPORT
http://slidepdf.com/reader/full/young-people-s-reading-final-report 12/60
© National Literacy Trust Children’s and Young People’s Reading Today 2012
12
Figure 5: Proportion of boys and girls who read daily 2010 and 2011 (with reference to2005 data too)
35.0%
24.1%
26.3%
42.0%
33.8%
35.3%
2005
2010
2011
Boys Girls
More girls than boys also read for longer periods of time. Nearly a third of girls (31.8%)compared to nearly a quarter of boys (23.9%) read for one hour or longer. More girls than boysalso say that they read for up to 30 minutes at a time (girls 26.2%, boys 23%). Conversely, moreboys than girls say that they only read for 10 minutes when they read (boys 23.6%, girls 15.9%).
Girls and boys also read different materials outside of class. More girls than boys say that theynot only read technology-based formats, such as text messages, messages on socialnetworking sites, emails and instant messages, but also that they read more “traditional” texts,such as fiction and poems as well as magazines and lyrics. By contrast, more boys than girlssay that they read non-fiction, newspapers, comics and manuals. Girls’ penchant fortechnology-based materials is not simply explained by girls having greater access to computersor the internet than boys; our survey also showed that roughly the same proportion of boys andgirls say that they either own a computer (boys 72.1%; girls 74.0%), have access to one (boys96.4%; girls 97.0%) or have the internet at home (boys 96.3%; girls 96.3%).
Given the above findings regarding the different reading choices of boys and girls, it is perhapsnot very surprising that more girls than boys say that they read using paper-based materials aswell as computers and mobile phones. While there was no difference in the proportion of boysand girls who say that they read using a Kindle or iPad, more boys than girls say that they readusing other electronic devices, such as Xbox, PS3 and iPods. Overall, girls are more likely thanboys to read a wider variety of materials using a greater range of media.
Finally, girls also think more positively about reading than boys. More girls than boys agreedwith the statement that “reading is cool”, while more boys than girls agreed with the statements“I prefer watching TV to reading”, “I only read when I have to” and “I cannot find things to readthat interest me”. More boys than girls also subscribed to a gendered view of reading, with17.9% of boys agreeing that “reading is more for girls than boys” compared with only 11.7% of
girls.
7/27/2019 Young People s Reading FINAL REPORT
http://slidepdf.com/reader/full/young-people-s-reading-final-report 13/60
7/27/2019 Young People s Reading FINAL REPORT
http://slidepdf.com/reader/full/young-people-s-reading-final-report 14/60
© National Literacy Trust Children’s and Young People’s Reading Today 2012
14
that they read text messages compared to 68.3% of KS3 pupils and only 32.5% KS2 pupils.Similarly, 70.4% of KS4 pupils say that they read messages on social networking sitescompared with 52.5% of KS3 pupils and only 24.8% of KS2 pupils. While technology-basedmaterials dominate older pupils’ reading choices outside of class, KS2 pupils are more“traditional” in their reading consumption, with their top four choices being fiction, magazines,non-fiction and poems.
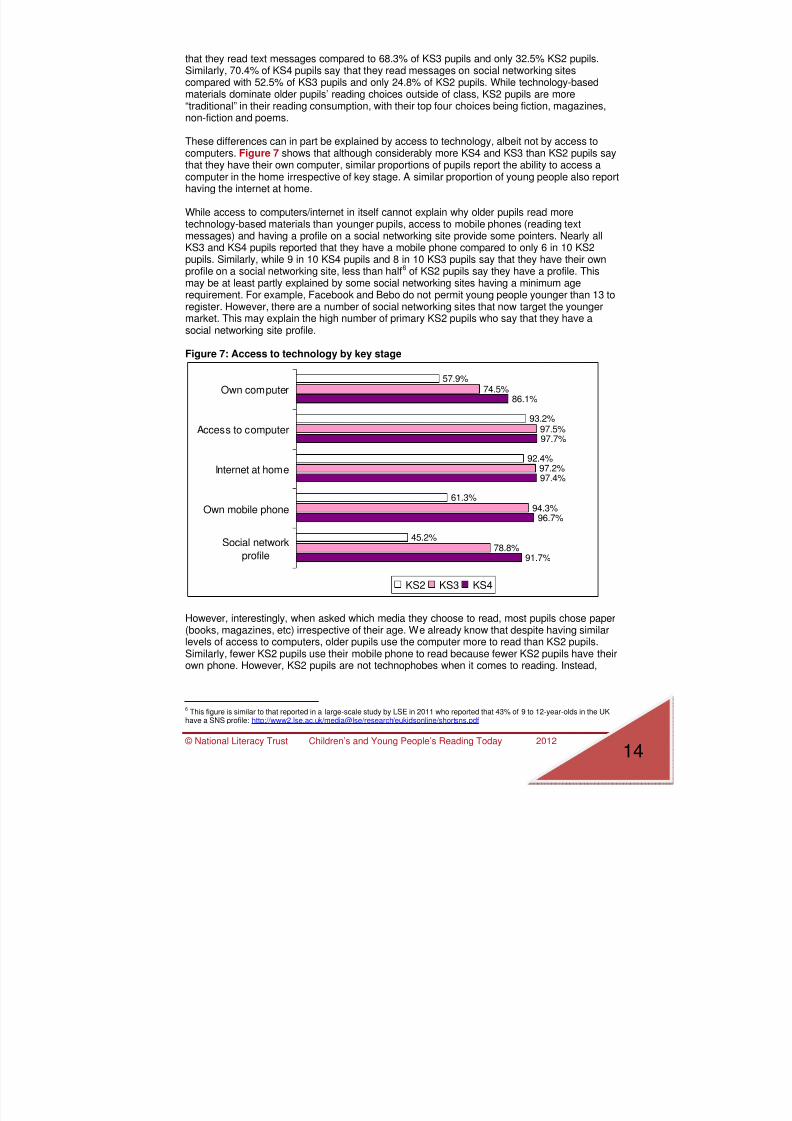
These differences can in part be explained by access to technology, albeit not by access tocomputers. Figure 7 shows that although considerably more KS4 and KS3 than KS2 pupils saythat they have their own computer, similar proportions of pupils report the ability to access acomputer in the home irrespective of key stage. A similar proportion of young people also reporthaving the internet at home.
While access to computers/internet in itself cannot explain why older pupils read moretechnology-based materials than younger pupils, access to mobile phones (reading textmessages) and having a profile on a social networking site provide some pointers. Nearly allKS3 and KS4 pupils reported that they have a mobile phone compared to only 6 in 10 KS2pupils. Similarly, while 9 in 10 KS4 pupils and 8 in 10 KS3 pupils say that they have their ownprofile on a social networking site, less than half6 of KS2 pupils say they have a profile. Thismay be at least partly explained by some social networking sites having a minimum agerequirement. For example, Facebook and Bebo do not permit young people younger than 13 toregister. However, there are a number of social networking sites that now target the youngermarket. This may explain the high number of primary KS2 pupils who say that they have asocial networking site profile.
Figure 7: Access to technology by key stage
57.9%
93.2%
92.4%
61.3%
45.2%
74.5%
97.5%
97.2%
94.3%
78.8%
86.1%
97.7%
97.4%
96.7%
91.7%
Own computer
Access to computer
Internet at home
Own mobile phone
Social network
profile
KS2 KS3 KS4
However, interestingly, when asked which media they choose to read, most pupils chose paper(books, magazines, etc) irrespective of their age. We already know that despite having similarlevels of access to computers, older pupils use the computer more to read than KS2 pupils.Similarly, fewer KS2 pupils use their mobile phone to read because fewer KS2 pupils have theirown phone. However, KS2 pupils are not technophobes when it comes to reading. Instead,
6This figure is similar to that reported in a large-scale study by LSE in 2011 who reported that 43% of 9 to 12-year-olds in the UK
have a SNS profile: http://www2.lse.ac.uk/media@lse/research/eukidsonline/shortsns.pdf
7/27/2019 Young People s Reading FINAL REPORT
http://slidepdf.com/reader/full/young-people-s-reading-final-report 15/60
© National Literacy Trust Children’s and Young People’s Reading Today 2012
15
slightly more KS2 than KS3 or KS4 pupils say that they use an iPad or Kindle to read and asimilar proportion of KS2, KS3 and KS4 pupils use other electronic devices to read.Finally, KS4 pupils, and to some extent KS3 pupils, are considerably less likely than KS2 pupilsto hold positive attitudes towards reading. They are less likely than their younger counterparts tobelieve in the adage that practice makes perfect as they are less likely to agree that “the more Iread, the better I become”. KS4 pupils are also nearly four times less likely than KS2 pupils toagree that “reading is cool”. However, KS2 pupils are more likely to subscribe to gender
stereotypes around reading, with nearly twice as many agreeing that “reading is more for girlsthan boys” than their older counterparts.
An even bigger challenge – Teenage boys and reading
Boys tend to enjoy reading less, tend to read less often and think less positively about readingthan girls. Similarly, older pupils tend to be more disengaged from reading in terms of enjoymentand attitudes when compared to younger pupils. However, when one combines gender and keystages in the analyses, it becomes evident that teenage boys, particularly those in KS4, presenta particular problem with reading.
Only 26.2% of boys in KS4 say that they enjoy reading either very much or quite a lot. This isnearly half of the number of KS3 boys who say that they enjoy reading (41.6%) and nearly athird of the number of KS2 boys who say that they enjoy reading (65.5%). This is also nearlyhalf the number of girls in KS4 (42.5%) who enjoy reading either very much or quite a lot.
Teenage boys also read less frequently than their younger counterparts, with over a third ofKS2 boys (35.4%) saying that they read every day compared with only a fifth of KS4 boys(20.5%).
Only half as many KS4 (27.9%) as KS2 (48.8%) boys say that they read fiction outside of classat least once a month. KS4 boys are also less likely than their younger counterparts to read
poems (8.7% vs. 29.8%) and non-fiction (27% vs. 43.9%). However, older boys are nearly twiceas likely to read newspapers compared with younger boys (48.3% vs. 29%).
Teenage boys also think less positively about reading compared with younger boys. Only 14.2%of boys in KS4 agree with the statement that “reading is cool” compared with 58.1% of boys inKS2. At the same time, however, KS4 boys are more likely to agree with the statement that “Icannot find anything to read that interests me” compared with KS2 boys (35% vs. 26%). KS4boys are also more likely to agree with the statement that they prefer watching TV to reading,with 72.1% of KS4 boys agreeing with the statement compared with just over half of KS2 boys(51.3%).
But let us not forget about teenage girls
While teenage boys are a particular concern when it comes to reading engagement, teenagegirls can also present a challenge. While 80.1% of KS2 girls say that they enjoy reading eithervery much or quite a lot, only half as many KS4 girls (42.5%) say that they enjoy reading.Similarly, while half of KS2 girls (50%) read daily, only half as many KS4 girls (25.4%) say thatthey read every day.
Three times as many KS2 girls as KS4 girls see reading as cool (69.5% vs. 21.8%). However,older girls are significantly less likely than younger girls to subscribe to reading as a genderedactivity, with only 7.2% of KS4 girls agreeing with the statement that “reading is more for girls
than boys” compared with 23.7% of KS2 girls.
7/27/2019 Young People s Reading FINAL REPORT
http://slidepdf.com/reader/full/young-people-s-reading-final-report 16/60
© National Literacy Trust Children’s and Young People’s Reading Today 2012
16
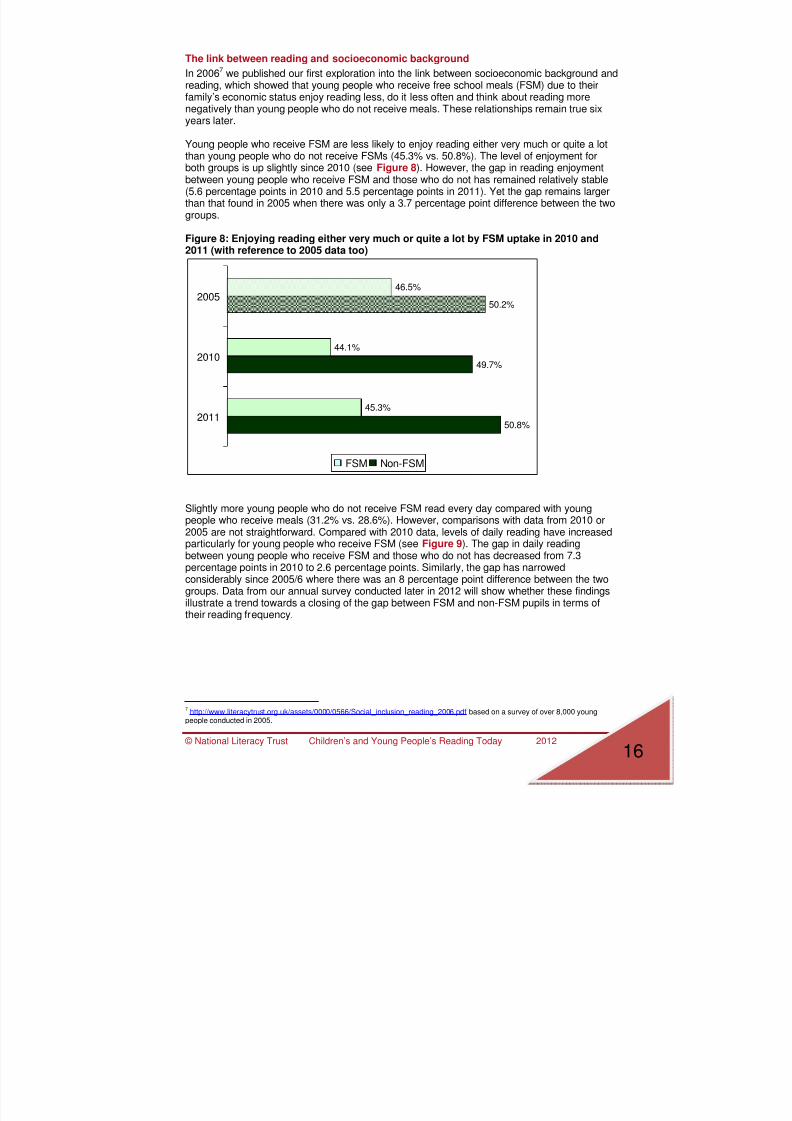
The link between reading and socioeconomic background
In 20067 we published our first exploration into the link between socioeconomic background andreading, which showed that young people who receive free school meals (FSM) due to theirfamily’s economic status enjoy reading less, do it less often and think about reading morenegatively than young people who do not receive meals. These relationships remain true sixyears later.
Young people who receive FSM are less likely to enjoy reading either very much or quite a lotthan young people who do not receive FSMs (45.3% vs. 50.8%). The level of enjoyment forboth groups is up slightly since 2010 (see Figure 8). However, the gap in reading enjoymentbetween young people who receive FSM and those who do not has remained relatively stable(5.6 percentage points in 2010 and 5.5 percentage points in 2011). Yet the gap remains largerthan that found in 2005 when there was only a 3.7 percentage point difference between the twogroups.
Figure 8: Enjoying reading either very much or quite a lot by FSM uptake in 2010 and2011 (with reference to 2005 data too)
46.5%
44.1%
45.3%
50.2%
49.7%
50.8%
2005
2010
2011
FSM Non-FSM
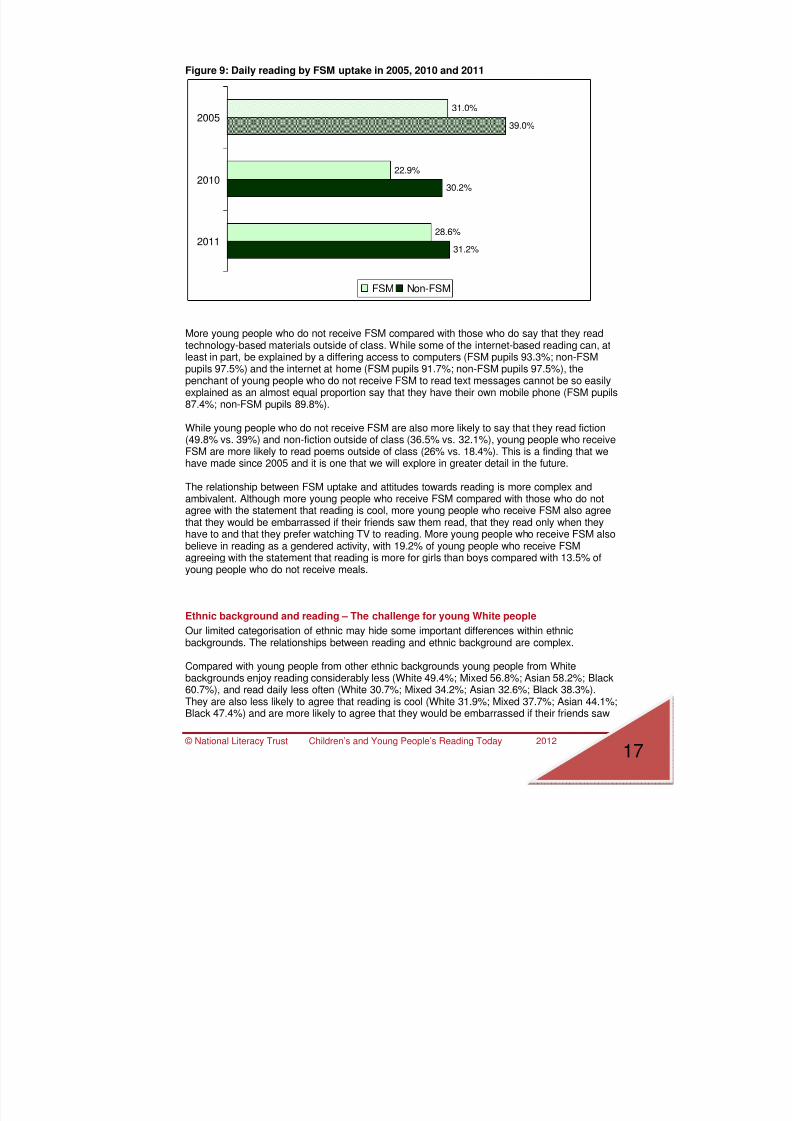
Slightly more young people who do not receive FSM read every day compared with youngpeople who receive meals (31.2% vs. 28.6%). However, comparisons with data from 2010 or2005 are not straightforward. Compared with 2010 data, levels of daily reading have increasedparticularly for young people who receive FSM (see Figure 9). The gap in daily reading
between young people who receive FSM and those who do not has decreased from 7.3percentage points in 2010 to 2.6 percentage points. Similarly, the gap has narrowedconsiderably since 2005/6 where there was an 8 percentage point difference between the twogroups. Data from our annual survey conducted later in 2012 will show whether these findingsillustrate a trend towards a closing of the gap between FSM and non-FSM pupils in terms oftheir reading frequency.
7 http://www.literacytrust.org.uk/assets/0000/0566/Social_inclusion_reading_2006.pdf based on a survey of over 8,000 young
people conducted in 2005.
7/27/2019 Young People s Reading FINAL REPORT
http://slidepdf.com/reader/full/young-people-s-reading-final-report 17/60
© National Literacy Trust Children’s and Young People’s Reading Today 2012
17
Figure 9: Daily reading by FSM uptake in 2005, 2010 and 2011
31.0%
22.9%
28.6%
39.0%
30.2%
31.2%
2005
2010
2011
FSM Non-FSM
More young people who do not receive FSM compared with those who do say that they readtechnology-based materials outside of class. While some of the internet-based reading can, atleast in part, be explained by a differing access to computers (FSM pupils 93.3%; non-FSMpupils 97.5%) and the internet at home (FSM pupils 91.7%; non-FSM pupils 97.5%), thepenchant of young people who do not receive FSM to read text messages cannot be so easilyexplained as an almost equal proportion say that they have their own mobile phone (FSM pupils87.4%; non-FSM pupils 89.8%).
While young people who do not receive FSM are also more likely to say that they read fiction(49.8% vs. 39%) and non-fiction outside of class (36.5% vs. 32.1%), young people who receiveFSM are more likely to read poems outside of class (26% vs. 18.4%). This is a finding that wehave made since 2005 and it is one that we will explore in greater detail in the future.
The relationship between FSM uptake and attitudes towards reading is more complex andambivalent. Although more young people who receive FSM compared with those who do notagree with the statement that reading is cool, more young people who receive FSM also agreethat they would be embarrassed if their friends saw them read, that they read only when theyhave to and that they prefer watching TV to reading. More young people who receive FSM alsobelieve in reading as a gendered activity, with 19.2% of young people who receive FSM
agreeing with the statement that reading is more for girls than boys compared with 13.5% ofyoung people who do not receive meals.
Ethnic background and reading – The challenge for young White people
Our limited categorisation of ethnic may hide some important differences within ethnicbackgrounds. The relationships between reading and ethnic background are complex.
Compared with young people from other ethnic backgrounds young people from Whitebackgrounds enjoy reading considerably less (White 49.4%; Mixed 56.8%; Asian 58.2%; Black
60.7%), and read daily less often (White 30.7%; Mixed 34.2%; Asian 32.6%; Black 38.3%).They are also less likely to agree that reading is cool (White 31.9%; Mixed 37.7%; Asian 44.1%;Black 47.4%) and are more likely to agree that they would be embarrassed if their friends saw
7/27/2019 Young People s Reading FINAL REPORT
http://slidepdf.com/reader/full/young-people-s-reading-final-report 18/60
© National Literacy Trust Children’s and Young People’s Reading Today 2012
18
them read (White 17.7%; Mixed 15.6%; Asian 13%; Black 12.3%). Young people from Whitebackgrounds are also more likely to agree that they prefer watching TV to reading (White54.5%; Mixed 50.3%; Asian 46.8%; Black 50.7%).
Overall, young people from Black backgrounds enjoy reading the most, rate themselves asgood readers and read more frequently than young people from the other three ethnicbackgrounds.
Why does it matter whether young people enjoy reading or read frequently?
Why does it matter whether young people enjoy reading, read frequently or think positivelyabout it? Firstly, reading enjoyment, behaviour and attitudes are clearly related to readingattainment8. Please note that while enjoyment, habits and attitudes are each related to readingattainment, our research design can make no inference about causality: that is, higherattainment may lead to greater enjoyment, more frequent reading or more positive attitudes; oralternatively higher enjoyment, more frequent reading or more positive attitudes may lead tohigher attainment. Indeed, the relationship might be cyclical. We have set up a longitudinal
subsample within our annual literacy survey, which will hopefully give us more information aboutthe direction of associations in the future.
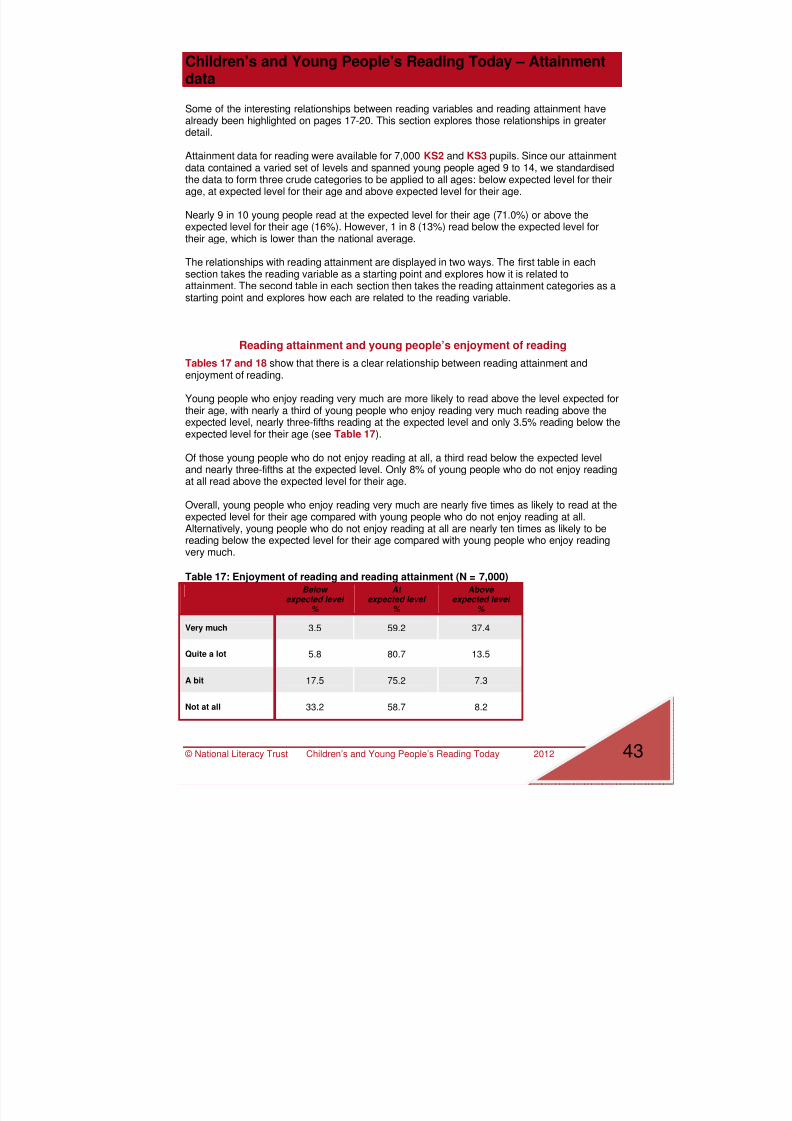
Table 1 shows the relationship between reading enjoyment and reading attainment9 veryclearly. Young people who enjoy reading very much are nearly five times as likely to read abovethe expected level for their age compared with young people who do not enjoy reading at all.Alternatively, young people who do not enjoy reading at all are nearly ten times as likely to bereading below the expected level for their age compared with young people who enjoy readingvery much.
Table 1: Enjoyment of reading and reading attainment (N = 7,000)Below
expected level %
At
expected level %
Above
expected level %
Very much 3.5 59.2 37.4
Quite a lot 5.8 80.7 13.5
A bit 17.5 75.2 7.3
Not at all 33.2 58.7 8.2
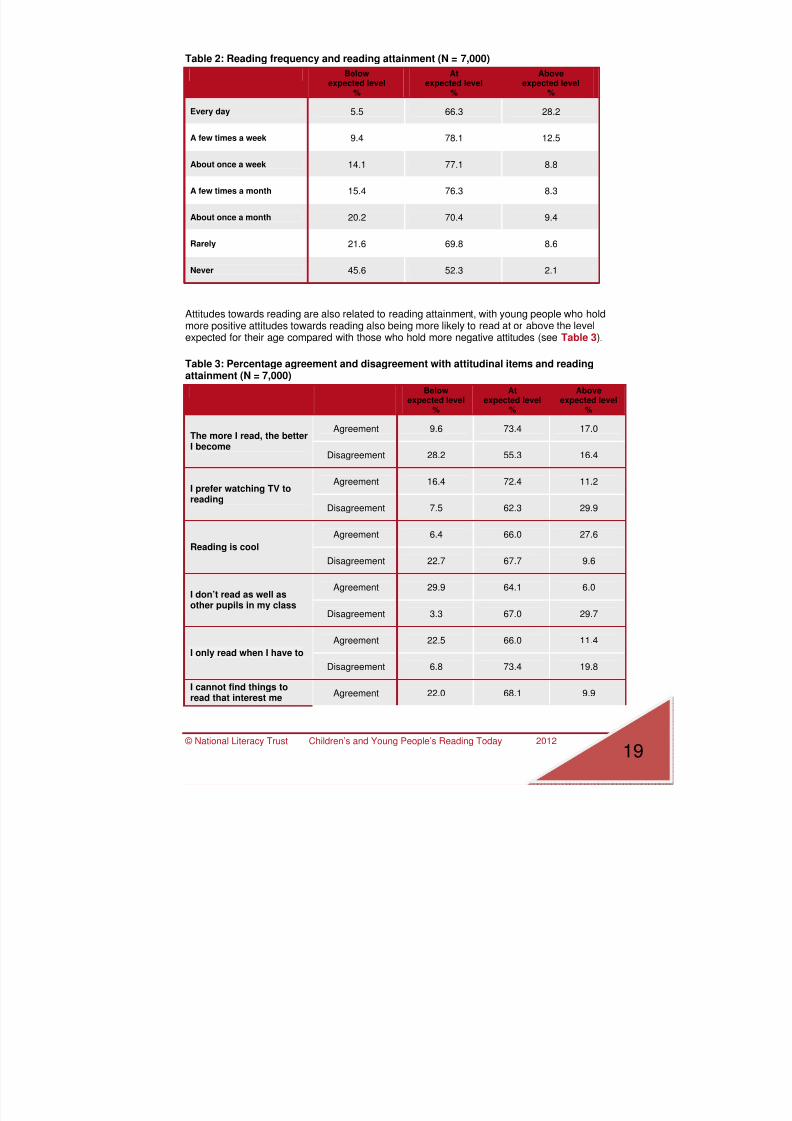
Table 2 shows that young people who read outside of class daily are 13 times more likely toread above the expected level for their age compared with young people who never readoutside of class. While 28% of young people who read every day read above the level expectedfor their age, only 2 to 9% of young people who read rarely or never read at that level. Overall,nearly half of those who never read outside of class read below the level expected for their age.
8 For more information regarding the relative importance of reading enjoyment, behaviour and attitudes on attainment see our 2011paper: http://www.literacytrust.org.uk/assets/0001/0025/Attainment_attitudes_behaviour_enjoyment-Final.pdf 9
For more information on our attainment data and for an alternative look at the link with attainment see the Attainment Data sectionon p. 44
7/27/2019 Young People s Reading FINAL REPORT
http://slidepdf.com/reader/full/young-people-s-reading-final-report 19/60
© National Literacy Trust Children’s and Young People’s Reading Today 2012
19
Table 2: Reading frequency and reading attainment (N = 7,000)
Belowexpected level
%
Atexpected level
%
Aboveexpected level
%
Every day 5.5 66.3 28.2
A few times a week 9.4 78.1 12.5
About once a week 14.1 77.1 8.8
A few times a month 15.4 76.3 8.3
About once a month 20.2 70.4 9.4
Rarely 21.6 69.8 8.6
Never 45.6 52.3 2.1
Attitudes towards reading are also related to reading attainment, with young people who holdmore positive attitudes towards reading also being more likely to read at or above the levelexpected for their age compared with those who hold more negative attitudes (see Table 3).
Table 3: Percentage agreement and disagreement with attitudinal items and readingattainment (N = 7,000)
Belowexpected level
%
Atexpected level
%
Aboveexpected level
%
Agreement 9.6 73.4 17.0The more I read, the betterI become
Disagreement 28.2 55.3 16.4
Agreement 16.4 72.4 11.2I prefer watching TV toreading
Disagreement 7.5 62.3 29.9
Agreement 6.4 66.0 27.6
Reading is cool
Disagreement 22.7 67.7 9.6
Agreement 29.9 64.1 6.0I don’t read as well asother pupils in my class
Disagreement 3.3 67.0 29.7
Agreement 22.5 66.0 11.4
I only read when I have to
Disagreement 6.8 73.4 19.8
I cannot find things toread that interest me Agreement 22.0 68.1 9.9
7/27/2019 Young People s Reading FINAL REPORT
http://slidepdf.com/reader/full/young-people-s-reading-final-report 20/60
7/27/2019 Young People s Reading FINAL REPORT
http://slidepdf.com/reader/full/young-people-s-reading-final-report 21/60
© National Literacy Trust Children’s and Young People’s Reading Today 2012
21
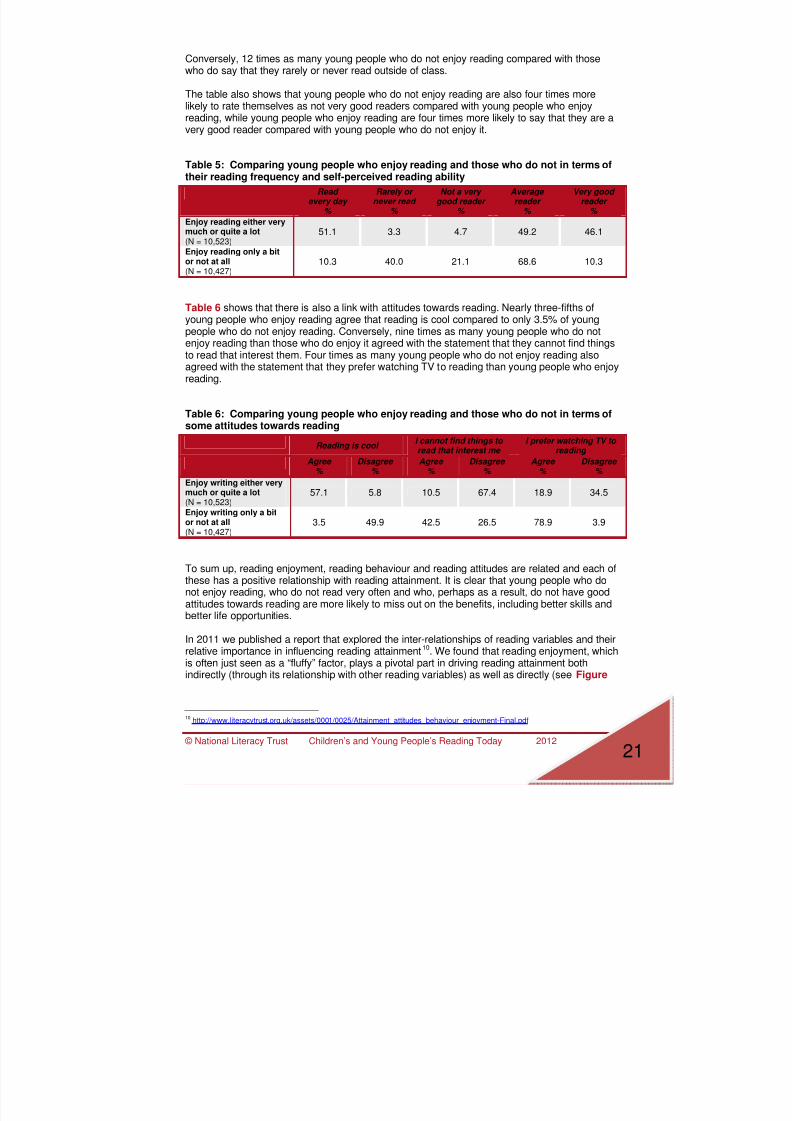
Conversely, 12 times as many young people who do not enjoy reading compared with thosewho do say that they rarely or never read outside of class.
The table also shows that young people who do not enjoy reading are also four times morelikely to rate themselves as not very good readers compared with young people who enjoyreading, while young people who enjoy reading are four times more likely to say that they are avery good reader compared with young people who do not enjoy it.
Table 5: Comparing young people who enjoy reading and those who do not in terms oftheir reading frequency and self-perceived reading ability
Read every day
%
Rarely or never read
%
Not a very good reader
%
Average reader
%
Very good reader
%
Enjoy reading either verymuch or quite a lot(N = 10,523)
51.1 3.3 4.7 49.2 46.1
Enjoy reading only a bitor not at all(N = 10,427)
10.3 40.0 21.1 68.6 10.3
Table 6 shows that there is also a link with attitudes towards reading. Nearly three-fifths ofyoung people who enjoy reading agree that reading is cool compared to only 3.5% of youngpeople who do not enjoy reading. Conversely, nine times as many young people who do notenjoy reading than those who do enjoy it agreed with the statement that they cannot find thingsto read that interest them. Four times as many young people who do not enjoy reading alsoagreed with the statement that they prefer watching TV to reading than young people who enjoyreading.
Table 6: Comparing young people who enjoy reading and those who do not in terms ofsome attitudes towards reading
Reading is cool I cannot find things to read that interest me
I prefer watching TV to reading
Agree %
Disagree %
Agree %
Disagree %
Agree %
Disagree %
Enjoy writing either verymuch or quite a lot(N = 10,523)
57.1 5.8 10.5 67.4 18.9 34.5
Enjoy writing only a bitor not at all(N = 10,427)
3.5 49.9 42.5 26.5 78.9 3.9
To sum up, reading enjoyment, reading behaviour and reading attitudes are related and each ofthese has a positive relationship with reading attainment. It is clear that young people who donot enjoy reading, who do not read very often and who, perhaps as a result, do not have goodattitudes towards reading are more likely to miss out on the benefits, including better skills andbetter life opportunities.
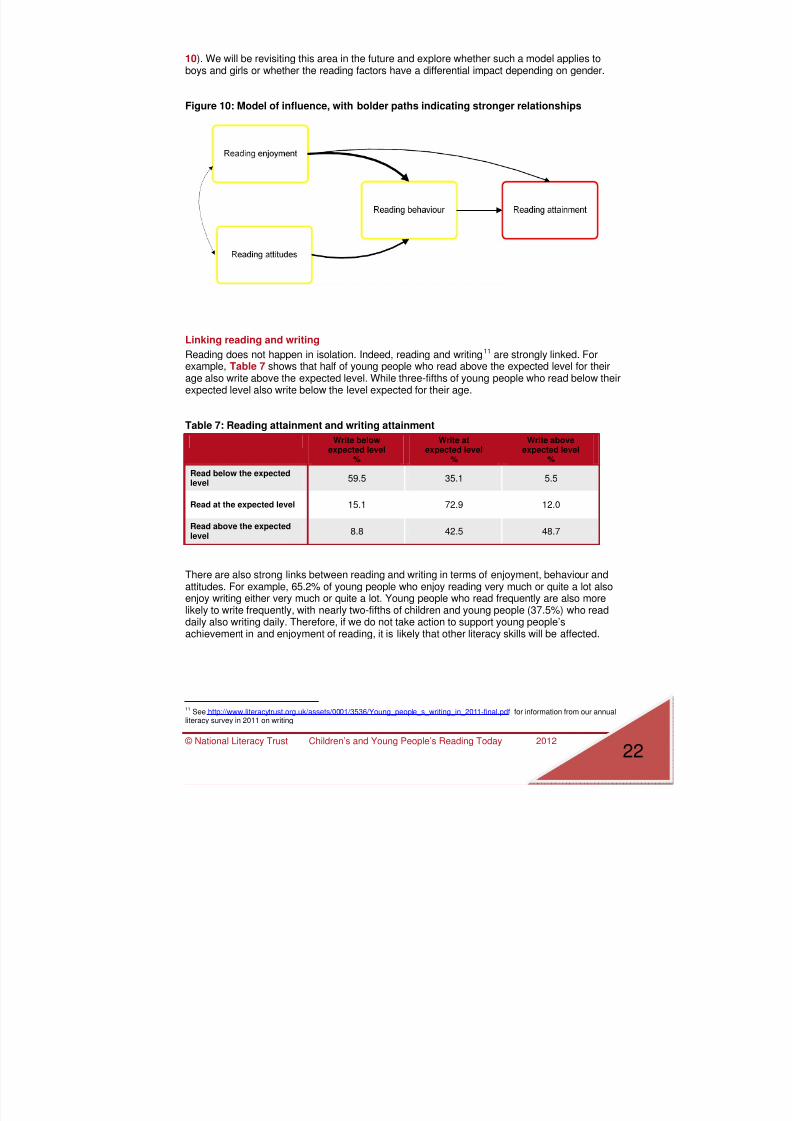
In 2011 we published a report that explored the inter-relationships of reading variables and theirrelative importance in influencing reading attainment10. We found that reading enjoyment, whichis often just seen as a “fluffy” factor, plays a pivotal part in driving reading attainment bothindirectly (through its relationship with other reading variables) as well as directly (see Figure
10 http://www.literacytrust.org.uk/assets/0001/0025/Attainment_attitudes_behaviour_enjoyment-Final.pdf
7/27/2019 Young People s Reading FINAL REPORT
http://slidepdf.com/reader/full/young-people-s-reading-final-report 22/60
© National Literacy Trust Children’s and Young People’s Reading Today 2012
22
10). We will be revisiting this area in the future and explore whether such a model applies toboys and girls or whether the reading factors have a differential impact depending on gender.
Figure 10: Model of influence, with bolder paths indicating stronger relationships
Linking reading and writing
Reading does not happen in isolation. Indeed, reading and writing11 are strongly linked. Forexample, Table 7 shows that half of young people who read above the expected level for theirage also write above the expected level. While three-fifths of young people who read below theirexpected level also write below the level expected for their age.
Table 7: Reading attainment and writing attainment
Write belowexpected level
%
Write atexpected level
%
Write aboveexpected level
%
Read below the expectedlevel
59.5 35.1 5.5
Read at the expected level 15.1 72.9 12.0
Read above the expectedlevel
8.8 42.5 48.7
There are also strong links between reading and writing in terms of enjoyment, behaviour andattitudes. For example, 65.2% of young people who enjoy reading very much or quite a lot alsoenjoy writing either very much or quite a lot. Young people who read frequently are also morelikely to write frequently, with nearly two-fifths of children and young people (37.5%) who readdaily also writing daily. Therefore, if we do not take action to support young people’sachievement in and enjoyment of reading, it is likely that other literacy skills will be affected.
11See http://www.literacytrust.org.uk/assets/0001/3536/Young_people_s_writing_in_2011-final.pdf for information from our annual
literacy survey in 2011 on writing
7/27/2019 Young People s Reading FINAL REPORT
http://slidepdf.com/reader/full/young-people-s-reading-final-report 23/60
© National Literacy Trust Children’s and Young People’s Reading Today 2012
23
Children’s and Young People’s Reading Today – Data tables
The following pages contain the information for each of our reading questions in tables. Eachtable contains information pertaining to the sample as a whole (top purple row) as well asbroken down by demographic background – gender, key stage, free school meal (FSM) uptake
and ethnic background. The shaded areas at the bottom of the table contain information wheretwo demographic background variables have been combined to provide a more detailed lookinto particular subgroups of young people.
Please note that due to rounding, the data in the tables do not necessarily add up to 100 percent exactly.
7/27/2019 Young People s Reading FINAL REPORT
http://slidepdf.com/reader/full/young-people-s-reading-final-report 24/60
© National Literacy Trust Children’s and Young People’s Reading Today 2012
24
Young people’s enjoyment of reading
Table 8: Enjoyment of reading in 2011 for whole sample and broken down bydemographic background
How much do you enjoy reading?
Very much
%
Quite a lot
%
Overall enjoyment %
A bit
%
Not at all
%
All (N = 20,950) 22.9 27.3 50.2 38.3 11.4
Boys (N = 10,484) 18.3 25.5 43.8 41.6 14.6
Girls (N = 10,466) 27.6 29.1 56.7 35.0 8.3
KS2 (N = 4,031) 44.3 28.7 73.0 23.2 3.8
KS3 (N = 13,698) 19.1 28.1 47.2 41.4 11.4
KS4 (N = 3,139) 12.6 21.8 34.4 44.6 21.0
FSM (N = 3,147) 21.8 23.5 45.3 41.0 13.7
Non-FSM (N = 16,498) 22.7 28.1 50.8 38.1 11.1
White (N = 15,211) 22.5 26.9 49.4 39.1 11.6
Mixed (N = 990) 27.5 29.3 56.8 33.3 9.8
Asian (N = 1,458) 25.7 32.5 58.2 34.5 7.3
Black (N = 815) 31.3 29.4 60.7 31.3 8.0
Boys – KS2 (N = 1,965) 36.8 28.7 65.5 28.7 5.8Girls – KS2 (N = 2,066) 51.3 28.8 80.1 18.1 1.9
Boys – KS3 (N = 6,907) 15.4 26.2 41.6 44.1 14.3
Girls – KS3 (N = 6,791) 22.9 30.1 53.0 38.6 8.4
Boys – KS4 (N = 1,565) 7.7 18.5 26.2 43.7 26.6
Girls – KS4 (N = 1,574) 17.5 25.0 42.5 42.0 15.5
Boys – FSM (N = 1,504) 18.8 21.8 40.6 43.3 16.2
Girls – FSM (N = 1,643) 24.5 25.0 49.5 39.0 11.4
Boys – Non-FSM
(N = 8,311) 17.7 26.3 44.0 41.6 14.4Girls – Non-FSM(N = 8,187)
27.9 29.9 57.8 34.6 7.7
Boys – White (N = 7,659) 18.2 25.4 43.6 42.0 14.5
Girls – White (N = 7,552) 26.8 28.4 55.2 36.1 8.7
Boys – Mixed (N = 486) 21.0 29.0 50.0 35.3 14.7
Girls – Mixed (N = 504) 33.8 29.6 63.4 31.4 5.2
Boys – Asian (N = 698) 20.9 28.3 49.2 40.0 10.8
Girls – Asian (N = 760) 30.1 36.3 66.4 29.6 4.1
Boys – Black (N = 413) 22.0 31.0 53.0 36.3 10.7
Girls – Black (N = 402) 40.8 27.9 68.7 26.1 5.2
7/27/2019 Young People s Reading FINAL REPORT
http://slidepdf.com/reader/full/young-people-s-reading-final-report 25/60
© National Literacy Trust Children’s and Young People’s Reading Today 2012
25
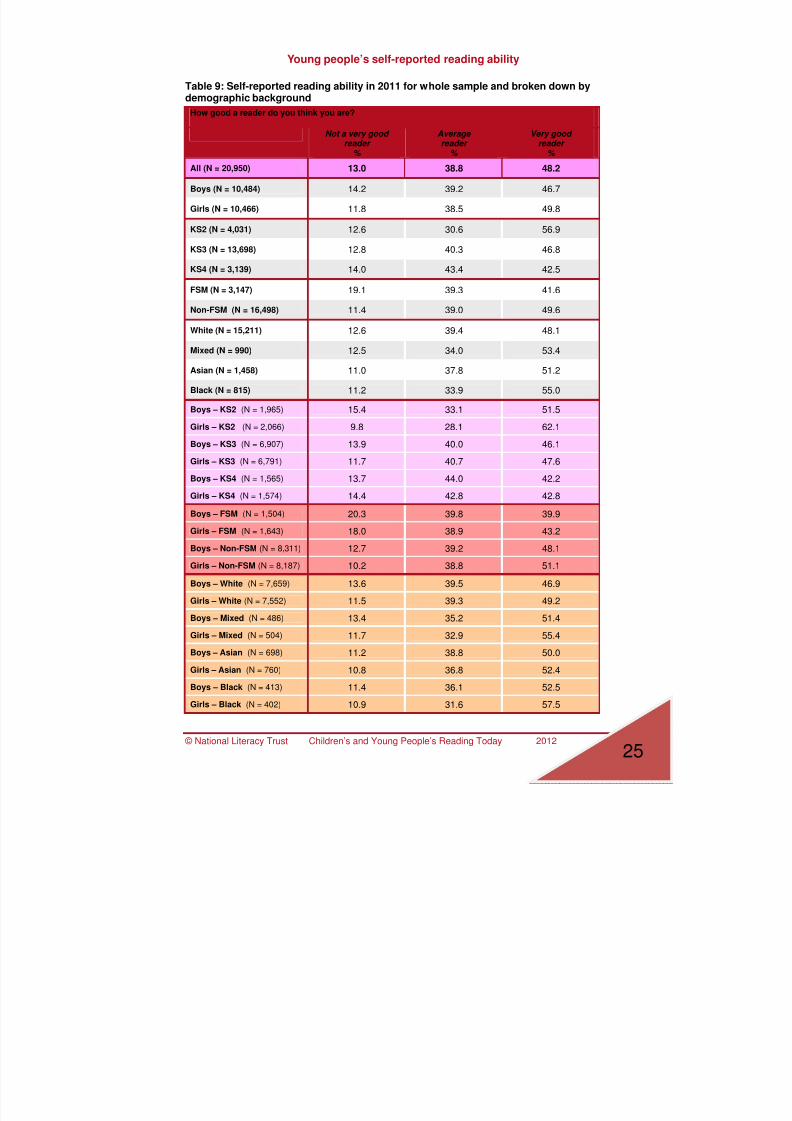
Young people’s self-reported reading ability
Table 9: Self-reported reading ability in 2011 for whole sample and broken down bydemographic background
How good a reader do you think you are?
Not a very good reader
%
Average reader
%
Very good reader
%
All (N = 20,950) 13.0 38.8 48.2
Boys (N = 10,484) 14.2 39.2 46.7
Girls (N = 10,466) 11.8 38.5 49.8
KS2 (N = 4,031) 12.6 30.6 56.9
KS3 (N = 13,698) 12.8 40.3 46.8
KS4 (N = 3,139) 14.0 43.4 42.5
FSM (N = 3,147) 19.1 39.3 41.6
Non-FSM (N = 16,498) 11.4 39.0 49.6
White (N = 15,211) 12.6 39.4 48.1
Mixed (N = 990) 12.5 34.0 53.4
Asian (N = 1,458) 11.0 37.8 51.2
Black (N = 815) 11.2 33.9 55.0
Boys – KS2 (N = 1,965) 15.4 33.1 51.5
Girls – KS2 (N = 2,066) 9.8 28.1 62.1
Boys – KS3 (N = 6,907) 13.9 40.0 46.1
Girls – KS3 (N = 6,791) 11.7 40.7 47.6
Boys – KS4 (N = 1,565) 13.7 44.0 42.2
Girls – KS4 (N = 1,574) 14.4 42.8 42.8
Boys – FSM (N = 1,504) 20.3 39.8 39.9
Girls – FSM (N = 1,643) 18.0 38.9 43.2
Boys – Non-FSM (N = 8,311) 12.7 39.2 48.1
Girls – Non-FSM (N = 8,187) 10.2 38.8 51.1
Boys – White (N = 7,659) 13.6 39.5 46.9
Girls – White (N = 7,552) 11.5 39.3 49.2
Boys – Mixed (N = 486) 13.4 35.2 51.4
Girls – Mixed (N = 504) 11.7 32.9 55.4
Boys – Asian (N = 698) 11.2 38.8 50.0
Girls – Asian (N = 760) 10.8 36.8 52.4
Boys – Black (N = 413) 11.4 36.1 52.5
Girls – Black (N = 402) 10.9 31.6 57.5
7/27/2019 Young People s Reading FINAL REPORT
http://slidepdf.com/reader/full/young-people-s-reading-final-report 26/60
7/27/2019 Young People s Reading FINAL REPORT
http://slidepdf.com/reader/full/young-people-s-reading-final-report 27/60
© National Literacy Trust Children’s and Young People’s Reading Today 2012
27
Which of the following do you read outside of class at least once a month?
T e x t
m e s s a g e s
M a g a z i n e s
W e b s i t e s
S o c i a l
n e t w o r k i n g
s i t e s
F i c t i o n
E m a i l s
L y r i c s
I n s t a n t
m e s s a g e s
% % % % % % % %
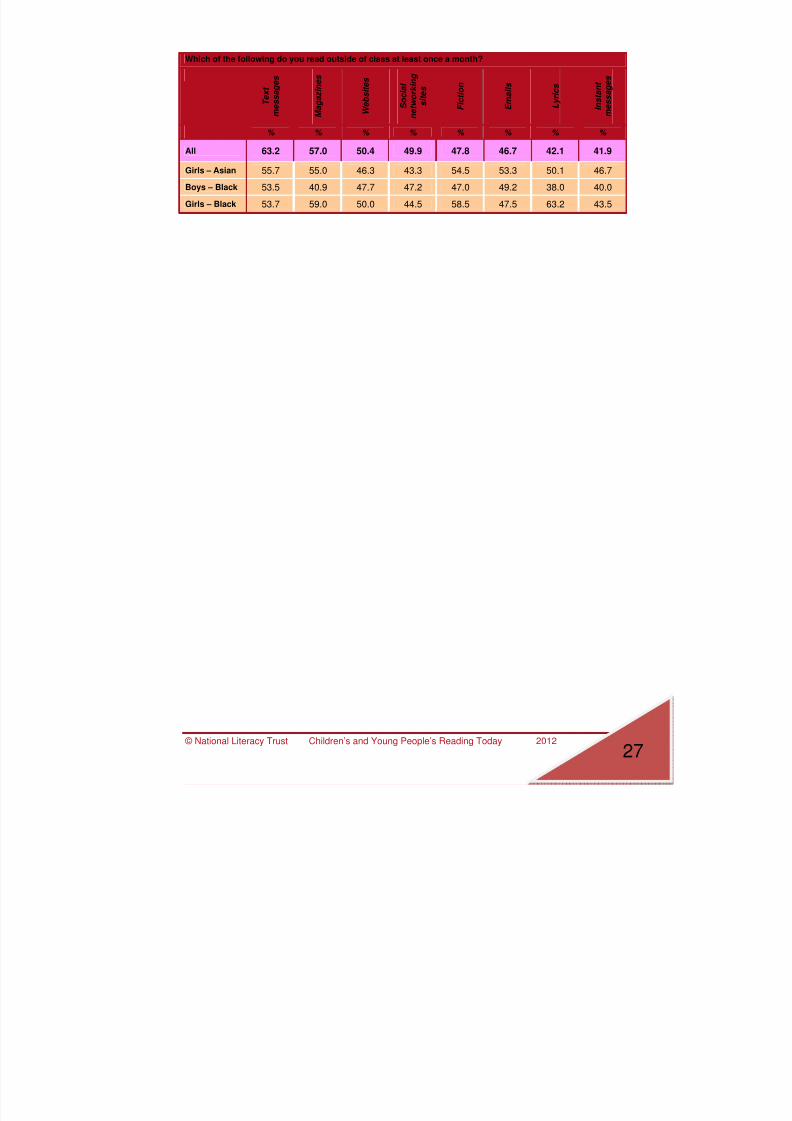
All 63.2 57.0 50.4 49.9 47.8 46.7 42.1 41.9
Girls – Asian 55.7 55.0 46.3 43.3 54.5 53.3 50.1 46.7
Boys – Black 53.5 40.9 47.7 47.2 47.0 49.2 38.0 40.0
Girls – Black 53.7 59.0 50.0 44.5 58.5 47.5 63.2 43.5
7/27/2019 Young People s Reading FINAL REPORT
http://slidepdf.com/reader/full/young-people-s-reading-final-report 28/60
© National Literacy Trust Children’s and Young People’s Reading Today 2012
28
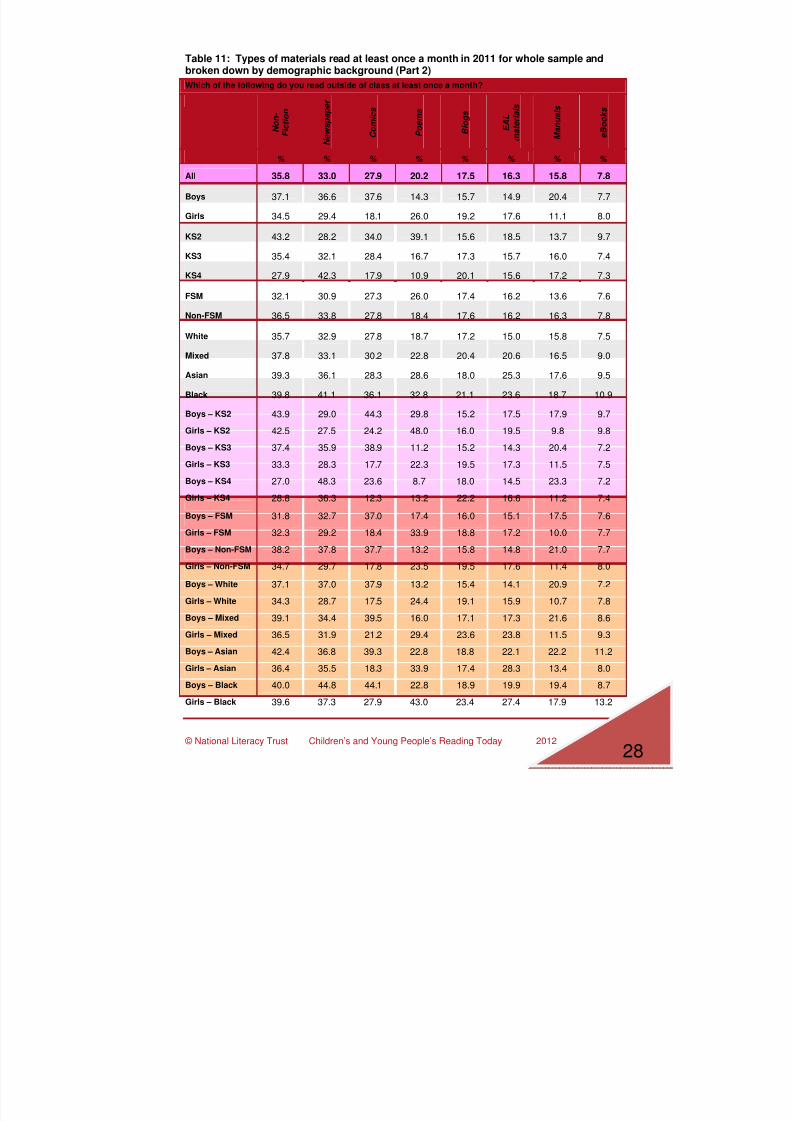
Table 11: Types of materials read at least once a month in 2011 for whole sample andbroken down by demographic background (Part 2)
Which of the following do you read outside of class at least once a month?
N o n -
F i c t i o n
N e
w s p a p e r
C o m i c s
P o e m s
B l o g s
E A L
m
a t e r i a l s
M
a n u a l s
e B o o k s
% % % % % % % %
All 35.8 33.0 27.9 20.2 17.5 16.3 15.8 7.8
Boys 37.1 36.6 37.6 14.3 15.7 14.9 20.4 7.7
Girls 34.5 29.4 18.1 26.0 19.2 17.6 11.1 8.0
KS2 43.2 28.2 34.0 39.1 15.6 18.5 13.7 9.7
KS3 35.4 32.1 28.4 16.7 17.3 15.7 16.0 7.4
KS4 27.9 42.3 17.9 10.9 20.1 15.6 17.2 7.3
FSM 32.1 30.9 27.3 26.0 17.4 16.2 13.6 7.6
Non-FSM 36.5 33.8 27.8 18.4 17.6 16.2 16.3 7.8
White 35.7 32.9 27.8 18.7 17.2 15.0 15.8 7.5
Mixed 37.8 33.1 30.2 22.8 20.4 20.6 16.5 9.0
Asian 39.3 36.1 28.3 28.6 18.0 25.3 17.6 9.5
Black 39.8 41.1 36.1 32.8 21.1 23.6 18.7 10.9
Boys – KS2 43.9 29.0 44.3 29.8 15.2 17.5 17.9 9.7Girls – KS2 42.5 27.5 24.2 48.0 16.0 19.5 9.8 9.8
Boys – KS3 37.4 35.9 38.9 11.2 15.2 14.3 20.4 7.2
Girls – KS3 33.3 28.3 17.7 22.3 19.5 17.3 11.5 7.5
Boys – KS4 27.0 48.3 23.6 8.7 18.0 14.5 23.3 7.2
Girls – KS4 28.8 36.3 12.3 13.2 22.2 16.6 11.2 7.4
Boys – FSM 31.8 32.7 37.0 17.4 16.0 15.1 17.5 7.6
Girls – FSM 32.3 29.2 18.4 33.9 18.8 17.2 10.0 7.7
Boys – Non-FSM38.2 37.8 37.7 13.2 15.8 14.8 21.0 7.7
Girls – Non-FSM 34.7 29.7 17.8 23.5 19.5 17.6 11.4 8.0
Boys – White 37.1 37.0 37.9 13.2 15.4 14.1 20.9 7.2
Girls – White 34.3 28.7 17.5 24.4 19.1 15.9 10.7 7.8
Boys – Mixed 39.1 34.4 39.5 16.0 17.1 17.3 21.6 8.6
Girls – Mixed 36.5 31.9 21.2 29.4 23.6 23.8 11.5 9.3
Boys – Asian 42.4 36.8 39.3 22.8 18.8 22.1 22.2 11.2
Girls – Asian 36.4 35.5 18.3 33.9 17.4 28.3 13.4 8.0
Boys – Black 40.0 44.8 44.1 22.8 18.9 19.9 19.4 8.7
Girls – Black 39.6 37.3 27.9 43.0 23.4 27.4 17.9 13.2
7/27/2019 Young People s Reading FINAL REPORT
http://slidepdf.com/reader/full/young-people-s-reading-final-report 29/60
© National Literacy Trust Children’s and Young People’s Reading Today 2012
29
Media formats young people read
Table 12: Reading media in 2011 for whole sample and broken down by demographicbackground
Paper
%
Computer
%
Mobile
%
Other device
%
iPad
%
Kindle
%
All (N = 20,950) 72.9 63.8 55.9 21.2 20.4 8.8
Boys (N = 10,484) 68.6 61.6 51.4 24.6 21.7 8.2
Girls (N = 10,466) 77.1 65.9 60.4 17.8 19.2 9.5
KS2 (N = 4,031) 70.5 52.2 32.3 18.9 24.3 10.7
KS3 (N = 13,698) 74.4 64.4 58.8 21.9 20.0 8.9
KS4 (N = 3,139) 69.4 75.8 73.7 21.3 17.4 6.2
FSM (N = 3,147) 65.3 63.1 56.5 19.5 20.7 8.8
Non-FSM (N = 16,498) 74.8 64.3 56.9 21.6 20.1 8.7
White (N = 15,211) 74.3 64.2 57.4 21.6 19.7 8.9
Mixed (N = 990) 73.3 65.1 52.4 20.8 24.4 9.2
Asian (N = 1,458) 74.3 67.5 51.0 20.9 23.2 7.6
Black (N = 815) 72.6 64.8 54.4 19.8 24.5 11.3
Boys – KS2 (N = 1,965) 66.6 52.0 29.8 21.7 25.4 10.3
Girls – KS2 (N = 2,066) 74.2 52.5 34.5 16.2 23.2 11.1
Boys – KS3 (N = 6,907) 70.3 61.3 53.1 25.2 21.2 8.2
Girls – KS3 (N = 6,791) 78.6 67.4 64.5 18.6 18.8 9.7
Boys – KS4 (N = 1,565) 63.8 74.6 71.1 25.9 19.2 5.6
Girls – KS4 (N = 1,574) 74.9 77.0 76.4 16.6 15.6 6.9
Boys – FSM (N = 1,504) 60.2 61.1 50.9 23.7 20.7 8.6
Girls – FSM (N = 1,643) 69.9 64.9 61.7 15.6 20.6 9.0
Boys – Non-FSM (N = 8,311) 70.6 62.2 52.5 24.9 21.5 8.0
Girls – Non-FSM (N = 8,187) 79.1 66.4 61.3 18.2 18.6 9.4
Boys – White (N = 7,659) 70.8 61.6 51.8 25.0 20.9 8.1
Girls – White (N = 7,552) 77.9 66.9 63.1 18.2 18.6 9.7
Boys – Mixed (N = 486) 67.9 63.2 48.1 24.3 26.1 7.8
Girls – Mixed (N = 504) 78.6 66.9 56.5 17.5 22.8 10.5
Boys – Asian (N = 698) 66.2 67.0 53.3 25.1 26.1 8.3
Girls – Asian (N = 760) 81.8 67.9 48.9 17.0 20.5 7.0
Boys – Black (N = 413) 67.3 65.6 57.1 23.0 23.5 9.0
Girls – Black (N = 402) 78.1 63.9 51.5 16.4 25.6 13.7
7/27/2019 Young People s Reading FINAL REPORT
http://slidepdf.com/reader/full/young-people-s-reading-final-report 30/60
© National Literacy Trust Children’s and Young People’s Reading Today 2012
30
How often young people read
Table 13: Reading frequency in 2011 for whole sample and broken down by demographicbackground
How often do you read outside of class?
Every day
%
A few times a week
%
About once a week
%
A few times a month
%
About once a month
%
Rarely
%
Never
%
All (N = 20,950) 30.8 28.2 9.8 6.7 2.9 15.0 6.6
Boys (N = 10,484) 26.8 27.2 10.3 7.3 3.2 17.3 8.4
Girls (N = 10,466) 35.3 29.1 9.4 6.1 2.7 12.6 4.8
KS2 (N = 4,031) 42.9 30.9 8.2 4.2 2.2 7.1 4.6
KS3 (N = 13,698) 29.0 28.7 10.6 7.1 2.9 15.6 6.1
KS4 (N = 3,139) 22.9 22.5 8.9 8.2 4.0 22.7 10.7
FSM (N = 3,147) 28.6 26.7 9.7 6.3 2.8 16.8 9.0
Non-FSM(N = 16,498)
31.2 28.3 9.9 6.8 3.0 14.9 6.0
White (N = 15,211) 30.7 28.3 9.7 6.7 2.8 15.5 6.3
Mixed (N = 990) 34.2 28.5 7.6 6.7 3.2 13.5 6.3
Asian (N = 1,458) 32.6 29.4 10.1 7.0 3.5 11.7 5.6
Black (N = 815) 38.3 26.8 9.7 6.0 2.7 10.6 5.9
Boys – KS2(N = 1,965)
35.4 32.5 9.8 5.5 2.6 8.5 5.7
Girls – KS2(N = 2,066)
50.0 29.4 6.6 3.0 1.7 5.7 3.6
Boys – KS3(N = 6,907)
25.0 27.1 10.8 7.7 3.2 18.2 7.9
Girls – KS3(N = 6,791)
33.1 30.2 10.3 6.6 2.6 12.9 4.3
Boys – KS4(N = 1,565)
20.5 21.1 8.4 8.0 3.8 25.0 13.3
Girls – KS4
(N = 1,574) 25.4 23.9 9.4 8.3 4.3 20.5 8.2Boys – FSM(N = 1,504)
24.0 25.3 9.9 6.8 3.8 19.2 10.9
Girls – FSM(N = 1,643)
32.7 28.0 9.6 5.8 2.0 14.6 7.3
Boys – Non-FSM(N = 8,311)
26.6 27.5 10.4 7.3 3.1 17.3 7.8
Girls – Non-FSM(N = 8,187)
35.8 29.2 9.4 6.2 2.8 12.4 4.2
Boys – White(N = 7,659)
26.3 27.6 9.8 7.3 3.1 18.1 7.9
Girls – White(N = 7,552)
35.1 29.0 9.6 6.2 2.6 12.9 4.7
Boys – Mixed(N = 486) 29.2 26.3 7.8 8.0 3.7 15.0 9.9

7/27/2019 Young People s Reading FINAL REPORT
http://slidepdf.com/reader/full/young-people-s-reading-final-report 31/60
© National Literacy Trust Children’s and Young People’s Reading Today 2012
31
How often do you read outside of class?
Every day
%
A few times a week
%
About once a week
%
A few times a month
%
About once a month
%
Rarely
%
Never
%
All (N = 20,950) 30.8 28.2 9.8 6.7 2.9 15.0 6.6
Girls – Mixed(N = 504)
39.0 30.6 7.4 5.4 2.8 12.1 2.8
Boys – Asian(N = 698)
27.8 27.7 10.2 8.0 4.0 13.8 8.5
Girls – Asian(N = 760)
37.0 31.1 10.0 6.1 3.0 9.9 3.0
Boys – Black(N = 413)
29.9 26.0 12.6 7.8 2.7 13.6 7.5
Girls – Black(N = 402)
46.9 27.7 6.4 4.2 2.7 7.5 4.2
7/27/2019 Young People s Reading FINAL REPORT
http://slidepdf.com/reader/full/young-people-s-reading-final-report 32/60
7/27/2019 Young People s Reading FINAL REPORT
http://slidepdf.com/reader/full/young-people-s-reading-final-report 33/60
7/27/2019 Young People s Reading FINAL REPORT
http://slidepdf.com/reader/full/young-people-s-reading-final-report 34/60
© National Literacy Trust Children’s and Young People’s Reading Today 2012
None
%
1
%
2
%
3
%
4
%
5
%
6
%
7
%
All (N = 20,950) 12.7 19.0 17.1 13.2 8.6 8.0 4.1 2.9
Boys – Non-FSM(N = 8,311)
16.2 21.5 17.8 12.5 7.9 6.9 3.6 2.5
Girls – Non-FSM(N = 8,187)
9.1 18.9 18.0 14.0 9.0 8.3 4.3 3.3
Boys – White (N = 7,659) 16.2 21.5 17.7 12.5 7.9 6.9 3.5 2.1
Girls – White (N = 7,552) 9.6 19.3 17.9 14.1 8.7 8.4 4.2 2.9
Boys – Mixed (N = 486) 15.6 18.3 14.8 15.4 6.0 7.1 4.0 4.0
Girls – Mixed (N = 504) 6.0 12.4 14.6 14.0 13.0 8.0 6.4 5.4
Boys – Asian (N = 698) 14.7 13.5 14.2 13.5 9.9 10.0 4.4 3.3
Girls – Asian (N = 760) 7.0 10.7 16.3 12.5 11.8 11.7 5.6 3.6
Boys – Black (N = 413) 9.8 13.7 12.0 13.2 10.2 10.0 5.1 5.9
Girls – Black (N = 402) 5.3 8.6 9.8 12.3 8.1 12.1 6.0 5.0
7/27/2019 Young People s Reading FINAL REPORT
http://slidepdf.com/reader/full/young-people-s-reading-final-report 35/60
Young people’s attitudes towards reading
Table 16.1: Attitudes towards reading in 2011 for whole sample and broken down bydemographic background – The more I read, the better I become
The more I read, the better I become
Overall agreement %
Neither agree nor disagree %
Overall disagreement %
Not sure
%
All (N = 20,950) 76.4 10.5 6.3 6.7
Boys (N = 10,484) 74.7 11.2 7.2 7.0
Girls (N = 10,466) 78.1 9.9 5.5 6.5
KS2 (N = 4,031) 87.9 4.4 3.6 4.1
KS3 (N = 13,698) 76.0 10.7 6.4 6.9
KS4 (N = 3,139)64.0 17.5 9.4 9.1
FSM (N = 3,147) 75.7 9.4 7.3 7.6
Non-FSM (N = 16,498) 76.3 11.0 6.2 6.5
White (N = 15,211) 75.9 11.0 6.5 6.8
Mixed (N = 990) 79.5 8.2 6.4 5.9
Asian (N = 1,458) 81.1 8.6 4.8 5.5
Black (N = 815) 81.4 7.9 5.9 4.7
Boys – KS2 (N = 1,965) 84.7 5.1 4.7 5.5Girls – KS2 (N = 2,066) 90.9 3.7 2.5 2.9
Boys – KS3 (N = 6,907) 74.8 11.2 7.1 6.9
Girls – KS3 (N = 6,791) 77.3 10.1 5.6 6.9
Boys – KS4 (N = 1,565) 62.6 18.1 10.4 8.9
Girls – KS4 (N = 1,574) 65.4 16.9 8.4 9.4
Boys – FSM (N = 1,504) 73.7 9.7 8.5 8.1
Girls – FSM (N = 1,643) 77.5 9.2 6.2 7.1
Boys – Non-FSM (N = 8,311) 74.7 11.7 7.0 6.6
Girls – Non-FSM (N = 8,187) 78.0 10.2 5.4 6.4
Boys – White (N = 7,659) 74.5 11.7 6.9 6.9
Girls – White (N = 7,552) 77.2 10.4 5.7 6.7
Boys – Mixed (N = 486) 74.3 9.1 8.9 7.6
Girls – Mixed (N = 504) 84.4 7.3 4.0 4.3
Boys – Asian (N = 698) 78.3 10.1 6.5 5.1
Girls – Asian (N = 760) 83.8 7.2 3.2 5.8
Boys – Black (N = 413) 78.9 8.7 7.4 5.1
Girls – Black (N = 402) 84.0 7.2 4.4 4.4
7/27/2019 Young People s Reading FINAL REPORT
http://slidepdf.com/reader/full/young-people-s-reading-final-report 36/60
7/27/2019 Young People s Reading FINAL REPORT
http://slidepdf.com/reader/full/young-people-s-reading-final-report 37/60
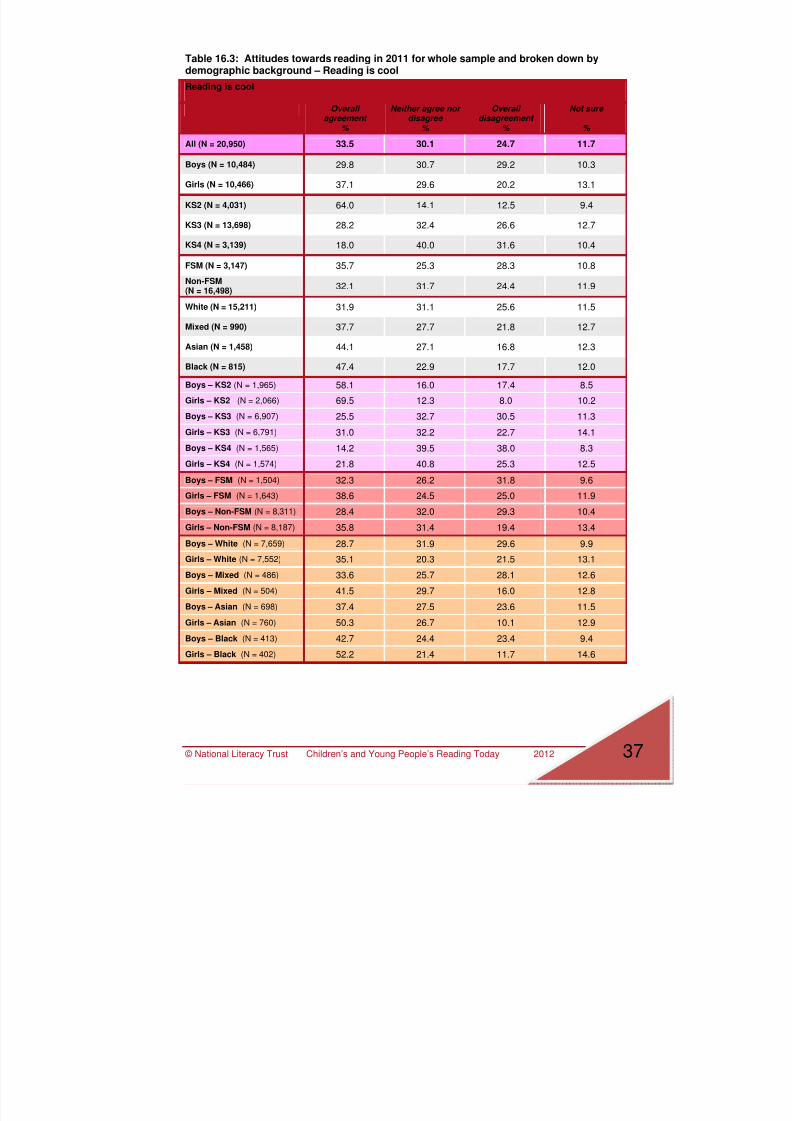
© National Literacy Trust Children’s and Young People’s Reading Today 2012 37
Table 16.3: Attitudes towards reading in 2011 for whole sample and broken down bydemographic background – Reading is cool
Reading is cool
Overall agreement
%
Neither agree nor disagree
%
Overall disagreement
%
Not sure
%
All (N = 20,950) 33.5 30.1 24.7 11.7
Boys (N = 10,484) 29.8 30.7 29.2 10.3
Girls (N = 10,466) 37.1 29.6 20.2 13.1
KS2 (N = 4,031) 64.0 14.1 12.5 9.4
KS3 (N = 13,698) 28.2 32.4 26.6 12.7
KS4 (N = 3,139) 18.0 40.0 31.6 10.4
FSM (N = 3,147) 35.7 25.3 28.3 10.8
Non-FSM(N = 16,498)
32.1 31.7 24.4 11.9
White (N = 15,211) 31.9 31.1 25.6 11.5
Mixed (N = 990) 37.7 27.7 21.8 12.7
Asian (N = 1,458) 44.1 27.1 16.8 12.3
Black (N = 815) 47.4 22.9 17.7 12.0
Boys – KS2 (N = 1,965) 58.1 16.0 17.4 8.5
Girls – KS2 (N = 2,066) 69.5 12.3 8.0 10.2
Boys – KS3 (N = 6,907) 25.5 32.7 30.5 11.3
Girls – KS3 (N = 6,791) 31.0 32.2 22.7 14.1
Boys – KS4 (N = 1,565) 14.2 39.5 38.0 8.3
Girls – KS4 (N = 1,574) 21.8 40.8 25.3 12.5
Boys – FSM (N = 1,504) 32.3 26.2 31.8 9.6
Girls – FSM (N = 1,643) 38.6 24.5 25.0 11.9
Boys – Non-FSM (N = 8,311) 28.4 32.0 29.3 10.4
Girls – Non-FSM (N = 8,187) 35.8 31.4 19.4 13.4
Boys – White (N = 7,659) 28.7 31.9 29.6 9.9
Girls – White (N = 7,552) 35.1 20.3 21.5 13.1
Boys – Mixed (N = 486) 33.6 25.7 28.1 12.6
Girls – Mixed (N = 504) 41.5 29.7 16.0 12.8
Boys – Asian (N = 698) 37.4 27.5 23.6 11.5
Girls – Asian (N = 760) 50.3 26.7 10.1 12.9
Boys – Black (N = 413) 42.7 24.4 23.4 9.4
Girls – Black (N = 402) 52.2 21.4 11.7 14.6

7/27/2019 Young People s Reading FINAL REPORT
http://slidepdf.com/reader/full/young-people-s-reading-final-report 38/60

7/27/2019 Young People s Reading FINAL REPORT
http://slidepdf.com/reader/full/young-people-s-reading-final-report 39/60
© National Literacy Trust Children’s and Young People’s Reading Today 2012 39
Table 16.5: Attitudes towards reading in 2011 for whole sample and broken down bydemographic background – I only read when I have to
I only read when I have to
Overall agreement
%
Neither agree nor disagree
%
Overall disagreement
%
Not sure
%
All (N = 20,950) 26.5 16.2 53.0 4.3
Boys (N = 10,484) 31.6 17.0 47.2 4.2
Girls (N = 10,466) 21.4 15.4 58.8 4.4
KS2 (N = 4,031) 26.2 11.6 56.9 5.4
KS3 (N = 13,698) 24.9 16.7 54.3 4.1
KS4 (N = 3,139) 34.0 19.5 42.6 3.8
FSM (N = 3,147) 32.8 14.6 47.6 5.1
Non-FSM(N = 16,498)
25.1 16.6 54.5 3.8
White (N = 15,211) 26.1 16.0 53.8 4.0
Mixed (N = 990) 23.6 17.5 53.9 5.0
Asian (N = 1,458) 26.3 16.5 52.6 4.7
Black (N = 815) 26.1 17.2 52.6 4.1
Boys – KS2 (N = 1,965) 34.1 11.8 49.5 4.6
Girls – KS2 (N = 2,066) 18.7 11.4 63.9 6.1
Boys – KS3 (N = 6,907) 28.9 17.6 49.5 4.0
Girls – KS3 (N = 6,791) 20.7 15.9 59.3 4.1
Boys – KS4 (N = 1,565) 40.5 20.7 34.5 4.3
Girls – KS4 (N = 1,574) 27.7 18.4 50.6 3.3
Boys – FSM (N = 1,504) 37.9 15.3 41.8 5.0
Girls – FSM (N = 1,643) 28.1 13.9 52.9 5.1
Boys – Non-FSM (N = 8,311) 30.3 17.5 48.5 3.7
Girls – Non-FSM (N = 8,187) 19.8 15.7 60.6 3.9
Boys – White (N = 7,659) 30.9 17.0 48.4 3.7
Girls – White (N = 7,552) 21.3 15.0 59.4 4.3
Boys – Mixed (N = 486) 29.2 17.1 48.2 5.6
Girls – Mixed (N = 504) 18.4 18.0 59.2 4.4
Boys – Asian (N = 698) 34.2 16.4 44.7 4.7
Girls – Asian (N = 760) 19.0 16.6 59.8 4.6
Boys – Black (N = 413) 32.0 19.8 44.7 3.6
Girls – Black (N = 402) 19.9 14.4 60.9 4.7
7/27/2019 Young People s Reading FINAL REPORT
http://slidepdf.com/reader/full/young-people-s-reading-final-report 40/60
© National Literacy Trust Children’s and Young People’s Reading Today 2012 40
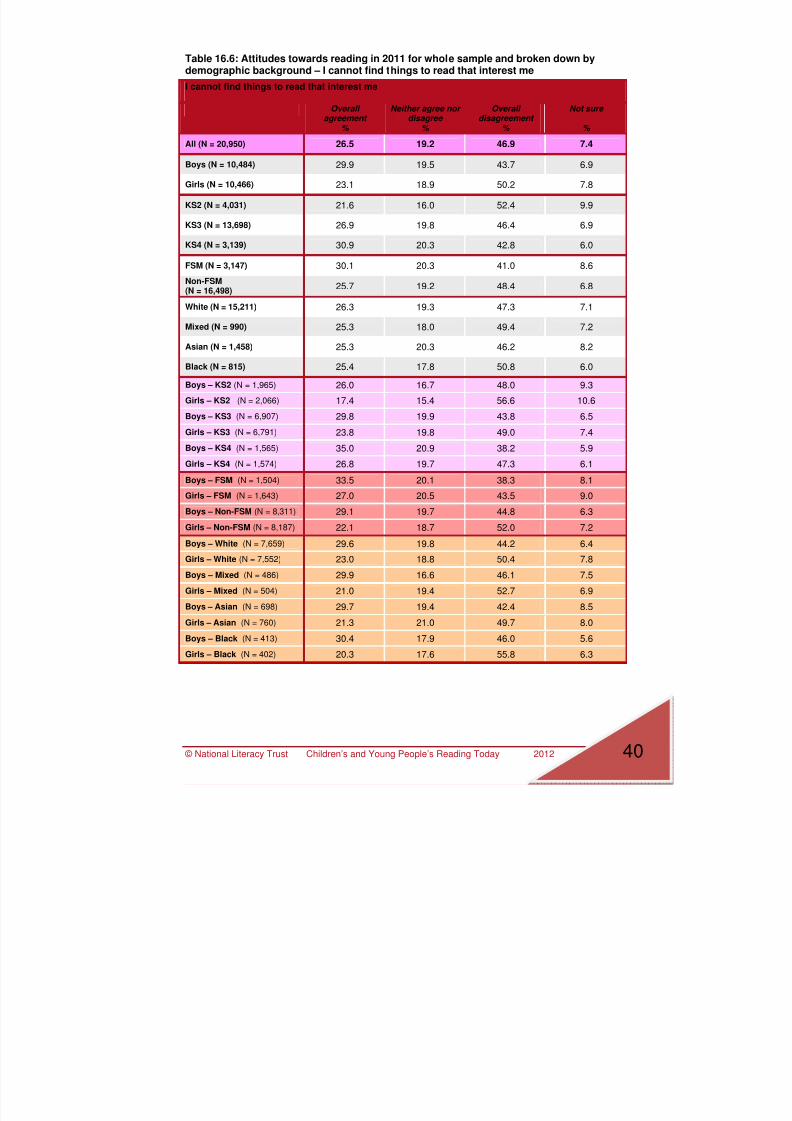
Table 16.6: Attitudes towards reading in 2011 for whole sample and broken down bydemographic background – I cannot find things to read that interest me
I cannot find things to read that interest me
Overall agreement
%
Neither agree nor disagree
%
Overall disagreement
%
Not sure
%
All (N = 20,950) 26.5 19.2 46.9 7.4
Boys (N = 10,484) 29.9 19.5 43.7 6.9
Girls (N = 10,466) 23.1 18.9 50.2 7.8
KS2 (N = 4,031) 21.6 16.0 52.4 9.9
KS3 (N = 13,698) 26.9 19.8 46.4 6.9
KS4 (N = 3,139) 30.9 20.3 42.8 6.0
FSM (N = 3,147) 30.1 20.3 41.0 8.6
Non-FSM(N = 16,498)
25.7 19.2 48.4 6.8
White (N = 15,211) 26.3 19.3 47.3 7.1
Mixed (N = 990) 25.3 18.0 49.4 7.2
Asian (N = 1,458) 25.3 20.3 46.2 8.2
Black (N = 815) 25.4 17.8 50.8 6.0
Boys – KS2 (N = 1,965) 26.0 16.7 48.0 9.3
Girls – KS2 (N = 2,066) 17.4 15.4 56.6 10.6
Boys – KS3 (N = 6,907) 29.8 19.9 43.8 6.5
Girls – KS3 (N = 6,791) 23.8 19.8 49.0 7.4
Boys – KS4 (N = 1,565) 35.0 20.9 38.2 5.9
Girls – KS4 (N = 1,574) 26.8 19.7 47.3 6.1
Boys – FSM (N = 1,504) 33.5 20.1 38.3 8.1
Girls – FSM (N = 1,643) 27.0 20.5 43.5 9.0
Boys – Non-FSM (N = 8,311) 29.1 19.7 44.8 6.3
Girls – Non-FSM (N = 8,187) 22.1 18.7 52.0 7.2
Boys – White (N = 7,659) 29.6 19.8 44.2 6.4
Girls – White (N = 7,552) 23.0 18.8 50.4 7.8
Boys – Mixed (N = 486) 29.9 16.6 46.1 7.5
Girls – Mixed (N = 504) 21.0 19.4 52.7 6.9
Boys – Asian (N = 698) 29.7 19.4 42.4 8.5
Girls – Asian (N = 760) 21.3 21.0 49.7 8.0
Boys – Black (N = 413) 30.4 17.9 46.0 5.6
Girls – Black (N = 402) 20.3 17.6 55.8 6.3

7/27/2019 Young People s Reading FINAL REPORT
http://slidepdf.com/reader/full/young-people-s-reading-final-report 41/60

7/27/2019 Young People s Reading FINAL REPORT
http://slidepdf.com/reader/full/young-people-s-reading-final-report 42/60
© National Literacy Trust Children’s and Young People’s Reading Today 2012 42
Table 16.8: Attitudes towards reading in 2011 for whole sample and broken down bydemographic background – Reading is more for girls than boys
Reading is more for girls than boys
Overall agreement
%
Neither agree nor disagree
%
Overall disagreement
%
Not sure
%
All (N = 20,950) 14.8 19.0 57.6 8.5
Boys (N = 10,484) 17.9 19.2 55.0 7.9
Girls (N = 10,466) 11.7 18.9 60.3 9.1
KS2 (N = 4,031) 23.1 14.7 52.9 9.3
KS3 (N = 13,698) 13.1 20.0 58.7 8.3
KS4 (N = 3,139) 12.2 20.3 59.0 8.5
FSM (N = 3,147) 19.2 17.7 52.9 10.2
Non-FSM(N = 16,498)
13.5 19.3 59.0 8.1
White (N = 15,211) 14.1 19.5 58.1 8.3
Mixed (N = 990) 15.8 16.6 59.9 7.7
Asian (N = 1,458) 16.0 16.0 58.4 9.6
Black (N = 815) 17.3 17.1 58.6 7.0
Boys – KS2 (N = 1,965) 22.5 14.4 55.5 7.5
Girls – KS2 (N = 2,066) 23.7 14.9 50.3 11.0
Boys – KS3 (N = 6,907) 16.9 19.7 55.5 8.0
Girls – KS3 (N = 6,791) 9.2 20.3 61.9 8.6
Boys – KS4 (N = 1,565) 17.3 22.3 51.9 8.4
Girls – KS4 (N = 1,574) 7.2 18.3 66.0 8.5
Boys – FSM (N = 1,504) 23.0 17.4 49.0 10.5
Girls – FSM (N = 1,643) 15.8 17.9 56.4 9.9
Boys – Non-FSM (N = 8,311) 16.8 19.6 56.3 7.4
Girls – Non-FSM (N = 8,187) 10.2 19.1 61.8 8.9
Boys – White (N = 7,659) 17.4 19.6 55.5 7.4
Girls – White (N = 7,552) 10.7 19.5 60.6 9.2
Boys – Mixed (N = 486) 18.7 11.9 59.4 7.9
Girls – Mixed (N = 504) 13.0 19.1 60.3 7.5
Boys – Asian (N = 698) 18.5 16.5 54.4 10.6
Girls – Asian (N = 760) 13.7 15.4 62.1 8.8
Boys – Black (N = 413) 17.1 17.9 58.0 7.0
Girls – Black (N = 402) 17.6 16.3 59.2 6.9
7/27/2019 Young People s Reading FINAL REPORT
http://slidepdf.com/reader/full/young-people-s-reading-final-report 43/60
© National Literacy Trust Children’s and Young People’s Reading Today 2012 43
Children’s and Young People’s Reading Today – Attainmentdata
Some of the interesting relationships between reading variables and reading attainment havealready been highlighted on pages 17-20. This section explores those relationships in greaterdetail.
Attainment data for reading were available for 7,000 KS2 and KS3 pupils. Since our attainmentdata contained a varied set of levels and spanned young people aged 9 to 14, we standardisedthe data to form three crude categories to be applied to all ages: below expected level for theirage, at expected level for their age and above expected level for their age.
Nearly 9 in 10 young people read at the expected level for their age (71.0%) or above theexpected level for their age (16%). However, 1 in 8 (13%) read below the expected level fortheir age, which is lower than the national average.
The relationships with reading attainment are displayed in two ways. The first table in each
section takes the reading variable as a starting point and explores how it is related toattainment. The second table in each section then takes the reading attainment categories as astarting point and explores how each are related to the reading variable.
Reading attainment and young people’s enjoyment of reading
Tables 17 and 18 show that there is a clear relationship between reading attainment andenjoyment of reading.
Young people who enjoy reading very much are more likely to read above the level expected for
their age, with nearly a third of young people who enjoy reading very much reading above theexpected level, nearly three-fifths reading at the expected level and only 3.5% reading below theexpected level for their age (see Table 17).
Of those young people who do not enjoy reading at all, a third read below the expected leveland nearly three-fifths at the expected level. Only 8% of young people who do not enjoy readingat all read above the expected level for their age.
Overall, young people who enjoy reading very much are nearly five times as likely to read at theexpected level for their age compared with young people who do not enjoy reading at all.Alternatively, young people who do not enjoy reading at all are nearly ten times as likely to bereading below the expected level for their age compared with young people who enjoy reading
very much.
Table 17: Enjoyment of reading and reading attainment (N = 7,000)Below
expected level %
At expected level
%
Above expected level
%
Very much 3.5 59.2 37.4
Quite a lot 5.8 80.7 13.5
A bit 17.5 75.2 7.3
Not at all 33.2 58.7 8.2
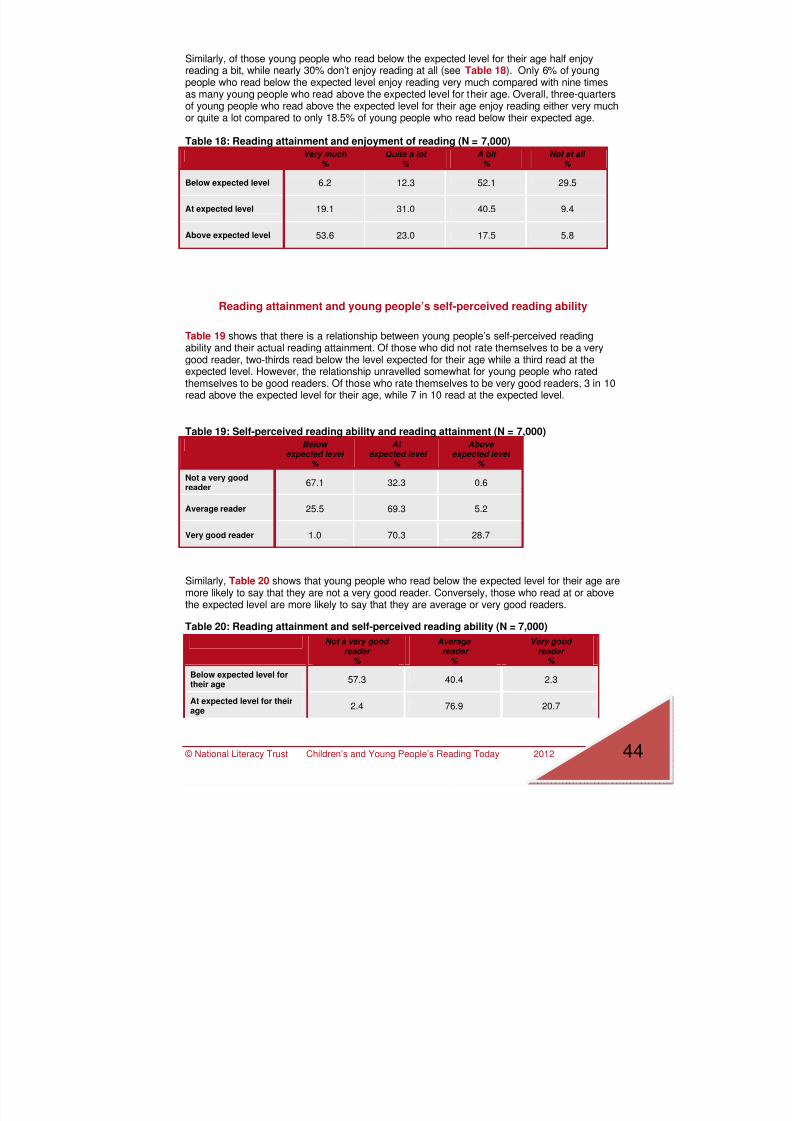
7/27/2019 Young People s Reading FINAL REPORT
http://slidepdf.com/reader/full/young-people-s-reading-final-report 44/60

7/27/2019 Young People s Reading FINAL REPORT
http://slidepdf.com/reader/full/young-people-s-reading-final-report 45/60
© National Literacy Trust Children’s and Young People’s Reading Today 2012 45
Not a very good reader
%
Average reader
%
Very good reader
%
Above expected level fortheir age
0.9 17.3 81.8
Reading attainment and the length of time young people spend readingYoung people’s reading skills are related to the frequency with which they read.
Table 21 shows that the proportion of young people who are in the highest achievementcategory declines as the frequency with which they read outside of class declines. While 28% ofyoung people who read every day read above the level expected for their age, only 2 to 9% ofyoung people who read rarely or never read at that level. Overall, nearly half of those who neverread outside of class read below the level expected for their age.
Table 21: Reading frequency and reading attainment (N = 7,000)
Below
expected level%
At
expected level%
Above
expected level%
Every day 5.5 66.3 28.2
A few times a week 9.4 78.1 12.5
About once a week 14.1 77.1 8.8
A few times a month 15.4 76.3 8.3
About once a month 20.2 70.4 9.4
Rarely 21.6 69.8 8.6
Never 45.6 52.3 2.1
Table 22 shows that four times as many young people who read above the expected level readevery day compared with young people who read below the expected level for their age.Conversely, young people who read below the expected level for their age were four times aslikely to say that they rarely or never read compared with young people who read above the
level expected for their age.
Table 22: Reading attainment and reading frequency (N = 7,000)
Every day
%
Few times a week
%
Once a week
%
Few times a month
%
Once a month
%
Rarely
%
Never
%
Belowexpected level
13.0 20.4 10.8 8.0 4.6 25.0 18.1
At expectedlevel
28.7 30.9 10.7 7.2 2.9 14.7 4.8
Aboveexpected level 54.3 22.0 5.4 3.5 1.7 8.0 5.0
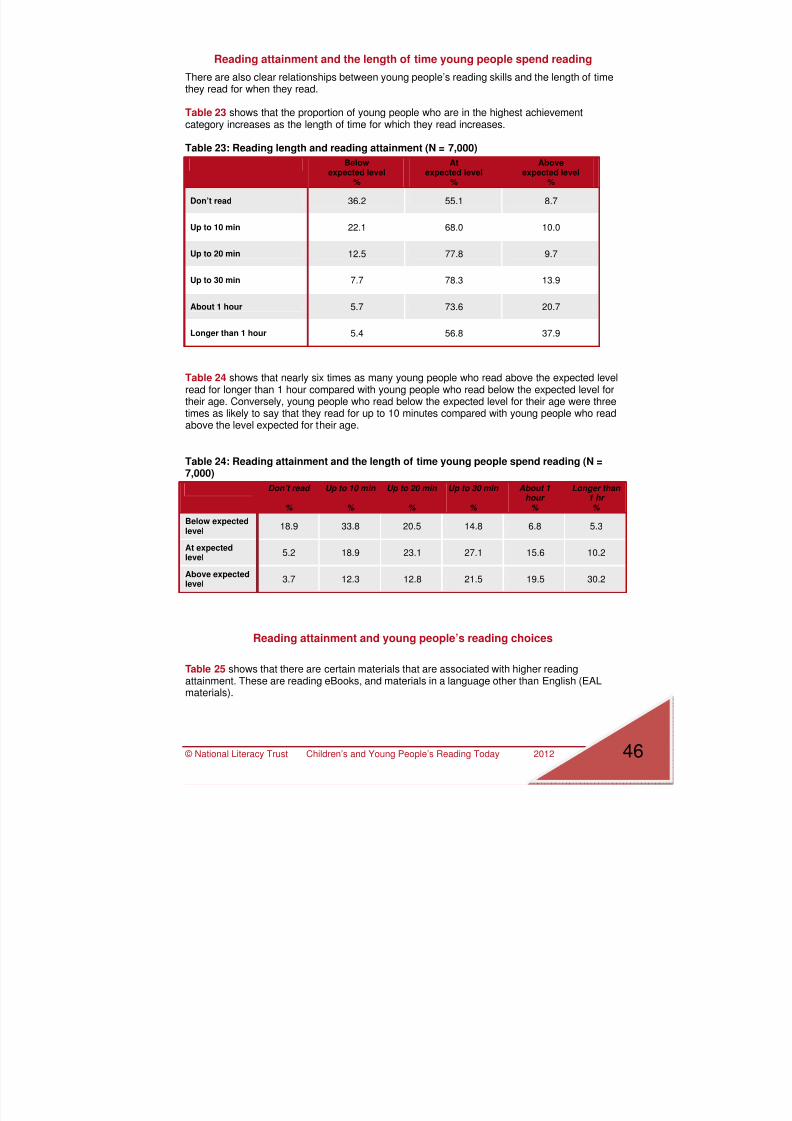
7/27/2019 Young People s Reading FINAL REPORT
http://slidepdf.com/reader/full/young-people-s-reading-final-report 46/60
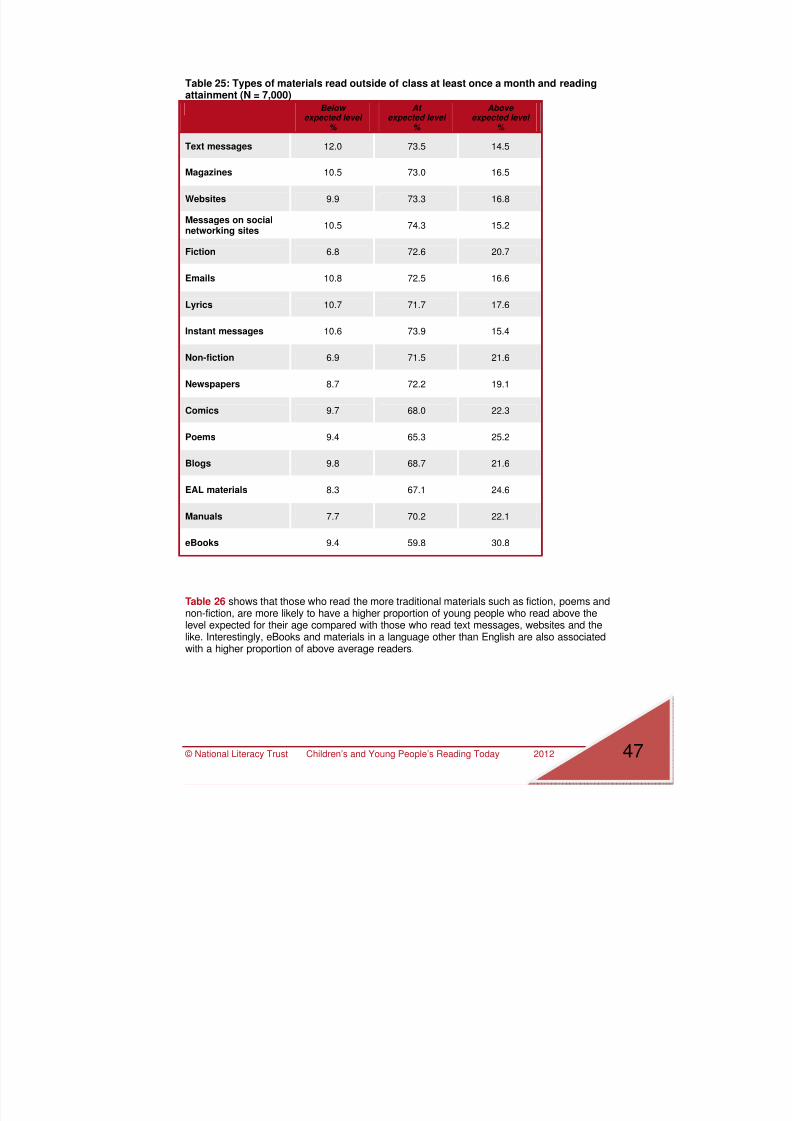
7/27/2019 Young People s Reading FINAL REPORT
http://slidepdf.com/reader/full/young-people-s-reading-final-report 47/60
© National Literacy Trust Children’s and Young People’s Reading Today 2012 47
Table 25: Types of materials read outside of class at least once a month and readingattainment (N = 7,000)
Below expected level
%
At expected level
%
Above expected level
%
Text messages 12.0 73.5 14.5
Magazines 10.5 73.0 16.5
Websites 9.9 73.3 16.8
Messages on socialnetworking sites
10.5 74.3 15.2
Fiction 6.8 72.6 20.7
Emails 10.8 72.5 16.6
Lyrics 10.7 71.7 17.6
Instant messages 10.6 73.9 15.4
Non-fiction 6.9 71.5 21.6
Newspapers 8.7 72.2 19.1
Comics9.7 68.0 22.3
Poems 9.4 65.3 25.2
Blogs 9.8 68.7 21.6
EAL materials 8.3 67.1 24.6
Manuals 7.7 70.2 22.1
eBooks 9.4 59.8 30.8
Table 26 shows that those who read the more traditional materials such as fiction, poems andnon-fiction, are more likely to have a higher proportion of young people who read above thelevel expected for their age compared with those who read text messages, websites and thelike. Interestingly, eBooks and materials in a language other than English are also associatedwith a higher proportion of above average readers.
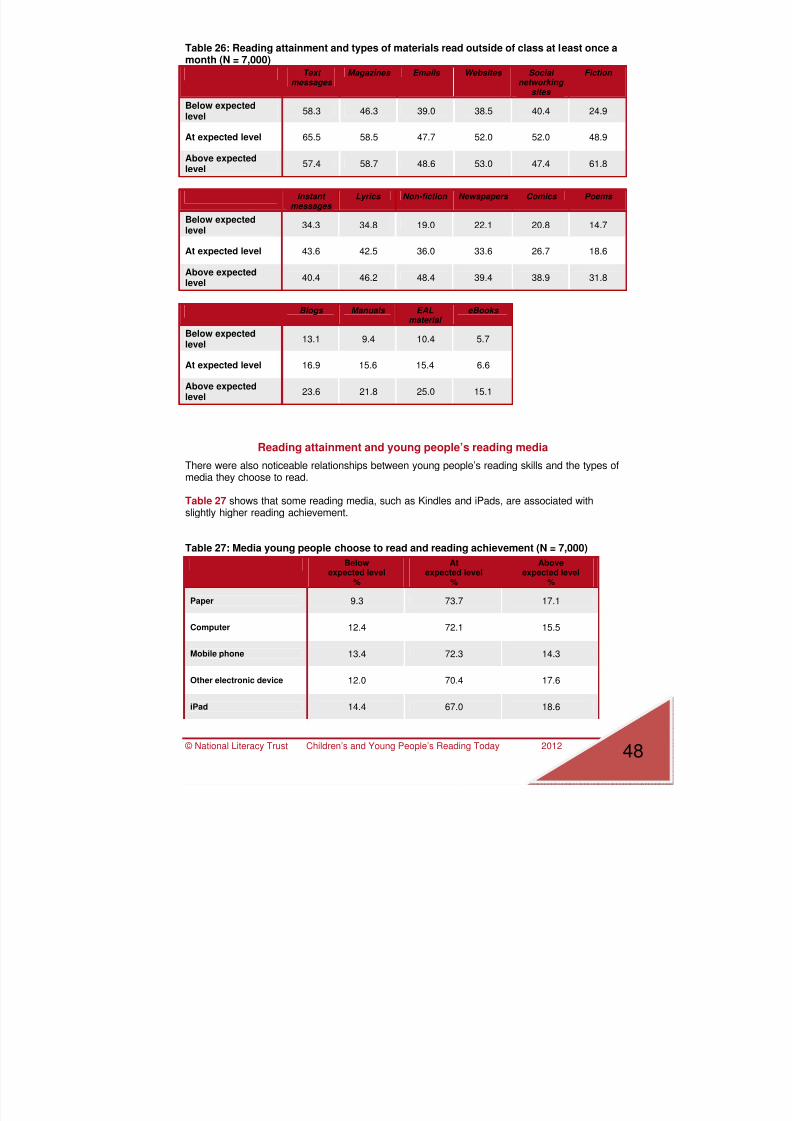
7/27/2019 Young People s Reading FINAL REPORT
http://slidepdf.com/reader/full/young-people-s-reading-final-report 48/60
© National Literacy Trust Children’s and Young People’s Reading Today 2012 48
Table 26: Reading attainment and types of materials read outside of class at least once amonth (N = 7,000)
Text messages
Magazines Emails Websites Social networking
sites
Fiction
Below expectedlevel
58.3 46.3 39.0 38.5 40.4 24.9
At expected level 65.5 58.5 47.7 52.0 52.0 48.9
Above expectedlevel
57.4 58.7 48.6 53.0 47.4 61.8
Instant messages
Lyrics Non-fiction Newspapers Comics Poems
Below expectedlevel
34.3 34.8 19.0 22.1 20.8 14.7
At expected level 43.6 42.5 36.0 33.6 26.7 18.6
Above expectedlevel 40.4 46.2 48.4 39.4 38.9 31.8
Blogs Manuals EALmaterial
eBooks
Below expectedlevel
13.1 9.4 10.4 5.7
At expected level 16.9 15.6 15.4 6.6
Above expectedlevel
23.6 21.8 25.0 15.1
Reading attainment and young people’s reading media
There were also noticeable relationships between young people’s reading skills and the types ofmedia they choose to read.
Table 27 shows that some reading media, such as Kindles and iPads, are associated withslightly higher reading achievement.
Table 27: Media young people choose to read and reading achievement (N = 7,000)
Belowexpected level
%
Atexpected level
%
Aboveexpected level
%
Paper 9.3 73.7 17.1
Computer 12.4 72.1 15.5
Mobile phone 13.4 72.3 14.3
Other electronic device 12.0 70.4 17.6
iPad 14.4 67.0 18.6

7/27/2019 Young People s Reading FINAL REPORT
http://slidepdf.com/reader/full/young-people-s-reading-final-report 49/60
© National Literacy Trust Children’s and Young People’s Reading Today 2012 49
Belowexpected level
%
Atexpected level
%
Aboveexpected level
%
Kindle 10.2 61.7 28.0
Table 28 shows that young people who read above the expected level are more likely to readpaper-based materials as well as read on the Kindle compared with young people who readbelow the level expected for their age.
Table 28: Reading attainment and media young people choose to read (N = 7,000)
Paper
%
Computer
%
Mobile
%
Other device
%
iPad
%
Kindle
%
Below expectedlevel
52.1 60.9 57.6 19.6 22.6 7.0
At expectedlevel
75.6 64.8 57.0 21.0 19.3 7.7
Above expectedlevel
77.7 61.6 50.0 23.4 23.8 15.5
Most young people (62%) say that they read paper-based materials as well as at least onetechnology-based medium. Only 17.8% say that they just read paper-based texts, while a fifth(20.2%) say that they do not read any paper-based texts at all. In terms of attainment, however,there were slightly more young people who read at or above the level expected for their agewho read paper-based as well as technology-based texts (91.9%; 57.6% at expected level and34.3% above expected level) than those who only read paper-based texts (90.2%; 56% atexpected level and 34.3% above expected level) or those who only read technology-based texts(78.5%; 56.1% at expected level and 22.4% at above expected levels). So, reading both paper-
based as well as technology-based texts afford an advantage in terms of attainment comparedwith just reading paper-based texts (only a slight difference though) and reading justtechnology-based texts.
Reading attainment and number of books read a month
Table 29 shows that as the number of books read in a month increases, the proportion of youngpeople who read above their expected level also increases.
Table 29: Number of books read a month and reading attainment (N = 7,000)Below
expected level %
At expected level
%
Above expected level
%
None 26.8 64.5 8.7
1 16.7 74.9 8.4
2 10.9 78.5 10.6
3 10.5 78.6 10.9
4 9.9 74.4 15.7
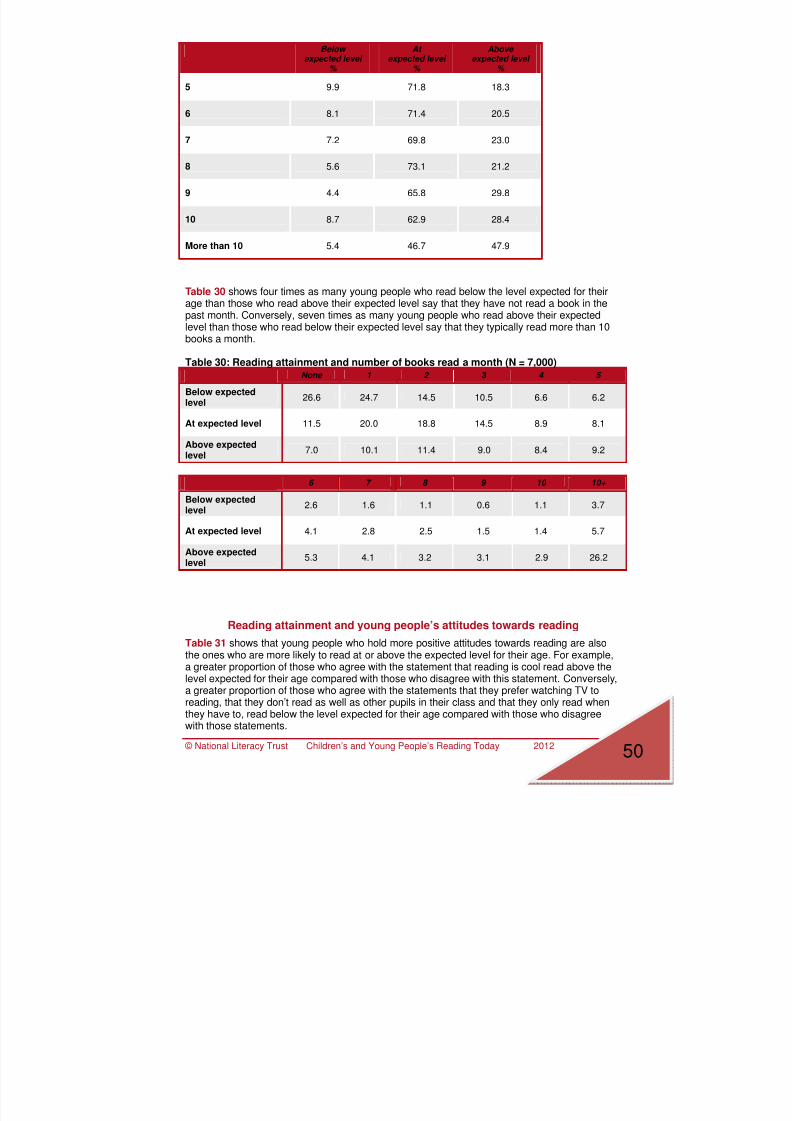
7/27/2019 Young People s Reading FINAL REPORT
http://slidepdf.com/reader/full/young-people-s-reading-final-report 50/60
© National Literacy Trust Children’s and Young People’s Reading Today 2012 50
Below expected level
%
At expected level
%
Above expected level
%
5 9.9 71.8 18.3
6 8.1 71.4 20.5
7 7.2 69.8 23.0
8 5.6 73.1 21.2
9 4.4 65.8 29.8
10 8.7 62.9 28.4
More than 10 5.4 46.7 47.9
Table 30 shows four times as many young people who read below the level expected for theirage than those who read above their expected level say that they have not read a book in thepast month. Conversely, seven times as many young people who read above their expectedlevel than those who read below their expected level say that they typically read more than 10books a month.
Table 30: Reading attainment and number of books read a month (N = 7,000)None 1 2 3 4 5
Below expectedlevel
26.6 24.7 14.5 10.5 6.6 6.2
At expected level 11.5 20.0 18.8 14.5 8.9 8.1
Above expectedlevel
7.0 10.1 11.4 9.0 8.4 9.2
6 7 8 9 10 10+
Below expectedlevel
2.6 1.6 1.1 0.6 1.1 3.7
At expected level 4.1 2.8 2.5 1.5 1.4 5.7
Above expectedlevel
5.3 4.1 3.2 3.1 2.9 26.2
Reading attainment and young people’s attitudes towards reading
Table 31 shows that young people who hold more positive attitudes towards reading are alsothe ones who are more likely to read at or above the expected level for their age. For example,a greater proportion of those who agree with the statement that reading is cool read above thelevel expected for their age compared with those who disagree with this statement. Conversely,
a greater proportion of those who agree with the statements that they prefer watching TV toreading, that they don’t read as well as other pupils in their class and that they only read whenthey have to, read below the level expected for their age compared with those who disagreewith those statements.
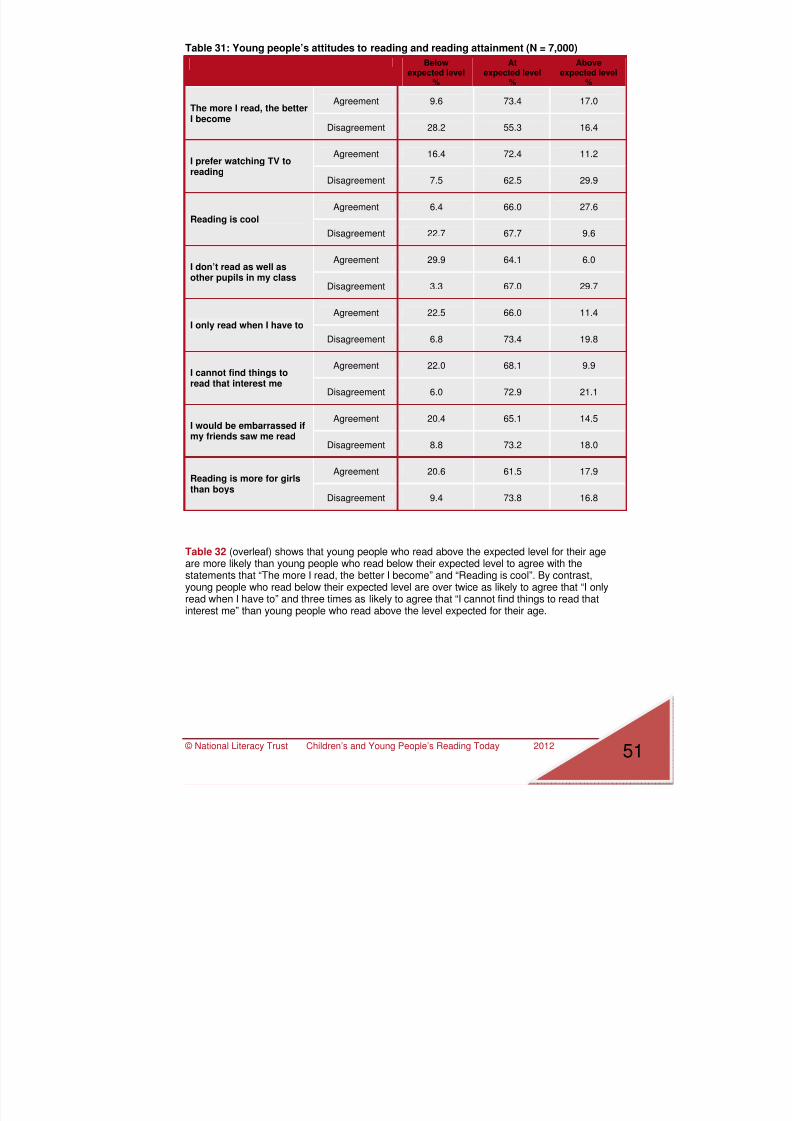
7/27/2019 Young People s Reading FINAL REPORT
http://slidepdf.com/reader/full/young-people-s-reading-final-report 51/60
© National Literacy Trust Children’s and Young People’s Reading Today 2012 51
Table 31: Young people’s attitudes to reading and reading attainment (N = 7,000)
Belowexpected level
%
Atexpected level
%
Aboveexpected level
%
Agreement 9.6 73.4 17.0The more I read, the betterI become
Disagreement 28.2 55.3 16.4
Agreement 16.4 72.4 11.2I prefer watching TV toreading
Disagreement 7.5 62.5 29.9
Agreement 6.4 66.0 27.6
Reading is cool
Disagreement 22.7 67.7 9.6
Agreement 29.9 64.1 6.0I don’t read as well as
other pupils in my classDisagreement 3.3 67.0 29.7
Agreement 22.5 66.0 11.4
I only read when I have to
Disagreement 6.8 73.4 19.8
Agreement 22.0 68.1 9.9I cannot find things toread that interest me
Disagreement 6.0 72.9 21.1
Agreement 20.4 65.1 14.5I would be embarrassed ifmy friends saw me read
Disagreement 8.8 73.2 18.0
Agreement 20.6 61.5 17.9Reading is more for girlsthan boys
Disagreement 9.4 73.8 16.8
Table 32 (overleaf) shows that young people who read above the expected level for their ageare more likely than young people who read below their expected level to agree with thestatements that “The more I read, the better I become” and “Reading is cool”. By contrast,young people who read below their expected level are over twice as likely to agree that “I onlyread when I have to” and three times as likely to agree that “I cannot find things to read thatinterest me” than young people who read above the level expected for their age.
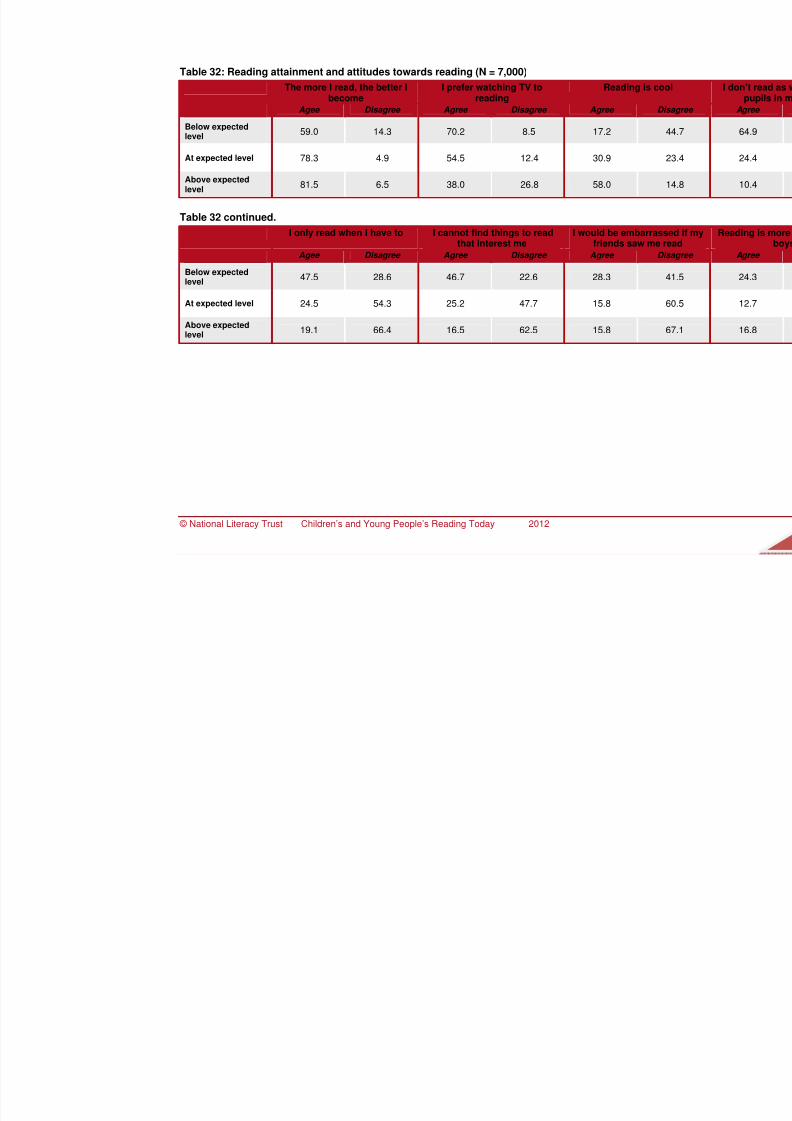
7/27/2019 Young People s Reading FINAL REPORT
http://slidepdf.com/reader/full/young-people-s-reading-final-report 52/60
© National Literacy Trust Children’s and Young People’s Reading Today 2012
Table 32: Reading attainment and attitudes towards reading (N = 7,000)
The more I read, the better Ibecome
I prefer watching TV toreading
Reading is cool
Agee Disagree Agree Disagree Agree Disa
Below expected
level59.0 14.3 70.2 8.5 17.2 44
At expected level 78.3 4.9 54.5 12.4 30.9 23
Above expectedlevel
81.5 6.5 38.0 26.8 58.0 14
Table 32 continued.
I only read when I have to I cannot find things to readthat interest me
I would be embarrassedfriends saw me rea
Agee Disagree Agree Disagree Agree Disa
Below expectedlevel 47.5 28.6 46.7 22.6 28.3 41
At expected level 24.5 54.3 25.2 47.7 15.8 60
Above expectedlevel
19.1 66.4 16.5 62.5 15.8 67
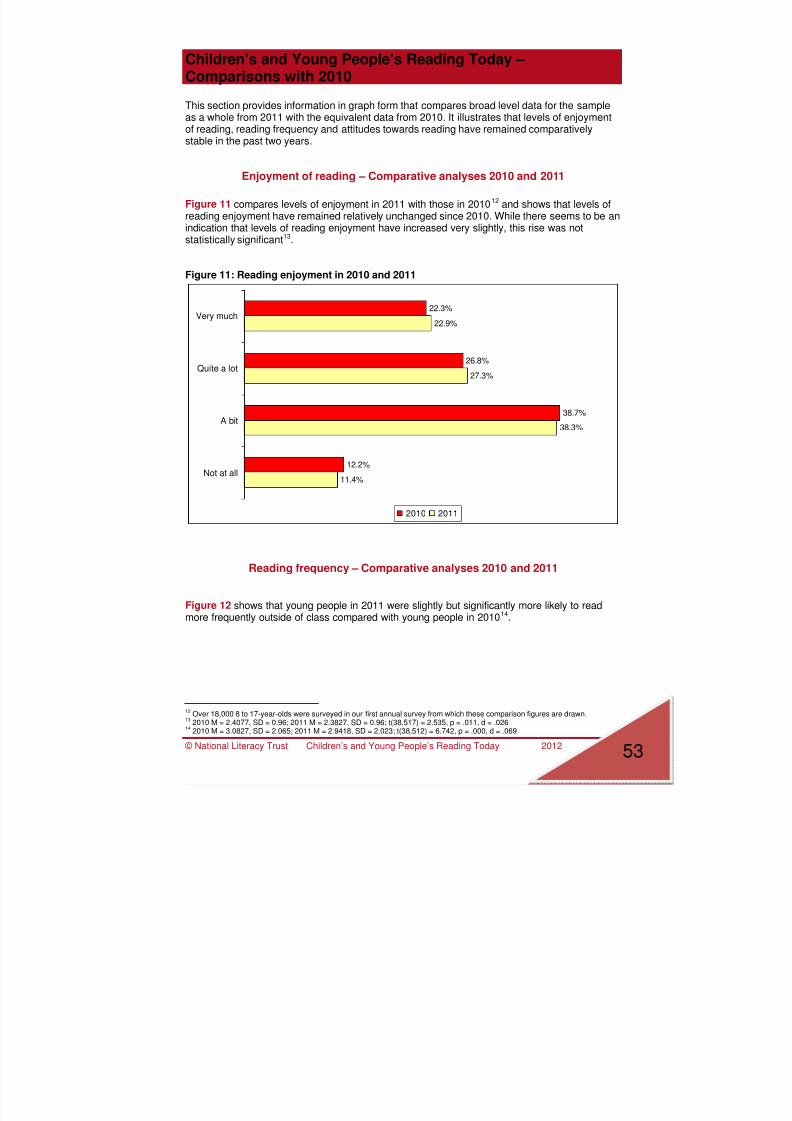
7/27/2019 Young People s Reading FINAL REPORT
http://slidepdf.com/reader/full/young-people-s-reading-final-report 53/60
© National Literacy Trust Children’s and Young People’s Reading Today 2012 53
Children’s and Young People’s Reading Today –Comparisons with 2010
This section provides information in graph form that compares broad level data for the sampleas a whole from 2011 with the equivalent data from 2010. It illustrates that levels of enjoymentof reading, reading frequency and attitudes towards reading have remained comparatively
stable in the past two years.
Enjoyment of reading – Comparative analyses 2010 and 2011
Figure 11 compares levels of enjoyment in 2011 with those in 201012 and shows that levels ofreading enjoyment have remained relatively unchanged since 2010. While there seems to be anindication that levels of reading enjoyment have increased very slightly, this rise was notstatistically significant13.
Figure 11: Reading enjoyment in 2010 and 2011
22.3%
26.8%
38.7%
12.2%
22.9%
27.3%
38.3%
11.4%
Very much
Quite a lot
A bit
Not at all
2010 2011
Reading frequency – Comparative analyses 2010 and 2011
Figure 12 shows that young people in 2011 were slightly but significantly more likely to readmore frequently outside of class compared with young people in 201014.
12Over 18,000 8 to 17-year-olds were surveyed in our first annual survey from which these comparison figures are drawn.
132010 M = 2.4077, SD = 0.96; 2011 M = 2.3827, SD = 0.96; t(38,517) = 2.535, p = .011, d = .026
142010 M = 3.0827, SD = 2.065; 2011 M = 2.9418, SD = 2.023; t(38,512) = 6.742, p = .000, d = .069

7/27/2019 Young People s Reading FINAL REPORT
http://slidepdf.com/reader/full/young-people-s-reading-final-report 54/60
© National Literacy Trust Children’s and Young People’s Reading Today 2012 54
Figure 12: Reading frequency in 2010 and 2011
29.1%
26.1%
10.2%
7.5%
3.4%
16.4%
7.3%
30.8%
28.2%
9.8%
6.7%
2.9%
15.0%
6.6%
Every day
A few times a week
About once a week
A few times a month
About once a month
Rarely
Never
2010 2011
Reading length – Comparative analyses 2010 and 2011
Figure 13 illustrates that the length young people read for has remained stable since 201015.
Figure 13: Reading length in 2010 and 2011
6.8%
19.3%
21.2%
25.0%
14.9%
12.7%
6.7%
19.7%
21.1%
24.6%
15.1%
12.7%
I don't read
Up to 10 min
Up to 20 min
Up to 30 min
About 1 hour
Longer than 1 hour
2010 2011
152010 M = 3.01, SD = 1.50; 2011 M = 3.00, SD 1.50; t(38,260) = 0.410, p = .682
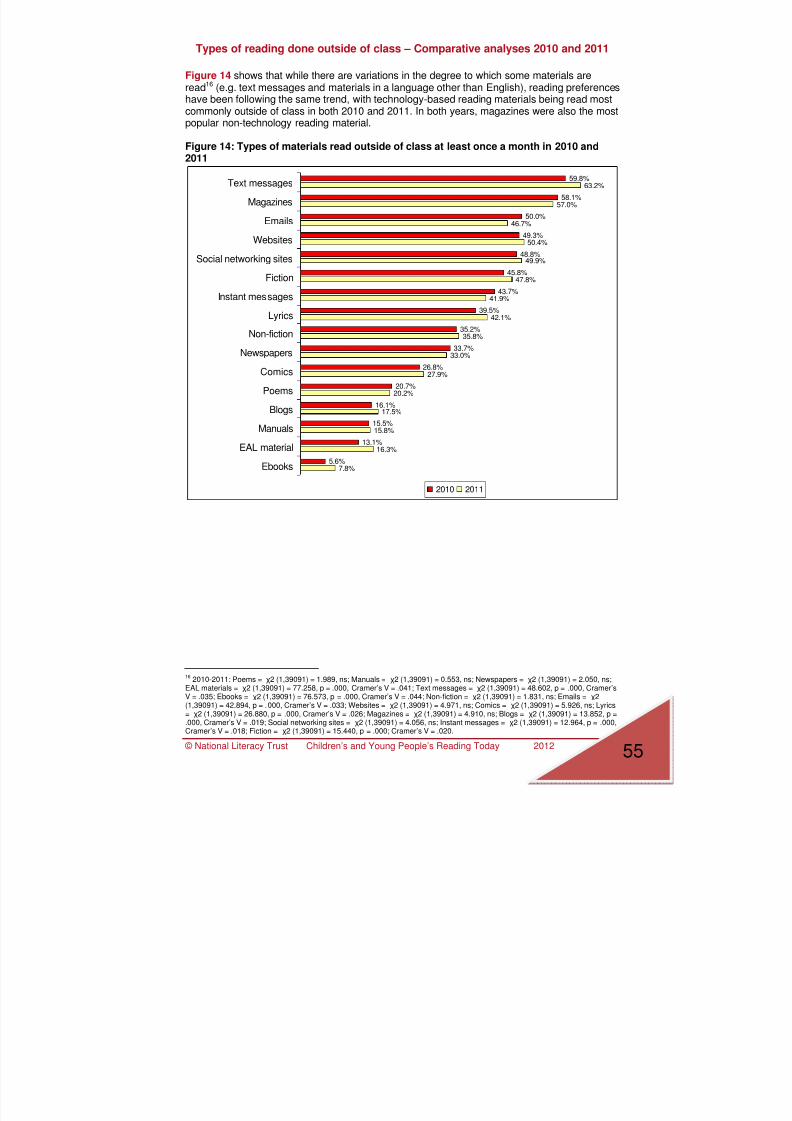
7/27/2019 Young People s Reading FINAL REPORT
http://slidepdf.com/reader/full/young-people-s-reading-final-report 55/60
© National Literacy Trust Children’s and Young People’s Reading Today 2012 55
Types of reading done outside of class – Comparative analyses 2010 and 2011
Figure 14 shows that while there are variations in the degree to which some materials areread16 (e.g. text messages and materials in a language other than English), reading preferenceshave been following the same trend, with technology-based reading materials being read mostcommonly outside of class in both 2010 and 2011. In both years, magazines were also the mostpopular non-technology reading material.
Figure 14: Types of materials read outside of class at least once a month in 2010 and2011
59.8%
58.1%
50.0%
49.3%
48.8%
45.8%
43.7%
39.5%
35.2%
33.7%
26.8%
20.7%
16.1%
15.5%
13.1%
5.6%
63.2%
57.0%
46.7%
50.4%
49.9%
47.8%
41.9%
42.1%
35.8%
33.0%
27.9%
20.2%
17.5%
15.8%
16.3%
7.8%
Text messages
Magazines
Emails
Websites
Social networking sites
Fiction
Instant messages
Lyrics
Non-fiction
Newspapers
Comics
Poems
Blogs
Manuals
EAL material
Ebooks
2010 2011
162010-2011: Poems = χ2 (1,39091) = 1.989, ns; Manuals = χ2 (1,39091) = 0.553, ns; Newspapers = χ2 (1,39091) = 2.050, ns;
EAL materials = χ2 (1,39091) = 77.258, p = .000, Cramer’s V = .041; Text messages = χ2 (1,39091) = 48.602, p = .000, Cramer’sV = .035; Ebooks = χ2 (1,39091) = 76.573, p = .000, Cramer’s V = .044; Non-fiction = χ2 (1,39091) = 1.831, ns; Emails = χ2(1,39091) = 42.894, p = .000, Cramer’s V = .033; Websites = χ2 (1,39091) = 4.971, ns; Comics = χ2 (1,39091) = 5.926, ns; Lyrics= χ2 (1,39091) = 26.880, p = .000, Cramer’s V = .026; Magazines = χ2 (1,39091) = 4.910, ns; Blogs = χ2 (1,39091) = 13.852, p =.000, Cramer’s V = .019; Social networking sites = χ2 (1,39091) = 4.056, ns; Instant messages = χ2 (1,39091) = 12.964, p = .000,Cramer’s V = .018; Fiction = χ2 (1,39091) = 15.440, p = .000; Cramer’s V = .020.
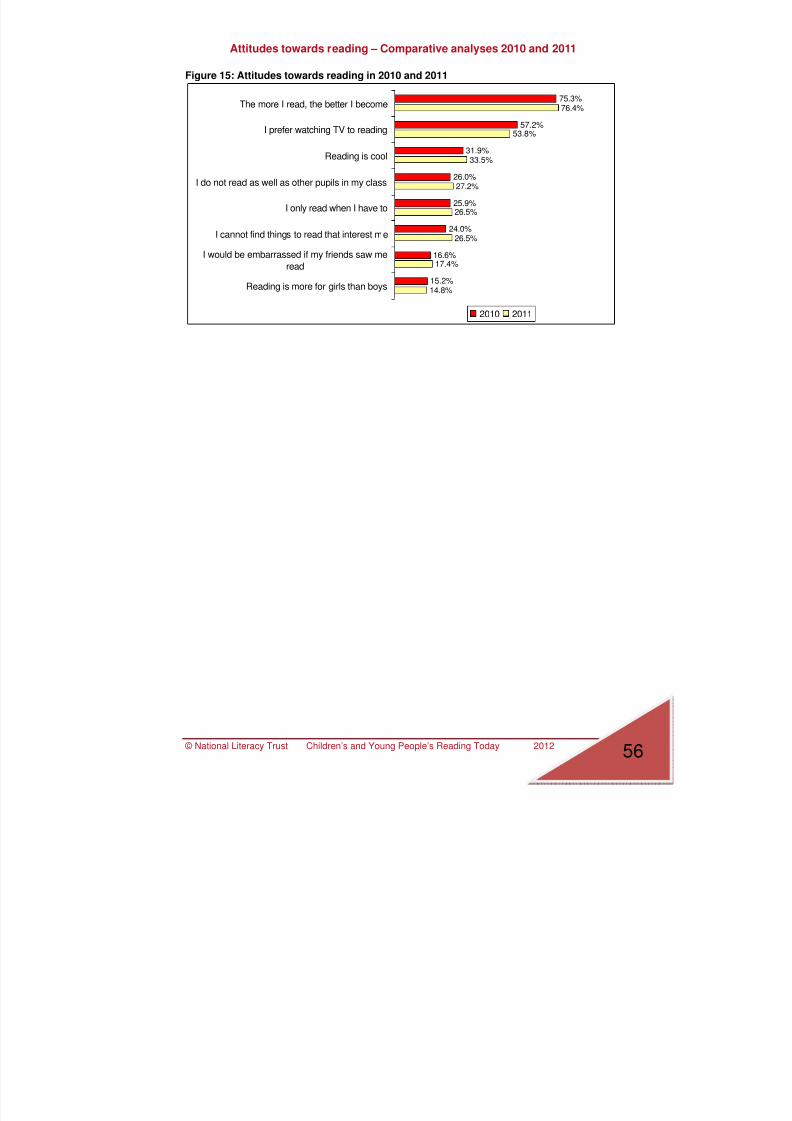
7/27/2019 Young People s Reading FINAL REPORT
http://slidepdf.com/reader/full/young-people-s-reading-final-report 56/60
© National Literacy Trust Children’s and Young People’s Reading Today 2012 56
Attitudes towards reading – Comparative analyses 2010 and 2011
Figure 15: Attitudes towards reading in 2010 and 2011
75.3%
57.2%
31.9%
26.0%
25.9%
24.0%
16.6%
15.2%
76.4%
53.8%
33.5%
27.2%
26.5%
26.5%
17.4%
14.8%
The more I read, the better I become
I prefer watching TV to reading
Reading is cool
I do not read as well as other pupils in my class
I only read when I have to
I cannot find things to read that interest me
I would be embarrassed if my friends saw me
read
Reading is more for girls than boys
2010 2011
7/27/2019 Young People s Reading FINAL REPORT
http://slidepdf.com/reader/full/young-people-s-reading-final-report 57/60
© National Literacy Trust Children’s and Young People’s Reading Today 2012 57
Appendix A: An introduction to the annual literacy survey
We have been surveying children and young people on all sorts of literacy matters since 2005.This has given us great insight into the views and attitudes of youngsters on reading, writing,speaking and listening skills, home resources, role models, perception of themselves as readersas well as technology use.
However, what is still lacking in the attitudinal landscape in the UK is annual data on how youngpeople feel about literacy to help us build a continuous picture of their attitudes year-on-year. Itis the purpose of the National Literacy Trust annual literacy survey to plug this gap in theevidence base.
Combining previous National Literacy Trust survey topics, the annual literacy survey exploresyoung people’s attitudes towards reading, writing and communication skills as well as theirtechnology use. More specifically, the key objectives of the annual literacy survey are toexplore:
• Whether young people enjoy reading, how good they think they are at reading,
how often they read and for how long, what type of materials they read outside ofclass, how many books they have in the home and what they think about reading.
• Whether young people enjoy writing, how good a writer they think they are, whatmakes a good writer, what types of materials they write and what they think aboutwriting.
• What they think good communication skills are, how they feel about them and howimportant they are to succeed.
Two additional areas were included in the second annual literacy survey, which are familyinvolvement in reading and young people’s perceptions of themselves as readers.
In addition to exploring children and young people’s attitudes towards reading, writing andcommunication, we will also explore their link to attainment in a subsample of pupils for whomattainment data are available.
These objectives were further broken down into a number of questions. These included thefollowing:
• Do reading enjoyment, behaviour and attitudes differ according to gender, age,socioeconomic and ethnic background?
• Do writing enjoyment, behaviour and attitudes differ according to gender, age,socioeconomic and ethnic background?
•
Do attitudes towards communication skills and their perceived importance differaccording to gender, age, socioeconomic and ethnic background?
7/27/2019 Young People s Reading FINAL REPORT
http://slidepdf.com/reader/full/young-people-s-reading-final-report 58/60
© National Literacy Trust Children’s and Young People’s Reading Today 2012 58
Appendix B: Methodology
An invitation to participate in this online survey was sent out in National Literacy Trustnewsletters at the beginning of September 2011. Schools were invited to express their interestto participate in one of three surveys:
1) A simple survey (without attainment data or name field)2) An amended survey with two attainment questions for pupils to fill in3) An amended survey with a name field and schools were asked to send us the reading
and writing attainment data for participating pupils
The basic online survey consisted of 43 questions exploring young people’s background,reading and writing enjoyment, behaviour and attitudes, attitudes towards communication skillsas well as questions about family involvement and being a reader (these latter two were newareas for the 2011 survey).
Due to the complexity of the questions and some concepts, the decision was made to restrictthe age range of participating pupils to upper Key Stage 2 (9 to 11 years) and older. However,some schools felt that their 8-year-olds would be capable of completing the survey.
210 schools expressed an interest in taking part in one of the three surveys. A link to the onlinesurvey alongside guidance notes for teachers was emailed to the schools at the beginning ofNovember. The survey was online between 14 November and 9 December 2011. It took anaverage of 25 minutes for young people to complete the survey. Schools were offered a school-specific summary report as an incentive to take part.
Participation rate
Of the 210 schools that had originally expressed an interest to take part 128 schoolsparticipated in our online survey, a participation rate of 61%.

7/27/2019 Young People s Reading FINAL REPORT
http://slidepdf.com/reader/full/young-people-s-reading-final-report 59/60
© National Literacy Trust Children’s and Young People’s Reading Today 2012 59
Appendix C: Sample characteristics
Overall, 20,950 young people participated in this survey in November/December 2011. Therewas an equal gender split in the sample, with 50% of respondents being boys (N = 10,484) and50% being girls (N = 10,466).
Table C1 shows that the majority of pupils were 11, 12 and 13 years old. To investigate the
impact of age, three broad categories were identified according to key stages: KS2, KS3 andKS4. The KS2 category (31.1%, N = 6,468) refers to pupils aged 7 to 11, KS3 (54.2%, N =11,261) refers to pupils aged 11 to 14, while KS4 (14.6%, N = 3,045) applies to pupils aged 14to 16. Although some young people aged 17 (N = 94, 0.4%) and 18 (N = 82, 0.4%) took parttoo, the sample was too small and they are therefore not part of the analyses by key stage.
Table C1: Sample age
% N % N
8 5.6 1,180 13 17.1 3,702
9 6.7 1,410 14 8.5 1,785
10 6.9 1,441 15 4.5 950
11 23.6 4,937 16 1.5 310
12 24.1 5,059
The percentage of pupils who receive free school meals (FSM), which is frequently used ineducational research as a crude indicator of socio-economic background, was 15.2%. Thepercentage of FSM uptake in this study is slightly lower than the national average (18.2%17).
When asked how they would describe their ethnic background, most pupils said that they wereWhite British (76.7%, N = 14,176). The second and third most frequent ethnic categories in thissample were Asian or Asian British Pakistani (3.3%, N = 604) and White other (3.2%, N = 593).See Table C2 for a full breakdown of ethnic background. Please note that 11.8% (N = 2,476) ofthe sample chose not to answer this question. Overall, the ethnic make-up of this sample isrepresentative of that found nationally18.
Table C2: Ethnic background
% N
White British 76.7 14,176
White Irish 1.5 270
White Traveller 0.3 58
White Romany 0.6 115
White other 3.2 593
Mixed White and Black Caribbean 1.3 243
Mixed White and Black African 0.8 146
Mixed White and Asian 1.2 214
17 http://media.education.gov.uk/assets/files/pdf/s/sfr10-2012.pdf;; primary and secondary. Primary 19.3%, second 16%
18 http://media.education.gov.uk/assets/files/pdf/s/sfr10-2012.pdf
7/27/2019 Young People s Reading FINAL REPORT
http://slidepdf.com/reader/full/young-people-s-reading-final-report 60/60