yemen environmental scanning “macro” 2013
TRANSCRIPT

Environmental Scanning “Macro” 2013

HSA MARKETING SECTOR
Content• Environmental Scanning “Macro”
Demographical analysis Economical analysis

HSA MARKETING SECTOR
Environmental
Macro Scanning
HSA MARKETING SECTOR
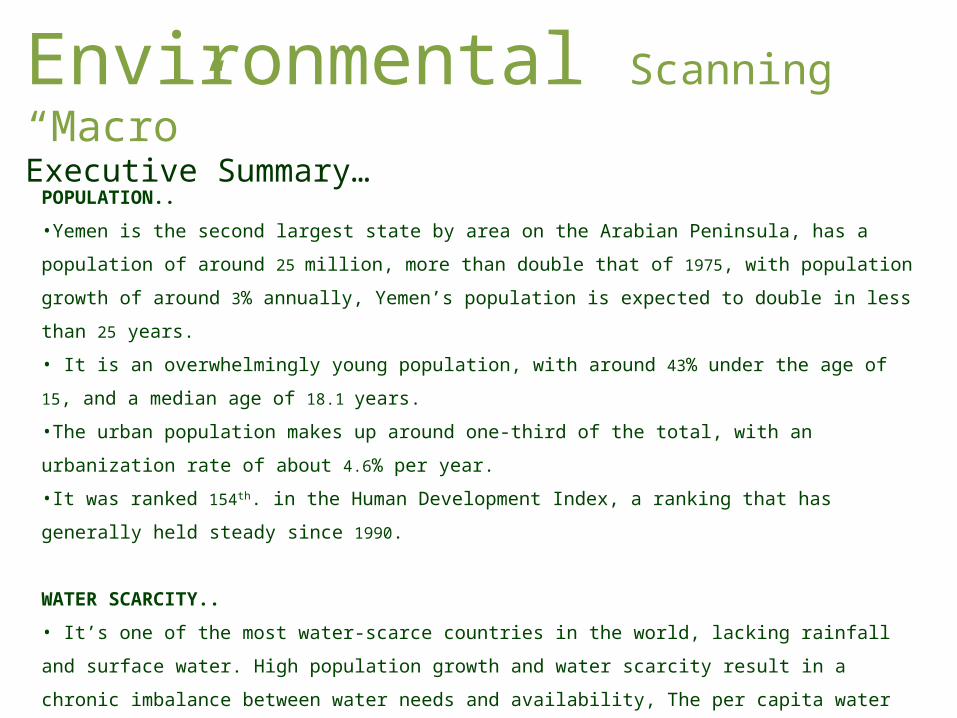
POPULATION..
•Yemen is the second largest state by area on the Arabian Peninsula, has a population of
around 25 million, more than double that of 1975, with population growth of around 3%
annually, Yemen’s population is expected to double in less than 25 years.
• It is an overwhelmingly young population, with around 43% under the age of 15, and a
median age of 18.1 years.
•The urban population makes up around one-third of the total, with an urbanization rate of
about 4.6% per year.
•It was ranked 154th. in the Human Development Index, a ranking that has generally held
steady since 1990.
WATER SCARCITY..
• It’s one of the most water-scarce countries in the world, lacking rainfall and surface water.
High population growth and water scarcity result in a chronic imbalance between water needs
and availability, The per capita water resources stand at 125 m3 compared to 1,250 m3 in the
Middle East and North Africa region, Agriculture uses by far the most water, with 96% of
water use, while QAT alone accounts for around 40%
Environmental Scanning “Macro”Executive Summary…

HSA MARKETING SECTOR
NATIONAL ECONOMY..
•After unification in 1990, the Government had to work to integrate two distinct economic
systems. Their efforts were hampered by the immediate return of some 850,000 Yemenis from
the Persian Gulf states, major reductions in aid flows, and the 1994 civil war. In 2009, Yemen
exported its first liquefied natural gas as part of wider efforts to diversify its economy.
Petroleum products make up around 70% of government revenue and some 25% of Yemen’s
GDP.
•The national currency, the RIAL, has depreciated significantly from 50 RIALS per dollar in 1995
to over 220 RIALS to the dollar by early 2010. During the peak of the crisis in 2011, the RIAL
reached close to 240 to the dollar. Given the country’s high reliance on imported commodities
–particularly food commodities – the currency’s deflation has contributed to significant,
broad-based inflationary pressures to the basic cost of living
•One-third of Yemen’s population is unemployed, while around 45% live below the poverty
line. In 2011, inflation was estimated to be 20%.
•Yemen is ranked as the 11th most food-insecure country globally with one in three Yemenis
suffering from acute hunger
Environmental Scanning “Macro”Executive Summary…
HSA MARKETING SECTOR
REVOLUTION & CHANGE..
2011 was a hugely unsettling year for Yemen. The country is facing a profound and complex
political and economic crisis, which both leads to and continues to be stimulated by social
unrest and outbreaks of violence. The backdrop to the recent violence are trends of
deteriorating economic fundamentals – declining oil production, an increasing current
account deficit, expanding fiscal deficit, depreciating currency and rising inflation. The World
Bank predicts that Yemen's oil and gas revenues will plummet over the next two years and
could fall to zero by 2017 as supplies run out. Given that oil provides around 90% of the
country's exports.
A SHOCK TO PURCHASING POWER..
When broad based inflation to the basic cost of living, including the cost of food, is
coupled with economic contraction
Environmental Scanning “Macro”Executive Summary…

HSA MARKETING SECTOR
Demographical analysisPopulation Amount & Growth TRENDS…
Y00 Y01 Y02 Y03 Y04 Y05 Y06 Y07 Y08 Y09 Y10 Y11 Y120
5,000,000
10,000,000
15,000,000
20,000,000
25,000,000
30,000,000
-2%
-1%
0%
1%
2%
3%
4%
17,479,210.018,078,040.018,701,260.019,349,880.020,024,870.020,727,060.021,456,190.022,230,530.023,013,380.023,822,780.023,495,360.024,133,490.024,771,810.0
3.4% 3.4% 3.4% 3.5% 3.5% 3.5% 3.5% 3.6% 3.5% 3.5%
-1.4%
2.7% 2.6%
PopulationAmount & Growth TRENDS
Population Growth
•Population growth trend gives good opportunity for annual consumption growth
•Consistency of population growth rate gives high certainty for growth strategy
formulation
•Comparing population growth rates trend with our actual sales growth trend; give
the real actual sales growth excluding normal growth came from the population

HSA MARKETING SECTOR
Demographical analysisGenerations & Age groups…
•64% of Yemen population age localized under 24 years, gives:
Amazing consumption opportunity
Opportunity to build loyalty
Higher consumption rate vs. other age segment
•Should to rescan & rediscover the NEW GENERATION
“behavior , thoughts , concepts , self attitude, buying motives, trends“
0-14 years 15-24 years 25-54 years 55-64 years Over 65 years0
2,000,000
4,000,000
6,000,000
8,000,000
10,000,000
12,000,000
0%5%10%15%20%25%30%35%40%45%
10,533,096.0 5,232,712.0 7,464,921.0 893,660.0 647,420.0
43%
21%
30%
4% 3%
Yemen PopulationBy Age Group
Amount Weight
In such virgin markets,
companies can’t rely on the
heritage & loyalty anymore
BUT need to building again
with the new generation which
will be absolutely more tough

HSA MARKETING SECTOR
Demographical analysisLiteracy & Education RATES…
Increasing of Yemeni citizens literacy rate generally in both genders gives an
indication for culture upgrading which will automatically influence consumer
behavior and preferences
(15Y-24Y) (Over 15Y) (15Y-24Y) (Over 15Y) (15Y-24Y) (Over 15Y)Female Male Population
35%
17%
83%
57%
60%
37%
60%
35%
93%
74%
77%
55%
74%
47%
96%
81% 85
%
64%
Literacy Rate Per Age Group
Y94 Y04 Y10
•We should upgrade & modernize our future theme & spirit in all what we do
“consumer touch points” however in quality, packaging, media messages and so on ..
•Higher education levels might be opportunity and threat at the same time, however
companies can take it or not

HSA MARKETING SECTOR
Demographical analysisMobile & Internet Users GROWTH…
Internet & Cell phones rapid growth reflects the trend of Yemen population for
Urbanization maturity, cognition, realization and discernment
Are we using the right and efficient media tool ?
Are we able to adapt the right attractive messages which able to inspire consumers?
Are we creative enough to deliver our consumers with tomorrow’s needs today ?
Y00 Y02 Y05 Y07 Y08 Y09 Y10 Y11 Y12 -
1,000,000
2,000,000
3,000,000
4,000,000
5,000,000
6,000,000
0%
5%
10%
15%
20%
25%
12,000.0100,000.0220,000.0320,000.0370,000.02,349,000.03,053,700.03,969,810.05,160,753.00% 1% 1% 1% 2%
10%
13%
16%
21%
Internet UsersAmount & Share
Internet Users %Poplution
Y95 Y00 Y02 Y05 Y06 Y09 2010 2011 2012 -
2,000,000
4,000,000
6,000,000
8,000,000
10,000,000
12,000,000
14,000,000
16,000,000
0%
10%
20%
30%
40%
50%
60%
8,250.0 32,042.0411,100.02,000,000.02,978,000.011,085,000.011,085,344.012,349,860.013,893,265.00% 0% 2%
10%14%
47% 47%51%
56%
Mobiles UsersAmount & Share
Mobile Users %Poplution
HSA MARKETING SECTOR
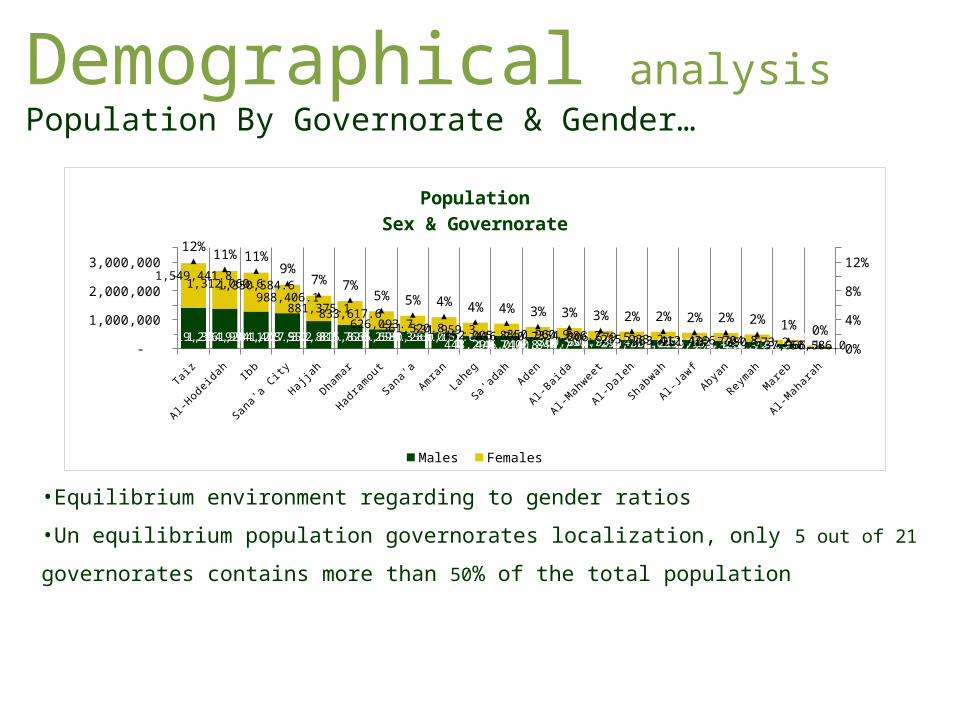
Demographical analysisPopulation By Governorate & Gender…
Taiz
Al-Hodeid
ah Ibb
Sana'a
City
Hajjah
Dhamar
Hadram
out
Sana'a
AmranLa
heg
Sa'ad
ahAden
Al-Baid
a
Al-Mah
weet
Al-Dale
h
Shab
wah
Al-Jaw
f
Abyan
Reymah
Mareb
Al-Mah
arah
- 500,000
1,000,000 1,500,000 2,000,000 2,500,000 3,000,000 3,500,000
0%2%4%6%8%10%12%14%
1,419,276.91,384,994.11,284,403.51,227,312.8952,887.7815,826.2665,699.3580,283.0560,163.6448,291.7446,016.8400,844.7360,953.7307,936.4299,771.6301,219.7296,156.4276,439.3237,729.5158,182.4
60,610.8
1,549,441.81,312,060.61,350,584.6
988,406.1881,375.1833,617.6
626,093.7561,520.8531,959.3452,005.8416,740.7350,960.9354,086.2306,679.5285,933.2283,412.4251,192.7266,704.8250,673.2137,965.150,586.0
12%11% 11%
9%7% 7%
5% 5% 4% 4% 4% 3% 3% 3% 2% 2% 2% 2% 2% 1% 0%
PopulationSex & Governorate
Males Females
•Equilibrium environment regarding to gender ratios
•Un equilibrium population governorates localization, only 5 out of 21 governorates
contains more than 50% of the total population
HSA MARKETING SECTOR
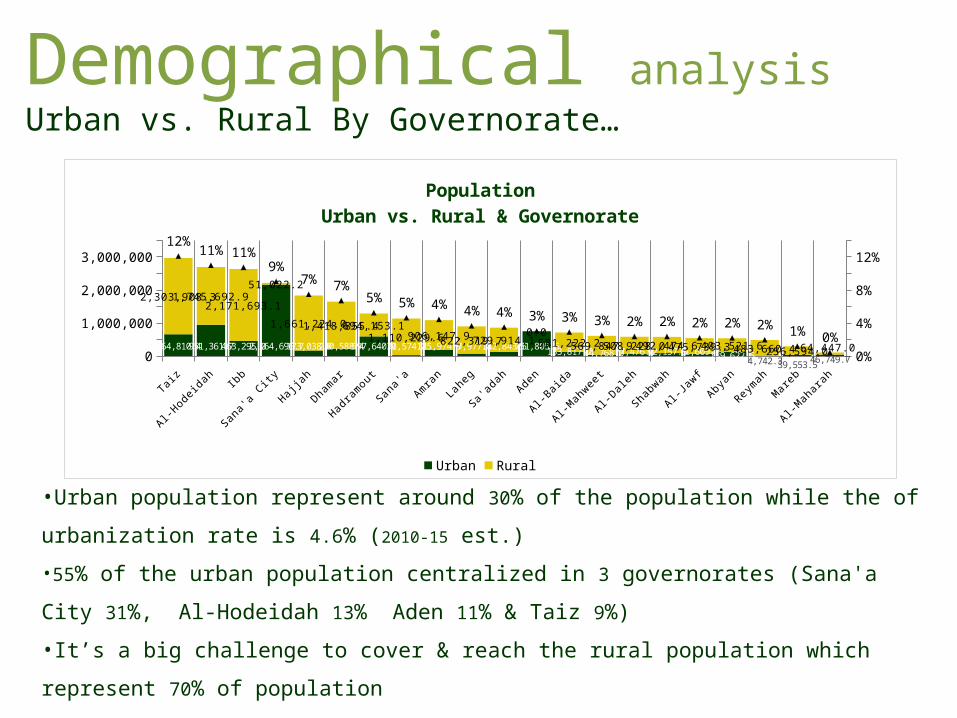
Demographical analysisUrban vs. Rural By Governorate…
•Urban population represent around 30% of the population while the of
urbanization rate is 4.6% (2010-15 est.)
•55% of the urban population centralized in 3 governorates (Sana'a City 31%, Al-
Hodeidah 13% Aden 11% & Taiz 9%)
•It’s a big challenge to cover & reach the rural population which represent 70% of
population
Taiz
Al-Hodeid
ah Ibb
Sana'a
City
Hajjah
Dhamar
Hadram
out
Sana'a
AmranLa
heg
Sa'ad
ahAden
Al-Baid
a
Al-Mah
weet
Al-Dale
h
Shab
wah
Al-Jaw
f
Abyan
Reymah
Mareb
Al-Mah
arah
0
500,000
1,000,000
1,500,000
2,000,000
2,500,000
3,000,000
3,500,000
0%
2%
4%
6%
8%
10%
12%
14%
664,810.4951,361.7463,295.02,164,696.7173,038.8230,588.4597,640.031,574.2185,974.977,977.8132,843.5751,805.6133,817.744,768.077,476.892,157.571,609.7139,622.54,742.3 39,553.546,749.7
2,303,908.31,745,692.92,171,693.1
51,022.2
1,661,224.01,418,855.4694,153.11,110,229.6906,147.9822,319.7729,914.1
0.0581,222.2569,847.9508,228.0492,474.6475,739.3403,521.6483,660.4256,594.064,447.0
12%11% 11%
9%7% 7%
5% 5% 4%4% 4% 3% 3% 3% 2% 2% 2% 2% 2%
1% 0%
PopulationUrban vs. Rural & Governorate
Urban Rural

HSA MARKETING SECTOR
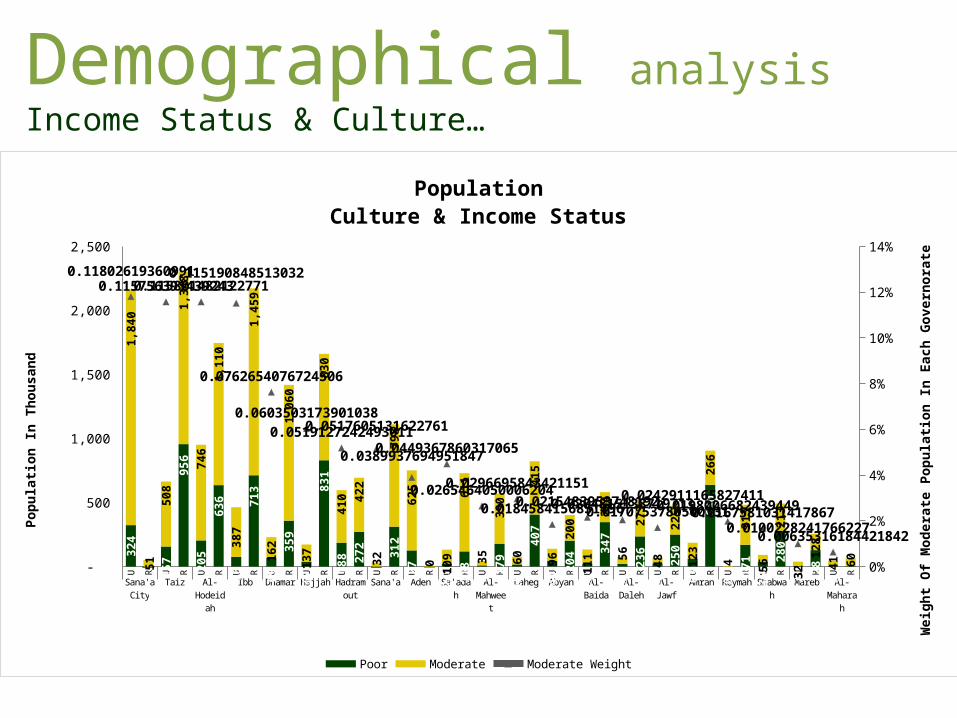
Demographical analysisIncome Status & Culture…
•Only 65% of the population have a good purchase power “moderate” while the
rest 35% are poor with low purchase power half of them considered as below the
poverty line population
•65% of moderate population “10.4mil” lives in rural areas, while only 35% “5.6mil”
lives in urban areas which means that rural areas contains double urban moderate
population
Poor Moderate -
2,000,000
4,000,000
6,000,000
8,000,000
10,000,000
12,000,000
14,000,000
16,000,000
18,000,000
1,457,497.8
5,618,606.8
7,043,845.2
10,407,050.2
PopulationCulture & Income Status
Urban Rural
23%
42%
29%
6%
What is our strategy to reach & cover urban ??
HSA MARKETING SECTOR
Demographical analysisIncome Status & Culture…
U R U R U R U R U R U R U R U R U R U R U R U R U R U R U R U R U R U R U R U R U R
Sana'a City
Taiz Al-Hodeidah
Ibb Dhamar Hajjah Hadramout
Sana'a Aden Sa'adah Al-Mah-weet
Laheg Abyan Al-Baida Al-Daleh Al-Jawf Amran Reymah Shabwah Mareb Al-Ma-
harah
-
500
1,000
1,500
2,000
2,500
0%
2%
4%
6%
8%
10%
12%
14%
324
- 1
57
956
205
636
76
713
69
359
36
831
188
272
-
312
127
-
24 1
18
10
179
18
407
44
204
22
347
22
236
23
250
63
640
0 1
71
36
280
7 1
28
5
4
1,84
0
5150
8
1,34
8
746
1,11
0
387
1,45
9
162
1,06
0
137
830
410 42
2
32
798
625
0 109
611
35
390
60
415
96
200
111
234
56
273
48
225
123
266
4
313
56
213
32
128
41 60
0.118026193609910.1157563914392430.115801482122771
0.115190848513032
0.0762654076724506
0.0603503173901038
0.05191272424930110.0517605131622761
0.03899376949518470.0449367860317065
0.02654640500062040.0296695843421151
0.01845841568514960.02154839537481920.02048151387197130.0170753780500331
0.02429111658274110.01980066824394490.0167581031417867
0.01002282417662270.00635316184421842
PopulationCulture & Income Status
Poor Moderate Moderate Weight
Popu
latio
n In
Tho
usan
d
Wei
ght O
f Mod
erat
e Po
pula
tion
In E
ach
Gove
rnor
ate

HSA MARKETING SECTOR
Shaping an effective & efficient distribution strategy require a deeply look into
previous rich graph which shows district opportunities and prioritizing them:
Only 4 governorates owns 46% of moderate population overall Yemen “Sana'a
City, Taiz, Ibb Al-Hodeidah” with 12% share for each
Rural areas considered “Goldmine”, Easily we can find the bulk of moderates
in each governorate in the urban areas “73% of Taiz, 79% of Ibb, 60% of Al-
Hodeidah, 87% of Dhamar, 86% of Hajjah, 51% of Hadramout and 97% of
Sana'a” This is what proves that 44% of total moderates localized in 6
governorate in RURAL areas only around 7 mil
Demographical analysisIncome Status & Culture…
Does our turnover breakdown by district match population & income status breakdown by
district ?
How to prioritize the governorate penetration based on each market attractiveness ?
Is it possible to capitalize on distribution & covering as one of the main competitive
advantages ?
Rural is “Goldmine” with high population, high purchase power “twice of rural”, lower
competition relatively to urban and hard to reach. Do we have smart tactics to penetrate ?
HSA MARKETING SECTOR
Next 4 slides contains graphs which classify regional market attractiveness based
on each region:
•Population
Percentage of (Urban/Rural/Total) Population to National Population
Percentage of (Urban/Rural) Population to Governorate Population
• Food Spending
Percentage of (Urban/Rural/Total) Food Spending to National Food Spending
Percentage of (Urban/Rural) Food Spending to Governorate Food Spending
(Urban/Rural/Total) Food Spending Per Capita in YER
• Income
Percentage of (Urban/Rural/Total) Moderates to National Moderates
Percentage of (Urban/Rural) Moderates to Governorate Moderates
Demographical analysisMarkets Attractiveness By Region…
NOW .. It’s time to prioritize our Penetration/ Expansion/ Market Development plan
Let’s formulate our DISTRIBUTION STRATEGY

IbbAbya
n
Sana'a
City
Al-Baid
aTa
iz
Al-Jawf
Hajjah
Al-Hodeid
ah
Hadram
out
Dhamar
Shab
wah
Sa'ad
ahSa
na'aAden
Laheg
Mareb
Al-Mah
weet
Al-Mah
arah
Amran
Al-Dale
h
Reymah
0%
10%
20%
30%
40%
50%
60%
70%
80%
90%
100%
0
10,000
20,000
30,000
40,000
50,000
60,000
11%2%
9%3%
12%2%
7% 11% 5% 7% 2% 4% 5% 3% 4% 1% 3% 0%4% 2% 2%
70%54%
85%
48%
62%
50% 52%
68% 64%74%
46%
83% 72%83%
53% 54%69%
91%
36%
56% 66%
12%
2%
12%
2%
12%
2%6%
12% 5%
8%
2%
5% 5%
4%
3% 1%3%
1%
2%
2% 2%
38% 42%
25%
44%39% 44%
53%
43% 44%38%
44%
42% 39%
29%
43% 42%46%
34%
44%
35% 41%
11%2%
11%3%
11%2%
8% 11%6% 7% 3% 3% 4% 3% 3% 1% 2% 1%
3% 2% 2%
Yemen Regional Total Markets AttractivenessBased on Purchasing Power Variables
%Population Nationaly %Moderate Governorate %Moderate Nationaly%Governorat Spending %National Food Spending Food Spending Per Capita in YER
Demographical analysisMarkets Attractiveness By Region…

IbbAbya
n
Sana'a
City
Al-Baid
aTa
iz
Al-Jawf
Hajjah
Al-Hodeid
ah
Hadram
out
Dhamar
Shab
wah
Sa'ad
ahSa
na'aAden
Laheg
Mareb
Al-Mah
weet
Al-Mah
arah
Amran
Al-Dale
h
Reymah
0%
10%
20%
30%
40%
50%
60%
70%
80%
90%
100%
0
10,000
20,000
30,000
40,000
50,000
60,000
70,000
18%26% 98%
19% 22% 13%9%
35%46%
14% 16% 15%
3% 100%
9%13%
7%
42%
17% 13%
1%
7%
2%
31%
2%9%
1%
2%
13%
8%
3%1% 2%
0%11%
1%
1%
1%
1%
3% 1%
0%
15%18%
83%
16%
17%
9%
7%
28%32%
10%
10%13%
3%
83%
7%
11%
6%
37%
11%10%
1%
7% 2%
33%
2%
9%
1%
2%
13%7%
3%
1%
2%
1%
11%
1%
1%
1%
1%
2%1%
0%
29%38%
25%
35%29%
35%
42%
32% 38%
27%
45%38%
29%
29%
31%
36%
34%
36% 31%
30%
7%2%
35%
2%8%
1% 3%11% 8% 3% 2% 2% 0%
10% 1% 1% 1% 1% 3% 1% 0%
Yemen Regional Urban Markets AttractivenessBased on Purchasing Power Variables
%Urban Population Governorate %Urban Population Nationaly %Urban Moderate Governorate %Urban Moderate Nationaly%Urben Food Spending Governorate %Urben Food Spending Nationaly Urben Food Spending Per Capita in YER
Demographical analysisUrban Markets Attractiveness By Region…
IbbAbya
n
Sana'a
City
Al-Baid
aTa
iz
Al-Jawf
Hajjah
Al-Hodeid
ah
Hadram
out
Dhamar
Shab
wah
Sa'ad
ahSa
na'aAden
Laheg
Mareb
Al-Mah
weet
Al-Mah
arah
Amran
Al-Dale
h
Reymah
0%
10%
20%
30%
40%
50%
60%
70%
80%
90%
100%
0
10,000
20,000
30,000
40,000
50,000
60,000
82%74%
2%
81%
78%
87%91%
65% 54%86%
84%
85% 97%
0%
91% 87%93%
58%
83% 87% 99%
12%
2%
0%
3%
13%
3%
10%
10% 4%8%
3%
4%6%
0%
5% 1%
3%
0%
5% 3%3%
55%37%
2%
33%
45%
41%
45%
41% 33%
64%36%
71%70%
0%
46% 43% 64%54%
24%47% 64%
14% 2%
0%
2% 13%2%
8%
11%4%
10%2%
6%8%
0%
4% 1%4% 1%
3%
3% 3%
42% 45%
24%
47% 44%47%
55%52% 51%
41% 44%44% 39%
45% 46% 47% 33%
47%
35% 42%
13%2% 0% 3%
13%2%
11% 11% 5% 9% 3% 4% 7%
0%
4% 1% 3% 0% 4% 2% 2%
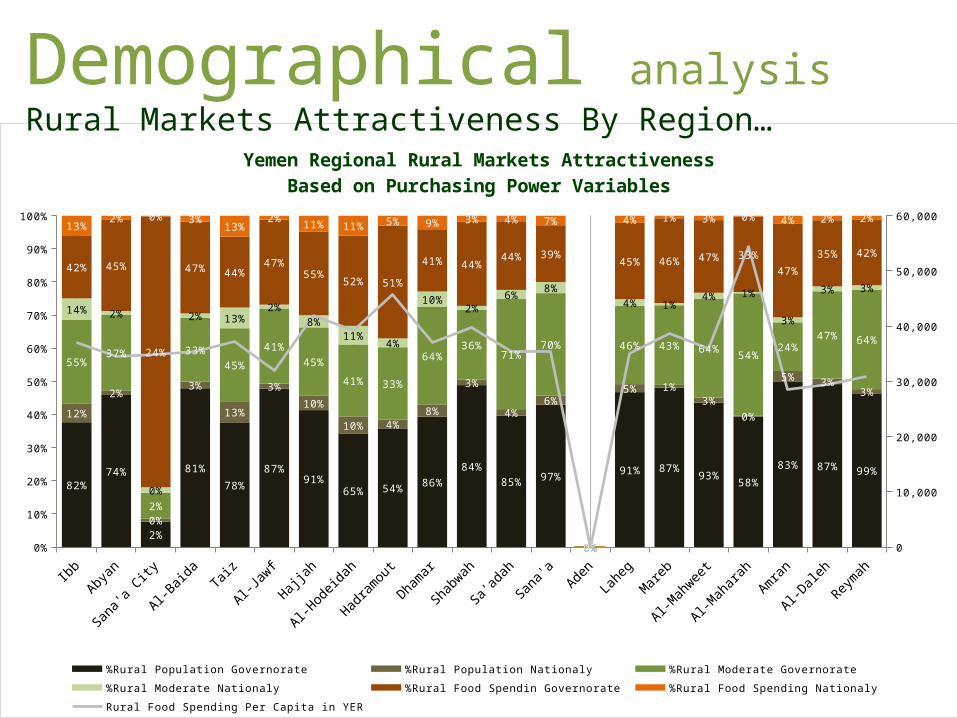
Yemen Regional Rural Markets AttractivenessBased on Purchasing Power Variables
%Rural Population Governorate %Rural Population Nationaly %Rural Moderate Governorate %Rural Moderate Nationaly%Rural Food Spendin Governorate %Rural Food Spending Nationaly Rural Food Spending Per Capita in YER
Demographical analysisRural Markets Attractiveness By Region…

11%
2%9%
3%
12%
2%
7%
11%
5% 7%2%
4%
5%
3%
4%
1%3%0%
4%
2%2%
11%
2%11%
3%
11%
2%
8%
11%
6% 7%
3%
3%
4%
3%
3%
1%
2%1%
3%
2%
2%
Ibb12%
Abyan2%
Sana'a City12%
Al-Baida2%
Taiz12%
Al-Jawf2%
Hajjah6%
Al-Hodeidah12%
Hadramout5%
Dhamar8%
Shabwah2%
Sa'adah5%
Sana'a5%
Aden4%
Laheg3%
Mareb1%
Al-Mahweet3%
Al-Maharah1%
Amran2%
Al-Daleh2%
Reymah2%
Yemen Regional Total Markets AttractivnessBased on Purchasing Power Variebles
1st. Moderate Nationally (Biggest)
2nd. National Food Spending
3rd. %Population Nationally
4th. Food Spending Per Capita
HSA MARKETING SECTOR
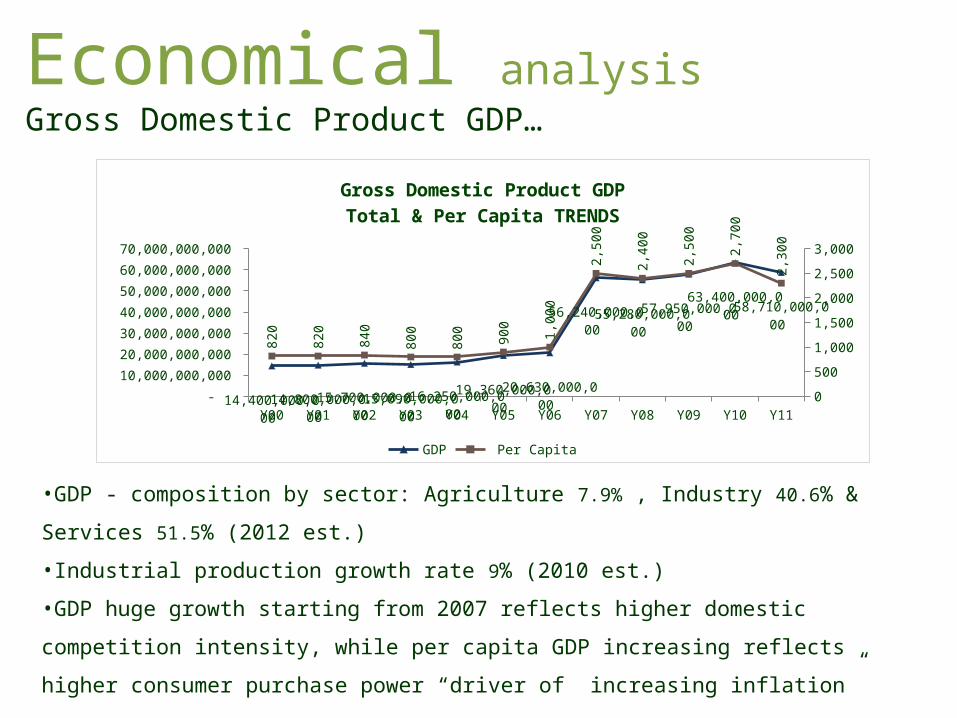
Economical analysisGross Domestic Product GDP…
•GDP - composition by sector: Agriculture 7.9% , Industry 40.6% & Services 51.5%
(2012 est.)
•Industrial production growth rate 9% (2010 est.)
•GDP huge growth starting from 2007 reflects higher domestic competition
intensity, while per capita GDP increasing reflects higher consumer purchase
power “driver of increasing inflation”
Y00 Y01 Y02 Y03 Y04 Y05 Y06 Y07 Y08 Y09 Y10 Y11 -
10,000,000,000
20,000,000,000
30,000,000,000
40,000,000,000
50,000,000,000
60,000,000,000
70,000,000,000
0
500
1,000
1,500
2,000
2,500
3,000
14,400,000,000 14,800,000,000 15,700,000,000 15,090,000,000 16,250,000,000 19,360,000,000 20,630,000,000
56,240,000,000 55,280,000,000 57,950,000,000 63,400,000,000
58,710,000,000
820
820
840
800
800
900
1,00
0
2,50
0
2,40
0
2,50
0
2,70
0
2,30
0
Gross Domestic Product GDPTotal & Per Capita TRENDS
GDP Per Capita
HSA MARKETING SECTOR
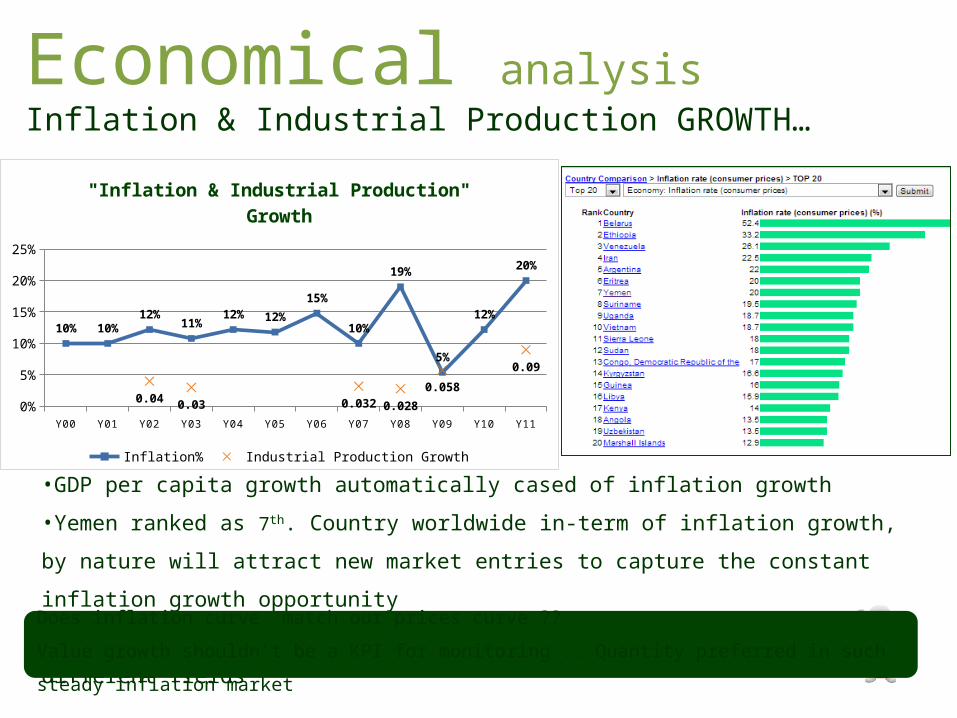
Economical analysisInflation & Industrial Production GROWTH…
•GDP per capita growth automatically cased of inflation growth
•Yemen ranked as 7th. Country worldwide in-term of inflation growth, by nature will
attract new market entries to capture the constant inflation growth opportunity
•Industrial production growth reflects competition intensity in different fields
Y00 Y01 Y02 Y03 Y04 Y05 Y06 Y07 Y08 Y09 Y10 Y110%
5%
10%
15%
20%
25%
10% 10%12%
11%12% 12%
15%
10%
19%
5%
12%
20%
0.040.03 0.032 0.028
0.058
0.09
"Inflation & Industrial Production" Growth
Inflation% Industrial Production Growth
Does inflation curve match our prices curve ??
Value growth shouldn’t be a KPI for monitoring .. Quantity preferred in such steady inflation
market

HSA MARKETING SECTOR
Economical analysisNational Trend For Foreign Investments Acquisition…
42
HSA MARKETING SECTOR
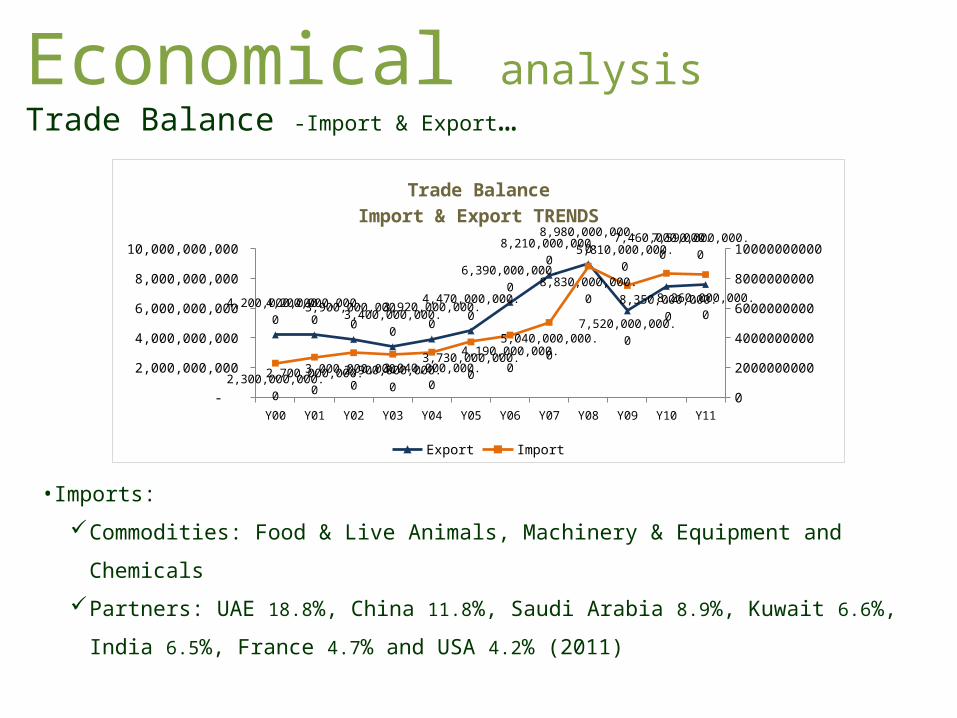
Economical analysisTrade Balance -Import & Export…
•Imports:
Commodities: Food & Live Animals, Machinery & Equipment and Chemicals
Partners: UAE 18.8%, China 11.8%, Saudi Arabia 8.9%, Kuwait 6.6%, India 6.5%,
France 4.7% and USA 4.2% (2011)
Y00 Y01 Y02 Y03 Y04 Y05 Y06 Y07 Y08 Y09 Y10 Y11 -
1,000,000,000 2,000,000,000 3,000,000,000 4,000,000,000 5,000,000,000 6,000,000,000 7,000,000,000 8,000,000,000 9,000,000,000
10,000,000,000
010000000002000000000300000000040000000005000000000600000000070000000008000000000900000000010000000000
4,200,000,000.04,200,000,000.03,900,000,000.03,400,000,000.0
3,920,000,000.04,470,000,000.0
6,390,000,000.0
8,210,000,000.08,980,000,000.0
5,810,000,000.07,460,000,000.07,590,000,000.0
2,300,000,000.02,700,000,000.03,000,000,000.02,900,000,000.03,040,000,000.03,730,000,000.0
4,190,000,000.05,040,000,000.0
8,830,000,000.0
7,520,000,000.0
8,350,000,000.08,260,000,000.0
Trade BalanceImport & Export TRENDS
Export Import

HSA MARKETING SECTOR
•Export growth gives a brilliant opportunity for company international expansion
•Imported growth reflects Yemeni consumer positive response toward the imported
products also indicates the increasing of consumer purchase power
We should continuously search for new opportunities beyond our national
boundaries; we have never been in a more internationalized and economically
competitive society than today.
A strategic plan should be conducted including answers for flowing questions:
Where is the attractive markets, Which countries to penetrate, How to enter (as an
exporter, licenser, joint venture partner or solo manufacturer), How to adapt our
products
and services features to fit each country, How to price our products in different
countries
& how to adapt effective communications which suits countries different cultures.
Economical analysisTrade Balance -Import & Export…
HSA MARKETING SECTOR
There are many potentially advantageous reasons to initiate, continue and
expanding exports:
Total turnover growth
Absorb excess capacity
Reduce overall unit cost
Spread economic risk over a wider number of markets
Extending product life cycle – existing products which are in the maturity or
declining stage might be reintroduced in another virgin market
Foreign market maybe has lower competition intense
Power and prestige in the domestic market will significantly enhance
companies bargaining power with consumers, customers, suppliers and local
manufactures
Increase media spending effectiveness through extending the prospects
segments
Economical analysisTrade Balance -Import & Export…

HSA MARKETING SECTOR
Environmental Scanning “Macro”Challenges…
Hard geographical natural, It's too tough to
get the full access for prospective
consumers
Economical and currency
fluctuation
Political instability & lack of
safety
Imported goods penetration characterized as (high quality, reasonable margins & affordable
prices)
Yemen consumer’s progressive trend toward
imported products to (Satisfy Ego & Better
quality perception)Result of Tribalism and Ethnicity, Clustered Demand formed “Consumer needs and desires
grouped into too many identical clusters (segments), each with its own set of purchase criteria
and preferences”

HSA MARKETING SECTOR
Environmental Scanning “Macro”What To Do !!
MANAGE THE CHANGE
In today’s Yemen business
environment more than in
any era, the only constant
is change, we should
effectively manage this
change, continuously
adapt bureaucracy,
strategies, system,
products and culture to
survive the shocks and
prosper from the forces
that decimate the
competition
VALUE
DIFFERENTIATION
We should find something
that rival firms can’t do,
or own something that
rival firm’s desire, which
can provide us with
competitive advantage,
gaining and sustaining
competitive advantage is
essential for long-term
success
STP
Companies can rarely
satisfy everyone in the
market, so we need to
clearly identify & profile
distinct groups who might
prefer or require varying
products and services
mixes by examining
demographic,
psychographic and
behavioral differences
among buyers

Thank YouAhmed Hamdy