yellowfin -lte - bvs wireless detection · pdf file3 about your yellowfin-lte all basic ports...
TRANSCRIPT

4G LTE Tablet PC Analyzermanual version 1.2
YELLOWFIN-LTE
YellowFin-LTE Receiver Hardware User’s ManualYellowFin-LTE/YellowFin-LTE Interface HardwareUnpacking Your YellowFin-LTE............................................................................................ 2About Your YellowFin-LTE.................................................................................................. 3Powering Your YellowFin-LTE............................................................................................. 3Optional Omni & Direction Finding Antenna Specifications.......................................................... 4YellowFin-LTE Standard & Optional Accessories Sheet.............................................................. 6
YellowFin-LTE General Operation Manual Introduction………….........................……………………………......................………… 7 Before Powering Up…...................………………………………......................………….. 7 Powering Up……......…………………………………....……………......................…........ 7 After Power Up………..………....……………………………..…......................………....... 7 Maintenance…...................……………………………..................................……....... 13
YellowFin-LTE Controller Software User’s Manual Introduction………….........................……………………………………… 14 Installation………........................………………………………………….. 15
System Requirements …..........………………………………….......…...... 15Connection Status………………………………………....………………........ 15Operating Modes………………....……………………………..…………....... 15 Spectrum…............…………………………….............……....... 16 Center/Span/Start/Stop……..…………………………........ 17 Marker/Delta...…...........……...……………….......…..… 17 Reference Level…….....………………………………........ 18 Resolution Bandwidth……….…………………………..…… 18 Screen Average………............…………………………..… 19 Traces…….....…...........……...……………….......…..… 20 Triggering………............……………………….......…..… 20 Video Smoothing…….................…..…………………..… 21 LTE..........…………...……………………............……………...... 22 Scan Mode..………………….............…..........……...... 22 Single Frequency Mode..………..………......…………...... 23 Single ID Mode..………..…………....................……..... 25 Multipath…………….....…………........……................. 26 Individual Spectrum…………….....…......……………...... 27
GPS………......................…………………………………...…..… 28 Data Logs………………..…...............................……… 29 Processing…….......…………............................……… 31 Fields…......….......…………............................……… 32 GPS Field Selection……………….......................……… 33 Spectrum Field Selection……………....................……… 34 LTE Field Selection……………...........................….…… 35 Options…..............……..….............................……… 36 System Information….......……..........................……… 37 Exit…....................…....….............................……… 37
Tutorial - Set Up & Run YellowFin-LTE Apps Setup and Run YellowFin-LTE Applications…………......……………........... 38
Projector Modules………...............………………………………………….. 39 Collector Module ….......……………………………….......….................. 43 Analyzer Module………………………………………....………………......... 44
1
2
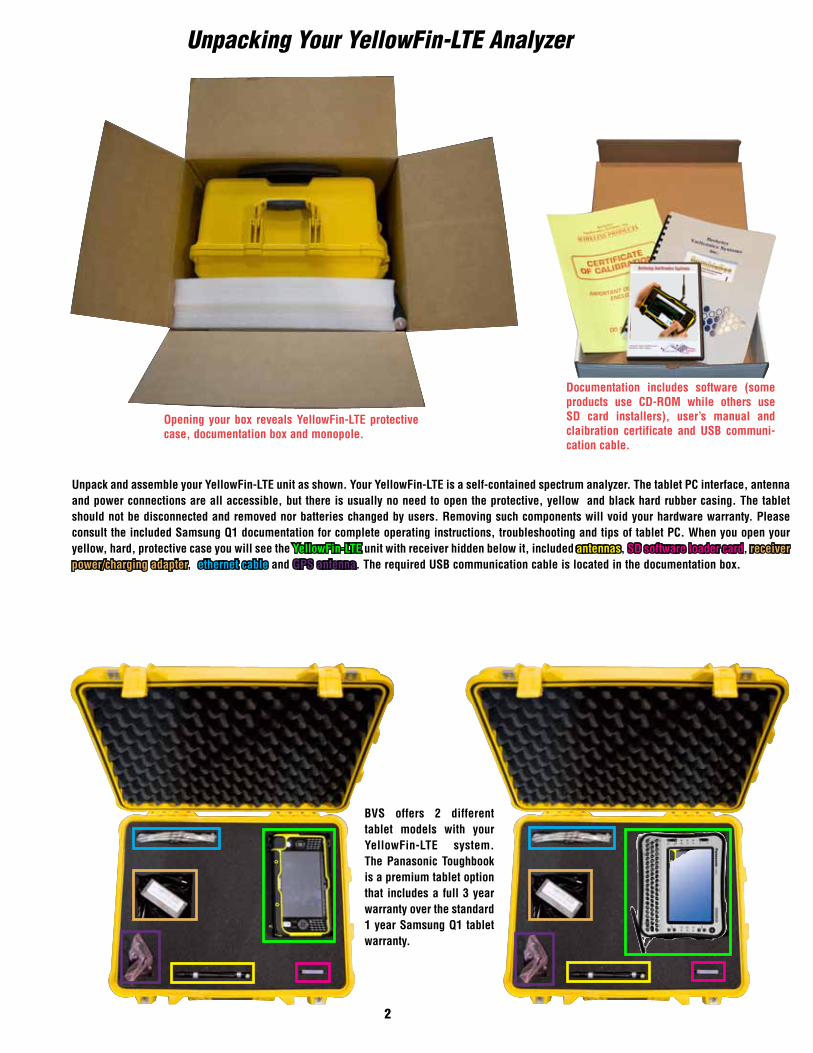
Unpacking Your YellowFin-LTE Analyzer
Opening your box reveals YellowFin-LTE protective case, documentation box and monopole.
Documentation includes software (some products use CD-ROM while others use SD card installers), user’s manual and claibration certificate and USB communi-cation cable.
Unpack and assemble your YellowFin-LTE unit as shown. Your YellowFin-LTE is a self-contained spectrum analyzer. The tablet PC interface, antenna and power connections are all accessible, but there is usually no need to open the protective, yellow and black hard rubber casing. The tablet should not be disconnected and removed nor batteries changed by users. Removing such components will void your hardware warranty. Please consult the included Samsung Q1 documentation for complete operating instructions, troubleshooting and tips of tablet PC. When you open your yellow, hard, protective case you will see the YellowFin-LTE unit with receiver hidden below it, included antennas, SD software loader card, receiver power/charging adapter, ethernet cable and GPS antenna. The required USB communication cable is located in the documentation box.
BVS offers 2 different tablet models with your YellowFin-LTE system. The Panasonic Toughbook is a premium tablet option that includes a full 3 year warranty over the standard 1 year Samsung Q1 tablet warranty.

3
About Your YellowFin-LTEAll basic ports and functions on the Samsung Q1 Tablet portion of your YellowFin-LTE Analyzer are explained in your Samsung
Q1 user’s manual included with your YellowFin-LTE unit. The YellowFin-LTE receiver contains all indicators and ports you need
to communicate with the Q1 tablet. The receiver should not be removed from the tablet unless a BVS technical support expert
has instructed you to do so. The ethernet 10/100 Mbit port is used to communicate with a PC. Be sure that the USB comm cable
is securely connected between the Q1 tablet and YellowFin-LTE receiver. The SD card slot is located next to that for installing,
removing or re-installing the YellowFin-LTE software. The SMA male antenna connector is for use with the included omni direc-
tional antennas or the optional DF antenna systems. Please consult with Berkeley engineers before employing any antenna not
supplied by BVS. The sylus can be found connected to the attached coil-cord which is attached to the bottom of the Q1 tablet.
The unit also contains a GPS antenna input when GPS data is required for studies.
Powering Your YellowFin-LTEPowering up your YellowFin-LTE begins by switching power on the Tablet PC. The Power ON/OFF switch is located on the side
of the tablet PC under the rubber flap. YellowFin-LTE receiver contains an internal, rechargeable Li-Ion battery system in the
receiver unit on the bottom. Users should not open the receiver unless a BVS technical support expert has instructed you to do
so. The internal batteries are charged using the supplied DC power adapter connected to the power input. Consult the technical
specifications sheet for common charging and running times for your unit. The red LED light next to this power input will blink
while charging and go solid red when charging is complete. When your YellowFin-LTE receiver is charged, the Samsung Q1
tablet is powered on and the YellowFin-LTE software is running, the red LED on the receiver (next to the GPS antenna input) will
turn on. This indicates constant communication between the receiver and the tablet interface. NOTE: BVS recommends charging the unit once every 2 weeks (once a month at an absolute minimum). Failure to do so may damage the battery and/or reduce battery run time. Not following these instructions may void warranty coverage on the battery.
Opening Your YellowFin-LTEAlways contact BVS technical support (1-888-737-4287 or +1 732-548-3737 8AM - 6PM EST or e-mail support@bvsystems.
com) before attempting any modifications or repairs to your Yellowjacket-TABLET. In some cases, users may replace batteries
or perform simple changes within the receiver module but failure to contact BVS technical support for procedural steps before
proceeding will result in a VOIDED WARRANTY.
YellowFin-LTE Top View(both models shown)
SMA Male Antenna InputWarning: Maximum input 0 dBm NO DC Input
Panasonic Toughbook
Center screw must be loosened fully (turn counterclockwise) before detaching tablet from receiver.
SMA Male Antenna InputWarning: Maximum input 0 dBm NO DC Input
Power ON/OFF switch located under rubber flapSamsung Q1

2.4 GHz Omni-Directional (7.5” long)2.4 GHz Direction FindingCorner Reflector
4.9/5 GHz Direction FindingCorner Reflector
4
4.9/5 GHz Omni-Directional (5.5” long)
Optional Directional & Omni Antenna Specifications

5

6
Accessories for your
2.4 GHz Direction Finding Antenna with mounting brack-et, cable & SMA male9 dBi gainP/N 2ND$ 250.00
Rugged Carrying CaseABS PlasticP/N P-CASE$ 150.00
2.4 GHz Omni AntennaSMA male swivelP/N S151AM-2450S$ 25.00
4.9/5 GHz Direction Finding Antenna with mounting bracket, cable & SMA male9 dBi gainP/N 5NE$ 250.00
30 dB attenuator pad for use with directional antennas (between DF antenna & YellowFin-LTE) SMA male to femaleP/N bbpad30$ 30.00
3.5 GHz Omni AntennaSMA male swivelP/N 5NP$ 25.00
4.9/5 GHz Omni AntennaSMA male swivelCo-Linear Dipole 5 dBi VSWR 1.8:1P/N K181AM-5250S$ 25.00
12VDC to 110VAC car cigarette lighter power inverter75 Watts outputP/N YF-12V-USB$ 75.00
OPTIONAL
OPTIONAL
OPTIONAL
OPTIONAL
STANDARD
STANDARD
STANDARD
STANDARD
STANDARD
OPTIONAL
YellowFin-LTE
700 MHz Omni AntennaSMA male swivelP/N S151AM-700$ 25.00 STAN
DARD

7
YELLOWFIN-LTE GENERAL OPERATION MANUAL
INTRODUCTION The purpose of this operator manual is to help the user properly setup the YellowFin LTE Analyzer unit hardware components prior to powering it up, and properly setting up the instrument attributes to be able to start using it.
For detailed instructions and lower-level menus of the LTE Analyzer application software the user is referred to the software manual entitled “BVS YellowFin LTE Receiver PC Software User Manual” accompanying this manual.
BEFORE POWERING UP A functioning YellowFin LTE 4G Analyzer product is comprised of the following components:
1. Panasonic CF-U1 TOUGHBOOK computer with Windows Operating System
2. LTE 4G Wireless Receiver Module 3. BVS YellowFin LTE Receiver PC Software
4. Receiving Antenna (multi-band Omnidirectional or Directional – 2.4GHz or 5.8GHz) Both the PC(1) and the Receiver (2) have internal batteries; they both have to be charged adequately before attempting to power the system. Assuming this condition is satisfied, proceed to configure the hardware:
Configuring the Hardware The hardware is configured as follows:
1. Insert the USB connector terminating the cable from the LTE Receiver into the USB port on the TOUGHBOOK PC
2. Connect the appropriate antenna to be used (Omnidirectional or one of the two Directional antennas) to the SMA jack (female) on the LTE Receiver
3. Connect the GPS Antenna cable to the coaxial port labeled “GPS” on the LTE Receiver module. Position the GPS antenna for an unobstructed and full “view” of the skies.
POWERING UP (powering off) The system is powered up by pressing the Power button on the TOUGHBOOK PC (to power off the system, simply turn off the PC).
AFTER POWER UP After the PC is booted and Windows Desktop is visible and settled, proceed to attaining “lock” on GPS timing as in the next section.

8
Attaining “Lock” on GPS Timing for Collecting Outdoor Data If the system is to be used outdoors, all data needs to be labeled by Time and Position information derived by the internal GPS receiver of the system. To attain “Lock” on GPS Timing;
1. Tap the “YellowFin LTE” icon on the Windows Desktop to start the Application Software and open the Main Screen (MS) (as described below)
2. From the MS, select the GPS button
3. Wait long enough for the GPS receiver to synchronize to satellite signal(s) indicated by the display of the “Lock” attribute to the right of the “Status” field in Figure 4 below.
If the system is to be used indoors, no dependable GPS data may be produced, hence this step can be skipped.
Initiation of Main Screen (MS) To start the LTE Analyzer double click on the “YellowFin LTE” icon from the Windows desktop touch screen to obtain the “Welcome to Yellowfin LTE” window, listing the 6 steps of “The BVS YellowFin LTE Receiver GETTING STARTED BASICS” . Click on “CONTINUE” to initiate the Main Screen (MS) seen in Figure 1:
Figure 1. Main Screen (MS) Any one of the 7 buttons seen in the MS may be selected by touching the screen. The functions associated with each button are discussed next:
“Spectrum” button Selecting this button makes the analyzer function as a typical Spectrum Analyzer (SA). The corresponding screen appears in Figure 2:

9
Figure 2. Spectrum Analyzer Screen The attributes listed on the right-hand side of this screen are:
FREQUENCY
SPAN AMPLITUDE
RES BW (resolution bandwidth) VID SM (video smoothing)
SCR AVG (screen average) TRACES
MARKER DELTA
TRIGGER each attribute may be adjusted by touching the corresponding zone on the touch screen and making changes in a lower-level menu. For example, selecting the “FREQUENCY” will allow the user to enter “CENTER”, “START” and “STOP” frequencies via a lower-level numerical pad type menu.
For a more detailed discussion of these menus, the user is referred to the software manual entitled “BVS YellowFin LTE Receiver PC Software User Manual” accompanying this manual.
“LTE” button Touching this button takes the user to the prime functionality of the unit, namely LTE Analyzer, displaying the LTE Scan screen seen in Figure 3:

10
Figure 3. LTE Scan Screen
“LTE Scan” mode Setup Prior to using the unit in the LTE Scan mode, the system has to be set up by specifying relevant attributes. To setup LTE Scan, enter attributes in the same order as the sequence of commands appearing on the right-hand-side of the LTE Scan screen (Figure 3), as follows:
1. Create the channel list using “CHANNEL LIST” button to enter the “Frequency List” screen, in order to enter desired channel frequencies, within the LTE Receiver unit frequency band1. Return to LTE Scan screen by selecting “BACK”. The list of channels will appear on the left-hand-column in Figure 3.
2. Define the bandwidths for the channels defined in Step 1, by selecting “BANDWIDTH” and choosing the former in the “LTE Bandwidth Selection” screen. Return to LTE Scan screen by selecting “RETURN”
3. Next, select “DROPOFF” to define the drop-off time for initially detected signal IDs from the “Drop Inactive ID After” screen. After setting it enter “OK” to return to the LTE Scan screen.
Following these steps, the user should begin to observe in time, points accumulating in the lower central plot (ID vs. PSS Power in dBm), with corresponding entries listed in the upper central Table in the LTE Scan screen, listing the signal attributes :
Frequency (MHz)
1 The LTE Receiver unit comes in two frequency band versions (700-2200MHz and 2.0-5.9GHz).

11
ID
Type RSSI
RSRP RSRQ
PCINR The user is referred to the corresponding section(s) in the “BVS YellowFin LTE Receiver PC Software User Manual” for accessing and using lower level menus in the LTE Scan mode.
“GPS” button Selecting this button will display the GPS Information screen seen in Figure 4:
Figure 4. GPS Information Screen Time-of-Day and Position data is generated by the GPS receiver. When using the LTE analyzer for outdoor surveys, this information is essential for uniquely labeling the data. Hence the user should always confirm that the GPS receiver has “locked” to satellite timing prior to starting to gather outdoor data. For indoor data gathering, Time-of-Day and Position data from the GPS receiver is not reliable, hence it should be ignored or considered irrelevant. For further details see the “BVS YellowFin LTE Receiver PC Software User Manual” accompanying this manual.
“Data Logs” button Selecting this button will allow the user to set up and/or specify data files on the TOUGHBOOP PC to log corresponding data, via the DATA LOGS screen seen Figure 5.

12
Figure 5. Data Logs Screen
The user can make appropriate choices by selecting the fields listed on the right-hand-side of the DATA LOGS screen (i.e., FILE, START, STOP, MODE). The user is referred to the corresponding section in the “BVS YellowFin LTE Receiver PC Software User Manual” for detailed lower-level menu instructions. Selecting “RETURN” sends the user to the MS.
“Processing” button Selecting this button will display the “DATA PROCESSING” screen seen in Figure 6. Starting from this screen, the user can selectively convert the logged data into ASCII files, suitable for importing into MS Office or other various application software. The user can accomplish these functions via the simple menu commands listed on the right-hand-side of the screen:
INPUT FILE
OUTPUT FILE
FIELDS
OPTIONS
MAIN (to return to MS)
For detailed instructions and lower-level screens, the user is referred to the corresponding section in the “BVS YellowFin LTE Receiver PC Software User Manual”.

13
Figure 6. DATA PROCESSING Screen
“Information” button Selecting this button will display the following information about the system:
1. YellowFin LTE Analyzer software version number 2. unit hardware serial number
3. unit firmware version number 4. unit frequency range
Selecting “OK” takes the user back to the MS.
“Exit” button Selecting this button exits the YellowFin LTE application program and returns the user to the Windows Desktop touchscreen of the TOUGHBOOK computer.
MAINTENANCE The LTE Receiver and the TOUGHBOOK PC internal batteries need to be charged regularly for trouble-free operation of the system.

14
BVS YellowFin LTE Controller
Software User’s Manual INTRODUCTION The YellowFin LTE control software runs on a Windows-based Tablet (XP/Vista) that is connected to a YellowFin LTE system. This connection is made through USB. The software can also run on a Windows PC or laptop if portability is not desired. Through this USB connection, the YellowFin can be controlled. The YellowFin can be set to any mode and settings available. Data can be monitored in real-time and stored in a log file for later post-processing.
YellowFin LTE PC Software

15
INSTALLATION The YellowFin Controller software can be installed from the SD card provided using the USB SD card adapter. .NET Framework needs to be installed on the computer in order for the software to function correctly. This framework is already installed at the factory on the tablet systems. The framework can be found on the SD card or on the internet at www.microsoft.com. SYSTEM REQUIREMENTS Below is the minimum system requirements recommended to run the YellowFin LTE software. Tablet Operating Systems: Windows XP,Vista PC Operating Systems: Windows Vista, Windows 7 (32-bit) Processor Speed: 1.33 GHz Memory: 1 GB RAM Hard Drive : 15 GB CONNECTION STATUS The status bar on the bottom of the main window will display the serial number of the YellowFin hardware and the firmware version installed. This information will only be displayed if the software has connected properly. A 'NOT CONNECTED' message will be displayed if this information was not able to be retrieved. Other items on the toolbar include a real-time clock, log file status, and whether or not the YellowFin is being powered internally via battery or externally via the A/C transformer and cord.
OPERATING MODES When starting up the application, a main menu will appear. The options for

16
each of the menu items are discussed in the following sections.
SPECTRUM Pressing the “SPECTRUM” button from the main menu placing the instrument into “Spectrum Analysis” mode. A screen will appear which displays the current spectrum being scanned as well as an option menu on the right-hand side of the screen.
SPECTRUM ANALYSIS MODE
The 'RETURN' option on the menu will return control to the main menu. The following information is displayed underneath the current spectrum: Center Frequency

17
Current Span Start Frequency Stop Frequency Resolution Bandwidth Reference Level The settings available from the option menu are discussed in the following sections. They are listed in alphabetical order with menu depth listed in parenthesis. For instance, the option for reference level is listed as (AMPLITUDE/REF LVL). This is because the user must press the AMPLITUDE option followed by the REF LVL option. Center Frequency: (FREQUENCY/CENTER) Changes the center frequency of the spectrum being displayed. Delta: (MORE/MORE/DELTA/ON-OFF) This delta marker shows the difference in frequency and power from the marker. Delta Center: (MORE/MORE/DELTA/CENTER) Places the delta at the center frequency of the current spectrum. Delta Peak: (MORE/MORE/DELTA/PEAK) Places the delta on the highest power value. Delta Track: (MORE/MORE/DELTA/TRACK) Choosing this option will have the delta marker track the peak value. Full Span: (SPAN/FULL SPAN)

18
That span will be set to the last span that was set using SPAN. Last Span: (SPAN/LAST SPAN) The span will be set to the last span value using any of span options. Marker: (MORE/MORE/MARKER/ON-OFF) The marker menu option allows the user to place a marker at a certain frequency. The frequency and power values are shown at the marker position. Marker Center: (MORE/MORE/MARKER/CENTER) Places the marker at the center frequency of the current spectrum. Marker Peak: (MORE/MORE/MARKER/PEAK) Places the marker on the highest power value. Marker Track: (MORE/MORE/MARKER/TRACK) Choosing this option will have the marker track the peak value. Reference Level: (AMPLITUDE/REF LVL) This menu option allows the user to set the current reference level of the receiver. The valid choices are between -20 and -70 dBm, in 10 dBm increments. The Reference Level should be adjusted to obtain the greatest dynamic range. The Reference Level should be set so that the strongest signal on the display is about 10 dB down from the top of the measurement display. If a signal is drawn off the top of the measurement display or the message “clipped” is displayed, lower the Reference Level. Resolution Bandwidth: (MORE/RES BW) The YellowFin measures the energy present in different frequency bins, each bin’s width equal to the resolution bandwidth. The resolution bandwidth is

19
set by setting the level for the resolution bandwidth desired. Why use a small Resolution Bandwidth? A small Resolution Bandwidth is appropriate to measure frequency components and signal characteristics. Smaller Resolution Bandwidths increases the Sweep Time (number of traces displayed per second) for a given frequency span. Why use a large Resolution Bandwidth? A large Resolution Bandwidth is appropriate to measure large Spans of frequencies quickly. A Resolution Bandwidth larger than the signal’s bandwidth can measure channel power. The YellowFin may be set to a large Resolution Bandwidth and a large Span to quickly sweep and identify frequencies of interest. The Span and Center can then be decreased to measure frequency components and the signal's characteristics. Screen Averaging: (MORE/SCR AVG) Using this setting, the average of the last N sweeps will be displayed. Span: (SPAN/SPAN) Sets the new span of the spectrum being displayed. Span Zoom: (SPAN/SPAN ZOOM) Reduces the span to half of the current span. Start Frequency: (FREQUENCY/START) Sets the start frequency of the spectrum displayed. Center and Span will be adjusted accordingly. Stop Frequency: (FREQUENCY/STOP))

20
Sets the stop frequency of the spectrum displayed. Center and Span will be adjusted accordingly. Traces: (MORE/MORE/TRACES) There are three available traces for display. By default, trace 1 is set to the live feed. Each trace can be set to the following: • LIVE – Current real-time data will be displayed. • PEAK – The highest value recorded at each frequency will be displayed. • AVG – Video Smoothing and Screen Average results will display. • FREEZE – The last sweep will be displayed and frozen. • OFF – Trace will be turned off.
Trigger: (MORE/MORE/MORE/TRIGGER) Triggering enables the YellowFin to quickly capture the spectrum from

21
sources that are not continuously transmitting. The trigger threshold represents the amount of CHANNEL POWER that when exceeded will trigger the YellowFin to measure the spectrum.
The trigger delay sets a delay between the trigger threshold being exceeded and the measurement of the spectrum. The trigger threshold is set by the user in dBm, and its range is from the current Reference Level to 20dB below the current Reference Level. Trigger Mode is very useful to capture the spectrum from any source that is not continually transmitting on the same frequency. Video Smoothing: (MORE/VID SM) Video Smoothing uses adjacent bin averaging to reduce the amount of fluctuation in the measured trace due to noise. This is different from Screen Averaging, which averages the same frequency bin from different traces. Use the arrows to increase or decrease the bandwidth which are averaged for the smoothing. When properly set, Video Smoothing can reduce the variation of the trace due to noise without distorting the trace. It is especially useful for smoothing

22
signals that are not continuous or repetitive. The user must use good judgment when applying Video Smoothing. It is possible to smooth the trace too much so that the trace no longer represents the spectrum of the signal.
LTE Pressing the LTE icon from the main menu brings up channel scan mode. This mode will display any Cell ID's found on any of the frequencies in the scan list. SCAN MODE By default, the last frequency list selected is used. A new or existing channel table can be loaded by choosing the “channel list” option from the LTE options menu on the right. Using this dialog, a user can create a new list, and save/restore existing lists to /from a file. Scan Mode will scan through these frequencies one at a time. Each frequency in the list is color-coded (up to 16 frequencies are allowed). Any Cell ID's that show up when the receiver is tuned to a particular frequency will show

23
up in the color of the frequency box. To look at an individual frequency only, touch the frequency box desired from the list on the left. Fields which are displayed at the top of this screen include: Frequency Type (whether or not this is a TDD or FDD transmission) Cell ID Group Sector RSSI SINGLE FREQUENCY MODE The list at the top of the screen will display any Cell ID's that were found on the selected frequency. If the Cell ID has not been seen for a time period it will eventually fall off of the list. The following fields are shown in the list on the top: • CELL ID – Cell ID. • GROUP – Group of this ID. • SECTOR – Sector of this ID. • BANDWIDTH – Bandwidth of this ID. • RSSP – Reference Signal Received Power. • RSSI – Received Signal Strength Indicator. • RSRQ – Reference Signal Received Quality. The bandwidth used for measuring can be adjusted by pressing one of the bandwidth options in the menu on the right side of the screen.

24
Press a particular ID from the list on the left of the display to go to Single ID mode. Press 'Return' on the options menu to go back to scan mode.

25
SINGLE ID MODE A closer look can be made at each of the Cell ID's in the list. Clicking on an item in the list will put the YellowFin into individual Cell ID mode. Only information from the selected Cell ID will be displayed. Press 'Return' from the options menu to go back to single frequency mode. The RSSI value for the selected ID is shown along with other ID information such as group,sector, etc. There are two additional data screens. These are Multipath, and Individual Spectrum. They can each be chosen from the option menu on the right hand side of the display.

26
MULTIPATH This display shows the multipath components for the preamble in question. In general, there should be one peak at or near the line marked '0'. Anything to the left is before the signal arrives. If multiple peaks are displayed to the right of the main peak, these would be multipath components. In essence, reflections of the main received signal path are seen. This could be from walls inside a building or clutter in the outside environment such as buildings.

27
INDIVIDUAL SPECTRUM This figure shows the individual spectrum centered on the carrier frequency. The spectrum shown is with one preamble on a single frequency. Different preambles may be on different segments. If there were preambles on different segments, more of the spectrum components within the waveform would show at values above the noise floor.

28
GPS Choosing GPS from the main menu activates a display which contains information from the internal GPS receiver. This display will show the position and current time if there is a 3D lock acquired from the GPS satellites in orbit. This information can be useful in real-time and also in post-processing as it is contained in log files.
If there is a point of interest during a study, the position and time will be marked in the log file along with the data taken at that point in time.

29
Data Logs Use this option of the main menu to start and stop logging of data being transmitted from the YellowFin to the computer running the YellowFin application.
There are a number of options in the option menu to facilitate the logging of data which can be post-processed later using the Processing option on the main menu. The log file contains information for either LTE or Spectrum mode as well as other information such as GPS data and receiver information. FILE The file option lets the user choose where to store the data being logged. START

30
Pressing this button on the option menu opens the file for logging using the current mode. STOP Pressing this button on the option menu closes the file to logging. MODE Pressing this button allows the user to decide whether or not the file will be overwritten or appended to when logging is started.

31
Processing The processing option off of the main menu allows the user to convert data logged into an ASCII-delimited readable format which is suitable for various spreadsheet applications as well as other applications for further post-processing. The main processing screen displays the current files selected, the fields and options selected, the number of bytes in the input file, and the progress of any conversion in progress. The options menu on the right allows for the selection of the input (binary) file, the output (converted) file, the fields to be included in the output file, and the options to be used during conversion.

32
FIELDS Choosing FIELDS from the option menu displays the 'Data Type' selection. Choose whether to convert LTE data or SPECTRUM data. The option menu on the right the allows for the selection of individual GPS, spectrum, or LTE fields.

33
GPS GPS fields which can be selected include latitude, longitude, date, time, speed, altitude, and status (2D or 3D lock).

34
Spectrum Spectrum fields include center, span, start and stop frequencies. Also, step size, resolution bandwidth, reference level, first frequency in the current record, count of rssi values in the current record, and the actual rssi values for the record.
35
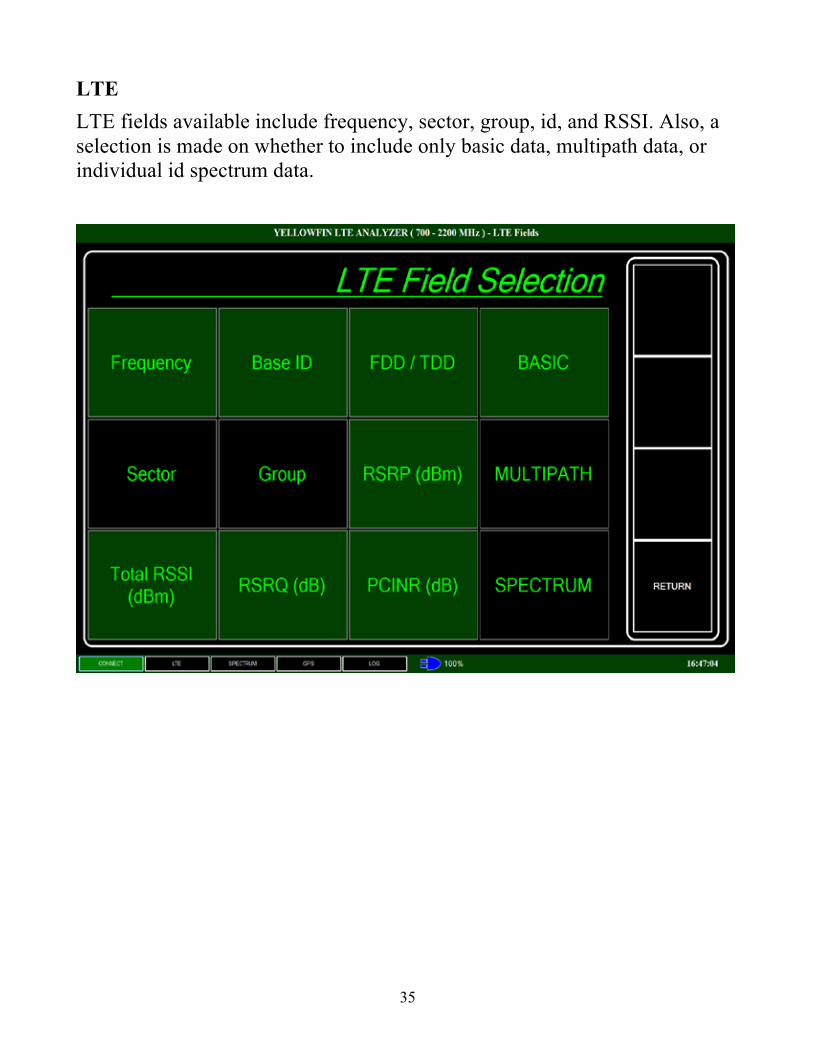
LTE LTE fields available include frequency, sector, group, id, and RSSI. Also, a selection is made on whether to include only basic data, multipath data, or individual id spectrum data.

36
OPTIONS Certain options which are selectable by pressing the options button in the option menu of the main processing display. These include the selection of a field delimiter, whether or not units will be Metric or English, and if a header record is to be included in the output file.

37
System Information The system information button on the main menu displays pertinent version and copyright information.
Exit Pressing this button from the main menu will exit the YellowFin application. Various settings and options are saved.

38
Tutorial – Set Up & Run YellowFin-LTE Apps The Yellow Fin LTE Analyzer comes with a number of optional application software packages. The current manual is generated to demonstrate to the user the setup and running of these software modules. The functions performed by each of these modules are summarized in Table 1:
Table 1. Functional Summary of Application Software Packages
Application Module
Functional Summary
Linear Projector or BVS Projector
For floor spaces, use the “Linear Projector” application. For outdoor spaces (geographic) use the “BVS Projector” application. The projector modules generate the background map for the specific floor space or geographic area to be surveyed by the analyzer module. The output from the projector modules is used as input by the Collector module. Both of these modules may be run on a fixed desktop or laptop.
Collector This module collects field data produced by the Yellow Fin LTE receiver in correlation with the geographic map or floor-plan produced by the corresponding Projector module. This module has to be run in the field, on the Tablet or Toughbook comprising the Yellow Fin LTE Analyzer, along with the YF LTE Receiver, while driving or walking.
Analyzer The Analyzer module generates the final results of the surveying effort in the form of received signal strength (RSSI) and/or signal-to-noise ratio per channel (PCINR) values over the geographic map generated by the Projector module. This module may be run on a fixed desktop or laptop.
To assure meaningful outputs from these modules, the user needs to follow the steps outlined in the Sample Example demonstrated in the rest of this manual. Prior to the use of this product for an actual survey, the user is advised to repeat these steps using a map for a local, well-known geographic area. It is assumed that all application modules and USB drivers are already installed as specified in the detailed Software manuals accompanying this product.
Projector Modules It is advisable to install the Linear Projector and BVS Projector applications on a desktop with a large enough display screen to be able to define and characterize desired areas and points adequately. In this case example we use the BVS Projector, because the Linear Projector module is relatively simpler to use.

39
Linear Projector Not used in this tutorial example. The user is referred to the detailed manual for a comprehensive coverage.
BVS Projector To initiate this module, the user selects a geographic area of interest, about the size of a “cell” typically not to exceed about a mile or two accross. In the current example, this map was extracted from Google Maps, for downtown Metuchen, NJ, as follows:
5. The area of interest was extracted from Google Earth by taking a screen shot, and saving as a bitmap (bmp) file.
6. Launch BVS Projector, click “File” then “New”, then select the bitmap file saved in Step 1. The base map will be displayed as seen in Figure 1. The red dot at the right upper corner in Figure 1 means that the base map needs to be geo-coded as specified in Step 3. Leave this window open, to be used in Step 4 below for entering points of reference.
Figure 2. Bitmap File Displayed by BVS Projector
7. Next, the user has to define the Latitude and Longitude coordinates of at least six (6) points of reference in the same map (obtained from Google Earth or other reliable source), as listed in standard format in Table 2:

40
Table 2. Coordinates for Six Points of Reference in Sample Map
Label Lat N (d m s)2
Long W( d m s) 3
Description
1 40 32 48 74 22 47.6 BVS 2 40 33 0.4 74 22 15.6 Central Av. & Plainfield Av. 3 40 32 51.9 74 22 13.9 Central Av. & Midland Av. 4 40 32 36.9 74 21 45.8 Rt. 27 & Main St. 5 40 32 37.1 74 22 10.9 Central Av. & Durham Av. 6 40 33 0.4 74 22 0.8 Main St. & Plainfield Av.
8. Having selected and tabulated (Table 2) the six points of reference in the base map, the user returns to the screen in Figure 1 of Step 2 to enter the corresponding coordinates as follows: Click on the 5th icon (Input Options) from the left in the BVS Projector screen toolbox (see Figure 1), select “Degree::Minute::Second” from the pull-down menu and select “OK”.
9. Click on the 6th icon (Set points) from the left in the BVS Projector screen toolbox (see Figure 1). This will change the appearance of the cursor from the usual mouse arrow to a small “cross-hairs” to facilitate accurate positioning of the cursor to any desired point on the map. The user moves the cursor to the first point of reference in Table 1 , and Left-Clicks to initiate the point entry window seen Figure 2 and enters the coordinates exactly as seen in the screen-shot in Figure 2 below. Then click “OK” to repeat the same for the second point in Table 1.
Figure 3. Entry of Point 1 Coordinates from Table 1 IMPORTANT NOTE: Points to the West of the Prime Meridian 4 have to be entered with
a negative sign (hyphen) preceding the Longitude “Degree” field – ONLY. 2 North (Degree, Minute, Second) format 3 West (Degree, Minute, Second) format 4 Longitude 0 degrees, 0 minutes, 0 seconds, corresponding to Greenwich, U.K.

41
10. After the sixth point is entered in the same manner, the program will accept the points (or ask for more points of reference) with accompanying information on overall accuracy as seen in Figure 3. Note also the Green dot (replacing the corresponding Red dot in Figure 1) indicating that the base map is now geo-coded. The map accuracy is now 0.19 Seconds, corresponding approximately to 19 feet.5
Figure 4. Base Map Geo-Coded with 0.19 second Accuracy
11. The geo-coded map now appears with all six points of reference, as seen in Figure 4:
5 Sixty (60) seconds = 1 nautical mile = 6076.1 feet; hence, 1 second = 6076.1/60 ~ 101 feet.

42
Figure 5. Geo-Coded Base Map with all Six Points of Reference
12. Next, the map is saved by clicking “File”, then selecting “Output A Geo-Map...”, giving it a name and saving it as a “GPF” (or, .gpf) file, as seen in Figure 5, then close the file. Before the next step can be performed on the YF LTE Analyzer, the geo-coded projection file has to be transferred to the Tablet or Toughbook computer.
Figure 6. Saving the geo-coded Projection File as a “GPF” file

43
Collector Module As a prerequisite to the following steps, the portable YF LTE Analyzer system has to be powered up, signal and GPS antennas have to be connected and the unit allowed to boot and settle for 5 to 10 minutes to accomplish synchronization with the GPS Sattelite system. Unless otherwise noted, the following steps are performed on the YF LTE Analyzer system (comprised by the Tablet/Toughbook computer and the YF LTE Receiver unit):
13. Start the Dragnet Collector program by double-clicking the corresponding icon on the Tablet/Toughbook desktop, then click on the leftmost icon designated “PROJECTION FILE” in the toolbox and select the file generated in Step 8 above.
14. Next, the user has to specify a new (or existing, with previous data) collection (.dld) file by clicking on the second icon from the left, designated “DATA FILE” in the toolbox area and click “Start”.
15. Next, the user has to select channel frequencies to be monitored, by clicking on the third icon from the left, designated “FREQUENCY LIST” in the toolbox area. This will open an intuitive window for entering the channel frequencies. The same frequencies will be listed on the left-hand-side of the Dragnet Collector window.
16. Next the user selects channel bandwidths by clicking on the fourth icon designated “BANDWIDTH” in the toolbox area. This starts a dialog box to allow the user to select among 3, 5, 10 or 20 MHz for channel bandwidth.
17. At this point, if the system has synchronized to the GPS Sattelite System the two sides of the Dragnet Collector screen will have turned Green (otherwise, the same areas will stay Brick Red for as long as the unit is not synchronized). The user cannot proceed to the next step, unless this synchronization (or, “GPS Lock”) has taken place.
18. Once the window turns Green, the user may start automatic scan by clicking on the fifth icon designated “START SCAN” in the toolbox area. The system will record signal levels at the rate of one per second. The user can now walk or drive over the area of interest and see new points being collected directly on the map, in real-time. When all areas of interest have been covered, the user can click on the sixth icon from left, designated “STOP SCAN” to stop collecting data. Stopping the scan will automatically update and save the collection file (or, data file) with the name specified in Step 10. The last two icons in the toolbox area can be used for zooming in or out as needed for inspecting the collected data points for as long as the collection file is open.
19. Exit the Dragnet Collector program.

44
Analyzer Module This program module may be run on a fixed desktop or laptop as long as the Projection and Data files are transferred to the former. The user follows the following steps:
20. Start the Dragnet Analyzer program module by double-clicking on the program icon, to obtain the blank Dragnet Analyzer screen seen in Figure 6:
Figure 7. Dragnet Analyzer Started 21. Select File, New, Analysis, then specify the name of the analysis file (analys-1.dlaf). 22. Select File, Open, Projection, and select the (metuchen.gpf )file generated in Step 8 above. This
will load the map file to the screen (see Figure 7) 23. Next, select File, Open, Data and select the (Data.dld) data file generated in step 14 above.
This will load the particular trajectory used while driving or walking on top of the map as seen in Figure 7 below. The three files for map projection, data and analysis are also listed in the upper center of the screen in Figure 7. Observation: When the user is moving extremely slowly, or stationary for a prolonged period of
time (several minutes or more), the trajectory points generated by the GPS receiver may drift; this is not due to any limitations of the YF LTE Analyzer system, but it is contributed by the GPS System itself and other errors due to random blockage or scattering of GPS signals by foliage or local weather conditions which may be hard to avoid. Generally, if the user is moving at the rate of a brisk walk (i.e., approximately 4 statute miles/hour) or higher, trajectory point drifting will be minimal.

45
Figure 8. Dragnet Analyzer Loaded and ready to run 24. To obtain the “coverage” for PCINR(dB) (Signal to Noise Ratio for the channel monitored),
click on the “Generate Coverage” button in Figure 7. The output of this analysis appears in Figure 8:
Figure 9. Computed PCINR Coverage
25. The RSSI coverage may similarly be obtained by selecting “RSSI (dBm)” in Figure 7 and

46
pressing “Generate Coverage”. The output of this analysis appears in Figure 9:
Figure 10. Computed RSSI Coverage
26. Exit the Analyzer Program module. The analysis file is automatically updated and saved.
These analysis outcomes may be retrieved at any time later, from the Analyzer Program module, by opening the analysis file (analys-1.dlaf), selecting “PCNR(dB)” or “RSSI(dBm)”, then pressing “Generate Coverage”.