year end 2020 - final - keyera
TRANSCRIPT
Keyera Corp. TSX: KEY 2020 Year End Report February 10, 2021
KEYERA CORP.
2
February 10, 2021
2020 Year End Report For the period ended December 31, 2020
CORPORATE HIGHLIGHTS
Keyera delivered adjusted earnings before interest, taxes, depreciation, and amortization (“adjusted EBITDA”1) for the fourth quarter of $168 million, contributing to $874 million for 2020. This represents a year-over-year decrease of only 7% from a record year in 2019, demonstrating the resilience of the business through even the most severe of commodity price downturns linked to the global pandemic. The strong financial results were delivered despite unplanned outages at the Wapiti and Alberta EnviroFuels (“AEF”) facilities that reduced annual EBITDA by approximately $45 million.
Distributable cash flow1 (“DCF”) was $133 million in the fourth quarter, with a record full year DCF1 of $718 million representing an annual increase of 21%.
Net earnings2 were negative $75 million for the fourth quarter and $62 million for the full year, compared to $30 million and $444 million, respectively, for the same periods in 2019. The decrease is largely attributable to an overall 2020 impairment expense of $371 million, of which $123 million was taken in Q4. The impairment expense resulted primarily from the shutdown of gas plants as part of the asset optimization program.
2020 dividends declared to shareholders were $423 million or $1.92 per share, a 7% increase over dividends declared in 2019. This represents a 59% payout ratio from distributable cash flow1, which was well within the targeted ratio of 50 to 70%.
Growth capital spending excluding capitalized interest was $524 million, in-line with the previously provided guidance range of $500 million to $550 million. The capital program was significantly reduced during the year following the decision to defer the KAPS pipeline project by one year.
The company achieved a 2020 Return on Invested Capital (“ROIC”1) of 11.4% demonstrating its continued ability to generate attractive returns through commodity price cycles.
Keyera maintains its strong financial position exiting the year with a net debt to adjusted EBITDA ratio1,3 of 2.9x, which is within the company’s stated targeted range of 2.5x to 3.0x. The company continues to command investment grade corporate credit ratings from S & P Global and DBRS. Available liquidity at year-end was $1.2 billion with minimal long-term debt maturities over the next 5 years.
In 2020, Keyera set an annual cost savings target of $45 million to $65 million. The company made significant progress toward this goal, enhancing its competitive position and reducing its cost structure. Most of the benefit is expected to materialize by the end of 2021. Cost reduction measures are detailed as follows:
o $15 million to $20 million in annual general and administrative cost savings – all actioned in 2020 primarily from lowering staffing levels. The company began realizing the benefits in the second half of 2020.
1 Keyera uses certain “Non-GAAP Measures” such as EBITDA, adjusted EBITDA, funds from operations, distributable cash flow, distributable cash flow per share, payout ratio and return on invested capital. See section titled “Non-GAAP Financial Measures”, “Dividends: Funds from Operations and Distributable Cash Flow” and “EBITDA” of the MD&A for further details. 2 Net earnings for 2019 have been restated. Refer to the “Voluntary Change in Accounting Policy” section of the MD&A for further details. For further details on impairment charges, refer to the “Net Impairment Expense” section of the MD&A. 3 Ratio is calculated in accordance with the covenant test calculations related to the company’s credit facility and senior note agreements and excludes hybrid notes.
Keyera Corp. TSX: KEY 2020 Year End Report February 10, 2021
KEYERA CORP.
3
o $10 million to $15 million in annual operating costs reductions in the Liquids Infrastructure segment – a significant portion of the cost reduction initiatives were actioned in 2020 with the annual benefit on track to be realized in 2021.
o $20 million to $30 million in annual savings from the optimization and closure of gas plants, and operating cost reductions in the Gathering and Processing segment – about half of the program is complete, with most of the benefits expected to begin in the second half of 2021.
In 2020, the dividend re-investment plan was discontinued with no plans for re-instatement.
In the fourth quarter, Keyera released its inaugural environment, social and governance (“ESG”) report and announced an agreement to fulfill 10% of the company’s electricity needs from renewable solar power. The ESG report aligns with guidance set out by the Sustainability Accounting Standards Board (“SASB”). The company plans to release a formal emissions reduction target aligned with phase one of the Task Force on Climate-related Financial Disclosures (“TCFD”) recommendations in 2021.
Beyond its own emission reduction efforts, Keyera’s assets are well positioned to enable customers to reduce their own emissions, partake in the energy transition, and integrate into the energy value chains of the future.
BUSINESS SEGMENT HIGHLIGHTS AND PROJECT UPDATES
Keyera’s three segments combined to achieve solid results despite challenging business conditions. Approximately 65% of Keyera’s realized margins4 are derived from customers who are investment grade entities and approximately 40% of realized margins4 were generated from take-or-pay contracts with an average remaining duration of 7 years.
o The Gathering and Processing segment generated a realized margin4 of $77 million for Q4 and $260 million for the full year. This represents a decrease of 5% and 12% respectively over the same periods in 2019, mostly attributable to lower overall volumes, fee reductions at certain gas plants in the South region and an unplanned six-week outage at the Wapiti gas plant. This was partially offset by the ramp-up of the newly commissioned Pipestone gas plant which was completed on budget and five months ahead of schedule. The first phase of the Gathering and Processing optimization plan was successfully completed with the safe and orderly shutdown of the Minnehik Buck Lake, West Pembina and Bigoray gas plants in Central Alberta. The majority of volumes from these plants were successfully transferred to other Keyera facilities to increase overall utilization rates, drive down per unit operating costs, and provide an advantaged netback for customers. The optimization effort will continue with the planned shutdown of the Ricinus and Brazeau North gas plants in 2021, and the Nordegg River gas plant in 2022.
o The Liquids Infrastructure segment delivered a realized margin4 of $98 million in Q4 and a record $399 million for the full year, an increase of 7% and 6% respectively, over the same periods in 2019. The continued strong and steady performance of this segment, which was responsible for 42% of total realized margins4 in 2020, demonstrates its resilience through multiple commodity price cycles. This segment has a high proportion of take-or-pay contracts with high-quality customers and counterparties accessing Keyera’s storage, transportation and fractionation assets.
o The Marketing segment’s realized margin4 was $295 million for the full year and $11 million for Q4. Realized margin4 for 2020 was $5 million below the bottom end of the previously provided guidance of $300 million. This was the result of the timing of a $12 million realized hedging loss on propane and butane, for which the underlying inventory remained unsold at year-end. The margin captured on the sale of the underlying products in Q1 2021 is expected to more than offset the realized hedging loss. Throughout 2020, Keyera’s effective risk management program protected margins and inventory values from significant volatility in commodity prices.
4 Realized margin is not a standard measure under GAAP and excludes the effect of $12 million in non-cash losses from commodity-related risk management contracts. See “Non-GAAP Financial Measures” in the MD&A.

Keyera Corp. TSX: KEY 2020 Year End Report February 10, 2021
KEYERA CORP.
4
Major project updates:
o Keyera evaluates all projects as part of its capital allocation process, to ensure capital discipline and long-term value generation for its shareholders.
o In light of prevailing industry and market uncertainty in 2020, Keyera and its customers elected to defer the KAPS pipeline project for one year. Since that time, Keyera has continued to advance project planning, including refining the project’s original $1.3 billion capital cost estimate. Due to increased competitive pressures from various pipeline construction activities underway in Western Canada, Keyera is currently forecasting the gross capital cost to be approximately $1.6 billion, with the company’s net share representing 50% of this amount.
o The Wildhorse crude oil storage and blending terminal in Cushing Oklahoma is substantially complete and is expected to be operational in mid-2021. Mechanical completion was declared on January 29, 2021 and commissioning activities are underway.
2021 guidance as previously disclosed:
o growth capital is expected to be between $400 million and $450 million excluding capitalized interest, with the majority related to the construction of the KAPS pipeline system;
o maintenance capital expenditures are expected to be between $25 million and $35 million;
o cash tax expense is expected to be between $20 million and $30 million; and
o the Marketing segment’s base realized margin of between $180 million and $220 million is expected to be achieved, however further guidance will be provided in the 2021 First Quarter Report.
A revised investor presentation is now available at www.keyera.com.

Keyera Corp. TSX: KEY 2020 Year End Report February 10, 2021
KEYERA CORP.
5
Notes: 1 Payout ratio is defined as dividends declared to shareholders divided by distributable cash flow. Payout ratio, funds from operations, and distributable
cash flow are not standard measures under Generally Accepted Accounting Principles (“GAAP”). See the section titled, “Dividends: Funds from Operations and Distributable Cash Flow”, for a reconciliation of funds from operations and distributable cash flow to the most closely related GAAP measure.
2 Adjusted EBITDA is defined as earnings before finance costs, taxes, depreciation, amortization, impairment expenses, unrealized gains/losses and any other non-cash items such as gains/losses on the disposal of property, plant and equipment. EBITDA and adjusted EBITDA are not standard measures under GAAP. See section of the MD&A titled “EBITDA” for a reconciliation of adjusted EBITDA to its most closely related GAAP measure.
3 Fractionation throughput in the Liquids Infrastructure segment is the aggregation of volumes processed through the fractionators and the de-ethanizers at the Keyera and Dow Fort Saskatchewan facilities.
4 Long-term debt includes the total value of Keyera’s hybrid notes which receive 50% equity treatment by Keyera’s rating agencies. The hybrid notes are also excluded from Keyera’s covenant test calculations related to the company’s credit facility and senior note agreements.
5 Working capital is defined as current assets less current liabilities.
Summary of Key Measures Three months ended
December 31, Twelve months ended
December 31, (Thousands of Canadian dollars, except where noted) 2020 2019 2020 2019
Net (loss) earnings (74,777) 29,718 62,030 443,609 Per share ($/share) – basic (0.34) 0.14 0.28 2.07 Cash flow from operating activities 116,446 213,676 688,173 887,935 Funds from operations1 155,812 200,871 810,436 754,254 Distributable cash flow1 132,629 158,261 718,176 593,584 Per share ($/share) 1 0.60 0.73 3.26 2.77 Dividends declared 106,091 104,280 423,485 396,862 Per share ($/share) 0.48 0.48 1.92 1.85 Payout ratio %1 80% 66% 59% 67% Adjusted EBITDA2 168,145 261,387 873,582 944,101 Gathering and Processing Gross processing throughput (MMcf/d) 1,307 1,483 1,274 1,496 Net processing throughput (MMcf/d) 1,106 1,186 1,057 1,191 Liquids Infrastructure Gross processing throughput3 (Mbbl/d) 155 157 149 170 Net processing throughput3 (Mbbl/d) 75 70 73 79 AEF iso-octane production volumes (Mbbl/d) 8 9 12 12 Marketing Inventory value 162,823 93,682 162,823 93,682 Sales volumes (Bbl/d) 153,900 177,300 149,900 150,100
Acquisitions 240 50 1,870 599 Growth capital expenditures 76,129 253,722 563,178 986,125 Maintenance capital expenditures 10,889 29,732 29,116 105,077 Total capital expenditures 87,258 283,504 594,164 1,091,801 Weighted average number of shares outstanding – basic and diluted 221,023 216,938 220,442 214,186 As at December 31, 2020 2019 Long-term debt4 2,940,701 2,548,468 Credit facility 280,000 90,000 Working capital (surplus) deficit5 (147,824) 160,684 Net debt 3,072,877 2,799,152 Common shares outstanding – end of period 221,023 217,916

Keyera Corp. TSX: KEY 2020 Year End Report February 10, 2021
KEYERA CORP.
6
Message to Shareholders
No one could have predicted the unprecedented developments the world faced resulting from the COVID-19 pandemic in 2020, which in turn posed tremendous challenges for the energy industry. Our highest priority has been and will continue to be the safety and health of our people and communities. I’m proud of how people adapted in order to safely maintain operations at our facilities.
At Keyera, we demonstrated our resilience by relying on our commitment to safety, the strength of our team and the quality of our integrated assets to quickly adapt to the changing environment. The actions we took – deferring capital spending, discontinuing the dividend reinvestment plan, maintaining ample liquidity, implementing cost reduction programs, delivering the Pipestone gas plant ahead of schedule, combined with the proven effectiveness of our risk management programs, ensured we preserved value for our shareholders.
In 2020, Keyera delivered $874 million in adjusted EBITDA. This was the second-best result in the history of the company, and we exited the year with leverage metrics within our targeted range.
In overcoming significant challenges this year, we continue to have confidence in Keyera’s ability to focus on capital discipline, manage risks, position for the energy transition and deliver returns for our shareholders which by extension, will bring value for all stakeholders for decades to come.
Management Succession
We would like to recognize and thank former CEO David Smith for his tremendous contribution and stewardship over his 22 years at Keyera. His focus on building deep bench strength allowed for a seamless transition of the senior executive management team upon his retirement at the end of 2020.
Under our new senior executive team, Keyera’s value proposition continues to be delivery of a sustainable dividend underpinned by low leverage and an asset base and strategy aimed at steady growth in distributable cash flow per share. Furthermore, we have integrated assets that are well positioned to capture the upside of a recovery in global energy demand, and participate in a low-carbon energy transition.
To align the organization with delivering value to all stakeholders, we have set priorities with the goal to achieve:
o #1 in safety
o #1 in customer recognition
o #1 in total shareholder returns
Strong Focus on Capital Discipline and Shareholder Returns
Keyera has a long history of delivering returns for shareholders. Since 2008, the company has grown distributable cash flow at a compounded annual growth rate of 9% allowing for consistent growth of the dividend. We target annual returns on invested capital (“ROIC”) to be in the range of 10% to 15%. In 2020, we delivered a 11.4% ROIC amidst a global pandemic that upended global economies and the energy industry alike. We will continue to practice prudent financial management guided by our financial priorities:
o maintain investment grade credit ratings;
o target a conservative Net Debt to Adjusted EBITDA ratio of between 2.5x to 3.0x;
o pay dividends at a sustainable payout ratio of 50% to 70% of DCF, with the objective to growing DCF on a per share basis over time; and
o maintain our disciplined process around capital investment which includes evaluating investments by returns, strategic merit, ESG considerations and other risk factors.
Keyera Corp. TSX: KEY 2020 Year End Report February 10, 2021
KEYERA CORP.
7
In addition to the above financial priorities, our team is focused on increasing the stability of cash flows. We can achieve this, in part, by growing our Liquids Infrastructure segment, which has a high degree of long-term take-or-pay commitments.
We are making solid progress on our cost reduction and optimization initiatives. In 2020, we shared our plan to achieve $45 million to $65 million in annual sustained cost savings. Most of the benefits are expected to take hold by the end of 2021 further contributing to our profitability.
Accelerating Technology and Innovation
We are prioritizing the use of technology and have formalized this effort by assembling an internal Innovation and Transformation team. We expect these efforts will increase overall returns by improving safety and reliability, increasing efficiencies, reducing costs and lowering our emissions.
Keyera’s Role in the Energy Transition
Conducting business responsibly has been a long-standing commitment and a source of great pride at Keyera. In 2020, we further enhanced our commitment to ESG principles by publishing Keyera’s inaugural ESG report which aligns with guidance set out by SASB.
Through robust stakeholder engagement we have identified six material ESG factors – Safety, People and Culture, Emissions, Community and Indigenous Engagement, Land Management and Water. ESG factors are incorporated into strategic planning, capital allocation and investment decisions and have oversight at the board of directors level. In 2020, the board also approved the inclusion of key ESG performance measures, including safety, reliability and emissions into our annual scorecard, used to determine bonuses for executives and employees. We have also committed to setting carbon emission reduction targets in 2021 and aligning with phase 1 TCFD disclosures.
Keyera’s assets position the company to be a leader in the transition to a low carbon future. We will reduce our own carbon footprint, but also help our customers reduce theirs.
Business Development
There are many reasons to be optimistic about the near-term outlook for the company.
We are seeing business conditions improving with volumes in our Gathering and Processing segment beginning to slowly improve. In this segment, we will be focused on growing margins and improving competitiveness through cost reduction and efficiency gains. This will allow our customers to achieve the highest netbacks, further cementing Keyera as their service provider of choice. The Pipestone gas plant was commissioned in the fourth quarter, ahead of schedule and its initial throughput has exceeded our expectations.
The Liquids Infrastructure segment is where we are focusing our growth efforts. Volumes in this part of our business are now surpassing pre-COVID levels as demand remains high for our industry leading condensate system. This business has high barriers to entry and produces our highest returns with the least volatility of cash flow given its contracted nature and quality of counterparties. The one-year delay in the KAPS pipeline project in 2020 allowed us to preserve balance sheet strength during a period of heightened uncertainty. In the US, Galena Park which was commissioned in December 2020 and the Wildhorse Terminal, which is expected to be operational in mid-2021 is anticipated to further grow our realized margins.

Keyera Corp. TSX: KEY 2020 Year End Report February 10, 2021
KEYERA CORP.
8
Outlook
I am proud of our performance in 2020 across all aspects of our business. We have demonstrated our resilience and positioned ourselves to keep the momentum going in 2021. The commodity markets and the outlook for our customers appear to be improving and we have several catalysts in the near-term contributing to growing distributable cash flow. Furthermore, we intend to keep our focus on all aspects of ESG performance, and we will investigate ways to continue to play an active role in the energy transition.
We are excited by the outlook for Keyera and are confident we have the people and the assets to succeed for decades to come.
Dean Setoguchi President and Chief Executive Officer Keyera Corp.

Keyera Corp. TSX: KEY 2020 Year End Report February 10, 2021
KEYERA CORP.
9
Management’s Discussion and Analysis The following management's discussion and analysis (“MD&A”) was prepared as of February 10, 2021, and is a review of the results of operations and the liquidity and capital resources of Keyera Corp. and its subsidiaries (collectively “Keyera”). The MD&A should be read in conjunction with the accompanying audited consolidated financial statements (“accompanying financial statements”) of Keyera Corp. for the years ended December 31, 2020 and 2019 and the notes thereto. The accompanying financial statements have been prepared in accordance with International Financial Reporting Standards (“IFRS”) also referred to as GAAP, and are stated in Canadian dollars. Effective December 31, 2019, Keyera voluntarily changed its accounting policy with respect to the discounting of its decommissioning liability. As a result, certain comparative information has been restated in this MD&A. Additional information related to Keyera, including its Annual Information Form, is available on SEDAR at www.sedar.com or on Keyera’s website at www.keyera.com. This MD&A contains non-GAAP measures and forward-looking information and readers are cautioned that the MD&A should be read in conjunction with Keyera’s disclosure under “Non-GAAP Financial Measures” and “Forward-Looking Information” included at the end of this MD&A. Keyera’s Business Keyera operates an integrated, primarily Canadian-based energy infrastructure business with extensive interconnected assets and depth of expertise in delivering energy infrastructure solutions. Keyera operates assets in the oil and gas industry between the upstream sector, which includes oil and gas exploration and production, and the downstream sector, which includes the refining and marketing of finished products. Keyera is organized into three highly integrated operating segments:
1. Gathering and Processing – Keyera owns and operates raw gas gathering pipelines and processing plants, which collect and process raw natural gas, remove waste products and separate the economic components, primarily natural gas liquids (“NGLs”), before the sales gas is delivered into long-distance pipeline systems for transportation to end-use markets. Keyera also provides condensate handling services through its condensate gathering pipelines and stabilization facilities.
2. Liquids Infrastructure – Keyera owns and operates a network of facilities for the gathering,
processing, fractionation, storage and transportation of the by-products of natural gas processing, including NGLs in mix form and specification NGLs such as ethane, propane, butane and condensate. In addition, this segment includes Keyera’s iso-octane facilities at Alberta EnviroFuels (“AEF”), its liquids blending facilities and its 50% interest in the crude oil storage facility at the Base Line Terminal.
3. Marketing – Keyera markets a range of products associated with its two infrastructure business
lines, primarily propane, butane, condensate and iso-octane, and also engages in liquids blending. The Gathering and Processing and Liquids Infrastructure segments provide energy infrastructure solutions to customers on a fee-for-service basis. Keyera also has a Corporate business segment described in this MD&A that is not considered a material part of the business.

Keyera Corp. TSX: KEY 2020 Year End Report February 10, 2021
KEYERA CORP.
10
Overview The year ended December 31, 2020 was like no other as the COVID-19 pandemic significantly affected the global economy and the full extent of the impact remains unknown at this time. Keyera took proactive measures to ensure the health and safety of its people, maintained its strong financial position, and delivered strong financial results despite the economic conditions. While net earnings were $382 million lower than the prior year primarily because of a $371 million non-cash impairment charge, results from operations were strong. Distributable cash flow was a record $718 million and Adjusted EBITDA for the year was $874 million, the second-best result in Keyera’s history. These results were achieved despite:
unplanned maintenance outages at both the Wapiti gas plant and AEF facility that reduced Adjusted EBITDA by approximately $45 million; and
approximately $12 million in realized hedging losses on propane and butane still in inventory at year-
end. The higher margin from the sale of these products will be captured in the first quarter of 2021. The timing of the hedging losses also contributed to the Marketing segment’s realized margin being $5 million below the low end of the previously provided guidance of $300 million.
The strong financial results delivered in 2020 are a testament of the resilience of Keyera’s Liquids Infrastructure business, and its disciplined and effective risk management program that protected margins in the Marketing segment. In 2020, Keyera enhanced its long-standing commitment to Environment, Social, and Governance (“ESG”) principles by publishing its inaugural ESG report in alignment with the guidance set out by the Sustainability Accounting Standards Board (“SASB”). Through robust stakeholder engagement, Keyera identified six material ESG factors: Safety, People and Culture, Emissions, Community and Indigenous Engagement, Land Management and Water. These factors are now incorporated into strategic planning, capital allocation and investment decisions. Keyera has also committed to setting carbon emission reduction targets in 2021 and made a commitment to align to phase 1 Task Force on Climate-Related Financial Disclosures (“TCFD”) recommendations. Keyera’s assets position the company to be a leader in the transition to a low carbon economy. Keyera continues to focus on the following priorities:
continue to be a safe, reliable and environmentally conscious operator of its facilities;
maintain the current monthly dividend, while preserving Keyera’s strong financial position, investment grade credit ratings and targeted dividend payout ratio of 50% to 70%. As of December 31, 2020, Keyera’s Net Debt to Adjusted EBITDA was 2.9x for covenant test purposes and its payout ratio was 59%;
maintain disciplined capital allocation that includes evaluating investments by returns, strategic merit, ESG considerations and other risk factors;
prioritize the use of technology and innovation to improve safety, reliability, increase efficiencies, reduce costs and lower emissions; and
reduce Keyera’s overall cost structure and increase the competitiveness and profitability of the Gathering and Processing segment by optimizing the portfolio of assets.
In 2020, Keyera made significant progress in implementing a number of measures to reduce both operating and general and administrative (“G&A”) expenses, while continuing to advance the optimization of gas plants in the Gathering and Processing segment. In the first half of 2020, Keyera decided to suspend operations at the Minnehik Buck Lake, West Pembina, Bigoray, Ricinus, Nordegg River and Brazeau North gas plants at

Keyera Corp. TSX: KEY 2020 Year End Report February 10, 2021
KEYERA CORP.
11
various times between 2020 and 2022. These suspensions are in addition to the facility closures at the Nevis and Gilby gas plants that occurred in 2019. Refer to the section of this MD&A, titled “Segmented Results of Operations: Gathering and Processing”, for more detailed information. The table below is a summary of the estimated costs and benefits associated with the overall reduction in operating and G&A expenses, and the optimization of gas plants in the Gathering and Processing segment. Category of Cost Reductions
Forecasted Non- Recurring (Expense/ Capital cost) or Savings
Forecasted Annual Earnings before tax Increase (Decrease)
Commentary
G&A
Salaries, benefits, LTIP & other
$15 million to $20 million
Annual cost savings beginning in mid-2020. Reduction to salaries, benefits, short-term and long-term incentive and other costs resulting from lower staffing levels.
Severance costs ($20 million to $25 million)
Severance costs associated with corporate and facility staff reductions of which $23 million was recorded in 2020 that also included severance costs related to the suspensions of the Gilby and Nevis gas plants.
Liquids Infrastructure
Operating cost reductions
$10 million to $15 million
On track to achieve the annual savings in 2021.
Gathering and Processing
Optimization of gas plants and operating cost reductions
$20 million to $30 million
Majority of the annual benefit is expected to materialize by the end of 2021 and is based on an increase in operating margin from optimization and operating cost reductions across all facilities. In addition, the optimization and cost reductions will result in incremental savings to customers that will improve their netbacks.
Plant closure operating expense
($5 million) To be incurred between 2020 and 2022 as facilities are suspended.
Growth capital ($20 million to $25 million)
Investment in infrastructure to redirect volumes to certain gas plants, to be incurred between 2020 and 2022.
Elimination of emission compliance cost
$15 million to $20 million
Eliminate compliance costs associated with emission regulations that would be incurred by 2025.
Total ($30 million to $35 million)
$45 million to $65 million
In addition to the above noted costs and savings, Keyera estimates that it will save on average approximately $3 million per year in maintenance and turnaround costs. Offsetting this benefit, are costs associated with decommissioning the facilities noted in the table above. These costs are currently estimated

Keyera Corp. TSX: KEY 2020 Year End Report February 10, 2021
KEYERA CORP.
12
to range between $5 million and $10 million per year to 2025. It typically takes 20 to 30 years to fully decommission and reclaim a gas plant, and costs are generally highest in the first 7 to 9 years with the remainder of costs spread out over the remaining period. Keyera expects the following for 2021:
a cash tax expense of between $20 million to $30 million (2020 – $45 million cash tax recovery);
maintenance capital expenditures to range between $25 million and $35 million (2020 – $29 million);
growth capital expenditures to range between $400 million and $450 million excluding capitalized interest (2020 – $524 million excluding capitalized interest), with the majority of these expenditures related to the construction of the KAPS pipeline system; and
the Marketing segment’s base realized margin of between $180 million and $220 million is expected to be achieved, however further guidance will be provided in the 2021 First Quarter Report once the NGL contracting season is complete.
Readers are referred to the section of the MD&A titled, “Forward-Looking Information” for a further discussion of the assumptions and risks that could affect future performance and plans.

Keyera Corp. TSX: KEY 2020 Year End Report February 10, 2021
KEYERA CORP.
13
CONSOLIDATED FINANCIAL RESULTS The following table highlights some of the key consolidated financial results for the years ended December 31, 2020 and 2019:
(Thousands of Canadian dollars, except per share data) 2020 2019
Net earnings 62,030 443,609
Net earnings per share (basic) 0.28 2.07
Operating margin 940,538 1,004,133
Realized margin1 957,162 1,053,727
Adjusted EBITDA2 873,582 944,101
Cash flow from operating activities 688,173 887,935
Funds from operations3 810,436 754,254
Distributable cash flow3 718,176 593,584
Distributable cash flow per share3 (basic) 3.26 2.77
Dividends declared 423,485 396,862
Dividends declared per share 1.92 1.85
Payout ratio4 59% 67% Notes: 1 Realized margin is defined as operating margin excluding unrealized gains and losses on commodity-related risk management contracts.
Realized margin is not a standard measure under GAAP. See “Non-GAAP Financial Measures” and see the section titled “Segmented Results of Operations: Marketing”, for a reconciliation of operating margin to realized margin as it relates to the Marketing segment. Realized margin for the two facilities segments (Gathering and Processing and Liquids Infrastructure) and the Corporate and Other segment excludes $757 of unrealized gains from commodity-related risk management contracts (2019 – $1,682 unrealized losses).
2 Adjusted EBITDA is defined as earnings before finance costs, taxes, depreciation, amortization, impairment expenses, unrealized gains/losses and any other non-cash items such as gains/losses on the disposal of property, plant and equipment. EBITDA and adjusted EBITDA are not standard measures under GAAP. See the section titled “EBITDA” for a reconciliation of EBITDA and adjusted EBITDA to their most closely related GAAP measure.
3 Funds from operations and distributable cash flow are not standard measures under GAAP. See “Non-GAAP Financial Measures” and see the section titled, “Dividends: Funds from Operations and Distributable Cash Flow”, for a reconciliation of funds from operations and distributable cash flow to the most closely related GAAP measure.
4 Payout ratio is defined as dividends declared to shareholders divided by distributable cash flow and is not a standard measure under GAAP. See “Non-GAAP Financial Measures”.
Keyera Corp. TSX: KEY 2020 Year End Report February 10, 2021
KEYERA CORP.
14
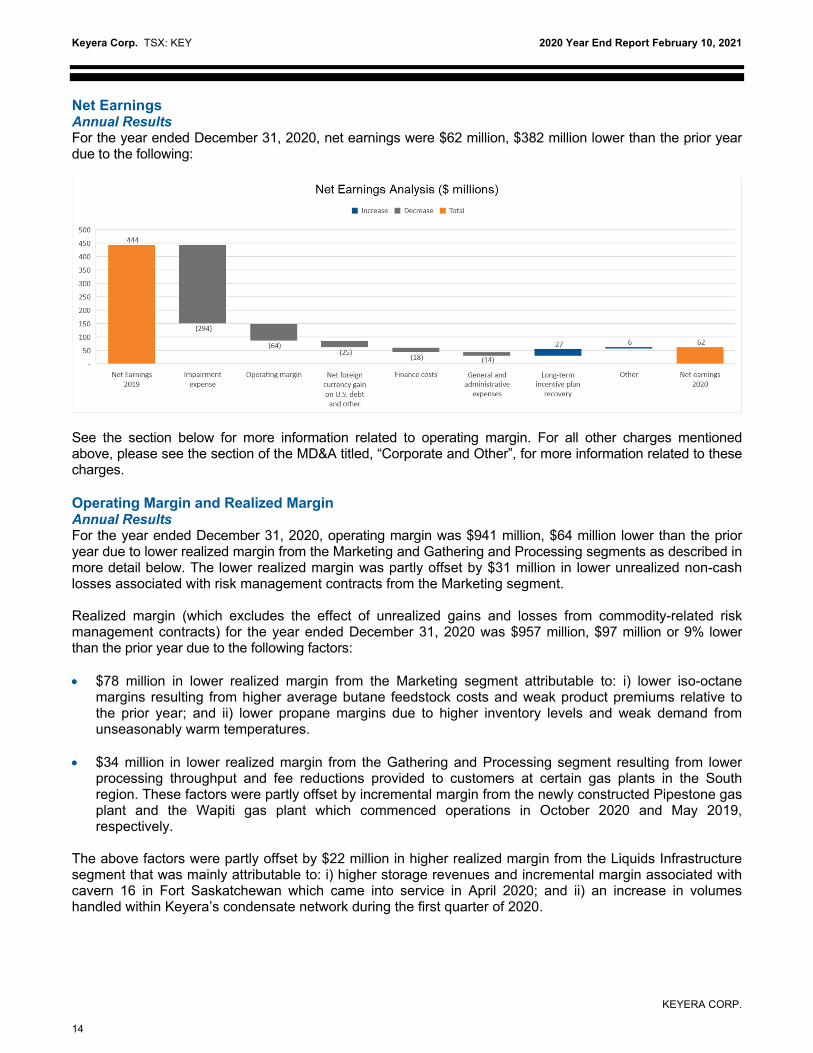
Net Earnings Annual Results For the year ended December 31, 2020, net earnings were $62 million, $382 million lower than the prior year due to the following:
See the section below for more information related to operating margin. For all other charges mentioned above, please see the section of the MD&A titled, “Corporate and Other”, for more information related to these charges. Operating Margin and Realized Margin Annual Results For the year ended December 31, 2020, operating margin was $941 million, $64 million lower than the prior year due to lower realized margin from the Marketing and Gathering and Processing segments as described in more detail below. The lower realized margin was partly offset by $31 million in lower unrealized non-cash losses associated with risk management contracts from the Marketing segment. Realized margin (which excludes the effect of unrealized gains and losses from commodity-related risk management contracts) for the year ended December 31, 2020 was $957 million, $97 million or 9% lower than the prior year due to the following factors: $78 million in lower realized margin from the Marketing segment attributable to: i) lower iso-octane
margins resulting from higher average butane feedstock costs and weak product premiums relative to the prior year; and ii) lower propane margins due to higher inventory levels and weak demand from unseasonably warm temperatures.
$34 million in lower realized margin from the Gathering and Processing segment resulting from lower processing throughput and fee reductions provided to customers at certain gas plants in the South region. These factors were partly offset by incremental margin from the newly constructed Pipestone gas plant and the Wapiti gas plant which commenced operations in October 2020 and May 2019, respectively.
The above factors were partly offset by $22 million in higher realized margin from the Liquids Infrastructure segment that was mainly attributable to: i) higher storage revenues and incremental margin associated with cavern 16 in Fort Saskatchewan which came into service in April 2020; and ii) an increase in volumes handled within Keyera’s condensate network during the first quarter of 2020.

Keyera Corp. TSX: KEY 2020 Year End Report February 10, 2021
KEYERA CORP.
15
See the section titled “Segmented Results of Operations” for more information on operating results by segment. Cash Flow Metrics Annual Results Cash flow from operating activities for the year ended December 31, 2020 was $688 million, $200 million lower than the prior year due to: i) a higher cash requirement to fund inventory as a result of higher average prices and higher volumes of butane and propane in inventory at the end of 2020 compared to the end of 2019; and ii) $97 million in lower realized margin primarily attributable to the Marketing and Gathering and Processing segments. Distributable cash flow in 2020 was $718 million, $125 million higher than the prior year mainly due to a $45 million current income tax recovery in 2020 compared to a $98 million current income tax expense in the prior year, and lower maintenance capital expenditures in 2020. These factors were partly offset by $97 million in lower realized margin as described above.

Keyera Corp. TSX: KEY 2020 Year End Report February 10, 2021
KEYERA CORP.
16
Refer to the sections of this MD&A titled, “Dividends: Funds from Operations and Distributable Cash Flow”, for a reconciliation of cash flow from operating activities to funds from operations and distributable cash flow and “Segmented Results of Operations: Marketing”, for a reconciliation of operating margin to realized margin related to the Marketing segment.
SEGMENTED RESULTS OF OPERATIONS The discussion of the results of operations for each of the operating segments focuses on operating margin. Operating margin refers to operating revenues less operating expenses and does not include the elimination of inter-segment transactions. Management believes operating margin provides an accurate portrayal of operating profitability by segment. Keyera’s Gathering and Processing and Liquids Infrastructure segments charge Keyera’s Marketing segment for the use of facilities at market rates. These segment measures of profitability for the years ended December 31, 2020 and 2019 are reported in note 30, Segment Information, of the accompanying financial statements. A complete description of Keyera’s businesses by segment can be found in Keyera’s Annual Information Form, which is available at www.sedar.com. Gathering and Processing Keyera currently has interests in 14 active gas plants1, all of which are located in Alberta. Keyera operates 11 of the 14 active gas plants and has the option to become the operator of the Pipestone gas plant on January 1, 2026, approximately five years after the commencement of its operations. The Gathering and Processing segment includes raw gas gathering systems and processing plants strategically located in the natural gas production areas on the western side of the Western Canada Sedimentary Basin (“WCSB”). Several of the gas plants are interconnected by raw gas gathering pipelines, allowing raw gas to be directed to the gas plant best suited to process the gas. Most of Keyera’s facilities are also equipped with condensate handling capabilities. Keyera’s facilities and gathering systems collectively constitute a network that is well positioned to serve drilling and production activity in the WCSB. Keyera’s Simonette, Wapiti and Pipestone gas plants, as well as the non-operated Edson gas plant, are generally referred to as its “Northern” or “North” gas plants due to their geographic location and proximity to one another. Gas plants in the North are generally dedicated to processing gas and handling condensate from the Montney formation. All of Keyera’s other Gathering and Processing plants are generally referred to as its “Southern” or “South” gas plants. Operating margin for the Gathering and Processing segment was as follows: Operating Margin and Throughput Information (Thousands of Canadian dollars) 2020 2019 Revenue2 501,942 513,452 Operating expenses2 (241,691) (219,072) Unrealized loss on electricity and other financial contracts — (664) Total operating expenses (241,691) (219,736) Operating margin 260,251 293,716 Gross processing throughput – (MMcf/d) 1,274 1,496 Net processing throughput3 – (MMcf/d) 1,057 1,191
1 Excludes gas plants where Keyera has suspended operations. 2 Includes inter-segment transactions. 3 Net processing throughput refers to Keyera’s share of raw gas processed at its processing facilities.

Keyera Corp. TSX: KEY 2020 Year End Report February 10, 2021
KEYERA CORP.
17
Annual Operating Margin and Revenue
Operating Margin
$33 million vs 2019
The decrease in operating margin in 2020 was primarily due to the following:
$33 million in lower operating margin due to lower
processing throughput volumes across virtually all Southern gas plants resulting from natural declines and low producer activity levels. Operating margin at the Brazeau River gas plant was further reduced due to a customer diverting volumes to their own facility beginning in April 2020;
to enhance Keyera’s competitiveness, fee reductions were
provided to customers at certain gas plants in the South region. Keyera’s optimization plan is intended to reduce overall operating costs and improve profitability for the South region gas plants; and
lower operating margin from the Alder Flats gas plant due to a disclaimed take-or-pay agreement with a former joint venture partner of the facility.
The above factors were partly offset by incremental operating margin from:
the newly constructed Pipestone gas plant which commenced operations in mid-October 2020; and
the Wapiti gas plant which began operations in May 2019. However, two unplanned outages in 2020 reduced operating margin by approximately $15 million.
Revenue
$12 million vs
2019
The decrease in revenue was primarily due to the same factors
that contributed to lower operating margin, partly offset by higher ethane sales revenue. Ethane sales are generally based on index pricing and can significantly influence revenues; however, the effect on operating margin is minimal as ethane purchases from producers are also based on index pricing and are included in operating expenses.
Gathering and Processing Activity The year ended December 31, 2020, was a very challenging year for the Gathering and Processing segment as well as its customers due to the low commodity price environment. Through these challenges, Keyera focused on the factors within its control and took important steps toward improving the competitive position of this operating segment for the long-term. The Gathering and Processing segment’s strategic priorities are as follows: reduce the overall cost structure and optimize the portfolio of gas plants; deliver competitive, full-service solutions and improve customer netbacks; and

Keyera Corp. TSX: KEY 2020 Year End Report February 10, 2021
KEYERA CORP.
18
increase the overall utilization of Keyera’s gas plants thereby reducing carbon emissions and associated compliance costs.
Over the past year, Keyera made significant progress in advancing these priorities as it undertook a reduction in operating expenses throughout its portfolio of assets, as well as developed and implemented an optimization plan for its gas plants in the South region. As part of this plan, Keyera suspended operations at its Minnehik Buck Lake, West Pembina, and Bigoray gas plants in 2020. Substantially all of the volumes from the West Pembina and Bigoray plant suspensions were successfully redirected to other Keyera facilities, thereby increasing overall utilization, reducing per unit operating costs and enhancing Keyera’s competitive positioning. The timing for completing the overall optimization plan is as follows: Gas Plant Timing of Suspension
Minnehik Buck Lake Completed in May 2020
West Pembina Completed in August 2020
Bigoray Completed in September 2020
Ricinus Mid-2021
Brazeau North Mid-2021
Nordegg River 2022
Upon completion of the optimization plan, utilization of Keyera’s gas plants in the South region is expected to increase from less than 50% to approximately 70% by mid-2022. The optimization strategy also aligns with Keyera's environmental efforts by reducing its overall gross greenhouse gas emissions by approximately 12% in 2021 relative to 2019. The operating cost reductions and optimization of gas plants are expected to result in an improvement in operating margin of $20 million to $30 million per year, with the majority of the annual benefit expected to materialize by the end of 2021. As the energy industry experienced a rapid decline in both global energy demand and commodity prices beginning in March, many producers active in the WCSB responded with significant reductions to their 2020 capital programs. The steep decline in condensate prices and low demand resulting from oil sands production cuts, particularly in the second quarter, significantly reduced producer activity levels in the condensate-rich Montney area. In response to the challenges facing Keyera’s customers in the North, Keyera provided short-term fee relief of approximately $5 million that allowed producers to keep the majority of their volumes on-line. It was important to ensure volumes were maintained at these facilities as this creates value throughout Keyera’s integrated business segments. As condensate demand and pricing steadily improved, the majority of fees reverted to their original contracted amounts in July. Gross processing throughput in the Gathering and Processing segment declined in 2020, averaging 1,274 million cubic feet per day, 15% lower than 2019 primarily due to the following factors:
natural declines and weak producer activity across most facilities resulting from the low commodity price environment;
volumes were diverted by a customer at the Brazeau River gas plant to their own facility beginning in
April 2020; and
volumes were diverted by a customer at the Simonette gas plant to a third-party facility in July 2020. This loss in volume had a minimal effect on operating margin due to a long-term, take-or-pay arrangement.
Through the course of the past year, Keyera completed its large-scale capital program for the Gathering and Processing segment, dedicated to establishing a strong position in the liquids-rich Montney and Duvernay

Keyera Corp. TSX: KEY 2020 Year End Report February 10, 2021
KEYERA CORP.
19
development areas. The Pipestone gas plant commenced operations in mid-October, generating incremental operating margin five months ahead of its original schedule. The facility was developed in a joint effort with Ovintiv Inc. (“Ovintiv”) and provides gas processing and liquids handling services to Ovintiv’s Pipestone Montney development under a 20-year infrastructure agreement. Ovintiv has diverted some existing volumes from two other facilities to the Pipestone gas plant for processing, along with new production. At the Wapiti gas plant, Keyera completed an expansion of its existing compressor station to accommodate additional volumes from Pipestone Energy Corp. (“PEC”). The expansion was a result of PEC’s option for an additional 30 million cubic feet per day of gathering, compression and processing capacity that was exercised in early 2020. The expansion was completed on time and processing of these additional volumes commenced in October. In addition, phase two of the Wapiti gas plant was completed in December 2020, however given the revised capital plans of Keyera’s customers, the additional capacity from this infrastructure is not needed in the near term. With the completion of this capital program, Keyera is well positioned to provide services to producers active in the Montney where the geology supports superior economics due to the condensate-rich gas. While drilling activity was weak in 2020, Keyera remains positive about the longer-term outlook for its Gathering and Processing business. The combination of a more competitive cost structure at Keyera’s facilities, improving natural gas, NGL and condensate prices, a greater emphasis on lower emission energy sources and improving pipeline take-away capacity in Alberta provides significant opportunities for this business to continue to grow without additional capital investment. There were no maintenance turnarounds in 2020. For 2021, maintenance turnarounds are scheduled to be completed at the Brazeau River and Zeta Creek gas plants at an estimated combined cost of approximately $10 million. The costs associated with maintenance turnarounds are capitalized for accounting purposes and do not have an effect on operating expenses in the Gathering and Processing segment. Distributable cash flow is reduced by Keyera’s share of the cost of the turnarounds, as these costs are included in its financial results as maintenance capital expenditures.

Keyera Corp. TSX: KEY 2020 Year End Report February 10, 2021
KEYERA CORP.
20
The following table provides more detail related to previously announced and recently completed major projects in the Gathering and Processing segment:
Gathering and Processing – Capital Projects Status Update Facility/Area Project Description Project Status Update Wapiti Wapiti Gas Plant (Phase One): Phase one
includes the construction of a 150 million cubic feet per day sour gas processing plant with acid gas injection capabilities and 25,000 barrels per day of condensate processing facilities, as well as a gathering pipeline system, field compressor stations, and condensate treating facilities. Water Disposal System: This project includes the installation of high pressure injection pumps and pipeline connectivity for multiple disposal wells that are capable of disposing up to 30,000 barrels per day of produced water from the Wapiti gas plant. North Wapiti Pipeline System: The North Wapiti Pipeline System extends the capture area of Keyera’s Wapiti gas plant and includes a 12-inch sour gas gathering pipeline, an 8-inch condensate and water pipeline, and a compressor station. Gold Creek Compressor and Gathering System Expansion: This project provides additional compression and includes an expansion of the Wapiti gathering system. Wapiti Gas Plant (Phase Two): Phase two adds another 150 million cubic feet per day of sour gas processing capacity to the Wapiti gas plant.
Wapiti Gas Plant (Phase One): Phase one of the Wapiti gas plant was completed and began operating in May 2019. Water Disposal System: The water disposal system became operational with the start-up of phase one of the Wapiti gas plant in May 2019. The system is currently equipped with two disposal wells, with the second disposal well coming into service in August 2019. North Wapiti Pipeline System: The pipeline system commenced operations in September 2019. The expansion of the compressor station was completed in October 2020. Gold Creek Compressor and Gathering System Expansion: The compressor station was complete in the first quarter of 2020. The additional compression and expansion of the Wapiti gathering system was completed at the start of the second quarter of 2020. Wapiti Gas Plant (Phase Two): Phase Two of the Wapiti gas plant was completed in December 2020. Estimated total cost to complete the Wapiti complex and related infrastructure: approximately $1 billion Total net costs to December 31, 2020: $78 million for the year ended
December 31, 2020
$1 billion since inception

Keyera Corp. TSX: KEY 2020 Year End Report February 10, 2021
KEYERA CORP.
21
Facility/Area Project Description Project Status Update Pipestone Pipestone Gas Plant: The Pipestone gas
plant includes a total of 200 million cubic feet per day of sour gas processing capacity with acid gas injection capabilities, 24,000 barrels per day of condensate processing capacity, and associated water disposal facilities.
The gas plant commenced operations in October 2020. Cost to complete: approximately $612 million Total net costs to December 31, 2020: $268 million for the year ended
December 31, 2020
$607 million since inception
A portion of the costs incurred for the projects discussed above are based on estimates. Final costs may differ when actual invoices are received or contracts are settled. Costs for the projects described above exclude carrying charges (i.e., capitalized interest).

Keyera Corp. TSX: KEY 2020 Year End Report February 10, 2021
KEYERA CORP.
22
Liquids Infrastructure The Liquids Infrastructure segment provides fractionation, storage, transportation, liquids blending and terminalling services for NGLs and crude oil, and produces iso-octane. These services are provided to customers through an extensive network of facilities, including the following assets:
NGL and crude oil pipelines;
underground NGL storage caverns;
above ground storage tanks;
NGL fractionation and de-ethanization facilities;
pipeline, rail and truck terminals;
liquids blending facilities; and
the AEF facility.
The AEF facility has a licensed production capacity of 13,600 barrels per day of iso-octane. Iso-octane is a low vapour pressure, high-octane gasoline blending component that contains virtually no sulphur, aromatics or benzene, making this product a clean burning gasoline additive. AEF uses butane as the primary feedstock to produce iso-octane. As a result, AEF’s business creates positive synergies with Keyera’s Marketing business, which purchases, handles, stores and sells large volumes of butane. Most of Keyera’s Liquids Infrastructure assets are located in, or connected to, the Edmonton/Fort Saskatchewan area of Alberta, one of four key NGL hubs in North America. A significant portion of the NGL production from Alberta raw gas processing plants is delivered into the Edmonton/Fort Saskatchewan area via multiple NGL gathering systems for fractionation into specification products and delivery to market. Keyera’s underground storage caverns at Fort Saskatchewan are used to store NGL mix and specification products. For example, propane can be stored in the summer months to meet winter demand; condensate can be stored to meet the diluent supply needs of the oil sands sector; and butane can be stored to meet blending and iso-octane feedstock requirements. Keyera’s Liquids Infrastructure assets are closely integrated with its Marketing segment, providing the ability to source, transport, process, store and deliver products across North America. A portion of the revenues earned by this segment relate to services provided to Keyera’s Marketing segment. All of the revenues in this segment that are associated with the AEF facility and the Oklahoma Liquids Terminal relate to services provided to the Marketing segment. Operating margin for the Liquids Infrastructure segment was as follows: Operating Margin (Thousands of Canadian dollars) 2020 2019 Revenue1 567,788 544,318 Operating expenses1 (168,641) (167,062) Unrealized gain (loss) on electricity financial contracts 477 (856) Total operating expenses (168,164) (167,918) Operating margin 399,624 376,400
Note: 1 Includes inter-segment transactions.
Keyera Corp. TSX: KEY 2020 Year End Report February 10, 2021
KEYERA CORP.
23
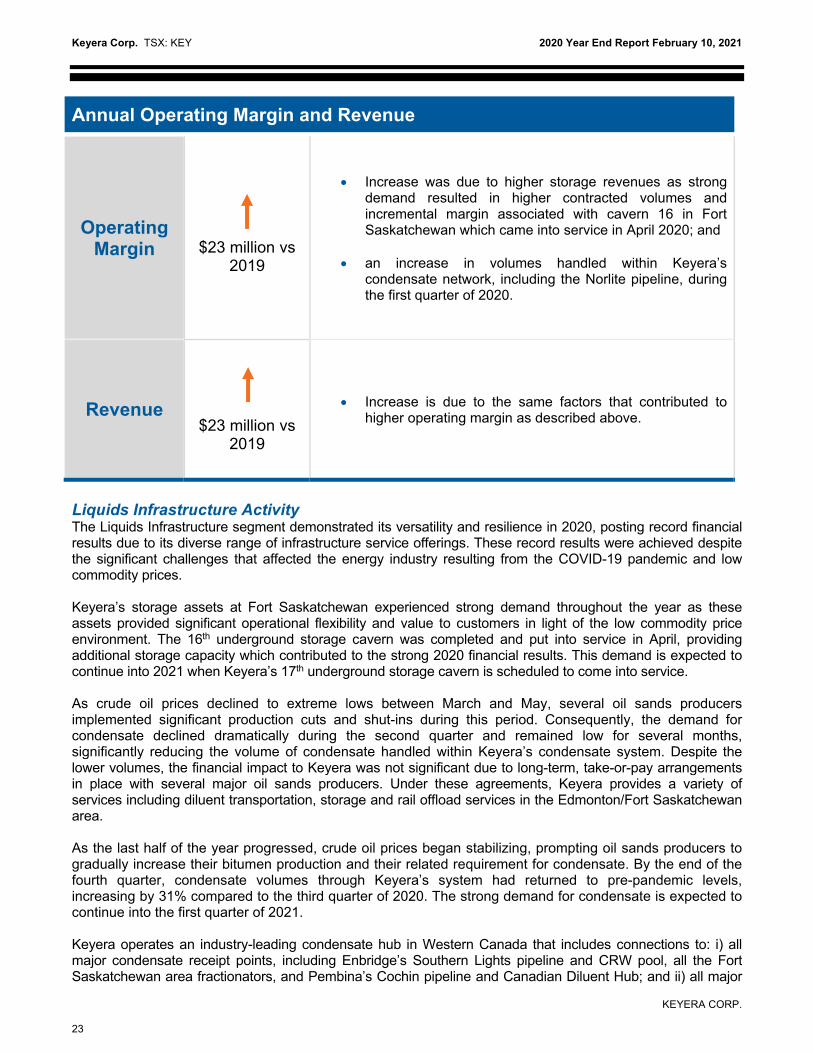
Annual Operating Margin and Revenue
Operating Margin
$23 million vs
2019
Increase was due to higher storage revenues as strong demand resulted in higher contracted volumes and incremental margin associated with cavern 16 in Fort Saskatchewan which came into service in April 2020; and
an increase in volumes handled within Keyera’s
condensate network, including the Norlite pipeline, during the first quarter of 2020.
Revenue
$23 million vs
2019
Increase is due to the same factors that contributed to higher operating margin as described above.
Liquids Infrastructure Activity The Liquids Infrastructure segment demonstrated its versatility and resilience in 2020, posting record financial results due to its diverse range of infrastructure service offerings. These record results were achieved despite the significant challenges that affected the energy industry resulting from the COVID-19 pandemic and low commodity prices. Keyera’s storage assets at Fort Saskatchewan experienced strong demand throughout the year as these assets provided significant operational flexibility and value to customers in light of the low commodity price environment. The 16th underground storage cavern was completed and put into service in April, providing additional storage capacity which contributed to the strong 2020 financial results. This demand is expected to continue into 2021 when Keyera’s 17th underground storage cavern is scheduled to come into service. As crude oil prices declined to extreme lows between March and May, several oil sands producers implemented significant production cuts and shut-ins during this period. Consequently, the demand for condensate declined dramatically during the second quarter and remained low for several months, significantly reducing the volume of condensate handled within Keyera’s condensate system. Despite the lower volumes, the financial impact to Keyera was not significant due to long-term, take-or-pay arrangements in place with several major oil sands producers. Under these agreements, Keyera provides a variety of services including diluent transportation, storage and rail offload services in the Edmonton/Fort Saskatchewan area. As the last half of the year progressed, crude oil prices began stabilizing, prompting oil sands producers to gradually increase their bitumen production and their related requirement for condensate. By the end of the fourth quarter, condensate volumes through Keyera’s system had returned to pre-pandemic levels, increasing by 31% compared to the third quarter of 2020. The strong demand for condensate is expected to continue into the first quarter of 2021. Keyera operates an industry-leading condensate hub in Western Canada that includes connections to: i) all major condensate receipt points, including Enbridge’s Southern Lights pipeline and CRW pool, all the Fort Saskatchewan area fractionators, and Pembina’s Cochin pipeline and Canadian Diluent Hub; and ii) all major

Keyera Corp. TSX: KEY 2020 Year End Report February 10, 2021
KEYERA CORP.
24
condensate delivery points, including Inter Pipeline’s Polaris and Cold Lake pipelines, the Norlite pipeline, Enbridge’s CRW pool, and Wolf Midstream’s Access pipeline system. Utilization of the two fractionation units at Keyera’s Fort Saskatchewan complex averaged 98% of nameplate capacity in 2020 (2019 – 101%). The high annual utilization rate in 2020 was maintained primarily due to Keyera’s strong customer base that includes several of the largest NGL producers active in the WCSB. The AEF facility is operated by the Liquids Infrastructure segment and provides iso-octane processing services to the Marketing segment on a fee-for-service basis. In response to a performance issue experienced in late September 2020 that resulted in the facility running at reduced capacity, Keyera took the facility offline for approximately five weeks beginning in mid-October to conduct maintenance work. The total cost of the maintenance work was $14 million, of which $10 million was expensed in the fourth quarter of 2020 and flowed through in full to the Marketing segment, while the remaining $4 million was treated as maintenance capital. This maintenance activity was required to facilitate AEF's continued reliable operations at full capacity until its next scheduled turnaround in the fall of 2022. The outage reduced the facility’s overall utilization rate for 2020, which averaged approximately 87% of nameplate capacity (2019 – 90%). In December, Keyera completed its capital investment in a butane-on-demand distribution system at Kinder Morgan’s Galena Park Products Terminal in Texas. The infrastructure is designed to provide butane for gasoline blending and includes butane storage connected to pipeline and truck supply with outbound blending connections to Galena Park’s tanks and ship docks. The facilities were constructed by Kinder Morgan and reimbursed by Keyera at a cost of US$51 million ($66 million) upon the commencement of initial operations. Full blending connectivity is expected to be complete in February 2021. In response to the significant challenges faced by the energy industry in 2020, Keyera along with its partner, Energy Transfer Canada ULC (formerly SemCAMS Midstream ULC), made a decision in April to defer construction of the KAPS pipeline system for approximately one year resulting in an expected in-service date of 2023 instead of 2022. Since that time, Keyera has continued to advance project planning, including refining the project’s original $1.3 billion capital cost estimate. Due to increased competitive pressures from various pipeline construction activities underway in Western Canada, the current gross capital cost is forecast to be approximately $1.6 billion, with Keyera’s net share representing 50% of this amount. The return from this investment is underpinned by contracts for more than 70% of the initial pipeline capacity, with 75% take-or-pay commitments for an average term of 14 years. The project is anticipated to earn an annual return on capital of 10% to 15% starting in 2025 based on existing contracts plus the ability to attract incremental volumes. This assumes the project is completed on a timely basis and energy demand and commodity prices continue to stabilize. In addition to economic returns, the project offers many additional strategic benefits to Keyera and its customers as it provides an alternative transportation solution for condensate and natural gas liquids from liquids-rich developments in northwestern Alberta. Refer to the table below, “Liquids Infrastructure – Capital Projects Status Update”, for more information related to this project.

Keyera Corp. TSX: KEY 2020 Year End Report February 10, 2021
KEYERA CORP.
25
Keyera continues to focus on enhancing its infrastructure to meet the needs of its customers. The table below is a status update of major projects in the Liquids Infrastructure segment:
Liquids Infrastructure – Capital Projects Status Update Facility/Area Project Description Project Status Update Fort Saskatchewan
Underground Storage Development: Development of five additional underground storage caverns (caverns 15-19), including ancillary infrastructure such as pumps, wells, piping and brine pond capacity.
Construction-In-Progress Assets: Washing of the 17th and 18th caverns continued through the fourth quarter of 2020. These caverns are expected to be in service during the second half of 2021 and second half of 2022, respectively. Work associated with the planning of the 19th cavern has been deferred for the near term. Completed Assets: The 16th cavern was completed and came into service in April 2020. The 15th cavern and its related infrastructure was put into service in early May 2018.
Since inception, $101 million or approximately 81% of the total cavern program costs have been expended.
Cushing, Oklahoma (90/10 joint venture with affiliate of Lama Energy Group)
Wildhorse Terminal (“Wildhorse”): Development of a crude oil storage and blending terminal in Cushing, Oklahoma which will include 12 above ground tanks with 4.5 million barrels of working storage capacity. Wildhorse will initially be pipeline connected to two existing storage terminals in Cushing.
The terminal was mechanically complete at the end of January 2021 and commissioning activities have commenced. The terminal is expected to be operational in mid-2021. Estimated total cost to complete: gross cost is approximately US$226
million
Keyera’s net share of costs is approximately US$203 million
Total net costs to December 31, 2020: $70 million (US$52 million) for the
year ended December 31, 2020
$251 million (US$187 million) since inception
Keyera Corp. TSX: KEY 2020 Year End Report February 10, 2021
KEYERA CORP.
26
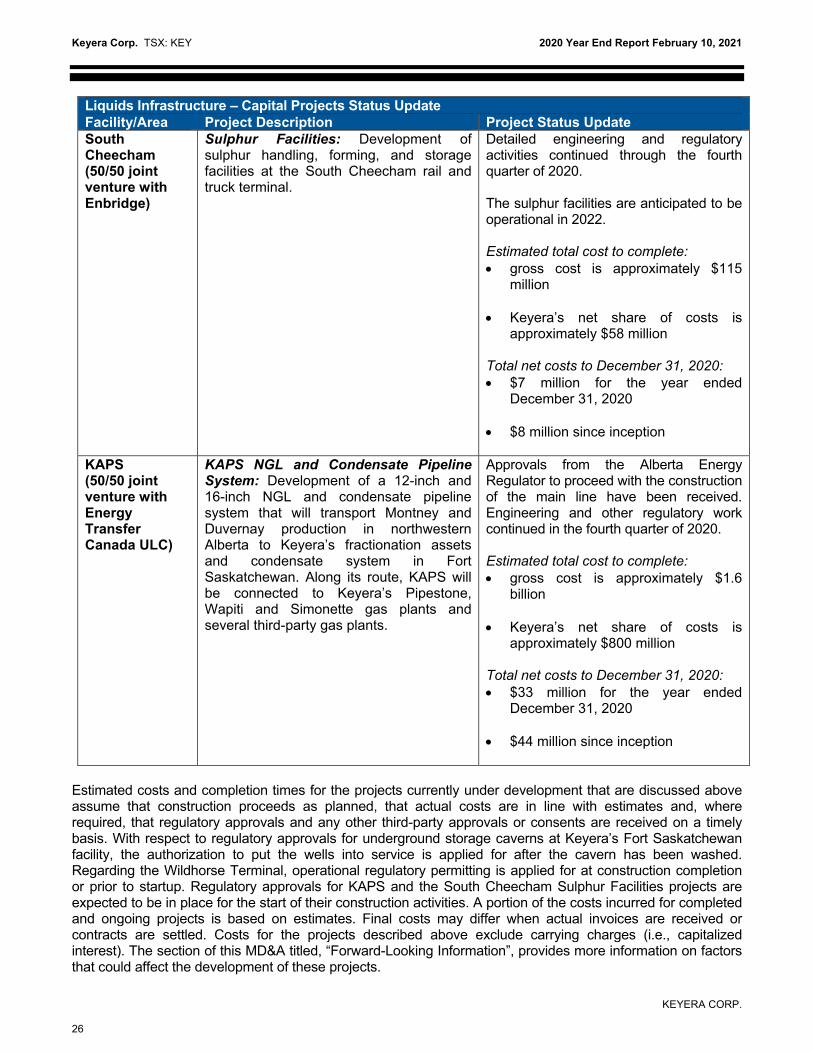
Liquids Infrastructure – Capital Projects Status Update Facility/Area Project Description Project Status Update South Cheecham (50/50 joint venture with Enbridge)
Sulphur Facilities: Development of sulphur handling, forming, and storage facilities at the South Cheecham rail and truck terminal.
Detailed engineering and regulatory activities continued through the fourth quarter of 2020. The sulphur facilities are anticipated to be operational in 2022. Estimated total cost to complete: gross cost is approximately $115
million Keyera’s net share of costs is
approximately $58 million Total net costs to December 31, 2020: $7 million for the year ended
December 31, 2020
$8 million since inception
KAPS (50/50 joint venture with Energy Transfer Canada ULC)
KAPS NGL and Condensate Pipeline System: Development of a 12-inch and 16-inch NGL and condensate pipeline system that will transport Montney and Duvernay production in northwestern Alberta to Keyera’s fractionation assets and condensate system in Fort Saskatchewan. Along its route, KAPS will be connected to Keyera’s Pipestone, Wapiti and Simonette gas plants and several third-party gas plants.
Approvals from the Alberta Energy Regulator to proceed with the construction of the main line have been received. Engineering and other regulatory work continued in the fourth quarter of 2020. Estimated total cost to complete: gross cost is approximately $1.6
billion Keyera’s net share of costs is
approximately $800 million Total net costs to December 31, 2020: $33 million for the year ended
December 31, 2020
$44 million since inception
Estimated costs and completion times for the projects currently under development that are discussed above assume that construction proceeds as planned, that actual costs are in line with estimates and, where required, that regulatory approvals and any other third-party approvals or consents are received on a timely basis. With respect to regulatory approvals for underground storage caverns at Keyera’s Fort Saskatchewan facility, the authorization to put the wells into service is applied for after the cavern has been washed. Regarding the Wildhorse Terminal, operational regulatory permitting is applied for at construction completion or prior to startup. Regulatory approvals for KAPS and the South Cheecham Sulphur Facilities projects are expected to be in place for the start of their construction activities. A portion of the costs incurred for completed and ongoing projects is based on estimates. Final costs may differ when actual invoices are received or contracts are settled. Costs for the projects described above exclude carrying charges (i.e., capitalized interest). The section of this MD&A titled, “Forward-Looking Information”, provides more information on factors that could affect the development of these projects.

Keyera Corp. TSX: KEY 2020 Year End Report February 10, 2021
KEYERA CORP.
27
Marketing The Marketing segment is focused on the purchase and sale of products associated with Keyera’s facilities, including NGLs, crude oil and iso-octane. Keyera markets products acquired through processing arrangements, term supply agreements and other purchase transactions. Most NGL volumes are purchased under one-year supply contracts typically with terms beginning in April of each year. In addition, Keyera has long-term supply arrangements with several producers for a portion of its NGL supply. Keyera may also source additional condensate or butane, including from the U.S., when market conditions and associated sales contracts are favourable. Keyera negotiates sales contracts with customers in Canada and the U.S. based on the volumes it has contracted to purchase. In the case of condensate sales, the majority of the product is sold to customers in Alberta shortly after it is purchased. Butane is used as the primary feedstock in the production of iso-octane at Keyera’s AEF facility and therefore a significant portion of the contracted butane supply is retained for Keyera’s own use. Propane markets are seasonal and geographically diverse. Keyera sells propane in various North American markets, often where the only option for delivery is via railcar or truck. Keyera is well positioned to serve these markets due to its extensive infrastructure and rail logistics expertise. Further, because demand for propane is typically higher in the winter, Keyera can utilize its NGL storage facilities to build an inventory of propane during the summer months when prices are typically lower to fulfill winter term-sales commitments. Keyera manages its NGL supply and sales portfolio by monitoring its inventory position and purchase and sale commitments. Nevertheless, the Marketing business is exposed to commodity price fluctuations arising between the time contracted volumes are purchased and the time they are sold, as well as pricing differentials between different geographic markets. These risks are managed by purchasing and selling product at prices based on the same or similar indices or benchmarks, and through physical and financial contracts that include energy-related forward contracts, price swaps, forward currency contracts and other hedging instruments. A more detailed description of the risks associated with the Marketing segment is available in Keyera’s Annual Information Form, which is available at www.sedar.com. Keyera’s primary markets for iso-octane are in the Gulf Coast, Midwestern United States, and Western Canada. Demand for iso-octane is seasonal, with higher demand in the spring and summer, typically resulting in higher sales prices during these months. There can be significant variability in iso-octane margins. As with Keyera’s other marketing activities, various strategies are utilized to mitigate the risks associated with the commodity price exposure, including the use of financial contracts. The section of this MD&A titled “Risk Management” provides more information on the risks associated with the sale of iso-octane and Keyera’s related hedging strategy. Keyera also engages in liquids blending, where it operates facilities at various locations, allowing it to transport, process and blend various product streams. Margins are earned by blending products of lower value into higher value products. As a result, these transactions are exposed to variability in price and quality differentials between various product streams. Keyera manages this risk by balancing its purchases and sales and employing risk management strategies. Overall, the integration of Keyera’s business lines means that its Marketing segment can draw on the resources available to it through its two fee-for-service, facilities-based operating segments (Liquids Infrastructure and Gathering and Processing), including access to NGL supply and key fractionation, storage and transportation infrastructure and logistics expertise. Keyera expects its Marketing business to contribute, on average, a “base realized margin” of between $180 million and $220 million annually. This base contribution assumes: i) AEF operates near capacity; ii) butane feedstock costs are comparable to the 2018 contract year; iii) there are no significant logistics or transportation curtailments; and iv) producers deliver their volumes according to plan. There are numerous variables that can affect the results from Keyera’s Marketing segment. For a detailed discussion of risk factors that affect Keyera, see Keyera’s Annual Information Form which is available at www.sedar.com.

Keyera Corp. TSX: KEY 2020 Year End Report February 10, 2021
KEYERA CORP.
28
Operating and realized margin for the Marketing segment was as follows: Operating and Realized Margin (Thousands of Canadian dollars, except for sales volume information) 2020 2019 Revenue1 2,276,679 2,879,757 Operating expenses1 (1,999,443) (2,554,769) Operating margin 277,236 324,988 Unrealized loss on risk management contracts 17,381 47,912 Realized margin 294,617 372,900 Sales volumes (Bbl/d) 149,900 150,100
Note: 1 Includes inter-segment transactions.
Realized margin is not a standard measure under GAAP. Management believes that this supplemental measure facilitates the understanding of the Marketing segment’s financial results in the period without the effect of mark-to-market changes from risk management contracts related to future periods. Composition of Marketing Revenue (Thousands of Canadian dollars) 2020 2019 Physical sales 2,230,645 2,918,108 Realized cash gain on financial contracts1 63,415 9,561 Unrealized gain (loss) due to reversal of financial contracts
existing at end of prior period 5,371 (41,516) Unrealized loss due to fair value of financial contracts existing
at end of current period (22,024) (5,371) Unrealized loss from change in fair value of fixed price
physical contracts2 (728) (1,025) Total unrealized loss on risk management contracts
(17,381)
(47,912)
Total gain (loss) on risk management contracts
46,034
(38,351)
Total Marketing revenue 2,276,679 2,879,757
Notes: 1 Realized cash gains and losses represent actual cash settlements or receipts under the respective contracts. 2 Unrealized gains and losses represent the change in fair value of fixed price physical contracts that meet the GAAP definition of a derivative
instrument.

Keyera Corp. TSX: KEY 2020 Year End Report February 10, 2021
KEYERA CORP.
29
Annual Operating & Realized Margin and Revenue
Operating Margin
$48 million vs 2019
Decrease was due to $78 million in lower realized margin as described in more detail below. The lower realized margin was partly offset by a $31 million decrease in unrealized non-cash losses from risk management contracts in 2020 relative to 2019.
Realized Margin
$78 million vs 2019
Decrease was due to $50 million in lower iso-octane
margins because of higher average butane feedstock costs and weak product premiums during the last three quarters of 2020 relative to the prior year; and
$45 million in lower propane margins. Propane margins
were negatively affected by high inventory levels across much of North America as a result of unseasonably warm weather and lower propane demand related to agricultural crop drying in the fourth quarter.
Revenue
$603 million vs
2019
In general, gross revenue in the Marketing segment is influenced by NGL and iso-octane sales volumes as well as commodity prices.
Decrease was due to lower average sales volumes and
significantly lower average sales prices for all products resulting from the significant decline in commodity prices in March 2020.

Keyera Corp. TSX: KEY 2020 Year End Report February 10, 2021
KEYERA CORP.
30
Market Commentary The Marketing segment posted strong financial results for the year ended December 31, 2020 due to:
an effective risk management program that protected margins from the significant decline in
commodity prices resulting from the COVID-19 pandemic;
robust iso-octane margins during the first quarter of the year due to strong product premiums and low butane feedstock costs that continued from the second half of 2019; and
effective utilization of Keyera’s infrastructure including storage, fractionation and transportation capabilities.
As a result of these factors, the Marketing segment significantly outperformed its base annual realized margin range of $180 million and $220 million. Approximately $12 million of realized hedging losses in the fourth quarter that were primarily related to propane and butane inventory prevented the segment from reaching the bottom end of its 2020 realized margin guidance range of $300 million to $340 million. These hedging losses will be more than offset by gains realized from the physical sale of the inventory in the first quarter of 2021. In 2020, energy markets experienced significant volatility throughout the year as the COVID-19 pandemic caused significant changes to energy supply and demand patterns. Under normal economic conditions, the demand and price premium for iso-octane increase in the spring and summer months as driving activity and gasoline demand increase. In March and April, U.S. gasoline demand decreased by approximately 50% compared to typical demand levels. As several U.S. states began to reopen their economies in May, U.S. gasoline demand increased to approximately 90% of pre-COVID forecasts by early July. Over the summer months, the surplus in U.S. gasoline inventory was essentially erased as refineries reduced utilization rates. In addition, permanent closures occurred at several U.S. refineries during this time period. The combination of higher gasoline demand and refiners limiting their utilization rates resulted in a significant improvement in motor gasoline prices during the third quarter, compared to the lows experienced in March and April. In the fourth quarter, as COVID-19 cases began increasing and incremental lockdowns were enacted across North America, mobility declined and U.S. gasoline demand suffered. As a result, the premium for iso-octane remained weak in the fourth quarter. This decline in demand is anticipated to continue into the first half of 2021 until vaccinations reduce the need for lockdown measures and mobility trends return to more normal levels. Despite the drastic drop in demand that began in March, Keyera’s iso-octane margins were strong in the first nine months of 2020 partly due to its effective risk management program. In the fourth quarter, iso-octane margins were weak due to lower sales volumes, as the AEF facility was taken offline for approximately five weeks to complete maintenance work. This maintenance work was required to facilitate AEF’s continued reliable operations at full capacity until its next scheduled turnaround in the fall of 2022. The costs associated with this outage were $14 million of which $10 million was flowed through to the Marketing segment, reducing the segment’s operating margin in the fourth quarter of 2020. The estimated total reduction to operating margin from the outage including the effect of lost iso-octane sales, was approximately $30 million. Refer to the section of this MD&A titled, “Segmented Results of Operations: Liquids Infrastructure”, for more information associated with this outage. Because butane is the primary feedstock to produce iso-octane, butane costs directly affect iso-octane margins. The majority of Keyera’s butane supply is purchased on a one-year term basis. For the annual term supply contracts that began on April 1, 2020, the price for butane as a percentage of crude oil is higher than the 2019 contract year, but lower compared to the average of the previous five years. As the AEF facility was taken offline to conduct maintenance work during the fourth quarter, Keyera’s butane inventory levels were higher than normal. During this time, the Marketing segment utilized Keyera’s rail facilities to access higher value markets in the U.S. for butane.

Keyera Corp. TSX: KEY 2020 Year End Report February 10, 2021
KEYERA CORP.
31
As crude oil prices fell dramatically in March, several oil sands producers cut bitumen production commencing in April. Much of this production gradually came back online during the second half of the year. Despite weak demand for condensate between the second and third quarters, margins in the Marketing segment were robust during these periods, as Keyera was able to source and rail-in low cost condensate barrels from the U.S. that were sold at an attractive margin. Condensate margins continued to be solid in the fourth quarter as oil sands production and the related demand for condensate recovered from the lows experienced earlier in the year. Margins from Keyera’s liquids blending business, which were weak during the second and third quarters of 2020 due to lower volumes and a reduction in blend margins, strengthened in the fourth quarter as volumes increased. Propane margins were weak in the fourth quarter of 2020 as inventory levels remained high across North America due to low demand from unseasonably warm temperatures and a lack of agricultural crop drying demand. A recovery in propane pricing and demand in North America has begun in early 2021 due to the return of colder winter weather patterns and an increase in propane exports. The outlook for propane pricing is anticipated to strengthen significantly, as incremental export capacity in North America comes online in early 2021 and Inter Pipeline’s Heartland propane dehydrogenation facility becomes operational in 2022. Access to Keyera’s cavern storage, Josephburg Terminal and Edmonton Terminal provides the Marketing segment with a competitive advantage as it can store and rail product to the highest value markets in North America throughout the year. Risk Management When possible, Keyera uses hedging strategies to mitigate risk in its Marketing business, including foreign currency exchange risk associated with the purchase and sale of NGLs and iso-octane. Keyera’s hedging objective for iso-octane is to secure attractive margins and mitigate the effect of iso-octane price fluctuations on its future operating margins. Iso-octane is generally priced at a premium to the price of Reformulated Blendstock for Oxygen Blending (“RBOB”). RBOB is the highest volume refined product sold in the U.S. and has the most liquid forward financial contracts. Accordingly, Keyera expects to continue to utilize RBOB-based financial contracts to hedge a portion of its iso-octane sales. To protect the value of its NGL inventory from fluctuations in commodity prices, Keyera typically uses physical and financial forward contracts. For propane inventory, contracts are generally put in place as inventory builds and may either: i) settle when products are expected to be withdrawn from inventory and sold; or ii) settle and reset on a month-to-month basis. Within these strategies, there may be differences in timing between when the contracts are settled and when the product is sold. In general, the increase or decrease in the fair value of the contracts is intended to mitigate fluctuations in the value of the inventories and protect operating margin. Keyera typically uses propane physical and financial forward contracts to hedge its propane inventory. Keyera may hold butane inventory to meet the feedstock requirements of the AEF facility. For condensate, most of the product purchased is sold within one month. The supply and sales prices for both butane and condensate are typically priced as a percentage of West Texas Intermediate (“WTI”) crude oil and in certain cases the supply cost may be based on a hub posted or index price. To align the pricing terms of physical supply with the terms of contracted sales and to protect the value of butane and condensate inventory, the following hedging strategies may be utilized:
Keyera may enter into financial contracts to lock in the supply price at a specified percentage of WTI, as the sales contracts for butane and condensate are also generally priced in relation to WTI. When butane or condensate is physically purchased, the financial contract is settled and a realized gain or loss is recorded in income.
Once the product is in inventory, WTI financial forward contracts are generally used to protect the value of the inventory.
Within these hedging strategies, there may be differences in timing between when the financial contracts are settled and when the products are purchased and sold. There may also be basis risk between the prices of crude oil and the NGL products, and therefore the financial contracts may not fully offset future butane and condensate price movements.

Keyera Corp. TSX: KEY 2020 Year End Report February 10, 2021
KEYERA CORP.
32
For the year ended December 31, 2020, the total unrealized loss on risk management contracts was $17 million. Further details are provided in the “Composition of Marketing Revenue” table above. The fair value of outstanding financial risk management contracts as at December 31, 2020 resulted in an unrealized (non-cash) loss of $22 million. The fair value of financial and fixed price physical contracts will vary as these contracts are marked-to-market at the end of each period. A summary of the financial contracts existing at December 31, 2020, and the sensitivity to earnings resulting from changes in commodity prices, can be found in note 22, Financial Instruments and Risk Management, of the accompanying financial statements. CORPORATE AND OTHER
Non-Operating Expenses and Other Income (Thousands of Canadian dollars) 2020 2019 Other income (operating margin) 3,427 9,029 General and administrative (net of overhead recoveries on operated facilities) (97,795) (83,492) Finance costs (131,507) (113,066) Depreciation, depletion and amortization expenses (290,416) (278,292) Net foreign currency gain on U.S. debt and other 9,421 34,352 Long-term incentive plan recovery (expense) 1,122 (26,134) Impairment expense (371,305) (77,095) Other 13,093 — Income tax expense (11,121) (16,797)
Other Income Keyera has acquired oil and gas reserves as part of the acquisition of ownership interests in the Minnehik Buck Lake, West Pembina, Bigoray and Cynthia facilities. Keyera reports operating margin (net of royalties and operating expenses) from the production associated with all of its reserves as other income as it has no plans to drill additional wells to offset natural production declines. Other income for the year ended December 31, 2020 was $3 million, $6 million lower than the prior year. Production for the year ended December 31, 2020 averaged 1,849 barrels of oil equivalent per day compared to 3,129 barrels of oil equivalent per day in 2019. The reserves and production are not material to Keyera’s business and do not have a material effect on its financial results. General and Administrative Expenses General and administrative (“G&A”) expenses for 2020 were $98 million, $14 million higher than the prior year. The higher costs in 2020 were primarily due to $23 million in severance costs, compared to $4 million for the prior year. The severance costs were mainly related to workforce reductions at Keyera’s corporate office and certain field locations, as well as closures of the Minnehik Buck Lake, West Pembina, Nevis and Gilby gas plants. These workforce reductions were part of Keyera’s overall cost reduction priority. Finance Costs Finance costs for the year ended December 31, 2020 were $132 million, $18 million higher than the prior year primarily due to incremental interest expense related to the $600 million subordinated hybrid notes that were issued in June 2019 as well as the $400 million medium-term notes issued at the end of May 2020. Partly offsetting this incremental interest was higher interest capitalized on qualifying projects (2020 – $39 million vs. 2019 – $36 million) that are a reduction to finance costs. Depreciation, Depletion and Amortization Expenses Depreciation, depletion and amortization (“DD&A”) expenses were $290 million in 2020, $12 million higher than the prior year due to: i) an increase in Keyera’s overall asset base including phase two of the Wapiti gas plant, the Gold Creek compressor and gathering system expansion at Wapiti, the Pipestone gas plant and underground storage cavern 16 at Fort Saskatchewan; and ii) an increase in Keyera’s decommissioning

Keyera Corp. TSX: KEY 2020 Year End Report February 10, 2021
KEYERA CORP.
33
asset base in 2020 that resulted in additional depreciation charges. These increases were offset by a decrease in depreciation expense related to right-of-use assets. Net Foreign Currency Gain (Loss) on U.S. Debt and Other The net foreign currency gain (loss) associated with the U.S. debt and other was as follows: Net Foreign Currency Gain (Loss) on U.S. Debt and Other (Thousands of Canadian dollars) 2020 2019 Translation of long-term debt and interest payable 4,676 29,861 Change in fair value of cross-currency swaps – principal and
interest portion
(30,379)
(8,800) Gain on cross-currency swaps – principal and interest portion1 31,771 3,116 Foreign exchange re-measurement of lease liabilities and other 3,353 10,175 Net foreign currency gain on U.S. debt and other 9,421 34,352
Note: 1 Foreign currency gains resulted from the exchange of currencies related to the settlement of principal and interest payments on the long-term
cross-currency swaps.
To manage the foreign currency exposure on U.S. dollar denominated debt, Keyera has entered into cross- currency agreements with a syndicate of banks to swap the U.S. dollar principal and future interest payments into Canadian dollars. The cross currency agreements are accounted for as derivative instruments and are marked-to-market at the end of each period. The fair value of the cross currency swap agreements will fluctuate between periods due to changes in the forward curve for foreign exchange rates, as well as an adjustment to reflect credit risk. Additional information on the swap agreements can be found in note 22, Financial Instruments and Risk Management, of the accompanying financial statements. Long-Term Incentive Plan (Expense) Recovery The Long-Term Incentive Plan (“LTIP”) recovery was $1 million for the year ended December 31, 2020, compared to an expense of $26 million in the prior year. The LTIP recovery in the current period was primarily attributable to the significant decline in share price at the end 2020 relative to the end of 2019, compared to an increase in share price during the prior year. In addition, there were lower estimated payout multipliers associated with certain outstanding LTIP grants when compared to the prior year, which also contributed to the LTIP recovery in 2020. Net Impairment Expense Keyera reviews its assets for indicators of impairment on a quarterly basis. As well, if an asset has been impaired and subsequently recovers in value, GAAP requires the asset to be written-up (i.e., reversal of previous impairments). Impairment expenses are non-cash charges and do not affect operating margin, funds from operations, distributable cash flow, or adjusted EBITDA. 2020 Impairment Expense During the fourth quarter of 2020, Keyera identified through its impairment review that its Alder Flats gas plant, and two of its non-core assets; the Edson gas plant and Gregg-Lake Obed pipeline system, had carrying values greater than their recoverable amounts due to underutilization of these assets. As a result, an aggregate impairment charge of $123 million was recorded during the quarter. The Alder Flats gas plant is included in Keyera’s Central Foothills Cash-Generating Unit (“CGU”), and the Edson gas plant and Gregg-Lake Obed pipeline system are included in Keyera’s Northern Area CGU. In the third quarter of 2020, Keyera recorded an impairment expense of $54 million as a result of underutilization of the Hull terminal, which is included in Keyera’s United States CGU. In the first quarter of 2020, Keyera recorded an impairment expense of $194 million in relation to the Central Foothills and Drayton Valley North CGUs.

Keyera Corp. TSX: KEY 2020 Year End Report February 10, 2021
KEYERA CORP.
34
Central Foothills CGU – the West Pembina, Ricinus and Nordegg River gas plants were impaired as a result of the planned suspension of these gas plants as part of the gathering and processing optimization strategy.
Drayton Valley North CGU – the Brazeau North and Pembina North gas plants were impaired due to
low utilization at these facilities. 2019 Impairment Expense In the fourth quarter of 2019, an impairment charge of $77 million was recorded to reduce the carrying values of the Bigoray, Gilby, Willesden Green, and Minnehik Buck Lake gas plants, as well as the inactive West Pembina production wells, to their recoverable amounts. These impairments largely resulted from low utilization at these facilities. Other For the year ended December 31, 2020, $13 million of income was recorded from the Canada Emergency Wage Subsidy (“CEWS”) program, which was passed by the Government of Canada in April 2020 as part of its COVID-19 Economic Response Plan. Taxes In general, as earnings before taxes increase, total tax expense (current and deferred taxes) will also be higher. If sufficient tax pools exist, current taxes will be reduced and deferred income taxes will increase as these tax pools are utilized. Other factors that affect the calculation of deferred income taxes include future income tax rate changes and permanent differences (i.e. accounting income or expenses that will never be taxed or deductible for income tax purposes). Current Income Taxes A current income tax recovery of $45 million was recorded for the year ended December 31, 2020, compared to a current income tax expense of $98 million in 2019. The current income tax recovery in 2020 is due to lower taxable income and higher tax pool deductions which results in a tax refund. Approximately $800 million of capital projects, primarily from the Gathering and Processing segment, became available for use in 2020. The significant tax depreciation (Capital Cost Allowance or “CCA”) from these capital projects allow for a tax loss carryback and refund in 2020. The majority of the costs associated with these capital projects attract a 25% CCA rate with some costs being eligible for accelerated first-year CCA deductions. For 2021, it is estimated that current income tax expense will be between $20 million and $30 million. The current income tax estimate for 2021 assumes that Keyera’s business performs as planned. Deferred Income Taxes A deferred income tax expense of $56 million was recorded for the year ended December 31, 2020, compared to a deferred income tax recovery of $81 million in 2019. The deferred income tax expense in 2020 is due to a reduction in tax pools available to shelter taxable income. The recovery of deferred income tax in 2019 was primarily the result of a decrease to the Alberta corporate tax rate enacted on June 28, 2019. Keyera estimates its total tax pools at December 31, 2020 were approximately $3.5 billion.
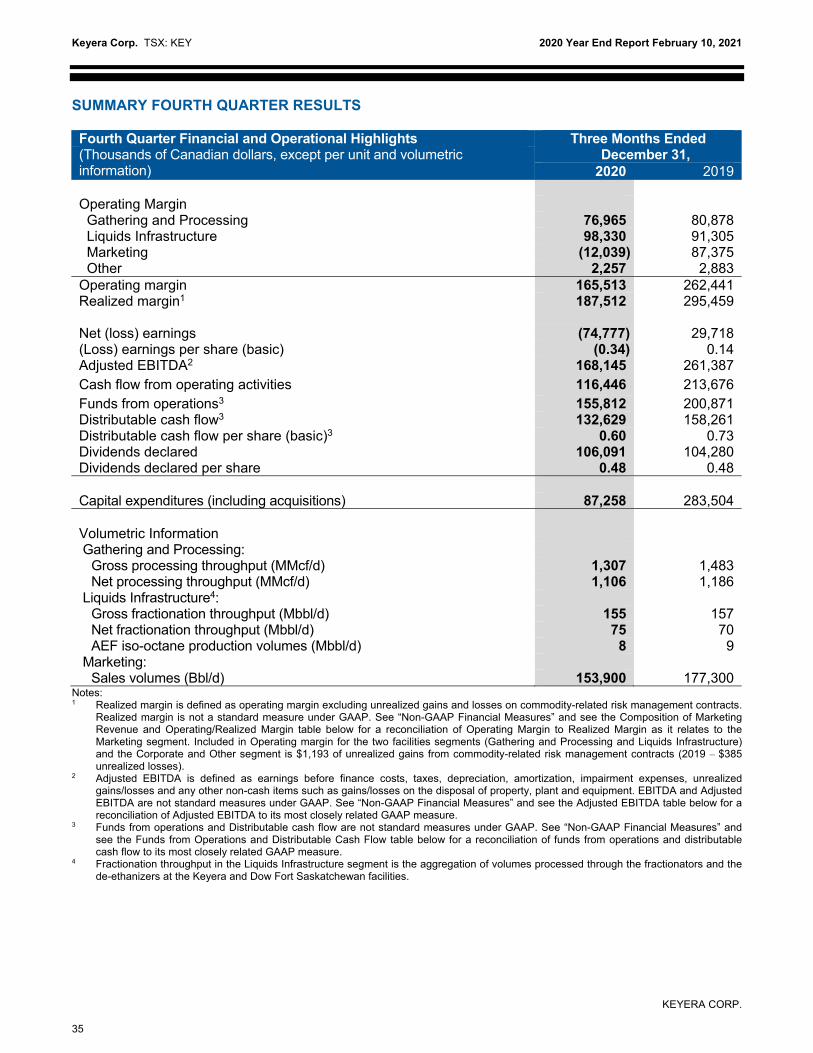
Keyera Corp. TSX: KEY 2020 Year End Report February 10, 2021
KEYERA CORP.
35
SUMMARY FOURTH QUARTER RESULTS Fourth Quarter Financial and Operational Highlights Three Months Ended
December 31, (Thousands of Canadian dollars, except per unit and volumetric information) 2020 2019 Operating Margin Gathering and Processing 76,965 80,878 Liquids Infrastructure 98,330 91,305 Marketing (12,039) 87,375 Other 2,257 2,883 Operating margin 165,513 262,441 Realized margin1
187,512 295,459
Net (loss) earnings (74,777) 29,718 (Loss) earnings per share (basic) (0.34) 0.14 Adjusted EBITDA2 168,145 261,387 Cash flow from operating activities 116,446 213,676 Funds from operations3 155,812 200,871 Distributable cash flow3 132,629 158,261 Distributable cash flow per share (basic)3 Dividends declared Dividends declared per share
0.60 106,091
0.48
0.73 104,280
0.48 Capital expenditures (including acquisitions) 87,258 283,504 Volumetric Information Gathering and Processing: Gross processing throughput (MMcf/d) 1,307 1,483 Net processing throughput (MMcf/d) 1,106 1,186
Liquids Infrastructure4: Gross fractionation throughput (Mbbl/d) 155 157 Net fractionation throughput (Mbbl/d) 75 70 AEF iso-octane production volumes (Mbbl/d) 8 9
Marketing: Sales volumes (Bbl/d) 153,900 177,300
Notes: 1 Realized margin is defined as operating margin excluding unrealized gains and losses on commodity-related risk management contracts.
Realized margin is not a standard measure under GAAP. See “Non-GAAP Financial Measures” and see the Composition of Marketing Revenue and Operating/Realized Margin table below for a reconciliation of Operating Margin to Realized Margin as it relates to the Marketing segment. Included in Operating margin for the two facilities segments (Gathering and Processing and Liquids Infrastructure) and the Corporate and Other segment is $1,193 of unrealized gains from commodity-related risk management contracts (2019 – $385 unrealized losses).
2 Adjusted EBITDA is defined as earnings before finance costs, taxes, depreciation, amortization, impairment expenses, unrealized gains/losses and any other non-cash items such as gains/losses on the disposal of property, plant and equipment. EBITDA and Adjusted EBITDA are not standard measures under GAAP. See “Non-GAAP Financial Measures” and see the Adjusted EBITDA table below for a reconciliation of Adjusted EBITDA to its most closely related GAAP measure.
3 Funds from operations and Distributable cash flow are not standard measures under GAAP. See “Non-GAAP Financial Measures” and see the Funds from Operations and Distributable Cash Flow table below for a reconciliation of funds from operations and distributable cash flow to its most closely related GAAP measure.
4 Fractionation throughput in the Liquids Infrastructure segment is the aggregation of volumes processed through the fractionators and the de-ethanizers at the Keyera and Dow Fort Saskatchewan facilities.

Keyera Corp. TSX: KEY 2020 Year End Report February 10, 2021
KEYERA CORP.
36
Composition of Marketing Revenue and Operating/Realized Margin
Three months ended December 31,
(Thousands of Canadian dollars) 2020 2019 Physical sales 559,411 812,721 Realized cash (loss) gain on financial contracts1 (22,638) 3,811 Unrealized loss due to reversal of financial contracts existing at
end of prior period
(189)
(26,843) Unrealized loss due to fair value of financial contracts existing
at end of current period (22,024) (5,371) Unrealized loss resulting from change in fair value of fixed price
physical contracts2 (979) (419) Total unrealized loss on risk management contracts
(23,192)
(32,633)
Total loss on risk management contracts (45,830) (28,822) Revenue3 513,581 783,899 Operating Expenses3 (525,620) (696,524) Marketing operating (loss) margin (12,039) 87,375 Unrealized loss on risk management contracts 23,192 32,633 Marketing realized margin 11,153 120,008
Notes: 1 Realized cash gains and losses represent actual cash settlements or receipts under the respective contracts. 2 Unrealized gains and losses represent the change in fair value of fixed price physical contracts that meet the GAAP definition of a derivative
instrument. 3 Includes inter-segment transactions.
The following is a reconciliation of distributable cash flow to its most closely related GAAP measure, cash flow from operating activities: Funds from Operations and Distributable Cash Flow
Three months ended December 31,
(Thousands of Canadian dollars) 2020 2019 Cash flow from operating activities 116,446 213,676 Add (deduct): Changes in non-cash working capital 39,366 (12,805) Funds from operations 155,812 200,871 Maintenance capital (10,889) (29,732) Leases (12,073) (12,878) Prepaid lease asset (221) — Distributable cash flow 132,629 158,261 Dividends declared to shareholders
106,091
104,280

Keyera Corp. TSX: KEY 2020 Year End Report February 10, 2021
KEYERA CORP.
37
The following is a reconciliation of EBITDA and Adjusted EBITDA to their most closely related GAAP measure, net earnings for the fourth quarter:
EBITDA Three months ended
December 31, (Thousands of Canadian dollars) 2020 2019 Net (Loss) Earnings (74,777) 29,718 Add (deduct): Finance costs 37,919 30,729 Depreciation, depletion and amortization expenses 89,798 85,542 Income tax (recovery) expense (26,226) 10,617 EBITDA 26,714 156,606 Unrealized loss on commodity-related contracts 21,999 33,018 Net foreign currency gain on U.S. debt and other (4,022) (5,332) Impairment expense 123,454 77,095 Adjusted EBITDA 168,145 261,387
Net Earnings A net loss of $75 million was recorded in the fourth quarter of 2020 compared to net earnings of $30 million in the fourth quarter of 2019. The decrease in earnings was due to the following:
Operating Margin and Realized Margin Total operating margin for the fourth quarter of 2020 was $166 million, $97 million lower than the same period in 2019 largely due to lower results from the Marketing segment which recorded an operating loss of $12 million compared to operating margin of $87 million during the same period in 2019. Realized margin (excluding the non-cash gains and losses from commodity-related risk management contracts) was $188 million, $108 million lower than the prior year. The fourth quarter operating results are discussed in more detail below.

Keyera Corp. TSX: KEY 2020 Year End Report February 10, 2021
KEYERA CORP.
38
Fourth Quarter Operating Margin and Revenue
Gathering & Processing
Operating Margin
$4 million vs Q4 2019
The decrease in operating margin in Q4 2020 was primarily due to the following:
lower processing throughput volumes across virtually all
South region gas plants resulting from natural declines and low producer activity levels. Operating margin at the Brazeau River gas plant was further reduced due to a customer diverting volumes to their own facility beginning in April 2020;
to enhance Keyera’s competitiveness, fee reductions were
provided to customers at certain gas plants in the South region. Keyera’s optimization plan is intended to reduce overall operating costs and improve profitability for the South region gas plants; and
lower operating margin from the Alder Flats gas plant due to a disclaimed take-or-pay agreement with a former joint venture partner of the facility.
The above factors were partly offset by incremental operating margin from:
the newly constructed Pipestone gas plant which commenced operations in mid-October 2020; and
higher processing throughput at the Wapiti gas plant.

Keyera Corp. TSX: KEY 2020 Year End Report February 10, 2021
KEYERA CORP.
39
Liquids Infrastructure
Operating Margin
$7 million vs Q4 2019
Increase was due to higher storage revenues as strong demand resulted in higher contracted volumes and incremental margin associated with cavern 16 in Fort Saskatchewan which came into service in April 2020.
Marketing
Operating Margin
$99 million vs Q4 2019
Decrease was mainly due to the same factors that resulted in lower realized margin as described below.
Realized Margin
$109 million vs Q4 2019
Decrease was due to $54 million in lower iso-octane margins because of higher average butane feedstock costs and weak product premiums relative to the prior year. Both periods included a maintenance outage at AEF; and
$33 million in lower propane margins. Propane margins were
negatively affected by high inventory levels across much of North America as a result of unseasonably warm weather and lower propane demand related to agricultural crop drying in the fourth quarter.

Keyera Corp. TSX: KEY 2020 Year End Report February 10, 2021
KEYERA CORP.
40
Cash Flow Metrics For the three months ended December 31, 2020, cash flow from operating activities was $116 million, $97 million lower than the same period in 2019. Funds from operations was $156 million for the fourth quarter of 2020, $45 million lower than the same period in the prior year. Distributable cash flow was $133 million for the fourth quarter of 2020, $26 million lower than the same period in the prior year. For the three months ended December 31, 2020, dividends declared were $106 million, or 80% of distributable cash flow, compared to dividends declared of $104 million, or 66% of distributable cash flow for the same period in 2019.
Keyera Corp. TSX: KEY 2020 Year End Report February 10, 2021
KEYERA CORP.
41
CRITICAL ACCOUNTING ESTIMATES In preparing Keyera’s consolidated financial statements in accordance with GAAP, management has made appropriate decisions with respect to the formulation of estimates and assumptions that affect the recorded amounts of certain assets, liabilities, revenues and expenses. Keyera has hired qualified individuals who have the skills required to make such estimates. These estimates and assumptions are reviewed and compared to actual results as well as to budgets in order to make more informed decisions on future estimates. The most significant estimates are those indicated below: Operating Revenues Gathering and Processing and Liquids Infrastructure: For each month, actual volumes processed and fees earned from the Gathering and Processing and Liquids Infrastructure assets are not known at the end of the month. Accordingly, the financial statements contain an estimate of one month's revenue based upon a review of historical trends. This estimate is adjusted for events that are known to have a significant effect on the month's operations such as non-routine maintenance projects. At December 31, 2020, operating revenues and accounts receivable for the Gathering and Processing and Liquids Infrastructure segments contained an estimate of approximately $72 million primarily for December 2020 operations. Marketing: The majority of the Marketing sales revenue is recorded based upon actual volumes and prices; however, in many cases actual product lifting volumes have not yet been confirmed and sales prices that are dependent on other variables are not yet known. Accordingly, the financial statements contain an estimate for these sales. Estimates are prepared based upon contract quantities and known events. The estimates are reviewed and compared to expected results to verify their accuracy. At December 31, 2020, the Marketing sales and accounts receivable contained an estimate for December 2020 revenues of approximately $117 million. Operating Expenses and Product Purchases Gathering and Processing and Liquids Infrastructure: The period in which invoices are rendered for the supply of goods and services necessary for the operation of the Gathering and Processing and Liquids Infrastructure assets is generally later than the period in which the goods or services were provided. Accordingly, the financial statements contain an estimate of one month's operating costs based upon a review of historical trends. This estimate is adjusted for events that are known to have a significant effect on the month's operations such as non-routine maintenance projects. At December 31, 2020, operating expenses and accounts payable contained an estimate of approximately $27 million primarily for December 2020 operations. Marketing: NGL mix feedstock and specification products such as propane, butane and condensate are purchased from facilities located throughout western Canada and in some locations in the U.S. The majority of NGL mix purchases are estimated each month as actual volume information is generally not available until the next month. Specification product volumes and prices are based upon contract volumes and prices. Accordingly, the financial statements contain an estimate for one month of these purchases. Marketing cost of goods sold, inventory and accounts payable contained an estimate of NGL product purchases of approximately $124 million at December 31, 2020. Equalization Adjustments Much of the revenue from the Gathering and Processing assets includes a recovery of operating costs. Under this method, the operating component of the fee is a pro rata share of the operating costs for the facility, calculated based upon total throughput. Users of each facility are charged a fee per unit based upon estimated costs and throughput, with an adjustment to actual throughput completed after the end of the year. Each

Keyera Corp. TSX: KEY 2020 Year End Report February 10, 2021
KEYERA CORP.
42
quarter, throughput volumes and operating costs are reviewed to determine whether the estimated unit fee charged during the quarter properly reflects the actual volumes and costs, and the allocation of revenues and operating costs to other plant owners is also reviewed. Appropriate adjustments to revenue and operating expenses are recognized in the quarter and allocations to other owners are recorded. For the Gathering and Processing segment, an equalization adjustment of $5 million was included in revenue and accounts receivable at December 31, 2020. Operating expenses and accounts payable contained an equalization adjustment of $7 million. Depreciation of property, plant and equipment For purposes of determining depreciation, depletion and amortization expense, estimates and judgments are required to establish depreciation methods, useful lives, and residual values for Keyera’s assets. Determining depreciation methods requires management to make judgments that most appropriately reflect the pattern of an asset’s future economic benefit expected to be consumed by Keyera. For assets other than production assets, useful life estimates include management’s assumptions regarding the period over which the asset is expected to be available for use by the company. This includes assessing the assets’ physical and economic lives and, if applicable, may include an estimation of the associated reserve lives and production activity related to the assets’ respective capture areas. Production assets are depleted using the unit-of-production method based on estimated proved reserves, which are determined by Keyera’s independent qualified reserves evaluator. The estimation of reserves involves the exercise of professional judgment and is inherently subject to uncertainty. Changes in forward price estimates, production costs or recovery rates may change the economic status of reserves. Allowance for Expected Credit Losses The allowance for expected credit losses is reviewed on a monthly basis. An assessment is made whether an account is deemed impaired based on the number of days outstanding and the likelihood of collection from the counterparty. The allowance for expected credit losses was $4 million as at December 31, 2020, an increase of $2 million from the prior year end. Derivative Financial Instruments Keyera utilizes derivative financial instruments to manage its exposure to market risks relating to commodity prices and foreign currency exchange rates. Fair values of derivative contracts fluctuate depending on the underlying estimates of future commodity prices or foreign currency exchange rates. The estimated fair value of all derivative financial instruments are based on observable market data, including commodity price curves, foreign currency curves and credit spreads. Refer to note 22, Financial Instruments and Risk Management, of the accompanying financial statements for a summary of the fair value of derivative financial instruments existing at December 31, 2020. Fair value estimates of property, plant and equipment Determination of the fair value of identifiable assets acquired in a business combination requires Keyera’s management to make assumptions and estimates about future events. The fair value of identifiable assets such as gathering and processing, storage and fractionation facilities, pipelines, terminals and other equipment is estimated with reference to the expected discounted future cash flows expected to be derived from the acquired assets. These assumptions and estimates generally require judgment and include estimates of future revenues, costs and discount rates. Changes in any of the assumptions or estimates used in determining the fair value of acquired assets and liabilities could impact the amounts assigned to the net assets acquired in a business combination. Impairment of property, plant and equipment and goodwill In determining the recoverable amount of assets, in the absence of quoted market prices, estimates are made regarding the present value of future cash flows. The useful lives of property, plant and equipment is determined by the present value of future cash flows. Future cash flow estimates are based on future production profiles and reserves for surrounding wells, commodity prices and costs. Estimates are also made in determining the discount rate used to calculate the present value of future cash flows.

Keyera Corp. TSX: KEY 2020 Year End Report February 10, 2021
KEYERA CORP.
43
Determining whether goodwill is impaired requires an estimation of the value in use of the CGUs to which goodwill has been allocated. The value in use calculation requires management to estimate the future cash flows expected to arise from the CGU and the discount rate in order to calculate present value. The determination of CGUs is subject to management’s judgment. Refer to note 9, Property, Plant and Equipment and note 11, Goodwill, of the accompanying financial statements for further details of the impairment expense recorded for the year ended December 31, 2020. Long-term incentive plan liability The LTIP is accounted for using the liability method and is measured at fair value. Determining the fair value requires management to estimate Keyera’s financial performance over a three-year period to determine the appropriate payout multiplier associated with the Performance Awards. The payout multiplier is based 70% on the average annual pre-tax distributable cash flow per share over the three-year period and 30% on the relative total shareholder return over the same period. The payout multiplier determines the number of shares expected to be settled following the third anniversary of the grant date of the Performance Awards. Refer to note 21, Share-based Compensation and Pension Plans, of the accompanying financial statements for further details. Decommissioning liability Keyera will be responsible for compliance with all applicable laws and regulations regarding the decommissioning, abandonment and reclamation of its gathering and processing, fractionation, iso-octane and storage facilities, pipelines and terminals at the end of their economic life. The majority of decommissioning obligations are generally expected to be incurred over the next 25 to 55 years. While the provision is based on the best estimate of future costs and the economic lives of these assets, there is uncertainty regarding the amount and timing of these costs. No assets have been legally restricted for settlement of the liability. The process, overseen by Keyera’s Health, Safety and Environment Committee, is undertaken by professionals involved in activities that deal with the design, construction, operation and decommissioning of assets. Specialists with knowledge and assessment processes specific to environmental and decommissioning activities and costs are also utilized in the process. Ultimately, all medium and large facilities will be independently assessed in accordance with regulatory requirements. Effective December 31, 2019, Keyera voluntarily changed its accounting policy with respect to the discounting of its decommissioning liability. Refer to the audited consolidated financial statements as at and for the year ended December 31, 2019 and related MD&A for further information including a description of the changes and the effect on Keyera’s consolidated financial statements. Keyera has estimated the net present value of its total decommissioning liability to be approximately $298 million at December 31, 2020, compared to $250 million at December 31, 2019. The fair value of the decommissioning liability was calculated by using a credit-adjusted risk-free discount rate of 4.2% (December 31, 2019 – 4.3%). Refer to note 14, Decommissioning Liability, of the accompanying financial statements for a reconciliation of the beginning and ending carrying amount of the decommissioning liability. Additional information related to decommissioning, abandonment and reclamation is also provided in Keyera’s Annual Information Form, which is available on SEDAR at www.sedar.com. Deferred tax assets and liabilities Deferred tax assets and liabilities require management’s judgment in determining the amounts to be recognized. In particular, judgment is used when assessing the extent to which deferred tax assets should be recognized with consideration given to the timing and level of future taxable income. To the extent estimates differ from the final tax return, earnings would be affected in a subsequent period. Refer to note 17, Income Taxes, of the accompanying financial statements for a reconciliation of income taxes to the income tax provision recognized for the year ended December 31, 2020.
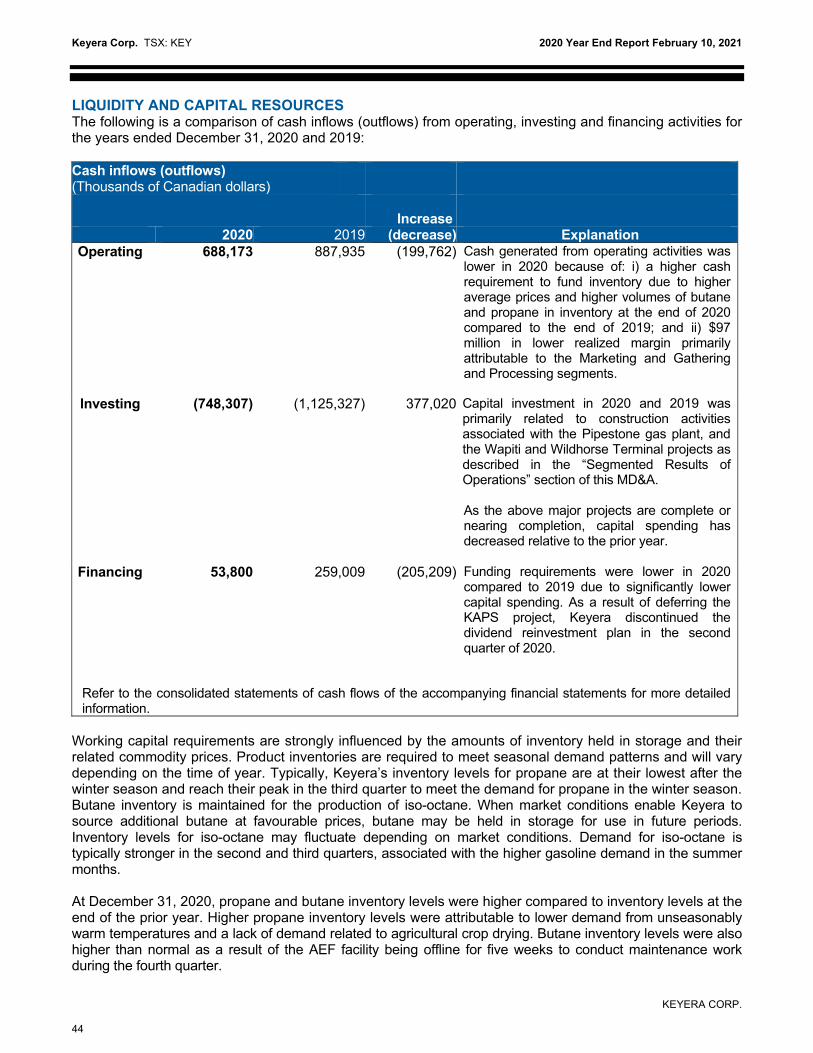
Keyera Corp. TSX: KEY 2020 Year End Report February 10, 2021
KEYERA CORP.
44
LIQUIDITY AND CAPITAL RESOURCES The following is a comparison of cash inflows (outflows) from operating, investing and financing activities for the years ended December 31, 2020 and 2019: Cash inflows (outflows) (Thousands of Canadian dollars)
Increase
2020 2019 (decrease) Explanation Operating 688,173 887,935 (199,762) Cash generated from operating activities was
lower in 2020 because of: i) a higher cash requirement to fund inventory due to higher average prices and higher volumes of butane and propane in inventory at the end of 2020 compared to the end of 2019; and ii) $97 million in lower realized margin primarily attributable to the Marketing and Gathering and Processing segments.
Investing (748,307) (1,125,327) 377,020 Capital investment in 2020 and 2019 was primarily related to construction activities associated with the Pipestone gas plant, and the Wapiti and Wildhorse Terminal projects as described in the “Segmented Results of Operations” section of this MD&A. As the above major projects are complete or nearing completion, capital spending has decreased relative to the prior year.
Financing 53,800 259,009 (205,209) Funding requirements were lower in 2020 compared to 2019 due to significantly lower capital spending. As a result of deferring the KAPS project, Keyera discontinued the dividend reinvestment plan in the second quarter of 2020.
Refer to the consolidated statements of cash flows of the accompanying financial statements for more detailed information.
Working capital requirements are strongly influenced by the amounts of inventory held in storage and their related commodity prices. Product inventories are required to meet seasonal demand patterns and will vary depending on the time of year. Typically, Keyera’s inventory levels for propane are at their lowest after the winter season and reach their peak in the third quarter to meet the demand for propane in the winter season. Butane inventory is maintained for the production of iso-octane. When market conditions enable Keyera to source additional butane at favourable prices, butane may be held in storage for use in future periods. Inventory levels for iso-octane may fluctuate depending on market conditions. Demand for iso-octane is typically stronger in the second and third quarters, associated with the higher gasoline demand in the summer months. At December 31, 2020, propane and butane inventory levels were higher compared to inventory levels at the end of the prior year. Higher propane inventory levels were attributable to lower demand from unseasonably warm temperatures and a lack of demand related to agricultural crop drying. Butane inventory levels were also higher than normal as a result of the AEF facility being offline for five weeks to conduct maintenance work during the fourth quarter.

Keyera Corp. TSX: KEY 2020 Year End Report February 10, 2021
KEYERA CORP.
45
A working capital surplus (current assets less current liabilities) of $148 million existed at December 31, 2020. This is compared to a deficit of $161 million at December 31, 2019. Keyera has access to a credit facility in the amount of $1.5 billion of which $280 million was drawn as at December 31, 2020 (December 31, 2019 – $90 million). Refer to the section below of this MD&A titled, “Long-term Debt”, for more information related to Keyera’s unsecured revolving credit facility. Dividend Reinvestment Plan In April, Keyera announced the discontinuation of the dividend reinvestment plan (the “Plan”). Shareholders who had been participating in either component of the Plan received the full cash dividend declared beginning with the dividend paid in May 2020. Prior to discontinuance, Keyera’s dividend reinvestment plan consisted of two components: a Premium DividendTM (“Premium DRIP”) reinvestment component and a regular dividend reinvestment component (“DRIP”). The DRIP component allowed eligible shareholders of Keyera to direct their cash dividends to be reinvested in additional shares issued from treasury at a 3% discount to the Average Market Price (as defined in the Plan) on the applicable dividend date, with no incremental finance costs. The Premium DRIP component permitted eligible shareholders to elect to have the additional shares issued at the 3% discount delivered to the designated Plan Broker in exchange for a premium cash payment equal to 101% of the regular, declared cash dividend that was reinvested on their behalf under the Plan. A copy of the Plan is also available on Keyera’s website at www.keyera.com and on SEDAR at www.sedar.com. The DRIP and Premium DRIP generated cash of $77 million for the year ended December 31, 2020. In 2019, the plan generated cash of $227 million. Corporate Credit Ratings In light of the sharp decline in commodity prices and S&P Global’s (“S&P”) outlook for the industry, in April, S&P lowered Keyera’s corporate credit rating from “BBB/stable” to a “BBB-/stable”. At the same time, S&P lowered Keyera's medium-term notes issued in June 2018 to 'BBB-' from 'BBB', and the rating on its subordinated hybrid notes issued in June 2019 to 'BB' from 'BB+'. Keyera’s corporate credit rating and issuer rating on its medium-term notes assigned by DBRS Limited (“DBRS”) remain unchanged at “BBB” with a “stable” trend. The issuer-rating assigned by DBRS on Keyera’s subordinated hybrid notes also remain at “BB (high)”. Both credit agencies currently treat the subordinated hybrid notes as 50% equity. Credit ratings are intended to provide investors with an independent measure of credit quality of an issue of securities. Credit ratings are not recommendations to purchase, hold or sell securities and do not address the market price or suitability of a specific security for a particular investor. There is no assurance that any rating will remain in effect for any given period of time or that any rating will not be revised or withdrawn entirely by a rating agency in the future if, in its judgment, circumstances so warrant. Rating agencies will regularly evaluate Keyera, including its financial strength. In addition, factors not entirely within Keyera’s control may also be considered, including conditions affecting the industry in which it operates. A credit rating downgrade could impair Keyera’s ability to enter into arrangements with suppliers or counterparties and could limit its access to private and public credit markets in the future and increase the costs of borrowing.

Keyera Corp. TSX: KEY 2020 Year End Report February 10, 2021
KEYERA CORP.
46
Long-term Debt (including Credit Facilities) Below is a summary of Keyera’s long-term debt obligations as at December 31, 2020: As at December 31, 2020 (Thousands of Canadian dollars)
Total
2021
2022
2023
2024
2025 After 2025
Credit facilities Bank credit facilities 280,000 — — — 280,000 — —Total credit facilities 280,000 — — — 280,000 — —
Canadian dollar denominated debt Senior unsecured notes: 6.14% due December 3, 2022 60,000 — 60,000 — — — —3.50% due June 16, 2023 30,000 — — 30,000 — — —4.91% due June 19, 2024 17,000 — — — 17,000 — —4.92% due October 10, 2025 100,000 — — — — 100,000 —5.05% due November 20, 2025 20,000 — — — — 20,000 —4.15% due June 16, 2026 30,000 — — — — — 30,0003.96% due October 13, 2026 200,000 — — — — — 200,0003.68% due September 20, 2027 400,000 — — — — — 400,0005.09% due October 10, 2028 100,000 — — — — — 100,0004.11% due October 13, 2028 100,000 — — — — — 100,0005.34% due April 8, 2029 75,000 — — — — — 75,000 1,132,000 — 60,000 30,000 17,000 120,000 905,000Senior unsecured medium-
term notes: 3.93% due June 21, 2028 400,000 — — — — — 400,0003.96% due May 29, 2030 400,000 — — — — — 400,000 Subordinated hybrid notes 6.88% due June 13, 2079 600,000 — — — — — 600,000 2,532,000 — 60,000 30,000 17,000 120,000 2,305,000 U.S. dollar denominated debt Senior unsecured notes: 4.19% due June 19, 2024 (US$128,000)
163,264
—
—
—
163,264 — —
4.75% due November 20, 2025 (US$140,000)
178,570
—
—
—
— 178,570 —
4.95% due November 20, 2028 (US$65,000)
82,908
—
—
—
— — 82,908
424,742 — — — 163,264 178,570 82,908Less: current portion of long-term debt — —
—
—
— — —
Total long-term debt 2,956,742 — 60,000 30,000 180,264 298,570 2,387,908
Keyera Corp. TSX: KEY 2020 Year End Report February 10, 2021
KEYERA CORP.
47
Credit Facilities Keyera’s Credit Facility is with a syndicate of eight lenders under which it can borrow up to $1.5 billion, with the potential to increase that limit to $1.85 billion subject to certain conditions. As at December 31, 2020, $280 million was drawn under this facility (December 31, 2019 – $90 million). In December 2019, the Credit Facility was amended to extend the term from December 6, 2023 to December 6, 2024. Management expects to extend the Credit Facility prior to maturity, and in the event of reaching maturity, expects an adequate replacement will be established. Keyera also has two unsecured revolving demand facilities, one with the Toronto Dominion Bank in the amount of $25 million and the other with the Royal Bank of Canada in the amount of $50 million. These facilities bear interest based on the lenders’ rates for Canadian prime commercial loans, U.S. base rate loans, LIBOR loans or bankers’ acceptances. Long-term Debt Keyera’s long-term debt structure consists of a number of senior unsecured notes, medium-term notes and subordinated hybrid notes. On September 8, 2020, Keyera completed two long-term debt senior note repayments of $2 million and US$103 million which were funded from Keyera’s credit facility. On May 29, 2020, Keyera issued $400 million of senior unsecured medium-term notes in the Canadian public debt market. The notes bear interest at 3.959% per annum, are payable semi-annually, and mature on May 29, 2030. The notes were issued under Keyera's short form base shelf prospectus dated November 15, 2019, as supplemented by a prospectus supplement dated November 18, 2019, and a pricing supplement dated May 26, 2020. A portion of the proceeds from the note offering was used to repay indebtedness under Keyera’s credit facility. The remaining proceeds were used for general corporate purposes, including funding capital expenditures and repayment of debt that matured in 2020. In June 2019, Keyera issued $600 million of fixed-to-floating rate subordinated hybrid notes due June 13, 2079 in the Canadian public debt market which receive 50% equity treatment by Keyera’s rating agencies. The subordinated notes were issued under Keyera’s short form base shelf prospectus and a prospectus supplement dated June 11, 2019. The interest rate of 6.875% is payable in equal semi-annual payments for the period December 13, 2019 to June 13, 2029. As at December 31, 2020, Keyera had $2,532 million and US$333 million of long-term debt outstanding. To manage the foreign currency exposure on the U.S. dollar denominated debt, Keyera has entered into cross-currency agreements with a syndicate of banks to swap the U.S. dollar principal and future interest payments into Canadian dollars at foreign exchange rates of $0.98 and $1.03 per U.S. dollar for the principal payments and $1.22 and $1.14 per U.S. dollar for the future interest payments. The cross-currency agreements are accounted for as derivative instruments and are measured at fair value at the end of each quarter. The section of this MD&A titled “Net Foreign Currency Gain (Loss) on U.S. Debt and Other” provides more information. Compliance with Covenants The Credit Facility is subject to two major financial covenants: “Net Debt to Adjusted EBITDA” and “Adjusted EBITDA to Interest Charges” ratios. The senior unsecured notes are subject to three major financial covenants: “Net Debt to Adjusted EBITDA”, “Adjusted EBITDA to Interest Charges” and “Priority Debt to Total Assets”. The medium-term notes are subject to one major financial covenant: “Funded Debt to Total Capitalization”. The calculations for each of these ratios (i) are based on specific definitions in the agreements governing the Credit Facility and relevant notes, as applicable, (ii) are not in accordance with GAAP, and (iii) cannot be easily calculated by referring to the company’s financial statements. Failure to adhere to these covenants may impair Keyera’s ability to pay dividends and such a circumstance could affect the company’s ability to execute future growth plans. Management expects that upon maturity of the company’s credit facilities and other debt arrangements, adequate replacements will be established.
The primary covenant for Keyera’s private senior unsecured notes and its Credit Facility is a Net Debt to Adjusted EBITDA ratio. In the calculation of debt for the purpose of calculating this covenant, Keyera is required to: i) include senior debt; ii) deduct working capital surpluses or add working capital deficits; and iii)

Keyera Corp. TSX: KEY 2020 Year End Report February 10, 2021
KEYERA CORP.
48
utilize the cross-currency swap rates in the calculation of debt rather than the spot rate as at each statement of financial position date. The covenant test calculation also excludes 100% of Keyera’s $600 million subordinated hybrid note. Keyera is required to maintain a Net Debt to Adjusted EBITDA ratio of less than 4.0; however, the company has the flexibility to increase this ratio from 4.0 to 4.5 for periods of up to four consecutive fiscal quarters.
As at December 31, 2020, Keyera was in compliance with all covenants under its Credit Facility and outstanding notes. Keyera’s Net Debt to Adjusted EBITDA ratio at December 31, 2020 was 2.9x for covenant test purposes (December 31, 2019 – 2.2x). As a long-term target, Keyera’s objective is to maintain a Net Debt to Adjusted EBITDA ratio of between 2.5x to 3.0x. This range results in a leverage profile that supports Keyera’s investment grade credit ratings. For additional information regarding these financial covenants, refer to the Credit Facility and the Note Agreements which are available on SEDAR at www.sedar.com.
Capital Expenditures and Acquisitions The following table is a breakdown of capital expenditures and acquisitions for the years ended December 31, 2020 and 2019: Capital Expenditures and Acquisitions (Thousands of Canadian dollars) 2020 2019 Acquisitions 1,870 599 Growth capital expenditures 563,178 986,125 Maintenance capital expenditures 29,116 105,077 Total capital expenditures 594,164 1,091,801
Growth capital expenditures for the year ended December 31, 2020 totaled $563 million. Refer to the section of this MD&A, titled “Segmented Results of Operations”, for information related to the various growth capital projects in the Gathering and Processing and Liquids Infrastructure segments, including estimated costs to complete, costs incurred in 2020 and since inception of the project, and estimated completion timeframes. In December 2020, Keyera completed its capital investment in a butane-on-demand distribution system at Kinder Morgan’s Galena Park Products Terminal in Texas. The infrastructure is designed to provide butane for gasoline blending and was constructed by Kinder Morgan and reimbursed by Keyera at a cost of US$51 million ($66 million). Keyera has exclusive use of the infrastructure over a 25-year period, and since the consideration associated with this investment was paid in advance, a prepaid lease asset has been recorded.
Keyera has comprehensive inspection, monitoring and maintenance programs in place. The objectives of these programs are to keep Keyera’s facilities in good working order and to maintain their ability to operate reliably for many years. In addition to the maintenance capital expenditures, Keyera incurred maintenance and repair expenses of $66 million for the year ended December 31, 2020, compared to $60 million in 2019.
At December 31, 2020, Keyera had a $2.9 billion capital program underway. Excluding KAPS, the capital program has an estimated total cost of $2.2 billion with the majority of projects dedicated to establishing a strong position in the liquids-rich Montney and Duvernay development areas. Of this capital program, approximately $2.1 billion has been expended since inception. Furthermore, all capital projects related to the Montney and Duvernay development areas are now substantially complete. The $2.2 billion growth capital program is expected to earn an annual return on capital of 10% to 15% in 2022, once all projects achieve their annual run rate. This return on capital estimate is unchanged from the December 31, 2019 year end MD&A. In light of prevailing industry and market uncertainty in 2020, Keyera and its customers elected to defer the KAPS pipeline project for one year. Since that time, Keyera has continued to advance project planning, including refining the project’s original $1.3 billion capital cost estimate. Due to increased competitive
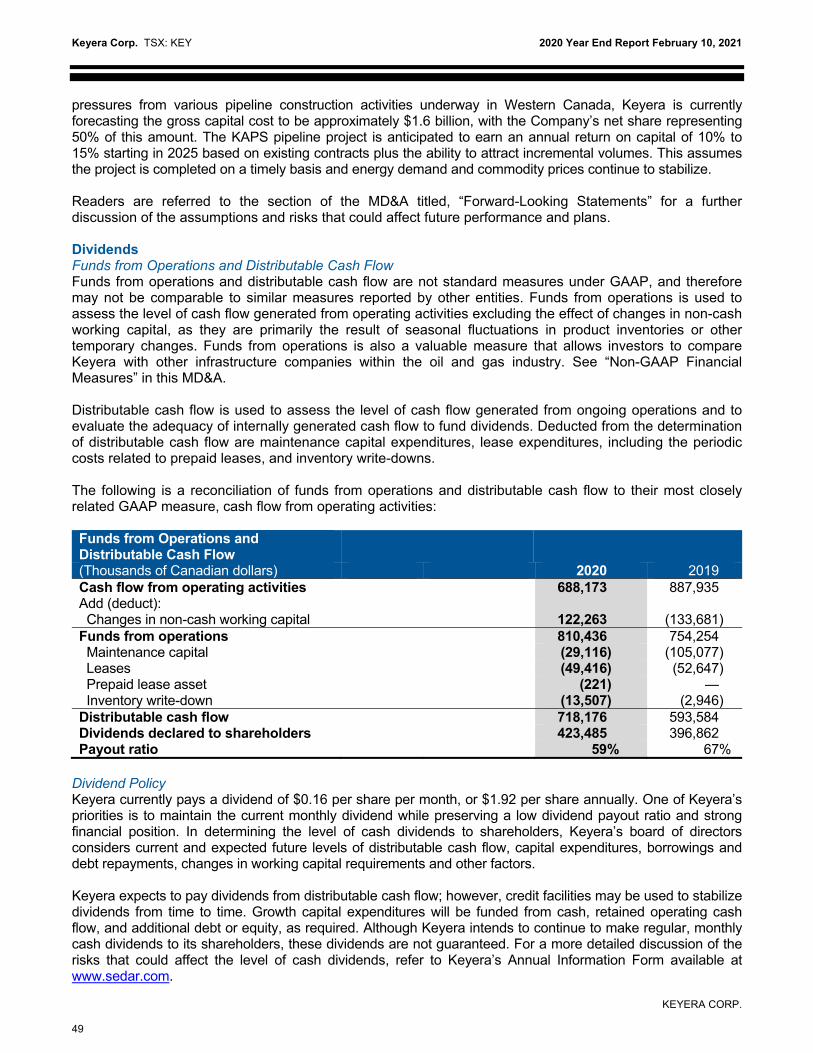
Keyera Corp. TSX: KEY 2020 Year End Report February 10, 2021
KEYERA CORP.
49
pressures from various pipeline construction activities underway in Western Canada, Keyera is currently forecasting the gross capital cost to be approximately $1.6 billion, with the Company’s net share representing 50% of this amount. The KAPS pipeline project is anticipated to earn an annual return on capital of 10% to 15% starting in 2025 based on existing contracts plus the ability to attract incremental volumes. This assumes the project is completed on a timely basis and energy demand and commodity prices continue to stabilize. Readers are referred to the section of the MD&A titled, “Forward-Looking Statements” for a further discussion of the assumptions and risks that could affect future performance and plans. Dividends Funds from Operations and Distributable Cash Flow Funds from operations and distributable cash flow are not standard measures under GAAP, and therefore may not be comparable to similar measures reported by other entities. Funds from operations is used to assess the level of cash flow generated from operating activities excluding the effect of changes in non-cash working capital, as they are primarily the result of seasonal fluctuations in product inventories or other temporary changes. Funds from operations is also a valuable measure that allows investors to compare Keyera with other infrastructure companies within the oil and gas industry. See “Non-GAAP Financial Measures” in this MD&A. Distributable cash flow is used to assess the level of cash flow generated from ongoing operations and to evaluate the adequacy of internally generated cash flow to fund dividends. Deducted from the determination of distributable cash flow are maintenance capital expenditures, lease expenditures, including the periodic costs related to prepaid leases, and inventory write-downs. The following is a reconciliation of funds from operations and distributable cash flow to their most closely related GAAP measure, cash flow from operating activities: Funds from Operations and Distributable Cash Flow (Thousands of Canadian dollars) 2020 2019 Cash flow from operating activities 688,173 887,935 Add (deduct): Changes in non-cash working capital 122,263 (133,681) Funds from operations 810,436 754,254 Maintenance capital (29,116) (105,077) Leases (49,416) (52,647) Prepaid lease asset (221) — Inventory write-down (13,507) (2,946) Distributable cash flow 718,176 593,584 Dividends declared to shareholders 423,485 396,862 Payout ratio 59% 67%
Dividend Policy Keyera currently pays a dividend of $0.16 per share per month, or $1.92 per share annually. One of Keyera’s priorities is to maintain the current monthly dividend while preserving a low dividend payout ratio and strong financial position. In determining the level of cash dividends to shareholders, Keyera’s board of directors considers current and expected future levels of distributable cash flow, capital expenditures, borrowings and debt repayments, changes in working capital requirements and other factors. Keyera expects to pay dividends from distributable cash flow; however, credit facilities may be used to stabilize dividends from time to time. Growth capital expenditures will be funded from cash, retained operating cash flow, and additional debt or equity, as required. Although Keyera intends to continue to make regular, monthly cash dividends to its shareholders, these dividends are not guaranteed. For a more detailed discussion of the risks that could affect the level of cash dividends, refer to Keyera’s Annual Information Form available at www.sedar.com.

Keyera Corp. TSX: KEY 2020 Year End Report February 10, 2021
KEYERA CORP.
50
EBITDA EBITDA and adjusted EBITDA are not standard measures under GAAP and, therefore, may not be comparable to similar measures reported by other entities. EBITDA is a measure showing earnings before finance costs, taxes, depreciation and amortization. Adjusted EBITDA is calculated as EBITDA before costs associated with non-cash items, including unrealized gains/losses on commodity contracts, impairment expenses and any other non-cash items such as gains/losses on the disposal of property, plant and equipment. Management believes that these supplemental measures facilitate the understanding of Keyera’s results from operations. See “Non-GAAP Financial Measures” in this MD&A.
The following is a reconciliation of EBITDA and adjusted EBITDA to their most closely related GAAP measure, net earnings:
EBITDA (Thousands of Canadian dollars) 2020 2019 Net earnings 62,030 443,609 Add (deduct): Finance costs 131,507 113,066 Depreciation, depletion and amortization expenses 290,416 278,292 Income tax expense 11,121 16,797 EBITDA 495,074 851,764 Unrealized loss on commodity-related contracts 16,624 49,594 Net foreign currency gain on U.S. debt and other (9,421) (34,352) Impairment expense 371,305 77,095 Adjusted EBITDA 873,582 944,101

Keyera Corp. TSX: KEY 2020 Year End Report February 10, 2021
KEYERA CORP.
51
CONTRACTUAL OBLIGATIONS Keyera has assumed various contractual obligations in the normal course of its operations. At December 31, 2020, the obligations that represent known future cash payments that are required under existing contractual arrangements were as follows:
Payments Due by Period Contractual obligations (Thousands of Canadian dollars)
Total
2021
2022
2023
2024
2025
After 2025
Derivative financial instruments 42,438 42,438 — — — — —
Dividends payable 35,364 35,364 — — — — —
Credit facility 280,000 — — — 280,000 — —
Long-term debt1 2,956,742 — 60,000 30,000 180,264 298,570 2,387,908
Lease liabilities2 261,672 44,115 35,764 24,633 22,296 20,756 114,108
Other liabilities3 18,670 7,986 4,683 6,001 — — —
Decommissioning liabilities4 298,178 15,520 — — — — 282,658
Service obligations5 37,855 14,291 12,968 4,205 2,856 2,737 798
Purchase obligations6,7 198,491 193,713 4,778 — — — —
Total contractual obligations 4,129,410 353,427 118,193 64,839 485,416 322,063 2,785,472Notes: 1 Long-term debt obligations are principal only and exclude interest payments. For the U.S. denominated senior unsecured notes, the principal
obligations are converted at the December 31, 2020 spot foreign exchange rate of 1.2755. 2 Lease liabilities include the expected undiscounted cash payments related to leases. 3 Other liabilities include the current portion of the LTIP and certain trade and other payable balances. 4 The majority of these obligations are expected to be settled between 2021 and 2073. No assets have been legally restricted for settlement of
the liability. 5 Keyera has service obligations related to terminal storage and natural gas transportation. 6 Purchase obligations include third party contractual commitments related to assets under construction. 7 Keyera through its operating entities has assumed commitments in various contractual purchase agreements in the normal course of its
operations. The agreements involve the purchase of NGL production from producers in the areas specified in the agreements. The purchase prices are based on current market prices. The future volumes and prices for these contracts cannot be reasonably determined and therefore no amount has been included in purchase obligations to reflect these contractual agreements.
RELATED PARTY TRANSACTIONS Keyera has provided compensation to key management personnel who are comprised of its directors and executive officers. There have been no other material related party transactions or significant changes to the annual compensation amounts disclosed in note 28, Related Party Transactions, of the accompanying December 31, 2020 financial statements. RISK FACTORS The majority of Keyera’s cash flow is derived from the Gathering and Processing and Liquids Infrastructure fee-for-service business segments. The contribution generated from Gathering and Processing facilities can be exposed to changes in operating costs, depending on the fee structures of the facilities which may or may not provide a mechanism for the recovery of operating costs. The most significant exposure faced by the Gathering and Processing and Liquids Infrastructure segments over the long term is related to declines in throughput volumes. Without reserve additions, third party production will decline over time, as reserves are depleted. Declining production volumes may translate into lower throughput and revenues at Keyera’s plants and facilities; however, the effect of any reduction in throughput would likely be gradual. Many of Keyera’s facilities are located in significant liquids-rich natural gas supply areas of the Western Canada Sedimentary Basin or major liquids hubs, and capital costs present barriers to entry for new competitors. The most significant exposure faced by the Marketing business is the fluctuation in the prices of the commodities that Keyera buys and sells. Refer to the section below titled, “Marketing Risk”, for more information related to these risks.

Keyera Corp. TSX: KEY 2020 Year End Report February 10, 2021
KEYERA CORP.
52
For a further discussion of the risks identified in this MD&A, other risks and trends that could affect Keyera’s performance and the steps that Keyera takes to mitigate these risks, readers are referred to the descriptions in this MD&A and Keyera’s Annual Information Form, which is available on SEDAR at www.sedar.com. Regulatory Risk Keyera is subject to a range of laws and regulations imposed by various levels of government and regulatory bodies in the jurisdictions in which it operates. In particular, income tax laws, environmental laws and regulatory requirements can have a significant financial and operational impact on Keyera’s business. While these laws and regulations affect all dimensions of Keyera’s activities, Keyera does not believe that they affect its operations in a manner materially different from other comparable businesses operating in the same jurisdictions. A more complete discussion of regulatory risks can be found in the Annual Information Form available on SEDAR at www.sedar.com and in the section of this MD&A titled, “Environmental Regulation and Climate Change”. Credit Risk Keyera assumes credit risk with respect to its fee-for-service business, the purchase and sale of commodities in its Marketing business, the hedging of commodity prices and the other financial contracts into which it enters. In particular, Keyera is exposed to credit-related losses in the event that counterparties to contracts become insolvent or otherwise fail to fulfill their present or future financial obligations to Keyera. The majority of Keyera’s accounts receivable are due from entities in the oil and gas business and are subject to normal industry credit risks. Concentration of credit risk is mitigated to some degree by having a broad based domestic and international customer base. With respect to counterparties for financial instruments used for economic hedging purposes, Keyera limits its credit risk by dealing with recognized futures exchanges, or investment grade financial institutions, or by adherence to credit policies that significantly reduce overall counterparty credit risk. Keyera regularly monitors accounts receivable for collection purposes and reviews exposure to customers and counterparties. It has also implemented other credit risk management strategies including but not limited to the following: i) obtaining netting agreements in order to reduce the net exposure to a particular customer or producer; ii) obtaining letters of credit that may be used as collateral; or iii) requiring pre-payment prior to the sale of product or rendering of services where deemed appropriate. Management believes these measures reduce Keyera’s overall credit risk; however, there can be no assurance that these processes will protect against all losses from non-performance. As at December 31, 2020, the allowance for expected credit losses was $4 million (December 31, 2019 – $2 million) to provide for specific accounts receivable amounts that may be uncollectible. Despite Keyera’s efforts in the monitoring and collection of accounts receivable, actual losses from defaults may be greater than that provided for. For a discussion of the risks that could affect Keyera’s liquidity and working capital and the steps Keyera takes to mitigate these risks, readers are referred to note 22, Financial Instruments and Risk Management, of the accompanying financial statements and to Keyera’s Annual Information Form, which are available on SEDAR at www.sedar.com. Credit Ratings With the assignment of two long-term corporate credit ratings, rating agencies will regularly evaluate Keyera, including its financial strength. In addition, factors not entirely within Keyera’s control may also be considered, including conditions affecting the industry in which it operates. There can be no assurance that one or more of Keyera’s credit ratings will not be downgraded. A credit rating downgrade could impair Keyera’s ability to enter into arrangements with suppliers or counterparties and could limit its access to private and public credit markets and increase the costs of borrowing. Credit ratings are intended to provide investors with an independent measure of credit quality of an issue of securities. Credit ratings are not recommendations to purchase, hold or sell securities and do not address the market price or suitability of a specific security for a particular investor. There is no assurance that any

Keyera Corp. TSX: KEY 2020 Year End Report February 10, 2021
KEYERA CORP.
53
rating will remain in effect for any given period of time or that any rating will not be revised or withdrawn entirely by a rating agency in the future if, in its judgment, circumstances so warrant. Marketing Risk Keyera enters into contracts to purchase and sell natural gas, NGLs, iso-octane and crude oil. Most of these contracts are priced at floating market prices. These activities expose Keyera to market risks resulting from movements in commodity prices between the time volumes are purchased and the time they are sold, from fluctuations in the margins between purchase prices and sales prices and, in some cases, may also expose Keyera to foreign currency risk. The prices of the products that are marketed by Keyera are subject to fluctuations as a result of such factors as seasonal demand changes, changes in crude oil, gasoline and natural gas markets and other factors. In many circumstances, particularly in NGL marketing, purchase and sale contracts are not perfectly matched as they are entered into at different times, locations and values. Further, Keyera normally has a long position in propane that it markets and in butane that it uses as a feedstock for the production of iso-octane, and it may store these products in order to meet seasonal demand and take advantage of seasonal pricing differentials, resulting in inventory price risk. In Keyera’s NGL, iso-octane and liquids blending marketing businesses, margins can vary significantly from period to period and volatility in the markets for these products may cause distortions in financial results from period to period that are not replicable. To some extent, Keyera can lessen certain elements of risk exposure through the integration of its marketing business with its facilities businesses. In spite of this integration, Keyera remains exposed to market and commodity price risk. Keyera manages this commodity risk in a number of ways, including the use of financial and physical hedging contracts and by offsetting some physical and financial contracts in terms of volumes, timing of performance and delivery obligations. There is no guarantee that hedging and other efforts to manage the marketing and inventory risks will generate profits or mitigate all the market and inventory risk associated with these activities. If Keyera hedges its commodity price exposure, it may forego the benefits that may otherwise be experienced if commodity prices were to change and it is subject to credit risks associated with the counterparties with whom it contracts. Refer to the section of this MD&A titled, “Segmented Results of Operations - Marketing: Risk Management”, for more information of Keyera’s risk management strategies. Operational Risk Keyera’s cash flows may be adversely affected by the occurrence of common hazards and environmental risks related to the natural gas gathering, processing and pipeline transportation business, such as the failure of equipment, systems or processes, operator error, labour disputes, disputes with owners of interconnected facilities, catastrophic events or acts of terrorism. To mitigate these operational and environmental risks, Keyera provides training to its employees, maintains written standard operating practices, formally assesses and documents employee competency, and maintains formal inspection, maintenance, safety and environmental programs. In addition, Keyera carries property, casualty and business interruption insurance, although there can be no assurance that the proceeds of such insurance will compensate Keyera fully for any losses, nor can it be assured that such insurance will be available in the future. For a further discussion of operational risks and the steps that Keyera takes to mitigate these risks, readers are referred to Keyera’s Annual Information Form which is available on SEDAR at www.sedar.com. Foreign Currency Risk Foreign currency risk arises on financial instruments that are denominated in a foreign currency. Keyera’s functional currency is the Canadian dollar. The Marketing segment has foreign currency risk associated with its sales and purchases denominated in U.S. dollars; however, the Gathering and Processing and Liquids Infrastructure segments have very little foreign currency risk as sales and purchases are primarily denominated in Canadian dollars. Foreign currency risk is actively managed by using forward currency contracts and cross currency swaps. Management monitors the exposure to foreign currency risk and regularly reviews its risk management strategies and all outstanding positions. Keyera is also exposed to foreign currency risk related to its U.S. dollar denominated long-term debt. To manage this currency exposure, Keyera has entered into cross currency swap contracts related to the

Keyera Corp. TSX: KEY 2020 Year End Report February 10, 2021
KEYERA CORP.
54
principal portion and future interest payments for substantially all of the U.S. dollar denominated debt. These cross currency swap contracts are discussed further in the “Liquidity and Capital Resources” section of this MD&A. Cyber Security There is a risk that failure of one or more technology systems could lead to failure of other systems. In addition, the risk of cyber-attacks in general are increasing. A breach in Keyera’s security or information technology could result in operational outages, financial loss, loss of material data, reputational harm and other adverse outcomes. These risks are somewhat mitigated through Keyera’s technology strategy that focuses on employing a multilayer security framework and incident management system to protect and detect issues within its information technology infrastructure. Risks related to the COVID-19 pandemic Keyera’s business operations and financial condition may be materially adversely affected by public health emergencies, including the COVID-19 pandemic, and related government responses. The risk of COVID-19 to Keyera includes the health and safety of its employees and contractors; the temporary suspension of operations in geographic locations in which Keyera operates; operational restrictions and restrictions on gatherings of individuals; delays in the completion, or deferral, of growth and expansion projects; counterparty credit risk; volatility in financial and commodity markets; and supply chain disruptions, all or any of which could materially adversely affect Keyera’s business operations and financial results. In the event that the spread (or fear of spreading) of COVID-19 and its variants continues, governments may increase or extend restrictions, directives, orders or regulations that could adversely affect Keyera’s operations, suppliers, customers, counterparties, shippers or partners, employee health, workforce productivity, insurance premiums and coverage, and ability to advance its existing and future growth projects or carry out its ongoing business plan. Keyera is monitoring recommendations from applicable government agencies and public health authorities to ensure the continued safe operation of its business operations and has implemented business continuity plans and steps to ensure the ongoing health of its workforce. However, such measures may not be effective, necessitating the closure of the affected facilities or projects. Such measures and mandates may increase Keyera’s expenses and limit, or potentially suspend, throughput volumes and processing handling capabilities at Keyera's facilities. Keyera has already deferred certain growth projects as a result of the COVID-19 pandemic and related market uncertainty that occurred in 2020. The full extent, effect and duration of the COVID-19 pandemic continues to be unknown and the degree to which it may affect Keyera’s business operations and financial results will depend on future developments, which are highly uncertain and cannot be predicted with any degree of confidence. Depending on the duration and severity of the COVID-19 pandemic, such events may increase the effect of the other risks described above, including, but not limited to, risks relating to the successful completion of Keyera’s growth and expansion projects and expected return on investments; its ability to maintain its credit ratings; restricted access to capital and increased borrowing costs; its ability to pay dividends and service obligations under its debt securities and other debt obligations; and otherwise complying with Keyera’s existing debt covenants. ENVIRONMENTAL REGULATION AND CLIMATE CHANGE Keyera is subject to a range of laws, regulations and requirements imposed by various levels of government and regulatory bodies in the jurisdictions in which it operates. While these legal controls and regulations affect numerous aspects of Keyera’s activities, including but not limited to, the operation of wells, pipelines and facilities, construction activities, transportation of dangerous goods, emergency response, operational safety and environmental matters, Keyera does not believe that they impact its operations in a manner materially different from other comparable businesses operating in the same jurisdictions.

Keyera Corp. TSX: KEY 2020 Year End Report February 10, 2021
KEYERA CORP.
55
The midstream industry is subject to provincial and federal environmental legislation and regulations. Among other things, the environmental regulatory regime provides for restrictions and prohibitions on releases or emissions of various substances produced in association with certain oil and natural gas industry operations. Environmental regulation affects the operation of facilities and limits the extent to which facility expansion is permitted. In addition, legislation requires that facility sites and pipelines be abandoned and reclaimed to the satisfaction of provincial authorities and local landowners. A breach of such legislation may result in the imposition of fines, the issuance of clean-up orders or the shutting down of facilities and pipelines. Greenhouse gases, mainly carbon dioxide and methane, are components of the raw natural gas processed and handled at Keyera’s facilities. Operations at Keyera’s facilities, including the combustion of fossil fuels in engines, turbines, heaters and boilers, release carbon dioxide, methane and other minor greenhouse gases. As such, Keyera is subject to various greenhouse gas reporting and reduction programs. Keyera uses engineering consulting firms and internal resources to compile inventories of greenhouse gas emissions and reports these inventories in accordance with federal and provincial programs. Third party audits or verifications of inventories are conducted for facilities that are required to meet regulatory targets. Keyera is closely monitoring the ongoing development and implementation of the regulatory framework through which the federal and provincial governments are implementing their climate change and emissions reduction policies.
Keyera’s year-over-year compliance costs are increasing as a result of the changes in emissions regulation and are expected to continue to increase. Overall, the increased costs are not expected to be material to Keyera; however, Keyera is looking at opportunities to reduce its costs and enhance the management of its emissions profile. For a detailed discussion of environmental regulations that affect Keyera, political and legislative developments as they relate to climate change and the risks associated therewith, see Keyera’s Annual Information Form which is available at www.sedar.com.
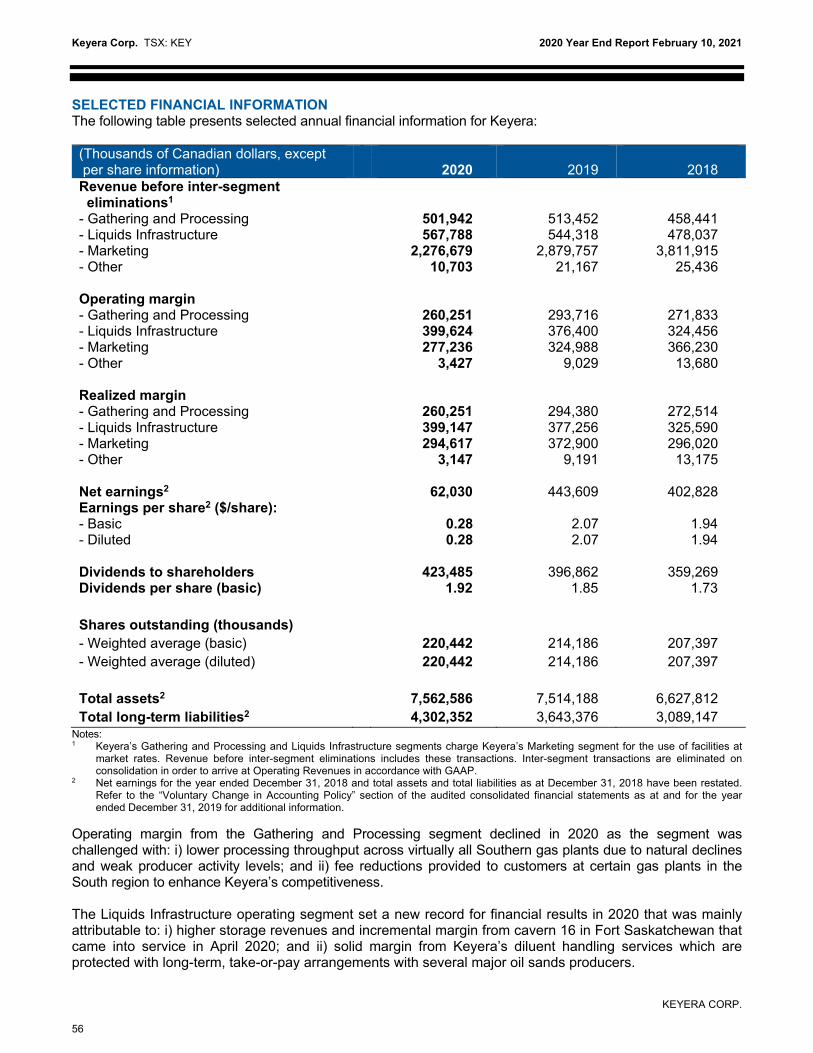
Keyera Corp. TSX: KEY 2020 Year End Report February 10, 2021
KEYERA CORP.
56
SELECTED FINANCIAL INFORMATION The following table presents selected annual financial information for Keyera: (Thousands of Canadian dollars, except per share information)
2020
2019
2018
Revenue before inter-segment eliminations1
- Gathering and Processing 501,942 513,452 458,441 - Liquids Infrastructure 567,788 544,318 478,037 - Marketing - Other
2,276,679 10,703
2,879,757 21,167
3,811,915 25,436
Operating margin - Gathering and Processing 260,251 293,716 271,833 - Liquids Infrastructure 399,624 376,400 324,456 - Marketing - Other
277,236 3,427
324,988 9,029
366,230 13,680
Realized margin - Gathering and Processing 260,251 294,380 272,514 - Liquids Infrastructure 399,147 377,256 325,590 - Marketing - Other
294,617 3,147
372,900 9,191
296,020 13,175
Net earnings2 62,030 443,609 402,828 Earnings per share2 ($/share): - Basic 0.28 2.07 1.94 - Diluted 0.28 2.07 1.94 Dividends to shareholders 423,485 396,862 359,269 Dividends per share (basic) 1.92 1.85 1.73 Shares outstanding (thousands) - Weighted average (basic) 220,442 214,186 207,397 - Weighted average (diluted) 220,442 214,186 207,397 Total assets2 7,562,586 7,514,188 6,627,812 Total long-term liabilities2 4,302,352 3,643,376 3,089,147
Notes: 1 Keyera’s Gathering and Processing and Liquids Infrastructure segments charge Keyera’s Marketing segment for the use of facilities at
market rates. Revenue before inter-segment eliminations includes these transactions. Inter-segment transactions are eliminated on consolidation in order to arrive at Operating Revenues in accordance with GAAP.
2 Net earnings for the year ended December 31, 2018 and total assets and total liabilities as at December 31, 2018 have been restated. Refer to the “Voluntary Change in Accounting Policy” section of the audited consolidated financial statements as at and for the year ended December 31, 2019 for additional information.
Operating margin from the Gathering and Processing segment declined in 2020 as the segment was challenged with: i) lower processing throughput across virtually all Southern gas plants due to natural declines and weak producer activity levels; and ii) fee reductions provided to customers at certain gas plants in the South region to enhance Keyera’s competitiveness. The Liquids Infrastructure operating segment set a new record for financial results in 2020 that was mainly attributable to: i) higher storage revenues and incremental margin from cavern 16 in Fort Saskatchewan that came into service in April 2020; and ii) solid margin from Keyera’s diluent handling services which are protected with long-term, take-or-pay arrangements with several major oil sands producers.

Keyera Corp. TSX: KEY 2020 Year End Report February 10, 2021
KEYERA CORP.
57
The Marketing segment generated solid financial results in 2020 due to: i) an effective risk management program that protected margins from the significant decline in commodity prices resulting from the COVID-19 pandemic; ii) robust iso-octane margins during the first quarter of the year due to strong product premiums and low butane feedstock costs that continued from the second half of 2019; and iii) effective utilization of Keyera’s infrastructure including storage, fractionation and transportation capabilities. SUMMARY OF QUARTERLY RESULTS The following table presents selected financial information for Keyera:
Dec 31, 2020
Sep 30, 2020
June 30, 2020
Mar 31, 2020
Dec 31, 2019
Sep 30, 2019
June 30, 2019
Mar 31, 2019
Revenue1 Gathering and Processing
139,826
108,486
124,871
128,759
143,736
133,057
120,012
116,647
Liquids Infrastructure 148,487 138,630 135,884 144,787 142,885 137,657 130,955 132,821 Marketing 513,581 546,067 343,868 873,163 783,899 644,141 785,736 665,981 Other 2,892 2,700 1,625 3,486 5,772 3,338 5,570 6,487
Operating margin (loss)
Gathering and Processing
76,965
49,404
69,411
64,471
80,878
74,803
69,713
68,322
Liquids Infrastructure 98,330 99,579 99,593 102,122 91,305 98,085 92,560 94,450 Marketing (12,039) 52,355 (9,103) 246,023 87,375 138,262 117,479 (18,128) Other 2,257 1,209 (106) 67 2,883 252 2,513 3,381
Operating margin 165,513 202,547 159,795 412,683 262,441 311,402 282,265 148,025 Realized margin2
Gathering and Processing
76,965 49,404 69,411
64,471
80,910
74,851
69,707
68,912
Liquids Infrastructure 97,609 99,223 99,233 103,082 91,628 98,535 92,655 94,438 Marketing 11,153 64,256 54,184 165,024 120,008 115,734 114,687 22,471 Other 1,785 1,086 (96) 372 2,913 388 2,531 3,359
Realized margin2 187,512 213,969 222,732 332,949 295,459 289,508 279,580 189,180 Net (loss) earnings3 (74,777) 33,436 17,763 85,608 29,718 154,428 224,511 34,952 Net (loss) earnings per share3 ($/share)
Basic (0.34) 0.15 0.08 0.39 0.14 0.72 1.05 0.17 Diluted (0.34) 0.15 0.08 0.39 0.14 0.72 1.05 0.17
Weighted average common shares (basic) 221,023 221,023 220,851 218,860 216,938 215,016 213,239 211,480 Weighted average common shares (diluted) 221,023 221,023 220,851 218,860 216,938 215,016 213,239 211,480 Dividends declared to shareholders
106,091
106,091
106,091
105,212
104,280
101,198
96,085
95,299
Notes: 1 Keyera’s Gathering and Processing and Liquids Infrastructure segments charge Keyera’s Marketing segment for the use of facilities at
market rates. Revenue before inter-segment eliminations reflects these transactions. Inter-segment transactions are eliminated on consolidation in order to arrive at operating revenues in accordance with GAAP.
2 Realized margin is defined as operating margin excluding unrealized gains and losses on commodity-related risk management contracts. Realized margin is not a standard measure under GAAP. See “Non-GAAP Financial Measures” and see the section titled, “Segmented Results of Operations: Marketing”, for a reconciliation of operating margin to realized margin as it relates to the Marketing segment. Realized margin for the two facilities segments (Gathering and Processing and Liquids Infrastructure) and the Corporate and Other segment excludes $1,193 of unrealized gains from commodity-related risk management contracts for the three months ended December 31, 2020 (three months ended December 31, 2019 – $385 unrealized losses).
3 Comparative March 31, 2019, June 30, 2019 and September 30, 2019 periods have been restated. Refer to the “Voluntary Change in Accounting Policy” section of the audited consolidated financial statements as at and for the year ended December 31, 2019 for additional information.
For the periods in the table above, Keyera’s results were affected by the following factors and trends:
incremental margin from new investments including the 16th underground storage cavern in Fort Saskatchewan, the Base Line Terminal, the Wapiti gas plant and related infrastructure, and the Pipestone liquids hub and gas plant;

Keyera Corp. TSX: KEY 2020 Year End Report February 10, 2021
KEYERA CORP.
58
declining volumes and fees for certain gas plants in the south region of the Gathering and Processing segment that has led to asset impairments;
growth in demand for diluent handling services in the Liquids Infrastructure segment backed by long-term, take-or-pay contracts with credit worthy counterparties;
strong demand and market fundamentals for iso-octane in the Marketing segment prior to the second quarter of 2020;
a prudent and effective risk management program; and
a steady increase in dividends declared to shareholders.
See the section of this MD&A titled “Segmented Results of Operations”, for more information on the financial results of Keyera’s operating segments for the year ended December 31, 2020. ADOPTION OF NEW AND AMENDED STANDARDS There were no new IFRS standards adopted by Keyera during the year ended December 31, 2020. FUTURE ACCOUNTING PRONOUNCEMENTS There were no significant new accounting standards or interpretations issued during the year ended December 31, 2020. CONTROL ENVIRONMENT Disclosure Controls and Procedures The Chief Executive Officer and the Chief Financial Officer are satisfied that, as of December 31, 2020, Keyera’s disclosure controls and procedures are designed to provide reasonable assurance that material information relating to Keyera and its consolidated subsidiaries has been brought to their attention and that information required to be disclosed pursuant to applicable securities legislation has been recorded, processed, summarized and reported in an appropriate and timely manner. Internal Controls Over Financial Reporting The Chief Executive Officer and the Chief Financial Officer are satisfied that Keyera’s internal controls over financial reporting are designed to provide reasonable assurance regarding the reliability of financial reporting and the preparation of financial statements for external purposes in accordance with GAAP. No changes were made for the period beginning January 1, 2020 and ending December 31, 2020 that have materially affected, or are reasonably likely to materially affect Keyera’s internal controls over financial reporting. COMMON SHARES There were 3,107,080 common shares issued under the DRIP and the Premium DRIP for consideration of $77 million, bringing the total common shares outstanding at December 31, 2020 to 221,022,873. Subsequent to December 31, 2020, no common shares were issued to shareholders due to the discontinuation of the DRIP and Premium DRIP programs.
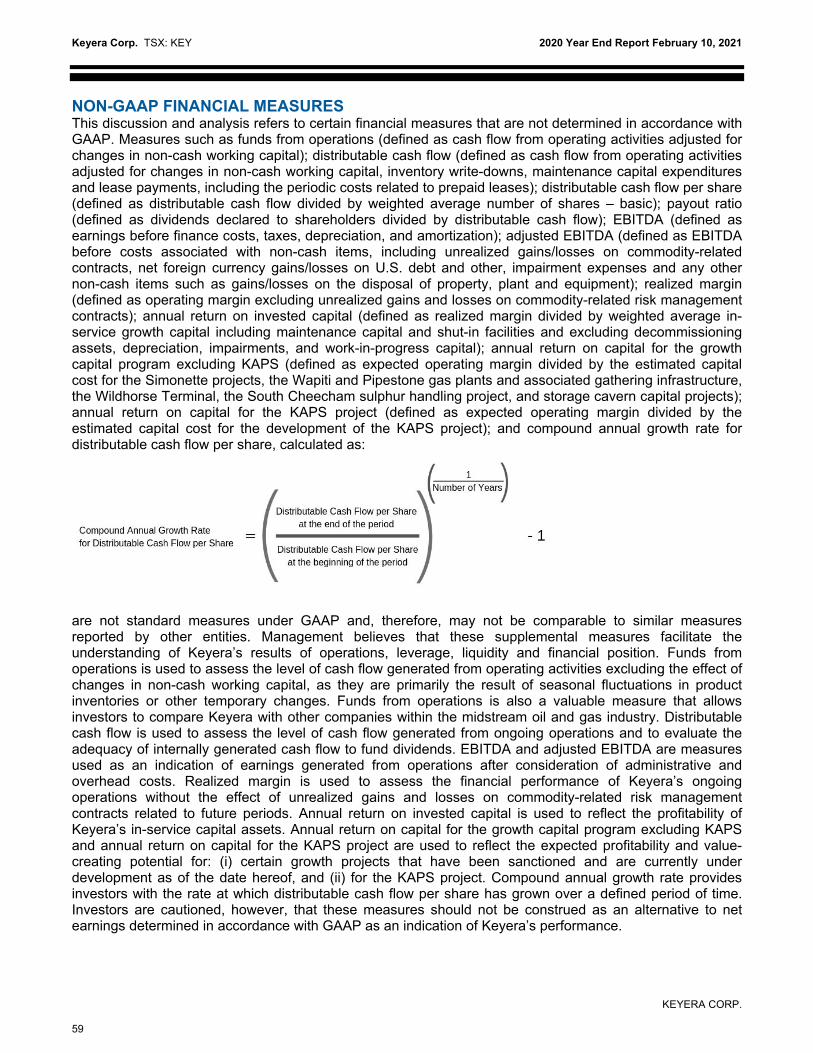
Keyera Corp. TSX: KEY 2020 Year End Report February 10, 2021
KEYERA CORP.
59
NON-GAAP FINANCIAL MEASURES This discussion and analysis refers to certain financial measures that are not determined in accordance with GAAP. Measures such as funds from operations (defined as cash flow from operating activities adjusted for changes in non-cash working capital); distributable cash flow (defined as cash flow from operating activities adjusted for changes in non-cash working capital, inventory write-downs, maintenance capital expenditures and lease payments, including the periodic costs related to prepaid leases); distributable cash flow per share (defined as distributable cash flow divided by weighted average number of shares – basic); payout ratio (defined as dividends declared to shareholders divided by distributable cash flow); EBITDA (defined as earnings before finance costs, taxes, depreciation, and amortization); adjusted EBITDA (defined as EBITDA before costs associated with non-cash items, including unrealized gains/losses on commodity-related contracts, net foreign currency gains/losses on U.S. debt and other, impairment expenses and any other non-cash items such as gains/losses on the disposal of property, plant and equipment); realized margin (defined as operating margin excluding unrealized gains and losses on commodity-related risk management contracts); annual return on invested capital (defined as realized margin divided by weighted average in-service growth capital including maintenance capital and shut-in facilities and excluding decommissioning assets, depreciation, impairments, and work-in-progress capital); annual return on capital for the growth capital program excluding KAPS (defined as expected operating margin divided by the estimated capital cost for the Simonette projects, the Wapiti and Pipestone gas plants and associated gathering infrastructure, the Wildhorse Terminal, the South Cheecham sulphur handling project, and storage cavern capital projects); annual return on capital for the KAPS project (defined as expected operating margin divided by the estimated capital cost for the development of the KAPS project); and compound annual growth rate for distributable cash flow per share, calculated as:
are not standard measures under GAAP and, therefore, may not be comparable to similar measures reported by other entities. Management believes that these supplemental measures facilitate the understanding of Keyera’s results of operations, leverage, liquidity and financial position. Funds from operations is used to assess the level of cash flow generated from operating activities excluding the effect of changes in non-cash working capital, as they are primarily the result of seasonal fluctuations in product inventories or other temporary changes. Funds from operations is also a valuable measure that allows investors to compare Keyera with other companies within the midstream oil and gas industry. Distributable cash flow is used to assess the level of cash flow generated from ongoing operations and to evaluate the adequacy of internally generated cash flow to fund dividends. EBITDA and adjusted EBITDA are measures used as an indication of earnings generated from operations after consideration of administrative and overhead costs. Realized margin is used to assess the financial performance of Keyera’s ongoing operations without the effect of unrealized gains and losses on commodity-related risk management contracts related to future periods. Annual return on invested capital is used to reflect the profitability of Keyera’s in-service capital assets. Annual return on capital for the growth capital program excluding KAPS and annual return on capital for the KAPS project are used to reflect the expected profitability and value-creating potential for: (i) certain growth projects that have been sanctioned and are currently under development as of the date hereof, and (ii) for the KAPS project. Compound annual growth rate provides investors with the rate at which distributable cash flow per share has grown over a defined period of time. Investors are cautioned, however, that these measures should not be construed as an alternative to net earnings determined in accordance with GAAP as an indication of Keyera’s performance.

Keyera Corp. TSX: KEY 2020 Year End Report February 10, 2021
KEYERA CORP.
60
FORWARD-LOOKING INFORMATION In order to provide readers with information regarding Keyera, including its assessment of future plans and operations, its financial outlook and future prospects overall, this MD&A contains certain statements that constitute “forward-looking information” within the meaning of applicable Canadian securities legislation (collectively, “forward-looking information”). Forward-looking information is typically identified by words such as “anticipate”, “continue”, “estimate”, “expect”, “may”, “will”, “project”, “should”, “plan”, “intend”, “believe”, and similar words or expressions, including the negatives or variations thereof. All statements other than statements of historical fact contained in this document are forward-looking information, including, without limitation, statements regarding:
industry, market and economic conditions and any anticipated effects on Keyera; Keyera’s future financial position and operational performance and future financial contributions and
margins from its business segments including, but not limited to, Keyera’s expectation that its Marketing business will contribute, on average, a “base realized margin” of between $180 million and $220 million annually;
estimated costs and benefits associated with reductions in operating and G&A expenses and optimization of gas plants, estimated maintenance and turnaround costs and estimated decommissioning expenses;
the expectation that demand for Keyera’s liquid infrastructure service offerings will remain strong; future dividends and taxes; business strategy, anticipated growth and plans of management; budgets, including future growth capital, operating and other expenditures and projected costs; estimated utilization rates and throughputs; expected costs, in-service dates and schedules for capital projects (including projects under
construction/development and proposed projects) and sources of funding for such projects; Keyera’s expectation that its growth capital program will earn an annual rate on capital of 10% to
15% in 2022, once all projects achieve their annual run rate; anticipated timing for future revenue streams and optimization plans; treatment of Keyera and its projects under existing and proposed governmental regulatory regimes; the operation and effectiveness of risk management programs, including, but not limited to, Keyera’s
expectation that realized hedging losses in Q4 2020 will be more than offset by gains realized from the physical sale of inventory in Q1 2021;
expected outcomes with respect to legal proceedings and potential insurance recoveries; expectations regarding Keyera’s ability to maintain its competitive position, raise capital and add to
its assets through acquisitions or internal growth opportunities; expectations as to the financial impact of Keyera’s compliance with future environmental and carbon
tax regulation; and the expected impact of the COVID-19 pandemic on Keyera and the economy generally.
All forward-looking information reflects Keyera’s beliefs and assumptions based on information available at the time the applicable forward-looking information is made and in light of Keyera’s current expectations with respect to such things as the outlook for general economic trends, industry trends, commodity prices, Keyera’s access to the capital markets and the cost of raising capital, the integrity and reliability of Keyera’s assets, and the governmental, regulatory and legal environment. Keyera’s expectation as to the “base realized margin” to be contributed by its Marketing segment assumes: (i) AEF operates near capacity; (ii) butane feedstock costs are comparable to the 2018 contract year; (iii) there are no significant logistical or transportation curtailments; and (iv) producers deliver their volumes according to plan. Keyera’s expectation that its $2.2 billion growth capital program will earn an annual return on capital of 10% to 15% in 2022, once all projects achieve their annual run rate assuming all the projects are completed on a timely basis and energy demand and commodity prices continue to stabilize. For all construction projects, estimated completion times and costs assume that construction proceeds as planned on schedule and on budget and that, where required, all regulatory approvals and other third-party approvals or consents are received on a timely basis. In some instances, this MD&A may also contain forward-looking information attributed to third parties. Forward-looking information does not guarantee future performance. Management believes that its assumptions and expectations reflected in the forward-looking information contained herein are reasonable

Keyera Corp. TSX: KEY 2020 Year End Report February 10, 2021
KEYERA CORP.
61
based on the information available on the date such information is provided and the process used to prepare the information. However, it cannot assure readers that these expectations will prove to be correct.
All forward-looking information is subject to known and unknown risks, uncertainties and other factors that may cause actual results, events, levels of activity and achievements to differ materially from those anticipated in the forward-looking information. Such risks, uncertainties and other factors include, without limitation, the following:
Keyera’s ability to implement its strategic priorities and business plan and achieve the expected benefits;
general industry, market and economic conditions; activities of customers, producers and other facility owners; operational hazards and performance; the effectiveness of Keyera’s risk management programs; competition; changes in commodity composition and prices, inventory levels, supply/demand trends and other
market conditions and factors; processing and marketing margins; climate change risks, including the effects of unusual weather and natural catastrophes; climate change effects and regulatory and market compliance and other costs associated with
climate change; variables associated with capital projects, including the potential for increased costs, timing, delays,
cooperation of partners, and access to capital no favourable terms; fluctuations in interest, tax and foreign currency exchange rates; counterparty performance and credit risk; changes in operating and capital costs; cost and availability of financing; ability to expand, update and adapt infrastructure on a timely and effective basis; decommissioning, abandonment and reclamation costs; reliance on key personnel and third parties; relationships with external stakeholders, including Indigenous stakeholders; technology, security and cybersecurity risks; potential litigation and disputes; uninsured and underinsured losses; ability to service debt and pay dividends; changes in credit ratings; reputational risks; changes in environmental and other laws and regulations; actions by governmental authorities; and global health crisis, such as pandemics and epidemics, including the COVID-19 pandemic and the
unexpected impact related thereto;
and other risks, uncertainties and other factors, many of which are beyond the control of Keyera, and some of which are discussed under “Risk Factors” herein and in Keyera’s Annual Information Form. Further, because there is interconnectivity between many of the risks Keyera faces, it is possible that different constellations of risk could materialize which could result in unanticipated outcomes or consequences. Proposed construction and completion schedules and budgets for capital projects described herein are subject to many variables, including weather; availability and prices of materials; labour; customer project schedules and expected in-service dates; contractor productivity; contractor disputes; quality of cost estimating; decision processes and approvals by joint venture partners; changes in project scope at the time of project sanctioning; regulatory approvals, conditions or delays; Keyera’s ability to secure adequate land rights and water supply; and macro socio-economic trends. As a result, expected timing, costs and benefits associated with these projects may differ materially from the descriptions contained herein. Further, some of the projects described are subject to securing sufficient producer/customer interest and may not proceed if sufficient commitments are not obtained. In addition to the factors referenced above, Keyera’s expectations
Keyera Corp. TSX: KEY 2020 Year End Report February 10, 2021
KEYERA CORP.
62
with respect to future returns associated with: (i) the growth capital projects that have been sanctioned and are in development as of the date hereof, and (ii) the KAPS project, are based on a number of assumptions, estimates and projections that have been developed based on past experience and anticipated trends, including but not limited to: capital cost estimates assuming no material unforeseen costs; timing for completion of growth capital projects; customer performance of contractual obligations; reliability of production profiles; commodity prices, margins and volumes; tax and interest rates; availability of capital at attractive prices; and no changes in regulatory or approval requirements, including no delay in securing any outstanding regulatory approvals.
Readers are cautioned that the foregoing list of important factors is not exhaustive and they should not unduly rely on the forward-looking information included in this MD&A. Further, readers are cautioned that the forward-looking information contained herein is made as of the date of this MD&A. Unless required by law, Keyera does not intend and does not assume any obligation to update any forward-looking information. All forward-looking information contained in this MD&A is expressly qualified by this cautionary statement. Further information about the factors affecting forward-looking information and management’s assumptions and analysis thereof, is available in filings made by Keyera with Canadian provincial securities commissions available on SEDAR at www.sedar.com.

Keyera Corp. TSX: KEY 2020 Year End Report February 10, 2021
KEYERA CORP.
63
Investor Information DIVIDENDS TO SHAREHOLDERS Dividends declared to shareholders of Keyera were $0.48 per share in the fourth quarter of 2020. TAXABILITY OF DIVIDENDS Keyera’s dividends are considered to be eligible dividends for the purpose of the Income Tax Act (Canada). For non-resident shareholders, Keyera’s dividends are subject to Canadian withholding tax. SUPPLEMENTARY INFORMATION A breakdown of Keyera’s operational and financial results, including volumetric and operating margin information by business segment, is available on our website at www.keyera.com/ir/reports. YEAR-END AND FOURTH QUARTER 2020 RESULTS CONFERENCE CALL AND WEBCAST Keyera will be conducting a conference call and webcast for investors, analysts, brokers and media representatives to discuss the financial results for the fourth quarter and year-end of 2020 at 8:00 a.m. Mountain Time (10:00 a.m. Eastern Time) on Wednesday, February 10, 2021. Callers may participate by dialing 888-231-8191 or 647-427-7450. A recording of the call will be available for replay until 10:00 p.m. Mountain Time (12:00 a.m. Eastern Time) on February 24, 2021 by dialing 855-859-2056 or 416-849-0833 and entering pass code 1489089. Internet users can listen to the call live on Keyera’s website at www.keyera.com/news/events. Shortly after the call, an audio archive will be posted on the website for 90 days. QUESTIONS We welcome questions from interested parties. Calls should be directed to Keyera’s Investor Relations Department at 403-205-7670, toll free at 1-888-699-4853 or via email at [email protected]. Information about Keyera can also be found on our website at www.keyera.com.

KEYERA CORP.
64
MANAGEMENT’S RESPONSIBILITY FOR FINANCIAL REPORTING The management of Keyera Corp. (the “Company”) is responsible for the preparation of the financial statements. The consolidated financial statements have been prepared in accordance with International Financial Reporting Standards as issued by the International Accounting Standards Board and include certain estimates that reflect management’s best estimates and judgments. Management has determined such amounts on a reasonable basis in order to ensure that the financial statements are presented fairly in all material respects. Management has developed and maintains an extensive system of internal accounting controls that provide reasonable assurance that all transactions are accurately recorded, that the financial statements realistically report the Company’s operating and financial results, and that the Company’s assets are safeguarded. Management believes that this system of internal controls has operated effectively for the year ended December 31, 2020. The Company has effective disclosure controls and procedures to ensure timely and accurate disclosure of material information relating to the Company which complies with the requirements of Canadian securities legislation. Deloitte LLP, an independent firm of chartered professional accountants, was appointed by a resolution of the Board of Directors to audit the financial statements of the Company and to provide an independent professional opinion. Deloitte LLP was appointed to hold such office until the next such annual meeting of the shareholders of the Company. The Board of Directors, through its Audit Committee, has reviewed the financial statements including notes thereto with management and Deloitte LLP. The members of the Audit Committee are composed of independent directors who are not employees of the Company. The Board of Directors has approved the information contained in the financial statements based on the recommendation of the Audit Committee. /s/ C. Dean Setoguchi /s/ Eileen Marikar C. Dean Setoguchi Eileen Marikar Chief Executive Officer Chief Financial Officer Keyera Corp. Keyera Corp. February 9, 2021 Calgary, Alberta
65
Deloitte LLP 700, 850 2 Street SW Calgary, AB T2P 0R8 Canada Tel: 403-267-1700 Fax: 587-774-5379 www.deloitte.ca
Independent Auditor’s Report To the Shareholders of Keyera Corp.:
Opinion We have audited the consolidated financial statements of Keyera Corp. (the “Company”), which comprise the consolidated statements of financial position as at December 31, 2020 and 2019, and the consolidated statements of net earnings and comprehensive income, changes in equity and cash flows for the years then ended, and notes to the consolidated financial statements, including a summary of significant accounting policies (collectively referred to as the “financial statements”).
In our opinion, the accompanying financial statements present fairly, in all material respects, the financial position of the Company as at December 31, 2020 and 2019, and its financial performance and its cash flows for the years then ended in accordance with International Financial Reporting Standards (“IFRS”).
Basis for Opinion We conducted our audit in accordance with Canadian generally accepted auditing standards (“Canadian GAAS”). Our responsibilities under those standards are further described in the Auditor’s Responsibilities for the Audit of the Financial Statements section of our report. We are independent of the Company in accordance with the ethical requirements that are relevant to our audit of the financial statements in Canada, and we have fulfilled our other ethical responsibilities in accordance with these requirements. We believe that the audit evidence we have obtained is sufficient and appropriate to provide a basis for our opinion.
Key Audit Matters Key audit matters are those matters that, in our professional judgment, were of most significance in our audit of the consolidated financial statements for the year ended December 31, 2020. These matters were addressed in the context of our audit of the consolidated financial statements as a whole, and in forming our opinion thereon, and we do not provide a separate opinion on these matters.
Property, Plant and Equipment —Alder Flats Gas Plant within the Central Foothills Cash Generating Unit (“identified asset”) — Refer to Notes 3 and 9 to the financial statements
Key Audit Matter Description
The Company assesses property, plant and equipment for impairment whenever events or changes in circumstances indicate that the carrying value of an asset may not be recoverable. The Company’s assessment of impairment involves the comparison of the recoverable amount of each asset to its carrying value. The Company used the discounted cash flow model to estimate the recoverable amount, which requires management to make significant estimates and assumptions. Changes in these assumptions could have a significant impact on either the recoverable amount, the amount of any impairment charge, or both. As at December 31, 2020, the carrying amount of the identified asset exceeded its recoverable amount, which resulted in an impairment charge to property, plant and equipment for the identified asset.

66
While there are several key estimates and assumptions that are required to estimate the recoverable amount of the identified asset, the assumptions with the highest degree of subjectivity and impact on the recoverable amount are forecast operating margin and discount rate. This required a high degree of auditor attention as these estimates and assumptions are subject to estimation uncertainty and auditing them required auditor judgment in applying audit procedures and in evaluating the results of those procedures. This resulted in an increased extent of audit effort including the involvement of fair value specialists.
How the Key Audit Matter Was Addressed in the Audit
Our audit procedures related to the forecast operating margin and discount rate used to estimate the recoverable amount of the identified asset included the following, among others:
Evaluated management’s ability to accurately forecast operating margins by comparing actual results to management’s historical forecasts.
Evaluated the reasonableness of forecast operating margin by comparing the forecasts to:
o Historical operating margins;
o Internal communications to management and the Board of Directors; and
o Whether these assumptions were consistent with evidence obtained in other areas of the audit.
With the assistance of fair value specialists:
o Evaluated the reasonableness of the discount rate by testing the source information underlying the determination of management’s discount rate and developing a range of independent estimates and comparing those to the discount rate selected by management; and
o Assessed management’s estimate of the recoverable amount by comparing management’s implied valuation multiple to market multiples for comparable entities.
Other Information Management is responsible for the other information. The other information comprises:
Management’s Discussion and Analysis; and
The information, other than the financial statements and our auditor’s report thereon, in the 2020 Year-End Report
Our opinion on the financial statements does not cover the other information and we do not express any form of assurance conclusion thereon. In connection with our audit of the financial statements, our responsibility is to read the other information identified above and, in doing so, consider whether the other information is materially inconsistent with the financial statements or our knowledge obtained in the audit, or otherwise appears to be materially misstated.
We obtained Management’s Discussion and Analysis and the 2020 Year-End Report prior to the date of this auditor’s report. If, based on the work we have performed on this other information, we conclude that there is a material misstatement of this other information, we are required to report that fact in this auditor’s report. We have nothing to report in this regard.

67
Responsibilities of Management and Those Charged with Governance for the Financial Statements Management is responsible for the preparation and fair presentation of the financial statements in accordance with IFRS, and for such internal control as management determines is necessary to enable the preparation of financial statements that are free from material misstatement, whether due to fraud or error.
In preparing the financial statements, management is responsible for assessing the Company’s ability to continue as a going concern, disclosing, as applicable, matters related to going concern and using the going concern basis of accounting unless management either intends to liquidate the Company or to cease operations, or has no realistic alternative but to do so.
Those charged with governance are responsible for overseeing the Company’s financial reporting process. Auditor’s Responsibilities for the Audit of the Financial Statements Our objectives are to obtain reasonable assurance about whether the financial statements as a whole are free from material misstatement, whether due to fraud or error, and to issue an auditor’s report that includes our opinion. Reasonable assurance is a high level of assurance, but is not a guarantee that an audit conducted in accordance with Canadian GAAS will always detect a material misstatement when it exists. Misstatements can arise from fraud or error and are considered material if, individually or in the aggregate, they could reasonably be expected to influence the economic decisions of users taken on the basis of these financial statements.
As part of an audit in accordance with Canadian GAAS, we exercise professional judgment and maintain professional skepticism throughout the audit. We also:
Identify and assess the risks of material misstatement of the financial statements, whether due to fraud or error, design and perform audit procedures responsive to those risks, and obtain audit evidence that is sufficient and appropriate to provide a basis for our opinion. The risk of not detecting a material misstatement resulting from fraud is higher than for one resulting from error, as fraud may involve collusion, forgery, intentional omissions, misrepresentations, or the override of internal control.
Obtain an understanding of internal control relevant to the audit in order to design audit procedures that are appropriate in the circumstances, but not for the purpose of expressing an opinion on the effectiveness of the Company’s internal control.
Evaluate the appropriateness of accounting policies used and the reasonableness of accounting estimates and related disclosures made by management.
Conclude on the appropriateness of management’s use of the going concern basis of accounting and, based on the audit evidence obtained, whether a material uncertainty exists related to events or conditions that may cast significant doubt on the Company’s ability to continue as a going concern. If we conclude that a material uncertainty exists, we are required to draw attention in our auditor’s report to the related disclosures in the financial statements or, if such disclosures are inadequate, to modify our opinion. Our conclusions are based on the audit evidence obtained up to the date of our auditor’s report. However, future events or conditions may cause the Company to cease to continue as a going concern.
Evaluate the overall presentation, structure and content of the financial statements, including the disclosures, and whether the financial statements represent the underlying transactions and events in a manner that achieves fair presentation.
We communicate with those charged with governance regarding, among other matters, the planned scope and timing of the audit and significant audit findings, including any significant deficiencies in internal control that we identify during our audit.
We also provide those charged with governance with a statement that we have complied with relevant ethical requirements regarding independence, and to communicate with them all relationships and other matters that may reasonably be thought to bear on our independence, and where applicable, related safeguards.

68
From the matters communicated with those charged with governance, we determine those matters that were of most significance in the audit of the consolidated financial statements of the current period and are therefore the key audit matters. We describe these matters in our auditor's report unless law or regulation precludes public disclosure about the matter or when, in extremely rare circumstances, we determine that a matter should not be communicated in our report because the adverse consequences of doing so would reasonably be expected to outweigh the public interest benefits of such communication.
The engagement partner on the audit resulting in this independent auditor’s report is Mandeep Singh.
/s/ Deloitte LLP
Chartered Professional Accountants Calgary, Alberta
February 9, 2021

Keyera Corp. TSX: KEY 2020 Year End Report February 10, 2021
KEYERA CORP.
69
Keyera Corp. Consolidated Statements of Financial Position (Thousands of Canadian dollars)
December 31, December 31,
As at Note 2020 2019 ASSETS
Cash 2,901 9,314 Trade and other receivables 6 447,723 488,587 Derivative financial instruments 22 20,625 54,144 Inventory 7 162,823 93,682 Other assets 8 12,778 10,550 Total current assets 646,850 656,277
Derivative financial instruments 22 93,632 95,891 Property, plant and equipment 9 6,401,185 6,365,832 Right-of-use assets 10 264,278 241,452 Intangible assets 71,320 80,149 Goodwill 11 55,761 55,761 Deferred tax assets 17 29,560 18,826 Total assets 7,562,586 7,514,188
LIABILITIES AND EQUITY
Trade and other payables, and provisions 12 369,622 560,338 Derivative financial instruments 22 42,438 31,213 Dividends payable 35,364 34,867 Current portion of long-term debt 13 — 135,540 Current portion of decommissioning liability 14 15,520 16,533 Current portion of lease liabilities 15 36,082 38,470 Total current liabilities 499,026 816,961
Credit facilities 13 280,000 90,000 Long-term debt 13 2,940,701 2,548,468 Decommissioning liability 14 282,658 233,220 Long-term lease liabilities 15 175,842 209,987 Other long-term liabilities 16 10,684 16,912 Deferred tax liabilities 17 612,467 544,789 Total liabilities 4,801,378 4,460,337
Equity Share capital 18 3,150,104 3,073,200 Accumulated deficit (379,477) (18,022) Accumulated other comprehensive loss (9,419) (1,327) Total equity 2,761,208 3,053,851 Total liabilities and equity 7,562,586 7,514,188 See accompanying notes to the consolidated financial statements. Commitments and contingencies (note 32) These consolidated financial statements were approved by the board of directors of Keyera Corp. on February 9, 2021.
(Signed) Michael Norris (Signed) C. Dean Setoguchi Director Director

Keyera Corp. TSX: KEY 2020 Year End Report February 10, 2021
KEYERA CORP.
70
Keyera Corp. Consolidated Statements of Net Earnings and Comprehensive Income For the Years Ended December 31, (Thousands of Canadian dollars, except share information)
Note 2020 2019 Revenues 30 3,012,510 3,616,922 Expenses 30 (2,071,972) (2,612,789) Operating margin 940,538 1,004,133 General and administrative expenses 25 (97,795) (83,492) Finance costs 26 (131,507) (113,066) Depreciation, depletion and amortization expenses 27 (290,416) (278,292) Net foreign currency gain on U.S. debt and other 23 9,421 34,352 Long-term incentive plan recovery (expense) 21 1,122 (26,134) Impairment expense 9 (371,305) (77,095) Other 31 13,093 — Earnings before income tax 73,151 460,406 Income tax expense 17 (11,121) (16,797) Net earnings 62,030 443,609 Other comprehensive loss Foreign currency translation adjustment (8,092) (20,812) Comprehensive income 53,938 422,797 Earnings per share Basic earnings per share 19 0.28 2.07 Diluted earnings per share 19 0.28 2.07 See accompanying notes to the consolidated financial statements.

Keyera Corp. TSX: KEY 2020 Year End Report February 10, 2021
KEYERA CORP.
71
Keyera Corp. Consolidated Statements of Cash Flows For the Years Ended December 31, (Thousands of Canadian dollars)
Note 2020 2019
Cash provided by (used in): OPERATING ACTIVITIES Net earnings 62,030 443,609 Adjustments for items not affecting cash:
Finance costs 26 23,755 23,607 Depreciation, depletion and amortization expenses 27 290,416 278,292 Unrealized loss on derivative financial instruments 22 47,003 58,394 Unrealized gain on foreign exchange (37,988) (38,805) Inventory write-down 7 13,507 2,946 Deferred income tax expense (recovery) 17 56,025 (81,256) Impairment expense 9 371,305 77,095
Decommissioning liability expenditures 14 (15,617) (9,628) Changes in non-cash working capital 29 (122,263) 133,681 Net cash provided by operating activities 688,173 887,935 INVESTING ACTIVITIES Acquisitions 9 (1,870) (599) Capital expenditures 9 (592,294) (1,091,202) Prepaid lease asset 10 (66,166) — Proceeds on disposal of property, plant, and equipment 9 — 499 Changes in non-cash working capital 29 (87,977) (34,025) Net cash used in investing activities (748,307) (1,125,327) FINANCING ACTIVITIES Borrowings under credit facility 13, 29 560,000 810,000 Repayments under credit facility 13, 29 (370,000) (800,000) Proceeds from issuance of long-term debt 13, 29 400,000 600,000 Repayment of long-term debt 13, 29 (137,893) (126,019) Financing costs related to credit facility/long-term debt 13, 29 (2,807) (5,462) Issuance costs 18 (250) — Proceeds from issuance of shares related to DRIP 18 77,154 226,704 Lease payments 15, 29 (49,416) (52,647) Dividends paid to shareholders 20 (422,988) (393,567) Net cash provided by financing activities 53,800 259,009
Effect of exchange rate fluctuations on foreign cash held
(79)
(1,443) Net (decrease) increase in cash (6,413) 20,174 Cash (bank indebtedness) at the beginning of the year 9,314 (10,860) Cash at the end of the year 2,901 9,314
Income taxes paid in cash 63,373 64,044 Interest paid in cash 157,546 135,868 See accompanying notes to the consolidated financial statements.

Keyera Corp. TSX: KEY 2020 Year End Report February 10, 2021
KEYERA CORP.
72
Keyera Corp. Consolidated Statements of Changes in Equity (Thousands of Canadian dollars)
Share
Capital Accumulated
Deficit
Accumulated Other
Comprehensive Income (Loss) Total
(Note 18)
Balance at December 31, 20181 2,846,496 (64,769) 19,485 2,801,212 Common shares issued pursuant to dividend reinvestment plans 226,704 — — 226,704 Net earnings — 443,609 — 443,609 Dividends declared to shareholders — (396,862) — (396,862)Other comprehensive loss — — (20,812) (20,812)Balance at December 31, 2019 3,073,200 (18,022) (1,327) 3,053,851 Common shares issued pursuant to dividend reinvestment plans 77,154 — — 77,154 Issuance costs (250) — — (250)Net earnings — 62,030 — 62,030 Dividends declared to shareholders — (423,485) — (423,485) Other comprehensive loss — — (8,092) (8,092) Balance at December 31, 2020 3,150,104 (379,477) (9,419) 2,761,208
Note: 1 Effective December 31, 2019, Keyera voluntarily changed its accounting policy to utilize a credit-adjusted risk-free interest rate to calculate
the present value of its decommissioning liabilities. Previously, the company utilized a risk-free rate. The change in accounting policy was applied retrospectively. Refer to note 2 of the consolidated financial statements as at and for the year ended December 31, 2019 for additional details.
See accompanying notes to the consolidated financial statements.
Keyera Corp. TSX: KEY 2020 Year End Report February 10, 2021
KEYERA CORP.
Notes to annual consolidated financial statements 73 All amounts expressed in thousands of Canadian dollars, except as otherwise noted
Keyera Corp. Notes to Consolidated Financial Statements As at and for the years ended December 31, 2020 and 2019 (All amounts expressed in thousands of Canadian dollars, except as otherwise noted) 1. GENERAL BUSINESS DESCRIPTION
The operating subsidiaries of Keyera Corp. include Keyera Partnership (the “Partnership”), Keyera Energy Ltd. (“KEL”), Keyera Energy Inc. (“KEI”), Keyera Rimbey Ltd. (“KRL”), Keyera RP Ltd. (“KRPL”), Rimbey Pipeline Limited Partnership (“RPLP”), Alberta Diluent Terminal Ltd. (“ADT”) and Alberta EnviroFuels Inc. (“AEF”). Keyera Corp. and its subsidiaries are involved in the business of natural gas gathering and processing; transportation, storage and marketing of natural gas liquids (“NGLs”) and iso-octane in Canada and the United States (“U.S.”); the production of iso-octane; and liquids blending in Canada and the U.S. Keyera Corp. and its subsidiaries are collectively referred to herein as “Keyera”. The address of Keyera’s registered office and principal place of business is Suite 200, Sun Life Plaza West Tower, 144 – 4th Avenue S.W., Calgary, AB, Canada. Pursuant to its Articles of Amalgamation, Keyera Corp. is authorized to issue an unlimited number of common shares (the “Shares”). The Shares trade on the Toronto Stock Exchange under the symbol “KEY”. Keyera is approved to issue two classes of preferred shares (one class referred to as the “First Preferred Shares”, a second class referred to as the “Second Preferred Shares”), and collectively both classes being referred to as the “Preferred Shares”. Each are issuable in one or more series without par value and each with such rights, restrictions, designations and provisions as the board of directors may at any time and from time to time determine, subject to an aggregate maximum number of authorized Preferred Shares. No preferred shares had been issued as at December 31, 2020. Interests in Subsidiaries Keyera Corp. directly or indirectly owns 100% of the voting interests in all of its operating subsidiaries and is the managing partner of the Partnership, Keyera’s primary Canadian operating subsidiary.

Keyera Corp. TSX: KEY 2020 Year End Report February 10, 2021
KEYERA CORP.
Notes to annual consolidated financial statements 74 All amounts expressed in thousands of Canadian dollars, except as otherwise noted
The following diagram sets out the name and jurisdiction of formation of the operating subsidiaries of Keyera Corp. as of December 31, 2020.
The Partnership owns and operates the majority of Keyera’s Canadian assets and businesses. In accordance with the Partnership Agreement, the Partnership is authorized to carry on a number of business activities including: (i) directly or indirectly, alone or in conjunction with other persons, gathering, processing, transporting, delivering, fractionating, extracting, storing, blending, buying, selling, marketing, investing in, developing, producing, and disposing of natural gas, NGLs, iso-octane, crude oil, bitumen and other petroleum products (including any by-products associated with the foregoing), petroleum based solvents, and electricity; (ii) constructing, owning, operating, managing, acquiring and investing in facilities and infrastructure related to the foregoing; (iii) other business activities as the board of directors may determine; and (iv) all activities ancillary or incidental to any of the foregoing.
Keyera’s only Canadian assets that are not owned and operated by the Partnership are the Rimbey Pipeline, which is owned and operated by RPLP, and the Alberta Diluent Terminal, which is owned and operated by ADT.
Keyera Energy Inc. is Keyera’s U.S. operating subsidiary. It carries out Keyera’s NGL, iso-octane, liquids blending, and marketing activities in the United States.

Keyera Corp. TSX: KEY 2020 Year End Report February 10, 2021
KEYERA CORP.
Notes to annual consolidated financial statements 75 All amounts expressed in thousands of Canadian dollars, except as otherwise noted
Interests in Material Jointly Controlled Operations For all of the material jointly controlled operations below, Keyera recognizes its proportionate share of revenues, expenses, and property, plant and equipment.
Notes: 1 Operations were suspended in May 2020. 2 Operations were suspended in August 2020.
Name of Joint Arrangement Place of Business % Ownership Nature of Relationship
Alberta Crude Terminal Alberta 50% Rail Loading, Offloading and Storage
Alder Flats Gas Plant Alberta 70% Gathering and Processing Facilities
Base Line Terminal Alberta 50% Crude Oil Storage
Brazeau River Gas Plant Alberta 94% Gathering and Processing Facilities
Cynthia Gas Plant Alberta 94% Gathering and Processing Facilities
Keyera Fort Saskatchewan Facilities
Alberta 77% NGL Processing, Storage and Pipelines
Minnehik Buck Lake Gas Plant1
Alberta 80% Gathering and Processing Facilities
Norlite Pipeline Alberta 30% NGL Pipelines
Ricinus Gas Plant Alberta 71% Gathering and Processing Facilities
Rimbey Gas Plant Alberta 99% Gathering and Processing Facilities, NGL Processing, and Rail Loading
South Cheecham Rail and Truck Terminal
Alberta 50% Rail Loading, Offloading and Storage
South Grand Rapids Pipeline Alberta 50% NGL Pipelines
West Pembina Gas Plant2 Alberta 83% Gathering and Processing Facilities
Zeta Creek Gas Plant Alberta 60% Gathering and Processing Facilities

Keyera Corp. TSX: KEY 2020 Year End Report February 10, 2021
KEYERA CORP.
Notes to annual consolidated financial statements 76 All amounts expressed in thousands of Canadian dollars, except as otherwise noted
2. BASIS OF PREPARATION International Financial Reporting Standards (“IFRS”) are the generally accepted accounting principles in Canada (“GAAP”). As such, the accompanying consolidated financial statements were prepared in accordance with the respective IFRS. The consolidated financial statements have been prepared on the historical cost basis except for the following:
derivative financial instruments are measured at fair value; and liabilities for Keyera’s long-term incentive plan are measured at fair value.
The consolidated financial statements were authorized for issuance on February 9, 2021 by the board of directors. Adoption of new and amended IFRS standards There were no new IFRS standards adopted by Keyera during the year ended December 31, 2020.
3. SIGNIFICANT ACCOUNTING POLICIES
Principles of consolidation The consolidated financial statements include the accounts of Keyera and all of its subsidiaries. Subsidiaries are entities over which Keyera has control. Generally, control is achieved where Keyera has the power to govern the financial and operating policies of an entity so as to obtain benefits from its activities. The financial statements of subsidiaries are prepared for the same reporting period as Keyera, using consistent accounting policies. All intercompany accounts and transactions have been eliminated upon consolidation. Jointly controlled operations Jointly controlled operations are assets over which Keyera has joint ownership with one or more unaffiliated entities. Keyera undertakes a number of Gathering and Processing and Liquids Infrastructure activities through jointly controlled operations.
Jointly controlled operations are accounted for using the proportionate consolidation method as follows:
the consolidated statements of financial position includes Keyera’s share of the assets that it controls jointly and the liabilities for which it is jointly responsible; and
the consolidated statements of net earnings and comprehensive income includes Keyera’s share
of the income and expenses generated by the jointly controlled operation.
Business combinations Business combinations are accounted for using the acquisition method. Assets and liabilities acquired in a business combination and any contingent consideration are measured at their fair values as of the date of acquisition and subsequently remeasured at fair value with changes recorded through the consolidated statements of net earnings and comprehensive income each period until settled. In addition, acquisition related and restructuring costs are recognized separately from the business combination and are expensed to the consolidated statements of net earnings and comprehensive income. Business combinations also applies to the acquisition of an interest in a joint operation in which the activity of the joint operation constitutes a business.

Keyera Corp. TSX: KEY 2020 Year End Report February 10, 2021
KEYERA CORP.
Notes to annual consolidated financial statements 77 All amounts expressed in thousands of Canadian dollars, except as otherwise noted
Currency The functional currency and presentation currency of Keyera and the majority of its subsidiaries is Canadian dollars. Keyera’s only foreign subsidiary, KEI, has a functional currency of U.S. dollars as the primary economic environment in which it operates is in the U.S. Transactions in foreign currencies are initially recorded in the functional currency by applying the rate of exchange at the date of the transaction. Monetary assets and liabilities denominated in foreign currencies are translated into the functional currency at the rate of exchange on the statement of financial position date. Any resulting exchange differences are included in the consolidated statements of net earnings and comprehensive income. Non-monetary assets and liabilities denominated in a foreign currency are measured at historical cost and are translated into the functional currency using the rates of exchange as at the dates of the initial transactions. Foreign Subsidiary Translation The accounts of KEI are translated into Keyera Corp.’s presentation currency at period-end exchange rates for assets and liabilities, and using the rates in effect at the date of the transaction for revenues and expenses. The resulting translation gains and losses related to the foreign operations of KEI are recognized as foreign currency translation adjustments in other comprehensive income (“OCI”) in the consolidated statements of net earnings and comprehensive income. The foreign currency translation adjustments accumulate in accumulated other comprehensive income (“AOCI”), which is a separate component of equity in the consolidated statements of financial position. These adjustments remain in equity until there is a disposal of the foreign operation. When the gain or loss on disposal is recognized, the cumulative amount of exchange differences relating to the foreign operation are reclassified from equity to net earnings. If there is a disposal of a partial interest in a foreign operation that continues to be a subsidiary, a proportionate amount of the accumulated foreign currency translation adjustments will be allocated between controlling and non-controlling interests. Revenue recognition Keyera’s performance obligations include the products or services that are promised to a customer. Revenues are recognized when Keyera satisfies its performance obligations by transferring control of the promised products or services to its customers, in an amount that reflects the consideration Keyera expects to be entitled to in exchange for those products or services. Customer credit worthiness is assessed prior to the signing of any contract, as well as throughout the contract duration. Revenues are generally invoiced and received on a monthly basis. Inter-segment and intra-segment revenues are recorded at current market prices and are eliminated upon consolidation to arrive at net earnings in accordance with IFRS. Keyera derives its revenue from its four operating segments:
1. Gathering and Processing (“G&P”); 2. Liquids Infrastructure; 3. Marketing; 4. Corporate and Other.
Gathering and Processing segment Keyera owns and operates raw gas gathering pipelines and processing plants, which collect and process raw natural gas, remove waste products and separate the economic components, primarily natural gas liquids, before the sales gas is injected into pipeline systems for transportation to end-use markets. The services performed in the G&P operating segment largely consist of gas handling services and other ancillary services such as NGL extraction, NGL handling and loading services, and condensate stabilization.

Keyera Corp. TSX: KEY 2020 Year End Report February 10, 2021
KEYERA CORP.
Notes to annual consolidated financial statements 78 All amounts expressed in thousands of Canadian dollars, except as otherwise noted
Revenue is recognized for each unit of raw gas volumes handled and processed by Keyera on a fee-for-service basis. The fee structure is stipulated in the contract and is based on either a fixed fee structure or a flow-through operating cost structure. Fixed fee arrangements: The fee is a fixed charge per unit transported or processed. Flow-through operating cost arrangements: The fees are generally comprised of a capital
component and a flow-through operating component. The capital component is usually a function of the replacement cost of capital invested in the facility with a rate of return, in light of market conditions. The operating component is based on the customer’s pro rata share of the operating costs for the facility calculated based on total throughput. Customers of each facility are charged a fee per unit based upon estimated operating costs and throughput, with an adjustment to actual costs and throughput completed after the end of the year.
Each quarter, throughput volumes and operating costs are reviewed to determine whether the estimated unit fee charged during the quarter properly reflects the actual volumes and costs, and the allocation of revenues and operating costs to other facility owners is also reviewed. Amounts collected in excess of the recoverable amounts under flow-through arrangements are recorded as a current liability. Recoverable amounts in excess of the amounts collected under flow-through arrangements are recorded as a current receivable.
Given that there are physical capacity limits at Keyera’s gathering and processing facilities, customers may enter into one of two service categories, or a combination of both, to determine how the raw gas is handled and processed:
(a) Firm service contracts: Firm service contracts generally have the highest priority of service in the
event of apportionment. Keyera’s obligation is to process and handle volumes nominated under firm service contracts above other service contracts. These contracts frequently contain a take-or-pay provision and/or dedication of reserves whereby a producer agrees to deliver all gas produced from specified reserves to a facility.
(b) Interruptible-service contracts: Under interruptible-service contracts, services are provided to the
customer only if the facility has capacity after all firm-service contracts, or other contracts with higher priority, have been satisfied. Enforceable rights and obligations are present when Keyera has capacity to process these lower priority volumes. Revenue from interruptible-service contracts is recognized when services are performed.
Keyera’s gas handling agreements are generally either evergreen or long term in nature. Evergreen contracts continue in force until terminated by either party by providing notice to the other party. In addition to providing services to third party customers at Keyera’s gathering and processing facilities, the G&P segment charges fees, at market rates, to Keyera’s Corporate and Other segment to process Keyera’s proprietary production and to Keyera’s Marketing segment for the use of the gathering and processing facilities.

Keyera Corp. TSX: KEY 2020 Year End Report February 10, 2021
KEYERA CORP.
Notes to annual consolidated financial statements 79 All amounts expressed in thousands of Canadian dollars, except as otherwise noted
Liquids Infrastructure segment Keyera owns and operates a network of facilities including underground NGL storage caverns, above ground storage tanks, NGL fractionation facilities, NGL pipelines as well as rail and truck terminals for the processing, fractionation, storage and transportation of the by-products of natural gas processing, including NGLs such as ethane, propane, butane and condensate. Most of Keyera’s Liquids Infrastructure assets are located in, or connected to, the Edmonton/Fort Saskatchewan area in Alberta, one of four key energy hubs in North America. This area also serves as a condensate hub which supports the operations of customers in the oil sands sector. Condensate is used as a diluent to facilitate movement of bitumen by pipeline. Diluent handling services provided to oil sands customers involves providing capacity for diluent transportation services, including the provision of operational storage on a temporary basis as well as rail and truck terminalling services. In addition, the Liquids Infrastructure segment produces iso-octane at the Alberta EnviroFuels facility (“AEF”). Iso-octane is a low vapour pressure, high-octane content component used in the blending of gasoline. The AEF facility is entirely reserved for the proprietary use of Keyera’s Marketing segment which sells this product to customers operating in the gasoline blending market. Keyera also engages in liquids blending, where it operates facilities at various locations, allowing it to transport, process and blend various product streams. Margins are earned by blending products of lower value into products of higher value. As a result, these products are exposed to variability in price and quality differential between various product streams. Customers who utilize the Liquids Infrastructure services enter into contracts with Keyera on a fee-for-service basis. Revenue is recognized for each unit of volume fractionated, processed, stored, transported and handled by Keyera based on the fee structure stipulated in the service contract with its customers. These contracts provide Keyera with an enforceable right to payment for services completed to date. The fees charged for services performed in the Liquids Infrastructure segment are negotiated on a customer-by-customer basis depending on the various assets required to fulfill the services stipulated in the contracts.
Given that there are physical capacity limits to the Liquids Infrastructure assets, customers may enter into one of two service categories, or a combination of both, to determine how services are to be prioritized and handled:
(a) Firm capacity reservation contracts: Firm capacity reservation contracts generally have the highest
priority of service in the event of capacity constraints. Keyera’s obligation is to process and handle volumes nominated under firm capacity reservation contracts above other service contracts.
(b) Interruptible-service contracts: Under interruptible-service contracts, services are provided to the customer only if the facility has capacity after all firm-service contracts, or other contracts with higher priority, have been satisfied. Under interruptible-service arrangements, enforceable rights and obligations are present once the customer nominates the volumes to be processed and Keyera has the capacity to process the nominated volumes. Revenue from interruptible-service contracts is recognized when services are performed.
In addition to including firm capacity and/or interruptible service terms, the Liquids Infrastructure contracts may also include volumetric tariffs, rate of return components, take-or-pay components and/or the flow through of certain costs.

Keyera Corp. TSX: KEY 2020 Year End Report February 10, 2021
KEYERA CORP.
Notes to annual consolidated financial statements 80 All amounts expressed in thousands of Canadian dollars, except as otherwise noted
Keyera’s Liquids Infrastructure segment provides a significant amount of processing, fractionation, storage, blending and/or de-ethanization services to Keyera’s Marketing segment, which pays market prices for the services it utilizes.
Take-or-pay arrangements In both the Liquids Infrastructure and G&P segments, certain contracts are entered into under take-or-pay arrangements whereby the customer has committed to minimum volume deliveries, regardless of whether the committed volumes are utilized. In these instances, Keyera recognizes revenue either rateably over the term of the fixed fee arrangement, or as volumes are handled and processed.
Take-or-pay arrangements may contain make-up rights, which are rights earned by the customer when the minimum volume commitments are not utilized during the period, but under certain circumstances can be used to offset excess volumes in future periods, subject to expiry. Consideration associated with take-or-pay contracts which have make-up rights are deferred and revenue is recognized at the earlier of (i) when the make-up volume is processed; (ii) the make-up right expires; or (iii) when it is determined the likelihood that the customer will exercise its make-up right is remote.
Non-cash consideration For any revenue contracts whereby a customer provides consideration in a form other than cash, such consideration is measured at fair value. If an estimate of fair value is not reasonably estimable, the consideration is measured by reference to the stand-alone selling price of the products or services promised to the customer in exchange for the consideration. When non-cash consideration is received in exchange for future services that have yet to be performed, revenue is deferred as a contract liability and recognized over the period that the performance obligation is expected to be satisfied. Marketing segment Keyera markets a range of products associated with its two infrastructure business lines, and revenue generated from this operating segment consists of primarily selling NGLs (ethane, propane, butane, condensate), iso-octane, as well as natural gas and crude oil. In addition, Keyera’s Marketing segment will enter into product purchase and processing contracts whereby NGL products are purchased from the customer at the delivery point to one or more of Keyera’s facilities. Revenue contracts within the Marketing segment are typically short term in nature (one year or less). Revenue from selling NGLs, iso-octane, natural gas and crude oil is recognized based on volumes delivered to customers at specified delivery points and at contracted prices, depending on the hydrocarbon product being sold. The contracted sales price is generally based on a market index price or is transacted at a fixed price. Keyera also enters into financial instruments and physical hedging contracts as risk mitigating measures to either protect the value of its NGL inventory, protect the sales price for iso-octane, or to hedge the foreign currency exposure on sales prices based in U.S. dollars. The unrealized gains/losses representing the change in fair value of financial instruments contracts are recorded in Marketing revenue along with the realized gains/losses resulting from the settlement of the financial instruments. Corporate and Other Keyera also engages in the production of oil and gas reserves which were acquired from its ownership interests in certain gathering and processing facilities. This activity represents an insignificant part of Keyera’s business and there are no plans to further develop the reserves. Production revenue, net of royalties is recorded in the Corporate and Other operating segment along with other corporate activities.
Share-based compensation Keyera has a Long-Term Incentive Plan (“LTIP”), which is described in note 21. The LTIP is accounted for using the liability method and is measured at fair value at each statement of financial position date until

Keyera Corp. TSX: KEY 2020 Year End Report February 10, 2021
KEYERA CORP.
Notes to annual consolidated financial statements 81 All amounts expressed in thousands of Canadian dollars, except as otherwise noted
the award is settled. The liability is measured by using a fair value pricing model. The compensation expense is recognized over the vesting period, with a corresponding liability recognized in the consolidated statements of financial position.
Cash Cash is comprised of cash on hand at year end.
Trade and other receivables Trade receivables are amounts due from customers from the rendering of services or sale of goods in the ordinary course of business. Trade receivables are classified as current assets if payment is due within one year or less. Trade receivables are recognized initially at fair value and subsequently measured at amortized cost, less allowance for expected credit losses. Keyera maintains an allowance for expected credit losses to provide for impairment of trade receivables. The expense or recovery relating to doubtful accounts is included within general and administrative expenses in the consolidated statements of net earnings and comprehensive income.
Inventory Inventory is comprised primarily of NGL and iso-octane products for sale through the Marketing operations. Inventory is measured at the lower of weighted average cost and net realizable value. Net realizable value represents the estimated selling price for inventories less selling expenses at the statement of financial position date. The reversal of previous net realizable value write-downs is recorded when there is a subsequent increase in the value of inventories.
Property, plant and equipment Items of property, plant and equipment, which include plant and processing equipment and production assets, are measured at cost less accumulated depreciation, depletion and accumulated impairment losses net of recoveries. The initial cost of an asset comprises its purchase price or construction cost, any costs directly attributable to bringing the asset into operation, the initial estimate of any decommissioning liability, and for qualifying assets, borrowing costs. The purchase price or construction cost is the aggregate amount paid and the fair value of any other consideration given to acquire the asset. Major maintenance programs (turnaround costs) are capitalized and amortized over the period to the next scheduled maintenance. The costs of day-to-day servicing of property, plant and equipment are recognized in the consolidated statements of net earnings and comprehensive income as incurred. The cost of replacing part of an item of property, plant and equipment is capitalized if it is probable that future economic benefits will flow to Keyera and its cost can be measured reliably. An item of property, plant and equipment is derecognized upon disposal, replacement or when no future economic benefits are expected to arise from the continued use of the asset. Any gains or losses arising on the disposal or retirement of an item of property, plant and equipment are determined by comparing the proceeds from disposal with the carrying amount of the item, and are recognized in the consolidated statements of net earnings and comprehensive income. Depreciation is recognized so as to expense the cost of significant components of assets less their residual values over their useful lives, using the straight-line method. Production assets are depleted using the unit-of-production method based on estimated proved reserves. Land and linefill are not depreciated. Depreciation methods, useful lives and residual values are reviewed on an annual basis and, if necessary, any changes would be accounted for prospectively.

Keyera Corp. TSX: KEY 2020 Year End Report February 10, 2021
KEYERA CORP.
Notes to annual consolidated financial statements 82 All amounts expressed in thousands of Canadian dollars, except as otherwise noted
The estimated useful lives of Keyera’s property, plant and equipment are as follows: General plant and processing equipment 4 - 45 years Other properties and equipment 5 - 10 years Turnarounds 4 - 10 years Borrowing costs Borrowing costs that Keyera incurs in connection with the borrowing of funds that are attributable to the acquisition, construction or production of a qualifying asset are capitalized when the assets take a significant period of time to get ready for use or sale. Other borrowing costs are expensed as incurred. Impairment of property, plant and equipment Keyera assesses assets for impairment whenever events or changes in circumstances indicate that the carrying value of an asset may not be recoverable. For the purposes of assessing impairment, assets are grouped at the lowest levels for which there are separately identifiable cash inflows (cash generating units or CGUs). Impairment losses are recognized for the amount by which the asset’s carrying amount exceeds its recoverable amount, and are recognized immediately in the consolidated statements of net earnings and comprehensive income. The recoverable amount is the greater of: i) an asset’s fair value less costs of disposal; and ii) its value in use. Fair value is the price that would be expected to be received in a sale transaction less costs of disposal. In assessing value in use, the estimated future cash flows are discounted to their present value using a pre-tax discount rate that reflects current market assessments of the time value of money and the risks specific to the asset for which the estimates of future cash flows have not been adjusted. Keyera evaluates impairment losses for potential reversals, other than goodwill impairment, when events or changes in circumstances warrant such consideration. Reversals of impairment losses are evaluated and if deemed necessary are recognized immediately in the consolidated statements of net earnings and comprehensive income. Goodwill Goodwill arising in a business combination is recognized as an asset and initially measured at cost, being the excess of the consideration transferred in the business combination over Keyera’s interest in the net fair value of the identifiable assets, liabilities and contingent liabilities recognized. If Keyera’s interest in the net fair value of the acquiree’s identifiable assets, liabilities and contingent liabilities exceeds the cost of the business combination, the excess is recognized immediately in the consolidated statements of net earnings and comprehensive income. Following initial recognition, goodwill is measured at cost less any accumulated impairment losses. Goodwill is not amortized but is reviewed for impairment at least annually. Impairment of goodwill Impairment is assessed at least annually and is determined by assessing the recoverable amount of the CGU or group of CGUs to which the goodwill relates. Where the recoverable amount of the CGU or group of CGUs is less than the carrying amount, an impairment loss is recognized in the consolidated statements of net earnings and comprehensive income. The impairment loss is allocated first to reduce the carrying amount of any goodwill and then on a pro-rata basis to the other assets within the CGU. An impairment loss recognized for goodwill is not reversed in a subsequent period.

Keyera Corp. TSX: KEY 2020 Year End Report February 10, 2021
KEYERA CORP.
Notes to annual consolidated financial statements 83 All amounts expressed in thousands of Canadian dollars, except as otherwise noted
The recoverable amount for CGUs with allocated goodwill is determined based on a value in use calculation or fair value less costs of disposal. Value in use is calculated by discounting future cash flow projections that are based on Keyera’s internal cash flow estimates. These forecasts include estimates of the future cash flows expected to be derived from continued use of the asset and involve the use of various assumptions, the most significant of which are operating margin, inter-segment allocations, discount rates, and terminal growth and decline rates. The discount rate used in the value in use calculation represents a weighted average cost of capital (“WACC”). The WACC is an estimate of the overall required rate of return on an investment for both debt and equity owners and serves as the basis for developing an appropriate discount rate. Determination of the WACC requires separate analysis of the cost of equity and debt, and considers a risk premium based on an assessment of risks related to the projected cash flows of each CGU.
Financial assets and financial liabilities Financial assets and financial liabilities are initially recognized at fair value, and for financial assets and liabilities not measured at fair value through profit or loss, net of transaction costs that are directly attributable to the acquisition or issue of the financial asset or financial liability. The subsequent measurement of financial assets and financial liabilities depends on their classification as follows: Financial assets Financial assets include cash, trade and other receivables and derivative financial instruments. Keyera determines the classification of its financial assets at initial recognition. a) Financial assets measured at amortized cost These are non-derivative financial assets composed of contractual cash flows that are held to collect and are solely payments of principal and interest on the principal amount outstanding with fixed or determinable payments that are not quoted in an active market. These assets are subsequently carried at amortized cost using the effective interest method. Gains and losses are recognized in the consolidated statements of net earnings and comprehensive income when the financial assets are derecognized or impaired. Assets in this category include cash, and trade and other receivables that are classified as current assets in the consolidated statements of financial position. b) Financial assets measured at fair value Financial assets not measured at amortized cost or at fair value through other comprehensive income are measured at fair value through profit or loss in the consolidated statements of net earnings and comprehensive income. Derivatives, other than those designated as effective hedging instruments, are included in this category. Keyera has not designated any derivative instruments as hedges. These assets are carried on the consolidated statements of financial position at fair value with gains or losses recognized in the consolidated statements of net earnings and comprehensive income in the period in which they arise. The estimated fair value of assets and liabilities classified as fair value through profit or loss in the consolidated statements of net earnings and comprehensive income is determined by reference to observable market data, including commodity price curves, foreign currency curves and credit spreads. Transaction costs are charged to the consolidated statements of net earnings and comprehensive income as incurred.

Keyera Corp. TSX: KEY 2020 Year End Report February 10, 2021
KEYERA CORP.
Notes to annual consolidated financial statements 84 All amounts expressed in thousands of Canadian dollars, except as otherwise noted
Impairment of financial assets Keyera assesses at each statement of financial position date whether there is objective evidence that a financial asset is impaired based on expected credit loss information. Impairments arising from expected credit losses are recognized in the consolidated statements of net earnings and comprehensive income. Financial liabilities Financial liabilities consist of derivative financial instruments, bank indebtedness, trade and other payables, dividends payable, current and long-term lease liabilities, credit facilities, current and long-term debt, and certain other long-term liabilities. a) Financial liabilities measured at fair value through profit or loss Derivatives are included in this category. These liabilities are carried on the consolidated statements of financial position at fair value with gains or losses recognized in the consolidated statements of net earnings and comprehensive income in the period in which they arise. Keyera has not designated any derivative instruments as hedges. Transaction costs are charged to the consolidated statements of net earnings and comprehensive income as incurred. b) Financial liabilities measured at amortized cost If a financial liability is not measured at fair value through profit or loss, it is measured at amortized cost. For interest bearing debt, this is the fair value of the proceeds received net of transaction costs associated with the borrowing. After initial recognition, financial liabilities are subsequently measured at amortized cost using the effective interest method. Amortized cost is calculated by taking into account any transaction costs, and any discount or premium on settlement. Keyera has classified bank indebtedness, current and long-term debt, credit facilities, trade and other payables, dividends payable and finance lease liabilities in this category. Derivatives and embedded derivatives Derivative instruments include financial contracts that derive their value from underlying changes in interest rates, foreign exchange rates, credit spreads, commodity prices, equities or other financial measures. Keyera uses derivative instruments such as commodity price swaps (NGLs, crude oil, natural gas, motor gasoline), electricity price swaps, foreign exchange forward contracts, and cross-currency swaps to manage its risks. Natural gas, NGL and crude oil contracts that require physical delivery at fixed prices and do not meet Keyera’s expected purchase, sale or usage requirements are accounted for as derivative instruments. Derivatives may include those derivatives that are embedded in financial or non-financial contracts that are not closely related to the host contracts. For embedded derivatives within a financial asset host contract, the embedded derivative is not separated from the host contract and instead, the whole contract is accounted for as a single instrument. For embedded derivatives within a financial liability host contract, the embedded derivative is separated from the host contract and accounted for as a derivative instrument. Changes in the fair value of derivatives are recognized in the consolidated statements of net earnings and comprehensive income and are included in Marketing revenue, Liquids Infrastructure operating expenses, Gathering and Processing operating expenses, Corporate and Other revenue and expenses and net foreign currency gain (loss) on U.S. debt and other. The grouping of these gains and losses in the consolidated statements of net earnings and comprehensive income is consistent with the underlying nature and purpose of the derivative instruments (see note 22).

Keyera Corp. TSX: KEY 2020 Year End Report February 10, 2021
KEYERA CORP.
Notes to annual consolidated financial statements 85 All amounts expressed in thousands of Canadian dollars, except as otherwise noted
Provisions Provisions are recognized when Keyera has a present obligation (legal or constructive) as a result of a past event, it is probable that Keyera will be required to settle the obligation, and a reliable estimate can be made of the amount of the obligation. The amount recognized as a provision is the best estimate of the consideration required to settle the present obligation at the statement of financial position date, taking into account the risks and uncertainties surrounding the obligation. Where a provision is measured using the cash flows estimated to settle the present obligation, its carrying amount is the present value of those cash flows. When some or all of the economic benefits required to settle a provision are expected to be recovered from a third party, a receivable is recognized as an asset if it is virtually certain that reimbursement will be received and the amount of the receivable can be measured reliably. Decommissioning Liability Liabilities for decommissioning costs are recognized for the reclamation of Keyera’s facilities at the end of their economic life. Any change in the present value, as a result of a change in discount rate or expected future costs, of the estimated obligation is reflected as an adjustment to the provision and the corresponding item of property, plant and equipment. Keyera’s discount rate is a credit-adjusted risk-free rate based on the Government of Canada’s benchmark long-term bond yield. The liability for decommissioning costs is increased each period through the unwinding of the discount, which is included in finance costs in the consolidated statements of net earnings and comprehensive income. Actual expenditures incurred are charged against the decommissioning liability.
Taxation Income tax expense represents the sum of current and deferred tax. Tax is recognized in the consolidated statements of net earnings and comprehensive income except to the extent it relates to items recognized in other comprehensive income or directly in equity. a) Current tax The tax currently payable is based on taxable profit for the year. Current tax expense is based on the results for the period as adjusted for items that are not taxable or not deductible. Current tax is calculated using tax rates and laws that were enacted or substantively enacted at the end of the reporting period. b) Deferred tax Deferred tax is recognized using the liability method on temporary differences arising between the tax basis of assets and liabilities and their carrying amounts on the consolidated statements of financial position. Deferred tax is calculated using tax rates and laws that have been enacted or substantively enacted at the end of the reporting period, and which are expected to apply when the related deferred income tax asset is realized or the deferred income tax liability is settled. Deferred tax liabilities: are generally recognized for all taxable temporary differences; are not recognized for taxable temporary differences arising on investments in subsidiaries,
associates and joint ventures, where the reversal of the temporary difference can be controlled and it is probable that the difference will not reverse in the foreseeable future; and
are not recognized on temporary differences that arise from goodwill which is not deductible for tax
purposes.

Keyera Corp. TSX: KEY 2020 Year End Report February 10, 2021
KEYERA CORP.
Notes to annual consolidated financial statements 86 All amounts expressed in thousands of Canadian dollars, except as otherwise noted
Deferred tax assets: are recognized to the extent it is probable that taxable income will be available against which the
deductible temporary differences can be utilized; and
are reviewed at the end of the reporting period and reduced to the extent that it is no longer probable that sufficient taxable profits will be available to allow all or part of the asset to be recovered.
Deferred tax assets and liabilities are not recognized in respect of temporary differences that arise on initial recognition of assets and liabilities acquired other than in a business combination. Deferred tax assets and liabilities are offset when there is a legally enforceable right to set off current tax assets against current tax liabilities and when they relate to income taxes levied by the same taxation authority and Keyera intends to settle its current tax assets and liabilities on a net basis.
Leases Lease identification and initial measurement Lessee lease arrangements are identified whenever the contract terms provide Keyera with the right to control the use of an identified asset for a period of time in exchange for consideration. Leases are recognized at the commencement of the lease, which is the date that the underlying asset is made available for use, by recording a lease liability and a corresponding right-of-use asset. The lease liability is initially recognized at the present value of the minimum lease payments that have not been paid at that date. Minimum lease payments include: (i) fixed payments (including in-substance fixed payments), (ii) variable lease payments that depend on an index or a rate, (iii) amounts expected to be payable under residual value guarantees, (iv) if the contract includes a purchase option, the exercise price of the purchase price if Keyera is reasonably certain to exercise the option; and (v) if the contract includes a termination option, payments of penalties for terminating the lease if the lease term reflects Keyera’s exercise of the termination option. Variable lease payments that are dependent on future performance or use of the underlying asset are excluded from the measurement of the lease liability, and instead are recognized in the consolidated statements of net earnings and comprehensive income in the period that such payments are incurred. Minimum lease payments are discounted using Keyera’s weighted average incremental borrowing rate when the rate implicit in the lease is not readily determinable. Individual weighted average incremental borrowing rates are calculated for lease payments denominated in Canadian dollars and U.S. dollars. The right-of-use asset is initially measured at cost, which includes: (i) the amount of the initial measurement of the lease liability, (ii) any lease payments made at or before the lease commencement date, less any lease incentives received, (iii) any initial direct costs incurred, and (iv) an estimate of restoration costs. Subsequent measurement – lease liabilities Subsequent to initial measurement, lease payments are allocated to: (i) interest expense on the lease liability, and (ii) repayment of the carrying value of the lease liability. The interest expense in each period during the lease term is the amount that produces a constant periodic rate of interest on the remaining balance of the lease liability and is included in finance costs in the consolidated statements of net earnings and comprehensive income. If there is a change in future lease payments resulting from a change in an index or rate used to determine the payments, the lease liability is remeasured to reflect such changes. For lease payments denominated in U.S. dollars, the lease liability is remeasured to reflect the applicable foreign exchange rate at each reporting period, with the offset recognized in the consolidated statements of net earnings and comprehensive income.

Keyera Corp. TSX: KEY 2020 Year End Report February 10, 2021
KEYERA CORP.
Notes to annual consolidated financial statements 87 All amounts expressed in thousands of Canadian dollars, except as otherwise noted
Subsequent measurement – right-of-use assets If the lease term reflects that Keyera will exercise a purchase option, the right-of-use asset is depreciated from the lease commencement date to the end of the useful life of the underlying asset. Otherwise, the right-of-use asset is depreciated to the earlier of the end of the useful life of the underlying asset or to the end of the lease term. Impairment – right-of-use assets Similar to property plant and equipment, right-of-use assets are subject to the impairment requirements of IAS 36, Impairment of Assets. Keyera assesses right-of-use assets for impairment whenever events or changes in circumstances indicate that the carrying value of the right-of-use asset may not be recoverable. A right-of-use asset may be assessed for impairment individually, or as part of a cash-generating unit (“CGU”) if the cash flows related to the lease are not independent from the cash flows of the CGU. An impairment loss is recognized immediately in the consolidated statements of net earnings and comprehensive income for the amount that the right-of-use asset’s carrying amount exceeds its recoverable amount.
Finance costs Finance costs include interest expense on debt, interest charges related to leases, non-cash expense related to the unwinding of the debt discount, and non-cash accretion expense related to decommissioning liabilities, net of interest capitalized for qualifying projects and interest income. All finance costs are recognized in the consolidated statements of net earnings and comprehensive income in the period in which they are incurred.
Earnings per share Basic earnings per share are calculated by dividing net earnings by the weighted average number of shares outstanding during the period. For the calculation of the weighted average number, shares are determined to be outstanding from the date they are issued. Diluted earnings per share are calculated by adding the weighted average number of shares outstanding during the period to the additional shares that would have been outstanding if potentially dilutive shares had been issued as a result of any convertible debentures outstanding, using the “if converted” method.
Accumulated deficit Accumulated deficit includes opening deficit, net earnings for the period to date, and dividends declared to shareholders. Reclassification Certain information provided for the prior year has been reclassified to conform to a change in presentation adopted in 2020.
4. CRITICAL ACCOUNTING ESTIMATES AND JUDGMENTS
In the application of Keyera’s accounting policies, management is required to make estimates and assumptions about the carrying amounts of assets and liabilities that are not readily apparent from other sources. The estimates and associated assumptions are based on historical experience and other factors that are considered to be relevant. Actual results may differ from the estimates. The most significant estimates and judgments contained in the consolidated financial statements are described below:
Allowance for expected credit losses Keyera provides services and sells NGLs and iso-octane to a number of counterparties on credit terms. The allowance for credit losses is reviewed on a monthly basis. An assessment is made whether an

Keyera Corp. TSX: KEY 2020 Year End Report February 10, 2021
KEYERA CORP.
Notes to annual consolidated financial statements 88 All amounts expressed in thousands of Canadian dollars, except as otherwise noted
account is deemed impaired based on expected credit losses, which includes the number of days outstanding and the likelihood of collection from the counterparty.
Depreciation of property, plant and equipment and amortization of intangible assets For purposes of determining depreciation, depletion and amortization expense, estimates and judgments are required to establish depreciation methods, useful lives, and residual values for Keyera’s assets. Determining depreciation methods requires management to make judgments that most appropriately reflect the pattern of an asset’s future economic benefit expected to be consumed by Keyera. For assets other than production assets, useful life estimates include management’s assumptions regarding the period over which the asset is expected to be available for use by the company. This includes assessing the assets’ physical and economic lives and, if applicable, may include an estimation of the associated reserve lives and production activity related to the assets’ respective capture areas. Production assets are depleted using the unit-of-production method based on estimated proved reserves, which are determined by Keyera’s independent qualified reserves evaluator. The estimation of reserves involves the exercise of professional judgment and is inherently subject to uncertainty. Changes in forward price estimates, production costs or recovery rates may change the economic status of reserves. Depreciation methods, useful lives and residual values are reviewed on an annual basis and, if necessary, any changes are accounted for prospectively.
Fair value estimates of property, plant and equipment Determination of the fair value of identifiable assets acquired in a business combination requires Keyera’s management to make assumptions and estimates about future events. The fair value of identifiable assets such as gathering and processing, storage and fractionation facilities, pipelines, terminals and other equipment is estimated with reference to the expected discounted future cash flows expected to be derived from the acquired assets. These assumptions and estimates generally require judgment and include estimates of future revenues, costs and discount rates. Changes in any of the assumptions or estimates used in determining the fair value of acquired assets and liabilities could impact the amounts assigned to the net assets acquired in a business combination.
Impairment of property, plant and equipment In determining the recoverable amount of assets, in the absence of quoted market prices, estimates are made regarding the present value of future cash flows. Future cash flow estimates are based on a number of factors, including future production profiles and reserves for surrounding wells, commodity prices and costs. Estimates are also made in determining the discount rate used to calculate the present value of future cash flows.
Impairment of goodwill Determining whether goodwill is impaired requires an estimation of the value in use of the CGUs to which goodwill has been allocated. The value in use calculation requires management to estimate the future cash flows expected to arise from the CGU and the discount rate in order to calculate present value. The determination of CGUs is subject to management’s judgment.
Derivative financial instruments Keyera utilizes derivative financial instruments to manage its exposure to market risks relating to commodity prices and foreign currency exchange rates. Fair values of derivative contracts fluctuate depending on the underlying estimates of future commodity prices or foreign currency exchange rates. The estimated fair value of all derivative financial instruments is based on observable market data, including commodity price curves, foreign currency curves and credit spreads.

Keyera Corp. TSX: KEY 2020 Year End Report February 10, 2021
KEYERA CORP.
Notes to annual consolidated financial statements 89 All amounts expressed in thousands of Canadian dollars, except as otherwise noted
Long-term incentive plan liability The LTIP is accounted for using the liability method and is measured at fair value. Determining the fair value requires management to estimate Keyera’s financial performance over a three-year period to determine the appropriate payout multiplier associated with the Performance Awards. The payout multiplier is based 70% on the average annual pre-tax distributable cash flow per share over the performance period of three years and 30% on the relative total shareholder return in a defined peer group over the performance period of three years. The payout multiplier determines the number of shares expected to be settled following the third anniversary of the grant date of the Performance Awards.
Decommissioning liabilities Keyera estimates future site restoration costs for its gathering and processing, fractionation, iso-octane and storage facilities, pipelines and terminals. The ultimate costs are uncertain and cost estimates can vary in response to many factors including changes to relevant legal requirements, the emergence of new restoration techniques or experience at other processing sites.
Deferred tax assets and liabilities Deferred tax assets and liabilities require management’s judgment in determining the amounts to be recognized. In particular, judgment is used when assessing the extent to which deferred tax assets should be recognized with consideration given to the timing and level of future taxable income. To the extent estimates differ from the final tax return, earnings would be affected in a subsequent period. Leases To account for Keyera’s lease obligations, the following significant judgments and estimates are utilized which affect the valuation of the lease liabilities and the right-of-use assets:
a) Determination of lease term In determining lease term, management must consider all relevant facts and circumstances that create an economic incentive for Keyera, and as a result, make it reasonably certain, that Keyera will exercise a lease extension option or not exercise a termination option. Upon the occurrence of a significant event or change in circumstances, Keyera reviews its assessment and if required, revises the lease term.
b) Estimation uncertainty arising from variable lease payments Some of Keyera’s lessee lease contracts contain lease payments that are only payable if certain options are elected under the arrangement. In these scenarios, there is more than one set of payments that Keyera can be expected to make: (i) $nil if the option is not elected, or (ii) the fixed payment outlined in the arrangement if the option is elected. As a result, these payments are only included in the measurement of the lease liability when they become in-substance fixed lease payments, which is if and when the variability associated with electing the option is resolved.
Revenue Recognition To determine the timing and amount of revenue recognition, management must utilize significant judgments and estimates, which include: the nature and type of performance obligations under contract, the timing of when such performance obligations have been satisfied, the amount of any variable consideration associated with a revenue contract and whether such consideration is constrained or not reasonably estimable, the contract term, and the likelihood that customers will have the ability to exercise any make-up rights that have accumulated before they expire.
Operating revenues and operating expenses a) Gathering and Processing and Liquids Infrastructure Each month, actual volumes processed and fees earned from the Gathering and Processing and Liquids Infrastructure assets are not known until the following month. In addition, the period in which invoices are rendered for the supply of goods and services necessary for the operation of the Gathering and Processing and Liquids Infrastructure assets is generally later than the period in which the goods or

Keyera Corp. TSX: KEY 2020 Year End Report February 10, 2021
KEYERA CORP.
Notes to annual consolidated financial statements 90 All amounts expressed in thousands of Canadian dollars, except as otherwise noted
services were provided. Estimates of one month’s revenue and one month’s operating costs are recorded in the consolidated financial statements based upon a review of historical trends that is adjusted for events that are known to have a significant effect on the month’s operations.
b) Marketing Marketing sales revenue is recorded based on actual volumes and prices. However, in many cases actual volumes have not yet been confirmed and sales prices that are dependent on other variables are not yet known. In addition, the majority of NGL supply purchases are estimated each month as actual volume information is not available until the following month. At the end of the period, estimates for sales and purchases are recorded in the consolidated financial statements. Estimates are prepared based on contracted volumes and known events. Equalization Adjustments Much of the revenue from the Gathering and Processing segment includes a recovery of operating costs. Users of each facility are charged a per unit fee based upon estimated costs and throughput, with an adjustment to actual throughput completed after the end of the year. On a quarterly basis, throughput volumes and operating costs are reviewed and adjustments are made to revenue and operating expenses based on actual operating costs incurred to date. The Effect of Recent Developments Related to the COVID-19 Pandemic In March 2020, the World Health Organization declared a global pandemic as a result of the emergence and rapid transmission of a novel strain of the coronavirus (“COVID-19”). The fluctuations in market conditions that have resulted from the pandemic introduce additional uncertainties, risks and complexities in management’s determination of the estimates and assumptions used to prepare Keyera’s financial results. While many government-imposed restrictions have been relaxed since the beginning of the outbreak, a resurgence of the virus, including variants, has resulted in governments reinstating or considering the reinstatement of restrictions. Although many countries, including Canada, approved the use and began administering COVID-19 vaccinations in the fourth quarter of 2020, it is still too early to determine the effect the vaccinations will have on the speed at which the global economy recovers. While Keyera monitors recommendations from applicable government agencies and public health authorities, the COVID-19 pandemic and volatility in financial markets is an evolving situation. As a result, management cannot reasonably estimate the extent, duration or severity of the implications. Actual results may differ from estimates and the effect of such differences may be material.

Keyera Corp. TSX: KEY 2020 Year End Report February 10, 2021
KEYERA CORP.
Notes to annual consolidated financial statements 91 All amounts expressed in thousands of Canadian dollars, except as otherwise noted
5. FUTURE ACCOUNTING PRONOUNCEMENTS There were no significant new accounting standards or interpretations issued during the year ended December 31, 2020.
6. TRADE AND OTHER RECEIVABLES
As at December 31, (Thousands of Canadian dollars) 2020 2019 Trade and other receivables 451,964 490,328 Allowance for expected credit losses: Balance at beginning of the year (1,741) (2,103) Impairment losses – trade receivables (2,500) 362 Balance at the end of the year (4,241) (1,741) Total trade and other receivables 447,723 488,587
Trade and other receivables are non-interest bearing and are generally on 5 to 30 day terms which are classified as neither past due or impaired in the aging analysis below.
Aging of receivables that are not impaired
As at December 31, (Thousands of Canadian dollars) 2020 2019 Neither past due or impaired 447,723 485,085 Past due 31 to 60 days — 3,502 Past due over 60 days — — Total trade and other receivables 447,723 488,587

Keyera Corp. TSX: KEY 2020 Year End Report February 10, 2021
KEYERA CORP.
Notes to annual consolidated financial statements 92 All amounts expressed in thousands of Canadian dollars, except as otherwise noted
7. INVENTORY
The total carrying amount and classification of inventory was as follows:
As at December 31, (Thousands of Canadian dollars) 2020 2019 NGLs and iso-octane 153,915 83,334 Other 8,908 10,348 Total inventory 162,823 93,682
For the year ended December 31, 2020, $162,823 (2019 – $93,682) of inventory was carried at cost and $nil (2019 – $nil) was carried at net realizable value. During the year, a write-down of $13,507 was recorded to adjust the carrying amount of inventory to its net realizable value (2019 – $2,946). The cost of inventory expensed for the year ended December 31, 2020 was $1,510,811 (2019 – $2,075,816).
8. OTHER ASSETS
As at December 31, (Thousands of Canadian dollars) 2020 2019 Prepaid deposits 2,916 3,469 Other 9,862 7,081 Total other assets 12,778 10,550

Keyera Corp. TSX: KEY 2020 Year End Report February 10, 2021
KEYERA CORP.
Notes to annual consolidated financial statements 93 All amounts expressed in thousands of Canadian dollars, except as otherwise noted
9. PROPERTY, PLANT, AND EQUIPMENT
Cost (Thousands of Canadian dollars)
General plant & processing
equipment
Other properties
& equipment Turnarounds
Land & linefill
Total
Balance at December 31, 20181 6,652,541 237,494 272,533 186,077 7,348,645
Additions 1,009,831 33,952 47,949 69 1,091,801 Disposals (499) — — — (499) Decommissioning asset (13,138) — — — (13,138) Foreign currency translation (12,406) (14) — (809) (13,229)
Balance at December 31, 2019
7,636,329
271,432
320,482
185,337
8,413,580 Additions 571,720 19,979 1,184 1,281 594,164 Decommissioning asset 52,842 — — — 52,842 Foreign currency translation (4,684) (192) — (255) (5,131) Balance at December 31, 2020 8,256,207 291,219 321,666 186,363 9,055,455
Accumulated depreciation, depletion and impairment (Thousands of Canadian dollars)
General plant & processing
equipment
Other properties
& equipment Turnarounds
Land & linefill
Total
Balance at December 31, 20181 (1,336,032) (179,955) (238,040) (2,291) (1,756,318)
Impairment expense (77,095) — — — (77,095) Depreciation and depletion expenses (174,431) (16,694) (23,429) — (214,554)
Foreign currency translation 219 — — — 219 Balance at December 31, 2019 (1,587,339) (196,649) (261,469) (2,291) (2,047,748) Impairment expense (371,305) — — — (371,305) Depreciation and depletion expenses (197,477) (14,792) (20,548) — (232,817)
Foreign currency translation (2,404) 4 — — (2,400) Balance at December 31, 2020 (2,158,525) (211,437) (282,017) (2,291) (2,654,270)
Carrying value (Thousands of Canadian dollars)
General plant & processing
equipment
Other properties
& equipment Turnarounds
Land & linefill
Total As at December 31, 20181 5,316,509 57,539 34,493 183,786 5,592,327 As at December 31, 2019 6,048,990 74,783 59,013 183,046 6,365,832 As at December 31, 2020 6,097,682 79,782 39,649 184,072 6,401,185
Note: 1 Effective December 31, 2019, Keyera voluntarily changed its accounting policy to utilize a credit-adjusted risk-free interest rate to
calculate the present value of its decommissioning liabilities. Previously, the company utilized a risk-free rate. The change in accounting policy was applied retrospectively. Refer to note 2 of the consolidated financial statements as at and for the year ended December 31, 2019 for additional details.

Keyera Corp. TSX: KEY 2020 Year End Report February 10, 2021
KEYERA CORP.
Notes to annual consolidated financial statements 94 All amounts expressed in thousands of Canadian dollars, except as otherwise noted
Property, plant and equipment under construction included in carrying value (Thousands of Canadian dollars) Cost As at December 31, 2019
790,796
As at December 31, 2020
426,619
2020 Impairment Expense For the year ended December 31, 2020, Keyera identified through its impairment review that certain assets had carrying values that were greater than their recoverable amounts. The recoverable amount for each asset was calculated based on value in use which represents the estimated net present value of the cash flows expected to be derived from the asset, or fair value less costs of disposal.
The following impairment expenses with a combined value of $371,305 were recognized during year ended December 31, 2020:
(Thousands of Canadian dollars, except rate information)
Period impairment
was recorded
Applicable discount
rate
Recoverable amount as at
December 31, 2020
Impairment expense
recognized Central Foothills CGU Ricinus gas plant1 Q1 2020 13.0% — 73,222 West Pembina gas plant1 Q1 2020 13.0% 773 52,634 Nordegg River gas plant1 Q1 2020 13.0% 155 42,167 Alder Flats gas plant1 Q4 2020 11.9% 59,947 103,342 Drayton Valley North CGU Brazeau North and Pembina North
gathering and processing complex1 Q1 2020 13.0%
— 25,978 Northern Area CGU Edson gas plant1 Q4 2020 11.9% 7,092 14,220 Gregg-Lake Obed pipeline system1 Q4 2020 11.9% 374 5,892 United States CGU Hull terminal2 Q3 2020 12.7% 48,440 53,850 Total impairment expense 371,305
Notes: 1 Included in the Gathering and Processing segment. 2 Included in the Liquids Infrastructure segment.
During the first quarter of 2020, a combined impairment expense of $194,001 was recognized. The impairment expense recorded for the Central Foothills Cash-Generating Unit during the first quarter was a result of Keyera’s gathering and processing optimization strategy. As part of this optimization strategy, Keyera suspended operations at its Minnehik Buck Lake gas plant in May 2020 and at its West Pembina gas plant in August 2020. The closures of the Ricinus and Nordegg River gas plants are expected to occur in mid-2021 and 2022, respectively. An impairment expense was not recorded for the Minnehik Buck Lake gas plant as this facility was previously impaired to its salvage value in 2019. The impairment expense recorded for the Drayton Valley North CGU during the first quarter was a result of underutilization of the Brazeau North and Pembina North gathering and processing complex, including lower producer activity in the capture areas for this complex.

Keyera Corp. TSX: KEY 2020 Year End Report February 10, 2021
KEYERA CORP.
Notes to annual consolidated financial statements 95 All amounts expressed in thousands of Canadian dollars, except as otherwise noted
During the third quarter, an impairment expense of $53,850 was recorded as a result of the underutilization of the Hull terminal in the United States. During the fourth quarter, a combined impairment expense of $123,454 was recognized for the Alder Flats gas plant, and two non-core assets; the Edson gas plant and the Gregg-Lake Obed pipeline system. Asset underutilization was the primary factor that resulted in a reduction in the carrying value for these assets.
2019 Impairment Expense The following impairment expenses with a combined value of $77,095 were recognized in the Gathering and Processing segment during the year ended December 31, 2019:
(Thousands of Canadian dollars, except rate information)
Period impairment
was recorded
Applicable discount rate
Impairment expense
recognized Drayton Valley North CGU Bigoray gas plant Q4 2019 10.1% 28,415 Rimbey Area CGU Willesden Green gas plant Q4 2019 9.4% 19,127 Gilby gas plant Q4 2019 9.4% 16,125 Central Foothills CGU Minnehik Buck Lake gas plant Q4 2019 9.4% 12,370 Production CGU West Pembina production wells Q4 2019 10.1% 1,058 Total impairment expense 77,095
All assets impaired in 2019 were included in the Gathering and Processing segment. The recoverable amounts were determined using a value in use calculation and were nominal in value. For the Bigoray gas plant, underutilization of the facility was the primary factor that resulted in a reduction in the carrying value of the asset. For the Gilby gas plant, the reduction was due to the suspension of operations at the facility, which also triggered a reduction in carrying value for the Willesden Green gas plant as this facility was repurposed. The reduction for the Minnehik Buck Lake gas plant was due to lower throughput in the capture area that surrounds this asset. The reduction for the West Pembina production wells was due to the wells being shut-in without a plan to recommence production from these wells in the near future.

Keyera Corp. TSX: KEY 2020 Year End Report February 10, 2021
KEYERA CORP.
Notes to annual consolidated financial statements 96 All amounts expressed in thousands of Canadian dollars, except as otherwise noted
10. RIGHT-OF-USE ASSETS
Cost (Thousands of Canadian dollars) Rail cars
Pipeline Transportation
Real Estate
Prepaid Lease Asset
Other
Total
Balance at January 1, 2019 141,356 44,669 10,269 — 2,225 198,519 Additions and adjustments 91,919 — 6,986 — (110) 98,795 Balance at December 31, 2019 233,275 44,669 17,255 — 2,115 297,314 Additions and adjustments 5,635 — 713 66,166 — 72,514 Balance at December 31, 2020 238,910 44,669 17,968 66,166 2,115 369,828
Accumulated depreciation (Thousands of Canadian dollars) Rail cars
Pipeline Transportation
Real Estate
Prepaid Lease Asset
Other
Total
Balance at January 1, 2019 — — — — — — Depreciation expense (52,602) (1,787) (1,287) — (186) (55,862) Balance at December 31, 2019 (52,602) (1,787) (1,287) — (186) (55,862) Depreciation expense (45,661) (1,787) (1,824) (221) (195) (49,688) Balance at December 31, 2020 (98,263) (3,574) (3,111) (221) (381) (105,550)
Carrying value (Thousands of Canadian dollars) Rail cars
Pipeline Transportation
Real Estate
Prepaid Lease Asset
Other
Total
As at January 1, 2019 141,356 44,669 10,269
— 2,225 198,519 As at December 31, 2019 180,673 42,882 15,968 — 1,929 241,452 As at December 31, 2020 140,647 41,095 14,857 65,945 1,734 264,278
In December 2020, Keyera entered into a long-term arrangement, which provides Keyera with the exclusive use of a butane-on-demand distribution system at Kinder Morgan’s Galena Park Products Terminal in Texas over a 25-year period. The associated facilities were constructed by Kinder Morgan and reimbursed by Keyera at a cost of $66,166 (US$51,383) upon the commencement of initial operations. Since the consideration associated with this investment was paid in advance, a prepaid lease asset has been recorded without the recognition of a corresponding lease liability.
11. GOODWILL
As at December 31, (Thousands of Canadian dollars) 2020 2019 Cost and carrying value 55,761 55,761
Impairment test of goodwill Keyera performed its annual tests for goodwill impairment on December 31, 2020 and 2019 in accordance with its policy described in note 3 and determined that goodwill was not impaired.

Keyera Corp. TSX: KEY 2020 Year End Report February 10, 2021
KEYERA CORP.
Notes to annual consolidated financial statements 97 All amounts expressed in thousands of Canadian dollars, except as otherwise noted
Allocation of goodwill to cash-generating units For the purpose of impairment testing, goodwill is allocated to Keyera’s CGUs which represent the lowest level within Keyera at which the goodwill is monitored for internal management purposes. The carrying amount of goodwill was allocated to CGUs as follows: As at December 31, (Thousands of Canadian dollars) 2020 2019 Liquids Infrastructure facilities 32,015 32,015 Rimbey gas plant 14,947 14,947 Simonette gas plant 8,799 8,799 Total goodwill 55,761 55,761 The recoverable amount for Keyera’s CGUs was determined based on a value in use calculation. At December 31, 2020, the discount rate used in the calculation of value in use was 11.2% for the Liquids Infrastructure facilities and Rimbey gas plant, and 11.9% for the Simonette gas plant (December 31, 2019 – 9.4% for all CGUs with allocated goodwill).
12. TRADE AND OTHER PAYABLES, AND PROVISIONS The components of trade and other payables, and provisions were as follows:
As at December 31, (Thousands of Canadian dollars)
2020
2019
Trade and accrued payables 347,894 463,358 Other payables 15,813 16,707 Current portion of long-term incentive plan 5,915 15,389 Current income taxes payable — 64,884 Total trade and other payables, and provisions 369,622 560,338
13. LONG-TERM DEBT
Carrying value Amounts recorded in the consolidated financial statements are referred to as carrying value. The carrying value of debt is reflected in current debt and long-term debt on the consolidated statements of financial position. Fair value The fair value of long-term debt is based on third party estimates for similar issues or current rates offered to Keyera for debt of the same maturity. The fair value of Keyera’s senior unsecured notes at December 31, 2020, as noted below was determined by reference to valuation inputs under Level 2 of the fair value hierarchy as referenced in note 22.

Keyera Corp. TSX: KEY 2020 Year End Report February 10, 2021
KEYERA CORP.
Notes to annual consolidated financial statements 98 All amounts expressed in thousands of Canadian dollars, except as otherwise noted
The following is a summary of Keyera’s current and long-term debt: _(Thousands of Canadian dollars)_
As at December 31, 2020
Effective Interest
Rate
Notes Carrying
Value Fair
Value Bank credit facilities 2.95% (a) 280,000 280,000 Total credit facilities 280,000 280,000 Canadian dollar denominated debt Senior unsecured notes:
6.14% due December 3, 2022 6.21% 60,000 63,500 3.50% due June 16, 2023 3.55% 30,000 30,300 4.91% due June 19, 2024 4.97% 17,000 18,000 4.92% due October 10, 2025 4.94% 100,000 106,200 5.05% due November 20, 2025 5.14% 20,000 21,400 4.15% due June 16, 2026 4.19% 30,000 30,900 3.96% due October 13, 2026 4.01% 200,000 204,100 3.68% due September 20, 2027 3.72% 400,000 400,400 5.09% due October 10, 2028 5.10% 100,000 109,200 4.11% due October 13, 2028 4.16% 100,000 102,600 5.34% due April 8, 2029 5.38% 75,000 83,200 1,132,000 1,169,800
Senior unsecured medium-term notes:
3.93% due June 21, 2028 4.00% 400,000 443,200 3.96% due May 29, 2030 4.02% (b) 400,000 440,000
Subordinated hybrid notes: 6.88% due June 13, 2079 6.89% (c) 600,000 646,300
2,532,000 2,699,300
U.S. dollar denominated debt Senior unsecured notes:
4.19% due June 19, 2024 (US$128,000)
4.24%
163,264
170,100
4.75% due November 20, 2025 (US$140,000)
4.81%
178,570
191,300
4.95% due November 20, 2028 (US$65,000)
4.99%
82,908
90,400
424,742 451,800 Less: Issuance costs (16,041) — Less: Current portion of long-term debt — — Total long-term debt 2,940,701 3,151,100

Keyera Corp. TSX: KEY 2020 Year End Report February 10, 2021
KEYERA CORP.
Notes to annual consolidated financial statements 99 All amounts expressed in thousands of Canadian dollars, except as otherwise noted
_(Thousands of Canadian dollars)_
As at December 31, 2019
Effective Interest
Rate
Notes Carrying
Value Fair
Value Bank credit facilities 3.30% (a) 90,000 90,000 Total credit facilities 90,000 90,000 Canadian dollar denominated debt Senior unsecured notes:
5.68% due September 8, 2020 5.75% 2,000 2,000 6.14% due December 3, 2022 6.21% 60,000 64,700 3.50% due June 16, 2023 3.55% 30,000 30,100 4.91% due June 19, 2024 4.97% 17,000 18,000 4.92% due October 10, 2025 4.94% 100,000 106,700 5.05% due November 20, 2025 5.14% 20,000 21,500 4.15% due June 16, 2026 4.19% 30,000 30,800 3.96% due October 13, 2026 4.01% 200,000 203,400 3.68% due September 20, 2027 3.72% 400,000 398,600 5.09% due October 10, 2028 5.10% 100,000 110,200 4.11% due October 13, 2028 4.16% 100,000 102,900 5.34% due April 8, 2029 5.38% 75,000 84,500 1,134,000 1,173,400
Senior unsecured medium-term notes:
3.93% due June 21, 2028 4.00% 400,000 417,400 Subordinated hybrid notes:
6.88% due June 13, 2079 6.89% (c) 600,000 625,500 2,134,000 2,216,300
U.S. dollar denominated debt Senior unsecured notes:
5.14% due September 8, 2020 (US$103,000)
5.22%
133,540
135,400
4.19% due June 19, 2024 (US$128,000)
4.24%
165,952
172,300
4.75% due November 20, 2025 (US$140,000)
4.81%
181,510
193,700
4.95% due November 20, 2028 (US$65,000)
4.99%
84,273
92,400
565,275 593,800 Less: Issuance costs (15,267) — Less: Current portion of long-term debt (135,540) (137,400) Total long-term debt 2,548,468 2,672,700

Keyera Corp. TSX: KEY 2020 Year End Report February 10, 2021
KEYERA CORP.
Notes to annual consolidated financial statements 100 All amounts expressed in thousands of Canadian dollars, except as otherwise noted
(a) On December 11, 2019, the Partnership amended its unsecured revolving credit facility (“Credit Facility”) with a syndicate of eight financial institutions under which it can borrow up to $1,500,000, with the potential to increase this limit to $1,850,000 subject to certain conditions. The Credit Facility has a five-year revolving term and the maturity date is December 6, 2024.
Financing costs of $1,057 were incurred upon the renewal and extension of the Credit Facility and have been deferred and are amortized using the effective interest method over the remaining term of the Credit Facility.
In addition, the Toronto Dominion Bank has provided a $25,000 unsecured revolving demand facility and the Royal Bank of Canada has provided a further unsecured revolving demand facility that is equal to the amount of outstanding letters of credit, up to $50,000. These unsecured revolving credit facilities bear interest based on the lenders’ rates for Canadian prime commercial loans, U.S. base rate loans, LIBOR loans, or bankers’ acceptances. As at December 31, 2020, outstanding letters of credit issued were $6,904 (December 31, 2019 – $6,543).
(b) On May 29, 2020, Keyera closed a public note offering of 10-year senior unsecured medium-term
notes to investors in Canada. The $400,000 senior unsecured notes bear interest at 3.959% per annum, paid semi-annually, and mature on May 29, 2030.
The associated financing costs of approximately $2,569 have been deferred and are amortized using the effective interest method over the remaining term of the debt.
(c) On June 13, 2019, Keyera closed a hybrid note offering of $600,000 of fixed-to-floating rate
subordinated notes due June 13, 2079 to investors in Canada. The interest rate of 6.875% is paid semi-annually and is fixed from June 13, 2019 to June 13, 2029. Commencing June 13, 2029, on every interest reset date (September 13, December 13, March 13, and June 13) until June 13, 2049, the interest rate will be reset to the three-month banker’s acceptance rate plus 5.17%. Commencing June 13, 2049, on every interest rate reset date until June 13, 2079, the interest rate will be reset to the three-month banker’s acceptance rate plus 5.92%. On or after June 13, 2029, the hybrid notes are subject to optional redemption by Keyera without the consent of the holders, whereby Keyera may redeem the notes in whole at any time, or in part on any interest payment date. The hybrid notes are also subject to an automatic conversion feature under certain bankruptcy and insolvency events. Upon an automatic conversion event, the notes will automatically be converted, without the consent of the note holders, into a newly issued series of First Preferred Shares (Preference Shares, Series 2019-A), that will carry the right to receive cumulative preferential cash dividends at the same rate as the interest rate that would have accrued on the notes. The fair value of the automatic conversion feature was deemed to be nominal at inception. The associated financing costs of approximately $5,429 have been deferred and are amortized using the effective interest method over the remaining term of the debt.
14. DECOMMISSIONING LIABILITY
Keyera estimates the future costs of decommissioning for its gathering and processing, fractionation, iso-octane and storage facilities, pipelines and terminals on a discounted basis upon acquisition or installation of these assets. The total undiscounted amount of cash flows required to settle the decommissioning liability is $1,062,815 (2019 – $1,020,718) which has been discounted using a credit-adjusted risk-free rate of 4.2% (2019 – 4.3%). The majority of these costs are expected to be incurred over the next 25 to 55 years. While the provision is based on the best estimate of future costs and the

Keyera Corp. TSX: KEY 2020 Year End Report February 10, 2021
KEYERA CORP.
Notes to annual consolidated financial statements 101 All amounts expressed in thousands of Canadian dollars, except as otherwise noted
economic lives of the facilities and pipelines, there is uncertainty regarding the amount and timing of these costs. No assets have been legally restricted for settlement of the liability. The following is a reconciliation of the beginning and ending carrying amount of the obligation associated with the decommissioning of Keyera’s assets: As at December 31, (Thousands of Canadian dollars) 2020 2019
Decommissioning liability, beginning of the year1 249,753 262,313 Liabilities acquired — 19 Liabilities settled (15,617) (9,628) Change in estimated cash flows and additions 19,912 10,877 Change in discount rate 6,757 41,840 Change in estimated timing of settlement 26,109 (65,895) Unwinding of discount included in finance costs 11,203 10,294 Foreign currency translation 61 (67) Decommissioning liability, end of the year 298,178 249,753
Note: 1 Effective December 31, 2019, Keyera voluntarily changed its accounting policy to utilize a credit-adjusted risk-free interest rate to
calculate the present value of its decommissioning liabilities. Previously, the company utilized a risk-free rate. The change in accounting policy was applied retrospectively. Refer to note 2 of the consolidated financial statements as at and for the year ended December 31, 2019 for additional details.
As at December 31, (Thousands of Canadian dollars) 2020 2019
Current portion of decommissioning liability 15,520 16,533 Long-term portion of decommissioning liability 282,658 233,220 Decommissioning liability, end of the year 298,178 249,753
15. LEASE LIABILITIES
As at December 31, (Thousands of Canadian dollars) 2020 2019
Lease liabilities, beginning of the year 248,457 202,698 Additions 6,349 98,905 Interest on leases 9,938 10,349 Lease payments (49,416) (52,647) Foreign exchange re-measurement and other (3,404) (10,848) Total lease liabilities, end of the year 211,924 248,457 Less: current portion of lease liabilities (36,082) (38,470) Long-term lease liabilities 175,842 209,987
Keyera’s most significant lease payments are incurred for rail car, pipeline transportation and real estate arrangements. The longest initial lease term for Keyera’s lease contracts is 15 years. For certain lease arrangements, Keyera has the option to extend the lease for additional terms, up to 5 years each. As at December 31, 2020, the incremental borrowing rates used to measure lease liabilities was 3.9% for Canadian dollar denominated leases, and 4.2% or 4.5% for U.S. dollar denominated leases.

Keyera Corp. TSX: KEY 2020 Year End Report February 10, 2021
KEYERA CORP.
Notes to annual consolidated financial statements 102 All amounts expressed in thousands of Canadian dollars, except as otherwise noted
(Thousands of Canadian dollars) 2020 2019
Variable lease payments1 1,939 708 Short-term and low-value leases 2,439 2,024 Total lease payments expensed for the period 4,378 2,732
Note: 1 The variable lease payments recognized have been reduced for lease incentives received. Total variable lease payments prior to
the inclusion of the lease incentives was $2,860 for the year ended December 31, 2020 (2019 – $3,275).
The variable lease payments primarily relate to operating expenses and property taxes for real estate contracts. Short-term leases include certain contracts which have a lease term that is 12 months or less. Low-value lease arrangements include certain contracts whereby the value of the underlying asset is of low-value, and are therefore insignificant to Keyera.
16. OTHER LIABILITIES
As at December 31, (Thousands of Canadian dollars) 2020 2019 Long-term incentive plan 6,951 11,012 Other liabilities 3,733 5,900 Total other liabilities 10,684 16,912
17. INCOME TAXES
The components of the income tax expense were as follows: (Thousands of Canadian dollars) 2020 2019
Current income taxes Current income tax charge (43,326) 97,435 Adjustments with respect to current income tax of the previous year (1,578) 618 Current income tax (recovery) expense (44,904) 98,053
Deferred income taxes Related to the origination and reversal of temporary differences 54,251 (80,726) Adjustments to opening deferred tax balances 1,774 (530) Deferred income tax expense (recovery) 56,025 (81,256) Total income tax expense 11,121 16,797
The following is a reconciliation of income taxes, calculated at the combined federal and provincial income tax rate, to the income tax provision included in the consolidated statements of net earnings and comprehensive income. (Thousands of Canadian dollars) 2020 2019 Earnings before income tax 73,151 460,406 Income tax at statutory rate of 23.99% (2019 – 26.5%) 17,549 122,008 Decrease in valuation allowance 189 (3,980) Permanent differences (1,147) (4,793) Effect of reduction in tax rate (1,164) (95,753) Tax rate differences and adjustments (4,864) (27) Adjustments to tax pool balances 145 88 Other 413 (746) Total income tax expense 11,121 16,797

Keyera Corp. TSX: KEY 2020 Year End Report February 10, 2021
KEYERA CORP.
Notes to annual consolidated financial statements 103 All amounts expressed in thousands of Canadian dollars, except as otherwise noted
Deferred tax balances (Thousands of Canadian dollars) 2020 2019 Deferred tax assets 29,560 18,826 Deferred tax liabilities (612,467) (544,789) Net deferred tax liabilities (582,907) (525,963)
The deferred tax (liabilities) assets relate to losses and to the (taxable) deductible temporary differences in the carrying values and tax bases as follows:
Consolidated Statements of
Financial Position Consolidated Statements
of Net Earnings as at December 31, Years ended December 31,
(Thousands of Canadian dollars) 2020 2019 2020 2019 Property, plant and equipment (728,448) (671,320) 56,694 43,052 Intangible assets (238) 801 989 569 Lease liabilities 48,839 58,305 9,437 (58,305) Non-capital losses 16,255 13,698 (2,955) 13,289 Partnership deferral — — — (71,958) Decommissioning liability 68,699 57,553 (11,210) 13,877 Other 11,986 15,000 3,070 (21,780) Net deferred tax liabilities (582,907) (525,963) Deferred income tax expense (recovery) 56,025 (81,256)
Reconciliation of net deferred tax liabilities (Thousands of Canadian dollars) 2020 2019 Balance at the beginning of the year (525,963) (606,341) Income tax (expense) recovery recognized in net earnings (56,025) 81,256 Revaluation of foreign net deferred tax liabilities (919) (878) Balance at the end of the year (582,907) (525,963)
Deferred tax assets are recognized for tax loss carry-forwards to the extent that the realization of the related tax benefit through future taxable profits is probable. The ability to realize the tax benefits of these losses is dependent upon a number of factors, including the future profitability of operations in the jurisdictions in which the tax losses arose. As at December 31, 2020, Keyera and its subsidiaries have non-capital losses carried forward of $67,536 (2019 – $57,084) which are available to offset income of specific entities of the consolidated group in future periods. The amount of unrecognized net capital losses and other assets as at December 31, 2020 was $7,909 (2019 – $7,122).

Keyera Corp. TSX: KEY 2020 Year End Report February 10, 2021
KEYERA CORP.
Notes to annual consolidated financial statements 104 All amounts expressed in thousands of Canadian dollars, except as otherwise noted
18. SHARE CAPITAL
(Thousands of
Canadian dollars)
Number of
Common Shares Share Capital Balance at December 31, 2018 210,478,743 2,846,496 Common shares issued pursuant to dividend
reinvestment plans 7,437,050 226,704 Balance at December 31, 2019 217,915,793 3,073,200 Common shares issued pursuant to dividend
reinvestment plans 3,107,080 77,154 Issuance costs — (250) Balance at December 31, 2020 221,022,873 3,150,104 Dividend Reinvestment Plan In April 2020, Keyera discontinued the regular and premium components of the dividend reinvestment plan (the “Plan”), effective with the May 2020 dividend payout. As a result, shareholders who were participating in either component of the Plan received the full cash dividend declared beginning with the dividend paid in May 2020. Prior to discontinuance, Keyera’s dividend reinvestment plan consisted of two components: a Premium DividendTM (“Premium DRIP”) reinvestment component and a regular dividend reinvestment component (“DRIP”). The DRIP component allowed eligible shareholders of Keyera to direct their cash dividends to be reinvested in additional shares issued from treasury at a 3% discount to the Average Market Price on the applicable dividend date without Keyera incurring typical financing costs. The Premium DRIP component permitted eligible shareholders to elect to have the additional shares issued at the 3% discount delivered to the designated Plan Broker in exchange for a premium cash payment equal to 101% of the regular, declared cash dividend.
For the year ended December 31, 2020, dividends declared totaled $423,485 or $1.92 per common share (2019 – $396,862 or $1.85 per common share).
19. EARNINGS PER SHARE
Basic earnings per share was calculated by dividing net earnings by the weighted average number of shares outstanding for the related period. (Thousands of Canadian dollars, except per share amounts) 2020 2019 Basic and diluted earnings per share 0.28 2.07 Net earnings – basic and diluted 62,030 443,609
(Thousands) 2020 2019 Weighted average number of shares – basic and diluted 220,442 214,186

Keyera Corp. TSX: KEY 2020 Year End Report February 10, 2021
KEYERA CORP.
Notes to annual consolidated financial statements 105 All amounts expressed in thousands of Canadian dollars, except as otherwise noted
20. ACCUMULATED DIVIDENDS TO SHAREHOLDERS The following table presents the reconciliation between the beginning and ending accumulated dividends to shareholders.
(Thousands of Canadian dollars) Balance at December 31, 2018 2,548,366 Dividends declared and paid 361,995 Dividends declared 34,867 Balance at December 31, 2019 2,945,228 Dividends declared and paid 388,121 Dividends declared 35,364 Balance at December 31, 2020 3,368,713
Keyera's general practice is to pay a monthly dividend on the closest business day to the 15th of each calendar month to shareholders of record as of the dividend record date, which is usually 20 to 26 days prior to the dividend payment date. Keyera's dividend policy is to provide shareholders with relatively stable and predictable monthly dividends, while retaining a portion of cash flow to fund ongoing growth projects. The amount of dividends to be paid on the common shares, if any, is subject to the discretion of the board of directors and may vary depending on a variety of factors. In determining the level of dividends to be declared each month, the board of directors takes into consideration such factors as current and expected future levels of distributable cash flow, capital expenditures, borrowings and debt repayments, changes in working capital requirements and other factors.
21. SHARE-BASED COMPENSATION AND PENSION PLANS Long-Term Incentive Plan Keyera has a Long-Term Incentive Plan (“LTIP”) which compensates officers and key employees by delivering shares of Keyera or paying cash in lieu of shares. Participants in the LTIP are granted rights (“share awards”) to receive shares of Keyera on specified dates in the future. Grants of share awards are authorized by the board of directors. Shares delivered to employees are acquired in the marketplace and not issued from treasury. The acquired shares are placed in a trust account established for the benefit of the participants until the share awards vest.
The LTIP consists of two types of share awards, which are described below: (a) Performance Awards
All Performance Awards issued and outstanding are settled on or before September 1st following the third anniversary of the grant date. The number of shares to be delivered will be determined by the financial performance of Keyera over the three-year period. The number of shares to be delivered will be calculated by multiplying the number of share awards by an adjustment ratio and a payout multiplier. The adjustment ratio adjusts the number of shares to be delivered to reflect the per share cash dividends paid by Keyera to its shareholders during the term that the share award is outstanding. The payout multiplier is based 70% on the average annual pre-tax distributable cash flow per share over the performance period of three years and 30% on the relative total shareholder return in a defined peer group over the performance period of three years.

Keyera Corp. TSX: KEY 2020 Year End Report February 10, 2021
KEYERA CORP.
Notes to annual consolidated financial statements 106 All amounts expressed in thousands of Canadian dollars, except as otherwise noted
(b) Time Vested Awards (“Restricted Awards”)
Restricted Awards are settled in three equal installments over a three-year period regardless of the performance of Keyera. The number of shares to be delivered will be multiplied by an adjustment ratio which reflects the per share cash dividends paid by Keyera to its shareholders during the term that the share award is outstanding. The LTIP is accounted for using the liability method and is measured at fair value at each statement of financial position date until the award is settled. The fair value of the liability is measured by applying a fair value pricing model whereby one of the valuation inputs was the December 31, 2020 share price of Keyera, which was $22.62 per share (December 31, 2019 – $34.02 per share). The compensation cost recorded for the LTIP was as follows:
(Thousands of Canadian dollars) 2020 2019 Performance Awards (2,665) 22,715 Restricted Awards 1,543 3,419 Total long-term incentive plan (recovery) expense (1,122) 26,134
The table below shows the number of share awards granted: Share awards granted as at December 31, December 31, Share Award Series 2020 2019 Issued July 1, 2017 – Performance Awards — 317,168 Issued July 1, 2018 – Performance Awards 341,477 401,812 Issued July 1, 2019 – Performance Awards 483,536 544,975 Issued July 1, 2020 – Performance Awards 833,981 — Issued July 1, 2017 – Restricted Awards — 21,998 Issued July 1, 2018 – Restricted Awards 25,134 57,926 Issued July 1, 2019 – Restricted Awards 57,008 98,207 Issued July 1, 2020 – Restricted Awards 146,708 —
Employee Stock Purchase Plan Keyera maintains an employee stock purchase plan (“ESPP”) whereby eligible employees can purchase common shares of Keyera. Keyera will contribute an amount equal to 5% of the employee’s contribution. To participate in the ESPP, eligible employees select an amount to be deducted from their semi-monthly remuneration. Employees may elect to withhold up to 25% of their base compensation for the stock purchases. The shares of Keyera are acquired on the Toronto Stock Exchange on a semi-monthly basis consistent with the timing of the semi-monthly remuneration. The cost of the shares purchased to match the employee’s contribution is expensed as incurred and recorded in general and administrative expenses. Defined Contribution Pension Plan For the year ended December 31, 2020, Keyera made pension contributions of $10,151 (2019 – $10,365) on behalf of its employees. The contributions were recorded in general and administrative expenses.

Keyera Corp. TSX: KEY 2020 Year End Report February 10, 2021
KEYERA CORP.
Notes to annual consolidated financial statements 107 All amounts expressed in thousands of Canadian dollars, except as otherwise noted
Deferred Share Unit Plan Effective January 1, 2016, Keyera implemented a deferred share unit (“DSU”) plan, for non-employee directors. Each DSU vests on the date the grant is awarded but cannot be redeemed until a director ceases to be a member of the board of directors. The grant value is determined based on a 20 day weighted average trading share price. DSUs are settled in cash (on an after-tax basis) based on the 20 day weighted average Keyera share price up to the date of termination. For the year ended December 31, 2020, Keyera recorded $377 (2019 – $1,662) in general and administrative expenses related to the DSU plan.
The following table reconciles the number of DSUs outstanding:
2020 2019 Balance at the beginning of the year 97,573 80,521 Granted 58,029 36,983 Redeemed — (19,931) Balance at the end of the year 155,602 97,573
22. FINANCIAL INSTRUMENTS AND RISK MANAGEMENT
Financial instruments include cash, trade and other receivables, derivative financial instruments, bank indebtedness, trade and other payables, dividends payable, current and long-term lease liabilities, credit facilities, current and long-term debt, and certain other long-term liabilities. Derivative financial instruments include foreign exchange contracts, cross-currency swaps, NGLs, crude oil, motor gasoline and natural gas price contracts, electricity price contracts and physical fixed price commodity contracts. Derivative instruments are measured at fair value through profit or loss in the consolidated statements of net earnings and comprehensive income. All other financial instruments are measured at amortized cost.
Financial Instruments (a) Fair value Fair value represents Keyera’s estimate of the price at which a financial instrument could be exchanged between knowledgeable and willing parties in an orderly arm’s length transaction motivated by normal business considerations. Fair value measurement of assets and liabilities recognized on the consolidated statements of financial position are categorized into levels within a fair value hierarchy based on the nature of valuation inputs. The fair value hierarchy has the following levels: - Level 1: quoted prices in active markets for identical assets or liabilities; - Level 2: inputs other than quoted prices included within Level 1 that are observable for the asset
or liability, either directly or indirectly; and - Level 3: inputs for the asset or liability that are not based on observable market data.
All of Keyera’s derivative instruments are classified as Level 2 as their fair value is derived by using observable inputs, including commodity price curves, foreign currency curves and credit spreads. For fixed price forward contracts, fair value is derived from observable NGL market prices. Financial instruments with fair value equal to carrying value The carrying values of cash, trade and other receivables, trade and other payables and dividends payable approximate their fair values because the instruments are either near maturity, have 5 to 30 days payment terms or have no fixed repayment terms. The carrying value of the credit facility approximates fair value due to their floating rates of interest.
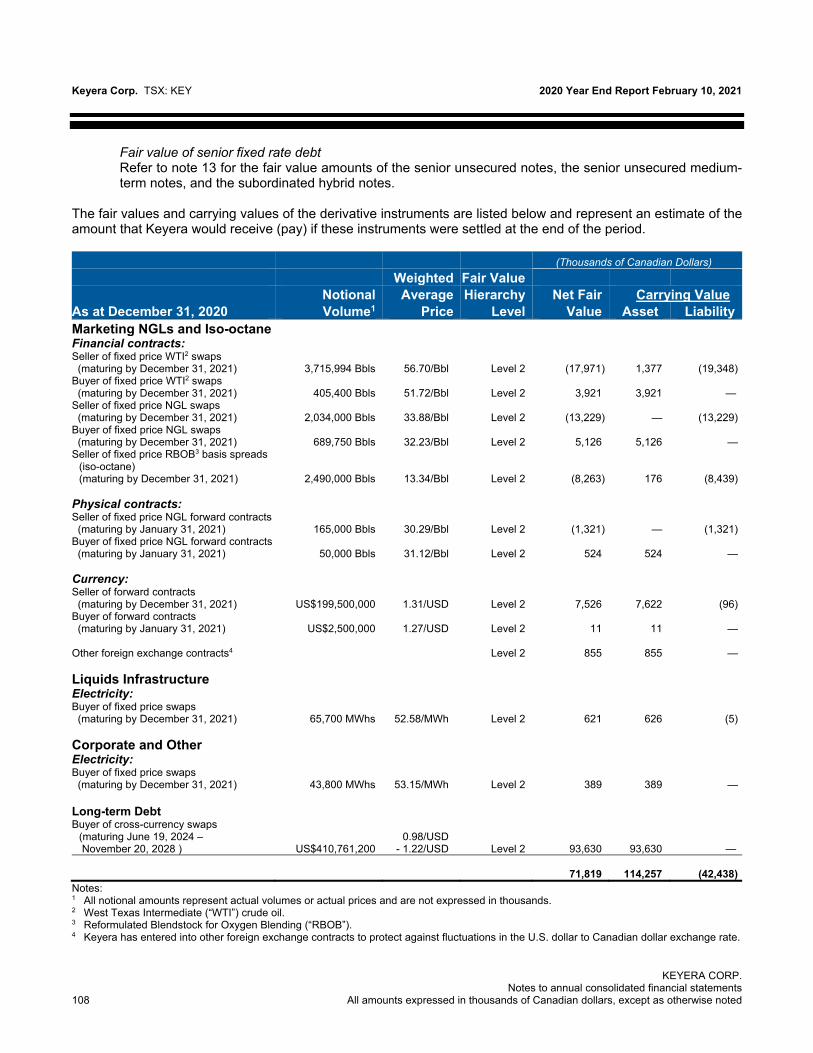
Keyera Corp. TSX: KEY 2020 Year End Report February 10, 2021
KEYERA CORP.
Notes to annual consolidated financial statements 108 All amounts expressed in thousands of Canadian dollars, except as otherwise noted
Fair value of senior fixed rate debt Refer to note 13 for the fair value amounts of the senior unsecured notes, the senior unsecured medium-term notes, and the subordinated hybrid notes.
The fair values and carrying values of the derivative instruments are listed below and represent an estimate of the amount that Keyera would receive (pay) if these instruments were settled at the end of the period. (Thousands of Canadian Dollars)
Weighted Fair Value Notional Average Hierarchy Net Fair Carrying Value As at December 31, 2020 Volume1 Price Level Value Asset Liability Marketing NGLs and Iso-octane Financial contracts: Seller of fixed price WTI2 swaps (maturing by December 31, 2021)
3,715,994 Bbls
56.70/Bbl
Level 2
(17,971)
1,377
(19,348)
Buyer of fixed price WTI2 swaps (maturing by December 31, 2021)
405,400 Bbls
51.72/Bbl
Level 2
3,921
3,921
—
Seller of fixed price NGL swaps (maturing by December 31, 2021)
2,034,000 Bbls
33.88/Bbl
Level 2
(13,229) —
(13,229)
Buyer of fixed price NGL swaps (maturing by December 31, 2021)
689,750 Bbls
32.23/Bbl
Level 2
5,126
5,126 —
Seller of fixed price RBOB3 basis spreads (iso-octane) (maturing by December 31, 2021)
2,490,000 Bbls
13.34/Bbl
Level 2
(8,263)
176
(8,439) Physical contracts: Seller of fixed price NGL forward contracts (maturing by January 31, 2021)
165,000 Bbls
30.29/Bbl
Level 2
(1,321)
—
(1,321)
Buyer of fixed price NGL forward contracts (maturing by January 31, 2021)
50,000 Bbls
31.12/Bbl
Level 2
524
524
—
Currency: Seller of forward contracts (maturing by December 31, 2021)
US$199,500,000
1.31/USD
Level 2 7,526
7,622
(96)
Buyer of forward contracts (maturing by January 31, 2021)
US$2,500,000
1.27/USD
Level 2
11
11
—
Other foreign exchange contracts4 Level 2 855 855 — Liquids Infrastructure Electricity: Buyer of fixed price swaps (maturing by December 31, 2021)
65,700 MWhs
52.58/MWh
Level 2
621
626
(5)
Corporate and Other Electricity: Buyer of fixed price swaps (maturing by December 31, 2021)
43,800 MWhs
53.15/MWh
Level 2
389
389
—
Long-term Debt Buyer of cross-currency swaps
(maturing June 19, 2024 – November 20, 2028 )
US$410,761,200
0.98/USD
- 1.22/USD
Level 2
93,630
93,630
—
71,819 114,257
(42,438) Notes: 1 All notional amounts represent actual volumes or actual prices and are not expressed in thousands. 2 West Texas Intermediate (“WTI”) crude oil. 3 Reformulated Blendstock for Oxygen Blending (“RBOB”). 4 Keyera has entered into other foreign exchange contracts to protect against fluctuations in the U.S. dollar to Canadian dollar exchange rate.

Keyera Corp. TSX: KEY 2020 Year End Report February 10, 2021
KEYERA CORP.
Notes to annual consolidated financial statements 109 All amounts expressed in thousands of Canadian dollars, except as otherwise noted
(Thousands of Canadian Dollars)
Weighted Fair Value Notional Average Hierarchy Net Fair Carrying Value As at December 31, 2019 Volume1 Price Level Value Asset Liability Marketing NGLs and Iso-octane Financial contracts: Seller of fixed price WTI2 swaps (maturing by December 31, 2020)
4,419,479 Bbls
74.85/Bbl
Level 2
(13,876)
989
(14,865)
Buyer of fixed price WTI2 swaps (maturing by December 31, 2020)
1,116,000 Bbls
73.42/Bbl
Level 2
5,065
5,486
(421)
Seller of fixed price NGL swaps (maturing by December 31, 2020)
1,660,200 Bbls
37.91/Bbl
Level 2
9,651
9,777
(126)
Buyer of fixed price NGL swaps (maturing by December 31, 2020)
1,800,400 Bbls
41.44/Bbl
Level 2
(11,771)
628
(12,399)
Seller of fixed price RBOB3 basis spreads (iso-octane) (maturing by December 31, 2020)
1,920,000 Bbls
19.59/Bbl
Level 2
1,257
3,679
(2,422) Physical contracts: Seller of fixed price NGL forward contracts (maturing by January 31, 2020)
130,000 Bbls
24.94/Bbl
Level 2
464
464
—
Buyer of fixed price NGL forward contracts (maturing by January 31, 2020)
105,000 Bbls
27.12/Bbl
Level 2
(533)
—
(533)
Currency: Seller of forward contracts (maturing by June 30, 2020)
US$146,500,000
1.33/USD
Level 2
4,303
4,303
—
Liquids Infrastructure Electricity: Buyer of fixed price swaps (maturing by December 31, 2020)
131,760 MWhs
57.55/MWh
Level 2
144
501
(357)
Corporate and Other Electricity: Buyer of fixed price swaps (maturing by December 31, 2020)
43,920 MWhs
56.15/MWh
Level 2
109
199
(90)
Long-term Debt Buyer of cross-currency swaps
(maturing September 8, 2020 –November 20, 2028 )
US$534,286,100
0.98/USD
- 1.22/USD
Level 2
124,009
124,009
—
118,822
150,035
(31,213) Notes: 1 All notional amounts represent actual volumes or actual prices and are not expressed in thousands. 2 West Texas Intermediate (“WTI”) crude oil. 3 Reformulated Blendstock for Oxygen Blending (“RBOB”).

Keyera Corp. TSX: KEY 2020 Year End Report February 10, 2021
KEYERA CORP.
Notes to annual consolidated financial statements 110 All amounts expressed in thousands of Canadian dollars, except as otherwise noted
Derivative instruments are recorded on the consolidated statements of financial position at fair value. Changes in the fair value of these financial instruments are recognized through profit or loss in the consolidated statements of net earnings and comprehensive income in the period in which they arise. Unrealized gains (losses), representing the change in fair value of derivative contracts, are recorded in the following consolidated statements of net earnings and comprehensive income line items and the related reportable operating segments: Derivative Contracts Related To
Reportable Operating Segments
Consolidated Net Earnings and Comprehensive Income Line Item
Natural gas, crude oil and NGLs, and iso-octane
Marketing Corporate and Other
Marketing revenue; Corporate and Other revenue
Electricity Liquids Infrastructure Gathering and Processing Corporate and Other
Liquids Infrastructure expenses; Gathering and Processing expenses; Corporate and Other revenues and
expenses
Cross-currency swaps Corporate and Other Net foreign currency gain/(loss) on U.S. debt and other
Unrealized gain (loss) (Thousands of Canadian dollars) 2020 2019 Marketing revenue (17,381) (47,912) Liquids infrastructure operating expenses 477 (856) Gathering and processing expenses — (664) Corporate and Other: Corporate and Other revenues and expenses 280 (162) Change in fair value of the cross currency swaps on U.S. debt1 (30,379) (8,800)
Total unrealized loss (47,003) (58,394) Note: 1 Includes principal and interest portion.
Risk Management Market risk is the risk that the fair value of future cash flows of a financial asset or a financial liability will fluctuate because of changes in market prices. Market risk is comprised of commodity price risk, interest rate risk, and foreign currency risk, as well as credit and liquidity risks. (b) Commodity price risk Subsidiaries of Keyera enter into contracts to purchase and sell primarily NGLs and iso-octane, as well as natural gas and crude oil. These contracts are exposed to commodity price risk between the time when contracted volumes are purchased and sold, and foreign currency risk for those sales denominated in U.S. dollars. These risks are actively managed by utilizing physical and financial contracts which include commodity-related forward contracts, price swaps and forward currency contracts. A risk management committee meets regularly to review and assess the risks inherent in existing contracts and the effectiveness of the risk management strategies. This is achieved by modeling future sales and purchase contracts to monitor the sensitivity of changing prices and volumes. Significant amounts of electricity and natural gas are consumed by certain facilities. In order to mitigate the exposure to fluctuations in the prices of electricity and natural gas, price swap agreements may be used. These agreements are accounted for as derivative instruments.

Keyera Corp. TSX: KEY 2020 Year End Report February 10, 2021
KEYERA CORP.
Notes to annual consolidated financial statements 111 All amounts expressed in thousands of Canadian dollars, except as otherwise noted
Certain NGL contracts that require physical delivery at fixed prices are accounted for as derivative instruments. (c) Foreign currency risk Foreign currency risk arises on financial instruments that are denominated in a foreign currency. Keyera’s foreign currency risk largely arises from the Marketing segment where a significant portion of sales and purchases are denominated in U.S. dollars. Foreign currency risk is actively managed by using forward currency contracts and cross-currency swaps. Management monitors the exposure to foreign currency risk and regularly reviews its financial instrument activities and all outstanding positions. The Gathering and Processing and Liquids Infrastructure segments have very little foreign currency risk as sales and purchases are primarily denominated in Canadian dollars.
Keyera is also exposed to foreign currency risk related to its U.S. dollar denominated long-term debt and U.S. dollar denominated LIBOR loans when drawn under Keyera’s bank credit facility. To manage this currency exposure, Keyera has entered into long-term cross-currency swap contracts relating to the principal portion and future interest payments of the U.S. dollar denominated debt. These cross-currency contracts are accounted for as derivative instruments. Refer to note 23 for a summary of the foreign currency gains (losses) associated with the U.S. dollar denominated long-term debt.
(d) Interest rate risk The majority of Keyera’s interest rate risk is attributed to its fixed and floating rate debt, which is used to finance capital investments and operations. Keyera’s remaining financial instruments are not significantly exposed to interest rate risk. The floating rate debt creates exposure to interest rate cash flow risk, whereas the fixed rate debt creates exposure to interest rate price risk. As at December 31, 2020, fixed rate borrowings comprised 91% of total debt outstanding (December 31, 2019 – 97%). The fair value of future cash flows for fixed rate debt fluctuates with changes in market interest rates. It is Keyera’s intention to not repay fixed rate debt until maturity and therefore future cash flows would not fluctuate. (e) Credit risk The majority of trade and other receivables are due from entities in the oil and gas industry and are subject to normal industry credit risks. Concentration of credit risk is mitigated by having a broad domestic and international customer base. Keyera evaluates and monitors the financial strength of its customers in accordance with its credit policy. Keyera does not typically renegotiate the terms of trade receivables. There were no significant renegotiated balances outstanding at December 31, 2020. With respect to counterparties for derivative financial instruments, the credit risk is managed through dealing primarily with recognized futures exchanges or investment grade financial institutions and by maintaining credit policies which significantly reduce overall counterparty credit risk. In addition, Keyera incorporates the credit risk associated with counterparty default, as well as Keyera’s own credit risk, into the estimates of fair value. The allowance for credit losses is reviewed on a monthly basis. An assessment is made whether an account is deemed impaired based on expected credit losses, which includes the number of days outstanding and the likelihood of collection from the counterparty. As a result of the decline in economic conditions at the beginning of the year, Keyera increased its allowance for expected credit losses by $2,500 during the first quarter of 2020. As certain market conditions have improved, it was determined that a further increase to the allowance was not required for the remainder of the year. As at December 31, 2020, the total allowance was $4,241 (2019 – $1,741). The carrying amount of financial assets on the consolidated statements of financial position approximates Keyera’s maximum exposure to credit risk.

Keyera Corp. TSX: KEY 2020 Year End Report February 10, 2021
KEYERA CORP.
Notes to annual consolidated financial statements 112 All amounts expressed in thousands of Canadian dollars, except as otherwise noted
(f) Liquidity risk Liquidity risk is the risk that suitable sources of funding for Keyera’s business activities may not be available. Keyera manages liquidity risk by maintaining bank credit facilities, continuously managing forecast and actual cash flows and monitoring the maturity profiles of financial assets and financial liabilities. Keyera has access to a wide range of funding at competitive rates through capital markets and banks to meet the immediate and ongoing requirements of the business. The following table shows the contractual maturities for financial liabilities of Keyera as at December 31, 2020:
(Thousands of Canadian dollars) Total
2021
2022
2023
2024
2025 After 2025
Trade and other payables 369,622 369,622 — — — — — Derivative financial instruments 42,438 42,438 — — — — —
Dividends payable 35,364 35,364 — — — — —
Credit facility 280,000 — — — 280,000 — —
Long-term debt1 2,956,742 — 60,000 30,000 180,264 298,570 2,387,908
Lease liabilities2 261,672 44,115 35,764 24,633 22,296 20,756 114,108
Other liabilities 10,684 — 4,683 6,001 — — —
3,956,522 491,539 100,447 60,634 482,560 319,326 2,502,016 Notes: 1 Amounts represent principal only and exclude accrued interest. 2 Amounts represent the expected undiscounted cash payments related to leases.

Keyera Corp. TSX: KEY 2020 Year End Report February 10, 2021
KEYERA CORP.
Notes to annual consolidated financial statements 113 All amounts expressed in thousands of Canadian dollars, except as otherwise noted
Risk Management Sensitivities The following table summarizes the sensitivity of the fair value of Keyera’s risk management positions to fluctuations in commodity price, interest rate, and foreign currency rate. Fluctuations in commodity prices, foreign currency rate and interest rate changes could have resulted in unrealized gains (losses) affecting income before tax as follows:
Impact on income before tax
Impact on income before tax
Risk sensitivities (Thousands of Canadian dollars)
December 31, 2020 December 31, 2019 Increase (Decrease) Increase (Decrease)
Commodity price changes
+ 10% in electricity price 679 — 1,030 —
- 10% in electricity price — (679) — (1,030) + 10% in NGL, crude oil and iso-octane prices — (30,513) — (28,494) - 10% in NGL, crude oil and iso-octane prices 30,513 — 28,494 —
Foreign currency rate changes + $0.01 in U.S./Canadian dollar exchange
rate
—
(2,273)
—
(1,762) - $0.01 in U.S./Canadian dollar exchange rate
2,273
—
1,762
—
Interest rate changes
+ 1% in interest rate — (2,800) — (900)
- 1% in interest rate 2,800 — 900 —
23. NET FOREIGN CURRENCY GAIN (LOSS) ON U.S. DEBT AND OTHER
The components of net foreign currency gain (loss) on U.S. debt and other were as follows: (Thousands of Canadian dollars) 2020 2019
Foreign currency gain (loss) resulting from:
Translation of long-term debt and interest payable 4,676 29,861 Change in fair value of the cross-currency swaps – principal and interest portion
(30,379)
(8,800)
Gain from cross-currency swaps – principal and interest portion1 31,771 3,116 Foreign exchange re-measurement of lease liabilities and other 3,353 10,175
Total net foreign currency gain on U.S. debt and other 9,421 34,352 Note: 1 Foreign currency gains resulted from the exchange of currencies related to the settlement of principal and interest payments on
the long-term cross-currency swaps.

Keyera Corp. TSX: KEY 2020 Year End Report February 10, 2021
KEYERA CORP.
Notes to annual consolidated financial statements 114 All amounts expressed in thousands of Canadian dollars, except as otherwise noted
24. CAPITAL MANAGEMENT Keyera’s objectives when managing capital are:
to safeguard Keyera’s ability to continue as a going concern; to maintain financial flexibility in order to fund investment opportunities and meet financial
obligations; and to distribute to shareholders a significant portion of the current cash flow of its subsidiaries, after
I. satisfaction of debt service obligations (principal and interest) and income tax expenses, II. satisfaction of any reclamation funding requirements, III. providing for maintenance capital expenditures, and IV. retaining reasonable reserves for administrative and other expense obligations and
reasonable reserves for working capital and capital expenditures as may be considered appropriate.
Keyera defines its capital as shareholders’ equity, long-term debt, credit facilities, and working capital (defined as current assets less current liabilities). Keyera manages its capital structure and makes adjustments to it in light of changes in economic conditions and the risk characteristics of the underlying assets. In order to maintain or adjust the capital structure, Keyera may adjust the amount of dividends paid to shareholders, issue new shares, issue new debt or replace existing debt with new debt having different characteristics. For the year ended December 31, 2020, Keyera’s capital management strategy was unchanged from the prior year. Keyera monitors its capital structure primarily based on its consolidated net debt to consolidated earnings before interest, taxes, depreciation, amortization, accretion, unrealized gains and losses, impairment expenses and any other non-cash items (“adjusted EBITDA”) ratio. The definition of adjusted EBITDA for capital management purposes is similar, but not identical to the adjusted EBITDA financial measure used in the calculation of Keyera’s financial covenants on its credit facilities and private long-term debt agreements. This ratio is calculated as consolidated net debt divided by a twelve-month trailing adjusted EBITDA, which are non-GAAP measures. For purposes of this financial covenant, Keyera has the ability to increase its Net Debt to EBITDA ratio from 4.0 to 4.5 for periods of up to four consecutive fiscal quarters. In addition, Keyera can utilize the cross-currency swap rates in the calculation of debt rather than the spot rate as at each statement of financial position date. Keyera is also subject to the following financial covenants: (i) adjusted EBITDA to consolidated interest charges, and (ii) priority debt to consolidated total assets. The calculation for each of these financial covenants is based on specific definitions and is not in accordance with GAAP, and cannot be directly derived from the consolidated financial statements. Keyera was in compliance with all financial covenants as at December 31, 2020.
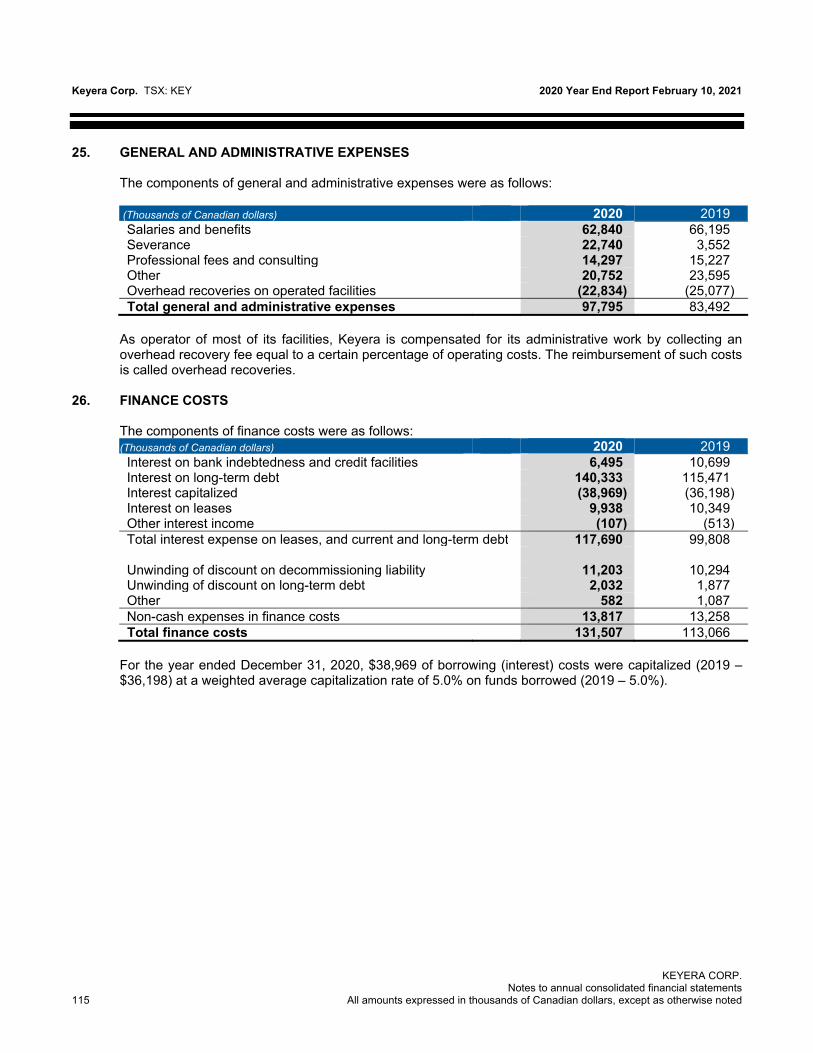
Keyera Corp. TSX: KEY 2020 Year End Report February 10, 2021
KEYERA CORP.
Notes to annual consolidated financial statements 115 All amounts expressed in thousands of Canadian dollars, except as otherwise noted
25. GENERAL AND ADMINISTRATIVE EXPENSES The components of general and administrative expenses were as follows: (Thousands of Canadian dollars) 2020 2019
Salaries and benefits 62,840 66,195 Severance 22,740 3,552 Professional fees and consulting 14,297 15,227 Other 20,752 23,595 Overhead recoveries on operated facilities (22,834) (25,077)
Total general and administrative expenses 97,795 83,492 As operator of most of its facilities, Keyera is compensated for its administrative work by collecting an overhead recovery fee equal to a certain percentage of operating costs. The reimbursement of such costs is called overhead recoveries.
26. FINANCE COSTS The components of finance costs were as follows: (Thousands of Canadian dollars) 2020 2019
Interest on bank indebtedness and credit facilities 6,495 10,699 Interest on long-term debt 140,333 115,471 Interest capitalized (38,969) (36,198) Interest on leases 9,938 10,349 Other interest income (107) (513) Total interest expense on leases, and current and long-term debt 117,690 99,808 Unwinding of discount on decommissioning liability 11,203 10,294 Unwinding of discount on long-term debt 2,032 1,877 Other 582 1,087 Non-cash expenses in finance costs 13,817 13,258
Total finance costs 131,507 113,066 For the year ended December 31, 2020, $38,969 of borrowing (interest) costs were capitalized (2019 – $36,198) at a weighted average capitalization rate of 5.0% on funds borrowed (2019 – 5.0%).

Keyera Corp. TSX: KEY 2020 Year End Report February 10, 2021
KEYERA CORP.
Notes to annual consolidated financial statements 116 All amounts expressed in thousands of Canadian dollars, except as otherwise noted
27. DEPRECIATION, DEPLETION AND AMORTIZATION The components of depreciation, depletion and amortization expense were as follows: (Thousands of Canadian dollars) 2020 2019
Depreciation and depletion on property, plant and equipment 232,817 214,609 Depreciation on right-of-use assets 49,688 55,862 Amortization of intangible assets 7,911 7,821 Total depreciation, depletion and amortization expenses 290,416 278,292
28. RELATED PARTY TRANSACTIONS
Key management personnel are comprised of Keyera’s board of directors and executive officers. Compensation of key management personnel was as follows: (Thousands of Canadian dollars) 2020 2019
Salaries and other short-term benefits 9,076 11,425 Post-employment benefits 365 375 Termination benefits 4,626 — Share-based payments 5,364 6,642 Total related party transactions 19,431 18,442
29. SUPPLEMENTAL CASH FLOW INFORMATION
Details of changes in non-cash working capital from operating activities were as follows:
(Thousands of Canadian dollars) 2020 2019
Inventory (82,413) 134,543 Trade and other receivables 68,531 (66,572) Other assets (2,131) (780) Trade and other payables, and provisions (106,250) 66,490 Changes in non-cash working capital from operating activities (122,263) 133,681
Details of changes in non-cash working capital from investing activities were as follows:
(Thousands of Canadian dollars) 2020 2019
Trade and other payables, and provisions (87,977) (34,025) Changes in non-cash working capital from investing activities (87,977) (34,025)

Keyera Corp. TSX: KEY 2020 Year End Report February 10, 2021
KEYERA CORP.
Notes to annual consolidated financial statements 117 All amounts expressed in thousands of Canadian dollars, except as otherwise noted
Reconciliation of liabilities arising from financing activities:
(Thousands of Canadian dollars) Credit
Facilities
Current and Long-term
Debt
Derivative Financial
Assets Related To
U.S. Long-term
Borrowings
Current and Long-term
Lease Liabilities
As at December 31, 2018 80,000 2,243,355 132,809 — Cash changes: Inflows from borrowings 810,000 600,000 — — Outflows related to repayments (800,000) (126,019) — (52,647) Outflows related to financing costs
— (5,462) — 10,349
Non-cash and other changes: Lease liabilities recognized upon the adoption of IFRS 16 — — — 202,698 Lease additions — — — 98,905 Fair value changes — — (8,800) — Unrealized foreign exchange and other — (29,743) — (10,848) Unwinding of discount on long- term debt — 1,877 — —
As at December 31, 2019 90,000 2,684,008 124,009 248,457 Cash changes: Inflows from borrowings 560,000 400,000 — — Outflows related to repayments (370,000) (137,893) — (49,416) Outflows related to financing
costs
— (2,807) — 9,938 Non-cash and other changes: Lease additions — — — 6,349 Fair value changes — — (30,379) — Unrealized foreign exchange and other — (4,639) — (3,404) Unwinding of discount on long-
term debt — 2,032 — — As at December 31, 2020 280,000 2,940,701 93,630 211,924

Keyera Corp. TSX: KEY 2020 Year End Report February 10, 2021
KEYERA CORP.
Notes to annual consolidated financial statements 118 All amounts expressed in thousands of Canadian dollars, except as otherwise noted
30. SEGMENT INFORMATION
Keyera has the following four reportable operating segments based on the nature of its business activities: Gathering and Processing The Gathering and Processing segment includes raw gas gathering systems and processing plants located in the natural gas production areas primarily on the western side of the Western Canada Sedimentary Basin. The operations primarily involve providing natural gas gathering and processing, including liquids extraction and condensate stabilization services to customers. This segment also includes sales of ethane volumes extracted from the Rimbey facility and sold to a third-party customer under a long-term commercial arrangement. Liquids Infrastructure The Liquids Infrastructure segment provides fractionation, storage, transportation and terminalling services for NGLs and crude oil. As well, it provides processing services to Keyera’s Marketing business related to NGLs, iso-octane and liquids blending. These services are provided to customers through an extensive network of facilities that include underground NGL storage caverns, NGL fractionation and de-ethanization facilities, NGL pipelines, rail and truck terminals, the AEF facility, a 50% interest in the Base Line Terminal, and the Oklahoma Liquids Terminal. Marketing The Marketing segment is primarily involved in the marketing of NGLs, such as propane, butane, and condensate; and iso-octane to customers in Canada and the United States, as well as liquids blending. Corporate and Other The Corporate and Other segment includes corporate functions and the production of natural gas, NGLs and crude oil.

Keyera Corp. TSX: KEY 2020 Year End Report February 10, 2021
KEYERA CORP.
Notes to annual consolidated financial statements 119 All amounts expressed in thousands of Canadian dollars, except as otherwise noted
Inter-segment and intra-segment sales and expenses are recorded at current market prices at the date of the transaction. These transactions are eliminated on consolidation in order to arrive at net earnings in accordance with IFRS. The following table shows the operating margin from each of Keyera’s operating segments and includes inter-segment transactions. Operating margin is a key measure used by management to monitor profitability by segment.
Year ended December 31, 2020 (Thousands of Canadian dollars)
Gathering & Processing
Liquids Infrastructure Marketing
Corporate and Other
Inter-segment Eliminations
Total
Segmented revenue 501,942 567,788 2,276,679 10,703 (344,602) 3,012,510 Segmented expenses (241,691) (168,164) (1,999,443) (7,276) 344,602 (2,071,972) Operating margin 260,251 399,624 277,236 3,427 — 940,538 General and administrative expenses — — — (97,795) — (97,795) Finance costs — — — (131,507) — (131,507) Depreciation, depletion and amortization expenses — — — (290,416) — (290,416) Net foreign currency gain on U.S. debt and other — — — 9,421 — 9,421 Long-term incentive plan recovery — — — 1,122 — 1,122 Impairment expense (317,455) (53,850) — — — (371,305) Other — — — 13,093 — 13,093 Earnings (loss) before income tax (57,204) 345,774 277,236 (492,655) — 73,151 Income tax expense — — — (11,121) — (11,121) Net earnings (loss) (57,204) 345,774 277,236 (503,776) — 62,030
Year ended December 31, 2019 (Thousands of Canadian dollars)
Gathering & Processing
Liquids Infrastructure Marketing
Corporate and Other
Inter-segment Eliminations
Total
Segmented revenue 513,452 544,318 2,879,757 21,167 (341,772) 3,616,922 Segmented expenses (219,736) (167,918) (2,554,769) (12,138) 341,772 (2,612,789) Operating margin 293,716 376,400 324,988 9,029 — 1,004,133 General and administrative expenses — — — (83,492) — (83,492) Finance costs — — — (113,066) — (113,066) Depreciation, depletion and amortization expenses — — — (278,292) — (278,292) Net foreign currency gain on U.S. debt and other — — — 34,352 — 34,352 Long-term incentive plan expense — — — (26,134) — (26,134) Impairment expense (77,095) — — — — (77,095) Earnings (loss) before income tax 216,621 376,400 324,988 (457,603) — 460,406 Income tax expense — — — (16,797) — (16,797) Net earnings (loss) 216,621 376,400 324,988 (474,400) — 443,609

Keyera Corp. TSX: KEY 2020 Year End Report February 10, 2021
KEYERA CORP.
Notes to annual consolidated financial statements 120 All amounts expressed in thousands of Canadian dollars, except as otherwise noted
DISAGGREGATION OF REVENUE The following table shows revenue disaggregated by the major service lines offered by Keyera in its four reportable operating segments: Year ended December 31, 2020 (Thousands of Canadian dollars)
Gathering & Processing
Liquids Infrastructure Marketing
Corporate and Other
Total
Gas handling and processing services1 426,975 106,100 — — 533,075 Fractionation and storage services 11,890 239,843 — — 251,733 Transportation and terminalling services — 220,768 — — 220,768 Marketing of NGLs and iso-octane — — 2,276,679 — 2,276,679 Other2 63,077 1,077 — 10,703 74,857 Revenue before inter-segment eliminations 501,942 567,788 2,276,679 10,703 3,357,112
Inter-segment revenue eliminations (19,763) (298,892) (15,344) (10,603) (344,602)
Revenue from external customers 482,179 268,896 2,261,335 100 3,012,510 Year ended December 31, 2019 (Thousands of Canadian dollars)
Gathering & Processing
Liquids Infrastructure Marketing
Corporate and Other
Total
Gas handling and processing services1 450,000 107,975 — — 557,975 Fractionation and storage services 10,803 223,754 — — 234,557 Transportation and terminalling services — 211,109 — — 211,109 Marketing of NGLs and iso-octane — — 2,879,757 — 2,879,757 Other2 52,649 1,480 — 21,167 75,296 Revenue before inter-segment eliminations 513,452 544,318 2,879,757 21,167 3,958,694
Inter-segment revenue eliminations (22,051) (286,986) (11,410) (21,325) (341,772)
Revenue from external customers 491,401 257,332 2,868,347 (158) 3,616,922 Notes: 1 Processing services revenue recognized in Keyera’s Liquids Infrastructure segment represents the processing fees charged to Keyera’s
Marketing segment for the production of iso-octane at the Keyera AEF facility. 2 Other revenue in Keyera’s Gathering and Processing segment includes sales of ethane volumes extracted from the Rimbey facility and sold
to a third party customer, and other miscellaneous revenue. Other revenue recognized in Keyera’s Corporate and Other segment relates to the production of oil and gas reserves.
Contract Balances Contract liabilities are recorded when consideration has been received from a customer prior to Keyera’s fulfillment of its obligation to provide future services. Contract liabilities primarily relate to consideration received under take-or-pay contract arrangements whereby the customer has the ability to exercise accumulated make-up rights prior to their expiry. Contract liabilities also arise when Keyera receives non-cash consideration or up-front payments from customers for the performance of future services. As at December 31, 2020 contract liabilities were $nil (December 31, 2019 – $nil) as there were no unperformed obligations related to customer make-up rights that were material and Keyera did not receive any non-cash consideration or up-front customer payments that required revenue deferral. Contract assets are recorded when Keyera performs services for customers in advance of receiving consideration from the customer or before payment is due. As at December 31, 2020 contract assets were $nil (December 31, 2019 – $nil). All instances whereby Keyera’s performance obligations were satisfied prior to receiving consideration from the customer were unconditional and therefore have been presented as a receivable.

Keyera Corp. TSX: KEY 2020 Year End Report February 10, 2021
KEYERA CORP.
Notes to annual consolidated financial statements 121 All amounts expressed in thousands of Canadian dollars, except as otherwise noted
Geographical information Keyera operates in two geographical areas, Canada and the U.S. Keyera’s revenue from external customers and information about its non-current assets by geographical location are detailed below based on the country of origin. Revenue from external customers located in (Thousands of Canadian dollars) 2020 2019 Canada 2,461,614 2,939,018 U.S. 550,896 677,904
Total revenue 3,012,510 3,616,922 Non-current assets1 as at December 31, (Thousands of Canadian dollars) 2020 2019 Canada 6,307,491 6,328,560 U.S. 485,053 414,634
Total non-current assets 6,792,544 6,743,194 Note: ¹ Non-current assets are comprised of property, plant and equipment, right-of-use assets, intangible assets, and goodwill.
Information about major customers Keyera did not earn revenues from a single external customer that accounted for more than 10% of its total revenue for the years ended December 31, 2020 and 2019.
31. OTHER
For the year ended December 31, 2020, $13,093 (2019 – $nil) of income was recorded from the Canada Emergency Wage Subsidy (“CEWS”) program, which was passed by the Government of Canada in April 2020 as part of its COVID-19 Economic Response Plan.
32. COMMITMENTS AND CONTINGENCIES Keyera, through its operating entities, has assumed commitments in various contractual purchase agreements in the normal course of its operations. The agreements involve the purchase of NGL production from producers in the areas specified in the agreements. The purchase prices are based on then current market prices. The future volumes and prices for these contracts cannot be reasonably determined and therefore no amount has been included in purchase obligations to reflect these contractual agreements. In addition, Keyera has service obligations relating to terminal storage and natural gas transportation, and third party contractual obligations related to assets under construction. The estimated annual minimum payments due for these commitments are as follows: 2021 208,004 2022 17,746 2023 4,205 2024 2,856 2025 2,737 Thereafter 798 Total commitments 236,346

Keyera Corp. TSX: KEY 2020 Year End Report February 10, 2021
KEYERA CORP.
Notes to annual consolidated financial statements 122 All amounts expressed in thousands of Canadian dollars, except as otherwise noted
33. SUBSEQUENT EVENTS On January 12, 2021, Keyera declared a dividend of $0.16 per share, payable on February 16, 2021 to shareholders of record as of January 22, 2021.

Keyera Corp. TSX: KEY 2020 Year End Report February 10, 2021
KEYERA CORP. 123
Additional Information
Fourth Quarter Results
Three months ended December 31, Consolidated Statements of Net Earnings and Comprehensive Income
(Thousands of Canadian dollars) (Unaudited) 2020 2019 Revenues 709,452 985,166 Expenses (543,939) (722,725) Operating margin 165,513 262,441 General and administrative expenses (22,863) (28,532) Finance costs (37,919) (30,729) Depreciation, depletion and amortization expenses (89,798) (85,542) Net foreign currency gain on U.S. debt and other 4,022 5,332 Long-term incentive plan expense (6,161) (5,540) Impairment expense (123,454) (77,095) Other 9,657 — (Loss) earnings before income tax (101,003) 40,335 Income tax recovery (expense) 26,226 (10,617) Net (loss) earnings (74,777) 29,718 Other comprehensive loss Foreign currency translation adjustment (18,759) (8,589) Comprehensive (loss) income (93,536) 21,129 Weighted average number of shares (in thousands) - basic 221,023 216,938 - diluted 221,023 216,938 (Loss) earnings per share $ $ - basic (0.34) 0.14 - diluted (0.34) 0.14

Keyera Corp. TSX: KEY 2020 Year End Report February 10, 2021
KEYERA CORP. 124
Consolidated Statements of Cash Flows (Thousands of Canadian dollars)
Three months ended December 31,
(unaudited) 2020 2019
Cash provided by (used in): OPERATING ACTIVITIES Net (loss) earnings (74,777) 29,718 Adjustments for items not affecting cash:
Finance costs 5,836 5,401 Depreciation, depletion and amortization expenses 89,798 85,542 Unrealized loss on derivative financial instruments 46,433 44,527 Unrealized gain on foreign exchange (24,893) (14,462) Deferred income tax recovery (5,742) (18,848) Impairment expense 123,454 77,095
Decommissioning liability expenditures (4,297) (8,102) Changes in non-cash working capital (39,366) 12,805
Net cash provided by operating activities 116,446 213,676 INVESTING ACTIVITIES Acquisitions (240) (50) Capital expenditures (87,018) (283,454) Prepaid lease asset (66,166) — Proceeds on disposal of property, plant, and equipment — 104 Changes in non-cash working capital (22,690) 1,111
Net cash used in investing activities (176,114) (282,289) FINANCING ACTIVITIES Borrowings under credit facilities 250,000 170,000 Repayments under credit facilities (80,000) (80,000) Financing costs related to credit facilities/long-term debt (35) — Issuance costs related to equity offering and other — — Proceeds from issuance of shares related to DRIP — 61,758 Lease payments (12,073) (12,878) Dividends paid to shareholders (106,091) (103,959)
Net cash provided by financing activities 51,801 34,921 Effect of exchange rate fluctuations on foreign cash held (836) (328) Net decrease in cash (8,703) (34,020) Cash, start of period 11,604 43,334 Cash, end of period 2,901 9,314

Keyera Corp. TSX: KEY 2020 Year End Report February 10, 2021
KEYERA CORP. 125
SUPPLEMENTAL CASH FLOW INFORMATION
Details of changes in non-cash working capital from operating activities were as follows:
Three months ended
December 31, (Thousands of Canadian dollars) (unaudited) 2020 2019 Inventory (20,141) 39,536 Trade and other receivables (66,358) (85,766) Other assets 6,780 6,554 Trade and other payables, and provisions 40,353 52,481 Changes in non-cash working capital from operating activities (39,366) 12,805
Details of changes in non-cash working capital from investing activities were as follows:
Three months ended
December 31, (Thousands of Canadian dollars) (unaudited) 2020 2019 Trade and other payables, and provisions (22,690) 1,111 Changes in non-cash working capital from investing activities (22,690) 1,111
The following amounts are included in Cash Flows from Operating Activities:
Three months ended
December 31, (Thousands of Canadian dollars) (unaudited) 2020 2019 Income taxes paid in cash 468 9,973 Interest paid in cash 67,648 60,764

Keyera Corp. TSX: KEY 2020 Year End Report February 10, 2021
KEYERA CORP. 126
SEGMENT INFORMATION The following table shows the operating margin from each of Keyera’s operating segments and includes inter-segment transactions. Operating margin is a key measure used by management to monitor profitability by segment.
Three months ended December 31, 2020 (Thousands of Canadian dollars) (unaudited)
Gathering & Processing
Liquids Infrastructure Marketing
Corporate and Other
Inter-segment Eliminations
Total
Segmented revenue 139,826 148,487 513,581 2,892 (95,334) 709,452 Segmented expenses (62,861) (50,157) (525,620) (635) 95,334 (543,939) Operating margin (loss) 76,965 98,330 (12,039) 2,257 — 165,513 General and administrative expenses — — — (22,863) — (22,863) Finance costs — — — (37,919) — (37,919) Depreciation, depletion and amortization expenses — — — (89,798) — (89,798) Net foreign currency gain on U.S. debt and other — — — 4,022 — 4,022 Long-term incentive plan expense — — — (6,161) — (6,161) Impairment expense (123,454) — — — — (123,454) Other — — — 9,657 — 9,657 Earnings (loss) before income tax (46,489) 98,330 (12,039) (140,805) — (101,003) Income tax recovery — — — 26,226 — 26,226 Net earnings (loss) (46,489) 98,330 (12,039) (114,579) — (74,777)
Three months ended December 31, 2019 (Thousands of Canadian dollars) (unaudited)
Gathering & Processing
Liquids Infrastructure Marketing
Corporate and Other
Inter-segment Eliminations
Total
Segmented revenue 143,736 142,885 783,899 5,772 (91,126) 985,166 Segmented expenses (62,858) (51,580) (696,524) (2,889) 91,126 (722,725) Operating margin 80,878 91,305 87,375 2,883 — 262,441 General and administrative expenses — — — (28,532) — (28,532) Finance costs — — — (30,729) — (30,729) Depreciation, depletion and amortization expenses — — — (85,542) — (85,542) Net foreign currency gain on U.S. debt and other — — — 5,332 — 5,332 Long-term incentive plan expense — — — (5,540) — (5,540) Impairment expense (77,095) — — — — (77,095) Earnings (loss) before income tax 3,783 91,305 87,375 (142,128) — 40,335 Income tax expense — — — (10,617) — (10,617) Net earnings (loss) 3,783 91,305 87,375 (152,745) — 29,718
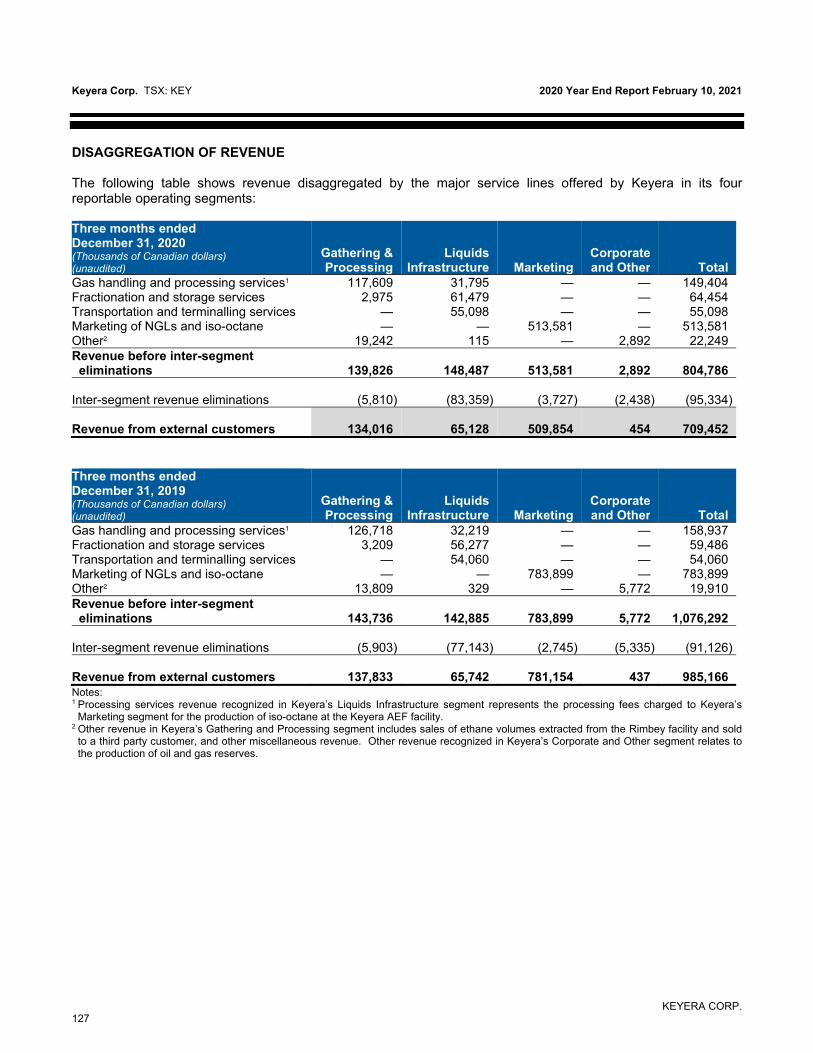
Keyera Corp. TSX: KEY 2020 Year End Report February 10, 2021
KEYERA CORP. 127
DISAGGREGATION OF REVENUE The following table shows revenue disaggregated by the major service lines offered by Keyera in its four reportable operating segments: Three months ended December 31, 2020 (Thousands of Canadian dollars) (unaudited)
Gathering & Processing
Liquids Infrastructure Marketing
Corporate and Other
Total
Gas handling and processing services1 117,609 31,795 — — 149,404 Fractionation and storage services 2,975 61,479 — — 64,454 Transportation and terminalling services — 55,098 — — 55,098 Marketing of NGLs and iso-octane — — 513,581 — 513,581 Other2 19,242 115 — 2,892 22,249 Revenue before inter-segment eliminations 139,826 148,487 513,581 2,892 804,786
Inter-segment revenue eliminations (5,810) (83,359) (3,727) (2,438) (95,334)
Revenue from external customers 134,016 65,128 509,854 454 709,452 Three months ended December 31, 2019 (Thousands of Canadian dollars) (unaudited)
Gathering & Processing
Liquids Infrastructure Marketing
Corporate and Other
Total
Gas handling and processing services1 126,718 32,219 — — 158,937 Fractionation and storage services 3,209 56,277 — — 59,486 Transportation and terminalling services — 54,060 — — 54,060 Marketing of NGLs and iso-octane — — 783,899 — 783,899 Other2 13,809 329 — 5,772 19,910 Revenue before inter-segment eliminations 143,736 142,885 783,899 5,772 1,076,292
Inter-segment revenue eliminations (5,903) (77,143) (2,745) (5,335) (91,126)
Revenue from external customers 137,833 65,742 781,154 437 985,166 Notes: 1 Processing services revenue recognized in Keyera’s Liquids Infrastructure segment represents the processing fees charged to Keyera’s
Marketing segment for the production of iso-octane at the Keyera AEF facility. 2 Other revenue in Keyera’s Gathering and Processing segment includes sales of ethane volumes extracted from the Rimbey facility and sold
to a third party customer, and other miscellaneous revenue. Other revenue recognized in Keyera’s Corporate and Other segment relates to the production of oil and gas reserves.

Keyera Corp. TSX: KEY 2020 Year End Report February 10, 2021
KEYERA CORP. 128
Corporate Information Board of Directors
Officers
Jim V. Bertram (1) Corporate Director Calgary, Alberta Douglas Haughey (2)(4) Corporate Director Calgary, Alberta Blair Goertzen (5) Corporate Director Red Deer, Alberta Gianna Manes (5) Corporate Director Fort Mill, South Carolina Donald J. Nelson (4)(5) President Fairway Resources Inc. Calgary, Alberta Michael Norris (3) Corporate Director Toronto, Ontario Thomas C. O’Connor (3) Corporate Director Denver, Colorado Charlene Ripley (4) Executive Vice President and General Counsel SNC-Lavalin Vancouver, British Columbia C. Dean Setoguchi President and Chief Executive Officer Keyera Corp. Calgary, Alberta Janet Woodruff (3) Corporate Director West Vancouver, British Columbia (1) Chair of the Board (2) Independent Lead Director (3) Member of the Audit Committee (4) Member of the Compensation and Governance Committee (5) Member of the Health, Safety and Environment Committee
Head Office Keyera Corp. Suite 200, Sun Life Plaza West Tower 144 – 4th Avenue S.W. Calgary, Alberta T2P 3N4 Main phone: 403-205-8300 Website: www.keyera.com
C. Dean Setoguchi President and Chief Executive Officer Bradley W. Lock Senior Vice President and Chief Operating Officer Eileen Marikar Senior Vice President and Chief Financial Officer Jamie Urquhart Senior Vice President and Chief Commercial Officer Nancy L. Brennan Senior Vice President, General Counsel and Corporate Secretary Dion O. Kostiuk Senior Vice President, Human Resources and Corporate Services Jarrod Beztilny Vice President, Operations, Gathering and Processing Kelly Hill Vice President, Information Technology John Hunszinger Vice President, Operations, Liquids Infrastructure Brian Martin Vice President, Business Development Bradley Slessor Vice President, New Ventures and U.S. Operations
Stock Exchange Listing The Toronto Stock Exchange Trading Symbol KEY
Trading Summary for Q4 2020 TSX:KEY – Cdn $ High $24.07 Low $18.05 Close December 31, 2020 $22.62 Volume 113,686,865 Average Daily Volume
1,804,553
Auditors Deloitte LLP Chartered Professional Accountants Calgary, Canada
Investor Relations Contact: Dan Cuthbertson, Calvin Locke or Beata Graham Toll Free: 1-888-699-4853 Direct: 403-205-7670 Email: [email protected]