xrf and sem-eds - the international centre for diffraction ... and sem-eds.pdf · xrf and sem‐eds...
TRANSCRIPT
XRF and SEM‐EDS
• Using the PDF for material identification using elemental data from XRF and SEM‐EDS.
XRF and SEM‐EDSWhat?
The Powder Diffraction File contains data on pure solid statecompounds of well defined elemental composition.
XRF and SEM-EDS methods can provide an experimentaldetermination of a specimen’s elemental composition.
By matching experimental composition data to the databaseentries, materials can be identified. The more elements positively identified in the XRF or SEM-EDS experiment, the more narrow the selection of candidate phases will be.
If additional data are used, such as physical properties (color, density) or chemical properties, a unique solution can often be identified.
XRF and SEM‐EDSWhy?
Scientists have long recognized that using multiple observationsof a specimen increases the probability of a successful identification.
The Powder Diffraction File is designed as a database for materialidentification. While characteristic diffraction and crystallographic data are a primary tool used in the database, other characteristicsof a material are input into the database or calculated to increase the chances of a successful identification.
Elemental composition has been experimentally determined or calculated for all entries in the Powder Diffraction File.
Elemental data, from an XRF or SEM-EDS, are often available in global analysis and materials characterization facilities.
XRF and SEM‐EDSHow?
All entries in the PDF have calculated atomic and weight percent compositions. The former was designed for use with EDS data and the latter with XRF analyses.
The PDF has composition searches so that experimental data can be compared to the references in the database. ESD’s and elemental ranges can be applied to the search.
XRF and SEM‐EDSHow?
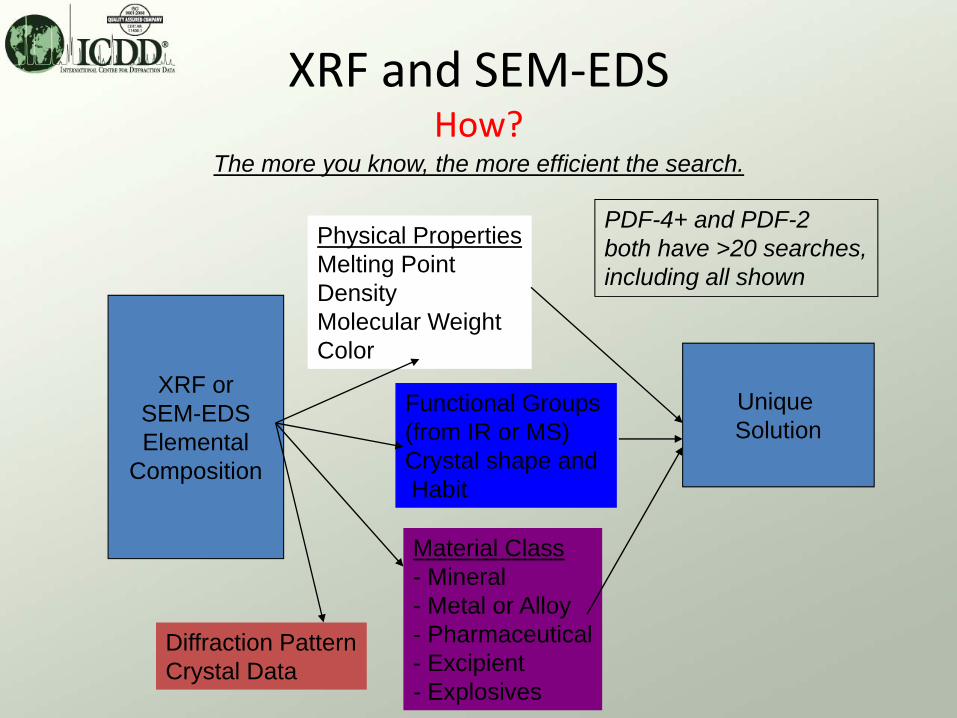
The more you know, the more efficient the search.
XRF orSEM-EDSElemental
Composition
Physical PropertiesMelting PointDensityMolecular WeightColor
Diffraction PatternCrystal Data
Material Class- Mineral- Metal or Alloy- Pharmaceutical- Excipient- Explosives
Functional Groups (from IR or MS)Crystal shape andHabit
Unique Solution
PDF-4+ and PDF-2both have >20 searches,including all shown
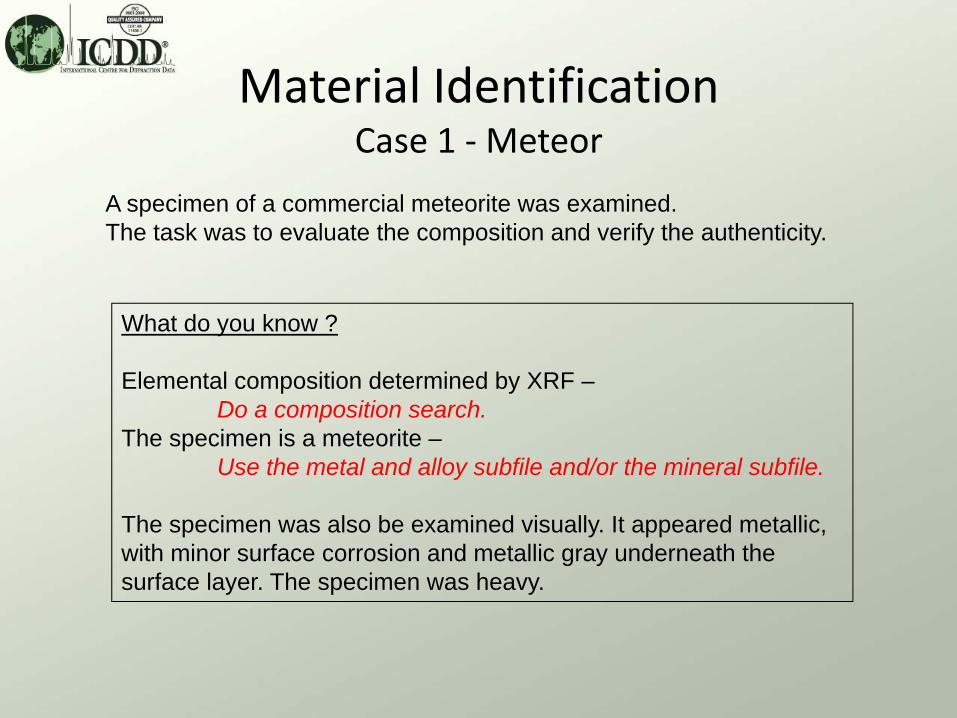
Material IdentificationCase 1 ‐Meteor
A specimen of a commercial meteorite was examined.The task was to evaluate the composition and verify the authenticity.
What do you know ?
Elemental composition determined by XRF –Do a composition search.
The specimen is a meteorite –Use the metal and alloy subfile and/or the mineral subfile.
The specimen was also be examined visually. It appeared metallic, with minor surface corrosion and metallic gray underneath the surface layer. The specimen was heavy.
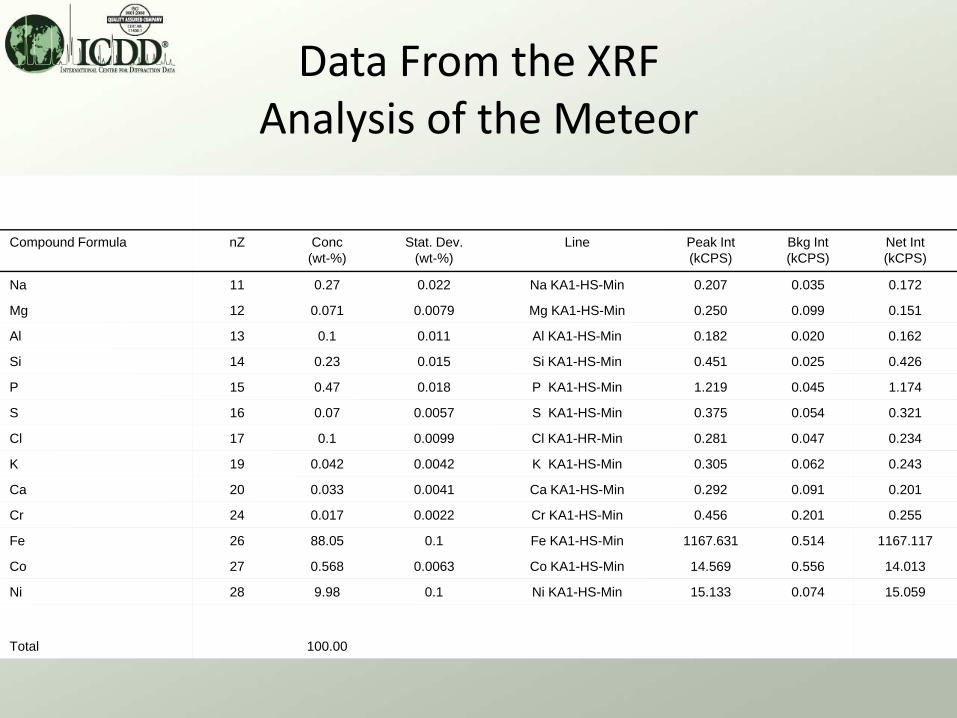
Data From the XRF Analysis of the Meteor
Compound Formula nZ Conc(wt-%)
Stat. Dev.(wt-%)
Line Peak Int(kCPS)
Bkg Int(kCPS)
Net Int(kCPS)
Na 11 0.27 0.022 Na KA1-HS-Min 0.207 0.035 0.172
Mg 12 0.071 0.0079 Mg KA1-HS-Min 0.250 0.099 0.151
Al 13 0.1 0.011 Al KA1-HS-Min 0.182 0.020 0.162
Si 14 0.23 0.015 Si KA1-HS-Min 0.451 0.025 0.426
P 15 0.47 0.018 P KA1-HS-Min 1.219 0.045 1.174
S 16 0.07 0.0057 S KA1-HS-Min 0.375 0.054 0.321
Cl 17 0.1 0.0099 Cl KA1-HR-Min 0.281 0.047 0.234
K 19 0.042 0.0042 K KA1-HS-Min 0.305 0.062 0.243
Ca 20 0.033 0.0041 Ca KA1-HS-Min 0.292 0.091 0.201
Cr 24 0.017 0.0022 Cr KA1-HS-Min 0.456 0.201 0.255
Fe 26 88.05 0.1 Fe KA1-HS-Min 1167.631 0.514 1167.117
Co 27 0.568 0.0063 Co KA1-HS-Min 14.569 0.556 14.013
Ni 28 9.98 0.1 Ni KA1-HS-Min 15.133 0.074 15.059
Total 100.00
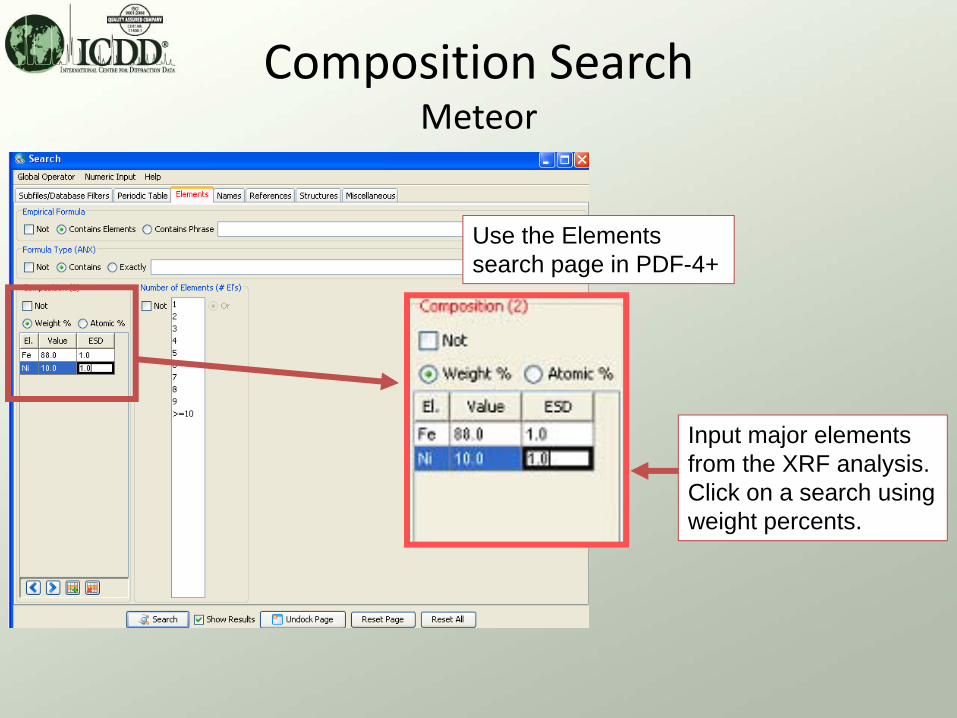
Composition SearchMeteor
Use the Elements search page in PDF-4+
Input major elementsfrom the XRF analysis. Click on a search usingweight percents.
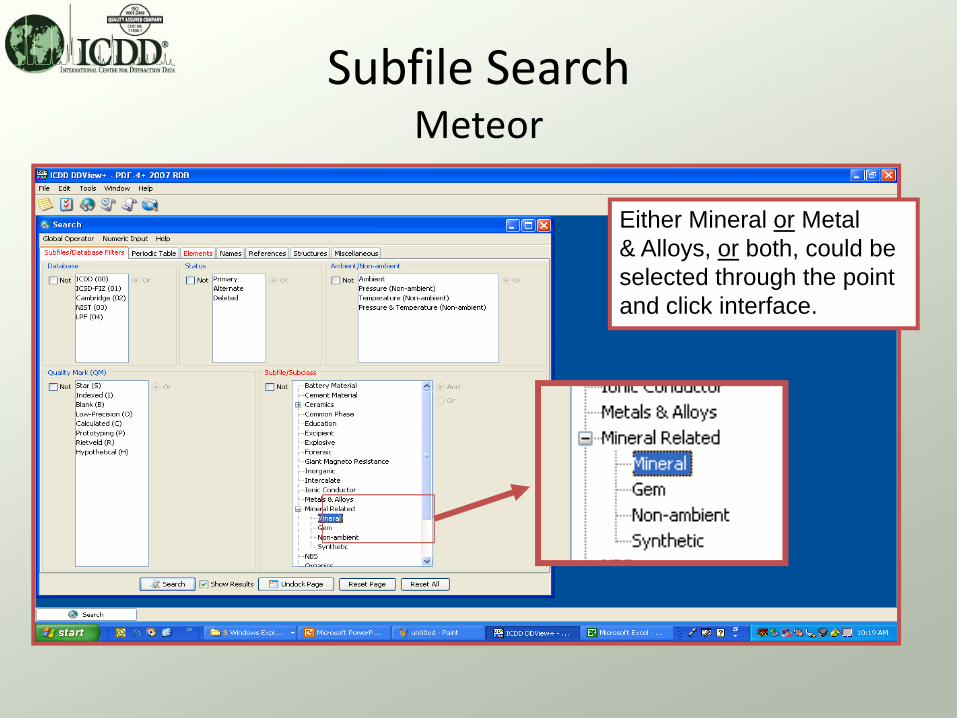
Subfile SearchMeteor
Either Mineral or Metal& Alloys, or both, could be selected through the pointand click interface.
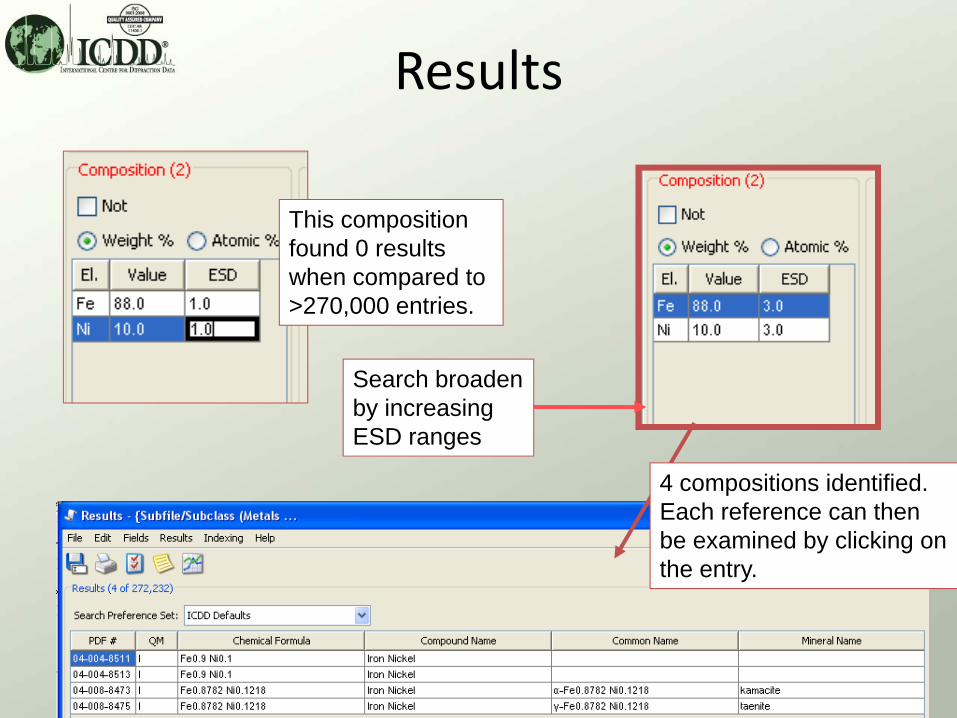
Results
This composition found 0 results when compared to >270,000 entries.
Search broadenby increasingESD ranges
4 compositions identified.Each reference can thenbe examined by clicking onthe entry.
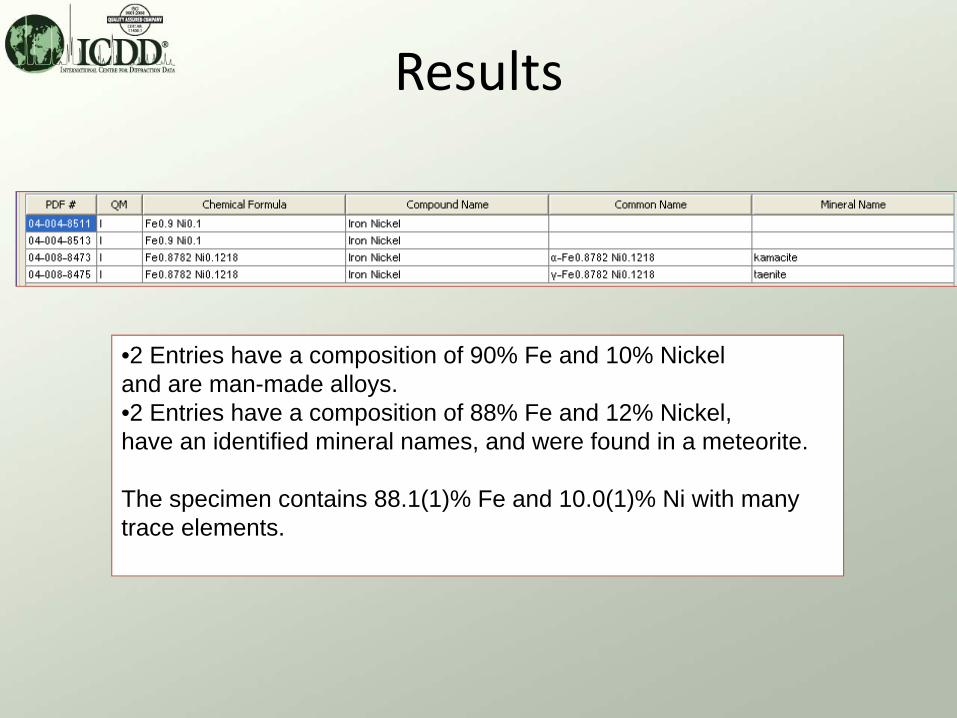
Results
•2 Entries have a composition of 90% Fe and 10% Nickeland are man-made alloys.•2 Entries have a composition of 88% Fe and 12% Nickel, have an identified mineral names, and were found in a meteorite.
The specimen contains 88.1(1)% Fe and 10.0(1)% Ni with manytrace elements.
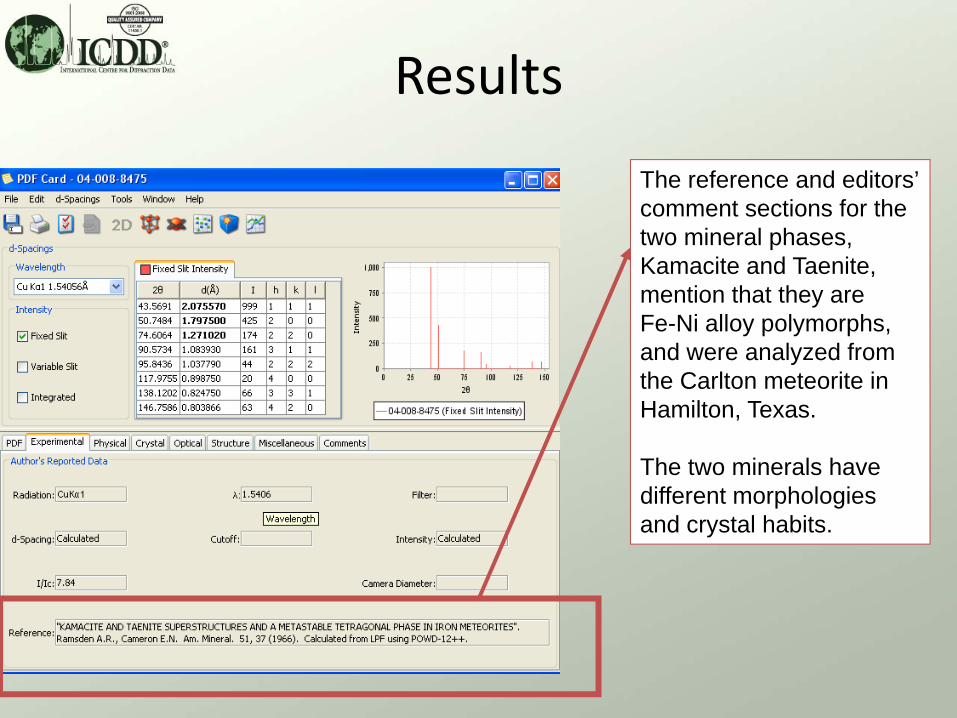
Results
The reference and editors’comment sections for the two mineral phases,Kamacite and Taenite,mention that they are Fe-Ni alloy polymorphs, and were analyzed fromthe Carlton meteorite inHamilton, Texas.
The two minerals have different morphologiesand crystal habits.
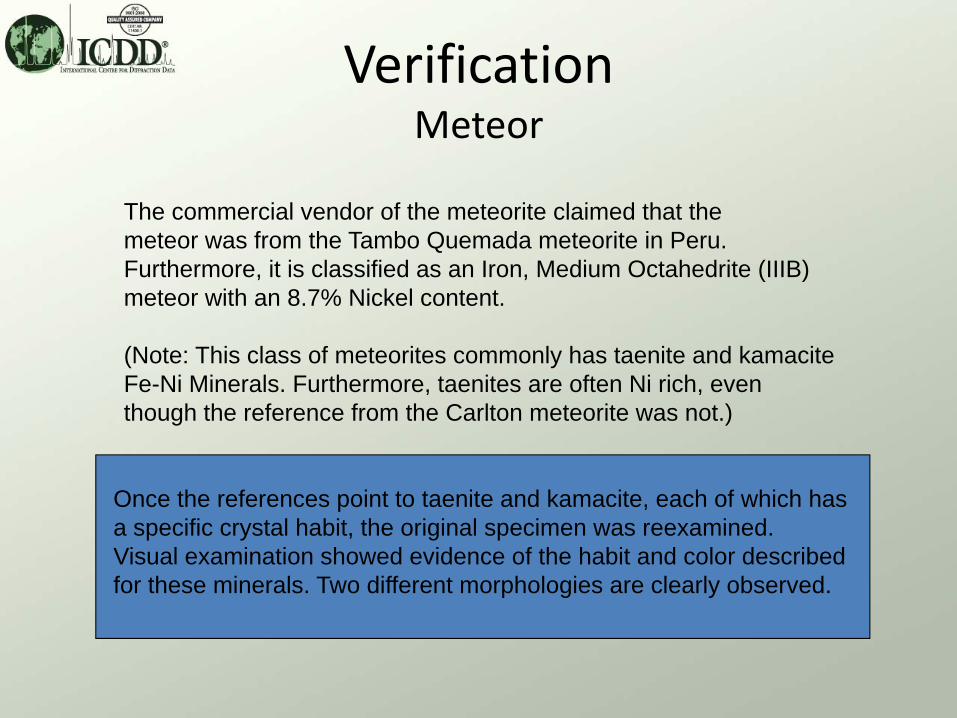
VerificationMeteor
The commercial vendor of the meteorite claimed that themeteor was from the Tambo Quemada meteorite in Peru.Furthermore, it is classified as an Iron, Medium Octahedrite (IIIB)meteor with an 8.7% Nickel content.
(Note: This class of meteorites commonly has taenite and kamaciteFe-Ni Minerals. Furthermore, taenites are often Ni rich, eventhough the reference from the Carlton meteorite was not.)
Once the references point to taenite and kamacite, each of which has a specific crystal habit, the original specimen was reexamined.Visual examination showed evidence of the habit and color described for these minerals. Two different morphologies are clearly observed.
Conclusion
• The commercial vendor claims were verified. XRF data directed the user to specific minerals contained in the PDF database.
• References in the PDF direct the user to cross confirm visual evidence on color and habit.
• The Ni content in the specimen was slightly higher than that of reference Carlton meteorites, and that claimed by the vendors’ bulk analysis of the Tambo Quemada meteorite.
• The Ni variation can be easily explained by differences in concentrations of kamacite and taenite, which are both observed in the specimen.
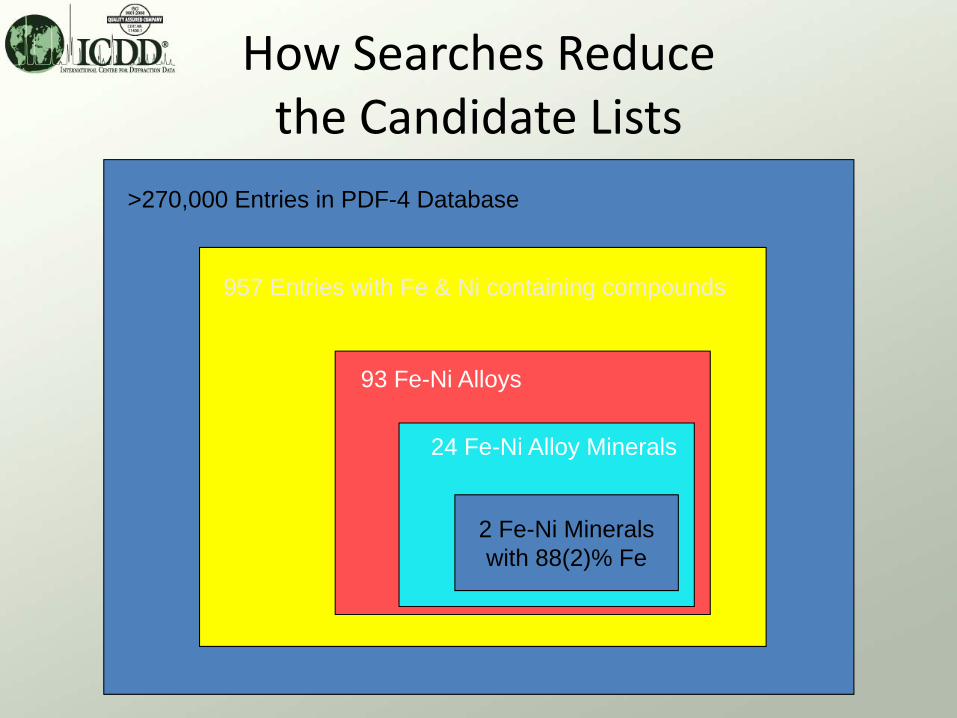
957 Entries with Fe & Ni containing compounds
>270,000 Entries in PDF-4 Database
93 Fe-Ni Alloys
24 Fe-Ni Alloy Minerals
2 Fe-Ni Mineralswith 88(2)% Fe
How Searches Reducethe Candidate Lists
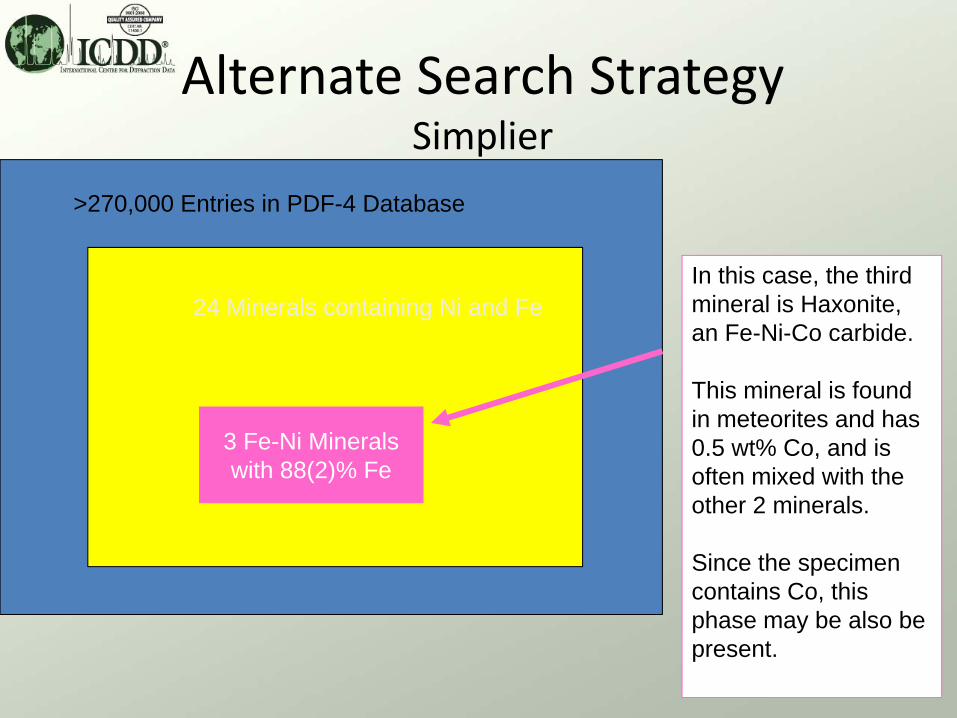
24 Minerals containing Ni and Fe
>270,000 Entries in PDF-4 Database
3 Fe-Ni Mineralswith 88(2)% Fe
Alternate Search StrategySimplier
In this case, the thirdmineral is Haxonite, an Fe-Ni-Co carbide.
This mineral is foundin meteorites and has0.5 wt% Co, and isoften mixed with theother 2 minerals.
Since the specimencontains Co, this phase may be also be present.
Mineral SampleCase 2
In this experiment, the specimen was a commercial raw material intended for a manufacturing process.
The objective was to verify purity and Composition, claimed by the producer.
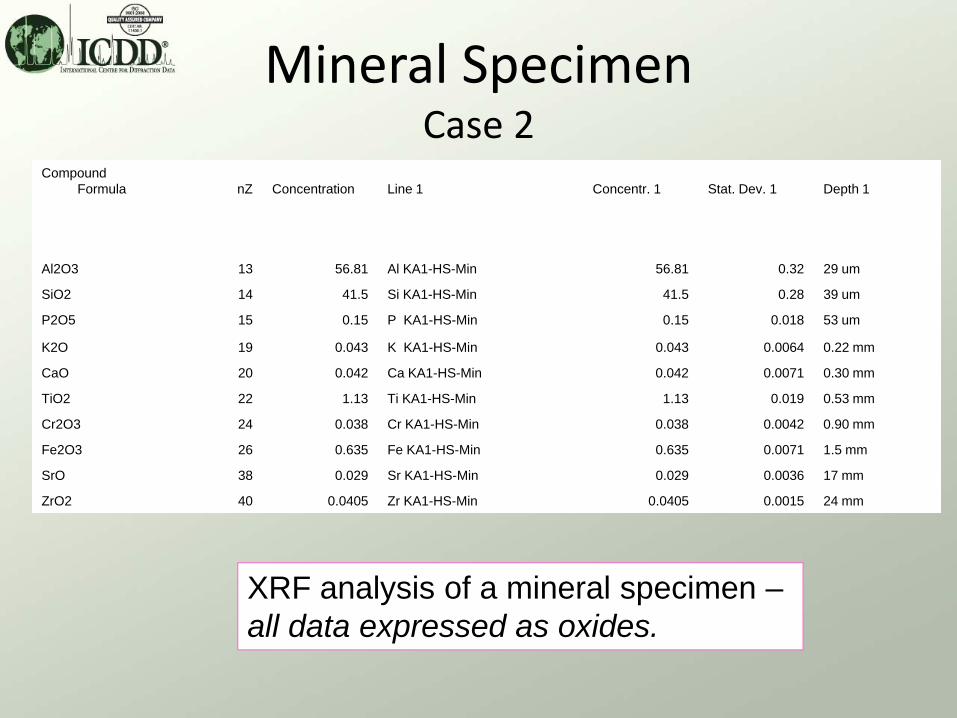
Mineral SpecimenCase 2
Compound Formula nZ Concentration Line 1 Concentr. 1 Stat. Dev. 1 Depth 1
Al2O3 13 56.81 Al KA1-HS-Min 56.81 0.32 29 um
SiO2 14 41.5 Si KA1-HS-Min 41.5 0.28 39 um
P2O5 15 0.15 P KA1-HS-Min 0.15 0.018 53 um
K2O 19 0.043 K KA1-HS-Min 0.043 0.0064 0.22 mm
CaO 20 0.042 Ca KA1-HS-Min 0.042 0.0071 0.30 mm
TiO2 22 1.13 Ti KA1-HS-Min 1.13 0.019 0.53 mm
Cr2O3 24 0.038 Cr KA1-HS-Min 0.038 0.0042 0.90 mm
Fe2O3 26 0.635 Fe KA1-HS-Min 0.635 0.0071 1.5 mm
SrO 38 0.029 Sr KA1-HS-Min 0.029 0.0036 17 mm
ZrO2 40 0.0405 Zr KA1-HS-Min 0.0405 0.0015 24 mm
XRF analysis of a mineral specimen –all data expressed as oxides.
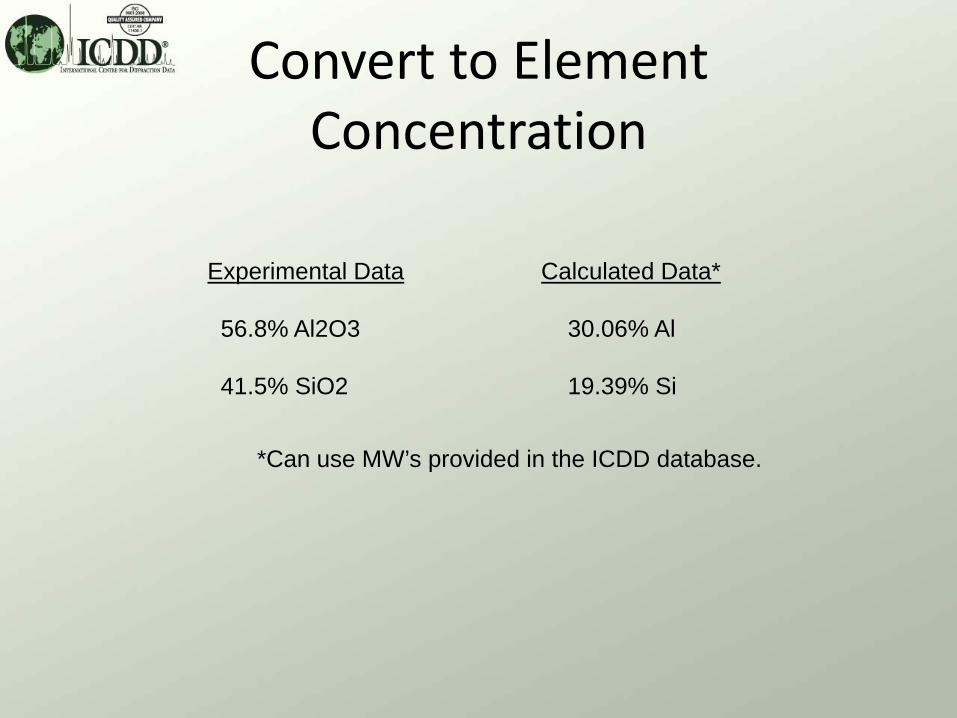
Convert to Element Concentration
Experimental Data Calculated Data*
56.8% Al2O3 30.06% Al
41.5% SiO2 19.39% Si
*Can use MW’s provided in the ICDD database.
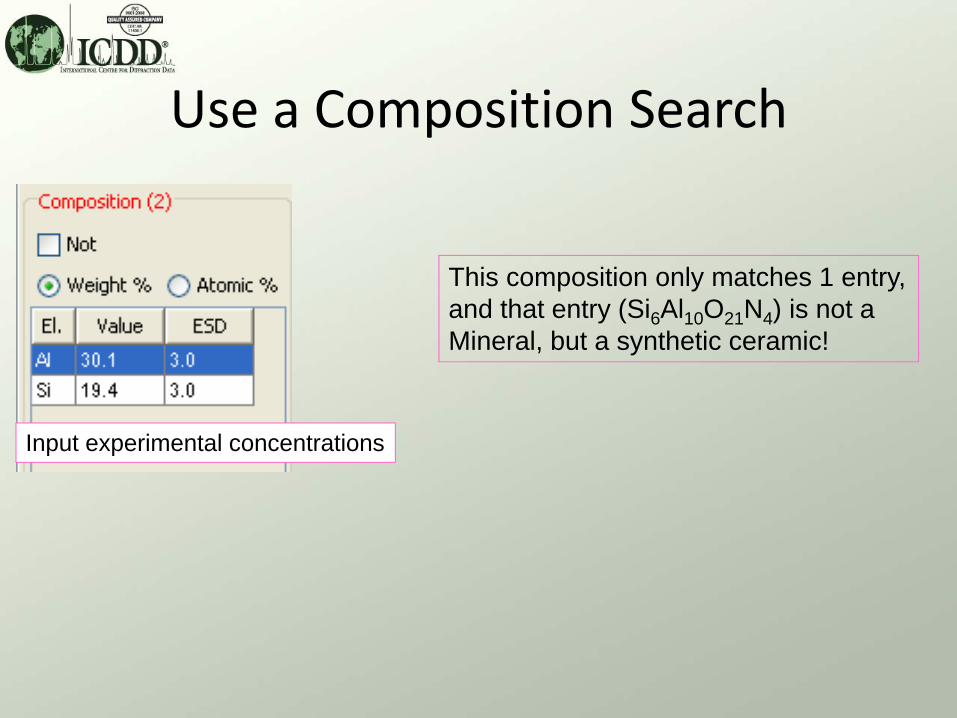
Use a Composition Search
Input experimental concentrations
This composition only matches 1 entry,and that entry (Si6Al10O21N4) is not a Mineral, but a synthetic ceramic!
No Success Try a New Search
Broaden composition range –
put ESD’s at 5 wt%.
Restrict to minerals (eliminates synthetic ceramics)
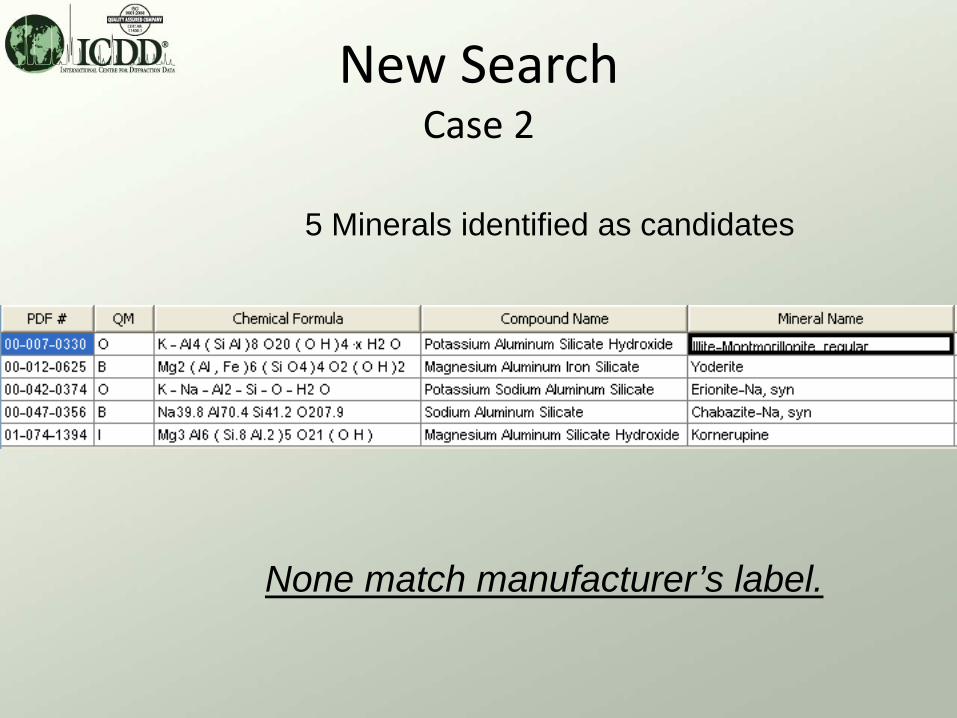
New SearchCase 2
5 Minerals identified as candidates
None match manufacturer’s label.
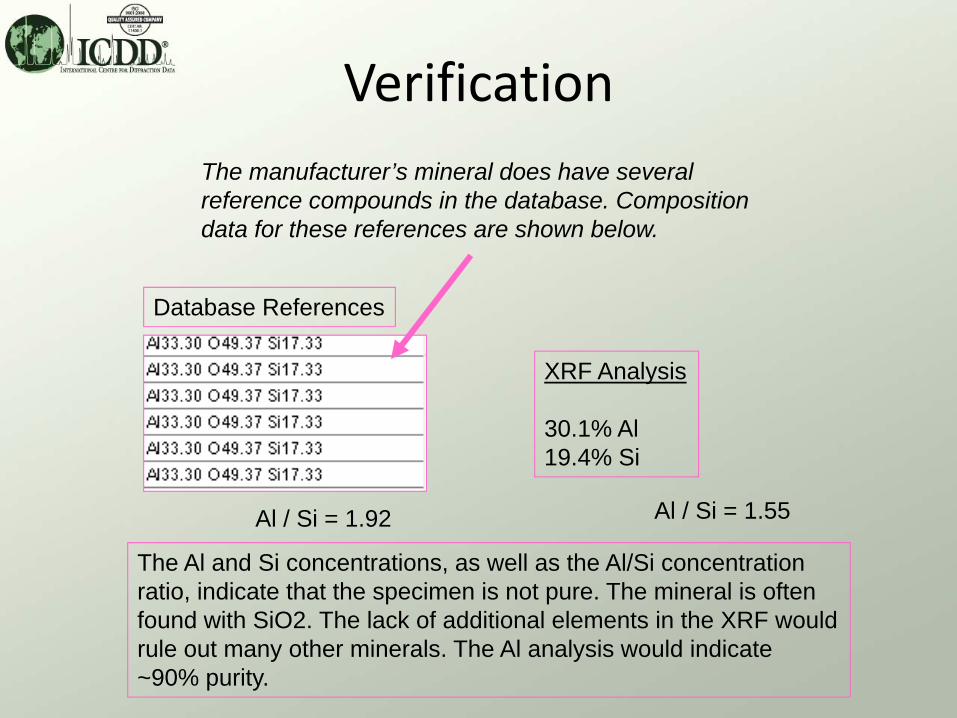
Verification
Database References
XRF Analysis
30.1% Al19.4% Si
The manufacturer’s mineral does have severalreference compounds in the database. Composition data for these references are shown below.
The Al and Si concentrations, as well as the Al/Si concentration ratio, indicate that the specimen is not pure. The mineral is often found with SiO2. The lack of additional elements in the XRF would rule out many other minerals. The Al analysis would indicate ~90% purity.
Al / Si = 1.92 Al / Si = 1.55
ConclusionCase 2
• In this case, the analysis indicates that
the specimen is not pure.
• Comparison of the data with standards
in the database, suggests impurities,
which could be verified with some
simple additional testing (i.e. light microscopy examination).
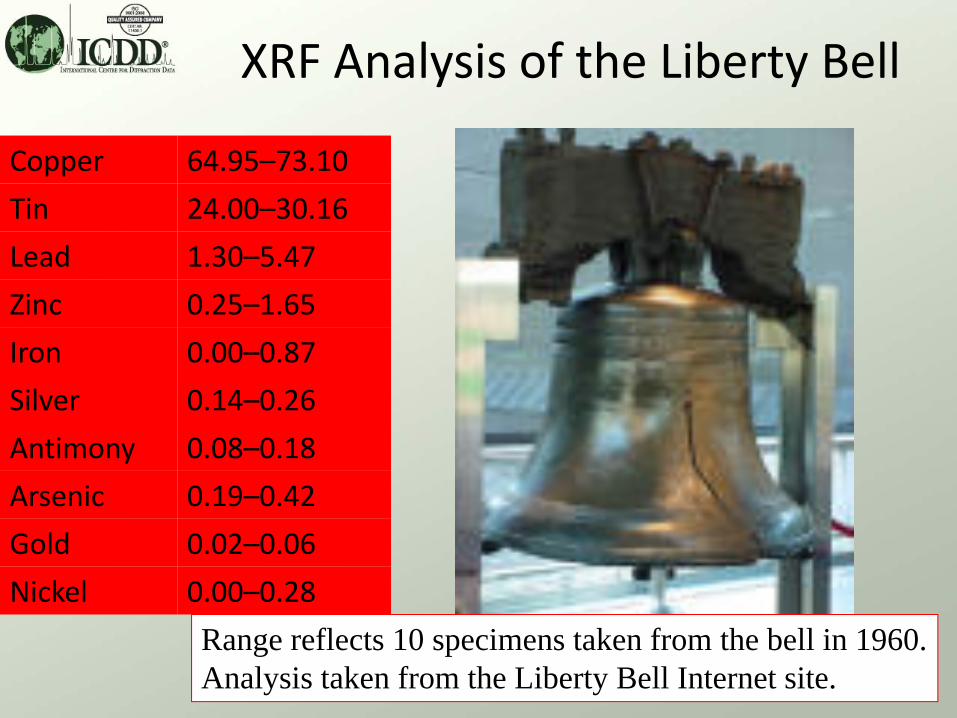
Copper 64.95–73.10
Tin 24.00–30.16
Lead 1.30–5.47
Zinc 0.25–1.65
Iron 0.00–0.87
Silver 0.14–0.26
Antimony 0.08–0.18
Arsenic 0.19–0.42
Gold 0.02–0.06
Nickel 0.00–0.28
XRF Analysis of the Liberty Bell
Range reflects 10 specimens taken from the bell in 1960.Analysis taken from the Liberty Bell Internet site.
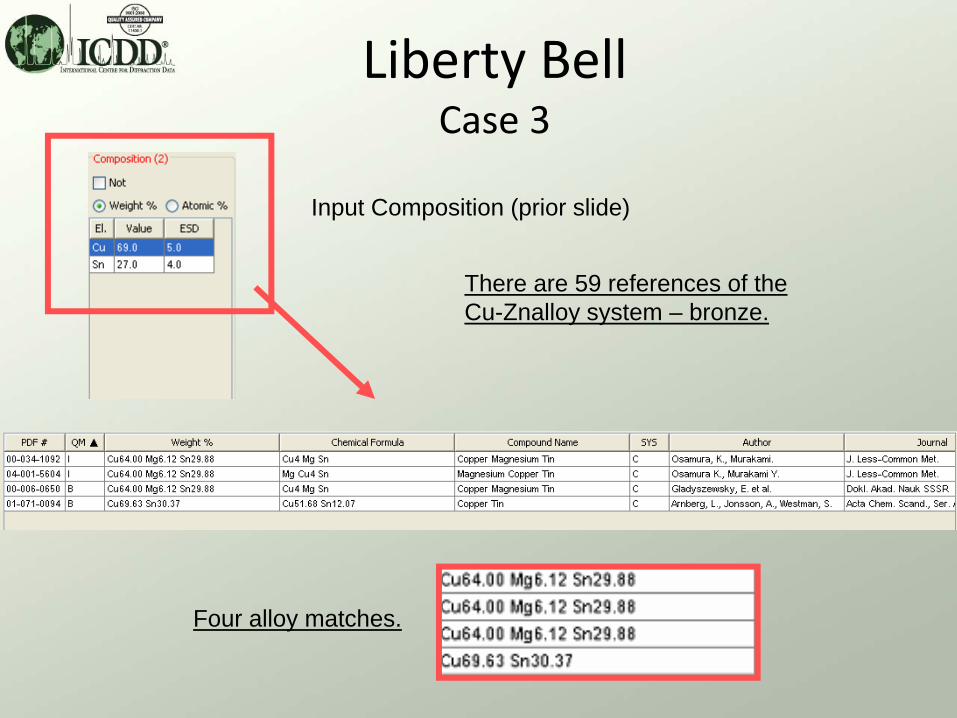
Liberty BellCase 3
Input Composition (prior slide)
Four alloy matches.
There are 59 references of theCu-Znalloy system – bronze.
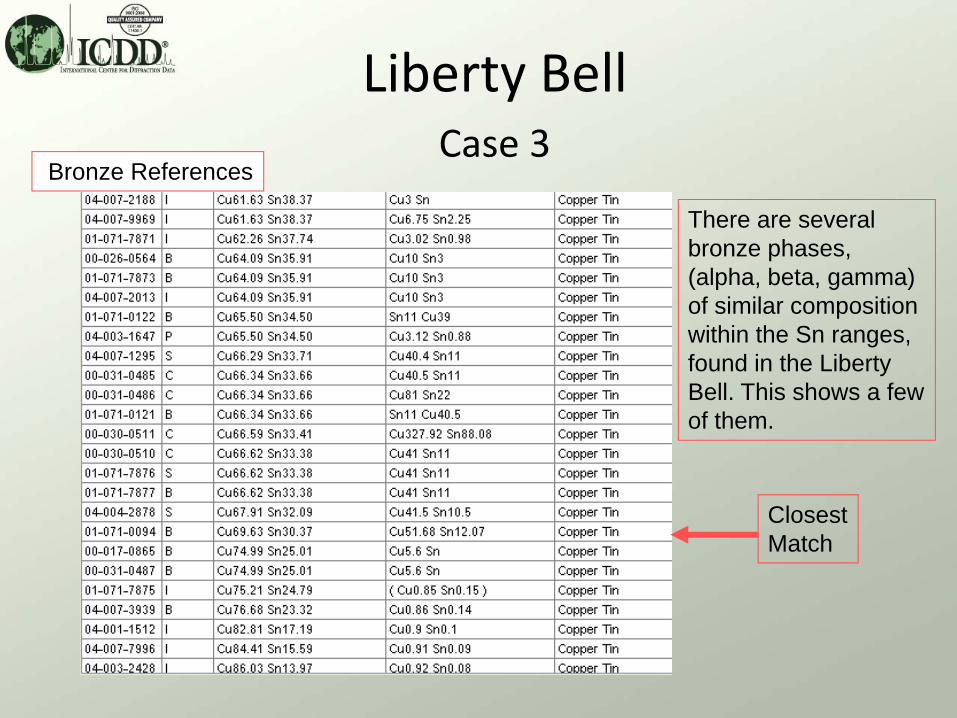
Liberty BellCase 3
Bronze References
ClosestMatch
There are severalbronze phases,(alpha, beta, gamma)of similar compositionwithin the Sn ranges,found in the Liberty Bell. This shows a fewof them.
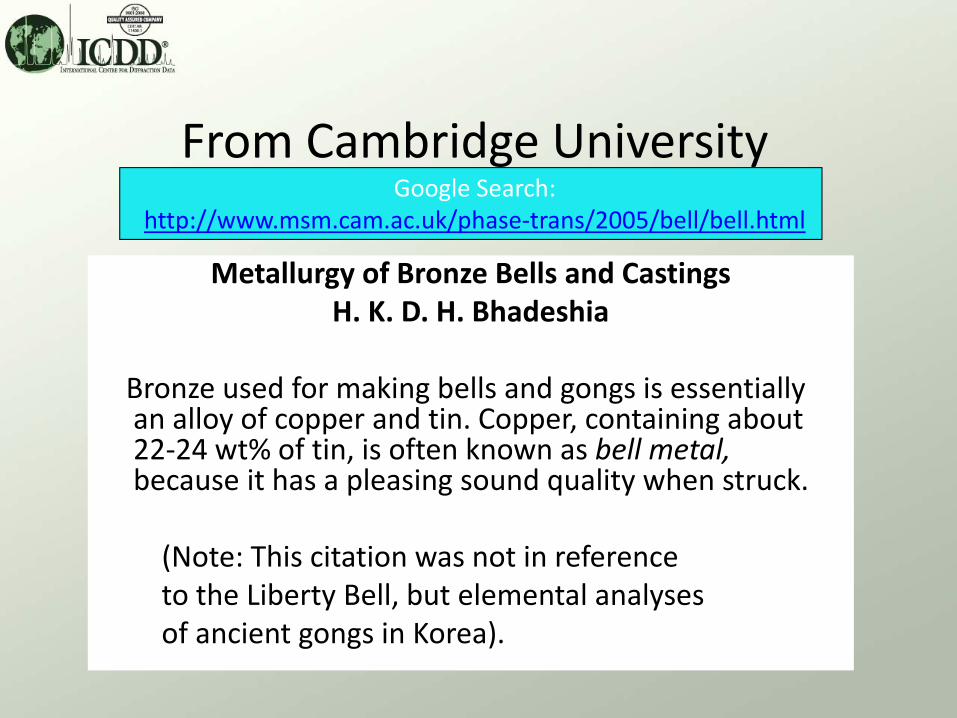
From Cambridge UniversityGoogle Search:
http://www.msm.cam.ac.uk/phase‐trans/2005/bell/bell.html
Metallurgy of Bronze Bells and CastingsH. K. D. H. Bhadeshia
Bronze used for making bells and gongs is essentially an alloy of copper and tin. Copper, containing about 22‐24 wt% of tin, is often known as bell metal,because it has a pleasing sound quality when struck.
(Note: This citation was not in referenceto the Liberty Bell, but elemental analysesof ancient gongs in Korea).
General SearchesStrategies
The prior examples assume that the user has a quantitativeelemental analysis, so the preferred search mechanism isthe composition search.
Qualitative analyses can also be used. In these cases,a general periodic table search is effective.
Semi-quantitative results might use combinations of thecomposition search with wide ESD’s and a periodic tablesearch and/or an elements search.
Any of the above searches can be combined with diffractiondata for dramatically improved results – see the AdvancedIdentification Tutorial for details. The results of any elementalanalysis search can be directly fed into the identificationPrograms, SIeve or SIeve+, as shown in the tutorial.
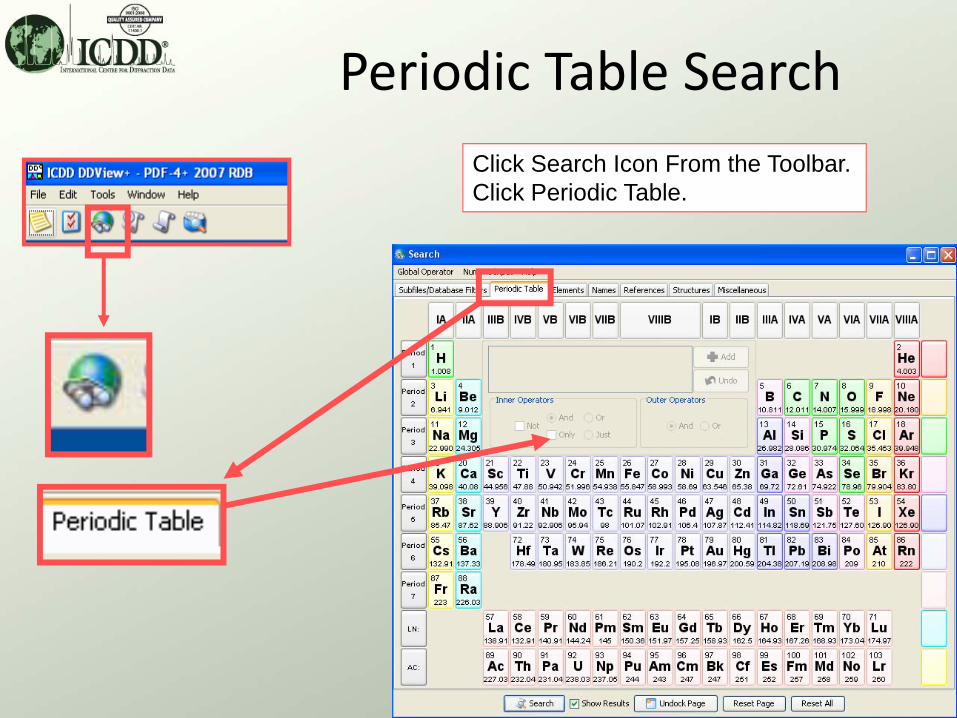
Periodic Table SearchClick Search Icon From the Toolbar.Click Periodic Table.
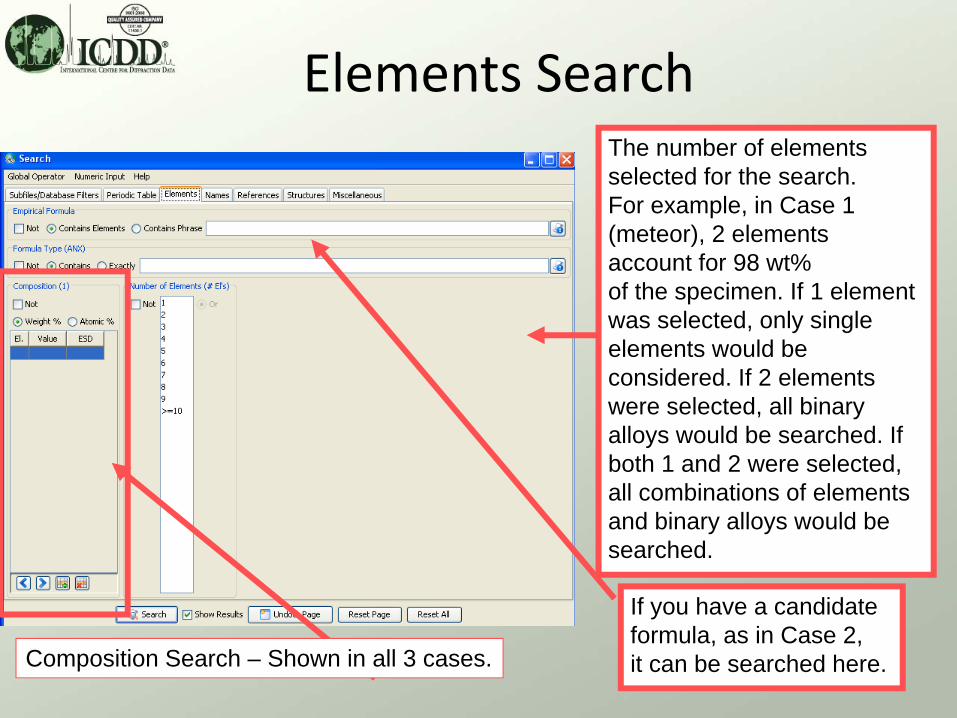
Elements Search
Composition Search – Shown in all 3 cases.
The number of elementsselected for the search.For example, in Case 1 (meteor), 2 elements account for 98 wt%of the specimen. If 1 elementwas selected, only singleelements would beconsidered. If 2 elements were selected, all binary alloys would be searched. If both 1 and 2 were selected,all combinations of elementsand binary alloys would besearched.
If you have a candidateformula, as in Case 2,it can be searched here.
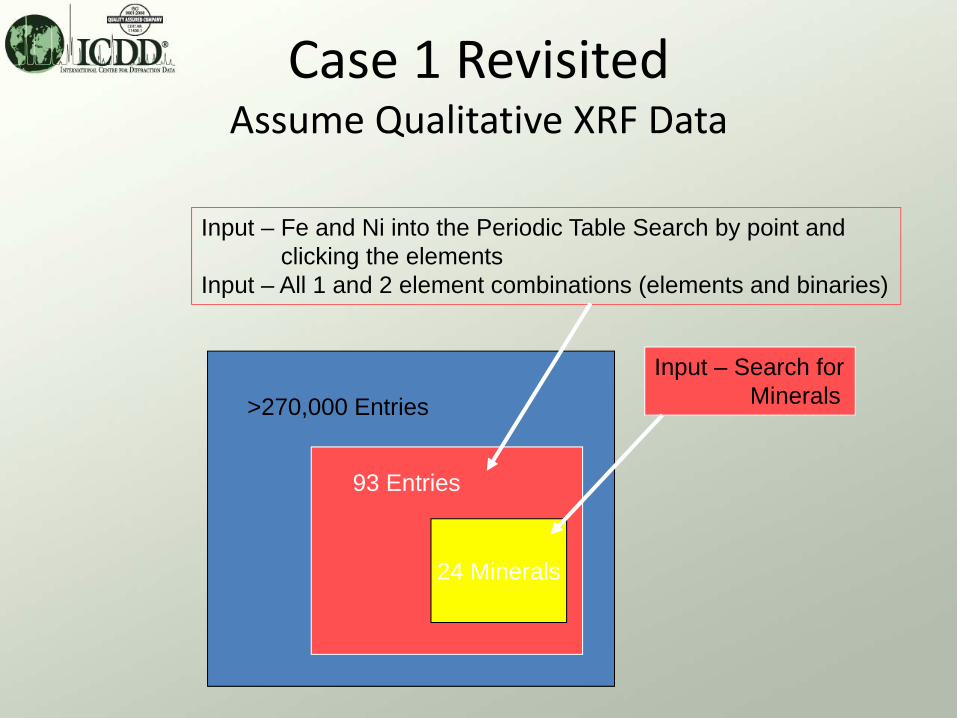
Case 1 RevisitedAssume Qualitative XRF Data
Input – Fe and Ni into the Periodic Table Search by point andclicking the elements
Input – All 1 and 2 element combinations (elements and binaries)
24 Minerals
>270,000 Entries
93 Entries
Input – Search forMinerals
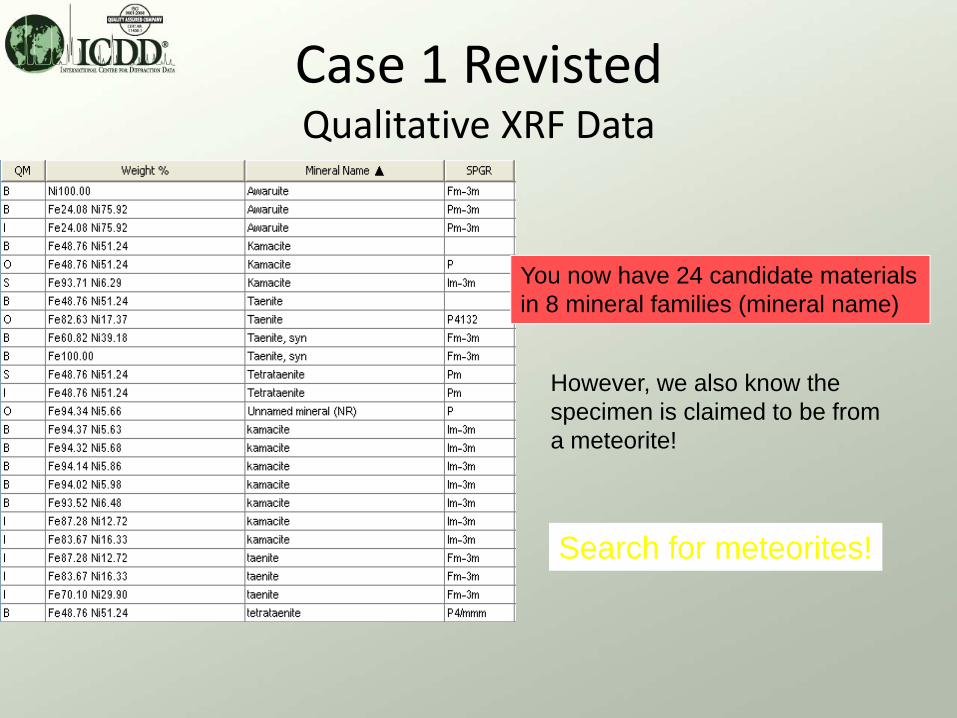
Case 1 Revisted Qualitative XRF Data
You now have 24 candidate materialsin 8 mineral families (mineral name)
However, we also know thespecimen is claimed to be froma meteorite!
Search for meteorites!
Case 1 RevisitedQualitative XRF Data
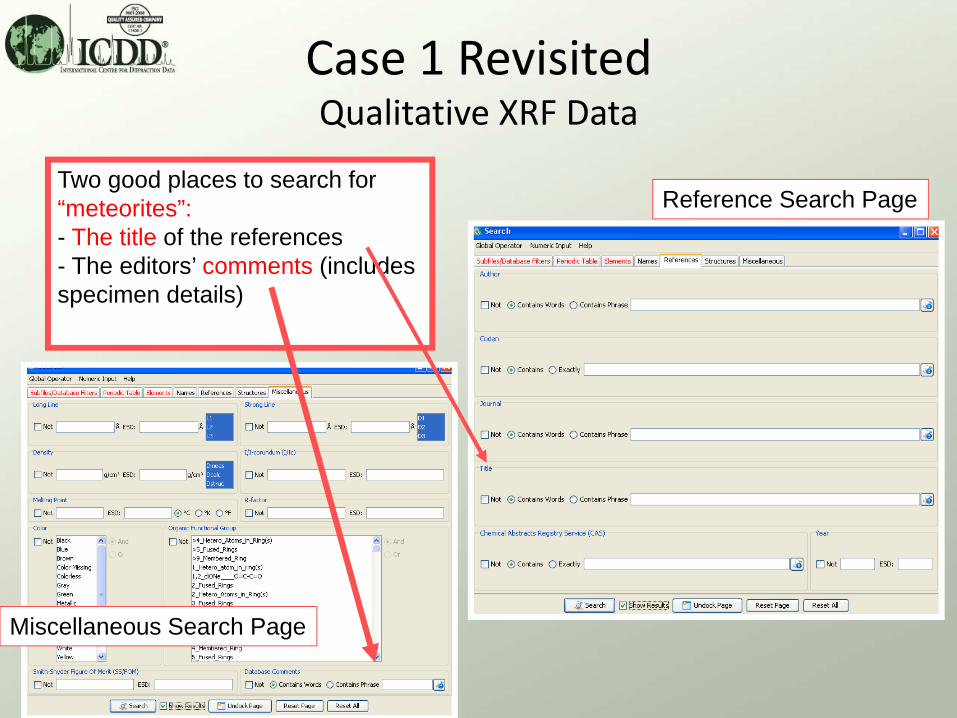
Two good places to search for“meteorites”:- The title of the references- The editors’ comments (includesspecimen details)
Reference Search Page
Miscellaneous Search Page
Case 1 RevisitedQualitative XRF Data
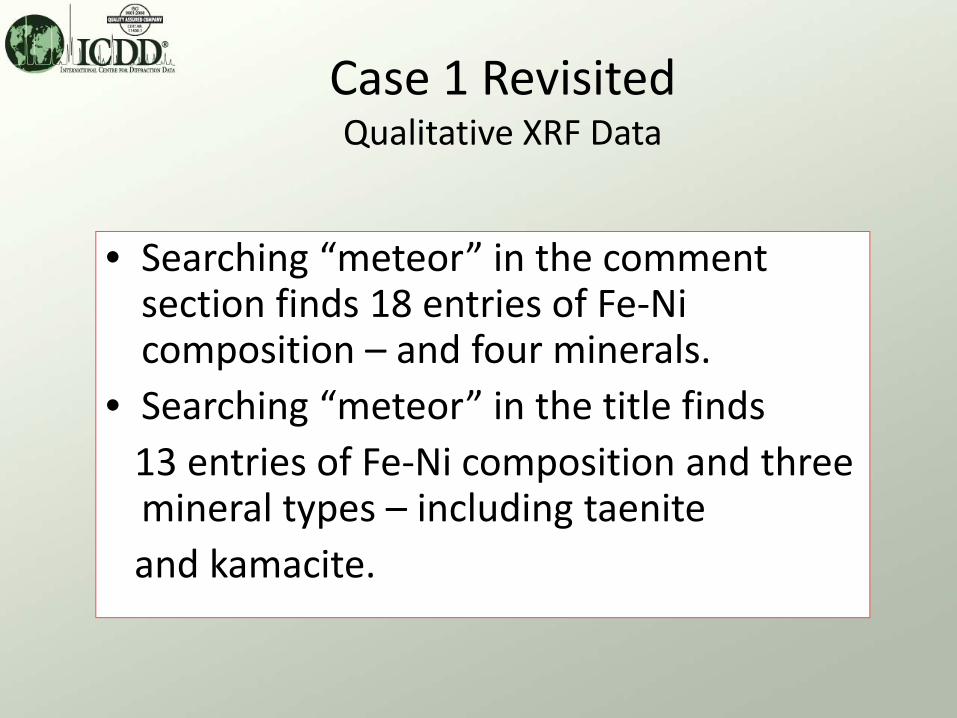
• Searching “meteor” in the comment section finds 18 entries of Fe‐Ni composition – and four minerals.
• Searching “meteor” in the title finds 13 entries of Fe‐Ni composition and three mineral types – including taeniteand kamacite.
Conclusions
Since the PDF is a collection of pure single phasematerials, identification is enhanced when thespecimen is phase pure. This means that thisapplication improves with either XRF or SEM‐EDSmicroanalysis.
The literature citations, reference histories,physical and chemical properties in the database,can all be used to cross reference withexperimental elemental data to assist in materialidentification.
International Centre for Diffraction Data
12 Campus Boulevard
Newtown Square, PA 19073
Phone: 610.325.9814
Fax: 610.325.9823
Thank you for viewing our tutorial.
Additional tutorials are available at the ICDD web site (www.icdd.com).