cdmpipeline.orgcdmpipeline.org/publications/cdmstatesan… · xls file · web view ·...
TRANSCRIPT

This workbook was produced by Jørgen Fenhann, UNEP DTU Partnership from the CDMPipeline of 1st Juney 2018, [email protected], Phone (+45)40202789
Projects that are rejected by the DOEs or by the EB or withdrawn or replaced are not included in these spreadsheets.
In this workbook there is a worksheet for each country that host a CDM Project in the CDMPipeline.If you find errors in the names of the Provinces/states/regions in a country please send an e-mail to the address above.
The input comes from the new column called "Province/state/region" in the "Analysis" sheet in the CDMPipeline.
The information shows all existing CDM project in the country submitted since the start of CDM, except the ones that have beem rejected by the EB or terminated validation by the DOEs.For a host country the number of CDM projects in this workbook is often larger than in the CDMPipeline. If the activities in a CDM project happen in e.g. three provinces it is counted as a CDM project activity in each province in this workbook.
For each country there is a column showing the GDP/capita and the population for each Province/state/region. If these data are missing and you have them, then please mail the data (and the source) to the e-mail address above.

This workbook was produced by Jørgen Fenhann, UNEP DTU Partnership from the CDMPipeline of 1st Juney 2018, [email protected], Phone (+45)40202789
Projects that are rejected by the DOEs or by the EB or withdrawn or replaced are not included in these spreadsheets.
If you find errors in the names of the Provinces/states/regions in a country please send an e-mail to the address above.
The input comes from the new column called "Province/state/region" in the "Analysis" sheet in the CDMPipeline.
The information shows all existing CDM project in the country submitted since the start of CDM, except the ones that have beem rejected by the EB or terminated validation by the DOEs.For a host country the number of CDM projects in this workbook is often larger than in the CDMPipeline. If the activities in a CDM project happen in e.g. three
For each country there is a column showing the GDP/capita and the population for each Province/state/region. If these data are missing and you have them, then please mail the data (and the source) to the e-mail address above.

This workbook was produced by Jørgen Fenhann, UNEP DTU Partnership from the CDMPipeline of 1st Juney 2018, [email protected], Phone (+45)40202789
Cement
Berat Diber Durres Elbasan Fier Gjirokaster KorceKukes Lezhe Shkoder Tirana VloreManyn.a.Total 0 0 0 0 0 0 0 0
Albania Counties
Afforestation
Agriculture
Biomass energy
CO2 capture
Coal bed/mine methane
Energy distribution
EE households

This workbook was produced by Jørgen Fenhann, UNEP DTU Partnership from the CDMPipeline of 1st Juney 2018, [email protected], Phone (+45)40202789
EE industry Fugitive HFCs Hydro
1
1
11
0 0 0 0 0 0 0 0 4 0 0
EE own generati
on
EE service
EE supply side
Fossil fuel
switch
Geothermal
Landfill gas
Methane avoidance

N2O Solar Tidal Wind Total GDP/cap
01 1
01 2
00
1 21 1
01 2
1000
0 0 0 5 0 0 0 0 9
Mixed renewable
s
PFCs and SF6
Reforestation
Transport
Population (millions)

This workbook was produced by Jørgen Fenhann, UNEP DTU Partnership from the CDMPipeline of 1st Juney 2018, [email protected], Phone (+45)40202789
Cement
AdrarAin DeflaAin TimouchentAlgiersAnnabaBatnaBécharBéjaïaBiskraBlidaBordj Bou ArréridjBouïraBoumerdesChlefConstantineDjelfaEl BayadhEl OuedEl TarefGhardaiaGuelmaIlliziJijelKhenchelaLaghouatMascaraMédéaMilaMostaganemM'SilaNaâmaOranOuarglaOum El BouaghiRelizaneSaïdaSétifSidi Bel AbbèsSkikdaSouk AhrasTamanrassetTébessaTiaretTindoufTipazaTissemsilt
Algeria Provinces
Afforestation
Agriculture
Biomass energy
CO2 capture
Coal bed/mine methane
Energy distribution
EE households

Tizi OuzouTlemcenManyn.a.Total 0 0 0 0 0 0 0 0

This workbook was produced by Jørgen Fenhann, UNEP DTU Partnership from the CDMPipeline of 1st Juney 2018, [email protected], Phone (+45)40202789
Fugitive HFCs HydroEE industry
EE own generation
EE service
EE supply side
Fossil fuel
switch
Geothermal
Landfill gas
Methane avoidance

0 0 0 0 0 0 0 0 0 0 0

N2O Solar Tidal Wind
0
00000000000000000000000000000
Mixed renewable
s
PFCs and SF6
Reforestation
Transport
Total number projects
Projects per million
cap
GDP/cap (A. peso/cap)

0000
0 0 0 0 0 0 0 0 0 0.00

Sources: Population: INDEC. Censo Nacional de Población, Hogares y Viviendas 2001 y 2010GDP: GGP (Gross Geographic Product from from CEP (Centre for Production Studies) is an agency from the Ministry of Industry. In constant 1993 prices.
1.4 4872
1.2 41630.5 18850.7 27541.1 43761.1 51731.0 47430.9 47081.2 80050.7 44390.3 2141
15.6 1063390.6 44240.3 23211.7 138300.4 3617
Population (millions in
2010)
GDP (A. pesos)
Adr
ar
Ain
Tim
ouch
ent
Ann
aba
Béc
har
Bis
kra
Bor
dj B
ou A
rrérid
j
Bou
mer
des
Con
stan
tine
El B
ayad
h
El T
aref
Gue
lma
Jije
l
Lagh
ouat
Méd
éa
Mos
taga
nem
Naâ
ma
Oua
rgla
Rel
izan
e
Sét
if
Ski
kda
Tam
anra
sset
Tiar
et
Tipa
za
Tizi
Ouz
ou
0.00
2.00
4.00
6.00
8.00
10.00
12.00
0
2
4
6
8
10
12
Total number of projects versus GDP/capita in Argentina provinces
Arge
ntin
a Pe
sos
/cap
Proj
ects
/mill
ion
cap

28.9 177790
Adr
ar
Ain
Tim
ouch
ent
Ann
aba
Béc
har
Bis
kra
Bor
dj B
ou A
rrérid
j
Bou
mer
des
Con
stan
tine
El B
ayad
h
El T
aref
Gue
lma
Jije
l
Lagh
ouat
Méd
éa
Mos
taga
nem
Naâ
ma
Oua
rgla
Rel
izan
e
Sét
if
Ski
kda
Tam
anra
sset
Tiar
et
Tipa
za
Tizi
Ouz
ou
0.00
2.00
4.00
6.00
8.00
10.00
12.00
0
2
4
6
8
10
12
Total number of projects versus GDP/capita in Argentina provinces
Arge
ntin
a Pe
sos
/cap
Proj
ects
/mill
ion
cap

INDEC. Censo Nacional de Población, Hogares y Viviendas 2001 y 2010GGP (Gross Geographic Product from from CEP (Centre for Production Studies) is an agency from the Ministry of Industry. In constant 1993 prices.
Adr
ar
Ain
Tim
ouch
ent
Ann
aba
Béc
har
Bis
kra
Bor
dj B
ou A
rrérid
j
Bou
mer
des
Con
stan
tine
El B
ayad
h
El T
aref
Gue
lma
Jije
l
Lagh
ouat
Méd
éa
Mos
taga
nem
Naâ
ma
Oua
rgla
Rel
izan
e
Sét
if
Ski
kda
Tam
anra
sset
Tiar
et
Tipa
za
Tizi
Ouz
ou
0.00
2.00
4.00
6.00
8.00
10.00
12.00
0
2
4
6
8
10
12
Total number of projects versus GDP/capita in Argentina provinces
Arge
ntin
a Pe
sos
/cap
Proj
ects
/mill
ion
cap

This workbook was produced by Jørgen Fenhann, UNEP DTU Partnership from the CDMPipeline of 1st Juney 2018, [email protected], Phone (+45)40202789
Cement
BengoBenguelaBiéCabindaCuando CubangoCuanza NorteCuanza SulCuneneHuamboHuilaLuandaLunda NorteLunda SulMalanjeMoxicoNamibeUígeZaireManyn.a.Total 0 0 0 0 0 0 0 0
Angola Provinces
Afforestation
Agriculture
Biomass energy
CO2 capture
Coal bed/mine methane
Energy distribution
EE households

This workbook was produced by Jørgen Fenhann, UNEP DTU Partnership from the CDMPipeline of 1st Juney 2018, [email protected], Phone (+45)40202789
Fugitive HFCs Hydro
0 0 0 0 0 0 0 0 0 0 0
EE industry
EE own generation
EE service
EE supply side
Fossil fuel
switch
Geothermal
Landfill gas
Methane avoidance

N2O Solar Tidal Wind
0 0.00 33640 0.00 34280 0.00 35560 0.00 40900 0.00 41470 0.00 46960 0.00 47780 0.00 53870 0.00 64770 0.00 65180 0.00 67130 0.00 68060 0.00 69270 0.00 69570 0.00 79530 0.00 83670 0.00 84510 0.00 888900
0 0 0 0 0 0 0 0 0 0.00
Mixed renewable
s
PFCs and SF6
Reforestation
Transport
Total number projects
Projects per million
cap
GDP/cap (A. peso/cap)

Sources: Population: INDEC. Censo Nacional de Población, Hogares y Viviendas 2001 y 2010GDP: GGP (Gross Geographic Product from from CEP (Centre for Production Studies) is an agency from the Ministry of Industry. In constant 1993 prices.
1.4 48721.2 41630.5 18850.7 27541.1 43761.1 51731.0 47430.9 47081.2 80050.7 44390.3 2141
15.6 1063390.6 44240.3 23211.7 138300.4 36173.3 279633.2 28395
35.4 234148
Population (millions in
2010)
GDP (A. pesos)
Ben
go
Ben
guel
a
Bié
Cab
inda
Cua
ndo
Cub
ango
Cua
nza
Nor
te
Cua
nza
Sul
Cun
ene
Hua
mbo
Hui
la
Luan
da
Lund
a N
orte
Lund
a S
ul
Mal
anje
Mox
ico
Nam
ibe
Uíg
e
Zaire
0.000.100.200.300.400.500.600.700.800.901.00
010002000300040005000600070008000900010000
Total number of projects versus GDP/capita in Argentina provinces
Arge
ntin
a Pe
sos
/cap
Proj
ects
/mill
ion
cap

INDEC. Censo Nacional de Población, Hogares y Viviendas 2001 y 2010GGP (Gross Geographic Product from from CEP (Centre for Production Studies) is an agency from the Ministry of Industry. In constant 1993 prices.
Ben
go
Ben
guel
a
Bié
Cab
inda
Cua
ndo
Cub
ango
Cua
nza
Nor
te
Cua
nza
Sul
Cun
ene
Hua
mbo
Hui
la
Luan
da
Lund
a N
orte
Lund
a S
ul
Mal
anje
Mox
ico
Nam
ibe
Uíg
e
Zaire
0.000.100.200.300.400.500.600.700.800.901.00
010002000300040005000600070008000900010000
Total number of projects versus GDP/capita in Argentina provinces
Arge
ntin
a Pe
sos
/cap
Proj
ects
/mill
ion
cap

This workbook was produced by Jørgen Fenhann, UNEP DTU Partnership from the CDMPipeline of 1st Juney 2018, [email protected], Phone (+45)40202789
Cement
TucumánSaltaFormosaJujuy 1ChacoMisiones 2Corrientes 1Santiago del Estero Entre RíosSan JuanLa PampaBuenos Aires 1Rio NegroLa Rioja MendozaSan Luis 1Córdoba 1Santa Fe 1ChubutCatamarcaSanta CruzTierra del FuegoNeuquénBuenos Aires CityManyn.a.Total 1 0 6 0 1 0 0 0
Argentina Provinces
Afforestation
Agriculture
Biomass energy
CO2 capture
Coal bed/mine methane
Energy distribution
EE households

This workbook was produced by Jørgen Fenhann, UNEP DTU Partnership from the CDMPipeline of 1st Juney 2018, [email protected], Phone (+45)40202789
Fugitive HFCs Hydro
1 41
1
22
1 1 7 1
1 11
1 12
1
1
2 2 0 3 0 0 0 1 2 12 8
EE industry
EE own generatio
n
EE service
EE supply side
Fossil fuel
switch
Geothermal
Landfill gas
Methane avoidance

N2O Solar Tidal Wind
5 3.45 33641 0.82 34280 0.00 35561 1.49 40900 0.00 41473 2.72 4696
1 2 2.01 47780 0.00 53872 1.62 6477
2 4 5.87 65180 0.00 6713
11 0.70 68060 0.00 69270 0.00 69572 1.15 79532 4.63 83671 0.30 84513 0.94 8889
1 10 13 25.53 98511 2.72 11326
1 1 3.65 122530 0.00 201881 1.81 251290 0.00 3131300
0 0 1 1 2 0 0 11 53 1.32
Mixed renewable
s
PFCs and SF6
Reforestation
Transport
Total number projects
Projects per million
cap
GDP/cap (A. peso/cap)

Sources: Population: INDEC. Censo Nacional de Población, Hogares y Viviendas 2001 y 2010GDP: GGP (Gross Geographic Product from from CEP (Centre for Production Studies) is an agency from the Ministry of Industry. In constant 1993 prices.
1.4 48721.2 41630.5 18850.7 27541.1 43761.1 51731.0 47430.9 47081.2 80050.7 44390.3 2141
15.6 1063390.6 44240.3 23211.7 138300.4 36173.3 279633.2 283950.5 50150.4 41660.3 33570.1 25680.6 138532.9 90498
40.1 353605
Population (millions in
2010)
GDP (A. pesos)
Tucu
mán
Sal
ta
Form
osa
Juju
y
Cha
co
Mis
ione
s
Cor
rient
es
San
tiago
del
Est
ero
Ent
re R
íos
San
Jua
n
La P
ampa
Bue
nos
Aire
s
Rio
Neg
ro
La R
ioja
Men
doza
San
Lui
s
Cór
doba
San
ta F
e
Chu
but
Cat
amar
ca
San
ta C
ruz
Tier
ra d
el F
uego
Neu
quén
Bue
nos
Aire
s C
ity
0.00
5.00
10.00
15.00
20.00
25.00
30.00
0
5000
10000
15000
20000
25000
30000
35000
Total number of projects versus GDP/capita in Argentina provinces
Arge
ntin
a Pe
sos
/cap
Proj
ects
/mill
ion
cap

INDEC. Censo Nacional de Población, Hogares y Viviendas 2001 y 2010GGP (Gross Geographic Product from from CEP (Centre for Production Studies) is an agency from the Ministry of Industry. In constant 1993 prices.
Tucu
mán
Sal
ta
Form
osa
Juju
y
Cha
co
Mis
ione
s
Cor
rient
es
San
tiago
del
Est
ero
Ent
re R
íos
San
Jua
n
La P
ampa
Bue
nos
Aire
s
Rio
Neg
ro
La R
ioja
Men
doza
San
Lui
s
Cór
doba
San
ta F
e
Chu
but
Cat
amar
ca
San
ta C
ruz
Tier
ra d
el F
uego
Neu
quén
Bue
nos
Aire
s C
ity
0.00
5.00
10.00
15.00
20.00
25.00
30.00
0
5000
10000
15000
20000
25000
30000
35000
Total number of projects versus GDP/capita in Argentina provinces
Arge
ntin
a Pe
sos
/cap
Proj
ects
/mill
ion
cap

This workbook was produced by Jørgen Fenhann, UNEP DTU Partnership from the CDMPipeline of 1st Juney 2018, [email protected], Phone (+45)40202789
Cement
AragatsotnAraratArmavirGegharkunikKotaykLoriShirakSyunikTavushVayots DzorYerevanManyn.a.Total 0 0 0 0 0 0 0 0
Armenia Provinces
Afforestation
Agriculture
Biomass energy
CO2 capture
Coal bed/mine methane
Energy distribution
EE households

This workbook was produced by Jørgen Fenhann, UNEP DTU Partnership from the CDMPipeline of 1st Juney 2018, [email protected], Phone (+45)40202789
EE industry Fugitive HFCs Hydro
1
1
11
1
0 0 0 0 0 1 0 0 3 1
EE own generation
EE service
EE supply side
Fossil fuel
switch
Geothermal
Landfill gas

N2O Solar Tidal Wind Total GDP/cap
0001
1 101001110
1 0 0 0 0 0 0 0 0 6
Methane avoidance
Mixed renewable
s
PFCs and SF6
Reforestation
Transport

0.1260.2530.2560.2150.2410.2530.2570.1340.1220.0531.091
Population (millions)

This workbook was produced by Jørgen Fenhann, UNEP DTU Partnership from the CDMPipeline of 1st Juney 2018, [email protected], Phone (+45)40202789
Cement
AbsheronAgjabadiAgdamAgdashAgstafaAgsuAli Bayramli cityAstara Baku cityBalakanBardaBeylaganBilasuvarJabrayilJalilabadDashkasanDavachiFizuliGadabayGanja cityGoranboy GoychayHajigabulImishliIsmailliKurdamirLachinLankaranLankaran cityLerik MasallyMingachevir cityNaftalan city NeftchalaOguzQabalaQakhQazakhQobustan Quba QubadliQusar SaatlySabirabad ShakiShaki city
Azerbaijan District
Afforestation
Agriculture
Biomass energy
CO2 capture
Coal bed/mine methane
Energy distribution
EE households

Salyan ShamakhiShamkirSamukhSiazanSumqayit cityTovuzUjarKhachmazGoygol KhiziYardymliYevlakhYevlakh cityZangilanZaqatala ZardabBabekJulfaKangarliNakhchivan CityOrdubad SadarakShakhbuzSharurManyn.a.Total 0 0 0 0 0 0 0 0

This workbook was produced by Jørgen Fenhann, UNEP DTU Partnership from the CDMPipeline of 1st Juney 2018, [email protected], Phone (+45)40202789
EE industry EE service Fugitive HFCs Hydro
1
1
2
1
EE own generation
EE supply side
Fossil fuel
switch
Geothermal
Landfill gas
Methane
avoidance

0 0 0 2 0 1 0 0 0 2 0

N2O Solar Tidal Wind Total GDP/cap
1000001020000000000000000000000100000000000000
Mixed renewa
bles
PFCs and SF6
Reforestation
Transport
Population (millions)

0000000000
2 20000000000000000
0 0 0 0 0 0 0 2 7

Districts1 Absheron2 Agjabadi3 Agdam4 Agdash5 Agstafa6 Agsu7 Ali Bayramli city (renamed Sirvan on April 24, 2008) 8 Astara 9 Baku city
10 Balakan11 Barda12 Beylagan13 Bilasuvar14 Jabrayil15 Jalilabad16 Dashkasan17 Davachi18 Fizuli19 Gadabay20 Ganja city21 Goranboy 22 Goychay23 Hajigabul24 Imishli25 Ismailli27 Kurdamir28 Lachin29 Lankaran30 Lankaran city31 Lerik 32 Masally33 Mingachevir city34 Naftalan city 35 Neftchala36 Oguz37 Qabala38 Qakh39 Qazakh40 Qobustan 41 Quba 42 Qubadli43 Qusar 44 Saatly45 Sabirabad 46 Shaki47 Shaki city
No. on Wikipedia map

48 Salyan 49 Shamakhi50 Shamkir51 Samukh52 Siazan53 Sumqayit city57 Tovuz58 Ujar59 Khachmaz61 Goygol (formerly Khanlar)62 Khizi65 Yardymli66 Yevlakh67 Yevlakh city68 Zangilan69 Zaqatala 70 Zardab
Nakhchivan Autonomous Republic1 Babek2 Julfa3 Kangarli4 Nakhchivan City5 Ordubad 6 Sadarak7 Shakhbuz8 Sharur

This workbook was produced by Jørgen Fenhann, UNEP DTU Partnership from the CDMPipeline of 1st Juney 2018, [email protected], Phone (+45)40202789
Bahamas Districts Afforestation Cement
NassauAcklinsBerry IslandsBiminiBlack PointCat IslandCentral AbacoCentral AndrosCentral EleutheraCity of FreeportCrooked IslandEast Grand BahamaExumaGrand CayHarbour IslandHope TownInaguaLong IslandMangrove CayMayaguanaMoore's IslandNorth AbacoNorth AndrosNorth EleutheraRagged IslandRum CaySan SalvadorSouth AbacoSouth AndrosSouth EleutheraSpanish WellsWest Grand BahamaGreen Turtle CayManyn.a.Total 0 0 0 0 0 0 0
Agriculture
Biomass energy
CO2 capture
Coal bed/mine methane
Energy distribution

This workbook was produced by Jørgen Fenhann, UNEP DTU Partnership from the CDMPipeline of 1st Juney 2018, [email protected], Phone (+45)40202789
Fugitive HFCs Hydro
1
0 0 0 0 0 0 0 0 0 0 1
EE households
EE industry
EE own generati
on
EE service
EE supply side
Fossil fuel
switch
Geothermal
Landfill gas

N2O Solar Tidal Wind Total GDP/cap
00000000000000000000000000000001000
0 0 0 0 0 0 0 0 0 1
Methane avoidance
Mixed renewable
s
PFCs and SF6
Reforestation
Transport

Population (millions)

This workbook was produced by Jørgen Fenhann, UNEP DTU Partnership from the CDMPipeline of 1st Juney 2018, [email protected], Phone (+45)40202789
Cement
BarisalChittagongDhaka 1KhulnaRajshaiSylhetManyn.a.Total 0 0 1 0 0 0 0 0
Bangladesh Divisions
Afforestation
Agriculture
Biomass energy
CO2 capture
Coal bed/mine methane
Energy distribution
EE households

This workbook was produced by Jørgen Fenhann, UNEP DTU Partnership from the CDMPipeline of 1st Juney 2018, [email protected], Phone (+45)40202789
EE industry EE service Fugitive HFCs Hydro
1 13 1 2
11
5 0 0 1 1 1 0 0 0 2 0
EE own generation
EE supply side
Fossil fuel
switch
Geothermal
Landfill gas
Methane
avoidance

Not available. Census 2001, SVRS, BBSN2O Solar Tidal Wind Total GDP/cap
0 8.1542 24.1207 38.9870 14.6051 30.0891 7.89700
0 0 0 0 0 0 0 0 11 123.851
Mixed renewa
bles
PFCs and SF6
Reforestation
Transport
Population (millions)

Census 2001, SVRS, BBS

This workbook was produced by Jørgen Fenhann, UNEP DTU Partnership from the CDMPipeline of 1st Juney 2018, [email protected], Phone (+45)40202789
Belize Districts Cement
BelizeCayoCorazalOrange WalkStann CreekToledoManyn.a.Total 0 0 0 0 0 0 0
Afforestation
Agriculture
Biomass energy
CO2 capture
Coal bed/mine methane
Energy distribution

This workbook was produced by Jørgen Fenhann, UNEP DTU Partnership from the CDMPipeline of 1st Juney 2018, [email protected], Phone (+45)40202789
Fugitive HFCs Hydro
1
0 0 0 0 0 0 0 0 0 0 1
EE households
EE industry
EE own generati
on
EE service
EE supply side
Fossil fuel
switch
Geothermal
Landfill gas

N2O Solar Tidal Wind Total GDP/cap
10000000
0 0 0 0 0 0 0 0 0 1
Methane avoidance
Mixed renewable
s
PFCs and SF6
Reforestation
Transport

Population (millions)

This workbook was produced by Jørgen Fenhann, UNEP DTU Partnership from the CDMPipeline of 1st Juney 2018, [email protected], Phone (+45)40202789
Cement
Bumthang ChukhaDagana Gasa Haa Lhuntse Mongar Paro PemagatshelPunaka Samdrup Jongkhar SamtseSarpang Thimphu TrashigangTrashiyangste TrongsaTsirangWangdue PhodrangZhemgangMany 1n.a.Total 0 0 0 0 0 0 1 0
Bhutan Districts (dzongkhag)
Afforestation
Agriculture
Biomass energy
CO2 capture
Coal bed/mine methane
Energy distribution
EE households

This workbook was produced by Jørgen Fenhann, UNEP DTU Partnership from the CDMPipeline of 1st Juney 2018, [email protected], Phone (+45)40202789
Fugitive HFCs Hydro
1
2
2
0 0 0 0 0 0 0 0 5 0 0
EE industry
EE own generati
on
EE service
EE supply side
Fossil fuel
switch
Geothermal
Landfill gas
Methane avoidance

N2O Solar Tidal Wind Total GDP/cap
0010000000000000202010
0 0 0 0 0 0 0 0 6
Mixed renewable
s
PFCs and SF6
Reforestation
Transport
Population (millions)

This workbook was produced by Jørgen Fenhann, UNEP DTU Partnership from the CDMPipeline of 1st Juney 2018, [email protected], Phone (+45)40202789
Cement
BeniChuquisacaCochabambaLa PazOruroPandoPotosiSanta CruzTarijaManyn.a.Total 0 0 0 0 0 0 0
Bolivia Departments
Afforestation
Agriculture
Biomass energy
CO2 capture
Coal bed/mine methane
Energy distribution

This workbook was produced by Jørgen Fenhann, UNEP DTU Partnership from the CDMPipeline of 1st Juney 2018, [email protected], Phone (+45)40202789
Fugitive HFCs Hydro
1
1 1
0 0 0 0 1 0 0 0 0 1 1
EE households
EE industry
EE own generati
on
EE service
EE supply side
Fossil fuel
switch
Geothermal
Landfill gas

N2O Solar Tidal Wind Total GDP/cap
1 10010002000
0 0 0 0 1 0 0 0 0 4
Methane avoidance
Mixed renewable
s
PFCs and SF6
Reforestation
Transport

Population (millions)

This workbook was produced by Jørgen Fenhann, UNEP DTU Partnership from the CDMPipeline of 1st Juney 2018, [email protected], Phone (+45)40202789
Cement
BrckoFederationSrpskaManyn.a.Total 0 0 0 0 0 0 0
Bosnia and Herzegovina subdivisions
Afforestation
Agriculture
Biomass energy
CO2 capture
Coal bed/mine methane
Energy distribution

This workbook was produced by Jørgen Fenhann, UNEP DTU Partnership from the CDMPipeline of 1st Juney 2018, [email protected], Phone (+45)40202789
Fugitive HFCs Hydro
0 0 0 0 0 0 0 0 0 0 0
EE households
EE industry
EE own generati
on
EE service
EE supply side
Fossil fuel
switch
Geothermal
Landfill gas

N2O Solar Tidal Wind Total GDP/cap
00000
0 0 0 0 0 0 0 0 0 0
Methane avoidance
Mixed renewable
s
PFCs and SF6
Reforestation
Transport

Population (millions)

This workbook was produced by Jørgen Fenhann, UNEP DTU Partnership from the CDMPipeline of 1st Juney 2018, [email protected], Phone (+45)40202789
Cement
AcreAlagoas 1AmapáAmazonas 1BahiaCearáEspírito SantoGoiás 1MaranhãoMato Grosso 1 1Mato Grosso do Sul 1Minas Gerais 8Pará 2ParaíbaParaná 5 1Pernambuco 1Piauí Rio de JaneiroRio Grande do NorteRio Grande do Sul 6RondôniaRoraimaSanta Catarina 3São Paulo 21SergipeTocantins 1Manyn.a.Total 0 0 51 0 1 0 2
Brazil States
Afforestation
Agriculture
Biomass energy
CO2 capture
Coal bed/mine methane
Energy distribution

This workbook was produced by Jørgen Fenhann, UNEP DTU Partnership from the CDMPipeline of 1st Juney 2018, [email protected], Phone (+45)40202789
Fugitive HFCs Hydro
12
11 2 4
12 1 3 2
101 1
206 1
2 5 15 31 2
14 1
11
1 5 61
19 46
14 31 4 4 25
2
0 1 4 0 0 6 7 0 0 113 59
EE households
EE industry
EE own generati
on
EE service
EE supply side
Fossil fuel
switch
Geothermal
Landfill gas

Source Brazilian Institute of Geography and Statistics: www.ibge.gov.brN2O Solar Tidal Wind Total
0 7 0412 5 1642 8 5432 11 829
3 1 14 25 6 92216 17 5 636
3 11 15 23615 26 9 962
2 4 62811 33 12 35015 23 10 59926 1 2 1 63 11 028
1 1 7 6 2411 2 5 507
9 20 13 1581 3 6 5282 3 4 213
1 13 17 69524 25 6 754
8 10 47 14 3101 7 8 391
0 9 07513 2 35 15 63815 4 1 75 19 548
0 7 5601 7 210
3 50
123 0 5 2 4 1 0 0 70 449
Methane avoidance
Mixed renewable
s
PFCs and SF6
Reforestation
Transport
GDP/cap in 2006 (Reais)

Source Brazilian Institute of Geography and Statistics: www.ibge.gov.br
0.653.030.583.22
14.088.183.352.856.122.852.26
19.277.063.64
10.288.483.03
15.423.01
10.581.450.395.86
39.821.931.24
178.63
Population in 2007
(millions)

This workbook was produced by Jørgen Fenhann, UNEP DTU Partnership from the CDMPipeline of 1st Juney 2018, [email protected], Phone (+45)40202789
Burundi Provinces Cement
BubanzaBujumbura MairieBujumbura RuralBururiCankuzoCibitokeGitegaKaruziKayanzaKirundoMakambaMuramvyaMuyingaMwaroNgoziRutanaRuyigiManyn.a.Total 0 0 0 0 0 0 0 0
Afforestation
Agriculture
Biomass energy
CO2 capture
Coal bed/mine methane
Energy distribution
EE households

This workbook was produced by Jørgen Fenhann, UNEP DTU Partnership from the CDMPipeline of 1st Juney 2018, [email protected], Phone (+45)40202789
Fugitive HFCs Hydro
3
0 0 3 0 0 0 0 0 0 0 0
EE industry
EE own generati
on
EE service
EE supply side
Fossil fuel
switch
Geothermal
Landfill gas
Methane avoidance

N2O Solar Tidal Wind Total GDP/cap
1 100000
1 1000000000030
0 0 0 0 2 0 0 0 5
Mixed renewable
s
PFCs and SF6
Reforestation
Transport
Population (millions)

This workbook was produced by Jørgen Fenhann, UNEP DTU Partnership from the CDMPipeline of 1st Juney 2018, [email protected], Phone (+45)40202789
Cement
Banteay MeancheyBattambangKampong ChamKampong ChhnangKampong SpeuKampong ThomKampotKandal 1Koh KongKepKratiéMondulkiriOddar MeancheayPailinPhnom PenhSihanoukvillePreah VihearPursatPrey VengRatanakiriSiem ReapStung TrengSvay RiengTakéoManyn.a.Total 0 0 1 0 0 0 0 0
Cambodia Provinces (khet) and Municipalities (krong)
Afforestation
Agriculture
Biomass energy
CO2 capture
Coal bed/mine methane
Energy distribution
EE households

This workbook was produced by Jørgen Fenhann, UNEP DTU Partnership from the CDMPipeline of 1st Juney 2018, [email protected], Phone (+45)40202789
Fugitive HFCs Hydro
2
1 12
2
1
0 1 0 0 0 0 0 0 4 0 4
EE industry
EE own generati
on
EE service
EE supply side
Fossil fuel
switch
Geothermal
Landfill gas
Methane avoidance

N2O Solar Tidal Wind Total GDP/cap
00200023200000000100000000
0 0 0 0 0 0 0 0 10
Mixed renewable
s
PFCs and SF6
Reforestation
Transport
Population (millions)

This workbook was produced by Jørgen Fenhann, UNEP DTU Partnership from the CDMPipeline of 1st Juney 2018, [email protected], Phone (+45)40202789
Cement Fugitive HFCs Hydro N2O Solar Tidal Wind Total GDP/cap
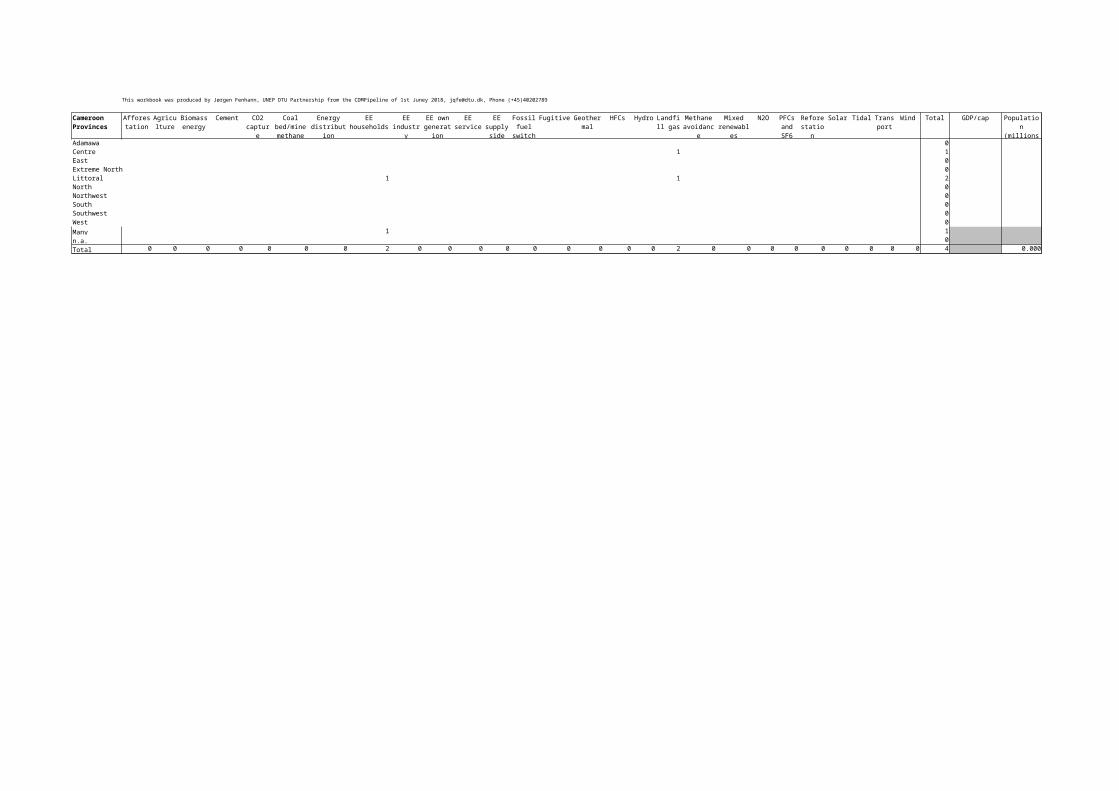
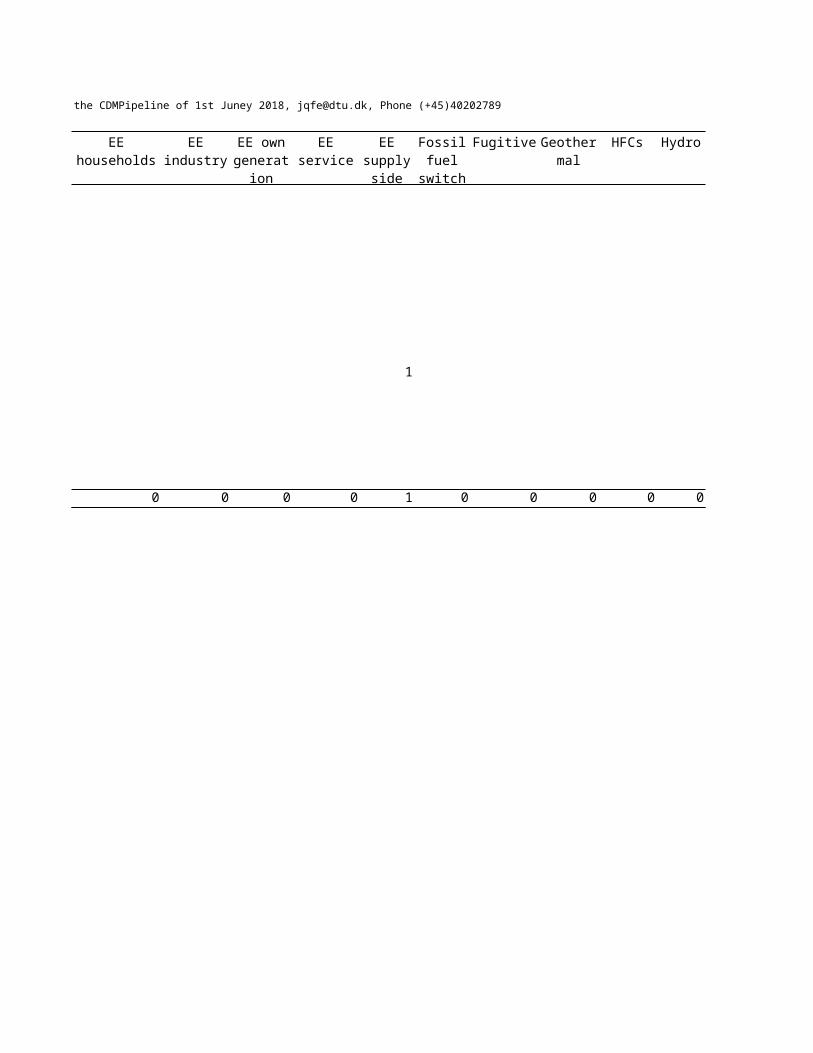
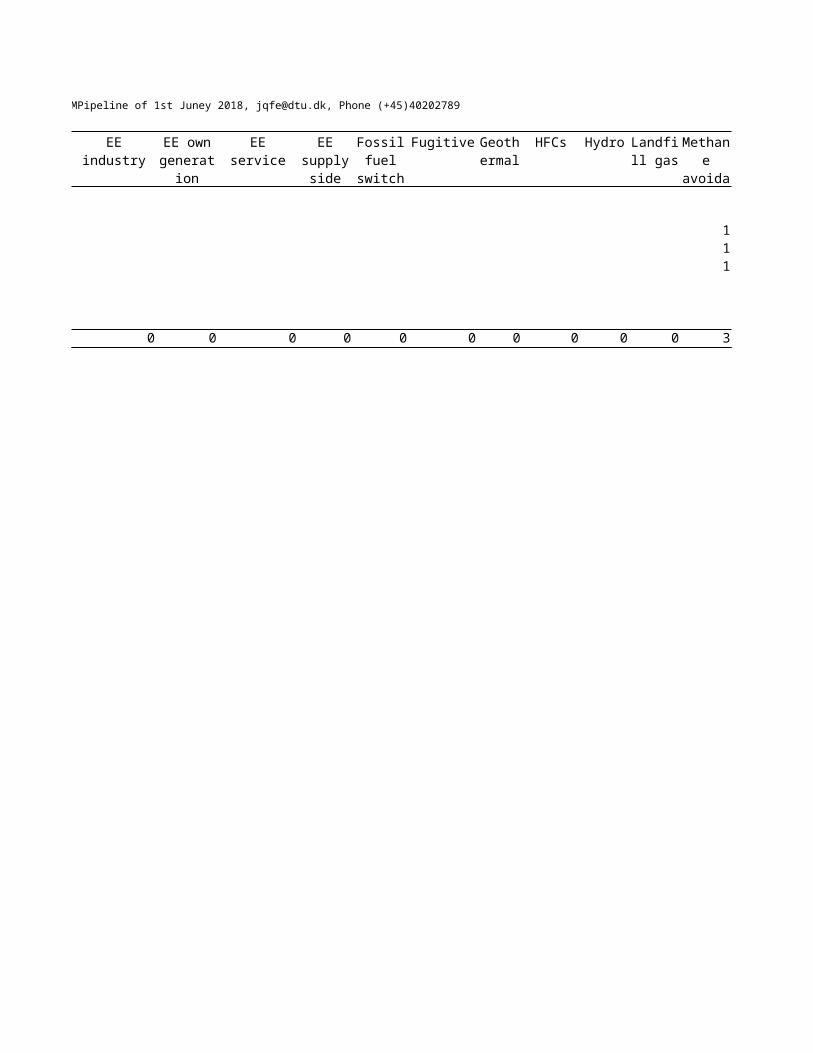
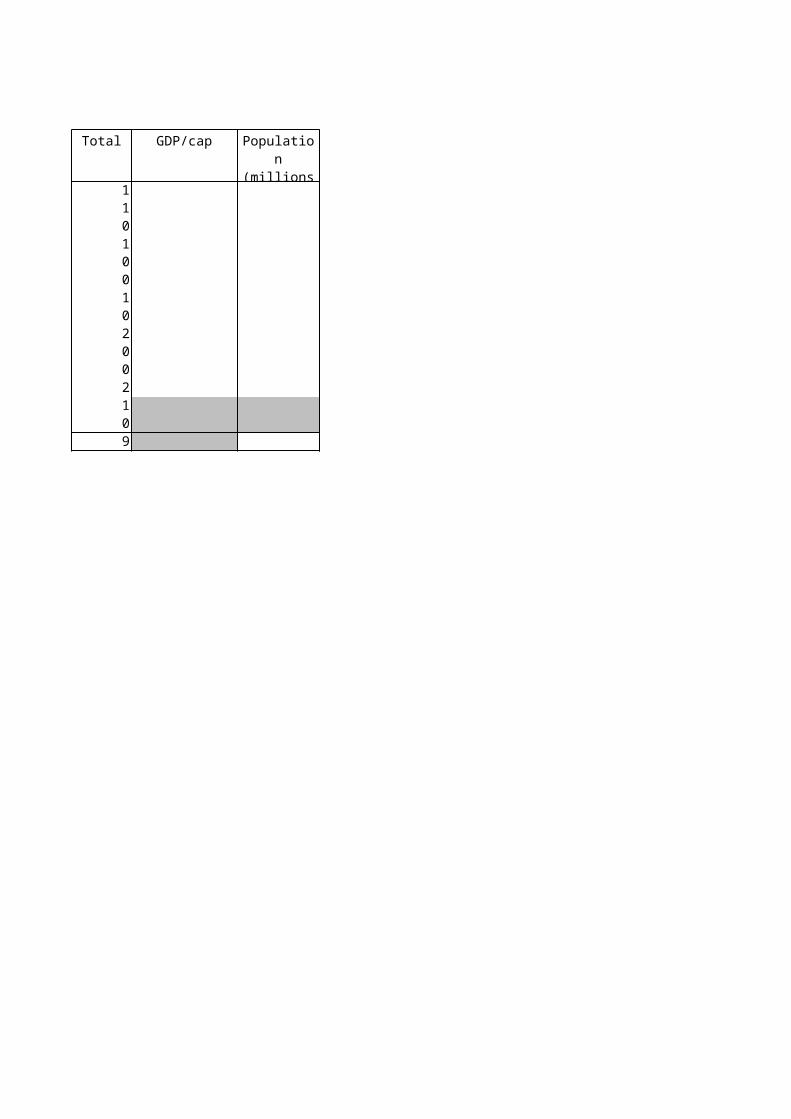
Adamawa 0Centre 1 1East 0Extreme North 0Littoral 1 1 2North 0Northwest 0South 0Southwest 0West 0Many 1 1n.a. 0Total 0 0 0 0 0 0 0 2 0 0 0 0 0 0 0 0 0 2 0 0 0 0 0 0 0 0 0 4 0.000
Cameroon Provinces
Afforestation
Agriculture
Biomass energy
CO2 capture
Coal bed/mine methane
Energy distribution
EE households
EE industry
EE own generati
on
EE service
EE supply side
Fossil fuel
switch
Geothermal
Landfill gas
Methane avoidance
Mixed renewable
s
PFCs and SF6
Reforestation
Transport
Population (millions)

This workbook was produced by Jørgen Fenhann, UNEP DTU Partnership from the CDMPipeline of 1st Juney 2018, [email protected], Phone (+45)40202789
Cement Fugitive HFCs Hydro N2O Solar Tidal Wind Total GDP/cap
Boa Vista 1 1Brava 0Fogo 0Maio 0Sal 1 1Santa Luzia 0Santiago 1 1Santo Antao 0Sao Vicente 1 1Sao Nicolau 0Many 0n.a. 0Total 0 0 0 0 0 0 0 0 0 0 0 0 0 0 0 0 0 0 0 0 0 0 0 0 0 0 4 4 0.000
Cape Verde Islands
Afforestation
Agriculture
Biomass energy
CO2 capture
Coal bed/mine methane
Energy distribution
EE households
EE industry
EE own generati
on
EE service
EE supply side
Fossil fuel
switch
Geothermal
Landfill gas
Methane avoidance
Mixed renewable
s
PFCs and SF6
Reforestation
Transport
Population (millions)

This workbook was produced by Jørgen Fenhann, UNEP DTU Partnership from the CDMPipeline of 1st Juney 2018, [email protected], Phone (+45)40202789
Region IRegion II 1 1Region IIIRegion IVRegion VRegion VI 1 1Region VII 1Region VIII 1 6Region IX 1 1Region X 3Region XIRegion XII 2Metropolitan Region 1 1Manyn.a.Total 3 0 13 0 0 0 0 0 1 1 0 1 2
Chile Regions

Total GDP/cap
2 6 8 17475 4285941 1 3 2 3 12 27061 493984
1 1 16768 2543362 1 7 10 8296 6032102 4 2 1 9 11142 15398525 4 11 9858 7806275 2 8 8507 9080973 5 1 5 21 10746 18615625 7 6167 8695357 1 2 13 9298 10731351 1 15536 91492
1 1 4 19151 1508262 3 1 8 15472 6061185
00
0 1 0 34 18 8 0 3 0 0 8 0 0 20 113 15116435Source: Banco Central de Chile and Instituto Nacional de Estadística (INE)
Source: Instituto Nacional de Estadística, Censo 2002.
Population (millions)

Region number Region name
Region I TarapacáRegion II AntofagastaRegion III AtacamaRegion IV CoquimboRegion V ValparaísoRegion VI Libertador General Bernando O'HigginsRegion VII MauleRegion VIII BiobíoRegion IX AraucaníaRegion X Los LagosRegion XI Aísen del General Carlos Ibañes del CampoRegion XII Magallanes y Antártica ChilenaMetropolitan Region
Source: Banco Central de Chile and Instituto Nacional de Estadística (INE)Source: Instituto Nacional de Estadística, Censo 2002.

This workbook was produced by Jørgen Fenhann, UNEP DTU Partnership from the CDMPipeline of 1st Juney 2018, [email protected], Phone (+45)40202789
Cement
Guizhou 2 8Yunnan 1Gansu 1 1Anhui 16 6Guangxi 4 1Jiangxi 7 2Sichuan 1 1 1 4HainanQinghai Hunan 12Henan 11 1 8Xinjiang 1 2 1Shanxi 2 1 30Ningxia 2 1Heilongjiang 13 2 2Shaanxi 17Chongqing 2 6Hubei 13Hebei 12 2 4 5Jilin 13 3Fujian 1Shandong 18 2Liaoning 3 4 2Guangdong 2Inner Mongolia 4 2 3Zhejiang 3 1Jiangsu 12 1TianjinBeijing 1ShanghaiManyn.a.Total 1 0 153 9 0 100 12 6Pct. of total 0.0% 0.0% 4.0% 0.2% 0.0% 2.6% 0.3% 0.2%
China Provinces
Afforestation
Agriculture
Biomass energy
CO2 capture
Coal bed/mine methane
Energy distributio
n
EE households

This workbook was produced by Jørgen Fenhann, UNEP DTU Partnership from the CDMPipeline of 1st Juney 2018, [email protected], Phone (+45)40202789
Fugitive HFCs Hydro
2 72 1 73 302 2 13 137 1
21 2 6 17 46 4 96 26 1 2
1 8 1 335 43 61 1 20 1
1 17 1 102 4 22 19 3 3 9 16
5 1 2 59 110 10 2 1
2 1 1 1 13 1 2 1
1 21 1 1 36 1 15 35 1
11 1 53 8 212 1 6 11
4 9 1 61 2 3 50 71 20 1 2 8 6
5 5 56 1 4 9 16 8 3
10 1 2 19 4 5 5 16 9 2
11 1 5 3 9 41 2 1
1 6 2 3 11 1 3 2
9 227 1 20 35 3 2 11 1340 107 830.2% 5.9% 0.0% 0.5% 0.9% 0.1% 0.1% 0.3% 34.7% 2.8% 2.1%
EE industry
EE own generation
EE service
EE supply side
Fossil fuel
switch
Geothermal
Landfill gas
Methane avoidance

CNSB (China National Statistical Bureau), 2011, China Statistical Yearbook 2011, China Statistical Press, Beijing. Available at http://www.stats.gov.cn/tjsj/ndsj/N2O Solar Tidal Wind Total
1 22 115 3.31 132444 4 52 369 8.03 15715
1 23 1 71 239 9.34 161092 1 14 69 1.16 207721 2 7 81 1.76 20790
1 9 54 1.21 212057 1 5 369 4.59 21370
1 7 17 1.96 2381228 6 57 10.12 239861 9 149 2.27 24418
9 5 1 15 102 1.08 245611 3 19 85 180 8.25 24931
3 1 1 39 100 2.80 2576536 109 154 24.44 26820
1 1 94 120 3.13 270652 3 47 131 3.51 271191 1 1 52 1.80 27472
2 6 96 1.68 278961 3 1 1 1 130 190 2.64 28384
1 99 136 4.95 3156432 96 2.60 39949
5 4 126 193 2.01 408913 114 141 3.22 42188
49 98 0.94 441161 2 1 16 315 358 14.49 47236
1 1 16 72 1.32 509321 9 22 78 0.99 52664
5 9 0.70 712863 3 20 1.05 738161 10 18 0.78 74570
00
4 48 2 4 162 0 5 1519 3863 2.910.1% 1.2% 0.1% 0.1% 4.2% 0.0% 0.1% 39.3% 100.0%
Mixed renewable
s
PFCs and SF6
Reforestation
Transport
Projects per million cap
GDP/cap (Yuan)

CNSB (China National Statistical Bureau), 2011, China Statistical Yearbook 2011, China Statistical Press, Beijing. Available at http://www.stats.gov.cn/tjsj/ndsj/
35 46046 72226 41260 123646 95745 94580 17199 2066 135
66 160494 230922 54436 9206 169
38 103737 101229 79357 159772 203927 86737 147496 391744 1846
104 460125 116754 277279 414313 92219 141123 1717
1329 43653
Population (millions)
GDP (Billion Yuan)
Gui
zhou
Gan
su
Gua
ngxi
Sic
huan
Qin
ghai
Hen
an
Sha
nxi
Hei
long
jiang
Cho
ngqi
ng
Heb
ei
Fujia
n
Liao
ning
Inne
r Mon
golia
Jian
gsu
Bei
jing
0
10000
20000
30000
40000
50000
60000
70000
80000
0
50
100
150
200
250
300
350
Number of the 3 most popular types of CDM projects versus GDP/capita in Chinese provinces
Hydro Wind EE own generation Yuan/cap
Yuan
/cap
Num
ber o
f CDM
pro
ject
s
Gui
zhou
Gan
su
Gua
ngxi
Sic
huan
Qin
ghai
Hen
an
Sha
nxi
Hei
long
jiang
Cho
ngqi
ng
Heb
ei
Fujia
n
Liao
ning
Inne
r Mon
golia
Jian
gsu
Bei
jing
0
10000
20000
30000
40000
50000
60000
70000
80000
0
50
100
150
200
250
300
350
400
Total number of projects versus GDP/capita in Chinese provinces
Total number of projects Yuan/cap
Yuan
/cap
Proj
ects
/mill
ion
cap

Gui
zhou
Gan
su
Gua
ngxi
Sic
huan
Qin
ghai
Hen
an
Sha
nxi
Hei
long
jiang
Cho
ngqi
ng
Heb
ei
Fujia
n
Liao
ning
Inne
r Mon
golia
Jian
gsu
Bei
jing
0
10000
20000
30000
40000
50000
60000
70000
80000
0
50
100
150
200
250
300
350
Number of the 3 most popular types of CDM projects versus GDP/capita in Chinese provinces
Hydro Wind EE own generation Yuan/cap
Yuan
/cap
Num
ber o
f CDM
pro
ject
s

CNSB (China National Statistical Bureau), 2011, China Statistical Yearbook 2011, China Statistical Press, Beijing. Available at http://www.stats.gov.cn/tjsj/ndsj/
Gui
zhou
Gan
su
Gua
ngxi
Sic
huan
Qin
ghai
Hen
an
Sha
nxi
Hei
long
jiang
Cho
ngqi
ng
Heb
ei
Fujia
n
Liao
ning
Inne
r Mon
golia
Jian
gsu
Bei
jing
0
10000
20000
30000
40000
50000
60000
70000
80000
0
50
100
150
200
250
300
350
Number of the 3 most popular types of CDM projects versus GDP/capita in Chinese provinces
Hydro Wind EE own generation Yuan/cap
Yuan
/cap
Num
ber o
f CDM
pro
ject
s
Gui
zhou
Gan
su
Gua
ngxi
Sic
huan
Qin
ghai
Hen
an
Sha
nxi
Hei
long
jiang
Cho
ngqi
ng
Heb
ei
Fujia
n
Liao
ning
Inne
r Mon
golia
Jian
gsu
Bei
jing
0
10000
20000
30000
40000
50000
60000
70000
80000
0
50
100
150
200
250
300
350
400
Total number of projects versus GDP/capita in Chinese provinces
Total number of projects Yuan/cap
Yuan
/cap
Proj
ects
/mill
ion
cap
Biomass energy4.4%
Cement0.3% Energy distribution
0.3% EE own generation6.5%
EE service0%
Fugitive 0.1%
Hydro38.2%
Landfill gas3%
Methane avoidance2.4%
Mixed renewables0.1%
N2O1%
Wind43%
Number of CDM projects in China by type
Gui
zhou
Gan
su
Gua
ngxi
Sic
huan
Qin
ghai
Hen
an
Sha
nxi
Hei
long
jiang
Cho
ngqi
ng
Heb
ei
Fujia
n
Liao
ning
Inne
r Mon
golia
Jian
gsu
Bei
jing
0
10000
20000
30000
40000
50000
60000
70000
80000
0
50
100
150
200
250
300
350
Number of the 3 most popular types of CDM projects versus GDP/capita in Chinese provinces
Hydro Wind EE own generation Yuan/cap
Yuan
/cap
Num
ber o
f CDM
pro
ject
s

Biomass energy4.4%
Cement0.3% Energy distribution
0.3% EE own generation6.5%
EE service0%
Fugitive 0.1%
Hydro38.2%
Landfill gas3%
Methane avoidance2.4%
Mixed renewables0.1%
N2O1%
Wind43%
Number of CDM projects in China by type

This workbook was produced by Jørgen Fenhann, UNEP DTU Partnership from the CDMPipeline of 1st Juney 2018, [email protected], Phone (+45)40202789
Cement
AmazonasAntioquiaAraucaAtlántico 1BolívarBogotáBoyacáCaldasCaquetáCasanareCauca 1 1CesarChocóCórdobaCundinamarcaGuainíaGuaviareHuilaLa GuajiraMagdalenaMetaNariño 1Norte de Santander 1PutumayoQuindíoRisaralda
SantanderSucreTolima 1Valle del Cauca 1VaupésVichada 1Manyn.a.Total 1 0 4 0 1 0 2
Colombia Departments
Afforestation
Agriculture
Biomass energy
CO2 capture
Coal bed/mine methane
Energy distribution
San Andrés and Providencia

This workbook was produced by Jørgen Fenhann, UNEP DTU Partnership from the CDMPipeline of 1st Juney 2018, [email protected], Phone (+45)40202789
Fugitive HFCs Hydro
1 10 3
11
1 11 21 1
4 1
11 1 1
1111
11 2
3 11
2 11
0 1 0 0 0 2 0 0 0 24 22
EE households
EE industry
EE own generati
on
EE service
EE supply side
Fossil fuel
switch
Geothermal
Landfill gas

N2O Solar Tidal Wind Total GDP/cap
01 2 2 19
01 1 41 2
1 33
1 30
1 11 1 93 3
01 2
3000
1 11 1 31 1 31 3
201
1 40
2 61 2
41 3
01
1 10
12 0 2 0 8 0 0 6 1 86
Methane avoidance
Mixed renewable
s
PFCs and SF6
Reforestation
Transport

0.0805.7500.2822.3662.2307.1181.4111.1700.4630.3261.3631.0500.4131.3939.4680.0430.0130.9940.5251.4030.7711.7751.4940.3780.6131.0241.0242.0850.8691.3134.5250.0330.097
53.866
Population (millions)

This workbook was produced by Jørgen Fenhann, UNEP DTU Partnership from the CDMPipeline of 1st Juney 2018, [email protected], Phone (+45)40202789
Cement
Bandundu Bas-Congo Equateur Kasai-Occidental Kasai-Oriental Katanga Kinshasa 1Maniema Nord-Kivu Orientale Sud-Kivu Off-shoreManyn.a.Total 1 0 0 0 0 0 0
Democratic Republic of Congo DR Provinces
Afforestation
Agriculture
Biomass energy
CO2 capture
Coal bed/mine methane
Energy distribution

This workbook was produced by Jørgen Fenhann, UNEP DTU Partnership from the CDMPipeline of 1st Juney 2018, [email protected], Phone (+45)40202789
Fugitive HFCs Hydro
1
0 0 0 0 0 0 0 0 0 0 1
EE households
EE industry
EE own generati
on
EE service
EE supply side
Fossil fuel
switch
Geothermal
Landfill gas

N2O Solar Tidal Wind Total GDP/cap
00000020000000
0 0 0 0 0 0 0 0 0 2
Methane avoidance
Mixed renewable
s
PFCs and SF6
Reforestation
Transport

Population (millions)

This workbook was produced by Jørgen Fenhann, UNEP DTU Partnership from the CDMPipeline of 1st Juney 2018, [email protected], Phone (+45)40202789
Cement
AlajuelaCartagoGuanacaste 1HerediaLimónPuntarenas 2San JoséManyn.a.Total 0 0 3 0 0 0 0 0
Costa Rica Provinces
Afforestation
Agriculture
Biomass energy
CO2 capture
Coal bed/mine methane
Energy distribution
EE households

This workbook was produced by Jørgen Fenhann, UNEP DTU Partnership from the CDMPipeline of 1st Juney 2018, [email protected], Phone (+45)40202789
Fugitive HFCs Hydro
1 12111
1 1
0 0 0 0 0 0 0 0 7 2 0
EE industry
EE own generati
on
EE service
EE supply side
Fossil fuel
switch
Geothermal
Landfill gas
Methane avoidance

N2O Solar Tidal Wind Total GDP/cap
21 34 6
112
1 1 400
0 0 0 1 0 0 0 6 19
Mixed renewables
PFCs and SF6
Reforestation
Transport
Population (millions)

This workbook was produced by Jørgen Fenhann, UNEP DTU Partnership from the CDMPipeline of 1st Juney 2018, [email protected], Phone (+45)40202789
Cuba Provinces Cement
CamagüeyCiego de ÁvillaCienfuegosGranmaGuantánamoHavanaHavana cityHolguínIsla de la JuventudLas TunasMatanzasPinar del RíoSancti SpíritusSantiago de CubaVilla ClaraManyn.a.Total 0 0 0 0 0 0 0 0
Afforestation
Agriculture
Biomass energy
CO2 capture
Coal bed/mine methane
Energy distribution
EE households

This workbook was produced by Jørgen Fenhann, UNEP DTU Partnership from the CDMPipeline of 1st Juney 2018, [email protected], Phone (+45)40202789
Fugitive HFCs Hydro
1
1
1
0 0 0 1 0 0 0 0 0 2 0
EE industry
EE own generati
on
EE service
EE supply side
Fossil fuel
switch
Geothermal
Landfill gas
Methane avoidance

N2O Solar Tidal Wind Total GDP/cap
00000010001001000
0 0 0 0 0 0 0 0 3
Mixed renewable
s
PFCs and SF6
Reforestation
Transport
Population (millions)

This workbook was produced by Jørgen Fenhann, UNEP DTU Partnership from the CDMPipeline of 1st Juney 2018, [email protected], Phone (+45)40202789
Cement
FamagustaKyreniaLarnacaLimassolNicosiaPaphosManyn.a.Total 0 0 0 0 0 0 0 0
Cyprus districts
Afforestation
Agriculture
Biomass
energy
CO2 capture
Coal bed/min
e methan
Energy distributio
n
EE households

This workbook was produced by Jørgen Fenhann, UNEP DTU Partnership from the CDMPipeline of 1st Juney 2018, [email protected], Phone (+45)40202789
EE industry EE service Fugitive HFCs Hydro
111
0 0 0 0 0 0 0 0 0 0 3
EE own generati
on
EE supply side
Fossil fuel
switch
Geothermal
Landfill gas
Methane
avoidance

N2O Solar Tidal Wind Total GDP/cap
00
4 51 21 21 1
00
0 0 0 0 0 0 0 7 10
Mixed renewa
bles
PFCs and SF6
Reforestation
Transport
Population (millions)

This workbook was produced by Jørgen Fenhann, UNEP DTU Partnership from the CDMPipeline of 1st Juney 2018, [email protected], Phone (+45)40202789
Cement
Azua Bahoruco Barahona Dajabón Duarte Elías Piña El Seibo Espaillat Hato Mayor Independencia La Altagracia La Romana La Vega María Trinidad Sánchez Monseñor Nouel 1Monte Cristi Monte Plata Pedernales Peravia Puerto Plata Hermanas Mirabal Samaná Sánchez Ramírez San Cristóbal San José de Ocoa San Juan San Pedro de Macorís 1 1Santiago Santiago Rodríguez Santo Domingo 3Santo Domingo CityManyn.a.Total 0 0 5 1 0 0 0 0
Dominican Republic Provinces
Afforestation
Agriculture
Biomass
energy
CO2 capture
Coal bed/min
e methan
Energy distributio
n
EE households

This workbook was produced by Jørgen Fenhann, UNEP DTU Partnership from the CDMPipeline of 1st Juney 2018, [email protected], Phone (+45)40202789
EE industry EE service Fugitive HFCs Hydro
1
11
0 0 0 0 1 0 0 0 1 1 0
EE own generati
on
EE supply side
Fossil fuel
switch
Geothermal
Landfill gas
Methane
avoidance

N2O Solar Tidal Wind Total GDP/cap
000000000000001
2 21 1
3 31 1
0000001200
1 5100
0 0 0 0 2 0 0 6 17
Mixed renewa
bles
PFCs and SF6
Reforestation
Transport
Population (millions)

This workbook was produced by Jørgen Fenhann, UNEP DTU Partnership from the CDMPipeline of 1st Juney 2018, [email protected], Phone (+45)40202789
Cement
AzuayBolívarCañarCarchiChimborazoCotopaxiEl OroEsmeraldasGalápagosGuayas 2Imbabura 1LojaLos RíosManabiMoronaNapoOrellanaPastazaPichinchaSucumbiusTungurahuaZamora-ChinchipeMany 1n.a.Total 0 0 3 0 0 0 0 1
Ecuador provinces
Afforestation
Agriculture
Biomass
energy
CO2 capture
Coal bed/min
e methan
Energy distributio
n
EE households

This workbook was produced by Jørgen Fenhann, UNEP DTU Partnership from the CDMPipeline of 1st Juney 2018, [email protected], Phone (+45)40202789
EE industry EE service Fugitive HFCs Hydro
2 1111
21
1
21
1
34
4 2 4
11
0 0 0 0 0 0 0 0 23 3 7
EE own generati
on
EE supply side
Fossil fuel
switch
Geothermal
Landfill gas
Methane
avoidance

N2O Solar Tidal Wind Total GDP/cap
31110211
2 242
1 1103400
1 1 1201110
0 0 0 0 1 0 1 3 42
Mixed renewa
bles
PFCs and SF6
Reforestation
Transport
Population (millions)

This workbook was produced by Jørgen Fenhann, UNEP DTU Partnership from the CDMPipeline of 1st Juney 2018, [email protected], Phone (+45)40202789
Cement
AlexandriaAswanAsyut 1BeheiraBeni SuefCairoDakahliaDamiettaFaiyumGharbiaGizaHelwanIsmailiaKafr el-SheikhLuxorMatruhMinya Minya Upper MonufiaNew ValleyNorth SinaiPort SaidQalyubiaQenaRed SeaSharqiaSohagSouth SinaiSuez 1Manyn.a.Total 0 0 2 0 0 0 0 0
Egypt Governates
Afforestation
Agriculture
Biomass
energy
CO2 capture
Coal bed/min
e methan
Energy distributio
n
EE households
This workbook was produced by Jørgen Fenhann, UNEP DTU Partnership from the CDMPipeline of 1st Juney 2018, [email protected], Phone (+45)40202789
EE industry EE service Fugitive HFCs Hydro
1 1 1 1
2 1
1 1
1 11
4 1 0 2 2 1 0 0 0 2 0
EE own generati
on
EE supply side
Fossil fuel
switch
Geothermal
Landfill gas
Methane
avoidance

N2O Solar Tidal Wind Total GDP/cap
1 51 1
1003
1 100020000000000000000
1 4 810
0 4 0 0 0 0 0 4 22
Mixed renewa
bles
PFCs and SF6
Reforestation
Transport
Population (millions)

Governorate Capital LocationAlexandria Alexandria Northern Aswan Aswan Upper Asyut Asyut Upper Beheira Damanhur LowerBeni Suef Beni Suef Upper Cairo Cairo MiddleDakahlia Mansura LowerDamietta Damietta LowerFaiyum Faiyum Upper Gharbia Tanta LowerGiza Giza Upper Helwan Helwan MiddleIsmailia Ismailia CanalKafr el-Sheikh Kafr el-Sheikh LowerLuxor Luxor Upper Matruh Mersa Matruh Western Minya Minya Upper Minya Upper Monufia Shibin el-Kom LowerNew Valley Kharga Western North Sinai Arish SinaiPort Said Port Said CanalQalyubia Banha LowerQena Qena Upper Red Sea Hurghada EasternSharqia Zagazig LowerSohag Sohag Upper South Sinai el-Tor SinaiSuez Suez Canal

This workbook was produced by Jørgen Fenhann, UNEP DTU Partnership from the CDMPipeline of 1st Juney 2018, [email protected], Phone (+45)40202789
Cement EE industry
Ahuachapán Cabañas Chalatenango Cuscatlán La Libertad La Paz La Unión Morazán San Miguel San Salvador 1San Vicente Santa Ana Sonsonate 1Usulután Manyn.a.Total 0 0 2 0 0 0 0 0 0
El Salvador Departments
Afforestation
Agriculture
Biomass
energy
CO2 capture
Coal bed/min
e methan
Energy distributio
n
EE households
This workbook was produced by Jørgen Fenhann, UNEP DTU Partnership from the CDMPipeline of 1st Juney 2018, [email protected], Phone (+45)40202789
EE service Fugitive HFCs Hydro N2O
12
12
0 0 0 0 0 2 0 2 2 0 0 0
EE own generati
on
EE supply side
Fossil fuel
switch
Geothermal
Landfill gas
Methane
avoidance
Mixed renewa
bles

Solar Tidal Wind Total GDP/cap
0000000013002200
0 0 0 0 0 0 8
PFCs and SF6
Reforestation
Transport
Population (millions)

This workbook was produced by Jørgen Fenhann, UNEP DTU Partnership from the CDMPipeline of 1st Juney 2018, [email protected], Phone (+45)40202789
Ethiopia Provinces Cement
Addis AbabaAfarAmharaBenishangul-GumuzDira DawaHarariOromiaSomaliSouthernTigrayManyn.a.Total 0 0 0 0 0 0 0 0
Afforestation
Agriculture
Biomass
energy
CO2 capture
Coal bed/min
e methan
Energy distributio
n
EE households

This workbook was produced by Jørgen Fenhann, UNEP DTU Partnership from the CDMPipeline of 1st Juney 2018, [email protected], Phone (+45)40202789
EE industry EE service Fugitive HFCs Hydro
1
1
0 0 0 0 0 0 0 0 0 1 1
EE own generati
on
EE supply side
Fossil fuel
switch
Geothermal
Landfill gas
Methane
avoidance

N2O Solar Tidal Wind Total GDP/cap
10000010
1 1000
0 0 0 1 0 0 0 0 3
Mixed renewa
bles
PFCs and SF6
Reforestation
Transport
Population (millions)

This workbook was produced by Jørgen Fenhann, UNEP DTU Partnership from the CDMPipeline of 1st Juney 2018, [email protected], Phone (+45)40202789
Cement EE industry
Viti Levu 1Vannu LevuKadavuTaveuniOvalauYasawa groupManyn.a.
0 0 1 0 0 0 0 0 0
Fiji Islands
Afforestation
Agriculture
Biomass
energy
CO2 capture
Coal bed/min
e methan
Energy distributio
n
EE households

This workbook was produced by Jørgen Fenhann, UNEP DTU Partnership from the CDMPipeline of 1st Juney 2018, [email protected], Phone (+45)40202789
EE service Fugitive HFCs Hydro N2O
2 1
0 0 0 0 0 0 0 2 0 1 0 0
EE own generati
on
EE supply side
Fossil fuel
switch
Geothermal
Landfill gas
Methane
avoidance
Mixed renewa
bles

Solar Tidal Wind Total GDP/cap
40000000
0 0 0 0 0 0 4
PFCs and SF6
Reforestation
Transport
Population (millions)

This workbook was produced by Jørgen Fenhann, UNEP DTU Partnership from the CDMPipeline of 1st Juney 2018, [email protected], Phone (+45)40202789
Gambia divisions Cement
AbkhaziaSamegrelo-Zemo SvanetiGuriaAdjaraRacha-Lechkhumi and Kvemo SvanetiImeretiSamtskhe-JavakhetiShida KartliMtskheta-MtianetiKvemo KartliKakhetiTbilisiManyn.a.Total 0 0 0 0 0 0 0
Afforestation
Agriculture
Biomass
energy
CO2 capture
Coal bed/min
e methan
Energy distributio
n

This workbook was produced by Jørgen Fenhann, UNEP DTU Partnership from the CDMPipeline of 1st Juney 2018, [email protected], Phone (+45)40202789
EE industry EE service Fugitive HFCs Hydro
0 0 0 0 0 0 0 0 0 0 0
EE households
EE own generati
on
EE supply side
Fossil fuel
switch
Geothermal
Landfill gas

N2O Solar Tidal Wind Total GDP/cap
00000000000000
0 0 0 0 0 0 0 0 0 0
Methane
avoidance
Mixed renewa
bles
PFCs and SF6
Reforestation
Transport
Population (millions)

This workbook was produced by Jørgen Fenhann, UNEP DTU Partnership from the CDMPipeline of 1st Juney 2018, [email protected], Phone (+45)40202789
Cement
AbkhaziaSamegrelo-Zemo SvanetiGuriaAdjaraRacha-Lechkhumi and Kvemo SvanetiImeretiSamtskhe-JavakhetiShida KartliMtskheta-MtianetiKvemo KartliKakhetiTbilisiManyn.a.Total 0 0 0 0 0 0 0
Georgia Autonomous Republics and Regions
Afforestation
Agriculture
Biomass
energy
CO2 capture
Coal bed/min
e methan
Energy distributio
n

This workbook was produced by Jørgen Fenhann, UNEP DTU Partnership from the CDMPipeline of 1st Juney 2018, [email protected], Phone (+45)40202789
EE industry EE service Fugitive HFCs Hydro
1
1
1
2
1 11
0 0 0 0 0 0 2 0 0 5 1
EE households
EE own generati
on
EE supply side
Fossil fuel
switch
Geothermal
Landfill gas

N2O Solar Tidal Wind Total GDP/cap
11 1
010010200210
0 0 0 0 1 0 0 0 0 9
Methane
avoidance
Mixed renewa
bles
PFCs and SF6
Reforestation
Transport
Population (millions)

This workbook was produced by Jørgen Fenhann, UNEP DTU Partnership from the CDMPipeline of 1st Juney 2018, [email protected], Phone (+45)40202789
Ghana Regions Cement
AshantiBrong-AhafoCentralEasternGreater AccraNorthernUpper EastUpper WestVoltaWesternManyn.a.Total 0 0 0 0 0 0 0 0
Afforestation
Agriculture
Biomass energy
CO2 capture
Coal bed/mine methane
Energy distribution
EE households

This workbook was produced by Jørgen Fenhann, UNEP DTU Partnership from the CDMPipeline of 1st Juney 2018, [email protected], Phone (+45)40202789
Fugitive HFCs Hydro
0 0 0 0 0 0 0 0 0 0 0
EE industry
EE own generatio
n
EE service
EE supply side
Fossil fuel
switch
Geothermal
Landfill gas
Methane avoidance

N2O Solar Tidal Wind Total GDP/cap
000000000000
0 0 0 0 0 0 0 0 0
Mixed renewable
s
PFCs and SF6
Reforestation
Transport
Population (millions)


This workbook was produced by Jørgen Fenhann, UNEP DTU Partnership from the CDMPipeline of 1st Juney 2018, [email protected], Phone (+45)40202789
Cement
Alta Verapaz Baja Verapaz Chimaltenango Chiquimula El Progreso Escuintla Guatemala 1Guatemala CityHuehuetenango Izabal Jalapa Jutiapa Petén Quetzaltenango Quiché Retalhuleu Sacatepéquez San Marcos Santa Rosa Sololá Suchitepequéz Totonicapan ZacapaManyn.a.Total 0 0 1 0 0 0 0 0
Guatemala departments
Afforestation
Agriculture
Biomass
energy
CO2 capture
Coal bed/min
e methan
Energy distributio
n
EE households

This workbook was produced by Jørgen Fenhann, UNEP DTU Partnership from the CDMPipeline of 1st Juney 2018, [email protected], Phone (+45)40202789
EE industry EE service Fugitive HFCs Hydro
32
1 21 1
11
2
121
1 1
0 0 0 0 0 0 2 0 12 1 5
EE own generati
on
EE supply side
Fossil fuel
switch
Geothermal
Landfill gas
Methane
avoidance

N2O Solar Tidal Wind Total GDP/cap
320003
1 41 2
12000121020000000
0 0 0 0 0 0 1 1 23
Mixed renewa
bles
PFCs and SF6
Reforestation
Transport
Population (millions)

This workbook was produced by Jørgen Fenhann, UNEP DTU Partnership from the CDMPipeline of 1st Juney 2018, [email protected], Phone (+45)40202789
Cement
Barima-WainiPomeroon-Supenaam
4Demerara-MahaicaMahaica-BerbiceEast Berbice-Corentyne 1Cuyuni-MazaruniPotaro-SiparuniUpper Takutu-Upper EssequiboUpper Demerara-BerbiceManyn.a.Total 0 0 1 0 0 0 0
Guyana Regions
Afforestation
Agriculture
Biomass
energy
CO2 capture
Coal bed/min
e methan
Energy distributio
n
Essequibo Islands-West Demerara

This workbook was produced by Jørgen Fenhann, UNEP DTU Partnership from the CDMPipeline of 1st Juney 2018, [email protected], Phone (+45)40202789
EE industry EE service Fugitive HFCs Hydro
0 0 0 0 0 0 0 0 0 0 0
EE households
EE own generati
on
EE supply side
Fossil fuel
switch
Geothermal
Landfill gas

N2O Solar Tidal Wind Total GDP/cap
0 0.0240 0.0490 0.1030 0.3100 0.0521 0.1240 0.0180 0.0100 0.0190 0.04100
0 0 0 0 0 0 0 0 0 1 0.750
Methane
avoidance
Mixed renewa
bles
PFCs and SF6
Reforestation
Transport
Population (millions)

This workbook was produced by Jørgen Fenhann, UNEP DTU Partnership from the CDMPipeline of 1st Juney 2018, [email protected], Phone (+45)40202789
Haiti Departments Cement
Nord-OuestNordNord-EstArtiboniteCentreOuestGrand'AnseNippesSudSud-EstManyn.a.Total 0 0 0 0 0 0 0 0
Afforestation
Agriculture
Biomass
energy
CO2 capture
Coal bed/min
e methan
Energy distributio
n
EE households

This workbook was produced by Jørgen Fenhann, UNEP DTU Partnership from the CDMPipeline of 1st Juney 2018, [email protected], Phone (+45)40202789
EE industry EE service Fugitive HFCs Hydro
0 0 0 0 0 0 0 0 0 0 0
EE own generati
on
EE supply side
Fossil fuel
switch
Geothermal
Landfill gas
Methane
avoidance

N2O Solar Tidal Wind Total GDP/cap
0 0.3440 0.3910 0.2470 0.3530 0.2890 1.2030 0.3500 1.1810 0.0670 0.18000
0 0 0 0 0 0 0 0 0 4.604
Mixed renewa
bles
PFCs and SF6
Reforestation
Transport
Population (millions)

This workbook was produced by Jørgen Fenhann, UNEP DTU Partnership from the CDMPipeline of 1st Juney 2018, [email protected], Phone (+45)40202789
Cement
AtlántidaCholutecaColónComayaguaCopánCortés 1El ParaísoFrancisco Morazán 1Gracias a DiosIntibucáIslas de la BahíaLa PazLempiraOcotepequeOlancho 1Santa BárbaraValleYoro 2Manyn.a.Total 0 0 5 0 0 0 0 0
Honduras Departments
Afforestation
Agriculture
Biomass
energy
CO2 capture
Coal bed/min
e methan
Energy distributio
n
EE households

This workbook was produced by Jørgen Fenhann, UNEP DTU Partnership from the CDMPipeline of 1st Juney 2018, [email protected], Phone (+45)40202789
EE industry EE service Fugitive HFCs Hydro
3 1
1 2
11 5 1
1
2
23
2 3
0 0 0 1 0 0 1 0 19 0 7
EE own generati
on
EE supply side
Fossil fuel
switch
Geothermal
Landfill gas
Methane
avoidance
N2O Solar Tidal Wind Total GDP/cap
4 0.3441 1 0.391
3 0.2470 0.3531 0.2898 1.2030 0.350
1 2 1.1810 0.0671 0.1800 0.0382 0.1570 0.2500 0.1083 0.4203 0.3420 0.1527 0.46500
0 0 0 0 0 0 0 2 35 6.535
Mixed renewa
bles
PFCs and SF6
Reforestation
Transport
Population (millions)

This workbook was produced by Jørgen Fenhann, UNEP DTU Partnership from the CDMPipeline of 1st Juney 2018, [email protected], Phone (+45)40202789
India States Cement
Bihar 5Andaman and NicobarUttar Pradesh 43 1Orissa 3 2Jharkhand 1 1Madhya Pradesh 13 2AssamChhattisgarh 21 2Rajasthan 16 4ManipurJammu and Kashmir 1Uttarakhand 5MeghalayaArunachal PradeshWest Bengal 11 1TripuraAndhra Pradesh 37 2 2TelanganaKarnataka 23 2SikkimNagalandTamil Nadu 25 1MizoramGujarat 17 1Kerala 1 1Himachal Pradesh 2 1Punjab 35 1Haryana 1 11Maharashtra 1 36 4DelhiGoaMany 1 1n.a.Total 1 1 307 24 0 1 4Pct. of total 0.0% 0.0% 14.6% 1.1% 0.0% 0.0% 0.2%
Afforestation
Agriculture
Biomass energy
CO2 capture
Coal bed/mine methane
Energy distribution

This workbook was produced by Jørgen Fenhann, UNEP DTU Partnership from the CDMPipeline of 1st Juney 2018, [email protected], Phone (+45)40202789
EE households Fugitive HFCs Hydro
1 1
4 10 2 1 3 1 89 7 14 3 1
3 12 1 1 1 11 1 1 2
1 5 28 1 18 3 7 1 1
31 1 1 1 1 17 1
12 2
5 9 5 6 1 31
1 12 9 5 2 10 1 6 3
3 1 7 1 1 41 19
4 5 1 1 3 2 2 2
1 14 6 9 12 2 2 32 7 1
1 1 75 11 6 2
1 3 1 4 2 127 7 3 8 2 5 2 1 12 2
2 1 51 2
6 4 1
62 81 98 27 29 39 9 0 8 196 303.0% 3.9% 4.7% 1.3% 1.4% 1.9% 0.4% 0.0% 0.4% 9.3% 1.4%
EE industry
EE own generati
on
EE service
EE supply side
Fossil fuel
switch
Geothermal
Landfill gas

N2O Solar Tidal Wind Total
1 8 56061 1
3 1 10 5 1 93 99631 3 3 46 10164
6 111391 8 11 37 78 115001 6 122472 2 2 65 12369
5 1 47 1 150 244 126410 128784 14507
1 29 149471 168034 16916
2 43 184941 18550
6 4 8 25 133 190871 1 19087
7 1 1 16 106 211 195769 200130 20746
6 1 1 6 260 320 217400 22207
1 3 1 57 146 275 226242 3 17 22776
1 82 229024 1 50 26395
2 2 28 268186 5 7 13 1 149 291 26858
1 2 11 455793 60787
2 4 21 400
41 25 8 2 23 176 0 10 898 21002.0% 1.2% 0.4% 0.1% 1.1% 8.4% 0.0% 0.5% 42.8% 100.0%
Methane avoidanc
e
Mixed renewabl
es
PFCs and SF6
Reforestation
Transport
2003 GDP/cap Rupies

March 2001
82.9
166.236.826.960.326.720.856.5
2.210.1
8.52.31.1
80.23.2
41.235.052.9
0.52.0
62.40.9
50.731.8
6.124.421.196.913.9
1.3
1025.8
Population (millions)
Bih
arA
ndam
an a
nd N
icob
arU
ttar
Pra
desh
Oris
saJh
arkh
and
Mad
hya
Pra
desh
Ass
amC
hhat
tisga
rhR
ajas
than
Man
ipur
Jam
mu
and
Kas
hmir
Utta
rakh
and
Meg
hala
yaA
runa
chal
Pra
desh
Wes
t Ben
gal
Trip
ura
And
hra
Pra
desh
Tel
anga
naK
arna
taka
Sik
kim
Nag
alan
dT
amil
Nad
uM
izor
amG
ujar
atK
eral
aH
imac
hal P
rade
shP
unja
bH
arya
naM
ahar
asht
raD
elhi
Goa
0
10000
20000
30000
40000
50000
60000
70000
0
50
100
150
200
250
300
350
Total number of projects versus GDP/capita in Indian states
Total number of projects Rupies/cap
Rupi
es/c
ap
Num
ber o
f pro
ject
s
Bih
arA
ndam
an a
nd N
icob
arU
ttar
Pra
desh
Oris
saJh
arkh
and
Mad
hya
Pra
desh
Ass
amC
hhat
tisga
rhR
ajas
than
Man
ipur
Jam
mu
and
Kas
hmir
Utta
rakh
and
Meg
hala
yaA
runa
chal
Pra
desh
Wes
t Ben
gal
Trip
ura
And
hra
Pra
desh
Tel
anga
naK
arna
taka
Sik
kim
Nag
alan
dT
amil
Nad
uM
izor
amG
ujar
atK
eral
aH
imac
hal P
rade
shP
unja
bH
arya
naM
ahar
asht
raD
elhi
Goa
0
10000
20000
30000
40000
50000
60000
70000
0
50
100
150
200
250
300
Number of the 3 most popular types of CDM projects versus GDP/capita in Indian states
Biomass Wind EE industry Rupies/cap
Rupi
es/c
ap
Num
ber o
f CDM
pro
ject
s

Bih
arA
ndam
an a
nd N
icob
arU
ttar
Pra
desh
Oris
saJh
arkh
and
Mad
hya
Pra
desh
Ass
amC
hhat
tisga
rhR
ajas
than
Man
ipur
Jam
mu
and
Kas
hmir
Utta
rakh
and
Meg
hala
yaA
runa
chal
Pra
desh
Wes
t Ben
gal
Trip
ura
And
hra
Pra
desh
Tel
anga
naK
arna
taka
Sik
kim
Nag
alan
dT
amil
Nad
uM
izor
amG
ujar
atK
eral
aH
imac
hal P
rade
shP
unja
bH
arya
naM
ahar
asht
raD
elhi
Goa
0
10000
20000
30000
40000
50000
60000
70000
0
50
100
150
200
250
300
350
Total number of projects versus GDP/capita in Indian states
Total number of projects Rupies/cap
Rupi
es/c
ap
Num
ber o
f pro
ject
s
Bih
arA
ndam
an a
nd N
icob
arU
ttar
Pra
desh
Oris
saJh
arkh
and
Mad
hya
Pra
desh
Ass
amC
hhat
tisga
rhR
ajas
than
Man
ipur
Jam
mu
and
Kas
hmir
Utta
rakh
and
Meg
hala
yaA
runa
chal
Pra
desh
Wes
t Ben
gal
Trip
ura
And
hra
Pra
desh
Tel
anga
naK
arna
taka
Sik
kim
Nag
alan
dT
amil
Nad
uM
izor
amG
ujar
atK
eral
aH
imac
hal P
rade
shP
unja
bH
arya
naM
ahar
asht
raD
elhi
Goa
0
10000
20000
30000
40000
50000
60000
70000
0
50
100
150
200
250
300
Number of the 3 most popular types of CDM projects versus GDP/capita in Indian states
Biomass Wind EE industry Rupies/cap
Rupi
es/c
ap
Num
ber o
f CDM
pro
ject
s
Biomass energy31.7%
Cement2.5%
EE households6.4%
EE industry8.4%EE own generation
10%
EE service2.8%
EE supply side3.0%
Fossil fuel switch4%
Hydro20.3%
Landfill gas3.1%
Methane avoidance4%
Reforestation2%
Transport1%
Number of CDM projects in India by type
Bih
arA
ndam
an a
nd N
icob
arU
ttar
Pra
desh
Oris
saJh
arkh
and
Mad
hya
Pra
desh
Ass
amC
hhat
tisga
rhR
ajas
than
Man
ipur
Jam
mu
and
Kas
hmir
Utta
rakh
and
Meg
hala
yaA
runa
chal
Pra
desh
Wes
t Ben
gal
Trip
ura
And
hra
Pra
desh
Tel
anga
naK
arna
taka
Sik
kim
Nag
alan
dT
amil
Nad
uM
izor
amG
ujar
atK
eral
aH
imac
hal P
rade
shP
unja
bH
arya
naM
ahar
asht
raD
elhi
Goa
0
10000
20000
30000
40000
50000
60000
70000
0
50
100
150
200
250
300
Number of the 3 most popular types of CDM projects versus GDP/capita in Indian states
Biomass Wind EE industry Rupies/cap
Rupi
es/c
ap
Num
ber o
f CDM
pro
ject
s

Biomass energy31.7%
Cement2.5%
EE households6.4%
EE industry8.4%EE own generation
10%
EE service2.8%
EE supply side3.0%
Fossil fuel switch4%
Hydro20.3%
Landfill gas3.1%
Methane avoidance4%
Reforestation2%
Transport1%
Number of CDM projects in India by type

This workbook was produced by Jørgen Fenhann, UNEP DTU Partnership from the CDMPipeline of 1st Juney 2018, [email protected], Phone (+45)40202789
Cement
AcehBaliBangka-Belitung 2BantenBengkuluCentral Java 2Central Kalimantan 2Central SulawesiEast Java 1East KalimantanEast Nusa TenggaraGorontaloJakartaJambiLampungMaluku
North MalukuNorth Sulawesi 1North Sumatra 2PapuaRiau 2Riau IslandsSouth East SulawesiSouth Kalimantan 1 1South Sulawesi 1South SumatraWest Java 2 1West Kalimantan 1West Nusa TenggaraWest PapuaWest SulawesiWest SumatraYogyakartaManyn.a.Total 0 0 17 2 0 0 0 0
Indonesia Provinces
Afforestation
Agriculture
Biomass energy
CO2 capture
Coal bed/mine methane
Energy distribution
EE households
Nanggroe Aceh Darussalam

This workbook was produced by Jørgen Fenhann, UNEP DTU Partnership from the CDMPipeline of 1st Juney 2018, [email protected], Phone (+45)40202789
Fugitive HFCs Hydro
11 1
11 1 1
2 12 2 1
61 1
1 11 1 2
1 11 4
2 1 1 21
28 7
2 1 2 111
12 1
1 3 1 93 1 1 2 6 3 3
1 21
1 1 1 1 2
5 1 0 5 5 3 14 0 20 19 70
EE industry
EE own generati
on
EE service
EE supply side
Fossil fuel
switch
Geothermal
Landfill gas
Methane avoidance

N2O Solar Tidal Wind Total GDP/cap
1 223337823
1 50025
250003
1 180
181034
141 23
41006000
0 2 1 0 1 0 0 0 165
Mixed renewables
PFCs and SF6
Reforestation
Transport
Population (millions)

This workbook was produced by Jørgen Fenhann, UNEP DTU Partnership from the CDMPipeline of 1st Juney 2018, [email protected], Phone (+45)40202789
Cement
ArdabilEast AzarbaijanWest AzarbaijanBushehrChahar Mahaal and BakhtiariFarsGilanGolestanHamadanHormozganIlamIsfahanKermanKermanshahNorth KhorasanRazavi KhorasanSouth KhorasanKhuzestanKohgiluyeh and Boyer-AhmadKordestanLorestanMarkaziMazandaranQazvinQomSemnanSistan and BaluchistanTehranYazdZanjanManyn.a.Total 0 0 0 0 0 0 0
Iran Provinces
Afforestation
Agriculture
Biomass
energy
CO2 capture
Coal bed/min
e methan
Energy distributio
n

This workbook was produced by Jørgen Fenhann, UNEP DTU Partnership from the CDMPipeline of 1st Juney 2018, [email protected], Phone (+45)40202789
EE industry EE service Fugitive HFCs Hydro
1 1
2 1
11
1 1
111 1
11
6
1
1
0 0 0 0 8 9 3 0 0 2 1
EE households
EE own generati
on
EE supply side
Fossil fuel
switch
Geothermal
Landfill gas

N2O Solar Tidal Wind Total GDP/cap
02030
1 210020112110601000
1 1000
2 210
1 10
2 0 1 1 0 0 0 0 1 28
Methane
avoidance
Mixed renewa
bles
PFCs and SF6
Reforestation
Transport
Population (millions)

This workbook was produced by Jørgen Fenhann, UNEP DTU Partnership from the CDMPipeline of 1st Juney 2018, [email protected], Phone (+45)40202789
Iraq Governates Cement
AnbarArbilBabilBaghdadBasraDhi QarDiyalaDohukKarbalaKirkukMaysanMuthannaNajafNinevehQadisiyyahSaladinSulaimaniyahWasitManyn.a.Total 0 0 0 0 0 0 0
Afforestation
Agriculture
Biomass
energy
CO2 capture
Coal bed/min
e methan
Energy distributio
n

This workbook was produced by Jørgen Fenhann, UNEP DTU Partnership from the CDMPipeline of 1st Juney 2018, [email protected], Phone (+45)40202789
EE industry EE service Fugitive HFCs Hydro
1
1
0 0 0 0 2 0 0 0 0 0 0
EE households
EE own generati
on
EE supply side
Fossil fuel
switch
Geothermal
Landfill gas

N2O Solar Tidal Wind Total GDP/cap
01000000000000001000
0 0 0 0 0 0 0 0 0 2
Methane
avoidance
Mixed renewa
bles
PFCs and SF6
Reforestation
Transport
Population (millions)

This workbook was produced by Jørgen Fenhann, UNEP DTU Partnership from the CDMPipeline of 1st Juney 2018, [email protected], Phone (+45)40202789
Cement EE industry
Center 1Haifa 1JerusalemNorthern 1SouthernTel AvivManyn.a.Total 0 0 2 0 0 0 0 0 1
Israel Districts
Afforestation
Agriculture
Biomass
energy
CO2 capture
Coal bed/min
e methan
Energy distributio
n
EE households

This workbook was produced by Jørgen Fenhann, UNEP DTU Partnership from the CDMPipeline of 1st Juney 2018, [email protected], Phone (+45)40202789
EE service Fugitive HFCs Hydro N2O
1 1 11 1 1
3 11 4 1 3
2
1 0 0 2 0 0 0 0 11 3 0 4
EE own generati
on
EE supply side
Fossil fuel
switch
Geothermal
Landfill gas
Methane
avoidance
Mixed renewa
bles

Solar Tidal Wind Total GDP/cap
1 51 5
01 6
2 4 152
3 31 1
2 0 9 0 0 2 37
PFCs and SF6
Reforestation
Transport
Population (millions)

This workbook was produced by Jørgen Fenhann, UNEP DTU Partnership from the CDMPipeline of 1st Juney 2018, [email protected], Phone (+45)40202789
Cement
Agnéby Bafing Bas-Sassandra Denguélé Dix-Huit Montagnes Fromager Haut-Sassandra Lacs Lagunes Marahoué Moyen-Cavally Moyen-Comoé N'zi-Comoé Savanes Sud-Bandama Sud-Comoé Vallée du Bandama Worodougou Zanzan Manyn.a.Total 0 0 0 0 0 0 0 0
Ivory Coast Regions
Afforestation
Agriculture
Biomass
energy
CO2 capture
Coal bed/min
e methan
Energy distributio
n
EE households

This workbook was produced by Jørgen Fenhann, UNEP DTU Partnership from the CDMPipeline of 1st Juney 2018, [email protected], Phone (+45)40202789
EE industry EE service Fugitive HFCs Hydro
0 0 0 0 0 0 0 0 0 0 0
EE own generati
on
EE supply side
Fossil fuel
switch
Geothermal
Landfill gas
Methane
avoidance

N2O Solar Tidal Wind Total GDP/cap
000000000000000000000
0 0 0 0 0 0 0 0 0
Mixed renewa
bles
PFCs and SF6
Reforestation
Transport
Population (millions)

This workbook was produced by Jørgen Fenhann, UNEP DTU Partnership from the CDMPipeline of 1st Juney 2018, [email protected], Phone (+45)40202789
Cement EE industry
HanoverSaint ElizabethSaint JamesTrelawnewWestmorelandClaredonManchesterSaint AnnSaint CathrineSaint maryKingstonPortlandSaint AndrewSaint ThomasManyn.a.Total 0 0 0 0 0 0 0 0 0
Jamaica Parishes
Afforestation
Agriculture
Biomass
energy
CO2 capture
Coal bed/min
e methan
Energy distributio
n
EE households

This workbook was produced by Jørgen Fenhann, UNEP DTU Partnership from the CDMPipeline of 1st Juney 2018, [email protected], Phone (+45)40202789
EE service Fugitive HFCs Hydro N2O
0 0 0 0 0 0 0 0 0 0 0 0
EE own generati
on
EE supply side
Fossil fuel
switch
Geothermal
Landfill gas
Methane
avoidance
Mixed renewa
bles

Solar Tidal Wind Total GDP/cap
000000
1 1000
1 100000
0 0 0 0 0 2 2
PFCs and SF6
Reforestation
Transport
Population (millions)

This workbook was produced by Jørgen Fenhann, UNEP DTU Partnership from the CDMPipeline of 1st Juney 2018, [email protected], Phone (+45)40202789
Cement EE industry
AjlunAmmanAqabaBalqaIrbidJerashKerakMa'anMadabaMafraqTafilahZarqaManyn.a.Total 0 0 0 0 0 0 0 0 0
Jordan Governates
Afforestation
Agriculture
Biomass
energy
CO2 capture
Coal bed/min
e methan
Energy distributio
n
EE households

This workbook was produced by Jørgen Fenhann, UNEP DTU Partnership from the CDMPipeline of 1st Juney 2018, [email protected], Phone (+45)40202789
EE service Fugitive HFCs Hydro N2O
11
1 1
0 0 0 2 0 0 0 0 2 0 0 0
EE own generati
on
EE supply side
Fossil fuel
switch
Geothermal
Landfill gas
Methane
avoidance
Mixed renewa
bles

Solar Tidal Wind Total GDP/cap
0 0.1321 2.2211 0.1200 0.3830 1.0180 0.1720 0.2230 0.1080 0.1430 0.2630 0.0802 0.85300
0 0 0 0 0 0 4
PFCs and SF6
Reforestation
Transport
Population (millions)

This workbook was produced by Jørgen Fenhann, UNEP DTU Partnership from the CDMPipeline of 1st Juney 2018, [email protected], Phone (+45)40202789
Cement EE industry
Central Coast 1Eastern Nairobi 1North Eastern Nyanza 1Rift Valley Western 1Manyn.a.Total 0 0 3 0 0 0 0 0 1
Kenya Provinces
Afforestation
Agriculture
Biomass
energy
CO2 capture
Coal bed/min
e methan
Energy distributio
n
EE households

This workbook was produced by Jørgen Fenhann, UNEP DTU Partnership from the CDMPipeline of 1st Juney 2018, [email protected], Phone (+45)40202789
EE service Fugitive HFCs Hydro N2O
1 1
1
5
0 0 0 0 0 5 0 2 0 1 0 0
EE own generati
on
EE supply side
Fossil fuel
switch
Geothermal
Landfill gas
Methane
avoidance
Mixed renewa
bles

Solar Tidal Wind Total GDP/cap
4 61
1 210
1 21 3 91 1 3
00
0 7 0 0 0 5 24
PFCs and SF6
Reforestation
Transport
Population (millions)

This workbook was produced by Jørgen Fenhann, UNEP DTU Partnership from the CDMPipeline of 1st Juney 2018, [email protected], Phone (+45)40202789
Cement EE industry
Al AhmadiAl KuwaytAl FarwaniyahAl JahraHawalli
Manyn.a.Total 0 0 0 0 0 0 0 0 0
Kuwait Governorates
Afforestation
Agriculture
Biomass
energy
CO2 capture
Coal bed/min
e methan
Energy distributio
n
EE households
Mubarak Al-Kabeer

This workbook was produced by Jørgen Fenhann, UNEP DTU Partnership from the CDMPipeline of 1st Juney 2018, [email protected], Phone (+45)40202789
EE service Fugitive HFCs Hydro N2O
11
0 0 0 0 2 0 0 0 0 0 0 0
EE own generati
on
EE supply side
Fossil fuel
switch
Geothermal
Landfill gas
Methane
avoidance
Mixed renewa
bles

Solar Tidal Wind Total GDP/cap
1 21000000
0 0 1 0 0 0 3
PFCs and SF6
Reforestation
Transport
Population (millions)

This workbook was produced by Jørgen Fenhann, UNEP DTU Partnership from the CDMPipeline of 1st Juney 2018, [email protected], Phone (+45)40202789
Cement EE industry
Bishkek City Batken Chui Jalal-Abad Naryn OshTalas Issyk-Kul Osh City Manyn.a.Total 0 0 0 0 0 0 0 0 0
Kyrgyzstan Provinces
Afforestation
Agriculture
Biomass
energy
CO2 capture
Coal bed/min
e methan
Energy distributio
n
EE households

This workbook was produced by Jørgen Fenhann, UNEP DTU Partnership from the CDMPipeline of 1st Juney 2018, [email protected], Phone (+45)40202789
EE service Fugitive HFCs Hydro N2O
0 0 0 0 0 0 0 0 0 0 0 0
EE own generati
on
EE supply side
Fossil fuel
switch
Geothermal
Landfill gas
Methane
avoidance
Mixed renewa
bles

Solar Tidal Wind Total GDP/cap
00000000000
0 0 0 0 0 0 0
PFCs and SF6
Reforestation
Transport
Population (millions)

This workbook was produced by Jørgen Fenhann, UNEP DTU Partnership from the CDMPipeline of 1st Juney 2018, [email protected], Phone (+45)40202789
Cement
AttapuBokeoBolikhamxaiChampasakHouaphanKhammouanLoung NamthaLouangphabangOudomxaiPhongsaliSaravanSavannakhetVientianeVientiane CityXaignabouliXiangkhoangXekongXaysombounManyn.a.Total 0 0 0 0 0 0 0 0
Lao PDR Provinces
Afforestation
Agriculture
Biomass
energy
CO2 capture
Coal bed/min
e methan
e
Energy distributio
n
EE households

This workbook was produced by Jørgen Fenhann, UNEP DTU Partnership from the CDMPipeline of 1st Juney 2018, [email protected], Phone (+45)40202789
EE industry EE service Fugitive HFCs Hydro
111 12111113115 1
1 1
212
1 0 0 0 0 0 0 0 26 0 2
EE own generati
on
EE supply side
Fossil fuel
switch
Geothermal
Landfill gas
Methane
avoidance

N2O Solar Tidal Wind Total GDP/cap
11
1 321111131162021
00
0 0 0 1 0 0 0 0 28
Mixed renewa
bles
PFCs and SF6
Reforestation
Transport
Population (millions)

This workbook was produced by Jørgen Fenhann, UNEP DTU Partnership from the CDMPipeline of 1st Juney 2018, [email protected], Phone (+45)40202789
Cement
Beirut 2Beqaa 1Mount Lebanon 1NabatiehNorth 1South 1Manyn.a.Total 0 0 0 0 0 0 0 6
Lebanon Governorates
Afforestation
Agriculture
Biomass
energy
CO2 capture
Coal bed/mine methane
Energy distributio
n
EE households

This workbook was produced by Jørgen Fenhann, UNEP DTU Partnership from the CDMPipeline of 1st Juney 2018, [email protected], Phone (+45)40202789
EE industry EE service Fugitive HFCs Hydro
0 0 0 0 0 0 0 0 0 0 0
EE own generati
on
EE supply side
Fossil fuel
switch
Geothermal
Landfill gas
Methane
avoidance

N2O Solar Tidal Wind Total GDP/cap
2110
1 2100
0 0 0 0 1 0 0 0 7
Mixed renewa
bles
PFCs and SF6
Reforestation
Transport
Population (millions)

This workbook was produced by Jørgen Fenhann, UNEP DTU Partnership from the CDMPipeline of 1st Juney 2018, [email protected], Phone (+45)40202789
Lesotho Districts Cement
Many 1n.a.Total 0 0 0 0 0 0 0 1
Afforestation
Agriculture
Biomass
energy
CO2 capture
Coal bed/min
e methan
Energy distributio
n
EE households

This workbook was produced by Jørgen Fenhann, UNEP DTU Partnership from the CDMPipeline of 1st Juney 2018, [email protected], Phone (+45)40202789
EE industry EE service Fugitive HFCs Hydro
0 0 0 0 0 0 0 0 0 0 0
EE own generati
on
EE supply side
Fossil fuel
switch
Geothermal
Landfill gas
Methane
avoidance

N2O Solar Tidal Wind Total GDP/cap
0000000000000000010
0 0 0 0 0 0 0 0 1
Mixed renewa
bles
PFCs and SF6
Reforestation
Transport
Population (millions)

This workbook was produced by Jørgen Fenhann, UNEP DTU Partnership from the CDMPipeline of 1st Juney 2018, [email protected], Phone (+45)40202789
Liberia Counties Cement
BomiBongGbarpoluGrand BassaGrand Cape MountGrand GedehGrand KruLofaMargibiMarylandMontserradoNimbaRivercessRiver GeeSinoeManyn.a.Total 0 0 0 0 0 0 0 0
Afforestation
Agriculture
Biomass
energy
CO2 capture
Coal bed/min
e methan
Energy distributio
n
EE households

This workbook was produced by Jørgen Fenhann, UNEP DTU Partnership from the CDMPipeline of 1st Juney 2018, [email protected], Phone (+45)40202789
EE industry EE service Fugitive HFCs Hydro
1
0 0 0 0 0 0 0 0 0 1 0
EE own generati
on
EE supply side
Fossil fuel
switch
Geothermal
Landfill gas
Methane
avoidance

N2O Solar Tidal Wind Total GDP/cap
00000000001000000
0 0 0 0 0 0 0 0 1
Mixed renewa
bles
PFCs and SF6
Reforestation
Transport
Population (millions)

This workbook was produced by Jørgen Fenhann, UNEP DTU Partnership from the CDMPipeline of 1st Juney 2018, [email protected], Phone (+45)40202789
Libya Districts Cement
Al WahatBenghazi 1ButnanDernaGhatJabal al AkhdarJabal al GharbiJafaraJufraKufraMarjMisrataMurqubMurzuqNalutNuqat al KhamsSabhaSirteTripoliWadi al HayaaWadi al ShatiiZawiyaManyn.a.Total 0 0 0 1 0 0 0 0
Afforestation
Agriculture
Biomass
energy
CO2 capture
Coal bed/min
e methan
Energy distributio
n
EE households

This workbook was produced by Jørgen Fenhann, UNEP DTU Partnership from the CDMPipeline of 1st Juney 2018, [email protected], Phone (+45)40202789
EE industry EE service Fugitive HFCs Hydro
0 0 0 0 0 0 0 0 0 0 0
EE own generati
on
EE supply side
Fossil fuel
switch
Geothermal
Landfill gas
Methane
avoidance

N2O Solar Tidal Wind Total GDP/cap
01000000
1 1000000000000000
0 0 0 0 1 0 0 0 2
Mixed renewa
bles
PFCs and SF6
Reforestation
Transport
Population (millions)

This workbook was produced by Jørgen Fenhann, UNEP DTU Partnership from the CDMPipeline of 1st Juney 2018, [email protected], Phone (+45)40202789
Cement EE industry
SkopjePelagonia Polog Eastern Southeastern Northeastern Southwestern Vardar Manyn.a.Total 0 0 0 0 0 0 0 0 0
Macedonia Regions
Afforestation
Agriculture
Biomass
energy
CO2 capture
Coal bed/min
e methan
Energy distributio
n
EE households

This workbook was produced by Jørgen Fenhann, UNEP DTU Partnership from the CDMPipeline of 1st Juney 2018, [email protected], Phone (+45)40202789
EE service Fugitive HFCs Hydro N2O
3
1
2
0 0 0 3 0 0 0 3 0 0 0 0
EE own generati
on
EE supply side
Fossil fuel
switch
Geothermal
Landfill gas
Methane
avoidance
Mixed renewa
bles

Solar Tidal Wind Total GDP/cap
3000010
1 120
0 0 0 0 0 1 7
PFCs and SF6
Reforestation
Transport
Population (millions)

This workbook was produced by Jørgen Fenhann, UNEP DTU Partnership from the CDMPipeline of 1st Juney 2018, [email protected], Phone (+45)40202789
Cement
Alaotra Mangoro Amoron'i Mania Analamanga Analanjirofo Androy Anosy Atsimo Andrefana Atsimo Atsinanana Atsinanana Betsiboka Boeny Bongolava Diana Haute-Matsiatra Ihorombe Itasy Melaky Menabe Vakinankaratra Vatovavy-Fitovinany Many 1n.a.Total 0 0 0 0 0 0 0 1
Madagascar Regions
Afforestation
Agriculture
Biomass energy
CO2 capture
Coal bed/mine methane
Energy distribution
EE households

This workbook was produced by Jørgen Fenhann, UNEP DTU Partnership from the CDMPipeline of 1st Juney 2018, [email protected], Phone (+45)40202789
Fugitive HFCs Hydro
1
1
0 0 0 0 0 0 0 0 2 0 0
EE industry
EE own generati
on
EE service
EE supply side
Fossil fuel
switch
Geothermal
Landfill gas
Methane avoidance

N2O Solar Tidal Wind Total GDP/cap
0010000000000000001010
0 0 0 0 0 0 0 0 3
Mixed renewable
s
PFCs and SF6
Reforestation
Transport
Population (millions)

Antananarivo (1) Analamanga Bongolava Itasy Vakinankaratra Antsiranana (2) Diana Sava Fianarantsoa (3) Amoron'i Mania Atsimo Atsinanana Haute-Matsiatra Ihorombe Vatovavy-Fitovinany Mahajanga (4) Betsiboka Boeny Melaky Sofia Toamasina (5) Alaotra Mangoro Analanjirofo Atsinanana Toliara (6) Androy Anosy Atsimo Andrefana Menabe
Provinces (Bold dissolved in 2009), Regions (normal)

This workbook was produced by Jørgen Fenhann, UNEP DTU Partnership from the CDMPipeline of 1st Juney 2018, [email protected], Phone (+45)40202789
Cement
Johor 3Kedah 1Kelantan 1Kuala LumpurLabuanMelaka 2Negeri Sembilan 4Pahang 5Perak 6PerlisPulau PinangPutrajayaSabah 16Sarawak 2Selangor 4TerengganuManyn.a.Total 0 0 44 0 0 0 0 0
Malaysia States
Afforestation
Agriculture
Biomass
energy
CO2 capture
Coal bed/min
e methan
Energy distributio
n
EE households

This workbook was produced by Jørgen Fenhann, UNEP DTU Partnership from the CDMPipeline of 1st Juney 2018, [email protected], Phone (+45)40202789
EE industry EE service Fugitive HFCs Hydro
1 1 103
2 11
1 1 11 4
1 1 131 17
1 1
1 1 1 301 5
2 1 2 33
4 0 0 1 1 0 1 0 5 9 91
EE own generati
on
EE supply side
Fossil fuel
switch
Geothermal
Landfill gas
Methane
avoidance

N2O Solar Tidal Wind Total GDP/cap
15441059
2024
020
498
123
1 10
0 0 0 0 0 0 1 0 157
Mixed renewa
bles
PFCs and SF6
Reforestation
Transport
Population (millions)

This workbook was produced by Jørgen Fenhann, UNEP DTU Partnership from the CDMPipeline of 1st Juney 2018, [email protected], Phone (+45)40202789
Malawi Districts Cement
BalakaBlantyreChikwawaChiradzuluChitipaDedzaDowaKarongaKasunguLikomaLilongweMachingaMangochiMchinjiMulanjeMwanzaMzimbaNenoNkhata Bay 2NkhotakotaNsanjeNtcheuNtchisiPhalombeRumphiSalimaThyoloZombaManyn.a.Total 0 0 0 0 0 0 0 2
Afforestation
Agriculture
Biomass
energy
CO2 capture
Coal bed/min
e methan
Energy distributio
n
EE households

This workbook was produced by Jørgen Fenhann, UNEP DTU Partnership from the CDMPipeline of 1st Juney 2018, [email protected], Phone (+45)40202789
EE industry EE service Fugitive HFCs Hydro
0 0 0 0 0 0 0 0 0 0 0
EE own generati
on
EE supply side
Fossil fuel
switch
Geothermal
Landfill gas
Methane
avoidance

N2O Solar Tidal Wind Total GDP/cap
000000000000000000200000000000
0 0 0 0 0 0 0 0 2
Mixed renewa
bles
PFCs and SF6
Reforestation
Transport
Population (millions)

This workbook was produced by Jørgen Fenhann, UNEP DTU Partnership from the CDMPipeline of 1st Juney 2018, [email protected], Phone (+45)40202789
Mali Regions Cement
BamakoGaoKayesKidalKoulikoroMoptiSégouSikassoTombouctouManyn.a.Total 0 0 0 0 0 0 0 0
Afforestation
Agriculture
Biomass
energy
CO2 capture
Coal bed/min
e methan
Energy distributio
n
EE households

This workbook was produced by Jørgen Fenhann, UNEP DTU Partnership from the CDMPipeline of 1st Juney 2018, [email protected], Phone (+45)40202789
EE industry EE service Fugitive HFCs Hydro
1
0 0 0 0 0 0 0 0 1 0 0
EE own generati
on
EE supply side
Fossil fuel
switch
Geothermal
Landfill gas
Methane
avoidance

N2O Solar Tidal Wind Total GDP/cap
00
1 200000000
0 0 0 0 1 0 0 0 2
Mixed renewa
bles
PFCs and SF6
Reforestation
Transport
Population (millions)

This workbook was produced by Jørgen Fenhann, UNEP DTU Partnership from the CDMPipeline of 1st Juney 2018, [email protected], Phone (+45)40202789
Cement
Black RiverFlacqGrand Port 1MokaPamplemoussesPlaines WilhemsPort LouisRivière du RempartSavanneRodriguesAgalegaCargados Carajos ShoalsSoudan BanksNazareth Bank Saya de Malha Bank Hawkins Bank Manyn.a.Total 0 0 0 0 1 0 0 0
Mauritius Districts
Afforestation
Agriculture
Biomass
energy
CO2 capture
Coal bed/min
e methan
Energy distributio
n
EE households

This workbook was produced by Jørgen Fenhann, UNEP DTU Partnership from the CDMPipeline of 1st Juney 2018, [email protected], Phone (+45)40202789
EE industry EE service Fugitive HFCs Hydro
1
0 0 0 0 0 0 0 0 0 1 0
EE own generati
on
EE supply side
Fossil fuel
switch
Geothermal
Landfill gas
Methane
avoidance

N2O Solar Tidal Wind Total GDP/cap
1 11 1
20000
1 10000000000
0 0 0 0 1 0 0 2 5
Mixed renewa
bles
PFCs and SF6
Reforestation
Transport
Population (millions)

Black River (Capital: Bambous) Flacq (Capital: Centre de Flacq) Grand Port (Capital: Mahebourg) Moka (Capital: Quartier Militaire) Pamplemousses (Capital: Triolet) Plaines Wilhems (Capital: Rose Hill/ Curepipe) Port Louis (Capital of Maurtius) Rivière du Rempart (Capital: Mapou) Savanne (Capital: Souillac)
Rodrigues, an island 560 kilometres north-east of Mauritius, which attained limited autonomy in October 2002.[10][11] Had the status of the 10th administrative district of Mauritius before autonomy was attained.[12] Agalega, two small islands about 933 kilometres (580 mi) north of Mauritius. Cargados Carajos Shoals, also known as the Saint Brandon islands, about 402 kilometres (250 mi) north of Mauritius.

Rodrigues, an island 560 kilometres north-east of Mauritius, which attained limited autonomy in October 2002.[10][11] Had the status of the 10th administrative district of Mauritius before autonomy was attained.[12]
Cargados Carajos Shoals, also known as the Saint Brandon islands, about 402 kilometres (250 mi) north of Mauritius.

Rodrigues, an island 560 kilometres north-east of Mauritius, which attained limited autonomy in October 2002.[10][11] Had the status of the 10th administrative district of Mauritius before autonomy was attained.[12]

This workbook was produced by Jørgen Fenhann, UNEP DTU Partnership from the CDMPipeline of 1st Juney 2018, [email protected], Phone (+45)40202789
Mexico States Cement
AguascalientesBaja California NorteBaja California SurCampecheChiapasChihuahuaCoahuila 5ColimaDurangoGuanajuatoGuerreroHidalgo 2Jalisco 3MexicoMexico cityMichoacánMorelosNayaritNuevo LeónOaxacaPuebla 2QuerétaroQuintana RooSan Luís Potosí 2SinaloaSonora 1TabascoTamaulipasTlaxcalaVeracruz 2Yucatán 1Manyn.a.Total 0 0 13 0 0 5 0 0
Afforestation
Agriculture
Biomass
energy
CO2 capture
Coal bed/min
e methan
Energy distributio
n
EE households

This workbook was produced by Jørgen Fenhann, UNEP DTU Partnership from the CDMPipeline of 1st Juney 2018, [email protected], Phone (+45)40202789
EE industry EE service Fugitive HFCs Hydro
1 42 1
11
1 11 11
1 51 6
11
4 3 95 3
41 1
23 1 1 4 3
21 1 19
1 411 12 3
161
1 1 2
1 1 2 1 152 6
1
5 2 0 0 0 1 1 1 9 30 120
EE own generati
on
EE supply side
Fossil fuel
switch
Geothermal
Landfill gas
Methane
avoidance

N2O Solar Tidal Wind Total GDP/cap
51 4
0112
2 190
1 771
1 41 20
84 4
1 522
3 1519 21
2351
2 65
171
2 60
22910
0 2 0 0 0 0 6 29 224
Mixed renewa
bles
PFCs and SF6
Reforestation
Transport
Population (millions)

This workbook was produced by Jørgen Fenhann, UNEP DTU Partnership from the CDMPipeline of 1st Juney 2018, [email protected], Phone (+45)40202789
Cement
Anenii Noi Basarabeasca Briceni Cahul, non-contiguous Cantemir Călăraşi Căuşeni ChisinauCimişlia Criuleni, non-contiguous Donduşeni Drochia 1Dubăsari, non-contiguous Edineţ Faleşti Floreşti Glodeni Hînceşti Ialoveni Leova Nisporeni Ocniţa Orhei PridnestrovieRezina Rîşcani Sîngerei Soroca Străşeni Şoldăneşti Ştefan Vodă Taraclia, non-contiguous Teleneşti UngheniMany 1n.a.Total 1 0 1 0 0 0 0 0
Moldova districts
Afforestation
Agriculture
Biomass
energy
CO2 capture
Coal bed/min
e methan
Energy distributio
n
EE households
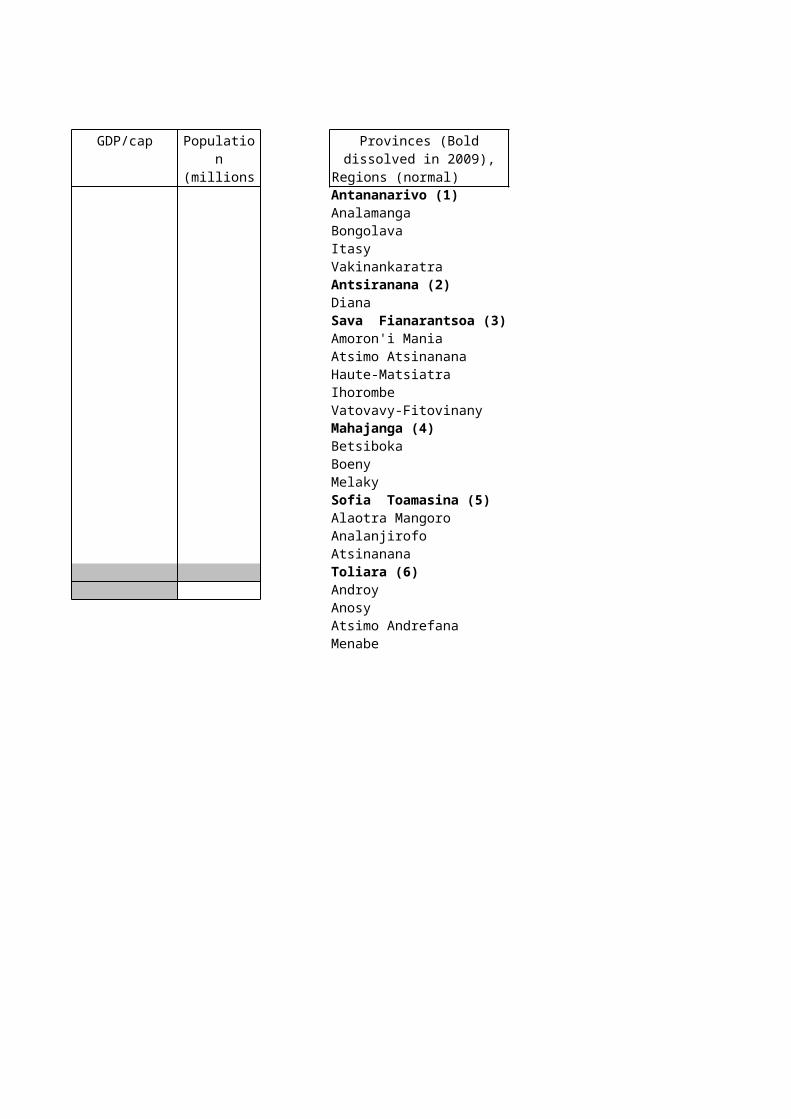
This workbook was produced by Jørgen Fenhann, UNEP DTU Partnership from the CDMPipeline of 1st Juney 2018, [email protected], Phone (+45)40202789
EE industry EE service Fugitive HFCs Hydro
1
1
3 2
0 0 3 1 0 2 0 0 0 1 0
EE own generati
on
EE supply side
Fossil fuel
switch
Geothermal
Landfill gas
Methane
avoidance

N2O Solar Tidal Wind Total GDP/cap
00000001000100000000000
0000000000
1 70
0 0 0 1 0 0 0 0 9
Mixed renewa
bles
PFCs and SF6
Reforestation
Transport
Population (millions)

This workbook was produced by Jørgen Fenhann, UNEP DTU Partnership from the CDMPipeline of 1st Juney 2018, [email protected], Phone (+45)40202789
Cement EE industry
Arkhangai Bayan-Ölgii Bayankhongor Bulgan Darkhan-Uul Dornod Dornogovi Dundgovi Govi-Altai Govisümber Khentii Khovd Khövsgöl Ömnögovi Orkhon Övörkhangai Selenge Sükhbaatar Töv Ulaanbaatar 1Uvs Zavkhan Manyn.a.Total 0 0 0 0 0 0 1 0 0
Mongolia Provinces
Afforestation
Agriculture
Biomass
energy
CO2 capture
Coal bed/min
e methan
Energy distributio
n
EE households

This workbook was produced by Jørgen Fenhann, UNEP DTU Partnership from the CDMPipeline of 1st Juney 2018, [email protected], Phone (+45)40202789
EE service Fugitive HFCs Hydro N2O
1
1
0 0 0 0 0 0 0 2 0 0 0 0
EE own generati
on
EE supply side
Fossil fuel
switch
Geothermal
Landfill gas
Methane
avoidance
Mixed renewa
bles

Solar Tidal Wind Total GDP/cap
000000001001000000
1 110000
0 0 0 0 0 1 4
PFCs and SF6
Reforestation
Transport
Population (millions)

This workbook was produced by Jørgen Fenhann, UNEP DTU Partnership from the CDMPipeline of 1st Juney 2018, [email protected], Phone (+45)40202789
Cement
AndrijevicaBarBeraneBijelo PoljeBudvaCetinjeDanilovgradGolubovciHerceg NoviKolasinKotorMojkovacNiksicPlavPljevljaPlužinePodgoricaRozajeSavnikTivatTuziUlcinjZabljakManyn.a.Total 0 0 0 0 0 0 0 0
Montenegro Municipalities
Afforestation
Agriculture
Biomass
energy
CO2 capture
Coal bed/min
e methan
Energy distributio
n
EE households

This workbook was produced by Jørgen Fenhann, UNEP DTU Partnership from the CDMPipeline of 1st Juney 2018, [email protected], Phone (+45)40202789
EE industry EE service Fugitive HFCs Hydro
1
0 0 0 0 0 0 0 0 1 0 0
EE own generati
on
EE supply side
Fossil fuel
switch
Geothermal
Landfill gas
Methane
avoidance

N2O Solar Tidal Wind Total GDP/cap
01 1
0000000000000000000
1 1010
0 0 0 0 0 0 0 2 3
Mixed renewa
bles
PFCs and SF6
Reforestation
Transport
Population (millions)

This workbook was produced by Jørgen Fenhann, UNEP DTU Partnership from the CDMPipeline of 1st Juney 2018, [email protected], Phone (+45)40202789
Cement
Chaouia-OuardighaDoukkala-AbdaFès-BoulemaneGharb-Chrarda-Béni HssenGreater Casablanca 1Guelmim-Es SemaraLaâyouneMarrakech-Tensift-El HaouzMeknès-Tafilalet 1OrientalRabat-Salé-Zemmour-ZaerSouss-Massa-DraâTadla-AzilalTangier-Tétouan 1Taza-Al Hoceima-TaounateManyn.a.Total 0 0 3 0 0 0 0 0
Morocco Regions
Afforestation
Agriculture
Biomass
energy
CO2 capture
Coal bed/min
e methan
Energy distributio
n
EE households

This workbook was produced by Jørgen Fenhann, UNEP DTU Partnership from the CDMPipeline of 1st Juney 2018, [email protected], Phone (+45)40202789
EE industry EE service Fugitive HFCs Hydro
1 1
1
1
11
0 0 0 0 0 0 0 0 0 3 3
EE own generati
on
EE supply side
Fossil fuel
switch
Geothermal
Landfill gas
Methane
avoidance

N2O Solar Tidal Wind Total GDP/cap
002020
1 11 2
101
1 20
5 60
1 10
0 0 0 0 2 0 0 7 18
Mixed renewa
bles
PFCs and SF6
Reforestation
Transport
Population (millions)

This workbook was produced by Jørgen Fenhann, UNEP DTU Partnership from the CDMPipeline of 1st Juney 2018, [email protected], Phone (+45)40202789
Cement
Cabo DelgadoGazaInhambaneManicaMaputo cityMaputo 1NampulaNiassaSofalaTeteZambeziaManyn.a.Total 0 0 0 0 0 0 0 1
Mozambique Provinces
Afforestation
Agriculture
Biomass
energy
CO2 capture
Coal bed/min
e methan
Energy distributio
n
EE households

This workbook was produced by Jørgen Fenhann, UNEP DTU Partnership from the CDMPipeline of 1st Juney 2018, [email protected], Phone (+45)40202789
EE industry EE service Fugitive HFCs Hydro
1
0 0 0 0 1 0 0 0 0 0 0
EE own generati
on
EE supply side
Fossil fuel
switch
Geothermal
Landfill gas
Methane
avoidance

N2O Solar Tidal Wind Total GDP/cap
0000020
1 100000
0 0 0 1 0 0 0 0 3
Mixed renewa
bles
PFCs and SF6
Reforestation
Transport
Population (millions)

This workbook was produced by Jørgen Fenhann, UNEP DTU Partnership from the CDMPipeline of 1st Juney 2018, [email protected], Phone (+45)40202789
Cement
AyeyarwadyBagoChinKachinKayahKayinMagwayMandalayMonRakhineSagaingShanTanintharyiYangonManyn.a.Total 0 0 0 0 0 0 0 0
Myanmar States and Regions
Afforestation
Agriculture
Biomass
energy
CO2 capture
Coal bed/min
e methan
Energy distributio
n
EE households

This workbook was produced by Jørgen Fenhann, UNEP DTU Partnership from the CDMPipeline of 1st Juney 2018, [email protected], Phone (+45)40202789
EE industry EE service Fugitive HFCs Hydro
1
0 0 0 0 0 0 0 0 1 0 0
EE own generati
on
EE supply side
Fossil fuel
switch
Geothermal
Landfill gas
Methane
avoidance

N2O Solar Tidal Wind Total GDP/cap
0001000000000000
0 0 0 0 0 0 0 0 1
Mixed renewa
bles
PFCs and SF6
Reforestation
Transport
Population (millions)

This workbook was produced by Jørgen Fenhann, UNEP DTU Partnership from the CDMPipeline of 1st Juney 2018, [email protected], Phone (+45)40202789
Cement EE industry
ErongoHardapKarasKavangoKhomasKuneneOhangwenaOmahekeOmusatiOshanaOshikotoOtjozondjupaZambeziManyn.a.Total 0 0 0 0 0 0 0 0 0
Namibia Regions
Afforestation
Agriculture
Biomass
energy
CO2 capture
Coal bed/min
e methan
Energy distributio
n
EE households

This workbook was produced by Jørgen Fenhann, UNEP DTU Partnership from the CDMPipeline of 1st Juney 2018, [email protected], Phone (+45)40202789
EE service Fugitive HFCs Hydro N2O
1 1
0 0 0 0 0 0 0 0 1 1 0 0
EE own generati
on
EE supply side
Fossil fuel
switch
Geothermal
Landfill gas
Methane
avoidance
Mixed renewa
bles

Solar Tidal Wind Total GDP/cap
000020000000000
0 0 0 0 0 0 2
PFCs and SF6
Reforestation
Transport
Population (millions)

This workbook was produced by Jørgen Fenhann, UNEP DTU Partnership from the CDMPipeline of 1st Juney 2018, [email protected], Phone (+45)40202789
Cement EE industry
Bagmati Bheri Dhawalagiri Gandaki Janakpur Karnali Kosi Lumbini Mahakali Mechi Narayani Rapti Sagarmatha Seti Many 1n.a.Total 0 0 0 0 0 0 0 1 0
Nepal Zones
Afforestation
Agriculture
Biomass
energy
CO2 capture
Coal bed/min
e methan
Energy distributio
n
EE households

This workbook was produced by Jørgen Fenhann, UNEP DTU Partnership from the CDMPipeline of 1st Juney 2018, [email protected], Phone (+45)40202789
EE service Fugitive HFCs Hydro N2O
1 4
0 0 0 0 0 0 0 1 0 4 0 0
EE own generati
on
EE supply side
Fossil fuel
switch
Geothermal
Landfill gas
Methane
avoidance
Mixed renewa
bles

Solar Tidal Wind Total GDP/cap
0000000000000060
0 0 0 0 0 0 6
PFCs and SF6
Reforestation
Transport
Population (millions)

This workbook was produced by Jørgen Fenhann, UNEP DTU Partnership from the CDMPipeline of 1st Juney 2018, [email protected], Phone (+45)40202789
Cement EE industry
BoacoCarazoChinandega 1 1ChontalesEstelíGranadaJinotegaLeónMadrizManaguaMasayaMatagalpaNueva SegoviaRivasRío San JuanRAANRAASManyn.a.Total 0 0 1 0 0 0 0 0 1
Nicaragua Departments
Afforestation
Agriculture
Biomass
energy
CO2 capture
Coal bed/min
e methan
Energy distributio
n
EE households

This workbook was produced by Jørgen Fenhann, UNEP DTU Partnership from the CDMPipeline of 1st Juney 2018, [email protected], Phone (+45)40202789
EE service Fugitive HFCs Hydro N2O
1
11
2
0 0 0 0 0 1 0 3 0 1 0 0
EE own generati
on
EE supply side
Fossil fuel
switch
Geothermal
Landfill gas
Methane
avoidance
Mixed renewa
bles

Solar Tidal Wind Total GDP/cap
0030001100020
1 4 51 1
0000
0 2 0 0 0 4 13
PFCs and SF6
Reforestation
Transport
Population (millions)

This workbook was produced by Jørgen Fenhann, UNEP DTU Partnership from the CDMPipeline of 1st Juney 2018, [email protected], Phone (+45)40202789
Niger Regions Cement
AgadezDiffaDossoMaradiTahouaTillabériZinderManyn.a.Total 0 0 0 0 0 0 0
Afforestation
Agriculture
Biomass
energy
CO2 capture
Coal bed/min
e methan
Energy distributio
n

This workbook was produced by Jørgen Fenhann, UNEP DTU Partnership from the CDMPipeline of 1st Juney 2018, [email protected], Phone (+45)40202789
EE industry EE service Fugitive HFCs Hydro
0 0 0 0 0 0 0 0 0 0 0
EE households
EE own generati
on
EE supply side
Fossil fuel
switch
Geothermal
Landfill gas

N2O Solar Tidal Wind Total GDP/cap
0000000
1 10
0 0 0 0 1 0 0 0 0 1
Methane
avoidance
Mixed renewa
bles
PFCs and SF6
Reforestation
Transport
Population (millions)

This workbook was produced by Jørgen Fenhann, UNEP DTU Partnership from the CDMPipeline of 1st Juney 2018, [email protected], Phone (+45)40202789
Nigeria Regions Cement
Abia Adamawa Akwa Ibom Anambra Bauchi Bayelsa Benue Borno Cross River Delta Ebonyi Edo Ekiti Enugu Gombe Imo Jigawa Kaduna Kano Katsina Kebbi Kogi Kwara Lagos Nasarawa Niger Ogun 1Ondo Osun Oyo Plateau Rivers Sokoto Taraba Yobe Zamfara Many 1n.a.Total 0 0 1 0 0 0 0 1
Afforestation
Agriculture
Biomass
energy
CO2 capture
Coal bed/min
e methan
Energy distributio
n
EE households

This workbook was produced by Jørgen Fenhann, UNEP DTU Partnership from the CDMPipeline of 1st Juney 2018, [email protected], Phone (+45)40202789
EE industry EE service Fugitive HFCs Hydro
5
2
1
1 1
0 0 0 1 1 5 0 0 1 2 0
EE own generati
on
EE supply side
Fossil fuel
switch
Geothermal
Landfill gas
Methane
avoidance

N2O Solar Tidal Wind Total GDP/cap
00000000050000000000000201100002000010
0 0 0 0 0 0 0 0 12
Mixed renewa
bles
PFCs and SF6
Reforestation
Transport
Population (millions)

This workbook was produced by Jørgen Fenhann, UNEP DTU Partnership from the CDMPipeline of 1st Juney 2018, [email protected], Phone (+45)40202789
Cement
ChagangKangwonNorth HamgyongNorth HwanghaeNorth PyonganPyongyangRasonRyanggang South HamgyongSouth HwanghaeSouth PyonganManyn.a.Total 0 0 0 0 0 0 0 0
North Korea Provinces
Afforestation
Agriculture
Biomass
energy
CO2 capture
Coal bed/min
e methan
Energy distributio
n
EE households

This workbook was produced by Jørgen Fenhann, UNEP DTU Partnership from the CDMPipeline of 1st Juney 2018, [email protected], Phone (+45)40202789
EE industry EE service Fugitive HFCs Hydro
3
12
0 0 0 0 0 0 0 0 6 0 0
EE own generati
on
EE supply side
Fossil fuel
switch
Geothermal
Landfill gas
Methane
avoidance

N2O Solar Tidal Wind Total GDP/cap
0003000120000
0 0 0 0 0 0 0 0 6
Mixed renewa
bles
PFCs and SF6
Reforestation
Transport
Population (millions)

This workbook was produced by Jørgen Fenhann, UNEP DTU Partnership from the CDMPipeline of 1st Juney 2018, [email protected], Phone (+45)40202789
Oman Regions Cement
Ad DakhiliyahAd DhahirahAl BatinahAl BuraimiAl WustaAsh SharqiyahDhofarMasqatMusandamManyn.a.Total 0 0 0 0 0 0 0 0
Afforestation
Agriculture
Biomass
energy
CO2 capture
Coal bed/min
e methan
Energy distributio
n
EE households

This workbook was produced by Jørgen Fenhann, UNEP DTU Partnership from the CDMPipeline of 1st Juney 2018, [email protected], Phone (+45)40202789
EE industry EE service Fugitive HFCs Hydro
1
1
0 0 0 0 0 1 0 0 0 0 1
EE own generati
on
EE supply side
Fossil fuel
switch
Geothermal
Landfill gas
Methane
avoidance

N2O Solar Tidal Wind Total GDP/cap
01000001000
0 0 0 0 0 0 0 0 2
Mixed renewa
bles
PFCs and SF6
Reforestation
Transport
Population (millions)

This workbook was produced by Jørgen Fenhann, UNEP DTU Partnership from the CDMPipeline of 1st Juney 2018, [email protected], Phone (+45)40202789
Cement
Azad KashmirBalochistan 1Federally Administered Tribal Areas Islamabad Capital Territory Northern AreasNorth-West Frontier Province 1Punjab 4Sindh 1Manyn.a.Total 0 0 7 0 0 0 0
Pakistan Subdivisions
Afforestation
Agriculture
Biomass
energy
CO2 capture
Coal bed/min
e methan
Energy distributio
n

This workbook was produced by Jørgen Fenhann, UNEP DTU Partnership from the CDMPipeline of 1st Juney 2018, [email protected], Phone (+45)40202789
EE industry EE service Fugitive HFCs Hydro
41 1
11
1 1 17 2 2 21 1 1
1
1 0 10 0 3 1 1 0 0 8 4
EE households
EE own generati
on
EE supply side
Fossil fuel
switch
Geothermal
Landfill gas

N2O Solar Tidal Wind Total GDP/cap
430114
1 2 3 238 12
10
1 0 2 0 0 3 0 0 8 49
Methane
avoidance
Mixed renewa
bles
PFCs and SF6
Reforestation
Transport
Population (millions)

Provinces:Balochistan North-West Frontier Province (NWFP) Punjab Sindh Balochistan and NWFP also have Provincially Administered Tribal Areas[32] (PATA) which are being developed into regular districts.
Territories:
Islamabad Capital Territory Federally Administered Tribal Areas
Pakistani-administered portions of Kashmir:Azad KashmirNorthern Areas

Balochistan and NWFP also have Provincially Administered Tribal Areas[32] (PATA) which are being developed into regular districts.

This workbook was produced by Jørgen Fenhann, UNEP DTU Partnership from the CDMPipeline of 1st Juney 2018, [email protected], Phone (+45)40202789
Cement EE industry
Bocas del ToroChiriquíCocléColónDariénEmberáHerreraKuna YalaLos SantosNgöbe-BugléPanamá 2Veraguas Manyn.a.Total 0 0 2 0 0 0 0 0 0
Panama Provinces
Afforestation
Agriculture
Biomass
energy
CO2 capture
Coal bed/min
e methan
Energy distributio
n
EE households

This workbook was produced by Jørgen Fenhann, UNEP DTU Partnership from the CDMPipeline of 1st Juney 2018, [email protected], Phone (+45)40202789
EE service Fugitive HFCs Hydro N2O
221
1
1 1
0 0 0 0 0 0 0 23 1 2 0 0
EE own generati
on
EE supply side
Fossil fuel
switch
Geothermal
Landfill gas
Methane
avoidance
Mixed renewa
bles

Solar Tidal Wind Total GDP/cap
022
2 300010004
1 100
0 0 0 0 0 3 31
PFCs and SF6
Reforestation
Transport
Population (millions)

Province Capital Bocas del ToroChiriquíCocléColónDariénHerreraLos SantosPanamáVeraguas Indigenous regionsEmberáKuna YalaNgöbe-Buglé

This workbook was produced by Jørgen Fenhann, UNEP DTU Partnership from the CDMPipeline of 1st Juney 2018, [email protected], Phone (+45)40202789
Cement
Central SimbuEastern Highlands East New Britain East Sepik Enga Gulf Madang Manus Milne Bay Morobe New Ireland OroNorth SolomonsSouthern Highlands FlyWestern Highlands West New Britain West SepikCapital District Manyn.a.Total 0 0 0 0 0 0 0 0
Papua New Guinea Provinces
Afforestation
Agriculture
Biomass
energy
CO2 capture
Coal bed/min
e methan
Energy distributio
n
EE households

This workbook was produced by Jørgen Fenhann, UNEP DTU Partnership from the CDMPipeline of 1st Juney 2018, [email protected], Phone (+45)40202789
EE industry EE service Fugitive HFCs Hydro
1
11
1
6
0 0 0 0 0 1 1 0 0 0 8
EE own generati
on
EE supply side
Fossil fuel
switch
Geothermal
Landfill gas
Methane
avoidance

N2O Solar Tidal Wind Total GDP/cap
0000000001011010060000
0 0 0 0 0 0 0 0 10
Mixed renewa
bles
PFCs and SF6
Reforestation
Transport
Population (millions)

This workbook was produced by Jørgen Fenhann, UNEP DTU Partnership from the CDMPipeline of 1st Juney 2018, [email protected], Phone (+45)40202789
Cement
Alto ParaguayAlto ParanáAmambayDistrito CapitalBoquerónCaaguazúCaazapáCanindeyúCentralConcepciónCordilleraGuairáItapúaMisionesÑeembucúParaguaríPresidente HayesSan PedroManyn.a.Total 0 0 0 0 0 0 0 0
Paraguay Departments
Afforestation
Agriculture
Biomass
energy
CO2 capture
Coal bed/min
e methan
Energy distributio
n
EE households

This workbook was produced by Jørgen Fenhann, UNEP DTU Partnership from the CDMPipeline of 1st Juney 2018, [email protected], Phone (+45)40202789
EE industry EE service Fugitive HFCs Hydro
0 0 0 0 0 0 0 0 0 0 0
EE own generati
on
EE supply side
Fossil fuel
switch
Geothermal
Landfill gas
Methane
avoidance

N2O Solar Tidal Wind Total GDP/cap
000000000000
1 11 1
01 1
0000
0 0 0 1 0 0 2 0 3
Mixed renewa
bles
PFCs and SF6
Reforestation
Transport
Population (millions)

This workbook was produced by Jørgen Fenhann, UNEP DTU Partnership from the CDMPipeline of 1st Juney 2018, [email protected], Phone (+45)40202789
Cement
Amazonas Ancash Apurímac Arequipa Ayacucho Cajamarca Callao Cusco Huancavelica Huánuco Ica Junín La LibertadLambayeque Lima Lima ProvinceLoreto Madre de Dios Moquegua Pasco Piura 1Puno San Martín Tacna Tumbes Ucayali 1Manyn.a.Total 0 0 2 0 0 0 0 0
Peru Regions
Afforestation
Agriculture
Biomass
energy
CO2 capture
Coal bed/min
e methan
Energy distributio
n
EE households

This workbook was produced by Jørgen Fenhann, UNEP DTU Partnership from the CDMPipeline of 1st Juney 2018, [email protected], Phone (+45)40202789
EE industry EE service Fugitive HFCs Hydro
110
2
41 1
1 114
511
2 1 6 23
1
21
1
0 0 0 3 2 0 0 0 41 4 2
EE own generati
on
EE supply side
Fossil fuel
switch
Geothermal
Landfill gas
Methane
avoidance

N2O Solar Tidal Wind Total GDP/cap
110
02 4
042214
1 15
1 21
11310
2 20
1 1 511
1 10100
0 0 0 1 5 0 0 3 63
Mixed renewa
bles
PFCs and SF6
Reforestation
Transport
Population (millions)

This workbook was produced by Jørgen Fenhann, UNEP DTU Partnership from the CDMPipeline of 1st Juney 2018, [email protected], Phone (+45)40202789
Cement
ARMMBicolCordillera Administrative RegionCagayan Valley 1CaragaCentral Luzon 2Central MindanaoCentral VisayasEastern VisayasLlocosNational Capital Region 1Northern MindanaoSouthern MindanaoSouthern TagalogWestern MindanaoWestern Visayas 2 1Manyn.a.Total 0 0 6 0 0 1 0
Phillipines Regions
Afforestation
Agriculture
Biomass
energy
CO2 capture
Coal bed/min
e methan
Energy distributio
n

This workbook was produced by Jørgen Fenhann, UNEP DTU Partnership from the CDMPipeline of 1st Juney 2018, [email protected], Phone (+45)40202789
EE industry EE service Fugitive HFCs Hydro
12112 1
1 1
11 2
1 21 1 2
0 0 2 0 0 0 0 4 0 10 5
EE households
EE own generati
on
EE supply side
Fossil fuel
switch
Geothermal
Landfill gas

N2O Solar Tidal Wind Total GDP/cap
01221
26 1 320
3 1 60
1 2 31 33 6
1 412 16
01 4
1 10
46 0 1 1 0 1 0 0 4 81
Methane
avoidance
Mixed renewa
bles
PFCs and SF6
Reforestation
Transport
Population (millions)

Regions Provinces
Bicol (Region V) Camarines Norte Camarines Sur Catanduanes Masbate Sorsogon
Cordillera Administrative Region Abra Apayao Benguet Ifugao Kalinga Mountain Province
Cagayan Valley (Region II) Batanes Cagayan Isabela Nueva Vizcaya Quirino
Central Luzon (Region III) Aurora Bataan Bulacan Pampanga Tarlac Zambales
Central Mindanao (Region XII) North Cotabato (new name: Soccskargen) Sarangani
South Cotabato Sultan Kudarat
Central Visayas (Region VII) Bohol Cebu Negros Oriental Siquijor
Eastern Visayas (Region VIII) Biliran Eastern Samar Leyte Northern Samar Samar Southern Leyte
Ilocos (Region I) Ilocos Norte Ilocos Sur La Union Pangasinan
National Capital Region ManillaNorthern Mindanao (Region X) Bukidnon
Camiguin Lanao del Norte Misamis Occidental Misamis Oriental

Southern Mindanao (Region XI) Compostela Valley (new name: Davoa) Davao del Norte
Davao del Sur Davao Oriental
Southern Tagalog (Region IV) Batangas Cavite
1-4 Calabarzon Laguna Quezon Rizal Marinduque
5-10 Mimaropa Occidental Mindoro Oriental Mindoro Romblon Palawan
Western Mindanao (Region IX) Zamboanga del Norte (before Western Mindenao) Zamboanga del Sur
Zamboanga Sibugay Western Visayas (Region VI) Aklan
Antique Capiz Guimaras Iloilo Negros Occidental
Caraga (Region XIII) Agusan del Norte Agusan del Sur Dinagat Islands Surigao del Norte Surigao del Sur
Autonomous Region in Muslim Mindanao Basilan (ARMM) Lanao del Sur
Maguindanao Shariff Kabunsuan Sulu

Tawi-Tawi


This workbook was produced by Jørgen Fenhann, UNEP DTU Partnership from the CDMPipeline of 1st Juney 2018, [email protected], Phone (+45)40202789
Cement EE industry EE service Fugitive HFCs Hydro N2O Solar Tidal Wind Total GDP/cap
Ad Dawhah 0Al Ghuwariyah 0Al Jumaliyah 0Al Khawr 0Al Wakrah 0Ar Rayyan 0Jariyan al Batnah 0Ash Shamal 1 1Umm Salal 0Mesaieed 0Many 0n.a. 1 1Total 0 0 0 0 0 0 0 0 0 0 0 1 0 1 0 0 0 0 0 0 0 0 0 0 0 0 0 2
Qatar Municipalities
Afforestation
Agriculture
Biomass
energy
CO2 capture
Coal bed/min
e methan
Energy distributio
n
EE households
EE own generati
on
EE supply side
Fossil fuel
switch
Geothermal
Landfill gas
Methane
avoidance
Mixed renewa
bles
PFCs and SF6
Reforestation
Transport
Population (millions)

This workbook was produced by Jørgen Fenhann, UNEP DTU Partnership from the CDMPipeline of 1st Juney 2018, [email protected], Phone (+45)40202789
Cement
EstKigaliNordOuestSudMany 2n.a.Total 0 0 0 0 0 0 0 2
Rwanda Provinces
Afforestation
Agriculture
Biomass
energy
CO2 capture
Coal bed/min
e methan
Energy distributio
n
EE households

This workbook was produced by Jørgen Fenhann, UNEP DTU Partnership from the CDMPipeline of 1st Juney 2018, [email protected], Phone (+45)40202789
EE industry EE service Fugitive HFCs Hydro
0 0 0 0 0 0 0 0 0 0 0
EE own generati
on
EE supply side
Fossil fuel
switch
Geothermal
Landfill gas
Methane
avoidance

N2O Solar Tidal Wind Total GDP/cap
02 22 21 1
020
0 0 0 0 5 0 0 0 7
Mixed renewa
bles
PFCs and SF6
Reforestation
Transport
Population (millions)

This workbook was produced by Jørgen Fenhann, UNEP DTU Partnership from the CDMPipeline of 1st Juney 2018, [email protected], Phone (+45)40202789
Cement
BahaAsirEastern ProvinceHailJeddahJizanJoufMadinahMakkahNajranNorthern BorderQasimRiyadhTabukManyn.a.Total 0 0 0 0 0 0 0 0
Saudi Arabia Provinces
Afforestation
Agriculture
Biomass
energy
CO2 capture
Coal bed/min
e methan
Energy distributio
n
EE households

This workbook was produced by Jørgen Fenhann, UNEP DTU Partnership from the CDMPipeline of 1st Juney 2018, [email protected], Phone (+45)40202789
EE industry EE service Fugitive HFCs Hydro
1
1 11 1
1
0 0 1 2 0 1 0 0 0 2 0
EE own generati
on
EE supply side
Fossil fuel
switch
Geothermal
Landfill gas
Methane
avoidance

N2O Solar Tidal Wind Total GDP/cap
00
1 20000220001000
0 0 0 0 1 0 0 0 7
Mixed renewa
bles
PFCs and SF6
Reforestation
Transport
Population (millions)

This workbook was produced by Jørgen Fenhann, UNEP DTU Partnership from the CDMPipeline of 1st Juney 2018, [email protected], Phone (+45)40202789
Senegal Regions Cement
Dakar 1DiourbelFatickKaolackKoldaLougaMatamSaint-Louis 1TambacoundaThièsZiguinchorMany 1n.a.Total 1 0 2 0 0 0 0 0
Afforestation
Agriculture
Biomass
energy
CO2 capture
Coal bed/min
e methan
Energy distributio
n
EE households

This workbook was produced by Jørgen Fenhann, UNEP DTU Partnership from the CDMPipeline of 1st Juney 2018, [email protected], Phone (+45)40202789
EE industry EE service Fugitive HFCs Hydro
1
0 0 0 0 0 0 0 0 0 1 0
EE own generati
on
EE supply side
Fossil fuel
switch
Geothermal
Landfill gas
Methane
avoidance

N2O Solar Tidal Wind Total GDP/cap
2000000
1 20
2 1 3010
0 0 0 0 3 0 0 1 8
Mixed renewa
bles
PFCs and SF6
Reforestation
Transport
Population (millions)

This workbook was produced by Jørgen Fenhann, UNEP DTU Partnership from the CDMPipeline of 1st Juney 2018, [email protected], Phone (+45)40202789
Cement
Belgrade
VojvodinaManyn.a.Total 0 0 0 0 0 0 0 0
Serbia Statistical Regions
Afforestation
Agriculture
Biomass
energy
CO2 capture
Coal bed/min
e methan
e
Energy distributio
n
EE households
Sumadija and Western SerbiaSouthern and Eastern Serbia

This workbook was produced by Jørgen Fenhann, UNEP DTU Partnership from the CDMPipeline of 1st Juney 2018, [email protected], Phone (+45)40202789
EE industry EE service Fugitive HFCs Hydro
11 1
0 0 0 0 0 1 0 0 0 1 1
EE own generati
on
EE supply side
Fossil fuel
switch
Geothermal
Landfill gas
Methane
avoidance

N2O Solar Tidal Wind Total GDP/cap
0
0
1 23 5
00
0 0 0 0 0 0 0 4 7
Mixed renewa
bles
PFCs and SF6
Reforestation
Transport
Population (millions)

This workbook was produced by Jørgen Fenhann, UNEP DTU Partnership from the CDMPipeline of 1st Juney 2018, [email protected], Phone (+45)40202789
Cement
EasternNorthern 1SouthernWesternManyn.a.Total 0 0 1 0 0 0 0 0
Sierra Leone Provinces
Afforestation
Agriculture
Biomass
energy
CO2 capture
Coal bed/min
e methan
Energy distributio
n
EE households

This workbook was produced by Jørgen Fenhann, UNEP DTU Partnership from the CDMPipeline of 1st Juney 2018, [email protected], Phone (+45)40202789
EE industry EE service Fugitive HFCs Hydro
0 0 0 0 0 0 0 0 0 0 0
EE own generati
on
EE supply side
Fossil fuel
switch
Geothermal
Landfill gas
Methane
avoidance

N2O Solar Tidal Wind Total GDP/cap
010000
0 0 0 0 0 0 0 0 1
Mixed renewa
bles
PFCs and SF6
Reforestation
Transport
Population (millions)

This workbook was produced by Jørgen Fenhann, UNEP DTU Partnership from the CDMPipeline of 1st Juney 2018, [email protected], Phone (+45)40202789
Singapore Cement
JurongSungei Kadut 1TuasUbinPulau TekongSentosaSingapore 1SudongPawalBukumSemakauManyn.a.Total 0 0 2 0 0 0 0 0
Afforestation
Agriculture
Biomass
energy
CO2 capture
Coal bed/min
e methan
Energy distributio
n
EE households

This workbook was produced by Jørgen Fenhann, UNEP DTU Partnership from the CDMPipeline of 1st Juney 2018, [email protected], Phone (+45)40202789
EE industry EE service Fugitive HFCs Hydro
1
1
1
0 0 0 0 1 0 0 0 0 1 1
EE own generati
on
EE supply side
Fossil fuel
switch
Geothermal
Landfill gas
Methane
avoidance

N2O Solar Tidal Wind Total GDP/cap
1110002
1 10
0 0 1 0 0 0 0 0 6
Mixed renewa
bles
PFCs and SF6
Reforestation
Transport
Population (millions)

This workbook was produced by Jørgen Fenhann, UNEP DTU Partnership from the CDMPipeline of 1st Juney 2018, [email protected], Phone (+45)40202789
Cement EE industry
Eastern Cape 2Free StateGauteng 1 4KwaZulu-Natal 2 1Limpopo 1Mpumalanga 1Northern CapeNorth WestWestern Cape 1Many 1n.a.Total
South Africa Regions
Afforestation
Agriculture
Biomass
energy
CO2 capture
Coal bed/min
e methan
Energy distributio
n
EE households

This workbook was produced by Jørgen Fenhann, UNEP DTU Partnership from the CDMPipeline of 1st Juney 2018, [email protected], Phone (+45)40202789
EE service Fugitive HFCs Hydro N2O
11 1 3
1 3 3 21 1 3 1
13 1 1
13 11 1 1
EE own generati
on
EE supply side
Fossil fuel
switch
Geothermal
Landfill gas
Methane
avoidance
Mixed renewa
bles

Solar Tidal Wind Total GDP/cap
7 10 6.4375 2.707
14 8.8379 9.4262 5.2746 3.123
5 3 9 0.8234 3.669
1 6 11 4.52410
71 44.820
PFCs and SF6
Reforestation
Transport
Population (millions)

This workbook was produced by Jørgen Fenhann, UNEP DTU Partnership from the CDMPipeline of 1st Juney 2018, [email protected], Phone (+45)40202789
Source: www.index.go.krCement EE industry EE service Fugitive HFCs Hydro N2O Solar Tidal Wind Total
Busan 1 1 23.6 3.324 78392Chungcheongbuk-do 1 1 1 3 35.3 1.485 52364Chungcheongnam-do 1 3 3 4 11 57.0 1.946 110857Daegu 1 1 1 1 4 3.7 2.378 8889Daejeon 0 23.1 1.468 33973Gangwon-do 2 1 1 1 2 4 11 27.7 1.429 39578Gwangju 1 1 22.5 1.438 32297Gyeonggi-do 1 1 5 1 2 1 2 13 29.9 11.744 350963Gyeongsangbuk-do 1 3 1 1 7 2 15 37.7 2.509 94617Gyeongsangnam-do 1 1 8 10 33.1 3.144 103973Incheon 1 1 2 27.5 2.767 76206Jeju-do 4 4 26.8 0.576 15432Jeollabuk-do 1 1 5 7 26.1 1.739 45425Jeollanam-do 1 3 1 2 10 1 18 38.6 1.701 65684Seoul 1 2 1 4 36.7 9.395 345138Ulsan 1 4 1 6 63.2 1.106 69881Many 4 1 1 2 8n.a. 0Total 0 0 1 0 0 0 0 0 0 0 1 0 5 0 1 1 24 7 1 5 6 7 1 43 1 0 14 118 31.6 48.148 1523669
South Korea Provinces
Afforestation
Agriculture
Biomass
energy
CO2 capture
Coal bed/min
e methan
e
Energy distributio
n
EE households
EE own generati
on
EE supply side
Fossil fuel
switch
Geothermal
Landfill gas
Methane
avoidance
Mixed renewa
bles
PFCs and SF6
Reforestation
Transport
GDP/cap (Miilion Won)
Population (millions) in
2015 Source: http://kosis.kr/
GDP (Billion Won in 2015)

This workbook was produced by Jørgen Fenhann, UNEP DTU Partnership from the CDMPipeline of 1st Juney 2018, [email protected], Phone (+45)40202789
Cement EE industry
CentralNorth CentralNorthernEastern 1North WesternSouthernUvaSabaragamuwa 2Western 1Manyn.a.Total 0 0 4 0 0 0 0 0 0
Sri Lanka Provinces
Afforestation
Agriculture
Biomass
energy
CO2 capture
Coal bed/min
e methan
Energy distributio
n
EE households

This workbook was produced by Jørgen Fenhann, UNEP DTU Partnership from the CDMPipeline of 1st Juney 2018, [email protected], Phone (+45)40202789
EE service Fugitive HFCs Hydro N2O
6
1
1
1 17
2
0 0 0 0 1 0 0 14 2 1 1 0
EE own generati
on
EE supply side
Fossil fuel
switch
Geothermal
Landfill gas
Methane
avoidance
Mixed renewa
bles

Solar Tidal Wind Total GDP/cap
6011
5 6029300
0 0 0 0 0 5 28
PFCs and SF6
Reforestation
Transport
Population (millions)

This workbook was produced by Jørgen Fenhann, UNEP DTU Partnership from the CDMPipeline of 1st Juney 2018, [email protected], Phone (+45)40202789
Sudan Sates Cement EE industry EE service Fugitive HFCs Hydro N2O Solar Tidal Wind Total GDP/cap
Al Jazirah 0Al Qadarif 0Blue Nile 0Central Darfur 0East Darfur 0Kassala 0Khartoum 1 1North Darfur 0North Kurdufan 0Northern 1 1Red Sea 0River Nile 0Sennar 0South Darfur 0South Kurdufan 0West Darfur 0West Kurdufan 0White Nile 0Many 0n.a. 0Total 0 0 0 0 0 0 0 0 0 0 0 0 0 0 0 0 0 1 0 0 0 0 0 0 0 0 1 2
Afforestation
Agriculture
Biomass
energy
CO2 capture
Coal bed/min
e methan
Energy distributio
n
EE households
EE own generati
on
EE supply side
Fossil fuel
switch
Geothermal
Landfill gas
Methane
avoidance
Mixed renewa
bles
PFCs and SF6
Reforestation
Transport
Population (millions)

This workbook was produced by Jørgen Fenhann, UNEP DTU Partnership from the CDMPipeline of 1st Juney 2018, [email protected], Phone (+45)40202789
Cement
HhohhoLubombo 1ManziniShiselweniManyn.a.Total 0 0 1 0 0 0 0 0
Swaziland districts
Afforestation
Agriculture
Biomass
energy
CO2 capture
Coal bed/min
e methan
Energy distributio
n
EE households

This workbook was produced by Jørgen Fenhann, UNEP DTU Partnership from the CDMPipeline of 1st Juney 2018, [email protected], Phone (+45)40202789
EE industry EE service Fugitive HFCs Hydro
0 0 0 0 0 0 0 0 0 0 0
EE own generati
on
EE supply side
Fossil fuel
switch
Geothermal
Landfill gas
Methane
avoidance

N2O Solar Tidal Wind Total GDP/cap
010000
0 0 0 0 0 0 0 0 1
Mixed renewa
bles
PFCs and SF6
Reforestation
Transport
Population (millions)

This workbook was produced by Jørgen Fenhann, UNEP DTU Partnership from the CDMPipeline of 1st Juney 2018, [email protected], Phone (+45)40202789
Syria Governates Cement EE industry EE service Fugitive HFCs Hydro N2O Solar Tidal Wind Total GDP/cap
Al-Hasakah 0Aleppo 1 1Ar-Raqqah 0As-Suwayda 0Daraa 0Deir ez-Zor 0Hama 0Homs 1 1 2Idlib 0Latakia 0Quneitra 0Rif Dimashq 0Tartus 0Many 1 1n.a. 0Total 0 0 0 0 0 0 0 0 1 0 0 0 0 0 0 0 0 2 0 0 1 0 0 0 0 0 0 4
Afforestation
Agriculture
Biomass
energy
CO2 capture
Coal bed/min
e methan
Energy distributio
n
EE households
EE own generati
on
EE supply side
Fossil fuel
switch
Geothermal
Landfill gas
Methane
avoidance
Mixed renewa
bles
PFCs and SF6
Reforestation
Transport
Population (millions)

This workbook was produced by Jørgen Fenhann, UNEP DTU Partnership from the CDMPipeline of 1st Juney 2018, [email protected], Phone (+45)40202789
Cement
SughdRegion of Republic SubordinationKhationGorno-BadakhstanManyn.a.Total 0 0 0 0 0 0 0
Tajikistan Divisions
Afforestation
Agriculture
Biomass
energy
CO2 capture
Coal bed/min
e methan
Energy distributio
n

This workbook was produced by Jørgen Fenhann, UNEP DTU Partnership from the CDMPipeline of 1st Juney 2018, [email protected], Phone (+45)40202789
EE industry EE service Fugitive HFCs Hydro
0 0 0 0 0 0 0 0 0 0 0
EE households
EE own generati
on
EE supply side
Fossil fuel
switch
Geothermal
Landfill gas

N2O Solar Tidal Wind Total GDP/cap
000000
0 0 0 0 0 0 0 0 0 0
Methane
avoidance
Mixed renewa
bles
PFCs and SF6
Reforestation
Transport
Population (millions)

This workbook was produced by Jørgen Fenhann, UNEP DTU Partnership from the CDMPipeline of 1st Juney 2018, [email protected], Phone (+45)40202789
Cement EE industry EE service Fugitive HFCs Hydro N2O Solar Tidal Wind Total GDP/cap
Arusha 0Dar es Salaam 1 1Dodoma 0Iringa 1 1 2Kagera 0Kigoma 0Kilimanjaro 0Lindi 0Manyara 0Mara 0Mbeya 0Morogoro 0Mtwara 0Mwanza 1 1Pemba North 0Pemba South 0Pwani 0Rukwa 0Ruvuma 0Shinyanga 0Singida 0Tabora 0Tanga 0Zanzibar Central/South 0Zanzibar North 0Zanzibar Urban/West 0Many 0n.a. 0Total 0 0 1 0 0 0 0 0 0 0 0 0 0 0 0 0 1 1 0 0 0 0 1 0 0 0 0 4
Tanzania Regions
Afforestation
Agriculture
Biomass
energy
CO2 capture
Coal bed/min
e methan
Energy distributio
n
EE households
EE own generati
on
EE supply side
Fossil fuel
switch
Geothermal
Landfill gas
Methane
avoidance
Mixed renewa
bles
PFCs and SF6
Reforestation
Transport
Population (millions)

This workbook was produced by Jørgen Fenhann, UNEP DTU Partnership from the CDMPipeline of 1st Juney 2018, [email protected], Phone (+45)40202789
Cement
Am Nat ChareonAng ThongBangkokBuri Ram 1ChachoengsaoChai NatChaiyaphum 1ChanthaburiChiang MaiChiang RaiChon Buri 1ChumphonKalasinKam Phaeng Phet 1KanchanaburiKhon Kaen 3Krabi 2LampangLamphunLoeiLop Buri 1Mae Hong SonMaha SarakhamMukdahanNakhon NayokNakhon PathomNakhon PhanomNakhon Ratchasima 3Nakhon SawanNakhon Si Thammarat 1NanNarathiwatNong Bua Lam PhuNong KhaiNonthaburiPathum ThaniPattaniPrachuap Khiri Khan 1PhangngaPhatthalungPhayaoPhetchabunPhetchaburiPhichit 1PhitsanulokPhra Nakhon Sri Ayuthaya 1
Thailand Provinces
Afforestation
Agriculture
Biomass
energy
CO2 capture
Coal bed/min
e methan
Energy distributio
n
EE households

PhraePhuketPrachinburiRanongRatchaburiRayongRoi Et 3Sa KaeoSakon NakhonSamut PrakanSamut SakhonSamut SongkhramSaraburiSatunSi Sa KetSingburiSongkhlaSukothaiSuphan Buri 2Surat Thani 1Surin 2TakTrangTratUbon Ratchathani 1Udon ThaniUthai Thani 2UttaraditYalaYasothonManyn.a.Total 0 0 28 0 0 0 0 0

This workbook was produced by Jørgen Fenhann, UNEP DTU Partnership from the CDMPipeline of 1st Juney 2018, [email protected], Phone (+45)40202789
EE industry EE service Fugitive HFCs Hydro
1 11
131
1352
11
101 1
1
1 1
1
14
91
1
1
1
11
EE own generati
on
EE supply side
Fossil fuel
switch
Geothermal
Landfill gas
Methane
avoidance

2
5111
1
3 1 2
1
11
12
14
211
0 5 0 1 0 1 0 0 7 6 78

N2O Solar Tidal Wind Total
0 18,004 0.5580 67,279 0.2850 311,225 6.8591 28,657 1.6002 273,965 0.6581 67,315 0.3592 33,973 1.1053 63,114 0.5321 68,480 1.606
1 1 36,318 1.3071 3 383,050 1.106
3 85,468 0.4845 33,253 0.9903 79,624 0.819
1 2 73,231 0.8454 70,521 1.646
12 95,135 0.4101 3 54,392 0.785
1 162,607 0.3680 40,662 0.653
3 6 89,478 0.7530 34,906 0.2531 33,598 0.8770 30,532 0.3751 65,159 0.2384 138,507 0.9600 35,229 0.571
2 2 16 50,779 2.6871 2 69,025 0.977
2 72,419 1.6380 38,643 0.4680 52,117 0.8020 18,287 0.7230 29,805 1.0140 85,659 1.2040 250,406 0.7550 65,275 0.564
1 3 103,179 0.4640 119,142 0.2370 60,559 0.5180 41,747 0.502
1 1 2 51,924 1.0481 108,846 0.4391 60,180 0.458
1 2 61,891 0.7871 3 409,500 0.734
Mixed renewa
bles
PFCs and SF6
Reforestation
Transport
GDP/cap (Baht)
Population (millions)

0 47,297 0.4230 190,421 0.300
1 3 171,965 0.4090 86,292 0.1885 117,550 0.851
1 2 995,733 0.5291 5 30,678 1.379
1 34,889 0.7340 31,467 1.0781 404,807 1.2710 533,159 0.5210 79,545 0.181
4 10 182,422 0.6870 89,704 0.285
2 3 26,153 1.5230 82,957 0.2420 117,861 1.3351 43,980 0.589
1 4 65,066 0.83413 119,508 0.975
2 25,826 1.5171 65,000 0.4904 92,714 0.6490 79,439 0.250
1 4 35,491 1.7261 41,014 1.4523 52,757 0.3020 55,204 0.4550 71,370 0.5000 32,184 0.534
2 20
0 1 0 0 26 0 0 3 156

Provinces sorted by regions
Northern Chiang MaiChiang RaiKam Phaeng PhetLampangLamphunMae Hong SonNakhon SawanNanPhayaoPhetchabunPhichitPhitsanulokPhraeSukothaiTakUthai ThaniUttaradit
WesternKanchanaburiPhetchaburiPhachuap Khiri KhanRatchaburiSamut SongkhramSuphan Buri
North-EasternAm Nat ChareonBuri RamChaiyaphumKalasinKhon KaenLoeiMaha SarakhamMukdahanNakhon PhanomNakhon RatchasimaNong Bua Lam PhuNong KhaiRoi EtSakon NakhonSi Sa KetSurinUbon RatchathaniUdon Thani

Yasothon CentralAng ThongPhra Nakhon Sri AyuthayaChai NatLop BuriSaraburiSingburi
EasternChachoengsaoChanthaburiChon BuriNakhon NayokPrachinburiRayongSa KaeoTrat
SouthernChumphonKrabiNakhon Si ThammaratNarathiwatPattaniPhangngaPhatthalungPhuketRanongSatunSongkhlaSurat ThaniTrangYala
BANGKOK AND VICINITIESBangkok (Krung Thep Maha Nakhon)Nakhon PathomNonthaburiPathum ThaniSamut PrakanSamut Sakhon

This workbook was produced by Jørgen Fenhann, UNEP DTU Partnership from the CDMPipeline of 1st Juney 2018, [email protected], Phone (+45)40202789
Cement EE industry EE service Fugitive HFCs Hydro N2O Solar Tidal Wind Total GDP/cap
Charquanas 0Couva-Tabaquite-Talparo 0Diego Martín 0Penal-Debe 0Point Fortin 0Port of Spain 0Princes Town 0Rio Claro-Mayaro 0San Fernando 0San Juan-Laventille 0Sangre Grande 0Siparia 0Tobago 0Tunapuna-Piarco 0Many 0n.a. 0Total 0 0 0 0 0 0 0 0 0 0 0 0 0 0 0 0 0 0 0 0 0 0 0 0 0 0 0 0
Trinidad and Tobago corporations and municipalities
Afforestation
Agriculture
Biomass
energy
CO2 capture
Coal bed/min
e methan
Energy distributio
n
EE households
EE own generati
on
EE supply side
Fossil fuel
switch
Geothermal
Landfill gas
Methane
avoidance
Mixed renewa
bles
PFCs and SF6
Reforestation
Transport
Population (millions)

This workbook was produced by Jørgen Fenhann, UNEP DTU Partnership from the CDMPipeline of 1st Juney 2018, [email protected], Phone (+45)40202789
Cement EE industry EE service Fugitive HFCs Hydro N2O Solar Tidal Wind Total GDP/cap
Ariana 0Béja 0Ben Arous 0Bizerte 1 1Gabès 0Gafsa 0Jendouba 0Kairouan 0Kasserine 0Kebili 0Kef 0Mahdia 0 Manouba 0Medenine 0Monastir 0Nabeul 1 1Sfax 0Sidi Bou Zid 0Siliana 0Sousse 0Tataouine 0Tozeur 0Tunis 1 1 1 3Zaghouan 0Many 1 1n.a. 0Total 0 0 1 0 0 0 0 0 0 0 0 0 0 0 0 0 0 2 0 0 0 0 0 0 0 1 2 6
Tunisia Governates
Afforestation
Agriculture
Biomass
energy
CO2 capture
Coal bed/min
e methan
Energy distributio
n
EE households
EE own generati
on
EE supply side
Fossil fuel
switch
Geothermal
Landfill gas
Methane
avoidance
Mixed renewa
bles
PFCs and SF6
Reforestation
Transport
Population (millions)

This workbook was produced by Jørgen Fenhann, UNEP DTU Partnership from the CDMPipeline of 1st Juney 2018, [email protected], Phone (+45)40202789
Cement EE industry EE service Fugitive HFCs Hydro N2O Solar Tidal Wind Total GDP/cap
Ashgabat 0Ahal 0Balkan 1 1Dasoguz 0Lebap 0Mary 0Many 0n.a. 0Total 0 0 0 0 0 0 0 0 0 0 0 0 0 1 0 0 0 0 0 0 0 0 0 0 0 0 0 1
Turkmenistan Provinces
Afforestation
Agriculture
Biomass
energy
CO2 capture
Coal bed/min
e methan
Energy distributio
n
EE households
EE own generati
on
EE supply side
Fossil fuel
switch
Geothermal
Landfill gas
Methane
avoidance
Mixed renewa
bles
PFCs and SF6
Reforestation
Transport
Population (millions)

This workbook was produced by Jørgen Fenhann, UNEP DTU Partnership from the CDMPipeline of 1st Juney 2018, [email protected], Phone (+45)40202789
Cement
Central 1EasternNorthern 1WesternMany 2n.a.Total 1 0 1 0 0 0 0 2
Uganda Regions
Afforestation
Agriculture
Biomass
energy
CO2 capture
Coal bed/min
e methan
Energy distributio
n
EE households

This workbook was produced by Jørgen Fenhann, UNEP DTU Partnership from the CDMPipeline of 1st Juney 2018, [email protected], Phone (+45)40202789
EE industry EE service Fugitive HFCs Hydro
1 2114
0 0 0 0 0 0 0 0 6 1 2
EE own generati
on
EE supply side
Fossil fuel
switch
Geothermal
Landfill gas
Methane
avoidance

N2O Solar Tidal Wind Total GDP/cap
1 512
5 91 3
00 0 0 6 0 0 1 0 20
Mixed renewa
bles
PFCs and SF6
Reforestation
Transport
Population (millions)

This workbook was produced by Jørgen Fenhann, UNEP DTU Partnership from the CDMPipeline of 1st Juney 2018, [email protected], Phone (+45)40202789
Cement EE industry
Abu Dhabi AjmanDubaiFujairahRas al-KhaimahSharjahUmm al-Quwain Manyn.a.Total 0 0 0 0 0 0 0 0 0
United Arab Emirates
Afforestation
Agriculture
Biomass
energy
CO2 capture
Coal bed/min
e methan
Energy distributio
n
EE households

This workbook was produced by Jørgen Fenhann, UNEP DTU Partnership from the CDMPipeline of 1st Juney 2018, [email protected], Phone (+45)40202789
EE service Fugitive HFCs Hydro N2O
1
0 0 0 0 1 0 0 0 0 0 0 0
EE own generati
on
EE supply side
Fossil fuel
switch
Geothermal
Landfill gas
Methane
avoidance
Mixed renewa
bles

Solar Tidal Wind Total GDP/cap
001000000
0 0 0 0 0 0 1
PFCs and SF6
Reforestation
Transport
Population (millions)

This workbook was produced by Jørgen Fenhann, UNEP DTU Partnership from the CDMPipeline of 1st Juney 2018, [email protected], Phone (+45)40202789
Cement EE industry EE service Fugitive HFCs Hydro N2O Solar Tidal Wind Total GDP/cap
Artigas 0 0.070Canelones 0 0.440Cerro Largo 1 1 1 0.080Colonia 2 2 0.120Durazno 0 0.060Flores 1 2 3 0.020Florida 3 3 0.070Lavalleja 1 1 2 0.060Maldonado 2 2 0.130Montevideo 1 1 1.330Paysandu 1 1 0.110Rio Negro 1 1 0.050Rivera 1 1 0.100Rocha 1 1 0.070Salto 0 0.120San Jose 2 2 0.100Soriano 0 0.080Tacuarembo 2 3 5 0.090Treinta y Tres 1 1 0.050Many 0n.a. 0Total 1 0 9 0 0 0 0 0 0 0 0 0 0 0 0 0 0 1 1 0 0 0 0 0 0 0 15 26 3.150
Uruguay Departments
Afforestation
Agriculture
Biomass
energy
CO2 capture
Coal bed/min
e methan
Energy distributio
n
EE households
EE own generati
on
EE supply side
Fossil fuel
switch
Geothermal
Landfill gas
Methane
avoidance
Mixed renewa
bles
PFCs and SF6
Reforestation
Transport
Population (millions)

This workbook was produced by Jørgen Fenhann, UNEP DTU Partnership from the CDMPipeline of 1st Juney 2018, [email protected], Phone (+45)40202789
Cement EE industry EE service Fugitive HFCs Hydro N2O Solar Tidal Wind Total GDP/cap
Bukhara 1 1Andijon 0Fargana 1 1Jizzax 1 1Khorezm 1 1Namangan 1 1Navoiy 1 4 5Qaraqalpaqstan 0Qashqadaryo 1 1 2Samarqand 1 1Sirdaryo 1 1 2Surxondaryo 1 1Tashkent 1 1 1 1 4Tashkent City 0Many 2 2n.a. 0Total 0 0 0 0 0 0 0 0 0 0 0 3 0 11 0 0 0 2 0 0 6 0 0 0 0 0 0 22 0.000
Uzbekistan Provinces
Afforestation
Agriculture
Biomass
energy
CO2 capture
Coal bed/min
e methan
Energy distributio
n
EE households
EE own generati
on
EE supply side
Fossil fuel
switch
Geothermal
Landfill gas
Methane
avoidance
Mixed renewa
bles
PFCs and SF6
Reforestation
Transport
Population (millions)

This workbook was produced by Jørgen Fenhann, UNEP DTU Partnership from the CDMPipeline of 1st Juney 2018, [email protected], Phone (+45)40202789
Cement
An GiangBa Ria-Vung TauBac GiangBac KanBac LieuBac NinhBinh Dinh 2Binh Duong 3Binh PhuocBinh ThuanCa MauCan Tho 2Cao BangDa Nang 2Dak LakDak NongDien BienDong NaiDong Thap 1en treGia Lai 1Ha GiangHa Nam 1Ha NoiHa TayHa TinhHai DuongHai PhongHau GiangHo Chi Minh 3Hoa BinhHung YenKhanh HoaKien GiangKon TumLai ChauLam DongLang SonLao CaiLong An 1Nam DinhNghe An 1Ninh BinhNinh ThuanPhu ThoPhu Yen
Vietnam Departments
Afforestation
Agriculture
Biomass
energy
CO2 capture
Coal bed/min
e methan
Energy distributio
n
EE households

Quang BinhQuang NamQuang NgaiQuang NinhQuang TriSoc TrangSon LaTay NinhThai BinhThai NguyenThanh Hoa 1Thua Thien-Hue 1Tien GiangTra VinhTuyen QuangVinh LongVinh PhucYen BaiMany 1n.a.Total 0 0 19 0 0 0 0 1

This workbook was produced by Jørgen Fenhann, UNEP DTU Partnership from the CDMPipeline of 1st Juney 2018, [email protected], Phone (+45)40202789
EE industry EE service Fugitive HFCs Hydro
1
1
31
1 12
13
5 211 1
31 1
1310
1
11
15
3
21
11 11011
327 1
12 2
11
2 1
EE own generati
on
EE supply side
Fossil fuel
switch
Geothermal
Landfill gas
Methane
avoidance

16 13 3
6 1
264
11 6
3
1
12 1
0 3 0 0 0 1 0 0 210 7 23

N2O Solar Tidal Wind Total GDP/cap
0 2.211 0.930 1.591 0.30
1 1 0.820 1.01
1 6 1.574 0.962 0.81
3 5 1.160 1.233 1.143 0.522 0.797 1.74
12 0.413 0.462 2.211 1.670 1.35
14 1.1610 0.68
1 0.831 3.220 2.541 1.311 1.720 1.801 0.808 6.11
1 4 0.820 1.142 1.141 1.68
12 0.3810 0.3211 1.18
3 0.7528 0.59
1 1.420 1.97
15 3.060 0.921 0.571 1.343 0.87
Mixed renewa
bles
PFCs and SF6
Reforestation
Transport
Population (millions)

0 0.8517 1.47
6 1.300 1.097 0.630 1.28
1 27 1.014 1.050 1.871 1.138 3.684 1.140 1.720 1.041 0.720 1.060 1.18
13 0.7410
0 0 0 1 1 0 0 5 271

This workbook was produced by Jørgen Fenhann, UNEP DTU Partnership from the CDMPipeline of 1st Juney 2018, [email protected], Phone (+45)40202789
Cement EE industry
CentralCopperbeltEasternLuapulaLusaka 1NorthernNorth WesternSouthernWesternManyn.a.Total 0 0 0 0 0 0 0 1 0
Zambia Provinces
Afforestation
Agriculture
Biomass
energy
CO2 capture
Coal bed/min
e methan
Energy distributio
n
EE households

This workbook was produced by Jørgen Fenhann, UNEP DTU Partnership from the CDMPipeline of 1st Juney 2018, [email protected], Phone (+45)40202789
EE service Fugitive HFCs Hydro N2O
11
0 0 0 0 0 0 0 2 0 0 0 0
EE own generati
on
EE supply side
Fossil fuel
switch
Geothermal
Landfill gas
Methane
avoidance
Mixed renewa
bles

Solar Tidal Wind Total GDP/cap
00001011000
0 0 0 0 0 0 3
PFCs and SF6
Reforestation
Transport
Population (millions)

This workbook was produced by Jørgen Fenhann, UNEP DTU Partnership from the CDMPipeline of 1st Juney 2018, [email protected], Phone (+45)40202789
Cement
BulawayoHarareManicalandMashonaland CentralMashonaland EastMashonaland WestMasvingoMatabeleland NorthMatabeleland SouthMidlandsManyn.a.Total 0 0 0 0 0 0 0 0
Zimbabwe Provinces
Afforestation
Agriculture
Biomass
energy
CO2 capture
Coal bed/min
e methan
Energy distributio
n
EE households

This workbook was produced by Jørgen Fenhann, UNEP DTU Partnership from the CDMPipeline of 1st Juney 2018, [email protected], Phone (+45)40202789
EE industry EE service Fugitive HFCs Hydro
0 0 0 0 0 0 0 0 0 0 0
EE own generati
on
EE supply side
Fossil fuel
switch
Geothermal
Landfill gas
Methane
avoidance

N2O Solar Tidal Wind Total GDP/cap
000000000
1 100
0 1 0 0 0 0 0 0 1
Mixed renewa
bles
PFCs and SF6
Reforestation
Transport
Population (millions)