xl cubed versión 7 userguide
DESCRIPTION
El xlcubed versión 7 es un complemento de excel para realizar manejo de datos. El documentos que se relaciona es una guía de usuario para aprender como es el manejo de dicha herramienta. Muy bueno para hacer tablas dinámicas y gráficos de las mismas además tiene una versión de prueba que puede ser usada por 30 díasTRANSCRIPT

7/17/2019 XL Cubed versión 7 UserGuide
http://slidepdf.com/reader/full/xl-cubed-version-7-userguide 1/567
XLCubed Ltd 07 August 2014
XLCubed v7 User Guide

7/17/2019 XL Cubed versión 7 UserGuide
http://slidepdf.com/reader/full/xl-cubed-version-7-userguide 2/567
Contents
Introduction & Overview ........................................................................................................................ 1
What is XLCubed? ......................................................................................................................................................... 1
Data Sources ................................................................................................................................................................. 1
How is it used? .............................................................................................................................................................. 1XLCubed and Cube Terminology ................................................................................................................................... 1
Ways to retrieve data in XLCubed................................................................................................................................. 4
QuickStart .............................................................................................................................................. 6
Managing Connections ................................................................................................................................................. 6
Connecting to your data ............................................................................................................................................... 6
Book I – Grids ....................................................................................................................................... 11
Grid Reporting Overview ............................................................................................................................................ 11
Grid Components ....................................................................................................................................................... 12Basic Navigation ......................................................................................................................................................... 12
Report Designer .......................................................................................................................................................... 16
Calculations Overview ................................................................................................................................................. 58
Grid Calculations ......................................................................................................................................................... 58
Subtotals ..................................................................................................................................................................... 67
Visual Totals ................................................................................................................................................................ 68
Actions ........................................................................................................................................................................ 73
Outlier Grouping ......................................................................................................................................................... 73Named Ranges ............................................................................................................................................................ 74
Linking Grids ............................................................................................................................................................... 80
Member Properties in Grids ....................................................................................................................................... 83
Active Cell Grid Selections .......................................................................................................................................... 84
Propagate Across Sheets ............................................................................................................................................ 87
Breakout Value ........................................................................................................................................................... 89
Converting Grid Reports ............................................................................................................................................. 93
Copying Grids .............................................................................................................................................................. 95
Deleting Grids .............................................................................................................................................................. 95
Drillthrough ................................................................................................................................................................. 96
Expanding Large Hierarchies ...................................................................................................................................... 97
Grid Charts .................................................................................................................................................................. 98
Book II - Formula Reporting ................................................................................................................ 102
Grid vs. Formula-based Reporting Key Differences ................................................................................................. 103
Drilling in Formula Report ........................................................................................................................................ 103
Insert Value ............................................................................................................................................................... 103
Insert Members ........................................................................................................................................................ 105
Insert Member Property ........................................................................................................................................... 106
OLAP Formulae ......................................................................................................................................................... 107

7/17/2019 XL Cubed versión 7 UserGuide
http://slidepdf.com/reader/full/xl-cubed-version-7-userguide 3/567
Tabular Formulae ...................................................................................................................................................... 108
In-Cell Chart Formulae .............................................................................................................................................. 108
Relational Formulae .................................................................................................................................................. 108
Report Management Formulae ................................................................................................................................ 108
Formula wizards ........................................................................................................................................................ 109
XL3Lookup ................................................................................................................................................................. 110
XL3Member ............................................................................................................................................................... 112
Syntax ........................................................................................................................................................................ 112
Other Formulae ......................................................................................................................................................... 115
Flex Reporting ........................................................................................................................................................... 181
Picture Links .............................................................................................................................................................. 186
Book III – Charting & Data Visualisation .............................................................................................. 188
Standard Excel Charts ............................................................................................................................................... 188
XLCubed Grid Charts ................................................................................................................................................. 189
In-Cell Charts ............................................................................................................................................................. 189
Small Multiples .......................................................................................................................................................... 189
Treemaps .................................................................................................................................................................. 190
Mapping .................................................................................................................................................................... 190
In-Cell Charts in Grids ............................................................................................................................................... 191
Small Multiple Charts ............................................................................................................................................... 196
Interactive Charting .................................................................................................................................................. 220
In-Cell Chart Designer ............................................................................................................................................... 223
SparkLine Chart Designer ......................................................................................................................................... 224
SparkColumns Chart Designer .................................................................................................................................. 227
SparkWinLose Chart Designer .................................................................................................................................. 229
SparkBar Chart Designer .......................................................................................................................................... 229
SparkBullet Chart Designer....................................................................................................................................... 231
SparkIcon Chart Designer ......................................................................................................................................... 233
SparkPie Chart Designer ........................................................................................................................................... 236
SparkHorizon Chart Designer .................................................................................................................................... 238
SparkBox Chart Designer .......................................................................................................................................... 239
DotPlot Chart Designer ............................................................................................................................................. 241
Lollipop Chart Designer ............................................................................................................................................ 244
Bandline Chart Designer ........................................................................................................................................... 245
Maps.......................................................................................................................................................................... 248
Treemaps .................................................................................................................................................................. 253
Book IV - Web Edition ......................................................................................................................... 258
Step 1. Design your report ........................................................................................................................................ 258
Step 2. Publish your report ....................................................................................................................................... 258
Step 3. View the report in a browser ........................................................................................................................ 258
Step 4. Enjoy OLAP in a browser ............................................................................................................................... 258

7/17/2019 XL Cubed versión 7 UserGuide
http://slidepdf.com/reader/full/xl-cubed-version-7-userguide 4/567
Web Publishing ......................................................................................................................................................... 259
Concurrent Users ...................................................................................................................................................... 274
Analytics books ......................................................................................................................................................... 277
Auto refresh .............................................................................................................................................................. 201
Browsing the XLCubed Web Repository .................................................................................................................. 202
Reporting Services .................................................................................................................................................... 203
Web Development .................................................................................................................................................... 204
HTML ......................................................................................................................................................................... 303
iPhone app ................................................................................................................................................................ 304
Publishing Connections ............................................................................................................................................. 311
Customising web config ............................................................................................................................................ 312
Web Parameters ....................................................................................................................................................... 313
Connection Mapping ................................................................................................................................................ 317
Dual Authentication .................................................................................................................................................. 320
Scheduling ................................................................................................................................................................. 322
Book V - Dimension Slicers ................................................................................................................. 338
Grid Slicers ................................................................................................................................................................ 338
Standalone Slicers ..................................................................................................................................................... 338
Member Selector Slicer ............................................................................................................................................ 340
Date Slicer ................................................................................................................................................................. 341
Updating Excel Ranges .............................................................................................................................................. 345
Excel Range Slicers .................................................................................................................................................... 345
Members with no data / Non empty ...................................................................................................................... 348
Cascading and Advanced Slicers .............................................................................................................................. 348
Initial Value ............................................................................................................................................................... 351
Disabling Slicers ........................................................................................................................................................ 352
Wait for Submit on Web ............................................................................................................................................ 352
Use query restrictions for children (new in v7.6) ..................................................................................................... 352
Book VI - Ranking, Sorting and Filtering............................................................................................... 353
Simple Filtering ......................................................................................................................................................... 354
Axis Ranking .............................................................................................................................................................. 369
Outlier Grouping ....................................................................................................................................................... 375
Book VII - SQL ..................................................................................................................................... 382
SQL Server 2012 ........................................................................................................................................................ 383
SQL Data Tables (Administrators) ............................................................................................................................ 385
SQL Data Tables (Standard Users) ............................................................................................................................ 391
SQL Slicers (Administrators) ..................................................................................................................................... 395
SQL Slicers (Standard Users) .................................................................................................................................... 401
Driving a SQL connection from an Excel range ......................................................................................................... 403
Using SQL Parameters .............................................................................................................................................. 404
Book VIII - Tables ................................................................................................................................ 408
7/17/2019 XL Cubed versión 7 UserGuide
http://slidepdf.com/reader/full/xl-cubed-version-7-userguide 5/567
SQL ............................................................................................................................................................................ 408
Multidimensional Table Designer ............................................................................................................................. 408
Tabular ...................................................................................................................................................................... 410
Tabular Designer ....................................................................................................................................................... 413
Formatting Tables ..................................................................................................................................................... 421
Book IX - SharePoint ........................................................................................................................... 434
Installing .................................................................................................................................................................... 434
Uninstalling ............................................................................................................................................................... 440
Using WebPart .......................................................................................................................................................... 445
Troubleshooting ........................................................................................................................................................ 450
SharePoint Integration .............................................................................................................................................. 451
Book X - Miscellaneous ....................................................................................................................... 463
XLCubed Options ...................................................................................................................................................... 463
Workbook Options .................................................................................................................................................... 467
Data Configuration Settings ...................................................................................................................................... 516
Book XI - Troubleshooting ................................................................................................................... 518
XLCubed Excel Edition ............................................................................................................................................... 518
Installation Troubleshooting ..................................................................................................................................... 518
XLCubed Web Edition................................................................................................................................................ 526
Book XII - Installation.......................................................................................................................... 541
XLCubed Excel Edition ............................................................................................................................................... 541
XLCubed Excel Edition Installation Logging ............................................................................................................... 542
XLCubed Web Edition................................................................................................................................................ 543
Overview ................................................................................................................................................................... 543
Installation Prerequisites .......................................................................................................................................... 543
Server Requirements ................................................................................................................................................ 543
Client Requirements ................................................................................................................................................. 543
Pre-Requisites ........................................................................................................................................................... 543
IIS8/Windows 8 ......................................................................................................................................................... 543
Configuration ............................................................................................................................................................ 544
Setting up the XLCubed Web Edition application manually ..................................................................................... 546
Accessing XLCubed Web reports from SharePoint and other portals ...................................................................... 548
Application Usage ..................................................................................................................................................... 550
7/17/2019 XL Cubed versión 7 UserGuide
http://slidepdf.com/reader/full/xl-cubed-version-7-userguide 6/567
1 | P a g e XLCubed v7 User Guide – Introduction, Overview and QuickStart
Introduction & Overview
What is XLCubed?
XLCubed’s products help business users deliver reporting and dashboards and to carry out their own
analysis and data exploration without the need for any programming experience. It can also be used in
planning and budgeting models. The two core products are based in Excel and Web.
Data Sources
A key aspect of XLCubed is that the data itself is not held in Excel. XLCubed’s primary data source is
Microsoft SQL Server Analysis Services. This can be multidimensional cubes, or the Tabular models
introduced in SQL 2012. XLCubed can also connect directly to relational databases, with a subset of the
overall XLCubed functionality.
How is it used?In most organisations XLCubed is used to provide a managed self-service business intelligence model,
where IT develop and own the cubes or tabular models, and business users are able to develop and
maintain their own reports, dashboards and analysis. This gives the business the flexibility and control they
need in terms of reporting, but retains IT control of corporate data.
XLCubed consists of two core products:
Excel Edition – an add-in for Microsoft Excel (2013 – 2003) which provides a powerful and flexible
reporting analysis and dashboard environment within Excel. The product extends the presentation and
query capabilities of Excel, and offers additional data visualization components. Users can do much more,
and more quickly than in a standard pivot table environment, but are still able to leverage their existing
Excel skills.
Web Edition – Web server based software, providing intranet or internet access to interactive reports
through all standard browsers and with mobile app access. Reports developed in XLCubed Excel Edition can
be published to XLCubed Web for a more widespread distribution. XLCubed Web also provide the ability
for ad-hoc reporting.
XLCubed and Cube Terminology
A cube is a set of data organized into a structure defined by a number of measures and dimensions.
It contains the following:
Measures
Dimensions
Levels
Members
Measures

7/17/2019 XL Cubed versión 7 UserGuide
http://slidepdf.com/reader/full/xl-cubed-version-7-userguide 7/567
2 | P a g e XLCubed v7 User Guide –Introduction, Overview and QuickStart
Cubes can be structured in different ways, but in simple terms measures are normally the elements you
want to add up in reporting. Typical measures might include ‘Sales Volume’, ‘Unit Sales’ and ‘Unit Cost’.
Dimensions, Hierarchies and Levels
Dimensions are the bywords of reporting. For example you may want to report sales by Region, by Period,
by Product. Region, Period and Product would each be a dimension within the cube, and XLCubed makesit easy for users to position dimensions within a report and choose the elements they want to see.
Dimensions may consist of one or more hierarchy. Hierarchies are ordered groupings, or drill paths of the
data. For example a Time Dimension may consist of both a Fiscal Date and a Calendar Date hierarchy.
These are different ways to group the days into months, quarters and years.
A Geography hierarchy may have 3 levels: Country, State, and City. Users can easily select items from any
level, or start at a higher level and drill down to detail.
Members
A member is any element, at any level within a hierarchy
Real world cubes typically have more than 3 dimensions, but to visualise an example cube we will use just
three. The diagram above shows a simple sales cube, for a bicycle sales business. The cube contains two
measures, Unit Sales and Profit, and three dimensions:
• Product : The product being sold. All products sold are bicycles, and they are categorised as
either Road or Mountain bikes, with two model types in each category.
• Region: The region the product is sold in, categorised by Hemisphere
• Time: The (simplified) time period the product was sold in. In this case it goes only to the
quarter level, but would typically begin at year level, and go down to month or day.

7/17/2019 XL Cubed versión 7 UserGuide
http://slidepdf.com/reader/full/xl-cubed-version-7-userguide 8/567
3 | P a g e XLCubed v7 User Guide –Introduction, Overview and QuickStart
Each axis of the cube represents one dimension. The texts along the axes of the cube are the members of
the dimensions. Example members are m50, Asia, and 2nd quarter. The individual members aggregate
into the hierarchy structures of the dimension.
The values within the cube represent the measures, Unit Sales and Profit in this case. Each cell within the
cube will contain a value for each of the measures, and is formed by the intersection of the dimension
members. For example, the cell shown in red represents the intersection of (Product: m50, Region: Asia,
Time: 2nd Quarter), and the measure values are Unit Sales: 600, Profit: $217.
End users of a cube can determine each measure’s values for every intersection between the dimensions
by slicing and dicing with a tool such as XLCubed.
7/17/2019 XL Cubed versión 7 UserGuide
http://slidepdf.com/reader/full/xl-cubed-version-7-userguide 9/567
4 | P a g e XLCubed v7 User Guide –Introduction, Overview and QuickStart
Ways to retrieve data in XLCubed
XLCubed offers three ways to bring data into the workbook, which we describe very briefly here, and in
more detail in the relevant sections.
Grids
Grids are the most commonly used approach in XLCubed. At the lowest level grids are similar to a pivot
table. Each Grid is an individual object, with rows and columns, and they can be drilled down to additional
levels of detail and support slice and dice.
Grids remove many of the restrictions of pivot tables, with simple user calculations, rich ranking and
filtering, and can fully leverage the cube hierarchies. Grids can be modified or designed using the report
designer, through the grid task pane, or simply by direct drag and drop of the hierarchy labels.
Grids can connect to multidimensional cubes or tabular models and use MDX as the query language.
Formulae
XLCubed provides formulae to retrieve values and hierarchy members from the cube. The formula
approach gives total control over layout and formatting, and the formulae are easy to understand and
have user dialogs.
Formulae are most often used in dashboards and formal financial reports where the layout is key. The
simplest approach to create a formula report is to create a grid and then convert to formula.
Formulae can connect to multidimensional cubes or Tabular models and use MDX as the query language.
Grids or Formulae?
User preferences vary, and in many cases either reporting approach can be used, but some considerations
are:
Grids are stronger for slice and dice analytics, supporting drag and drop analysis
Grids handle dynamic data in terms of changing numbers of rows and columns
Like for like a grid will be faster than a formula report returning the same data
Formulae offer total flexibility in terms of layout and formatting possibilities
Tables
Tables can connect to multidimensional cubes using MDX, to tabular models using DAX, or relational
databases using SQL.

7/17/2019 XL Cubed versión 7 UserGuide
http://slidepdf.com/reader/full/xl-cubed-version-7-userguide 10/567
5 | P a g e XLCubed v7 User Guide –Introduction, Overview and QuickStart
Tables have similarities to grids, but have no concept of rows – everything is a column.
Tables or Grids?
If your data is in a multidimensional cube, a grid will generally be a better fit as it is more flexible
and dynamic.
For in-memory tabular models (xVelocity) you can use grids or tables. Grids will give more flexibility,in some cases Tables may have a performance benefit due to running a DAX query.
For direct query tabular models you need to use tables as they only support DAX.
For SQL you need to use a table
7/17/2019 XL Cubed versión 7 UserGuide
http://slidepdf.com/reader/full/xl-cubed-version-7-userguide 11/567
6 | P a g e XLCubed v7 User Guide –Introduction, Overview and QuickStart
QuickStart
Managing Connections
The Connections form is available from the XLCubed > Connections ribbon or menu item.
It allows you to view, edit and delete existing connections for the workbook, and to create new
connections when required.
Connecting to your data
One workbook can support multiple connections to different server/database/cube combinations.
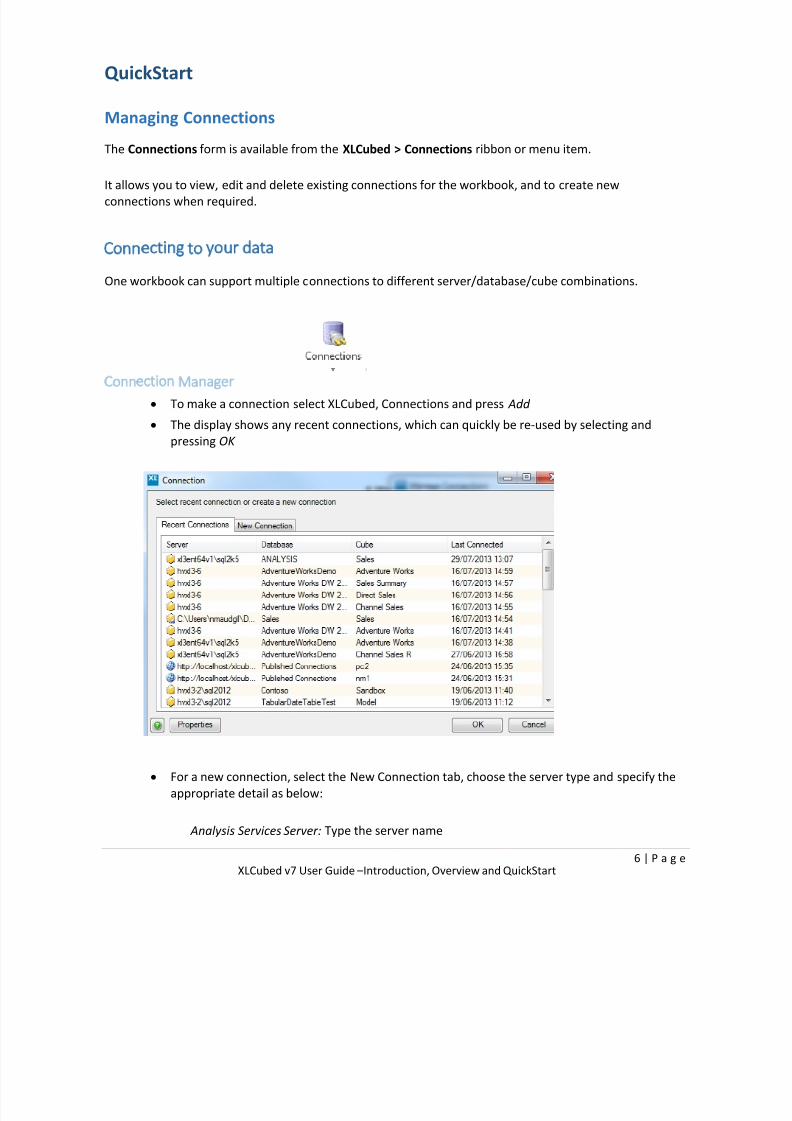
Connection Manager
To make a connection select XLCubed, Connections and press Add
The display shows any recent connections, which can quickly be re-used by selecting and
pressing OK
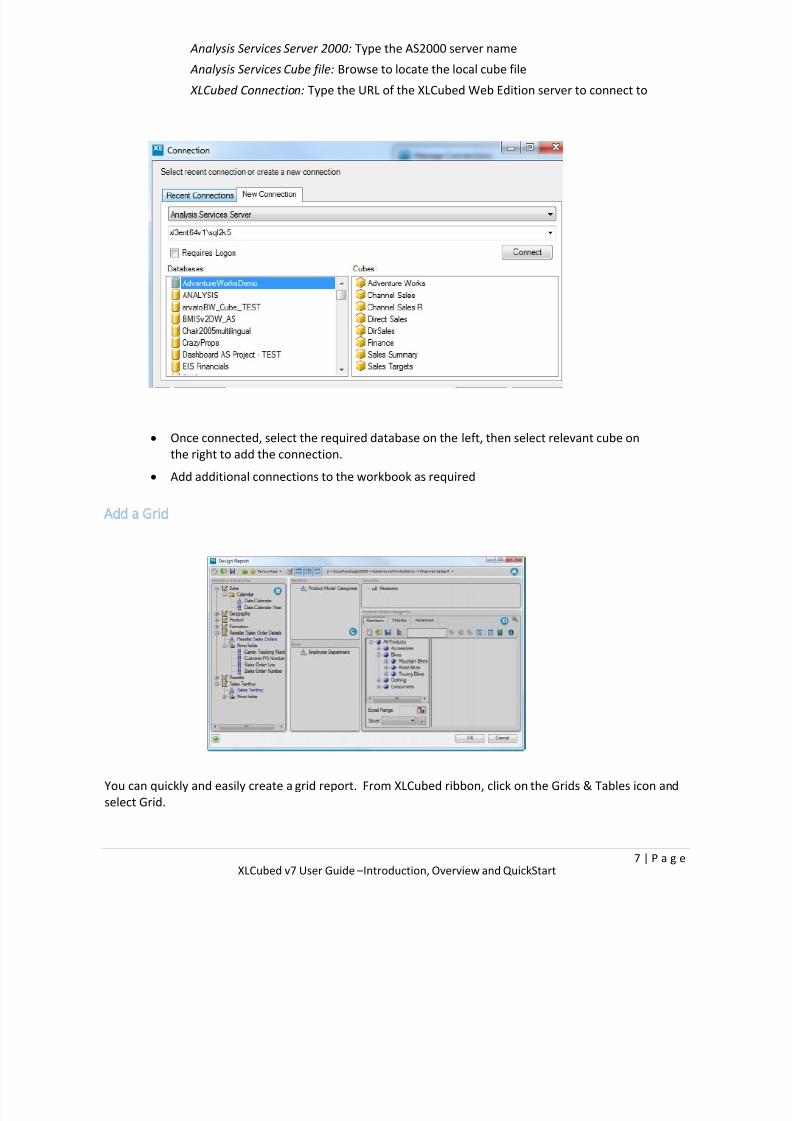
For a new connection, select the New Connection tab, choose the server type and specify the
appropriate detail as below:
Analysis Services Server: Type the server name
7/17/2019 XL Cubed versión 7 UserGuide
http://slidepdf.com/reader/full/xl-cubed-version-7-userguide 12/567
7 | P a g e XLCubed v7 User Guide –Introduction, Overview and QuickStart
Analysis Services Server 2000: Type the AS2000 server name
Analysis Services Cube file: Browse to locate the local cube file
XLCubed Connection: Type the URL of the XLCubed Web Edition server to connect to
Once connected, select the required database on the left, then select relevant cube on
the right to add the connection.
Add additional connections to the workbook as required
Add a Grid
You can quickly and easily create a grid report. From XLCubed ribbon, click on the Grids & Tables icon and
select Grid.

7/17/2019 XL Cubed versión 7 UserGuide
http://slidepdf.com/reader/full/xl-cubed-version-7-userguide 13/567
8 | P a g e XLCubed v7 User Guide –Introduction, Overview and QuickStart
You will be prompted to create a connection or select a recent connection (see Connecting to your Data).
The Report Designer window will then be displayed. It has four main parts, as shown in the diagram
below:
• A: The toolbar allows you to perform various operations and set certain options on the report.
• B: The Available Hierarchies panel contains a tree that allows you to select new hierarchies from
the cube. Expand the dimension to view the hierarchies which it contains. Hierarchies can be
dragged from this area into Headers, Rows or Columns to be used within the report. The
different hierarchy types can be distinguished by their icon:
• C: The selected hierarchies’ panels show you what hierarchies are currently selected for the
report. Clicking on a hierarchy shows the current member selection in D.
• D: The member selection panel shows the members selected for a hierarchy, as well as
advanced selections such as rankings and member properties. More information can be found
here.

7/17/2019 XL Cubed versión 7 UserGuide
http://slidepdf.com/reader/full/xl-cubed-version-7-userguide 14/567
9 | P a g e XLCubed v7 User Guide –Introduction, Overview and QuickStart
Moving Hierarchies
Hierarchies can be easily moved between axes by dragging and dropping. The member selections and
options for the hierarchy are preserved for the new position. To remove hierarchies from the report,
drag them to the Available Hierarchies panel (B above).
To select more than one hierarchy for moving, either hold down the Ctrlkey while clicking, or hold down
the Shift key to select a range of hierarchies.
Toolbar
Creating a simple grid report with a slicer
Simply drag and drop hierarchies from the Available Hierarchies area to Headers, Rows and Columns:
This gives a simple grid report with the default Measure, Reseller Sales Amount on Headers and
Product Model Categories and Calendar Date on columns:

7/17/2019 XL Cubed versión 7 UserGuide
http://slidepdf.com/reader/full/xl-cubed-version-7-userguide 15/567
10 | P a g e XLCubed v7 User Guide –Introduction, Overview and QuickStart
Now let’s create a slicer on the Header (Measures) so that the user can report another measure apart from
Reseller Sales Amount.
Simply right-click on the member, Reseller Sales Amount to access XLCubed’s right-click menu and choose
Add Slicer.
You will see that Reseller Sales Amount now has a drop-down:
You can then right-click on the slicer to edit it. From here you can set up the type of slicer that should be
displayed and the choices that should be offered.

7/17/2019 XL Cubed versión 7 UserGuide
http://slidepdf.com/reader/full/xl-cubed-version-7-userguide 16/567
11 | P a g e XLCubed v7 User Guide –Book I - Grids
Book I – Grids
Grid Reporting Overview
Grid reports (i.e. those generated using Design Grid option) are treated as a single object by XLCubed. The
report shape will always be rectangular, and some aspects will be familiar to users of Excel's PivotTables.However, much of the power of Grid-based reporting is in the additional functionality not available
through native PivotTables. Grids are well-suited to analytical work, but can also be used in more formal
reporting, depending on the formatting required. For more flexible layout options, formula reports are
also possible.
Grid reports can be modified or designed using the Report Designer, or by simply dragging the hierarchy
labels to the axis where you require them.
More detail about your data can be obtained by double-clicking on the members (known as drilling), and
many other functions, for example Subtotals and Grid Calculations, can be accessed via right-click
menus on the Grid.
Multiple Grids can exist in one worksheet. There are shown in the XLCubed ribbon or toolbar.Formatting, modification and deletion of Grids should be handled through XLCubed rather than native
Excel. Changes will otherwise not be retained when the Grid is next refreshed.

7/17/2019 XL Cubed versión 7 UserGuide
http://slidepdf.com/reader/full/xl-cubed-version-7-userguide 17/567
12 | P a g e XLCubed v7 User Guide –Book I - Grids
Grid Components The main components of the Grid are listed below:
• Header/Filter Area (C3:D5)
• Dimension Labels (C3:C5, D8, C9)
• Selected Dimension Members (B10:C20, D9:H9)
• Data Area (D10:G20)
Basic Navigation
The XLCubed Grid basic navigation operates in a similar way to Pivot Tables in Excel.
Drilling applies to Members located on either Rows or Columns.
• Drill up / down by double clicking on a Member.
•
Drill all currently selected members by right clicking on a Member and selecting the Drill All optionfrom the XLCubed menu.
• Keep only the selected Member(s) by right clicking on them and selecting the Keep Only
option from the XLCubed menu.
• Exclude only the selected Member(s) by right clicking on them and selecting the Keep All
Except option on the XLCubed menu.
• Drag and Drop applies to any Dimension Labels
• Swap Dimensions in the Grid by dragging one Dimension with the cursor to hover over another
Dimension.
• Add/Remove Dimensions from Rows and Columns by dragging a Dimension with the cursor to
the desired location.

7/17/2019 XL Cubed versión 7 UserGuide
http://slidepdf.com/reader/full/xl-cubed-version-7-userguide 18/567
13 | P a g e XLCubed v7 User Guide –Book I - Grids
Edit Grid
• At any point it is possible to return to the Report Designer for the current grid by right clicking on
the grid, and choosing XLCubed> Design Grid.
7/17/2019 XL Cubed versión 7 UserGuide
http://slidepdf.com/reader/full/xl-cubed-version-7-userguide 19/567
14 | P a g e XLCubed v7 User Guide –Book I - Grids
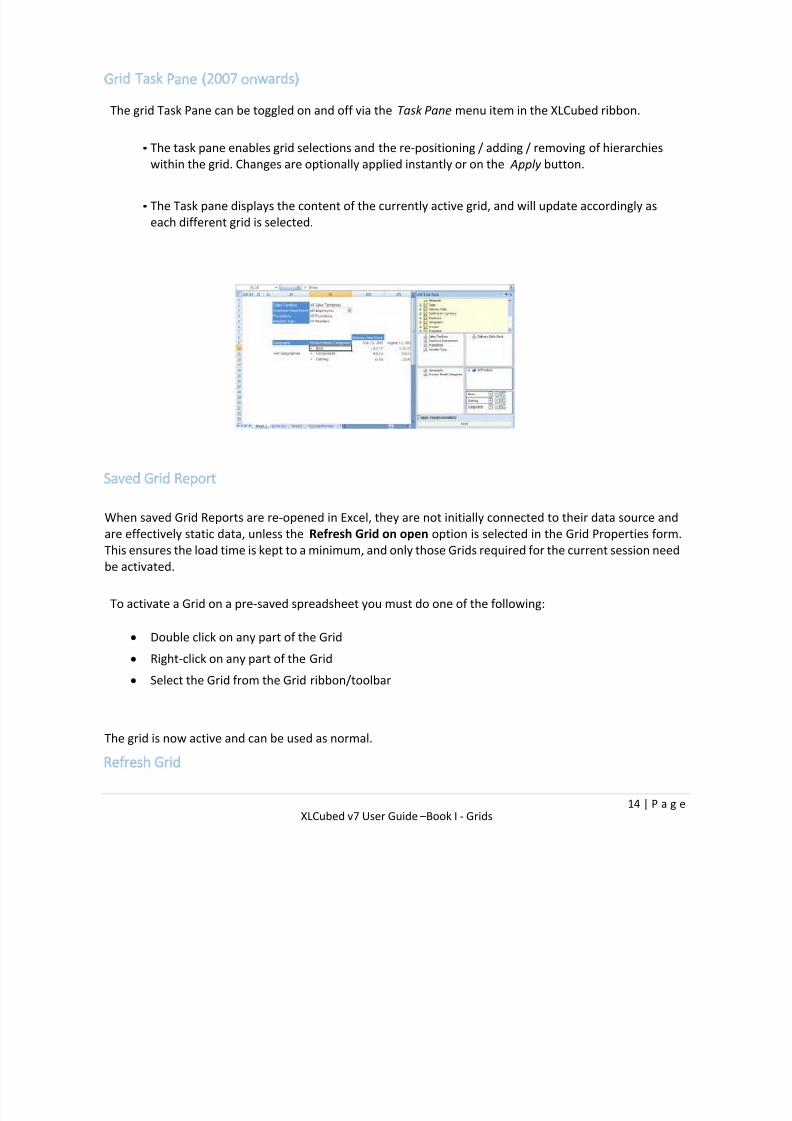
Grid Task Pane (2007 onwards)
The grid Task Pane can be toggled on and off via the Task Pane menu item in the XLCubed ribbon.
• The task pane enables grid selections and the re-positioning / adding / removing of hierarchies
within the grid. Changes are optionally applied instantly or on the Apply button.
• The Task pane displays the content of the currently active grid, and will update accordingly as
each different grid is selected.
Saved Grid Report
When saved Grid Reports are re-opened in Excel, they are not initially connected to their data source and
are effectively static data, unless the Refresh Grid on open option is selected in the Grid Properties form.
This ensures the load time is kept to a minimum, and only those Grids required for the current session need
be activated.
To activate a Grid on a pre-saved spreadsheet you must do one of the following:
Double click on any part of the Grid
Right-click on any part of the Grid Select the Grid from the Grid ribbon/toolbar
The grid is now active and can be used as normal.
Refresh Grid
7/17/2019 XL Cubed versión 7 UserGuide
http://slidepdf.com/reader/full/xl-cubed-version-7-userguide 20/567
15 | P a g e XLCubed v7 User Guide –Book I - Grids
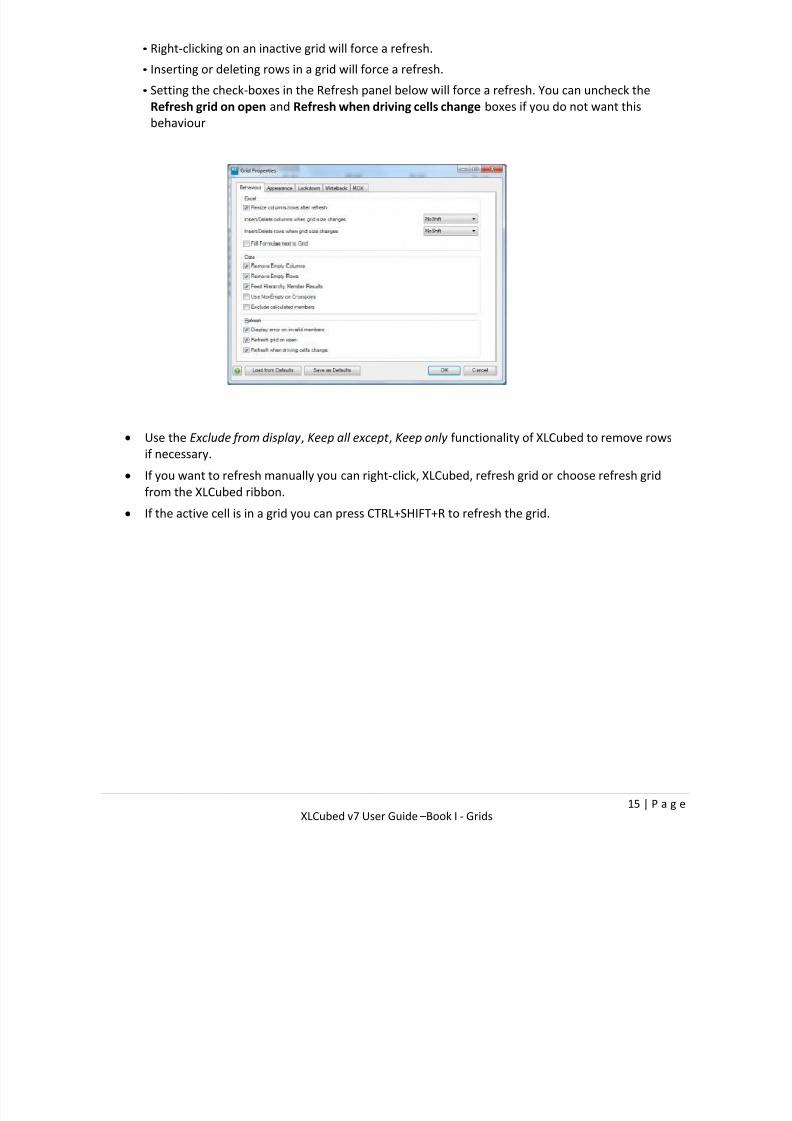
• Right-clicking on an inactive grid will force a refresh.
• Inserting or deleting rows in a grid will force a refresh.
• Setting the check-boxes in the Refresh panel below will force a refresh. You can uncheck the
Refresh grid on open and Refresh when driving cells change boxes if you do not want this
behaviour
Use the Exclude from display , Keep all except , Keep only functionality of XLCubed to remove rows
if necessary.
If you want to refresh manually you can right-click, XLCubed, refresh grid or choose refresh grid
from the XLCubed ribbon. If the active cell is in a grid you can press CTRL+SHIFT+R to refresh the grid.

7/17/2019 XL Cubed versión 7 UserGuide
http://slidepdf.com/reader/full/xl-cubed-version-7-userguide 21/567
16 | P a g e XLCubed v7 User Guide –Book I - Grids
Report Designer
The Report Designer dialog can be accessed either when creating a new report (through the XLCubed >
Grid or Formula Report ribbon item), or when editing an existing Grid (via the XLCubed > Design Grid...
right-click menu item). When first creating a Grid or formula report, if the workbook has no connections,
then XLCubed will first prompt you to create a connection.
General Layout
The Report Designer has four main parts, as shown in the diagram below:
• A: The toolbar allows you to perform various operations and set certain options on the report.
• B: The Available Hierarchies panel contains a tree that allows you to select new hierarchies from
the cube. Expand the dimension to view the hierarchies which it contains. Hierarchies can be
dragged from this area into Headers, Rows or Columns to be used within the report. The
different hierarchy types can be distinguished by their icon:
7/17/2019 XL Cubed versión 7 UserGuide
http://slidepdf.com/reader/full/xl-cubed-version-7-userguide 22/567
17 | P a g e XLCubed v7 User Guide –Book I - Grids
• C: The selected hierarchies’ panels show you what hierarchies are currently selected for the
report. Clicking on a hierarchy shows the current member selection in D.
• D: The member selection panel shows the members selected for a hierarchy, as well as
advanced selections such as rankings and member properties. More information can be found
here.
Moving Hierarchies
Hierarchies can be easily moved between axes by dragging and dropping. The member selections and
options for the hierarchy are preserved for the new position. To remove hierarchies from the report,
drag them to the Available Hierarchies panel (B above).
To select more than one hierarchy for moving, either hold down the Ctrlkey while clicking, or hold down
the Shift key to select a range of hierarchies.
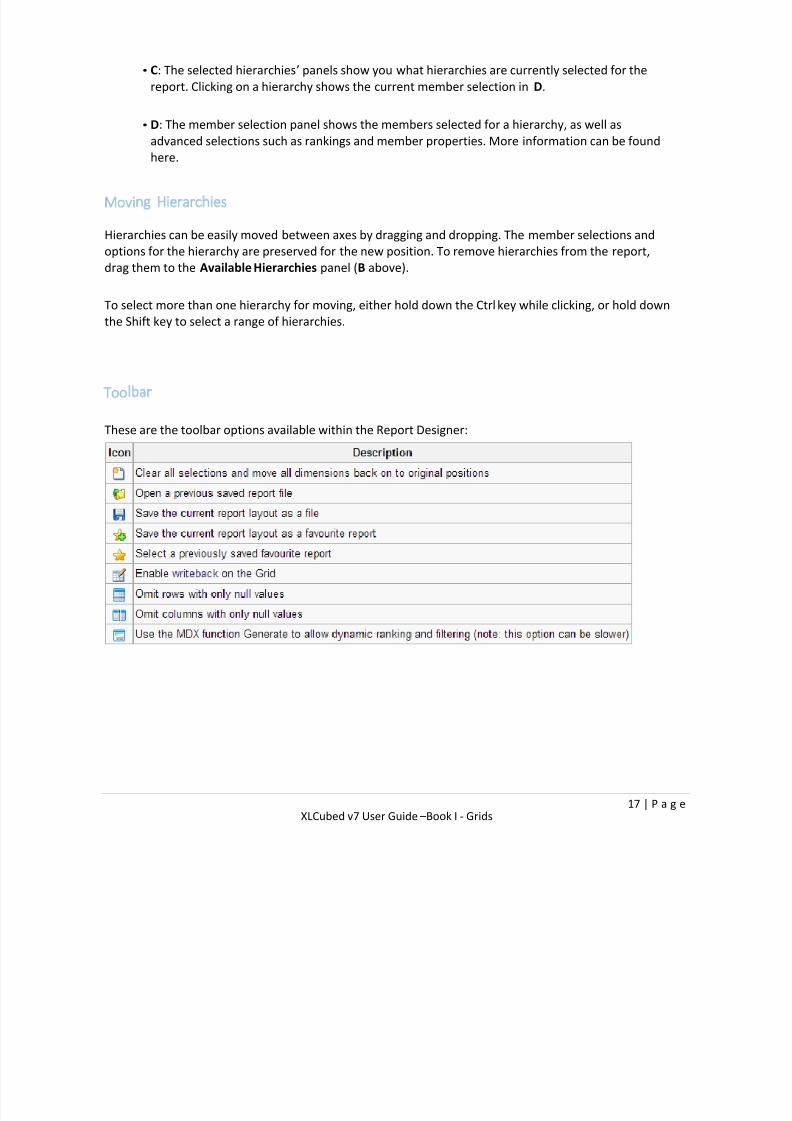
Toolbar
These are the toolbar options available within the Report Designer:

7/17/2019 XL Cubed versión 7 UserGuide
http://slidepdf.com/reader/full/xl-cubed-version-7-userguide 23/567
18 | P a g e XLCubed v7 User Guide –Book I - Grids
Grid Properties
There are many Grid Properties settings available from XLCubed’s right-click menu which give the user
more control over how the grid is displayed.
Behaviour options
Excel
Resize columns/rows after refresh: Automatically adjust the columns and rows to fit the data
Insert/Delete columns/rows when grid size changes: Determines the behaviour when members are added
or removed
Fill Formulae next to Grid: Detect and fill down/across any formulae directly adjacent to the grid as
members are added or removed.
Data
Remove empty columns/rows: Exclude columns/rows with no values from the result set
Replace 0 with null: Allows zeroes to be removed from report using the Exclude Empty options
Feed hierarchy member results: Use the MDX function Generate to allow dynamic ranking and filtering
(note: this option can be slower).
Use NonEmpty on Crossjoins: Use the NonEmptyCrossJoin MDX function
Exclude Calculated Members: by default XLCubed will show calculated members when drilling members to
display their children. This option means those calculations are no longer shown.
Where clause style: When aggregating in a hierarchy, XLCubed can generate MDX that:
With members Extracts each aggregate into a With member
Sets Leaves the aggregates in-lined as a set
Subselect Uses an in-line subselect statement for the
aggregates
Drill Mode: Changes which members are shown when members are drilled
Standard Drilled members are expanded in all
positions
Drill and Replace Drilled members and their children are
shown. Drill the parent member to drill
back up

7/17/2019 XL Cubed versión 7 UserGuide
http://slidepdf.com/reader/full/xl-cubed-version-7-userguide 24/567
19 | P a g e XLCubed v7 User Guide –Book I - Grids
Asymmetric Drilled members are expanded only in then
location drilled. This applies if you have
more than one dimension on rows, when
the members can be repeated. This feature
was introduced in version 7.2
Refresh
Display error on invalid members: Displays a warning if invalid selections are found on any hierarchy
Refresh Grid on open: Causes the grid to update itself when the workbook is opened
Refresh when driving cells change: If the grid is driven from any Excel range then causes the grid to update
itself whenever any of these changes
Default Grid Options
The defaults for new Grids can be set by using the Save as Defaults button. To set a Grid back to the saved
defaults, use the Load from Defaults button.
Appearance options
General
Title: the title of the Grid, displayed in dialogs and menus whenever the Grid is referred to.
The following parameters can also be used to display information regarding the cube connection: {server}
{database} {cube} {lastupdate}.
Display Grid title: Display the Grid title in the worksheet.
Replace nulls with: Instead of an empty cell, XLCubed inserts the desired value.
Formatting
Apply formatting: Override formats on the Grid, or let you manage them manually.
Format Grid without borders: Exclude borders from the formatting applied to the Grid.
Apply Cube formatting: Retrieve and apply formats that are defined in the cube.
Merge repeating cells: When crossjoining, merge the repeated cells for the outer hierarchies:

7/17/2019 XL Cubed versión 7 UserGuide
http://slidepdf.com/reader/full/xl-cubed-version-7-userguide 25/567
20 | P a g e XLCubed v7 User Guide –Book I - Grids
Show member properties in separate columns: If any member properties are selected, display each in its
own column, or in the same cell as the member caption:
Group member properties with the same name: Where member properties are being displayed, group
together those with same name.
Drilling
Show drill indicator: If a member is drillable, a symbol is displayed before the member's caption:
Indent members when drilling: The indentation of the members in a Grid reflects what level they are on.
The size of indentation can also be adjusted.
Grid Elements
In this section you can choose not to display sections of the grid. This allow you to place grids in specific
places without needing to hide rows/columns which is useful if they move when drilled.This example screenshot shows the standard view and then below that the effect of hiding all areas except
Row Members on the second grid:

7/17/2019 XL Cubed versión 7 UserGuide
http://slidepdf.com/reader/full/xl-cubed-version-7-userguide 26/567
21 | P a g e XLCubed v7 User Guide –Book I - Grids
Interaction Options
Track grid's active cell
The current cell in the Grid can be used as input for other Grids and formulae. See Active Cell Grid
Selections for more information.
Named Ranges
XLCubed can create named ranges based on Grid elements that can then be used by other Excel objects,
such as formulae and charts. See Named Grid Ranges for more information.
Lockdown Options
Password protect Grid properties: Before showing the Grid Properties dialog, a password is required.
Apply restrictions in Excel: Enforce the following permissions in Excel. If off, the restrictions are onlyapplied when published to XLCubed Web Edition.
Permissions
Show Grid menus: Show the right-click Grid menu. Note: The Grid properties dialog is always available
unless specifically excluded below.
7/17/2019 XL Cubed versión 7 UserGuide
http://slidepdf.com/reader/full/xl-cubed-version-7-userguide 27/567
22 | P a g e XLCubed v7 User Guide –Book I - Grids
Allow hierarchy navigation: Show the Hierarchy Editor for any hierarchy.
Can change filter/column/row members: Show the Hierarchy Editor for the hierarchies on the given axis.
Can drill columns/rows: Allow drilling on members in the given axis.
Set All to No: Disallows all the above permissions.
Hiding Menu Items
These options allow you to hide specific operations from the Grid's right-click menu.
Writeback Options
See Book IV – Web Edition for more detail about writeback in XLCubed.
MDX Options
Connection: Set the connection for the Grid
Auto-generate MDX (default): XLCubed controls the MDX for the Grid, given the selected options,
hierarchies and members.
Manual MDX: You may type your own MDX in the edit field. Using XL3Parm( Address ) allows you to
substitute parts of the MDX with cells on the worksheet.
Get MDX from Excel range: The entire MDX statement for the Grid is taken from a cell on the worksheet.
Performance Tips for Large Grids
Turn Off:
Apply formatting
Merge repeating cellsTurn On:
Hide draggable hierarchy labels
After making these changes to all the grids use XLCubed -> Connections -> Refresh connections to clear any
remaining hierarchy labels.
Saving Reports
Saving as a File
Using the Open Report and Save Report toolbar options, you can load and save the current report as
.xl3gridfiles, which can then be shared with other users.

7/17/2019 XL Cubed versión 7 UserGuide
http://slidepdf.com/reader/full/xl-cubed-version-7-userguide 28/567
23 | P a g e XLCubed v7 User Guide –Book I - Grids
Favourites
You can add the current report as a favourite by using the Add to Favourites toolbar option, and reload a
saved one by selecting it from the Favourites dropdown.
Saved favourites can be viewed, edited and deleted in the XLCubed > Utilities > Manage Favourites
dialog.

7/17/2019 XL Cubed versión 7 UserGuide
http://slidepdf.com/reader/full/xl-cubed-version-7-userguide 29/567
24 | P a g e XLCubed v7 User Guide –Book I - Grids
Slicers
Dimension slicers simplify the process of creating cube dynamic drop-downs.
For more information see Book V – Slicers
Ranking, Sorting & Filtering
Ranking, Sorting and Filtering allows the user to control the order of the data displayed.For more information see Book VI – Ranking, Sorting & Filtering
Driving Grids from an Excel Range
For many standard reports, you will want to use data from the Excel workbook to influence your Grids.
Driving dimensions from a range provides a simple way to do this, especially when multiple Grids need to
use the same parameters.
If the input to the Grid can contain members that aren't found in the Cube, then the error message that is
shown for invalid members can be hidden. See the Grid Properties Display error on invalid members
option.
Example (based on the Bicycle Sales cube)
We will create a dropdown to automatically switch the Time dimension of our Grid.
1. Insert a Grid based on the Bicycle Sales demo cube, starting from A7. Select Time and Measures on
Slicers, Region on Columns and Product on Rows.
2. In cells B3 to B5, we enter the years we want to analyse:
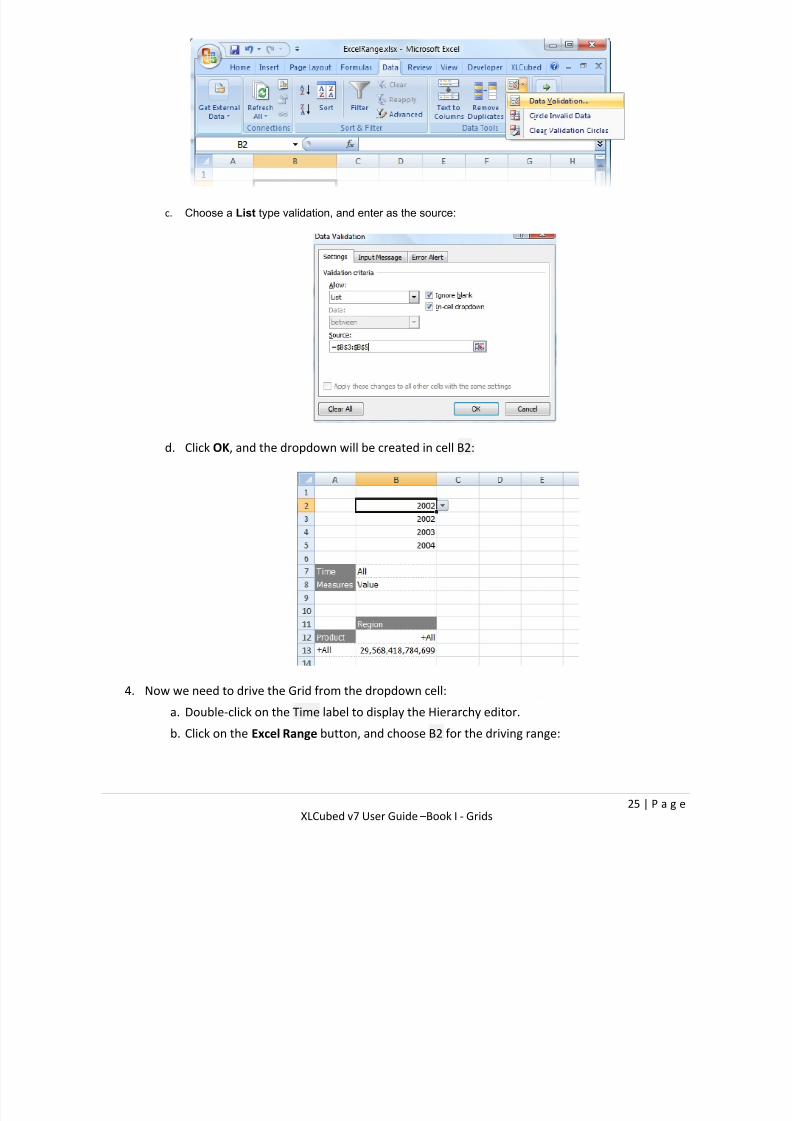
3. To create a validation dropdown cell:
a. Select the B2 cell for the dropdown
b. Select the Data Validation ribbon item:
7/17/2019 XL Cubed versión 7 UserGuide
http://slidepdf.com/reader/full/xl-cubed-version-7-userguide 30/567
25 | P a g e XLCubed v7 User Guide –Book I - Grids
c. Choose a List type validation, and enter as the source:
d. Click OK, and the dropdown will be created in cell B2:
4. Now we need to drive the Grid from the dropdown cell:
a. Double-click on the Time label to display the Hierarchy editor.
b. Click on the Excel Range button, and choose B2 for the driving range:

7/17/2019 XL Cubed versión 7 UserGuide
http://slidepdf.com/reader/full/xl-cubed-version-7-userguide 31/567
26 | P a g e XLCubed v7 User Guide –Book I - Grids
c. The selected range is added to the list of selections:
d. Click OK
5. The Grid will update to use the new range for the Time hierarchy. Because the range is currently
empty, the Grid seems to be unaffected, but if we now use the dropdown to switch the year
to 2003, we'll see the Grid update:

7/17/2019 XL Cubed versión 7 UserGuide
http://slidepdf.com/reader/full/xl-cubed-version-7-userguide 32/567
27 | P a g e XLCubed v7 User Guide –Book I - Grids
6. As you can see, the validation list range can be hidden to keep the report tidy.
7. Even after drilling the Grid, the driving cell is still maintained:
Dragging and Dropping in Grids
One of the quickest ways to change a Grid report is to use the drag and drop feature. This allows you to
drag and drop hierarchies between the rows, columns and header axes of the report allowing you toquickly produce detailed reports.
Click and hold the left mouse down on the hierarchy you want to move:

7/17/2019 XL Cubed versión 7 UserGuide
http://slidepdf.com/reader/full/xl-cubed-version-7-userguide 33/567
28 | P a g e XLCubed v7 User Guide –Book I - Grids
As you move the mouse over the other hierarchies, the cursor will change. In this example, we
are swapping the two hierarchies:
Release the mouse button to complete the operation:
When over other hierarchies, the drop indicator will change to indicate whether the dropped field
will be placed before or after the current field, or whether they will swap positions:

7/17/2019 XL Cubed versión 7 UserGuide
http://slidepdf.com/reader/full/xl-cubed-version-7-userguide 34/567
29 | P a g e XLCubed v7 User Guide –Book I - Grids
7/17/2019 XL Cubed versión 7 UserGuide
http://slidepdf.com/reader/full/xl-cubed-version-7-userguide 35/567
30 | P a g e XLCubed v7 User Guide –Book I - Grids
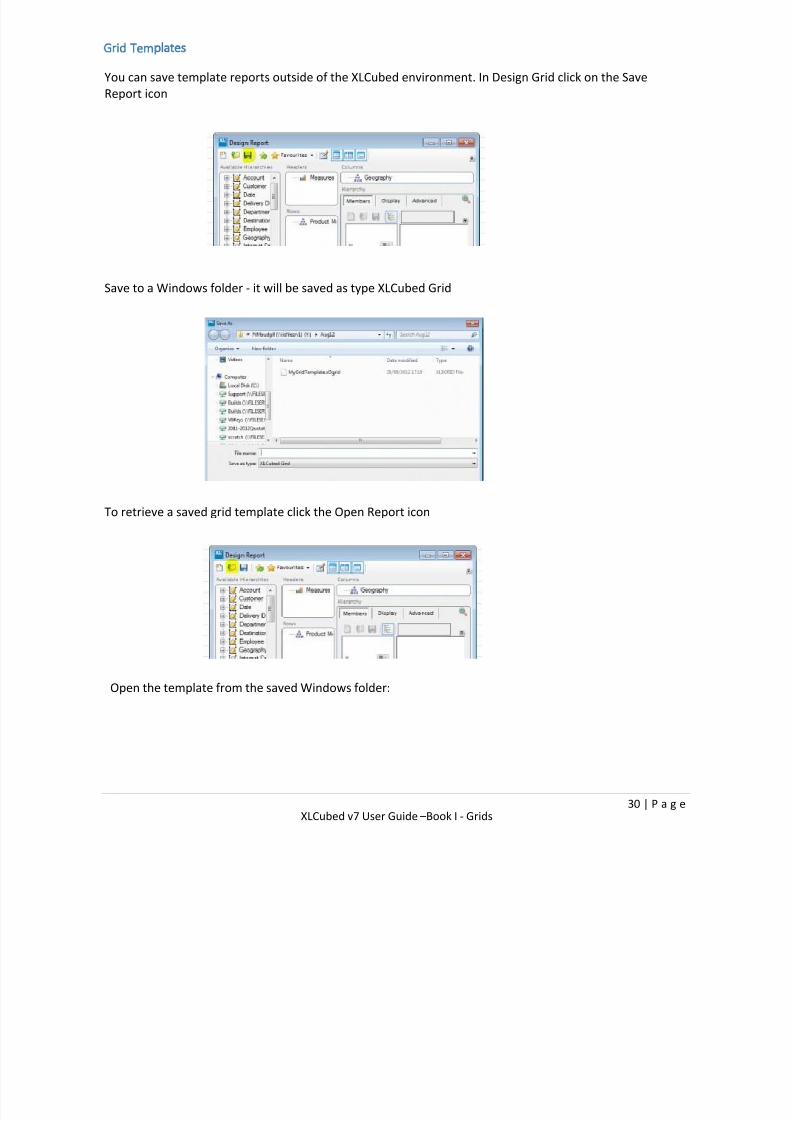
Grid Templates
You can save template reports outside of the XLCubed environment. In Design Grid click on the Save
Report icon
Save to a Windows folder - it will be saved as type XLCubed Grid
To retrieve a saved grid template click the Open Report icon
Open the template from the saved Windows folder:
7/17/2019 XL Cubed versión 7 UserGuide
http://slidepdf.com/reader/full/xl-cubed-version-7-userguide 36/567
31 | P a g e XLCubed v7 User Guide –Book I - Grids
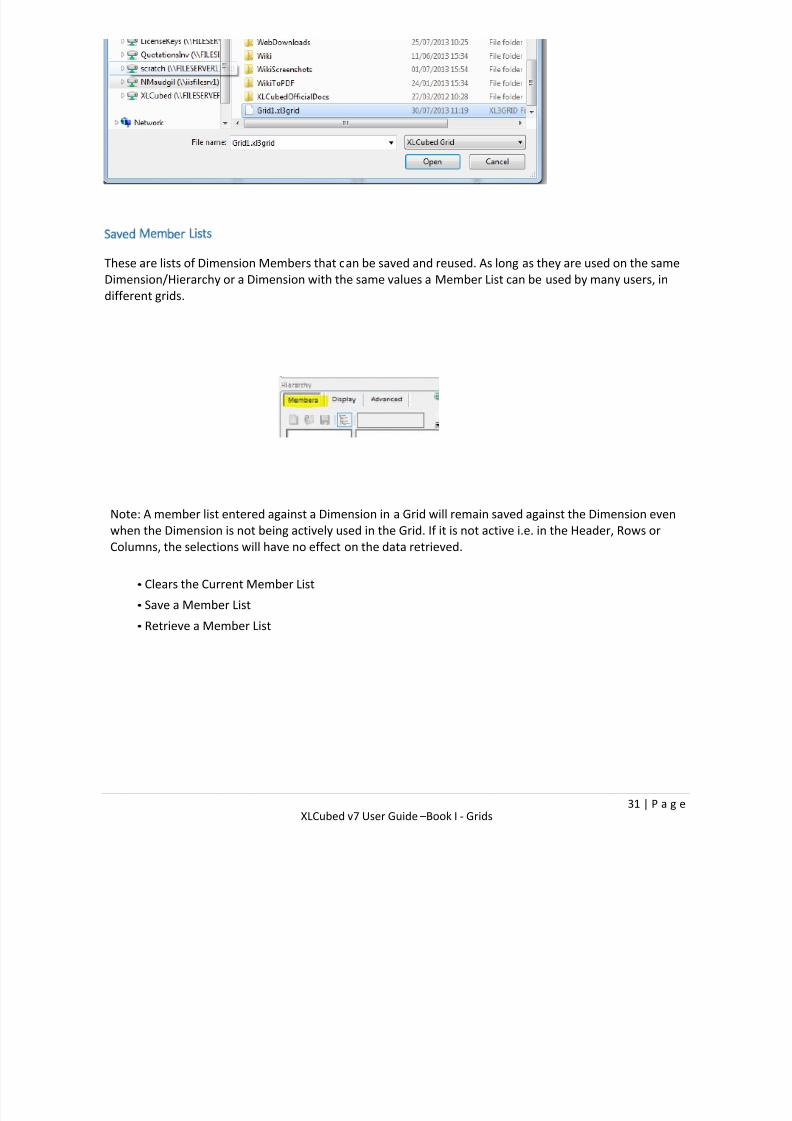
Saved Member Lists
These are lists of Dimension Members that can be saved and reused. As long as they are used on the same
Dimension/Hierarchy or a Dimension with the same values a Member List can be used by many users, in
different grids.
Note: A member list entered against a Dimension in a Grid will remain saved against the Dimension even
when the Dimension is not being actively used in the Grid. If it is not active i.e. in the Header, Rows or
Columns, the selections will have no effect on the data retrieved.
• Clears the Current Member List
• Save a Member List
• Retrieve a Member List
7/17/2019 XL Cubed versión 7 UserGuide
http://slidepdf.com/reader/full/xl-cubed-version-7-userguide 37/567
32 | P a g e XLCubed v7 User Guide –Book I - Grids
Advanced Row and Column selections
Named Sets
A named set is a Multidimensional Expressions (MDX) expression that returns a set of dimension
members. Named sets can be created at cube level or within an application such as XLCubed. They can be
created combining cube data, arithmetic operators, numbers and functions.
From v6.5 two new options, Between and Manual MDX are available on Advanced tab Member Set when
editing hierarchies.
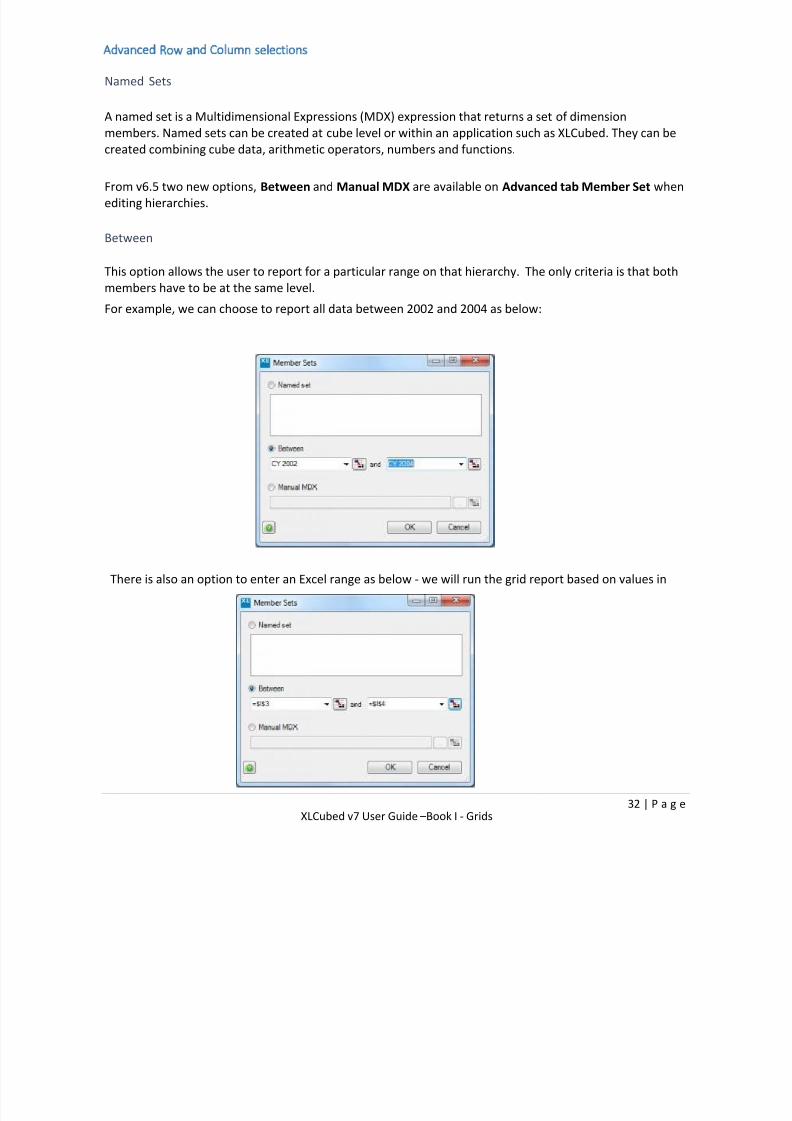
Between
This option allows the user to report for a particular range on that hierarchy. The only criteria is that both
members have to be at the same level.
For example, we can choose to report all data between 2002 and 2004 as below:
There is also an option to enter an Excel range as below - we will run the grid report based on values in

7/17/2019 XL Cubed versión 7 UserGuide
http://slidepdf.com/reader/full/xl-cubed-version-7-userguide 38/567
33 | P a g e XLCubed v7 User Guide –Book I - Grids
$I$3 and $I$4. The start range value is in $I$3 and the last range value is $I$4.
Another feature of using the range option is that you can choose to leave one of the ranges blank.
Manual MDX
This option allows you to use MDX code - click on the ellipse to the right of the Manual MDX radio
button and you will be able to enter MDX code in the following window:
For example if you only want to report CY 2002 and CY 2004 you would enter {[CY 2002], {CY 2004]} in
the Manual MDX window. You can also specify an Excel cell range as the MDX source. Once you have
defined your named set you can then select to report Descendants, Lowest Descendants or Descendants
At.

7/17/2019 XL Cubed versión 7 UserGuide
http://slidepdf.com/reader/full/xl-cubed-version-7-userguide 39/567
34 | P a g e XLCubed v7 User Guide –Book I - Grids
7/17/2019 XL Cubed versión 7 UserGuide
http://slidepdf.com/reader/full/xl-cubed-version-7-userguide 40/567
35 | P a g e XLCubed v7 User Guide –Book I - Grids
Task Pane
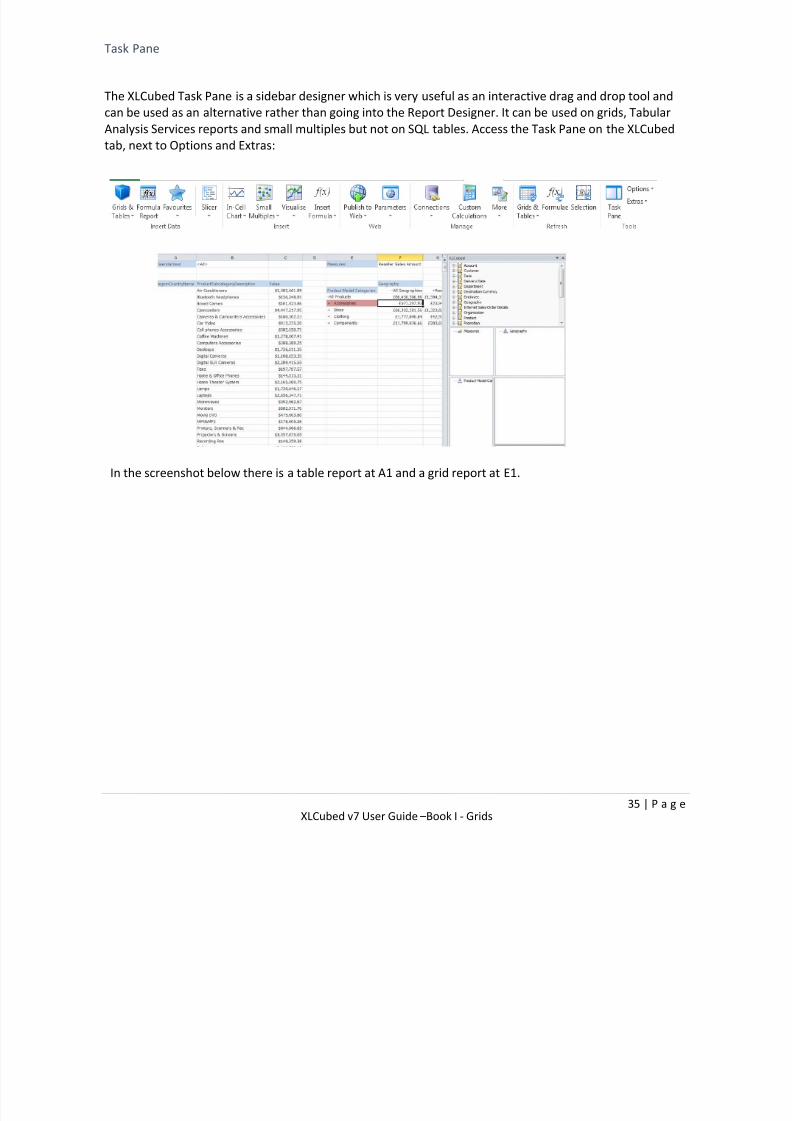
The XLCubed Task Pane is a sidebar designer which is very useful as an interactive drag and drop tool and
can be used as an alternative rather than going into the Report Designer. It can be used on grids, Tabular
Analysis Services reports and small multiples but not on SQL tables. Access the Task Pane on the XLCubed
tab, next to Options and Extras:
In the screenshot below there is a table report at A1 and a grid report at E1.

7/17/2019 XL Cubed versión 7 UserGuide
http://slidepdf.com/reader/full/xl-cubed-version-7-userguide 41/567
36 | P a g e XLCubed v7 User Guide –Book I - Grids
On the right of the screenshot is the Task Pane. The focus is currently on the grid report so the Task Pane
shows information relating to the grid: Measures on header, ProductModelCategories on rows and
Geography on columns. You can quickly drag and drop as needed. Clicking on the table report makes the
Task Pane refresh to show the table report detail instead.
Inside the Task Pane the behaviour is the same as the Report Designer. For example, clicking on a columninside the Task Pane, such as RegionCountryName displays all its members. You can also search for
members and set up criteria for which members to be retrieved.
7/17/2019 XL Cubed versión 7 UserGuide
http://slidepdf.com/reader/full/xl-cubed-version-7-userguide 42/567
37 | P a g e XLCubed v7 User Guide –Book I - Grids
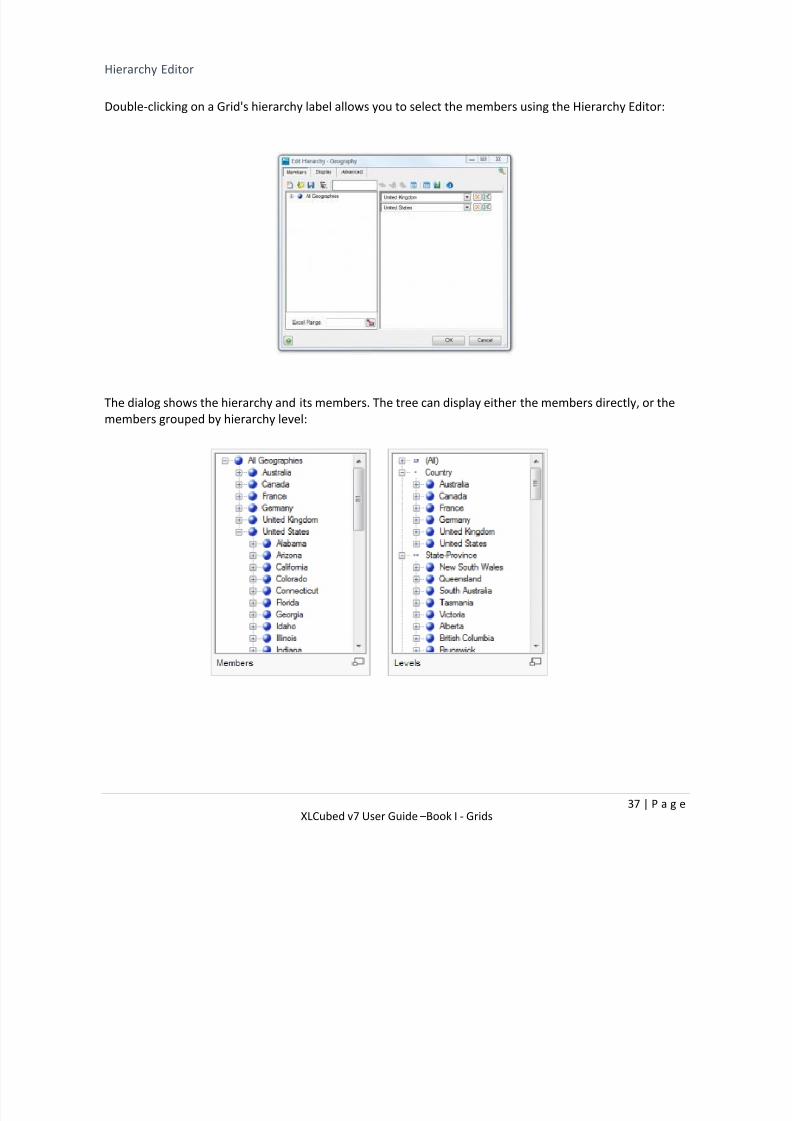
Hierarchy Editor
Double-clicking on a Grid's hierarchy label allows you to select the members using the Hierarchy Editor:
The dialog shows the hierarchy and its members. The tree can display either the members directly, or the
members grouped by hierarchy level:
7/17/2019 XL Cubed versión 7 UserGuide
http://slidepdf.com/reader/full/xl-cubed-version-7-userguide 43/567
38 | P a g e XLCubed v7 User Guide –Book I - Grids
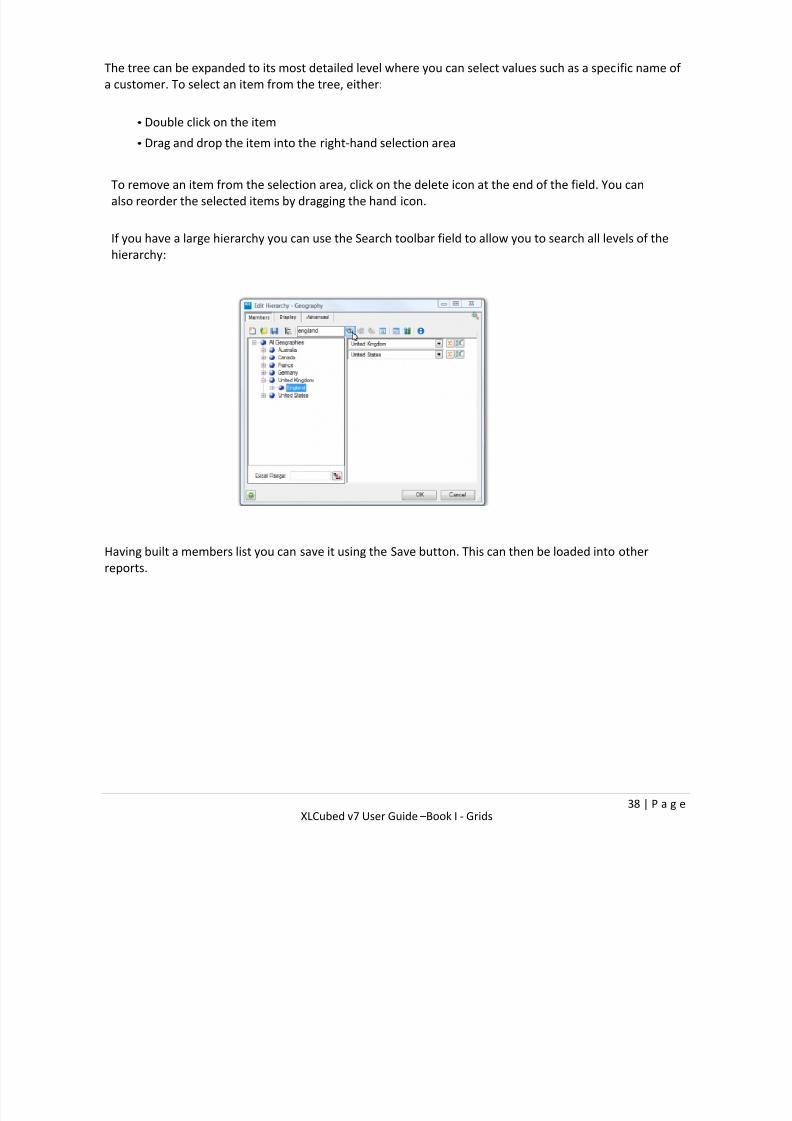
The tree can be expanded to its most detailed level where you can select values such as a specific name of
a customer. To select an item from the tree, either:
• Double click on the item
• Drag and drop the item into the right-hand selection area
To remove an item from the selection area, click on the delete icon at the end of the field. You can
also reorder the selected items by dragging the hand icon.
If you have a large hierarchy you can use the Search toolbar field to allow you to search all levels of the
hierarchy:
Having built a members list you can save it using the Save button. This can then be loaded into other
reports.
7/17/2019 XL Cubed versión 7 UserGuide
http://slidepdf.com/reader/full/xl-cubed-version-7-userguide 44/567
39 | P a g e XLCubed v7 User Guide –Book I - Grids
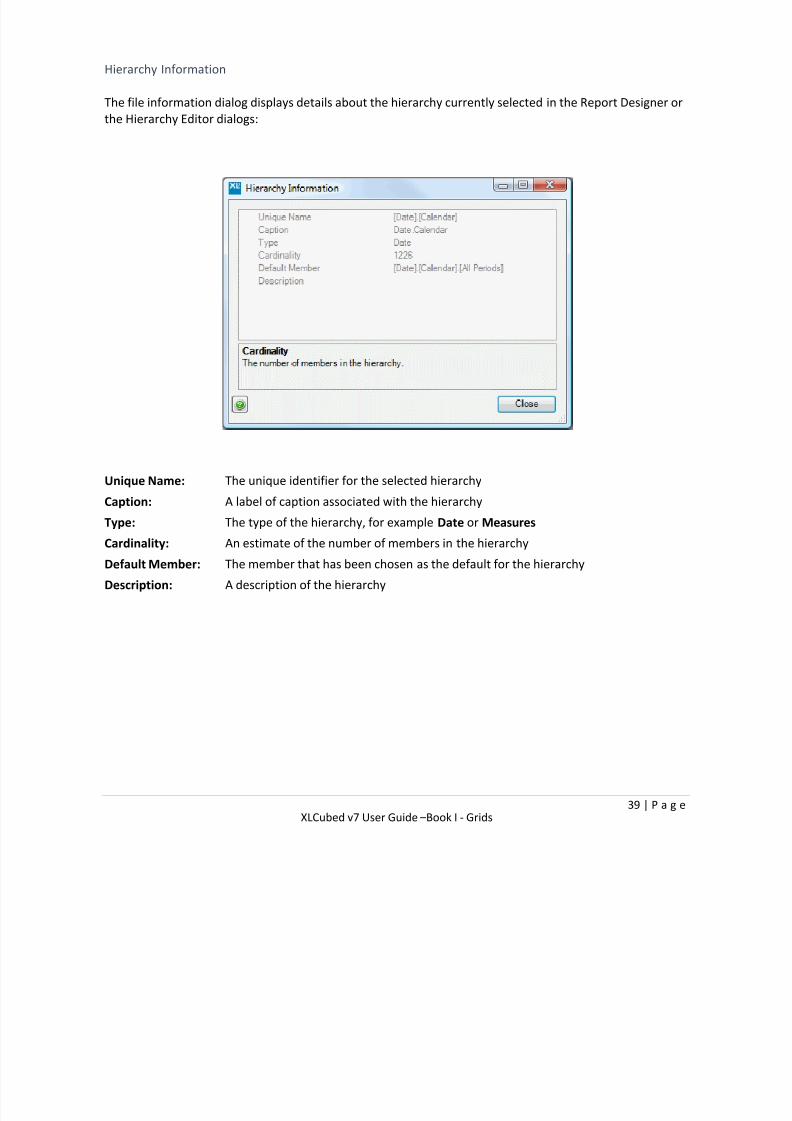
Hierarchy Information
The file information dialog displays details about the hierarchy currently selected in the Report Designer or
the Hierarchy Editor dialogs:
Unique Name: The unique identifier for the selected hierarchy
Caption: A label of caption associated with the hierarchy
Type: The type of the hierarchy, for example Date or Measures
Cardinality: An estimate of the number of members in the hierarchy
Default Member: The member that has been chosen as the default for the hierarchy
Description: A description of the hierarchy

7/17/2019 XL Cubed versión 7 UserGuide
http://slidepdf.com/reader/full/xl-cubed-version-7-userguide 45/567
40 | P a g e XLCubed v7 User Guide –Book I - Grids
Formatting Grids
In v7 formatting is available on XLCubed right-click menu as option, Format This Member.
So if we want to format Accessories row, we right-click on Accessories, XLCubed, Format This Member.
We are presented with the standard Excel Format Cells window from which we can choose any of the
usual settings to change.
We will choose Fill, select a colour and OK. The refreshed grid now looks like this:

7/17/2019 XL Cubed versión 7 UserGuide
http://slidepdf.com/reader/full/xl-cubed-version-7-userguide 46/567
41 | P a g e XLCubed v7 User Guide –Book I - Grids
The lower half of the XLCubedFormats sheet shows that both Member Accessories and associated row
data will be filled in pink.
If you do not want the data to be filled go to the XLCubedFormats sheet, right-click the Data Format cell
for Accessories and remove the fill colour by setting the backgound to 'No Colour'.
Once refreshed, the grid now looks like:

7/17/2019 XL Cubed versión 7 UserGuide
http://slidepdf.com/reader/full/xl-cubed-version-7-userguide 47/567
42 | P a g e XLCubed v7 User Guide –Book I - Grids
Formatting Rows and Columns
In v7.2 we now have the ability to set formatting on rows and/or columns for grid members. Here we have
a simple report where we have set formatting at different levels:
The format sheet looks like this:
Change the format sheet to ROWS as below:
7/17/2019 XL Cubed versión 7 UserGuide
http://slidepdf.com/reader/full/xl-cubed-version-7-userguide 48/567
43 | P a g e XLCubed v7 User Guide –Book I - Grids
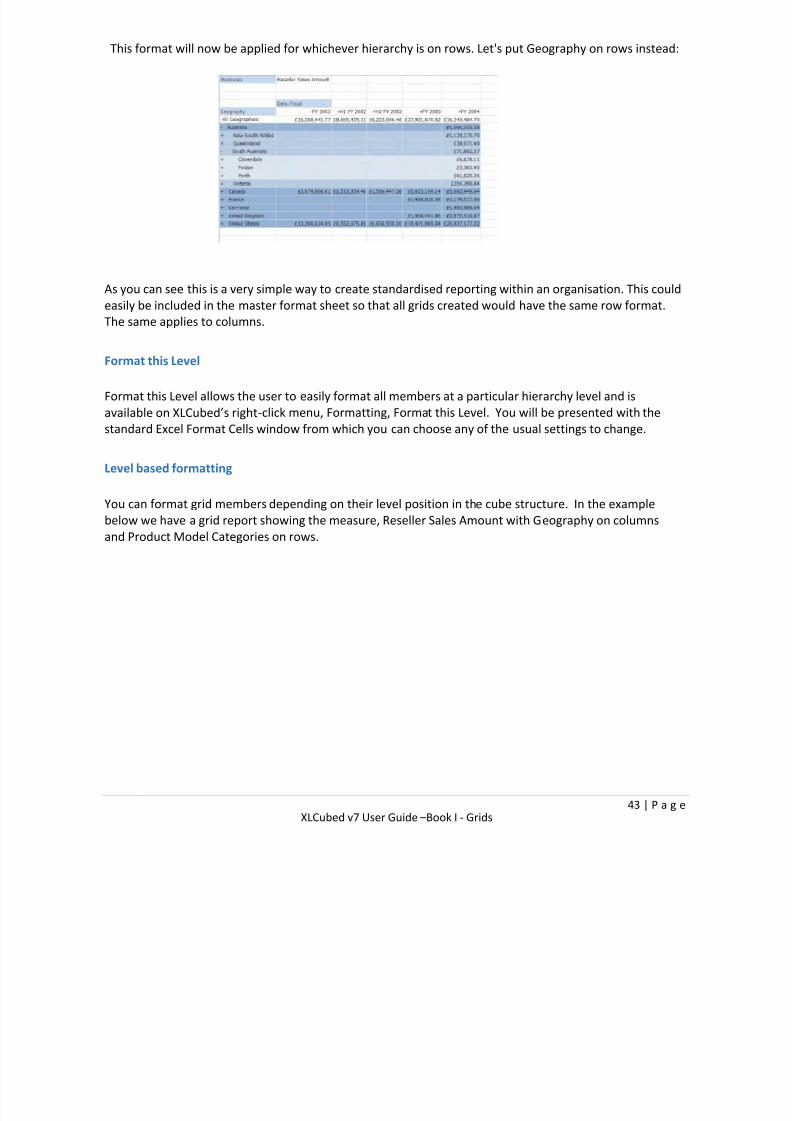
This format will now be applied for whichever hierarchy is on rows. Let's put Geography on rows instead:
As you can see this is a very simple way to create standardised reporting within an organisation. This could
easily be included in the master format sheet so that all grids created would have the same row format.
The same applies to columns.
Format this Level
Format this Level allows the user to easily format all members at a particular hierarchy level and is
available on XLCubed’s right-click menu, Formatting, Format this Level. You will be presented with the
standard Excel Format Cells window from which you can choose any of the usual settings to change.
Level based formatting
You can format grid members depending on their level position in the cube structure. In the example
below we have a grid report showing the measure, Reseller Sales Amount with Geography on columns
and Product Model Categories on rows.

7/17/2019 XL Cubed versión 7 UserGuide
http://slidepdf.com/reader/full/xl-cubed-version-7-userguide 49/567
44 | P a g e XLCubed v7 User Guide –Book I - Grids
We would like to apply some formatting on rows so that each level on the Product Model Categories
hierarchy is displayed in a different shade of blue.
We want to display All Products level in dark blue and then all levels (Category, Subcategory and Model
Name) in that hierarchy in lighter shades of blue. Make the changes to the XLCubedFormats sheet as
below:
[Dimension].[Hierarchy1]: enter the dimension and hierarchy
[Member1 Name]: rather than a member name, here we need to specify a level name. We must put the
asterisk (*) at the end of the level name to ensure that all members at that level are displayed in thedesired format. We can check the full level name by selecting a member at that level, and then going to
Grid Properties to check the MDX generated. We can also edit the hierarchy that we wish to format to
confirm the hierarchy level names.

7/17/2019 XL Cubed versión 7 UserGuide
http://slidepdf.com/reader/full/xl-cubed-version-7-userguide 50/567
45 | P a g e XLCubed v7 User Guide –Book I - Grids
The report is formatted as below:

7/17/2019 XL Cubed versión 7 UserGuide
http://slidepdf.com/reader/full/xl-cubed-version-7-userguide 51/567
46 | P a g e XLCubed v7 User Guide –Book I - Grids
Parent Child Dimensions
This method doesn’t currently support parent child dimensions as the member unique names don’t
contain the level name.
If you are using v7 onwards you can also use the syntax – LEVEL: Number eg LEVEL:3
Conditional formatting
Overview
Excel conditional formatting allows the format of a cell to change based on its value or a formula.
Conditional Formatting in Grids
Conditional formatting can be setup on specific members, by using the "Format this member" right-click
option and then adding the conditional format to the data cell for that slice on the format sheet.
Conditional formatting can be applied to the whole grid by formatting the "Data Cell" value on the formatsheet.
XLCubedWeb Edition Restrictions
XLCubedWeb is limited to 3 conditional formats per cell and only supports the conditional formatting
available in Excel 2003, that is:
Format based on cell value
7/17/2019 XL Cubed versión 7 UserGuide
http://slidepdf.com/reader/full/xl-cubed-version-7-userguide 52/567
47 | P a g e XLCubed v7 User Guide –Book I - Grids
Format based on Formula (the formula must keep all references on the same sheet as the cell being
formatted)
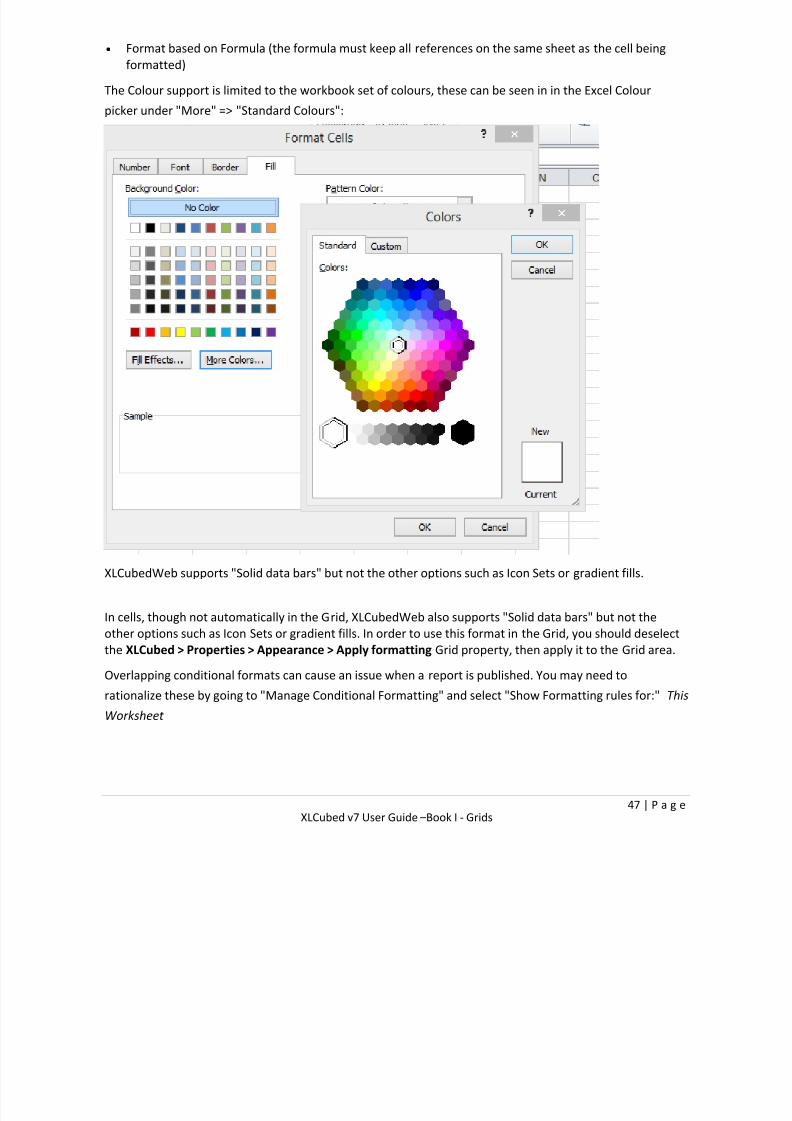
The Colour support is limited to the workbook set of colours, these can be seen in in the Excel Colour
picker under "More" => "Standard Colours":
XLCubedWeb supports "Solid data bars" but not the other options such as Icon Sets or gradient fills.
In cells, though not automatically in the Grid, XLCubedWeb also supports "Solid data bars" but not the
other options such as Icon Sets or gradient fills. In order to use this format in the Grid, you should deselect
the XLCubed > Properties > Appearance > Apply formatting Grid property, then apply it to the Grid area.
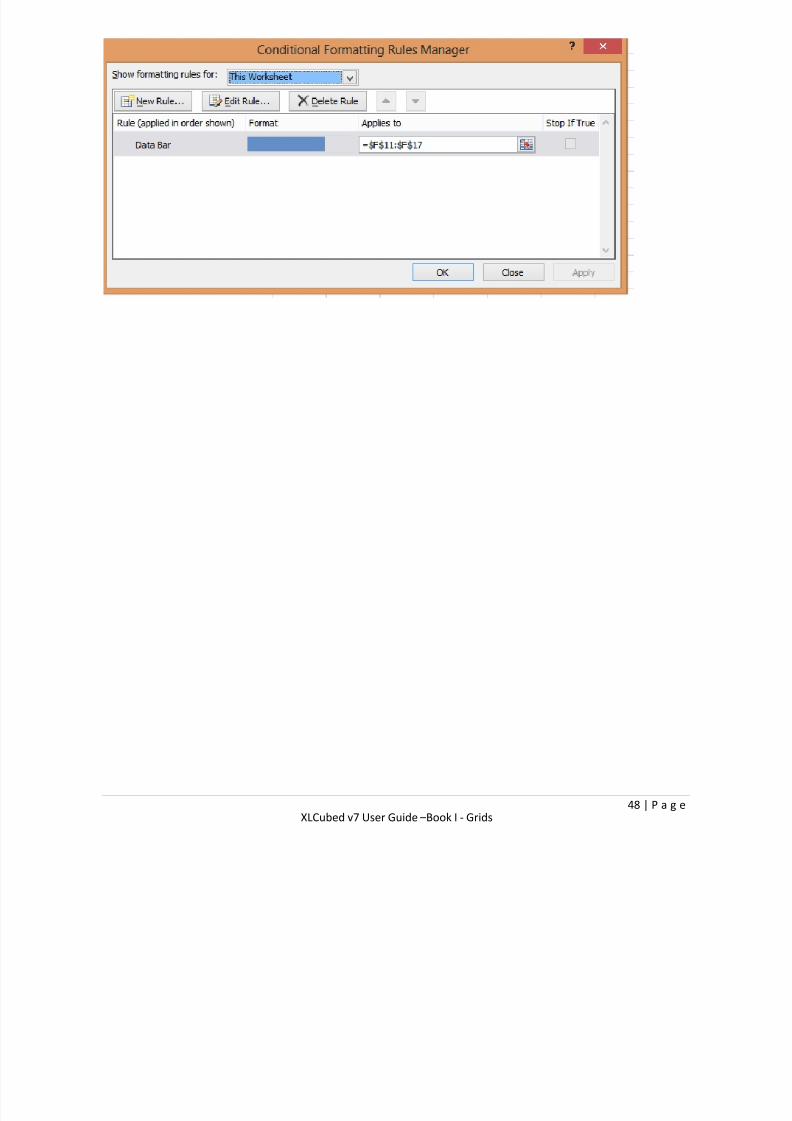
Overlapping conditional formats can cause an issue when a report is published. You may need to
rationalize these by going to "Manage Conditional Formatting" and select "Show Formatting rules for:" This
Worksheet
7/17/2019 XL Cubed versión 7 UserGuide
http://slidepdf.com/reader/full/xl-cubed-version-7-userguide 53/567
48 | P a g e XLCubed v7 User Guide –Book I - Grids

7/17/2019 XL Cubed versión 7 UserGuide
http://slidepdf.com/reader/full/xl-cubed-version-7-userguide 54/567
49 | P a g e XLCubed v7 User Guide –Book I - Grids
Drilling in Grids
Drilling up and down is probably the simplest OLAP technique to master: it is simply a way of expanding
and collapsing the cells in a Grid report to show their component parts. Row or column members can be
drilled down to show the child members on the level below, or drilled up again to hide them.
To drill down on a cell, double-click on it. The following shows what happens when you double-click on
the All Customer cell:
Double-clicking on the cell again returns the Grid to its previous state.
Drilling Options
GRIDPROPERTIES>APPEARANCE>SHOWDRILLINDICATOR
If a member is drillable, a symbol can be displayed before the member's caption:
GRIDPROPERTIES>APPEARANCE>INDENTMEMBERSWHENDRILLING
The indentation of the members in a Grid reflects what level they are on if this option is selected. The size
of indentation can also be adjusted.
Drill Across
New in Version 7.6
The drill across menu allows you to expand the grid using a dimension that isn't currently in the grid. In this
example we expand the data for 2007 by drilling into the promotions.

7/17/2019 XL Cubed versión 7 UserGuide
http://slidepdf.com/reader/full/xl-cubed-version-7-userguide 55/567
50 | P a g e XLCubed v7 User Guide –Book I - Grids
The data is filtered to 2007, and drilled into the promotions.
7/17/2019 XL Cubed versión 7 UserGuide
http://slidepdf.com/reader/full/xl-cubed-version-7-userguide 56/567
51 | P a g e XLCubed v7 User Guide –Book I - Grids
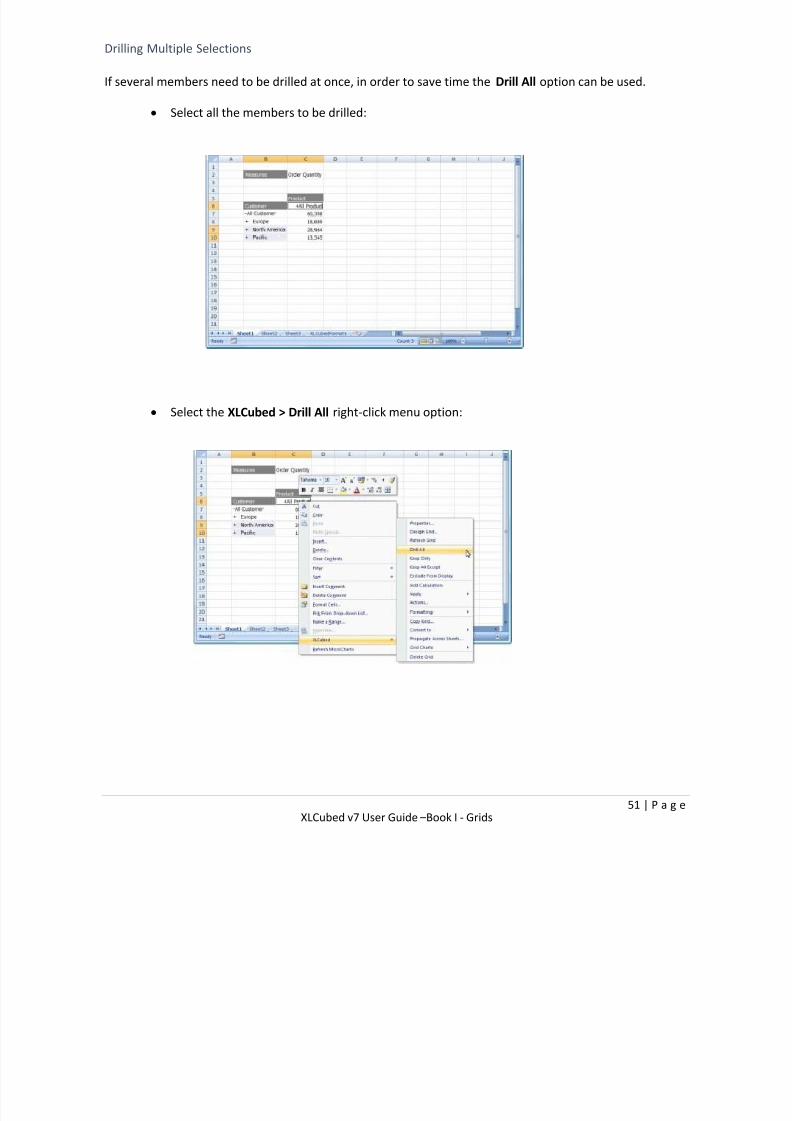
Drilling Multiple Selections
If several members need to be drilled at once, in order to save time the Drill All option can be used.
Select all the members to be drilled:
Select the XLCubed > Drill All right-click menu option:

7/17/2019 XL Cubed versión 7 UserGuide
http://slidepdf.com/reader/full/xl-cubed-version-7-userguide 57/567
52 | P a g e XLCubed v7 User Guide –Book I - Grids
All the selected members are drilled:

7/17/2019 XL Cubed versión 7 UserGuide
http://slidepdf.com/reader/full/xl-cubed-version-7-userguide 58/567
53 | P a g e XLCubed v7 User Guide –Book I - Grids
Drill Modes
When drilling down to the next level of detail contained in a hierarchy XLCubed grids can be set to behave
in one of three ways. The setting can be changed either from the grid ribbon as shown below, or in the
properties for the individual grid.
STANDARD
Standard is the default method, and is best described as Drill and Expand . In the example above, drilling
Canada will insert additional rows beneath the Canada member to show the provinces, while still
displaying the other countries. The before and after is shown below:
7/17/2019 XL Cubed versión 7 UserGuide
http://slidepdf.com/reader/full/xl-cubed-version-7-userguide 59/567
54 | P a g e XLCubed v7 User Guide –Book I - Grids
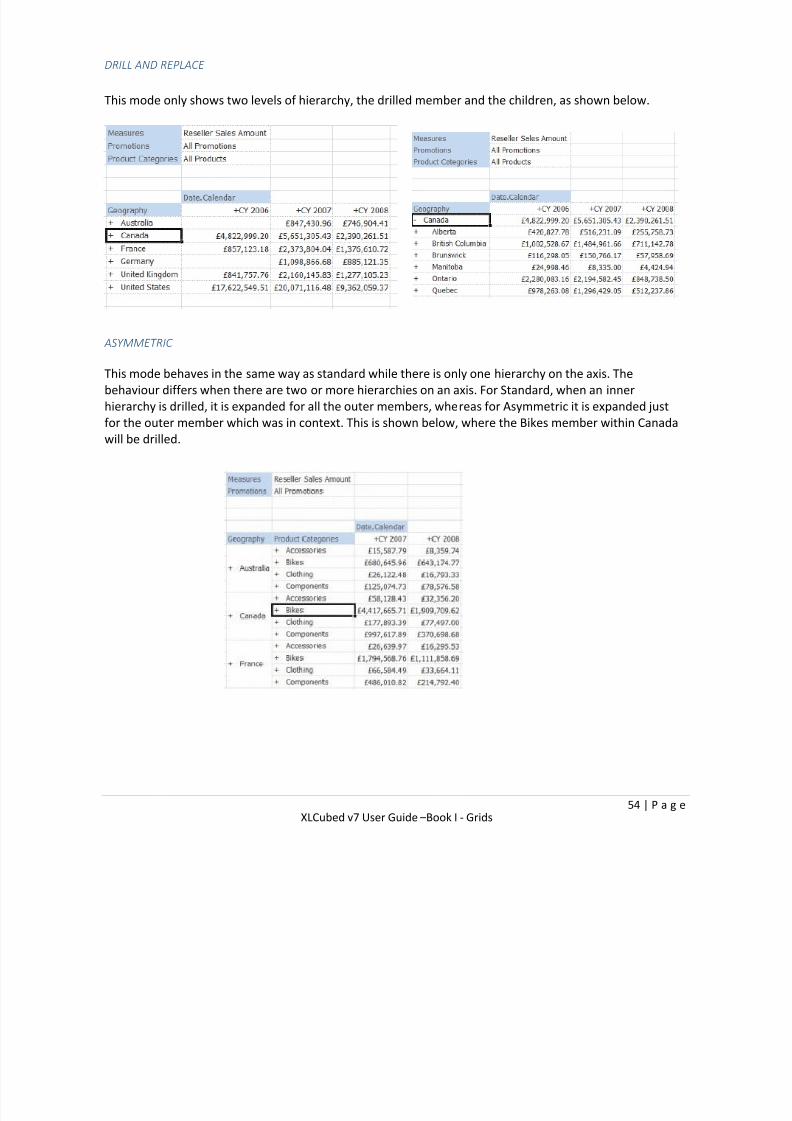
DRILLANDREPLACE
This mode only shows two levels of hierarchy, the drilled member and the children, as shown below.
ASYMMETRIC
This mode behaves in the same way as standard while there is only one hierarchy on the axis. The
behaviour differs when there are two or more hierarchies on an axis. For Standard, when an inner
hierarchy is drilled, it is expanded for all the outer members, whereas for Asymmetric it is expanded just
for the outer member which was in context. This is shown below, where the Bikes member within Canada
will be drilled.

7/17/2019 XL Cubed versión 7 UserGuide
http://slidepdf.com/reader/full/xl-cubed-version-7-userguide 60/567
55 | P a g e XLCubed v7 User Guide –Book I - Grids

7/17/2019 XL Cubed versión 7 UserGuide
http://slidepdf.com/reader/full/xl-cubed-version-7-userguide 61/567
56 | P a g e XLCubed v7 User Guide –Book I - Grids
Asymmetric Grids
ASYMMETRICGRIDS
XLCubed has three quick select options on the right click menu for a grid. Right-click menu and select Keep
followed by This Member, All Other Members or Exclude from Display.
This Member – retains just the highlighted members
All Other Members – will remove the members that are selected Exclude from Display – allows for the creation of asymmetric grids
For example you may want to display only budget for future months and only actuals for historic months.
To achieve this select the items which you want to remove, and on the right click menu select Keep -
Exclude from Display . Note this is only applicable where there are two hierarchies on the axis, and the
user must select elements from both hierarchies. In the example below January 2004 is being excluded
specifically for Australia.
Excluded items can then be viewed in two ways. If items are excluded you will see a red triangle in the
corner of the report. Hover on the cell, right-click and Axis, Edit Axis (or Clear All to delete all exclusions).
If you Edit Axis you will see this window – from here you can also delete exclusions individually or all at
once by clicking the highlighted icon:

7/17/2019 XL Cubed versión 7 UserGuide
http://slidepdf.com/reader/full/xl-cubed-version-7-userguide 62/567
57 | P a g e XLCubed v7 User Guide –Book I - Grids
You can also view and delete from the report designer via the information icon which appears on the
relevant axis as shown below on columns (highlighted in screenshot below):

7/17/2019 XL Cubed versión 7 UserGuide
http://slidepdf.com/reader/full/xl-cubed-version-7-userguide 63/567
58 | P a g e XLCubed v7 User Guide –Book I - Grids
Calculations Overview
XLCubed features a few ways to define your own calculations.
Grid Calculation Columns and Rows
Used only in Grid-based reports, Grid Calculations allow you to define your own dynamic calculations
within a Grid report.
They allow Excel formulas to be used within the Grid, based either on the visible data or on other elementson the worksheet. See the Grid Calculations section in this document for more information.
MDX Calculated Members
MDX Calculations are a simple but powerful means to manage calculated members, sets and custom MDX
commands that live in the session, and are executed on connection.
They are more involved to implement than Grid Calculations, but enable more complex and flexible
calculations.
Please see Book X – Miscellaneous and the section on MDX Calculations for more information.
XLCubed OLAP Formulae
XLCubed offers several formulas that allow you to bring Cube data into Excel. This allows you to create
complex workbooks interacting in all the sophisticated ways that Excel allows.
A more detailed description can be found in Book II - Formula Reporting.
MDX: and MDXSet: members
Grids and formulae can both refer to an MDX: calculation defined in an Excel cell. In addition, Grids can useMDXSet: in an Excel cell to define a named set. Information can be found in the section on Mdx in Book X –
Miscellaneous and also XL3Member in Book II – Formula Reporting.
Grid Calculations
The Add Calculation option is available on the Grid's right mouse button pop-up menu.
For example, if you have the Time hierarchy on the columns and right click to add a Grid Calculation to Q2
you can add an additional Q2-Q1 delta column to the Grid. The column is inserted as an empty column towhich you can add a title and formula. The formula can be typed into any of the cells, and will be
propagated to all the other cells in the row or column automatically.
This column will be automatically refreshed as you drill or swap dimensions.
You can view or delete the inserted rows/columns on the XLCubed > Calculation > Manage Calculations
form.
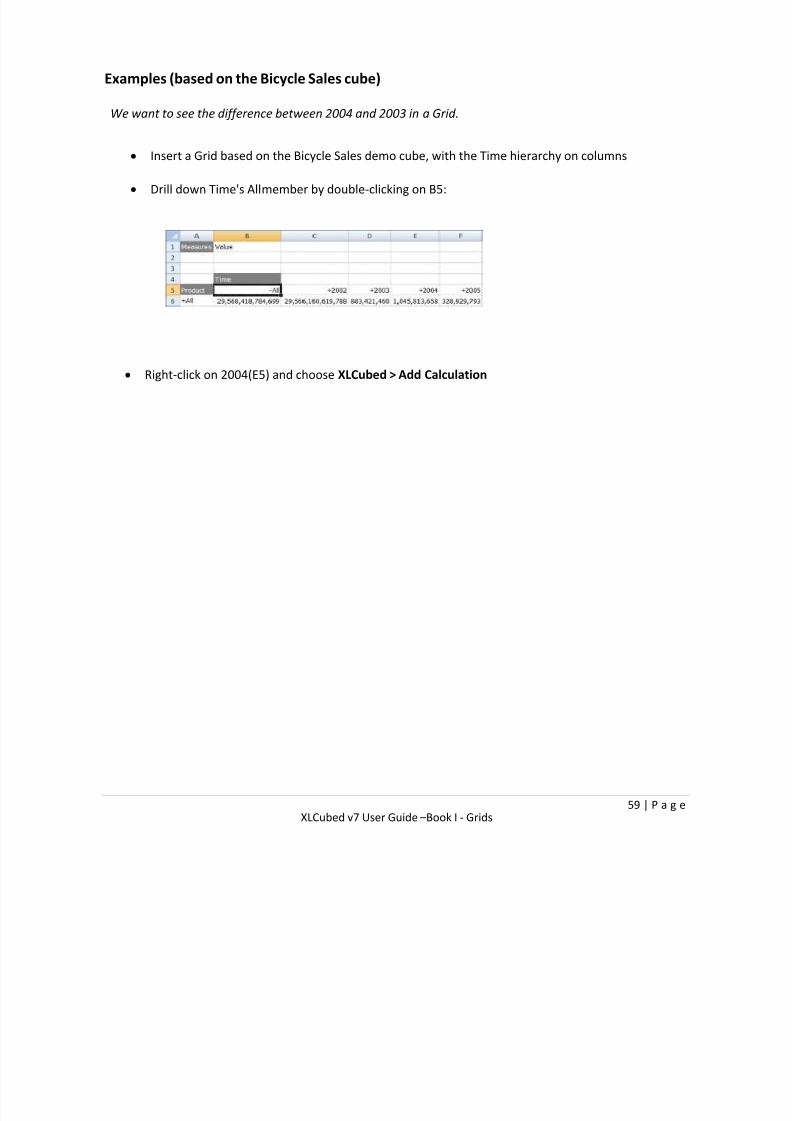
7/17/2019 XL Cubed versión 7 UserGuide
http://slidepdf.com/reader/full/xl-cubed-version-7-userguide 64/567
59 | P a g e XLCubed v7 User Guide –Book I - Grids
Examples (based on the Bicycle Sales cube)
We want to see the difference between 2004 and 2003 in a Grid.
Insert a Grid based on the Bicycle Sales demo cube, with the Time hierarchy on columns
Drill down Time's Allmember by double-clicking on B5:
Right-click on 2004(E5) and choose XLCubed > Add Calculation
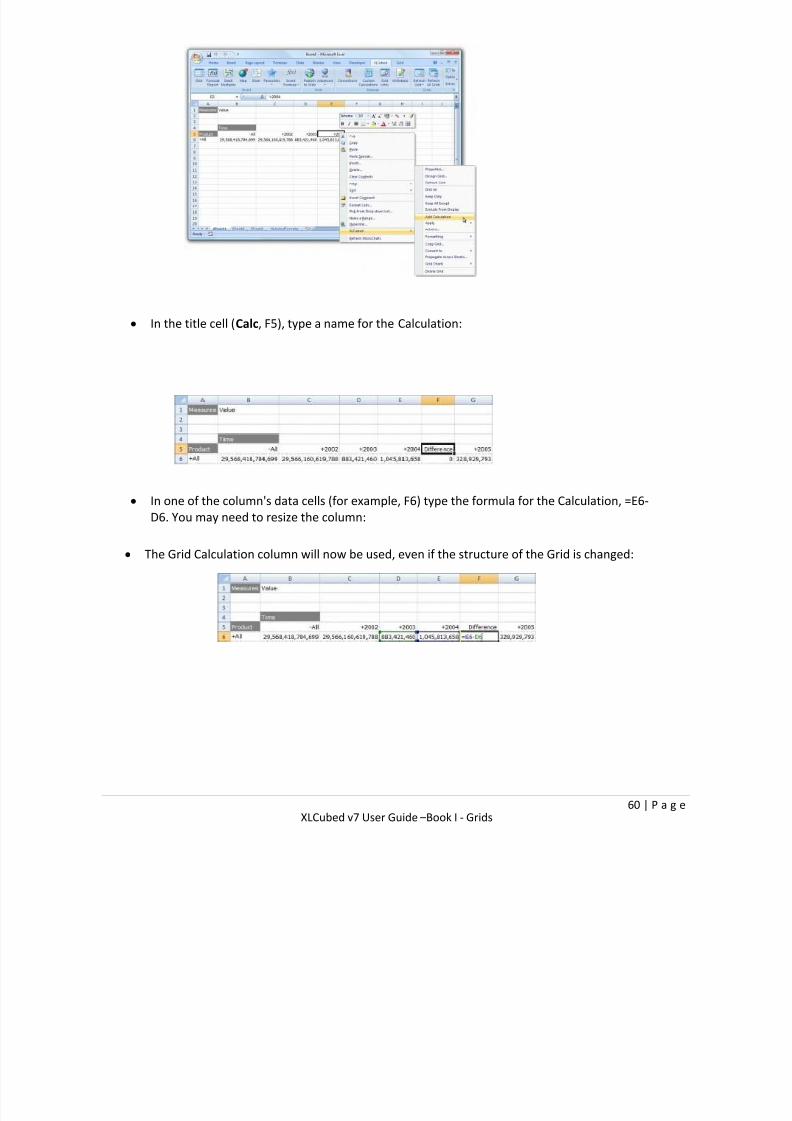
7/17/2019 XL Cubed versión 7 UserGuide
http://slidepdf.com/reader/full/xl-cubed-version-7-userguide 65/567
60 | P a g e XLCubed v7 User Guide –Book I - Grids
In the title cell (Calc, F5), type a name for the Calculation:
In one of the column's data cells (for example, F6) type the formula for the Calculation, =E6-D6. You may need to resize the column:
The Grid Calculation column will now be used, even if the structure of the Grid is changed:

7/17/2019 XL Cubed versión 7 UserGuide
http://slidepdf.com/reader/full/xl-cubed-version-7-userguide 66/567
61 | P a g e XLCubed v7 User Guide –Book I - Grids
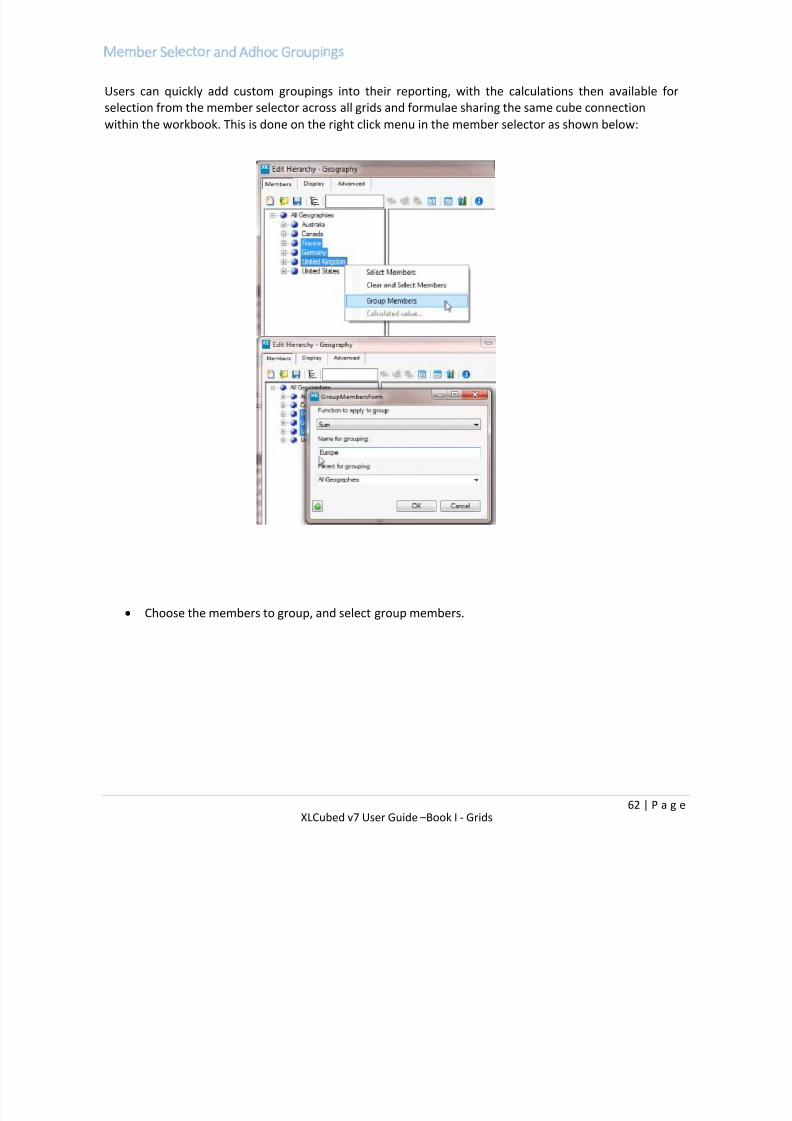
7/17/2019 XL Cubed versión 7 UserGuide
http://slidepdf.com/reader/full/xl-cubed-version-7-userguide 67/567
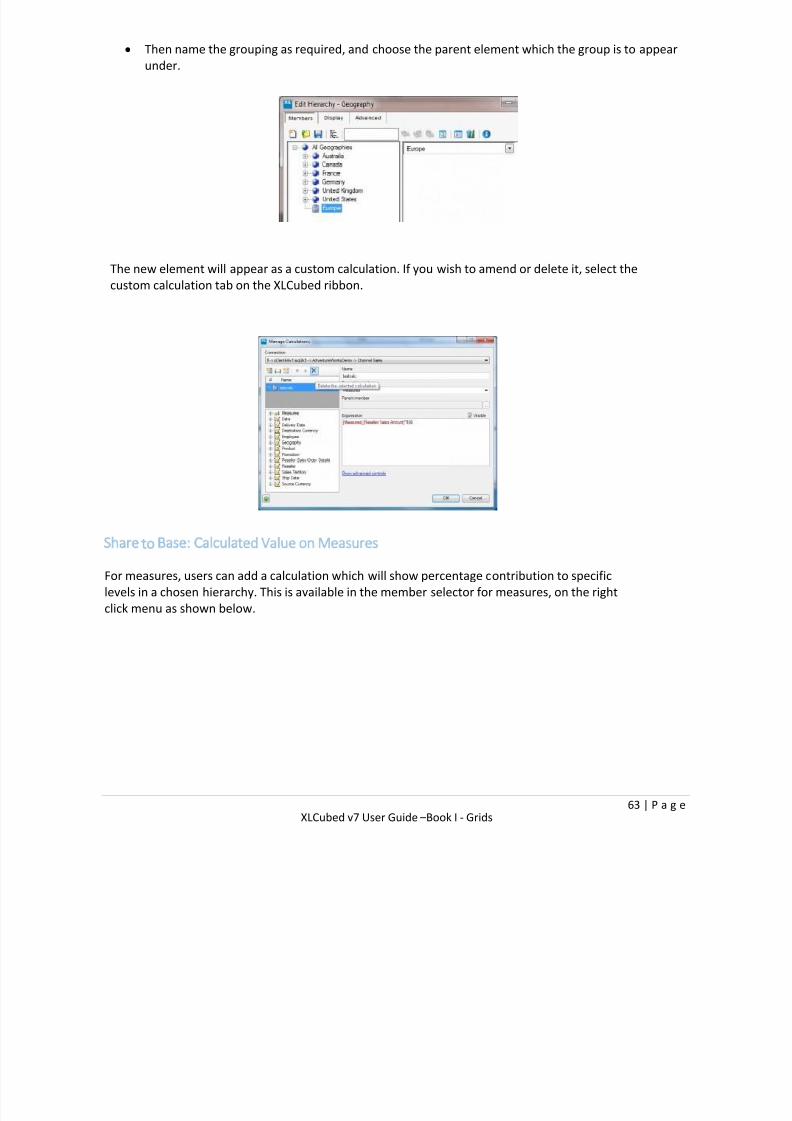
7/17/2019 XL Cubed versión 7 UserGuide
http://slidepdf.com/reader/full/xl-cubed-version-7-userguide 68/567
63 | P a g e XLCubed v7 User Guide –Book I - Grids
Then name the grouping as required, and choose the parent element which the group is to appear
under.
The new element will appear as a custom calculation. If you wish to amend or delete it, select the
custom calculation tab on the XLCubed ribbon.
Share to Base: Calculated Value on Measures
For measures, users can add a calculation which will show percentage contribution to specific
levels in a chosen hierarchy. This is available in the member selector for measures, on the right
click menu as shown below.
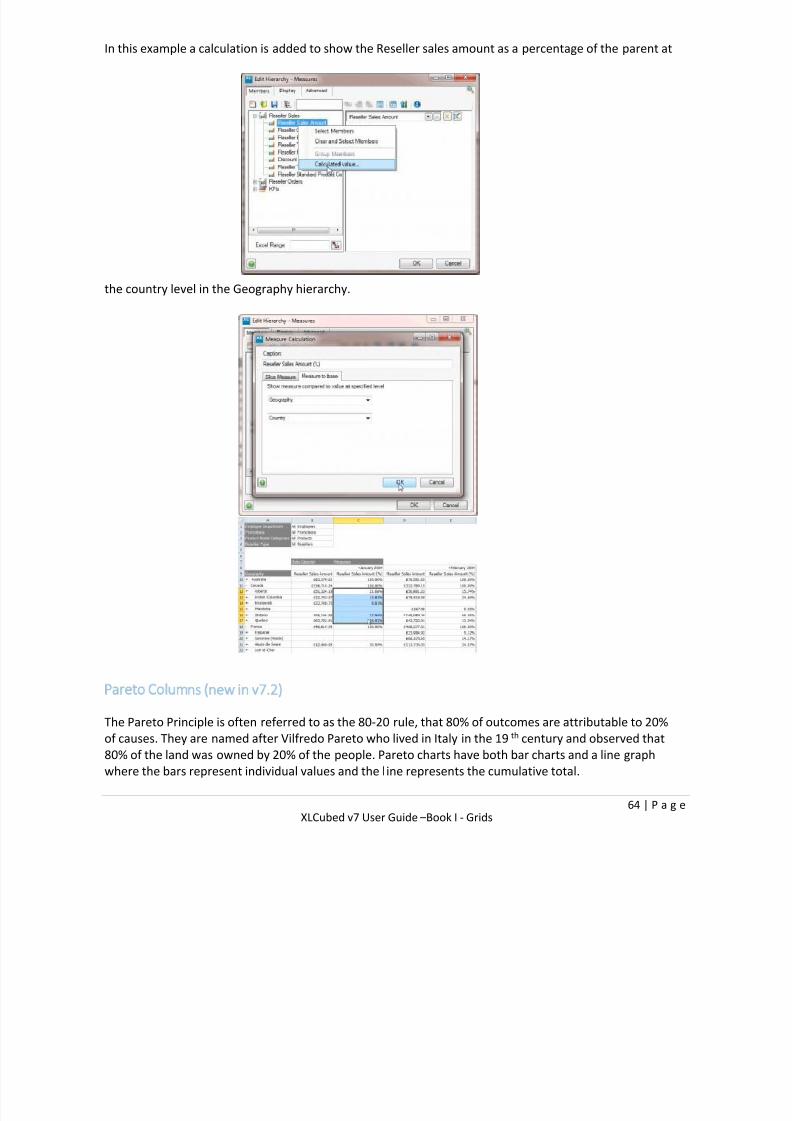
7/17/2019 XL Cubed versión 7 UserGuide
http://slidepdf.com/reader/full/xl-cubed-version-7-userguide 69/567
64 | P a g e XLCubed v7 User Guide –Book I - Grids
In this example a calculation is added to show the Reseller sales amount as a percentage of the parent at
the country level in the Geography hierarchy.
Pareto Columns (new in v7.2)
The Pareto Principle is often referred to as the 80-20 rule, that 80% of outcomes are attributable to 20%
of causes. They are named after Vilfredo Pareto who lived in Italy in the 19th century and observed that
80% of the land was owned by 20% of the people. Pareto charts have both bar charts and a line graph
where the bars represent individual values and the l ine represents the cumulative total.

7/17/2019 XL Cubed versión 7 UserGuide
http://slidepdf.com/reader/full/xl-cubed-version-7-userguide 70/567
65 | P a g e XLCubed v7 User Guide –Book I - Grids
To use Pareto Charts from XLCubed, within a grid, right-click on the column header to access XLCubed’s
right-click menu, Grid Charts and Add Pareto Analysis.
Take this simple grid showing Reseller Sales for Product Model Categories for Canadian cities:
Right-clicking on All Products to Add Pareto Analysis brings up this window:
Click OK to return to the workbook and you will see that we have a chart showing that the top 9 cities
provide some 80% of the sales.

7/17/2019 XL Cubed versión 7 UserGuide
http://slidepdf.com/reader/full/xl-cubed-version-7-userguide 71/567
66 | P a g e XLCubed v7 User Guide –Book I - Grids
You could also include the rolling total and percentage in your Pareto Chart.
Notice that we now also have some extra columns on the grid showing the cumulative total of all
sales, the sales percentage per category and the cumulative percentage.
So that's Pareto Charts - in a nutshell, an easy to use graphical tool which ties directly into dynamic
XLCubed grids.
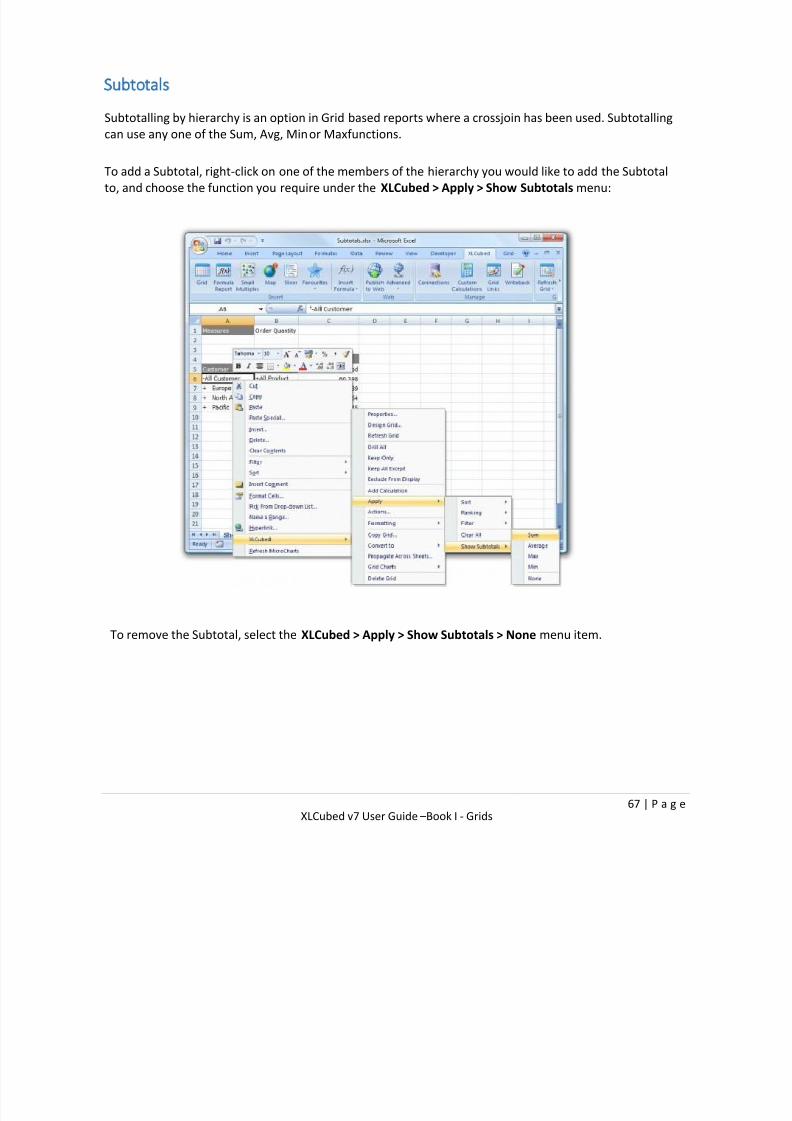
7/17/2019 XL Cubed versión 7 UserGuide
http://slidepdf.com/reader/full/xl-cubed-version-7-userguide 72/567
67 | P a g e XLCubed v7 User Guide –Book I - Grids
Subtotals
Subtotalling by hierarchy is an option in Grid based reports where a crossjoin has been used. Subtotalling
can use any one of the Sum, Avg, Minor Maxfunctions.
To add a Subtotal, right-click on one of the members of the hierarchy you would like to add the Subtotal
to, and choose the function you require under the XLCubed > Apply > Show Subtotals menu:
To remove the Subtotal, select the XLCubed > Apply > Show Subtotals > None menu item.
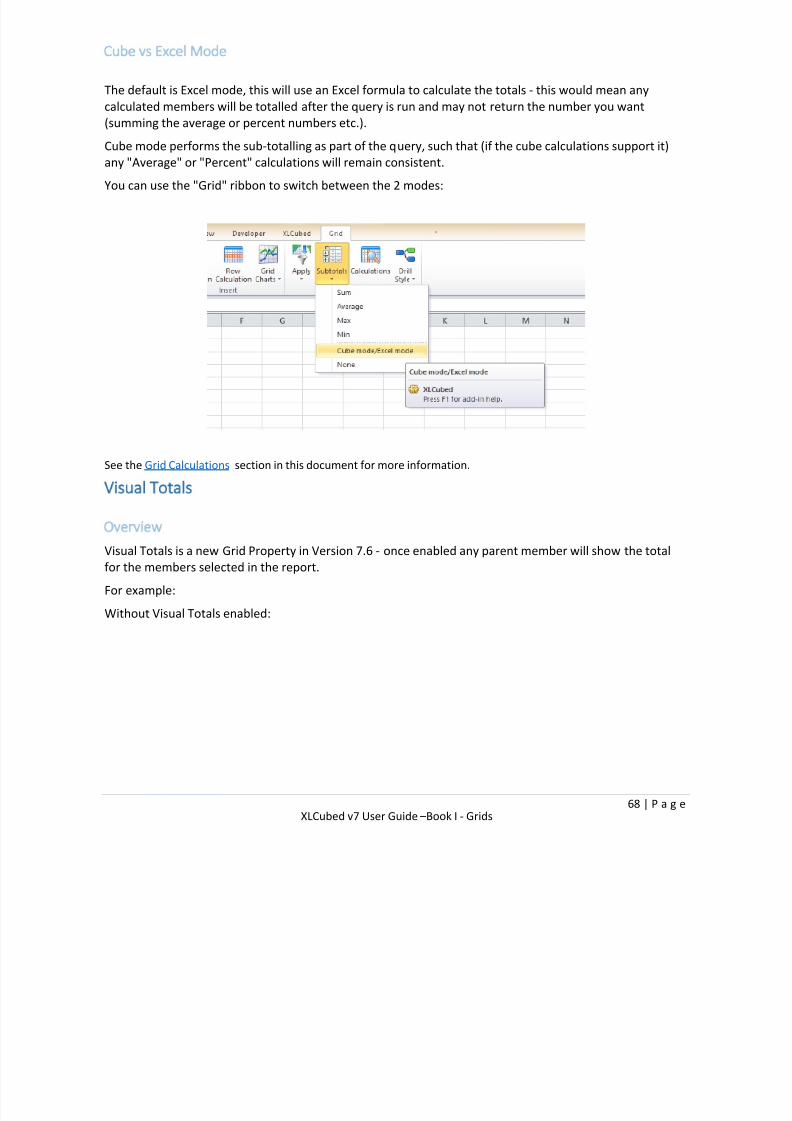
7/17/2019 XL Cubed versión 7 UserGuide
http://slidepdf.com/reader/full/xl-cubed-version-7-userguide 73/567
68 | P a g e XLCubed v7 User Guide –Book I - Grids
Cube vs Excel Mode
The default is Excel mode, this will use an Excel formula to calculate the totals - this would mean any
calculated members will be totalled after the query is run and may not return the number you want
(summing the average or percent numbers etc.).
Cube mode performs the sub-totalling as part of the query, such that (if the cube calculations support it)
any "Average" or "Percent" calculations will remain consistent.You can use the "Grid" ribbon to switch between the 2 modes:
See the Grid Calculations section in this document for more information.
Visual Totals
Overview
Visual Totals is a new Grid Property in Version 7.6 - once enabled any parent member will show the total
for the members selected in the report.
For example:
Without Visual Totals enabled:
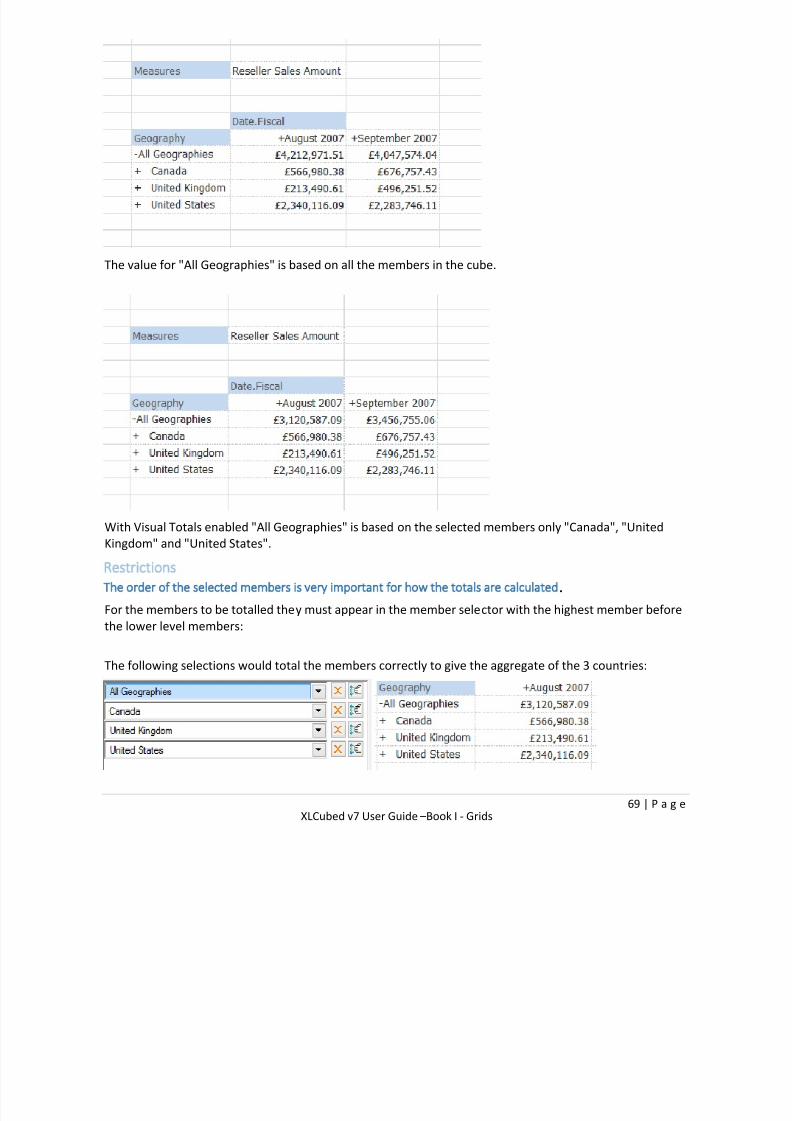
7/17/2019 XL Cubed versión 7 UserGuide
http://slidepdf.com/reader/full/xl-cubed-version-7-userguide 74/567
69 | P a g e XLCubed v7 User Guide –Book I - Grids
The value for "All Geographies" is based on all the members in the cube.
With Visual Totals enabled "All Geographies" is based on the selected members only "Canada", "United
Kingdom" and "United States".
Restrictions
The order of the selected members is very important for how the totals are calculated .
For the members to be totalled they must appear in the member selector with the highest member before
the lower level members:
The following selections would total the members correctly to give the aggregate of the 3 countries:

7/17/2019 XL Cubed versión 7 UserGuide
http://slidepdf.com/reader/full/xl-cubed-version-7-userguide 75/567
70 | P a g e XLCubed v7 User Guide –Book I - Grids
This example would display the real total for "All Geographies" as it appears underneath its children:
So the following example would give the total for France:
You cannot include the Parent or Ancestor members twice
If you try to include "All Geographies" twice - it will not work be displayed with visual totals enabled (even
if you try using Unions). This is a restriction with Analysis Services
Visual totals are calculated before Sorting and Unions
This means that if you want to display the Visual Total for "All Geographies", you can do this using the
"Reverse" sort:

7/17/2019 XL Cubed versión 7 UserGuide
http://slidepdf.com/reader/full/xl-cubed-version-7-userguide 76/567
71 | P a g e XLCubed v7 User Guide –Book I - Grids
This only works if you just have a single member selection and no ranking,filter or exclusions
Visual totals work only with unsorted ranking and filter
So you could setup to show the top 3 countries and the totals:

7/17/2019 XL Cubed versión 7 UserGuide
http://slidepdf.com/reader/full/xl-cubed-version-7-userguide 77/567
72 | P a g e XLCubed v7 User Guide –Book I - Grids
Note we use top 4 to include "All Geographies" and then the top 3 countries
But you couldn't then sort this result to show the total at the bottom.

7/17/2019 XL Cubed versión 7 UserGuide
http://slidepdf.com/reader/full/xl-cubed-version-7-userguide 78/567
73 | P a g e XLCubed v7 User Guide –Book I - Grids
Actions
Actions defined in the Cube can launch applications, perform Drillthroughs, etc.
To launch an Action, right-click the cell in the Grid that you want to launch the Action from and select
XLCubed > Actions....
The following Analysis Services Action types are supported:
• URL
• HTML
• Application
• Drillthrough (2005 and later)
Outlier Grouping
Outlier Grouping allows the user to display a subset of selected members into a common set, often called “Others”.
For more information see Book VI – Ranking, Sorting & Filtering

7/17/2019 XL Cubed versión 7 UserGuide
http://slidepdf.com/reader/full/xl-cubed-version-7-userguide 79/567
74 | P a g e XLCubed v7 User Guide –Book I - Grids
Named Ranges
From Version 7.6, XLCubed allows the automatic creation of named ranges based on parts of the Grid or
Table. This simplifies many interactions between Excel and XLCubed, such as formulae or charts based on
XLCubed ranges. The feature can be found on the Grid Properties or Table Properties form, on
the Interaction tab. From here, you can see and edit existing ranges or set up new ones.
Named Range properties for Grids
Name
The name to give the named range; this is used to refer to the range in formulae and the chart dialogs
Scope
Where the named range is recognised - either all over the workbook, or tied to the Grid worksheet (for
example, Sheet1!MyRange)
Whole Grid - Members and data
The named range covers all members and data in the entire Grid
Whole Grid - DataThe named range covers all the data in the Grid
Members - Axis
The named range covers the members on the specified axis
Members - Hierarchy
The named range covers the members belonging to the specified hierarchy
Slice - Members and data
The named range covers the members and data belonging to the specified slice
Slice - Members
The named range covers the members belonging to the specified slice
Slice - Data
The named range covers the data belonging to the specified slice
Named Range properties for Tables
Name
The name to give the named range; this is used to refer to the range in formulae and the chart dialogs
Scope
Where the named range is recognised - either all over the workbook, or tied to the Table worksheet (for
example, Sheet1!MyRange)
Table - Headers and data
The named range covers all headers and data in the entire Table
Table - Headers
The named range covers all headers in the entire Table
Table - Data
The named range covers all the data in the Table
Columns - Headers and data
The named range covers the headers and data belonging to the specified column

7/17/2019 XL Cubed versión 7 UserGuide
http://slidepdf.com/reader/full/xl-cubed-version-7-userguide 80/567
75 | P a g e XLCubed v7 User Guide –Book I - Grids
Columns - Headers
The named range covers the headers belonging to the specified column
Columns - Data
The named range covers the data belonging to the specified column
Example: Calculating an average of all the data shown in the Grid
Add a new named range with the following properties:
1. Name: GridData
2. Scope: Workbook
3. Whole Grid - Data
The formula =Average(GridData) placed anywhere in the workbook will now calculate the average
value of the Grid.
Example: Charting all the data shown for Calendar Year 2002 in the Grid
Based on the Adventure Works demo cube
Create a Grid with the years across columns, and Products on rows & then add three named ranges.
Named ranges are added through the Grid Properties, Interaction tab:
Add a new named range with the following properties:
1. Name: CY2002Members
2. Scope: Workbook
3. Slice - Members, then add Date Calendar - CY 2002 to the slice

7/17/2019 XL Cubed versión 7 UserGuide
http://slidepdf.com/reader/full/xl-cubed-version-7-userguide 81/567
76 | P a g e XLCubed v7 User Guide –Book I - Grids
Add a new named range with the following properties:
1. Name: CY2002Data
2. Scope: Workbook
3. Slice - Data, then add Date Calendar - CY 2002 to the slice
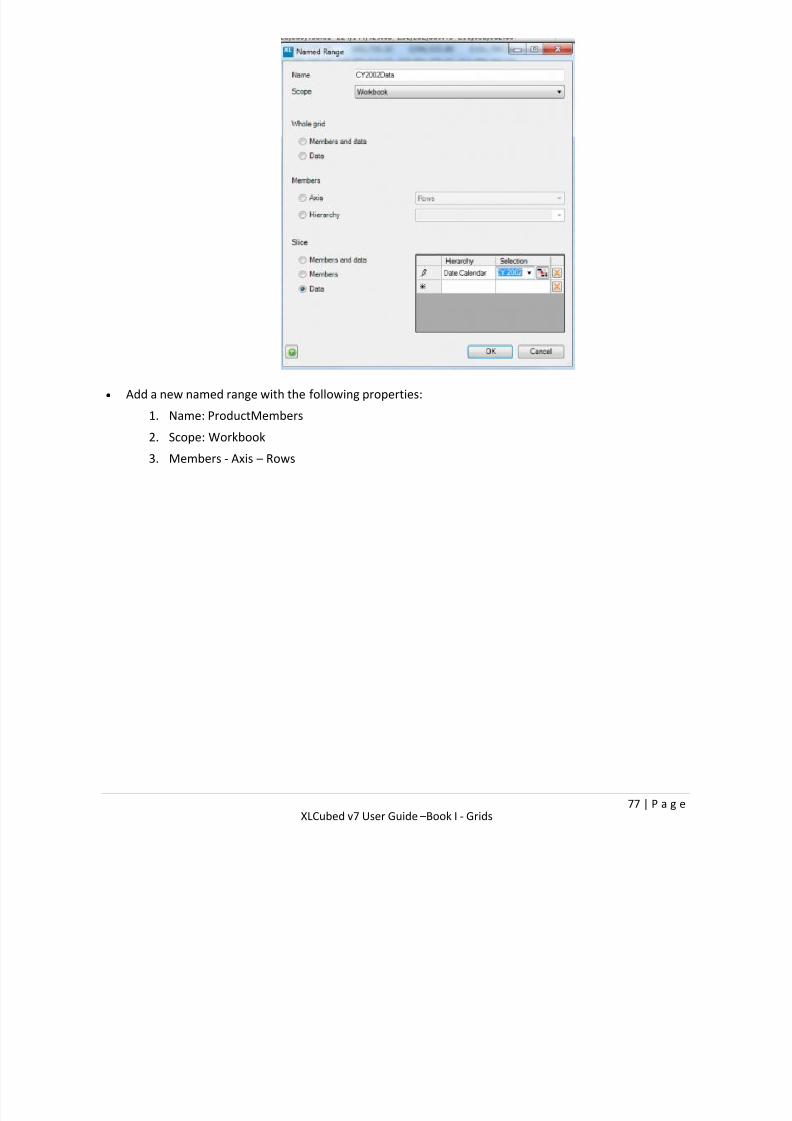
7/17/2019 XL Cubed versión 7 UserGuide
http://slidepdf.com/reader/full/xl-cubed-version-7-userguide 82/567
77 | P a g e XLCubed v7 User Guide –Book I - Grids
Add a new named range with the following properties:
1. Name: ProductMembers
2. Scope: Workbook
3. Members - Axis – Rows
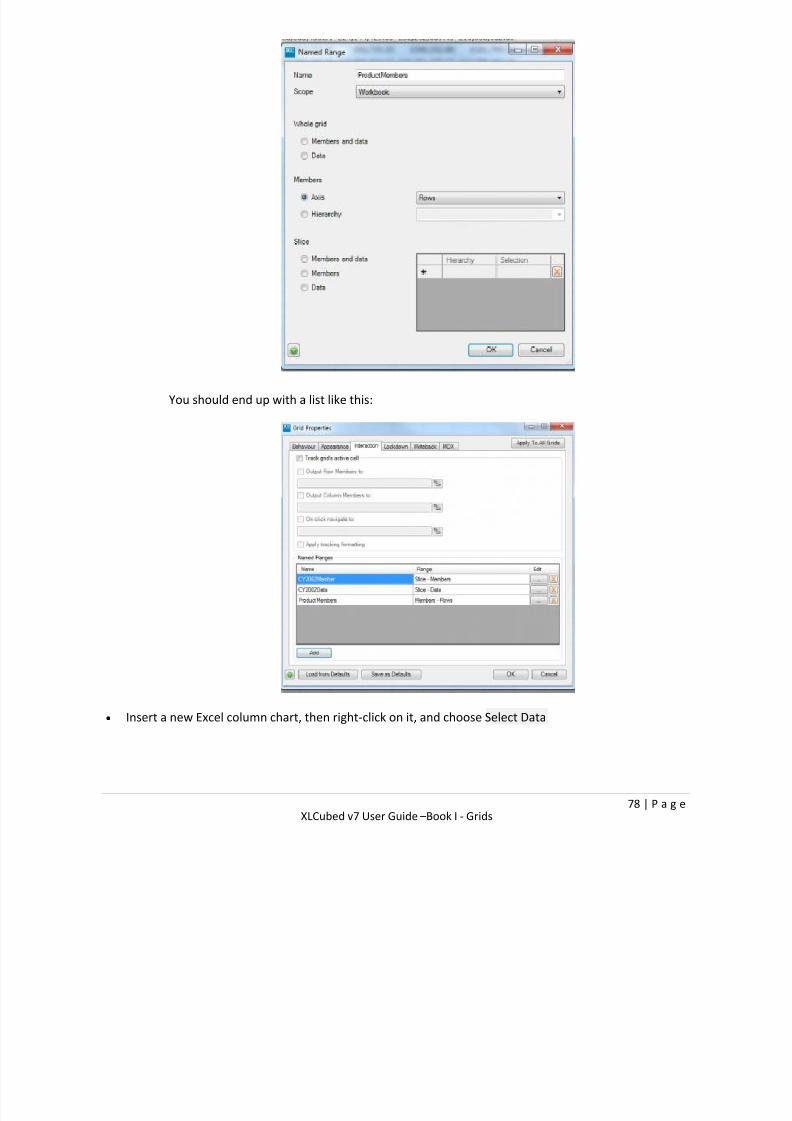
7/17/2019 XL Cubed versión 7 UserGuide
http://slidepdf.com/reader/full/xl-cubed-version-7-userguide 83/567
78 | P a g e XLCubed v7 User Guide –Book I - Grids
You should end up with a list like this:
Insert a new Excel column chart, then right-click on it, and choose Select Data

7/17/2019 XL Cubed versión 7 UserGuide
http://slidepdf.com/reader/full/xl-cubed-version-7-userguide 84/567
79 | P a g e XLCubed v7 User Guide –Book I - Grids
Add a Legend Entry (Series) as Series name: =Sheet1!CY2002Members; Series
values: =Sheet1!CY2002Data
Edit the Horizontal category labels to =Sheet1!ProductMembers and click OK
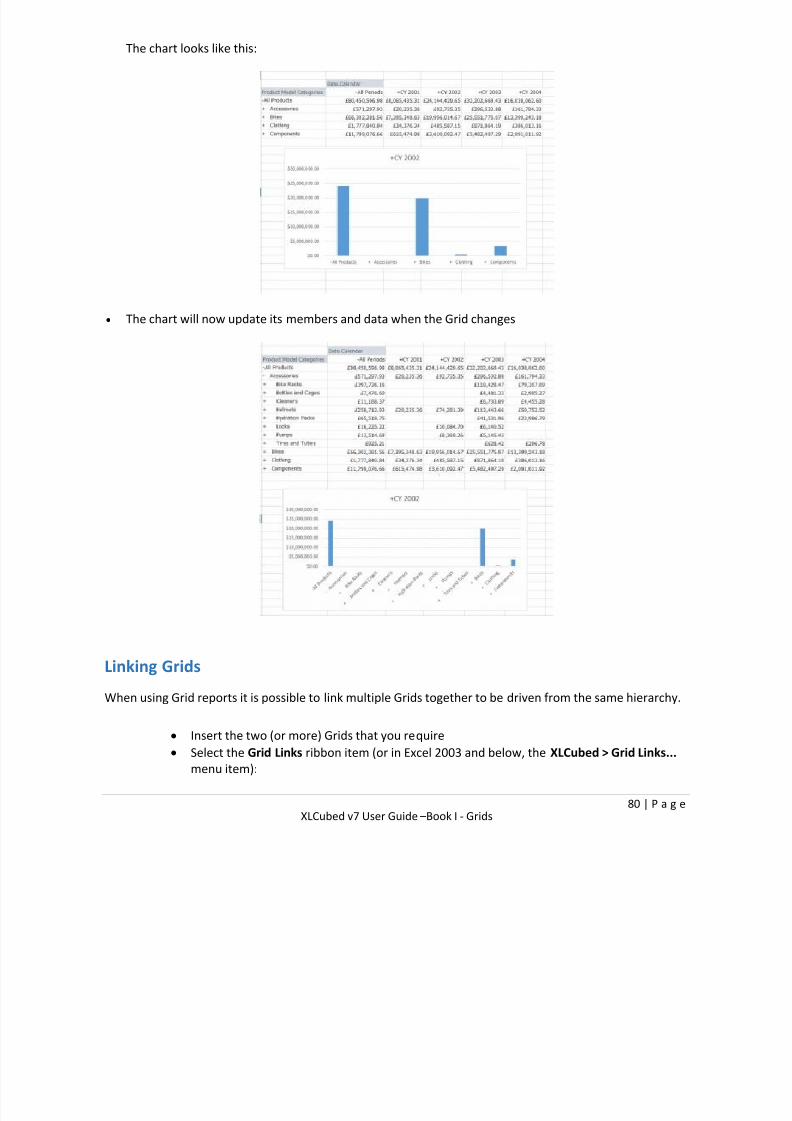
7/17/2019 XL Cubed versión 7 UserGuide
http://slidepdf.com/reader/full/xl-cubed-version-7-userguide 85/567
80 | P a g e XLCubed v7 User Guide –Book I - Grids
The chart looks like this:
The chart will now update its members and data when the Grid changes
Linking Grids
When using Grid reports it is possible to link multiple Grids together to be driven from the same hierarchy.
Insert the two (or more) Grids that you require
Select the Grid Links ribbon item (or in Excel 2003 and below, the XLCubed > Grid Links...
menu item):

7/17/2019 XL Cubed versión 7 UserGuide
http://slidepdf.com/reader/full/xl-cubed-version-7-userguide 86/567
81 | P a g e XLCubed v7 User Guide –Book I - Grids
Select the Grid that you want to be the master in the dropdown:
Find the Grid that you want to be driven in the table, and click in the cells to select the
hierarchies you want to be linked. Either a Two-Way link (changing either Grid will drive
the other Grid) or a One-Way link (only changing one of the Grids will affect the link) can
be selected.
Linking means that whatever changes are made to the driving Grid's linked hierarchy will
be reflected in the driven Grids. The actual result will depend upon the structure of the
driven Grid. For example, if you linked on the Product hierarchy in the driven Grid and this
appeared as a column in all the linked Grids then drilling down the Product column in the
driving Grid will drill down all the Grids. This also applies to any member selection
operations.

7/17/2019 XL Cubed versión 7 UserGuide
http://slidepdf.com/reader/full/xl-cubed-version-7-userguide 87/567
82 | P a g e XLCubed v7 User Guide –Book I - Grids
Grids can also be linked to Dimension Slicers and Small Multiple Charts.
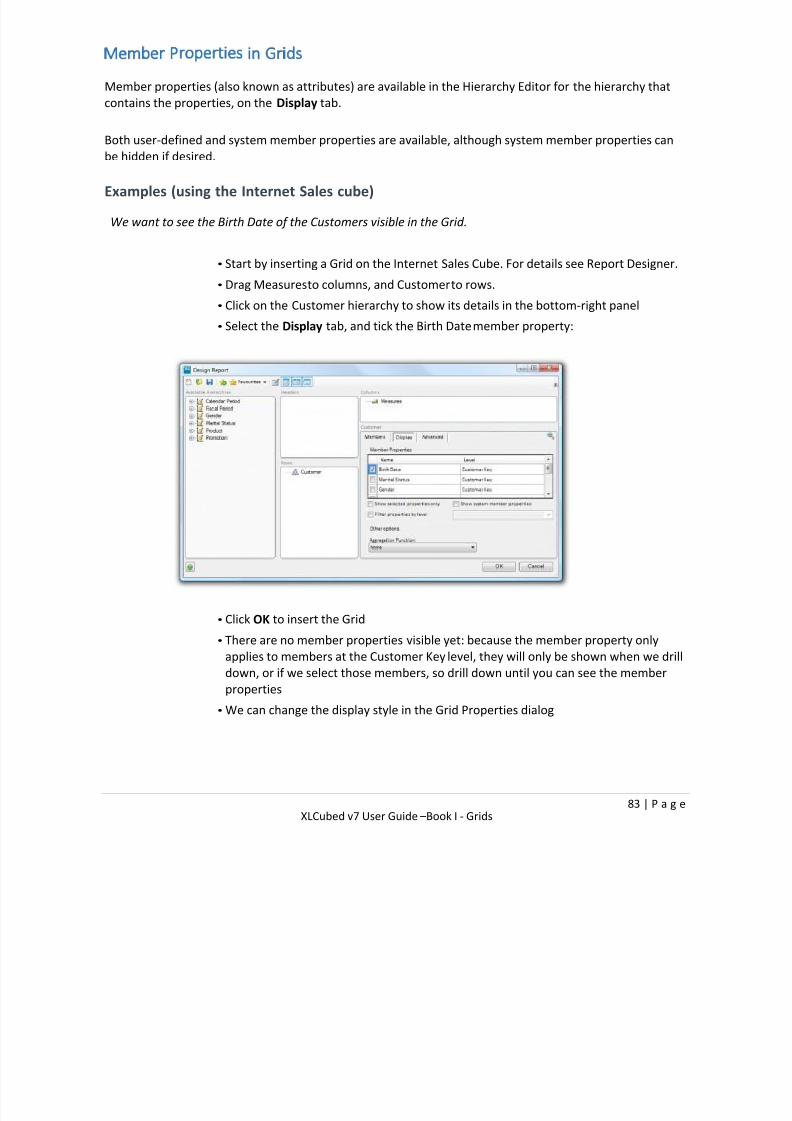
7/17/2019 XL Cubed versión 7 UserGuide
http://slidepdf.com/reader/full/xl-cubed-version-7-userguide 88/567
83 | P a g e XLCubed v7 User Guide –Book I - Grids
Member Properties in Grids
Member properties (also known as attributes) are available in the Hierarchy Editor for the hierarchy that
contains the properties, on the Display tab.
Both user-defined and system member properties are available, although system member properties can
be hidden if desired.
Examples (using the Internet Sales cube)
We want to see the Birth Date of the Customers visible in the Grid.
• Start by inserting a Grid on the Internet Sales Cube. For details see Report Designer.
• Drag Measuresto columns, and Customerto rows.
• Click on the Customer hierarchy to show its details in the bottom-right panel
•
Select the Display tab, and tick the Birth Datemember property:
• Click OK to insert the Grid
• There are no member properties visible yet: because the member property only
applies to members at the Customer Keylevel, they will only be shown when we drill
down, or if we select those members, so drill down until you can see the member
properties
• We can change the display style in the Grid Properties dialog

7/17/2019 XL Cubed versión 7 UserGuide
http://slidepdf.com/reader/full/xl-cubed-version-7-userguide 89/567
84 | P a g e XLCubed v7 User Guide –Book I - Grids
Active Cell Grid Selections
From XLCubed v7.2, Grid reports can be driven from the current selected range of another Grid.
Example
We would like one Grid to show a high-level summary of time vs. region, then a second Grid to be driven
from the first, showing a breakdown of products vs. month for that region.
Insert the first Grid, with years on columns and countries on rows:
From the Grid's right-click menu, choose XLCubed > Properties, then select Interaction > Track
grid's active cell. Optionally, also turn on Apply tracking formatting
Insert a second Grid. Select the Time hierarchy on columns, and then the Active cell option:
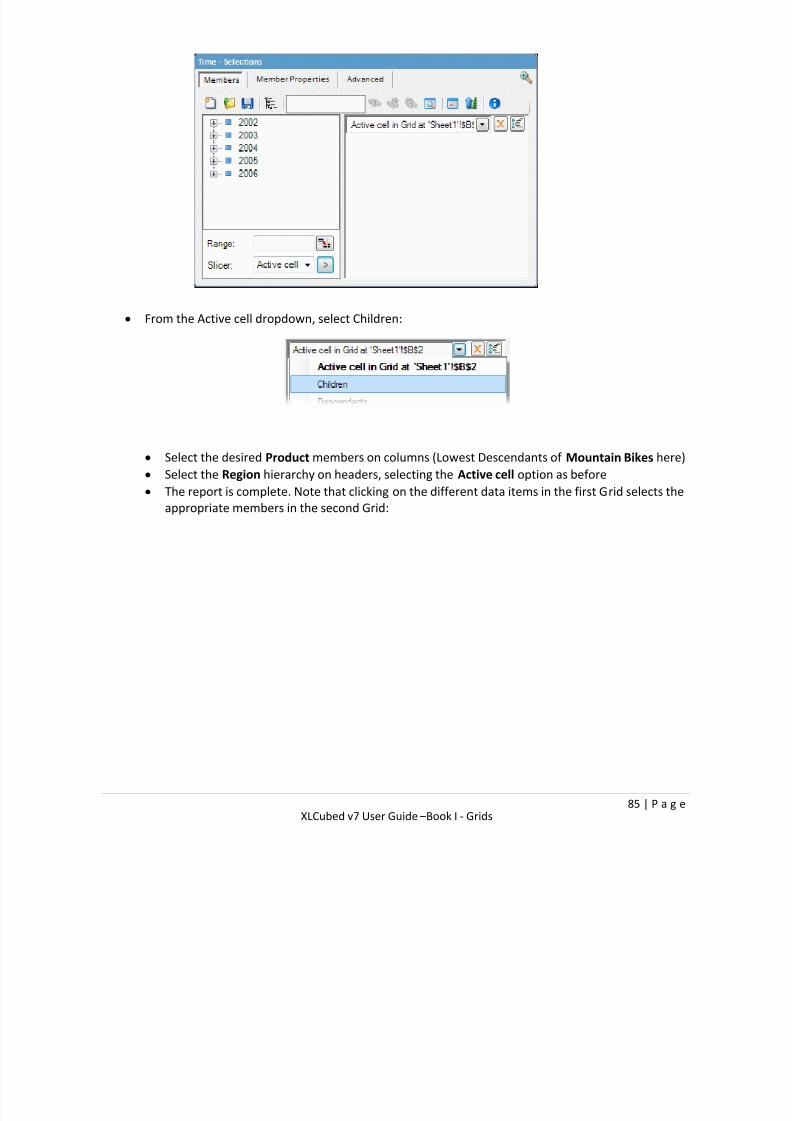
7/17/2019 XL Cubed versión 7 UserGuide
http://slidepdf.com/reader/full/xl-cubed-version-7-userguide 90/567
85 | P a g e XLCubed v7 User Guide –Book I - Grids
From the Active cell dropdown, select Children:
Select the desired Product members on columns (Lowest Descendants of Mountain Bikes here)
Select the Region hierarchy on headers, selecting the Active cell option as before
The report is complete. Note that clicking on the different data items in the first Grid selects theappropriate members in the second Grid:

7/17/2019 XL Cubed versión 7 UserGuide
http://slidepdf.com/reader/full/xl-cubed-version-7-userguide 91/567
86 | P a g e XLCubed v7 User Guide –Book I - Grids
Additional Options
Output Row/Column Members to
The selected Grid members will be copied to the selected cells. This allows formulae to be driven from the
active selection, for example. If you have several hierarchies on rows or columns you can select a range
and the members of the cross-join will be put into each cell.
On Click Navigate to
After cells have been selected, the selection is immediately changed to this cell. This allows the results to
be highlighted, or the worksheet to be changed.
Apply Tracking Formatting
The tracked and currently selected cells are highlighted, as specified on the XLCubedFormats worksheet
(see the Tracked Cell and Active Tracking Cell format)
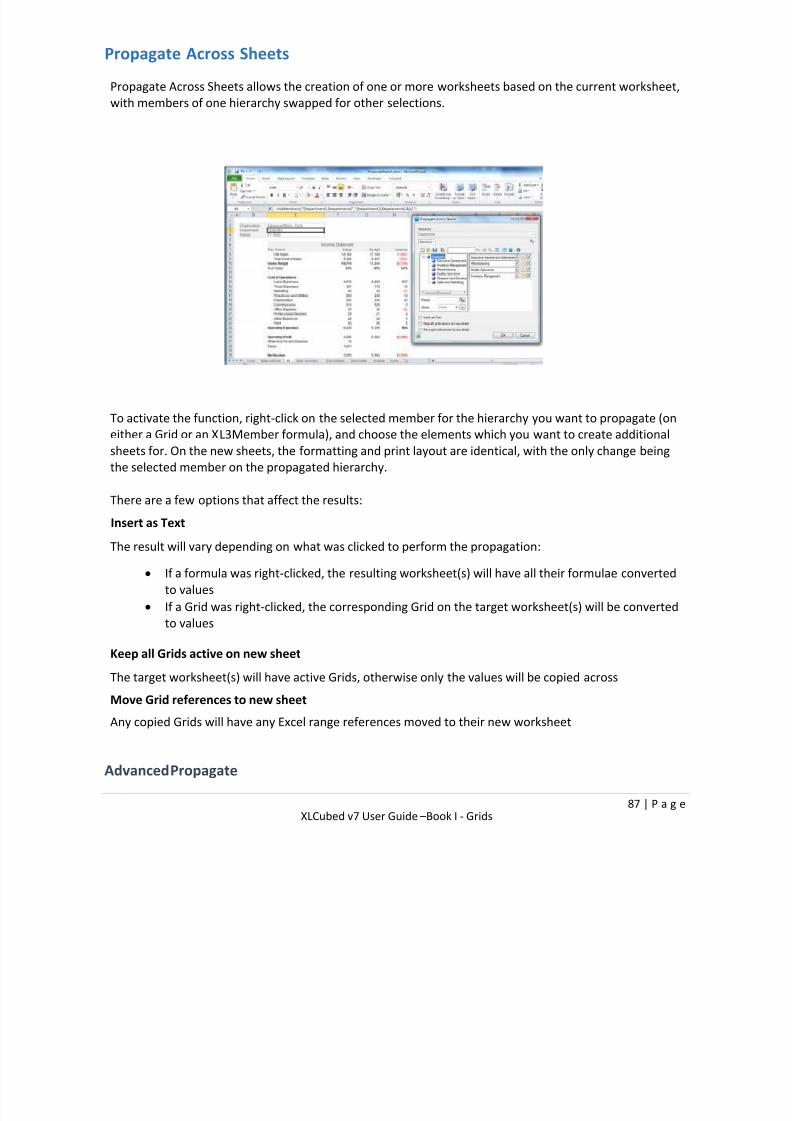
7/17/2019 XL Cubed versión 7 UserGuide
http://slidepdf.com/reader/full/xl-cubed-version-7-userguide 92/567
87 | P a g e XLCubed v7 User Guide –Book I - Grids
Propagate Across Sheets
Propagate Across Sheets allows the creation of one or more worksheets based on the current worksheet,
with members of one hierarchy swapped for other selections.
To activate the function, right-click on the selected member for the hierarchy you want to propagate (on
either a Grid or an XL3Member formula), and choose the elements which you want to create additional
sheets for. On the new sheets, the formatting and print layout are identical, with the only change being
the selected member on the propagated hierarchy.
There are a few options that affect the results:
Insert as Text
The result will vary depending on what was clicked to perform the propagation:
If a formula was right-clicked, the resulting worksheet(s) will have all their formulae converted
to values
If a Grid was right-clicked, the corresponding Grid on the target worksheet(s) will be converted
to values
Keep all Grids active on new sheet
The target worksheet(s) will have active Grids, otherwise only the values will be copied across
Move Grid references to new sheet
Any copied Grids will have any Excel range references moved to their new worksheet
Advanced Propagate

7/17/2019 XL Cubed versión 7 UserGuide
http://slidepdf.com/reader/full/xl-cubed-version-7-userguide 93/567
88 | P a g e XLCubed v7 User Guide –Book I - Grids
Version 7.2 introduces advanced propagation - this allows the results to be based on a particular data
query. For example: give me a new sheet for each product with sales greater than x or any of the other
Ranking, Sorting and Filtering options.
Create new Workbook
Version 7.5 adds a new option to propagate to a new workbook. This will create a new workbook and
populate it with all the new Worksheets.

7/17/2019 XL Cubed versión 7 UserGuide
http://slidepdf.com/reader/full/xl-cubed-version-7-userguide 94/567
89 | P a g e XLCubed v7 User Guide –Book I - Grids
Breakout Value
The Breakout Value option is available on the right mouse button pop-up menu when the currently active
cell contains an XL3Lookup function, an XL3ValueRankLookup function, or a Grid data cell.
The Breakout Value option allows an interesting piece of data to be further explored and broken down into
component parts. For example, if the cell showing Reseller Sales Amount for the United States region in of
2003 is broken out by product, then the result will be the top 10 (or however many items are selected toBreakout by) products for the United States region in 2003. The items broken out can then themselves be
broken out by another hierarchy to analyse more deeply.
Select a cell to analyse
Select Break Out from the right mouse button pop-up menu
The Breakout dialog appears:

7/17/2019 XL Cubed versión 7 UserGuide
http://slidepdf.com/reader/full/xl-cubed-version-7-userguide 95/567
90 | P a g e XLCubed v7 User Guide –Book I - Grids
The Position to insert breakout is used to specify the starting cell on the spread
sheet where the Breakout values are to be inserted
The Hierarchy to breakout field is used to select a dimension to use to Break out the cell
value
Show top or bottom members and Breakout count determines the number of rows of
Breakout information that are generated, and whether they should be of the highest or
lowest ranked members
The How to breakout hierarchy field (when Breaking out from a Grid), or the Rank by
selection field (when Breaking out a formula) is used to choose a selection from the
Breakout hierarchy
Show percentages include a % column to show that items contribution to the parent
value
Track active cell see section below
Display percentage bar include a incell bar to represent the % value
Include 'Others' grouping If breaking out to display the top 5 members - this option will
create an "Others" grouping to group all the items outside of the top 5
Exclude zeros exclude members with a 0 value from the breakout
Exclude nulls exclude members with no values from the breakout

7/17/2019 XL Cubed versión 7 UserGuide
http://slidepdf.com/reader/full/xl-cubed-version-7-userguide 96/567
91 | P a g e XLCubed v7 User Guide –Book I - Grids
The result is inserted into the sheet.
An item in the Breakout can then be further broken out.
Track Active Cell
With "Active Cell Tracking" enabled then clicking on another data value in the source grid will update the
breakout values to reflect that selection. The "Active Cell" is highlighted to show the current selection.
Breakout of "United Kingdom", "All Periods"

7/17/2019 XL Cubed versión 7 UserGuide
http://slidepdf.com/reader/full/xl-cubed-version-7-userguide 97/567
92 | P a g e XLCubed v7 User Guide –Book I - Grids
Breakout of "United States", "CY 2001"

7/17/2019 XL Cubed versión 7 UserGuide
http://slidepdf.com/reader/full/xl-cubed-version-7-userguide 98/567
93 | P a g e XLCubed v7 User Guide –Book I - Grids
Converting Grid Reports
Convert to Formula
The XLCubed > Convert to > Formula option converts a Grid report into XLCubed formulae. In XLCubed you
can easily convert an existing grid report to a formula report.
To do this right-click on the grid, then select the XLCubed > Convert to > Formula menu item as below:
You will get a message asking you to confirm that you wish to convert to formula.
If you are converting a grid report that contains Slicers you will also get a message that links to any slicers
in the report will be removed and that you can manually recreate these links.
To manually recreate links to slicers you need to follow these steps:

7/17/2019 XL Cubed versión 7 UserGuide
http://slidepdf.com/reader/full/xl-cubed-version-7-userguide 99/567
94 | P a g e XLCubed v7 User Guide –Book I - Grids
• right-click the slicer and choose edit slicer
• on the settings tab check box ‘Update range with selection’ and point to the cell location
where the slicer choice is located; (if not already set)
• select Caption from the drop-down (if not already set)
Next you will need to edit your formula statement to point to this cell location, right-click on a cell in the
formula report, edit the XL3Lookup statement as below to make sure the cell location which holds the
slicer choice is correct.
Convert to Values
The XLCubed > Convert to > Values option converts an XLCubed Grid report into just its values.

7/17/2019 XL Cubed versión 7 UserGuide
http://slidepdf.com/reader/full/xl-cubed-version-7-userguide 100/567
95 | P a g e XLCubed v7 User Guide –Book I - Grids
Copying Grids
Selecting the XLCubed > Copy Grid... menu option allows you to quickly replicate Grids. Once this option
has been selected, select the destination cell and click OK to insert the copy.
Deleting Grids
Selecting the XLCubed > Delete Grid... menu option allows you to delete a grid. You will be prompted to
confirm that you do wish to delete the grid.

7/17/2019 XL Cubed versión 7 UserGuide
http://slidepdf.com/reader/full/xl-cubed-version-7-userguide 101/567
96 | P a g e XLCubed v7 User Guide –Book I - Grids
Drillthrough
Drillthrough is used to list the base data from the database that constitutes the cell on the
spreadsheet. The Drillthrough option is available on the right mouse button pop-up menu
when:
• the currently active cell contains an XL3Lookup formula
• the currently active cell is part of the data area of an active Grid Reporting Overview
To display the Drill Through dialog, select a cell and choose XLCubed > Drillthrough... from the right
mouse button menu.
• The Destination field determines where the Drillthrough information will be placed on the
worksheet.
• The Limit rows field allows you to restrict the returned result set.
• You can create a new worksheet to place the data on by clicking on the New Sheet button and
entering a name for the worksheet.
The Drillthrough places the returned data directly onto the spreadsheet. The values inserted are values
and not formulae.

7/17/2019 XL Cubed versión 7 UserGuide
http://slidepdf.com/reader/full/xl-cubed-version-7-userguide 102/567
97 | P a g e XLCubed v7 User Guide –Book I - Grids
Expanding Large Hierarchies
When trying to show a very large number of members in the Report Designer or the Hierarchy Editor,
XLCubed will warn you:
You may do three things:
• retrieve all the available members
• retrieve a customisable number of members
• cancel the operation
The limit is configurable by editing the Options > XLCubed Options > Main > Limit number of membersreturned in tree XLCubed option.

7/17/2019 XL Cubed versión 7 UserGuide
http://slidepdf.com/reader/full/xl-cubed-version-7-userguide 103/567
98 | P a g e XLCubed v7 User Guide –Book I - Grids
Grid Charts
Grid Charts introduce truly dynamic charting to XLCubed. One or more Grid charts can be tied to each
Grid. You have the ability to specify the level being charted (Entire Grid / Specific Level / Lowest Level) as
shown below, and the charts will change, grow and shrink with the Grid. Once created, the Grid chart can
be sized and formatted as with a standard Excel chart.
To create a Grid Chart, right-click on a Grid and choose XLCubed > Grid Charts and then the type of Chart.
Chart Types
Show Lowest Members
This option charts the cross-section of the lowest levels in the Grid:

7/17/2019 XL Cubed versión 7 UserGuide
http://slidepdf.com/reader/full/xl-cubed-version-7-userguide 104/567
99 | P a g e XLCubed v7 User Guide –Book I - Grids
Show All Members
This option creates a Grid chart which shows details of the entire visible Grid:
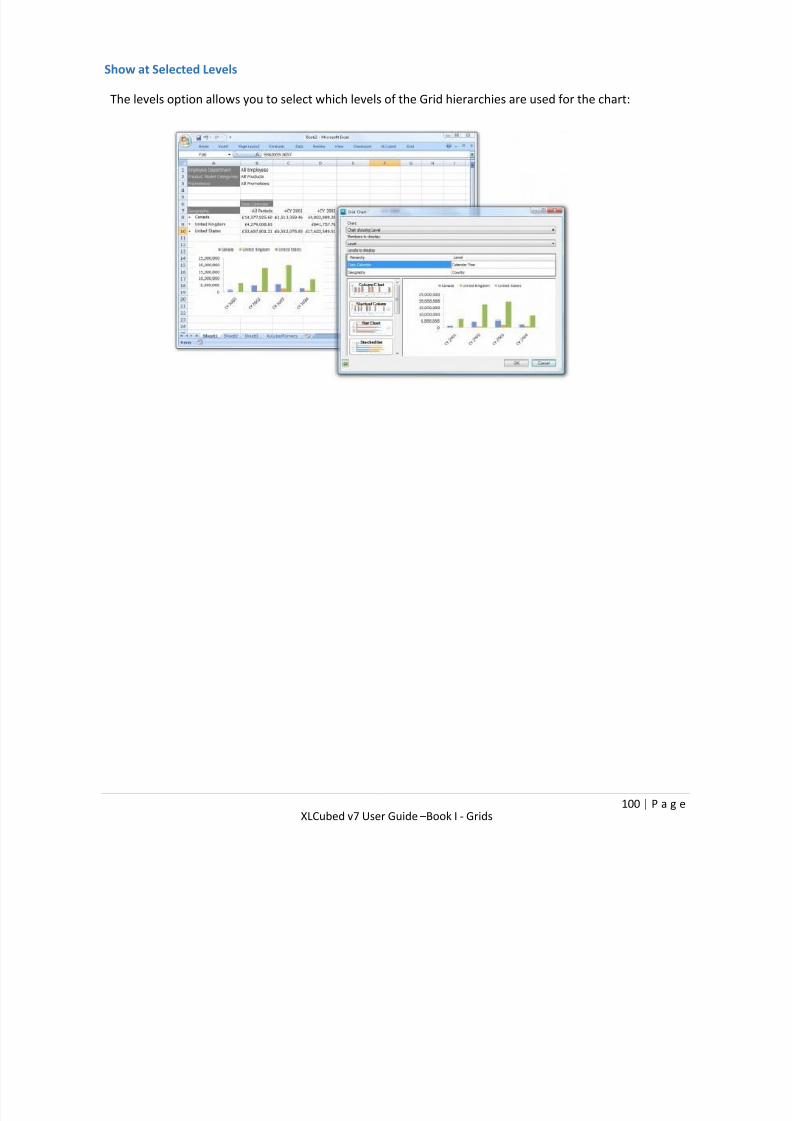
7/17/2019 XL Cubed versión 7 UserGuide
http://slidepdf.com/reader/full/xl-cubed-version-7-userguide 105/567
100 | P a g e XLCubed v7 User Guide –Book I - Grids
Show at Selected Levels
The levels option allows you to select which levels of the Grid hierarchies are used for the chart:

7/17/2019 XL Cubed versión 7 UserGuide
http://slidepdf.com/reader/full/xl-cubed-version-7-userguide 106/567
101 | P a g e XLCubed v7 User Guide –Book I - Grids
Configuring Existing Charts
Right-clicking a Grid and choosing XLCubed > Grid Charts > Manage Grid Charts... allows you to change the
chart type and what members are being charted.

7/17/2019 XL Cubed versión 7 UserGuide
http://slidepdf.com/reader/full/xl-cubed-version-7-userguide 107/567
102 | P a g e XLCubed v7 User Guide –Book II – Formulae Reporting
Book II - Formula Reporting
When using formulae to retrieve information and data from the OLAP cube, each cell contains a formula
rather than the data itself (unlike Grid reports). It is therefore possible to put any value in any cell, and to
have fully disjoint reports.
Most formula reports are built primarily using just two XLCubed formulae:
XL3Lookup: retrieves the cube value from a specified slice, and will normally reference one or more
XL3Member formulae
XL3Member : returns the caption for a specified member
Formula reports will often be preferred where the required formatting is complex, or where existing
'static' financial reports are being replaced.

7/17/2019 XL Cubed versión 7 UserGuide
http://slidepdf.com/reader/full/xl-cubed-version-7-userguide 108/567
103 | P a g e XLCubed v7 User Guide –Book II – Formulae Reporting
Grid vs. Formula-based Reporting Key Differences
Grid reports
Grids are good for ad-hoc analysis, where the data needs to be sliced quickly. Drag and drop makes
it easy to quickly change the data on show
The report shape is always rectangular. Elements are always in familiar places
The grid contains comprehensive information about one slice of the data Formats are created and maintained by the grid. Complex OLAP-aware highlighting and conditional
formatting are possible.
Grids can be edited simply by using the Report Designer
Grids are faster for very large numbers of cells
Formulae
Formulae are good for reports with a static layout, where design can be used to emphasize and de-
emphasize information as necessary
Any formula can be in any cell. The shape of the report can be as flexible as is necessary
Formulae can put the most important information in the most prominent position
Formats are maintained by Excel. All of Excel’s formatting options are available
Once inserted, formulae must be edited individually, using the Edit Lookup dialog or by hand
Formulae are slower if the number of formulae is very large
Drilling in Formula Report
A cell that contains an XL3Member formula can be drilled into to show details about its components.
To use the drill down feature, double-click on a cell that contains an XL3Member and depending on the
current state of the workbook, it will:
Drill down: the children of the hierarchy member double-clicked on will be displayed. This is done by
looking at which cells refer to the current cell. This option will drill down to the level beneath the one
selected in the current cell and will attempt to determine the best place to insert the new columns or
rows. Using this option with a heavily disjoint report may not produce expected results!
Drill up: the children of the hierarchy member double-clicked on will be removed from the report
Insert Value
This allows you to insert a value from the cube. XL3Lookupand XL3LookupRWformulae can be inserted
directly into the spreadsheet using the XLCubed > Insert Formula > Value ribbon or menu option.
To insert a value lookup:
1. Select the XLCubed > Insert Formula > Value ribbon or menu option

7/17/2019 XL Cubed versión 7 UserGuide
http://slidepdf.com/reader/full/xl-cubed-version-7-userguide 109/567
104 | P a g e XLCubed v7 User Guide –Book II – Formulae Reporting
2. Choose a location for the new formulae
3. Choose the connection to use from the dropdown
4. Use the grid to select the hierarchies and member selections to retrieve the
value for
5. Click OK and the formulae will be inserted
Additional Options
•
If you want to insert the writeable XL3LookupRWformulae instead of
XL3Lookup, select the Insert XL3LookupRW checkbox

7/17/2019 XL Cubed versión 7 UserGuide
http://slidepdf.com/reader/full/xl-cubed-version-7-userguide 110/567
105 | P a g e XLCubed v7 User Guide –Book II – Formulae Reporting
Insert Members
This allows you to insert a member or list of members from the cube. XL3Memberformulae can be inserted
directly into the spreadsheet using the XLCubed > Insert Formula > Members ribbon or menu option.
To insert members:
1. Select the XLCubed > Insert Formula > Members ribbon or menu option
2. Choose a location for the new formulae
3. Choose the connection to use from the dropdown
4. Select the hierarchy the desired members belong to
5. Select the members to insert. An overview of how to select members can be found here
6. Click OK and the formulae will be inserted
Additional Options
• If you want to just insert the captions of the members instead of XL3Memberformulae, select
the Insert as Text checkbox
• If multiple members are selected, they can be either inserted vertically (Insert down) or
horizontally (Insert right)
7/17/2019 XL Cubed versión 7 UserGuide
http://slidepdf.com/reader/full/xl-cubed-version-7-userguide 111/567
106 | P a g e XLCubed v7 User Guide –Book II – Formulae Reporting
Insert Member Property
XL3PropertyLookupformulae can be inserted directly into the spreadsheet using the XLCubed > Insert
Formula
> Member Property ribbon or menu option.
To insert a member property:
1. Select the XLCubed > Insert Formula > Member Property ribbon or menu option
2. Choose a location for the new formulae
3. Choose the connection to use from the dropdown
4. Select the hierarchy the desired property belong to
5. Select the member to use
6. Choose a member property from the Property dropdown
7. Click OK and the formula will be inserted
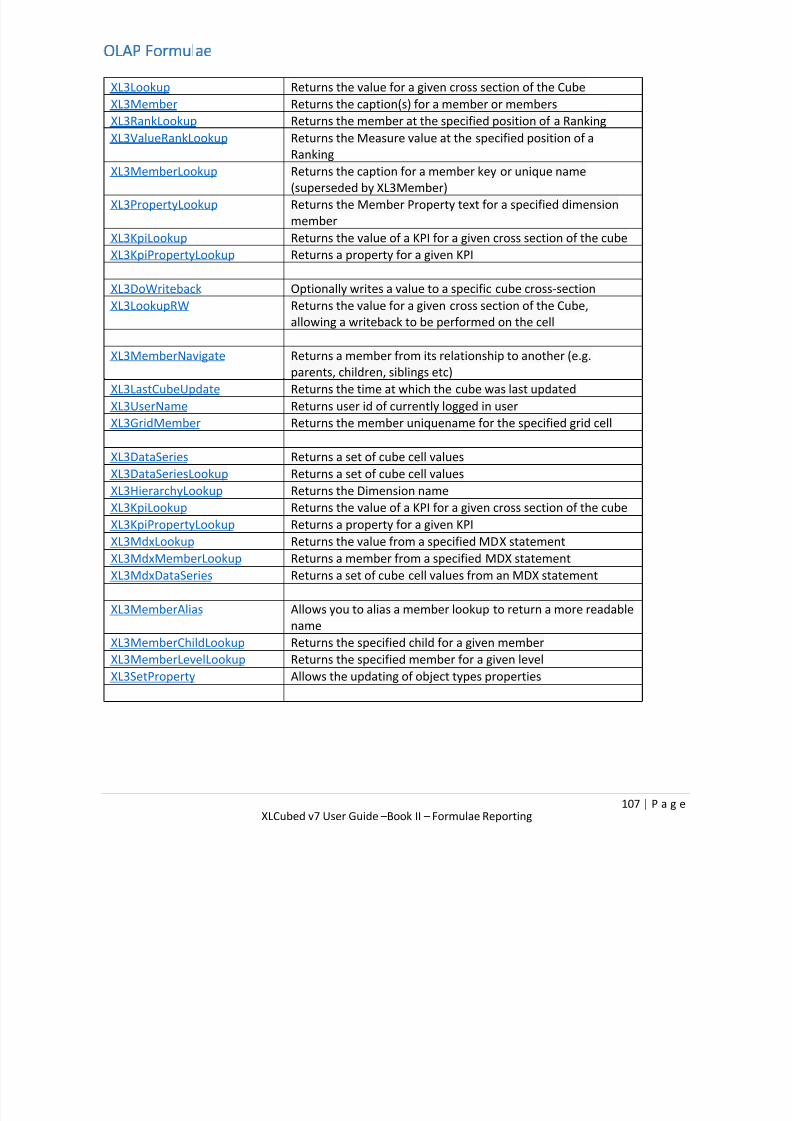
7/17/2019 XL Cubed versión 7 UserGuide
http://slidepdf.com/reader/full/xl-cubed-version-7-userguide 112/567
107 | P a g e XLCubed v7 User Guide –Book II – Formulae Reporting
OLAP Formulae
XL3Lookup Returns the value for a given cross section of the Cube
XL3Member Returns the caption(s) for a member or members
XL3RankLookup Returns the member at the specified position of a Ranking
XL3ValueRankLookup Returns the Measure value at the specified position of a
Ranking
XL3MemberLookup Returns the caption for a member key or unique name
(superseded by XL3Member)
XL3PropertyLookup Returns the Member Property text for a specified dimension
member
XL3KpiLookup Returns the value of a KPI for a given cross section of the cube
XL3KpiPropertyLookup Returns a property for a given KPI
XL3DoWriteback Optionally writes a value to a specific cube cross-section
XL3LookupRW Returns the value for a given cross section of the Cube,
allowing a writeback to be performed on the cell
XL3MemberNavigate Returns a member from its relationship to another (e.g.
parents, children, siblings etc)
XL3LastCubeUpdate Returns the time at which the cube was last updated
XL3UserName Returns user id of currently logged in user
XL3GridMember Returns the member uniquename for the specified grid cell
XL3DataSeries Returns a set of cube cell values
XL3DataSeriesLookup Returns a set of cube cell values
XL3HierarchyLookup Returns the Dimension name
XL3KpiLookup Returns the value of a KPI for a given cross section of the cube
XL3KpiPropertyLookup Returns a property for a given KPI
XL3MdxLookup Returns the value from a specified MDX statement
XL3MdxMemberLookup Returns a member from a specified MDX statement
XL3MdxDataSeries Returns a set of cube cell values from an MDX statement
XL3MemberAlias Allows you to alias a member lookup to return a more readable
name
XL3MemberChildLookup Returns the specified child for a given member
XL3MemberLevelLookup Returns the specified member for a given levelXL3SetProperty Allows the updating of object types properties
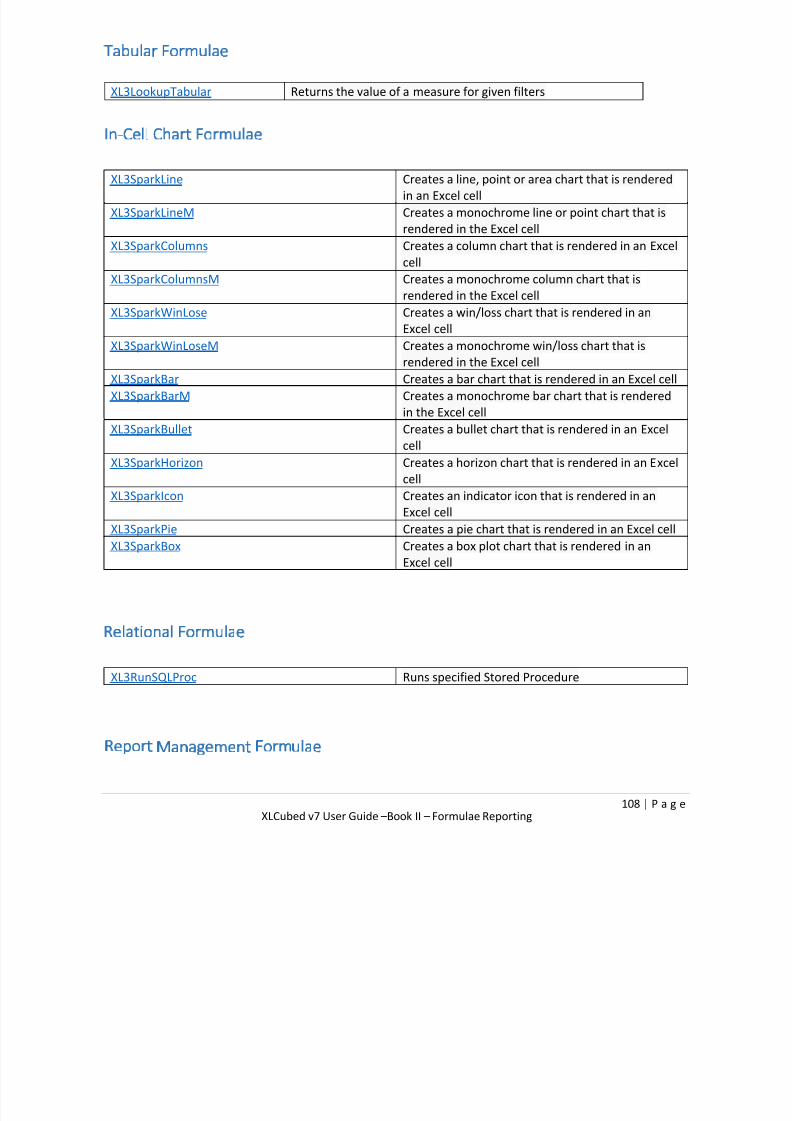
7/17/2019 XL Cubed versión 7 UserGuide
http://slidepdf.com/reader/full/xl-cubed-version-7-userguide 113/567
108 | P a g e XLCubed v7 User Guide –Book II – Formulae Reporting
Tabular Formulae
XL3LookupTabular Returns the value of a measure for given filters
In-Cell Chart Formulae
XL3SparkLine Creates a line, point or area chart that is rendered
in an Excel cell
XL3SparkLineM Creates a monochrome line or point chart that is
rendered in the Excel cell
XL3SparkColumns Creates a column chart that is rendered in an Excel
cell
XL3SparkColumnsM Creates a monochrome column chart that is
rendered in the Excel cell
XL3SparkWinLose Creates a win/loss chart that is rendered in an
Excel cellXL3SparkWinLoseM Creates a monochrome win/loss chart that is
rendered in the Excel cell
XL3SparkBar Creates a bar chart that is rendered in an Excel cell
XL3SparkBarM Creates a monochrome bar chart that is rendered
in the Excel cell
XL3SparkBullet Creates a bullet chart that is rendered in an Excel
cell
XL3SparkHorizon Creates a horizon chart that is rendered in an Excel
cell
XL3SparkIcon Creates an indicator icon that is rendered in anExcel cell
XL3SparkPie Creates a pie chart that is rendered in an Excel cell
XL3SparkBox Creates a box plot chart that is rendered in an
Excel cell
Relational Formulae
XL3RunSQLProc Runs specified Stored Procedure
Report Management Formulae

7/17/2019 XL Cubed versión 7 UserGuide
http://slidepdf.com/reader/full/xl-cubed-version-7-userguide 114/567
109 | P a g e XLCubed v7 User Guide –Book II – Formulae Reporting
XL3Link Creates a hyperlink that opens a sheet and sets
parameters
XL3RowVisible Shows or hides a row
XL3ColumnVisible Shows or hides a column
XL3DynamicPicture Updates a Picture based on a URL (web address)
XL3RefreshObjects Refreshes objects in the report based on type
XL3RefreshObjectsNamed Refreshes objects in the report based on name
XL3WebReportLink Creates a hyperlink that opens an XLCubed Webreport and optionally sets web parameters
Formula wizards
The XLCubed Excel Add-in provides a menu-driven, graphical user interface to facilitate easy building of reports. The
reports are built by combining XLCubed functions on a spreadsheet page. The following functions are supported by
the GUI:
Ribbon/Menu option Function
Insert Members XL3Member
Insert Value XL3Lookup/XL3LookupRW
Insert Ranking XL3RankLookup
Insert Member Property XL3PropertyLookup
Insert Data Series XL3DataSeriesLookup
Insert Link XL3Link
Insert Picture Link XL3PictureLink
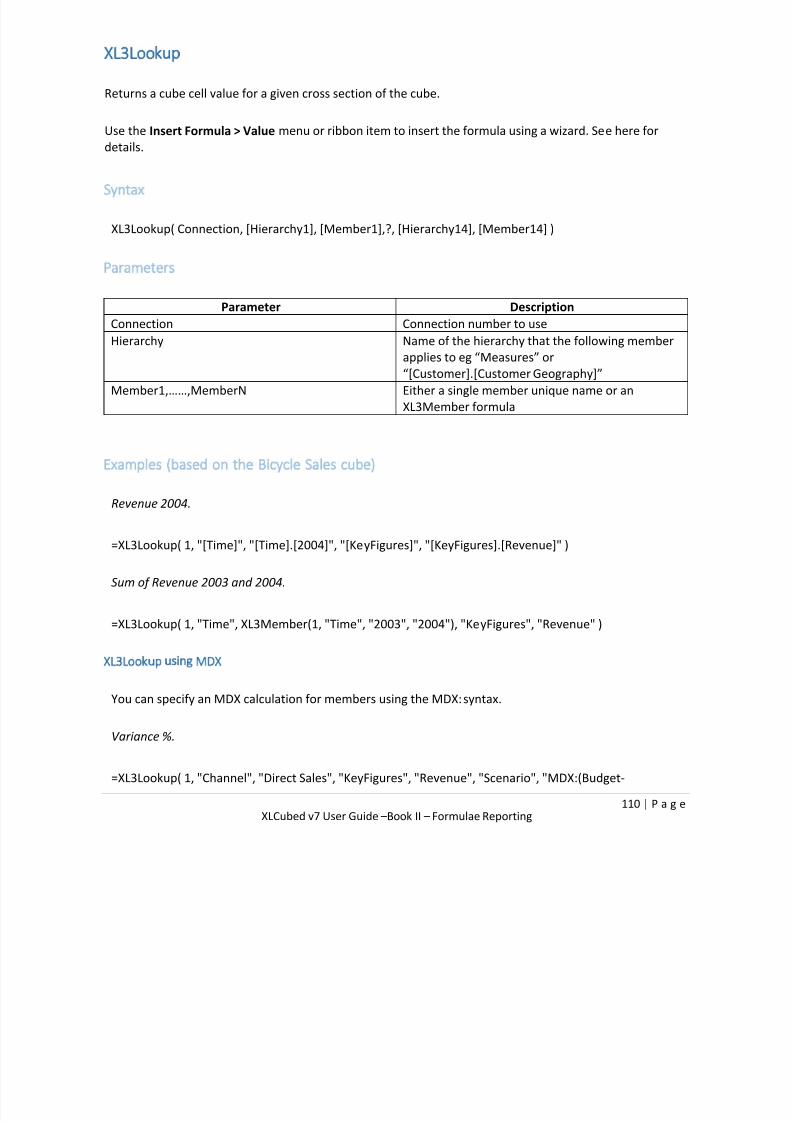
7/17/2019 XL Cubed versión 7 UserGuide
http://slidepdf.com/reader/full/xl-cubed-version-7-userguide 115/567
110 | P a g e XLCubed v7 User Guide –Book II – Formulae Reporting
XL3Lookup
Returns a cube cell value for a given cross section of the cube.
Use the Insert Formula > Value menu or ribbon item to insert the formula using a wizard. See here for
details.
Syntax
XL3Lookup( Connection, [Hierarchy1], [Member1],?, [Hierarchy14], [Member14] )
Parameters
Parameter Description
Connection Connection number to use
Hierarchy Name of the hierarchy that the following member
applies to eg “Measures” or
“[Customer].[Customer Geography]”
Member1,……,MemberN Either a single member unique name or an
XL3Member formula
Examples (based on the Bicycle Sales cube)
Revenue 2004.
=XL3Lookup( 1, "[Time]", "[Time].[2004]", "[KeyFigures]", "[KeyFigures].[Revenue]" )
Sum of Revenue 2003 and 2004.
=XL3Lookup( 1, "Time", XL3Member(1, "Time", "2003", "2004"), "KeyFigures", "Revenue" )
XL3Lookup using MDX
You can specify an MDX calculation for members using the MDX:syntax.
Variance %.
=XL3Lookup( 1, "Channel", "Direct Sales", "KeyFigures", "Revenue", "Scenario", "MDX:(Budget-

7/17/2019 XL Cubed versión 7 UserGuide
http://slidepdf.com/reader/full/xl-cubed-version-7-userguide 116/567
111 | P a g e XLCubed v7 User Guide –Book II – Formulae Reporting
Actual)/Budget", "Time", "January 2003" )
% of Previous Year.
=XL3Lookup( 1, "Time", "2003", "Measures", "MDX:((Measures.Revenue,ParallelPeriod(Time.Year))-
(Measures.Revenue))/(Measures.Revenue,ParallelPeriod(Time.Year))”)

7/17/2019 XL Cubed versión 7 UserGuide
http://slidepdf.com/reader/full/xl-cubed-version-7-userguide 117/567
112 | P a g e XLCubed v7 User Guide –Book II – Formulae Reporting
XL3Member
Returns a name or caption for a member or members. Multiple members can be specified (as separate
parameters) to allow a multi-member set to be used.
Use the Insert Formula > Members menu or ribbon item to insert the formula using a wizard.
Syntax
XL3Member( Connection, Hierarchy, Member1, [Member2],….,[MemberN] )
Parameters
Parameter Description
Connection Connection number to use
Hierarchy Name of the hierarchy that the member applies to
eg “Measures” or “[Customer].[Customer
Geography]”
Member1,……,MemberN Members to use
Examples (based on the Bicycle Sales cube)
Member name 'W6000/185'
=XL3Member( 1, "Product", "[Product].&[W6000/185]" )
Multiple Members
You can specify multiple members for an XL3Memberformula by using additional parameters.
When referred to by an XL3Lookup formula, it returns the sum of Allround and Mountain Bikes.
=XL3Member( 1, "Product", "[Product].&[Allround]", "[Product].&[Mountain]" )
XL3Member using MDX
You can specify an MDX calculation for members using the MDX syntax. These cells can then be referenced
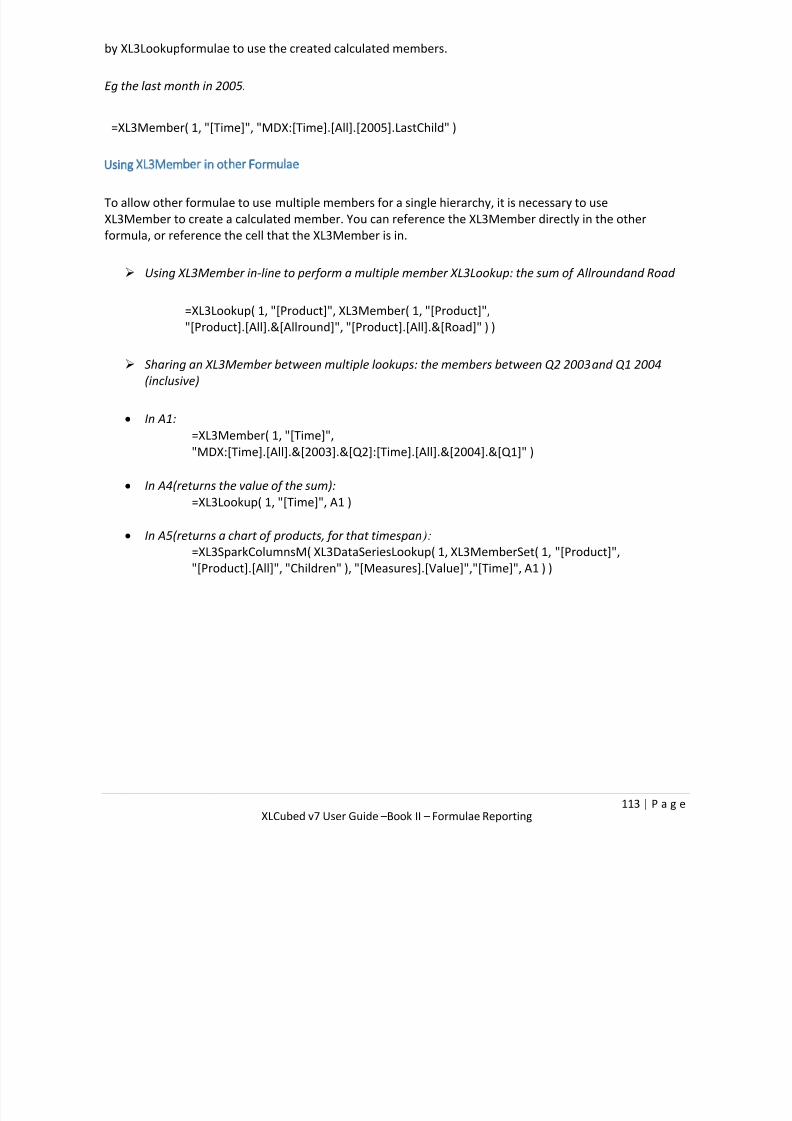
7/17/2019 XL Cubed versión 7 UserGuide
http://slidepdf.com/reader/full/xl-cubed-version-7-userguide 118/567
113 | P a g e XLCubed v7 User Guide –Book II – Formulae Reporting
by XL3Lookupformulae to use the created calculated members.
Eg the last month in 2005.
=XL3Member( 1, "[Time]", "MDX:[Time].[All].[2005].LastChild" )
Using XL3Member in other Formulae
To allow other formulae to use multiple members for a single hierarchy, it is necessary to use
XL3Member to create a calculated member. You can reference the XL3Member directly in the other
formula, or reference the cell that the XL3Member is in.
Using XL3Member in-line to perform a multiple member XL3Lookup: the sum of Allroundand Road
=XL3Lookup( 1, "[Product]", XL3Member( 1, "[Product]",
"[Product].[All].&[Allround]", "[Product].[All].&[Road]" ) )
Sharing an XL3Member between multiple lookups: the members between Q2 2003and Q1 2004
(inclusive)
In A1:
=XL3Member( 1, "[Time]",
"MDX:[Time].[All].&[2003].&[Q2]:[Time].[All].&[2004].&[Q1]" )
In A4(returns the value of the sum):
=XL3Lookup( 1, "[Time]", A1 )
In A5(returns a chart of products, for that timespan ):
=XL3SparkColumnsM( XL3DataSeriesLookup( 1, XL3MemberSet( 1, "[Product]",
"[Product].[All]", "Children" ), "[Measures].[Value]","[Time]", A1 ) )

7/17/2019 XL Cubed versión 7 UserGuide
http://slidepdf.com/reader/full/xl-cubed-version-7-userguide 119/567
114 | P a g e XLCubed v7 User Guide –Book II – Formulae Reporting

7/17/2019 XL Cubed versión 7 UserGuide
http://slidepdf.com/reader/full/xl-cubed-version-7-userguide 120/567
115 | P a g e XLCubed v7 User Guide –Book II – Formulae Reporting
Other Formulae
XL3DataSeries
Returns the set of values from a range of given time members. Often used to provide an
OLAP data source for In-Cell Chart formulae.
Syntax
XL3DataSeries( Connection, TimeHierarchy, PeriodMember, PeriodCount, Measure, Hierarchy1,
Member1,…, Hierarchy12, Member12)
Parameters
Parameter Description
Connection Connection number to use
TimeHierarchy Name of the time hierarchy to usePeriodMember The time member to use
PeriodCount The number of periods to return
Measure The measure to use
Hierarchy1….HierarchyN Name of the hierarchy that the following member applies to eg
“Measures” or “[Customer].[Customer Geography]”
Member1….MemberN Either a single member unique name or an XL3Member formula
Examples (based on the Bicycle Sales cube)
Returns the set of 12 Revenues for January 2004 to December 2004:
=XL3DataSeries (1, “Time”, “December 2004”, 12, “Value”, “KeyFigures”, “Revenue”)
Returns a column chart for a set of 12 Revenues for January 2004 to December 2004:
=XL3SparkColumnsM(XL3DataSeries (1, “Time”, “December 2004”, 12, “Value”, “KeyFigures”, “Revenue”))

7/17/2019 XL Cubed versión 7 UserGuide
http://slidepdf.com/reader/full/xl-cubed-version-7-userguide 121/567
116 | P a g e XLCubed v7 User Guide –Book II – Formulae Reporting
XL3DataSeriesLookup
Returns the set of values from a range of given members. Often used to provide a OLAP
data source for In-Cell Chart formulae.
Use the Insert Formula > Data Series menu or ribbon item to insert the formula using a wizard. See here
for details.
Syntax
XL3DataSeriesLookup( Connection, MemberSet, Measure, Hierarchy1, Member1,?,
Hierarchy13, Member13 )
Parameters
Parameter Description
Connection Connection number to use
MemberSet An XL3MemberSet formula specifying the set to return
Measure The measure to use
Hierarchy1….HierarchyN Name of the hierarchy that the following member applies to eg
“Measures” or “[Customer].[Customer Geography]”
Member1….MemberN Either a single member unique name or an XL3Member formula
Examples (based on the Bicycle Sales cube)
Returns the a set of 12 Revenues for the months of 2003
=XL3DataSeriesLookup(1,XL3MemberSet(1,"[Time]","[Time].[All].&[2003]","DescendantsAt","[Ti
Returns a line chart for a set of 12 Revenues for the months of 2003
=XL3SparkLineM(
XL3DataSeriesLookup(1,XL3MemberSet(1,"[Time]","[Time].[All].&[2003]","DescendantsAt","[Tim
)

7/17/2019 XL Cubed versión 7 UserGuide
http://slidepdf.com/reader/full/xl-cubed-version-7-userguide 122/567
117 | P a g e XLCubed v7 User Guide –Book II – Formulae Reporting
XL3DoWriteback
Allows a writeback to be performed on demand. It can be used in conjunction with XL3Link to trigger the
execution.
This setup is designed to allow the calculation of any number of cells to be separated from the sometimes
slow writeback process. The final calculations for the cells can all be submitted in one batch, without
having to wait for the writeback to occur between each calculation.Syntax
XL3DoWriteback (PerformWriteback, WriteValue, Connection, [Hierarchy1], [Member1],…, [Hierarchy13],
[Member13])
Parameter Description
PerfomWriteback A boolean value (TRUE or FALSE) specifying whether to actually
perform the writeback. If this is an Excel Range then that cell's
value will be reset to FALSE following the writeback operationWriteValue The value to be written. Typically an Excel cell reference.
Connection Connection number to use
Hierarchy1,…,HierarchyN Name of the hierarchy that the following member applies to eg
“Measures” or “[Customer].[Customer Geography]”
Member1,…,MemberN Either a single member unique name or an XL3Member
formula
Example
This example shows an input template that could be achieved using XL3DoWriteback. While this templatehas a single column, and writes back for just 5 members on 3 dimensions, the same concept could be
applied to many members over up to 14 dimensions. To use it:
1. Enter the new values in column C. These could be entered by:
Directly typing the values
Copy and paste from another document
Formula calculations based on other values
XL3Lookup formulae
2. Click the XL3Link in cell A1, which updates B1 to be TRUE
3. The XL3DoWriteback formulae in column E are triggered. The writeback speed can vary depending
on your cube
4. When the writeback is complete, cell B1 is automatically reset to FALSE
A B C D E
1 =XL3Link(,"SubmitWriteback",,XL3Address($B$1),TRUE)
FALSE
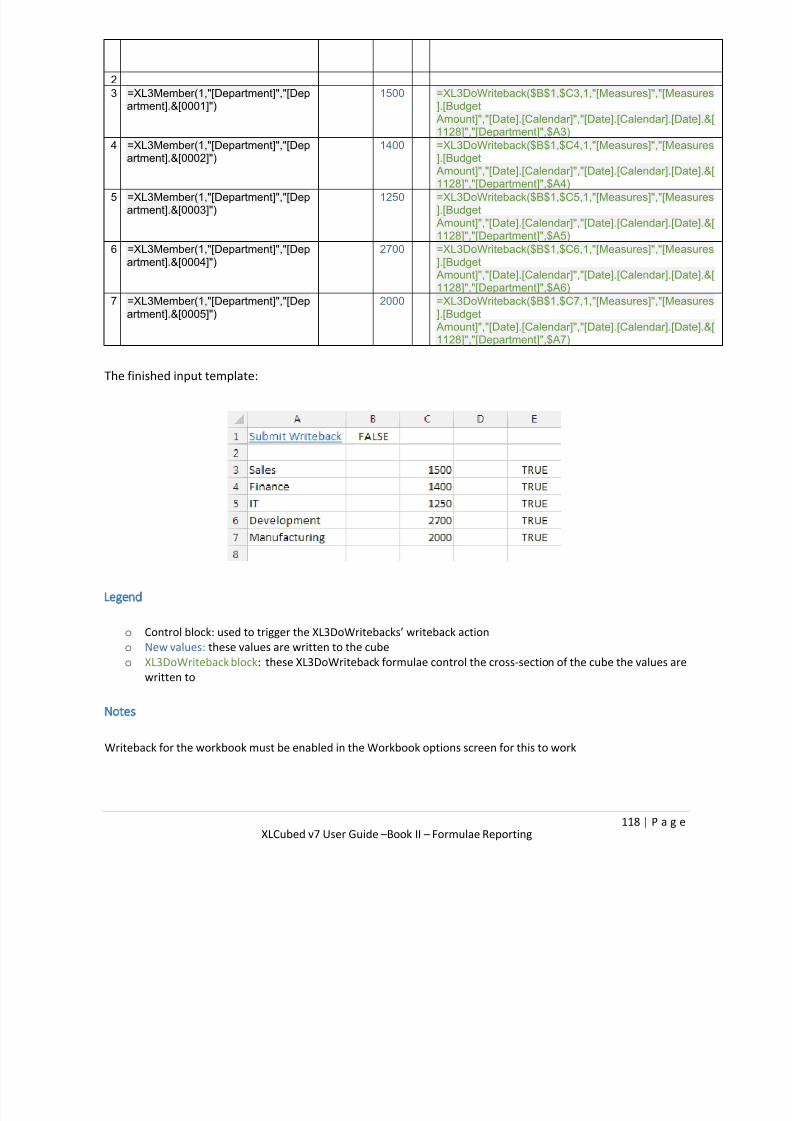
7/17/2019 XL Cubed versión 7 UserGuide
http://slidepdf.com/reader/full/xl-cubed-version-7-userguide 123/567
118 | P a g e XLCubed v7 User Guide –Book II – Formulae Reporting
23 =XL3Member(1,"[Department]","[Dep
artment].&[0001]")1500 =XL3DoWriteback($B$1,$C3,1,"[Measures]","[Measures
].[Budget Amount]","[Date].[Calendar]","[Date].[Calendar].[Date].&[1128]","[Department]",$A3)
4 =XL3Member(1,"[Department]","[Department].&[0002]")
1400 =XL3DoWriteback($B$1,$C4,1,"[Measures]","[Measures].[Budget
Amount]","[Date].[Calendar]","[Date].[Calendar].[Date].&[1128]","[Department]",$A4)
5 =XL3Member(1,"[Department]","[Department].&[0003]")
1250 =XL3DoWriteback($B$1,$C5,1,"[Measures]","[Measures].[Budget
Amount]","[Date].[Calendar]","[Date].[Calendar].[Date].&[1128]","[Department]",$A5)
6 =XL3Member(1,"[Department]","[Department].&[0004]")
2700 =XL3DoWriteback($B$1,$C6,1,"[Measures]","[Measures].[Budget
Amount]","[Date].[Calendar]","[Date].[Calendar].[Date].&[1128]","[Department]",$A6)
7 =XL3Member(1,"[Department]","[Department].&[0005]")
2000 =XL3DoWriteback($B$1,$C7,1,"[Measures]","[Measures].[Budget
Amount]","[Date].[Calendar]","[Date].[Calendar].[Date].&[1128]","[Department]",$A7)
The finished input template:
Legend
o Control block: used to trigger the XL3DoWritebacks’ writeback action
o New values: these values are written to the cube
o XL3DoWriteback block: these XL3DoWriteback formulae control the cross-section of the cube the values arewritten to
Notes
Writeback for the workbook must be enabled in the Workbook options screen for this to work

7/17/2019 XL Cubed versión 7 UserGuide
http://slidepdf.com/reader/full/xl-cubed-version-7-userguide 124/567
119 | P a g e XLCubed v7 User Guide –Book II – Formulae Reporting
XL3HierarchyLookup
Returns a hierarchy caption from a given hierarchy unique name.
Syntax
XL3HierarchyLookup (Connection, Hierarchy)
Parameters
Parameter Description
Connection Connection number to use
Hierarchy Unique name of the hierarchy to retrieve the caption for
Examples (based on the Bicycle Sales cube)
Returns ‘Product’ the caption of the [Product] dimension
=XL3HierarchyLookup( 1, "[Product]")
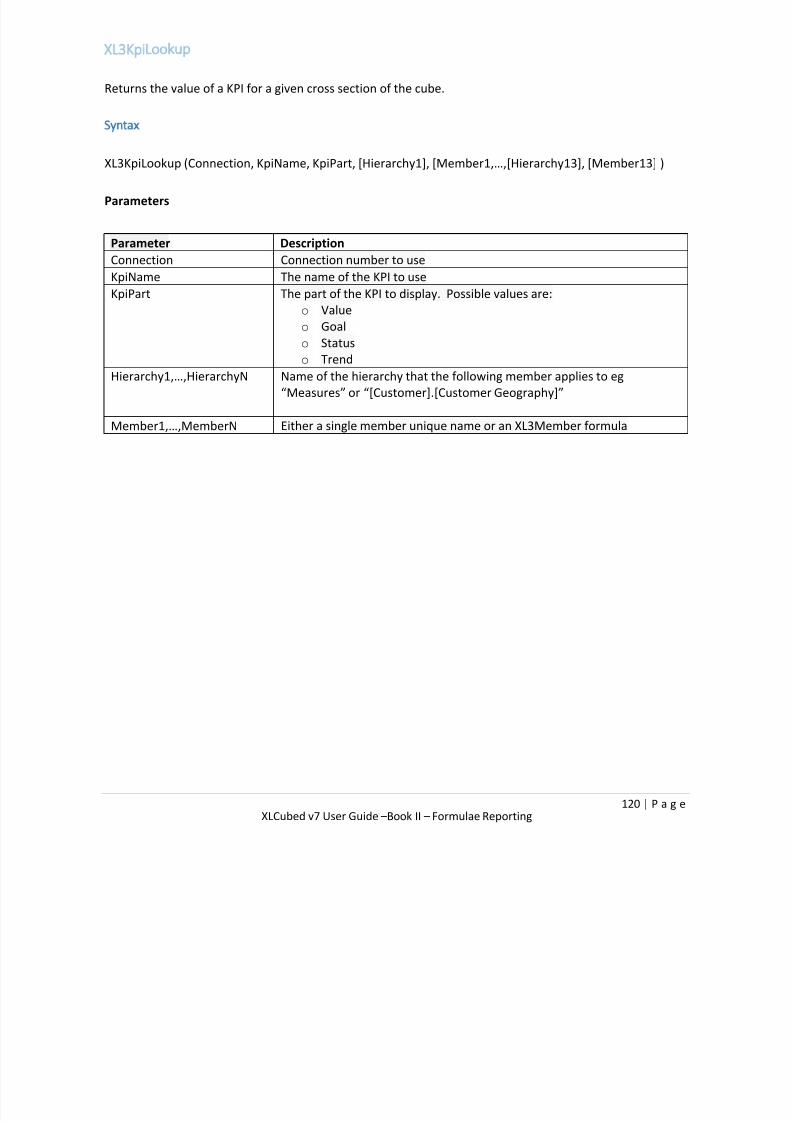
7/17/2019 XL Cubed versión 7 UserGuide
http://slidepdf.com/reader/full/xl-cubed-version-7-userguide 125/567
120 | P a g e XLCubed v7 User Guide –Book II – Formulae Reporting
XL3KpiLookup
Returns the value of a KPI for a given cross section of the cube.
Syntax
XL3KpiLookup (Connection, KpiName, KpiPart, [Hierarchy1], [Member1,…,[Hierarchy13], [Member13] )
Parameters
Parameter Description
Connection Connection number to use
KpiName The name of the KPI to use
KpiPart The part of the KPI to display. Possible values are:
o Value
o Goalo Status
o Trend
Hierarchy1,…,HierarchyN Name of the hierarchy that the following member applies to eg
“Measures” or “[Customer].[Customer Geography]”
Member1,…,MemberN Either a single member unique name or an XL3Member formula

7/17/2019 XL Cubed versión 7 UserGuide
http://slidepdf.com/reader/full/xl-cubed-version-7-userguide 126/567
121 | P a g e XLCubed v7 User Guide –Book II – Formulae Reporting
XL3KpiPropertyLookup
Returns a property of the given KPI.
Syntax
XL3KpiPropertyLookup( Connection, KpiName, KpiProperty )
Parameters
Parameter Description
Connection Connection number to use
KpiName The name of the KPI to use
KpiProperty The name of the property to return
KPI Properties
XL3KpiPropertyLookupsupports the following properties:
Parameter Description
MEASUREGROUP_NAME The associated measure group for the KPI
KPI_NAME The name of the KPI
KPI_CAPTION A label or caption associated with the KPI. Used primarily for display purposes.If a caption does not exist, KPI_NAME is returned
KPI_DESCRIPTION A human-readable description of the KPI
KPI_DISPLAY_FOLDER A string that identifies the path of the display folder that the client applicationuses to show the member
KPI_VALUE The unique name of the member in the measures dimension for the KPI Value
KPI_GOAL The unique name of the member in the measures dimension for the KPI Goal
KPI_STATUS The unique name of the member in the measures dimension for the KPI Status
KPI_TREND The unique name of the member in the measures dimension for the KPI Trend
KPI_STATUS_GRAPHIC The default graphical representation of the KPI
KPI_TREND_GRAPHIC The default graphical representation of the KPI
KPI_WEIGHT The unique name of the member in the measures dimension for the KPIWeight
KPI_CURRENT_TIME_MEMBER The unique name of the member in the time dimension that defines the
temporal context of the KPIKPI_PARENT_KPI_NAME The name of the parent KPI

7/17/2019 XL Cubed versión 7 UserGuide
http://slidepdf.com/reader/full/xl-cubed-version-7-userguide 127/567
122 | P a g e XLCubed v7 User Guide –Book II – Formulae Reporting
XL3LookupRW
Returns a cube cell value for a given cross section of the cube. Allows the formula to be typed on to
perform a writeback operation for the given tuple.
Use the Insert Formula > Value menu or ribbon item to insert the formula using a wizard. See here for
details.
Syntax
XL3LookupRW( Connection, [Hierarchy1], [Member1],?, [Hierarchy14], [Member14] )
Parameters
Parameter DescriptionConnection Connection number to use
Hierarchy Name of the hierarchy that the following member
applies to eg “Measures” or
“[Customer].[Customer Geography]”
Member1,……,MemberN Either a single member unique name or an
XL3Member formula
Examples (based on the Bicycle Sales cube)
Revenue 2004.
=XL3LookupRW( 1, "[Time]", "[Time].[2004]","[KeyFigures]","[KeyFigures].[Revenue]" )
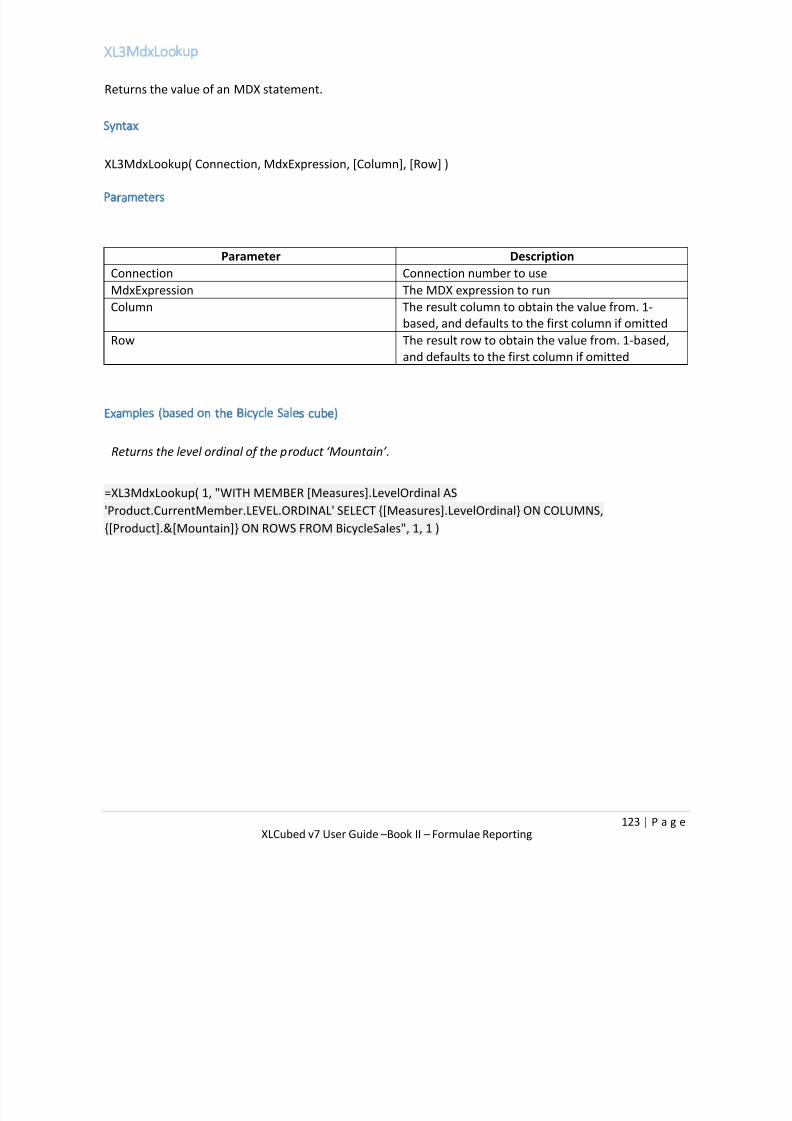
7/17/2019 XL Cubed versión 7 UserGuide
http://slidepdf.com/reader/full/xl-cubed-version-7-userguide 128/567
123 | P a g e XLCubed v7 User Guide –Book II – Formulae Reporting
XL3MdxLookup
Returns the value of an MDX statement.
Syntax
XL3MdxLookup( Connection, MdxExpression, [Column], [Row] )
Parameters
Parameter Description
Connection Connection number to use
MdxExpression The MDX expression to run
Column The result column to obtain the value from. 1-
based, and defaults to the first column if omitted
Row The result row to obtain the value from. 1-based,
and defaults to the first column if omitted
Examples (based on the Bicycle Sales cube)
Returns the level ordinal of the product ‘Mountain’ .
=XL3MdxLookup( 1, "WITH MEMBER [Measures].LevelOrdinal AS'Product.CurrentMember.LEVEL.ORDINAL' SELECT {[Measures].LevelOrdinal} ON COLUMNS,
{[Product].&[Mountain]} ON ROWS FROM BicycleSales", 1, 1 )

7/17/2019 XL Cubed versión 7 UserGuide
http://slidepdf.com/reader/full/xl-cubed-version-7-userguide 129/567
124 | P a g e XLCubed v7 User Guide –Book II – Formulae Reporting
XL3MdxMemberLookup
Returns the member of a specified position of an MDX statement.
Syntax
XL3MdxMemberLookup( Connection, MdxExpression, [Axis], [Hierarchy], [Position], [Format] )Parameters
Parameter Description
Connection Connection number to use
MdxExpression The MDX expression to run
Axis The number of the axis to obtain the member
from. 1-based, and defaults to the first axis if
omitted.
Hierarchy The number of the hierarchy on the axis to obtain
the member from. 1-based, and defaults to the
first hierarchy if omitted
Position The number of the member on the hierarchy to
use. 1-based, and defaults to the first member if
omitted.
Format The format to use for the returned member:
Examples (based on the Bicycle Sales cube)
Returns the 2nd child of the product group 'Mountain'
=XL3MdxLookup( 1, "WITH MEMBER [Measures].LevelOrdinal AS
'Product.CurrentMember.LEVEL.ORDINAL' SELECT {[Measures].LevelOrdinal} ON COLUMNS,{[Product].&[Mountain]} ON ROWS FROM BicycleSales", 1, 1 )

7/17/2019 XL Cubed versión 7 UserGuide
http://slidepdf.com/reader/full/xl-cubed-version-7-userguide 130/567
125 | P a g e XLCubed v7 User Guide –Book II – Formulae Reporting
XL3MdxDataSeries
Returns the set of values given by the specified MDX. Often used to provide a OLAP data source for
In-Cell Chart formulae.
Syntax
XL3MdxDataSeries( Connection, MdxExpression, Measure, Hierarchy1, Member1,…, Hierarchy13,
Member13 )
Parameters
Parameter Description
Connection Connection number to use
MdxExpression The MDX expression to runMeasure The measure to use
Hierarchy1,…,HierarchyN Name of the hierarchy that the following member
applies to eg “Measures” or
“[Customer].[Customer Geography]”
Member1,…,MemberN Either a single member unique name or an
XL3Member formula
Examples (based on the Bicycle Sales cube)
Returns the a set of 12 Revenues for January 2004 to December 2004
=XL3MdxDataSeries( 1, "{ LASTPERIODS(12,Time.[December 2004])*{KeyFigures.Revenue} }", "Value" )
Returns a column chart for a set of 12 Revenues for January 2004 to December 2004
=XL3SparkColumnsM( XL3MdxDataSeries( 1, "{ LASTPERIODS(12,Time.[December 2004])*{KeyFigures.Revenue} }", "Value" ) )

7/17/2019 XL Cubed versión 7 UserGuide
http://slidepdf.com/reader/full/xl-cubed-version-7-userguide 131/567
126 | P a g e XLCubed v7 User Guide –Book II – Formulae Reporting
XL3MemberAlias
Allows you to alias a member lookup to return a more readable name.
Parameter Description
Connection Connection number to use
Hierarchy Name of the hierarchy that the following member applies to eg“Measures” or “[Customer].[Customer Geography]”
Member Member to use. This will often point to a cell containing an
XL3Member formula
Alias Text that can be used to refer to the member specified. This
will often be used by a cell containing an Xl3Lookup formula

7/17/2019 XL Cubed versión 7 UserGuide
http://slidepdf.com/reader/full/xl-cubed-version-7-userguide 132/567
127 | P a g e XLCubed v7 User Guide –Book II – Formulae Reporting
XL3MemberChildLookup
Returns a name or caption of a child of a given member.
Syntax
XL3MemberChildLookup( Connection, Position, Hierarchy, Member )
Parameter Description
Connection Connection number to use
Position Number of the child to return
Hierarchy Name of the hierarchy that the following member applies to eg
“Measures” or “[Customer].[Customer Geography]”
Member Member whose child should be returned
Examples (based on the Bicycle Sales cube)
=XL3MemberChildLookup( 1, 2, "Product", "[Product].[Scenario W7000]" )

7/17/2019 XL Cubed versión 7 UserGuide
http://slidepdf.com/reader/full/xl-cubed-version-7-userguide 133/567
128 | P a g e XLCubed v7 User Guide –Book II – Formulae Reporting
XL3MemberLevelLookup
Returns a name or caption of a member at a given level.
Syntax
XL3MemberLevelLookup( Connection, Position, Hierarchy, Level)
Parameter Description
Connection Connection number to use
Position Number of member to return
Hierarchy Name of the hierarchy that the following member applies to eg
“Measures” or “[Customer].[Customer Geography]”
Level Level whose child should be returned
Examples (based on the Bicycle Sales cube)
Returns ‘Asia’, the 3rd member on level ‘Continent’
=XL3MemberLevelLookup( 1, 3, "Region", "Continent" )
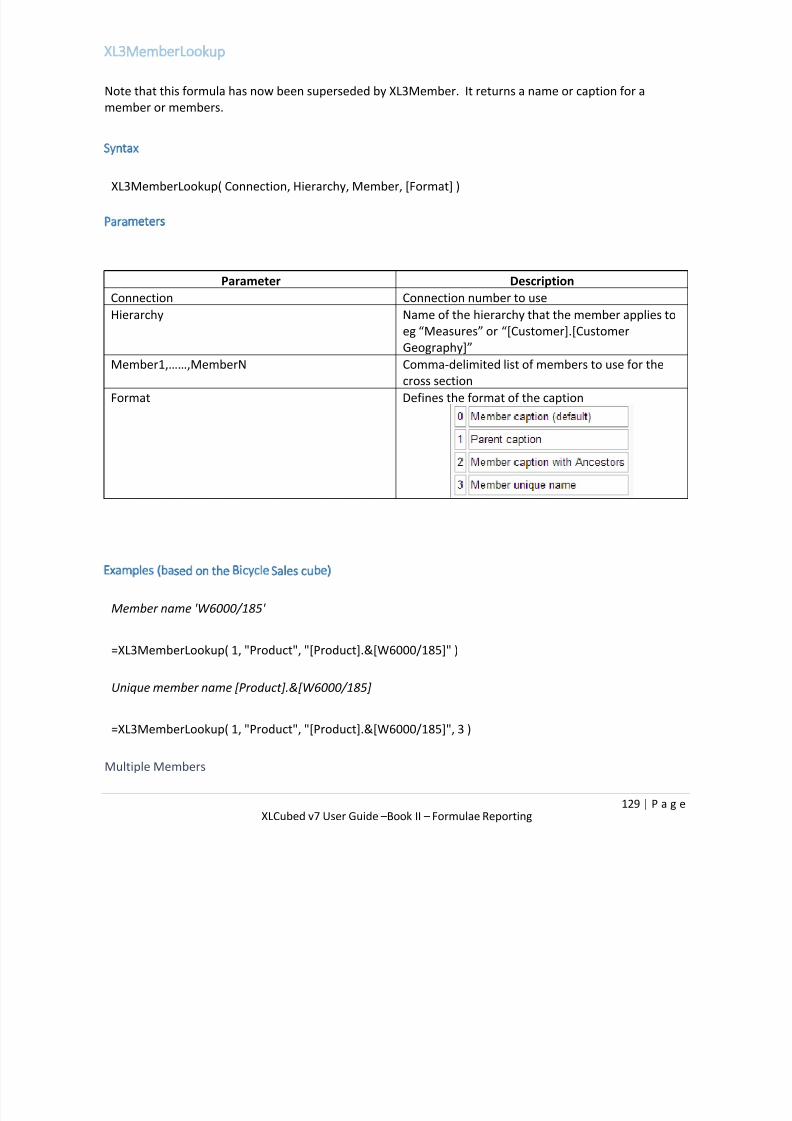
7/17/2019 XL Cubed versión 7 UserGuide
http://slidepdf.com/reader/full/xl-cubed-version-7-userguide 134/567
129 | P a g e XLCubed v7 User Guide –Book II – Formulae Reporting
XL3MemberLookup
Note that this formula has now been superseded by XL3Member. It returns a name or caption for a
member or members.
Syntax
XL3MemberLookup( Connection, Hierarchy, Member, [Format] )
Parameters
Parameter Description
Connection Connection number to use
Hierarchy Name of the hierarchy that the member applies to
eg “Measures” or “[Customer].[CustomerGeography]”
Member1,……,MemberN Comma-delimited list of members to use for the
cross section
Format Defines the format of the caption
Examples (based on the Bicycle Sales cube)
Member name 'W6000/185'
=XL3MemberLookup( 1, "Product", "[Product].&[W6000/185]" )
Unique member name [Product].&[W6000/185]
=XL3MemberLookup( 1, "Product", "[Product].&[W6000/185]", 3 )
Multiple Members

7/17/2019 XL Cubed versión 7 UserGuide
http://slidepdf.com/reader/full/xl-cubed-version-7-userguide 135/567
130 | P a g e XLCubed v7 User Guide –Book II – Formulae Reporting
You can specify multiple members for the Memberparameter by separating them with a comma.
When referred to by an XL3Lookup formula, it returns the sum of Allround and Mountain Bikes.
=XL3MemberLookup( 1, "Product", "[Product].&[Allround],[Product].&[Mountain]", 0)
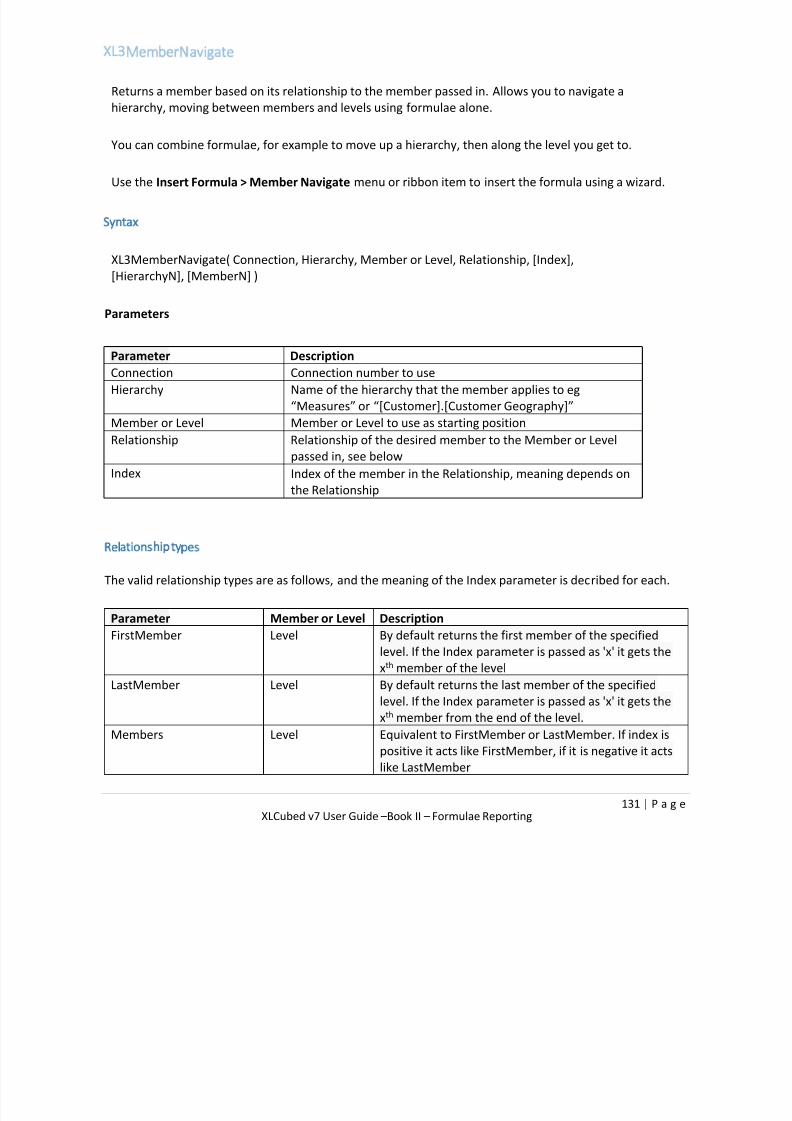
7/17/2019 XL Cubed versión 7 UserGuide
http://slidepdf.com/reader/full/xl-cubed-version-7-userguide 136/567
131 | P a g e XLCubed v7 User Guide –Book II – Formulae Reporting
XL3MemberNavigate
Returns a member based on its relationship to the member passed in. Allows you to navigate a
hierarchy, moving between members and levels using formulae alone.
You can combine formulae, for example to move up a hierarchy, then along the level you get to.
Use the Insert Formula > Member Navigate menu or ribbon item to insert the formula using a wizard.
Syntax
XL3MemberNavigate( Connection, Hierarchy, Member or Level, Relationship, [Index],
[HierarchyN], [MemberN] )
Parameters
Parameter Description
Connection Connection number to use
Hierarchy Name of the hierarchy that the member applies to eg
“Measures” or “[Customer].[Customer Geography]”
Member or Level Member or Level to use as starting position
Relationship Relationship of the desired member to the Member or Level
passed in, see below
Index Index of the member in the Relationship, meaning depends on
the Relationship
Relationship types
The valid relationship types are as follows, and the meaning of the Index parameter is decribed for each.
Parameter Member or Level Description
FirstMember Level By default returns the first member of the specified
level. If the Index parameter is passed as 'x' it gets the
xth member of the level
LastMember Level By default returns the last member of the specified
level. If the Index parameter is passed as 'x' it gets the
xth member from the end of the level.
Members Level Equivalent to FirstMember or LastMember. If index is
positive it acts like FirstMember, if it is negative it acts
like LastMember

7/17/2019 XL Cubed versión 7 UserGuide
http://slidepdf.com/reader/full/xl-cubed-version-7-userguide 137/567
132 | P a g e XLCubed v7 User Guide –Book II – Formulae Reporting
Parent Member Gets the parent of the member passed in. If index is 2,
it will retreive the grandparent (parent of the parent),
3 the great-grandparent etc
Next Member Gets the next member following the member passed
in. If index is greater than one then it skips forwards
that number of members.
Previous Member Gets the previous member preceding the member
passed in. If index is greater than one then it skipsbackwards that number of members
FirstSibling Member Gets the first member with the same parent as the
member passed in. If index is greater than one then it
gets the child at that index
LastSibling Member Gets the last member with the same parent as the
member passed in. If index is greater than one then it
gets the child at that index from the last sibling
Siblings Member Equivalent to FirstSibling or LastSibling. If index is
positive it acts like FirstSibling, if it is negative it acts
like LastSibling.FirstChild Member Gets the first child of the member passed in. If index is
greater than one then it gets the child as that index.
LastChild Member Gets the last child of the member passed in. If index is
greater than one then it gets the child at that index
from the last child.
Children Member Equivalent to FirstChild or LastChild. If index is positive
it acts like FirstChild, if it is negative it acts like
LastChild.
FirstDescendantAtLevel Member Gets the first descendant of the member at a level
specified by index. Index is one based. (new in v7.1)LastDescendantAtLevel Member Gets the last descendant of the member at a level
specified by index. Index is one based. (new in v7.1)
FirstDescendantAtDistance Member Gets the first descendant of the member at a distance
specified by index. An index of one is equivalent of
children. (new in v7.1)
LastDescendantAtDistance Member Gets the last descendant of the member at a distance
specified by index. An index of one is equivalent of
children. (new in v7.1)
DefaultMember Any Gets the default member for the hierarchy (new in
v7.6)
Non-Empty behaviour
Sometimes you need to restrict the members by those with data. To do this you can specify
hierarchy/member pairs for which data must exist.

7/17/2019 XL Cubed versión 7 UserGuide
http://slidepdf.com/reader/full/xl-cubed-version-7-userguide 138/567
133 | P a g e XLCubed v7 User Guide –Book II – Formulae Reporting
For example you may want the last date where data exists. To do this you could add a measure to a
XL3MemberNavigate on the LastMember of a level.
For example:
=XL3MemberNavigate(1,"[Date].[Calendar]","[Date].[Calendar].[Date]","LastMember")
August 31, 2004
=XL3MemberNavigate(1,"[Date].[Calendar]","[Date].[Calendar].[Date]","LastMember", 1,
"[Measures]", "[Measures].[Reseller Sales Amount]")
June 1, 2004
Examples (based on the Bicycle Sales cube)
Level Relationships
These examples assume that [Time].[Year] is in cell A1
=XL3MemberNavigate( 1, "Time", A1, "FirstMember" )
• 2002
=XL3MemberNavigate( 1, "Time", A1, "LastMember", 2 )
• 2004
Member Relationships
These examples assume that [Time].[All].&[2003].&[Q2] is in cell A1
=XL3MemberNavigate( 1, "Time", A1, "Parent" )
• 2003
=XL3MemberNavigate( 1, "Time", A1, "Parent", 2 )
• All
=XL3MemberNavigate( 1, "Time", A1, "Next" )
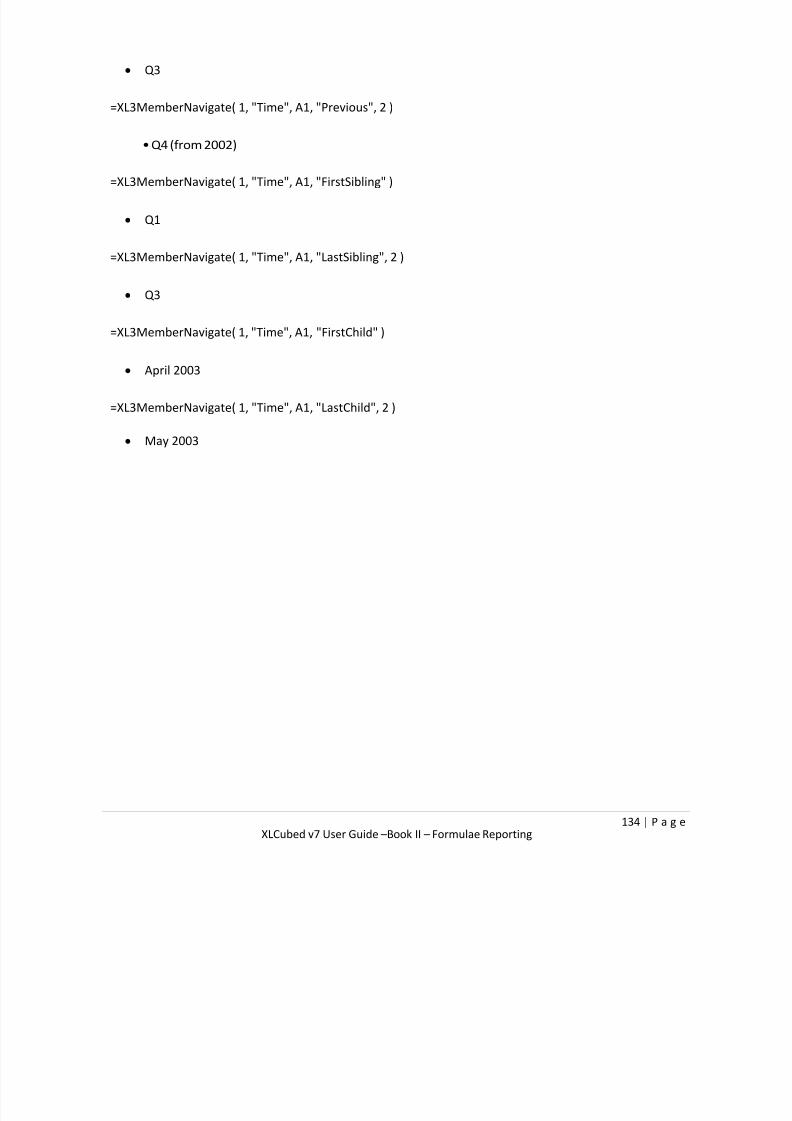
7/17/2019 XL Cubed versión 7 UserGuide
http://slidepdf.com/reader/full/xl-cubed-version-7-userguide 139/567
134 | P a g e XLCubed v7 User Guide –Book II – Formulae Reporting
Q3
=XL3MemberNavigate( 1, "Time", A1, "Previous", 2 )
• Q4 (from 2002)
=XL3MemberNavigate( 1, "Time", A1, "FirstSibling" )
Q1
=XL3MemberNavigate( 1, "Time", A1, "LastSibling", 2 )
Q3
=XL3MemberNavigate( 1, "Time", A1, "FirstChild" )
April 2003
=XL3MemberNavigate( 1, "Time", A1, "LastChild", 2 )
May 2003

7/17/2019 XL Cubed versión 7 UserGuide
http://slidepdf.com/reader/full/xl-cubed-version-7-userguide 140/567
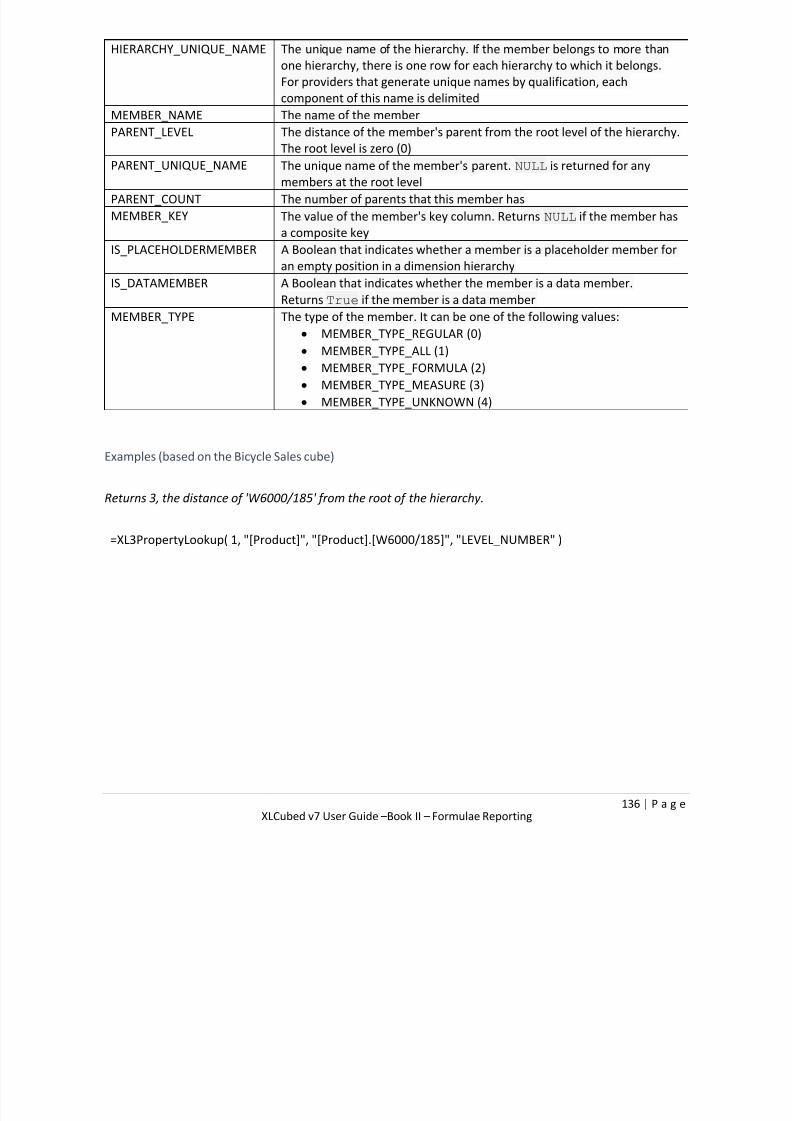
7/17/2019 XL Cubed versión 7 UserGuide
http://slidepdf.com/reader/full/xl-cubed-version-7-userguide 141/567
136 | P a g e XLCubed v7 User Guide –Book II – Formulae Reporting
HIERARCHY_UNIQUE_NAME The unique name of the hierarchy. If the member belongs to more than
one hierarchy, there is one row for each hierarchy to which it belongs.
For providers that generate unique names by qualification, each
component of this name is delimited
MEMBER_NAME The name of the member
PARENT_LEVEL The distance of the member's parent from the root level of the hierarchy.
The root level is zero (0)
PARENT_UNIQUE_NAME The unique name of the member's parent. NULL is returned for anymembers at the root level
PARENT_COUNT The number of parents that this member has
MEMBER_KEY The value of the member's key column. Returns NULL if the member has
a composite key
IS_PLACEHOLDERMEMBER A Boolean that indicates whether a member is a placeholder member for
an empty position in a dimension hierarchy
IS_DATAMEMBER A Boolean that indicates whether the member is a data member.
Returns True if the member is a data member
MEMBER_TYPE The type of the member. It can be one of the following values:
MEMBER_TYPE_REGULAR (0) MEMBER_TYPE_ALL (1)
MEMBER_TYPE_FORMULA (2)
MEMBER_TYPE_MEASURE (3)
MEMBER_TYPE_UNKNOWN (4)
Examples (based on the Bicycle Sales cube)
Returns 3, the distance of 'W6000/185' from the root of the hierarchy.
=XL3PropertyLookup( 1, "[Product]", "[Product].[W6000/185]", "LEVEL_NUMBER" )

7/17/2019 XL Cubed versión 7 UserGuide
http://slidepdf.com/reader/full/xl-cubed-version-7-userguide 142/567
137 | P a g e XLCubed v7 User Guide –Book II – Formulae Reporting
XL3RankLookup
Returns the member at the specified position of a ranking. To return the value of the member instead, use
the XL3ValueRankLookup formula.
Use the XLCubed > Insert Formula > Ranking menu or ribbon item to insert the formula using a wizard. See
here for details.
Syntax
XL3RankLookup( Connection, Position, TopOrBottom, MaxCount, Measure, RankHierarchy, RankMembers,
Hierarchy1, Member1,?, [Hierarchy11], [Member11] )
Parameters
Parameter DescriptionConnection Connection number to use
Position Position in the ranking to return
RankingType The ranking type. Use the sum of the following
possibilities:
MaxCount The maximum number of members to return in the
ranking
Measure The measure on which to rank
RankHierarchy Name of the hierarchy that the member applies to
eg “Measures” or “[Customer].[Customer
Geography]”
RankMembers An XL3MemberSet formula to specify what to rank
over
Hierarchy Name of the hierarchy that the member applies toeg “Measures” or “[Customer].[Customer
Geography]”
Member1,……,MemberN Either a single member unique name or an
XL3Member formula to filter the ranking across

7/17/2019 XL Cubed versión 7 UserGuide
http://slidepdf.com/reader/full/xl-cubed-version-7-userguide 143/567
138 | P a g e XLCubed v7 User Guide –Book II – Formulae Reporting
Examples (based on the Bicycle Sales cube)
Returns 'AS800/195', the 2nd ranked product in the tuple ([Time].[2003], [KeyFigures].[Revenue],
[Scenario].[Budget]).
=XL3RankLookup( 1, 2, 0, 10, "[Measures].[Value]", "Product", XL3MemberSet( 1, "[Product]", "",
"DescendantsAt", "[Product].[Product]" ), "Time", "2003", "KeyFigures", "Revenue", "Scenario", "Budget" )

7/17/2019 XL Cubed versión 7 UserGuide
http://slidepdf.com/reader/full/xl-cubed-version-7-userguide 144/567
139 | P a g e XLCubed v7 User Guide –Book II – Formulae Reporting
XL3SetProperty
This function updates XLCubed objects in the workbook such as grids, slicers and small multiples.
You can use this to update some setting from the properties screen or move hierarchies.
Syntax
XL3SetProperty( ObjectType, ObjectName, Property, Arg1, [Arg2],…, [Arg27] )
Parameters
Parameter Description
ObjectType Object Type to update. Valid values are "Workbook", "Grid",
"Slicer", "SmallMultiple" and "Chart".
ObjectName Name of the object to update. You can not update an object
unless you have given it a name in its properties screen
Property Name of the property to update. Valid names depend on theobject type. Details for each are below.
Arg1, [Arg2],…, [Arg27] Value or values to set the property to. Valid values depend on
the object type. Details for each are below.
Workbook
For workbook level properties the object name refers to the area of the product being updated.
Object Name Property Description ValueObjectType “Spreadmethod” Sets the formula spread method Valid values are
"USE_EQUAL_ALLOCATION",
"USE_EQUAL_INCREMENT",
"USE_WEIGHTED_ALLOCATION",
"USE_WEIGHTED_INCREMENT"
Grid
Grid Display
Property Description Value
"RemoveEmptyColumns" Sets the columns to hide or
show members with no data.
TRUE or FALSE
"RemoveEmptyRows" Sets the rows to hide or show
members with no data.
TRUE or FALSE

7/17/2019 XL Cubed versión 7 UserGuide
http://slidepdf.com/reader/full/xl-cubed-version-7-userguide 145/567
140 | P a g e XLCubed v7 User Guide –Book II – Formulae Reporting
"HierarchiesOnHeaders" Sets hierarchies on headers.
Will move hierarchies as
required.
Hierarchy name or names.
"HierarchiesOnColumns" Sets hierarchies on columns.
Will move hierarchies as
required.
Hierarchy name or names.
"HierarchiesOnRows" Sets hierarchies on rows. Works
as HierarchiesOnColumns.
Hierarchy name or names.
"MergeRepeatingCells" Merge cells containing the same
member in cross-joins.
TRUE or FALSE
“MemberSelectionType” Sets the selection type of the
members, e.g. children, parent,
descendants etc
See the Member Selection
Type section for more details
Grid Permissions
See Book I – Grids and the section on Grid Permissions for details of what the following options do:
Property Value"ColumnMembers" TRUE or FALSE" ColumnNavigation" TRUE or FALSE"RowMembers" TRUE or FALSE
"RowNavigation" TRUE or FALSE"DimensionNavigation" TRUE or FALSE"Menus" TRUE or FALSE“SlicerMembers” TRUE or FALSE
Slicer
Property Description Value
"RemoveEmpty" Sets the slicer to hide or show
members with no data.
TRUE or FALSE
"Visible" Show or hide the slicer (will only
be applied for published
reports)
TRUE or FALSE
"Multiselect" Allow multi selection on the
slicer, dependant on slicer type
TRUE or FALSE
"MemberSelectionType" Sets the selection type of the
members eg children, parent,
descendants etc
See the Member Selection Type
section for more details
Table
Property Description Value

7/17/2019 XL Cubed versión 7 UserGuide
http://slidepdf.com/reader/full/xl-cubed-version-7-userguide 146/567
141 | P a g e XLCubed v7 User Guide –Book II – Formulae Reporting
"ColunmDisplay" Sets the column(s) shown and
their order (new in v7.1)
Equivalent to setting up the columns on the ColumnDisplay tab in the table properties. The column displaymust be enabled in the properties for this to take effect.
"Sorting" Sets the column(s) to sort by
(new in v7.1) Pairs of column name and direction. If no direction is
provided ascending is assume. e.g.
=XL3SetProperty("Table", "myTable",
"Sorting", "Product", "asc", "Profit",
"desc")
Small Multiple
Property Description Value
"RemoveEmptyCategories" Sets the categories to hide or
show members with no data
TRUE or FALSE
"RemoveEmptySeries" Sets the series to hide or show
members with no data.
TRUE or FALSE
"RemoveEmptyColumns" Sets the columns to hide or
show members with no data.
TRUE or FALSE
"RemoveEmptyRows" Sets the rows to hide or show
members with no data.
TRUE or FALSE
"HierarchiesOnCategories" Sets hierarchies on categories.
Will move hierarchies as
required.
Hierarchy name or names
"HierarchiesOnSeries" Sets hierarchies on series.
Works as
HierarchiesOnCategories
Hierarchy name or names
"HierarchiesOnColumns" Sets hierarchies on columns.
Works as
HierarchiesOnCategories.
Hierarchy name or names
"HierarchiesOnRows" Sets hierarchies on rows. Works
as HierarchiesOnCategories.
Hierarchy name or names
"MemberSelectionType" Sets the selection type of the
members, e.g. children, parent,
descendants etc.
See the Member Selection
Type section for more details.
"ChartType" Sets chart type of the series. Valid values are "Column",
"StackedColumn","StackedColumn100", "Bar",
"StackedBar", "StackedBar100",
"Area", "StackedArea",
"StackedArea100", "Line".
"ChartType2" Sets chart type of the series
once moved to the secondary
axis.
Same as ChartType.

7/17/2019 XL Cubed versión 7 UserGuide
http://slidepdf.com/reader/full/xl-cubed-version-7-userguide 147/567
142 | P a g e XLCubed v7 User Guide –Book II – Formulae Reporting
Chart
Property Description Value"YMin" or "YMax" Sets the limit of the Y axis Numeric
“Y2Min” or “Y2Max” Sets the limit of the Y2 axis Numeric
“XMin” or “XMax” Sets the limit of the X axis Numeric
“X2Min” or “X2Max” Sets the limit of the X” axis Numeric

7/17/2019 XL Cubed versión 7 UserGuide
http://slidepdf.com/reader/full/xl-cubed-version-7-userguide 148/567
143 | P a g e XLCubed v7 User Guide –Book II – Formulae Reporting
XL3ValueRankLookup
Returns the value at the specified position of a ranking. To return the member name instead, use the
XL3RankLookup formula.
Use the XLCubed > Insert Formula > Ranking menu or ribbon item to insert the formula using a wizard.
See here for details.
Syntax
XL3ValueRankLookup( Connection, Position, TopOrBottom, MaxCount, Measure, RankHierarchy,
RankMembers, Hierarchy1, Member1,?, [Hierarchy11], [Member11] )
Parameters
Parameter DescriptionConnection Connection number to use
Position Position in the ranking to return
RankingType The ranking type. Use the sum of the following
possibilities:
MaxCount The maximum number of members to return in the
ranking
Measure The measure on which to rank
RankHierarchy Name of the hierarchy that the member applies to
eg “Measures” or “[Customer].[Customer
Geography]”
RankMembers An XL3MemberSet formula to specify what to rank
over
Hierarchy Name of the hierarchy that the member applies to
eg “Measures” or “[Customer].[Customer
Geography]”
Member1,……,MemberN Either a single member unique name or an
XL3Member formula to filter the ranking across
Examples (based on the Bicycle Sales cube)

7/17/2019 XL Cubed versión 7 UserGuide
http://slidepdf.com/reader/full/xl-cubed-version-7-userguide 149/567
144 | P a g e XLCubed v7 User Guide –Book II – Formulae Reporting
Returns the value of 'AS800/195', the 2nd ranked product in the tuple ([Time].[2003],
[KeyFigures].[Revenue], [Scenario].[Budget]).
=XL3ValueRankLookup( 1, 2, 0, 10, "[Measures].[Value]", "Product", XL3MemberSet( 1, "[Product]", "",
"DescendantsAt", "[Product].[Product]" ), "Time", "2003", "KeyFigures", "Revenue", "Scenario", "Budget"

7/17/2019 XL Cubed versión 7 UserGuide
http://slidepdf.com/reader/full/xl-cubed-version-7-userguide 150/567
145 | P a g e XLCubed v7 User Guide –Book II – Formulae Reporting

7/17/2019 XL Cubed versión 7 UserGuide
http://slidepdf.com/reader/full/xl-cubed-version-7-userguide 151/567
146 | P a g e XLCubed v7 User Guide –Book II – Formulae Reporting
XL3LastCubeUpdate
Returns the date and time that the cube was last updated.
Syntax
XL3LastCubeUpdate (Connection)
Parameters
Parameter Description
Connection Connection number of the cube to retrieve the last update time for

7/17/2019 XL Cubed versión 7 UserGuide
http://slidepdf.com/reader/full/xl-cubed-version-7-userguide 152/567
147 | P a g e XLCubed v7 User Guide –Book II – Formulae Reporting
XL3UserName
Returns the user id of currently logged in user, optionally including the domain name
Syntax
XL3UserName (Domain)
Parameters
Parameter Description
Domain Boolean value, pass True to return the domain as part of the username
DOMAIN\USER (optional)

7/17/2019 XL Cubed versión 7 UserGuide
http://slidepdf.com/reader/full/xl-cubed-version-7-userguide 153/567
148 | P a g e XLCubed v7 User Guide –Book II – Formulae Reporting
XL3GridMember
Returns the member uniquename for the specified grid cell. This can be useful for when you want to get
the unique name of a particular member from a grid for passing as an XL3Link parameter or to use in other
formulae (VLOOKUP, XL3Lookup etc.) - avoiding any issues with duplicate/translated captions etc.
Syntax
XL3GridMember ( )
Parameters
The parameters can take one of two forms:
Parameter DescriptionGrid cell location Shows member uniquename for grid cell
Or
Parameter Description
Grid name Name of the grid to get the member for
Axis 1 for columns, 2 for rows
Dimension Dimension on the axis to look at, 1-based
Member Index Member index to look at, 1-based
Examples
Form 1
Used in conjunction with XL3Link, the following formula copies the unique name from the row when the
report user clicks on "..." into the cell $A$14:
=XL3Link(XL3Address($D$7),"...",,XL3Address($A$14),XL3GridMember(A7))

7/17/2019 XL Cubed versión 7 UserGuide
http://slidepdf.com/reader/full/xl-cubed-version-7-userguide 154/567
149 | P a g e XLCubed v7 User Guide –Book II – Formulae Reporting
Form 2The second structure provides a more dynamic way to address the members that appear on the grid, for
example:
Return the first member from the first hierarchy on columns:
=XL3GridMember("My Grid",1,1,1)
In the above example this is: [Geography].[Geography].[All Geographies]
Return the nth member from the first hierarchy on rows:
=XL3GridMember("My Grid",2,1,nth)
You would only need to consider the hierarchy number if the Axis has cross-joined hierarchies.

7/17/2019 XL Cubed versión 7 UserGuide
http://slidepdf.com/reader/full/xl-cubed-version-7-userguide 155/567
150 | P a g e XLCubed v7 User Guide –Book II – Formulae Reporting
XL3LookupTabular
Returns a value for a given measure for a specific filter,
Syntax
XL3LookupTabular( Connection, Measure, [Column1], [Value1],…, [Column14], [Value14] )
Parameters
Parameter Description
Connection Connection number to use
Measure Measure to calculate
Column1,…, ColumnN Name of the hierarchy that the following value applies to e.g.
"Date[Year]" or "'Customer Geography'[City]"
Value,…..,ValueN Value for the preceding column. Can be text, numeric, date or
boolean.
Examples
Revenue 2004.
=XL3LookupTabular( 1, "Revenue", "'Date'[Year]", 2004 )
Revenue 2004, USA.
=XL3LookupTabular( 1, "Revenue", "'Date'[Year]", 2004, "'Geography'[Country]", "USA" )
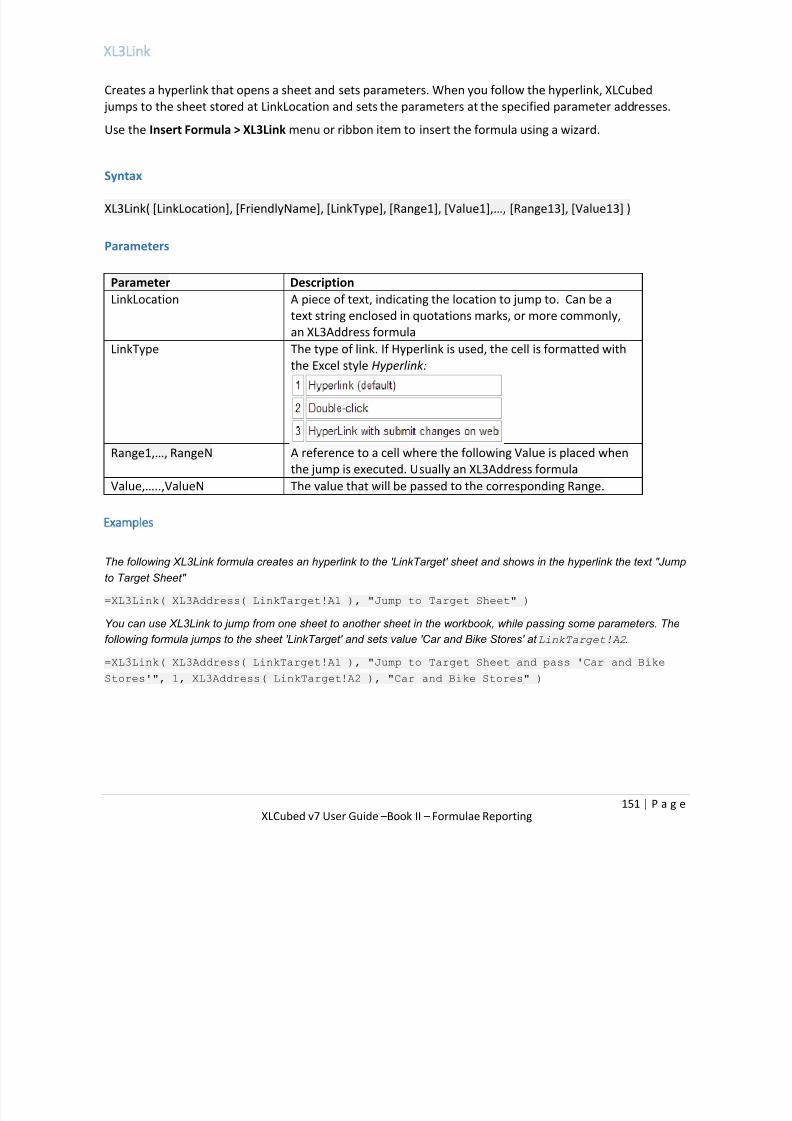
7/17/2019 XL Cubed versión 7 UserGuide
http://slidepdf.com/reader/full/xl-cubed-version-7-userguide 156/567
151 | P a g e XLCubed v7 User Guide –Book II – Formulae Reporting
XL3Link
Creates a hyperlink that opens a sheet and sets parameters. When you follow the hyperlink, XLCubed
jumps to the sheet stored at LinkLocation and sets the parameters at the specified parameter addresses.
Use the Insert Formula > XL3Link menu or ribbon item to insert the formula using a wizard.
Syntax
XL3Link( [LinkLocation], [FriendlyName], [LinkType], [Range1], [Value1],…, [Range13], [Value13] )
Parameters
Parameter Description
LinkLocation A piece of text, indicating the location to jump to. Can be a
text string enclosed in quotations marks, or more commonly,
an XL3Address formulaLinkType The type of link. If Hyperlink is used, the cell is formatted with
the Excel style Hyperlink:
Range1,…, RangeN A reference to a cell where the following Value is placed when
the jump is executed. Usually an XL3Address formula
Value,…..,ValueN The value that will be passed to the corresponding Range.
Examples
The following XL3Link formula creates an hyperlink to the 'LinkTarget' sheet and shows in the hyperlink the text "Jump
to Target Sheet"
=XL3Link( XL3Address( LinkTarget!A1 ), "Jump to Target Sheet" )
You can use XL3Link to jump from one sheet to another sheet in the workbook, while passing some parameters. The
following formula jumps to the sheet 'LinkTarget' and sets value 'Car and Bike Stores' at LinkTarget!A2.
=XL3Link( XL3Address( LinkTarget!A1 ), "Jump to Target Sheet and pass 'Car and BikeStores'", 1, XL3Address( LinkTarget!A2 ), "Car and Bike Stores" )

7/17/2019 XL Cubed versión 7 UserGuide
http://slidepdf.com/reader/full/xl-cubed-version-7-userguide 157/567
152 | P a g e XLCubed v7 User Guide –Book II – Formulae Reporting
XL3RowVisible
Shows and hides the row the formula is in.
Syntax
XL3RowVisible( Visible )
Parameters
Parameter Description
Visible If set to TRUE the row is shown; if set to FALSE the row is
hidden
Examples
Hides the row if the value in cell A3is less than or equal to 10000.
=XL3RowVisible( A3 > 10000 )

7/17/2019 XL Cubed versión 7 UserGuide
http://slidepdf.com/reader/full/xl-cubed-version-7-userguide 158/567
153 | P a g e XLCubed v7 User Guide –Book II – Formulae Reporting
XL3ColumnVisible
Shows and hides the column the formula is in.
Syntax
XL3ColumnVisible( Visible )
Parameters
Parameter Description
Visible If set to TRUE the column is shown; if set to FALSE the column
is hidden
Examples
Shows the column if the value in cell C5contains an error.
=XL3ColumnVisible( IsError( C5 ) )

7/17/2019 XL Cubed versión 7 UserGuide
http://slidepdf.com/reader/full/xl-cubed-version-7-userguide 159/567
154 | P a g e XLCubed v7 User Guide –Book II – Formulae Reporting

7/17/2019 XL Cubed versión 7 UserGuide
http://slidepdf.com/reader/full/xl-cubed-version-7-userguide 160/567
155 | P a g e XLCubed v7 User Guide –Book II – Formulae Reporting
Insert Ranking
A simple ranking report containing XL3RankLookupand XL3ValueRankLookupformulae can be inserted
directly into the spreadsheet using the XLCubed > Insert Formula > Ranking ribbon or menu option.
To insert a ranking report:
Select the XLCubed > Insert Formula > Ranking ribbon or menu option:
• Choose a location for the report
Choose the hierarchy to return a ranking for
Choose the type of selection:
o Rank at level: returns a ranking of the members at the selected level
o Rank by selection: allows you to choose a custom member selection to include in the
report
Click OK and the formulae will be inserted
Additional Options
• Additional filters can be specified in the grid on the right of the dialog
• You can choose whether to get the highest or lowest ranked members by selecting
Rank from Top or Bottom
• The number of members to return in the ranking can be chosen
• Various other options can be selected for the ranking:
Show title A brief summary of the ranking report is displayedShow headings Displays a heading for each column of the report
Show totals Totals are displayed at the foot of each column
Show percentages A column is added showing the percentage contribution for
each row
Show cumulative percentages A column is adding showing the cumulative percentage up to
that row
Exclude zeroes Zero values are excluded from the report
Exclude nulls Null values are excluded from the report

7/17/2019 XL Cubed versión 7 UserGuide
http://slidepdf.com/reader/full/xl-cubed-version-7-userguide 161/567
156 | P a g e XLCubed v7 User Guide –Book II – Formulae Reporting
XL3SparkLine
Creates a line, point or area chart that is rendered in an Excel cell.
Double-clicking the chart, or selecting the XLCubed > Format In-Cell Chart... right-click menu item allow
the editing of the chart format using the SparkLine Chart Designer.
Syntax
XL3SparkLine( Data, Output, InRows, [LineType], [LineColour], [PointColour], [NegativePointColour],
[PeriodLength], [PeriodColour], [StartColour], [EndColour], [MinColour], [MaxColour], [ReferenceValues],
[ReferenceColour], [Minimum], [Maximum], [UseCommonScale], [NormalLowerBounds],
[NormalUpperBounds], [NormalBandColour], [AreaColour], [ScaleFactor], [MissingValueHandling], [Label] )
Parameters
Parameter Description
Data The data to chart. This can be a range or a formula
Output The target range in which to render the chart(s)
InRows Specifies whether the input data are in rows or columns:
LineType Specifies how to plot the data:
LineColour The colour to use for the line
PointColour The default colour to use for the data points
NegativePointColour The default colour to use for negative data points
PeriodLength The length of the period for alternate background shading
PeriodColour The colour of the alternate background shading
StartColour The colour to highlight the first point, or -1 or an empty parameter for none
EndColour The colour to highlight the lowest point, or -1 or an empty parameter for none
MinColour The colour to highlight the lowest point, or -1 or an empty parameter for none
MaxColour The colour to highlight the highest point, or -1 or an empty parameter for noneReferenceValues A value or range to use for a reference line. To use the mean value instead, use
“Average”
ReferenceColour The colour to use for the reference line, or -1 or an empty parameter for none
Minimum A value to use for the minimum vertical axis value, or an empty parameter to
use an automatic value
Maximum A value to use for the maximum vertical axis value, or an empty parameter to
use an automatic value
UseCommonScale Use 1 here to force all charts to use a common scale

7/17/2019 XL Cubed versión 7 UserGuide
http://slidepdf.com/reader/full/xl-cubed-version-7-userguide 162/567
157 | P a g e XLCubed v7 User Guide –Book II – Formulae Reporting
NormalLowerBounds A value or range to use for the lower bounds of the normal bands
NormalUpperBounds A value or range to use for the upper bounds of the normal bands
NormalBandColour The colour to use for the normal band, or -1 or an empty parameter for none
AreaColour The colour to fill the chart area under the line, or -1 or an empty parameter for
none
ScaleFactor The horizontal scale factor to use when drawing the chart
MissingValueHandling Specifies how missing values should be rendered:
Label Specifies the text to use in the formula cell
XL3SparkLineM
Creates a monochrome line or point chart that is rendered in the Excel cell.
Syntax
XL3SparkLineM( Data, [LineType], [ScaleFactor], [Minimum], [Maximum], [MissingValueHandling] )
Parameters
Parameter Description
Data The data to chart. This can be a range or a formula
LineType Specifies how to plot the data:
ScaleFactor The horizontal scale factor to use when drawing the chart
Minimum A value to use for the minimum vertical axis value, or an empty parameter to
use an automatic value
Maximum A value to use for the maximum vertical axis value, or an empty parameter to
use an automatic valueMissingValueHandling Specifies how missing values should be rendered:

7/17/2019 XL Cubed versión 7 UserGuide
http://slidepdf.com/reader/full/xl-cubed-version-7-userguide 163/567
158 | P a g e XLCubed v7 User Guide –Book II – Formulae Reporting
XL3SparkColumns
Creates a column chart that is rendered in an Excel cell.
Double-clicking the chart, or selecting the XLCubed > Format In-Cell Chart... right-click menu item allow
the editing of the chart format using the SparkColumns Chart Designer.
Syntax
XL3SparkColumns( Data, Output, InRows, [ColumnColour], [NegativeColumnColour], [ColumnWidth],
[PeriodLength], [PeriodColour], [NegativePeriodColour], [StartColour], [EndColour], [MinColour],
[MaxColour], [ReferenceValues], [ReferenceColour], [Minimum], [Maximum], [UseCommonScale], [Label] )
Parameters
Parameter Description
Data The data to chart. This can be a range or a formula
Output The target range in which to render the chart(s)
InRows Specifies whether the input data are in rows or columns:
ColumnColour The default colour to use for the columns
NegativeColumnColour The default colour to use for negative columns
ColumnWidth The width of each column
PeriodLength The length of the period for alternate column shading
PeriodColour The colour of the alternately coloured columns
StartColour The colour to highlight the first point, or -1 or an empty parameter for none
EndColour The colour to highlight the lowest point, or -1 or an empty parameter for none
MinColour The colour to highlight the lowest point, or -1 or an empty parameter for none
MaxColour The colour to highlight the highest point, or -1 or an empty parameter for
none
ReferenceValues A value or range to use for a reference line. To use the mean value instead, use
“Average”
ReferenceColour The colour to use for the reference line, or -1 or an empty parameter for none
Minimum A value to use for the minimum vertical axis value, or an empty parameter to
use an automatic valueMaximum A value to use for the maximum vertical axis value, or an empty parameter to
use an automatic value
UseCommonScale Use 1 here to force all charts to use a common scale
Label Specifies the text to use in the formula cell

7/17/2019 XL Cubed versión 7 UserGuide
http://slidepdf.com/reader/full/xl-cubed-version-7-userguide 164/567
159 | P a g e XLCubed v7 User Guide –Book II – Formulae Reporting
XL3SparkColumnsM
Creates a monochrome column chart that is rendered in the Excel cell.
Syntax
XL3SparkColumnsM( Data, [Minimum], [Maximum] )
Parameters
Parameter Description
Data The data to chart. This can be a range or a formula
Minimum A value to use for the minimum vertical axis value, or an empty parameter to
use an automatic value
Maximum A value to use for the maximum vertical axis value, or an empty parameter to
use an automatic value
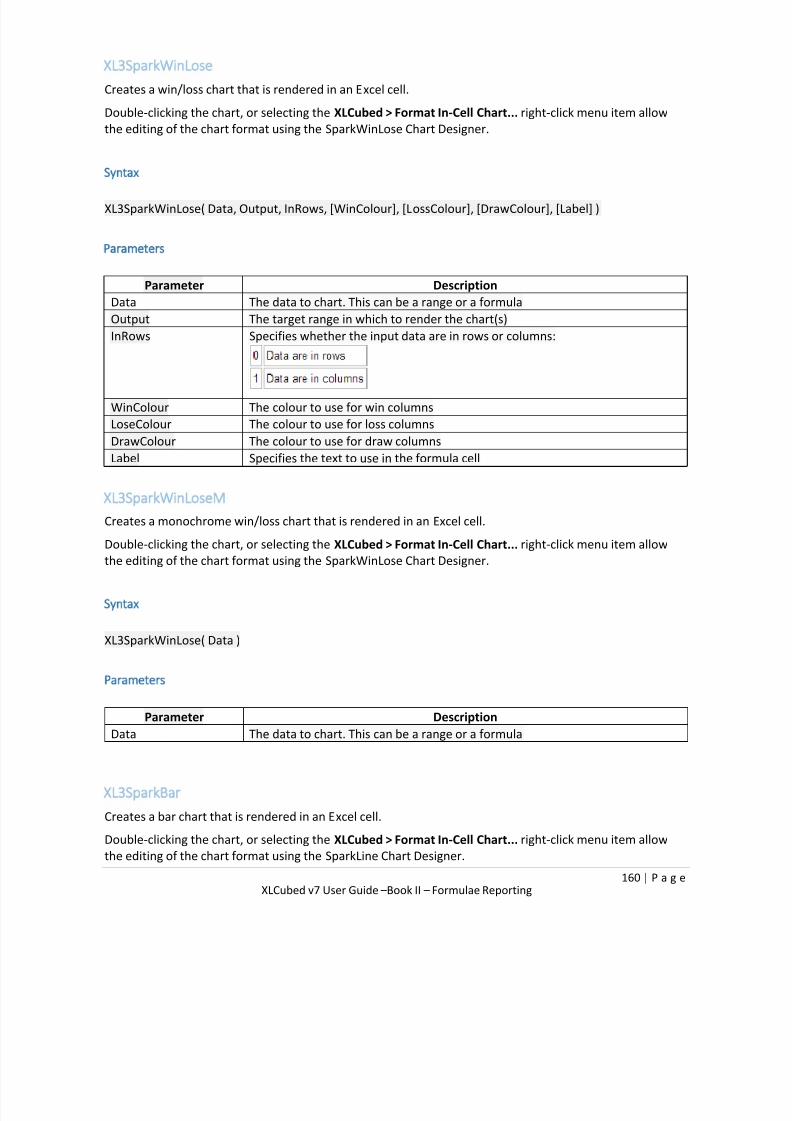
7/17/2019 XL Cubed versión 7 UserGuide
http://slidepdf.com/reader/full/xl-cubed-version-7-userguide 165/567
160 | P a g e XLCubed v7 User Guide –Book II – Formulae Reporting
XL3SparkWinLose
Creates a win/loss chart that is rendered in an Excel cell.
Double-clicking the chart, or selecting the XLCubed > Format In-Cell Chart... right-click menu item allow
the editing of the chart format using the SparkWinLose Chart Designer.
Syntax
XL3SparkWinLose( Data, Output, InRows, [WinColour], [LossColour], [DrawColour], [Label] )
Parameters
Parameter Description
Data The data to chart. This can be a range or a formula
Output The target range in which to render the chart(s)
InRows Specifies whether the input data are in rows or columns:
WinColour The colour to use for win columns
LoseColour The colour to use for loss columns
DrawColour The colour to use for draw columns
Label Specifies the text to use in the formula cell
XL3SparkWinLoseM
Creates a monochrome win/loss chart that is rendered in an Excel cell.
Double-clicking the chart, or selecting the XLCubed > Format In-Cell Chart... right-click menu item allow
the editing of the chart format using the SparkWinLose Chart Designer.
Syntax
XL3SparkWinLose( Data )
Parameters
Parameter Description
Data The data to chart. This can be a range or a formula
XL3SparkBar
Creates a bar chart that is rendered in an Excel cell.
Double-clicking the chart, or selecting the XLCubed > Format In-Cell Chart... right-click menu item allow
the editing of the chart format using the SparkLine Chart Designer.

7/17/2019 XL Cubed versión 7 UserGuide
http://slidepdf.com/reader/full/xl-cubed-version-7-userguide 166/567
161 | P a g e XLCubed v7 User Guide –Book II – Formulae Reporting
Syntax
XL3SparkBar( Data, Output, InRows, [LongestBarLength], [Colour1], [Colour2], [Colour3], [Colour4],
[Colour5], [Colour6], [Colour7], [Colour8], [IsStacked100%], [ShowZeros], [Minimum], [Maximum],
[DataLabelAlign], [DataLabelFontName], [DataLabelFontSize], [DataLabelFormatString],
[DataLabelFontStyle], [DataLabelColour], [AxisType], [MajorTickmarkFrequency],[MinorTickmarksPerMajor], [TickmarkLabelFormatString], [Label] )
Parameters
Parameter Description
Data The data to chart. This can be a range or a formula
Output The target range in which to render the chart(s)
InRows Specifies whether the input data are in rows or columns:
LongestBarLength The length of the longest bar
Colour1 The colour for the bar chart, or the first section in a stacked bar, or -1 or an
empty parameter for default
Colour2 The colour for the second section, or -1 or an empty parameter for default
Colour3 The colour for the third section, or -1 or an empty parameter for default
Colour4 The colour for the fourth section, or -1 or an empty parameter for default
Colour5 The colour for the fifth section, or -1 or an empty parameter for default
Colour6 The colour for the sixth section, or -1 or an empty parameter for defaultColour7 The colour for the seventh section, or -1 or an empty parameter for default
Colour8 The colour for the eighth section, or -1 or an empty parameter for default
IsStacked100% For bars with multiple data points; defines whether the bar length should be
the same for all charts, or whether the bar length should be proportional to the
total for that bar:
0 Total bar width varies according to the total, with the longest bar width
given by the LongestBarLength parameter
1 Bar widths are all equal, with the widths of individual data points
showing their proportion of the total
ShowZeros Specifies whether to draw bars for zero-valued data pointsMinimum A value to use for the minimum horizontal axis value, or an empty parameter to
use an automatic value
Maximum A value to use for the maximum horizontal axis value, or an empty parameter
to use an automatic value
DataLabelAlign Specifies the position of data labels for the bars:
DataLabelFontName The typeface to use for the data labels
DataLabelFontSize The font size for the data labels

7/17/2019 XL Cubed versión 7 UserGuide
http://slidepdf.com/reader/full/xl-cubed-version-7-userguide 167/567
162 | P a g e XLCubed v7 User Guide –Book II – Formulae Reporting
DataLabelFormatString The format string for the data labels
DataLabelFontStyle Reserved
DataLabelColour The colour for the data labels, or -1 or an empty parameter for none
AxisType The type of axis to render in the formula cell:
MajorTickmarkFrequency The frequency of the major, labelled tickmarks
MinorTickmarksPerMajor The number of additional labelless tickmarks per major tickmark
TickmarkLabelFormatString The format string for the axis tickmark labels
Label Specifies the text to use in the formula cell, if no axis is used

7/17/2019 XL Cubed versión 7 UserGuide
http://slidepdf.com/reader/full/xl-cubed-version-7-userguide 168/567
163 | P a g e XLCubed v7 User Guide –Book II – Formulae Reporting
XL3SparkBarM
Creates a monochrome bar chart that is rendered in the Excel cell.
Syntax
XL3SparkBarM( Data, [Max Value] )
Parameters
Parameter Description
Data The data to chart. This can be a range or a formula
Max Value The max value of the data to chart. This can be a range or a formula (new in
v7.2)
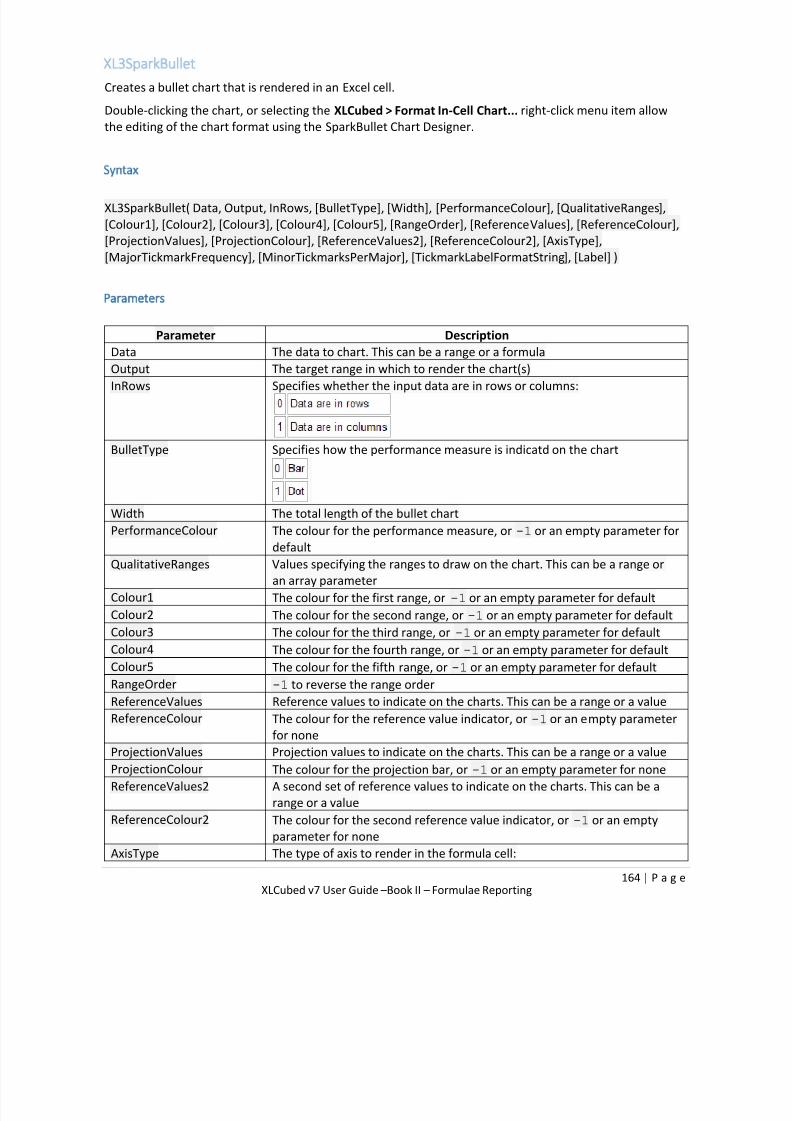
7/17/2019 XL Cubed versión 7 UserGuide
http://slidepdf.com/reader/full/xl-cubed-version-7-userguide 169/567
164 | P a g e XLCubed v7 User Guide –Book II – Formulae Reporting
XL3SparkBullet
Creates a bullet chart that is rendered in an Excel cell.
Double-clicking the chart, or selecting the XLCubed > Format In-Cell Chart... right-click menu item allow
the editing of the chart format using the SparkBullet Chart Designer.
Syntax
XL3SparkBullet( Data, Output, InRows, [BulletType], [Width], [PerformanceColour], [QualitativeRanges],
[Colour1], [Colour2], [Colour3], [Colour4], [Colour5], [RangeOrder], [ReferenceValues], [ReferenceColour],
[ProjectionValues], [ProjectionColour], [ReferenceValues2], [ReferenceColour2], [AxisType],
[MajorTickmarkFrequency], [MinorTickmarksPerMajor], [TickmarkLabelFormatString], [Label] )
Parameters
Parameter DescriptionData The data to chart. This can be a range or a formula
Output The target range in which to render the chart(s)
InRows Specifies whether the input data are in rows or columns:
BulletType Specifies how the performance measure is indicatd on the chart
Width The total length of the bullet chart
PerformanceColour The colour for the performance measure, or -1 or an empty parameter for
default
QualitativeRanges Values specifying the ranges to draw on the chart. This can be a range or
an array parameter
Colour1 The colour for the first range, or -1 or an empty parameter for default
Colour2 The colour for the second range, or -1 or an empty parameter for default
Colour3 The colour for the third range, or -1 or an empty parameter for default
Colour4 The colour for the fourth range, or -1 or an empty parameter for default
Colour5 The colour for the fifth range, or -1 or an empty parameter for defaultRangeOrder -1 to reverse the range order
ReferenceValues Reference values to indicate on the charts. This can be a range or a value
ReferenceColour The colour for the reference value indicator, or -1 or an empty parameter
for none
ProjectionValues Projection values to indicate on the charts. This can be a range or a value
ProjectionColour The colour for the projection bar, or -1 or an empty parameter for none
ReferenceValues2 A second set of reference values to indicate on the charts. This can be a
range or a value
ReferenceColour2 The colour for the second reference value indicator, or -1 or an empty
parameter for none
AxisType The type of axis to render in the formula cell:
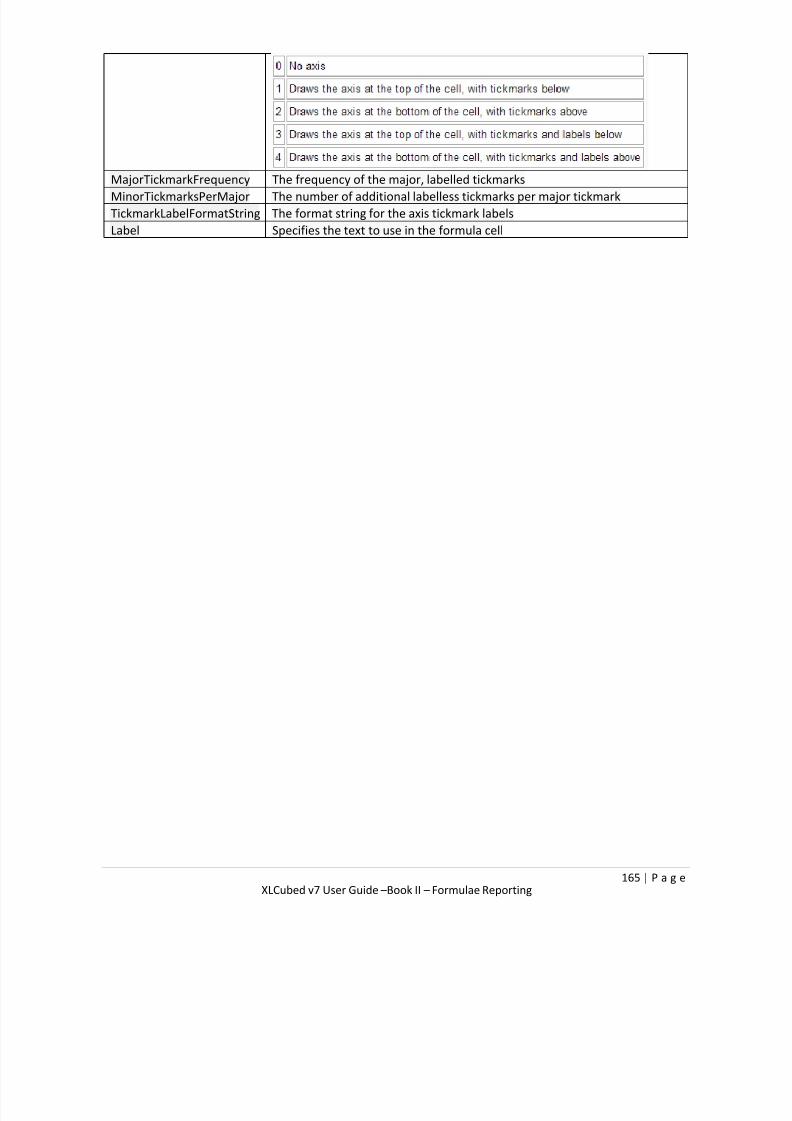
7/17/2019 XL Cubed versión 7 UserGuide
http://slidepdf.com/reader/full/xl-cubed-version-7-userguide 170/567
165 | P a g e XLCubed v7 User Guide –Book II – Formulae Reporting
MajorTickmarkFrequency The frequency of the major, labelled tickmarks
MinorTickmarksPerMajor The number of additional labelless tickmarks per major tickmark
TickmarkLabelFormatString The format string for the axis tickmark labels
Label Specifies the text to use in the formula cell
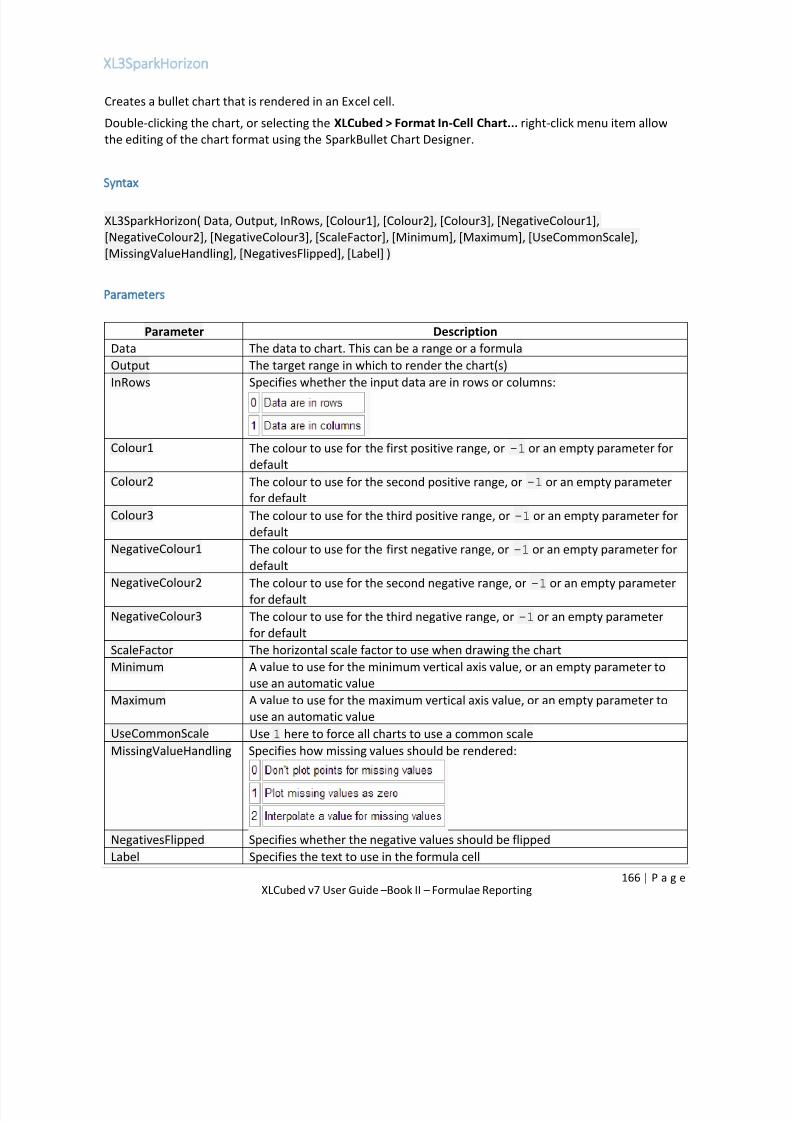
7/17/2019 XL Cubed versión 7 UserGuide
http://slidepdf.com/reader/full/xl-cubed-version-7-userguide 171/567
166 | P a g e XLCubed v7 User Guide –Book II – Formulae Reporting
XL3SparkHorizon
Creates a bullet chart that is rendered in an Excel cell.
Double-clicking the chart, or selecting the XLCubed > Format In-Cell Chart... right-click menu item allow
the editing of the chart format using the SparkBullet Chart Designer.
Syntax
XL3SparkHorizon( Data, Output, InRows, [Colour1], [Colour2], [Colour3], [NegativeColour1],
[NegativeColour2], [NegativeColour3], [ScaleFactor], [Minimum], [Maximum], [UseCommonScale],
[MissingValueHandling], [NegativesFlipped], [Label] )
Parameters
Parameter DescriptionData The data to chart. This can be a range or a formula
Output The target range in which to render the chart(s)
InRows Specifies whether the input data are in rows or columns:
Colour1 The colour to use for the first positive range, or -1 or an empty parameter for
default
Colour2 The colour to use for the second positive range, or -1 or an empty parameter
for defaultColour3 The colour to use for the third positive range, or -1 or an empty parameter for
default
NegativeColour1 The colour to use for the first negative range, or -1 or an empty parameter for
default
NegativeColour2 The colour to use for the second negative range, or -1 or an empty parameter
for default
NegativeColour3 The colour to use for the third negative range, or -1 or an empty parameter
for default
ScaleFactor The horizontal scale factor to use when drawing the chart
Minimum A value to use for the minimum vertical axis value, or an empty parameter touse an automatic value
Maximum A value to use for the maximum vertical axis value, or an empty parameter to
use an automatic value
UseCommonScale Use 1 here to force all charts to use a common scale
MissingValueHandling Specifies how missing values should be rendered:
NegativesFlipped Specifies whether the negative values should be flipped
Label Specifies the text to use in the formula cell
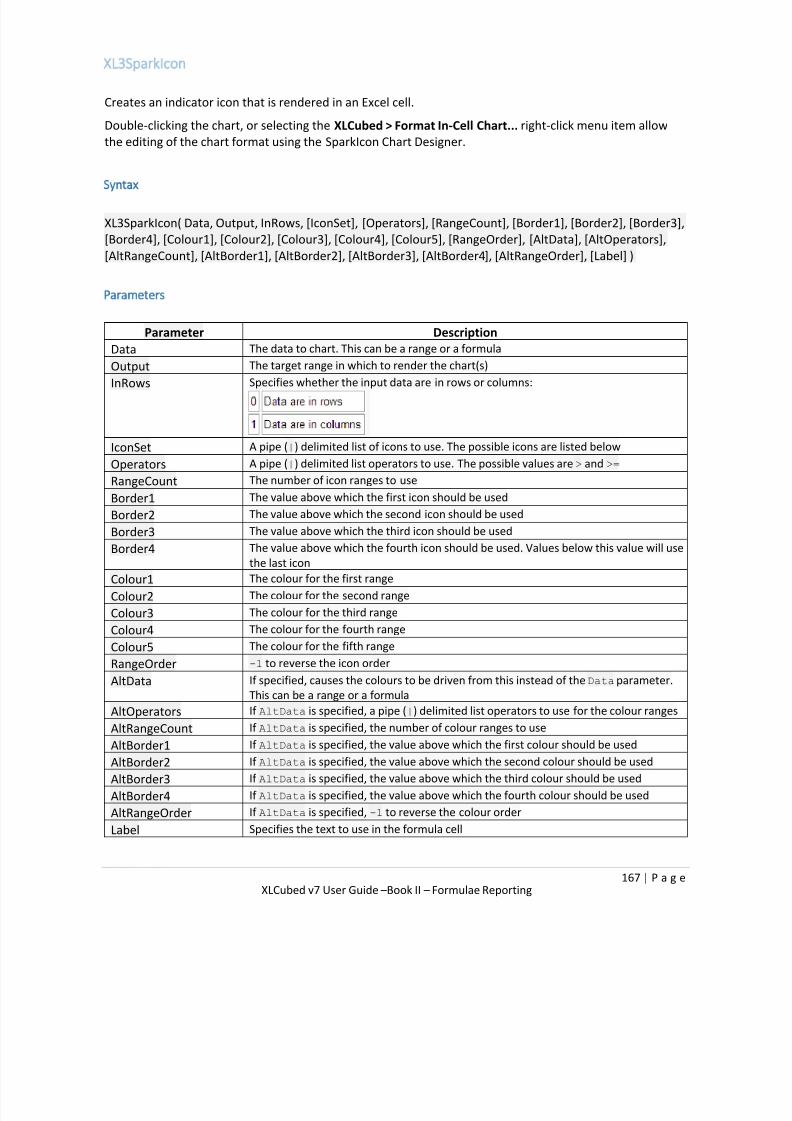
7/17/2019 XL Cubed versión 7 UserGuide
http://slidepdf.com/reader/full/xl-cubed-version-7-userguide 172/567
167 | P a g e XLCubed v7 User Guide –Book II – Formulae Reporting
XL3SparkIcon
Creates an indicator icon that is rendered in an Excel cell.
Double-clicking the chart, or selecting the XLCubed > Format In-Cell Chart... right-click menu item allow
the editing of the chart format using the SparkIcon Chart Designer.
Syntax
XL3SparkIcon( Data, Output, InRows, [IconSet], [Operators], [RangeCount], [Border1], [Border2], [Border3],
[Border4], [Colour1], [Colour2], [Colour3], [Colour4], [Colour5], [RangeOrder], [AltData], [AltOperators],
[AltRangeCount], [AltBorder1], [AltBorder2], [AltBorder3], [AltBorder4], [AltRangeOrder], [Label] )
Parameters
Parameter DescriptionData The data to chart. This can be a range or a formula
Output The target range in which to render the chart(s)
InRows Specifies whether the input data are in rows or columns:
IconSet A pipe (|) delimited list of icons to use. The possible icons are listed below
Operators A pipe (|) delimited list operators to use. The possible values are > and >=
RangeCount The number of icon ranges to use
Border1 The value above which the first icon should be usedBorder2 The value above which the second icon should be used
Border3 The value above which the third icon should be used
Border4 The value above which the fourth icon should be used. Values below this value will use
the last icon
Colour1 The colour for the first range
Colour2 The colour for the second range
Colour3 The colour for the third range
Colour4 The colour for the fourth range
Colour5 The colour for the fifth range
RangeOrder -1 to reverse the icon orderAltData If specified, causes the colours to be driven from this instead of the Data parameter.
This can be a range or a formula
AltOperators If AltData is specified, a pipe (|) delimited list operators to use for the colour ranges
AltRangeCount If AltData is specified, the number of colour ranges to use
AltBorder1 If AltData is specified, the value above which the first colour should be used
AltBorder2 If AltData is specified, the value above which the second colour should be used
AltBorder3 If AltData is specified, the value above which the third colour should be used
AltBorder4 If AltData is specified, the value above which the fourth colour should be used
AltRangeOrder If AltData is specified, -1 to reverse the colour order
Label Specifies the text to use in the formula cell

7/17/2019 XL Cubed versión 7 UserGuide
http://slidepdf.com/reader/full/xl-cubed-version-7-userguide 173/567
168 | P a g e XLCubed v7 User Guide –Book II – Formulae Reporting
Icon Sets

7/17/2019 XL Cubed versión 7 UserGuide
http://slidepdf.com/reader/full/xl-cubed-version-7-userguide 174/567
169 | P a g e XLCubed v7 User Guide –Book II – Formulae Reporting
XL3SparkPie
Creates a pie chart that is rendered in an Excel cell.
Double-clicking the chart, or selecting the XLCubed > Format In-Cell Chart... right-click menu item allow
the editing of the chart format using the SparkBullet Chart Designer.
Syntax
XL3SparkPie( Data, Output, InRows, [Colour1], [Colour2], [Colour3], [Colour4], [Colour5], [Colour6],
[Colour7], [Colour8], [Label] )
Parameters
Parameter Description
Data The data to chart. This can be a range or a formulaOutput The target range in which to render the chart(s)
InRows Specifies whether the input data are in rows or columns:
Colour1 The colour to use for the first sector or -1 or an empty parameter for default
Colour2 The colour to use for the second sector or -1 or an empty parameter for
default
Colour3 The colour to use for the third sector or -1 or an empty parameter for default
Colour4 The colour to use for the fourth sector or -1 or an empty parameter fordefault
Colour5 The colour to use for the fifth sector or -1 or an empty parameter for default
Colour6 The colour to use for the sixth sector or -1 or an empty parameter for default
Colour7 The colour to use for the seventh sector or -1 or an empty parameter for
default
Colour8 The colour to use for the eighth sector or -1 or an empty parameter for
default
Label Specifies the text to use in the formula cell
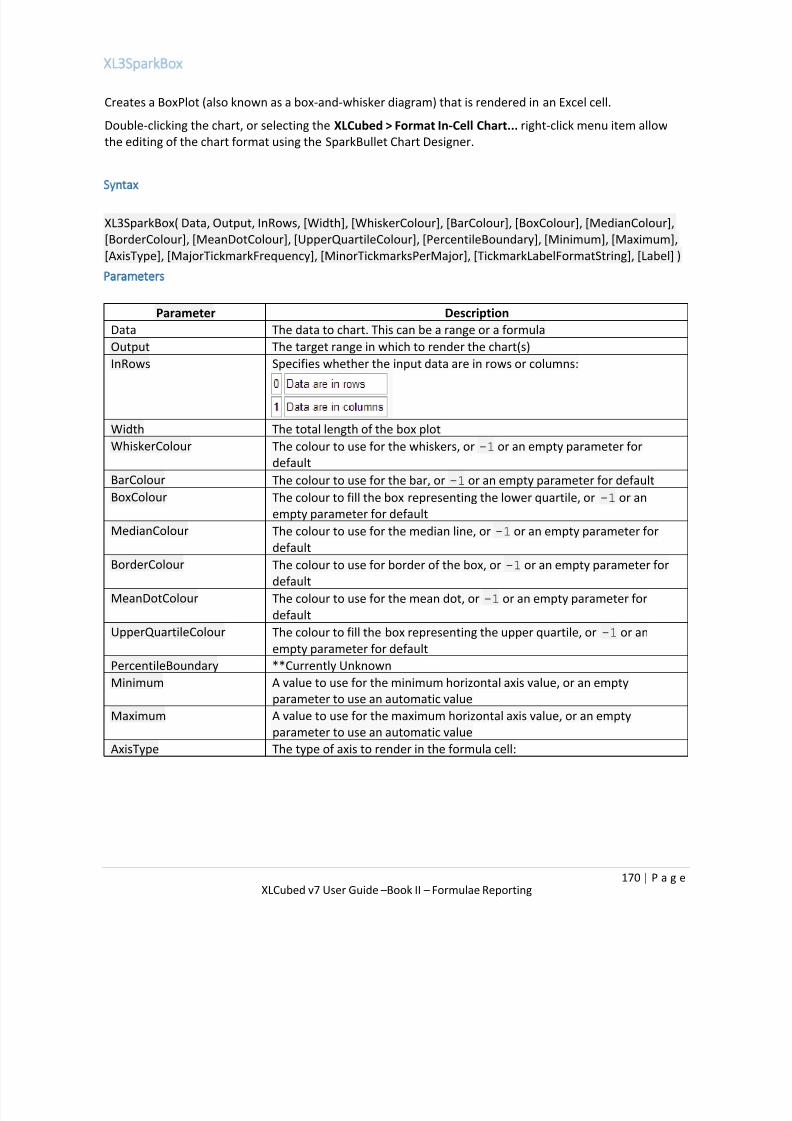
7/17/2019 XL Cubed versión 7 UserGuide
http://slidepdf.com/reader/full/xl-cubed-version-7-userguide 175/567
170 | P a g e XLCubed v7 User Guide –Book II – Formulae Reporting
XL3SparkBox
Creates a BoxPlot (also known as a box-and-whisker diagram) that is rendered in an Excel cell.
Double-clicking the chart, or selecting the XLCubed > Format In-Cell Chart... right-click menu item allow
the editing of the chart format using the SparkBullet Chart Designer.
Syntax
XL3SparkBox( Data, Output, InRows, [Width], [WhiskerColour], [BarColour], [BoxColour], [MedianColour],
[BorderColour], [MeanDotColour], [UpperQuartileColour], [PercentileBoundary], [Minimum], [Maximum],
[AxisType], [MajorTickmarkFrequency], [MinorTickmarksPerMajor], [TickmarkLabelFormatString], [Label] )
Parameters
Parameter Description
Data The data to chart. This can be a range or a formulaOutput The target range in which to render the chart(s)
InRows Specifies whether the input data are in rows or columns:
Width The total length of the box plot
WhiskerColour The colour to use for the whiskers, or -1 or an empty parameter for
default
BarColour The colour to use for the bar, or -1 or an empty parameter for default
BoxColour The colour to fill the box representing the lower quartile, or -1 or anempty parameter for default
MedianColour The colour to use for the median line, or -1 or an empty parameter for
default
BorderColour The colour to use for border of the box, or -1 or an empty parameter for
default
MeanDotColour The colour to use for the mean dot, or -1 or an empty parameter for
default
UpperQuartileColour The colour to fill the box representing the upper quartile, or -1 or an
empty parameter for default
PercentileBoundary **Currently UnknownMinimum A value to use for the minimum horizontal axis value, or an empty
parameter to use an automatic value
Maximum A value to use for the maximum horizontal axis value, or an empty
parameter to use an automatic value
AxisType The type of axis to render in the formula cell:

7/17/2019 XL Cubed versión 7 UserGuide
http://slidepdf.com/reader/full/xl-cubed-version-7-userguide 176/567
171 | P a g e XLCubed v7 User Guide –Book II – Formulae Reporting
MajorTickmarkFrequency The frequency of the major, labelled tickmarks
MinorTickmarksPerMajor The number of additional labelless tickmarks per major tickmark
TickmarkLabelFormatString The format string for the axis tickmark labels
Label Specifies the text to use in the formula cell
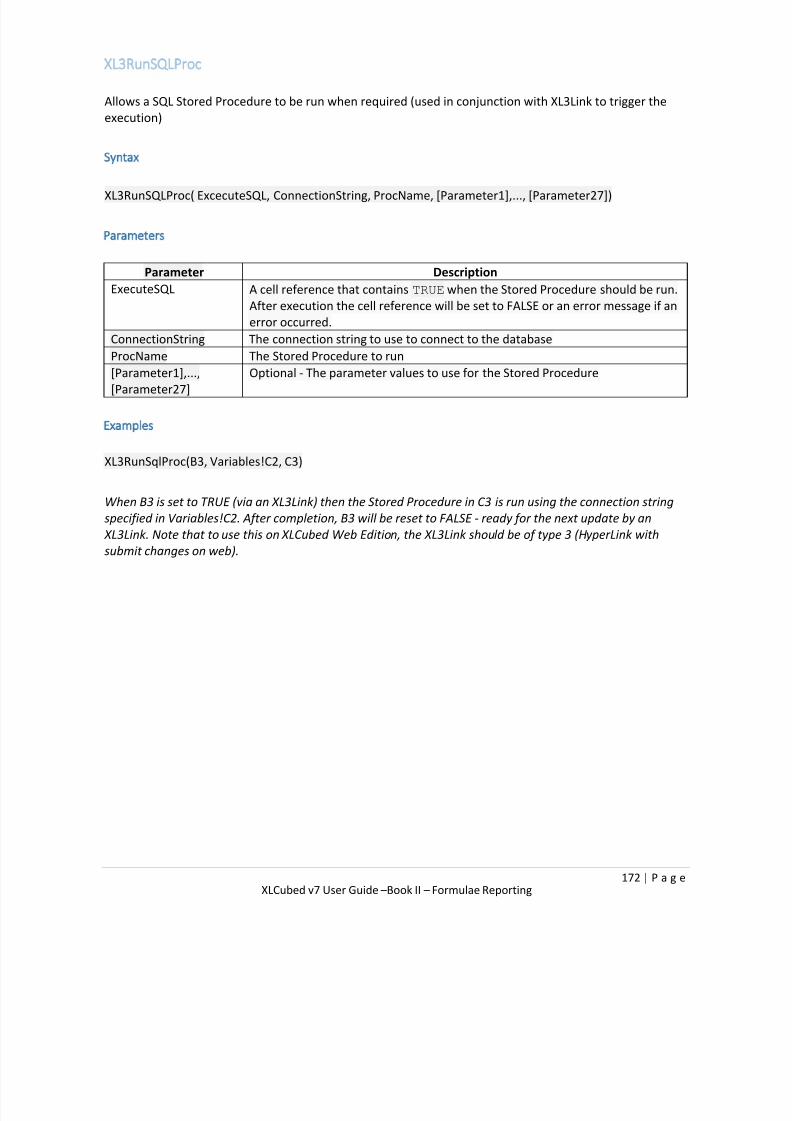
7/17/2019 XL Cubed versión 7 UserGuide
http://slidepdf.com/reader/full/xl-cubed-version-7-userguide 177/567
172 | P a g e XLCubed v7 User Guide –Book II – Formulae Reporting
XL3RunSQLProc
Allows a SQL Stored Procedure to be run when required (used in conjunction with XL3Link to trigger the
execution)
Syntax
XL3RunSQLProc( ExcecuteSQL, ConnectionString, ProcName, [Parameter1],..., [Parameter27])
Parameters
Parameter Description
ExecuteSQL A cell reference that contains TRUE when the Stored Procedure should be run.
After execution the cell reference will be set to FALSE or an error message if an
error occurred.
ConnectionString The connection string to use to connect to the database
ProcName The Stored Procedure to run
[Parameter1],...,
[Parameter27]
Optional - The parameter values to use for the Stored Procedure
Examples
XL3RunSqlProc(B3, Variables!C2, C3)
When B3 is set to TRUE (via an XL3Link) then the Stored Procedure in C3 is run using the connection stringspecified in Variables!C2. After completion, B3 will be reset to FALSE - ready for the next update by an
XL3Link. Note that to use this on XLCubed Web Edition, the XL3Link should be of type 3 (HyperLink with
submit changes on web).

7/17/2019 XL Cubed versión 7 UserGuide
http://slidepdf.com/reader/full/xl-cubed-version-7-userguide 178/567
173 | P a g e XLCubed v7 User Guide –Book II – Formulae Reporting
XL3DynamicPicture
Updates a Picture or Pictures to an image on the internet.
This allows you to display a Picture based on a parameter in Excel. For example if a report is driven by a
Store parameter, you could use this to display a picture of the store.
This function is primarily for use in reports published to the web where images update automatically. InExcel you can force a refresh of the images by using the XLCubed -> Extra -> Refresh Dynamic Pictures
menu option (please note this will only retrieve a new picture in Excel if the formula has run in the current
session and had a different URL to the last run)
Syntax
XL3DynamicPicture( PictureName, Url )
Parameters
Parameter Description
PictureName Alt Text > Alternative text (or the Alt Text > Description in Excel 2010 and
higher) of the Picture to update. If several Pictures have the same name they
will all be updated.
URL Web address of the image to use, in the
form https://reader009.{domain}/reader009/html5/0315/5aaa28be80a2c/5aaa29547ae
Example
You can setup a named image by inserting a picture using the standard Excel menu option.
Next set the Picture name by right-clicking it, and selecting properties. The name goes in the "Alt Text" box.

7/17/2019 XL Cubed versión 7 UserGuide
http://slidepdf.com/reader/full/xl-cubed-version-7-userguide 179/567
174 | P a g e XLCubed v7 User Guide –Book II – Formulae Reporting
Finally set up a formula, e.g.
=XL3DynamicPicture("MyLogo"; "https://reader009.{domain}/reader009/html5/0315/5aaa28be80a2c/5a
Here the URL paramater is fixed, but it could be set to reference another cell or concatenated text.
Scheduling/PDF
For dynamic pictures in reports that are going to be scheduled or downloaded as PDFs/Workbooks, the
URL will need to be for a server that is accessible from the XLCubedWeb server and doesn't required any
authentication. So an internet site URL is fine if the server has internet access, or a local server would be
OK if that was setup to allow Anonymous access.

7/17/2019 XL Cubed versión 7 UserGuide
http://slidepdf.com/reader/full/xl-cubed-version-7-userguide 180/567
175 | P a g e XLCubed v7 User Guide –Book II – Formulae Reporting
XL3RefreshObjects
Refreshes objects in the report based on type. (new in v7.1)
This allows you to refresh objects on demand.
This function is for use with the XL3Link function, which can be used to switch the refresh on.
Syntax
XL3RefreshObjects( [RunRefresh], [RefreshGrids], [RefreshTables], [RefreshSlicers],
[RefreshSmallMultiples], [RefreshTreemaps] )
Parameters
Parameter Description
RunRefresh Should the refresh fire. This should be a reference to another cell that contains TRUEor FALSE. Once the refresh fires that cell will be reset to FALSE. Use XL3Link to setthe cell to true, causing a refresh.
RefreshGrids TRUE or FALSE. Refresh all Grids.
RefreshTables TRUE or FALSE. Refresh all Tables.
RefreshSlicers TRUE or FALSE. Refresh all Slicers.
RefreshSmallMultiples TRUE or FALSE. Refresh all SmallMultiples.
RefreshTreeMaps TRUE or FALSE. Refresh all TreeMaps.
You may also call the formula with just the RunRefresh parameter to refresh all types.
Examples
This example assumes you are using cell $A$1 to hold the RunRefresh variable. We will refresh just the
grids.
First, create the XL3RefreshObjects, as follows:
=XL3RefreshObjects($A$1, True)
Next set up the link to fire the refresh, as follows:
=XL3Link(XL3Address($A$1),"Refresh All",,XL3Address($A$1),TRUE)
Now clicking the hyperlink will refresh all grids in the workbook.
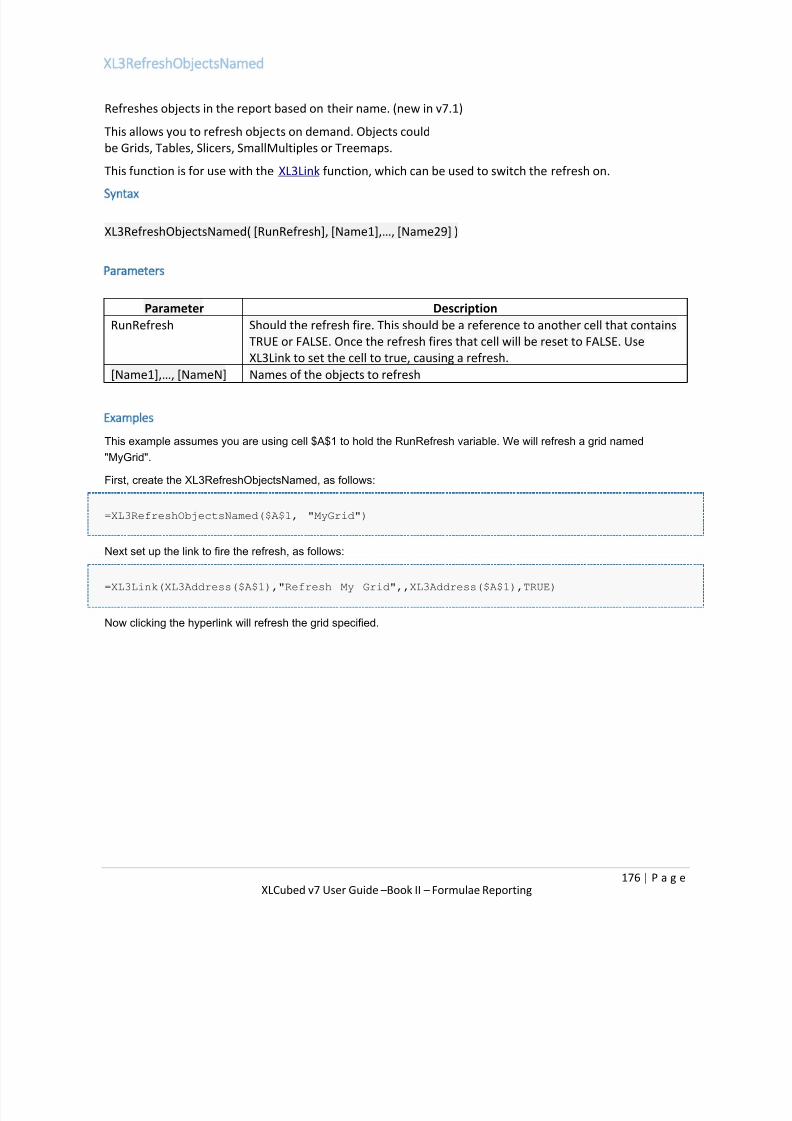
7/17/2019 XL Cubed versión 7 UserGuide
http://slidepdf.com/reader/full/xl-cubed-version-7-userguide 181/567
176 | P a g e XLCubed v7 User Guide –Book II – Formulae Reporting
XL3RefreshObjectsNamed
Refreshes objects in the report based on their name. (new in v7.1)
This allows you to refresh objects on demand. Objects could
be Grids, Tables, Slicers, SmallMultiples or Treemaps.
This function is for use with the XL3Link function, which can be used to switch the refresh on.
Syntax
XL3RefreshObjectsNamed( [RunRefresh], [Name1],…, [Name29] )
Parameters
Parameter Description
RunRefresh Should the refresh fire. This should be a reference to another cell that contains
TRUE or FALSE. Once the refresh fires that cell will be reset to FALSE. Use
XL3Link to set the cell to true, causing a refresh.
[Name1],…, [NameN] Names of the objects to refresh
Examples
This example assumes you are using cell $A$1 to hold the RunRefresh variable. We will refresh a grid named
"MyGrid".
First, create the XL3RefreshObjectsNamed, as follows:
=XL3RefreshObjectsNamed($A$1, "MyGrid")
Next set up the link to fire the refresh, as follows:
=XL3Link(XL3Address($A$1),"Refresh My Grid",,XL3Address($A$1),TRUE)
Now clicking the hyperlink will refresh the grid specified.
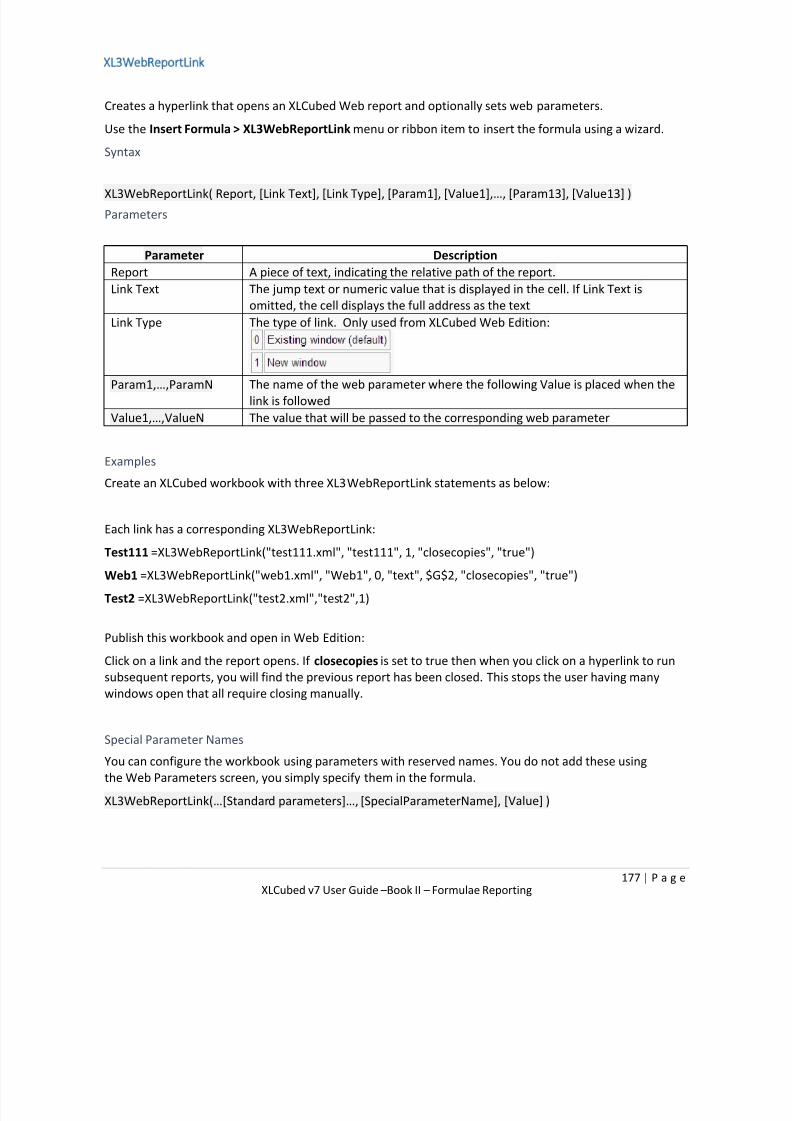
7/17/2019 XL Cubed versión 7 UserGuide
http://slidepdf.com/reader/full/xl-cubed-version-7-userguide 182/567
177 | P a g e XLCubed v7 User Guide –Book II – Formulae Reporting
XL3WebReportLink
Creates a hyperlink that opens an XLCubed Web report and optionally sets web parameters.
Use the Insert Formula > XL3WebReportLink menu or ribbon item to insert the formula using a wizard.
Syntax
XL3WebReportLink( Report, [Link Text], [Link Type], [Param1], [Value1],…, [Param13], [Value13] )
Parameters
Parameter Description
Report A piece of text, indicating the relative path of the report.
Link Text The jump text or numeric value that is displayed in the cell. If Link Text is
omitted, the cell displays the full address as the text
Link Type The type of link. Only used from XLCubed Web Edition:
Param1,…,ParamN The name of the web parameter where the following Value is placed when the
link is followed
Value1,…,ValueN The value that will be passed to the corresponding web parameter
Examples
Create an XLCubed workbook with three XL3WebReportLink statements as below:
Each link has a corresponding XL3WebReportLink:
Test111 =XL3WebReportLink("test111.xml", "test111", 1, "closecopies", "true")
Web1 =XL3WebReportLink("web1.xml", "Web1", 0, "text", $G$2, "closecopies", "true")
Test2 =XL3WebReportLink("test2.xml","test2",1)
Publish this workbook and open in Web Edition:
Click on a link and the report opens. If closecopies is set to true then when you click on a hyperlink to runsubsequent reports, you will find the previous report has been closed. This stops the user having many
windows open that all require closing manually.
Special Parameter Names
You can configure the workbook using parameters with reserved names. You do not add these using
the Web Parameters screen, you simply specify them in the formula.
XL3WebReportLink(…[Standard parameters]…, [SpecialParameterName], [Value] )

7/17/2019 XL Cubed versión 7 UserGuide
http://slidepdf.com/reader/full/xl-cubed-version-7-userguide 183/567
178 | P a g e XLCubed v7 User Guide –Book II – Formulae Reporting
Parameter Description
XL3ActiveWorksheetName The worksheet to display when the report link is opened
Relative Paths
In v7.5 a relative path can be used by using the syntax “./Book2.xml” – this would load the report “Book2”
from the same source folder as the report containing the XL3WebReportLink.

7/17/2019 XL Cubed versión 7 UserGuide
http://slidepdf.com/reader/full/xl-cubed-version-7-userguide 184/567
179 | P a g e XLCubed v7 User Guide –Book II – Formulae Reporting
Clear all data values
New in Version 7.5 it is possible to clear all the data values from a workbook. Go to XLCubed -> Extras ->
Clear all data values. This does the following:
1. Clears all grids
2. Sets any XLCubed Formulae to "Working..."
The workbook can then be saved or published. For a saved workbook the numbers will only be re-
retrieved once the workbook is loaded and the grids & formulae are refreshed. For a published report,
the published file will not contain any data and the numbers will only be retrieved after the report is
viewed in Web Edition.
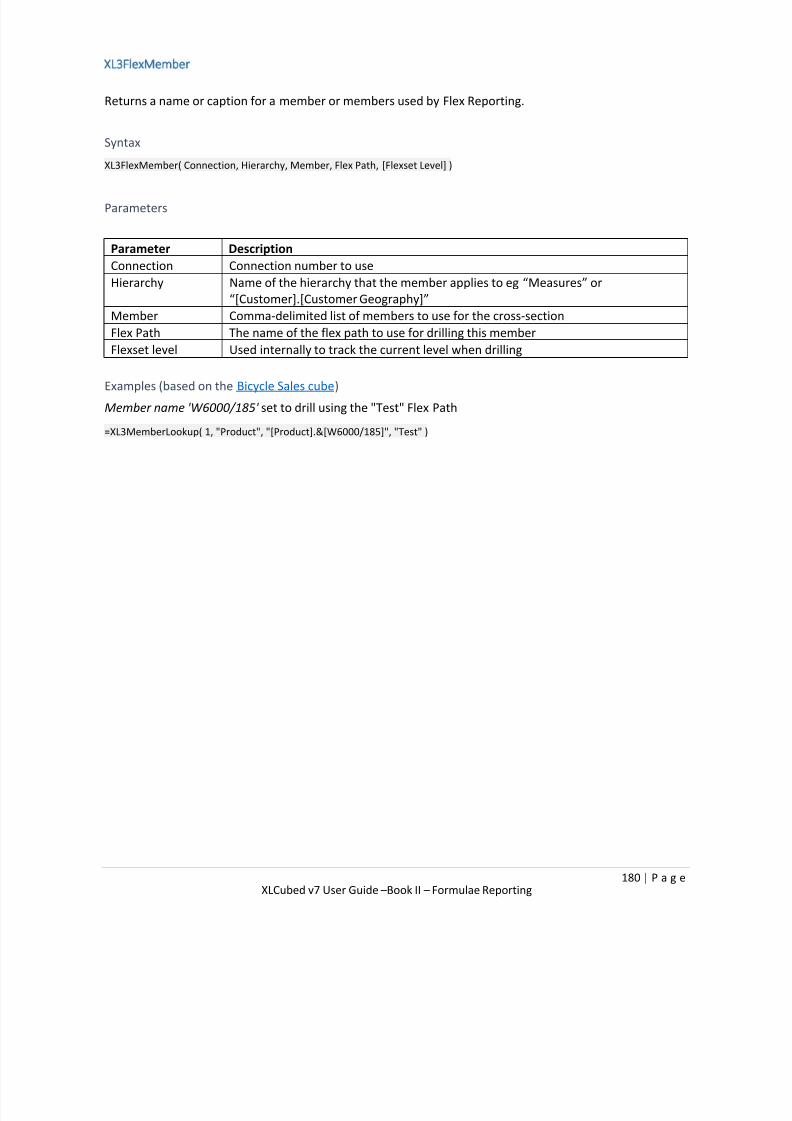
7/17/2019 XL Cubed versión 7 UserGuide
http://slidepdf.com/reader/full/xl-cubed-version-7-userguide 185/567
180 | P a g e XLCubed v7 User Guide –Book II – Formulae Reporting
XL3FlexMember
Returns a name or caption for a member or members used by Flex Reporting.
Syntax
XL3FlexMember( Connection, Hierarchy, Member, Flex Path, [Flexset Level] )
Parameters
Parameter Description
Connection Connection number to use
Hierarchy Name of the hierarchy that the member applies to eg “Measures” or
“[Customer].[Customer Geography]”
Member Comma-delimited list of members to use for the cross-section
Flex Path The name of the flex path to use for drilling this memberFlexset level Used internally to track the current level when drilling
Examples (based on the Bicycle Sales cube)
Member name 'W6000/185' set to drill using the "Test" Flex Path
=XL3MemberLookup( 1, "Product", "[Product].&[W6000/185]", "Test" )
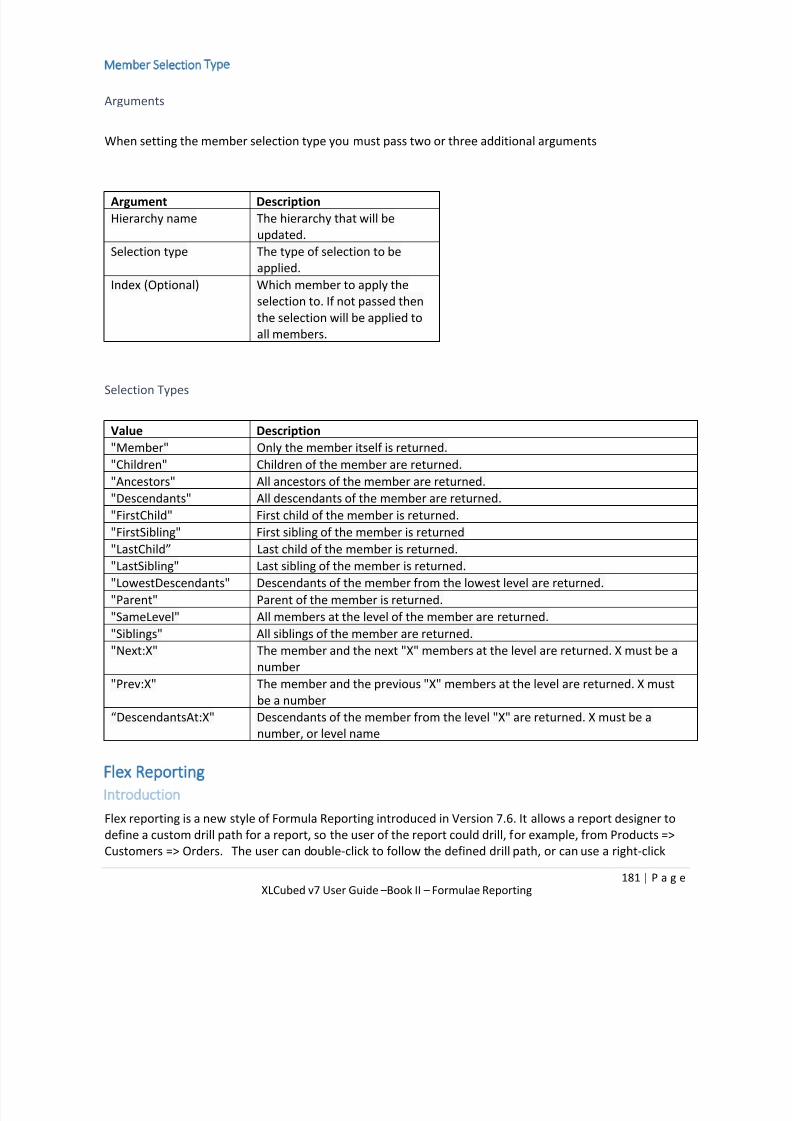
7/17/2019 XL Cubed versión 7 UserGuide
http://slidepdf.com/reader/full/xl-cubed-version-7-userguide 186/567
181 | P a g e XLCubed v7 User Guide –Book II – Formulae Reporting
Member Selection Type
Arguments
When setting the member selection type you must pass two or three additional arguments
Argument Description
Hierarchy name The hierarchy that will be
updated.
Selection type The type of selection to be
applied.
Index (Optional) Which member to apply the
selection to. If not passed then
the selection will be applied to
all members.
Selection Types
Value Description
"Member" Only the member itself is returned.
"Children" Children of the member are returned.
"Ancestors" All ancestors of the member are returned.
"Descendants" All descendants of the member are returned."FirstChild" First child of the member is returned.
"FirstSibling" First sibling of the member is returned
"LastChild” Last child of the member is returned.
"LastSibling" Last sibling of the member is returned.
"LowestDescendants" Descendants of the member from the lowest level are returned.
"Parent" Parent of the member is returned.
"SameLevel" All members at the level of the member are returned.
"Siblings" All siblings of the member are returned.
"Next:X" The member and the next "X" members at the level are returned. X must be a
number"Prev:X" The member and the previous "X" members at the level are returned. X must
be a number
“DescendantsAt:X" Descendants of the member from the level "X" are returned. X must be a
number, or level name
Flex Reporting
Introduction
Flex reporting is a new style of Formula Reporting introduced in Version 7.6. It allows a report designer to
define a custom drill path for a report, so the user of the report could drill, for example, from Products =>
Customers => Orders. The user can double-click to follow the defined drill path, or can use a right-click

7/17/2019 XL Cubed versión 7 UserGuide
http://slidepdf.com/reader/full/xl-cubed-version-7-userguide 187/567
182 | P a g e XLCubed v7 User Guide –Book II – Formulae Reporting
shortcut to go directly to any defined level in the drill path which gives huge flexibility in a controlled
environment.
Each Drill is performed so that only rows with data are returned, this means drilling into a particular
product would only return customers that have bought that product (this is dependent on the Measure
applying over both hierarchies).
Getting Started
The starting place for any Flex Report is to insert a Grid and define the starting structure, so which
dimensions will be on filters, rows and columns. As with traditional formula reports the structure of the
report is static once converted to formula so it's important to start with a grid that matches the final
structure.
Once the grid is ready, right-click and select "Convert to flex report", this will show the Flex Report form.
Flex Reporting Form
An individual drill level is called a "Flex Set" and a collection of these is a "Flex Path". An individual member
can be assigned a "Flex Path" and as the user drills they will navigate the "Flex Sets" in the path.
Flex Paths
A workbook can contain several Flex Paths, it's also possible to export and import the definitions so they
can be reused. Each flex path has a defined name, and it's this name that links a formula to a particular flex
path.
When converting a grid to a flex report, select or define the default path for the flex report and click OK
(you can always edit the formula to change the flex path later).
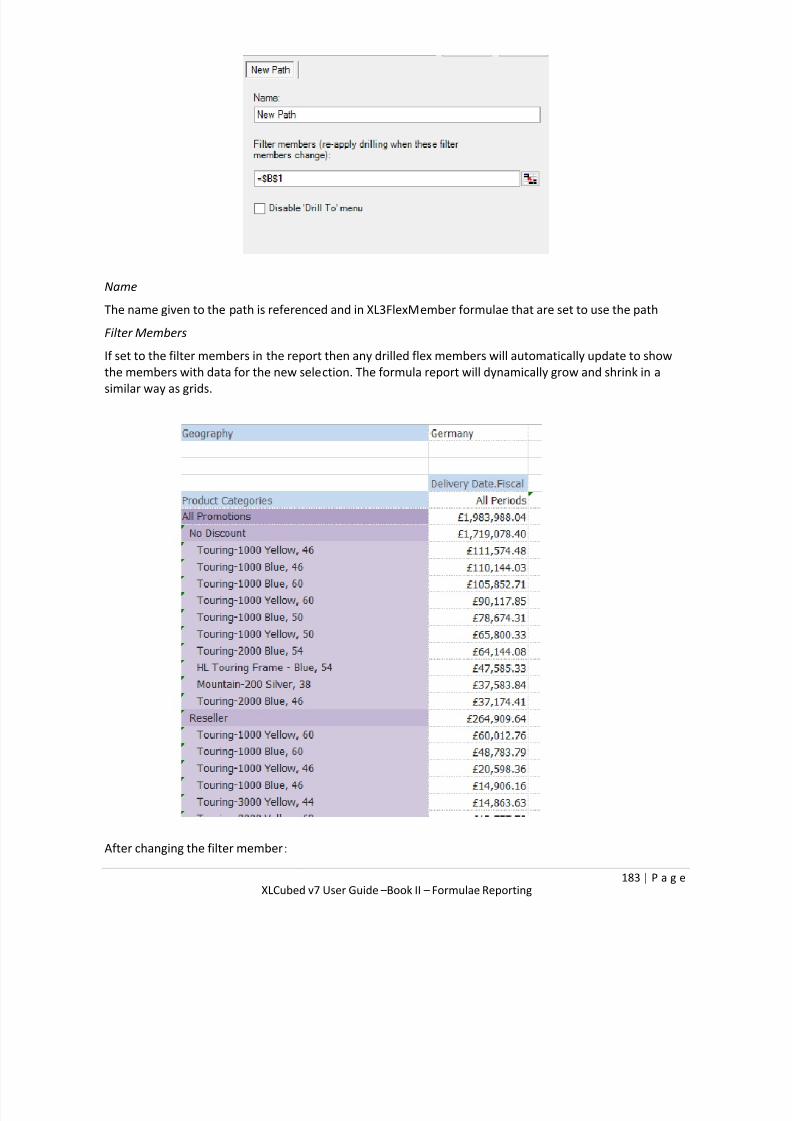
7/17/2019 XL Cubed versión 7 UserGuide
http://slidepdf.com/reader/full/xl-cubed-version-7-userguide 188/567
183 | P a g e XLCubed v7 User Guide –Book II – Formulae Reporting
Name
The name given to the path is referenced and in XL3FlexMember formulae that are set to use the path
Filter Members
If set to the filter members in the report then any drilled flex members will automatically update to show
the members with data for the new selection. The formula report will dynamically grow and shrink in a
similar way as grids.
After changing the filter member:

7/17/2019 XL Cubed versión 7 UserGuide
http://slidepdf.com/reader/full/xl-cubed-version-7-userguide 189/567
184 | P a g e XLCubed v7 User Guide –Book II – Formulae Reporting
Disable 'Drill To' menu
By default any XL3FlexMember will include a "Dill To" menu option, this allows the report's user to drill to
any valid attribute/hierarchy level. You can use this option to disable that functionality for the given path.
Flex Sets
A flex set is the level to drill to you can control the order the flex sets appear in by using the toolbar to
move them:
Each set can be given a name, this will default to the level name (the name will be shown on the right-click
menu) and can be changed to anything suitable.
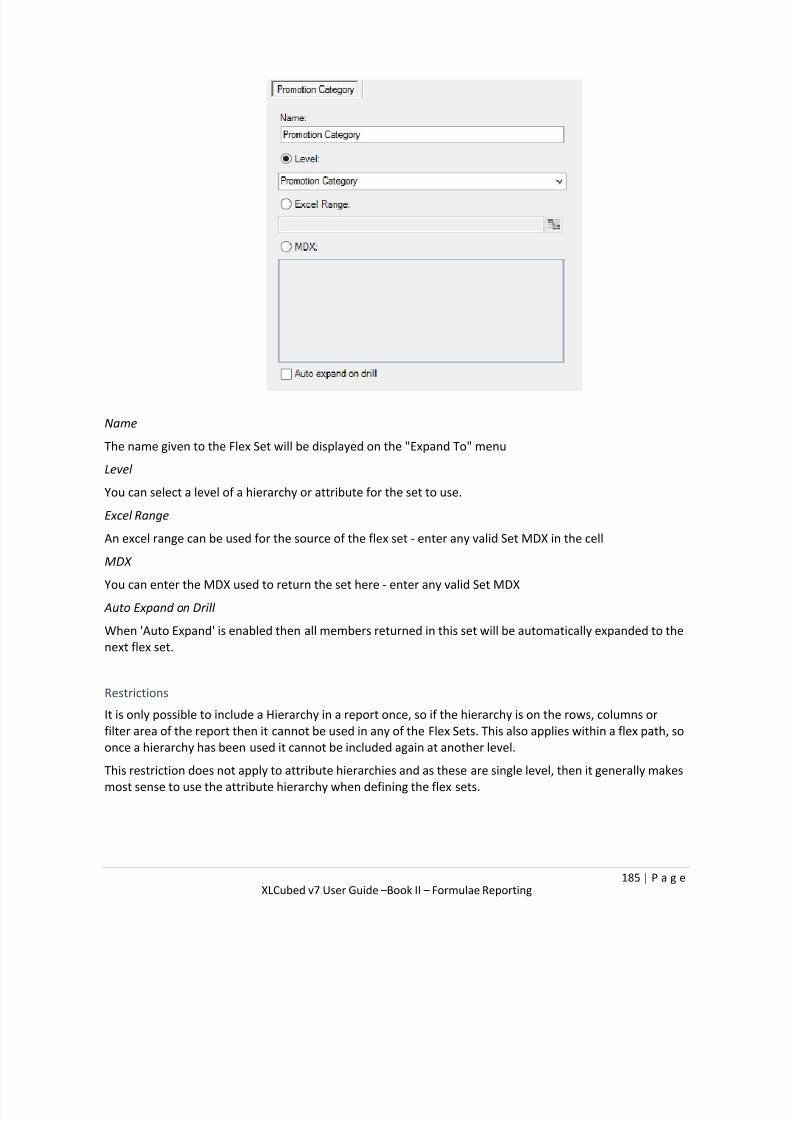
7/17/2019 XL Cubed versión 7 UserGuide
http://slidepdf.com/reader/full/xl-cubed-version-7-userguide 190/567
185 | P a g e XLCubed v7 User Guide –Book II – Formulae Reporting
Name
The name given to the Flex Set will be displayed on the "Expand To" menu
Level
You can select a level of a hierarchy or attribute for the set to use.Excel Range
An excel range can be used for the source of the flex set - enter any valid Set MDX in the cell
MDX
You can enter the MDX used to return the set here - enter any valid Set MDX
Auto Expand on Drill
When 'Auto Expand' is enabled then all members returned in this set will be automatically expanded to the
next flex set.
Restrictions
It is only possible to include a Hierarchy in a report once, so if the hierarchy is on the rows, columns or
filter area of the report then it cannot be used in any of the Flex Sets. This also applies within a flex path, so
once a hierarchy has been used it cannot be included again at another level.
This restriction does not apply to attribute hierarchies and as these are single level, then it generally makes
most sense to use the attribute hierarchy when defining the flex sets.

7/17/2019 XL Cubed versión 7 UserGuide
http://slidepdf.com/reader/full/xl-cubed-version-7-userguide 191/567
186 | P a g e XLCubed v7 User Guide –Book II – Formulae Reporting
XL3FlexMember
For more information about the XL3FlexMember please see the section on XL3FlexMember in Book II –
Formula Reporting.
Navigating
Once a flex report has been created then drilling will work in the same way as Formula Drilling, but will
follow the Flex Path defined rather than the hierarchy levels.
Expand to
Right-clicking on a Flex report member will give an "Expand To" option, this can be used to skip to a
particular flex set level.
Drill to
The Drill to option allows drilling to any valid hierarchy/attribute in the cube, it's not possible to drill to any
hierarchies included in the report already so these will be disabled
Slicers
To add slicers to a flex report - highlight one or more filter members and select "Add Slicer" - this will addslicers that are automatically cascading (that is they feed into each other top to bottom) and will also
enable the "Auto Filter" option on the flex path.
Picture Links
Version 7.5 added support for Picture Links these are pictures that can be inserted into a workbook that
provide the same functionality as the XL3Link formula.
Inserting
To insert a picture link, go to Insert Formula -> XL3PictureLink.

7/17/2019 XL Cubed versión 7 UserGuide
http://slidepdf.com/reader/full/xl-cubed-version-7-userguide 192/567
187 | P a g e XLCubed v7 User Guide –Book II – Formulae Reporting
Picture file to insert
Select the image to display in the picture link
Link To
Select the destination cell for where the user will be taken when the image is clicked on (this can be the
same sheet if the picture link is controlling something on this sheet or a different sheet to allow report
navigation)
Perform a "Submit Changes" on WebWith this enabled and the report has been published any writable cells or "Delayed Slicers" will be
submitted when the picture is clicked on, it acts the same as the "Submit" toolbar button on the web
Hyperlinks to update
You can provide a list of cells to update with either a value or the contents of another cell. This can be used
to drive a selection or copy ranges of values between worksheets or cells on the same sheet.
Editing
To edit an existing Picture Link, hold the "Shift" key when clicking and the standard Picture Link form willbe displayed
Using Camera Objects
To use a camera object as the source for an image, first insert the Picture Link selecting a temporary
picture. Then right-click on the picture to highlight it and then type the source range for the image in the
formula bar, i.e. Sheet2!a1:f10 would change the picture link to show the contents of the range, it can then
resized and re-positioned as required.

7/17/2019 XL Cubed versión 7 UserGuide
http://slidepdf.com/reader/full/xl-cubed-version-7-userguide 193/567
188 | P a g e
XLCubed v7 User Guide - Book III – Charting & Data Visualisation
Book III – Charting & Data Visualisation
Standard Excel Charts
XLCubed operates within Excel and as such any data retrieved into the workbook using XLCubed can be
charted using any standard Excel chart type. If the data being plotted is static in shape and you need veryfine grain control over the chart formatting this is likely the best approach.

7/17/2019 XL Cubed versión 7 UserGuide
http://slidepdf.com/reader/full/xl-cubed-version-7-userguide 194/567
189 | P a g e
XLCubed v7 User Guide - Book III – Charting & Data Visualisation
XLCubed Grid Charts
XLCubed provides a way to tie a chart directly to an XLCubed grid. This caters for when the grid changes in
shape and the number of elements, and lets the user specify the hierarchical level of the data to be
plotted. The available chart types are a subset of the Excel Chart library. For more information see Book I
– Grids and the section on Grid Charts.
In-Cell Charts
In-cell charts are small, focused charts which each fit within one Excel cell. They are designed to be used
within tables of data and allow the mixing of numbers and charts together in tables. They are often a very
space-efficient way to give context to, or highlight outliers in a data table.
In-Cell Charts can be used in two ways within XLCubed:
Formula-based: where an XLCubed formula controls the chart and the data being plotted must first be
returned into Excel.
Embedded in grids: where the charts are generated directly as part of the gird and support data growth.
For more details see the section in this document on In-Cell Charts in Grids
Small Multiples
Small Multiples, often known as Trellis Charts, are highly interactive and use individual charts to display
each slice of a data set. The axes are on a common scale and the only variable is the data set slice being
changed. They make it easy to see shared trend and pattern or outliers across the data set.

7/17/2019 XL Cubed versión 7 UserGuide
http://slidepdf.com/reader/full/xl-cubed-version-7-userguide 195/567
190 | P a g e
XLCubed v7 User Guide - Book III – Charting & Data Visualisation
For more information see the section in this document on Small Multiple Charts
Treemaps
A Treemap is a way to display hierarchical information using nesting rectangles or tiles. They are most
often set up where the size of the rectangle depicts one metric and the colour depicts another. They can
often help identify patterns which would otherwise be difficult to see.
For further information see the section in this document on Treemaps.
Mapping
XLCubed provides point and shape-based geospatial mapping. The maps can be zoomed and panned as
needed, and can be used as a selector for a report as well as just a display. For further information see the
section in this document on Maps .

7/17/2019 XL Cubed versión 7 UserGuide
http://slidepdf.com/reader/full/xl-cubed-version-7-userguide 196/567
191 | P a g e
XLCubed v7 User Guide - Book III – Charting & Data Visualisation
In-Cell Charts in Grids
In-Cell Charts can be used in two ways within XLCubed. Firstly, they can be selected in the measures
dialog. This is termed a Visual Grid. In this scenario, the In-Cell Charts behave in the same way as a
standard measure, and hierarchies can be dragged and repositioned during analysis with the In-Cell Charts
moving in sequence.
Secondly, in an environment where the hierarchies on rows and columns will not change, In-Cell Charts can
be inserted as Grid Calculations. This allows for the use of spark bars as, for example, deviation analysis, or
bullet charts. These can be configured to cater for row dynamic reporting as outlined below.
Visual Grids for Time Series Analysis
Visual Grids add visualization capability to the dynamic XLCubed Grid. In-Cell Charts add historical context
to the headline numbers and allow fast, effective parallel comparisons of trends and patterns, while fully
retaining the slice and dice environment. So in any XLCubed Grid you can now choose to display just thenumbers, just the historical trend through In-Cell Charts, or indeed both as below:
In this case we can see a revenue fall across all products for Europe in the same time frame, which
should be investigated further and understood. There are a large number of formatting options around
the charts, for example it's possible to use a common chart scale across the whole Grid, which can be
used to good effect with column or area charts.
The process of adding a chart into a Grid is initiated through the measure selection. In the Hierarchy
Editor for Measures, a drop down menu is available which gives the option to display the value (default),
or to chart the trend:
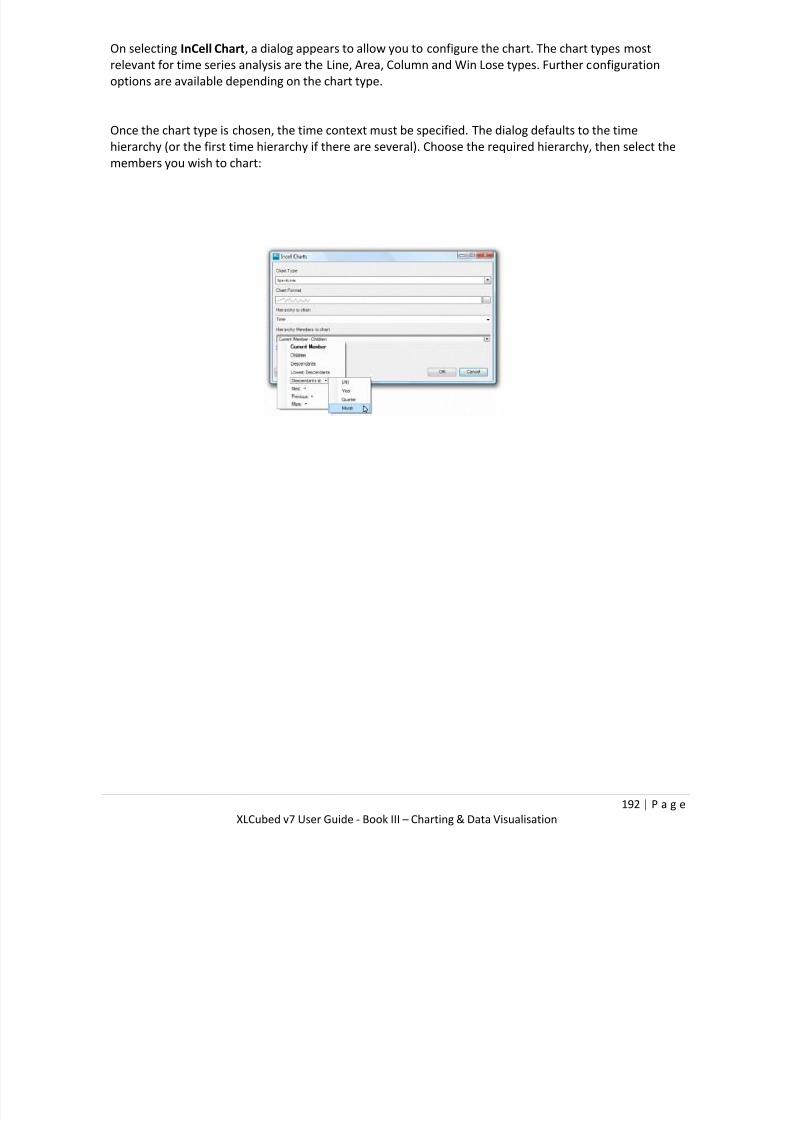
7/17/2019 XL Cubed versión 7 UserGuide
http://slidepdf.com/reader/full/xl-cubed-version-7-userguide 197/567
192 | P a g e
XLCubed v7 User Guide - Book III – Charting & Data Visualisation
On selecting InCell Chart, a dialog appears to allow you to configure the chart. The chart types most
relevant for time series analysis are the Line, Area, Column and Win Lose types. Further configuration
options are available depending on the chart type.
Once the chart type is chosen, the time context must be specified. The dialog defaults to the time
hierarchy (or the first time hierarchy if there are several). Choose the required hierarchy, then select the
members you wish to chart:

7/17/2019 XL Cubed versión 7 UserGuide
http://slidepdf.com/reader/full/xl-cubed-version-7-userguide 198/567
193 | P a g e
XLCubed v7 User Guide - Book III – Charting & Data Visualisation
Visual Grids for Performance Analysis
We will use Visual Grid charts to show a chart for Gross Profit and when its margin falls below a specified
value.
Start by following the MDX calculations in Book XI - Tutorials to create the initial report.
To create the Gross Profit bar chart:
Open the Hierarchy Editor for Measures by double clicking on the Measures hierarchy label.
Click on the Gross Profit dropdown, and select InCell Chart:
Select Bar as the chart type and choose the one with a value axis as the subtype:

7/17/2019 XL Cubed versión 7 UserGuide
http://slidepdf.com/reader/full/xl-cubed-version-7-userguide 199/567
194 | P a g e
XLCubed v7 User Guide - Book III – Charting & Data Visualisation
Select just Current Member for the Hierarchy members to chart.
To create the Gross Profit Margin alert indicator:
Select the Gross Profit Margindropdown, and choose InCell Chart.
Select 3-State Alert Icons (Red Shade) as the chart type
Click the Chart Format button to change the format, and change the first colour's condition to >
0.6 and the second colour's to > 0.55:
• On the Label tab, set the chart label to Alert, then click OK
• Select just Current Member for the Hierarchy members to chart

7/17/2019 XL Cubed versión 7 UserGuide
http://slidepdf.com/reader/full/xl-cubed-version-7-userguide 200/567
195 | P a g e
XLCubed v7 User Guide - Book III – Charting & Data Visualisation
Click OK again to accept the chart.
When we run the report, we see all of the Roadproduct group is in a warning state, and Road S8000is
in the alert state:

7/17/2019 XL Cubed versión 7 UserGuide
http://slidepdf.com/reader/full/xl-cubed-version-7-userguide 201/567
196 | P a g e
XLCubed v7 User Guide - Book III – Charting & Data Visualisation
Small Multiple Charts
Small multiple charts is a term popularised by Edward Tufte. They allow comparing data series as they are
repeated for different members. In XLCubed they are useful for visualising large amounts of data, as
hundreds of data points can be plotted and compared easily.
This allows users to find trends and outliers in the data more easily than by trying to study a large table of
data.
User Interface
As mentioned previously it can be difficult to understand outliers, trends etc when the data is presented
as just numbers and text as can be seen below. Using Small Multiples with this example below will guide
you through creating meaningful information from the data.
Task Pane: building a set of Charts Example Basic
As you can see the image on the right is a much easier way of viewing the data, compared to the grid.
Let's work through an example.
Category defines the Category (X Axis) within each individual Chart, in this case a Trend over Time

7/17/2019 XL Cubed versión 7 UserGuide
http://slidepdf.com/reader/full/xl-cubed-version-7-userguide 202/567
197 | P a g e
XLCubed v7 User Guide - Book III – Charting & Data Visualisation
The Series defines the number of data series to be charted.
In order to be able to visualise a simple trend this would be easier with Lines rather than Columns. Use
the Chart Type on the Options panel of the Task Pane to change the chart style.
By dragging the Region hierarchy onto columns, and then selecting Children of All, we can split data into
separate charts at Region level.
We can additionally split this by Channel by dragging the Channel hierarchy onto rows,
Now we have a graph for each Region by Sales Channel. The Scales (Y axis) are shared so that the charts
can be easily compared.
More detail is available for each chart by double clicking on the individual chart eg Direct Sales/ Australia
Pacific, where the data is unclear because of low numbers can be further explored like this. The scale is
automatically adjusted to give a clearer picture of the data. Use the back button to return to the higher
level.
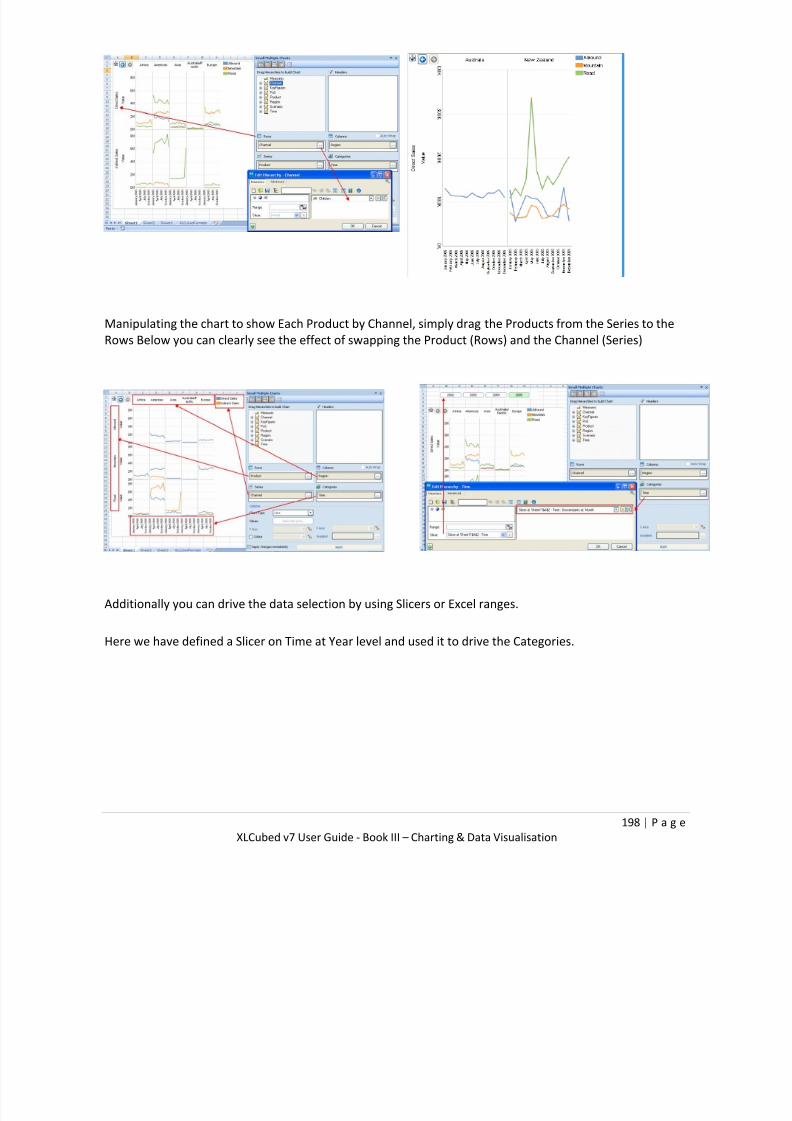
7/17/2019 XL Cubed versión 7 UserGuide
http://slidepdf.com/reader/full/xl-cubed-version-7-userguide 203/567
198 | P a g e
XLCubed v7 User Guide - Book III – Charting & Data Visualisation
Manipulating the chart to show Each Product by Channel, simply drag the Products from the Series to the
Rows Below you can clearly see the effect of swapping the Product (Rows) and the Channel (Series)
Additionally you can drive the data selection by using Slicers or Excel ranges.
Here we have defined a Slicer on Time at Year level and used it to drive the Categories.

7/17/2019 XL Cubed versión 7 UserGuide
http://slidepdf.com/reader/full/xl-cubed-version-7-userguide 204/567
199 | P a g e
XLCubed v7 User Guide - Book III – Charting & Data Visualisation
Small Multiple Chart Designer
Insert a Small Multiples chart by using the Small Multiples option on the ribbon, or the Insert -> Small
Multiples Menu option.
After inserting a Small Multiples Chart the above windows will be displayed. The Small Multiples Charts -
Task Pane is automatically displayed on the right of the sheet. The Task Pane can also be accessed from
the right mouse button pop-up menu.
To delete the Small Multiple chart use the right mouse button pop-up menu -> Delete option.
To Move, Size or Close the Task Pane, drag it using the window bar or use the drop down menu on the
Task Pane Header.
The data within the Charts can be refreshed (like a grid) by using the right mouse button pop-up menu ->
Refresh option There is also an initial Warning displayed on the empty chart as it is essential for the design
of a Small Multiple Chart set that a Category is selected. This warning can also be seen on the Task Pane.
Display Options
Using some of the other features in the Options section of the Task Panel, charts can be made to display
data in order to be able to better view correlations and or outliers
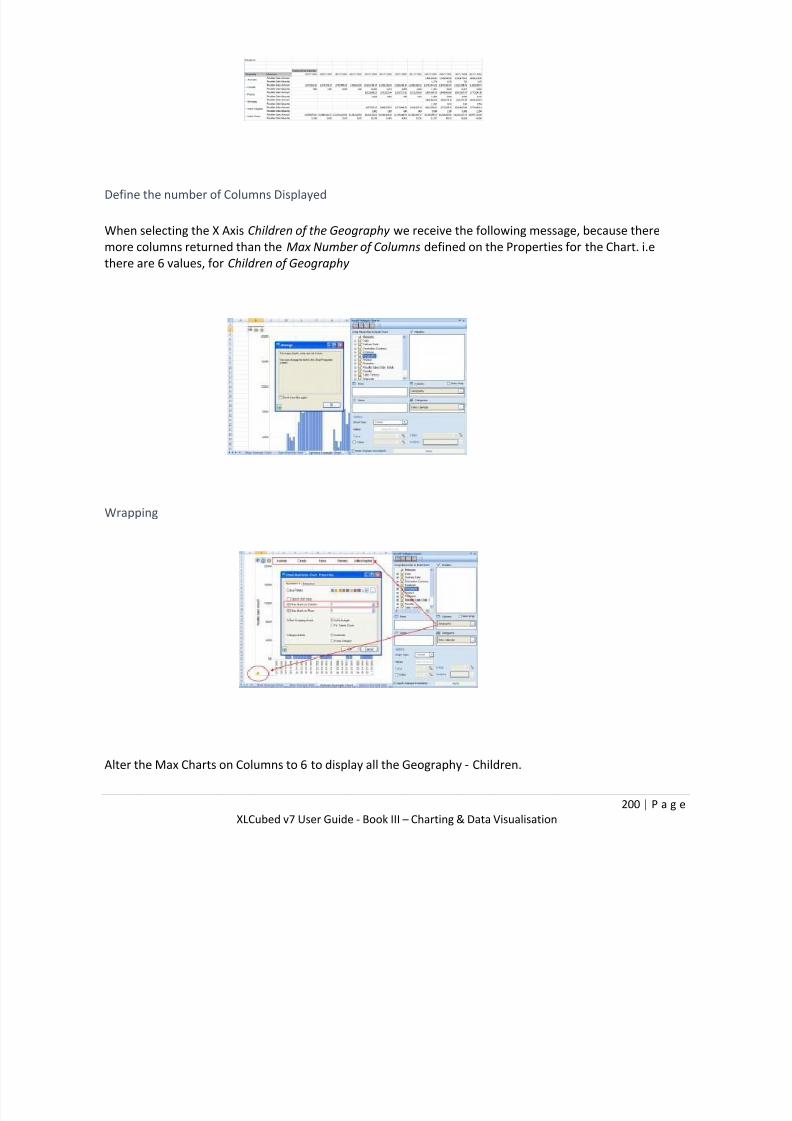
7/17/2019 XL Cubed versión 7 UserGuide
http://slidepdf.com/reader/full/xl-cubed-version-7-userguide 205/567

7/17/2019 XL Cubed versión 7 UserGuide
http://slidepdf.com/reader/full/xl-cubed-version-7-userguide 206/567
201 | P a g e
XLCubed v7 User Guide - Book III – Charting & Data Visualisation
Note the Warning indicator icon in the bottom left corner of the Chart has now disappeared as all the data
is displayed.

7/17/2019 XL Cubed versión 7 UserGuide
http://slidepdf.com/reader/full/xl-cubed-version-7-userguide 207/567
202 | P a g e
XLCubed v7 User Guide - Book III – Charting & Data Visualisation
As there is nothing selected on the Rows, a better way to display this information, given its long narrow
nature would be to turn on Chart wrapping.
The data still has a common scale and is more easily compared

7/17/2019 XL Cubed versión 7 UserGuide
http://slidepdf.com/reader/full/xl-cubed-version-7-userguide 208/567
203 | P a g e
XLCubed v7 User Guide - Book III – Charting & Data Visualisation
Move the Legend
Using Right Mouse Menu select the position for the Legend, Right, Bottom or None. If None is selected the
Legend can easily be retrieved by using the Right Mouse button anywhere on the Chart.
Highlight a Series
Using the Legend series on the Charts can be highlighted, this is useful where series overlap. Here the
Reseller Order Count appears brighter. Multiple series can be selected by using Crtl Click.
Drill Into: for a breakdown on the Column

7/17/2019 XL Cubed versión 7 UserGuide
http://slidepdf.com/reader/full/xl-cubed-version-7-userguide 209/567
204 | P a g e
XLCubed v7 User Guide - Book III – Charting & Data Visualisation
Using the Right Mouse Menu Drill Into the data for Canada, you can continue drilling as far as the Hierarchy
allows.Using the Back button returns to the previous level of Charts.

7/17/2019 XL Cubed versión 7 UserGuide
http://slidepdf.com/reader/full/xl-cubed-version-7-userguide 210/567
205 | P a g e
XLCubed v7 User Guide - Book III – Charting & Data Visualisation
Keep Only: for a closer look at a single Column
Click on the chart you wish to keep and use the Keep
Only menu option to remove the other charts
Keep Except: for a closer Comparison
Using this option you can get a closer comparison between two or more Geographies. Here we have
removed the United States and Canada, in order to get a better look at how the other Geographies
compare to each other. Notice the scales have been adjusted to reflect only the data displayed.

7/17/2019 XL Cubed versión 7 UserGuide
http://slidepdf.com/reader/full/xl-cubed-version-7-userguide 211/567
206 | P a g e
XLCubed v7 User Guide - Book III – Charting & Data Visualisation
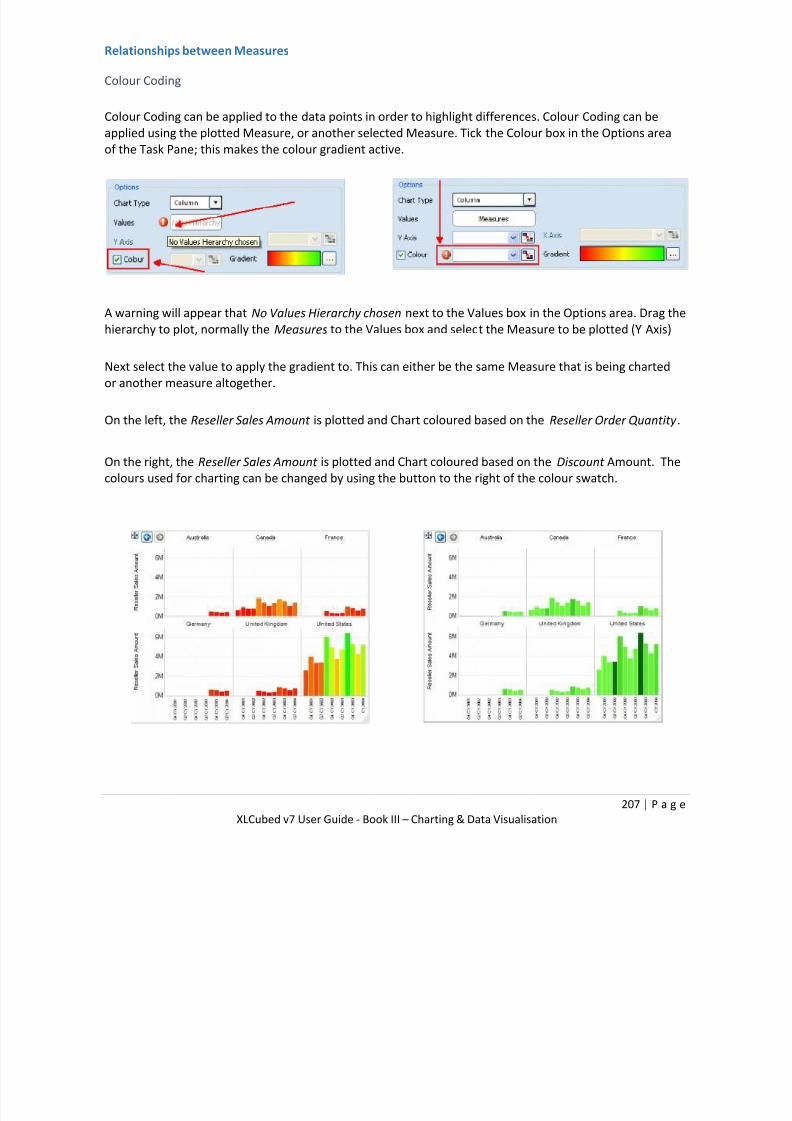
7/17/2019 XL Cubed versión 7 UserGuide
http://slidepdf.com/reader/full/xl-cubed-version-7-userguide 212/567
207 | P a g e
XLCubed v7 User Guide - Book III – Charting & Data Visualisation
Relationships between Measures
Colour Coding
Colour Coding can be applied to the data points in order to highlight differences. Colour Coding can be
applied using the plotted Measure, or another selected Measure. Tick the Colour box in the Options area
of the Task Pane; this makes the colour gradient active.
A warning will appear that No Values Hierarchy chosen next to the Values box in the Options area. Drag the
hierarchy to plot, normally the Measures to the Values box and select the Measure to be plotted (Y Axis)
Next select the value to apply the gradient to. This can either be the same Measure that is being charted
or another measure altogether.
On the left, the Reseller Sales Amount is plotted and Chart coloured based on the Reseller Order Quantity .
On the right, the Reseller Sales Amount is plotted and Chart coloured based on the Discount Amount. The
colours used for charting can be changed by using the button to the right of the colour swatch.
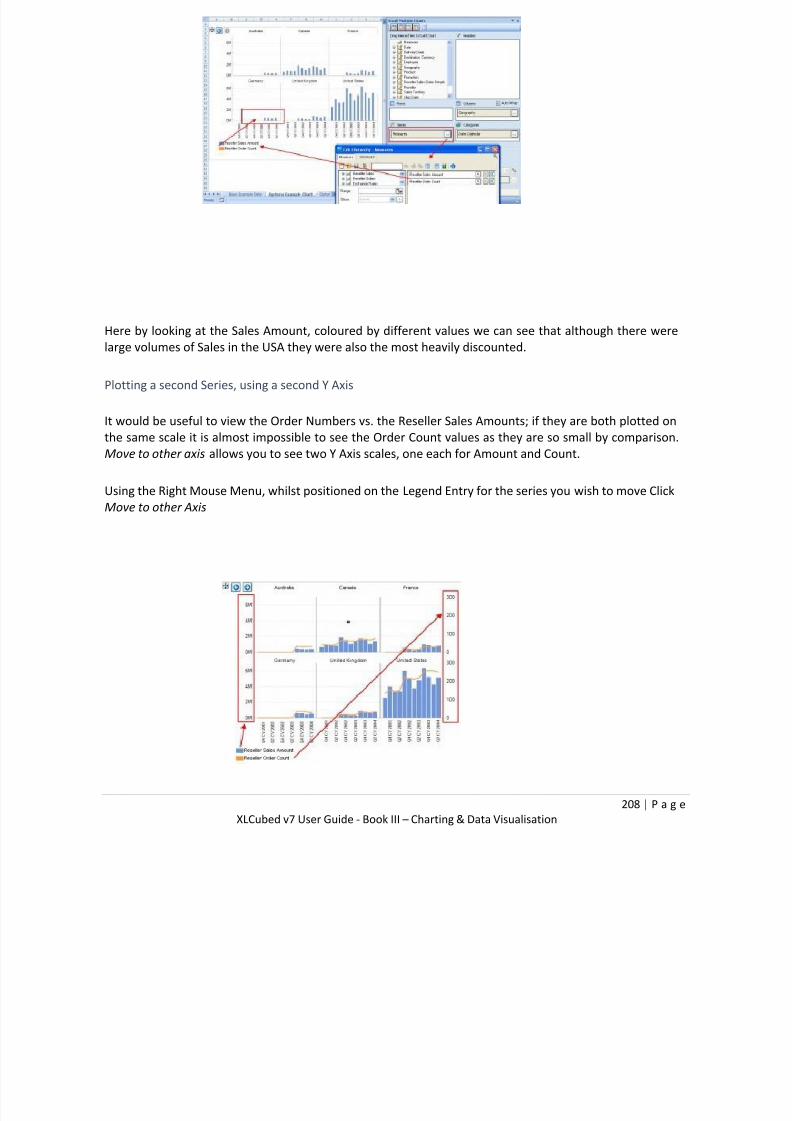
7/17/2019 XL Cubed versión 7 UserGuide
http://slidepdf.com/reader/full/xl-cubed-version-7-userguide 213/567
208 | P a g e
XLCubed v7 User Guide - Book III – Charting & Data Visualisation
Here by looking at the Sales Amount, coloured by different values we can see that although there werelarge volumes of Sales in the USA they were also the most heavily discounted.
Plotting a second Series, using a second Y Axis
It would be useful to view the Order Numbers vs. the Reseller Sales Amounts; if they are both plotted on
the same scale it is almost impossible to see the Order Count values as they are so small by comparison.
Move to other axis allows you to see two Y Axis scales, one each for Amount and Count.
Using the Right Mouse Menu, whilst positioned on the Legend Entry for the series you wish to move Click
Move to other Axis

7/17/2019 XL Cubed versión 7 UserGuide
http://slidepdf.com/reader/full/xl-cubed-version-7-userguide 214/567
209 | P a g e
XLCubed v7 User Guide - Book III – Charting & Data Visualisation
Scatter Charts: plotting a correlation
Plotting a correlation, using a scatter chart option - firstly define the Y axis and then the X axis against which
it is to be plotted. Here we can see how the Sales Amount and Order Count are related - closely in Australia,
but spread out in the United States.
In a second example, for selected Geographies, we can apply colour to the chart using a third measure,
Discount Amount. Additionally the data is split by Product Category on the rows.
Heavily discounted sales can be seen as red data points.
Using the first example the chart type can be changed to a Bubble. Using the Discount Amount to determine
the size of the bubble it can be seen that the greatest discounts occur in the United States.

7/17/2019 XL Cubed versión 7 UserGuide
http://slidepdf.com/reader/full/xl-cubed-version-7-userguide 215/567
210 | P a g e
XLCubed v7 User Guide - Book III – Charting & Data Visualisation
Drilling through the individual charts, using the Right Mouse can then provide more details as to where the
actual sales occur. eg. in Australia, most Sales with high Discounts occur in New South Wales in the LaneCove area.
Use the back button to navigate back through the previous charts.
Headers: Filtering the Data
By moving the Measures to the Headers you can add to and or change the currently charted
measure.
By moving any of the other Hierarchies into the Headers area filters can be applied to the data. eg Here we
are looking at Reseller Sales for just Accessories and Clothing Sales.
Versus Sales for Components below: Components are sold in more locations than the Clothing and
Accessories. Note that these selections can be driven from an Excel range or Slicer and could therefore be
preset or selected by the viewer.

7/17/2019 XL Cubed versión 7 UserGuide
http://slidepdf.com/reader/full/xl-cubed-version-7-userguide 216/567
211 | P a g e
XLCubed v7 User Guide - Book III – Charting & Data Visualisation
Properties
The Small Multiple Chart Properties can be accessed either from the right mouse button pop-up menu -
> Properties or from the tool bar at the top of the Small Multiple Charts Task Pane
Appearance
Colour Palette: Select the Colour Palette for the Chart
Space chart areas: when ticked creates a space between each chart.
Max charts on Columns: the maximum number of Charts displayed in each Column. Max charts on
Rows: the maximum number of Charts displayed in each Row.
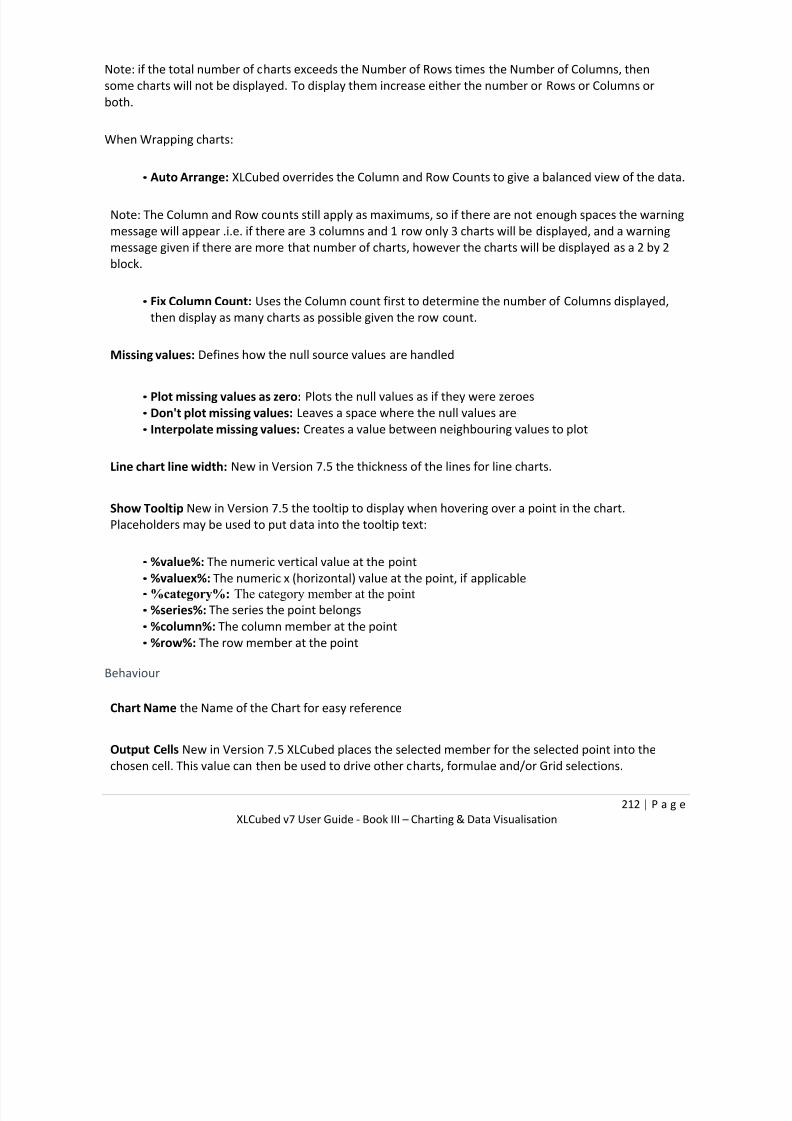
7/17/2019 XL Cubed versión 7 UserGuide
http://slidepdf.com/reader/full/xl-cubed-version-7-userguide 217/567
212 | P a g e
XLCubed v7 User Guide - Book III – Charting & Data Visualisation
Note: if the total number of charts exceeds the Number of Rows times the Number of Columns, then
some charts will not be displayed. To display them increase either the number or Rows or Columns or
both.
When Wrapping charts:
• Auto Arrange: XLCubed overrides the Column and Row Counts to give a balanced view of the data.
Note: The Column and Row counts still apply as maximums, so if there are not enough spaces the warning
message will appear .i.e. if there are 3 columns and 1 row only 3 charts will be displayed, and a warning
message given if there are more that number of charts, however the charts will be displayed as a 2 by 2
block.
• Fix Column Count: Uses the Column count first to determine the number of Columns displayed,
then display as many charts as possible given the row count.
Missing values: Defines how the null source values are handled
• Plot missing values as zero: Plots the null values as if they were zeroes
• Don't plot missing values: Leaves a space where the null values are
• Interpolate missing values: Creates a value between neighbouring values to plot
Line chart line width: New in Version 7.5 the thickness of the lines for line charts.
Show Tooltip New in Version 7.5 the tooltip to display when hovering over a point in the chart.
Placeholders may be used to put data into the tooltip text:
• %value%: The numeric vertical value at the point
• %valuex%: The numeric x (horizontal) value at the point, if applicable
• %category%: The category member at the point
• %series%: The series the point belongs
• %column%: The column member at the point
• %row%: The row member at the point
Behaviour
Chart Name the Name of the Chart for easy reference
Output Cells New in Version 7.5 XLCubed places the selected member for the selected point into the
chosen cell. This value can then be used to drive other charts, formulae and/or Grid selections.
7/17/2019 XL Cubed versión 7 UserGuide
http://slidepdf.com/reader/full/xl-cubed-version-7-userguide 218/567
213 | P a g e
XLCubed v7 User Guide - Book III – Charting & Data Visualisation
In this example, the Column member Geography - France is placed in $A$26, and Product Categories - [1]
Bikes in
$A$27. This value can then be used to drive other charts, formulas and or grid selections:
Link To New in Version 7.5 when a point on the chart is clicked, this range is selected.
Placement Controls the behaviour of the chart when surrounding cells are moved and resized:
• Free floating: The chart ignores all cell size changes
• Move: The chart is moved together with the surrounding cells, but is not resized by them
• Move and Size: The chart is moved and resized together with the surrounding cells
Show Back/Forward controls Controls whether back and forward controls are displayed on the chart to
undo and redo changes made to it
Enable high performance charts If ticked, high performance charts are used
Axes Controls the minima and maxima of the vertical axes
Titles and Axes
New in Version 7.5
Chart titles: The font used to display the column and row members
Chart axes:
• Label font The font used to display the labels on the axis
• Label angle The angle to show the label text at
• Allow label truncation Allows label text to be shortened in order to display tidily

7/17/2019 XL Cubed versión 7 UserGuide
http://slidepdf.com/reader/full/xl-cubed-version-7-userguide 219/567
214 | P a g e
XLCubed v7 User Guide - Book III – Charting & Data Visualisation
• Stagger labels Allows alternate labels to be shifted in order to improve readability
• End label visible Shows or hides the last label
Category Labels: Determines the display of the Category Labels on the Chart.
• Automatic: XLCubed will decide how many labels to display, based on the space available.
•
Every Category: each category will be displayed regardless of the space available.• None: No labels will be displayed.
• Custom: The labels will be shown based on a number you enter.
Colours and Style
From Version 7.6
Chart background: the colour used to fill in the area behind the charts
Chart area background: the colour used to fill the individual charts
Axis colour: the colour used to draw the vertical and horizontal axes
Gridline colour: the colour used to draw any gridlines on each chartShow columns and bars as cylinders: when ticked, column and bar charts are filled with a 3D effect
Marker style: for chart types that use them (e.g. scatter charts), the shape of the markers:
Triangle
Star10
Star6
Star5
Star4
Square
Diamond
Cross
Circle
Marker size: for chart types that use them (e.g. scatter charts, dot charts), the size of the markers

7/17/2019 XL Cubed versión 7 UserGuide
http://slidepdf.com/reader/full/xl-cubed-version-7-userguide 220/567
215 | P a g e
XLCubed v7 User Guide - Book III – Charting & Data Visualisation
Colour and Gradient Picker
The colour gradient picker is used to determine both the colours and the rate at which the colour changes.
This can have a dramatic effect on the impact on the data being displayed and is a valuable tool for making
sure that data becomes information
Here the only change was made to the centre of the colour bar
Chart type
Use the drop-down on chart-type as below to see the many different chart types available within XLCubed
for use within Small Multiples graphing.
Trendlines
New in Version 7.5 - you can right-click on a Series (or the chart for all series) to add a trendline:

7/17/2019 XL Cubed versión 7 UserGuide
http://slidepdf.com/reader/full/xl-cubed-version-7-userguide 221/567
216 | P a g e
XLCubed v7 User Guide - Book III – Charting & Data Visualisation
You can then select the type of trendline and formatting in the Trendline Options
Interactive Charting
New in Version 7.5 - charts can be made an interactive, clickable part of the overall report
7/17/2019 XL Cubed versión 7 UserGuide
http://slidepdf.com/reader/full/xl-cubed-version-7-userguide 222/567
217 | P a g e
XLCubed v7 User Guide - Book III – Charting & Data Visualisation
Small Multiple Charts based on other data sources
From XLCubed v7.5, you may also insert Small Multiple Charts based on data from sources other than
Analysis Services.
Small Multiple Charts based on SQL
From v7.5, XLCubed has the ability to create Small Multiple Charts from data in relational databases. Toinsert a new chart:
1. Select the XLCubed > Insert > Small Multiples > SQL... ribbon item
2. Select the data source and query, as described in SQL Data Tables (Administrators)
3. XLCubed will then insert an empty chart for you, ready for your columns selections
These small multiple charts are identical to the Analysis Services based charts described on the Small
Multiple Charts page, except for a few differences:
• There is no Header area: the charts are always based on the entire data set, and each returned
column can be placed anywhere on the chart designer.
• Any numeric column can be selected for the Y Axis values. When appropriate, this also applies to
X Axis and Colour values.
• To edit the connection, you may click the Select data source toolbar button in the Task Pane:
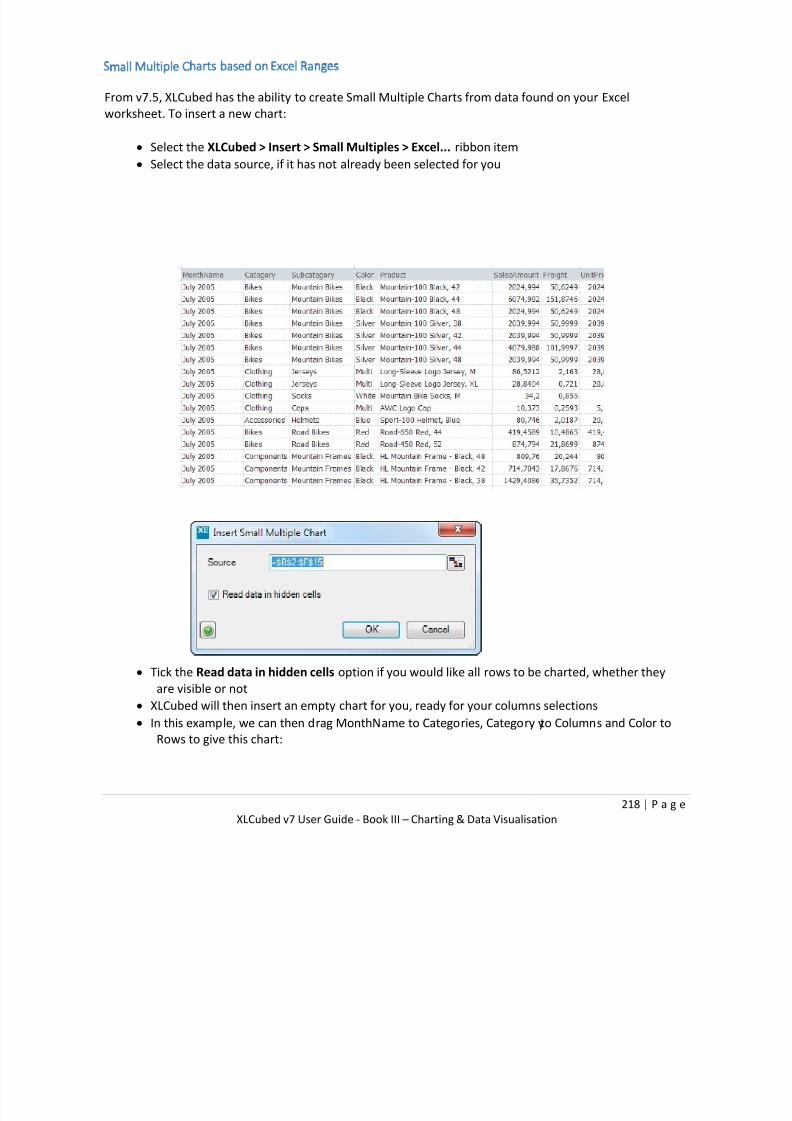
7/17/2019 XL Cubed versión 7 UserGuide
http://slidepdf.com/reader/full/xl-cubed-version-7-userguide 223/567
218 | P a g e
XLCubed v7 User Guide - Book III – Charting & Data Visualisation
Small Multiple Charts based on Excel Ranges
From v7.5, XLCubed has the ability to create Small Multiple Charts from data found on your Excel
worksheet. To insert a new chart:
Select the XLCubed > Insert > Small Multiples > Excel... ribbon item
Select the data source, if it has not already been selected for you
Tick the Read data in hidden cells option if you would like all rows to be charted, whether they
are visible or not
XLCubed will then insert an empty chart for you, ready for your columns selections
In this example, we can then drag MonthName to Categories, Category yto Columns and Color to
Rows to give this chart:
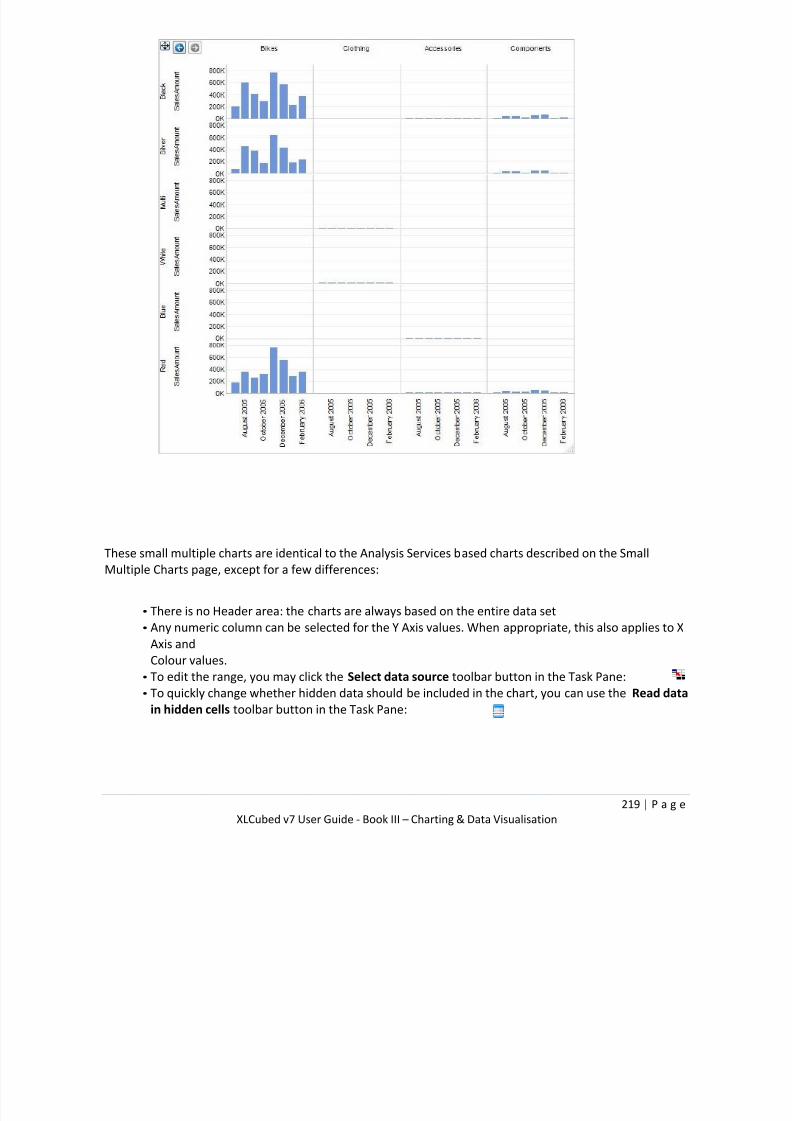
7/17/2019 XL Cubed versión 7 UserGuide
http://slidepdf.com/reader/full/xl-cubed-version-7-userguide 224/567
219 | P a g e
XLCubed v7 User Guide - Book III – Charting & Data Visualisation
These small multiple charts are identical to the Analysis Services based charts described on the Small
Multiple Charts page, except for a few differences:
• There is no Header area: the charts are always based on the entire data set
• Any numeric column can be selected for the Y Axis values. When appropriate, this also applies to X
Axis and
Colour values.• To edit the range, you may click the Select data source toolbar button in the Task Pane:
• To quickly change whether hidden data should be included in the chart, you can use the Read data
in hidden cells toolbar button in the Task Pane:

7/17/2019 XL Cubed versión 7 UserGuide
http://slidepdf.com/reader/full/xl-cubed-version-7-userguide 225/567
220 | P a g e
XLCubed v7 User Guide - Book III – Charting & Data Visualisation
Interactive Charting
Version 7.5 provides the ability for more interactive, chart-driven reporting. This is achieved by extending
the existing Small Multiple Charts in the product. Users can now click a chart, or a datapoint within a chart
and have the rest of the report update in context, as in the example below where Road Bikes, Q2 has been
selected and the ranking table beneath has been filtered accordingly.
Small Multiples have been extended in three key areas:
• Full control over selected chart and chart area, with associated formatting
• More control over axis and title formatting
• In addition to cubes, Small Multiple charts can also be built from an Excel Range or directly from
SQL.

7/17/2019 XL Cubed versión 7 UserGuide
http://slidepdf.com/reader/full/xl-cubed-version-7-userguide 226/567
221 | P a g e
XLCubed v7 User Guide – Book III – Charting & Data Visualisation
Chart Selections
When building reports, it's now possible to track any selected element of a Small Multiple Chart. This
includes an axis element, an individual chart, or any data point in the chart. This information can be
output to a range of Excel cells, and then other parts of the overall report, including grids and formulae,
can be based on the content of these cells. The chart will also indicate by colour which chart or datapoint
is selected. This is handled by all unselected elements being displayed in a much lighter shade, while theselected item retains the original colour.
These output properties are configured in the properties for the chart control, as shown in the
screenshot. To track an element, select the relevant checkbox and chose the desired output cell.
'Link to' is also available as an option, where the focus can be moved to another area of the report in the
context of the selected chart or chart element.
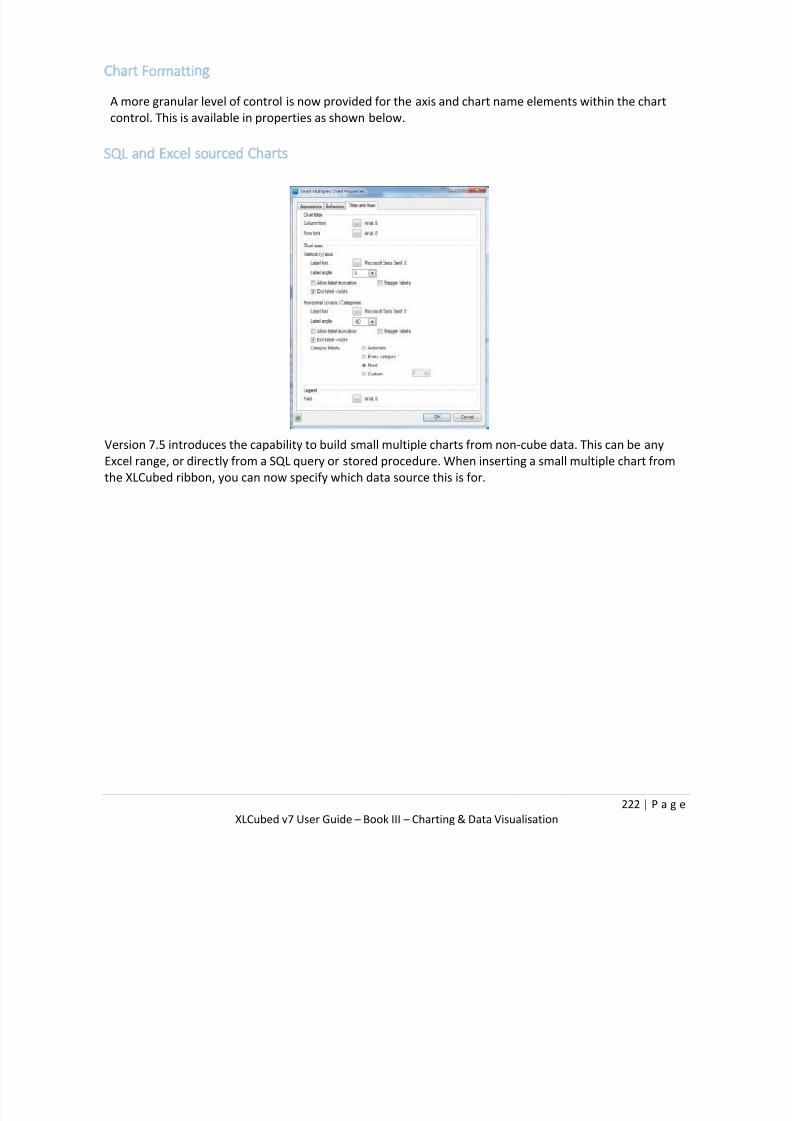
7/17/2019 XL Cubed versión 7 UserGuide
http://slidepdf.com/reader/full/xl-cubed-version-7-userguide 227/567
222 | P a g e
XLCubed v7 User Guide – Book III – Charting & Data Visualisation
Chart Formatting
A more granular level of control is now provided for the axis and chart name elements within the chart
control. This is available in properties as shown below.
SQL and Excel sourced Charts
Version 7.5 introduces the capability to build small multiple charts from non-cube data. This can be any
Excel range, or directly from a SQL query or stored procedure. When inserting a small multiple chart from
the XLCubed ribbon, you can now specify which data source this is for.

7/17/2019 XL Cubed versión 7 UserGuide
http://slidepdf.com/reader/full/xl-cubed-version-7-userguide 228/567
223 | P a g e
XLCubed v7 User Guide – Book III – Charting & Data Visualisation
In-Cell Chart Designer
This dialog is used to format any In-Cell Charts in your report, and can be invoked in several ways:
For In-Cell Chart formulae
While inserting an In-Cell Chart formula, after choosing the desired chart type, clicking the ...button under Chart Format
Right-clicking on an existing In-Cell Chart or formula, then selecting XLCubed > Format In-Cell
Chart...
Double-clicking on an existing In-Cell Chart or formula
For Grid-based In-Cell Charts
While inserting an In-Cell Chart member, after choosing the desired chart type, clicking the ...
button under Chart Format
In the Report Designer or the Hierarchy Editor, existing In-Cell Chart members have a ...button to
format the chart
The specific dialog that is displayed depends on which chart type has been selected for the In-Cell Charts:
• SparkLine Chart Designer (including area charts)
• SparkColumns Chart Designer
• SparkWinLose Chart Designer
• SparkBar Chart Designer
•
SparkBullet Chart Designer• SparkIcon Chart Designer
• SparkPie Chart Designer
• SparkHorizon Chart Designer
• SparkBox Chart Designer
• DotPlot Chart Designer
• Lollipop Chart Designer
• Bandline Chart Designer

7/17/2019 XL Cubed versión 7 UserGuide
http://slidepdf.com/reader/full/xl-cubed-version-7-userguide 229/567
224 | P a g e
XLCubed v7 User Guide – Book III – Charting & Data Visualisation
SparkLine Chart Designer
This dialog is used to format any SparkLine or SparkArea In-Cell Charts in your report. For details about
how to invoke the dialog, see the section In-Cell Chart Designer.
Chart Options
General
Title: Specifies a title to place in the formula cell (for In-Cell Chart formulae), or to use as the member
name (when used in Grids)
Line type: Uses the desired rendering style for the data points
Line colour: The colour to use for the line
Point colour: The default colour to use for the data points
Negative point colour: The default colour to use for negative data points
Stretch factor: The horizontal scale factor to use when drawing the chart
Point highlighting
Minimum value colour: The colour to highlight the lowest point
Maximum value colour: The colour to highlight the highest point
Start value colour: The colour to highlight the first point
End value colour: The colour to highlight the last point

7/17/2019 XL Cubed versión 7 UserGuide
http://slidepdf.com/reader/full/xl-cubed-version-7-userguide 230/567
225 | P a g e
XLCubed v7 User Guide – Book III – Charting & Data Visualisation
Missing values
Don't plot missing values: Leave a gap where there is a gap in the source data
Plot missing values as zero: Substitute gaps in the source data with zeros
Interpolate missing values: Fill in missing values with statistically appropriate values

7/17/2019 XL Cubed versión 7 UserGuide
http://slidepdf.com/reader/full/xl-cubed-version-7-userguide 231/567
226 | P a g e
XLCubed v7 User Guide – Book III – Charting & Data Visualisation
Axis Options
Vertical Scale
Automatic common scale: If selected, overrides all the other vertical scale options and chooses one set
of scales to suit all the charts controlled by this formula or member
Minimum
Automatic: Selects a suitable minimum for each chart individually
Custom: Specifies the minimum for all charts
Maximum
Automatic: Selects a suitable maximum for each chart individually
Custom: Specifies the maximum for all charts
Period
No period colour: Disables alternate background shading
Period colour: Enables alternate background shading, allowing you to specify the
alternate colour and the length of the period
Background Options
No background: Renders the chart as just lines and points (as previously specified), without
additional background
Fill area: Renders the chart as an area chart, with the area below the line filled in the
specified colour
Normal band: Renders a band on the chart, within which normal points are expected to fall
Normal band colour: The colour for the normal band
Standard deviations: Specifies that the normal band should be calculated as plus or minus the
specified number of standard deviations from the mean
Custom: Allows selection of custom values or values for the minimum and maximum
normal values
Reference Line Options
No reference line: Disables the reference line
Reference line: Renders a reference line on each chart, and allows you to specify furtheroptions
Reference line colour : The colour for the reference line
Automatic average: Specifies that the reference line should be calculated as the mean of all the
points in the chart
Custom value: Allows selection of a custom value or values for the reference line data points

7/17/2019 XL Cubed versión 7 UserGuide
http://slidepdf.com/reader/full/xl-cubed-version-7-userguide 232/567
227 | P a g e
XLCubed v7 User Guide – Book III – Charting & Data Visualisation
SparkColumns Chart Designer
This dialog is used to format any SparkColumns In-Cell Charts in your report. For details about how to
invoke the dialog, see In-Cell Chart Designer.
Chart Options
General
Title: Specifies a title to place in the formula cell (for In-Cell Chart formulae), or to
use as the member name (when used in Grids)
Column colour: The default colour to use for the columns
Negative point colour: The default colour to use for negative columns
Column width: The width of each column
Column highlighting
Minimum value colour: The colour to highlight the lowest column
Maximum value colour: The colour to highlight the highest column
Start value colour: The colour to highlight the first column
End value colour: The colour to highlight the last column
Axis Options
Vertical Scale
Automatic common scale: If selected, overrides all the other vertical scale options and chooses one set
of scales to suit all the charts controlled by this formula or member
Minimum
Automatic: Selects a suitable minimum for each chart individually
Custom: Specifies the minimum for all charts
Maximum
Automatic: Selects a suitable maximum for each chart individuallyCustom: Specifies the maximum for all charts
Period
No period colour: Disables alternate column shading
Period colour: Enables alternate column shading, allowing you to specify the alternate
colour for positive and negative columns and period length

7/17/2019 XL Cubed versión 7 UserGuide
http://slidepdf.com/reader/full/xl-cubed-version-7-userguide 233/567
228 | P a g e
XLCubed v7 User Guide – Book III – Charting & Data Visualisation
Reference Line Options
No reference line: Disables the reference line
Reference line: Renders a reference line on each chart, and allows you to specify further
options
Reference line colour : The colour for the reference line
Automatic average: Specifies that the reference line should be calculated as the mean of all thepoints in the chart
Custom value: Allows selection of a custom value or values for the reference line data points

7/17/2019 XL Cubed versión 7 UserGuide
http://slidepdf.com/reader/full/xl-cubed-version-7-userguide 234/567
229 | P a g e
XLCubed v7 User Guide – Book III – Charting & Data Visualisation
SparkWinLose Chart Designer
This dialog is used to format any SparkWinLose In-Cell Charts in your report. For details about how to
invoke the dialog, see In-Cell Chart Designer.
General
Title Specifies a title to place in the formula cell (for In-Cell Chart formulae), or to
use as the member name (when used in Grids)Win column colour the colour to use for win columns
Loss column colour the colour to use for loss columns
Draw column colour the colour to use for draw columns
SparkBar Chart Designer
This dialog is used to format any SparkBar In-Cell Charts in your report. For details about how to invoke
the dialog, see In-Cell Chart Designer.
Chart Options
Colours 1 to 8 specify the colours used for the bars. If the bar is positive, the data points will
start with colour 1; if the bar is negative, the data points will start with colour
5.
Stacked bar chart the total bar width varies according to the total
100% stacked bar chart the widths are all equal, with the widths of individual data points showing
their proportion of the total
Custom bar length specifies the maximum chart width
Show zero bars Specifies whether to draw bars for zero-valued data points
Value Label Options
Use value labels If selected, each bar is labelled with its total value
Before bar The value label is rendered to the left of the chart itself
After bar The value label is rendered to the right of the chart itself
Number format Specifies the format string for the value labels
Label colour the colour for the value labels
Font Allows you to choose the typeface and size of the value labels
Axis Options
Customise axis Allows you to choose further options defining how the formula cell (for In-
Cell Chart formulae), or the member name (when used in Grids) is rendered
Use title only uses the given text as a caption
Axis with tickmarks above draws a horizontal axis, with tickmarks and optional labels above the axis
Axis with tickmarks below draws a horizontal axis, with tickmarks and optional labels below the axis
Custom tickmark frequency overrides the automatic calculation of major tickmarks

7/17/2019 XL Cubed versión 7 UserGuide
http://slidepdf.com/reader/full/xl-cubed-version-7-userguide 235/567
230 | P a g e
XLCubed v7 User Guide – Book III – Charting & Data Visualisation
Minor ticks per major tick Adds the given number of minor (labelless) tickmarks between each major
tickmark
Show labels on major tick Specifies whether numeric labels should be rendered for the axis
Number format the format string to be used for the axis labels
Custom axis minimum overrides the automatic minimum for the axis
Custom axis maximum overrides the automatic maximum for the axis

7/17/2019 XL Cubed versión 7 UserGuide
http://slidepdf.com/reader/full/xl-cubed-version-7-userguide 236/567
231 | P a g e
XLCubed v7 User Guide – Book III – Charting & Data Visualisation
SparkBullet Chart Designer
This dialog is used to format any SparkBullet In-Cell Charts in your report. For details about how to invoke
the dialog, see In-Cell Chart Designer.
Chart Options
This page has two modes. When the qualitative ranges are being driven from a range in your Workbook,
some of the controls will be uneditable or hidden, as the values they contain will be predetermined.
Qualitative ranges Specifies how many qualitative ranges should be rendered in the bullet chart.
Available only when not being driven from a range
Reverse range order -1 to cause the qualitative ranges to be reversed when rendering
Use Excel range Specifies that the qualitative ranges should be defined by values in the given range.
Show measure as Specifies whether to render the measure value as a Bar or a Dot:
Measure bar colour the colour to user for the measure bar or dot
Bullet length the width of the bullet chart
When Use Excel range is enabled
Range colour the colour for the given qualitative range
When Use Excel range is disabled
Lower limit gives the lower limit for the first qualitative range
Subsequent rows give the colour and upper limit for each qualitative range.
Reference Value Options
Reference lines
No reference lines: The bullet chart is rendered without reference line
One reference line: The bullet chart has one reference line
Two reference lines: The bullet chart has two reference lines
Colour: The colour to use for the given reference line
Value: The value to use for the given reference line. May be either a value or a
range

7/17/2019 XL Cubed versión 7 UserGuide
http://slidepdf.com/reader/full/xl-cubed-version-7-userguide 237/567
232 | P a g e
XLCubed v7 User Guide – Book III – Charting & Data Visualisation
Projection bar
No projection bar: The bullet chart is rendered without a projection bar
Project bar: The bullet chart has an additional bar or dot, showing the projected value for the measure
Colour: The colour to use for the projection bar
Value: The value to use for the projection bar. May be either a value or a range
Axis Options
Customise axis: Allows you to choose further options defining how the formula cell (for In-
Cell Chart formulae), or the member name (when used in Grids) is rendered
Use title only: Uses the given text as a caption
Axis with tickmarks above: Draws a horizontal axis, with tickmarks and optional labels above the axis
Axis with tickmarks below: Draws a horizontal axis, with tickmarks and optional labels below the axis
Custom tickmark frequency: Overrides the automatic calculation of major tickmarks
Minor ticks per major tick: Adds the given number of minor (labelless) tickmarks between each major
tickmarkShow labels on major tick: Specifies whether numeric labels should be rendered for the axis
Number format: The format string to be used for the axis labels

7/17/2019 XL Cubed versión 7 UserGuide
http://slidepdf.com/reader/full/xl-cubed-version-7-userguide 238/567
233 | P a g e
XLCubed v7 User Guide – Book III – Charting & Data Visualisation
SparkIcon Chart Designer
This dialog is used to format any SparkIcon In-Cell Charts in your report. These charts have two ways of
being used:
• Single data source: the colour and icon type are driven from the same data, giving two ways to
see the same information
• Dual data sources: the colour and icon type have independent data sources, giving the
opportunity to increase data density of your reports
For details about how to invoke the dialog, see In-Cell Chart Designer.
Single Data Source Mode
Title Specifies a title to place in the formula cell (for In-Cell Chart formulae), or to
use as the member name (when used in Grids)
Icon count specifies how many icon styles to use
Reverse range order -1 to cause the icon ranges to be reversed when renderingIcon type field the icon type to use for the given value range.
Colour field the colour to use for the given value range
Operator and value fields together, these give the boundaries for the given value range. The highest
value range should be at the top
Separate Icons and Colour Converts the SparkIcon Chart to a dual data source chart
Dual Data Source Mode
Icon Options
Title Specifies a title to place in the formula cell (for In-Cell Chart formulae), or to
use as the member name (when used in Grids)
Icon count specifies how many icon types to use
Reverse range order -1 to cause the icon ranges to be reversed when rendering
Icon type field the icon type to use for the given value range
Operator and value fields together, these give the boundaries for the given value range. The highest
value range should be at the top
Merge Icons and Colours Converts the SparkIcon Chart to a single data source chart. Note that the
colour boundaries are discarded when using this option
Colour Options
Colour data specifies the data to use to render the icon colours
Colour count specifies how many colours to use
Reverse range order -1 to cause the colour ranges to be reversed when rendering
Colour field the colour to use for the given value range

7/17/2019 XL Cubed versión 7 UserGuide
http://slidepdf.com/reader/full/xl-cubed-version-7-userguide 239/567
234 | P a g e
XLCubed v7 User Guide – Book III – Charting & Data Visualisation
Operator and value fields together, these give the boundaries for the given value range. The highest
value range should be at the top

7/17/2019 XL Cubed versión 7 UserGuide
http://slidepdf.com/reader/full/xl-cubed-version-7-userguide 240/567
235 | P a g e
XLCubed v7 User Guide – Book III – Charting & Data Visualisation
Icon Sets
The following icon types are available for use with the SparkIcon In-Cell Chart.

7/17/2019 XL Cubed versión 7 UserGuide
http://slidepdf.com/reader/full/xl-cubed-version-7-userguide 241/567
236 | P a g e
XLCubed v7 User Guide – Book III – Charting & Data Visualisation
SparkPie Chart Designer
This dialog is used to format any SparkPie In-Cell Charts in your report. For details about how to invoke the
dialog, see In-Cell Chart Designer.
Chart Options
Title Specifies a title to place in the formula cell (for In-Cell Chart formulae), or to use as
the member name (when used in Grids)
Colours 1 to 8 Specify the colours used for the pie sector

7/17/2019 XL Cubed versión 7 UserGuide
http://slidepdf.com/reader/full/xl-cubed-version-7-userguide 242/567
237 | P a g e
XLCubed v7 User Guide – Book III – Charting & Data Visualisation
7/17/2019 XL Cubed versión 7 UserGuide
http://slidepdf.com/reader/full/xl-cubed-version-7-userguide 243/567
238 | P a g e
XLCubed v7 User Guide – Book III – Charting & Data Visualisation
SparkHorizon Chart Designer
This dialog is used to format any SparkHorizon In-Cell Charts in your report. For details about how to
invoke the dialog, see the section in this document on In-Cell Chart Designer.
General
Title specifies a title to place in the formula cell (for In-Cell Chart formulae) or to
use as the member name (when used in Grids)Positive colours the colours to use for the positive regions, highest at the bottom
Negative colours the colours to use for the negative regions, most negative at the bottom
Stretch factor the horizontal scale factor to use when drawing the chart
Missing values
Don’t plot missing values leave a gap where there is a gap in the source data
Plot missing values as zero substitute gaps in the source data with zeroes
Interpolate missing values fill in missing values with statistically appropriate values
Vertical scale
Automatic common scale if selected, overrides all the other scale options and chooses one set of scales
to suit all the charts controlled by this formula or member
Minimum
Automatic selects a suitable minimum for each chart individually
Custom specifies the minimum for all charts
Maximum
Automatic selects a suitable minimum for each chart individually
Custom specifies the maximum for all charts
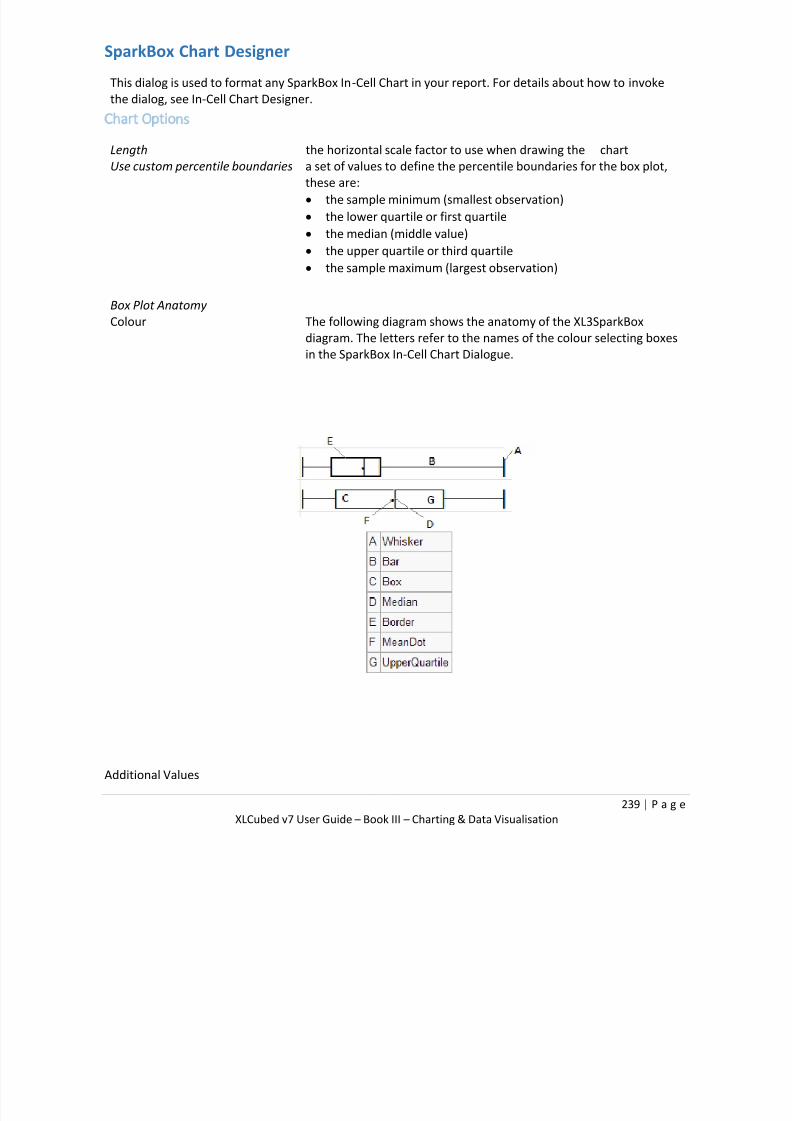
7/17/2019 XL Cubed versión 7 UserGuide
http://slidepdf.com/reader/full/xl-cubed-version-7-userguide 244/567
239 | P a g e
XLCubed v7 User Guide – Book III – Charting & Data Visualisation
SparkBox Chart Designer
This dialog is used to format any SparkBox In-Cell Chart in your report. For details about how to invoke
the dialog, see In-Cell Chart Designer.
Chart Options
Length the horizontal scale factor to use when drawing the chart
Use custom percentile boundaries a set of values to define the percentile boundaries for the box plot,these are:
the sample minimum (smallest observation)
the lower quartile or first quartile
the median (middle value)
the upper quartile or third quartile
the sample maximum (largest observation)
Box Plot Anatomy
Colour The following diagram shows the anatomy of the XL3SparkBox
diagram. The letters refer to the names of the colour selecting boxes
in the SparkBox In-Cell Chart Dialogue.
Additional Values

7/17/2019 XL Cubed versión 7 UserGuide
http://slidepdf.com/reader/full/xl-cubed-version-7-userguide 245/567
240 | P a g e
XLCubed v7 User Guide – Book III – Charting & Data Visualisation
New in Version 7.5 you can also plot additional values on the box plot, this could be the same
values already
used in the box plot to help visualize the distribution or another set of values to compare
distribution:
Axis Options
Customise axis Allows you to choose further options defining how the formula cell (for In-
Cell Chart formulae), or the member name (when used in Grids) is rendered
Use title only Uses the given text as a caption
Axis with tickmarks above Draws a horizontal axis, with tickmarks and optional labels above the axis Axis with tickmarks below Draws a horizontal axis, with tickmarks and optional labels below the axis
Custom tickmark frequency Overrides the automatic calculation of major tickmarks
Minor ticks per major tick Adds the given number of minor (labelless) tickmarks between each major
tickmark
Show labels on major ticks Specifies whether numeric labels should be rendered for the axis
Number format The format string to be used for the axis labels
Custom axis minimum A value to use for the minimum horizontal axis value
Custom axis maximum A value to use for the maximum horizontal axis value

7/17/2019 XL Cubed versión 7 UserGuide
http://slidepdf.com/reader/full/xl-cubed-version-7-userguide 246/567
241 | P a g e
XLCubed v7 User Guide – Book III – Charting & Data Visualisation
DotPlot Chart Designer
This dialog is used to format any Dotplot In-Cell Charts in your report. For details about how to invoke the
dialog, see In-Cell Chart Designer.
Chart Options
Length The horizontal scale factor to use when drawing the chart
Colour The colour to draw the plots
Plot symbol There are two choices – Dot and Circle
Stacking type Based on the stacking type – the values will be grouped and drawn either
varying the colour or the vertical position
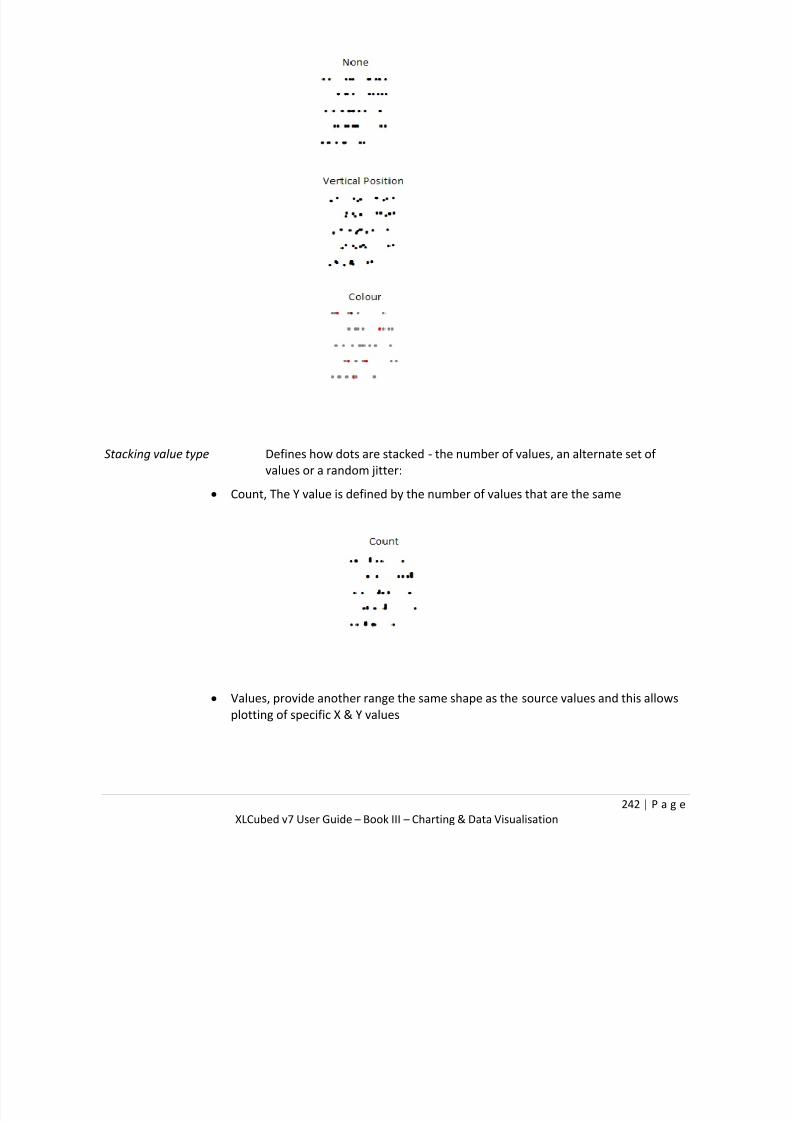
7/17/2019 XL Cubed versión 7 UserGuide
http://slidepdf.com/reader/full/xl-cubed-version-7-userguide 247/567
242 | P a g e
XLCubed v7 User Guide – Book III – Charting & Data Visualisation
Stacking value type Defines how dots are stacked - the number of values, an alternate set of
values or a random jitter:
Count, The Y value is defined by the number of values that are the same
Values, provide another range the same shape as the source values and this allows
plotting of specific X & Y values

7/17/2019 XL Cubed versión 7 UserGuide
http://slidepdf.com/reader/full/xl-cubed-version-7-userguide 248/567
243 | P a g e
XLCubed v7 User Guide – Book III – Charting & Data Visualisation
Jitter, the Y value is taken from a fixed set of random values to allow dots near each
other to be easily distinguished
Colours
Defines the Colours to use when stacking values
Axis
Use title only Displays the text in the header cell for the charts
Axis with tickmarks above Axis will have tickmarks above the base line
Axis with tickmarks below Axis will have tickmarks below the base line
Custom tickmark frequency Controls how often an axis value will be displayed
Minor tick per major tick Number of ticks to appear inbetween each value
Show labels on major ticks Controls when to display the values
Number format Specify the number format for the tickmarks
Custom x-axis min & Custom x-axis max Controls the horizontal maximums and minimums
Custom y-axis min & Custom y-axis max Controls the maximums and minimums for when stacking isenabled
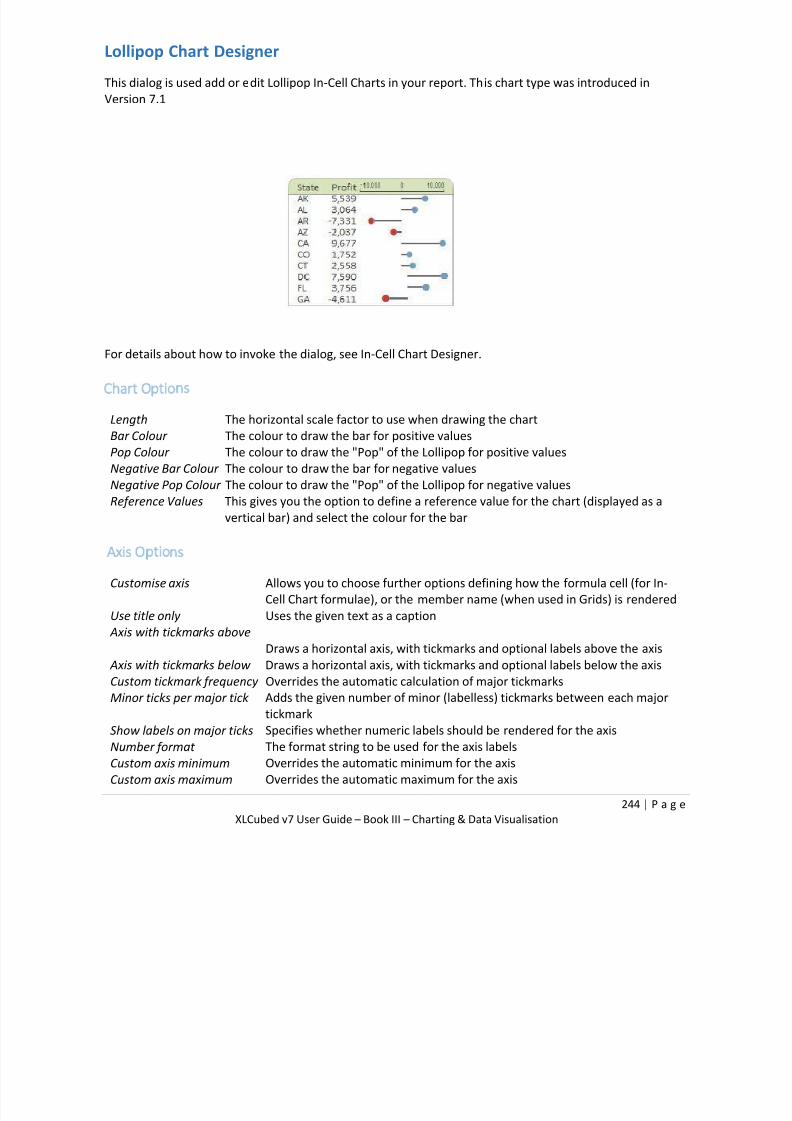
7/17/2019 XL Cubed versión 7 UserGuide
http://slidepdf.com/reader/full/xl-cubed-version-7-userguide 249/567
244 | P a g e
XLCubed v7 User Guide – Book III – Charting & Data Visualisation
Lollipop Chart Designer
This dialog is used add or edit Lollipop In-Cell Charts in your report. This chart type was introduced in
Version 7.1
For details about how to invoke the dialog, see In-Cell Chart Designer.
Chart Options
Length The horizontal scale factor to use when drawing the chart
Bar Colour The colour to draw the bar for positive values
Pop Colour The colour to draw the "Pop" of the Lollipop for positive values
Negative Bar Colour The colour to draw the bar for negative values
Negative Pop Colour The colour to draw the "Pop" of the Lollipop for negative values
Reference Values This gives you the option to define a reference value for the chart (displayed as avertical bar) and select the colour for the bar
Axis Options
Customise axis Allows you to choose further options defining how the formula cell (for In-
Cell Chart formulae), or the member name (when used in Grids) is rendered
Use title only Uses the given text as a caption
Axis with tickmarks above
Draws a horizontal axis, with tickmarks and optional labels above the axis
Axis with tickmarks below Draws a horizontal axis, with tickmarks and optional labels below the axis Custom tickmark frequency Overrides the automatic calculation of major tickmarks
Minor ticks per major tick Adds the given number of minor (labelless) tickmarks between each major
tickmark
Show labels on major ticks Specifies whether numeric labels should be rendered for the axis
Number format The format string to be used for the axis labels
Custom axis minimum Overrides the automatic minimum for the axis
Custom axis maximum Overrides the automatic maximum for the axis
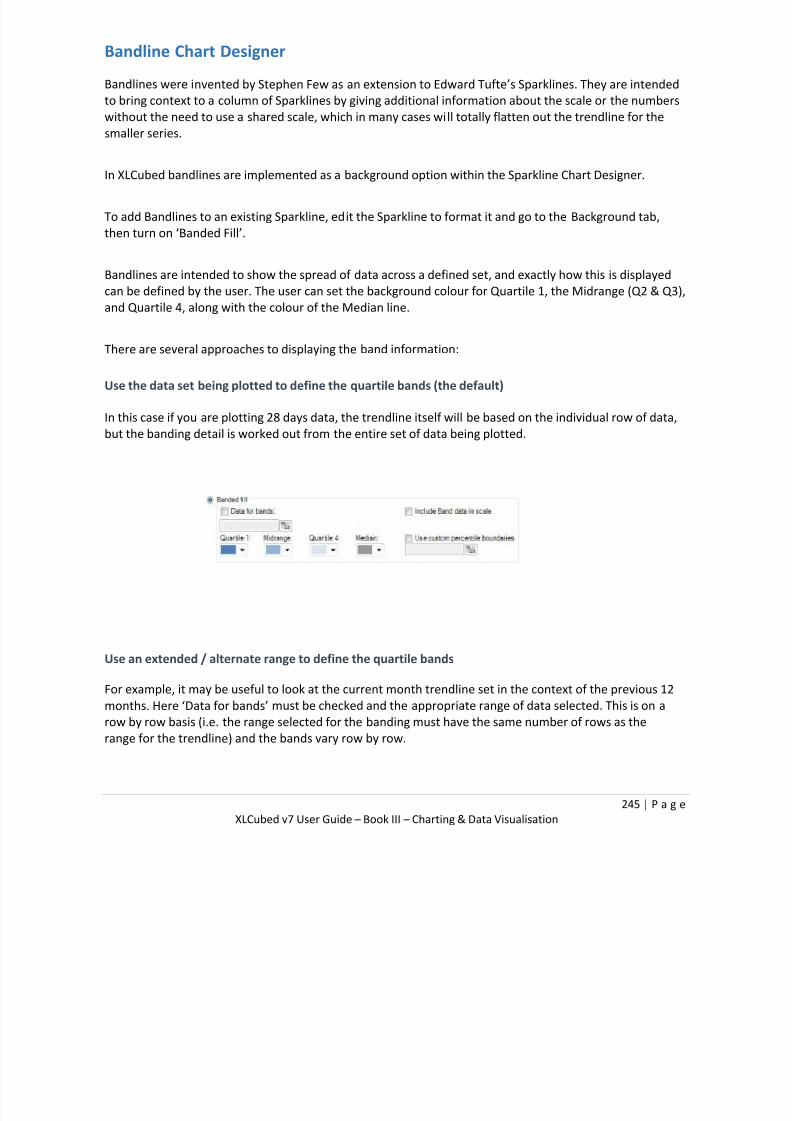
7/17/2019 XL Cubed versión 7 UserGuide
http://slidepdf.com/reader/full/xl-cubed-version-7-userguide 250/567
245 | P a g e
XLCubed v7 User Guide – Book III – Charting & Data Visualisation
Bandline Chart Designer
Bandlines were invented by Stephen Few as an extension to Edward Tufte’s Sparklines. They are intended
to bring context to a column of Sparklines by giving additional information about the scale or the numbers
without the need to use a shared scale, which in many cases will totally flatten out the trendline for the
smaller series.
In XLCubed bandlines are implemented as a background option within the Sparkline Chart Designer.
To add Bandlines to an existing Sparkline, edit the Sparkline to format it and go to the Background tab,
then turn on ‘Banded Fill’.
Bandlines are intended to show the spread of data across a defined set, and exactly how this is displayed
can be defined by the user. The user can set the background colour for Quartile 1, the Midrange (Q2 & Q3),
and Quartile 4, along with the colour of the Median line.
There are several approaches to displaying the band information:
Use the data set being plotted to define the quartile bands (the default)
In this case if you are plotting 28 days data, the trendline itself will be based on the individual row of data,
but the banding detail is worked out from the entire set of data being plotted.
Use an extended / alternate range to define the quartile bands
For example, it may be useful to look at the current month trendline set in the context of the previous 12
months. Here ‘Data for bands’ must be checked and the appropriate range of data selected. This is on a
row by row basis (i.e. the range selected for the banding must have the same number of rows as the
range for the trendline) and the bands vary row by row.

7/17/2019 XL Cubed versión 7 UserGuide
http://slidepdf.com/reader/full/xl-cubed-version-7-userguide 251/567
246 | P a g e
XLCubed v7 User Guide – Book III – Charting & Data Visualisation
Use Custom Percentile Boundaries
Rather than use quartiles, it’s possible to define custom percentile bands. This approach still requires
one row of incoming data, specifying 5 ascending percentage values (typically starting with 0% and
ending with 100%).
Include Band data in Scale
There will be higher and lower values in the set of data being used to calculate the bands than in most
individual rows being plotted. The dialogs allow you to choose whether or not to include the defined
bands in the scale. Including the banding data will have the effect of flattening the trendline, so where the
overall values being plotted are fairly close, it may make sense to do include this. However, where there is
significant variance it is generally best not to include it, and to rely on the colour banding to display this
information.
The example below shows the potential difference in this approach, where the Sparkline itself shows the
previous 30 days volumes, and the bands are based on the previous 90 days. Where the bands are
included in the scale the trendlines are much flatter, and everything is on a consistent scale. With
Bandlines excluded from the scale here the individual trends are more obvious, and their position in the
overall spread can still be determined from the background colour of the associated quartile the values
are falling into.

7/17/2019 XL Cubed versión 7 UserGuide
http://slidepdf.com/reader/full/xl-cubed-version-7-userguide 252/567
247 | P a g e
XLCubed v7 User Guide – Book III – Charting & Data Visualisation
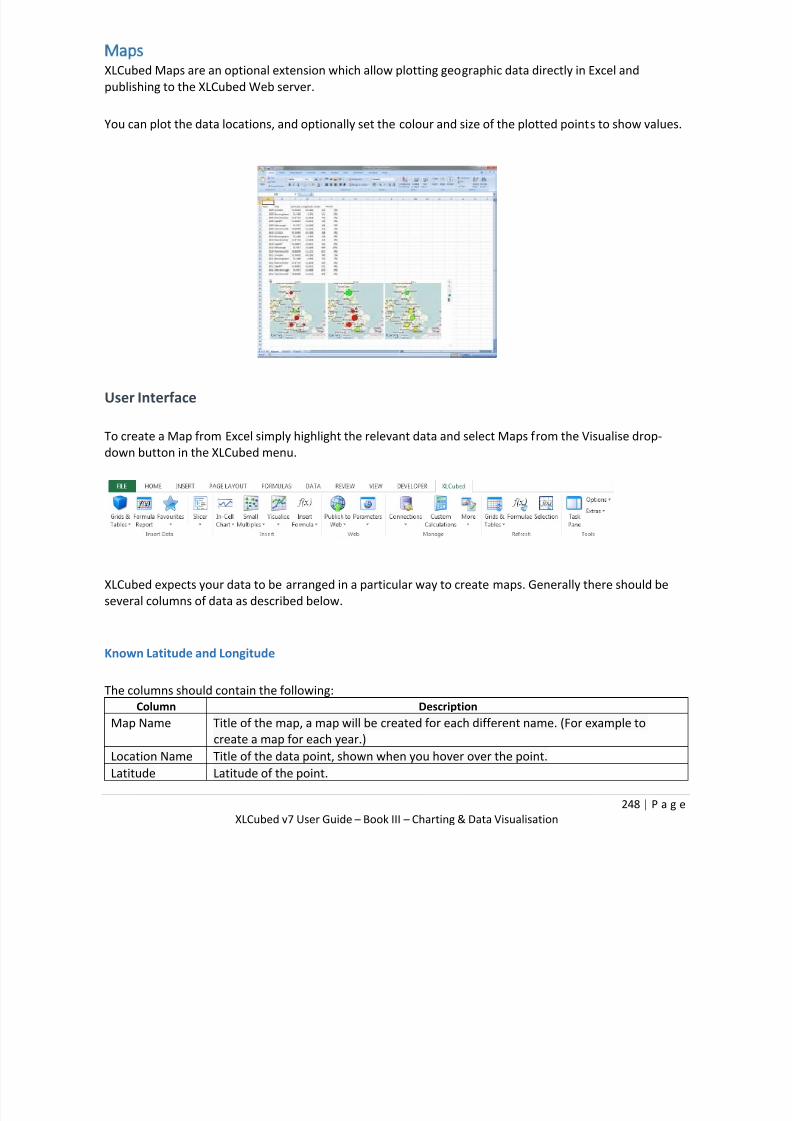
7/17/2019 XL Cubed versión 7 UserGuide
http://slidepdf.com/reader/full/xl-cubed-version-7-userguide 253/567
248 | P a g e
XLCubed v7 User Guide – Book III – Charting & Data Visualisation
Maps XLCubed Maps are an optional extension which allow plotting geographic data directly in Excel and
publishing to the XLCubed Web server.
You can plot the data locations, and optionally set the colour and size of the plotted points to show values.
User Interface
To create a Map from Excel simply highlight the relevant data and select Maps from the Visualise drop-
down button in the XLCubed menu.
XLCubed expects your data to be arranged in a particular way to create maps. Generally there should be
several columns of data as described below.
Known Latitude and Longitude
The columns should contain the following:
Column Description
Map Name Title of the map, a map will be created for each different name. (For example to
create a map for each year.)
Location Name Title of the data point, shown when you hover over the point.
Latitude Latitude of the point.

7/17/2019 XL Cubed versión 7 UserGuide
http://slidepdf.com/reader/full/xl-cubed-version-7-userguide 254/567
249 | P a g e
XLCubed v7 User Guide – Book III – Charting & Data Visualisation
Longitude Longitude of the point
Colour
(optional)
Defines the colour of the point plotted, can be a number or text. If no column is
selected then all points will be the same colour. See Colours for more information
Size (optional) Defines the size of the point, this must be a number. If no column is selected then all
points will be the same size.
This would be a typical set of mapping data:
If you do not know the latitude/longitude you can look it up using the Extras ->
Lookup Latitude/Longitudemenu item.
Highlight the place names and select the menu item. This can take some time, so is not available as a
function. It is recommended you look up the locations once and then reference them, for example using
the VLookup()formula.
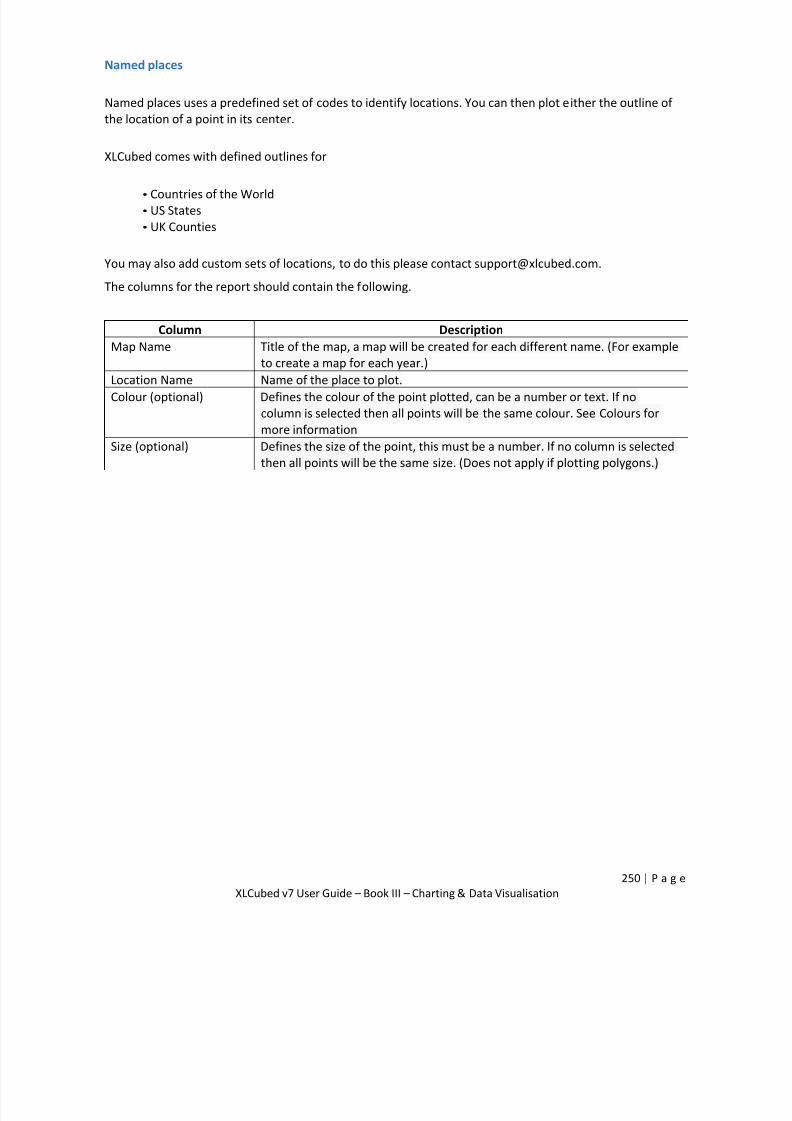
7/17/2019 XL Cubed versión 7 UserGuide
http://slidepdf.com/reader/full/xl-cubed-version-7-userguide 255/567
250 | P a g e
XLCubed v7 User Guide – Book III – Charting & Data Visualisation
Named places
Named places uses a predefined set of codes to identify locations. You can then plot either the outline of
the location of a point in its center.
XLCubed comes with defined outlines for
• Countries of the World
• US States
• UK Counties
You may also add custom sets of locations, to do this please contact [email protected].
The columns for the report should contain the following.
Column DescriptionMap Name Title of the map, a map will be created for each different name. (For example
to create a map for each year.)
Location Name Name of the place to plot.
Colour (optional) Defines the colour of the point plotted, can be a number or text. If no
column is selected then all points will be the same colour. See Colours for
more information
Size (optional) Defines the size of the point, this must be a number. If no column is selected
then all points will be the same size. (Does not apply if plotting polygons.)

7/17/2019 XL Cubed versión 7 UserGuide
http://slidepdf.com/reader/full/xl-cubed-version-7-userguide 256/567
251 | P a g e
XLCubed v7 User Guide – Book III – Charting & Data Visualisation
Display
For named places you can choose to display the outline of the place rather than just a marker at its centre.
As of Version 7.6 you can customise the transparency of the shape and border.
Map controls
Output cells
In the properties screen you can set up "output cells" for the map and location names.
With these selected clicking a data point will update Excel. This can then be used to drive a detailed
report for the selected point.
If you turn on multi-select and pick an output range rather than a cell you can output multiple values.
Drawing tools appear on the map to allow you to pick many points, and OK the selection.
Colours
This column can contain numbers or text, and there are three ways the values could drive the
colour. Firstly, if you have numbers the colours can be from a colour gradient. E.g. Red-Green
shading.
Secondly, you can categorise the point. For example with stores the colour column could contain the store
type. Each store type would then be plotted a particular colour.
Finally the column could contain specific colours, using named colours or HTML syntax such as #ff0000.
This allows you maximum flexibility to drive the colour using any criteria you choose.
All of these options are configured in the map properties screen. Right click the map to bring up the
screen.
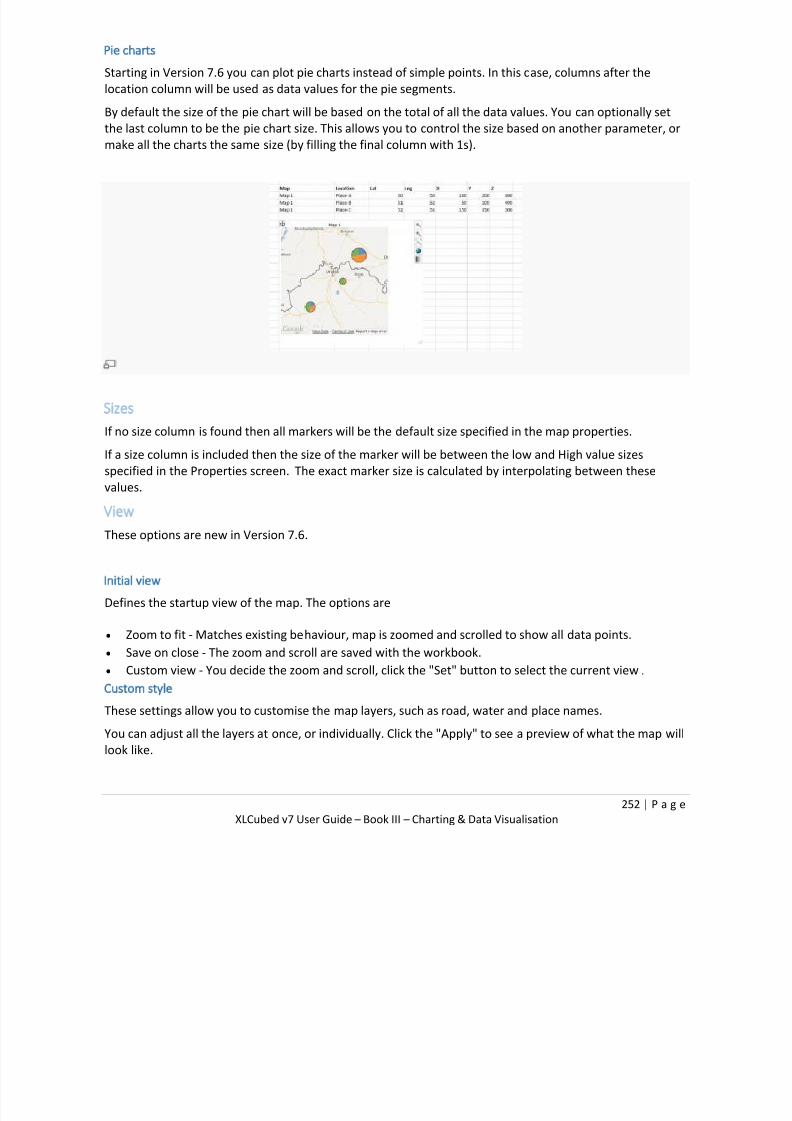
7/17/2019 XL Cubed versión 7 UserGuide
http://slidepdf.com/reader/full/xl-cubed-version-7-userguide 257/567
252 | P a g e
XLCubed v7 User Guide – Book III – Charting & Data Visualisation
Pie charts
Starting in Version 7.6 you can plot pie charts instead of simple points. In this case, columns after the
location column will be used as data values for the pie segments.
By default the size of the pie chart will be based on the total of all the data values. You can optionally set
the last column to be the pie chart size. This allows you to control the size based on another parameter, or
make all the charts the same size (by filling the final column with 1s).
Sizes
If no size column is found then all markers will be the default size specified in the map properties.
If a size column is included then the size of the marker will be between the low and High value sizes
specified in the Properties screen. The exact marker size is calculated by interpolating between these
values.
View
These options are new in Version 7.6.
Initial view
Defines the startup view of the map. The options are
Zoom to fit - Matches existing behaviour, map is zoomed and scrolled to show all data points.
Save on close - The zoom and scroll are saved with the workbook.
Custom view - You decide the zoom and scroll, click the "Set" button to select the current view.
Custom style
These settings allow you to customise the map layers, such as road, water and place names.
You can adjust all the layers at once, or individually. Click the "Apply" to see a preview of what the map will
look like.

7/17/2019 XL Cubed versión 7 UserGuide
http://slidepdf.com/reader/full/xl-cubed-version-7-userguide 258/567
253 | P a g e
XLCubed v7 User Guide – Book III – Charting & Data Visualisation
Treemaps
Treemaps are a new visualization available in Version 7.1 of XLCubed. They can show the relationship
between two measures, and their variance across a dimension.
The above Treemap plots Sales against Profit across the top ten states in the USA. In this example the size
of the area represents the total sales, and the colour shows how profitable the sales in that area were.
In XLCubed Treemaps can be sourced from a Table, and Excel range or from a cube.
Data sources
Table or Excel range
The data sources for tables and Excel ranges are quite similar.
In both cases you select a number of columns. XLCubed will use the last two columns as the size and
colour values to plot, and other columns provide the member values.
You can have several member columns, in which XLCubed will allow drill-down into the data.

7/17/2019 XL Cubed versión 7 UserGuide
http://slidepdf.com/reader/full/xl-cubed-version-7-userguide 259/567
254 | P a g e
XLCubed v7 User Guide – Book III – Charting & Data Visualisation
Example
If we start with the following data in Excel:
We can create the following Treemap, which starts at the top level:
We can drill into the areas by double clicking to get more detail:

7/17/2019 XL Cubed versión 7 UserGuide
http://slidepdf.com/reader/full/xl-cubed-version-7-userguide 260/567
255 | P a g e
XLCubed v7 User Guide – Book III – Charting & Data Visualisation
Data options
If you edit the Treemap, you get some options to customize its behaviour.
The Show second level option allows you to instantly see the make up of each outer area from its children.
For example, in the above example we see the product category, and how each sub-category contributes
to it. Drill and we can see the products in a sub-category:
The Total Size using and Total Colour using options allow you to choose how the data is aggregated.
By default a parent's number is made up of the sum of its children, but you may want to use another
method, e.g. totalling a percentage using the average of the children.
Finally you can use the number format text boxes to set the number format used on the Treemap. By
default data sourced from an Excel range will use the number format set in Excel.

7/17/2019 XL Cubed versión 7 UserGuide
http://slidepdf.com/reader/full/xl-cubed-version-7-userguide 261/567
256 | P a g e
XLCubed v7 User Guide – Book III – Charting & Data Visualisation
Cube
When sourcing a Treemap from a cube you get the usual member selector found throughout
XLCubed. You must put a hierarchy in the Plot area, and this defines the areas to be plotted.
The Header area performs the usual action of slicing the results, e.g. showing only data for a given
time period. The Behaviour tab allow you to control the data displayed.
The Values section allows you to pick the measures used for the size and colour of the Treemap. Althoughmeasures is the default hierarchy, you can drop in a different one if you need to. From v7.5, you can also
select the number formats for the values, although these are overridden by the Apply Cube formatting
option, if that is selected.
The Split by section allows you to define a two level Treemap. The second level can be a lower level of the
hierarchy you chose to plot, or could be a different hierarchy entirely.

7/17/2019 XL Cubed versión 7 UserGuide
http://slidepdf.com/reader/full/xl-cubed-version-7-userguide 262/567
257 | P a g e
XLCubed v7 User Guide – Book III – Charting & Data Visualisation
Common Options
• Gradient: Choose the colour scheme for the Treemap. Allow you to reverse the colour order in
cases there low numbers are good, e.g. losses.
•
Layout: Allows you to change the method by which the areas are laid out.o Order by Size - Larger areas come first.
o Natural Order - Attempts to keep the areas in the order they started in. This is the
order they are found in tables and ranges, cube order when the data source is a
cube.
o Squares - Attempts to make the areas as square as possible, makes comparing sizes
easier.
• Parent name position: Choose the title position when showing two levels in the Treemap.
• Output range: Area to output the clicked area name. Allows you to drive another section of the
report from the Treemap. Note that if you have nested areas then you can pick a range of several
cells to contain the names at each level.
• Link to: Use in conjunction with Output range, allows you to jump to the section of the report
updated when the Treemap was clicked.
• Show back/forward controls: Show the arrows used to navigate when drilling.

7/17/2019 XL Cubed versión 7 UserGuide
http://slidepdf.com/reader/full/xl-cubed-version-7-userguide 263/567
258 | P a g e
XLCubed v7 User Guide – Book IV – Web Edition
Book IV - Web Edition
XLCubed Web Edition allows you to publish your XLCubed reports to the web. It is more than just a
publishing tool, it lets you organise your reports on the web and provides OLAP functionality in your
browser - it is not just Excel running on a server….
Step 1. Design your reportDesign your report in Excel using the XLCubed add-in, visualise the data using In-Cell Charts and standard
Excel Charting. Reports can contain grid and formula based report sections, use multiple sheets, and make
use of standard Excel formulae. Both standard Excel Charting and In Cell Charts are supported for
publication to the web.
Step 2. Publish your report From within Excel you simply select the Publish option from the XLCubed menu and choose the location
on the server where you want it to be located - click publish and the report is published to the web.
Step 3. View the report in a browser It’s as simple as accessing any web page, point your browser at the Repository and you’ll see the report
as it appeared in Excel.
Step 4. Enjoy OLAP in a browser The report isn’t simply published, it contains the OLAP functionality that the XLCubed add-in has
become renowned for. You can perform member selection and drill-down, all within the browser
environment.

7/17/2019 XL Cubed versión 7 UserGuide
http://slidepdf.com/reader/full/xl-cubed-version-7-userguide 264/567
259 | P a g e
XLCubed v7 User Guide – Book IV – Web Edition
Web Publishing
To publish reports from XLCubed you will need to have the XLCubed Web Edition installed on an
appropriate server. The publication process is very straightforward and any report that can be opened in
your XLCubed enabled version of Excel can be published.
Publication Process
To begin the publication process first open the XLCubed report and select the Publish to Web ribbon
item (or the XLCubed > Publish to Web menu option in Excel 2003 and below) in Excel. This will display
the Publish dialog:
The dialog allows you to connect to an XLCubed Web Edition server and select where the current report
should be published. The detailed steps are outlined below:
Connect to the server you want to publish to:
Enter the name of the XLCubed Web Edition server you want to connect to in the Web
Site field. This will depend on how you have installed the XLCubed Web Edition softwareon your server. Click Connect, and if connection is successful the folders available on the
server will be displayed in the right hand side of the dialog (Folder to publish to).
Enter the Report details:
Type in the Name and Description that you want to give the report. The Name will
appear in the Navigation tree view and on the report's tab. The Description will appear
7/17/2019 XL Cubed versión 7 UserGuide
http://slidepdf.com/reader/full/xl-cubed-version-7-userguide 265/567
260 | P a g e
XLCubed v7 User Guide – Book IV – Web Edition
in the Repository on detail pages.
Select where to publish:
Navigate through the folders on the server to find the location you want by clicking on the
tree on the right-hand side of the Publisher dialog. The report will be published to the
folder that is currently highlighted.Existing reports are also shown in the tree. If an existing report is highlighted, then
XLCubed will attempt to replace it with the published report.
Depending on how your Administrator has configured the XLCubed Web Server it is quite
possible that although you may be able to see a folder, you may not have the required
security privileges to actually write (publish) to that directory. If this is the case a message
will be displayed informing you that publication was not possible and you must select a
folder to which you do have write permission. Contact your System Administrator to
discuss permissions further.
Choose options:
Check Web Compatibility allows XLCubed to check for some Excel features that are
unsupported in XLCubed Web Edition.
Display after Publish causes XLCubed to open the published report in your web browser
when the publication process is finished.
Publish:
You can click the Preview button to allow you to view the report in a browser without
permanently publishing it to the server. A new browser window is opened when this
option is selected. Click the Publish button to actually publish the report to the server. On
successful completion a message is displayed confirming that the report will now be
available in XLCubed Web Edition’s repository.
If you see a message below please see the Publishing more than 1000 rows page.
"The maximum number of rows that can be published is 1000. Sheet1 has xxx rows".

7/17/2019 XL Cubed versión 7 UserGuide
http://slidepdf.com/reader/full/xl-cubed-version-7-userguide 266/567
261 | P a g e
XLCubed v7 User Guide – Book IV – Web Edition
Manage Repository
You can now right-click to manage your Repository folders. The following options are available:
• Rename - renames the currently selected folder
• Add Sub Folder- adds a new sub-folder beneath the currently selected folder
•
Add Top Level Folder - adds a new folder at top level of Repository• Delete - deletes the currently selected folder
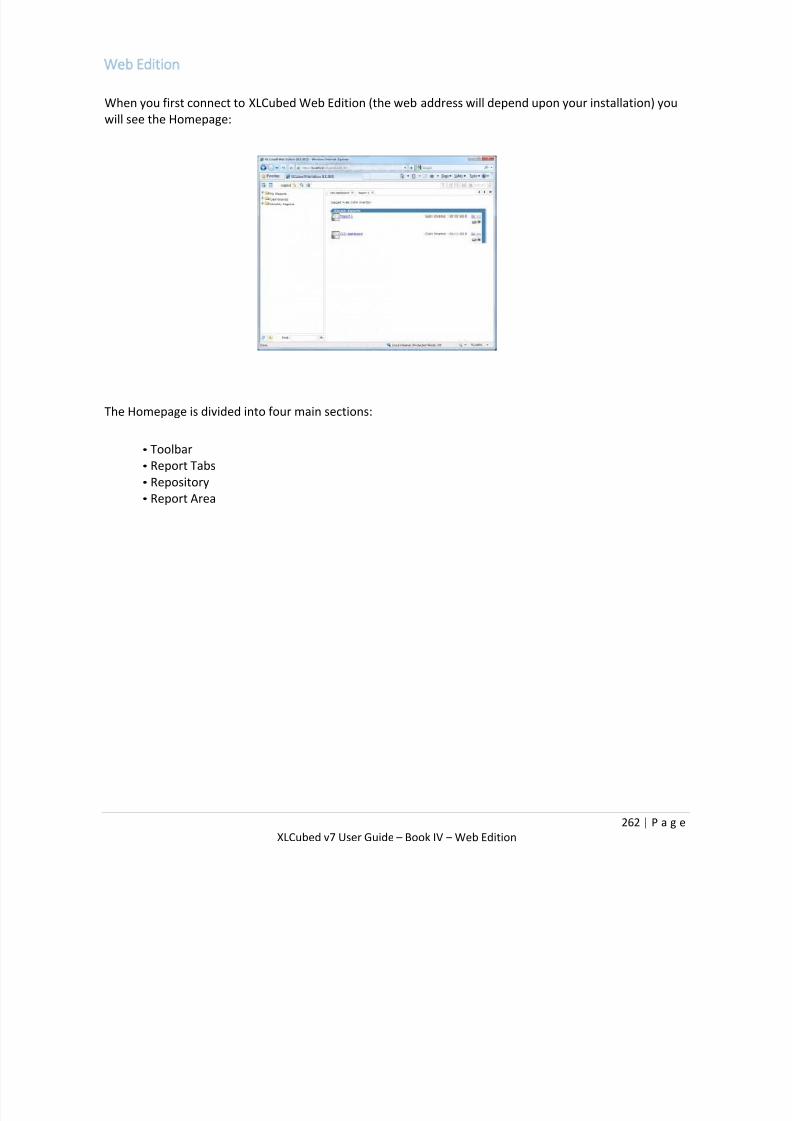
7/17/2019 XL Cubed versión 7 UserGuide
http://slidepdf.com/reader/full/xl-cubed-version-7-userguide 267/567
262 | P a g e
XLCubed v7 User Guide – Book IV – Web Edition
Web Edition
When you first connect to XLCubed Web Edition (the web address will depend upon your installation) you
will see the Homepage:
The Homepage is divided into four main sections:
• Toolbar
• Report Tabs
• Repository
•
Report Area

7/17/2019 XL Cubed versión 7 UserGuide
http://slidepdf.com/reader/full/xl-cubed-version-7-userguide 268/567
263 | P a g e
XLCubed v7 User Guide – Book IV – Web Edition
Toolbar
The following toolbar options are available.
Toggle Tree: allows you to toggle the screen display
Adhoc Grid: allow the creation of grid report - see section Creating Reports in Web Edition below
Logout: to exit Web Edition
Home: takes user back to Recent Reports
Help: takes you to our Wiki Help
Submit Changes: allows changes to be written back to the XLCubed report
Print: generates report in PDF format
Excel: allows user to save to Excel:
• Fixed will not allow user to use XLCubed functionality
• Live requires XLCubed Excel Edition to be installed on machine and will allow
updating
Save: Saves as an XLCubed Web report
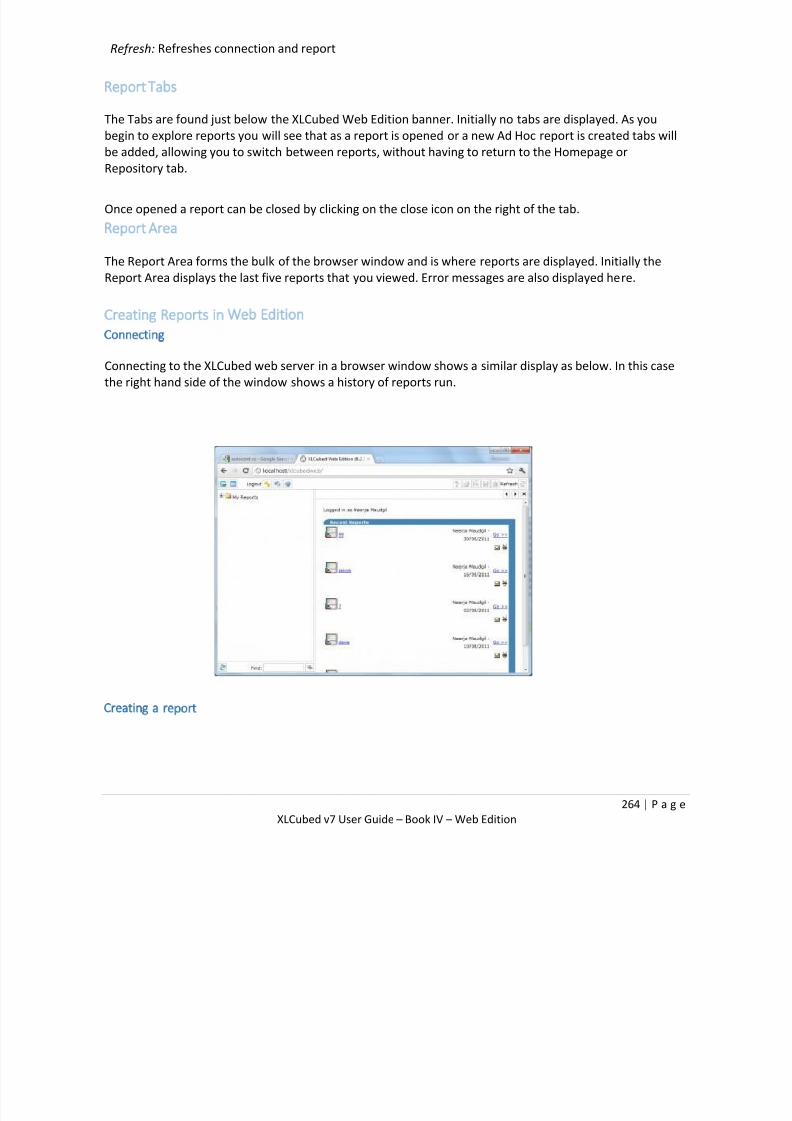
7/17/2019 XL Cubed versión 7 UserGuide
http://slidepdf.com/reader/full/xl-cubed-version-7-userguide 269/567
264 | P a g e
XLCubed v7 User Guide – Book IV – Web Edition
Refresh: Refreshes connection and report
Report Tabs
The Tabs are found just below the XLCubed Web Edition banner. Initially no tabs are displayed. As you
begin to explore reports you will see that as a report is opened or a new Ad Hoc report is created tabs will
be added, allowing you to switch between reports, without having to return to the Homepage or
Repository tab.
Once opened a report can be closed by clicking on the close icon on the right of the tab.
Report Area
The Report Area forms the bulk of the browser window and is where reports are displayed. Initially the
Report Area displays the last five reports that you viewed. Error messages are also displayed here.
Creating Reports in Web Edition
Connecting
Connecting to the XLCubed web server in a browser window shows a similar display as below. In this case
the right hand side of the window shows a history of reports run.
Creating a report
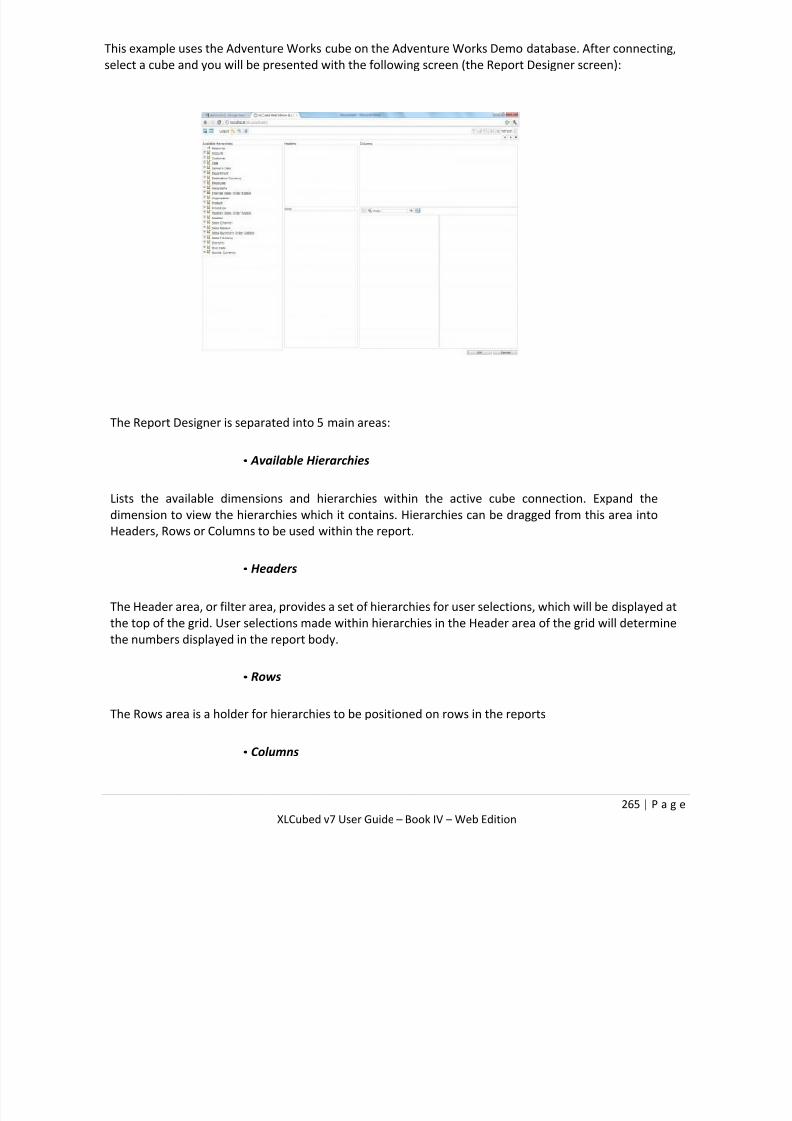
7/17/2019 XL Cubed versión 7 UserGuide
http://slidepdf.com/reader/full/xl-cubed-version-7-userguide 270/567
265 | P a g e
XLCubed v7 User Guide – Book IV – Web Edition
This example uses the Adventure Works cube on the Adventure Works Demo database. After connecting,
select a cube and you will be presented with the following screen (the Report Designer screen):
The Report Designer is separated into 5 main areas:
• Available Hierarchies
Lists the available dimensions and hierarchies within the active cube connection. Expand thedimension to view the hierarchies which it contains. Hierarchies can be dragged from this area into
Headers, Rows or Columns to be used within the report.
• Headers
The Header area, or filter area, provides a set of hierarchies for user selections, which will be displayed at
the top of the grid. User selections made within hierarchies in the Header area of the grid will determine
the numbers displayed in the report body.
• Rows
The Rows area is a holder for hierarchies to be positioned on rows in the reports
• Columns
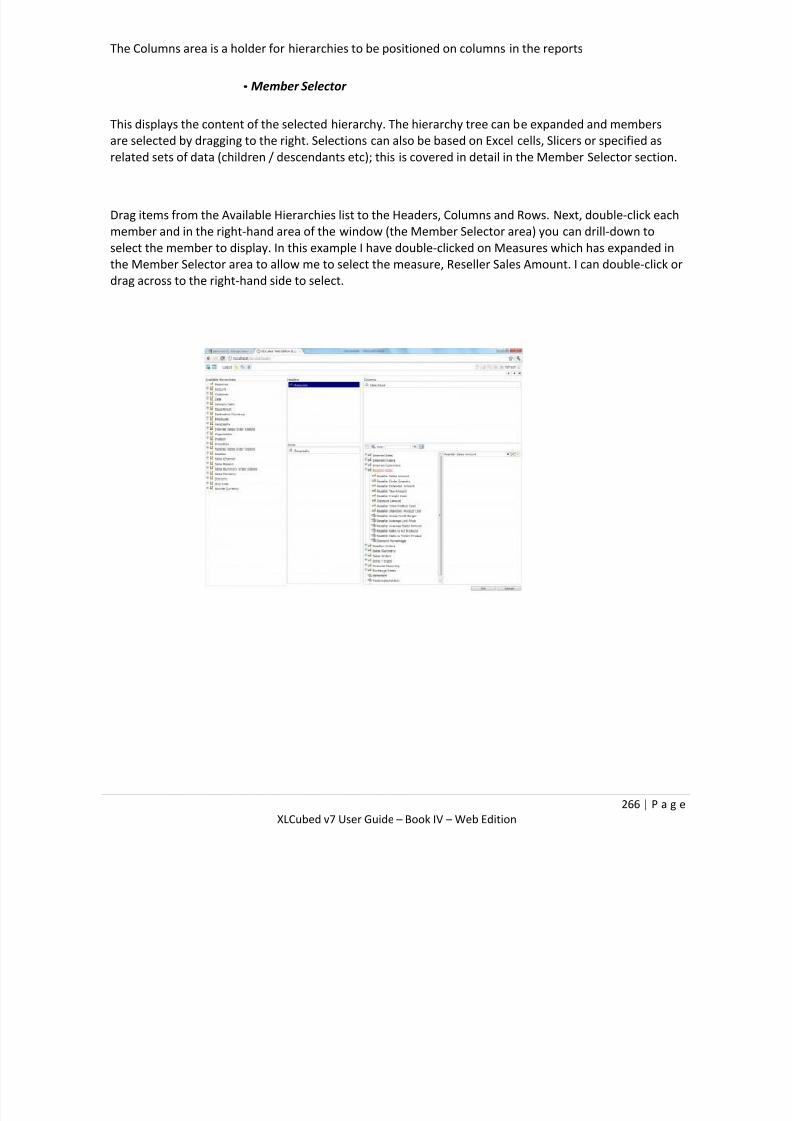
7/17/2019 XL Cubed versión 7 UserGuide
http://slidepdf.com/reader/full/xl-cubed-version-7-userguide 271/567
266 | P a g e
XLCubed v7 User Guide – Book IV – Web Edition
The Columns area is a holder for hierarchies to be positioned on columns in the reports
• Member Selector
This displays the content of the selected hierarchy. The hierarchy tree can be expanded and members
are selected by dragging to the right. Selections can also be based on Excel cells, Slicers or specified as
related sets of data (children / descendants etc); this is covered in detail in the Member Selector section.
Drag items from the Available Hierarchies list to the Headers, Columns and Rows. Next, double-click each
member and in the right-hand area of the window (the Member Selector area) you can drill-down to
select the member to display. In this example I have double-clicked on Measures which has expanded in
the Member Selector area to allow me to select the measure, Reseller Sales Amount. I can double-click or
drag across to the right-hand side to select.

7/17/2019 XL Cubed versión 7 UserGuide
http://slidepdf.com/reader/full/xl-cubed-version-7-userguide 272/567
267 | P a g e
XLCubed v7 User Guide – Book IV – Web Edition
You can use SHIFT and click or CTRL and click as normal to select members when you are selecting morethan one member.
Having positioned and made selections within the hierarchies as required, press OK to insert the report.
Double-click on entries in the grid to toggle between drill-down to expand and drill-up again. In the
example above double-clicking on Australia will expand to show the rows beneath (at state level). Double-
clicking on Australia again will return to just showing one row for Australia.
You can change the layout of the report by clicking and dragging the hierarchy labels. For example, in theabove report you can drag Geography from rows to columns or drag it to the Headers area. You can do
this with any of the hierarchies being displayed.

7/17/2019 XL Cubed versión 7 UserGuide
http://slidepdf.com/reader/full/xl-cubed-version-7-userguide 273/567
268 | P a g e
XLCubed v7 User Guide – Book IV – Web Edition
Right-click menu
This report shows sales of products model categories across sales territories. Right-click on the grid and
you will see a menu as below:
Grid Properties: Behaviour, Appearance, Mdx:
These three tabs allow you to change certain aspects of the grid report
•

7/17/2019 XL Cubed versión 7 UserGuide
http://slidepdf.com/reader/full/xl-cubed-version-7-userguide 274/567
269 | P a g e
XLCubed v7 User Guide – Book IV – Web Edition
.
Design Grid
This takes you into Report Designer as detailed previously.
•

7/17/2019 XL Cubed versión 7 UserGuide
http://slidepdf.com/reader/full/xl-cubed-version-7-userguide 275/567
270 | P a g e
XLCubed v7 User Guide – Book IV – Web Edition
Number format: This allows you to format the cell values.
Breakout: This option allows you to take a subset of the grid report and display in more detail. In this
example we can set up the breakout options as below:
This result of the breakout shows the 10 highest models in the Product Model Categories:

7/17/2019 XL Cubed versión 7 UserGuide
http://slidepdf.com/reader/full/xl-cubed-version-7-userguide 276/567
271 | P a g e
XLCubed v7 User Guide – Book IV – Web Edition
Drillthrough
Apply: Sort, Rank, Filter
This option allows you to sort (ascending or descending), rank or filter the grid report.
The screenshot below shows the above report sorted in ascending order on the measure Reseller Sales
Amount.
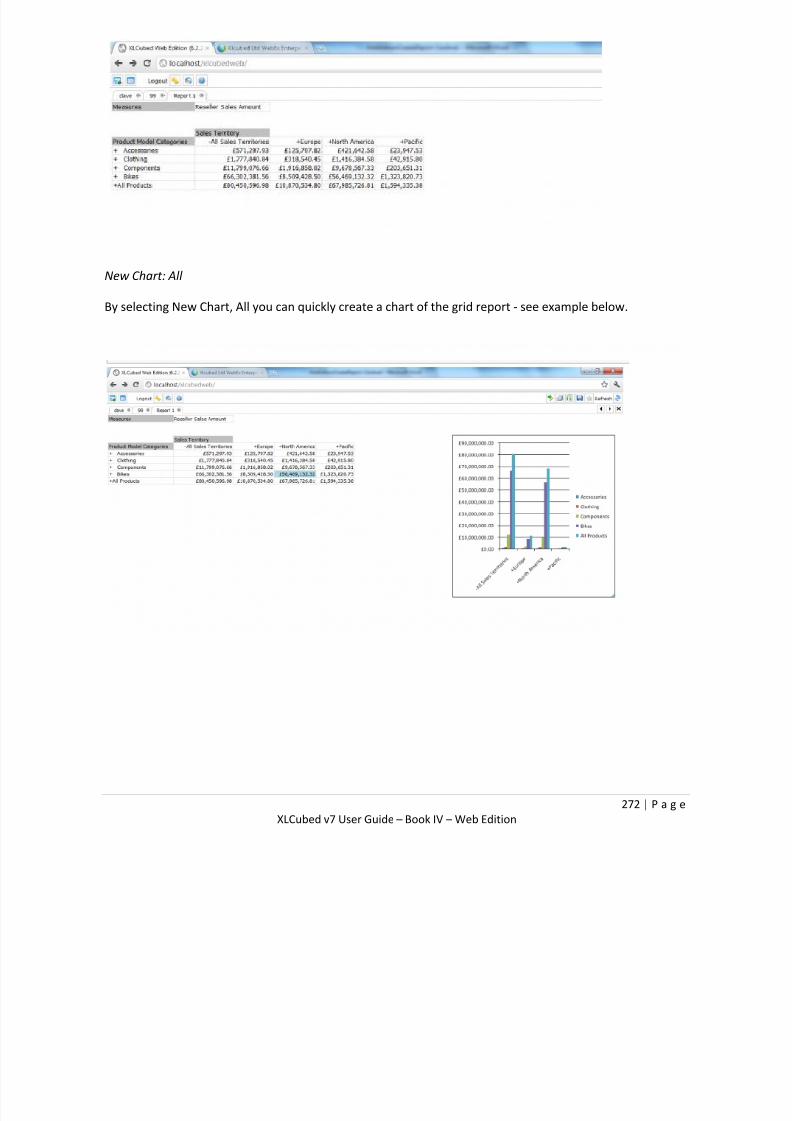
7/17/2019 XL Cubed versión 7 UserGuide
http://slidepdf.com/reader/full/xl-cubed-version-7-userguide 277/567
272 | P a g e
XLCubed v7 User Guide – Book IV – Web Edition
New Chart: All
By selecting New Chart, All you can quickly create a chart of the grid report - see example below.

7/17/2019 XL Cubed versión 7 UserGuide
http://slidepdf.com/reader/full/xl-cubed-version-7-userguide 278/567
273 | P a g e
XLCubed v7 User Guide – Book IV – Web Edition
Improved visuals in v7.2
Web Edition screens have been improve – for example when adding an Adhoc grid in v7.2
.

7/17/2019 XL Cubed versión 7 UserGuide
http://slidepdf.com/reader/full/xl-cubed-version-7-userguide 279/567
274 | P a g e
XLCubed v7 User Guide – Book IV – Web Edition
Concurrent Users
These are the XLCubed installation level defaults which are applied to any new workbooks opened
during the Excel session
Overview
XLCubedWeb licensing is based on a concurrent user model, a concurrent session is tied to the user's
session managed by IIS. The default timeout of a session is 20 minutes of inactivity, there is also a "LogOut" option which will end the user's session immediately and release them from the concurrent user
count.
If the number of concurrent users exceeds the licensed amount then any additional users will receive a
"Too many users" error message.
Checking license
The Web Configuration tool will show you the number of concurrent users you are currently licensed for
under the "Licensing tab"

7/17/2019 XL Cubed versión 7 UserGuide
http://slidepdf.com/reader/full/xl-cubed-version-7-userguide 280/567
275 | P a g e
XLCubed v7 User Guide – Book IV – Web Edition
Modifying session duration
To change the default sessions length from 20 minutes, you will need to launch Internet Information
Services Manager on the web server, and go to the XLCubed Website and select "Session State":
You can change the session time out under the "Cookies" section:
Viewing active sessions
The easiest method to monitor currently active users is to use Performance Monitor, you need to select
the event: "ASP.Net Applications" => "Sessions Active". You would need to limit this to the XLCubedWeb
Instance if running more than one website on the same server.

7/17/2019 XL Cubed versión 7 UserGuide
http://slidepdf.com/reader/full/xl-cubed-version-7-userguide 281/567
276 | P a g e
XLCubed v7 User Guide – Book IV – Web Edition
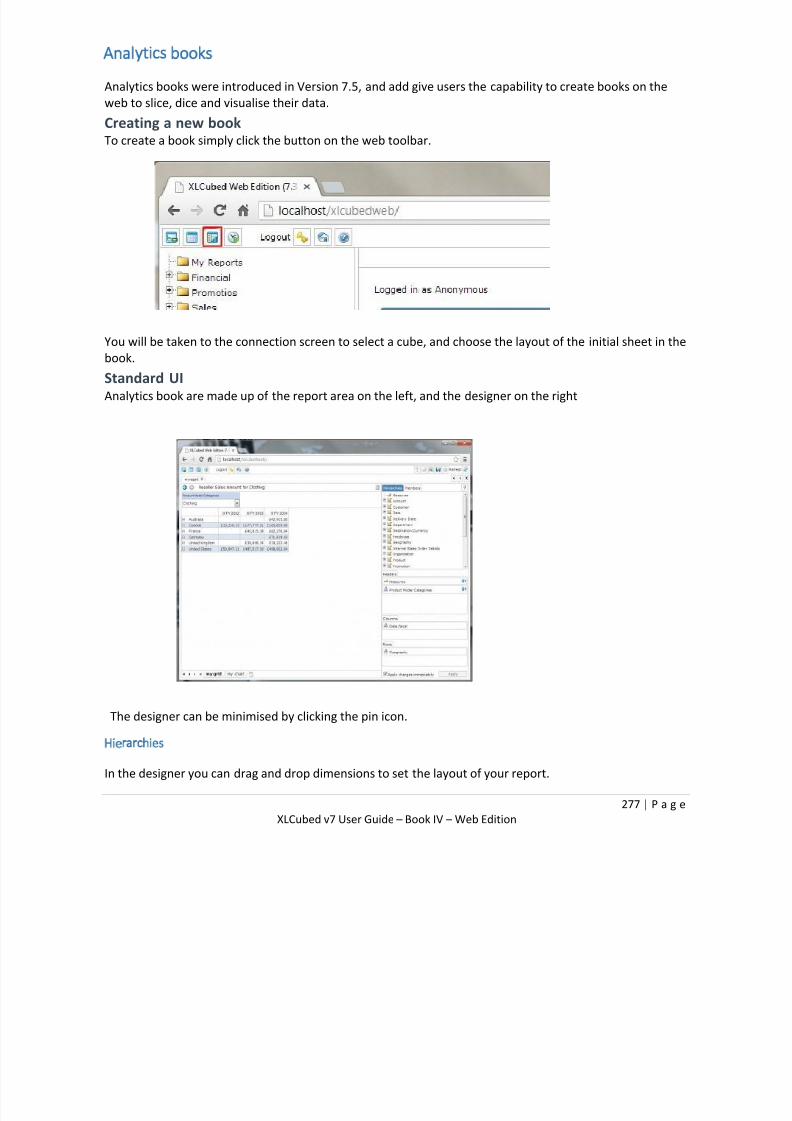
7/17/2019 XL Cubed versión 7 UserGuide
http://slidepdf.com/reader/full/xl-cubed-version-7-userguide 282/567
277 | P a g e
XLCubed v7 User Guide – Book IV – Web Edition
Analytics books
Analytics books were introduced in Version 7.5, and add give users the capability to create books on the
web to slice, dice and visualise their data.
Creating a new bookTo create a book simply click the button on the web toolbar.
You will be taken to the connection screen to select a cube, and choose the layout of the initial sheet in the
book.
Standard UIAnalytics book are made up of the report area on the left, and the designer on the right
The designer can be minimised by clicking the pin icon.
Hierarchies
In the designer you can drag and drop dimensions to set the layout of your report.
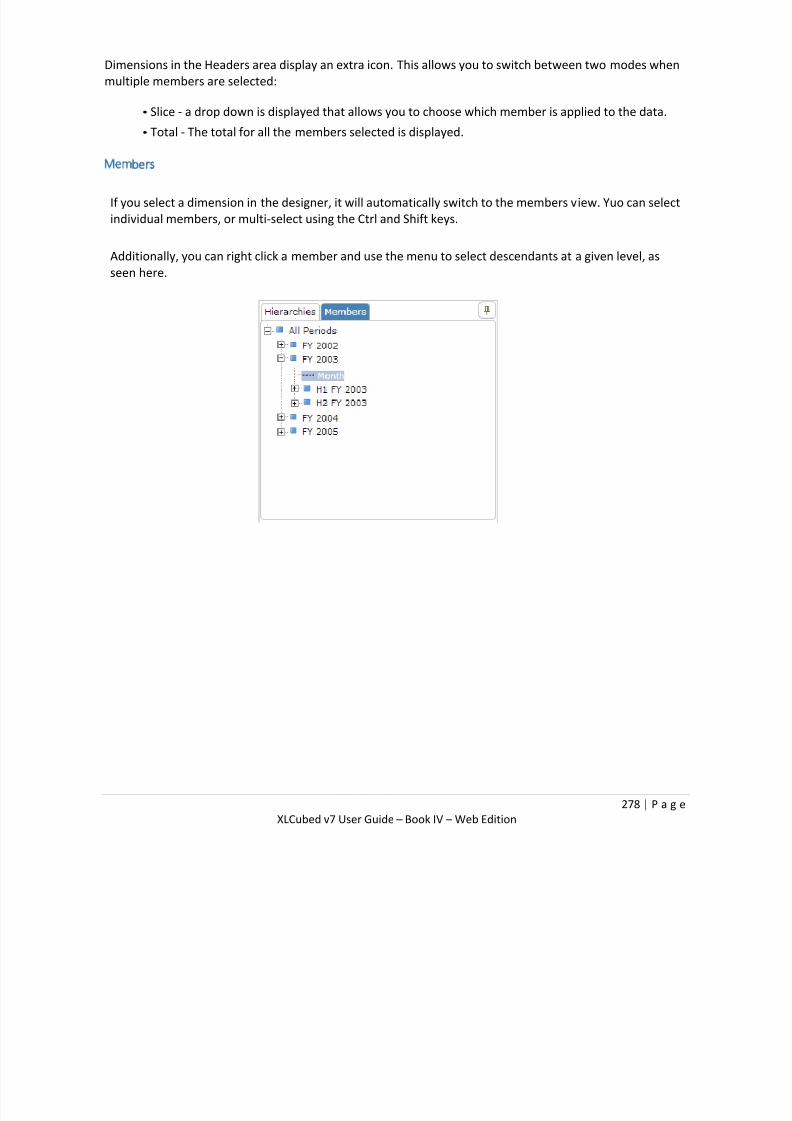
7/17/2019 XL Cubed versión 7 UserGuide
http://slidepdf.com/reader/full/xl-cubed-version-7-userguide 283/567
278 | P a g e
XLCubed v7 User Guide – Book IV – Web Edition
Dimensions in the Headers area display an extra icon. This allows you to switch between two modes when
multiple members are selected:
• Slice - a drop down is displayed that allows you to choose which member is applied to the data.
• Total - The total for all the members selected is displayed.
Members
If you select a dimension in the designer, it will automatically switch to the members view. Yuo can select
individual members, or multi-select using the Ctrl and Shift keys.
Additionally, you can right click a member and use the menu to select descendants at a given level, as
seen here.

7/17/2019 XL Cubed versión 7 UserGuide
http://slidepdf.com/reader/full/xl-cubed-version-7-userguide 284/567
279 | P a g e
XLCubed v7 User Guide – Book IV – Web Edition
Report Header The top section of the report area contains two sections.
The first is the Title area. This gives a brief description of the current selection, and contains a few
buttons.
On the left are the back/forward buttons, which allow you to undo any changes you have made to
the report, for example navigating back up the dimension you have been dril ling down into.
On the right is the sheet properties button. This allows you to alter the report layout, and set drill mode.
The second selection contains the slicers for dimensions in the header area. Slicers only apply when there
are multiple selections, so will not appear for single members, or when the header is in Total mode.
If no slicers are visible the section is automatically hidden to give more room to display the data.
Report Types
There are several sheet layouts available when you create a new sheet.
Grid
This is simply a table of data which you can manipulate. You can drill into the data using the drill
indicators, and sort the data by clicking the arrows in columns headers.
Context menus provide access to more complex functions such as ranking and filtering the columns
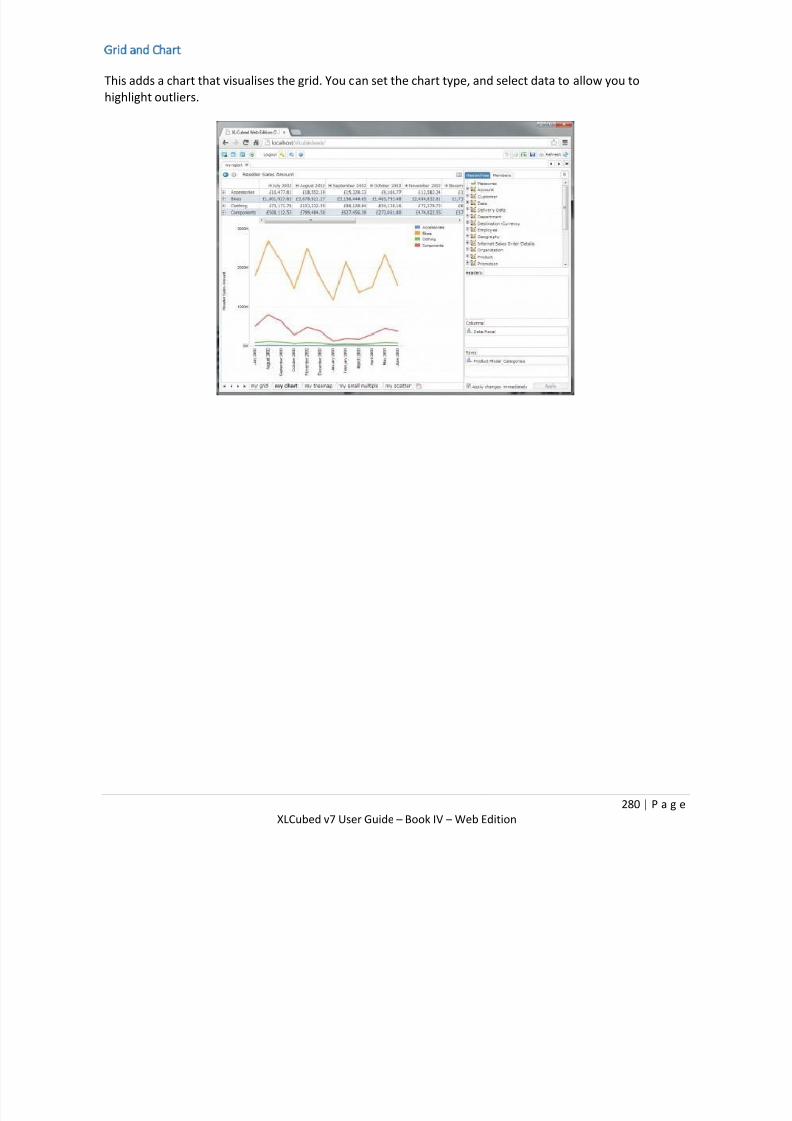
7/17/2019 XL Cubed versión 7 UserGuide
http://slidepdf.com/reader/full/xl-cubed-version-7-userguide 285/567
280 | P a g e
XLCubed v7 User Guide – Book IV – Web Edition
Grid and Chart
This adds a chart that visualises the grid. You can set the chart type, and select data to allow you to
highlight outliers.

7/17/2019 XL Cubed versión 7 UserGuide
http://slidepdf.com/reader/full/xl-cubed-version-7-userguide 286/567
281 | P a g e
XLCubed v7 User Guide – Book IV – Web Edition
Grid and Treemap
Treemaps allow you to visualise two measures at once, and compare their relative sizes. The UI
changes slightly in this mode so that you can easily pick the two measures to represent the size and colour
to the tree segments.
Small Multiple
Small Multiple Charts allow you to slice and display your data by a number of dimensions at once. Here
the UI changes to give you more positions for Hierarchies to exploit this ability.

7/17/2019 XL Cubed versión 7 UserGuide
http://slidepdf.com/reader/full/xl-cubed-version-7-userguide 287/567
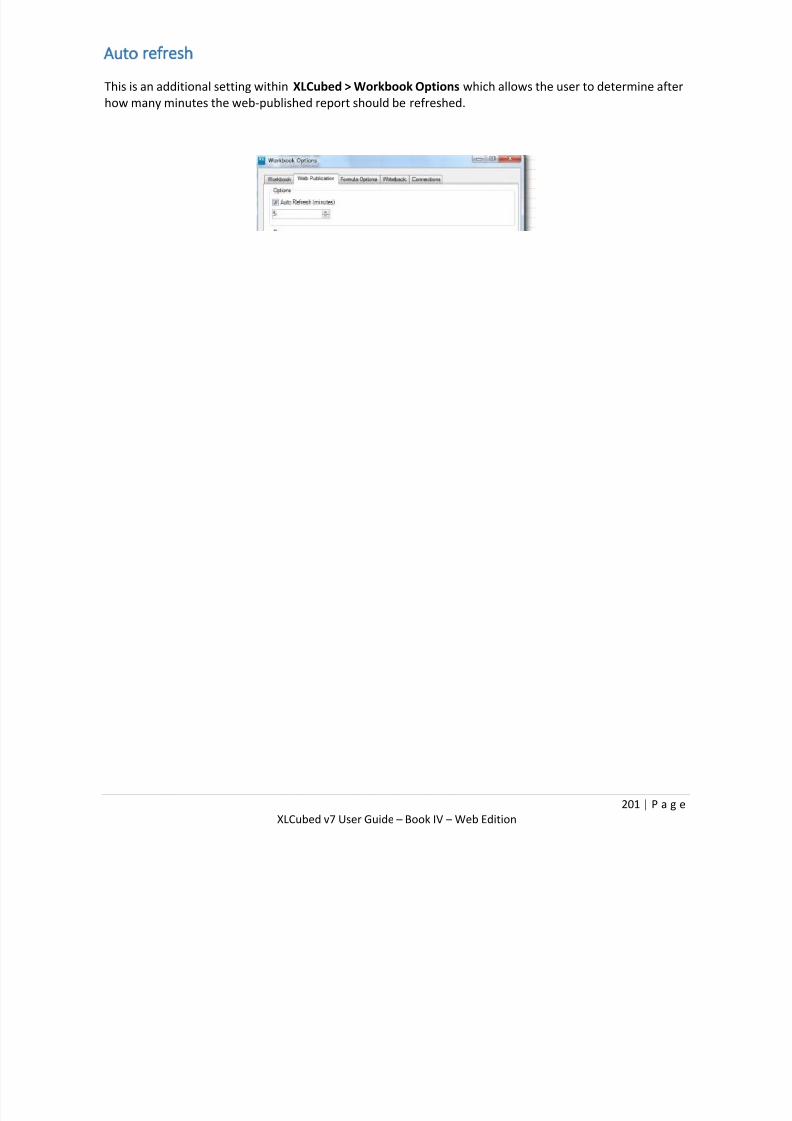
7/17/2019 XL Cubed versión 7 UserGuide
http://slidepdf.com/reader/full/xl-cubed-version-7-userguide 288/567
201 | P a g e
XLCubed v7 User Guide – Book IV – Web Edition
Auto refresh
This is an additional setting within XLCubed > Workbook Options which allows the user to determine after
how many minutes the web-published report should be refreshed.

7/17/2019 XL Cubed versión 7 UserGuide
http://slidepdf.com/reader/full/xl-cubed-version-7-userguide 289/567
202 | P a g e
XLCubed v7 User Guide – Book IV – Web Edition
Browsing the XLCubed Web Repository
When XLCubed requires the selection of an item from the Web Edition repository, it will present you with
the Browse Repository dialog. This dialog will allow you to connect to the Web Edition and select an item:
Type the XLCubed Web Edition address into the Web site text box:
Select the desired item from the repository tree:
Click OK to select the item

7/17/2019 XL Cubed versión 7 UserGuide
http://slidepdf.com/reader/full/xl-cubed-version-7-userguide 290/567
203 | P a g e
XLCubed v7 User Guide – Book IV – Web Edition
Reporting Services
As of V7 XLCubed can integrate your Reporting Services reports with the XLCubed Repository. The first
step is to install the ReportViewer control, which is available for download from Microsoft’s web site.
Next, to configure this you will need to add the following settings in the web.config file of your
XLCubedWeb installation:
<appSettings>
<!-----Existing settings-- >
<add key="ReportingServicesUrl" value="http://my-server:8080/Reports_SQL2008RS" />
<add key="ReportingServicesServerUrl"value="http://myserver:8080/ReportServer_SQL2008RS"
/>
</appSettings>
Remove the comments around sections of the web.config labeled:
<!----ReportingServices Integration-- >
Once this is done XLCubed will query the Reporting Services report list when a user logs in, and create
folders for the reports found. These can then be opened directly in the XLCubedWeb application.

7/17/2019 XL Cubed versión 7 UserGuide
http://slidepdf.com/reader/full/xl-cubed-version-7-userguide 291/567
204 | P a g e
XLCubed v7 User Guide – Book IV – Web Edition
Web Development
XLCubed Web Edition allows application developers to embed XLCubed reports in their own web
pages.
Several reports can be embedded in a single page and linked together using parameters as
required, allowing you to build custom pages out of existing published workbooks.
This page describes the web API, and the html and JavaScript required to embed reports.

7/17/2019 XL Cubed versión 7 UserGuide
http://slidepdf.com/reader/full/xl-cubed-version-7-userguide 292/567
205 | P a g e
XLCubed v7 User Guide – Book IV – Web Edition
Direct report linking
It is possible to link to a published report directly using the following URL syntax:
http://Server/XLCubedWeb/WebForm/ShowReport.aspx?rep=report.xml
This can also include any Web Parameters to allow specific criteria to be passed.
Embedding Workbooks
Standards Mode
XLCubed does not support “Quirks Mode” in Internet Explorer. To ensure that IE renders your page in
Standards Mode you will need to put a suitable doctype at the top of your page. Sample doctypes can be
found on Wikipedia.
Required Includes
Embedded XLCubed reports reference various JavaScript libraries which must be included in your page. You
should change the references to "MyServerName" to the name of the XLCubed web site, eg:
"WebServer01/XLCubedWeb"
Required Css:
<link rel="stylesheet" type="text/css" href="http://MyServerName/Css/XLCubedWeb.css" />
<link rel="stylesheet" type="text/css"
href="http://MyServerName/Css/XLCubed.Workbook.css" />
<link rel="stylesheet" type="text/css" href="http://MyServerName/Css/redmond/jquery-ui-
1.8.custom.css" />
<link rel="stylesheet" type="text/css" href="http://MyServerName/Css/redmond/jquery.treeview.css"
/>
Required Javascript:
<script type="text/JavaScript" src="http://MyServerName/js/JQuery/jquery-
1.4.2.min.js"></script>
<script type="text/JavaScript" src="http://MyServerName/js/JQuery/jquery-ui-
1.8.custom.min.js"></script>
<script type="text/JavaScript" src="http://MyServerName/js/JQuery/jquery.treeview.min.js"></script><script type="text/JavaScript"
src="http://MyServerName/js/JQuery/jquery.treeview.async.js"></script>
<script type="text/JavaScript"
src="http://MyServerName/js/JQuery/jquery.cookie.js"></script>

7/17/2019 XL Cubed versión 7 UserGuide
http://slidepdf.com/reader/full/xl-cubed-version-7-userguide 293/567
206 | P a g e
XLCubed v7 User Guide – Book IV – Web Edition
<script type="text/JavaScript" src="http://MyServerName/js/JQuery/jquery.n-
contextmenu.js"></script>
<script type="text/JavaScript" src="http://MyServerName/js/JQuery/jquery.scrollTo-1.4.2-
min.js"></script>
<script type="text/JavaScript"
src="http://MyServerName/js/JQuery/jquery.xlcubedextensions.js"></script><script type="text/JavaScript"
src="http://MyServerName/js/microsoft/microsoftajax.js"></script>
<script type="text/JavaScript" src="http://MyServerName/js/XLCubed.Web.js"></script>
<script type="text/JavaScript" src="http://MyServerName/js/XLCubed.Workbook.js"></script>
<script type="text/JavaScript" src="http://MyServerName/js/XLCubed.Toolbars.js"></script>
<script type="text/JavaScript" src="http://MyServerName/js/XLCubed.Repository.js"></script>
<script type="text/JavaScript"
src="http://MyServerName/js/XLCubed.DialogManager.js"></script>
<script type="text/JavaScript" src="http://MyServerName/js/XLCubed.Controls.js"></script>
<script type="text/JavaScript" src="http://MyServerName/js/XLCubed.Dialogs.js"></script>
<script type="text/JavaScript"
src="http://MyServerName/WebServices/WorkbookService.svc/js"></script>
Updates for version 6.5
As of version 6.5 many resources have been consolidated, and you can instead include the following.
Required Css:
<link rel="stylesheet" type="text/css" href="http://MyServerName/Css/redmond/jquery-ui-
1.8.custom.css" />
<link rel="stylesheet" type="text/css" href="http://MyServerName/Css/redmond/jquery.treeview.css"
/>
<link rel="stylesheet" type="text/css" href="http://MyServerName/Css/XLCubed.min.css" />
Required JavaScript:
<script type="text/JavaScript" src="http://MyServerName/js/JQuery/jquery
1.4.2.min.js"></script>

7/17/2019 XL Cubed versión 7 UserGuide
http://slidepdf.com/reader/full/xl-cubed-version-7-userguide 294/567
284 | P a g e
XLCubed v7 User Guide – Book IV – Web Edition
<script type="text/JavaScript" src="http://MyServerName/js/JQuery/jquery-ui-
1.8.custom.min.js"></script>
<script type="text/JavaScript"
src="http://MyServerName/js/Microsoft/MicrosoftAjax.js"></script>
<script type="text/JavaScript"
src="http://MyServerName/WebServices/WorkbookService.svc/js"></script>
<script type="text/JavaScript" src="http://MyServerName/js/XLCubed.min.js"></script>

7/17/2019 XL Cubed versión 7 UserGuide
http://slidepdf.com/reader/full/xl-cubed-version-7-userguide 295/567
284 | P a g e
XLCubed v7 User Guide – Book IV – Web Edition
Updates for version 7.0
As of version 7.0 the version of jQuery has been updated to 1.7.2, so the includes are as follows.
Required Css:
<link rel="stylesheet" type="text/css" href="http://MyServerName/Css/redmond/jquery-ui-
1.8.custom.css" /> <link rel="stylesheet" type="text/css" href="http://MyServerName/Css/redmond/jquery.treeview.css"
/>
<link rel="stylesheet" type="text/css" href="http://MyServerName/Css/XLCubed.min.css" />
Required JavaScript:
<script type="text/JavaScript" src="http://MyServerName/js/JQuery/jquery-
1.7.2.min.js"></script>
<script type="text/JavaScript" src="http://MyServerName/js/JQuery/jquery-ui-1.8.custom.min.js"></script>
<script type="text/JavaScript"
src="http://MyServerName/js/Microsoft/MicrosoftAjax.js"></script>
<script type="text/JavaScript"
src="http://MyServerName/WebServices/WorkbookService.svc/js"></script>
<script type="text/JavaScript" src="http://MyServerName/js/XLCubed.min.js"></script>
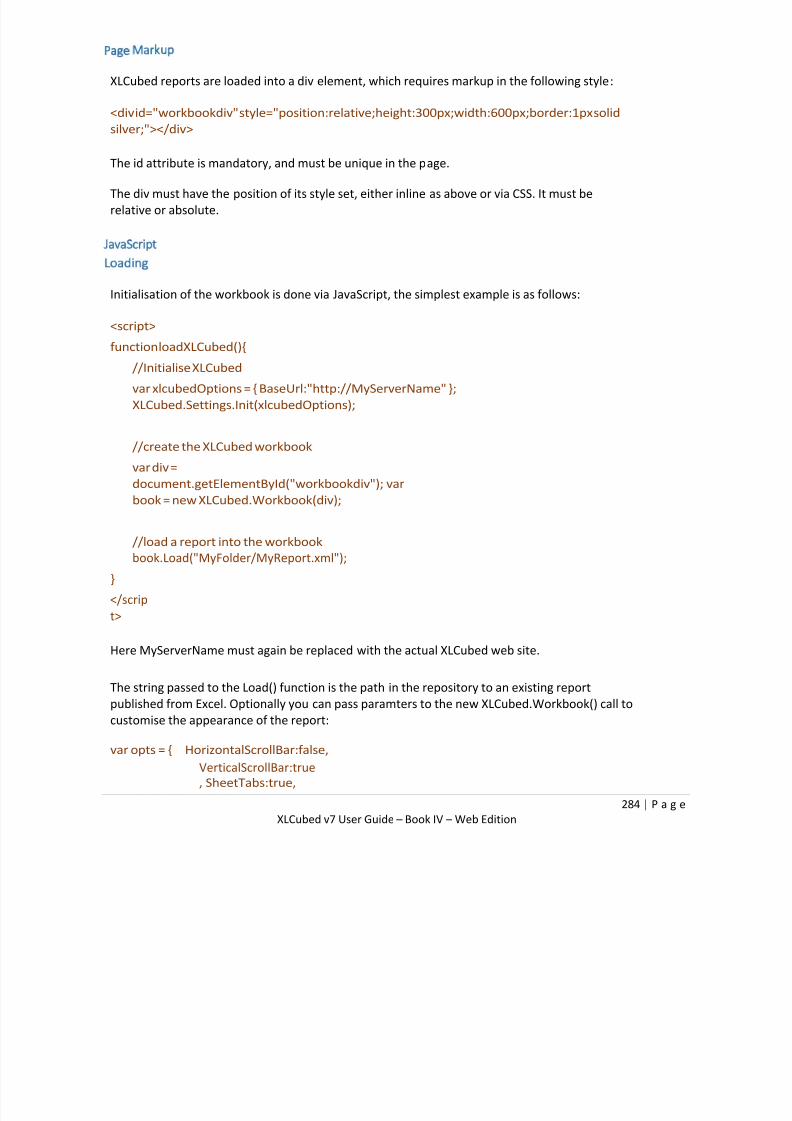
7/17/2019 XL Cubed versión 7 UserGuide
http://slidepdf.com/reader/full/xl-cubed-version-7-userguide 296/567
284 | P a g e
XLCubed v7 User Guide – Book IV – Web Edition
Page Markup
XLCubed reports are loaded into a div element, which requires markup in the following style:
<div id="workbookdiv" style="position:relative;height:300px;width:600px;border:1px solid
silver;"></div>
The id attribute is mandatory, and must be unique in the page.
The div must have the position of its style set, either inline as above or via CSS. It must be
relative or absolute.
JavaScript
o ding
Initialisation of the workbook is done via JavaScript, the simplest example is as follows:
<script> function loadXLCubed(){
//Initialise XLCubed
var xlcubedOptions = { BaseUrl:"http://MyServerName" };
XLCubed.Settings.Init(xlcubedOptions);
//create the XLCubed workbook
var div =
document.getElementById("workbookdiv"); var
book = new XLCubed.Workbook(div);
//load a report into the workbook
book.Load("MyFolder/MyReport.xml");
}
</scrip
t>
Here MyServerName must again be replaced with the actual XLCubed web site.
The string passed to the Load() function is the path in the repository to an existing report
published from Excel. Optionally you can pass paramters to the new XLCubed.Workbook() call to
customise the appearance of the report:
var opts = { HorizontalScrollBar:false,
VerticalScrollBar:true, SheetTabs:true,

7/17/2019 XL Cubed versión 7 UserGuide
http://slidepdf.com/reader/full/xl-cubed-version-7-userguide 297/567
285 | P a g e
XLCubed v7 User Guide – Book IV – Web Edition
ContextMenus:false
};
var book = new XLCubed.Workbook(div,
opts);
If you wish to load a different report, then simply call
book.Load()
again on the same book variable, do not create a second book in the same div.

7/17/2019 XL Cubed versión 7 UserGuide
http://slidepdf.com/reader/full/xl-cubed-version-7-userguide 298/567
286 | P a g e
XLCubed v7 User Guide – Book IV – Web Edition

7/17/2019 XL Cubed versión 7 UserGuide
http://slidepdf.com/reader/full/xl-cubed-version-7-userguide 299/567
287 | P a g e
XLCubed v7 User Guide – Book IV – Web Edition
Impersonation
XLCubed can impersonate a named user if required. To do this the following API can be called:
//Set up the user we want to run queries as var logonOptions = {Username:"MyUsername",
Domain:"MyDomain",
Password:"MyPassword"};
XLCubed.Settings.Logon(logonOptions);
The Logon() function must be called after XLCubed.Settings.Init() and before book.Load()

7/17/2019 XL Cubed versión 7 UserGuide
http://slidepdf.com/reader/full/xl-cubed-version-7-userguide 300/567
288 | P a g e
XLCubed v7 User Guide – Book IV – Web Edition
Parameters
If a report is published with web parameters, these can be setup through the API. You can load a report with
parameters set as follows:
//create book as above...
var params = { Date:"January 2010", Geography:"Europe" };
book.Load("MyFolder/MyReport.xml", params);
After a book has been loaded you can update the parameters as follows:
//book variable from elsewhere, the report is already loaded
Var params = { Date:"March 2010",
Geography:"America" };
book.ApplyParameters(params);
As of v7.6 you can also retrieve the current values of the parameters:
//book variable from elsewhere, the report is already loaded
Var params = book.GetParameters();
For (var param in params) {
Alert (param + “ + “ + params[param];
}

7/17/2019 XL Cubed versión 7 UserGuide
http://slidepdf.com/reader/full/xl-cubed-version-7-userguide 301/567
289 | P a g e
XLCubed v7 User Guide – Book IV – Web Edition
Toolbar
You can create a toolbar for your report using the following:
Markup:
<div id="toolbar"></div>
Script:
//book already created
var toolDiv = document.getElementById("toolbar");
var toolbar = new XLCubed.WorkbookToolbar(toolDiv, book);

7/17/2019 XL Cubed versión 7 UserGuide
http://slidepdf.com/reader/full/xl-cubed-version-7-userguide 302/567
290 | P a g e
XLCubed v7 User Guide – Book IV – Web Edition
Events
An XLCubed workbook will fire events which you can attach to to customise your page and link reports
together. Binding to events uses the following syntax
//book already created book.Bind(eventName,
eventHandlerFunction)
The eventHandlerFunction takes two arguments, an event object and a data object containing
information about the event that fired.
function loadXLCubed(){
//book already created book.Bind("load",
loadHandler);
}
function loadHandler(e, data){
//we can get a reference to the book from here var b =
data.workbook;
alert("loaded");
}

7/17/2019 XL Cubed versión 7 UserGuide
http://slidepdf.com/reader/full/xl-cubed-version-7-userguide 303/567
291 | P a g e
XLCubed v7 User Guide – Book IV – Web Edition
The events fired are:

7/17/2019 XL Cubed versión 7 UserGuide
http://slidepdf.com/reader/full/xl-cubed-version-7-userguide 304/567
292 | P a g e
XLCubed v7 User Guide – Book IV – Web Edition
Embedding Repository

7/17/2019 XL Cubed versión 7 UserGuide
http://slidepdf.com/reader/full/xl-cubed-version-7-userguide 305/567
293 | P a g e
XLCubed v7 User Guide – Book IV – Web Edition
Required Includes
You can query the repository to get a list of the folders and files available on the server. To do this you
must reference a couple of JavaScript files.
You should change the references to "MyServerName" to the name of the XLCubed web site, eg:
"WebServer01/XLCubedWeb"
Required Css:
None
Required JavaScript:
<script type="text/JavaScript" src="http://MyServerName/js/JQuery/jquery-1.7.2.min.js"></script>
<script type="text/JavaScript" src="http://MyServerName/js/JQuery/jquery-ui-
1.8.custom.min.js"></script><script type="text/JavaScript" src="http://MyServerName/js/Microsoft/MicrosoftAjax.js"></script>
<script type="text/JavaScript"
src="http://MyServerName/WebServices/RepositoryService.svc/js"></script>
<script type="text/JavaScript" src="http://MyServerName/js/XLCubed.min.js"></script>

7/17/2019 XL Cubed versión 7 UserGuide
http://slidepdf.com/reader/full/xl-cubed-version-7-userguide 306/567
294 | P a g e
XLCubed v7 User Guide – Book IV – Web Edition
JavaScript

7/17/2019 XL Cubed versión 7 UserGuide
http://slidepdf.com/reader/full/xl-cubed-version-7-userguide 307/567
295 | P a g e
XLCubed v7 User Guide – Book IV – Web Edition
Loading
Initialisation of the repository is done via JavaScript, the simplest example is as follows:
<script> function loadXLCubed(){
//Initialise XLCubed
var xlcubedOptions = {
BaseUrl:"http://MyServerName" };
XLCubed.Settings.Init(xlcubedOptions);
//create a repository object var oRep = new XLCubed.Repository(); //and query the server
//This is asynchronous, so pass in a callback to handle the results oRep.GetRepository( function(oTopFolder) {

7/17/2019 XL Cubed versión 7 UserGuide
http://slidepdf.com/reader/full/xl-cubed-version-7-userguide 308/567
296 | P a g e
XLCubed v7 User Guide – Book IV – Web Edition
});}
alert(oTopFolder.folders.length);

7/17/2019 XL Cubed versión 7 UserGuide
http://slidepdf.com/reader/full/xl-cubed-version-7-userguide 309/567
297 | P a g e
XLCubed v7 User Guide – Book IV – Web Edition
</script>
Here MyServerName must again be replaced with the actual XLCubed web site. The oTopFolder object is
an instance of the folder class, which itself contains file.
You can then iterate over the contents of the top level folder to create your own UI, or do anything else
you'd like.
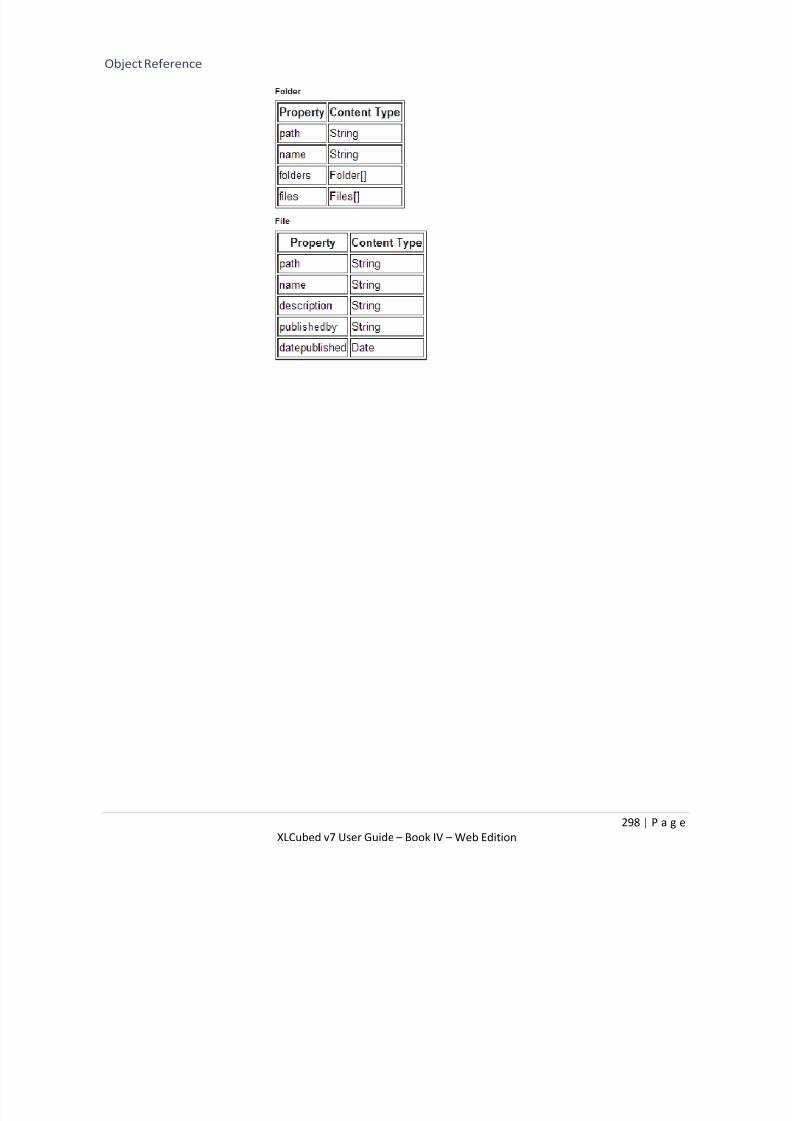
7/17/2019 XL Cubed versión 7 UserGuide
http://slidepdf.com/reader/full/xl-cubed-version-7-userguide 310/567
298 | P a g e
XLCubed v7 User Guide – Book IV – Web Edition
Object Reference

7/17/2019 XL Cubed versión 7 UserGuide
http://slidepdf.com/reader/full/xl-cubed-version-7-userguide 311/567
299 | P a g e
XLCubed v7 User Guide – Book IV – Web Edition
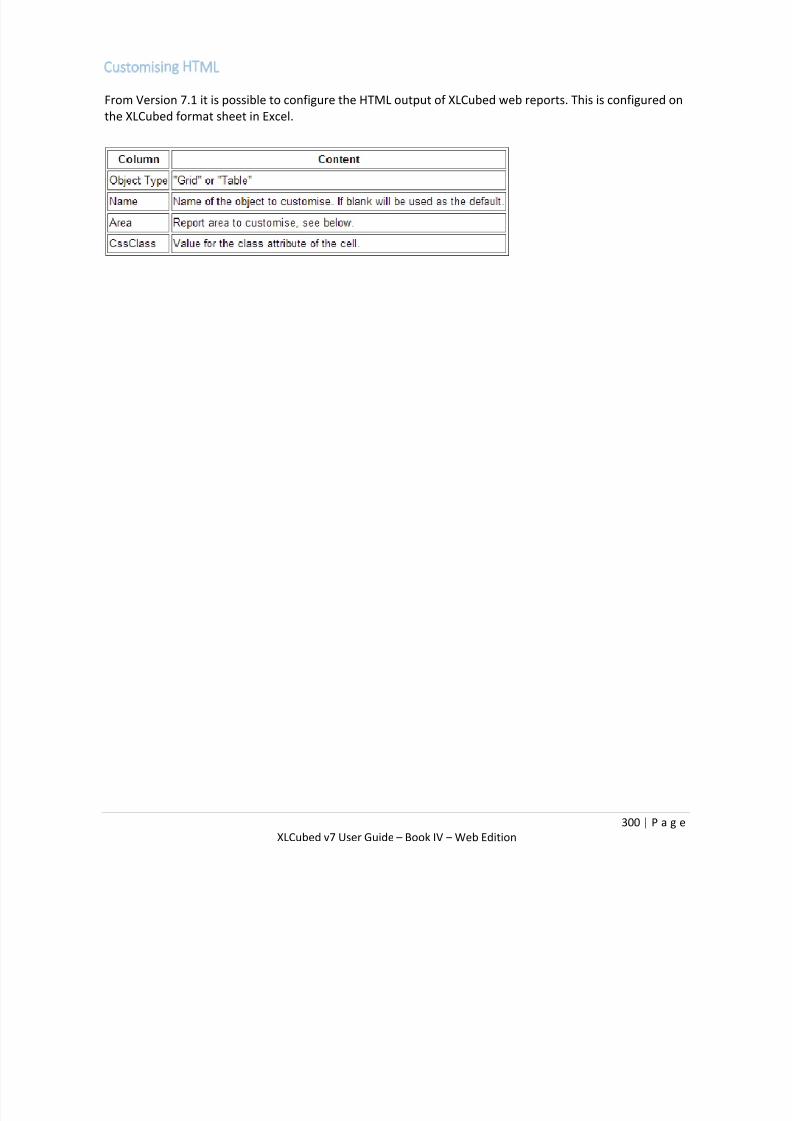
7/17/2019 XL Cubed versión 7 UserGuide
http://slidepdf.com/reader/full/xl-cubed-version-7-userguide 312/567
300 | P a g e
XLCubed v7 User Guide – Book IV – Web Edition
Customising HTML
From Version 7.1 it is possible to configure the HTML output of XLCubed web reports. This is configured on
the XLCubed format sheet in Excel.

7/17/2019 XL Cubed versión 7 UserGuide
http://slidepdf.com/reader/full/xl-cubed-version-7-userguide 313/567
301 | P a g e
XLCubed v7 User Guide – Book IV – Web Edition
Area Names

7/17/2019 XL Cubed versión 7 UserGuide
http://slidepdf.com/reader/full/xl-cubed-version-7-userguide 314/567
302 | P a g e
XLCubed v7 User Guide – Book IV – Web Edition
Grid
Possible values are:
• FiltMemLabel
• FiltMem
• ColMemLabel
•
ColPropLabel• ColMem
• ColProp
• RowMemLabel
• RowPropLabel
• RowMem
• RowProp
• Data
Table
Possible values are:
• WhereLabel
• WhereMem
• Header
• Data

7/17/2019 XL Cubed versión 7 UserGuide
http://slidepdf.com/reader/full/xl-cubed-version-7-userguide 315/567
303 | P a g e
XLCubed v7 User Guide – Book IV – Web Edition
HTML
This feature was introduced in version 7.5, and allows you to emit html tags directly into a web report.
As this could introduce a security risk it must first be enabled by an administrator by editing the setting in
the web.config file.
If enabled, cells whose value starts with "HTML:" will have that prefix removed, and the rest of the textwill then be written directly.
The cell value can be fixed, or dynamically created using a formula.

7/17/2019 XL Cubed versión 7 UserGuide
http://slidepdf.com/reader/full/xl-cubed-version-7-userguide 316/567
304 | P a g e
XLCubed v7 User Guide – Book IV – Web Edition
iPhone app
Version 6.5 of XLCubed Web provides platform access for the iPad app.
Once reports are published to XLCubed Web, they can be accessed on any device with a compatible
browser, including smartphones and tablets. If reports will primarily be used on iPad it is best to size
them accordingly, however larger reports can still of course be used. The iPad app is designed primarily
around interactive and connected report access. It provides customised report navigation in a similarmodel to Apple’s standard email app, as shown below.
The XLCubed Viewer app is pre-loaded with a connection to our sample Web Edition server, which
provides access to some example reports.

7/17/2019 XL Cubed versión 7 UserGuide
http://slidepdf.com/reader/full/xl-cubed-version-7-userguide 317/567
305 | P a g e
XLCubed v7 User Guide – Book IV – Web Edition
To set up access to your own Web Server, press the plus (+) on the repository viewer. You then need to
complete the details below.
• Name: The display name which you will see the server as within the app
• URL: The URL path to the web server
•
Domain: The network domain which the web server is running on• UserName: The username you wish to use
• Password: The password
Touch Done when finished.
Once your server has been added, you can browse the Repository and select a report to run.
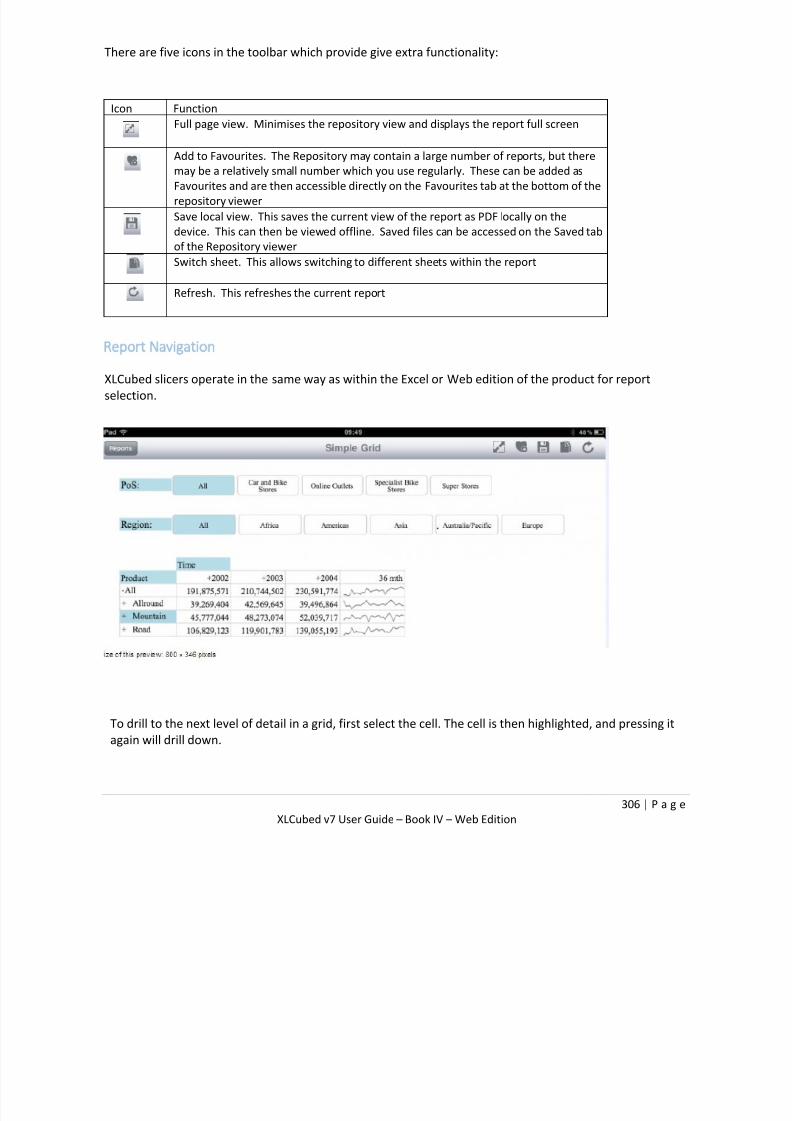
7/17/2019 XL Cubed versión 7 UserGuide
http://slidepdf.com/reader/full/xl-cubed-version-7-userguide 318/567
306 | P a g e
XLCubed v7 User Guide – Book IV – Web Edition
There are five icons in the toolbar which provide give extra functionality:
Icon Function
Full page view. Minimises the repository view and displays the report full screen
Add to Favourites. The Repository may contain a large number of reports, but there
may be a relatively small number which you use regularly. These can be added as
Favourites and are then accessible directly on the Favourites tab at the bottom of the
repository viewer
Save local view. This saves the current view of the report as PDF locally on the
device. This can then be viewed offline. Saved files can be accessed on the Saved tab
of the Repository viewer
Switch sheet. This allows switching to different sheets within the report
Refresh. This refreshes the current report
Report Navigation
XLCubed slicers operate in the same way as within the Excel or Web edition of the product for report
selection.
To drill to the next level of detail in a grid, first select the cell. The cell is then highlighted, and pressing it
again will drill down.

7/17/2019 XL Cubed versión 7 UserGuide
http://slidepdf.com/reader/full/xl-cubed-version-7-userguide 319/567
307 | P a g e
XLCubed v7 User Guide – Book IV – Web Edition

7/17/2019 XL Cubed versión 7 UserGuide
http://slidepdf.com/reader/full/xl-cubed-version-7-userguide 320/567
308 | P a g e
XLCubed v7 User Guide – Book IV – Web Edition
Mobile analytics
From version 7.5 the iPad and Android apps support analytics books.
Once you connect to your web server you will be able to create new reports, providing the web server
itself has also been upgraded to version 7.5.
A new icon (Analytics Report) appears at the top level of the repository browser at the bottom left of the
screen:
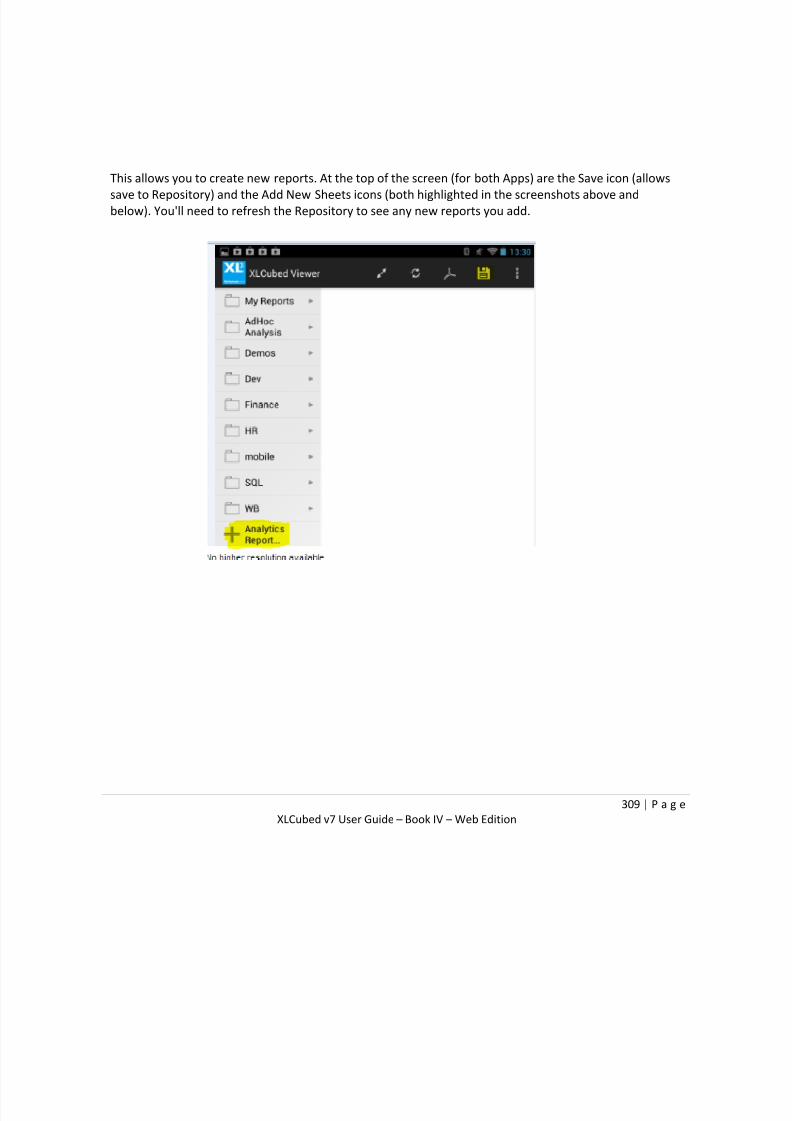
7/17/2019 XL Cubed versión 7 UserGuide
http://slidepdf.com/reader/full/xl-cubed-version-7-userguide 321/567
309 | P a g e
XLCubed v7 User Guide – Book IV – Web Edition
This allows you to create new reports. At the top of the screen (for both Apps) are the Save icon (allows
save to Repository) and the Add New Sheets icons (both highlighted in the screenshots above and
below). You'll need to refresh the Repository to see any new reports you add.
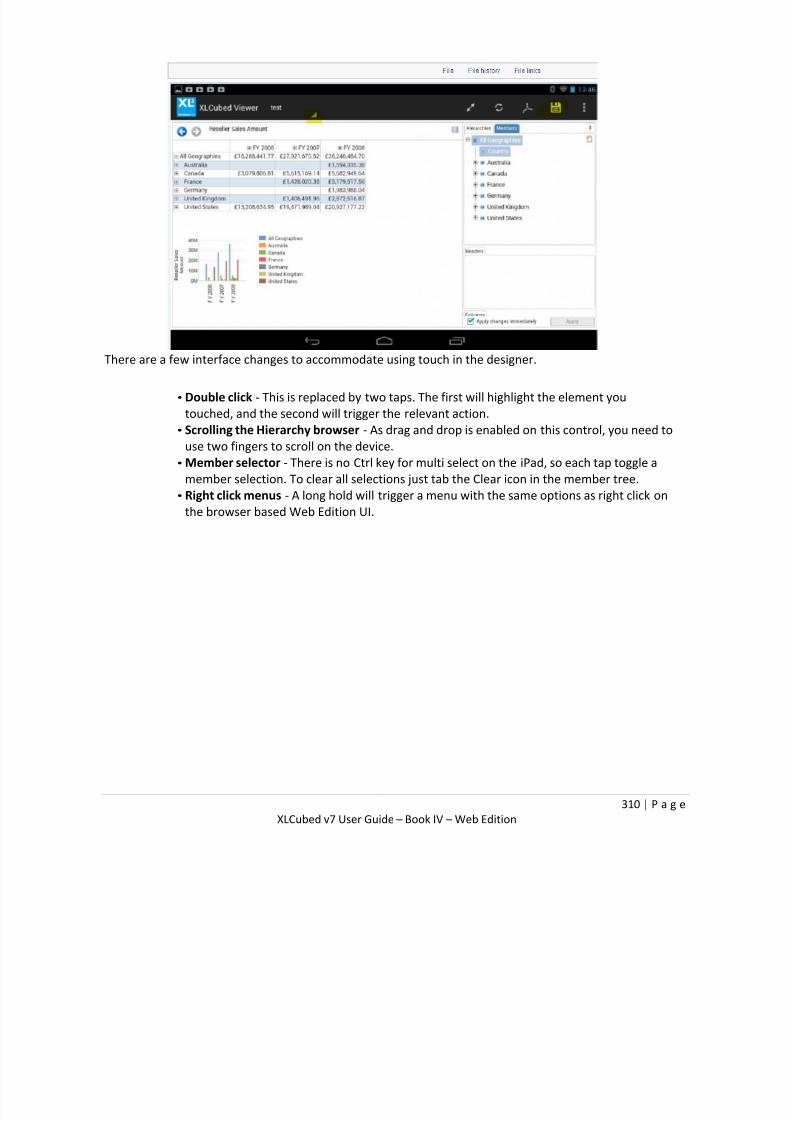
7/17/2019 XL Cubed versión 7 UserGuide
http://slidepdf.com/reader/full/xl-cubed-version-7-userguide 322/567
310 | P a g e
XLCubed v7 User Guide – Book IV – Web Edition
There are a few interface changes to accommodate using touch in the designer.
• Double click - This is replaced by two taps. The first will highlight the element you
touched, and the second will trigger the relevant action.
• Scrolling the Hierarchy browser - As drag and drop is enabled on this control, you need to
use two fingers to scroll on the device.
• Member selector - There is no Ctrl key for multi select on the iPad, so each tap toggle a
member selection. To clear all selections just tab the Clear icon in the member tree.
•
Right click menus - A long hold will trigger a menu with the same options as right click onthe browser based Web Edition UI.
7/17/2019 XL Cubed versión 7 UserGuide
http://slidepdf.com/reader/full/xl-cubed-version-7-userguide 323/567
311 | P a g e
XLCubed v7 User Guide – Book IV – Web Edition
Publishing Connections
Connections in the current workbook can be published to an instance of XLCubed Web Edition so
that they can be easily shared with other users:
Click the XLCubed > Web > Publish to Web > Publish Connection... ribbon option or
the XLCubed > Publish Connection... menu option in Excel 2003 and previous Select the connection you wish to publish from the dropdown at the top of the Publish
Connection form
Connect to the server you want to publish to:
o Enter the name of the XLCubed Web Edition server you want to connect to in the
Web site field. This will depend on how you have installed the XLCubed Web
Edition software on your server.
o Click Connect and if connection is successful the folders available on the server will
be displayed in the right hand side of the dialog (Folder to publish to).
Enter the Report details:
o Type in the Name and Description that you want to give the connection. The Namewill appear in the Navigation tree view. The Description will appear in the
Repository on detail pages.
Select where to publish:
o Navigate through the folders on the server to find the location you want by
clicking on the tree on the right-hand side of the Publisher dialog. The connection
will be published to the folder that is currently highlighted.
o Existing connections are also shown in the tree. If an existing connection is
highlighted, then XLCubed will attempt to replace it with the published
connection. Depending on how your Administrator has configured the XLCubed
Web Server it is quite possible that although you may be able to see a folder, youmay not have the required security privileges to actually write (publish) to that
directory. If this is the case a message will be displayed informing you that
publication was not possible and you must select a folder to which you do have
write permission. Contact your System Administrator to discuss permissions
further.
When you click OK , the connection is published.

7/17/2019 XL Cubed versión 7 UserGuide
http://slidepdf.com/reader/full/xl-cubed-version-7-userguide 324/567
312 | P a g e
XLCubed v7 User Guide – Book IV – Web Edition
Customising web config
There are several settings that administrators can edit in the web.config file to alter the default behaviour
of XLCubedWeb.
If these don't exist in the <appSettings> section they can be added.
StartupReport - Replaced the default startup page with the specified report. The report should
be in the form:
<add key="StartupReport" value="Folder/reportname.xml"/>
CustomHelpUrl - Allows you to direct your users to a custom help portal you have created.
ProgressBarUrl - Sets a custom image for the progress bar.
ProgressBarCss - Custom css class for the progress image. Built in values are "xl3-progress", the
standard position and "xl3-progress-center" which centers the image.
AllowHtmlColon - Allows outputting or raw html into workbooks. True/False.
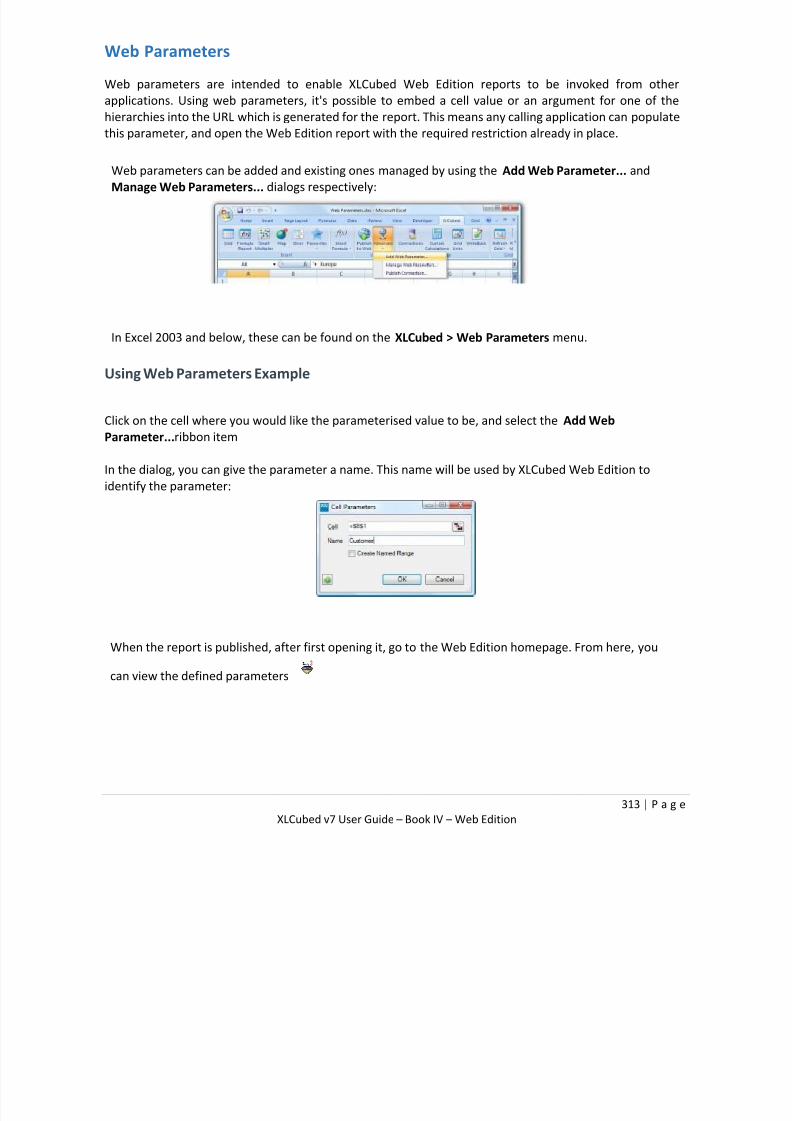
7/17/2019 XL Cubed versión 7 UserGuide
http://slidepdf.com/reader/full/xl-cubed-version-7-userguide 325/567
313 | P a g e
XLCubed v7 User Guide – Book IV – Web Edition
Web Parameters
Web parameters are intended to enable XLCubed Web Edition reports to be invoked from other
applications. Using web parameters, it's possible to embed a cell value or an argument for one of the
hierarchies into the URL which is generated for the report. This means any calling application can populate
this parameter, and open the Web Edition report with the required restriction already in place.
Web parameters can be added and existing ones managed by using the Add Web Parameter... and
Manage Web Parameters... dialogs respectively:
In Excel 2003 and below, these can be found on the XLCubed > Web Parameters menu.
Using Web Parameters Example
Click on the cell where you would like the parameterised value to be, and select the Add Web
Parameter...ribbon item
In the dialog, you can give the parameter a name. This name will be used by XLCubed Web Edition to
identify the parameter:
When the report is published, after first opening it, go to the Web Edition homepage. From here, you
can view the defined parameters

7/17/2019 XL Cubed versión 7 UserGuide
http://slidepdf.com/reader/full/xl-cubed-version-7-userguide 326/567
314 | P a g e
XLCubed v7 User Guide – Book IV – Web Edition
After entering the parameters as required, you can use the Get URL button to generate a link, which
can be used from calling applications:

7/17/2019 XL Cubed versión 7 UserGuide
http://slidepdf.com/reader/full/xl-cubed-version-7-userguide 327/567
315 | P a g e
XLCubed v7 User Guide – Book IV – Web Edition
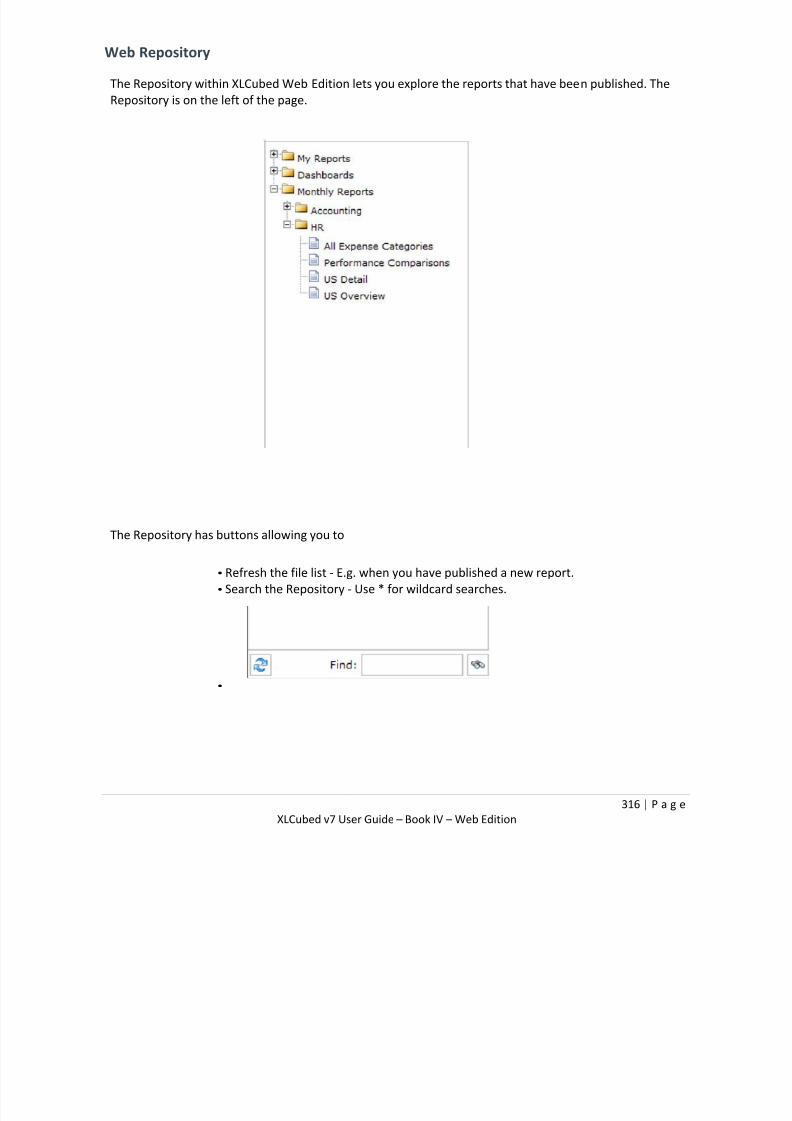
7/17/2019 XL Cubed versión 7 UserGuide
http://slidepdf.com/reader/full/xl-cubed-version-7-userguide 328/567
316 | P a g e
XLCubed v7 User Guide – Book IV – Web Edition
Web Repository
The Repository within XLCubed Web Edition lets you explore the reports that have been published. The
Repository is on the left of the page.
The Repository has buttons allowing you to
• Refresh the file list - E.g. when you have published a new report.
• Search the Repository - Use * for wildcard searches.
•

7/17/2019 XL Cubed versión 7 UserGuide
http://slidepdf.com/reader/full/xl-cubed-version-7-userguide 329/567
317 | P a g e
XLCubed v7 User Guide – Book IV – Web Edition
Connection Mapping
XLCubed Web Edition supports the re-targeting of connections for reports published to the web server.
To enable this feature, the ConnectionMapping.xml file must be created in the XML subfolder of the
XLCubed Web installation folder. This file can contain one or more connectionmap nodes, each of which
must contain a ‘from’ connection definition and a ‘to’ connection definition. After modifying this file, IISmust be restarted.
When a user loads a Report to view, the Web Edition will automatically search for any connections
matching a ‘from’ definition, and replace them with the corresponding todefinition.
The match is done using the Type, Server, Database and Cube of the ‘from’ connection. The ID number
and name for the connection will be left unchanged.

7/17/2019 XL Cubed versión 7 UserGuide
http://slidepdf.com/reader/full/xl-cubed-version-7-userguide 330/567
318 | P a g e
XLCubed v7 User Guide – Book IV – Web Edition
Example XML file
This example matches connections to the DEVELOPMENT server and replaces them with connections to
the PRODUCTION server.
<?xml version="1.0" encoding="utf-8"?>
<connectionmapper>
<connectionmap>
<from>
<connection id="0" name="">
<type>AnalysisServices</type>
<variable type="String" name="server"><value>DEVELOPMENT</value></variable>
<variable type="String" name="database"><value>Demo Database</value></variable>
<variable type="String" name="cube"><value>Demo Cube</value></variable>
<writebacktype>AnalysisServices</writebacktype>
<writebacksetting />
<nodummyrelationalwriteback>0</nodummyrelationalwriteback>
<variable type="Boolean" name="requirespassword"><value>0</value></variable>
<lastconnected>0001-01-01T00:00:00</lastconnected>
<props />
</connection>
</from>
<to>
<connection id="0" name="">
<type>AnalysisServices</type>
<variable type="String" name="server"><value>PRODUCTION</value></variable>
<variable type="String" name="database"><value>Demo Database</value></variable>
<variable type="String" name="cube"><value>Demo Cube</value></variable>
<writebacktype>AnalysisServices</writebacktype>
<writebacksetting />
<nodummyrelationalwriteback>0</nodummyrelationalwriteback> <variable type="Boolean" name="requirespassword"><value>0</value></variable>
<lastconnected>0001-01-01T00:00:00</lastconnected>
<props />
</connection>
</to>
</connectionmap>

7/17/2019 XL Cubed versión 7 UserGuide
http://slidepdf.com/reader/full/xl-cubed-version-7-userguide 331/567
319 | P a g e
XLCubed v7 User Guide – Book IV – Web Edition
</connectionmapper>

7/17/2019 XL Cubed versión 7 UserGuide
http://slidepdf.com/reader/full/xl-cubed-version-7-userguide 332/567
320 | P a g e
XLCubed v7 User Guide – Book IV – Web Edition
Dual Authentication
Requirement
There may be some circumstances where you need XLCubedWeb reports to be available via 2 different
authentication methods, for example Windows Authentication for internal users and Basic Authentication
for external users.
Solution
The approach to solve this is to create 2 copies of the XLCubedWeb website and create a shared
repository. With this approach the reports can be published to 1 website, but be immediately available
on both.
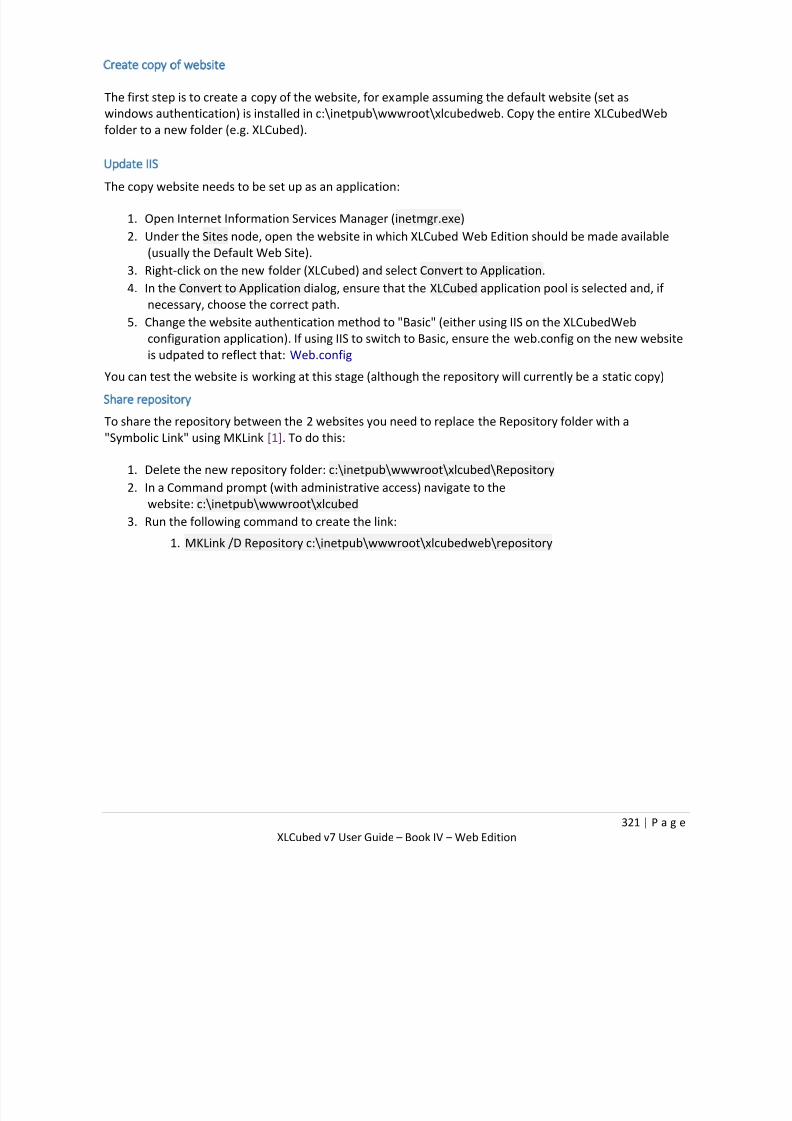
7/17/2019 XL Cubed versión 7 UserGuide
http://slidepdf.com/reader/full/xl-cubed-version-7-userguide 333/567
321 | P a g e
XLCubed v7 User Guide – Book IV – Web Edition
Create copy of website
The first step is to create a copy of the website, for example assuming the default website (set as
windows authentication) is installed in c:\inetpub\wwwroot\xlcubedweb. Copy the entire XLCubedWeb
folder to a new folder (e.g. XLCubed).
Update IIS
The copy website needs to be set up as an application:
1. Open Internet Information Services Manager (inetmgr.exe)
2. Under the Sites node, open the website in which XLCubed Web Edition should be made available
(usually the Default Web Site).
3. Right-click on the new folder (XLCubed) and select Convert to Application.
4. In the Convert to Application dialog, ensure that the XLCubed application pool is selected and, if
necessary, choose the correct path.
5. Change the website authentication method to "Basic" (either using IIS on the XLCubedWeb
configuration application). If using IIS to switch to Basic, ensure the web.config on the new website
is udpated to reflect that: Web.config
You can test the website is working at this stage (although the repository will currently be a static copy)
Share repository
To share the repository between the 2 websites you need to replace the Repository folder with a
"Symbolic Link" using MKLink [1]. To do this:
1. Delete the new repository folder: c:\inetpub\wwwroot\xlcubed\Repository
2. In a Command prompt (with administrative access) navigate to the
website: c:\inetpub\wwwroot\xlcubed
3. Run the following command to create the link:
1. MKLink /D Repository c:\inetpub\wwwroot\xlcubedweb\repository

7/17/2019 XL Cubed versión 7 UserGuide
http://slidepdf.com/reader/full/xl-cubed-version-7-userguide 334/567
322 | P a g e
XLCubed v7 User Guide – Book IV – Web Edition
Scheduling
XLCubed Web Edition can be used to deliver reports to users automatically.
Using a schedule you can define which reports go to which users, and can optionally parameterise the
results. Scheduling maintenance is setup in the browser using this icon:
Concepts
The scheduling module is made up of a few key parts:
SMTP Servers
An SMTP server is a computer that is configured to send emails. You will need to set one up so that
reports can be delivered to your users.
Report Distribution
XLCubed allows two different ways to set up the recipients for a report. The first is ideal for where the
report needs to be sent to just one or two people. Just type in the email addresses and it is ready to go.
The alternative is slightly more complex to set up, but once set up, it is easy to make new reports with the
same recipients. To use this, you set up a Distribution Group, composed of any number of people. To
make it easy to set up the reports as needed, each Group is assigned a Database Role to use and a Locale
to format its numbers and dates. One or more Distribution Groups are assigned to each Distribution List,
so that your scheduled report can be sent to more than one group at once.
Distribution Groups
A Distribution Group defines a set of users by their email addresses. Also associated with this is a locale
for formatting the report (Numbers appear as 1,234.56 or 1.234,56) and a database role to run the report
as.
For example you could define "USA Managers" to run with US formatting under the US role, and have
"German Managers" run with their own settings.
Distribution Lists
A Distribution Lists is a set of Distribution Groups which are linked together so a report goes to all users in
all groups at the same time.
For example you could define "Managers" as a list composed of the USA Managers and the German
Managers, and have reports sent to all of them.
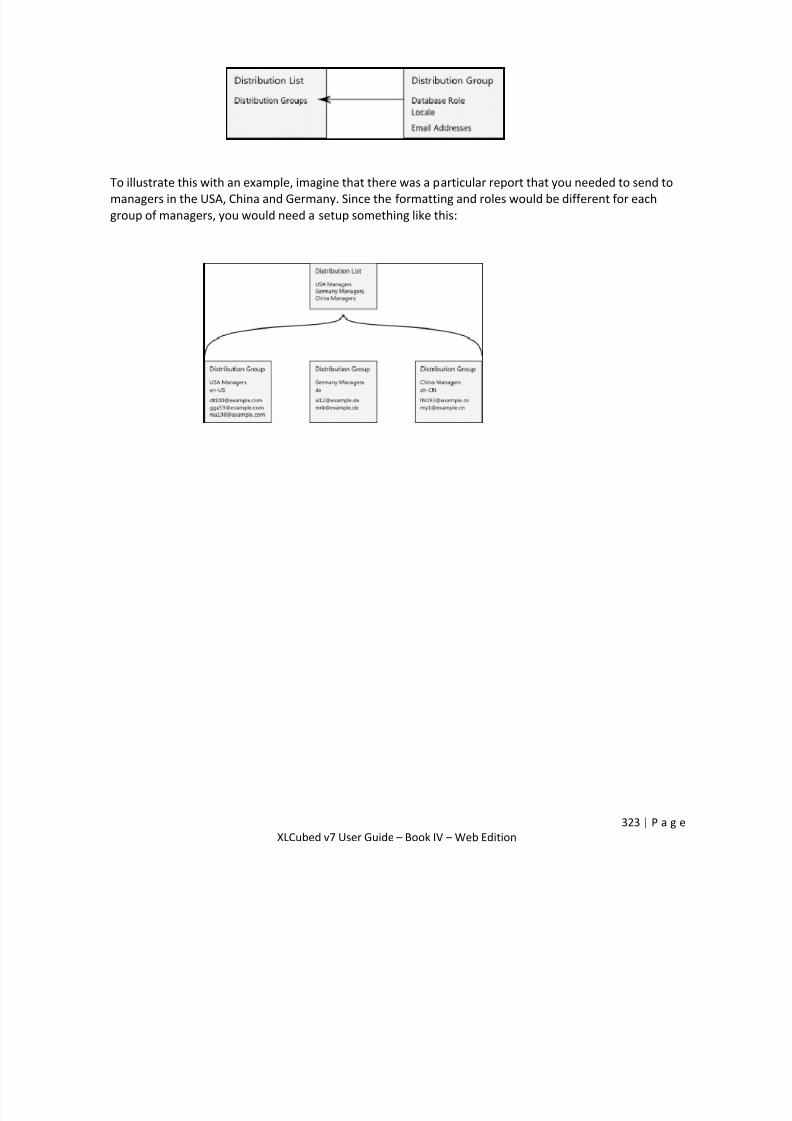
7/17/2019 XL Cubed versión 7 UserGuide
http://slidepdf.com/reader/full/xl-cubed-version-7-userguide 335/567
323 | P a g e
XLCubed v7 User Guide – Book IV – Web Edition
To illustrate this with an example, imagine that there was a particular report that you needed to send to
managers in the USA, China and Germany. Since the formatting and roles would be different for each
group of managers, you would need a setup something like this:

7/17/2019 XL Cubed versión 7 UserGuide
http://slidepdf.com/reader/full/xl-cubed-version-7-userguide 336/567
324 | P a g e
XLCubed v7 User Guide – Book IV – Web Edition
Schedules
A Schedule defines:
• which reports get sent
• who they are sent to• when they are sent (once, daily, weekly or monthly, on days of your choosing)
If you wish to have a different set of reports go to different people then this would be a new schedule.

7/17/2019 XL Cubed versión 7 UserGuide
http://slidepdf.com/reader/full/xl-cubed-version-7-userguide 337/567
325 | P a g e
XLCubed v7 User Guide – Book IV – Web Edition
Picking Reports
When picking a Report to be added the dialog box offers some options.
Parameters
Report parameters are defined in XLCubed Excel edition. You can set fixed values, or pick one of thePlaceholders to be set up when the report is generated.
Roles
Sets the role to run the report as, useful if you have cube security. This setting will be overridden by any
setting made for a Distribution Group.
Attach As
Defines the format of the report to be delivered, either PDF or Excel file.
Placeholders
By entering these custom values as report parameters you can customise the file for each user.
Code Description
%date% Inserts the current date
%time% Inserts the current time%datetime% Inserts the current date and time
%rolename% Inserts the database role or roles that are being used
%groupname% Inserts the name of the distribution group
%email% Inserts the email address of the recipient. Ignored
if %emailtosendto% is also used
%displayname% Inserts the display name of the recipient. Ignored
if %emailtosendto% is also used
%sendiftrue% Triggers sending of the report. May only be used once per report
%emailtosendto% Retrieves a comma-delimited list of email addresses from the report.
May only be used once per schedule
%sendiftrue%
If %sendiftrue%is used the report will be generated normally, but only sent to users if this parameter is
calculated to be TRUE.

7/17/2019 XL Cubed versión 7 UserGuide
http://slidepdf.com/reader/full/xl-cubed-version-7-userguide 338/567
326 | P a g e
XLCubed v7 User Guide – Book IV – Web Edition
This allows exception reporting, for example, if you had appropriate names defined in Excel, you could set
the formula in the parameter cell to be
=Or(Sales < 1000, Losses > 50)
The report can be published with the exception-detecting cell exposed as a Web Parameter:
This parameter can then be used as the %sendiftrue% parameter when setting up the schedule:
%emailtosendto%
If %emailtosendto%is used, the email addresses defined in the schedule or distribution group will be
ignored, and the addresses retrieved from this parameter instead. The value in the cell may be either one
email address or a comma-delimited list.
Note that this parameter overrides the %email%and %displayname%parameters.
Starting from an Existing Schedule
If the schedule you are trying to create is similar to an existing schedule, you can copy the details into the
new schedule by following these steps:
Click the Add Schedulebutton to create the new schedule
Click the Clone Existingbutton to display the Select a Scheduledialog

7/17/2019 XL Cubed versión 7 UserGuide
http://slidepdf.com/reader/full/xl-cubed-version-7-userguide 339/567
327 | P a g e
XLCubed v7 User Guide – Book IV – Web Edition
Select the schedule you would like to copy the details from
When you click the OK button, the details are copied into the new schedule
Finding the Scheduling Error Log
The Scheduling error log can be found in the XLCubed Web Edition Repository, under the
xlcubed \ scheduling subfolder. For example, if XLCubed is installed in the standard location, it can be
found here:
C:\inetpub\wwwroot\XLCubedWeb\Repository\_ xlcubed_ \_ scheduling_ \error.log
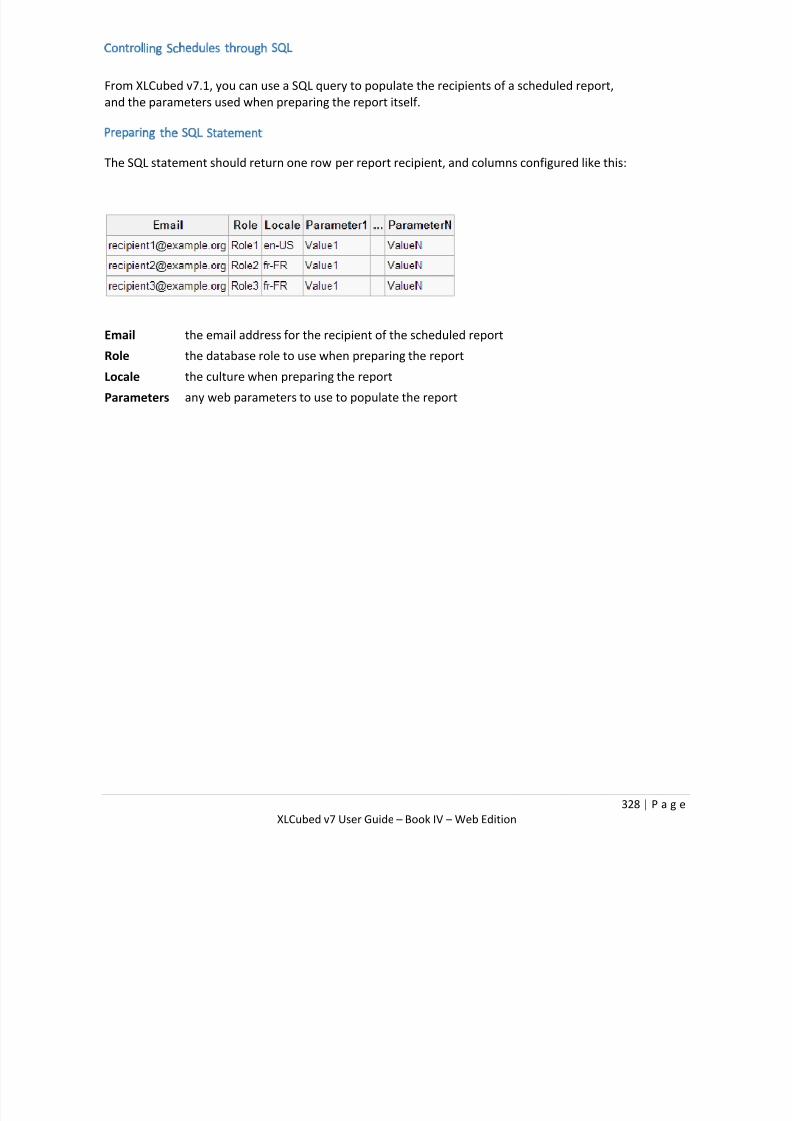
7/17/2019 XL Cubed versión 7 UserGuide
http://slidepdf.com/reader/full/xl-cubed-version-7-userguide 340/567
328 | P a g e
XLCubed v7 User Guide – Book IV – Web Edition
Controlling Schedules through SQL
From XLCubed v7.1, you can use a SQL query to populate the recipients of a scheduled report,
and the parameters used when preparing the report itself.
Preparing the SQL Statement
The SQL statement should return one row per report recipient, and columns configured like this:
Email the email address for the recipient of the scheduled report
Role the database role to use when preparing the report
Locale the culture when preparing the report
Parameters any web parameters to use to populate the report

7/17/2019 XL Cubed versión 7 UserGuide
http://slidepdf.com/reader/full/xl-cubed-version-7-userguide 341/567
329 | P a g e
XLCubed v7 User Guide – Book IV – Web Edition

7/17/2019 XL Cubed versión 7 UserGuide
http://slidepdf.com/reader/full/xl-cubed-version-7-userguide 342/567
330 | P a g e
XLCubed v7 User Guide – Book IV – Web Edition
Configuring the Distribution List to use the SQL Query
• On the web server, open the distributionLists.xmlconfiguration file, found in
the
xlcubed \ scheduling subfolder of the XLCubed Repository
• To each dynamically populated distribution list add:
• a dbConnectionelement, containing the connection string to use to
connect to the database. This can include the User Idand Password
connection properties if appropriate
• a populateQueryelement, containing the SQL statement to run
• Your distributionLists.xmlfile should now contain an element that looks like
this:
<distributionlist guid="xxxxxxxx-xxxx-xxxx-xxxx-xxxxxxxxxxxx" name="List name">
<dbConnection>DataSource=serverName\instance;Initial Catalog=DBName;User
Id=Username;Password=ThePassword
<populateQuery>ap_GetSchedulingItems</populateQuery>
</distributionlist>
Populating Web Parameters
The columns returned by the SQL statement above can be used as dynamic parameter
placeholders. For example, if we return a column named AccountName, we can now use the
parameter placeholder %AccountName%when configuring the report to use. For more
information about parameter placeholders, see the Scheduling page.

7/17/2019 XL Cubed versión 7 UserGuide
http://slidepdf.com/reader/full/xl-cubed-version-7-userguide 343/567
331 | P a g e
XLCubed v7 User Guide – Book IV – Web Edition
Sending a Scheduled Report Using Integration Services
In this tutorial, we will set up a Microsoft Integration Services task, which will trigger one or more
scheduled reports. We will assume a pre-existing Analysis Services Processing Task, and one or
more scheduled reports.
Open your existing Integration Services project in Business Intelligence Development Studio. In the Control Flowtab, open the Toolbox and drag a Web Service Taskinto the window.
Set the task to run after the existing Analysis Services Processing Task as normal:
Right-click the new task, and select the Edit...menu option.
On the Generalpage, configure the Web Service details:
o For the HTTPConnection, select New connection....
o The Server URL should be:
http(s)://yourwebserver/XLCubedWeb/WebServices/SchedulingServer.svc?wsdl
o If necessary, set up the credentials and other properties for access to the website:
When successfully tested, click OK to confirm the connection.
Choose a local file path for the WSDLFileproperty, set the OverwriteWSDLFileproperty to True,
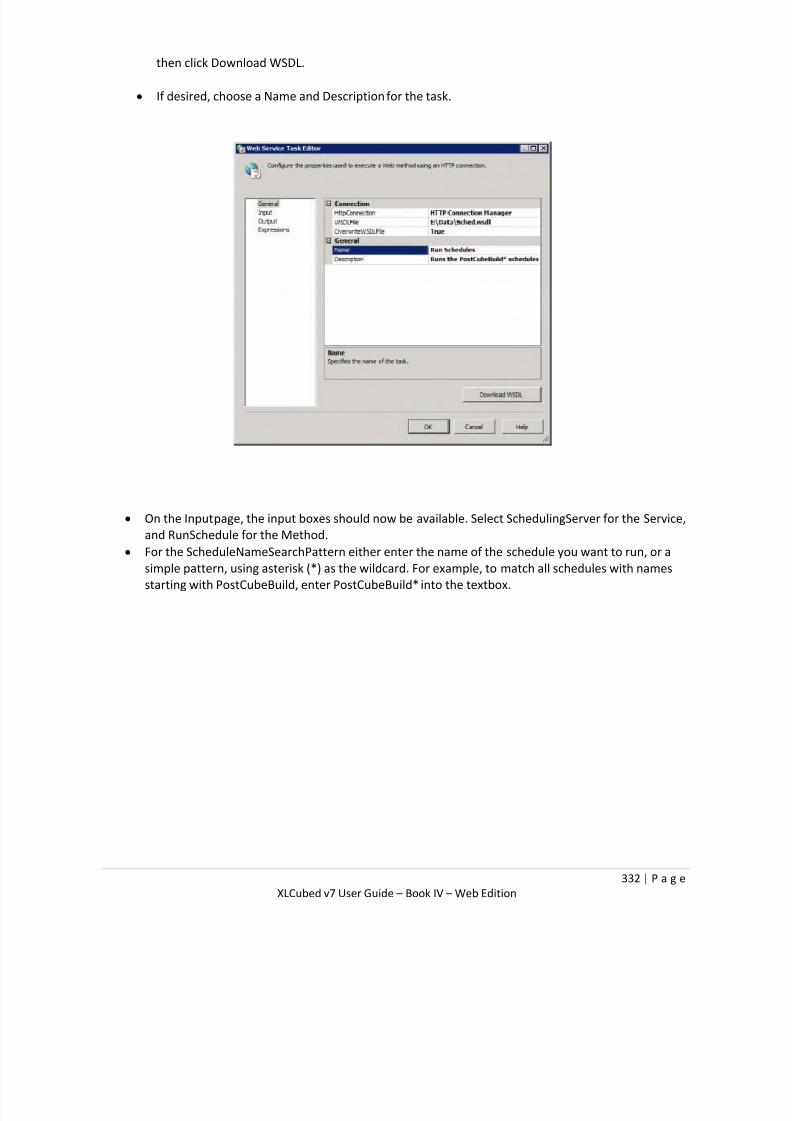
7/17/2019 XL Cubed versión 7 UserGuide
http://slidepdf.com/reader/full/xl-cubed-version-7-userguide 344/567
332 | P a g e
XLCubed v7 User Guide – Book IV – Web Edition
then click Download WSDL.
If desired, choose a Name and Descriptionfor the task.
On the Inputpage, the input boxes should now be available. Select SchedulingServer for the Service,
and RunSchedule for the Method.
For the ScheduleNameSearchPattern either enter the name of the schedule you want to run, or a
simple pattern, using asterisk (*) as the wildcard. For example, to match all schedules with names
starting with PostCubeBuild, enter PostCubeBuild*into the textbox.
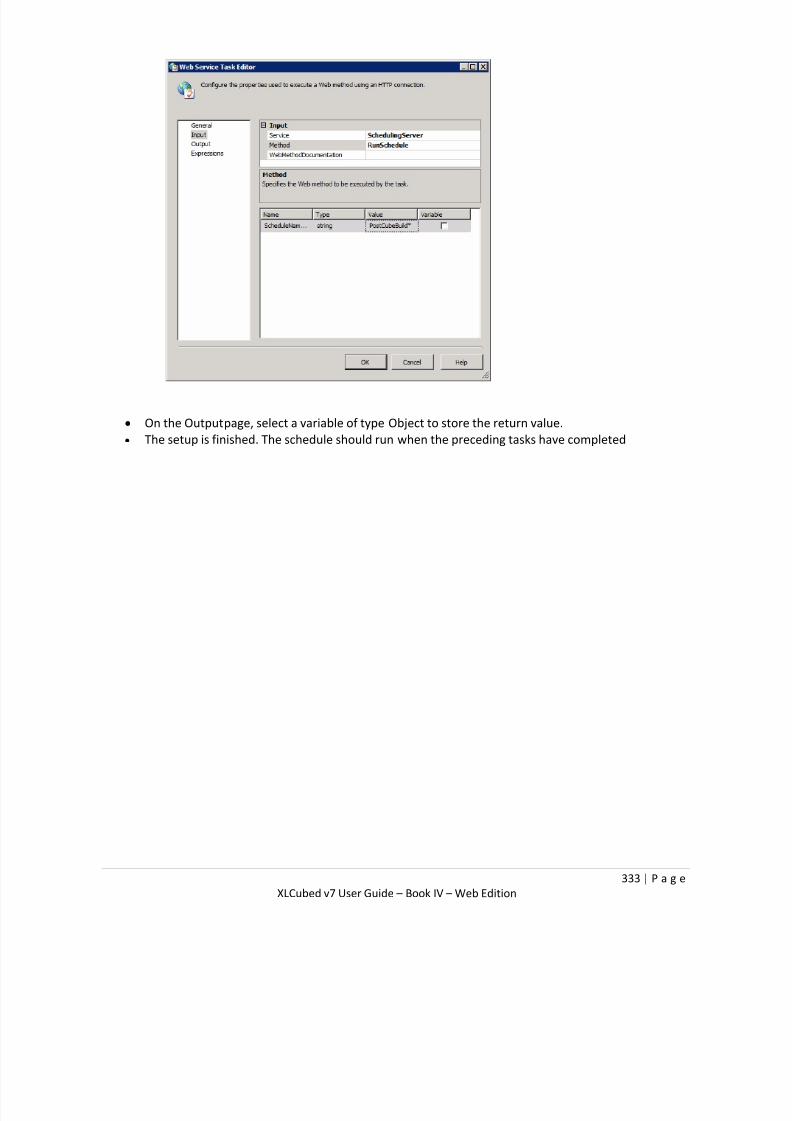
7/17/2019 XL Cubed versión 7 UserGuide
http://slidepdf.com/reader/full/xl-cubed-version-7-userguide 345/567
333 | P a g e
XLCubed v7 User Guide – Book IV – Web Edition
On the Outputpage, select a variable of type Object to store the return value.
The setup is finished. The schedule should run when the preceding tasks have completed
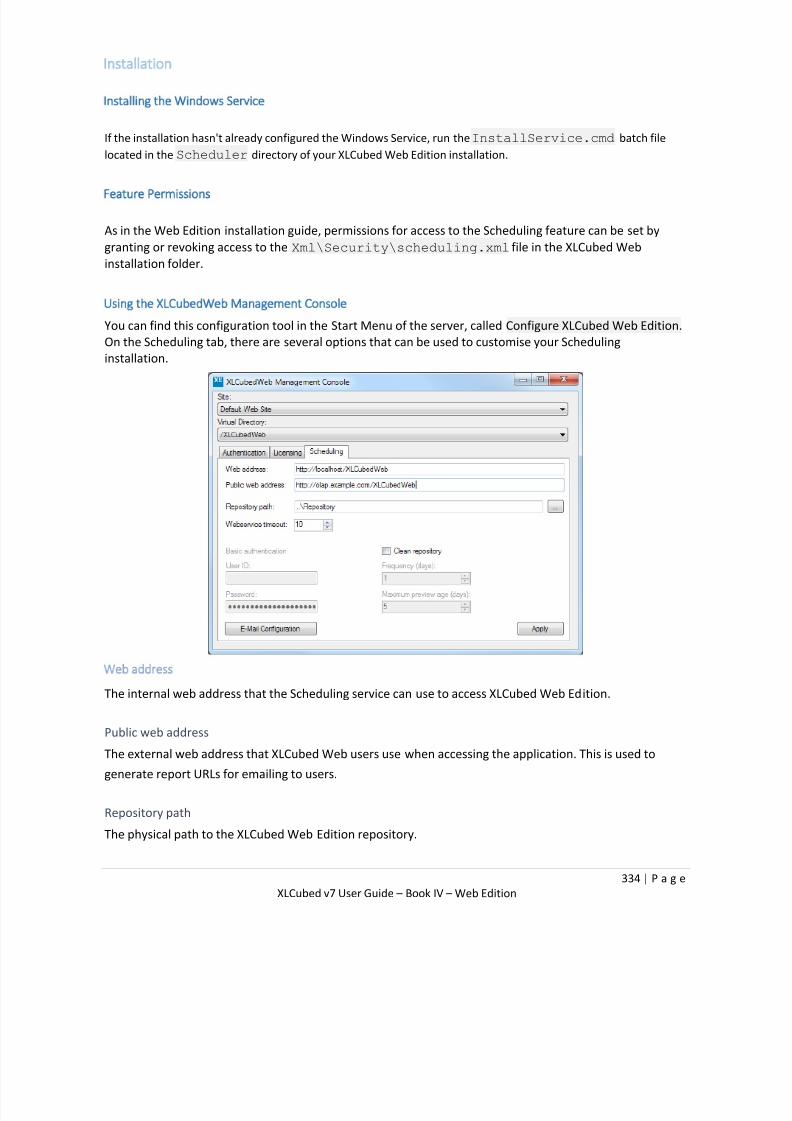
7/17/2019 XL Cubed versión 7 UserGuide
http://slidepdf.com/reader/full/xl-cubed-version-7-userguide 346/567
334 | P a g e
XLCubed v7 User Guide – Book IV – Web Edition
Installation
Installing the Windows Service
If the installation hasn't already configured the Windows Service, run the InstallService.cmd batch file
located in the Scheduler directory of your XLCubed Web Edition installation.
Feature Permissions
As in the Web Edition installation guide, permissions for access to the Scheduling feature can be set by
granting or revoking access to the Xml\Security\scheduling.xml file in the XLCubed Web
installation folder.
Using the XLCubedWeb Management Console
You can find this configuration tool in the Start Menu of the server, called Configure XLCubed Web Edition.On the Scheduling tab, there are several options that can be used to customise your Scheduling
installation.
Web address
The internal web address that the Scheduling service can use to access XLCubed Web Edition.
Public web address
The external web address that XLCubed Web users use when accessing the application. This is used to
generate report URLs for emailing to users.
Repository path
The physical path to the XLCubed Web Edition repository.
7/17/2019 XL Cubed versión 7 UserGuide
http://slidepdf.com/reader/full/xl-cubed-version-7-userguide 347/567
335 | P a g e
XLCubed v7 User Guide – Book IV – Web Edition
Webservice timeout
The length of time the scheduling service should wait before giving up when rendering reports, in minutes.
The default value is 10 minutes.
Basic authentication
The credentials to use to connect to XLCubed Web Edition to render the reports when Basic authentication
is being used.
Clean repository
Automatically remove previews and unused images.
You may need to restart the XLCubed Scheduling Windows service after changing these properties.
Configuration Files
There are two sets of configuration files for the Scheduling Service.
XLCubed.Scheduling.Service.exe.config in the Scheduler directory of your XLCubed
Web Edition installation. This should be automatically populated with the correct values, and will only
need modification if the website or repository are subsequently manually moved, or if the XLCubed
Web Edition server uses a non-default Authentication mode.
The schedules and other configuration files for the Scheduling Service in the XLCubed Web Repository
folder, in the __xlcubed__\__scheduling__ subfolder. It is normal for there to be no files until
schedules or other configuration parameters have been set up.
Authentication Mode
The Scheduling service is set up to use Windows Integrated authentication by default. To use Basic
authentication instead, edit the XLCubed.Scheduling.Service.exe.config file, changing
the AuthenticationType line to Basic and fill in the user name and password below it. (XLCubed Web
Edition v6.5.014 and higher). This account should have permission to access the XLCubed Web Edition
instance, as well as any repository folders required for scheduling.
Using the Role Selector
When configuring schedules and distribution groups, the Scheduling configuration screens can offer a list
of relevant roles available on the server. In order for this to work, Microsoft's Analysis Management
Objects must be installed. This can be found here, included in Microsoft SQL Server 2005 Management
Objects Collection: Feature Pack for Microsoft SQL Server 2005 SP4.
Configuring the Windows Service
The Service Identity
By default, the Scheduling Service runs under the Local System account. This allows it to have access to the
necessary files, webservices and resources it needs to run reports and send emails. However, to use the
Roles feature, a new identity must be chosen that is allowed to use all the roles that will be used. For
simplicity, this can be an OLAP Administrator.
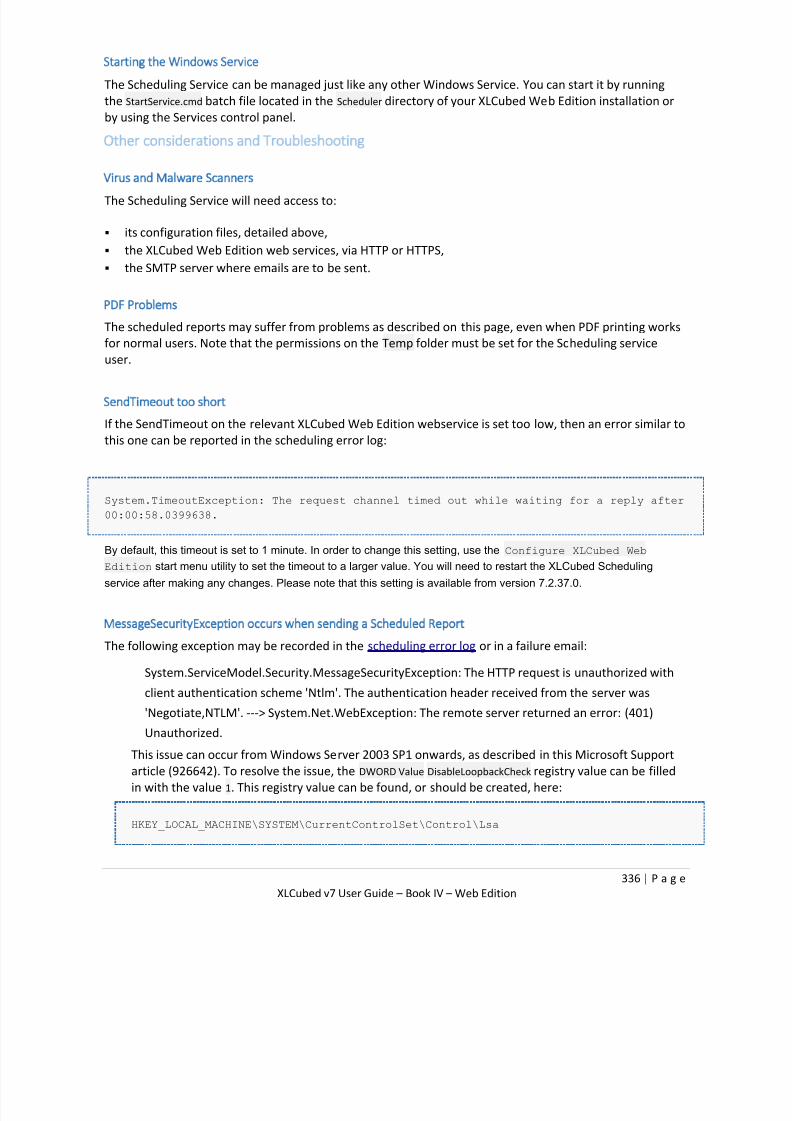
7/17/2019 XL Cubed versión 7 UserGuide
http://slidepdf.com/reader/full/xl-cubed-version-7-userguide 348/567
336 | P a g e
XLCubed v7 User Guide – Book IV – Web Edition
Starting the Windows Service
The Scheduling Service can be managed just like any other Windows Service. You can start it by running
the StartService.cmd batch file located in the Scheduler directory of your XLCubed Web Edition installation or
by using the Services control panel.
Other considerations and Troubleshooting
Virus and Malware Scanners
The Scheduling Service will need access to:
its configuration files, detailed above,
the XLCubed Web Edition web services, via HTTP or HTTPS,
the SMTP server where emails are to be sent.
PDF Problems
The scheduled reports may suffer from problems as described on this page, even when PDF printing worksfor normal users. Note that the permissions on the Temp folder must be set for the Scheduling service
user.
SendTimeout too short
If the SendTimeout on the relevant XLCubed Web Edition webservice is set too low, then an error similar to
this one can be reported in the scheduling error log:
System.TimeoutException: The request channel timed out while waiting for a reply after00:00:58.0399638.
By default, this timeout is set to 1 minute. In order to change this setting, use the Configure XLCubed WebEdition start menu utility to set the timeout to a larger value. You will need to restart the XLCubed Scheduling
service after making any changes. Please note that this setting is available from version 7.2.37.0.
MessageSecurityException occurs when sending a Scheduled Report
The following exception may be recorded in the scheduling error log or in a failure email:
System.ServiceModel.Security.MessageSecurityException: The HTTP request is unauthorized with
client authentication scheme 'Ntlm'. The authentication header received from the server was
'Negotiate,NTLM'. ---> System.Net.WebException: The remote server returned an error: (401)
Unauthorized.
This issue can occur from Windows Server 2003 SP1 onwards, as described in this Microsoft Support
article (926642). To resolve the issue, the DWORD Value DisableLoopbackCheck registry value can be filled
in with the value 1. This registry value can be found, or should be created, here:
HKEY_LOCAL_MACHINE\SYSTEM\CurrentControlSet\Control\Lsa

7/17/2019 XL Cubed versión 7 UserGuide
http://slidepdf.com/reader/full/xl-cubed-version-7-userguide 349/567
337 | P a g e
XLCubed v7 User Guide – Book IV – Web Edition
You may also need to follow the instructions found in this Microsoft Support article (281308) to
disable strict name checking.
Alternatively, this exception may be recorded:
System.ServiceModel.Security.MessageSecurityException: The HTTP request is unauthorized with
client authentication scheme 'Ntlm'. The authentication header received from the server was
'Basic realm="localhost"'. ---> System.Net.WebException: The remote server returned an error:
(401) Unauthorized.
This issue may occur if the XLCubedWeb server and the Scheduling service are configured to use different
authentication schemes.

7/17/2019 XL Cubed versión 7 UserGuide
http://slidepdf.com/reader/full/xl-cubed-version-7-userguide 350/567
338 | P a g e
XLCubed v7 User Guide – Book V – Dimension Slicers
Book V - Dimension Slicers
Dimension slicers simplify the process of creating cube dynamic drop downs. Five display options are
provided:
From left to right and top to bottom we have Treeview, Combo Box, Buttons, List Box and lastly Member
Selector slicer (this allows efficient access to more advanced functionality, for example, searching).
Grid Slicers
To add a slicer to a grid, right-click on the relevant dimension member, and choose XLCubed and then
Add Slicer . Note that grid slicers can be positioned where required, and are not restricted to the grid
area.
The default will be an in-cell treeview with the last active member selected. Once inserted, right click on
the slicer and choose Edit for configuration and design options. Choose the required slicer display type,
and then, using the member selector on the right, choose the set of members to enable selection from.
These can be either static lists of members, or dynamic selections such as children, descendants at level,
Level x or even ranked lists etc.
Note that the slicer content can also be driven from an Excel cell (e.g. Children of E11). A slicer which has
been added to an individual grid can be used as the selection mechanism for multiple grids through the
Grid Links Dialog. It can also update a specified range with the uniquename of the member chosen, which
could for example be used as the argument for XL3Lookup formulae.
Standalone Slicers
A standalone slicer can also be added using the slicer button on the Ribbon. Here the required hierarchy is
chosen from the list of available hierarchies, and dragged into the Slicer Hierarchy control. From that point
the setup is the same as with Grid Slicers.

7/17/2019 XL Cubed versión 7 UserGuide
http://slidepdf.com/reader/full/xl-cubed-version-7-userguide 351/567
339 | P a g e
XLCubed v7 User Guide – Book V – Dimension Slicers
Standalone slicers will need to be manually linked into grids as required. This is done by selecting the slicer
in the member selector form:
Alternatively you could use them to drive other XLCubed or Excel formulae and then other
reports/query tables.

7/17/2019 XL Cubed versión 7 UserGuide
http://slidepdf.com/reader/full/xl-cubed-version-7-userguide 352/567
340 | P a g e
XLCubed v7 User Guide – Book V – Dimension Slicers
Member Selector Slicer
The Member Selector slicer is a space efficient control which gives full access to the member selector and
search functionality. From the Slicer tab on the XLCubed ribbon:
Insert a hierarchy slicer, choose your hierarchy and select the slicer type as highlighted below:
Click OK to return to your workbook and you will see the slicer similar to:
Click on the ellipsis and the Member Selector will be displayed, allowing you to run some of the Advanced
Member functionality such as searching.
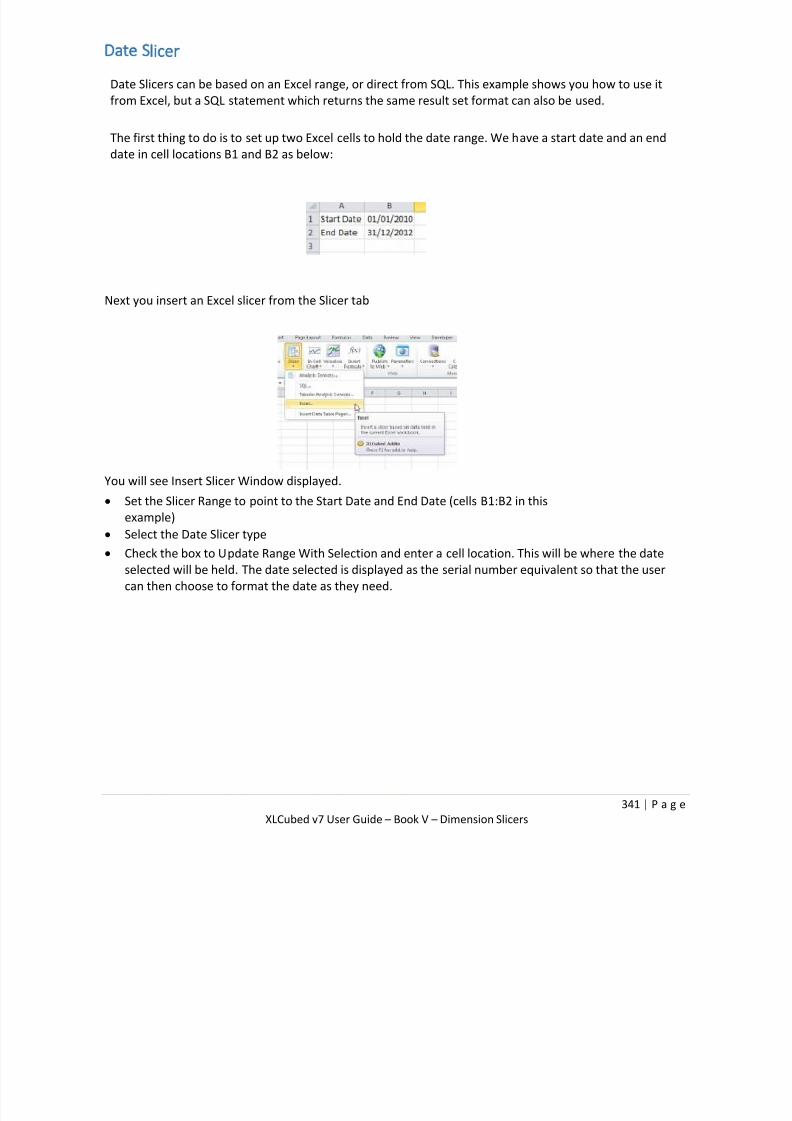
7/17/2019 XL Cubed versión 7 UserGuide
http://slidepdf.com/reader/full/xl-cubed-version-7-userguide 353/567
341 | P a g e
XLCubed v7 User Guide – Book V – Dimension Slicers
Date Slicer
Date Slicers can be based on an Excel range, or direct from SQL. This example shows you how to use it
from Excel, but a SQL statement which returns the same result set format can also be used.
The first thing to do is to set up two Excel cells to hold the date range. We have a start date and an end
date in cell locations B1 and B2 as below:
Next you insert an Excel slicer from the Slicer tab
You will see Insert Slicer Window displayed.
Set the Slicer Range to point to the Start Date and End Date (cells B1:B2 in thisexample)
Select the Date Slicer type
Check the box to Update Range With Selection and enter a cell location. This will be where the date
selected will be held. The date selected is displayed as the serial number equivalent so that the user
can then choose to format the date as they need.

7/17/2019 XL Cubed versión 7 UserGuide
http://slidepdf.com/reader/full/xl-cubed-version-7-userguide 354/567
342 | P a g e
XLCubed v7 User Guide – Book V – Dimension Slicers
Click OK to exit
Click the drop-down on the slicer and XLCubed will display a calendar control which can be
navigated between the specified start and end dates.
Click a date to select it and it will be written as the Excel serial number equivalent to the cell location
defined in Update Range With Selection.
You can then choose to format this by using the Excel TEXT function eg =TEXT(E1,"dd-mm-yyyy").
You can also include a third cell in your Slicer Range as Selection Type eg Day, Month or Year. Valid
selections are D, M or Y. Day is taken to be the default selection type and is the default display mode if no
selection type if specified.
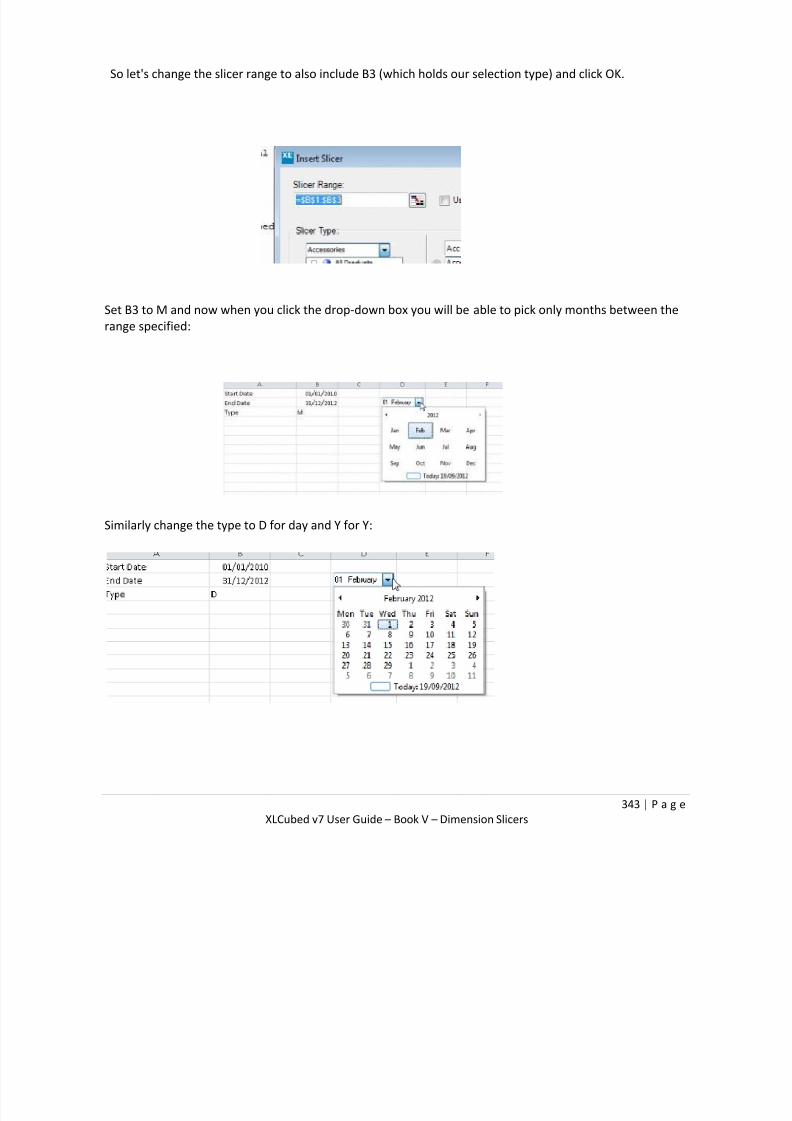
7/17/2019 XL Cubed versión 7 UserGuide
http://slidepdf.com/reader/full/xl-cubed-version-7-userguide 355/567
343 | P a g e
XLCubed v7 User Guide – Book V – Dimension Slicers
So let's change the slicer range to also include B3 (which holds our selection type) and click OK.
Set B3 to M and now when you click the drop-down box you will be able to pick only months between the
range specified:
Similarly change the type to D for day and Y for Y:

7/17/2019 XL Cubed versión 7 UserGuide
http://slidepdf.com/reader/full/xl-cubed-version-7-userguide 356/567
344 | P a g e
XLCubed v7 User Guide – Book V – Dimension Slicers

7/17/2019 XL Cubed versión 7 UserGuide
http://slidepdf.com/reader/full/xl-cubed-version-7-userguide 357/567
345 | P a g e
XLCubed v7 User Guide – Book V – Dimension Slicers
Updating Excel Ranges
You can set up a slicer to output the selected item(s) to an Excel range which can then be used to drive
formula reports. If you have multi-select turned on then you should select a range instead of a single cell.
One selected item will be put into each output cell.
You can then use the XL3Member formula to reference the output range, and run XL3Lookup formulae
off of this. Setting two or more slicers to output to the same range will keep the slicers "in-sync" with
each other, so updating one of the slicers will also update the others.
Excel Range Slicers
In the scenario where a Slicer needs to be used to allow the selection of an item from a range of cells,
then have the corresponding selection passed to another report as a parameter, Excel range driven
slicers can be useful.
The screenshot below shows a selection list containing two continents and some of their children, each
with a corresponding region code. When the user selects a region, its corresponding region code shouldbe displayed.
This can be done through an XLCubed slicer. Create a slicer as follows:
Select the XLCubed > Slicer > Excel ribbon item.
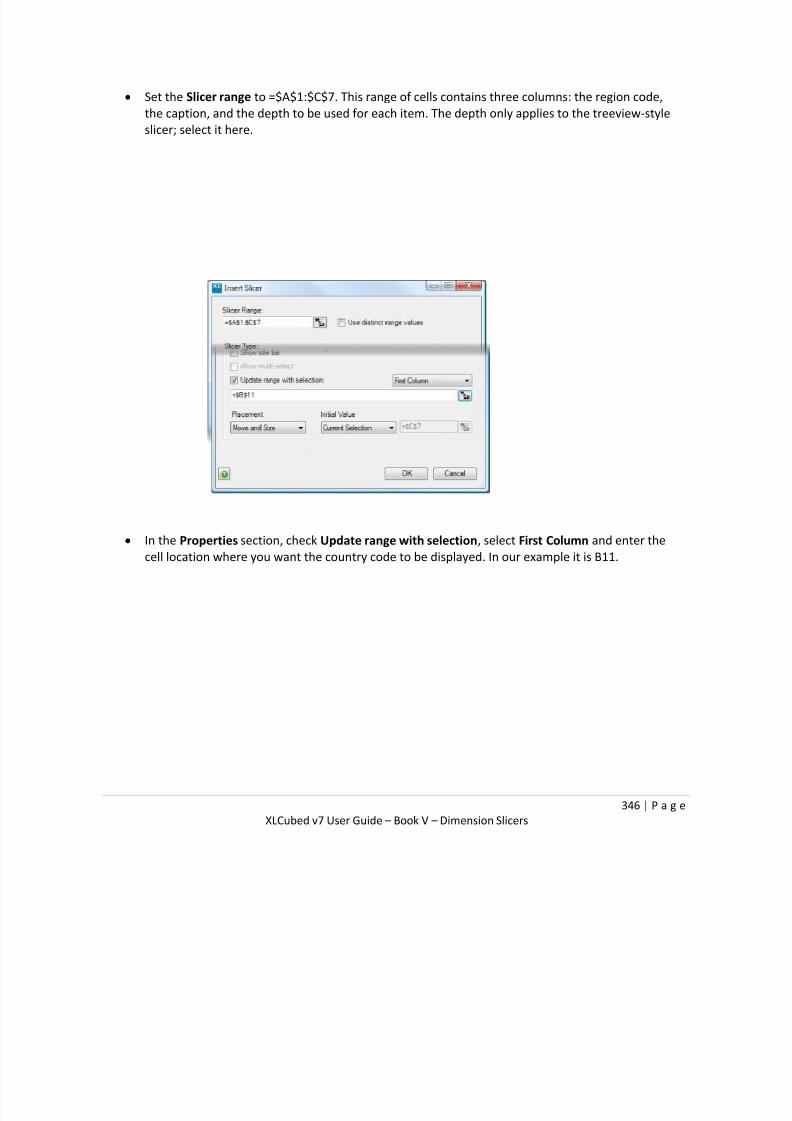
7/17/2019 XL Cubed versión 7 UserGuide
http://slidepdf.com/reader/full/xl-cubed-version-7-userguide 358/567
346 | P a g e
XLCubed v7 User Guide – Book V – Dimension Slicers
Set the Slicer range to =$A$1:$C$7. This range of cells contains three columns: the region code,
the caption, and the depth to be used for each item. The depth only applies to the treeview-style
slicer; select it here.
In the Properties section, check Update range with selection, select First Column and enter the
cell location where you want the country code to be displayed. In our example it is B11.
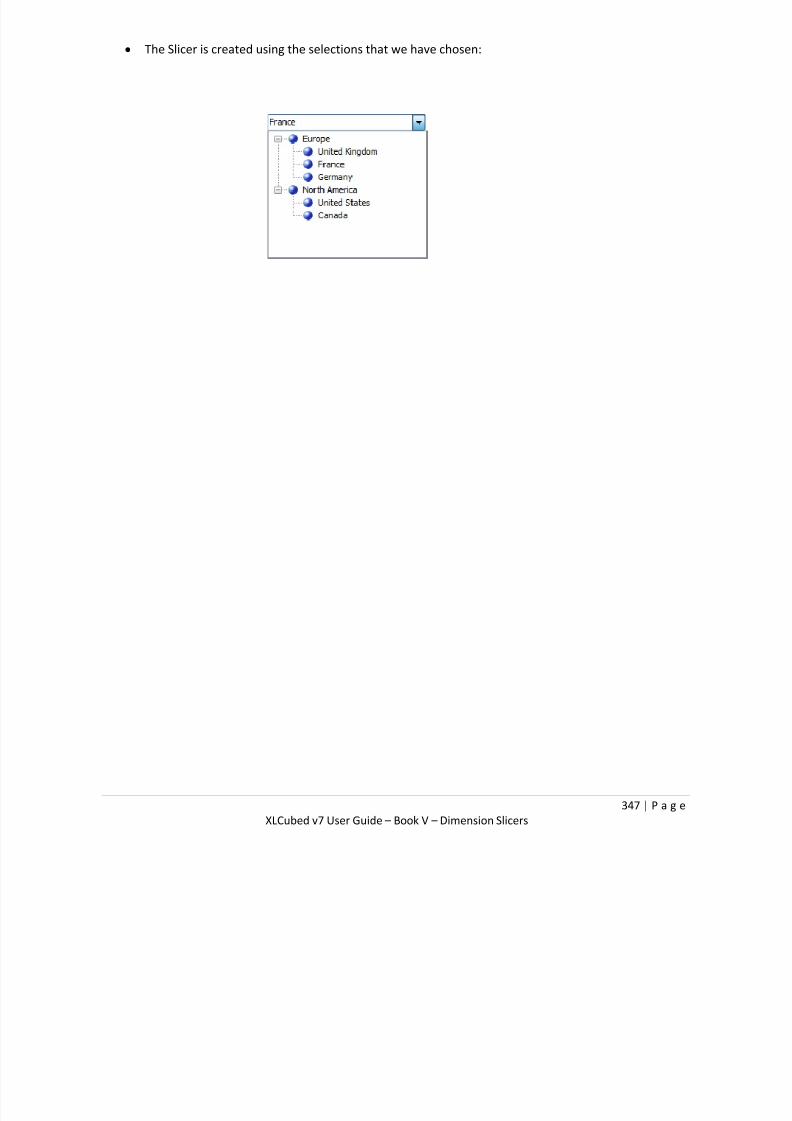
7/17/2019 XL Cubed versión 7 UserGuide
http://slidepdf.com/reader/full/xl-cubed-version-7-userguide 359/567
347 | P a g e
XLCubed v7 User Guide – Book V – Dimension Slicers
The Slicer is created using the selections that we have chosen:
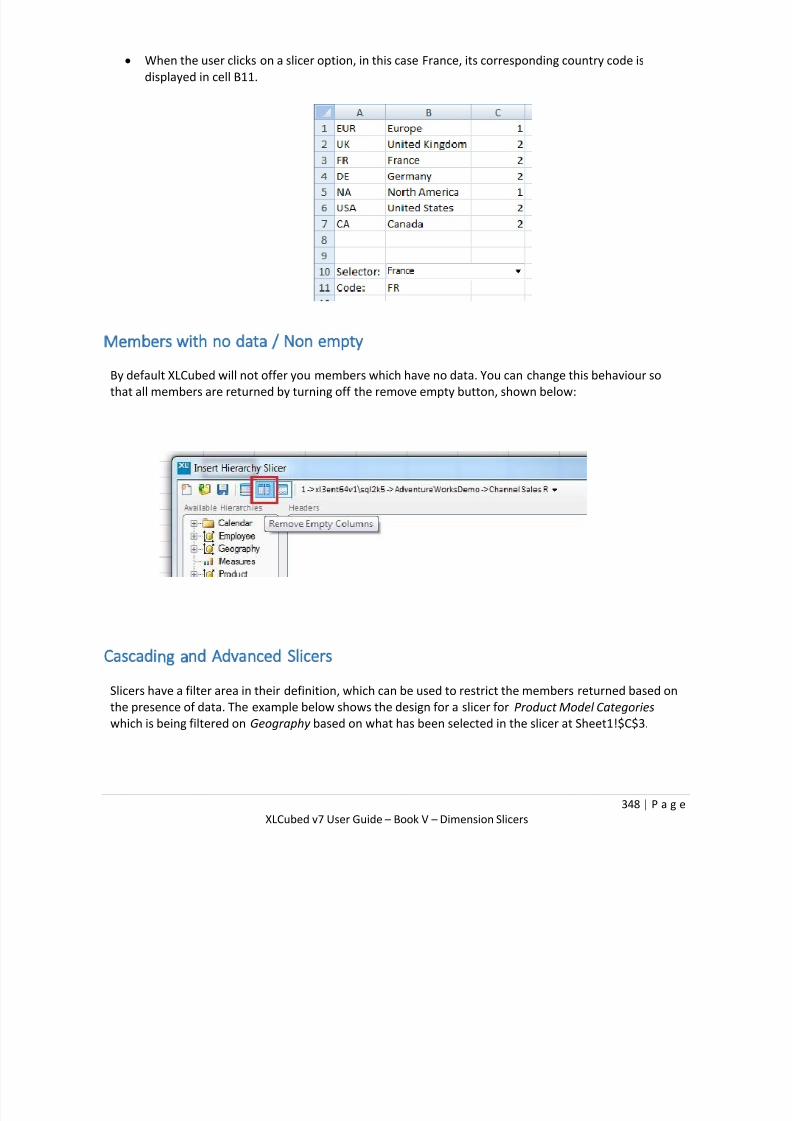
7/17/2019 XL Cubed versión 7 UserGuide
http://slidepdf.com/reader/full/xl-cubed-version-7-userguide 360/567
348 | P a g e
XLCubed v7 User Guide – Book V – Dimension Slicers
When the user clicks on a slicer option, in this case France, its corresponding country code is
displayed in cell B11.
Members with no data / Non empty
By default XLCubed will not offer you members which have no data. You can change this behaviour so
that all members are returned by turning off the remove empty button, shown below:
Cascading and Advanced Slicers
Slicers have a filter area in their definition, which can be used to restrict the members returned based on
the presence of data. The example below shows the design for a slicer for Product Model Categories
which is being filtered on Geography based on what has been selected in the slicer at Sheet1!$C$3.

7/17/2019 XL Cubed versión 7 UserGuide
http://slidepdf.com/reader/full/xl-cubed-version-7-userguide 361/567
349 | P a g e
XLCubed v7 User Guide – Book V – Dimension Slicers
In this example, the selections made by the user in the Geography slicer will cascade into the available
selections within this Product Model Categories slicer, and create an intelligent linked and data-dynamic
set of available report selections for the user.
Cascading slicers can also be configured within one hierarchy, where a user choice made at a higher
level restricts the secondary slicer selections to children of or descendants at level x . This is shown inthe example below for the Geography hierarchy.

7/17/2019 XL Cubed versión 7 UserGuide
http://slidepdf.com/reader/full/xl-cubed-version-7-userguide 362/567
350 | P a g e
XLCubed v7 User Guide – Book V – Dimension Slicers
In this case the cascade is achieved by selecting the initial (country Level) slicer within the Geography
hierarchy, and then choosing Descendants at City .
Slicers can also be defined as a dynamic filter or ranking. To achieve this, the slicer content is defined as
an advanced selection, and the ranking, filter or sort is defined here, as shown below.
In this case the Product Model Categories filter content is restricted by Geography in the filter area, which
is in turn based on another slicer selection. The members to display are then defined in the advanced
dialog as the lowest level members where sales are over 400 units and sorted descending.

7/17/2019 XL Cubed versión 7 UserGuide
http://slidepdf.com/reader/full/xl-cubed-version-7-userguide 363/567
351 | P a g e
XLCubed v7 User Guide – Book V – Dimension Slicers
Initial Value
When you create an XLCubed slicer under the Settings tab, you are now able to include an initial value
which can be any of the following:
• Current Selection: sets the value of the slicer as when the report was published
• First Selection: sets the value of the slicer to be the first in the list of possible selections
• Last Selection: sets the value of the slicer to be the last in the list of possible selections
• Default Member: sets the value of the slicer to be the default member - usually the All member
• Range: sets the value of the slicer to be whatever the cell value is in the range location defined
Version 7.5 allows multiple source cells for multi-select slicers and also includes a new option for when to
apply the initial selection, these are:
• Selection becomes invalid: the default for new slicers, when the current member selection
becomes invalid then the initial selection will be applied
• Report Opens: the default for existing pre-V7.5 slicers, the initial selection is only applied

7/17/2019 XL Cubed versión 7 UserGuide
http://slidepdf.com/reader/full/xl-cubed-version-7-userguide 364/567
352 | P a g e
XLCubed v7 User Guide – Book V – Dimension Slicers
when the report first opens
• Available items change: the initial selection will be applied if the available members changes
(even if the current selection is in the new list of slicers)
Disabling Slicers
If you show the title bar, you can optionally add a disable button to the slicer.
Clicking this will toggle whether or not the slicer filters objects it is linked to. This means a slicer can
easily be turned off to return all results. If the slicer is outputs to a range then that range will be cleared.
Wait for Submit on Web
With XLCubed Version 7.5 there is a new option for "Wait for Submit on Web".
This allows several slicers to be changed and rather than the report refreshing for each change it will wait
for the user to submit the selection either by click the Submit toolbar button or by using a "Submit"
XL3Link or Pictures Links.
This also removes the individual "Submit" button from multi-select slicers.
Use query restrictions for children (new in v7.6)
For tree slicers, the default behaviour is to show all children when expanding a member. By checking this
option you can restrict the children using the same query used for the initial member list.
This is most useful when restricting the tree to show only members with data, as the non-empty will be
applied to the children as the tree is expanded.

7/17/2019 XL Cubed versión 7 UserGuide
http://slidepdf.com/reader/full/xl-cubed-version-7-userguide 365/567
353 | P a g e
XLCubed v7 User Guide – Book VI – Ranking, Sorting and Filtering
Book VI - Ranking, Sorting and Filtering
XLCubed provides two modes of Ranking: Hierarchy Ranking and Axis Ranking.
Hierarchy mode is accessed through the Advanced tab on the member selector for the relevant hierarchy.
The following tutorial shows how to use Hierarchy Ranking to filter, sort and rank using different members
of a Cube. It uses the Internet Sales cube.
Axis Mode is a different approach to Ranking, Filtering and Sorting, and can be thought of as result set
ranking.
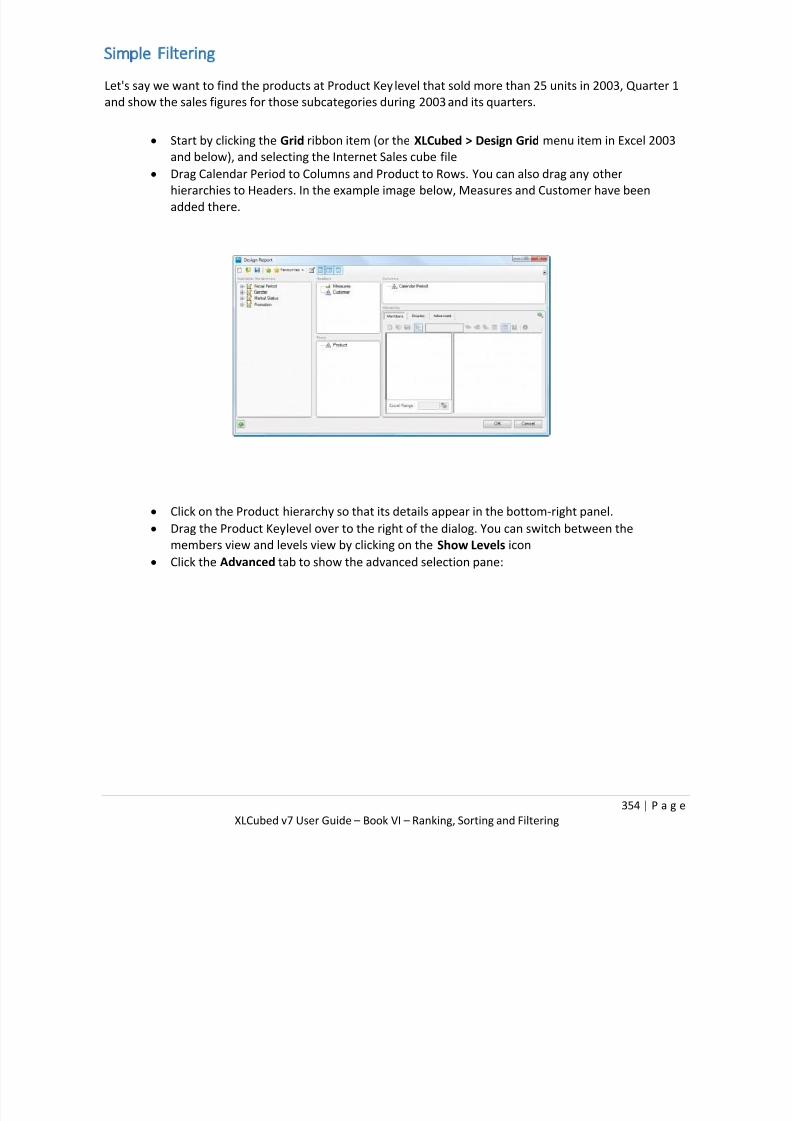
7/17/2019 XL Cubed versión 7 UserGuide
http://slidepdf.com/reader/full/xl-cubed-version-7-userguide 366/567
354 | P a g e
XLCubed v7 User Guide – Book VI – Ranking, Sorting and Filtering
Simple Filtering
Let's say we want to find the products at Product Keylevel that sold more than 25 units in 2003, Quarter 1
and show the sales figures for those subcategories during 2003and its quarters.
Start by clicking the Grid ribbon item (or the XLCubed > Design Grid menu item in Excel 2003
and below), and selecting the Internet Sales cube file
Drag Calendar Period to Columns and Product to Rows. You can also drag any other
hierarchies to Headers. In the example image below, Measures and Customer have been
added there.
Click on the Product hierarchy so that its details appear in the bottom-right panel.
Drag the Product Keylevel over to the right of the dialog. You can switch between the
members view and levels view by clicking on the Show Levels icon
Click the Advanced tab to show the advanced selection pane:

7/17/2019 XL Cubed versión 7 UserGuide
http://slidepdf.com/reader/full/xl-cubed-version-7-userguide 367/567
355 | P a g e
XLCubed v7 User Guide – Book VI – Ranking, Sorting and Filtering
Click the Members dropdown and choose Filter result:
Click the Calendar Period edit control in the grid to change its selection to the desired
member (2003, Quarter 1):

7/17/2019 XL Cubed versión 7 UserGuide
http://slidepdf.com/reader/full/xl-cubed-version-7-userguide 368/567
356 | P a g e
XLCubed v7 User Guide – Book VI – Ranking, Sorting and Filtering
Select the This measure radio button, and select Order Quantity as the desired measure.
Change the Operation to >, and type 25 in the edit field on the right:
Click OK. The new filter is displayed in the advanced selections tab:
Click OK again to run the Report – the Grid shows the members that fit our criteria:

7/17/2019 XL Cubed versión 7 UserGuide
http://slidepdf.com/reader/full/xl-cubed-version-7-userguide 369/567
357 | P a g e
XLCubed v7 User Guide – Book VI – Ranking, Sorting and Filtering
Sorting on a different dimension
Now let's sort the report in descending order of the Q1 sales:
Display the Hierarchy Editor for the Product hierarchy by double-clicking on the Productlabel in
the Grid If it’s not already visible select the Advanced tab
Click the Sort result toolbar button
Change the Calendar Periodselection to 2003, Quarter 1:
Click the Sort Descending (9-1) radio button
Click OK. The new sort is displayed in the advanced selections tab
Click OK again to run the Report
(As of version 7.2 you can set the sort direction to a range. In this case desc or descending
will set the sort to descending, otherwise it will be ascending.
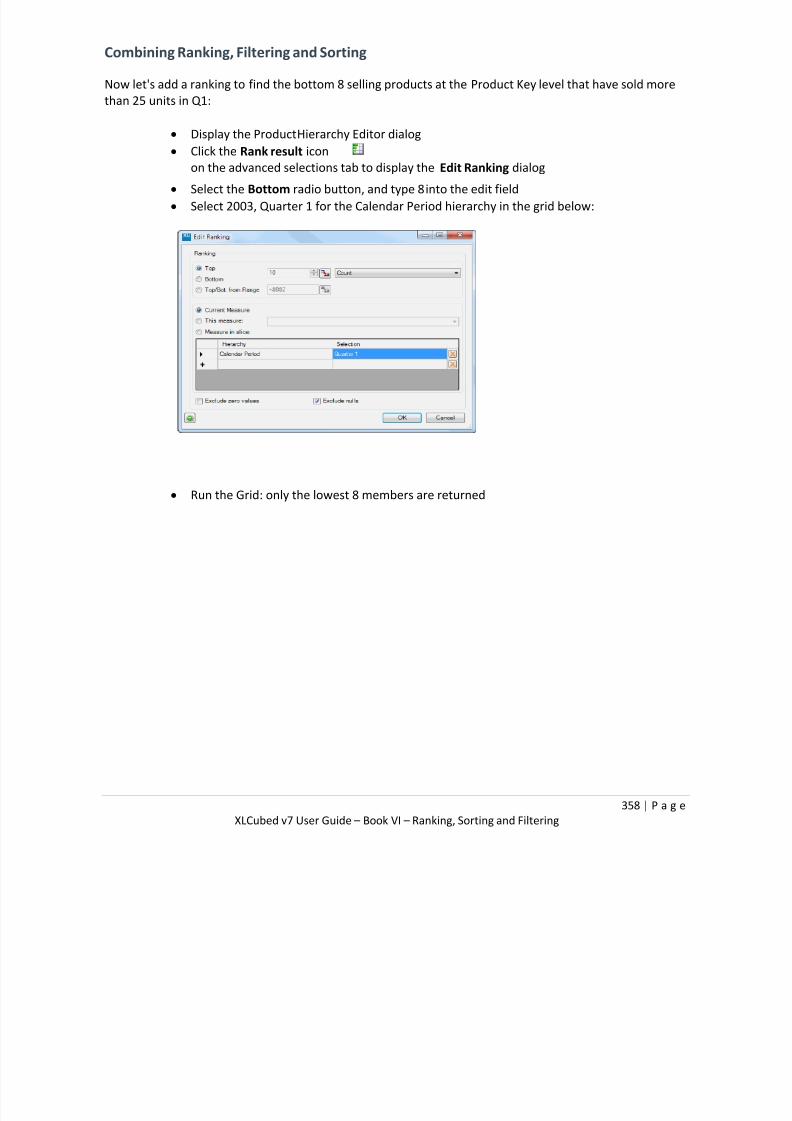
7/17/2019 XL Cubed versión 7 UserGuide
http://slidepdf.com/reader/full/xl-cubed-version-7-userguide 370/567
358 | P a g e
XLCubed v7 User Guide – Book VI – Ranking, Sorting and Filtering
Combining Ranking, Filtering and Sorting
Now let's add a ranking to find the bottom 8 selling products at the Product Keylevel that have sold more
than 25 units in Q1:
Display the ProductHierarchy Editor dialog
Click the Rank result icon
on the advanced selections tab to display the Edit Ranking dialog
Select the Bottom radio button, and type 8into the edit field
Select 2003, Quarter 1 for the Calendar Period hierarchy in the grid below:
Run the Grid: only the lowest 8 members are returned
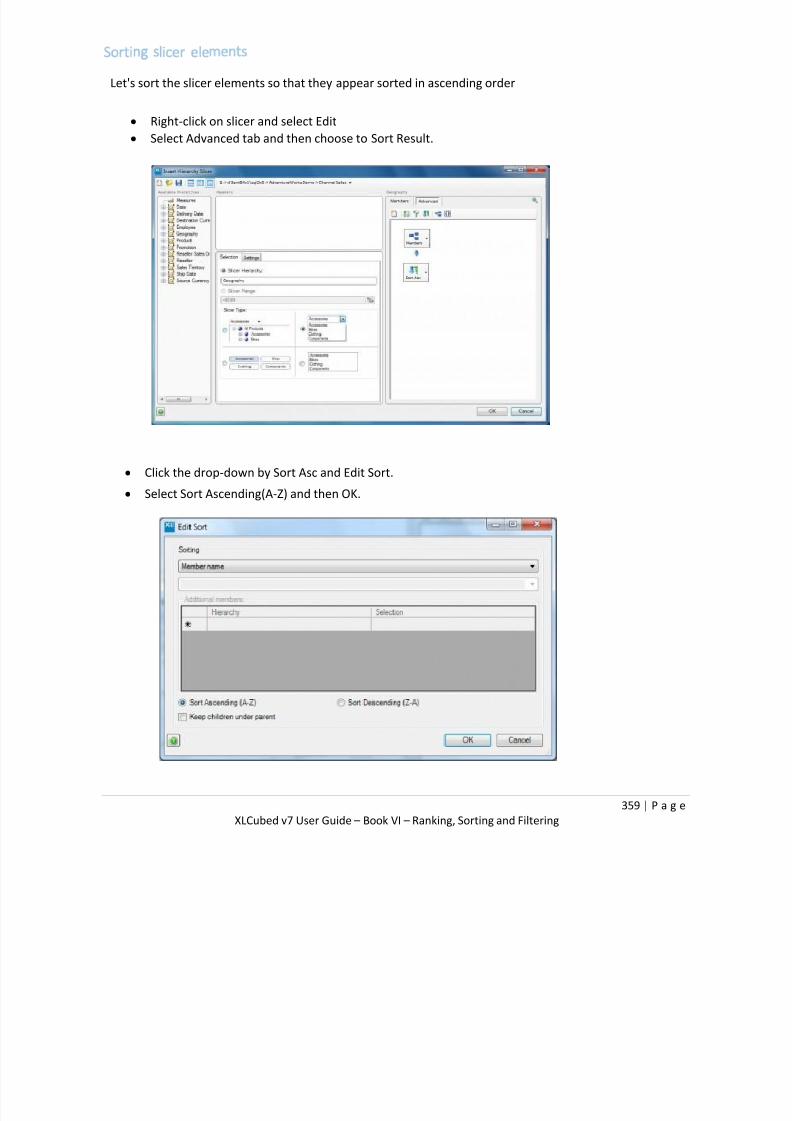
7/17/2019 XL Cubed versión 7 UserGuide
http://slidepdf.com/reader/full/xl-cubed-version-7-userguide 371/567
359 | P a g e
XLCubed v7 User Guide – Book VI – Ranking, Sorting and Filtering
Sorting slicer elements
Let's sort the slicer elements so that they appear sorted in ascending order
Right-click on slicer and select Edit
Select Advanced tab and then choose to Sort Result.
Click the drop-down by Sort Asc and Edit Sort.
Select Sort Ascending(A-Z) and then OK.

7/17/2019 XL Cubed versión 7 UserGuide
http://slidepdf.com/reader/full/xl-cubed-version-7-userguide 372/567
360 | P a g e
XLCubed v7 User Guide – Book VI – Ranking, Sorting and Filtering
Sorting by sub-category within category
The grid report below is based on the Bicycle Sales cube and it shows a measure called value in 2002
against the three bicycle product groups: Allround, Mountain and Road.
We then include the sub-category into the report and you can see the bicycle models appearing
as a list beneath the bicycle product groups.

7/17/2019 XL Cubed versión 7 UserGuide
http://slidepdf.com/reader/full/xl-cubed-version-7-userguide 373/567
361 | P a g e
XLCubed v7 User Guide – Book VI – Ranking, Sorting and Filtering
We would like to sort the grid members so that the categories, Allround, Mountain and Road are
sorted by the current measure (value). We also want the sub-categories of bicycle models to be
sorted on the same measure within that first sort.
This is achieved by editing the member selector and making sure all members to be reported are
included.
Click on Advanced and select Sort or click drop-down on Member button and select Sort
Result.
In the following window you need to choose whether you are sorting the measure in ascending or
descending order. It is also important to check the Keep children under parent box. Click OK twice
to save changes.

7/17/2019 XL Cubed versión 7 UserGuide
http://slidepdf.com/reader/full/xl-cubed-version-7-userguide 374/567
362 | P a g e
XLCubed v7 User Guide – Book VI – Ranking, Sorting and Filtering
• You will see the grid has refreshed and sorted in ascending order of value of sales of the category as
well as value of sales of the sub-category.
Allround sales are the lowest, followed by Road and then Mountain with highest. Within each of these
categories, the individual model sales are ranked in ascending order showing that, for example, within the
Allround category, Scenario W7000 has the lowest sales, whilst Scenario W6000 has the highest sales.
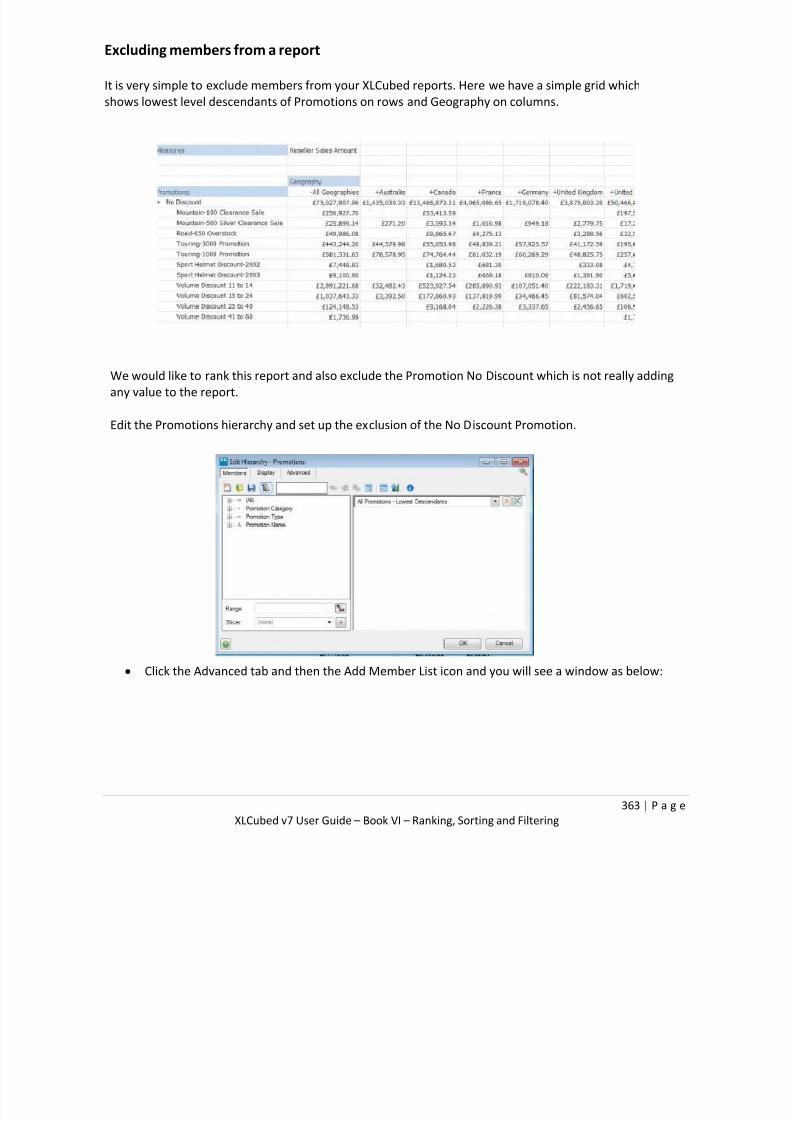
7/17/2019 XL Cubed versión 7 UserGuide
http://slidepdf.com/reader/full/xl-cubed-version-7-userguide 375/567
363 | P a g e
XLCubed v7 User Guide – Book VI – Ranking, Sorting and Filtering
Excluding members from a report
It is very simple to exclude members from your XLCubed reports. Here we have a simple grid which
shows lowest level descendants of Promotions on rows and Geography on columns.
We would like to rank this report and also exclude the Promotion No Discount which is not really adding
any value to the report.
Edit the Promotions hierarchy and set up the exclusion of the No Discount Promotion.
Click the Advanced tab and then the Add Member List icon and you will see a window as below:
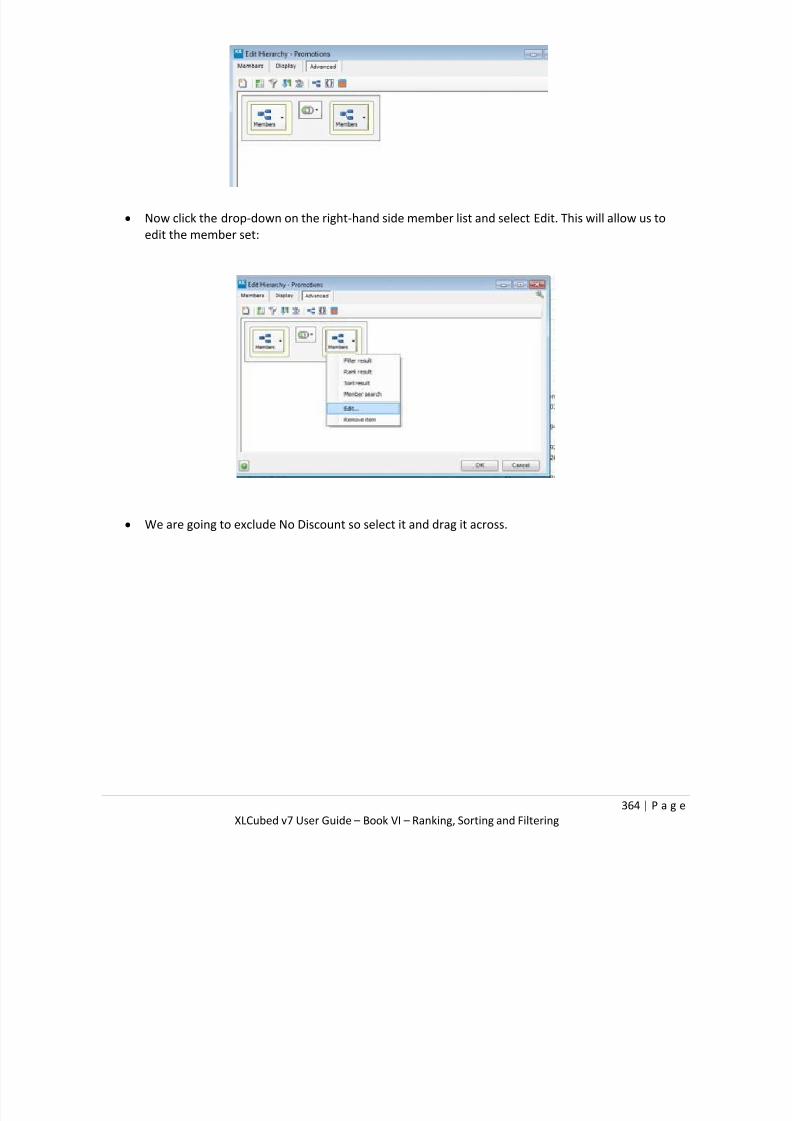
7/17/2019 XL Cubed versión 7 UserGuide
http://slidepdf.com/reader/full/xl-cubed-version-7-userguide 376/567
364 | P a g e
XLCubed v7 User Guide – Book VI – Ranking, Sorting and Filtering
Now click the drop-down on the right-hand side member list and select Edit. This will allow us to
edit the member set:
We are going to exclude No Discount so select it and drag it across.
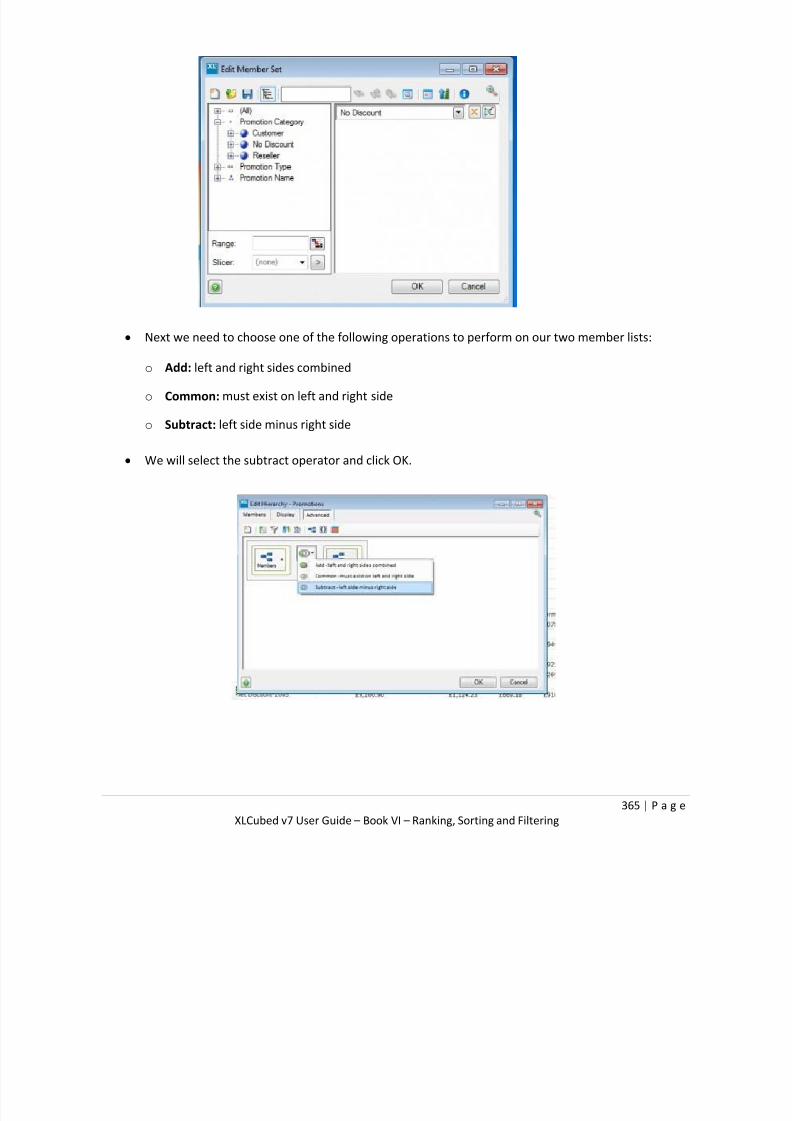
7/17/2019 XL Cubed versión 7 UserGuide
http://slidepdf.com/reader/full/xl-cubed-version-7-userguide 377/567
365 | P a g e
XLCubed v7 User Guide – Book VI – Ranking, Sorting and Filtering
Next we need to choose one of the following operations to perform on our two member lists:
o Add: left and right sides combined
o Common: must exist on left and right side
o Subtract: left side minus right side
We will select the subtract operator and click OK.

7/17/2019 XL Cubed versión 7 UserGuide
http://slidepdf.com/reader/full/xl-cubed-version-7-userguide 378/567
366 | P a g e
XLCubed v7 User Guide – Book VI – Ranking, Sorting and Filtering
Let's rank these Promotions based on the current measure, Reseller Sales Amount:
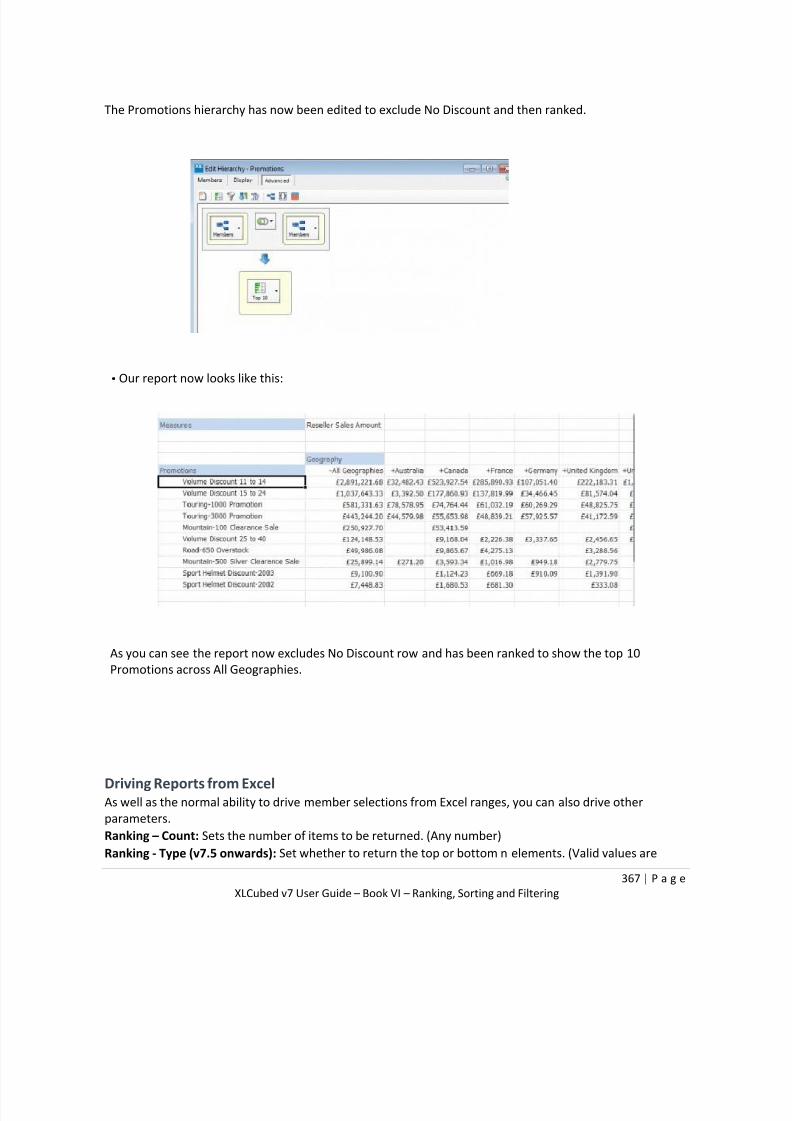
7/17/2019 XL Cubed versión 7 UserGuide
http://slidepdf.com/reader/full/xl-cubed-version-7-userguide 379/567
367 | P a g e
XLCubed v7 User Guide – Book VI – Ranking, Sorting and Filtering
The Promotions hierarchy has now been edited to exclude No Discount and then ranked.
• Our report now looks like this:
As you can see the report now excludes No Discount row and has been ranked to show the top 10
Promotions across All Geographies.
Driving Reports from Excel As well as the normal ability to drive member selections from Excel ranges, you can also drive other
parameters.
Ranking – Count: Sets the number of items to be returned. (Any number)
Ranking - Type (v7.5 onwards): Set whether to return the top or bottom n elements. (Valid values are

7/17/2019 XL Cubed versión 7 UserGuide
http://slidepdf.com/reader/full/xl-cubed-version-7-userguide 380/567
368 | P a g e
XLCubed v7 User Guide – Book VI – Ranking, Sorting and Filtering
top or bottom)
Filter – Operator: How to compare the measure when filtering. (Valid values are >, >=, <, <=, =, <>)
Sorting – Direction: Allows you to reverse the order as required. (Valid values are asc, ascending, desc,
descending)
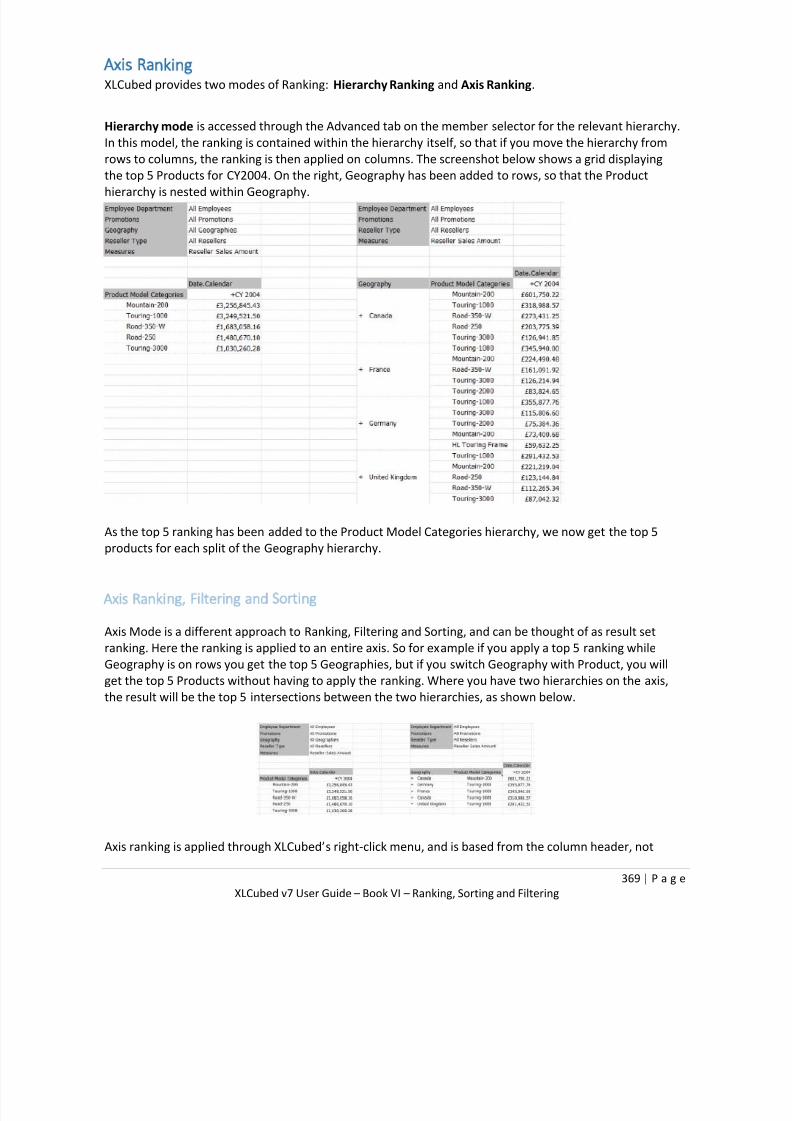
7/17/2019 XL Cubed versión 7 UserGuide
http://slidepdf.com/reader/full/xl-cubed-version-7-userguide 381/567
369 | P a g e
XLCubed v7 User Guide – Book VI – Ranking, Sorting and Filtering
Axis Ranking
XLCubed provides two modes of Ranking: Hierarchy Ranking and Axis Ranking.
Hierarchy mode is accessed through the Advanced tab on the member selector for the relevant hierarchy.
In this model, the ranking is contained within the hierarchy itself, so that if you move the hierarchy from
rows to columns, the ranking is then applied on columns. The screenshot below shows a grid displaying
the top 5 Products for CY2004. On the right, Geography has been added to rows, so that the Product
hierarchy is nested within Geography.
As the top 5 ranking has been added to the Product Model Categories hierarchy, we now get the top 5
products for each split of the Geography hierarchy.
Axis Ranking, Filtering and Sorting
Axis Mode is a different approach to Ranking, Filtering and Sorting, and can be thought of as result set
ranking. Here the ranking is applied to an entire axis. So for example if you apply a top 5 ranking while
Geography is on rows you get the top 5 Geographies, but if you switch Geography with Product, you willget the top 5 Products without having to apply the ranking. Where you have two hierarchies on the axis,
the result will be the top 5 intersections between the two hierarchies, as shown below.
Axis ranking is applied through XLCubed’s right-click menu, and is based from the column header, not

7/17/2019 XL Cubed versión 7 UserGuide
http://slidepdf.com/reader/full/xl-cubed-version-7-userguide 382/567
370 | P a g e
XLCubed v7 User Guide – Book VI – Ranking, Sorting and Filtering
from within a specific hierarchy. Right-click on the column header that you wish to rank (in our example
you would right-click on CY 2004) and then select XLCubed, Apply, ranking, Top x Rows. You can see that
Top 10 and Bottom 10 appear as options. If you wish to rank any other count you select Top x Rows/
Bottom x Rows and you will be prompted to enter a figure.
You will notice that the first member on the right-hand hierarchy has a little red indicator in the corner,
see screenshot below:

7/17/2019 XL Cubed versión 7 UserGuide
http://slidepdf.com/reader/full/xl-cubed-version-7-userguide 383/567
371 | P a g e
XLCubed v7 User Guide – Book VI – Ranking, Sorting and Filtering
If you hover over this cell it displays an informational message that the rows are being ranked and that you
can right-click to edit axis or clear the axis ranking.

7/17/2019 XL Cubed versión 7 UserGuide
http://slidepdf.com/reader/full/xl-cubed-version-7-userguide 384/567
372 | P a g e
XLCubed v7 User Guide – Book VI – Ranking, Sorting and Filtering
Clear All: Use this option to clear all axis ranking options.
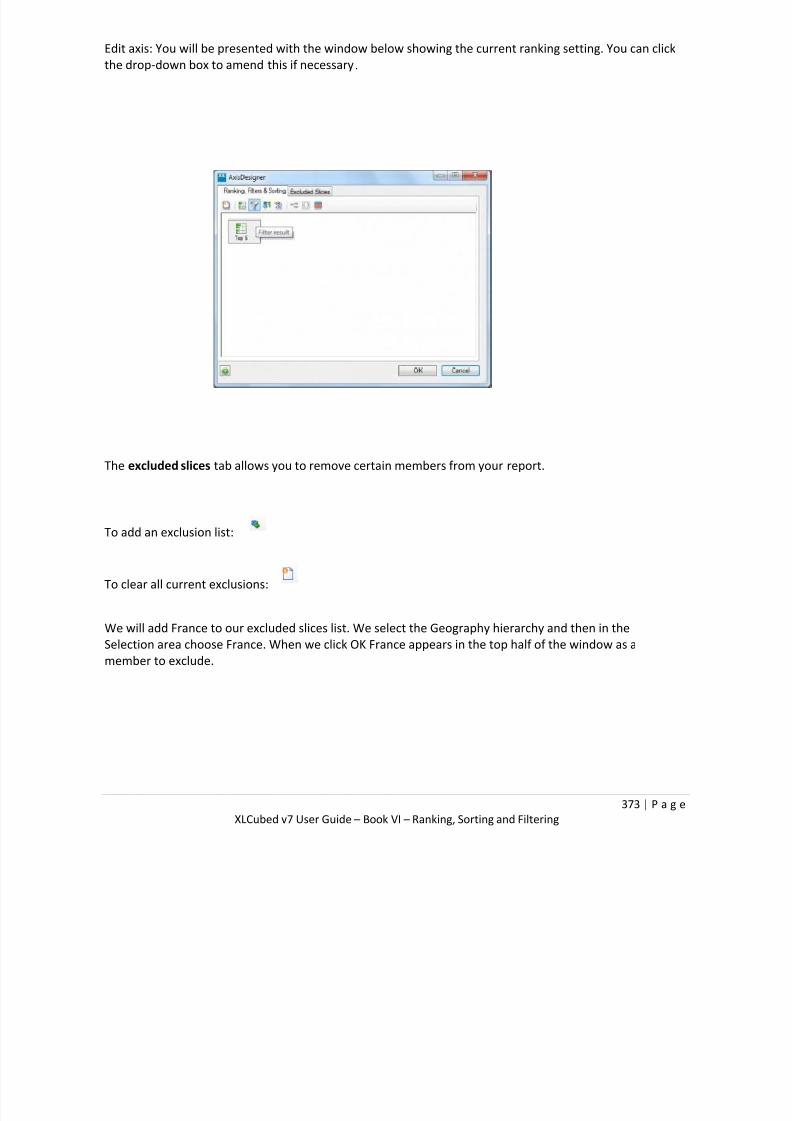
7/17/2019 XL Cubed versión 7 UserGuide
http://slidepdf.com/reader/full/xl-cubed-version-7-userguide 385/567
373 | P a g e
XLCubed v7 User Guide – Book VI – Ranking, Sorting and Filtering
Edit axis: You will be presented with the window below showing the current ranking setting. You can click
the drop-down box to amend this if necessary.
The excluded slices tab allows you to remove certain members from your report.
To add an exclusion list:
To clear all current exclusions:
We will add France to our excluded slices list. We select the Geography hierarchy and then in the
Selection area choose France. When we click OK France appears in the top half of the window as a
member to exclude.

7/17/2019 XL Cubed versión 7 UserGuide
http://slidepdf.com/reader/full/xl-cubed-version-7-userguide 386/567
374 | P a g e
XLCubed v7 User Guide – Book VI – Ranking, Sorting and Filtering
The report is refreshed and you can see that France has been removed from the report
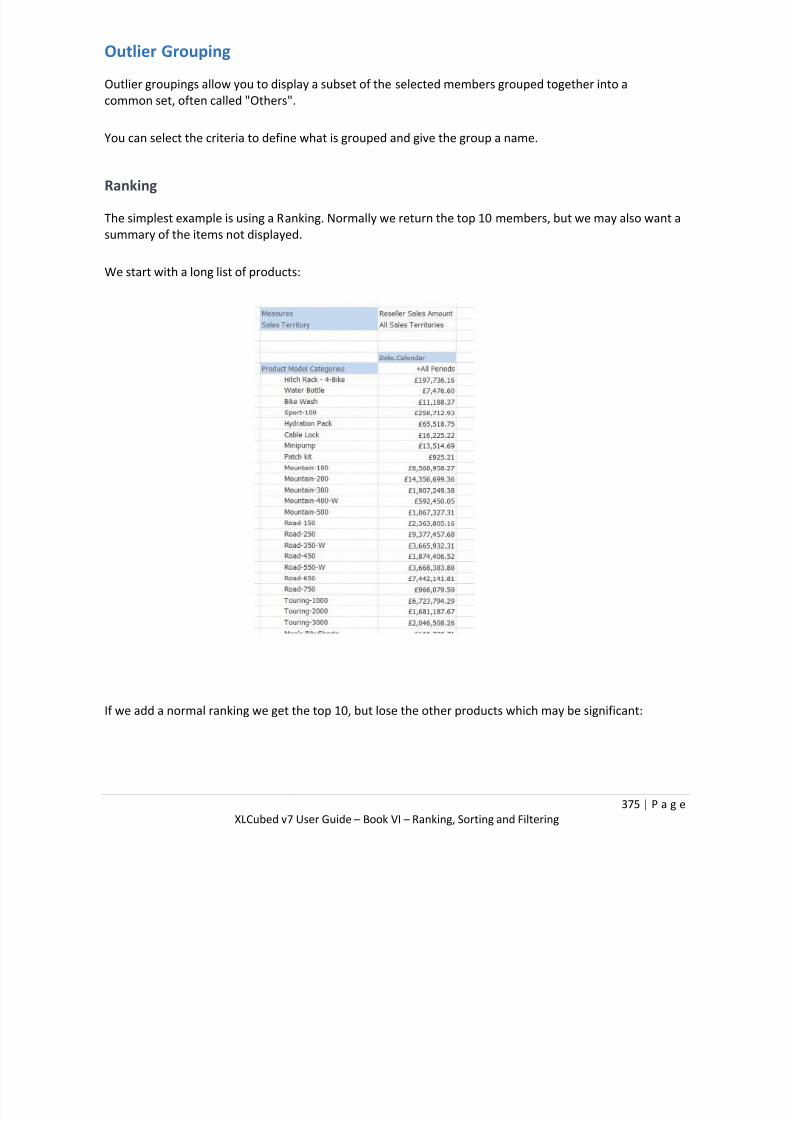
7/17/2019 XL Cubed versión 7 UserGuide
http://slidepdf.com/reader/full/xl-cubed-version-7-userguide 387/567
375 | P a g e
XLCubed v7 User Guide – Book VI – Ranking, Sorting and Filtering
Outlier Grouping
Outlier groupings allow you to display a subset of the selected members grouped together into a
common set, often called "Others".
You can select the criteria to define what is grouped and give the group a name.
Ranking
The simplest example is using a Ranking. Normally we return the top 10 members, but we may also want a
summary of the items not displayed.
We start with a long list of products:
If we add a normal ranking we get the top 10, but lose the other products which may be significant:

7/17/2019 XL Cubed versión 7 UserGuide
http://slidepdf.com/reader/full/xl-cubed-version-7-userguide 388/567
376 | P a g e
XLCubed v7 User Guide – Book VI – Ranking, Sorting and Filtering
Instead we will remove the ranking and add an Outlier Grouping.
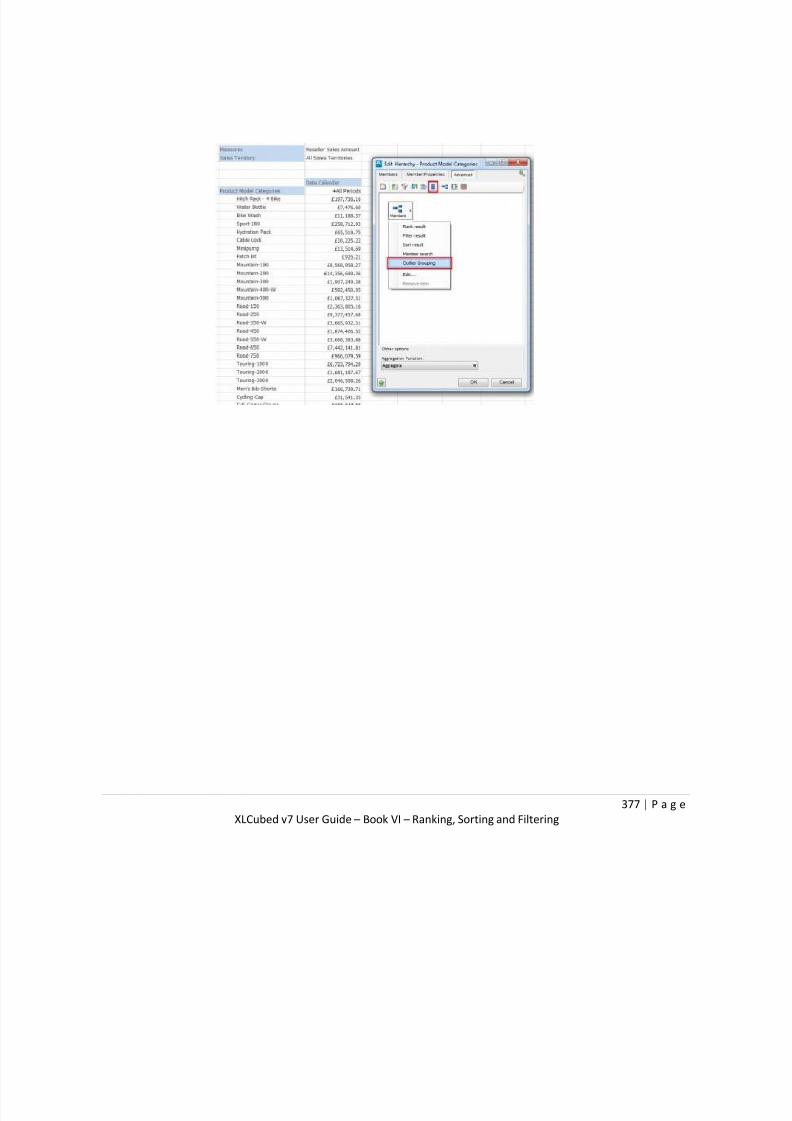
7/17/2019 XL Cubed versión 7 UserGuide
http://slidepdf.com/reader/full/xl-cubed-version-7-userguide 389/567
377 | P a g e
XLCubed v7 User Guide – Book VI – Ranking, Sorting and Filtering

7/17/2019 XL Cubed versión 7 UserGuide
http://slidepdf.com/reader/full/xl-cubed-version-7-userguide 390/567
378 | P a g e
XLCubed v7 User Guide – Book VI – Ranking, Sorting and Filtering
In this dialog we will just use the default top 10 ranking, although we could also group by value (Filter), or
chose certain members that will go into the group.
This results in the following grid:

7/17/2019 XL Cubed versión 7 UserGuide
http://slidepdf.com/reader/full/xl-cubed-version-7-userguide 391/567
379 | P a g e
XLCubed v7 User Guide – Book VI – Ranking, Sorting and Filtering
Note that we choose "Keep these members separate". We could change this and select "Group these
members" to have the top 10 grouped, and all other members shown as normal.

7/17/2019 XL Cubed versión 7 UserGuide
http://slidepdf.com/reader/full/xl-cubed-version-7-userguide 392/567
380 | P a g e
XLCubed v7 User Guide – Book VI – Ranking, Sorting and Filtering
User driven grouping
In this example we will have members picked, and allow the user to select which go into the "Others"
group by selecting some of them in a slicer.
We start with a simple grid listing the Sales Territories. We would like the user to be able to select some of
the territories, and have those go into the "Others" group. The remainder will be displayed as normal.
This is the initial setup with the slicer not linked to anything
We open the member selector for Sales Territory and add the Outlier Grouping. The settings here are to
group "Specific members", and to "Group these members".
All that is left to do is define the members in the grouping, so we simply pick the slicer we already have.
The end result is a slicer allowing the user to dynamically group the results.

7/17/2019 XL Cubed versión 7 UserGuide
http://slidepdf.com/reader/full/xl-cubed-version-7-userguide 393/567
381 | P a g e
XLCubed v7 User Guide – Book VI – Ranking, Sorting and Filtering

7/17/2019 XL Cubed versión 7 UserGuide
http://slidepdf.com/reader/full/xl-cubed-version-7-userguide 394/567
382 | P a g e
XLCubed v7 User Guide – Book VII - SQL
Book VII - SQL
Relational reporting in XLCubed is handled through Tables and Slicers.
There are two levels of SQL reporting user in XLCubed, with differing levels of design access. This providesa controlled level of SQL reporting to non-technical users, giving access to SQL-based data without the risk
of allowing free access to designing their own queries.
Administrators: can create new connections and design new SQL queries from scratch
using the Query designer. Administrator users can also publish pre-built queries to
XLCubed Web Edition, for use by standard users.
Standard Users: have no SQL designer access, but can use pre-published SQL queries
from the SQL report library on XLCubed Web.

7/17/2019 XL Cubed versión 7 UserGuide
http://slidepdf.com/reader/full/xl-cubed-version-7-userguide 395/567
383 | P a g e
XLCubed v7 User Guide – Book VII - SQL
SQL Server 2012
In SQL Server 2012 Microsoft introduced the BI Semantic Model - "BISM". BISM encompasses the
different deployment options for Business Intelligence within SQL Server 2012. The highest level choice is
between Multi-dimensional Analysis Services and Tabular. Multi-dimensional is the latest incarnation of
the hierarchical
Analysis Services model which has been in widespread use since SQL Server 2000, and was heavily
revised in SQL 2005 and 2008. Tabular is a new deployment option specific to SQL 2012 and basedaround tables rather than hierarchies.
MDX is the query language of hierarchical cubes, and continues to be used to query SQL 2012 Multi-
dimensional. It can also be used to query Tabular models which have been deployed to the xVelocity
(previously VertiPaq) in-memory engine within Analysis Services. So Tabular models which have been
deployed this way can be queried by any MDX generating client tool (by and large anything which could
connect to Analysis Services previously), or also through the DAX language.
Tabular models can also be deployed using Direct Query mode, but these can only be queried through
DAX, and not MDX. In terms of the native client tools for SQL 2012, Pivot Tables use MDX, and PowerView
uses DAX. To connect to all the BISM deployment modes you would need both Pivot Tables and
PowerView. XLCubed felt users would benefit from a consistent experience whichever flavour of BISM was
being accessed, and so version 7 can query using MDX or DAX (with the new table object). The diagram
below outlines this.

7/17/2019 XL Cubed versión 7 UserGuide
http://slidepdf.com/reader/full/xl-cubed-version-7-userguide 396/567
384 | P a g e
XLCubed v7 User Guide – Book VII - SQL
SQL Administrators
SQL Administrators are responsible for creating connections and queries for all relational reporting in theorganisation. These connections and queries can then be distributed to Standard SQL Users in one of two
ways:
• Distribution of workbooks
• Publication of queries using XLCubed Web Edition
Once distributed either in workbook form or via XLCubed Web Edition, the connections and queries
become read-only to standard users, though any parameters provided in the query will still be editable.
SQL Administrators will continue to be able to modify the queries.
Standard SQL Users
Standard SQL Users have no SQL designer access, and are only able to consume relational reports designed
for them by
SQL Administrators. Connections and queries can be made available to them in two ways:
• Distribution of workbooks
• Publication of queries using XLCubed Web Edition (see this article for more detailed instructions)
Once distributed either in workbook form or via XLCubed Web Edition, the connections and queries
become read-only to standard users, though any parameters provided in the query will still be editable.
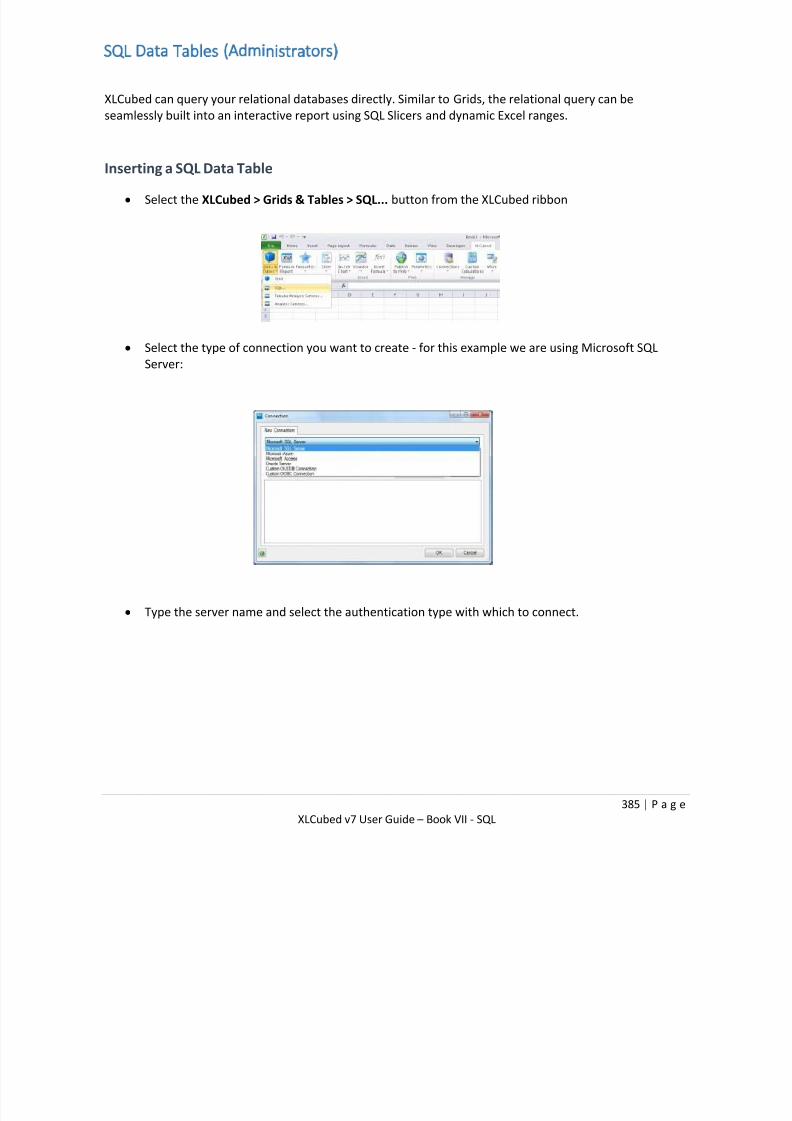
7/17/2019 XL Cubed versión 7 UserGuide
http://slidepdf.com/reader/full/xl-cubed-version-7-userguide 397/567
385 | P a g e
XLCubed v7 User Guide – Book VII - SQL
SQL Data Tables (Administrators)
XLCubed can query your relational databases directly. Similar to Grids, the relational query can be
seamlessly built into an interactive report using SQL Slicers and dynamic Excel ranges.
Inserting a SQL Data Table
Select the XLCubed > Grids & Tables > SQL... button from the XLCubed ribbon
Select the type of connection you want to create - for this example we are using Microsoft SQL
Server:
Type the server name and select the authentication type with which to connect.

7/17/2019 XL Cubed versión 7 UserGuide
http://slidepdf.com/reader/full/xl-cubed-version-7-userguide 398/567
386 | P a g e
XLCubed v7 User Guide – Book VII - SQL
Click Connect and you should then see all the databases on the server to which you have
access. Select the desired database and click OK to continue.
Select the destination cell for your statement and then build up your query by dragging
tables and views into the main tab.
As you pick the fields you will see the SQL statement build up in the lower half of the
screen. You may also type the SQL statement directly. Click OK when finished.
The SQL table will be inserted at the point you selected.
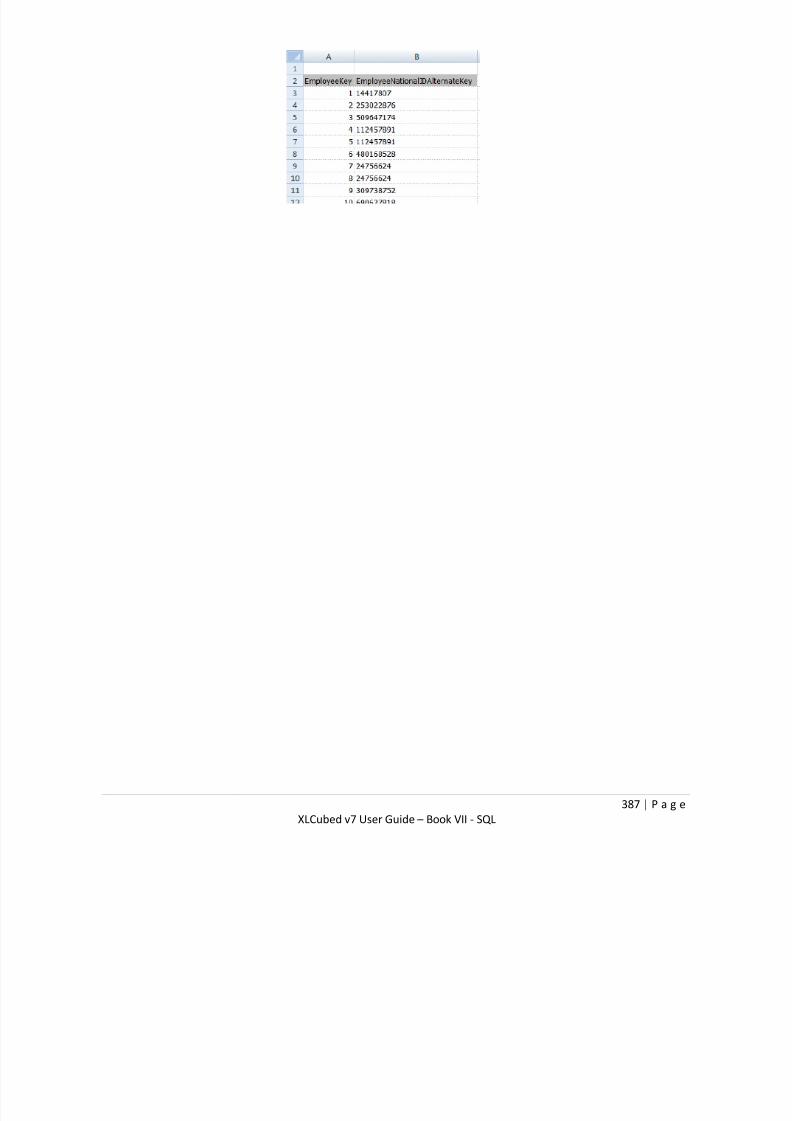
7/17/2019 XL Cubed versión 7 UserGuide
http://slidepdf.com/reader/full/xl-cubed-version-7-userguide 399/567
387 | P a g e
XLCubed v7 User Guide – Book VII - SQL
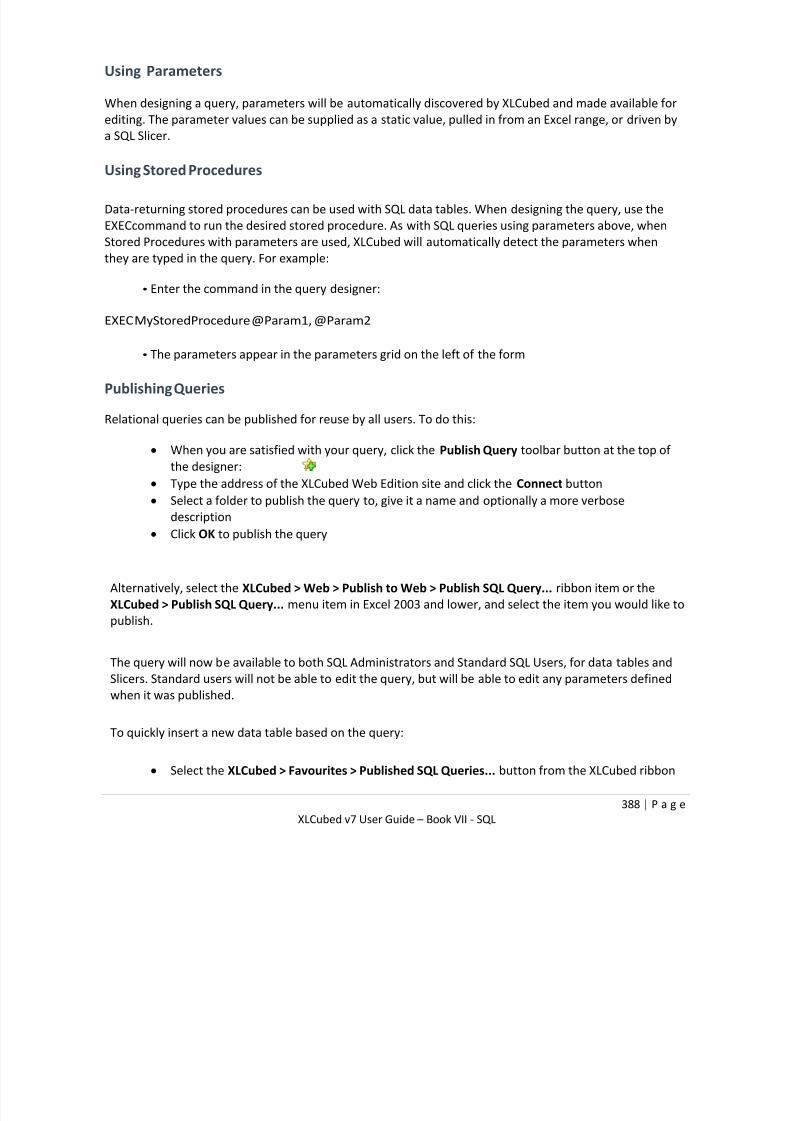
7/17/2019 XL Cubed versión 7 UserGuide
http://slidepdf.com/reader/full/xl-cubed-version-7-userguide 400/567
388 | P a g e
XLCubed v7 User Guide – Book VII - SQL
Using Parameters
When designing a query, parameters will be automatically discovered by XLCubed and made available for
editing. The parameter values can be supplied as a static value, pulled in from an Excel range, or driven by
a SQL Slicer.
Using Stored Procedures
Data-returning stored procedures can be used with SQL data tables. When designing the query, use the
EXECcommand to run the desired stored procedure. As with SQL queries using parameters above, when
Stored Procedures with parameters are used, XLCubed will automatically detect the parameters when
they are typed in the query. For example:
• Enter the command in the query designer:
EXEC MyStoredProcedure @Param1, @Param2
• The parameters appear in the parameters grid on the left of the form
Publishing Queries
Relational queries can be published for reuse by all users. To do this:
When you are satisfied with your query, click the Publish Query toolbar button at the top of
the designer:
Type the address of the XLCubed Web Edition site and click the Connect button
Select a folder to publish the query to, give it a name and optionally a more verbosedescription
Click OK to publish the query
Alternatively, select the XLCubed > Web > Publish to Web > Publish SQL Query... ribbon item or the
XLCubed > Publish SQL Query... menu item in Excel 2003 and lower, and select the item you would like to
publish.
The query will now be available to both SQL Administrators and Standard SQL Users, for data tables andSlicers. Standard users will not be able to edit the query, but will be able to edit any parameters defined
when it was published.
To quickly insert a new data table based on the query:
Select the XLCubed > Favourites > Published SQL Queries... button from the XLCubed ribbon

7/17/2019 XL Cubed versión 7 UserGuide
http://slidepdf.com/reader/full/xl-cubed-version-7-userguide 401/567
389 | P a g e
XLCubed v7 User Guide – Book VII - SQL
Type the address of the XLCubed Web Edition site and click the Connect button
Select the desired query
Click OK to insert the table

7/17/2019 XL Cubed versión 7 UserGuide
http://slidepdf.com/reader/full/xl-cubed-version-7-userguide 402/567
390 | P a g e
XLCubed v7 User Guide – Book VII - SQL

7/17/2019 XL Cubed versión 7 UserGuide
http://slidepdf.com/reader/full/xl-cubed-version-7-userguide 403/567
391 | P a g e
XLCubed v7 User Guide – Book VII - SQL
SQL Data Tables (Standard Users)
Inserting a SQL Data Table
Select the XLCubed > Insert Data Table > SQL... button from the XLCubed ribbon.
Enter the name of the XLCubed web site to connect to:

7/17/2019 XL Cubed versión 7 UserGuide
http://slidepdf.com/reader/full/xl-cubed-version-7-userguide 404/567
392 | P a g e
XLCubed v7 User Guide – Book VII - SQL
Select the desired query and click OK to continue:
If applicable, enter the parameters you wish to use.
The SQL table will be inserted at the point you selected.

7/17/2019 XL Cubed versión 7 UserGuide
http://slidepdf.com/reader/full/xl-cubed-version-7-userguide 405/567
393 | P a g e
XLCubed v7 User Guide – Book VII - SQL
Using Parameters
When inserting a query, parameters will be automatically discovered by XLCubed and made available for
editing. The parameter values can be supplied as a static value, pulled in from an Excel range, or driven bya SQL Slicer.

7/17/2019 XL Cubed versión 7 UserGuide
http://slidepdf.com/reader/full/xl-cubed-version-7-userguide 406/567
394 | P a g e
XLCubed v7 User Guide – Book VII - SQL

7/17/2019 XL Cubed versión 7 UserGuide
http://slidepdf.com/reader/full/xl-cubed-version-7-userguide 407/567
395 | P a g e
XLCubed v7 User Guide – Book VII - SQL
SQL Slicers (Administrators)
Introduction
SQL slicers allow you to take data and metadata from your relational data sources (for example, SQL
Server) and use it to easily make selections on linked reports.

7/17/2019 XL Cubed versión 7 UserGuide
http://slidepdf.com/reader/full/xl-cubed-version-7-userguide 408/567
396 | P a g e
XLCubed v7 User Guide – Book VII - SQL
Using Slicers for Table Parameters
To automatically add a linked Slicer:
Select XLCubed > Edit Parameters... from the table's right-click menu
Select <Add new slicer> or <Add published slicer> from the dropdown for the parameter
you would like to drive using a slicer:
Create or select the query to use to return the ID, caption and depth columns. The first column
will be used as the parameter; the second will be displayed in the Slicer itself. If you have
selected a treeview-style slicer, the depth column will control the item's depth.
Select a range to insert the Slicer
When you accept the dialogs, the new Slicer will be available for input

7/17/2019 XL Cubed versión 7 UserGuide
http://slidepdf.com/reader/full/xl-cubed-version-7-userguide 409/567
397 | P a g e
XLCubed v7 User Guide – Book VII - SQL
Standalone Slicers
As with Dimension Slicers, standalone slicers can be added using the XLCubed > Slicer > SQL... ribbon
button. These can be used to place their output into an Excel range, or can be linked to one or more SQL
data tables, as described above.
Tree Slicers for Hierarchical Data
Data returned from a relational database can be displayed in a hierarchical form using tree slicers. More
information on how to construct these are in the following example.
Constructing a Tree Slicer for SQL
As for Excel Range Slicers, SQL Slicers can also allow users to select items in a familiar tree style. The key is
to have three columns returned by the SQL query:
ID column
Caption column
Tree level column
Any additional columns will be ignored.
In this example, we will use Microsoft's Adventure Works demo relational database, and the DimProduct,
DimProductSubcategory and DimProductCategory tables, which will be familiar to users of the Adventure
Works cube as the Product dimension sources.
1. After making a connection to the Adventure Works relational database, you should enter a query tobring back the three columns listed above:
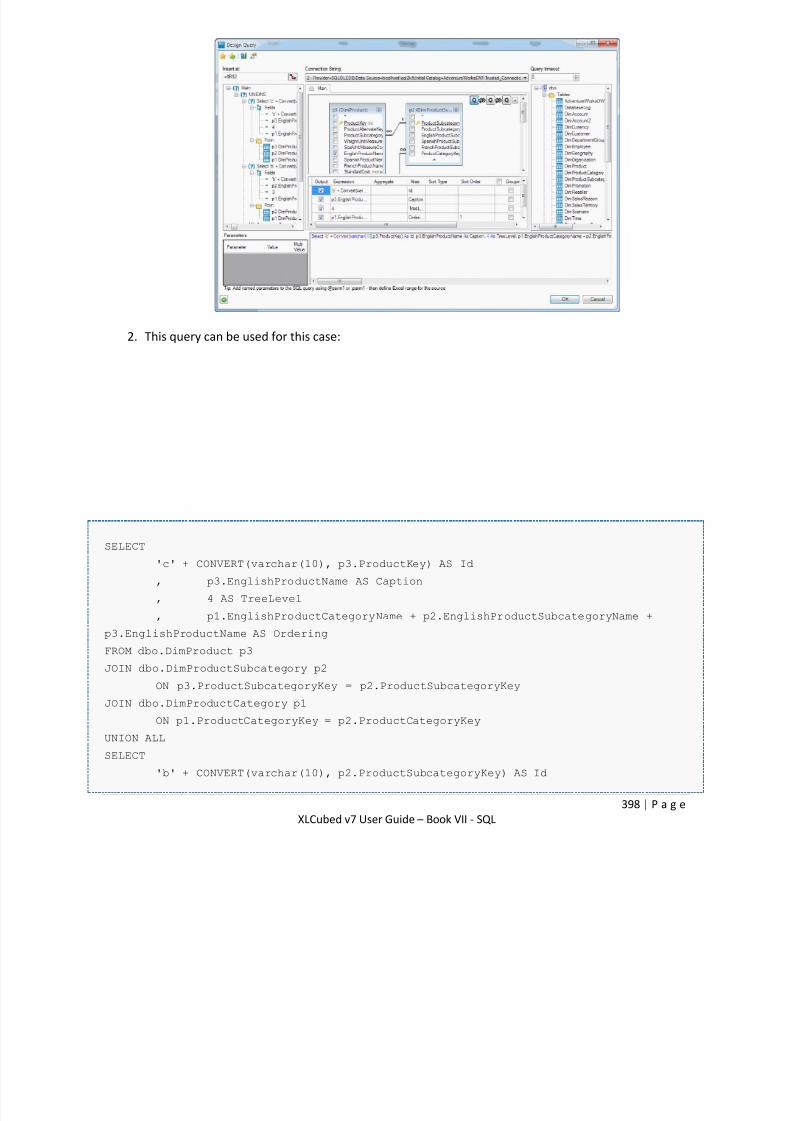
7/17/2019 XL Cubed versión 7 UserGuide
http://slidepdf.com/reader/full/xl-cubed-version-7-userguide 410/567
398 | P a g e
XLCubed v7 User Guide – Book VII - SQL
2. This query can be used for this case:
SELECT
'c' + CONVERT(varchar(10), p3.ProductKey) AS Id
, p3.EnglishProductName AS Caption
, 4 AS TreeLevel
, p1.EnglishProductCategoryName + p2.EnglishProductSubcategoryName +
p3.EnglishProductName AS Ordering
FROM dbo.DimProduct p3
JOIN dbo.DimProductSubcategory p2
ON p3.ProductSubcategoryKey = p2.ProductSubcategoryKey
JOIN dbo.DimProductCategory p1
ON p1.ProductCategoryKey = p2.ProductCategoryKey
UNION ALL
SELECT
'b' + CONVERT(varchar(10), p2.ProductSubcategoryKey) AS Id
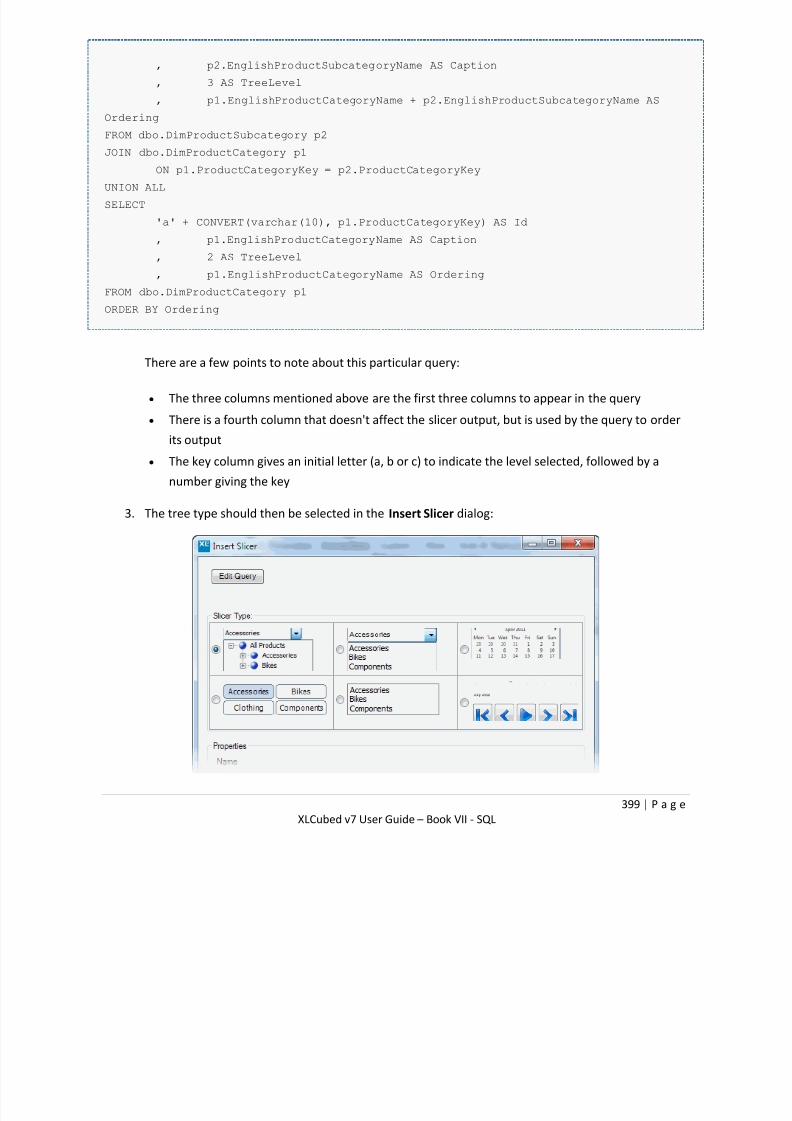
7/17/2019 XL Cubed versión 7 UserGuide
http://slidepdf.com/reader/full/xl-cubed-version-7-userguide 411/567
399 | P a g e
XLCubed v7 User Guide – Book VII - SQL
, p2.EnglishProductSubcategoryName AS Caption
, 3 AS TreeLevel
, p1.EnglishProductCategoryName + p2.EnglishProductSubcategoryName AS
Ordering
FROM dbo.DimProductSubcategory p2
JOIN dbo.DimProductCategory p1
ON p1.ProductCategoryKey = p2.ProductCategoryKey
UNION ALL
SELECT
'a' + CONVERT(varchar(10), p1.ProductCategoryKey) AS Id
, p1.EnglishProductCategoryName AS Caption
, 2 AS TreeLevel
, p1.EnglishProductCategoryName AS Ordering
FROM dbo.DimProductCategory p1
ORDER BY Ordering
There are a few points to note about this particular query:
The three columns mentioned above are the first three columns to appear in the query
There is a fourth column that doesn't affect the slicer output, but is used by the query to order
its output
The key column gives an initial letter (a, b or c) to indicate the level selected, followed by a
number giving the key
3. The tree type should then be selected in the Insert Slicer dialog:

7/17/2019 XL Cubed versión 7 UserGuide
http://slidepdf.com/reader/full/xl-cubed-version-7-userguide 412/567
400 | P a g e
XLCubed v7 User Guide – Book VII - SQL
4. This gives the following output:
5. If the Update range with selection property is selected, and the First column option chosen, then
the composite key that was mentioned above will be output to the cell. This can then be simply
parsed with Excel formulae, for example (assuming the output cell is A1):
Level
=IF(LEFT(A1,1)="a","Category",IF(LEFT(A1,1)="b","Subcategory",IF(LEFT(A1,1)="c","Product","Unkn
own")))
Id=MID(A1,2,LEN(A1)-1)

7/17/2019 XL Cubed versión 7 UserGuide
http://slidepdf.com/reader/full/xl-cubed-version-7-userguide 413/567
401 | P a g e
XLCubed v7 User Guide – Book VII - SQL
SQL Slicers (Standard Users)
Introduction
SQL slicers allow you to take data and metadata from your relational data sources (for example, SQL
Server) and use it to easily make selections on linked reports.
Five display options are provided:
Using Slicers for Table Parameters
To automatically add a linked Slicer:
Select XLCubed > Edit Parameters... from the table's right-click menu
Select <Add published slicer> from the dropdown for the parameter you would like to drive
using a slicer:
Select the query to use to return the ID, caption and depth columns. The first column will be
used as the parameter, the second will be displayed in the slicer itself. If you have selected a
treeview-style slicer, the depth column will control the item’s depth.
Select a range to insert the slicer
When you accept the dialogs the new slicer will be available for input.

7/17/2019 XL Cubed versión 7 UserGuide
http://slidepdf.com/reader/full/xl-cubed-version-7-userguide 414/567
402 | P a g e
XLCubed v7 User Guide – Book VII - SQL
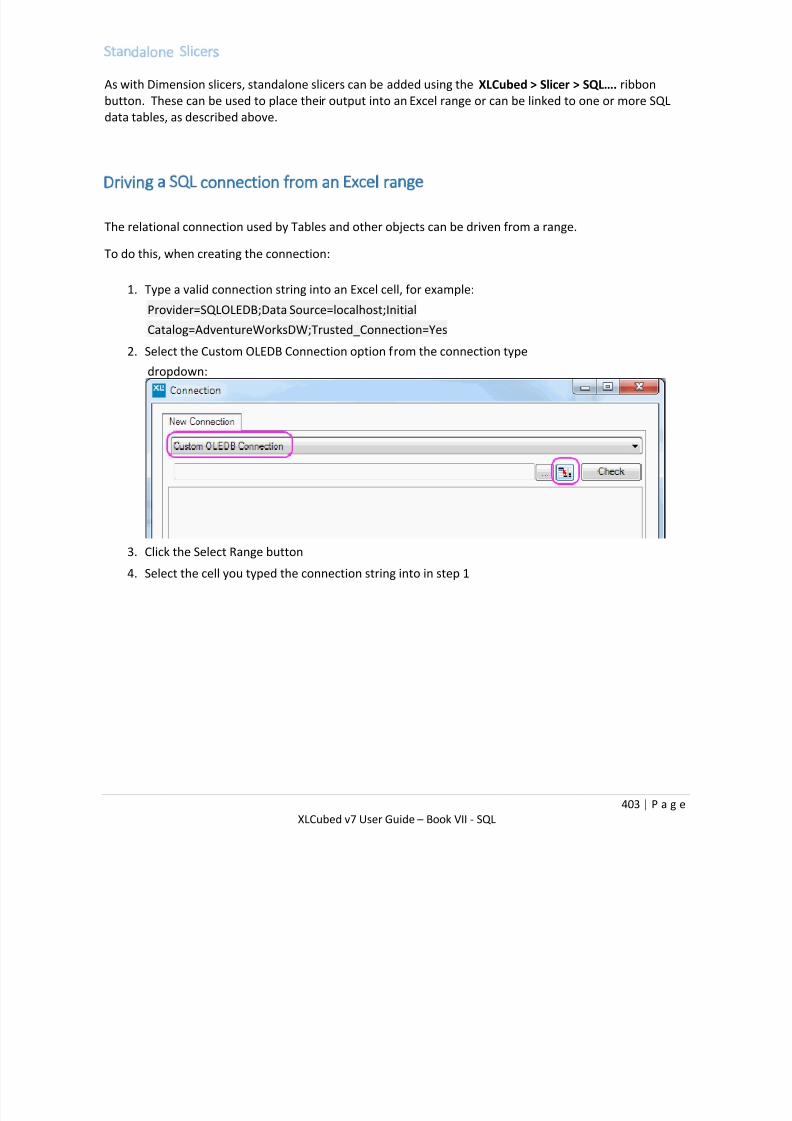
7/17/2019 XL Cubed versión 7 UserGuide
http://slidepdf.com/reader/full/xl-cubed-version-7-userguide 415/567
403 | P a g e
XLCubed v7 User Guide – Book VII - SQL
Standalone Slicers
As with Dimension slicers, standalone slicers can be added using the XLCubed > Slicer > SQL…. ribbon
button. These can be used to place their output into an Excel range or can be linked to one or more SQL
data tables, as described above.
Driving a SQL connection from an Excel range
The relational connection used by Tables and other objects can be driven from a range.
To do this, when creating the connection:
1. Type a valid connection string into an Excel cell, for example:
Provider=SQLOLEDB;Data Source=localhost;Initial
Catalog=AdventureWorksDW;Trusted_Connection=Yes2. Select the Custom OLEDB Connection option from the connection type
dropdown:
3. Click the Select Range button
4. Select the cell you typed the connection string into in step 1

7/17/2019 XL Cubed versión 7 UserGuide
http://slidepdf.com/reader/full/xl-cubed-version-7-userguide 416/567
404 | P a g e
XLCubed v7 User Guide – Book VII - SQL
Using SQL Parameters
Creating SQL Parameters
When editing the SQL query, the SQL Administrator can create parameters that can later be edited by
Standard SQL Users.
To create the parameter, type the SQL query as usual, but substitute @paramNameto create a parameter
named paramName. The parameter can then be edited by clicking on the Parameters grid. The following
screenshot shows a parameter named @pAccTypecreated in the Parameters grid:
These parameters can then set them from several different data sources, shown below.
Static Values
To use a single, static value in a SQL report, the value can be typed in directly:

7/17/2019 XL Cubed versión 7 UserGuide
http://slidepdf.com/reader/full/xl-cubed-version-7-userguide 417/567
405 | P a g e
XLCubed v7 User Guide – Book VII - SQL
Values from an Excel range
To drive the Table or Slicer from an Excel range, click the select range button:
Select a range in the dialog that appears, and the range reference will appear in the parameters grid:

7/17/2019 XL Cubed versión 7 UserGuide
http://slidepdf.com/reader/full/xl-cubed-version-7-userguide 418/567
406 | P a g e
XLCubed v7 User Guide – Book VII - SQL
Values from a Slicer
You can either select an existing Slicer or create a new one.
Selecting an Existing Slicer
If a Slicer already exists in the workbook, you may select it directly in the Edit Parameters dialog:
Creating a New Slicer
If no appropriate Slicer exists, you may create a new one.
In the Edit Parameters dialog, select the <Add new slicer> option:
Select the published slicer query (or, for SQL Administrators, design your query):
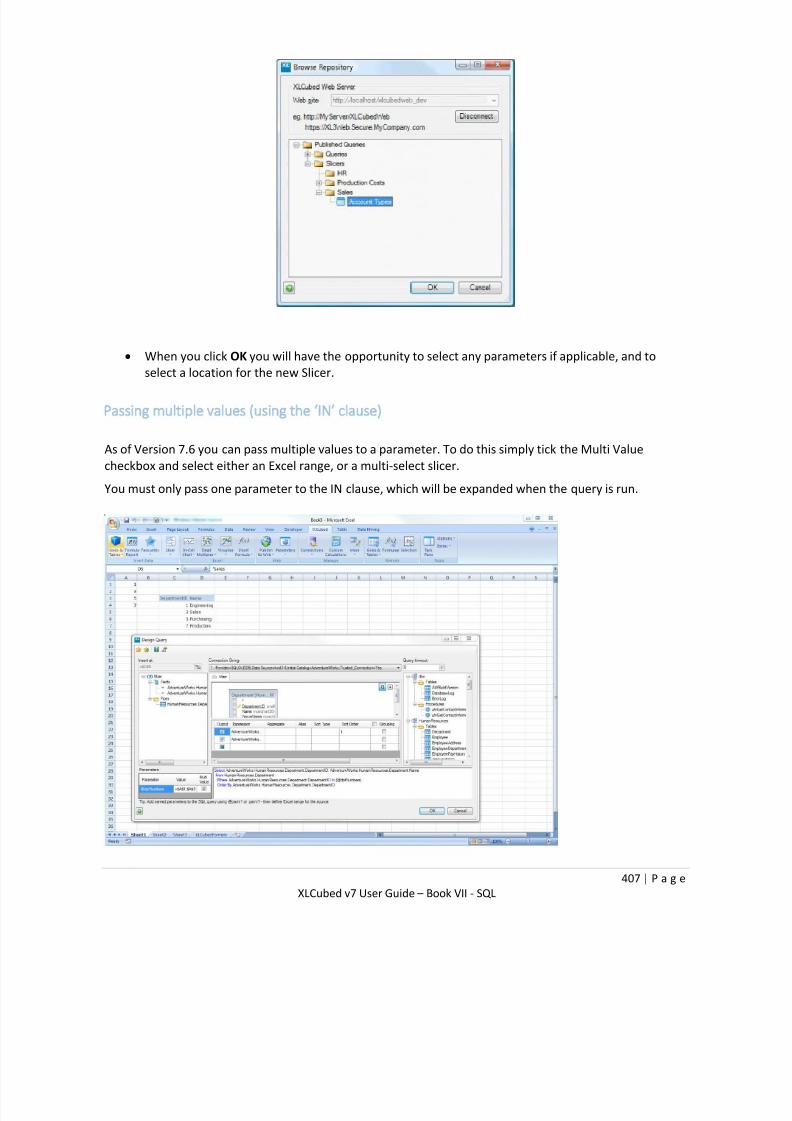
7/17/2019 XL Cubed versión 7 UserGuide
http://slidepdf.com/reader/full/xl-cubed-version-7-userguide 419/567
407 | P a g e
XLCubed v7 User Guide – Book VII - SQL
When you click OK you will have the opportunity to select any parameters if applicable, and to
select a location for the new Slicer.
Passing multiple values (using the ‘IN’ clause)
As of Version 7.6 you can pass multiple values to a parameter. To do this simply tick the Multi Value
checkbox and select either an Excel range, or a multi-select slicer.
You must only pass one parameter to the IN clause, which will be expanded when the query is run.

7/17/2019 XL Cubed versión 7 UserGuide
http://slidepdf.com/reader/full/xl-cubed-version-7-userguide 420/567
408 | P a g e
XLCubed v7 User Guide – Book VIII - Tables
Book VIII - Tables
XLCubed tables can be inserted from several sources:
SQL data sources
Multidimensional
Tabular cubes
Once the table has been inserted, several features are available which apply to all tables.
SQL
Relational reporting in XLCubed is handled through Tables and Slicers.
There are two levels of SQL reporting user in XLCubed, with differing levels of design access. This provides
a controlled level of SQL reporting to non-technical users, giving access to SQL-based data without the risk
of allowing free access to designing their own queries.
Administrators: can create new connections and design new SQL queries from scratch
using the Query designer. Administrator users can also publish pre-built queries to
XLCubed Web Edition, for use by standard users.
Standard Users: have no SQL designer access, but can use pre-published SQL queries
from the SQL report library on XLCubed Web
Please see Book VII – SQL for more details
Multidimensional Table Designer
This designer allows you to create an XLCubed table from an Analysis Services cube. This can be useful for
list style reporting.
When compared to grids, these reports are easier for new users to create, but offer less functionality and
interactivity.
Designer
After selecting a cube to report on, you will be presented with a simple designer with three areas.
On the left is a list of the hierarchies in the cube. There can be dragged to the center section to includethem as a column in the table. Individual members can be picked to restrict the rows returned.
Finally the Measures section allows you to select the numbers you'd like to see for each row. These are
displayed after the columns for the hierarchies.

7/17/2019 XL Cubed versión 7 UserGuide
http://slidepdf.com/reader/full/xl-cubed-version-7-userguide 421/567
409 | P a g e
XLCubed v7 User Guide – Book VIII - Tables
SQL data sources
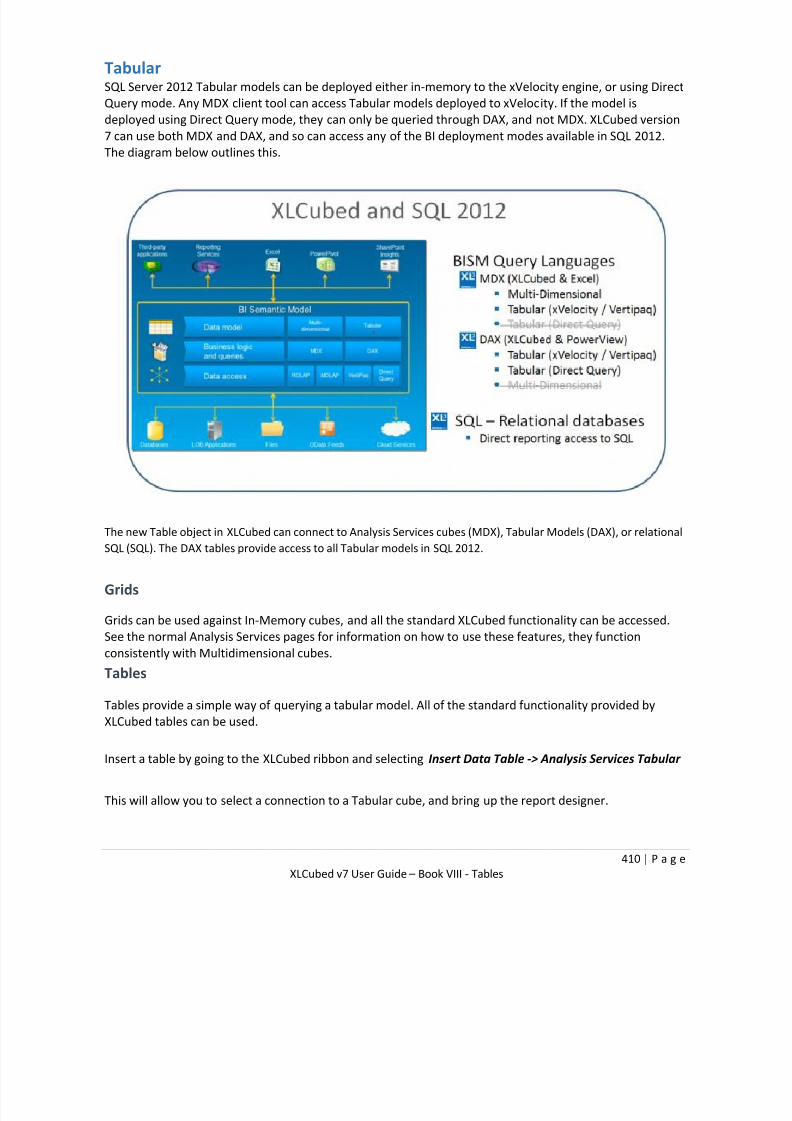
7/17/2019 XL Cubed versión 7 UserGuide
http://slidepdf.com/reader/full/xl-cubed-version-7-userguide 422/567
410 | P a g e
XLCubed v7 User Guide – Book VIII - Tables
TabularSQL Server 2012 Tabular models can be deployed either in-memory to the xVelocity engine, or using Direct
Query mode. Any MDX client tool can access Tabular models deployed to xVelocity. If the model is
deployed using Direct Query mode, they can only be queried through DAX, and not MDX. XLCubed version
7 can use both MDX and DAX, and so can access any of the BI deployment modes available in SQL 2012.
The diagram below outlines this.
The new Table object in XLCubed can connect to Analysis Services cubes (MDX), Tabular Models (DAX), or relational
SQL (SQL). The DAX tables provide access to all Tabular models in SQL 2012.
Grids
Grids can be used against In-Memory cubes, and all the standard XLCubed functionality can be accessed.
See the normal Analysis Services pages for information on how to use these features, they function
consistently with Multidimensional cubes.
Tables
Tables provide a simple way of querying a tabular model. All of the standard functionality provided by
XLCubed tables can be used.
Insert a table by going to the XLCubed ribbon and selecting Insert Data Table -> Analysis Services Tabular
This will allow you to select a connection to a Tabular cube, and bring up the report designer.

7/17/2019 XL Cubed versión 7 UserGuide
http://slidepdf.com/reader/full/xl-cubed-version-7-userguide 423/567
411 | P a g e
XLCubed v7 User Guide – Book VIII - Tables
Slicers
Slicers give users simple to use pick lists which can be used to filter reports.
By adding a slicer based on Tabular Analysis Services you create a slicer that can be linked directly to a
Table
As with standard cube slicers, you can restrict the members shown to those with data by putting a
measure into the Filters section.
The following slicer gives all the years for which there is Sales data.
Hierarchies
As of Version 7.6 XLCubed supports tabular hierarchies, provided the server is on SSAS2012 SP1 or above.
Hierarchies can be used in two ways:
Placed on the Filter area - you get a treeview to select the report filter.
This can also be linked to a treeview slicer if required.
Placed on the Selected Columns area - you can drill into the data by double clicking a value, and drill
back up by double clicking the column header.
Calculations
You can create new DAX calculations for your report without updating the cube.
These calculations are stored with the workbook, and are available from any grid, table or formula in the
book. Click the DAX button (highlighted) to create a new calculation, and then use the controls on the right

7/17/2019 XL Cubed versión 7 UserGuide
http://slidepdf.com/reader/full/xl-cubed-version-7-userguide 424/567
412 | P a g e
XLCubed v7 User Guide – Book VIII - Tables
to select:
• Table the measure will appear in
• Name for the measure
• Formula to define the measure
You can drag tables, columns and measures from the tree on the left into the formula area to insert theirnames.

7/17/2019 XL Cubed versión 7 UserGuide
http://slidepdf.com/reader/full/xl-cubed-version-7-userguide 425/567
413 | P a g e
XLCubed v7 User Guide – Book VIII - Tables
Tabular Designer
The tabular designer allows you to automatically create table reports against Analysis Services cubes in the
DAX language.
These are simpler to create than a Grid, and can run against In-Memory or DirectQuery cubes. (Grids
cannot query DirectQuery Cubes)
Report layout
The tabular report designer is split into three parts.
First is the database browser, which allow you to see the Tables, Columns and Measures which exist.
Next is the report layout section, where you can specify the columns and measures on filters (above thetable) and in the table.
Finally is the criteria area. Here you can select the members retrieved, and filter the rows based on
measure values.
By dragging columns or measures into the "Filters" and "Selected Columns" areas you can specify the table
layout.

7/17/2019 XL Cubed versión 7 UserGuide
http://slidepdf.com/reader/full/xl-cubed-version-7-userguide 426/567
414 | P a g e
XLCubed v7 User Guide – Book VIII - Tables

7/17/2019 XL Cubed versión 7 UserGuide
http://slidepdf.com/reader/full/xl-cubed-version-7-userguide 427/567
415 | P a g e
XLCubed v7 User Guide – Book VIII - Tables
Member filters
When selecting a column you can chose only to return rows for specific members.
To select a member, drag it from the left to the right panel. You can also add selections based on Excel
cells and XLCubed Slicers.
If you have a lot of values in the columns, you can use the search box to find members you are interested
in.

7/17/2019 XL Cubed versión 7 UserGuide
http://slidepdf.com/reader/full/xl-cubed-version-7-userguide 428/567
416 | P a g e
XLCubed v7 User Guide – Book VIII - Tables
Measure filters
If you select a measure you can add a filter to include only values that fit the criteria you want. These can
come from an Excel cell if required.
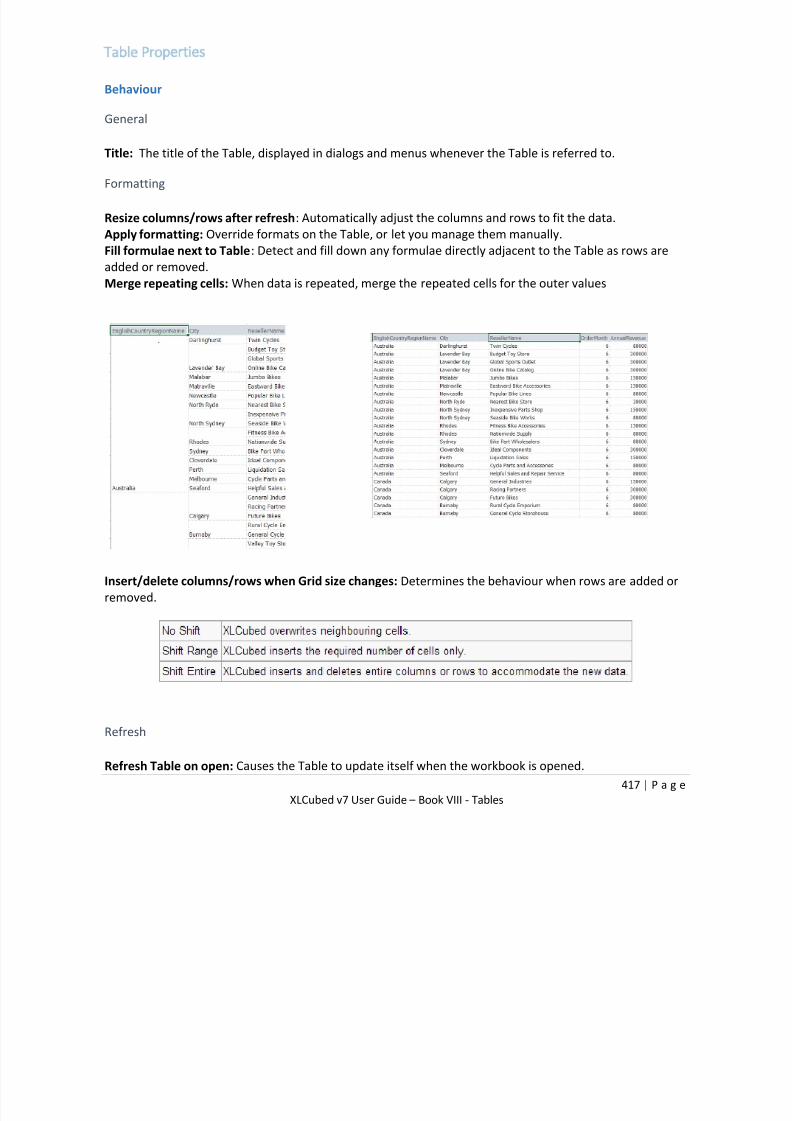
7/17/2019 XL Cubed versión 7 UserGuide
http://slidepdf.com/reader/full/xl-cubed-version-7-userguide 429/567
417 | P a g e
XLCubed v7 User Guide – Book VIII - Tables
Table Properties
Behaviour
General
Title: The title of the Table, displayed in dialogs and menus whenever the Table is referred to.
Formatting
Resize columns/rows after refresh: Automatically adjust the columns and rows to fit the data.
Apply formatting: Override formats on the Table, or let you manage them manually.
Fill formulae next to Table: Detect and fill down any formulae directly adjacent to the Table as rows are
added or removed.
Merge repeating cells: When data is repeated, merge the repeated cells for the outer values
Insert/delete columns/rows when Grid size changes: Determines the behaviour when rows are added or
removed.
Refresh
Refresh Table on open: Causes the Table to update itself when the workbook is opened.

7/17/2019 XL Cubed versión 7 UserGuide
http://slidepdf.com/reader/full/xl-cubed-version-7-userguide 430/567
418 | P a g e
XLCubed v7 User Guide – Book VIII - Tables
Refresh when driving cells change: Causes the Table to update itself when cells driving the query are
updated.

7/17/2019 XL Cubed versión 7 UserGuide
http://slidepdf.com/reader/full/xl-cubed-version-7-userguide 431/567
419 | P a g e
XLCubed v7 User Guide – Book VIII - Tables
Appearance
Pivoting
These options apply when pivoting data:
Group by pivoted value: Pivoted values are kept together, e.g. all columns for January will be together
Nest by pivoted value: Numeric columns are kept together, e.g. all columns for Sales Value will be
together
Show in-cell charts: Useful when pivoting on a date, automatically displays a chart of the data.
Pivot fixed on column name: By default XLCubed stores the pivoted column index. You can instead switch
so the column name is used. This is useful if the query can vary the columns it returns, e.g. from a stored
procedure.
When using named query for pivot: For SQL queries you can specify the order for pivoted columns to bedisplayed (by default alphabetical order is used). If you specify an order query, you can also decide
whether to emit all columns in the order query, or just those which have data.
Sections
This is used to configure the columns used as section headers, as described in the section help.

7/17/2019 XL Cubed versión 7 UserGuide
http://slidepdf.com/reader/full/xl-cubed-version-7-userguide 432/567
420 | P a g e
XLCubed v7 User Guide – Book VIII - Tables
Column Display
When enabled, this feature allows you to reorder the columns of the query before they are displayed, and
to suppress any columns that aren't required.
This reordering is done after any pivoting has been done, so only affects the final displayed results.
Query
Auto-generate Query (default): XLCubed controls the query for the Table given the selected options.
Manual Query: You may type your own query in the edit field.
Get Query from Excel range: The entire query statement for the Table is taken from a cell on the
worksheet.
Performance tips for large tables
If you have very large tables, the following options will speed up data refreshes:
Turn off
• Apply Formatting
• Merge repeating cells
• Resize Columns

7/17/2019 XL Cubed versión 7 UserGuide
http://slidepdf.com/reader/full/xl-cubed-version-7-userguide 433/567
421 | P a g e
XLCubed v7 User Guide – Book VIII - Tables
Formatting Tables
As with grids, formatting for tables is defined on the XLCubedFormats worksheet. Tables will automatically
pick up the default formatting for the column headers and data area. In addition you can also define
formats that will only apply to certain sections of the table.
Formatting Columns
You can format specific columns easily by right clicking the table and selecting "Format Column" or
"Format Column Title" from the menu. This will show the Excel standard formatting dialog, and
automatically create the relevant rows in the format sheet.
This can also be done manually on the format sheet. To do this type the word "Column" as the column
name, and then the name of the column.
You can the format the header and data areas. The following example makes the "SalesTerritoryKey"
header bold, and uses italic formatting for the data.

7/17/2019 XL Cubed versión 7 UserGuide
http://slidepdf.com/reader/full/xl-cubed-version-7-userguide 434/567
422 | P a g e
XLCubed v7 User Guide – Book VIII - Tables
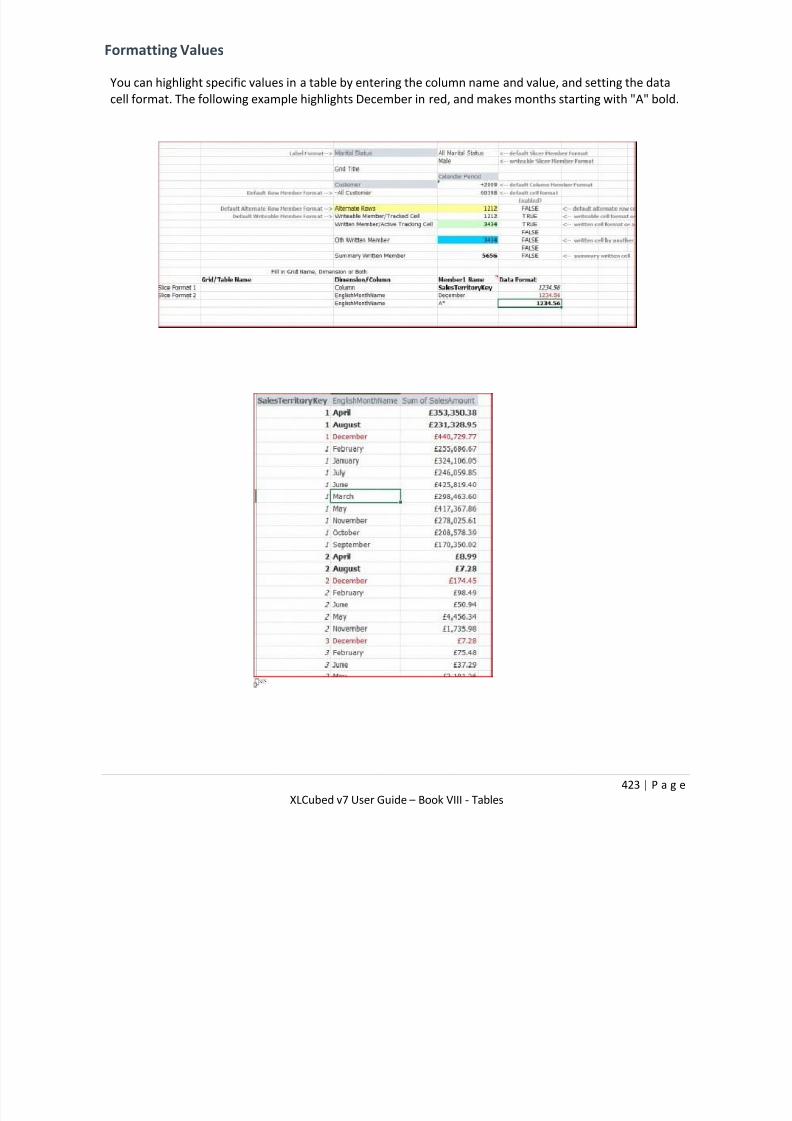
7/17/2019 XL Cubed versión 7 UserGuide
http://slidepdf.com/reader/full/xl-cubed-version-7-userguide 435/567
423 | P a g e
XLCubed v7 User Guide – Book VIII - Tables
Formatting Values
You can highlight specific values in a table by entering the column name and value, and setting the data
cell format. The following example highlights December in red, and makes months starting with "A" bold.

7/17/2019 XL Cubed versión 7 UserGuide
http://slidepdf.com/reader/full/xl-cubed-version-7-userguide 436/567
424 | P a g e
XLCubed v7 User Guide – Book VIII - Tables

7/17/2019 XL Cubed versión 7 UserGuide
http://slidepdf.com/reader/full/xl-cubed-version-7-userguide 437/567
425 | P a g e
XLCubed v7 User Guide – Book VIII - Tables
Calculations
You can add your own calculated columns to an XLCubed table, which can contain any Excel
formula. To add a calculation, simple right click a column header and select "Add Calculation".
When you enter a calculation in the first cell, it will automatically "fill down". If the calculation references
and columns in the table these will be stored as references to the column, so they will continue to work
even if the columns are reordered.
In this example the total value is calculated from two columns retrieved, and the calculated column has
been formatted as currency, as described in the formatting section.
Paging

7/17/2019 XL Cubed versión 7 UserGuide
http://slidepdf.com/reader/full/xl-cubed-version-7-userguide 438/567
426 | P a g e
XLCubed v7 User Guide – Book VIII - Tables
If you have a large amount of data, it is often useful to display it in a series of pages. This is easily done
with XLCubed tables.
The simplest way is to simply right click the table and select "Insert Pager".
Alternatively, go to the Slicer menu, and select "Insert data table pager". Right click the pager to configure
which table you wish to page, and the page size, and click OK. This is useful when you want the pager tobe on a different sheet to the table
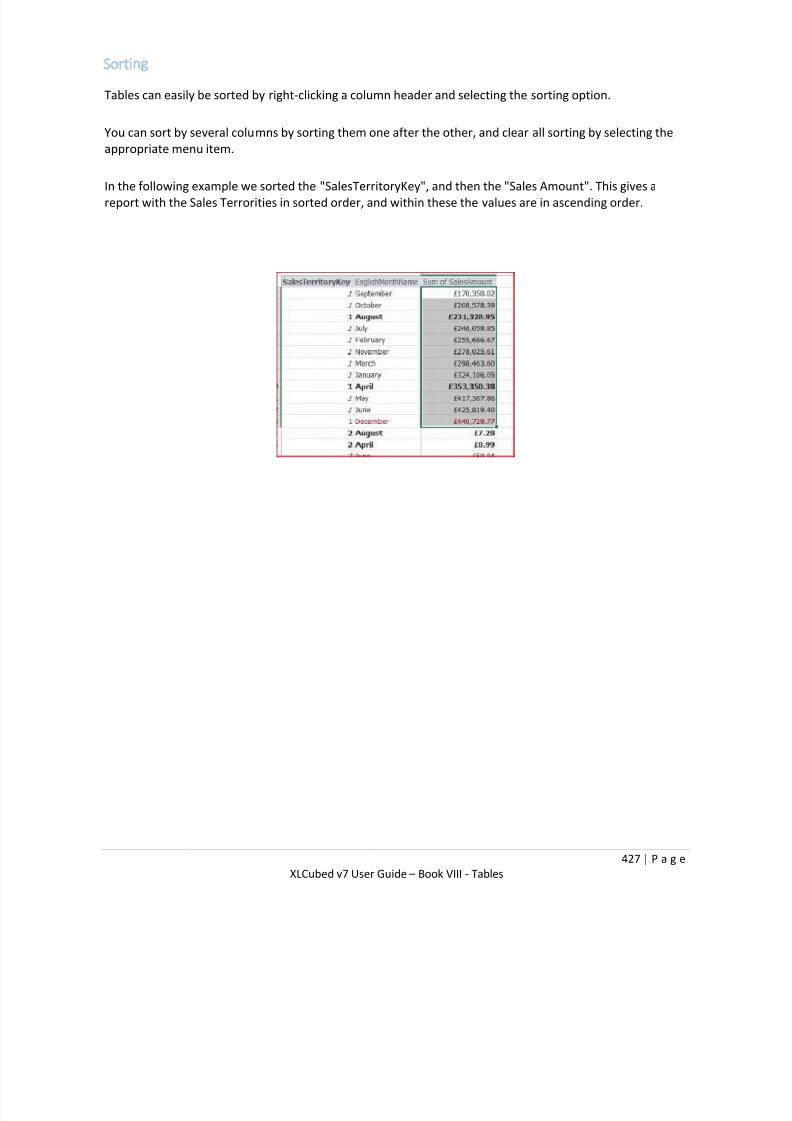
7/17/2019 XL Cubed versión 7 UserGuide
http://slidepdf.com/reader/full/xl-cubed-version-7-userguide 439/567
427 | P a g e
XLCubed v7 User Guide – Book VIII - Tables
Sorting
Tables can easily be sorted by right-clicking a column header and selecting the sorting option.
You can sort by several columns by sorting them one after the other, and clear all sorting by selecting the
appropriate menu item.
In the following example we sorted the "SalesTerritoryKey", and then the "Sales Amount". This gives a
report with the Sales Terrorities in sorted order, and within these the values are in ascending order.

7/17/2019 XL Cubed versión 7 UserGuide
http://slidepdf.com/reader/full/xl-cubed-version-7-userguide 440/567
428 | P a g e
XLCubed v7 User Guide – Book VIII - Tables

7/17/2019 XL Cubed versión 7 UserGuide
http://slidepdf.com/reader/full/xl-cubed-version-7-userguide 441/567
429 | P a g e
XLCubed v7 User Guide – Book VIII - Tables
Sections and Pivoting
These are two features that change the layout of a table from that returned by a query, making the result
more useful for users. Repeating data can be eliminated, and layout improved (e.g. for charting).
Sections
Often one or more columns will repeat their value for many lines in the report. Often this is not useful
information, and Sections can reduce this redundancy.
When you enable sections, column values will be written once as a header. As an example, take the
following report.
EnglishCountryRegionName is repeated a great deal, and does not add much value to the report. By going
into the Table Properties screen, we can enable sections, and use one column in the header.

7/17/2019 XL Cubed versión 7 UserGuide
http://slidepdf.com/reader/full/xl-cubed-version-7-userguide 442/567
430 | P a g e
XLCubed v7 User Guide – Book VIII - Tables
The result is as follows (EnglishCountryRegionName column has been configured to highlight in bold,
using the standard formatting sheet).
The style of the sections can be controlled using the Table Properties form:
Sections in one cell:
Sections in separate cells

7/17/2019 XL Cubed versión 7 UserGuide
http://slidepdf.com/reader/full/xl-cubed-version-7-userguide 443/567
431 | P a g e
XLCubed v7 User Guide – Book VIII - Tables
Sections in separate rows
Display column names
Toggles the column name as part of the section.
Using a combination of sections and the format sheet, it is possible to produce a classic "Reporting
Services" style report:
Hide repeating values
New in Version 7.5 there is an option to hide repeating values - so only the columns with a changed value
will be displayed in each section.
With this option enabled, "Car and Bike Stores" would be shown once and each sub-category listed
underneath:

7/17/2019 XL Cubed versión 7 UserGuide
http://slidepdf.com/reader/full/xl-cubed-version-7-userguide 444/567
432 | P a g e
XLCubed v7 User Guide – Book VIII - Tables
Pivoting
Pivoting a column takes the values for that column, and makes a new column for each.
For example, instead of having months going down, with one month on each row, we can pivot the column
and have months go across the columns. The following example shows this in action.
This screenshot shows one column for month names:
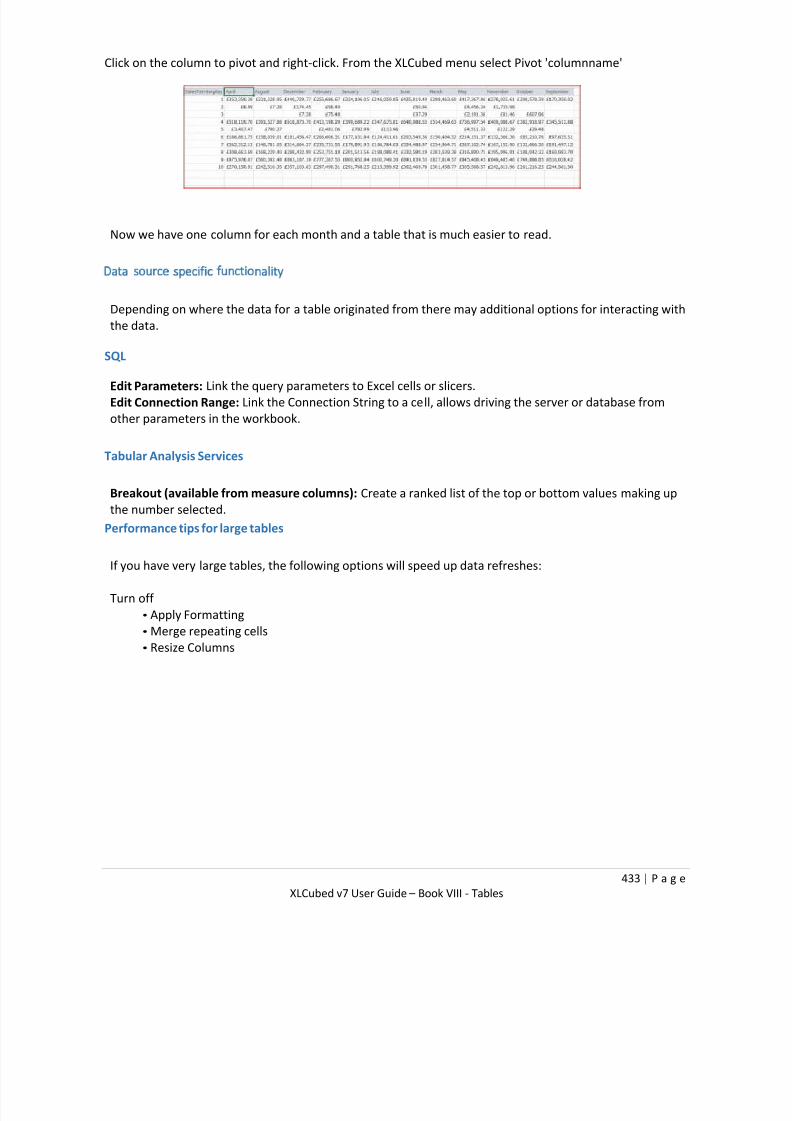
7/17/2019 XL Cubed versión 7 UserGuide
http://slidepdf.com/reader/full/xl-cubed-version-7-userguide 445/567
433 | P a g e
XLCubed v7 User Guide – Book VIII - Tables
Click on the column to pivot and right-click. From the XLCubed menu select Pivot 'columnname'
Now we have one column for each month and a table that is much easier to read.
Data source specific functionality
Depending on where the data for a table originated from there may additional options for interacting with
the data.
SQL
Edit Parameters: Link the query parameters to Excel cells or slicers.
Edit Connection Range: Link the Connection String to a cell, allows driving the server or database from
other parameters in the workbook.
Tabular Analysis Services
Breakout (available from measure columns): Create a ranked list of the top or bottom values making upthe number selected.
Performance tips for large tables
If you have very large tables, the following options will speed up data refreshes:
Turn off
• Apply Formatting
• Merge repeating cells
• Resize Columns

7/17/2019 XL Cubed versión 7 UserGuide
http://slidepdf.com/reader/full/xl-cubed-version-7-userguide 446/567
434 | P a g e
XLCubed v7 User Guide – Book IX - SharePoint
Book IX - SharePoint
The XLCubed SharePoint Webpart, available from XLCubed version 6.5, allows XLCubed Reports to be
embedded into SharePoint pages and allows connections between filter web-parts and other XLCubed
Report web-parts.
Installing
Copy the CAB file onto the SharePoint server, for example
c:\inetpub\wwwroot\xlcubedweb\extensions
SharePoint 2010
• Enable full trust in IIS - run Internet Information Services Manager
o Click on the server and select .Net Trust Levels
o Change the trust level to Full (Internal)

7/17/2019 XL Cubed versión 7 UserGuide
http://slidepdf.com/reader/full/xl-cubed-version-7-userguide 447/567
435 | P a g e
XLCubed v7 User Guide – Book IX - SharePoint
o Enable full trust on the SharePoint website
Click on the SharePoint website and select .Net Trust Levels

7/17/2019 XL Cubed versión 7 UserGuide
http://slidepdf.com/reader/full/xl-cubed-version-7-userguide 448/567
436 | P a g e
XLCubed v7 User Guide – Book IX - SharePoint
• Change the trust level to Full (Internal)

7/17/2019 XL Cubed versión 7 UserGuide
http://slidepdf.com/reader/full/xl-cubed-version-7-userguide 449/567
437 | P a g e
XLCubed v7 User Guide – Book IX - SharePoint
• Run the SharePoint 2010 ManagementShell (Start -> Microsoft SharePoint 2010 Products -> SharePoint
2010 Management Shell:
Register the .CAB with Sharepoint:
o Add-SPSolution -LiteralPath c:\inetpub\wwwroot\xlcubedweb\extensions\XLCubed.Sharepoint.cab
Deploy the webpart to the SharePoint websites:
o Install-SPSolution -Identity xlcubed.sharepoint.cab -allwebapplications -forcesharepoint
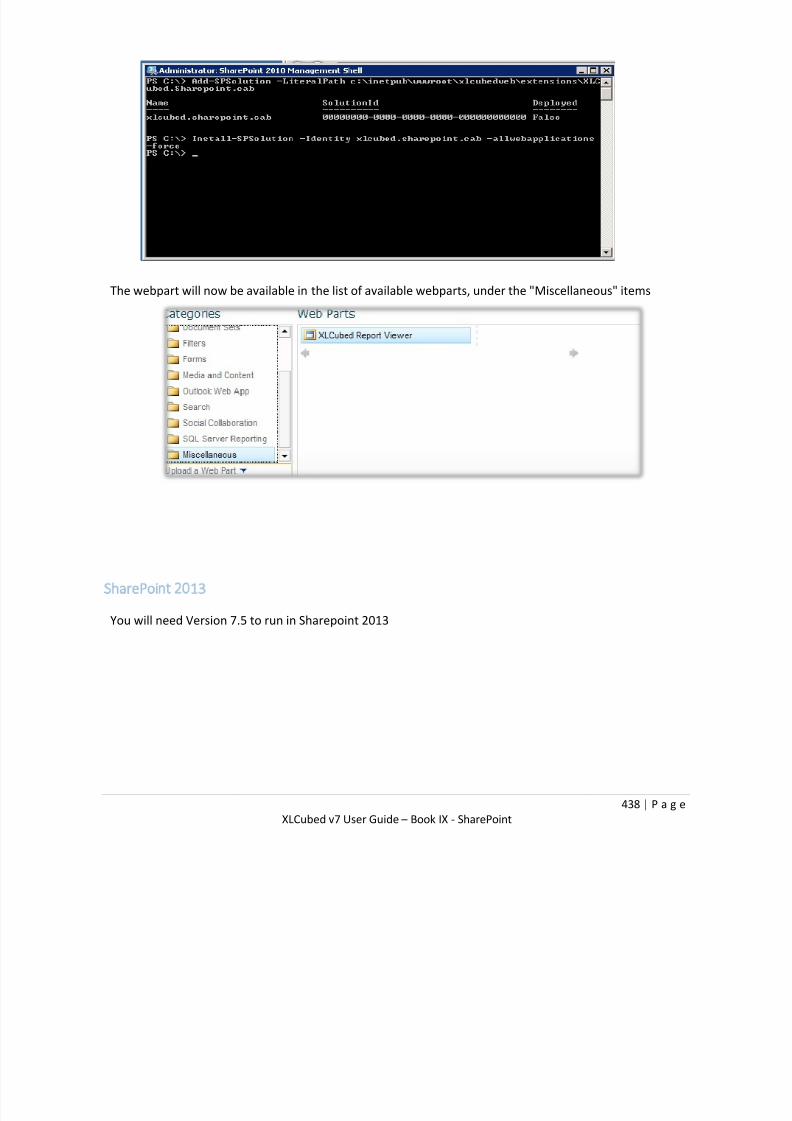
7/17/2019 XL Cubed versión 7 UserGuide
http://slidepdf.com/reader/full/xl-cubed-version-7-userguide 450/567
438 | P a g e
XLCubed v7 User Guide – Book IX - SharePoint
The webpart will now be available in the list of available webparts, under the "Miscellaneous" items
SharePoint 2013
You will need Version 7.5 to run in Sharepoint 2013

7/17/2019 XL Cubed versión 7 UserGuide
http://slidepdf.com/reader/full/xl-cubed-version-7-userguide 451/567
439 | P a g e
XLCubed v7 User Guide – Book IX - SharePoint
Run the SharePoint 2013 ManagementShell (Start -> Microsoft SharePoint 2010 Products ->
SharePoint 2010 Management Shell:
•
Register the .CAB with Sharepoint:
Add-SPSolution -LiteralPath c:\inetpub\wwwroot\xlcubedweb\extensions\XLCubed.Sharepoint.cab
• Deploy the webpart to the SharePoint websites:
Install-SPSolution -Identity xlcubed.sharepoint.cab -allwebapplications –force -FullTrustBinDeployment
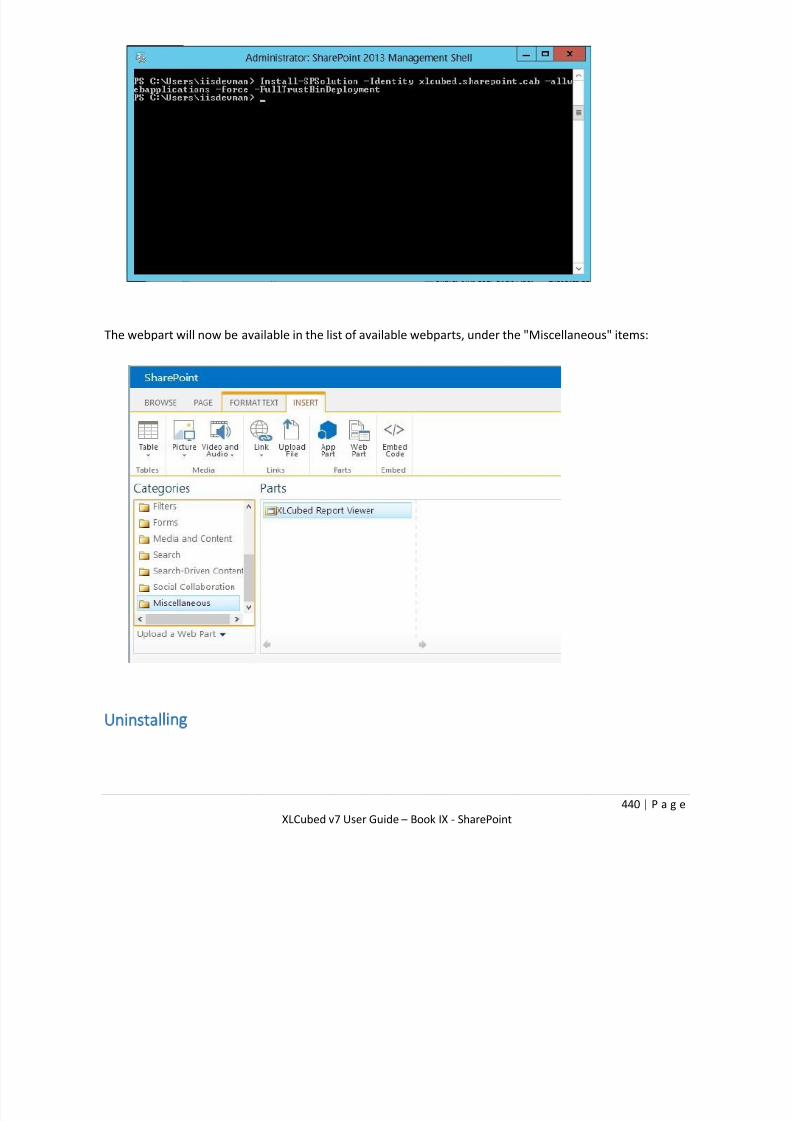
7/17/2019 XL Cubed versión 7 UserGuide
http://slidepdf.com/reader/full/xl-cubed-version-7-userguide 452/567
440 | P a g e
XLCubed v7 User Guide – Book IX - SharePoint
The webpart will now be available in the list of available webparts, under the "Miscellaneous" items:
Uninstalling

7/17/2019 XL Cubed versión 7 UserGuide
http://slidepdf.com/reader/full/xl-cubed-version-7-userguide 453/567
441 | P a g e
XLCubed v7 User Guide – Book IX - SharePoint
SharePoint 2010
Run the SharePoint 2010 ManagementShell: Start -> Microsoft SharePoint 2010 Products ->
SharePoint 2010 Management Shell
Remove the webpart from the SharePoint websites:
UnInstall-SPSolution -Identity xlcubed.sharepoint.cab -allwebapplications
Remove the .CAB from SharePoint:

7/17/2019 XL Cubed versión 7 UserGuide
http://slidepdf.com/reader/full/xl-cubed-version-7-userguide 454/567
442 | P a g e
XLCubed v7 User Guide – Book IX - SharePoint
Remove-SPSolution xlcubed.sharepoint.cab
SharePoint 2013
Run the SharePoint 2013 ManagementShell (As Administrator) Start -> Microsoft SharePoint 2013 Products
-> SharePoint 2013 Management Shell:
Remove the .CAB from SharePoint:
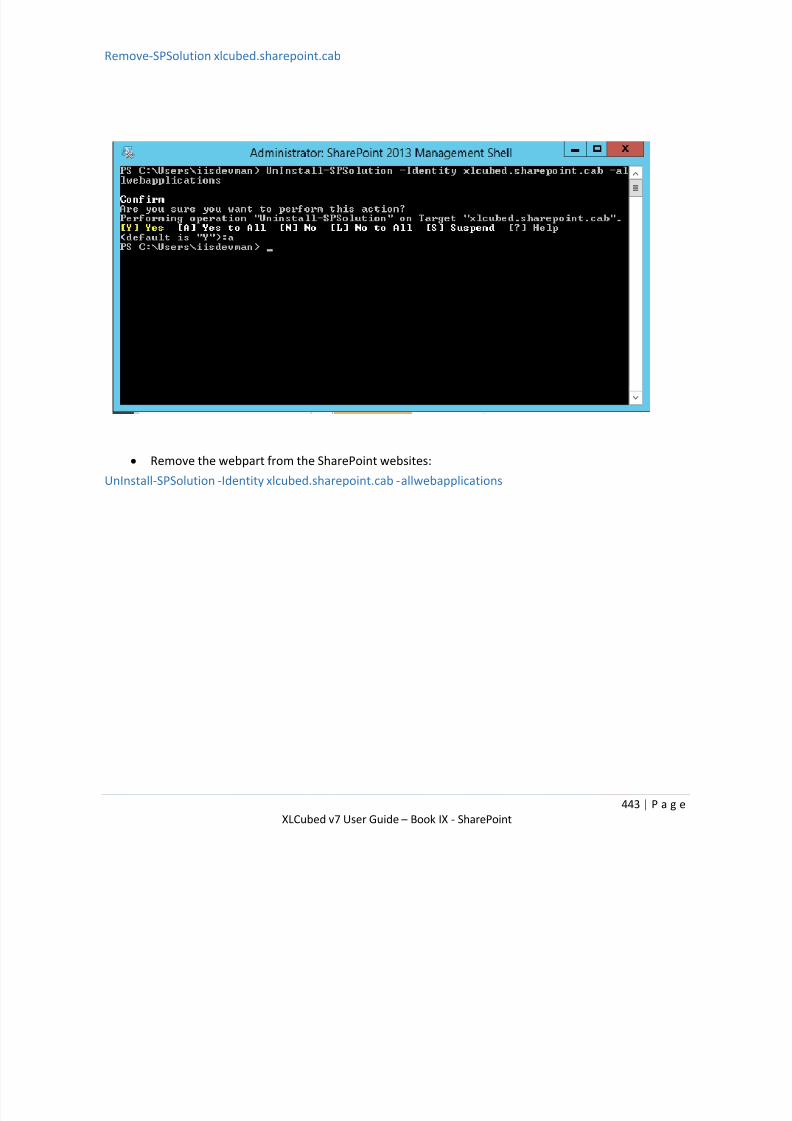
7/17/2019 XL Cubed versión 7 UserGuide
http://slidepdf.com/reader/full/xl-cubed-version-7-userguide 455/567
443 | P a g e
XLCubed v7 User Guide – Book IX - SharePoint
Remove-SPSolution xlcubed.sharepoint.cab
Remove the webpart from the SharePoint websites:
UnInstall-SPSolution -Identity xlcubed.sharepoint.cab -allwebapplications
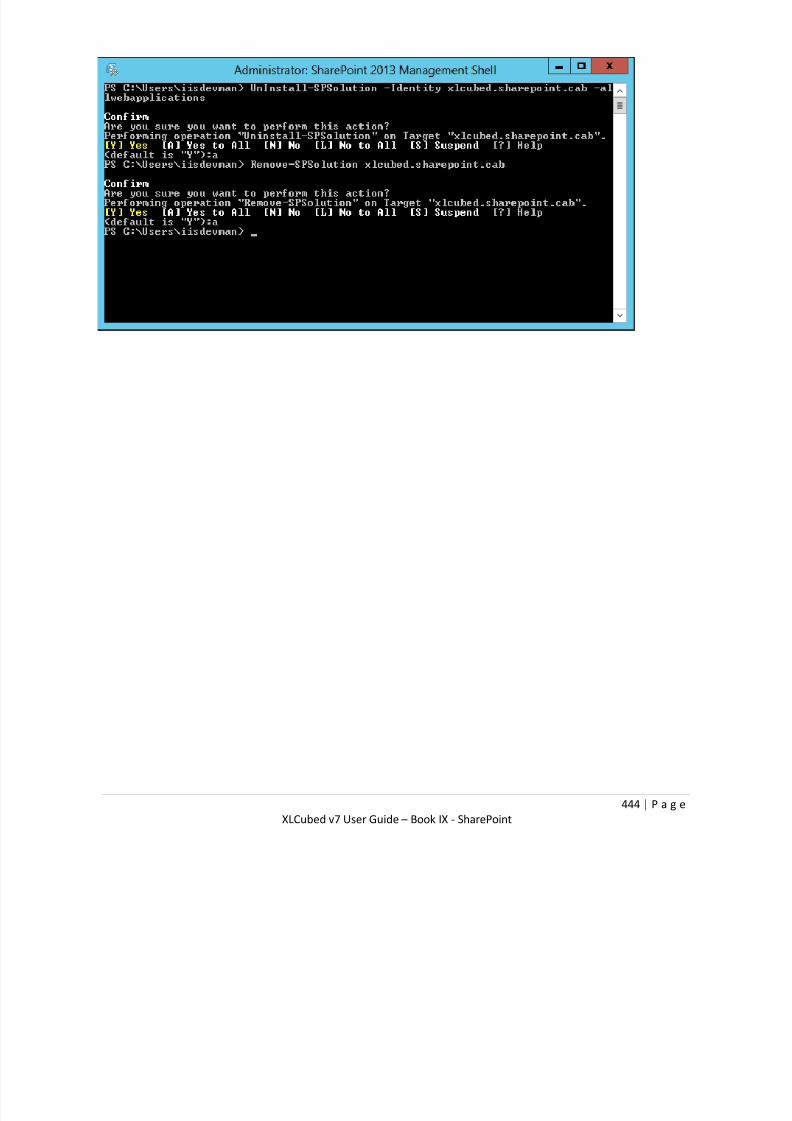
7/17/2019 XL Cubed versión 7 UserGuide
http://slidepdf.com/reader/full/xl-cubed-version-7-userguide 456/567
444 | P a g e
XLCubed v7 User Guide – Book IX - SharePoint
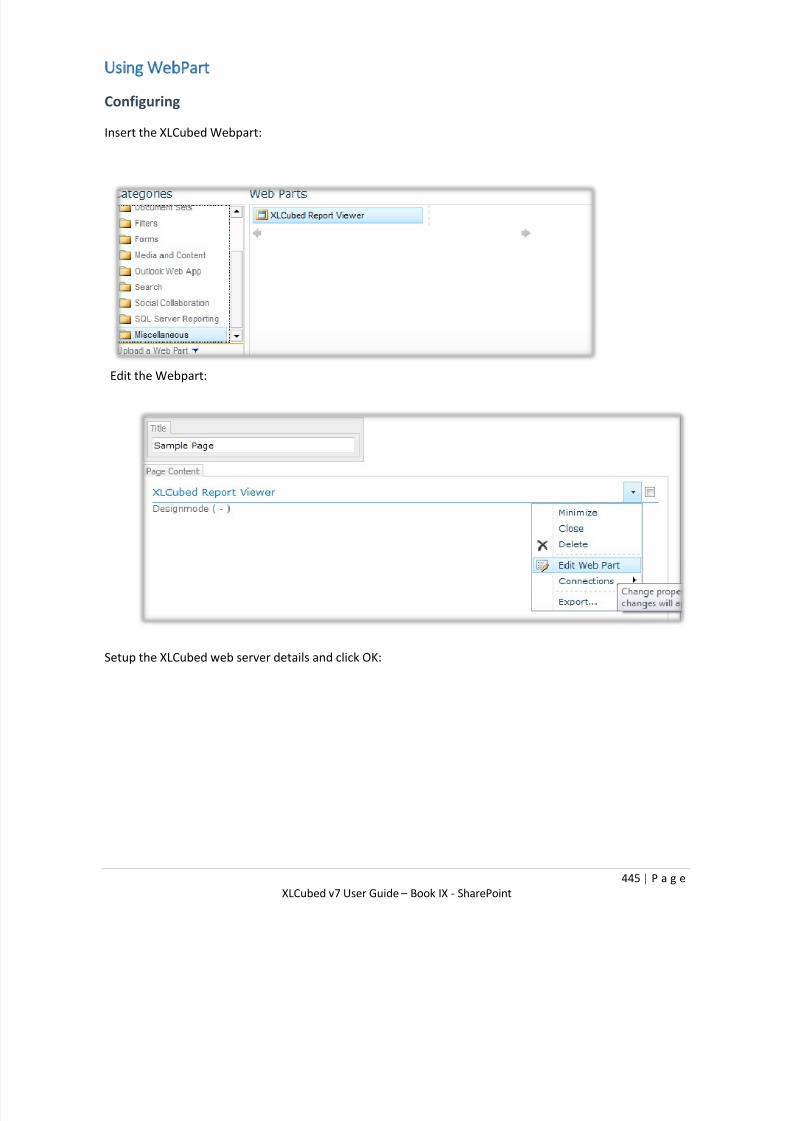
7/17/2019 XL Cubed versión 7 UserGuide
http://slidepdf.com/reader/full/xl-cubed-version-7-userguide 457/567
445 | P a g e
XLCubed v7 User Guide – Book IX - SharePoint
Using WebPart
Configuring
Insert the XLCubed Webpart:
Edit the Webpart:
Setup the XLCubed web server details and click OK:

7/17/2019 XL Cubed versión 7 UserGuide
http://slidepdf.com/reader/full/xl-cubed-version-7-userguide 458/567
446 | P a g e
XLCubed v7 User Guide – Book IX - SharePoint
Now the Report browser button will be enabled
:

7/17/2019 XL Cubed versión 7 UserGuide
http://slidepdf.com/reader/full/xl-cubed-version-7-userguide 459/567
447 | P a g e
XLCubed v7 User Guide – Book IX - SharePoint
Click on the button and browse to the report to display on this page:
Give the report a defined height (if not already inserted into a control with a height defined)

7/17/2019 XL Cubed versión 7 UserGuide
http://slidepdf.com/reader/full/xl-cubed-version-7-userguide 460/567
448 | P a g e
XLCubed v7 User Guide – Book IX - SharePoint
Click OK/Apply to see the report embedded in the page:
Linking XLCubedReport WebParts
XLCubed Webparts can be linked via Web Parameters - once a link is in place then when the web
parameters with the same name are passed between the linked WebParts.
Insert 2 or more webparts in the same page, then select the Connections menu when editing thewebpart:
Linking to filter WebParts
XLCubed Webparts can be linked to Filter webparts so that the parameters can be passed into the XLCubed
Report - first you would need to defined the Web Parameters to be driven by the Filter control. Then
select the connections menu and Inbound Parameters - select the filter control to receive the parameter
from:

7/17/2019 XL Cubed versión 7 UserGuide
http://slidepdf.com/reader/full/xl-cubed-version-7-userguide 461/567
449 | P a g e
XLCubed v7 User Guide – Book IX - SharePoint
Select which Web Parameters is to receive the data from the filter:

7/17/2019 XL Cubed versión 7 UserGuide
http://slidepdf.com/reader/full/xl-cubed-version-7-userguide 462/567
450 | P a g e
XLCubed v7 User Guide – Book IX - SharePoint
Troubleshooting
If the SharePoint website is in the browser's "Trusted Sites" list then you may need to enable "Access
data sources across domains". This can be found in the browser's Tool -> Internet Options form, under
"Security" click "Custom" for "Trusted Sites”.

7/17/2019 XL Cubed versión 7 UserGuide
http://slidepdf.com/reader/full/xl-cubed-version-7-userguide 463/567
451 | P a g e
XLCubed v7 User Guide – Book IX - SharePoint
SharePoint Integration
XLCubed have developed an option for tighter integration with SharePoint, allowing SharePoint to act as a
repository for XLCubedWeb reports, so publication and report navigation is contained within SharePoint.
Installing
There are several steps to complete configuration, this requires XLCubedWeb to be already setup andconfigured. There are 2 ways to display the reports, as standalone pages redirecting the user to
XLCubedWeb or by creating a "Container" page so the report is displayed within a standard SharePoint
page.
Option 1
Option 2

7/17/2019 XL Cubed versión 7 UserGuide
http://slidepdf.com/reader/full/xl-cubed-version-7-userguide 464/567
452 | P a g e
XLCubed v7 User Guide – Book IX - SharePoint
Custom Handler
XLCubed Handler Assembly
The first stage is to install the custom handler for XLCubed Reports on the SharePoint server. You
need to download and extract following file:
http://www.xlcubed.com/downloads/xlcubedhandler.zip
Once installed this needs to be installed in the GAC, the easiest way is to use Windows Explorer to
drag the file into the \windows\Assembly folder.
Windows Server 2012
To install an assembly to the GAC in 2012, you will need to run PowerShell as an Administrator and use the
following commands (assuming the assembly has been extracted to "c:\xl3"):
Set-location "c:\xl3"
[System.Reflection.Assembly]::Load("System.EnterpriseServices, Version=4.0.0.0,
Culture=neutral, PublicKeyToken=b03f5f7f11d50a3a")
$publish = New-Object System.EnterpriseServices.Internal.Publish
$publish.GacInstall("c:\xl3\xlcubed.handlermapping.dll")
iisreset

7/17/2019 XL Cubed versión 7 UserGuide
http://slidepdf.com/reader/full/xl-cubed-version-7-userguide 465/567
453 | P a g e
XLCubed v7 User Guide – Book IX - SharePoint
Register Handler with IIS
You now need to register the Assembly with IIS, this can be done by editing the SharePoint web.config,
usually in:
\inetpub\wwwroot\wss\VirtualDirectories\80
in the
<system.web>
<compilation>
<assemblies>
collection add the line:
<add assembly="XLCubed.HandlerMapping, Version=1.0.0.0, Culture=neutral,
PublicKeyToken=add6446b63d88928" />
in:
<system.webServer>
<modules>
Add the following:
<add name="XLCubedModule" type="XLCubed.HandlerMapping.XLCubedModule,
XLCubed.HandlerMapping, Version=1.0.0.0, Culture=neutral,
PublicKeyToken=add6446b63d88928" />
Set icon file type
Download the following file: http://www.xlcubed.com/downloads/xlcubed.gif and copy it to the
"Template\Images" folder, for example:
\Program Files\Common Files\Microsoft Shared\Web Server Extensions\14\Template\Images
Or for SharePoint 2013 (the 14 folder exists, but use the 15 instead)
Then edit "docicon.xml" in the "Template\Xml" folder (\Program Files\Common Files\Microsoft
Shared\Web Server Extensions\14\Template\Xml) and add the following line to:
<DocIcons>
<ByExtension>
<Mapping Key="xl3wbz" Value="xlcubed.gif"/>
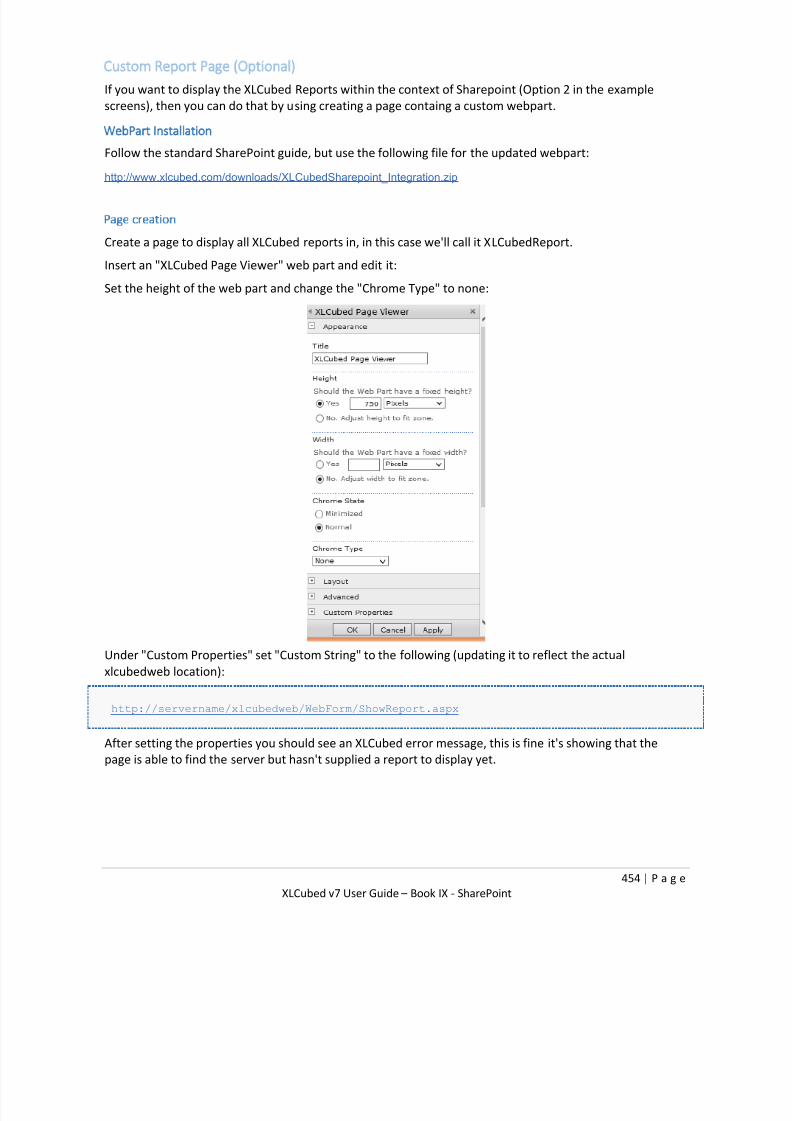
7/17/2019 XL Cubed versión 7 UserGuide
http://slidepdf.com/reader/full/xl-cubed-version-7-userguide 466/567
454 | P a g e
XLCubed v7 User Guide – Book IX - SharePoint
Custom Report Page (Optional)
If you want to display the XLCubed Reports within the context of Sharepoint (Option 2 in the example
screens), then you can do that by using creating a page containg a custom webpart.
WebPart Installation
Follow the standard SharePoint guide, but use the following file for the updated webpart:
http://www.xlcubed.com/downloads/XLCubedSharepoint_Integration.zip
Page creation
Create a page to display all XLCubed reports in, in this case we'll call it XLCubedReport.
Insert an "XLCubed Page Viewer" web part and edit it:
Set the height of the web part and change the "Chrome Type" to none:
Under "Custom Properties" set "Custom String" to the following (updating it to reflect the actual
xlcubedweb location):
http://servername/xlcubedweb/WebForm/ShowReport.aspx
After setting the properties you should see an XLCubed error message, this is fine it's showing that the
page is able to find the server but hasn't supplied a report to display yet.

7/17/2019 XL Cubed versión 7 UserGuide
http://slidepdf.com/reader/full/xl-cubed-version-7-userguide 467/567
455 | P a g e
XLCubed v7 User Guide – Book IX - SharePoint
Configure redirect
The next step is to add the configuration items required for the custom handler installed previously. Open
the SharePoint web.config, usually in:
\inetpub\wwwroot\wss\VirtualDirectories\80
To the section:
<configuration>
<appSettings>
Add a new key:
<add key="XLCubedReportURL" value="http://hvxl3-
sp/SitePages/XLCubedReport.aspx?rep=%rep%&embedded=SharePoint&toolbar=true " />
If you are going for "Option 1" enter the XLCubedWeb server address:
http://xlcubedservername/xlcubedweb/WebForm/ShowReport.aspx?rep=%rep%&embedded=Shar
ePoint
If you have created a custom SharePoint page then use that instead:
http://sharepointserver/SitePages/XLCubedReport.aspx?rep=%rep%&embedded=SharePoint
If you want to include a toolbar when display reports, you can add the following:
&toolbar=true
Subsites
You can also use a relative path to keep navigation within the context of any sub-sites:
./XLCubedReport.aspx?rep=%rep%&embedded=SharePoint
With this kind of configuration a SharePoint XLCubed Report page would need to be created in the every
location to which reports can be published (i.e. \sites\subsite\sitepages\xlcubedreport.aspx,
\SitePages\XLCubedReport.aspx etc.)
Searching
To allow published reports to be indexed by SharePoint you need to register the report extension type with
SharePoint and then add the file type to the list of files to be indexed.

7/17/2019 XL Cubed versión 7 UserGuide
http://slidepdf.com/reader/full/xl-cubed-version-7-userguide 468/567
456 | P a g e
XLCubed v7 User Guide – Book IX - SharePoint
The SharePoint crawler will index the contents of the Workbook as it was at publication time.
Register file extension
Add the following reg keys (updating the version of SharePoint if not 2010):
[HKEY_LOCAL_MACHINE\SOFTWARE\Microsoft\Office
Server\14.0\Search\Setup\ContentIndexCommon\Filters\Extension\.xl3wbz]
@=hex(7):7b,00,32,00,30,00,45,00,38,00,32,00,33,00,43,00,32,00,2d,00,36,00,32,\
00,46,00,33,00,2d,00,34,00,36,00,33,00,38,00,2d,00,39,00,36,00,42,00,44,00,\
2d,00,39,00,30,00,46,00,34,00,46,00,36,00,37,00,38,00,34,00,45,00,42,00,43,\
00,7d,00,00,00,00,00
[HKEY_LOCAL_MACHINE\SOFTWARE\Microsoft\Shared Tools\Web Server
Extensions\14.0\Search\Setup\ContentIndexCommon\Filters\Extension\.xl3wbz]
@=hex(7):7b,00,32,00,30,00,45,00,38,00,32,00,33,00,43,00,32,00,2d,00,36,00,32,\
00,46,00,33,00,2d,00,34,00,36,00,33,00,38,00,2d,00,39,00,36,00,42,00,44,00,\
2d,00,39,00,30,00,46,00,34,00,46,00,36,00,37,00,38,00,34,00,45,00,42,00,43,\
00,7d,00,00,00,00,00
You can download an exported reg file from the following link:
http://www.xlcubed.com/downloads/xlcubedsharepoint_regkey.zip
Add file types to be indexed
Go to the SharePoint Central Administration Website, under Application Managment => Manage Service
Applications => Search Service Application:
Under "Crawling", select "File Types" and click "New File Type":

7/17/2019 XL Cubed versión 7 UserGuide
http://slidepdf.com/reader/full/xl-cubed-version-7-userguide 469/567
457 | P a g e
XLCubed v7 User Guide – Book IX - SharePoint
enter "XL3WBZ" as the extension.
7/17/2019 XL Cubed versión 7 UserGuide
http://slidepdf.com/reader/full/xl-cubed-version-7-userguide 470/567
458 | P a g e
XLCubed v7 User Guide – Book IX - SharePoint
Sharepoint on different server
If SharePoint is on a different server to XLCubedWeb and XLCubedWeb is using "Windows Authentication"
then by default the User's credentials will not be passed from XLCubedWeb to Sharepoint, this will prevent
the reports from displaying correctly (you'd get an invalid or no login credentials error when accessing the
reports)
You could configure Kerberos, this would allow the credentials to be passed correctly (XLCubedWeb usesWebDav to access the reports) or enable the following setting on the XLCubedWeb server:
<add key="UseAppPoolUserForSharepointDownload" value="false" />
With that setting enabled then any SharePoint access from XLCubedWeb will be done using the Application
Pool identity, so set that to run as an account that has the required permissions in SharePoint
Published Connections, Queries and Favourites
To allow publishing of Connections, Sql Queries and Favourites you must create the following folderstructure at the root of the SharePoint site, the users would need to connect at the root level to use this
feature:
/XLCubed
/PublishedConnections
/PublishedGrids
/PublishedSQLQueries
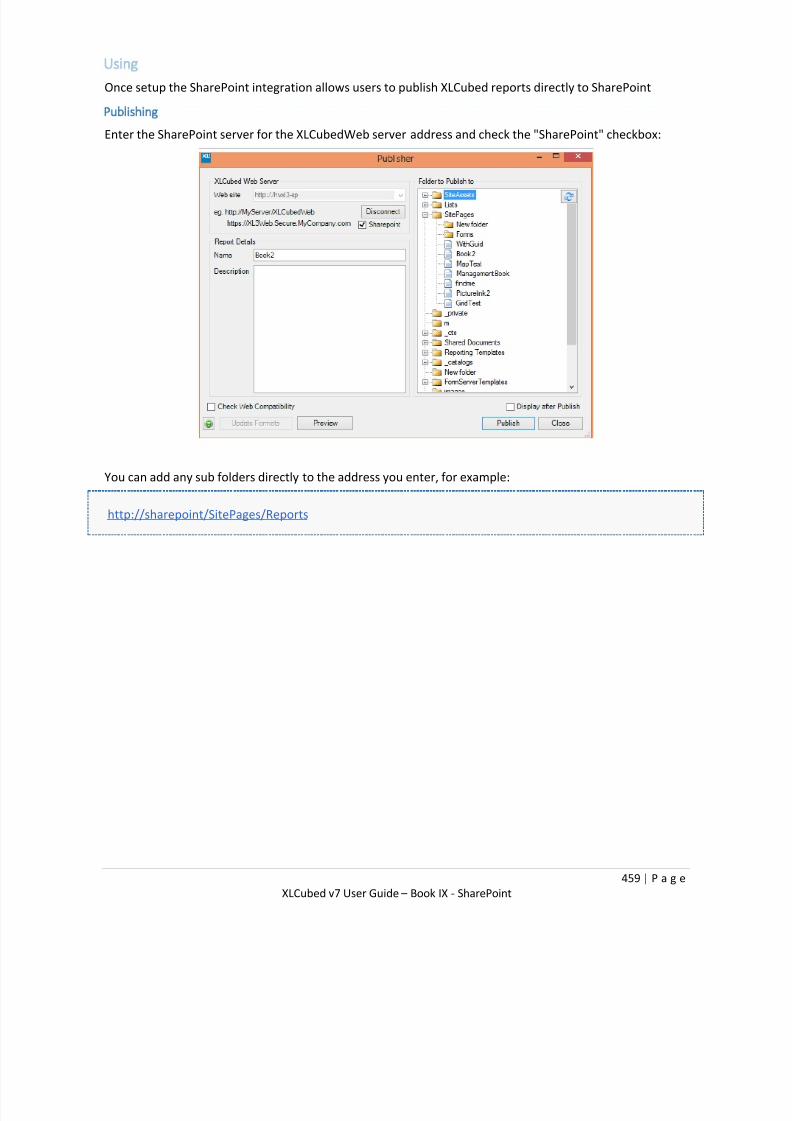
7/17/2019 XL Cubed versión 7 UserGuide
http://slidepdf.com/reader/full/xl-cubed-version-7-userguide 471/567
459 | P a g e
XLCubed v7 User Guide – Book IX - SharePoint
Using
Once setup the SharePoint integration allows users to publish XLCubed reports directly to SharePoint
Publishing
Enter the SharePoint server for the XLCubedWeb server address and check the "SharePoint" checkbox:
You can add any sub folders directly to the address you enter, for example:
http://sharepoint/SitePages/Reports

7/17/2019 XL Cubed versión 7 UserGuide
http://slidepdf.com/reader/full/xl-cubed-version-7-userguide 472/567
460 | P a g e
XLCubed v7 User Guide – Book IX - SharePoint
Viewing
Any published reports will be displayed and viewed within SharePoint:

7/17/2019 XL Cubed versión 7 UserGuide
http://slidepdf.com/reader/full/xl-cubed-version-7-userguide 473/567
461 | P a g e
XLCubed v7 User Guide – Book IX - SharePoint
Customising
dding a ‘Load to Excel’ option
If you want to add an option to load a report directly into Excel you can define a Custom Action with a URL
of:
http://xlcubedserver/xlcubedweb/webform/showreport.aspx?rep={SiteUrl}{ItemUrl}&XL3Repor
tType=excelfixed
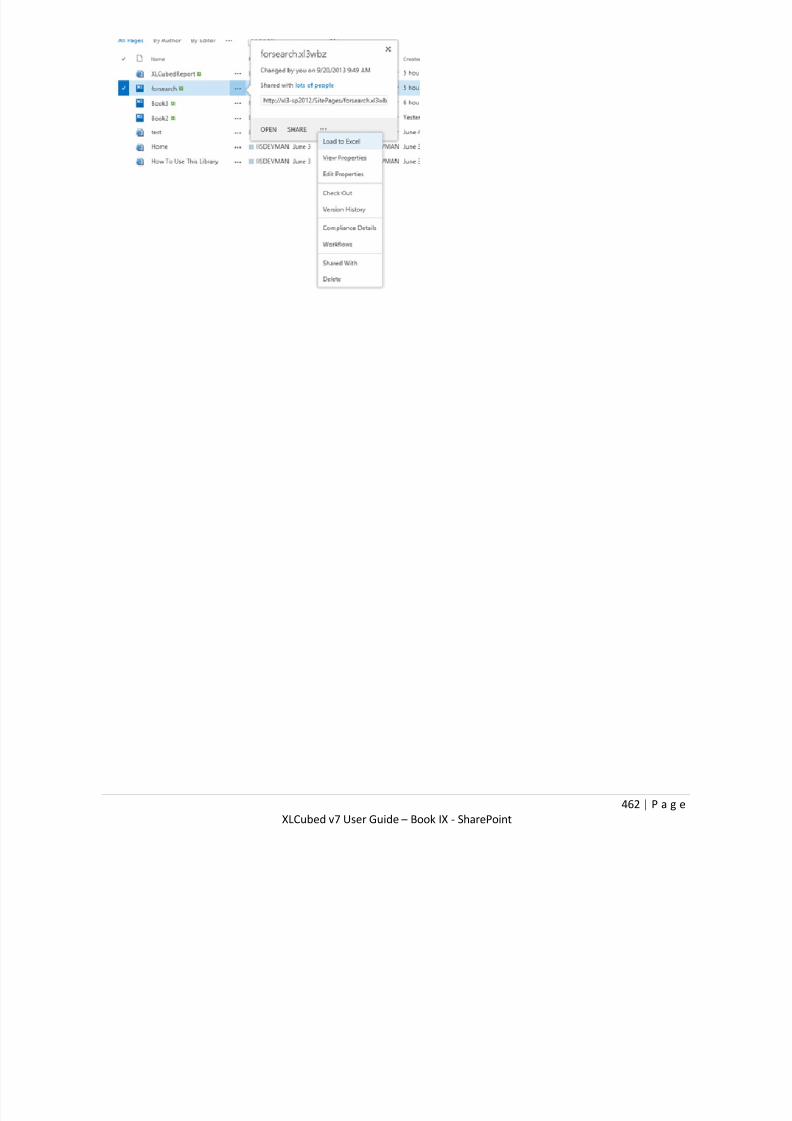
7/17/2019 XL Cubed versión 7 UserGuide
http://slidepdf.com/reader/full/xl-cubed-version-7-userguide 474/567
462 | P a g e
XLCubed v7 User Guide – Book IX - SharePoint

7/17/2019 XL Cubed versión 7 UserGuide
http://slidepdf.com/reader/full/xl-cubed-version-7-userguide 475/567
463 | P a g e
XLCubed v7 User Guide – Book X - Miscellaneous
Book X - Miscellaneous
XLCubed Options
These are the XLCubed installation level defaults which are applied to any new workbooks opened
during the Excel session
Main
• Format File: the default FormatSheet location
• Language: selects XLCubed's interface language
• Hide format sheet: sets whether the format worksheet is hidden when created in new workbooks
• Default at level view in member tree: sets the default view of hierarchies to be level based, rather
than member based
• Default at level view in measure tree: sets the default view of the measures hierarchy to be level
based, rather than member based
•
Sort hierarchies alphabetically: rather than the cube defined order• Show dimensions in folders: display folders shown at a level above the dimension rather than
beneath the dimension
• Limit number of members returned in tree to: limits to specified value in user interface.
• Show right-click menu option at top (restart Excel to apply): the XLCubed right click menu option
is by default at the bottom

7/17/2019 XL Cubed versión 7 UserGuide
http://slidepdf.com/reader/full/xl-cubed-version-7-userguide 476/567
464 | P a g e
XLCubed v7 User Guide – Book X - Miscellaneous
• Use single members on filters: implements 'select and replace' on hierarchies in the filter area of
grid (selecting a member replaces any existing selected member)
• Automatically select Children of first member
• Display Dimension Name with Hierarchy Name: prefixes the hierarchy name with the dimension
name
• Disable Tabular columns in Designer: sets whether XLCubed automatically attempts to disable
unrelated columns for the tabular report designer• Don't show Small Multiples warning: controls whether XLCubed warns when it restricts the
number of charts it shows in a Small Multiple chart
Auto apply changes in Task Pane: grid task pane defaults to 'Auto Apply', i.e. changes are made
instantaneously
• Unicode Compatibility (Excel 2003): this is required for Unicode support in Excel 2003 and earlier.
Note should it only be set in Excel 2003 / XP if Unicode member names exist
• Display Conversion Options: shows the Convert from V5 options in the XLCubed ribbon

7/17/2019 XL Cubed versión 7 UserGuide
http://slidepdf.com/reader/full/xl-cubed-version-7-userguide 477/567
465 | P a g e
XLCubed v7 User Guide – Book X - Miscellaneous
Web Publication
• Default Web Address: the default web address for publishing
• Maximum number of columns allowed: the maximum number of columns allowed per page
•
Maximum number of rows allowed: the maximum number of rows allowed per page
• Log Publication Process: in the event of a problem, logs additional detail
• Check Web Compatibility: checks the workbook pre-publication for any known compatibility
issues.
Workbook Defaults
Controls the defaults for new workbooks.

7/17/2019 XL Cubed versión 7 UserGuide
http://slidepdf.com/reader/full/xl-cubed-version-7-userguide 478/567
466 | P a g e
XLCubed v7 User Guide – Book X - Miscellaneous
• Available Actions - Ignore multiple filter members: if multiple members are selected on filters,
these are ignored when determining which Actions to display
• Replace null values: replaces null values with the contents of the Replace null values with text
field
• Remove nulls when drilling: if there are any null rows/columns when drilling down on a member,
they will be removed so that there are no fully empty rows/columns in the report.
• Remove 0 values when drilling: if there are any rows/columns when drilling down on a member
that only contain zeros, they will be removed so that there are no zero rows/columns in thereport.
• Resize Columns after drilling: this allows a column to resize itself when drilled
• Indent drilled members: when the user drills down on a member, they will be displayed indented

7/17/2019 XL Cubed versión 7 UserGuide
http://slidepdf.com/reader/full/xl-cubed-version-7-userguide 479/567
467 | P a g e
XLCubed v7 User Guide – Book X - Miscellaneous
Workbook Options
These are the workbook level options that can be set for each workbook.
Workbook
Maximum calculation depth during grid refresh: if a workbook has "Circular" dependencies in grids,then this setting controls the maximum number of times to recalculate the same grid
Available Actions - Ignore multiple filter members: with this setting enabled, then the available
actions uses only the first member for each filter hierarchy (if more than one member is select). This
can speed up the display of the action form if lots of members are selected
Worksheet protection password: setting the password value used to "protect" the worksheets will
allow XLCubed to unprotect the sheets during grid refreshes, the sheets are protected again after the
refresh is completed. (This feature is new in Version 7.1)
Reset Format Sheet: this removes any customised formatting from workbook by replacing the existing
FormatSheet sheet with the default sheet as defined in Options > XLCubed Options > Main
Web Publication
Specifies the behaviour and options available in the report once published to XLCubed Web.

7/17/2019 XL Cubed versión 7 UserGuide
http://slidepdf.com/reader/full/xl-cubed-version-7-userguide 480/567
468 | P a g e
XLCubed v7 User Guide – Book X - Miscellaneous
Auto Refresh (minutes): sets an interval after which the published report will automatically refresh in
the user's browser
Display Submit Changes: controls display of Submit Changes toolbar button on XLCubed Web - default
is Yes
Allow Printing: controls display of the Print toolbar button on XLCubed Web - default is Yes
Allow save workbook to Excel: controls display of save to Excel on XLCubed Web - default is Yes Allow save active sheet to Excel: controls display of save to Excel on XLCubed Web
Allow save to repository: controls display of save to Repository on XLCubed Web - default is Yes
Display Refresh button: controls display of Refresh button on XLCubed Web - default is Yes
Enable Right-Click Menus: controls availability of right click menus on XLCubed Web - default is Yes
Save Custom View: controls availability of save custom view on XLCubed Web
Drill Formulae: whether formulae can be drilled on XLCubed Web - default is No
Edit Member Formulae: whether XL3Member formulae can be edited on XLCubed Web - default is Yes
Auto Reload: whether the report auto-reloads if IIS has timed out due to inactivity - default is No
Edit XL3LookupRW without unlocking: enable LookupRW formulae for editing - default is No Open Links in same Window: whether any XL3Link formulae to other websites or reports are opened
in the same or different windows - default is Yes
Use V5 Chart Rendering: For historical (pre v6 reports) this option allows charts to be rendered as per
v5 - default is No
Allow save to Excel live: whether the workbook can be saved as "Live" (i.e. remain interactive) when
downloading from the web - default is Yes. This is new in Version 7.1.
Handle Excel chart types:

7/17/2019 XL Cubed versión 7 UserGuide
http://slidepdf.com/reader/full/xl-cubed-version-7-userguide 481/567
469 | P a g e
XLCubed v7 User Guide – Book X - Miscellaneous

7/17/2019 XL Cubed versión 7 UserGuide
http://slidepdf.com/reader/full/xl-cubed-version-7-userguide 482/567
470 | P a g e
XLCubed v7 User Guide – Book X - Miscellaneous
Formula Options
Replace null values: replaces null values with the contents of the field Replace null values with:
Remove nulls when drilling: if there are any blank rows/columns when drilling down on a member,
they will be removed so that there are no empty rows/columns in the report.
Remove 0 values when drilling: if there are any rows/columns when drilling down on a member that
only contain zeros, they will be removed so that there are no zero rows/columns in the report.
Resize Columns after drilling: this allows a cell to resize itself when a formula is inserted to display the
result correctly.
Indent drilled members: when the user drills down on a member, they will be displayed indented.
Lighten background colour on drill: when the user drills on a member a slightly lighter version of itsbackground colour will be used for the new members (new in Version 7.6)
Writeback
Formula Writeback
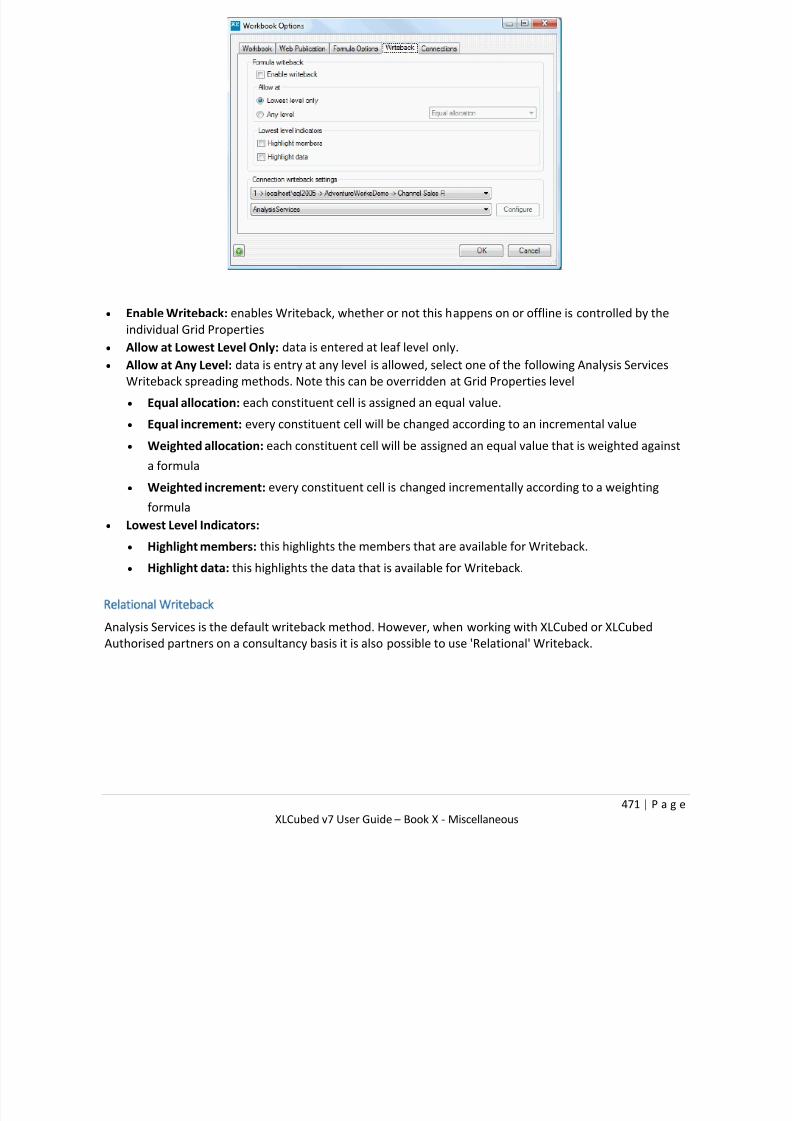
7/17/2019 XL Cubed versión 7 UserGuide
http://slidepdf.com/reader/full/xl-cubed-version-7-userguide 483/567
471 | P a g e
XLCubed v7 User Guide – Book X - Miscellaneous
Enable Writeback: enables Writeback, whether or not this happens on or offline is controlled by the
individual Grid Properties Allow at Lowest Level Only: data is entered at leaf level only.
Allow at Any Level: data is entry at any level is allowed, select one of the following Analysis Services
Writeback spreading methods. Note this can be overridden at Grid Properties level
Equal allocation: each constituent cell is assigned an equal value.
Equal increment: every constituent cell will be changed according to an incremental value
Weighted allocation: each constituent cell will be assigned an equal value that is weighted against
a formula
Weighted increment: every constituent cell is changed incrementally according to a weighting
formula
Lowest Level Indicators:
Highlight members: this highlights the members that are available for Writeback.
Highlight data: this highlights the data that is available for Writeback.
Relational Writeback
Analysis Services is the default writeback method. However, when working with XLCubed or XLCubed
Authorised partners on a consultancy basis it is also possible to use 'Relational' Writeback.

7/17/2019 XL Cubed versión 7 UserGuide
http://slidepdf.com/reader/full/xl-cubed-version-7-userguide 484/567
472 | P a g e
XLCubed v7 User Guide – Book X - Miscellaneous
When using relational writeback, the server and database being used must be specified in the dialog
above.
Connections
Connection details can optionally be specified within defined Excel cells in the workbook. These can also be
parametrised for web deployment.
In Excel, any changes made to the connection via the defined cells will only take effect after closing and re-
opening the workbook. When published, if they have been set as web parameters, the connection detail
can be passed into the report as part of the calling URL. This enables straightforward switching of
published reports between development / acceptance and production databases in environments where
the reporting is hosted within other portals such as SharePoint.
To access the parameters in the published report, click on the view parameters icon from Recent reports,
as shown below.
Connection details can optionally be specified within defined Excel cells in the workbook. These can also beparametrised for web deployment.

7/17/2019 XL Cubed versión 7 UserGuide
http://slidepdf.com/reader/full/xl-cubed-version-7-userguide 485/567
473 | P a g e
XLCubed v7 User Guide – Book X - Miscellaneous
This is accessed via the Options > Workbook Options > Connections tab. Specify the values for each
parameter, and where required change the server, database, cube, and whether the report requires a
password before pressing Get URL.
On accessing the report through the URL, the connection will switch to the server and database specified.

7/17/2019 XL Cubed versión 7 UserGuide
http://slidepdf.com/reader/full/xl-cubed-version-7-userguide 486/567
474 | P a g e
XLCubed v7 User Guide – Book X - Miscellaneous
Language Options
New in Version 7.5 - you can define on this tab the report name and description to be displayed in for
different language users.

7/17/2019 XL Cubed versión 7 UserGuide
http://slidepdf.com/reader/full/xl-cubed-version-7-userguide 487/567
475 | P a g e
XLCubed v7 User Guide – Book X - Miscellaneous
MDX Calculations
Not all OLAP environments are as rich as we, the analysts would like. These examples show how XLCubed
allows the power of OLAP to be simply used to improve our analyses.
Creating Calculated Members (based on the Bicycle Sales cube)
We will create new Gross Profit and Gross Profit Margin measures.
Start by creating a connection to the BicycleSales Demo Cube. This cube only has one measure, Value, but
several different 'views' of the data, provided by the KeyFigures hierarchy.
To create the calculated measures:
1. Open the Manage Calculations dialog by selecting the XLCubed > Custom Calculations ribbon or
menu option.
2. To create the Gross Profit member, click the Insert a new calculated member toolbar button
3. A new 'untitled' member will appear. Fill in the following details for the new member:
Name Gross Profit
Parent Hierarchy KeyFigures
Parent Member [KeyFigures].[All]
Expression [KeyFigures].[All].&[Revenue] - [KeyFigures].[All].&[Cost of Sales] -
[KeyFigures].[All].&[Production Costs]
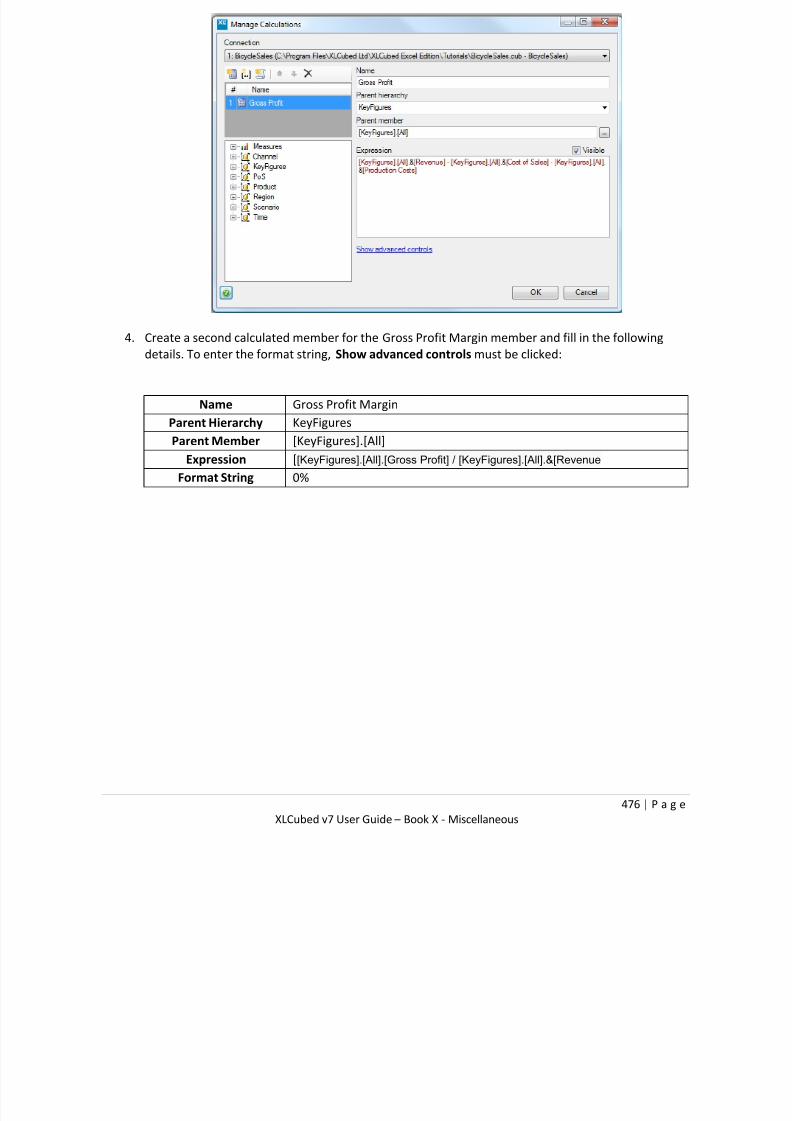
7/17/2019 XL Cubed versión 7 UserGuide
http://slidepdf.com/reader/full/xl-cubed-version-7-userguide 488/567
476 | P a g e
XLCubed v7 User Guide – Book X - Miscellaneous
4. Create a second calculated member for the Gross Profit Margin member and fill in the following
details. To enter the format string, Show advanced controls must be clicked:
Name Gross Profit Margin
Parent Hierarchy KeyFigures
Parent Member [KeyFigures].[All]
Expression [[KeyFigures].[All].[Gross Profit] / [KeyFigures].[All].&[Revenue
Format String 0%

7/17/2019 XL Cubed versión 7 UserGuide
http://slidepdf.com/reader/full/xl-cubed-version-7-userguide 489/567
477 | P a g e
XLCubed v7 User Guide – Book X - Miscellaneous
5. We now have members in the KeyFigures hierarchy but if we want to use them as normal measures
we need to create two more members in the Measures hierarchy:
Name Gross Profit
Parent Hierarchy Measures
Parent Member Leave empty
Expression [[KeyFigures].[All].[Gross Profit Margin].[Measures].[Value])
Name Gross Profit Margin
Parent Hierarchy Measures
Parent Member Leave empty
Expression [[KeyFigures].[All].[Gross Profit Margin].[Measures].[Value])
Format String 0%
6. Click on OK to create the calculated members
We can now see the new measures in context. Let's find badly performing product groups
for 2004.
1. Click on the XLCubed > Grid ribbon item (or the XLCubed > Design Grid menu item in Excel
2003 and below). For more information about using this dialog, see Report Designer.

7/17/2019 XL Cubed versión 7 UserGuide
http://slidepdf.com/reader/full/xl-cubed-version-7-userguide 490/567
478 | P a g e
XLCubed v7 User Guide – Book X - Miscellaneous
2. Move Measures to columns, Product to rows and Time to headers.
3. Click on the Time hierarchy, then select 2004, the year we want to analyse.
4. Click on the Measures hierarchy to select the Gross Profit and Gross Profit Margin measures.
5. Click OK to insert the Grid.
6. When we drill down on the Product hierarchy, we can see that Road S8000 is the failing
product.
We could extend this report to use In-Cell Charts.

7/17/2019 XL Cubed versión 7 UserGuide
http://slidepdf.com/reader/full/xl-cubed-version-7-userguide 491/567
479 | P a g e
XLCubed v7 User Guide – Book X - Miscellaneous
Creating Named Sets
A named set is a Multidimensional Expressions (MDX) expression that returns a set of dimension members.
Named sets can be created at cube level or within an application such as XLCubed. They can be created
combining cube data, arithmetic operators, numbers and functions.
You create a named set from the Custom Calculation tab:
Click to Insert a new calculated set.
In this example I have created a named set, RacksAndStands, which is a grouping of Bike Racks and BikeStands.
The expression needs to be inside braces as below { } and separated by commas.
{[Product].[Product Model Categories].[Subcategory].&[26],[Product].[Product Model
Categories].[Subcategory].&[27]}
The next step is to include the named set in the report:

7/17/2019 XL Cubed versión 7 UserGuide
http://slidepdf.com/reader/full/xl-cubed-version-7-userguide 492/567
480 | P a g e
XLCubed v7 User Guide – Book X - Miscellaneous
You must be editing the hierarchy/dimension that the named set is linked to, in this example Product
Model Categories.
Click on the Advanced tab and select Member Set
You should see your named set appearing as below, select it and click OK.
You can then select to include/exclude the named set in your report.
In this example the members of the named set will not appear in the report.
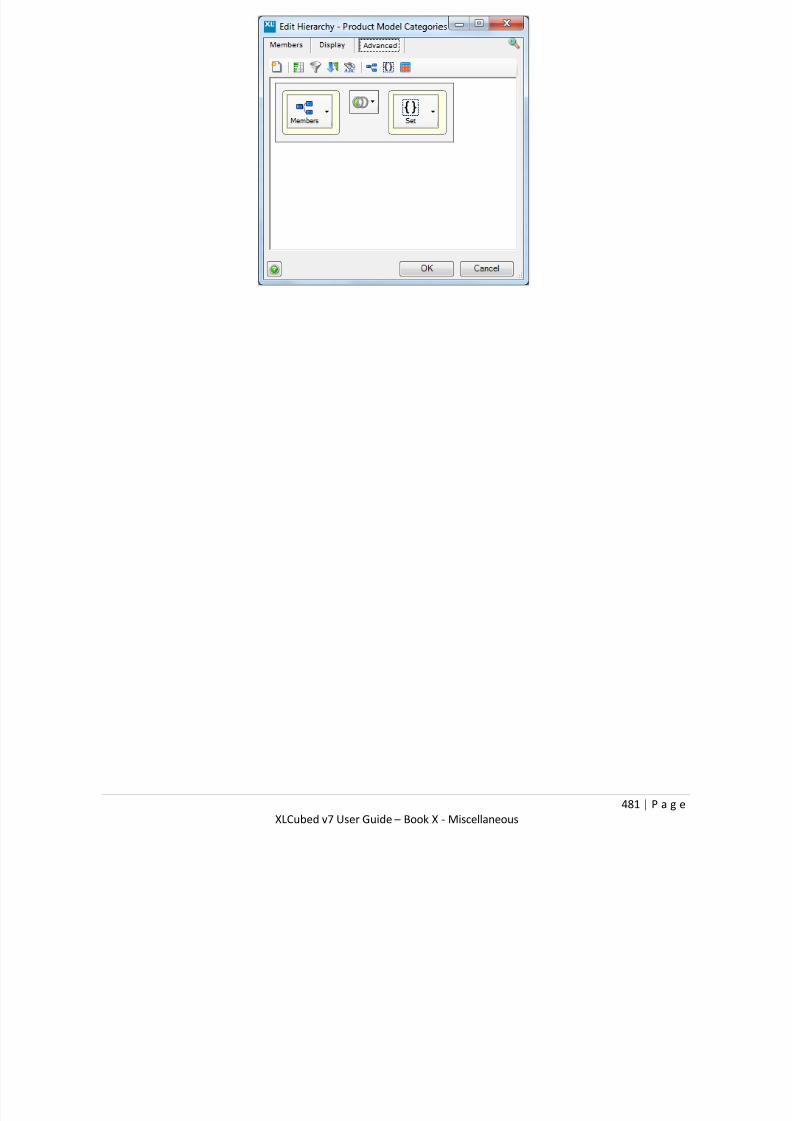
7/17/2019 XL Cubed versión 7 UserGuide
http://slidepdf.com/reader/full/xl-cubed-version-7-userguide 493/567
481 | P a g e
XLCubed v7 User Guide – Book X - Miscellaneous

7/17/2019 XL Cubed versión 7 UserGuide
http://slidepdf.com/reader/full/xl-cubed-version-7-userguide 494/567
482 | P a g e
XLCubed v7 User Guide – Book X - Miscellaneous
Show with Captions
New in v7.2 there is an option within Custom Calculations to switch from showing unique names to
captions
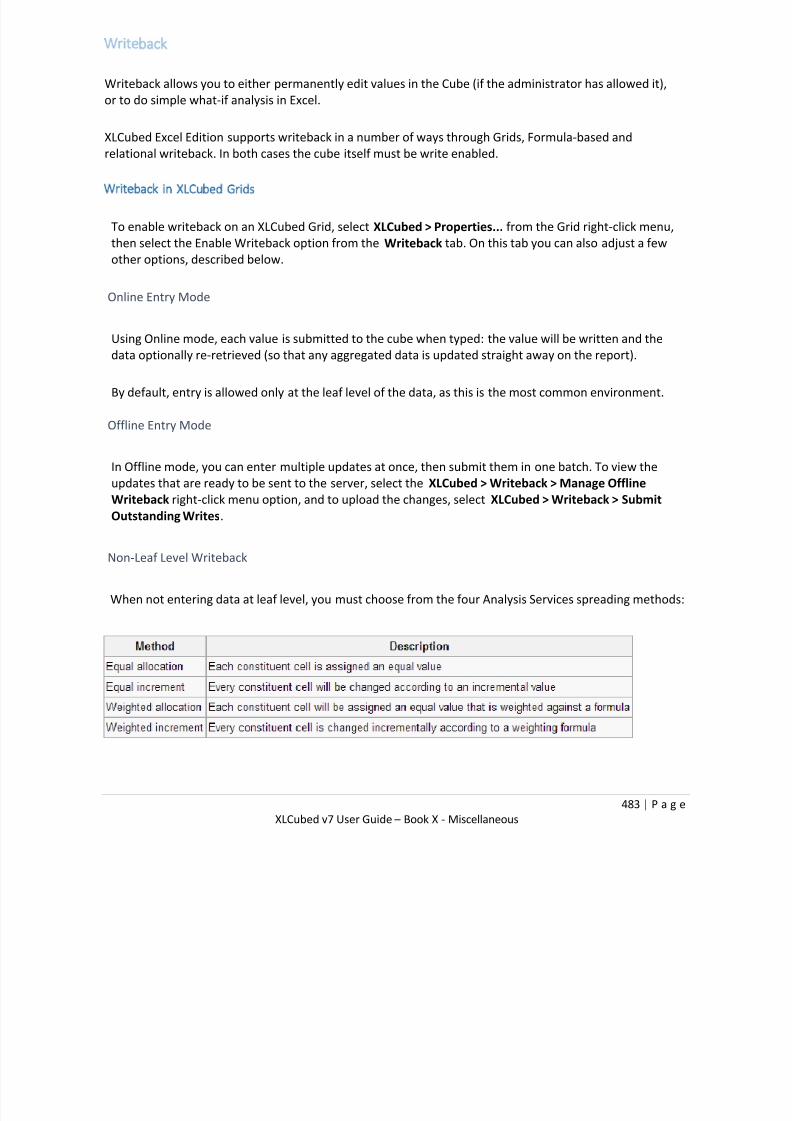
7/17/2019 XL Cubed versión 7 UserGuide
http://slidepdf.com/reader/full/xl-cubed-version-7-userguide 495/567
483 | P a g e
XLCubed v7 User Guide – Book X - Miscellaneous
Writeback
Writeback allows you to either permanently edit values in the Cube (if the administrator has allowed it),
or to do simple what-if analysis in Excel.
XLCubed Excel Edition supports writeback in a number of ways through Grids, Formula-based and
relational writeback. In both cases the cube itself must be write enabled.
Writeback in XLCubed Grids
To enable writeback on an XLCubed Grid, select XLCubed > Properties... from the Grid right-click menu,
then select the Enable Writeback option from the Writeback tab. On this tab you can also adjust a few
other options, described below.
Online Entry Mode
Using Online mode, each value is submitted to the cube when typed: the value will be written and the
data optionally re-retrieved (so that any aggregated data is updated straight away on the report).
By default, entry is allowed only at the leaf level of the data, as this is the most common environment.
Offline Entry Mode
In Offline mode, you can enter multiple updates at once, then submit them in one batch. To view the
updates that are ready to be sent to the server, select the XLCubed > Writeback > Manage Offline
Writeback right-click menu option, and to upload the changes, select XLCubed > Writeback > SubmitOutstanding Writes.
Non-Leaf Level Writeback
When not entering data at leaf level, you must choose from the four Analysis Services spreading methods:
7/17/2019 XL Cubed versión 7 UserGuide
http://slidepdf.com/reader/full/xl-cubed-version-7-userguide 496/567
484 | P a g e
XLCubed v7 User Guide – Book X - Miscellaneous
Data can then be entered for aggregate levels in the cube, and will be spread according to the rule
specified.
Note that non-leaf Writeback in the Analysis Services environment should be used with caution since it can
be time-consuming, depending on cube size and dimensionality.
Formula Writeback
There are two XLCubed formulae which handle Analysis Services writeback:XL3DoWriteback formula and
XL3LookupRW formula.
XL3DoWriteback allows a value held in another cell to be written back to the cube whereas with
XL3LookupRW the formula itself is overwritten directly.
In most cases XL3DoWriteback offers more flexibility and control.
There is also XL3RunSQL formula which is available for relational SQL updates.
Relational Writeback
In XLCubed > Options > Workbook Options, you can specify whether to use Standard (Analysis Services) or
Relational writeback. Relational writeback requires certain cube customisations, and is typically a
consultancy-led process to provide additional flexibility or performance over the standard writeback
processing.
Relational writeback in XLCubed allows writeback operations to call SQL Stored Procedures - these
procedures can be used to store additional data (i.e. text commentary) or perform advanced
transformation on the written values before applying them to the cube.
Analysis Services Cube Configuration
• The cube needs to be enabled for writeback, using the standard approach,
• An additional table (henceforth RWritetable, mirroring the fact table structure, is created in the
source SQL database, and added into the datasource view,
• An additional ROLAP Partition is added to the AS database, using the RWritetable,
• The standard writeback table needs to remain in place although is essentially unused.

7/17/2019 XL Cubed versión 7 UserGuide
http://slidepdf.com/reader/full/xl-cubed-version-7-userguide 497/567
485 | P a g e
XLCubed v7 User Guide – Book X - Miscellaneous
ANALYSIS SERVICES 2008 R2
In Analysis Services 2008 R2, the additional table RWritetableis an optional step. Instead, it is possible to
change the storage mode of the Writeback table to be ROLAP, it is then possible for the StoredProcedure to make updates directly to the standard Writeback table (NB. if using this approach then the
SQL updates cannot update the same slice/measure being written back by the user, but can update
other measures/slices. This is useful, for example, in a Workflow situation to move data from one slice
to another).
Stored Procedure Config
A stored procedure must be created within the source SQL database, configured to the rules outlined
below. It is only this stored procedure which will be called from XLCubed when a relational writeback isinvoked, though it can of course call other procedures as required. The fundamental job of the
procedure will be to populate the RWritetable.
Procedure Name
• [dbo].[XL3_DatabaseName_CubeName_Writeback]
◆Replace any spaces in the database or cube name with ‘_’
PARAMETERNAMES
• @Dimension_Hierarchy
◆(Hierarchy unique name without the [ ], replace ‘.’ With ‘_’)
◆The values for members will be the member keys, passed as
NVarChar(max)
• @Value
◆Values will be passed as T-SQL float (.Net double).

7/17/2019 XL Cubed versión 7 UserGuide
http://slidepdf.com/reader/full/xl-cubed-version-7-userguide 498/567
486 | P a g e
XLCubed v7 User Guide – Book X - Miscellaneous
◆For measures the measure caption will be passed as there is no
row key.
EXAMPLE
A very simple example procedure follows. (This is the simplest case, anticipating the entered value as
Budget, rather than handling the possibility of several measures being available for entry):
AS Database Name
Retail

7/17/2019 XL Cubed versión 7 UserGuide
http://slidepdf.com/reader/full/xl-cubed-version-7-userguide 499/567
487 | P a g e
XLCubed v7 User Guide – Book X - Miscellaneous
AS Cube Name
Retail Forecast
Created Relational Writeback table
RetailRelWriteback
CREATE PROCEDURE[dbo].[XL3_Retail_Retail_Forecast_Writeback]
@Accounts_ChartOfAccounts nvarchar(50),
@Measures nvarchar(50),
@Period_Period nvarchar(50),
@Unit_Category1 nvarchar(50),
@Unit_Category2 nvarchar(50),
@Unit_Category3 nvarchar(50),
@Unit_Category4 nvarchar(50),
@Unit_Category5 nvarchar(50),
@Unit_Organisation nvarchar(50),
@Value double precision
AS BEGIN
SET NOCOUNT ON;
insert into [dbo].[RetailRelWriteback](
[Account],
[Unit],
[Period],
[Budget], [Forecast],
[Actual], [Phasing],
[cCurrency], [nEntity]
)
values(
)
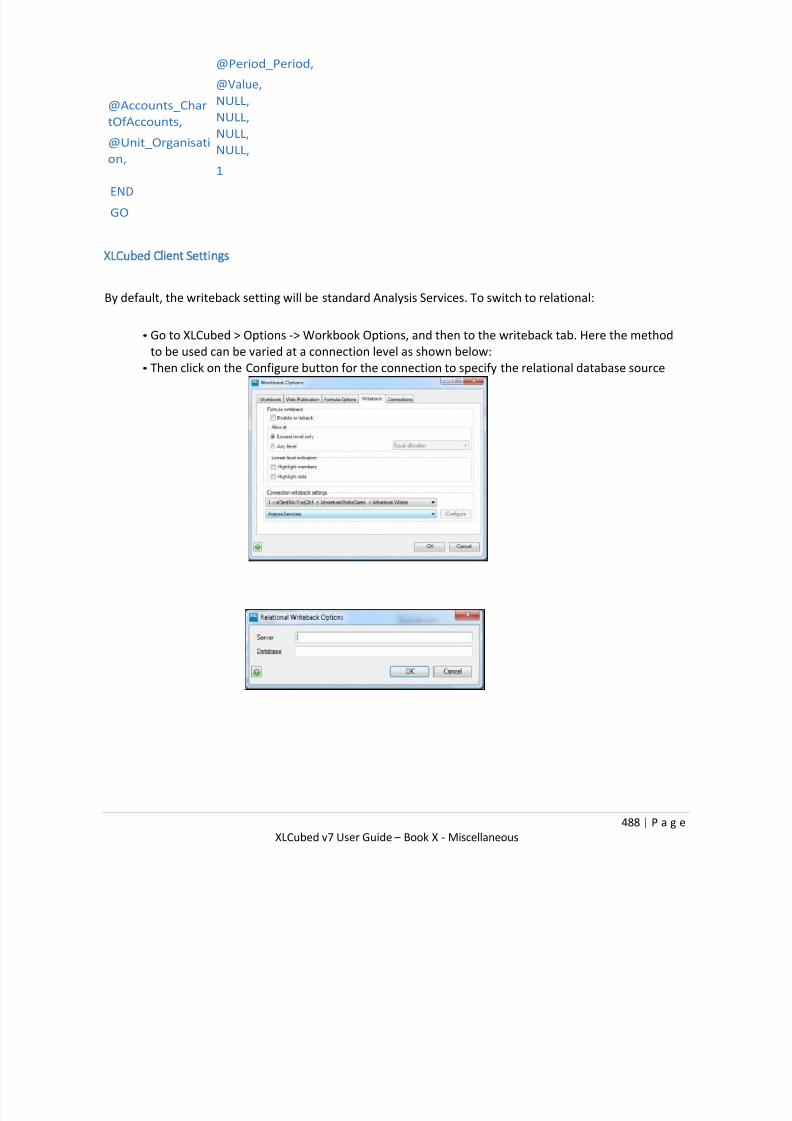
7/17/2019 XL Cubed versión 7 UserGuide
http://slidepdf.com/reader/full/xl-cubed-version-7-userguide 500/567
488 | P a g e
XLCubed v7 User Guide – Book X - Miscellaneous
@Accounts_Char
tOfAccounts,
@Unit_Organisati
on,
@Period_Period,
@Value,
NULL,
NULL,
NULL,
NULL,
1
END
GO
XLCubed Client Settings
By default, the writeback setting will be standard Analysis Services. To switch to relational:
•
Go to XLCubed > Options -> Workbook Options, and then to the writeback tab. Here the methodto be used can be varied at a connection level as shown below:
• Then click on the Configure button for the connection to specify the relational database source

7/17/2019 XL Cubed versión 7 UserGuide
http://slidepdf.com/reader/full/xl-cubed-version-7-userguide 501/567
489 | P a g e
XLCubed v7 User Guide – Book X - Miscellaneous
Once relational is specified, the writeback process will be unchanged from a user perspective, but will
call the stored procedure specified in steps 1 and 2.
It's worth noting that the change is now applicable for the connection, so relational writeback will now be
used for grids as well as the writeback formula (XL3LookupRW and XL3DoWriteback.
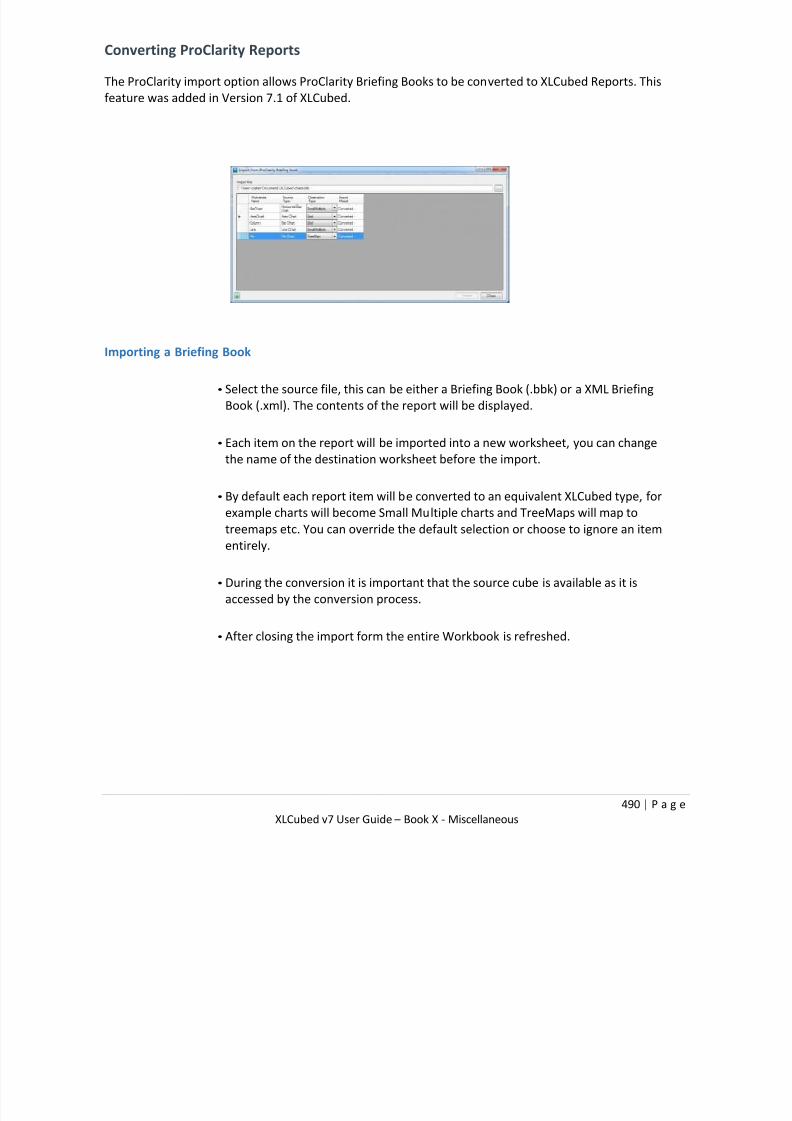
7/17/2019 XL Cubed versión 7 UserGuide
http://slidepdf.com/reader/full/xl-cubed-version-7-userguide 502/567
490 | P a g e
XLCubed v7 User Guide – Book X - Miscellaneous
Converting ProClarity Reports
The ProClarity import option allows ProClarity Briefing Books to be converted to XLCubed Reports. This
feature was added in Version 7.1 of XLCubed.
Importing a Briefing Book
• Select the source file, this can be either a Briefing Book (.bbk) or a XML Briefing
Book (.xml). The contents of the report will be displayed.
• Each item on the report will be imported into a new worksheet, you can change
the name of the destination worksheet before the import.
•
By default each report item will be converted to an equivalent XLCubed type, forexample charts will become Small Multiple charts and TreeMaps will map to
treemaps etc. You can override the default selection or choose to ignore an item
entirely.
• During the conversion it is important that the source cube is available as it is
accessed by the conversion process.
• After closing the import form the entire Workbook is refreshed.

7/17/2019 XL Cubed versión 7 UserGuide
http://slidepdf.com/reader/full/xl-cubed-version-7-userguide 503/567
491 | P a g e
XLCubed v7 User Guide – Book X - Miscellaneous
Publishing PowerPivot Reports
From XLCubed v7.5 users can take XLCubed workbooks which connect to PowerPivot data, and
publish these to XLCubed Web Edition. This enables sharing of the reports or dashboards with
non-PowerPivot users through XLCubed Web Edition and also provides increased scalability and
security options.
The publication process moves the data model directly onto the specified Tabular AnalysisServices instance, and dynamically changes the data connection on the published report. The
publication process does not require SharePoint or Excel services.
Requirements
• XLCubed Web Edition v7.5 Enterprise Edition with the scheduling feature set up
• Microsoft Analysis Services 2012 in Tabular mode
Overview
XLCubed can monitor one or more directories on the Web Edition server, usually in the
Web repository. When an appropriate set of files is created or updated in that directory,
the PowerPivot connections are published to Analysis Services:
• The connection file is uploaded to a common network share
• The information is copied to an Analysis Services database
• The XLCubed report is modified to point to the newly created database
Configuration
A new configuration file must be created in the XLCubed Web Edition repository:
\Repository\_xlcubed_\_scheduling_\monitor.xml
This configuration file is an XML file containing one or more powerPivot elements, enclosed in
a single monitor element:
<monitor>
<powerPivot
folder="C:\inetpub\wwwroot\XLCubedWeb\Repository\PowerPivot Reports"
includeSubfolders="true" server="as2012server" uploadShare="\\as2012server\powerPivotFiles\"
serverLocalPath="C:\powerPivotFiles" allowOverwrite="true"
/>
</monitor>

7/17/2019 XL Cubed versión 7 UserGuide
http://slidepdf.com/reader/full/xl-cubed-version-7-userguide 504/567
492 | P a g e
XLCubed v7 User Guide – Book X - Miscellaneous
Each PowerPivotelement defines a repository folder to watch, and information about
what to do with new files:
Folder the folder to watch
Include subfolders whether to also watch subfolders of the main folder
Server the Analysis Server 2012 Vertipaq server on which to create the database
uploadShare a shared directory on the Analysis Services server, which can be used for temporarily
holding the connection information. The user running the scheduler service must
have write access to this folder
serverLocalPath the same directory as uploadShare, but from the point of view of the server
allowOverwrite defines whether any existing database should be overwritten. Can be set to true or
false
roleMembers a semicolon delimited set of usernames and groups to give access to the new
database
notificationEmail an email address to send the notification to when a new database is uploaded.
Optional; uses the first available SMTP server
If the server is on the same machine as XLCubed Web Edition, then uploadShareand
serverLocalPathcan both be left blank, and the scheduler will just use the workbook where it is.
Note that the scheduler user must have permissions on the Analysis Services server to restore a database.
Any messages, success or failure, will be written to the standard scheduling error log file.
7/17/2019 XL Cubed versión 7 UserGuide
http://slidepdf.com/reader/full/xl-cubed-version-7-userguide 505/567
493 | P a g e
XLCubed v7 User Guide – Book X - Miscellaneous
Using Grids with Protected Worksheets
XLCubed Grids can coexist with protected worksheets in several ways.
Set the XLCubed Workbook Options to use your password
In the XLCubed > Options > Workbook Options... dialog, you can set the Workbook > Workbookprotection password. The Grids should then update as required.
Using the Grid on the protected worksheet
The Grid may be placed directly on the worksheet that is to be protected. To do this, follow these steps:
On the Grid Properties > Appearance tab, deselect Apply formatting and Merge repeating
cells
Set all the Grid cells to be unlocked. See this Microsoft article for details on how to lock andunlock specific cells.
If the Grid can be edited by drilling or other member selection methods, also unlock cells to
accommodate the potential expansion.
Protect the sheet. At least the following options must be allowed:
Format cells
Format columns
Format rows
If Format columns and Format rows protection are desired, then Grid Properties > Behaviour > Resize
columns/rows after refresh must be disabled.
Placing the Grid on a non-protected worksheet
The Grid can be placed on a non-protected worksheet, and the data brought to the protected sheet by
using either:
• The Camera tool
•
Formulae
Alternatives
• Publishing the finished reports
• Using Formulae instead of Grids
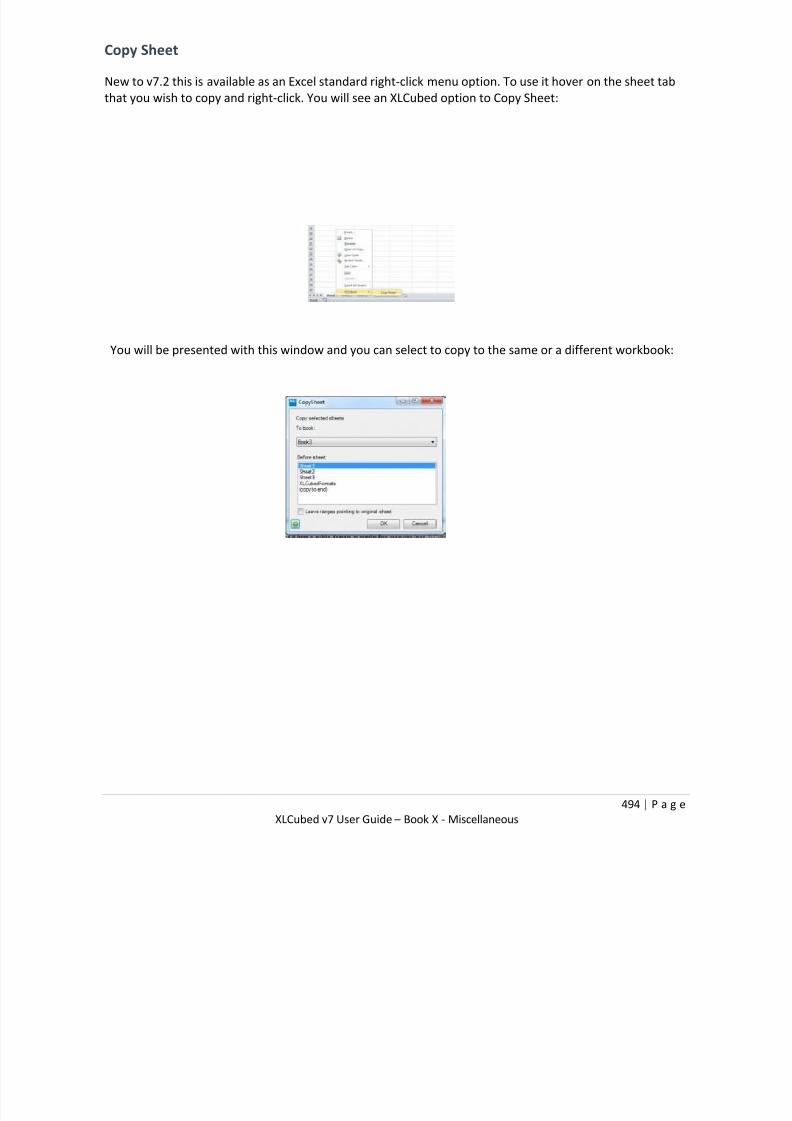
7/17/2019 XL Cubed versión 7 UserGuide
http://slidepdf.com/reader/full/xl-cubed-version-7-userguide 506/567
494 | P a g e
XLCubed v7 User Guide – Book X - Miscellaneous
Copy Sheet
New to v7.2 this is available as an Excel standard right-click menu option. To use it hover on the sheet tab
that you wish to copy and right-click. You will see an XLCubed option to Copy Sheet:
You will be presented with this window and you can select to copy to the same or a different workbook:

7/17/2019 XL Cubed versión 7 UserGuide
http://slidepdf.com/reader/full/xl-cubed-version-7-userguide 507/567
495 | P a g e
XLCubed v7 User Guide – Book X - Miscellaneous
Macros
The following XLCubed macros can be called from VBA:
Code Description Introduced
Application.Run
"XL3RefreshGrid","Sheet1!a1"
Include an address for the
grid is to be refreshed
v6.1
Application.Run “XL3RefreshAllGrids” Refreshes all grids v6.0
Application.Run “XL3RefreshTable”,
“Sheet1!A1”
Include an address for the
Table to be refreshed
v7.1
Application.Run “XL3RefreshAllTables” Refreshes all Tables v7.0
Application.CalculateFull Force a calculate of XLCubed
formulae
All
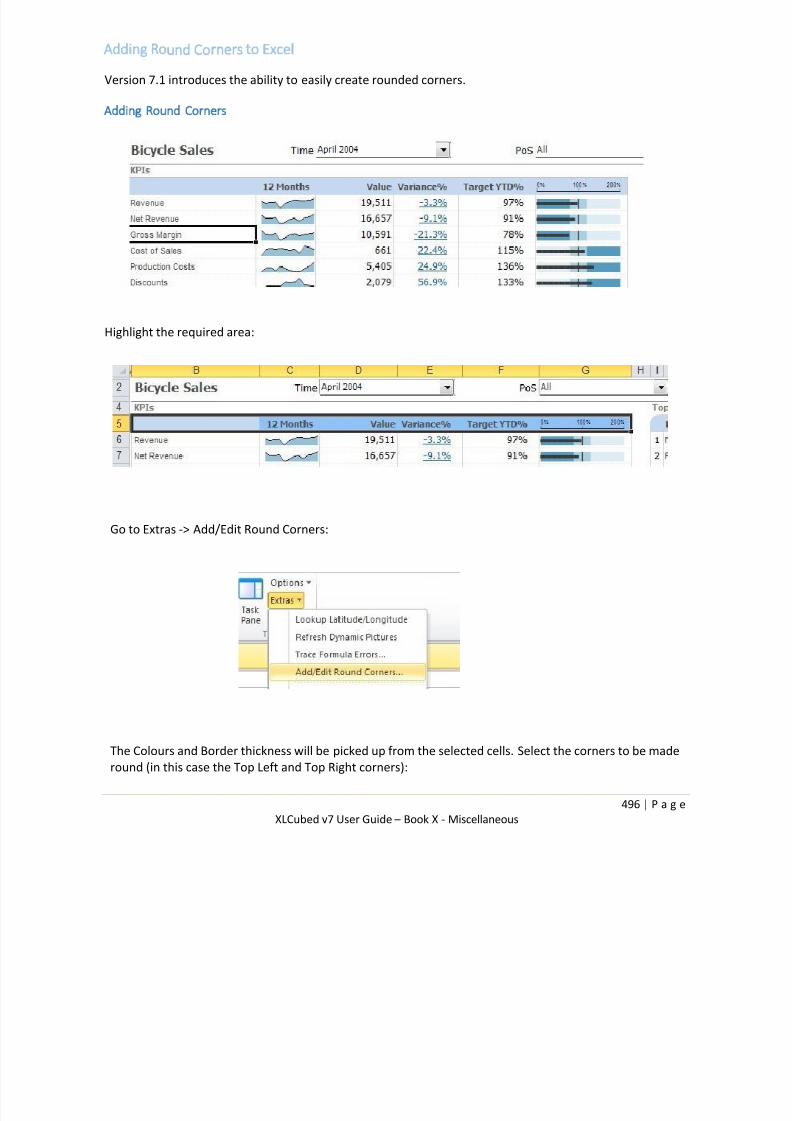
7/17/2019 XL Cubed versión 7 UserGuide
http://slidepdf.com/reader/full/xl-cubed-version-7-userguide 508/567
496 | P a g e
XLCubed v7 User Guide – Book X - Miscellaneous
Adding Round Corners to Excel
Version 7.1 introduces the ability to easily create rounded corners.
Adding Round Corners
Highlight the required area:
Go to Extras -> Add/Edit Round Corners:
The Colours and Border thickness will be picked up from the selected cells. Select the corners to be made
round (in this case the Top Left and Top Right corners):

7/17/2019 XL Cubed versión 7 UserGuide
http://slidepdf.com/reader/full/xl-cubed-version-7-userguide 509/567
497 | P a g e
XLCubed v7 User Guide – Book X - Miscellaneous
Click OK to apply the borders
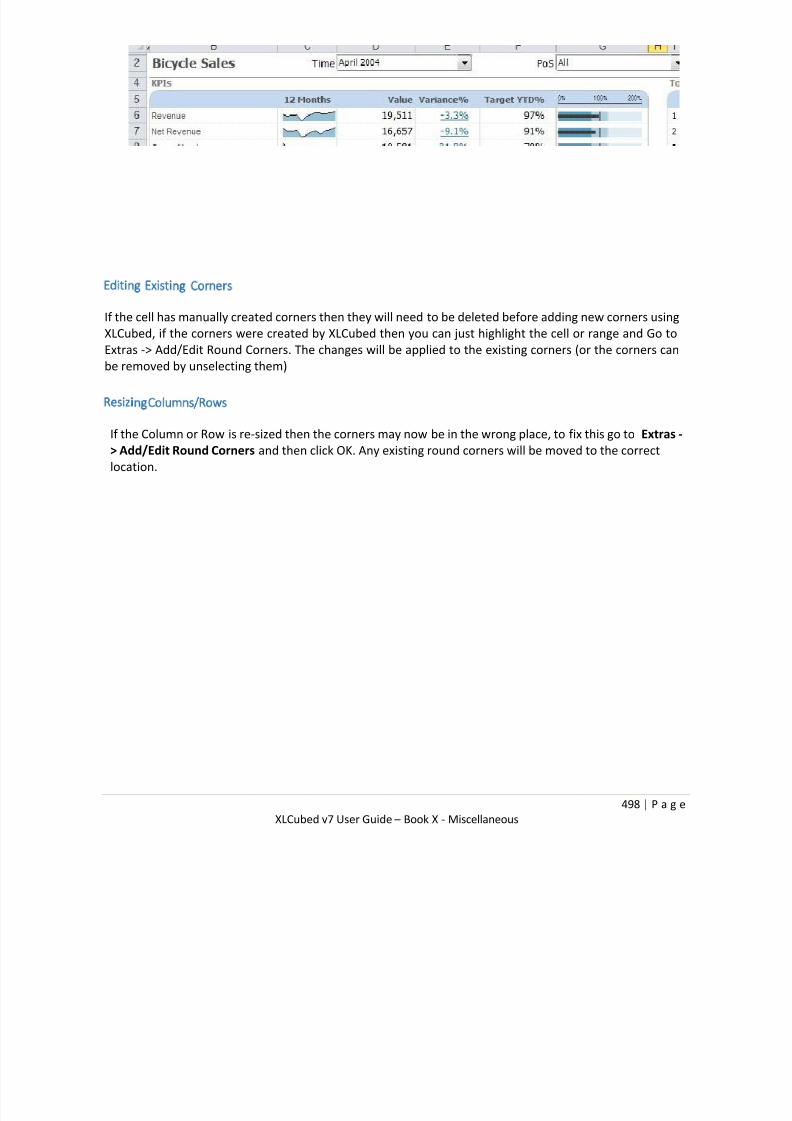
7/17/2019 XL Cubed versión 7 UserGuide
http://slidepdf.com/reader/full/xl-cubed-version-7-userguide 510/567
498 | P a g e
XLCubed v7 User Guide – Book X - Miscellaneous
Editing Existing Corners
If the cell has manually created corners then they will need to be deleted before adding new corners using
XLCubed, if the corners were created by XLCubed then you can just highlight the cell or range and Go toExtras -> Add/Edit Round Corners. The changes will be applied to the existing corners (or the corners can
be removed by unselecting them)
Resizing Columns/Rows
If the Column or Row is re-sized then the corners may now be in the wrong place, to fix this go to Extras -
> Add/Edit Round Corners and then click OK. Any existing round corners will be moved to the correct
location.

7/17/2019 XL Cubed versión 7 UserGuide
http://slidepdf.com/reader/full/xl-cubed-version-7-userguide 511/567
499 | P a g e
XLCubed v7 User Guide – Book X - Miscellaneous
Pie Charts in Web Edition
Chart in Excel before publishing:
After publishing to web:
To resolve this you need to:
• Click on the pie chart in Excel and choose Format data series

7/17/2019 XL Cubed versión 7 UserGuide
http://slidepdf.com/reader/full/xl-cubed-version-7-userguide 512/567
500 | P a g e
XLCubed v7 User Guide – Book X - Miscellaneous
•
choose solid fill rather than automatic and choose a fill colour - this will set everything to onecolour
• then right-click to select each data series individually and choose Format Data Point and set to the
appropriate colour for each one
Having done that it will publish as you see it in Excel.
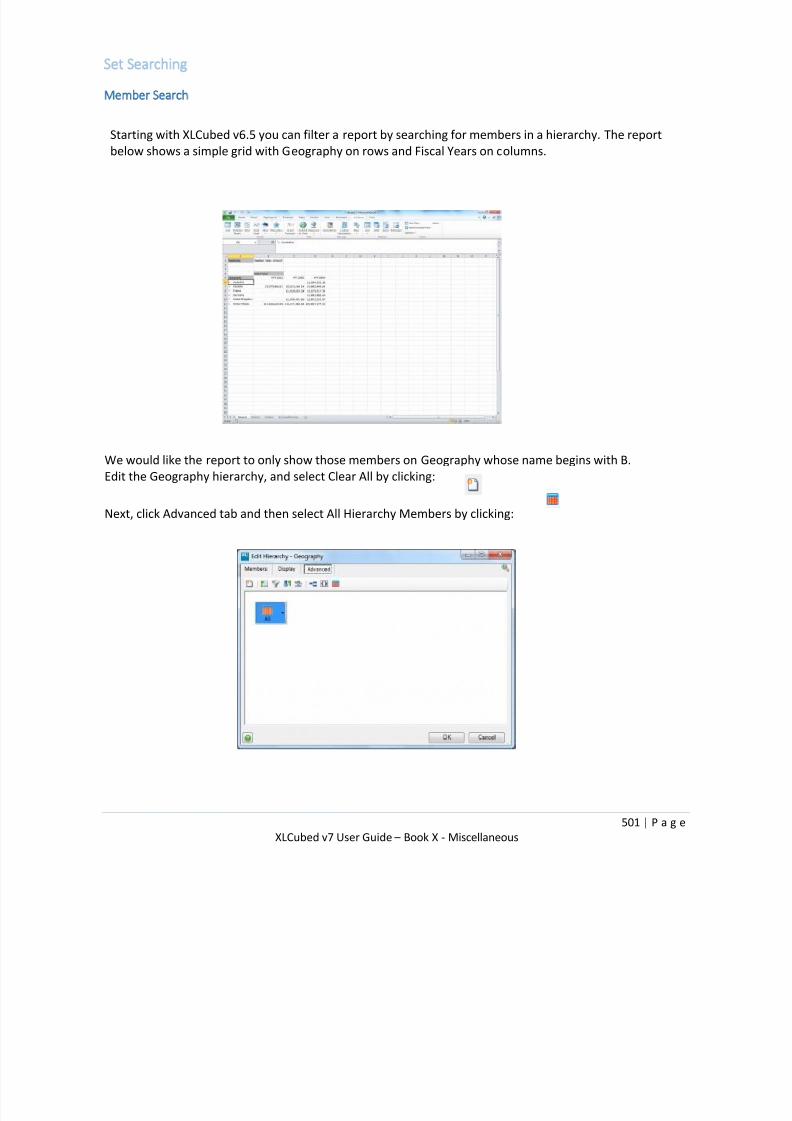
7/17/2019 XL Cubed versión 7 UserGuide
http://slidepdf.com/reader/full/xl-cubed-version-7-userguide 513/567
501 | P a g e
XLCubed v7 User Guide – Book X - Miscellaneous
Set Searching
Member Search
Starting with XLCubed v6.5 you can filter a report by searching for members in a hierarchy. The report
below shows a simple grid with Geography on rows and Fiscal Years on columns.
We would like the report to only show those members on Geography whose name begins with B.
Edit the Geography hierarchy, and select Clear All by clicking:
Next, click Advanced tab and then select All Hierarchy Members by clicking:

7/17/2019 XL Cubed versión 7 UserGuide
http://slidepdf.com/reader/full/xl-cubed-version-7-userguide 514/567
502 | P a g e
XLCubed v7 User Guide – Book X - Miscellaneous
Then, click on Member Search and the following window will be displayed.
At this point you have three options:
• enter a value in the Search Value field - in our example we enter B as we want to report all
members whose name starts with the letter B
• click the ellipse and add some filtering using MDX
• use Excel range to hold the value that should be used
In our example we are using the value in cell F2 to determine the filtering on our report. You can alsodetermine the 'search by' criteria as below:
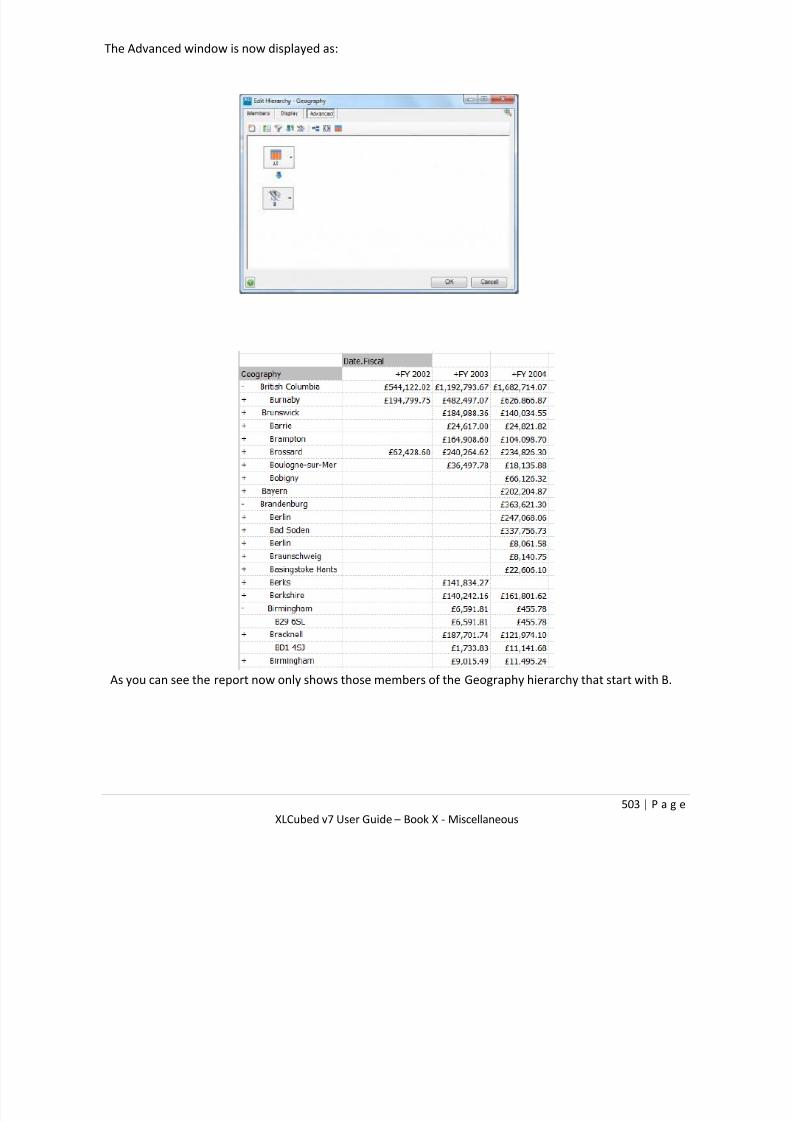
7/17/2019 XL Cubed versión 7 UserGuide
http://slidepdf.com/reader/full/xl-cubed-version-7-userguide 515/567
503 | P a g e
XLCubed v7 User Guide – Book X - Miscellaneous
The Advanced window is now displayed as:
As you can see the report now only shows those members of the Geography hierarchy that start with B.
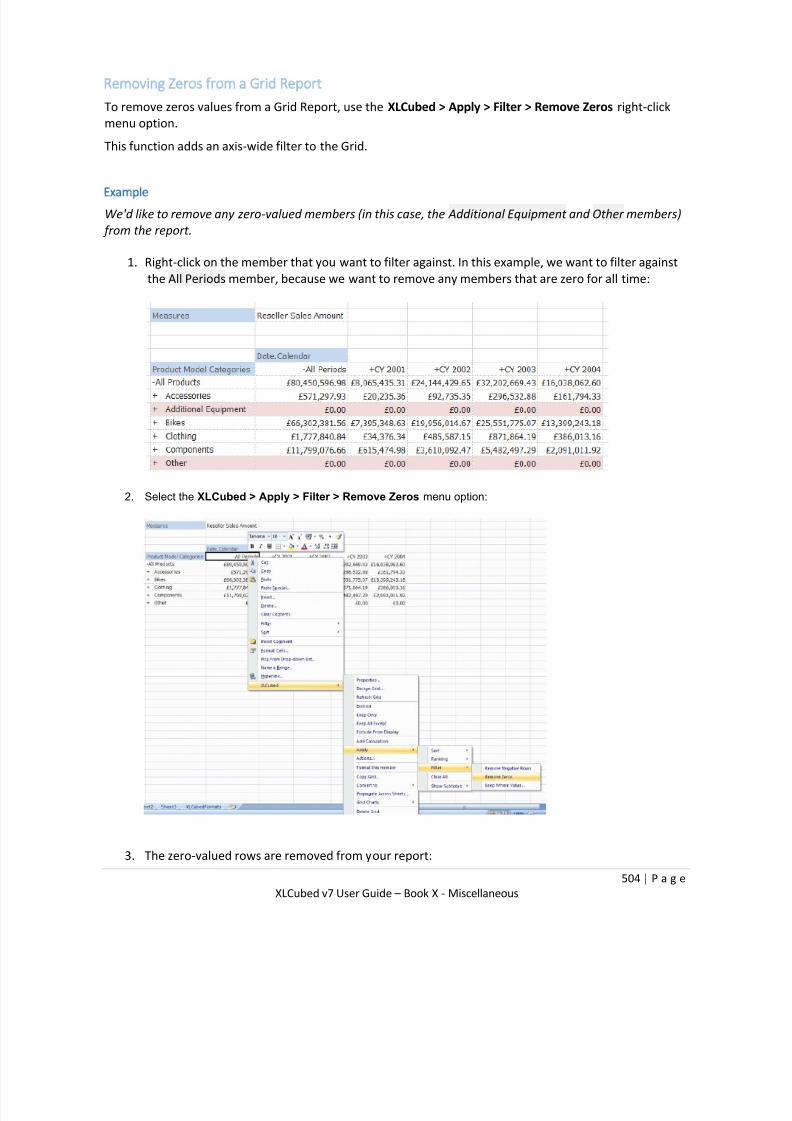
7/17/2019 XL Cubed versión 7 UserGuide
http://slidepdf.com/reader/full/xl-cubed-version-7-userguide 516/567
504 | P a g e
XLCubed v7 User Guide – Book X - Miscellaneous
Removing Zeros from a Grid Report
To remove zeros values from a Grid Report, use the XLCubed > Apply > Filter > Remove Zeros right-click
menu option.
This function adds an axis-wide filter to the Grid.
Example
We'd like to remove any zero-valued members (in this case, the Additional Equipment and Other members)
from the report.
1. Right-click on the member that you want to filter against. In this example, we want to filter against
the All Periods member, because we want to remove any members that are zero for all time:
2. Select the XLCubed > Apply > Filter > Remove Zeros menu option:
3. The zero-valued rows are removed from your report:
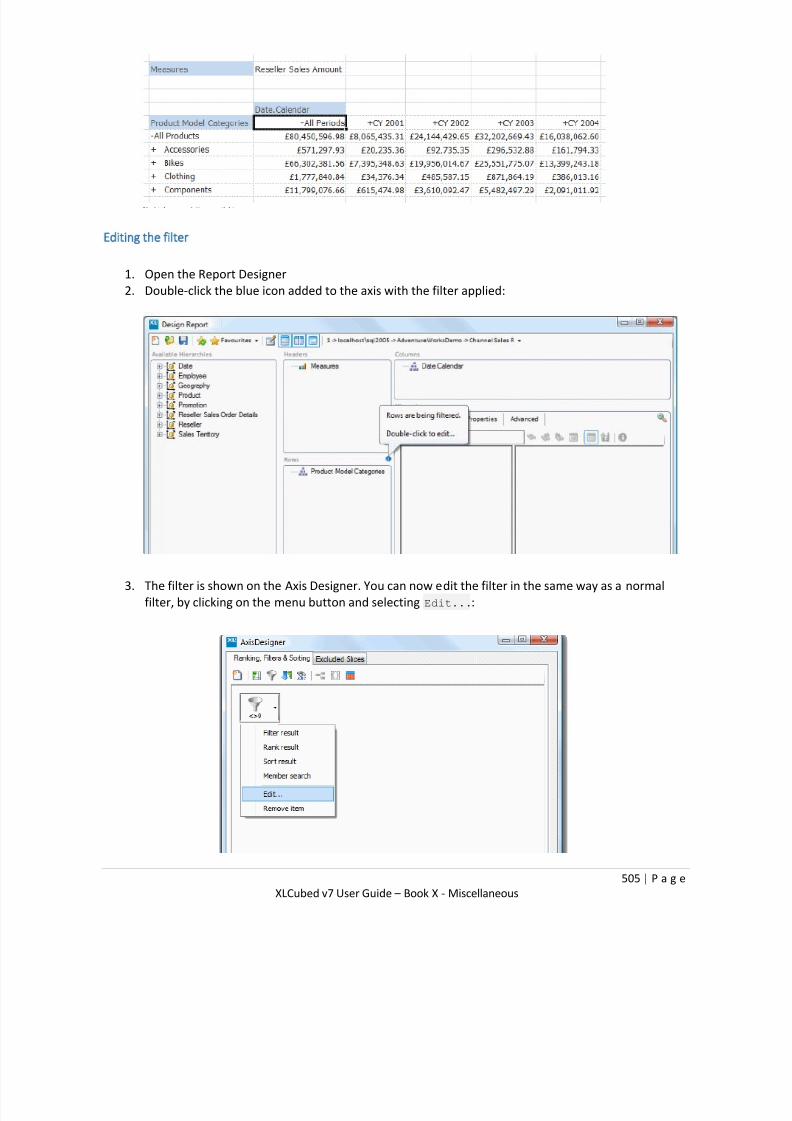
7/17/2019 XL Cubed versión 7 UserGuide
http://slidepdf.com/reader/full/xl-cubed-version-7-userguide 517/567
505 | P a g e
XLCubed v7 User Guide – Book X - Miscellaneous
Editing the filter
1. Open the Report Designer
2. Double-click the blue icon added to the axis with the filter applied:
3. The filter is shown on the Axis Designer. You can now edit the filter in the same way as a normal
filter, by clicking on the menu button and selecting Edit...:
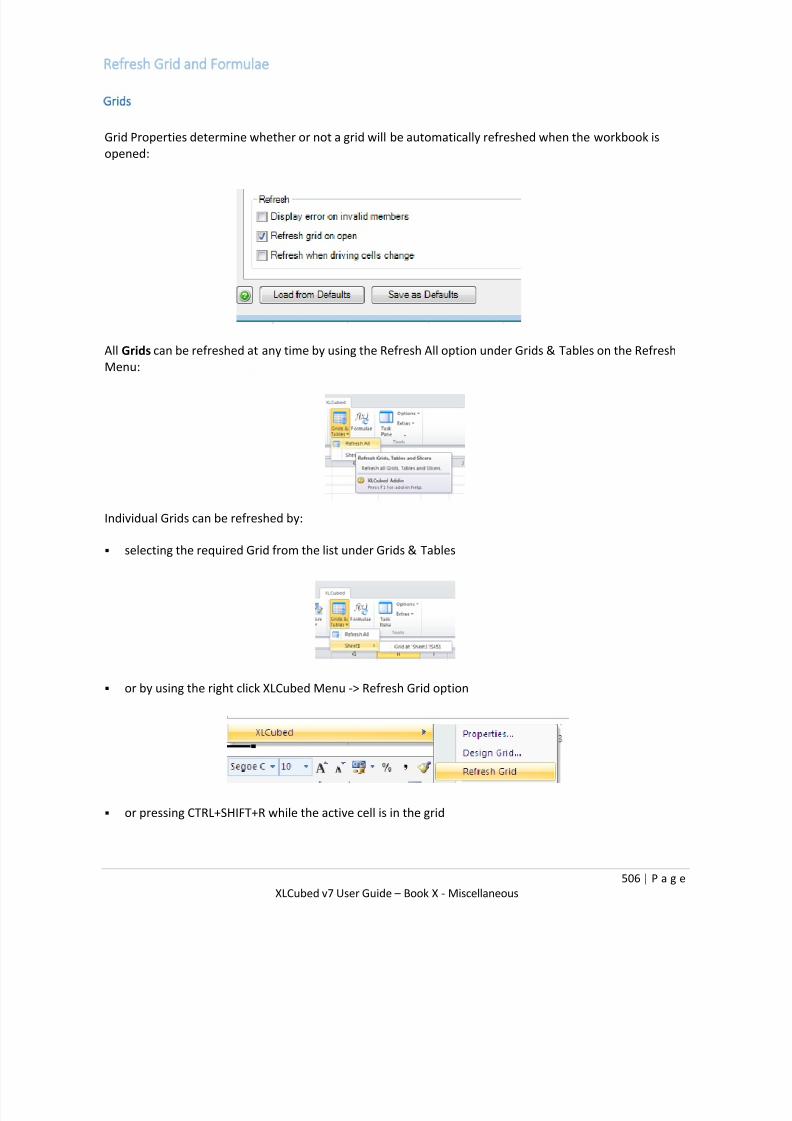
7/17/2019 XL Cubed versión 7 UserGuide
http://slidepdf.com/reader/full/xl-cubed-version-7-userguide 518/567
506 | P a g e
XLCubed v7 User Guide – Book X - Miscellaneous
Refresh Grid and Formulae
Grids
Grid Properties determine whether or not a grid will be automatically refreshed when the workbook is
opened:
All Grids can be refreshed at any time by using the Refresh All option under Grids & Tables on the Refresh
Menu:
Individual Grids can be refreshed by:
selecting the required Grid from the list under Grids & Tables
or by using the right click XLCubed Menu -> Refresh Grid option
or pressing CTRL+SHIFT+R while the active cell is in the grid
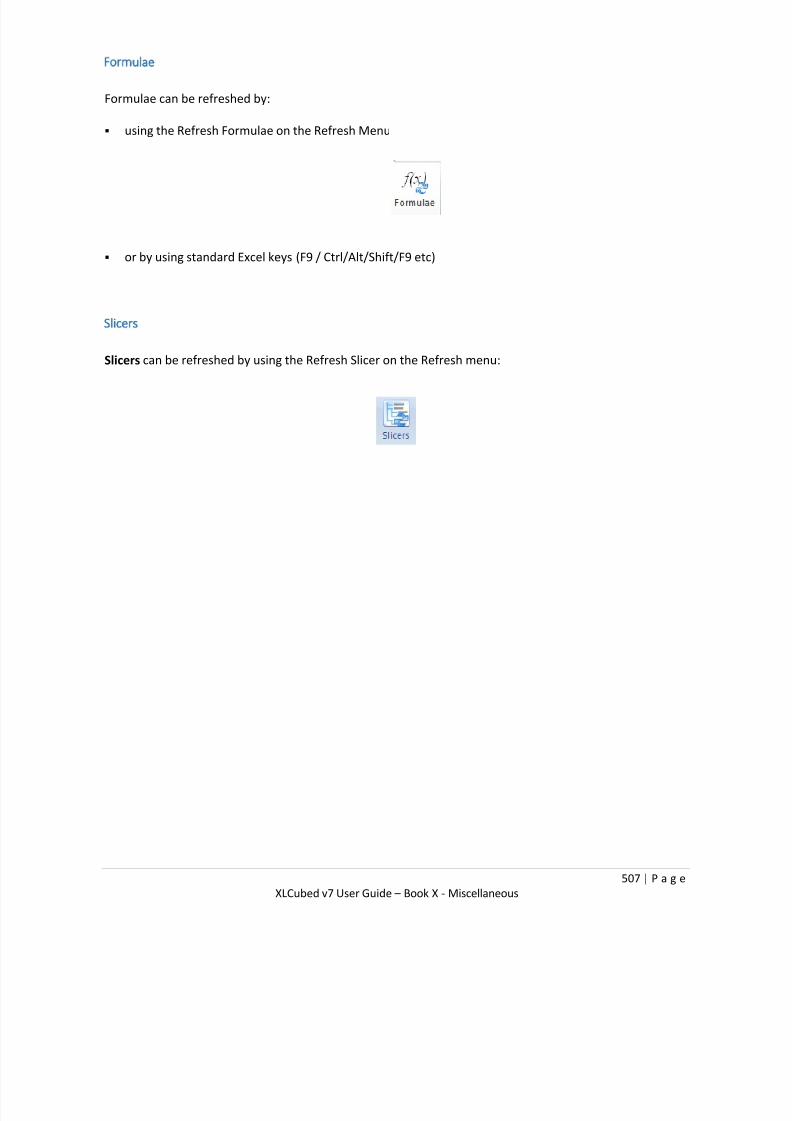
7/17/2019 XL Cubed versión 7 UserGuide
http://slidepdf.com/reader/full/xl-cubed-version-7-userguide 519/567
507 | P a g e
XLCubed v7 User Guide – Book X - Miscellaneous
Formulae
Formulae can be refreshed by:
using the Refresh Formulae on the Refresh Menu
or by using standard Excel keys (F9 / Ctrl/Alt/Shift/F9 etc)
Slicers
Slicers can be refreshed by using the Refresh Slicer on the Refresh menu:

7/17/2019 XL Cubed versión 7 UserGuide
http://slidepdf.com/reader/full/xl-cubed-version-7-userguide 520/567
508 | P a g e
XLCubed v7 User Guide – Book X - Miscellaneous
MDX
Description
The Mdx: or Mdx Colon feature allows you to easily combine snippets of Mdx with your existing
XLCubed Grids and other report objects.
The Mdx: statement could be a fixed piece of text, or created by using an Excel formula.
You can use this to create members or sets depending on your requirements.
Syntax
The Mdx: statement is made up of two or three parts.
Part Optional? Description
Mdx: or MdxSet: No Select based on whether your mdx snippet returns a single
member or a set of membersCaption:= Yes Puts a user friendly caption against the member when it is
returned.
Mdx No The Mdx snippet to run.
Examples
Valid examples would be:
Mdx:nextYear:=[Date].[Calendar].[Calendar Year].&[2002].NextMember
Mdxset:{[Date].[Calendar].[Calendar Year].&[2001]:[Date].[Calendar].[Calendar Year].&[2003]}
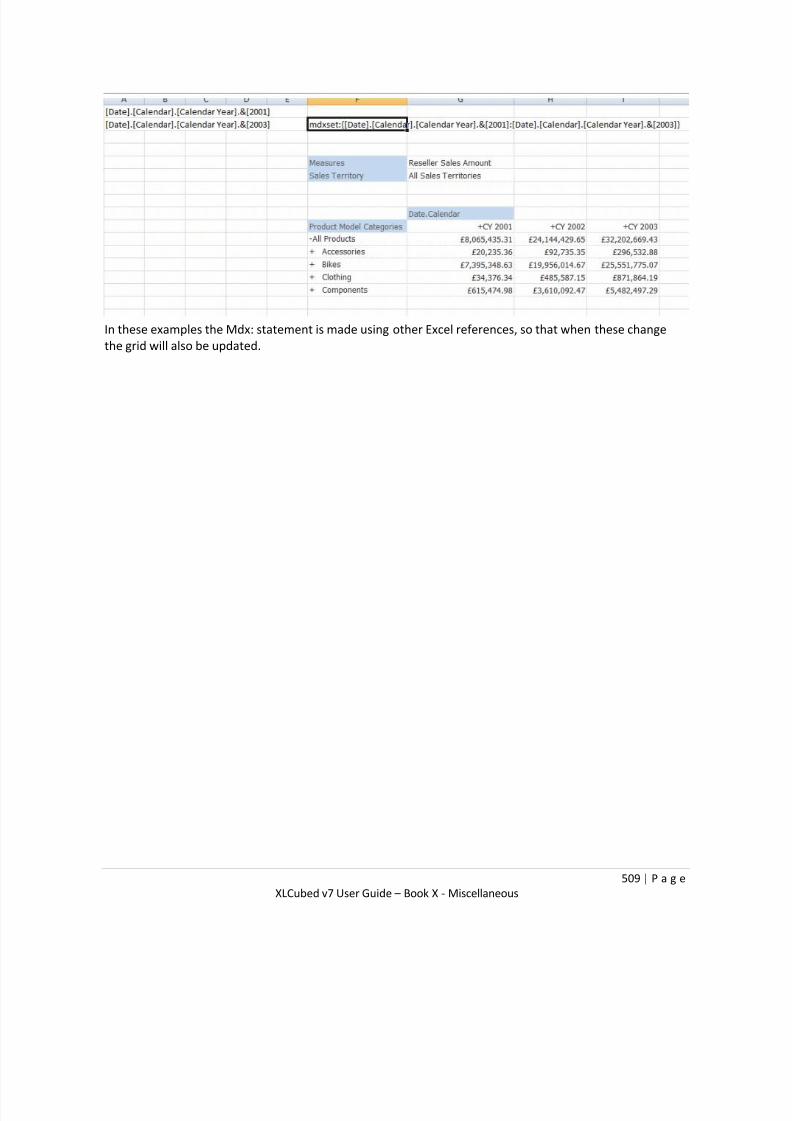
7/17/2019 XL Cubed versión 7 UserGuide
http://slidepdf.com/reader/full/xl-cubed-version-7-userguide 521/567
509 | P a g e
XLCubed v7 User Guide – Book X - Miscellaneous
In these examples the Mdx: statement is made using other Excel references, so that when these changethe grid will also be updated.

7/17/2019 XL Cubed versión 7 UserGuide
http://slidepdf.com/reader/full/xl-cubed-version-7-userguide 522/567
510 | P a g e
XLCubed v7 User Guide – Book X - Miscellaneous
Managing Favourites
Create a grid report which I want to save as a favourite for my own use
Create grid report and in Report Designer click Favourites icon highlighted
You will be prompted to enter a name and then OK.
This will add the report to your Favourites.
Click Favourites icon in XLCubed Excel Edition and in the drop-down you will see your report
Create a grid report which I want to save as a favourite and share with other Excel Edition users
This is intended as a way for Excel Edition users to share favourites. To enable this you publish them to
the web rather than save locally.
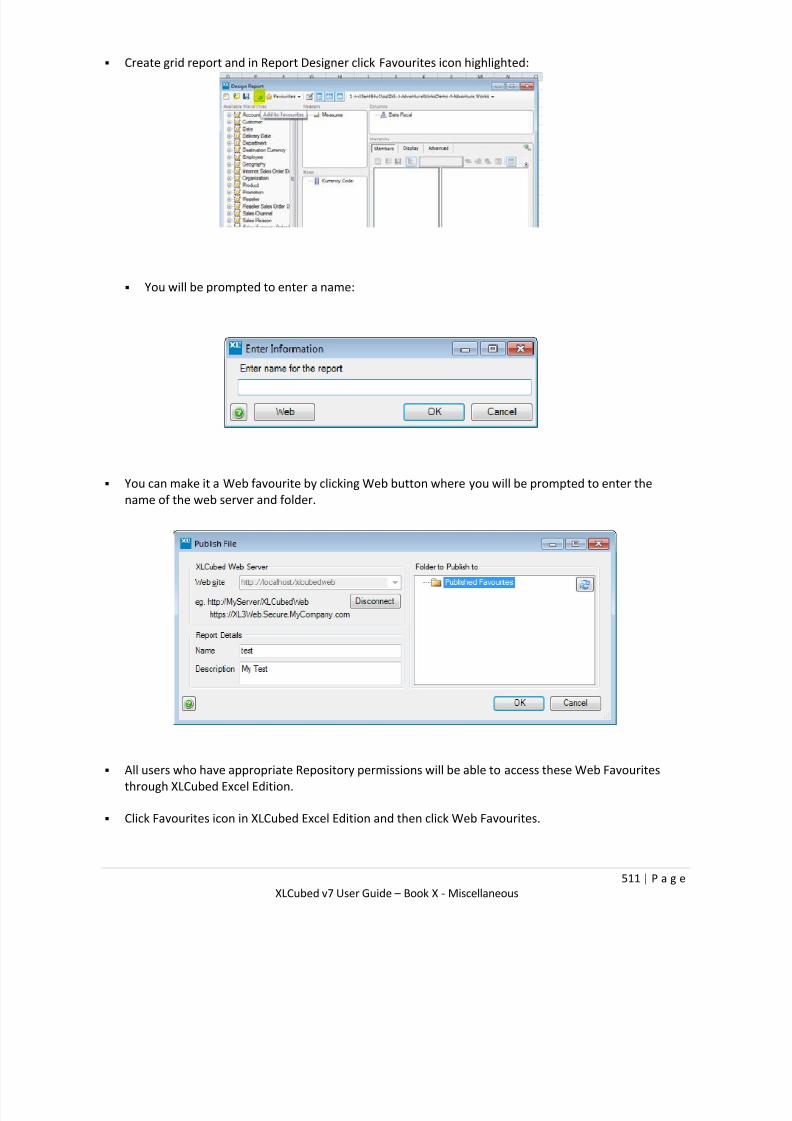
7/17/2019 XL Cubed versión 7 UserGuide
http://slidepdf.com/reader/full/xl-cubed-version-7-userguide 523/567
511 | P a g e
XLCubed v7 User Guide – Book X - Miscellaneous
Create grid report and in Report Designer click Favourites icon highlighted:
You will be prompted to enter a name:
You can make it a Web favourite by clicking Web button where you will be prompted to enter the
name of the web server and folder.
All users who have appropriate Repository permissions will be able to access these Web Favourites
through XLCubed Excel Edition.
Click Favourites icon in XLCubed Excel Edition and then click Web Favourites.

7/17/2019 XL Cubed versión 7 UserGuide
http://slidepdf.com/reader/full/xl-cubed-version-7-userguide 524/567
512 | P a g e
XLCubed v7 User Guide – Book X - Miscellaneous
Click Connect to connect to your web server and you will be able to browse the Repository and select
your report.
Create a grid report which I want to save as a favourite and share with other Web Edition users
The best way to do this is to create a new folder on the Web Edition with an appropriate name (e.g.
Web Favourites), and then publish a series of starting point grids into this folder. Users can then open
these up on the Web Edition as needed.
Create a grid report and Publish Workbook to Web
At Publisher window: to create this shared Favourites folder, right-click to create
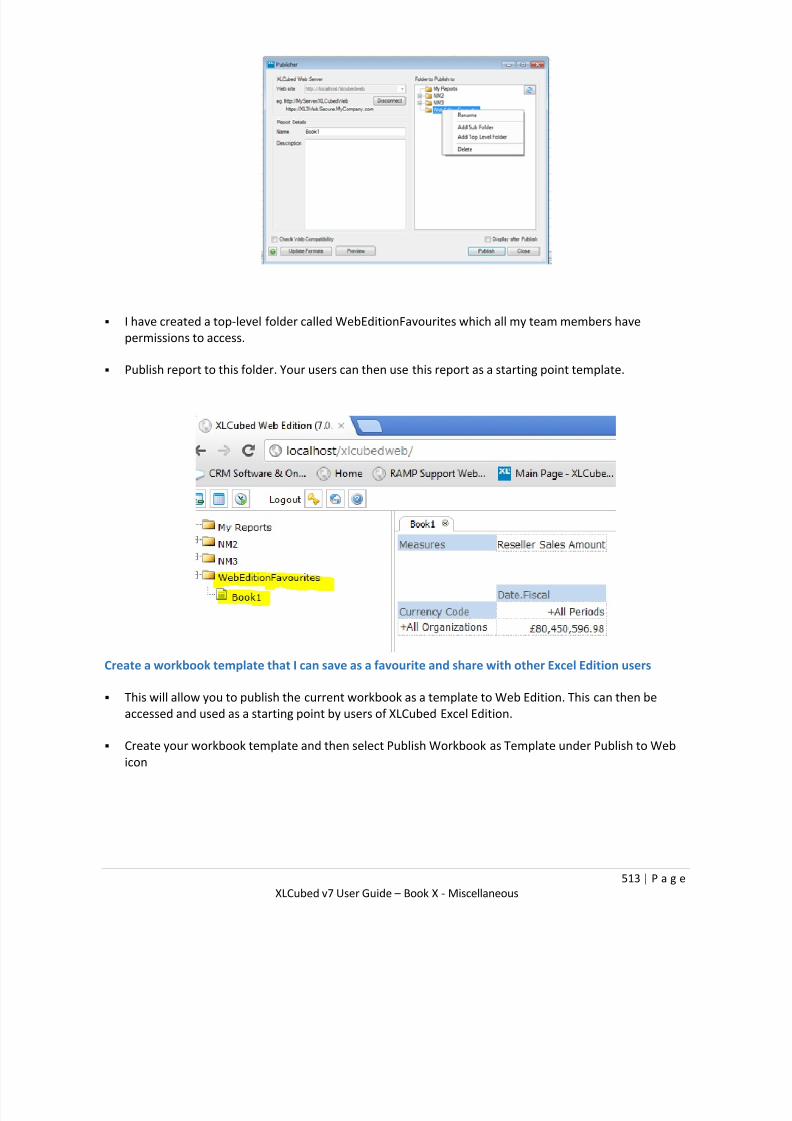
7/17/2019 XL Cubed versión 7 UserGuide
http://slidepdf.com/reader/full/xl-cubed-version-7-userguide 525/567
513 | P a g e
XLCubed v7 User Guide – Book X - Miscellaneous
I have created a top-level folder called WebEditionFavourites which all my team members have
permissions to access.
Publish report to this folder. Your users can then use this report as a starting point template.
Create a workbook template that I can save as a favourite and share with other Excel Edition users
This will allow you to publish the current workbook as a template to Web Edition. This can then be
accessed and used as a starting point by users of XLCubed Excel Edition.
Create your workbook template and then select Publish Workbook as Template under Publish to Web
icon
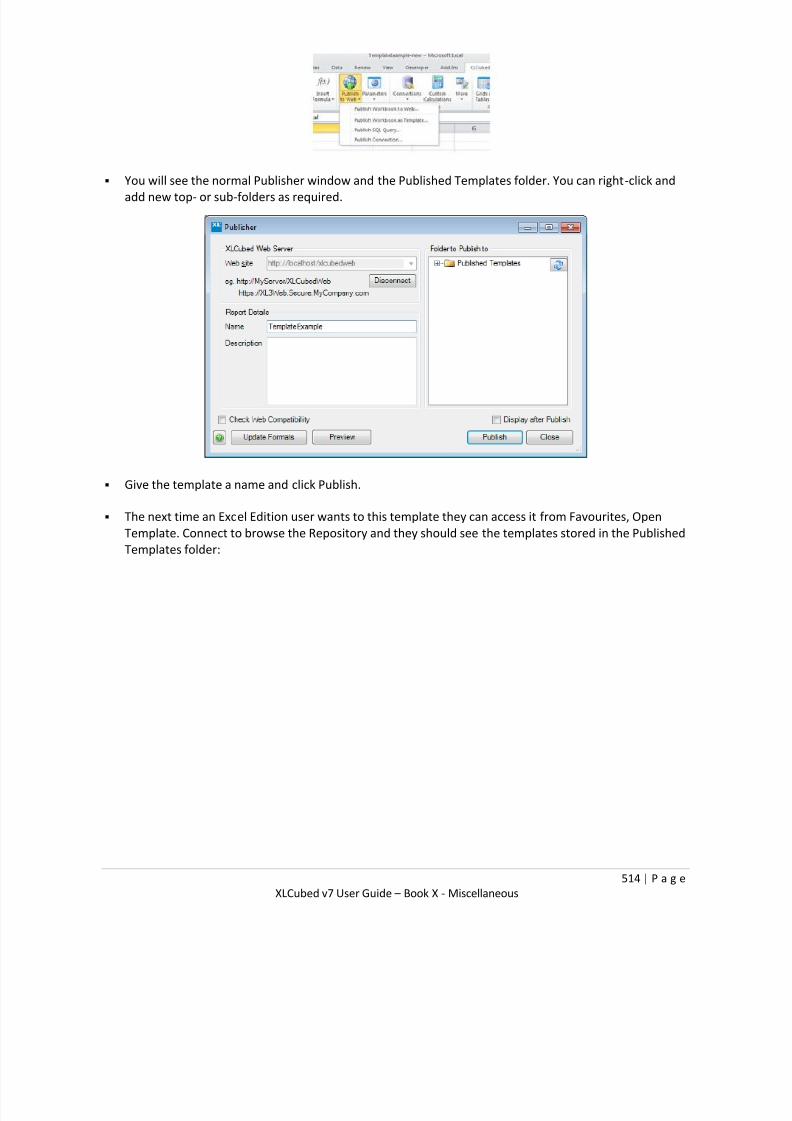
7/17/2019 XL Cubed versión 7 UserGuide
http://slidepdf.com/reader/full/xl-cubed-version-7-userguide 526/567
514 | P a g e
XLCubed v7 User Guide – Book X - Miscellaneous
You will see the normal Publisher window and the Published Templates folder. You can right-click and
add new top- or sub-folders as required.
Give the template a name and click Publish.
The next time an Excel Edition user wants to this template they can access it from Favourites, Open
Template. Connect to browse the Repository and they should see the templates stored in the Published
Templates folder:

7/17/2019 XL Cubed versión 7 UserGuide
http://slidepdf.com/reader/full/xl-cubed-version-7-userguide 527/567
515 | P a g e
XLCubed v7 User Guide – Book X - Miscellaneous
Select one and OK and they will be prompted to save their copy of the template workbook. Once saved
they can make changes as required.

7/17/2019 XL Cubed versión 7 UserGuide
http://slidepdf.com/reader/full/xl-cubed-version-7-userguide 528/567
516 | P a g e
XLCubed v7 User Guide – Book X - Miscellaneous
Data Configuration Settings
XLCubed's data access behaviour can be configured using xml files.
It is not recommended to change these without advice from XLCubed support.
File Locations
These files are found in the following places:
Excel Edition - Install folder e.g. C:\Program Files (x86)\XLCubed Ltd\XLCubed
Web Edition - Install folder\bin e.g c:\Inetpub\wwwroot\XLCubedWeb\bin
Config Files
XLCubed.Data.xml
This file controls XLCubed's cache behaviour. XLCubed will cache metadata to improve performance, but
will not cache data (query results).
Here you can control when the cache is cleared, and which metadata to cache.
The cache settings can be configured per cube and schema. If a specific setting is found that will override a
general one. (e.g. a specific schema setting will override that for * schemas).
Caches can have the policy type and size set.
Policy types are:
PublicChecked - Shared between users, but on the first request the cube will be queried to check the
user has permission to read the object.
PublicUnchecked - Shared between users, on the first ever request the cube will be queried to get the
metadata which is then shared between subsequent users.
Private - Cache is per user, cube is queried for metadata the first time each user requests it.
PrivateBySession - Cache is per user session, the cube will be queried for different connections fromthe same user.
Cache policy sizes can be:
0 - Do not cache
-1 - Cache all objects
N - any positive number, maximum cache size before objects are removed. N is the count of objects
stored.

7/17/2019 XL Cubed versión 7 UserGuide
http://slidepdf.com/reader/full/xl-cubed-version-7-userguide 529/567
517 | P a g e
XLCubed v7 User Guide – Book X - Miscellaneous
XLCubed.Data.AnalysisServices.xml
This file controls some aspects of XLCubed's connectivity to Analysis Services.
Connections:
keepopen - For use on the web, keeps connections open between page loads. Occasionally useful for
AS2000 servers.
keepsession - For use on the web, keeps sessions open between page loads.
usenativecom - Controls the internal implementation of some data reading.
useconnectionpooling - Shares connections between users, useful for .cub files where a maximum of 5
connections can be made at once.
Metadata:
hierarchies : useindexnameascaption - For backwards compatibility, returns the unique name with
brackets removed as the hierarchy caption. hierarchies : usefirstmemberasdefault - Used for some situations when the default member may not
be visible to the users.

7/17/2019 XL Cubed versión 7 UserGuide
http://slidepdf.com/reader/full/xl-cubed-version-7-userguide 530/567
518 | P a g e
XLCubed v7 User Guide – Book XI - Troubleshooting
Book XI - Troubleshooting
XLCubed Excel Edition
Installation Troubleshooting
Prerequisites
Details of prerequisites can be found here.
Could not access network location \Hewlett-Packard\\
When installing XLCubed, you get the above error message. This is because of a
faulty InstallLocation registry entry, found in these two places:
HKLM\SOFTWARE\Microsoft\Windows\CurrentVersion\Uninstall\
HKLM\SOFTWARE\Wow6432Node\Microsoft\Windows\CurrentVersion\Uninstall\
You can either back up, then remove it manually, or follow the instructions listed in this article.
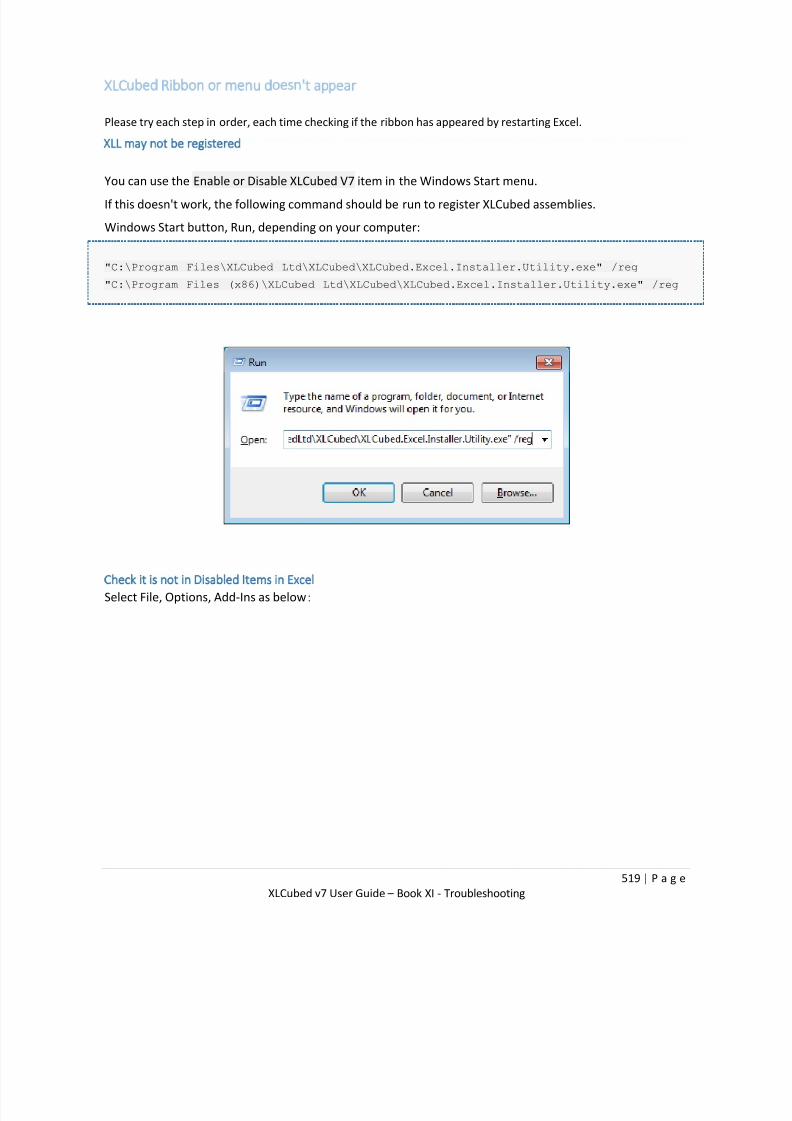
7/17/2019 XL Cubed versión 7 UserGuide
http://slidepdf.com/reader/full/xl-cubed-version-7-userguide 531/567
519 | P a g e
XLCubed v7 User Guide – Book XI - Troubleshooting
XLCubed Ribbon or menu doesn't appear
Please try each step in order, each time checking if the ribbon has appeared by restarting Excel.
XLL may not be registered
You can use the Enable or Disable XLCubed V7 item in the Windows Start menu.
If this doesn't work, the following command should be run to register XLCubed assemblies.
Windows Start button, Run, depending on your computer:
"C:\Program Files\XLCubed Ltd\XLCubed\XLCubed.Excel.Installer.Utility.exe" /reg
"C:\Program Files (x86)\XLCubed Ltd\XLCubed\XLCubed.Excel.Installer.Utility.exe" /reg
Check it is not in Disabled Items in Excel
Select File, Options, Add-Ins as below:

7/17/2019 XL Cubed versión 7 UserGuide
http://slidepdf.com/reader/full/xl-cubed-version-7-userguide 532/567
520 | P a g e
XLCubed v7 User Guide – Book XI - Troubleshooting
Select Manage, Disabled Items from the drop down and Go.
If there are any Disabled Items they will appear in the following window.
You will have to select, enable and close this window before restarting Excel.
Check it is not in Disabled Items in Registry
Check it is not appearing as a disabled item in the registry. Sometimes Excel may not list it as disabled item
even though it is disabled in the Registry.
Look in the following location:
HKEY_CURRENT_USER\Software\Microsoft\Office\14.0\Excel\Resiliency\Disabled Items
The sub-folder below Office in the above location varies depending on the version of Office:
Office XP: 10.0
Office 2003: 11.0
Office 2007: 12.0
Office 2010: 14.0If there is an entry in the above registry location you will need to delete it.
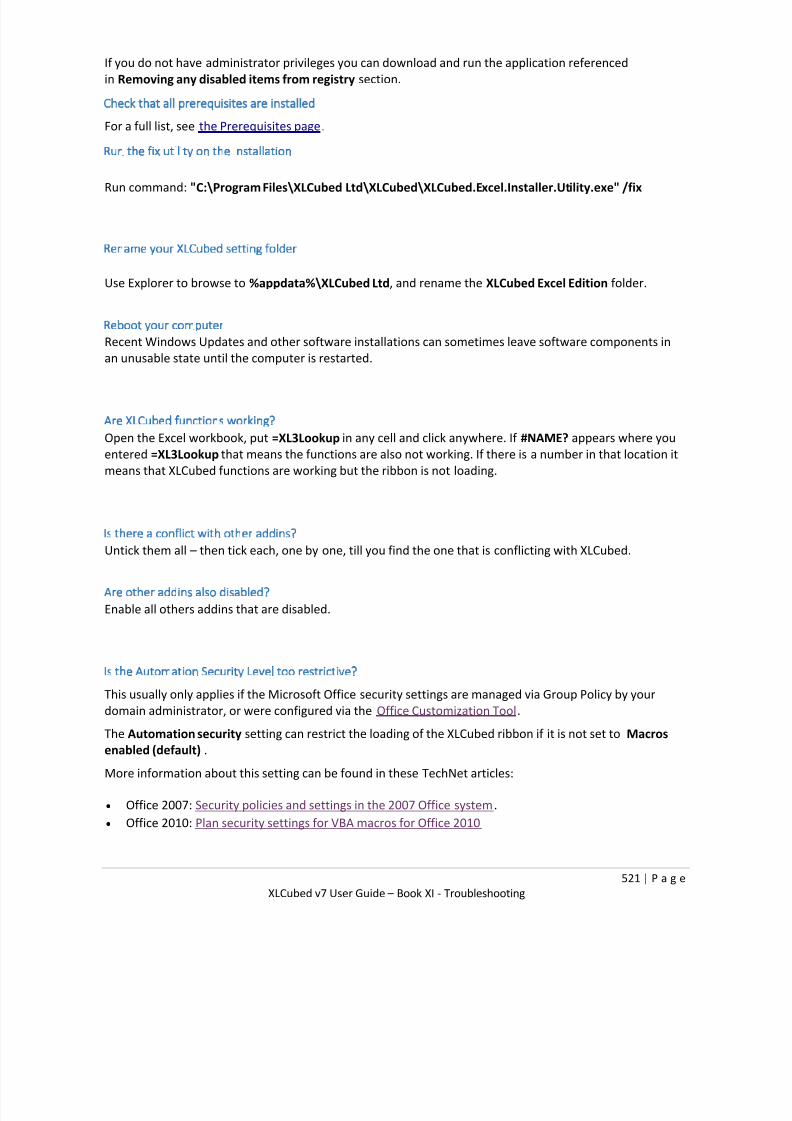
7/17/2019 XL Cubed versión 7 UserGuide
http://slidepdf.com/reader/full/xl-cubed-version-7-userguide 533/567
521 | P a g e
XLCubed v7 User Guide – Book XI - Troubleshooting
If you do not have administrator privileges you can download and run the application referenced
in Removing any disabled items from registry section.
Check that all prerequisites are installed
For a full list, see the Prerequisites page.
Run the fix utility on the installation
Run command: "C:\Program Files\XLCubed Ltd\XLCubed\XLCubed.Excel.Installer.Utility.exe" /fix
Rename your XLCubed setting folder
Use Explorer to browse to %appdata%\XLCubed Ltd, and rename the XLCubed Excel Edition folder.
Reboot your computerRecent Windows Updates and other software installations can sometimes leave software components in
an unusable state until the computer is restarted.
Are XLCubed functions working?
Open the Excel workbook, put =XL3Lookup in any cell and click anywhere. If #NAME? appears where you
entered =XL3Lookup that means the functions are also not working. If there is a number in that location it
means that XLCubed functions are working but the ribbon is not loading.
Is there a conflict with other addins?
Untick them all – then tick each, one by one, till you find the one that is conflicting with XLCubed.
Are other addins also disabled?
Enable all others addins that are disabled.
Is the Automation Security Level too restrictive?
This usually only applies if the Microsoft Office security settings are managed via Group Policy by your
domain administrator, or were configured via the Office Customization Tool.
The Automation security setting can restrict the loading of the XLCubed ribbon if it is not set to Macros
enabled (default) .
More information about this setting can be found in these TechNet articles:
Office 2007: Security policies and settings in the 2007 Office system.
Office 2010: Plan security settings for VBA macros for Office 2010

7/17/2019 XL Cubed versión 7 UserGuide
http://slidepdf.com/reader/full/xl-cubed-version-7-userguide 534/567
522 | P a g e
XLCubed v7 User Guide – Book XI - Troubleshooting
Necessary Office components not installed
If the 'Visual Basic for Applications' and '.NET Programmability Support' components are not installed, functions and
the ribbon/menu may not work.
Solution:
Go to Control Panel, Add/Remove Programs and select the entry for Microsoft Office.
Change, Add or remove Features.
Office Shared Features > Visual Basic for Applications – make sure there is not a cross against
Visual Basic for Applications
Microsoft Office Excel > .NET Programmability Support – make sure there is not a cross against
.NET Programmability Support
Removing any disabled items from Registry
Download & run the application from:
http://www.xlcubed.com/downloads/RemoveAllDisabledItems.zip
It will pop up a console window and then proceed to delete any disabled add-in entries in registry.
You are receiving an error while processing XLCubed.dna
There was an error during processing of C:\Program Files (x86)\XLCubed
Ltd\XLCubed\XLCubed.dna:

7/17/2019 XL Cubed versión 7 UserGuide
http://slidepdf.com/reader/full/xl-cubed-version-7-userguide 535/567
523 | P a g e
XLCubed v7 User Guide – Book XI - Troubleshooting
There is an error in XML document (0, 0).
The type initializer for 'System.Xml.Serialization.XmlSerializationReader' threw an
exception.
Error while processing XLCubed.dna
When you open XLCubed, you get the following error message:
There was an error during processing of C:\Program Files (x86)\XLCubed
Ltd\XLCubed\XLCubed.dna:
There is an error in XML document (0, 0).
The type initializer for 'System.Xml.Serialization.XmlSerializationReader' threw an
exception.

7/17/2019 XL Cubed versión 7 UserGuide
http://slidepdf.com/reader/full/xl-cubed-version-7-userguide 536/567
524 | P a g e
XLCubed v7 User Guide – Book XI - Troubleshooting
This error can be caused by problems with one of several configuration files:
XLCubed.dna, XLCubed64.dna, XLCubed.xll.config or XLCubed64.xll.config, all
found in the XLCubed installation folder (usually C:\Program Files (x86)\XLCubed
Ltd\XLCubed) Excel.exe.config, found in the Excel installation folder (usually C:\Program Files
(x86)\Microsoft Office\Office15 or similar)
machine.config, found in the Microsoft.NET configuration folder
(usually C:\Windows\Microsoft.NET\Framework\v4.0.30319\Config andC:\Window
s\Microsoft.NET\Framework64\v4.0.30319\Config)
The problems can be caused by several underlying issues:
The files do not exist (except for XLCubed.xll.config and Excel.exe.config, which are not
necessary) The files exist, but are protected and not accessible by Excel while it is loading
The files exist, but are corrupted
In particular, installation of some IBM Client Access providers can cause problems with
the machine.config file. See this IBM support article for details.
Grid Troubleshooting
When I try to create a Grid Chart, no chart types are listed, and I cannot press OK to insert it.
Your formats file may be missing or corrupted. Please back it up, then copy a new version from the
XLCubed installation folder. Typical locations are:
Installation version
C:\Program Files\XLCubed
Ltd\XLCubed\FormatSheet.xls and FormatSheet.xlsx
User's customised version
C:\Users\username\AppData\Roaming\XLCubed Ltd\XLCubed Excel Edition

7/17/2019 XL Cubed versión 7 UserGuide
http://slidepdf.com/reader/full/xl-cubed-version-7-userguide 537/567
525 | P a g e
XLCubed v7 User Guide – Book XI - Troubleshooting
Slicer Troubleshooting
You receive a Cannot insert object error when inserting a Dimension Slicer
This error is caused by some of the XLCubed assemblies not being correctly registered. To re-register them,
you must run the following command as an elevated administrator:
"C:\Program Files\XLCubed Ltd\XLCubed\XLCubed.Excel.Installer.Utility.exe" /regctls
In version 6.1 and prior versions, the /regctls switch wasn't available. In this case, use this instead, again
using an administrator account:
C:\Windows\Microsoft.NET\Framework\v4.0.30319\RegAsm.exe /tlb /codebase "C:\Program
Files\XLCubed Ltd\XLCubed\XLCubed.Excel.UserInterface.dll"
C:\Windows\Microsoft.NET\Framework64\v4.0.30319\RegAsm.exe /tlb /codebase "C:\Program
Files\XLCubed Ltd\XLCubed\XLCubed.Excel.UserInterface.dll"
You receive a Can't exit design mode because Control 'ExcelDimensionSlicer1' can not be created error during
normal operation
This error is caused by some corruption in your saved workbook when saving as Excel 97-2003 format (.xls).
It is caused by a limitation of the .xls file format and can occur from time to time when using slicers. To fix
the corruption, save the workbook as the more modern .xlsx file format instead. If this is not available to
you, the workbook can be temporarily fixed by:
1. Save the file as .xlsx
2. Close Excel
3.
Open the .xlsx workbook and resave as .xls
If you are using Microsoft Excel 2003, and are unable to save as .xlsx, you may need to install the Microsoft
Office Compatibility Pack, which should allow you to save as the newer .xlsx format. Alternatively, for some
workbooks you may be able to save as the XML Spreadsheet (.xml) type instead.
Miscellaneous Issues
Error when editing calculated members based on calculated sets
You may receive this error:
The selected calculation could not be executed:
The 'NamedSetName' named set cannot be created because a set with the same name already exists.
Please check the details and try again.
You may receive this error when using a named set in a calculated member created on a non-Measures
hierarchy.
For example (based on Adventure Works):
Named Set 'MySet'[Geography].[Geography].[Country].members

7/17/2019 XL Cubed versión 7 UserGuide
http://slidepdf.com/reader/full/xl-cubed-version-7-userguide 538/567
526 | P a g e
XLCubed v7 User Guide – Book XI - Troubleshooting
Calculated Member 'MyMember'
Aggregate([MySet])
Editing the above results in an error. This is because of a problem executing the necessary MDX with
Analysis Services. You should instead use the following, making sure you set the solve order of the
calculated member to 1:
Named Set 'MySet'[Geography].[Geography].[Country].members
Calculated Member 'MyMember'
Aggregate(StrToSet('[MySet]'))
In order to successfully create this once the error has been triggered, you will also have to rename the
named set.
XLCubed Web Edition
Publishing Troubleshooting
Connection failure
When you click "Connect" in the publishing dialog XLCubed will try to contact your web server.
If you can't connect to the web server, you can try the following
Client configuration
If you use a proxy server to access the internet this can prevent XLCubed connecting correctly
To allow the connection turn on the option to bypass the proxy for local addresses.
Note that you only need to do this is you use a proxy, otherwise there is no need to make this change.
If this fails an administrator can check the following to try to resolve the problem.
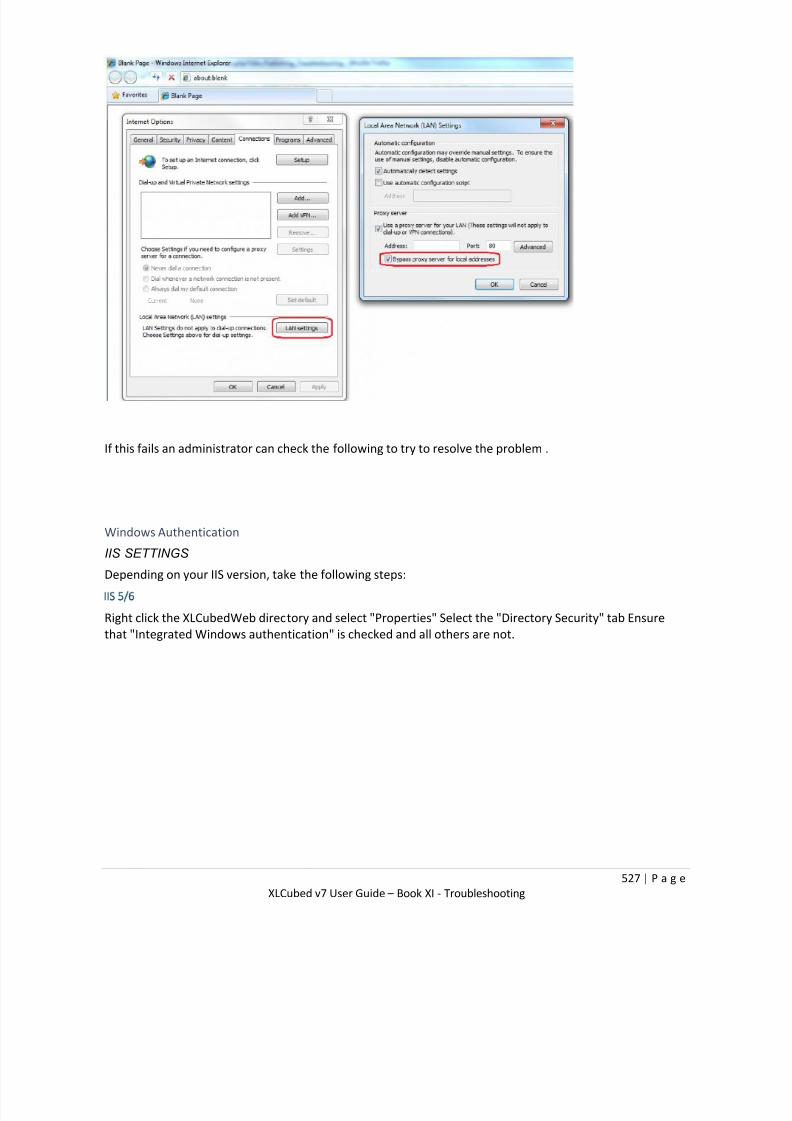
7/17/2019 XL Cubed versión 7 UserGuide
http://slidepdf.com/reader/full/xl-cubed-version-7-userguide 539/567
527 | P a g e
XLCubed v7 User Guide – Book XI - Troubleshooting
If this fails an administrator can check the following to try to resolve the problem.
Windows Authentication
IIS SETTINGS
Depending on your IIS version, take the following steps:
IIS 5/6
Right click the XLCubedWeb directory and select "Properties" Select the "Directory Security" tab Ensure
that "Integrated Windows authentication" is checked and all others are not.

7/17/2019 XL Cubed versión 7 UserGuide
http://slidepdf.com/reader/full/xl-cubed-version-7-userguide 540/567
528 | P a g e
XLCubed v7 User Guide – Book XI - Troubleshooting
IIS 7/7.5
Select the XLCubedWeb directory and open the "Authentication" section.
Ensure "ASP.NET Impersonation" and “Windows Authentication" are enabled, and others are disabled.

7/17/2019 XL Cubed versión 7 UserGuide
http://slidepdf.com/reader/full/xl-cubed-version-7-userguide 541/567
529 | P a g e
XLCubed v7 User Guide – Book XI - Troubleshooting
If you do not have these options you must add them from Control Panel > Programs > Turn Windows
features on or off
IIS 8
In addition to the IIS 7/7.5 steps, the HTTP Activation feature must also be installed.
Server Manager > Roles and Features > Add Role or Feature > Features then select .NET 4.5 > WCF
Services > HTTP-Activation.
Web.config
You will need to change the web.config file to include entries for all bindings. These entries are dependent
on the authentication mode (Basic, Windows or Anonymous) and whether or not you are using HTTPS.
Please note that when using HTTPS the security mode should be equal to Transport.
Authentication Using HTTPS? Web.config: on all bindingsWindows Yes <security mode="Transport">
<transport
clientCredentialType="Windows"/>
</security>Windows No <security
mode="TransportCredentialOnly">
<transport
clientCredentialType="Windows"/>
</security>
Basic Authentication
IIS SETTINGS
Depending on your IIS version, take the following steps:
IIS 5/6
Right click the XLCubedWeb directory and select "Properties" Select the "Directory Security" tab Ensure
that "Basic authentication" is checked and all others are not.

7/17/2019 XL Cubed versión 7 UserGuide
http://slidepdf.com/reader/full/xl-cubed-version-7-userguide 542/567
530 | P a g e
XLCubed v7 User Guide – Book XI - Troubleshooting
IIS 7/7.5/8
Select the XLCubedWeb directory and open the "Authentication" section.

7/17/2019 XL Cubed versión 7 UserGuide
http://slidepdf.com/reader/full/xl-cubed-version-7-userguide 543/567
531 | P a g e
XLCubed v7 User Guide – Book XI - Troubleshooting
Ensure "ASP.NET Impersonation" and "Basic Authentication" are enabled, and others are disabled.
Web.config
You will need to change the web.config file to include entries for all bindings. These entries are dependenton the authentication mode (Basic, Windows or Anonymous) and whether or not you are using HTTPS.
Please note that when using HTTPS the security mode should be equal to Transport.
Authentication Using HTTPS? Web.config: on all bindingsBasic Yes <security mode="Transport">
<transport
clientCredentialType="Basic"/>
</security>Basic No <security
mode="TransportCredentialOnly">
<transport
clientCredentialType="Basic"/>
</security>
Anonymous Authentication
IIS SETTINGS
Depending on your IIS version, take the following steps:
IIS 5/6
Right click the XLCubedWeb directory and select "Properties" Select the "Directory Security" tab Ensure
that "Enable anonymous access" is checked and all others are not.
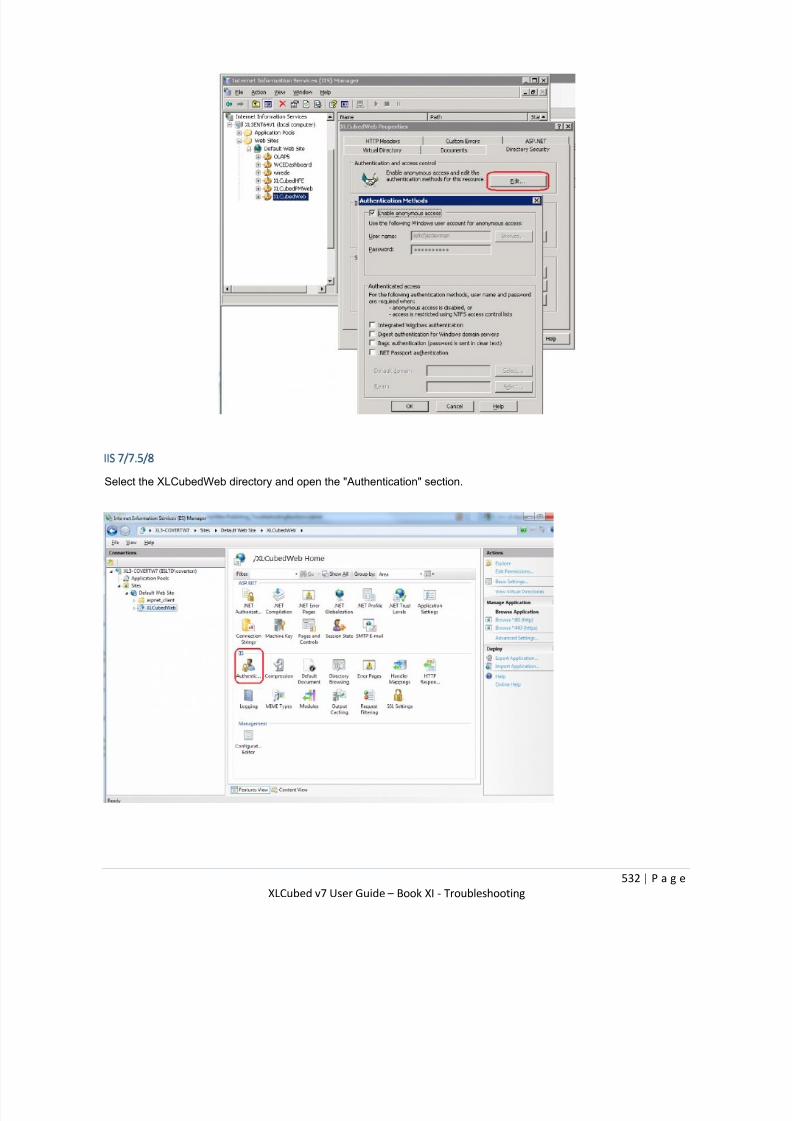
7/17/2019 XL Cubed versión 7 UserGuide
http://slidepdf.com/reader/full/xl-cubed-version-7-userguide 544/567
532 | P a g e
XLCubed v7 User Guide – Book XI - Troubleshooting
IIS 7/7.5/8
Select the XLCubedWeb directory and open the "Authentication" section.
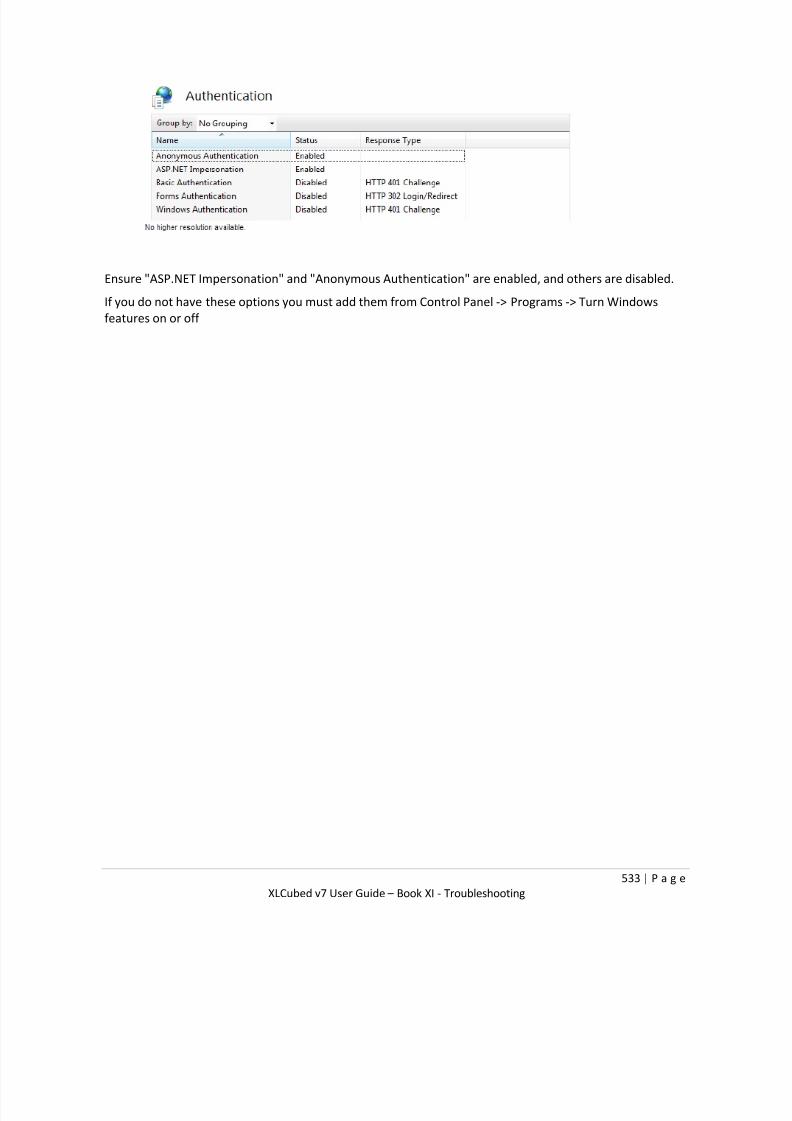
7/17/2019 XL Cubed versión 7 UserGuide
http://slidepdf.com/reader/full/xl-cubed-version-7-userguide 545/567
533 | P a g e
XLCubed v7 User Guide – Book XI - Troubleshooting
Ensure "ASP.NET Impersonation" and "Anonymous Authentication" are enabled, and others are disabled.
If you do not have these options you must add them from Control Panel -> Programs -> Turn Windows
features on or off
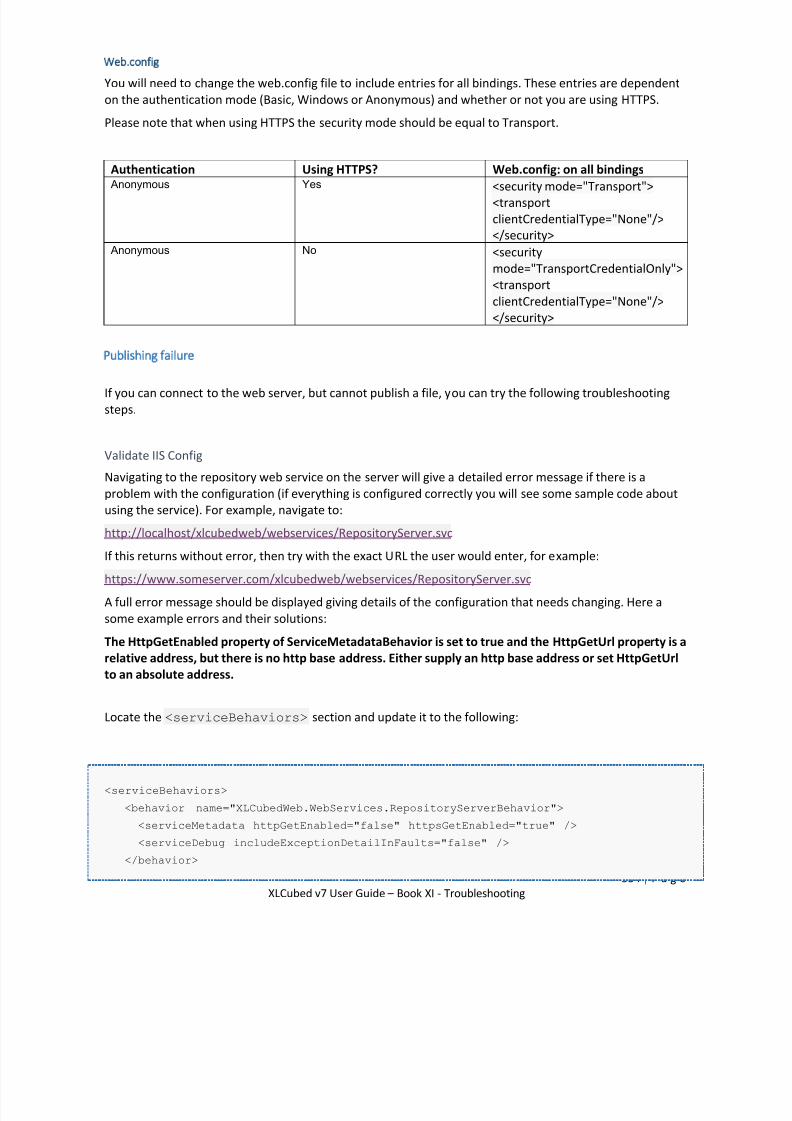
7/17/2019 XL Cubed versión 7 UserGuide
http://slidepdf.com/reader/full/xl-cubed-version-7-userguide 546/567
534 | P a g e
XLCubed v7 User Guide – Book XI - Troubleshooting
Web.config
You will need to change the web.config file to include entries for all bindings. These entries are dependent
on the authentication mode (Basic, Windows or Anonymous) and whether or not you are using HTTPS.
Please note that when using HTTPS the security mode should be equal to Transport.
Authentication Using HTTPS? Web.config: on all bindings Anonymous Yes <security mode="Transport">
<transport
clientCredentialType="None"/>
</security> Anonymous No <security
mode="TransportCredentialOnly">
<transport
clientCredentialType="None"/>
</security>
Publishing failure
If you can connect to the web server, but cannot publish a file, you can try the following troubleshooting
steps.
Validate IIS Config
Navigating to the repository web service on the server will give a detailed error message if there is a
problem with the configuration (if everything is configured correctly you will see some sample code aboutusing the service). For example, navigate to:
http://localhost/xlcubedweb/webservices/RepositoryServer.svc
If this returns without error, then try with the exact URL the user would enter, for example:
https://www.someserver.com/xlcubedweb/webservices/RepositoryServer.svc
A full error message should be displayed giving details of the configuration that needs changing. Here a
some example errors and their solutions:
The HttpGetEnabled property of ServiceMetadataBehavior is set to true and the HttpGetUrl property is a
relative address, but there is no http base address. Either supply an http base address or set HttpGetUrlto an absolute address.
Locate the <serviceBehaviors> section and update it to the following:
<serviceBehaviors>
<behavior name="XLCubedWeb.WebServices.RepositoryServerBehavior">
<serviceMetadata httpGetEnabled="false" httpsGetEnabled="true" /><serviceDebug includeExceptionDetailInFaults="false" />
</behavior>

7/17/2019 XL Cubed versión 7 UserGuide
http://slidepdf.com/reader/full/xl-cubed-version-7-userguide 547/567
535 | P a g e
XLCubed v7 User Guide – Book XI - Troubleshooting
<behavior name="XLCubedWeb.WebServices.SmallMultipleChartServerBehavior">
<serviceMetadata httpGetEnabled="false" httpsGetEnabled="true" />
<serviceDebug includeExceptionDetailInFaults="false" />
</behavior>
<behavior name="XLCubedWeb.WebServices.MapServerBehavior">
<serviceMetadata httpGetEnabled="false" httpsGetEnabled="true" />
<serviceDebug includeExceptionDetailInFaults="false" />
</behavior>
<behavior name="XLCubedWeb.WebServices.PrintRendererServerBehavior">
<serviceMetadata httpGetEnabled="false" httpsGetEnabled="true" />
<serviceDebug includeExceptionDetailInFaults="true" />
</behavior>
<behavior name="XLCubedWeb.WebServices.SchedulingServerBehavior">
<serviceMetadata httpGetEnabled="false" httpsGetEnabled="true" />
<serviceDebug includeExceptionDetailInFaults="false" />
</behavior>
</serviceBehaviors>
Permissions
Users need write permission to the repository directory in order to be able to publish files.
If this permission is missing often users can connect to the web server, but don't see a "My Reports" folder,
and get an error when attempting to publish a file.
To check if this is the problem you can grant Read and Write Access to the Repository directory in the
XLCubedWeb site to everyone and retry publishing.
If the publish then succeeds then permissions was the issue, and you can restrict access to the users you
wish to be able to publish.

7/17/2019 XL Cubed versión 7 UserGuide
http://slidepdf.com/reader/full/xl-cubed-version-7-userguide 548/567
536 | P a g e
XLCubed v7 User Guide – Book XI - Troubleshooting
Publishing more than 1000 rows
If you try to publish a workbook with a large number of rows or columns you may get a message telling you
that a sheet has too many rows or columns.
Note the small scroll bar indicating that there are a lot of rows in use.
While XLCubed Web can handle a large number of rows, browsers will hang if given very large tables to
display. To avoid giving web users a poor experience XLCubed will warn you when you try to publish a
sheet which is very large.
From here you have several options:
If the sheet is used for calculation, and does not need to be shown to the user then it can be hidden. As
it the sheet cannot be shown in a browser the publication limit will not apply.
If you are displaying a large Grid or Tables, consider using a Pager.
If you really need to show such a large number of rows, the limits can be adjusted in the XLCubed
options screen.
If you don't think you are using 1000 rows you can follow the instructions below.
Reducing the used range
Excel controls the used range of the sheet, this is the limits of the cells with contents. XLCubed uses this to
count the number of rows and columns used on a sheet before publication.
This normally includes cells with content, but formatting large areas can cause it to get recalculated.

7/17/2019 XL Cubed versión 7 UserGuide
http://slidepdf.com/reader/full/xl-cubed-version-7-userguide 549/567
537 | P a g e
XLCubed v7 User Guide – Book XI - Troubleshooting
Sometimes the used range can get incorrectly calculated. In this case you can delete the rows or columns
you know are unused to fix the used range.
To do this:
Select any cell in the worksheet
Press Ctrl+End - this will move you to the last cell in the used range.
Select the entire row by clicking on the row number
Use the scrollbars to move to the end of the report
While holding Shift, select below the last row in the report, again by clicking the row number.
Right click and Delete the range.
You can now publish again, and the used range will be recalculated.
If the scrollbar is still very small you can force excel to recalculate the used range by going to the VBA
editor and entering the following in the immediate window.
?ActiveSheet.UsedRange.Address
Slow Web Edition
XLCubed Web Edition's startup performance can be affected by several factors.
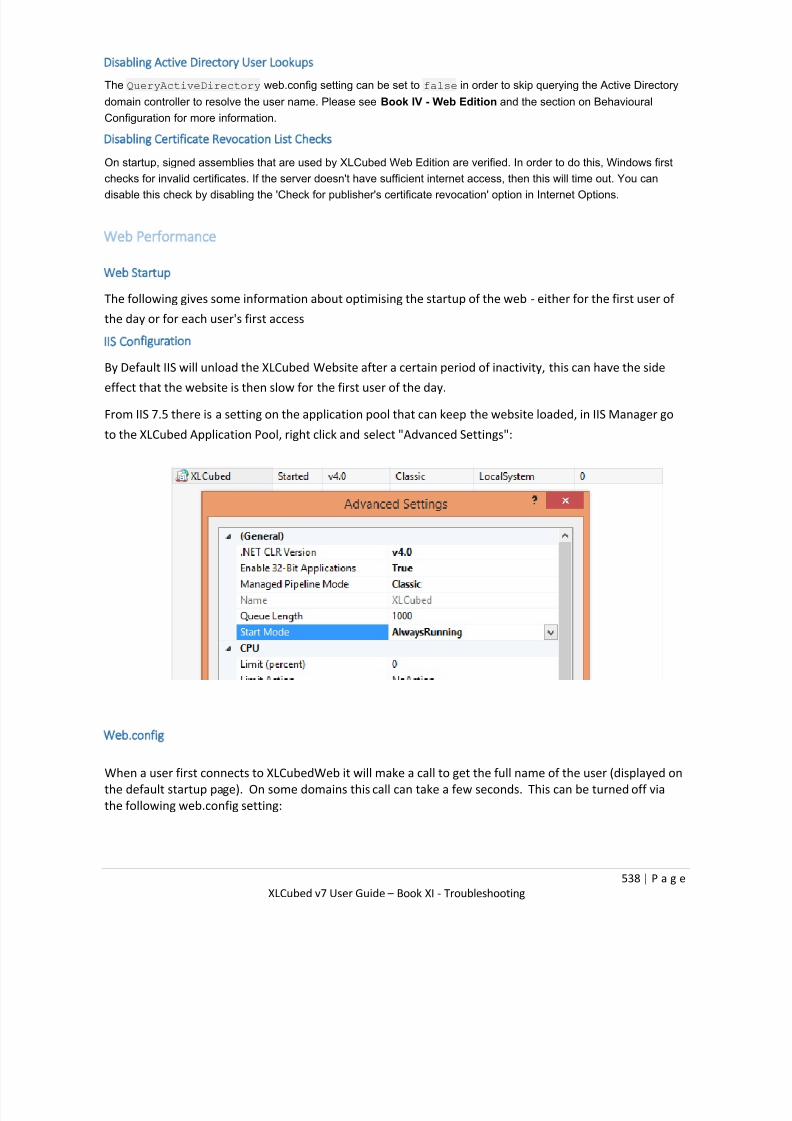
7/17/2019 XL Cubed versión 7 UserGuide
http://slidepdf.com/reader/full/xl-cubed-version-7-userguide 550/567
538 | P a g e
XLCubed v7 User Guide – Book XI - Troubleshooting
Disabling Active Directory User Lookups
The QueryActiveDirectory web.config setting can be set to false in order to skip querying the Active Directory
domain controller to resolve the user name. Please see Book IV - Web Edition and the section on Behavioural
Configuration for more information.
Disabling Certificate Revocation List Checks
On startup, signed assemblies that are used by XLCubed Web Edition are verified. In order to do this, Windows firstchecks for invalid certificates. If the server doesn't have sufficient internet access, then this will time out. You can
disable this check by disabling the 'Check for publisher's certificate revocation' option in Internet Options.
Web Performance
Web Startup
The following gives some information about optimising the startup of the web - either for the first user of
the day or for each user's first access
IIS Configuration
By Default IIS will unload the XLCubed Website after a certain period of inactivity, this can have the side
effect that the website is then slow for the first user of the day.
From IIS 7.5 there is a setting on the application pool that can keep the website loaded, in IIS Manager go
to the XLCubed Application Pool, right click and select "Advanced Settings":
Web.config
When a user first connects to XLCubedWeb it will make a call to get the full name of the user (displayed on
the default startup page). On some domains this call can take a few seconds. This can be turned off via
the following web.config setting:

7/17/2019 XL Cubed versión 7 UserGuide
http://slidepdf.com/reader/full/xl-cubed-version-7-userguide 551/567
539 | P a g e
XLCubed v7 User Guide – Book XI - Troubleshooting
<add key="QueryActiveDirectory" value="false" />

7/17/2019 XL Cubed versión 7 UserGuide
http://slidepdf.com/reader/full/xl-cubed-version-7-userguide 552/567
540 | P a g e
XLCubed v7 User Guide – Book XII - Installation

7/17/2019 XL Cubed versión 7 UserGuide
http://slidepdf.com/reader/full/xl-cubed-version-7-userguide 553/567
541 | P a g e
XLCubed v7 User Guide – Book XII - Installation
Book XII - Installation
XLCubed Excel Edition
Installation Prerequisites
XLCubed Excel Edition requires several packages installed in order to operate correctly. These will be
downloaded and installed automatically when you run the XLCubed Excel Edition Setup program.
If access to the internet is unavailable, the packages can be installed manually prior to installation.
Microsoft .NET Framework 4.0
Microsoft Visual C++ 2010 SP1 Redistributable (x86) or (x64) Note: install the version appropriate for
the Excel architecture you are using
Microsoft Core XML Services (MSXML) 6.0 (x86) or (x64)
Microsoft SQL Server 2000 PivotTable Services (Analysis Services 8.0 OLEDB Provider) (x86 only)
Microsoft SQL Server 2005 Analysis Services 9.0 OLEDB Provider (x86) or (x64) Microsoft SQL Server 2008 Analysis Services 10.0 OLEDB Provider (x86) or (x64)
Microsoft SQL Server 2012 Analysis Services 11.0 OLEDB Provider (x86) or (x64)
Microsoft SQL Server 2012 Analysis Services 11.0 ADOMD.NET Provider (x86) or (x64)
Supported environments
Excel Edition:
Windows XP / Vista / 7 / 8
Office XP, 2003, 2007, 2010, 2013
Microsoft .NET Framework v4
Supported Versions of SQL Server:
SQL Server 2000 Standard or higher
SQL Server 2005 Standard or higher
SQL Server 2008 Standard or higher
SQL Server 2008R2 Standard or higher
SQL Server 2012 Standard or higher
Silent installation
To create a silent installation for XLCubed Excel Edition, first install the appropriate prerequisites as
detailed on the previous section Installation Prerequisites. The Windows Installer MSI may then be
obtained by entering the following at the command line:
XLCubedInstaller.exe /ExtractCab
where XLCubedInstaller.exe should be replaced with the full path of the setup executable. This will extract
the MSI into a subdirectory called SupportFiles. This MSI can then be invoked silently by passing
the /q switch:
msiexec.exe /i "MSINAME.msi" /qn

7/17/2019 XL Cubed versión 7 UserGuide
http://slidepdf.com/reader/full/xl-cubed-version-7-userguide 554/567
542 | P a g e
XLCubed v7 User Guide – Book XII - Installation
Using this method, any prerequisites must be installed manually.
XLCubed Excel Edition Installation Logging
The XLCubed Excel Edition installation program is a standard Windows Installer (MSI) program wrapped in
a bootstrapper EXE. You can log any errors by using the following command line switches.
Windows Installer (MSI)
"XLCubed Excel Edition.msi" /l*v C:\LogFiles\Log.txt
Windows Executable (EXE)
XLCubedExcelEdition.exe /ComponentArgs "XLCubed Excel Edition":"/l*v C:\log.txt"

7/17/2019 XL Cubed versión 7 UserGuide
http://slidepdf.com/reader/full/xl-cubed-version-7-userguide 555/567
543 | P a g e
XLCubed v7 User Guide – Book XII - Installation
XLCubed Web Edition
Overview
To install XLCubed Web:
Run the setup program while logged onto the server as a user with administrator permissions
Once installed, copy the provided license key (xl3web.license) into the website folder, which is bydefault: C:\Inetpub\wwwroot\XLCubedWeb
When installed, the application is accessed by navigating to http://<yourservername>/XLCubedWeb
XLCubedWeb is the default website name during installation, but can be changed as required during
the installation process
Please note versions 5 and below are not upgraded: this version will install as a separate product
Installation Prerequisites
Server Requirements
Windows 2000 Server or above Internet Information Services (IIS) 5.1 or above (including the required authentication methods, static
content and asp.net)
Microsoft .NET Framework version 4.0
Hardware Requirements
Recommended specification is dependent on the cube size and design, the number of users, and the
pattern of usage. Having Analysis Services on the same machine will also have an impact.
As an absolute minimum we recommend:
Memory: 2GB
Processor: Dual Core 2.2 GHz
Client Requirements
Internet Explorer 7.0 or above
Google Chrome 5.0 or above
Mozilla Firefox 3.6 or above
Safari 5.0.6 or higher
Pre-Requisites
The installation will automatically download and install any required Microsoft redistributables. If desired
or if Internet access is restricted, these can be downloaded and installed manually before running the
XLCubed setup process. A list is available here.
IIS8/Windows 8
The following features must be enabled for XLCubed Web to work:
Control Panel / Programs and Features / Turn Windows features on or off / .Net Framework 3.5 /
Windows Communication Foundation HTTP Activation
Control Panel / Programs and Features / Turn Windows features on or off / .Net Framework 4.5
Advanced Services / WCF Services / HTTP Activation

7/17/2019 XL Cubed versión 7 UserGuide
http://slidepdf.com/reader/full/xl-cubed-version-7-userguide 556/567
544 | P a g e
XLCubed v7 User Guide – Book XII - Installation
Configuration
After the installation has completed you will be shown the configuration utility:
(If the server is running a version of IIS older than 7 you will need to follow the old installation guide here)
Authentication
You will need to decide on the type of Authentication, here's a brief summary of each option:
Anonymous
A user account needs to be specified, all users will connect to the data source as this user. The database
server can be on a different machine to the web server.
This would be typically used where XLCubedWeb needs to be available to everyone with no restrictions,
such as on the Internet or available to an entire organisation (with no restrictions) on an Intranet.
Basic
The client will be prompted for a user-id and password - this will be authenticated against local users (if no
domain is specified) or the active directory users. The database will be accessed using the given account
and can be located on a different server to the web server.
This would typically be used where it's not possible to configure Kerberos or if the set of users need to be
maintained locally on the machine (independent of the Active Directory/Domain users)
Windows
The default and most common method. The client's current credentials will be passed to the server and
they will be used when connecting to the datasource. If the database server is on a different server then
they will only receive the credentials if Kerberos has been configured, see Book XII – Installation and thesection on Kerberos for more information. (Kerberos will need to be set up and configured by a domain

7/17/2019 XL Cubed versión 7 UserGuide
http://slidepdf.com/reader/full/xl-cubed-version-7-userguide 557/567
545 | P a g e
XLCubed v7 User Guide – Book XII - Installation
administrator. Most large organisations will have an existing process for doing this - the previous article
contains all the information required.)
This method would be used in most organisations as authentication, and therefore access, is controlled
through the same mechanisms as other network resources.
HTTPS
If the website has been set up to use HTTPS (see this Microsoft support article for more information) then"Use HTTPS" will be checked. Click the "Apply" button to ensure XLCubedWeb has the correct settings to
support this.
Repository Access
The repository, visible in the left hand pane of the web application, is simply a folder on the Web Server
within which additional subfolders can be added. All published reports are held within the repository
folder, or subfolders within it. The permissions for the repository can be controlled by clicking on
"Repository Access". You will be presented with the form for maintaining which groups have access and
the level (write for publishing reports, or read-only for viewing reports only)
Finer control can be maintained by navgating to the repository folder in windows explorer, the folder
location will by default be:
C:\Inetpub\wwwroot\XLCubedWeb\Repository

7/17/2019 XL Cubed versión 7 UserGuide
http://slidepdf.com/reader/full/xl-cubed-version-7-userguide 558/567
546 | P a g e
XLCubed v7 User Guide – Book XII - Installation
Additional folders can be added as required, at the level immediately beneath the Repository folder itself,
for example one folder per user group. If the user has the permissions, they can maintain the folder
structure by right-clicking on the "Publish Report" screen in the Excel client.
The Temp folder should also have these permissions set on it. Its default location is:
C:\Inetpub\wwwroot\XLCubedWeb\temp
Windows permissions determine which folders are visible within the web application to any given user, e.g.
can be configured such that the 'Sales' function cannot see the 'Finance' function folder and vice versa.
This is all handled transparently by the application, and set at the Windows folder level permissions level.
The same logic is true of read/write vs. a read-only split between user groups.
Note that every user has a 'My Reports' folder, which is the equivalent of 'My Documents' in Windows, and
is only accessible by the individual user. These are held in the location below:
C:\Inetpub\wwwroot\XLCubedWeb\Repository\__userfolders__
Licensing
To apply a license key, click on "Licensing":
Click "Apply New Key" and select the appropriate license key file. You will be given a summary about the
key (such as the number of concurrent users and any expiration date)
Setting up the XLCubed Web Edition application manually
This step is usually not required, as the setup program will create the web application for you. It may benecessary if:

7/17/2019 XL Cubed versión 7 UserGuide
http://slidepdf.com/reader/full/xl-cubed-version-7-userguide 559/567
547 | P a g e
XLCubed v7 User Guide – Book XII - Installation
During the setup process, the Add XLCubed Web Edition to IIS checkbox was unselected
Your web server is set up in a non-standard configuration, especially where the Default Web Site has
been modified
You wish to create the web application yourself for whatever reason
Note that in the non-standard configuration, you may receive the following error message from the setup
program: Failed while processing WebVirtualDirs. (-2147024894)
In any of these cases, the setup program will have copied the application files to the web server, but you
will have to create the site yourself. To do this:
1. Open Internet Information Services Manager (inetmgr.exe)
2. Under the Application Pools node, ensure that the XLCubed application pool has been set up. It
must be configured to use v4.0 of the .NET Framework and use the Classic pipeline mode.
3. Under the Sites node, open the website in which XLCubed Web Edition should be made available
(usually the Default Web Site).
4. Usually the XLCubedWeb Virtual Directory will already exist within the website. If this is the case,
then right-click on it and select Convert to Application. If not, right-click on the website instead andselect Add Application...
5. In the Add Application dialog, ensure that the XLCubed application pool is selected and, if
necessary, choose the correct path.
This will set up the application's web site. Further security setup and other configuration will likely be
necessary. Information can be found below.
Functional User Permissions
Access to the application, and the type of access is controlled by two files located in:
C:\Inetpub\wwwroot\XLCubedWeb\Xml\Security
To enable or disable user or group access to the Web Edition, enable or disable read access for the relevant
user or group to:
system.xml
'Ad hoc' access gives users the ability to build their own report from scratch. This access is controlled via
the adhoc.xml file. To restrict users to be able to view only pre-published reports, revoke access to:
adhoc.xml
The scheduling features allows users to schedule reports, if Web Edition scheduling is licensed. To enable
or disable user or group access to this feature, enable or disable read access to:
scheduling.xml
Published Connections
When a user publishes a connection to XLCubed Web, which may contain custom calculations etc they arepublished to:
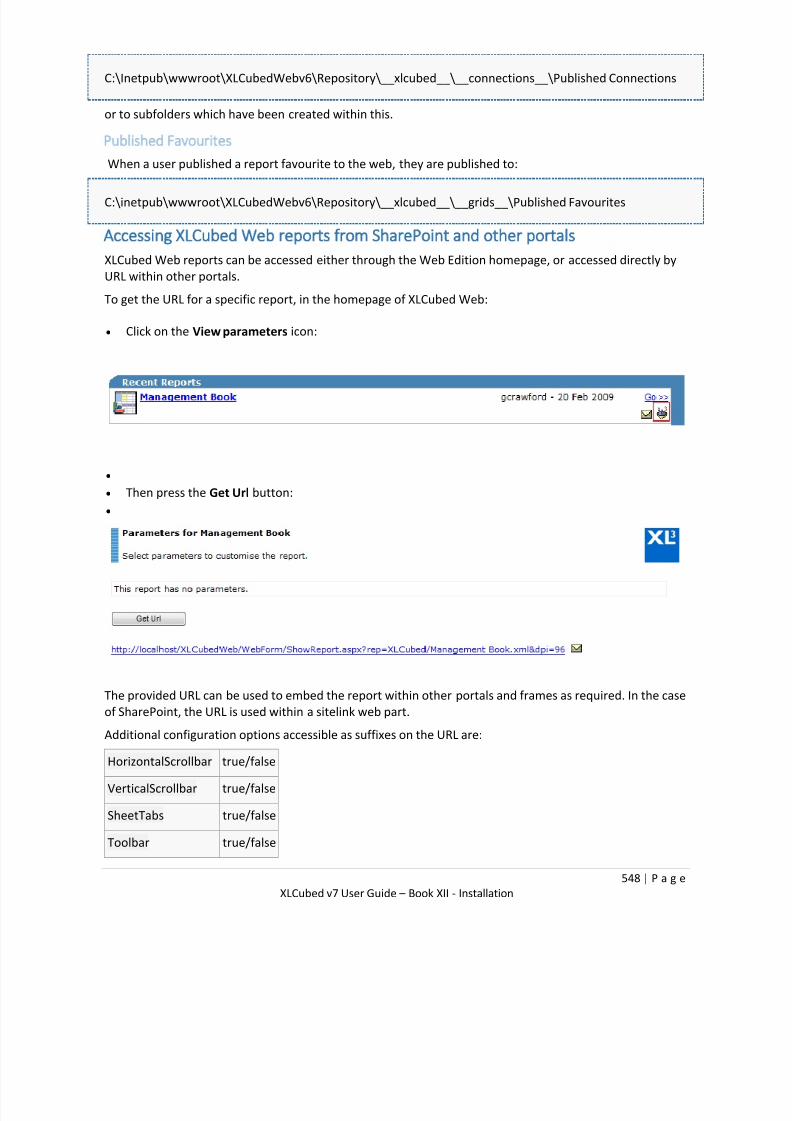
7/17/2019 XL Cubed versión 7 UserGuide
http://slidepdf.com/reader/full/xl-cubed-version-7-userguide 560/567
548 | P a g e
XLCubed v7 User Guide – Book XII - Installation
C:\Inetpub\wwwroot\XLCubedWebv6\Repository\__xlcubed__\__connections__\Published Connections
or to subfolders which have been created within this.
Published Favourites
When a user published a report favourite to the web, they are published to:
C:\inetpub\wwwroot\XLCubedWebv6\Repository\__xlcubed__\__grids__\Published Favourites
Accessing XLCubed Web reports from SharePoint and other portals
XLCubed Web reports can be accessed either through the Web Edition homepage, or accessed directly by
URL within other portals.
To get the URL for a specific report, in the homepage of XLCubed Web:
Click on the View parameters icon:
Then press the Get Url button:
The provided URL can be used to embed the report within other portals and frames as required. In the case
of SharePoint, the URL is used within a sitelink web part.
Additional configuration options accessible as suffixes on the URL are:
HorizontalScrollbar true/false
VerticalScrollbar true/false
SheetTabs true/false
Toolbar true/false

7/17/2019 XL Cubed versión 7 UserGuide
http://slidepdf.com/reader/full/xl-cubed-version-7-userguide 561/567
549 | P a g e
XLCubed v7 User Guide – Book XII - Installation
DefaultTargetFrame text
For example, for the report above, to include the toolbar in the rendered version, the URL would become:
http://localhost/XLCubedWeb/WebForm/ShowReport.aspx?rep=XLCubed/Management
Book.xml&dpi=96&Toolbar=True
System Configuration Settings
Behavioural Configuration
The web.config file held within the XLCubedWeb folder determines various behavioural aspects of the
product. The following settings are held within the <appSettings> section.
LogErrors write errors to Error.log
LogPerformance for debug only
ShowErrorMessages show detailed error messages or just a reference
to the log file
DefaultChartSeries default number of series to chart on an ad-hoc
report
MaxChartSeries maximum number of series to chart on an ad-hoc
report
DisplaySystemMemProps show system member properties available for
selection
DrillthroughDefaultMaxRows default maximum rows on a drillthrough
DrillthroughAbsoluteMaxRows maximum permitted rows on a drillthrough
RepositioryRootUNC No longer supported - listed for compatibilityreasons. To create a shared repository, use
MKLink [1] to replace the folder with a Symbolic
Link to a network share.
ClearLevelsMovedToFilters Where an entire level is selected on an axis
(potentially a large number of members), and is
dragged onto the slicer, the selection is changed to
the default member (Typically 'All'). This is to
prevent users accidentally creating a very slow
running query by individually aggregating all the
members dragged to the slice
DefaultCulture Backup culture where it cannot be retrieved from
the browser
QueryActiveDirectory Used to display the user name on homepage
WritebackTimeout Writeback timeout in milliseconds
PdfConverterUserName No longer required
PdfConverterPassword No longer required
PdfUseAppPoolUserForXpsPrint true to use the IIS configured application pool user
for creating the XPS during the PDF print; false
uses the impersonated user. Must be true for 64-
bit application pools
PdfUseAppPoolUserForPdfConversion true to use the IIS configured application pool user
for creating the PDF during the PDF print; false

7/17/2019 XL Cubed versión 7 UserGuide
http://slidepdf.com/reader/full/xl-cubed-version-7-userguide 562/567
550 | P a g e
XLCubed v7 User Guide – Book XII - Installation
uses the impersonated user. Must be true for 64-
bit application pools
DocumentDomain used when embedding XLCubed within an iframe
on a different server
PDF Printing Configuration
To configure the web edition to use the impersonated user instead of the application pool user, see Version
7.1 instructions.
1. Set PdfUseAppPoolUserForXpsPrint and PdfUseAppPoolUserForPdfConversion to true
2. Ensure the application pool user has read and write access to the "Temp" folder,
\inetpub\wwwroot\xlcubedweb\temp
Data Configuration Settings
Updating Data Configuration Settings (see section in Book X – Miscellaneous) may be done to affectconnection behaviour by advanced users, although it is not recommended to do this without advice from
XLCubed support.
Application Usage
Please refer to the help menu within the product for an overview of all functionality.
Kerberos Delegation - Introduction
Delegation will need to be configured if XLCubedWeb is installed on a different server to the underlying
database and the Website is configured to use Windows Authentication.
If you have this type of setup and Delegation isn't configured then you will receive a message such as
"Server is unavailable" for Analysis Services or a "(null) user" error for SQL Server when trying to access
published reports.
Most corporations have a standard setup for Delegation and this would be handled by the Domain
Administrators. The following is a guide to how to configure Delegation in the simplest case but is no
means a "Best practice" guide as each domain setup and infrastructure can vary enormously.
There are also many other factors that can impact a successful implementation Delegation, such as
network infrastructure, client security settings and software. The following guide will assume that all the
clients will be running Internet Explorer and there is only one domain with everything located on the same
physical network with no firewalls/routers that could filter Delegation requests.
Preparation
Before beginning it is worth ensuring XLCubedWeb is working correctly including loading a report (at which
point it should give the server is not available error)
Ensure the XLCubed Website Application pool is running as either NetworkService or a specifically created
domain user and then only "Windows Authentication" and "ASP.net Impersonation" are enabled in the
Authentication settings of the website.
Check/clear any existing SPNs for the servers - if any already exist and they are invalid then the
configuration will not work. The following link contains some good information about how to do that:
http://blogs.msdn.com/b/psssql/archive/2009/02/13/searching-for-duplicate-spn-s-got-a-little-easier.aspx
7/17/2019 XL Cubed versión 7 UserGuide
http://slidepdf.com/reader/full/xl-cubed-version-7-userguide 563/567
551 | P a g e
XLCubed v7 User Guide – Book XII - Installation
Information Required
Before configuring Delegation you will need to know the following information:
What the networks domain name is - this is needed to get a server's Fully Qualifed Domain Name
(FQDN): server.domain
The name and FQDN of the Web Server: Webserver
The name and FQDN of the Analysis Services: ASServer
The name and FQDN of the SQL Server (if allowing SQL connections): SQLServer
The port SQLServer is running under (if allowing SQL connections)
The User ID for the XLCubed Application Pool configured for the XLCubedWeb website: WebUser
The User ID the Analysis Services service is running as: ASUser
The User ID the SQL Server service is running as: SQLUser
User ID format
If the User IDs are domain accounts then the format needed is simply:
domain\user
If the service or application pool is set to run under NetworkService then use the server name:
server
Access Required
You will need to be a Domain Administrator to perform all of the configuration steps
Domain configuration
Enable Server Delegation
The first step is to enable delegation on ALL the machines involved in the process:
WebServer
ASServer
SQLServer
This is a domain level setting and is set using the "Active Directory Users and Computers" administrative
tool which is part of the Microsoft Admin Tools Pack and would normally be on the Domain Controller.

7/17/2019 XL Cubed versión 7 UserGuide
http://slidepdf.com/reader/full/xl-cubed-version-7-userguide 564/567
552 | P a g e
XLCubed v7 User Guide – Book XII - Installation
If there is more than one domain controller then you would need to either initiate a propagate or wait for
this change to be applied to all the domain controllers.
Set SPNs
The Service Princial Names (SPNs) are set using a Command Line tool: setspn. This needs to be run in an
Administrator Command Prompt with an account that has Domain Admin privileges. It needs to be run for
BOTH the server name and the Fully Qualified Domain Name.
If there is more than one domain controller then you would need to wait for this change to propagate to all
the servers
WEBSERVER
setspn –A http/WebServer WebUser
setspn –A http/WebServerFQDN WebUser
Example:
setspn -A http/webserver domain\appooluser
setspn -A http/webserver.domain.com domain\appooluser
ANALYSISSERVICES
setspn –A MSOLAPSvc.3/ ASServer ASUser
setspn –A MSOLAPSvc.3/ ASServerFQDN ASUser
Named instance
Where InstanceName is the name of the instance:
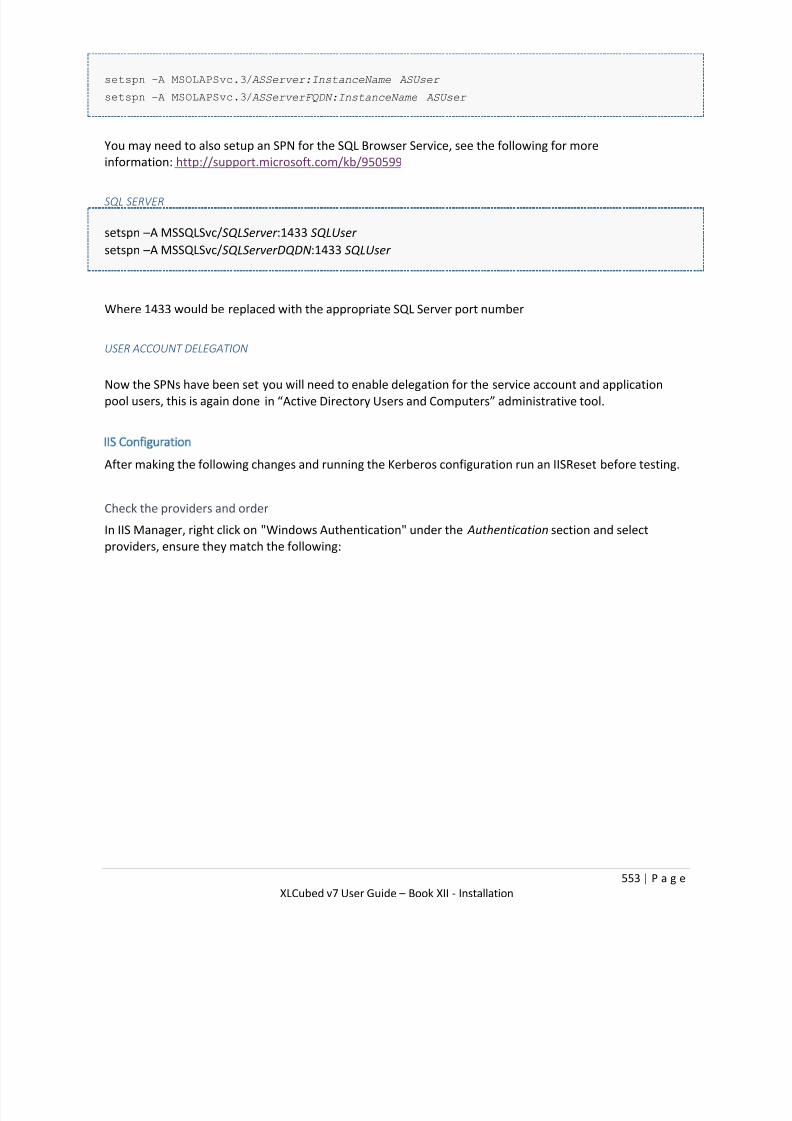
7/17/2019 XL Cubed versión 7 UserGuide
http://slidepdf.com/reader/full/xl-cubed-version-7-userguide 565/567
553 | P a g e
XLCubed v7 User Guide – Book XII - Installation
setspn –A MSOLAPSvc.3/ASServer:InstanceName ASUser
setspn –A MSOLAPSvc.3/ASServerFQDN:InstanceName ASUser
You may need to also setup an SPN for the SQL Browser Service, see the following for more
information: http://support.microsoft.com/kb/950599
SQLSERVER
setspn –A MSSQLSvc/SQLServer :1433 SQLUser
setspn –A MSSQLSvc/SQLServerDQDN:1433 SQLUser
Where 1433 would be replaced with the appropriate SQL Server port number
USERACCOUNTDELEGATION
Now the SPNs have been set you will need to enable delegation for the service account and application
pool users, this is again done in “Active Directory Users and Computers” administrative tool.
IIS Configuration
After making the following changes and running the Kerberos configuration run an IISReset before testing.
Check the providers and order
In IIS Manager, right click on "Windows Authentication" under the Authentication section and select
providers, ensure they match the following:
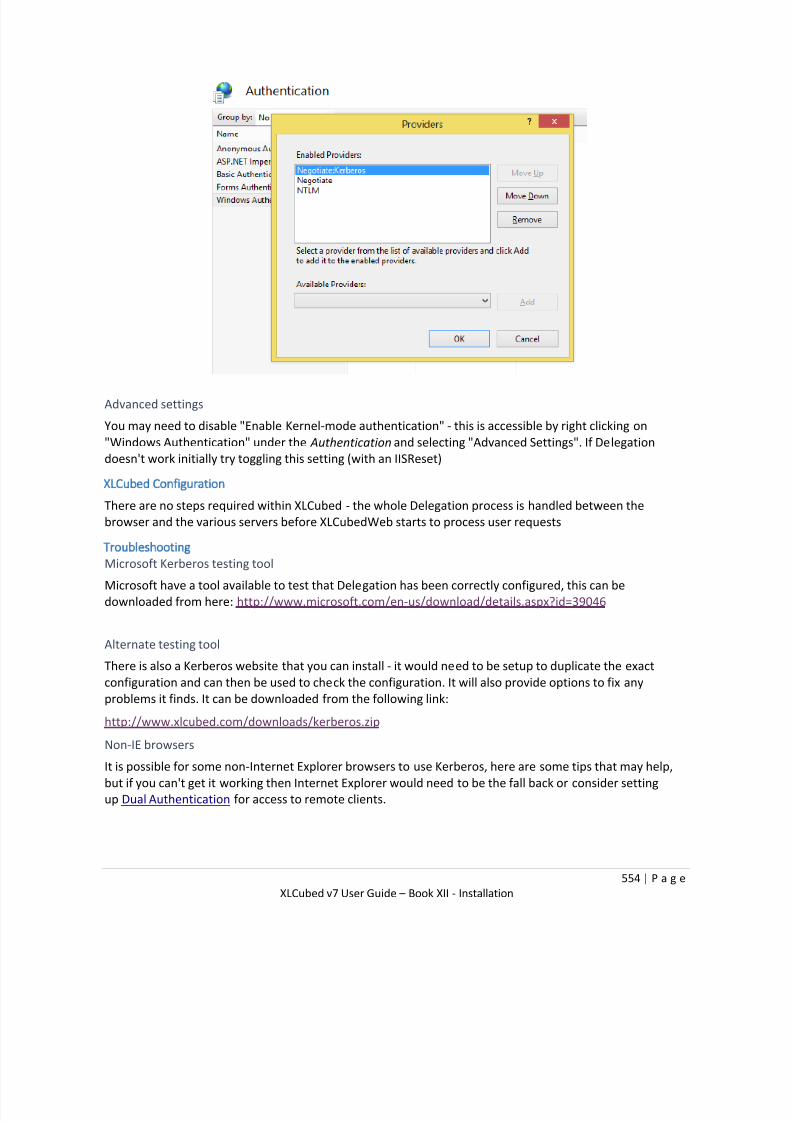
7/17/2019 XL Cubed versión 7 UserGuide
http://slidepdf.com/reader/full/xl-cubed-version-7-userguide 566/567
554 | P a g e
XLCubed v7 User Guide – Book XII - Installation
Advanced settings
You may need to disable "Enable Kernel-mode authentication" - this is accessible by right clicking on
"Windows Authentication" under the Authentication and selecting "Advanced Settings". If Delegation
doesn't work initially try toggling this setting (with an IISReset)
XLCubed Configuration
There are no steps required within XLCubed - the whole Delegation process is handled between the
browser and the various servers before XLCubedWeb starts to process user requests
Troubleshooting
Microsoft Kerberos testing tool
Microsoft have a tool available to test that Delegation has been correctly configured, this can be
downloaded from here: http://www.microsoft.com/en-us/download/details.aspx?id=39046
Alternate testing tool
There is also a Kerberos website that you can install - it would need to be setup to duplicate the exactconfiguration and can then be used to check the configuration. It will also provide options to fix any
problems it finds. It can be downloaded from the following link:
http://www.xlcubed.com/downloads/kerberos.zip
Non-IE browsers
It is possible for some non-Internet Explorer browsers to use Kerberos, here are some tips that may help,
but if you can't get it working then Internet Explorer would need to be the fall back or consider setting
up Dual Authentication for access to remote clients.

7/17/2019 XL Cubed versión 7 UserGuide
http://slidepdf.com/reader/full/xl-cubed-version-7-userguide 567/567
CHROME
You would need to add all the servers involved in the process to the "White List", this is done via the
shortcut for the browser:
"C:\Program Files\Google\Chrome\Application\chrome.exe" --auth-server-
whitelist=" ASServer ,WebServer ,SQLServer " --auth-negotiate-delegate-
whitelist=" ASServer ,WebServer ,SQLServer "