xcalibur proteome discoverer - forth-imbb€¦ · xcalibur proteome discoverer user guide...
TRANSCRIPT

Xcalibur
Proteome Discoverer
User Guide
XCALI-97232 Revision A July 2008

© 2008 Thermo Fisher Scientific Inc. All rights reserved.
Xcalibur is a registered trademarks of Thermo Fisher Scientific Inc. in the United States. ZCore, and Proteome Discoverer are trademarks of Thermo Fisher Scientific Inc. in the United States.
Adobe® and Acrobat® are registered trademarks of Adobe Systems Incorporated. Microsoft®, Excel®, Windows®, and ActiveX® are registered trademarks of Microsoft Corporation. SEQUEST® is a registered trademark of the University of Washington. Mascot is first defined in an Electrophoresis publication, 20(18) 3551-67 (1999).
Thermo Fisher Scientific Inc. provides this document to its customers with a product purchase to use in the product operation. This document is copyright protected and any reproduction of the whole or any part of this document is strictly prohibited, except with the written authorization of Thermo Fisher Scientific Inc.
The contents of this document are subject to change without notice. All technical information in this document is for reference purposes only. System configurations and specifications in this document supersede all previous information received by the purchaser.
Thermo Fisher Scientific Inc. makes no representations that this document is complete, accurate or error-free and assumes no responsibility and will not be liable for any errors, omissions, damage or loss that might result from any use of this document, even if the information in the document is followed properly.
This document is not part of any sales contract between Thermo Fisher Scientific Inc. and a purchaser. This document shall in no way govern or modify any Terms and Conditions of Sale, which Terms and Conditions of Sale shall govern all conflicting information between the two documents.
Release history: version 1.0
For Research Use Only. Not regulated for medical or veterinary diagnostic use by U.S. Federal Drug Administration or other competent authorities.

C
Contents
Preface . . . . . . . . . . . . . . . . . . . . . . . . . . . . . . . . . . . . . . . . . . . . . . . . . . . . . . . . . . . . . viiRelated Documentation . . . . . . . . . . . . . . . . . . . . . . . . . . . . . . . . . . . . . . . . . . viiSystem Requirements . . . . . . . . . . . . . . . . . . . . . . . . . . . . . . . . . . . . . . . . . . . .viiiLicenses . . . . . . . . . . . . . . . . . . . . . . . . . . . . . . . . . . . . . . . . . . . . . . . . . . . . . .viiiSafety and Special Notices . . . . . . . . . . . . . . . . . . . . . . . . . . . . . . . . . . . . . . . . . xContacting Us . . . . . . . . . . . . . . . . . . . . . . . . . . . . . . . . . . . . . . . . . . . . . . . . . .xi
Chapter 1 Getting to Know Proteome Discoverer . . . . . . . . . . . . . . . . . . . . . . . . . . . . . . . . . . . .1Proteome Discoverer User Interface. . . . . . . . . . . . . . . . . . . . . . . . . . . . . . . . . . . 1
Main Window and Navigation . . . . . . . . . . . . . . . . . . . . . . . . . . . . . . . . . . . . 2Menus . . . . . . . . . . . . . . . . . . . . . . . . . . . . . . . . . . . . . . . . . . . . . . . . . . . . . . . 4
Understanding Proteome Discoverer . . . . . . . . . . . . . . . . . . . . . . . . . . . . . . . . . 11Proteome Discoverer Features . . . . . . . . . . . . . . . . . . . . . . . . . . . . . . . . . . . . . . 12Using Proteome Discoverer . . . . . . . . . . . . . . . . . . . . . . . . . . . . . . . . . . . . . . . . 13Search Algorithms Overview . . . . . . . . . . . . . . . . . . . . . . . . . . . . . . . . . . . . . . . 14
Overview of Processing, Analyzing, and Interpreting Raw Data. . . . . . . . . . . 14Mascot Search Algorithm . . . . . . . . . . . . . . . . . . . . . . . . . . . . . . . . . . . . . . . 16ZCore Search Algorithm . . . . . . . . . . . . . . . . . . . . . . . . . . . . . . . . . . . . . . . . 16SEQUEST Search Algorithm . . . . . . . . . . . . . . . . . . . . . . . . . . . . . . . . . . . . 17
Raw Data, Results, Reports, and Analysis . . . . . . . . . . . . . . . . . . . . . . . . . . . . . 18Databases and Sample Files . . . . . . . . . . . . . . . . . . . . . . . . . . . . . . . . . . . . . . 18Proteome Discoverer Input and Output File Types . . . . . . . . . . . . . . . . . . . . 18
Proteome Discoverer Workflow. . . . . . . . . . . . . . . . . . . . . . . . . . . . . . . . . . . . . 19Quantitation Overview . . . . . . . . . . . . . . . . . . . . . . . . . . . . . . . . . . . . . . . . . . . 20
About iTRAQ Quantitation . . . . . . . . . . . . . . . . . . . . . . . . . . . . . . . . . . . . . 20Peptide Ratio Calculation . . . . . . . . . . . . . . . . . . . . . . . . . . . . . . . . . . . . . . . 20Show Reporter Intensities . . . . . . . . . . . . . . . . . . . . . . . . . . . . . . . . . . . . . . . 21Quantitation Spectrum . . . . . . . . . . . . . . . . . . . . . . . . . . . . . . . . . . . . . . . . . 21
Qual Browser Overview. . . . . . . . . . . . . . . . . . . . . . . . . . . . . . . . . . . . . . . . . . . 22InforSense Protein Annotation Discussion . . . . . . . . . . . . . . . . . . . . . . . . . . . . 23
InforSense Workflow Types . . . . . . . . . . . . . . . . . . . . . . . . . . . . . . . . . . . . . 23Introduction to GO Ontology. . . . . . . . . . . . . . . . . . . . . . . . . . . . . . . . . . . . 24Introduction to Metadata Retrieval . . . . . . . . . . . . . . . . . . . . . . . . . . . . . . . . 24
Thermo Scientific Proteome Discoverer User Guide iii

Contents
iv
Chapter 2 Using Proteome Discoverer . . . . . . . . . . . . . . . . . . . . . . . . . . . . . . . . . . . . . . . . . . . .25How Proteome Discoverer Fits Into Your Lab Workflow . . . . . . . . . . . . . . . . . 26Overview of Menu Options. . . . . . . . . . . . . . . . . . . . . . . . . . . . . . . . . . . . . . . . 27
Start Proteome Discoverer . . . . . . . . . . . . . . . . . . . . . . . . . . . . . . . . . . . . . . . 27File Menu . . . . . . . . . . . . . . . . . . . . . . . . . . . . . . . . . . . . . . . . . . . . . . . . . . . 27
Working with Search Wizards . . . . . . . . . . . . . . . . . . . . . . . . . . . . . . . . . . . . . . 29Search Results, Reports, and Analysis . . . . . . . . . . . . . . . . . . . . . . . . . . . . . . . . 36
Understanding Reports and Views. . . . . . . . . . . . . . . . . . . . . . . . . . . . . . . . . 37Search Summary Page . . . . . . . . . . . . . . . . . . . . . . . . . . . . . . . . . . . . . . . . . . 38Protein Grid . . . . . . . . . . . . . . . . . . . . . . . . . . . . . . . . . . . . . . . . . . . . . . . . . 39Creating a Report from Multiple Results . . . . . . . . . . . . . . . . . . . . . . . . . . . . 41Peptide Grid . . . . . . . . . . . . . . . . . . . . . . . . . . . . . . . . . . . . . . . . . . . . . . . . . 43Peptide Confidence Page . . . . . . . . . . . . . . . . . . . . . . . . . . . . . . . . . . . . . . . . 46Search Input Page . . . . . . . . . . . . . . . . . . . . . . . . . . . . . . . . . . . . . . . . . . . . . 46Filters Page . . . . . . . . . . . . . . . . . . . . . . . . . . . . . . . . . . . . . . . . . . . . . . . . . . 47
Using the Proteome Discoverer Workflow Editor . . . . . . . . . . . . . . . . . . . . . . . 49Workflow Workspace . . . . . . . . . . . . . . . . . . . . . . . . . . . . . . . . . . . . . . . . . . 51Creating and Saving a Search Workflow . . . . . . . . . . . . . . . . . . . . . . . . . . . . 53Discoverer Workflow Nodes Details . . . . . . . . . . . . . . . . . . . . . . . . . . . . . . . 57
Working with Reports . . . . . . . . . . . . . . . . . . . . . . . . . . . . . . . . . . . . . . . . . . . . 59Working with the Search Job Queue . . . . . . . . . . . . . . . . . . . . . . . . . . . . . . . . . 60
Checking Your Job Queue Search Status . . . . . . . . . . . . . . . . . . . . . . . . . . . . 60Deleting Items from the Queue List . . . . . . . . . . . . . . . . . . . . . . . . . . . . . . . 61
Using FASTA Database Utilities . . . . . . . . . . . . . . . . . . . . . . . . . . . . . . . . . . . . 62FASTA Files . . . . . . . . . . . . . . . . . . . . . . . . . . . . . . . . . . . . . . . . . . . . . . . . . 63Adding Protein References to FASTA . . . . . . . . . . . . . . . . . . . . . . . . . . . . . . 64Performing a Decoy Database Search . . . . . . . . . . . . . . . . . . . . . . . . . . . . . . 64
Working with Chemical Modifications . . . . . . . . . . . . . . . . . . . . . . . . . . . . . . . 66How to Quantify Your Data Using Adminstration and Workflow . . . . . . . . . . 67
Reporter Ion Based Quantitation in Proteome Discoverer . . . . . . . . . . . . . . . 67Quantitation Summary . . . . . . . . . . . . . . . . . . . . . . . . . . . . . . . . . . . . . . . . . 70Assess the Abundance of the Precursor. . . . . . . . . . . . . . . . . . . . . . . . . . . . . . 72
Using Qual Browser . . . . . . . . . . . . . . . . . . . . . . . . . . . . . . . . . . . . . . . . . . . . . 72Job Queue . . . . . . . . . . . . . . . . . . . . . . . . . . . . . . . . . . . . . . . . . . . . . . . . . . . . . 73
Using the Job Queue . . . . . . . . . . . . . . . . . . . . . . . . . . . . . . . . . . . . . . . . . . . 73Open a Completed Report From Job Queue . . . . . . . . . . . . . . . . . . . . . . . . . 74
InforSense . . . . . . . . . . . . . . . . . . . . . . . . . . . . . . . . . . . . . . . . . . . . . . . . . . . . . 75
Chapter 3 Interpreting Search Results . . . . . . . . . . . . . . . . . . . . . . . . . . . . . . . . . . . . . . . . . . . .77Working with the Initial Results Report . . . . . . . . . . . . . . . . . . . . . . . . . . . . . . 78
Organizing Rows and Columns. . . . . . . . . . . . . . . . . . . . . . . . . . . . . . . . . . . 78Saving and Applying Results Report Layout Changes . . . . . . . . . . . . . . . . . . 82
Proteome Discoverer User Guide Thermo Scientific

Contents
Working with Filters . . . . . . . . . . . . . . . . . . . . . . . . . . . . . . . . . . . . . . . . . . . . . 84Filtering Results. . . . . . . . . . . . . . . . . . . . . . . . . . . . . . . . . . . . . . . . . . . . . . . 85Removing and Deactivating Filters . . . . . . . . . . . . . . . . . . . . . . . . . . . . . . . . 87Quick Filtered Items . . . . . . . . . . . . . . . . . . . . . . . . . . . . . . . . . . . . . . . . . . . 92
False Discovery Rates . . . . . . . . . . . . . . . . . . . . . . . . . . . . . . . . . . . . . . . . . . . . 93How to Calculate False Discovery Rates . . . . . . . . . . . . . . . . . . . . . . . . . . . . 93What are Target False Discovery Rates (FDRs)? . . . . . . . . . . . . . . . . . . . . . . 94Determining False Discovery Rates . . . . . . . . . . . . . . . . . . . . . . . . . . . . . . . . 95False Discovery Rates and Peptide Confidence Indicators . . . . . . . . . . . . . . . 97
Working with the Proteins Grid . . . . . . . . . . . . . . . . . . . . . . . . . . . . . . . . . . . . 98Researching Groups of Proteins. . . . . . . . . . . . . . . . . . . . . . . . . . . . . . . . . . . 98Interpreting Your Results with the Chromatogram View. . . . . . . . . . . . . . . 100Interpreting Your Results with the Protein Identification Details View . . . . 102Report Item Distribution Chart . . . . . . . . . . . . . . . . . . . . . . . . . . . . . . . . . 103
Working with the Peptides Grid . . . . . . . . . . . . . . . . . . . . . . . . . . . . . . . . . . . 106Interpreting Your Results with the Search Reports Views . . . . . . . . . . . . . . 106Peptide Identification Details . . . . . . . . . . . . . . . . . . . . . . . . . . . . . . . . . . . 108Fragment Ions . . . . . . . . . . . . . . . . . . . . . . . . . . . . . . . . . . . . . . . . . . . . . . . 109
Working with the Search Input . . . . . . . . . . . . . . . . . . . . . . . . . . . . . . . . . . . . 112Interpreting the Isotope Pattern View . . . . . . . . . . . . . . . . . . . . . . . . . . . . . . . 113Interpreting the Spectrum View . . . . . . . . . . . . . . . . . . . . . . . . . . . . . . . . . . . 114Interpreting the Extracted Ion Chromatogram . . . . . . . . . . . . . . . . . . . . . . . . 115Interpreting the Fragment Match View . . . . . . . . . . . . . . . . . . . . . . . . . . . . . . 115Exporting Data to Other Programs . . . . . . . . . . . . . . . . . . . . . . . . . . . . . . . . . 117
Copying or Saving a View to an Image . . . . . . . . . . . . . . . . . . . . . . . . . . . . 117Exporting Exclusion and Inclusion Mass Lists to Xcalibur. . . . . . . . . . . . . . 118Export Search Results to Excel. . . . . . . . . . . . . . . . . . . . . . . . . . . . . . . . . . . 119Exporting Spectra . . . . . . . . . . . . . . . . . . . . . . . . . . . . . . . . . . . . . . . . . . . . 123
Working with InforSense Discussion. . . . . . . . . . . . . . . . . . . . . . . . . . . . . . . . 124InforSense and the Internet . . . . . . . . . . . . . . . . . . . . . . . . . . . . . . . . . . . . . 124Data Retrieval Content Levels . . . . . . . . . . . . . . . . . . . . . . . . . . . . . . . . . . . 125Using InforSense Protein Annotation . . . . . . . . . . . . . . . . . . . . . . . . . . . . . 125
Chapter 4 Customizing Proteome Discoverer. . . . . . . . . . . . . . . . . . . . . . . . . . . . . . . . . . . . . .131Customizing the Toolbar. . . . . . . . . . . . . . . . . . . . . . . . . . . . . . . . . . . . . . . . . 131
Customizing the Toolbar Layout. . . . . . . . . . . . . . . . . . . . . . . . . . . . . . . . . 132Customizing Toolbar Icons, Fonts, and Tooltips Display . . . . . . . . . . . . . . 135
Customizing Cleavage Reagents . . . . . . . . . . . . . . . . . . . . . . . . . . . . . . . . . . . 137Customizing Chemical Modification Settings . . . . . . . . . . . . . . . . . . . . . . . . . 138
Entering and Deleting Chemical Modifications. . . . . . . . . . . . . . . . . . . . . . 139Adding and Removing Amino Acids . . . . . . . . . . . . . . . . . . . . . . . . . . . . . . 141Importing Chemical Modifications . . . . . . . . . . . . . . . . . . . . . . . . . . . . . . . 142
Using FASTA Database Administration . . . . . . . . . . . . . . . . . . . . . . . . . . . . . 144
Thermo Scientific Proteome Discoverer User Guide v

Contents
vi
Appendix A Chemistry References . . . . . . . . . . . . . . . . . . . . . . . . . . . . . . . . . . . . . . . . . . . . . . . .147Amino Acid Mass Values. . . . . . . . . . . . . . . . . . . . . . . . . . . . . . . . . . . . . . . . . 147Modification Values . . . . . . . . . . . . . . . . . . . . . . . . . . . . . . . . . . . . . . . . . . . . 148Enzyme Cleavage Properties . . . . . . . . . . . . . . . . . . . . . . . . . . . . . . . . . . . . . . 149Fragment Ions . . . . . . . . . . . . . . . . . . . . . . . . . . . . . . . . . . . . . . . . . . . . . . . . . 150
Appendix B FASTA Reference . . . . . . . . . . . . . . . . . . . . . . . . . . . . . . . . . . . . . . . . . . . . . . . . . . . .151NCBI . . . . . . . . . . . . . . . . . . . . . . . . . . . . . . . . . . . . . . . . . . . . . . . . . . . . . . . 151MSIPI . . . . . . . . . . . . . . . . . . . . . . . . . . . . . . . . . . . . . . . . . . . . . . . . . . . . . . . 152IPI . . . . . . . . . . . . . . . . . . . . . . . . . . . . . . . . . . . . . . . . . . . . . . . . . . . . . . . . . . 152UniRef100 . . . . . . . . . . . . . . . . . . . . . . . . . . . . . . . . . . . . . . . . . . . . . . . . . . . 153SwissProt & TrEMBL . . . . . . . . . . . . . . . . . . . . . . . . . . . . . . . . . . . . . . . . . . . 153MSDB. . . . . . . . . . . . . . . . . . . . . . . . . . . . . . . . . . . . . . . . . . . . . . . . . . . . . . . 154Custom Database Support. . . . . . . . . . . . . . . . . . . . . . . . . . . . . . . . . . . . . . . . 154
Custom Parsing Rule A . . . . . . . . . . . . . . . . . . . . . . . . . . . . . . . . . . . . . . . . 154Custom Parsing Rule B . . . . . . . . . . . . . . . . . . . . . . . . . . . . . . . . . . . . . . . . 154Custom Parsing Rule C . . . . . . . . . . . . . . . . . . . . . . . . . . . . . . . . . . . . . . . . 155
Index . . . . . . . . . . . . . . . . . . . . . . . . . . . . . . . . . . . . . . . . . . . . . . . . . . . . . . . . . . . . . . .157
Proteome Discoverer User Guide Thermo Scientific

P
Preface
This guide describes how to use Proteome Discoverer™ 1.0 for peptide and protein mass spectrometry analyses.
Related DocumentationThis guide includes information on procedures and parameters used in Proteome Discoverer. You can access this information by reading a PDF version of the Xcalibur Proteome Discoverer User Guide or searching the Help from within the Proteome Discoverer program using the Help menu. The User Guide (PDF) comes bundled with the application software.
To open the help
• From the main Proteome Discoverer window, choose Help > Proteome Discoverer Help.
• If available for a specific window or view, click Help or press F1 for information about setting parameters.
For more information, including upcoming application notes, visit www.thermo.com.
Contents
• Related Documentation
• Getting to Know Proteome Discoverer
• System Requirements
• Licenses
• Safety and Special Notices
• Contacting Us
Thermo Scientific Proteome Discoverer User Guide vii

Preface
vii
System RequirementsProteome Discoverer requires a license. In addition, your system must meet these minimum requirements.
LicensesYou can request a license for Proteome Discoverer as well as for your proteome computer lab, such as InforSense.
To request your Proteome Discoverer license
1. Choose Administration > Manage Licenses.
2. In the barcode column Discoverer row, enter the number from the Proteome Discoverer jewel case.
Figure 1. License Administration list of features
System Requirements
Hardware • 2 GHz processor with 2 GB RAM• CD-ROM drive• Video card and monitor capable of 1280x1024 resolution (XGA)• Screen resolution of 96 dpi (set in Windows Disaply Properties)• 75 GB or greater available on the C: drive • NTFS format
Software • Microsoft™ Windows™ XP Professional with Service Pack 2 or Service Pack 3
Tip The barcode is read-only for permanent licenses.
i Proteome Discoverer User Guide Thermo Scientific

Preface
T
3. In the User Information pane, type your contact information.
Figure 2. License User Information pane
4. In the Host Information pane, click Compose Email.
Figure 3. License Host Information pane
Your default e-mail tool creates a new e-mail message, prepopulated with a message to Thermo Fisher Scientific, with a request for a Thermo Proteome Discoverer License.
5. When the license is sent back to you, copy and paste the license number into the Add Licenses box. See Figure 4.
6. Click Add Licenses.
Figure 4. Proteome Discoverer Add License pane
hermo Scientific Proteome Discoverer User Guide ix

Preface
x
To enter other licenses, such as InforSense
1. Choose Administration > Manage Licenses.
2. In the Serial Number column <application> row, enter the <application> jewel case number.
Safety and Special NoticesMake sure you follow the precautionary statements presented in this guide. The safety and other special notices appear in boxes.
Safety and special notices include the following:
CAUTION Highlights hazards to humans, property, or the environment. Each CAUTION notice is accompanied by an appropriate CAUTION symbol.
IMPORTANT Highlights information necessary to prevent damage to software, loss of data, or invalid test results; or might contain information that is critical for optimal performance of the system.
Note Highlights information of general interest.
Tip Highlights helpful information that can make a task easier.
Proteome Discoverer User Guide Thermo Scientific

Preface
T
Contacting UsThere are several ways to contact Thermo Fisher Scientific for the information you need.
To contact Technical Support
Find software updates and utilities to download at mssupport.thermo.com.
To contact Customer Service for ordering information
To copy manuals from the Internet
Go to mssupport.thermo.com and click Customer Manuals in the left margin of the window.
To suggest changes to documentation or to Help
• Fill out a reader survey online at www.thermo.com/lcms-techpubs.
• Send an e-mail message to the Technical Publications Editor at [email protected].
Phone 800-532-4752Fax 561-688-8736E-mail [email protected] base www.thermokb.com
Phone 800-532-4752Fax 561-688-8731E-mail [email protected] site www.thermo.com/ms
hermo Scientific Proteome Discoverer User Guide xi


1
Getting to Know Proteome Discoverer
Proteome Discoverer™1.0 is a configurable software package for peptide and protein mass spectrometry analyses. It is a true end-to-end solution for workflow driven analysis. You can use this suite of applications to analyze spectral data from all Thermo Fisher Scientific and other mass spectrometers.
This chapter provides an overview of Proteome Discoverer functionality and discusses in detail its user interface.
Proteome Discoverer User InterfaceIn the Proteome Discoverer window, you can process data and view reports. You can customize the toolbar, and launch these tools easily from the main window.
Contents
• Proteome Discoverer User Interface
• Understanding Proteome Discoverer
• Proteome Discoverer Features
• Using Proteome Discoverer
• Search Algorithms Overview
• Raw Data, Results, Reports, and Analysis
• Proteome Discoverer Workflow
• Quantitation Overview
• Qual Browser Overview
• InforSense Protein Annotation Discussion
Thermo Scientific Proteome Discoverer User Guide 1

1 Getting to Know Proteome DiscovererProteome Discoverer User Interface
2
Main Window and Navigation
Figure 1, shows the toolbar options and button names. The buttons give you quick access to the following:
• Views
• Search wizards
• Administrative options and features
Use the toolbar handle to move a group of buttons to a different location on the toolbar. The Customize menu provides options to change the visual appearance of Proteome Discoverer.
Figure 1. Proteome Discoverer window
Toolbar
Show reports and graphs quick access
Search wizards
Workflow quick access
Handles
Administration quick access
Access tohidden file
Quantitation
Proteome Discoverer User Guide Thermo Scientific
1 Getting to Know Proteome DiscovererProteome Discoverer User Interface
T
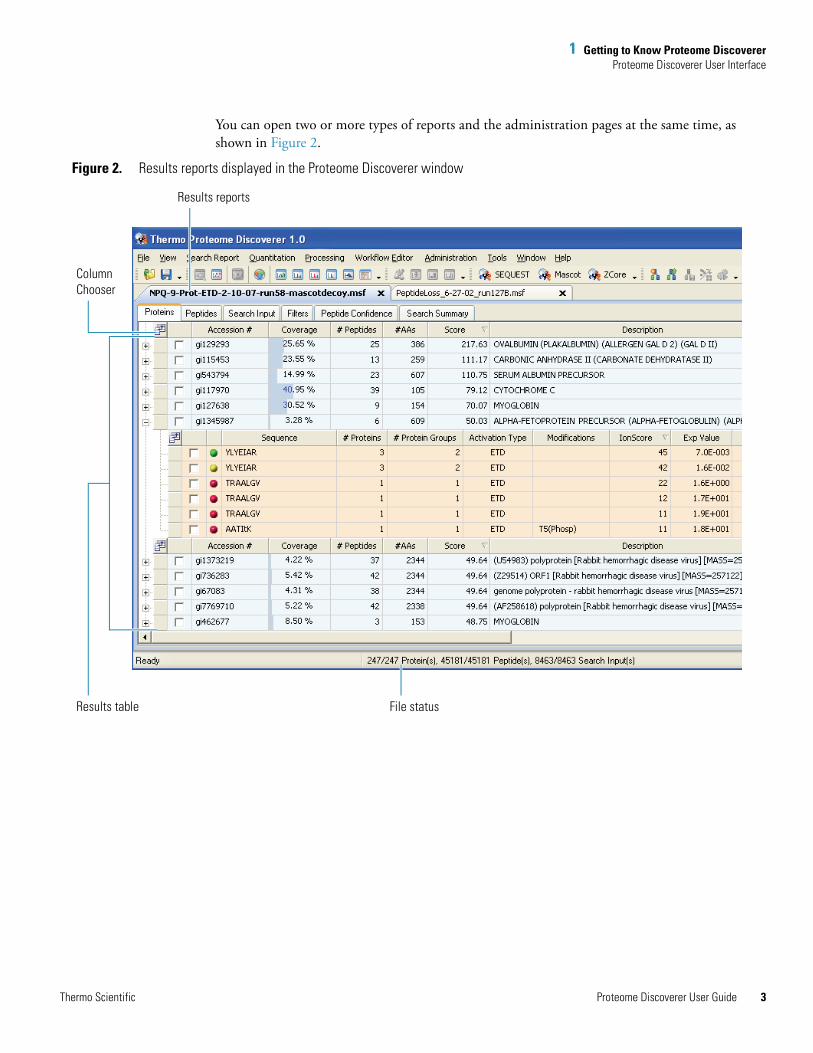
You can open two or more types of reports and the administration pages at the same time, as shown in Figure 2.
Figure 2. Results reports displayed in the Proteome Discoverer window
ColumnChooser
Results table File status
Results reports
hermo Scientific Proteome Discoverer User Guide 3

1 Getting to Know Proteome DiscovererProteome Discoverer User Interface
4
Menus
Proteome Discoverer has two broad types of toolbar menus to access tools:
• Display reports and views
• Configure database files and displays
The following are menu choices:
• Shortcut Menus• File Menu• Search Report Menu• Search Report Menu• Quantitation Menu• Processing Menu• Workflow Editor Menu• Administration Menu• Tools Menu• Window Menu• Help Menu
Shortcut Menus
Proteome Discoverer reports and views have shortcut menus with features you can use to help analyze data.
• Right-click anywhere in a view to display the shortcut menu. Figure 3 shows the View shortcut menu with commands to zoom into the chromatogram or copy it, or save the view to be included in another program.
Figure 3. View shortcut menu
View shortcut menu
Proteome Discoverer User Guide Thermo Scientific

1 Getting to Know Proteome DiscovererProteome Discoverer User Interface
T
• Right-click anywhere in a report to display its shortcut menu as shown in Figure 4.
Figure 4. Report shortcut menu
File Menu
Use File menu commands (see Table 1) to open, close, or save your reports; connect or disconnect from a server; import a Bioworks .srf file; and close Proteome Discoverer.
Table 1. Description of File menu commands (Sheet 1 of 2)
Feature Description Menuaccess
Shortcut keyaccess
Toolbaraccess
Open report Use to upload a report. File > Open Report CTRL+O
Save report Use to save a modified report. File > Save Report
Close Use to close a report without saving any modifications, such as applying filters. Proteome Discoverer remains open after the report is closed.
File > Close
Import Search Results from SRF
Import search results that are in SRF format.
File > Import Search Results from SRF
Connect to Server (only if the Client_Server feature is licensed)Select a different server to use for your search process.
File > Connect to Server
hermo Scientific Proteome Discoverer User Guide 5

1 Getting to Know Proteome DiscovererProteome Discoverer User Interface
6
Search Report Menu
Use the Search Report menu to access views and export commands.
Disconnect from Server
(only if the Client_Server feature is licensed)Select the server to disconnect from.
File > Disconnect from Server
Exit Close Proteome Discoverer and all opened views and reports without saving any unspecified modifications.
File > Exit
Table 1. Description of File menu commands (Sheet 2 of 2)
Feature Description Menuaccess
Shortcut keyaccess
Toolbaraccess
Table 2. Description of the Search Report menu commands (Sheet 1 of 2)
Feature Description Menuaccess
Shortcut keyaccess
Toolbaraccess
Show Details When you select a protein row, the Protein Identification Details view appears. When you select a peptide row, the Peptide Identification Details view appears.
Search Report > Show Details
CTRL+D
Show Distribution Chart
Assess different aspects of the search results including scores, delta masses, retention times, and such by plotting them in relationship to each other.
Search Report > Show Distribution View
CTRL+SHIFT+D
Show proteins covered by this set of peptides
Explores what proteins are present and their associations through related peptides.
Search Report > Show proteins covered by this set of peptides
CTRL+SHIFT+H
Show Chromatogram View
Shows the intensities of one or more masses as a function of time.
Search Report > Show Chromatogram View
CTRL+SHIFT+C
Show Spectrum Shows the MS/MS spectrum that was used for the peptide search.
Search Report > Show Spectrum
CTRL+SHIFT+S
Proteome Discoverer User Guide Thermo Scientific

1 Getting to Know Proteome DiscovererProteome Discoverer User Interface
T
Show Fragment Match Spectrum
Shows the MS/MS spectrum used for the search, annotated with the fragments that have been assigned within a predefined mass tolerance.
Search Report > Show Fragment Match Spectrum
CTRL+SHIFT+F
Show Isotope Pattern Shows a detailed perspective of the MS scan of the precursor isotope pattern of the selected precursor.
Search Report > Show Isotope Pattern
CTRL+SHIFT+P
Show Sequence Comparison
Displays the complete sequences for different proteins associated with a single peptide.
Search Report > Show Sequence Comparison
Show Extracted Ion Chromatogram
Shows the extracted mass chromatogram of the precursor mass of the selected peptide.
Search Report > Show Extracted Ion Chromatogram
CTRL+SHIFT+T
Export Xcalibur Exclusion List
Exports the exclusion list, which is defined in this Search Report option.
Search Report > Export Xcalibur Exclusion List
Export Spectra Exports the spectra, which is defined in this Search Report option.
Search Report > Export Spectra
ProtXML Exports selected rows into prot format.
Search Report > Export ProtXML
Layout Provides a menu of options to save result layout.
Search Report > Layout
Peptide Consensus View
A graphic view of the ion and peptide search results data.
Search Report > Show Peptide Consensus View
Table 2. Description of the Search Report menu commands (Sheet 2 of 2)
Feature Description Menuaccess
Shortcut keyaccess
Toolbaraccess
hermo Scientific Proteome Discoverer User Guide 7

1 Getting to Know Proteome DiscovererProteome Discoverer User Interface
8
Quantitation Menu
Use the Quantitation menu to access the quantitation methods.
Processing Menu
Use the wizards from the Processing menu to start your search process with predefined workflows. Process your .raw files and scans based on the parameters you set in the wizard. To establish your own search process, use the Workflow Editor Menu.
Workflow Editor Menu
Use the Workflow Editor to customize your search workflow, so you do not have to use the predefined search wizards.
Table 3. Description of the Quantitation menu commands
Feature Description Menuaccess
Shortcut keyaccess
Toolbaraccess
Edit Quantitation Method
Edits the quantitation method of the current report.
Quantitation > Edit Quantitation Method
Show peptide ratios Shows the peptide ratios per protein view.
Quantitation > Show Peptide Ratios
CTRL+SHIFT+R
Show Reporter Intensities
Shows the reporter intensities view.
Quantitation > Show Reporter Intensities
CTRL+SHIFT+N
Show Quantitation Spectrum
Shows the spectrum used for quantitation.
Quantitation > Show Quantitation Spectrum
CTRL+SHIFT+Q
Table 4. Description of the Workflow Editor menu commands (Sheet 1 of 2)
Feature Description Menuaccess
Shortcut keyaccess
Toolbaraccess
New Workflow Opens Workflow Editor page. Workflow Editor > New Workflow
Open From Template Opens existing saved data analysis workflow.
Workflow Editor > Open From Template
Save As Template Saves a workflow. Workflow Editor > Save As Template
Proteome Discoverer User Guide Thermo Scientific

1 Getting to Know Proteome DiscovererProteome Discoverer User Interface
T
Administration Menu
Use the Adminstation menu to manage processed data, methods, and job queues.
Auto Layout Automatically adjusts and aligns the connecting arrows and nodes.
Workflow Editor > Auto Layout
Start Workflow Begins the data analysis search using your selected workflow.
Workflow Editor > Start Workflow
Import Workflow from XML
Imports a data analysis workflow from data in XML format.
Workflow Editor > Import Workflow from XML
Export Workflow to XML
Exports your workflow into an XML formatted file.
Workflow Editor > Export Workflow to XML
Table 4. Description of the Workflow Editor menu commands (Sheet 2 of 2)
Feature Description Menuaccess
Shortcut keyaccess
Toolbaraccess
Table 5. Description of the Administration menu commands (Sheet 1 of 2)
Feature Description Menuaccess
Shortcut keyaccess
Toolbaraccess
Show Job Queue Displays the search queue and the status of current job searches.
Administration > Show Job Queue
CTRL+J
Open .msf Opens a recently completed, hightlighted report in the job queue.
Administration > Show Job Queue > Open Report
Maintains FASTA Files Adds, removes, and modifies FASTA files.
Administration > Maintain FASTA Files
Maintain Chemical Modifications
Sets the chemical modifications to be used in the search process.
Administration > Maintain Chemical Modifications
Maintain Cleavage Reagents
Adds, removes, and modifies the cleavage reagents.
Administration > Maintain Cleavage Reagents
Maintain Quantitation Methods
Maintains and edits known quantitation methods.
Administration > Maintain Quantitation Methods
hermo Scientific Proteome Discoverer User Guide 9

1 Getting to Know Proteome DiscovererProteome Discoverer User Interface
10
Tools Menu
Window Menu
Use the Window menu to see all of the open windows available to view in your session of Proteome Discoverer.
Configuration Configuration of parameters used in all searches.
Administration > Configuration
Manage Licenses View license status and add new licenses.
Administration > Manage License
Table 6. Description of the Tools menu commands
Feature Description Menuaccess
Shortcut keyaccess
Toolbaraccess
Open QualBrowser Launches QualBrowser. Tools > Qual Browser CTRL+SHIFT+B
Open InforSense Launches InforSense. Tools > InforSense CTRL+SHIFT+I
FASTA Database Utilities
Appends and adds to an existing FASTA file.
Tools > FASTA Database Utilities
Table 5. Description of the Administration menu commands (Sheet 2 of 2)
Feature Description Menuaccess
Shortcut keyaccess
Toolbaraccess
Feature Description Menu access
Close All Windows Closes all the open windows of your Proteome Discoverer session.
Windows > Close All Windows
Proteome Discoverer User Guide Thermo Scientific

1 Getting to Know Proteome DiscovererUnderstanding Proteome Discoverer
T
Help Menu
Use the Help menu to access the Help and to determine the revision number of Proteome Discoverer.
Understanding Proteome DiscovererUse Proteome Discoverer to identify proteins from the mass spectra of digested fragments. The following concepts are highlights of Proteome Discoverer:
• Works with peak-finding search engines, such as SEQUEST™, Mascot™, and ZCore™, to process all data types collected from low- and high-mass accuracy MS instruments.
• Produces complementary data from a variety of dissociation methods and data-dependent stages of tandem mass spectrometry.
• Combines, filters, and annotates results from several search database engines and from multiple analysis iterations.
The peak-finding software searches the raw MS data and outputs a peak list and relative abundances. The peaks represent the peptides for a given mass and charge.
In the next step, the search engine correlates the uninterrupted tandem mass spectra of peptides with databases, such as FASTA. See “Databases and Sample Files” on page 18. Figure 5 outlines a standard workflow you can use with Proteome Discoverer.
Table 7. Description of the Help menu commands
Feature Description Menuaccess
Short key access
Toolbaraccess
About Proteome Discoverer
Displays the install version of Proteome Discoverer and its components. Shows the Thermo Fisher Scientific copyright notice.
Help > About Proteome Discoverer
Proteome Discoverer Help
Opens Proteome Discoverer Help.
Help > Proteome Discoverer Help
F1
hermo Scientific Proteome Discoverer User Guide 11

1 Getting to Know Proteome DiscovererProteome Discoverer Features
12
Figure 5. Searching spectra flowchart
Proteome Discoverer FeaturesProteome Discoverer includes the following features:
• Multiple search engines. See “Working with Search Wizards.”
• Workflow editor for searching with multiple algorithms and merging results from multiple dissociation techniques. See “Using the Proteome Discoverer Workflow Editor.”
• Database search results available from multiple raw files in a single protein/peptide report See “Understanding Reports and Views.”
• Ability to export a peptide/protein report. See “Exporting Data to Other Programs.”
• Integration with a local MASCOT installation.
• Ability to run tasks concurrently, such as database indexing and database searching.
• During database searching, the user interface remains responsive.
START with digested proteins.
Open a raw file.Spectra shown as relative abundances/time.
Select your search engine.Find peaks in raw data.
View report of matching peptide sequences. Interpret and search results.
Use filters as necessary.
Search processed data against FASTA database.
MS experiment produces raw data.
Proteome Discoverer
Experimental setup
Analysis
Quantitation
Legend
Proteome Discoverer User Guide Thermo Scientific

1 Getting to Know Proteome DiscovererUsing Proteome Discoverer
T
• Ability to import standard spectrum data formats, such as mzDATA, mzXml, and MGF.
• Ability to export standard spectrum data formats, such as mzDATA, dta, and MGF.
• Exports all or filtered results to the protXML format. See “Exporting Data to Other Programs.”
• Merges filtered or unfiltered search results.
• Displays graphic comparisons of two or more protein sequences.
• Support for a FASTA database manager tool. See “Using FASTA Database Utilities.”
• Connection to InforSense annotation workflows. See “InforSense Protein Annotation Discussion.”
• Integration with GO™ annotation, through InforSense, for proteins in summary results. See “InforSense Protein Annotation Discussion.”
• Support for TMT™ quantitation. See “Peptide Ratio Calculation.”
• Support for iTRAQ™ quantitation. See “About iTRAQ Quantitation.”
• Support for HMA ETD-Orbitrap data analysis.
Combining the traditional sensitivity of SEQUEST with the stringency of a probability-based scoring algorithm, Proteome Discoverer provides the flexibility to complete results and improve confidence in your peptide and protein matches.
Using Proteome DiscovererWith Proteome Discoverer, you can conduct data analysis searches of your spectrum using the search wizards or the Workflow Editor.
The Proteome Discoverer search wizards are predefined to quickly set your search parameters and get your results. There is one wizard for each of the supplied search engines: ZCore, SEQUEST, and Mascot.
For additional information on how to use the wizards, see “Working with Search Wizards” on page 29.
The Workflow Editor provides greater flexibility to create custom search results. Use the three-pane display to create a custom workflow. For additonal information, see “Using the Proteome Discoverer Workflow Editor” on page 49.
The next sections describe the following:
• Search Algorithms Overview
• Raw Data, Results, Reports, and Analysis
• Databases and Sample Files
hermo Scientific Proteome Discoverer User Guide 13

1 Getting to Know Proteome DiscovererSearch Algorithms Overview
14
Search Algorithms OverviewProteome Discoverer has search algorithms, ZCore, SEQUEST and Mascot; each produces complementary data. ZCore and SEQUEST are peptide search engines distributed by Thermo Fisher Scientific. Mascot is a protein identification search engine created by Matrix Science.
Mascot uses mass spectrometry data to identify proteins from primary sequence databases. ZCore is specifically developed and optimized to evaluate both high-mass accuracy and low-mass accuracy ETD and ECD data. SEQUEST is capable of analyzing three types:
• Electron-transfer dissociation (ETD)
• Electron-capture dissociation (ECD)
• Collision-induced dissociation (CID)
ETD and CID ion fragmentation methods produce distinct ion fragment sets:
• ETD and ECD generate primarily C and Z ion fragments.
• CID generates primarily B and Y ion fragments.
Frequently, peptides identified by CID are not observed with ETD and vice versa so that combining results from CID and ETD can enhance sequence coverage. Many times CID and ETD identify the same peptides, often with different precursor ion charge states. Combining ETD and CID results improve confidence in identifications.
Overview of Processing, Analyzing, and Interpreting Raw Data
Through user-specified settings in Proteome Discoverer, ZCore and SEQUEST algorithms can search, filter, and sort raw file data. In addition to creating reports from the analyzed data, Proteome Discoverer extracts relevant MS/MS spectra from the .raw file and determines the precursor charge state. Proteome Discoverer filters remove false positives and other non-relevant information with a variety of user-specified methods.
The following briefly outlines how to use Proteome Discoverer when processing, analyzing, and interpreting your MS data. See the flowchart in Figure 6 for more details.
1. Open a .raw file with Proteome Discoverer and define your configuration.
2. Select the activation and instrument types to initiate preprocessing;Proteome Discoverer automatically initates spectral preprocessing.
3. Select your search parameter settings and begin a search.Proteome Discoverer initiates a search against a FASTA database.
4. Review the generated reports and interpret the search results.
Note You can filter data according to false discovery rates that you define through the use of reverse FASTA databases.
Proteome Discoverer User Guide Thermo Scientific
1 Getting to Know Proteome DiscovererSearch Algorithms Overview
T
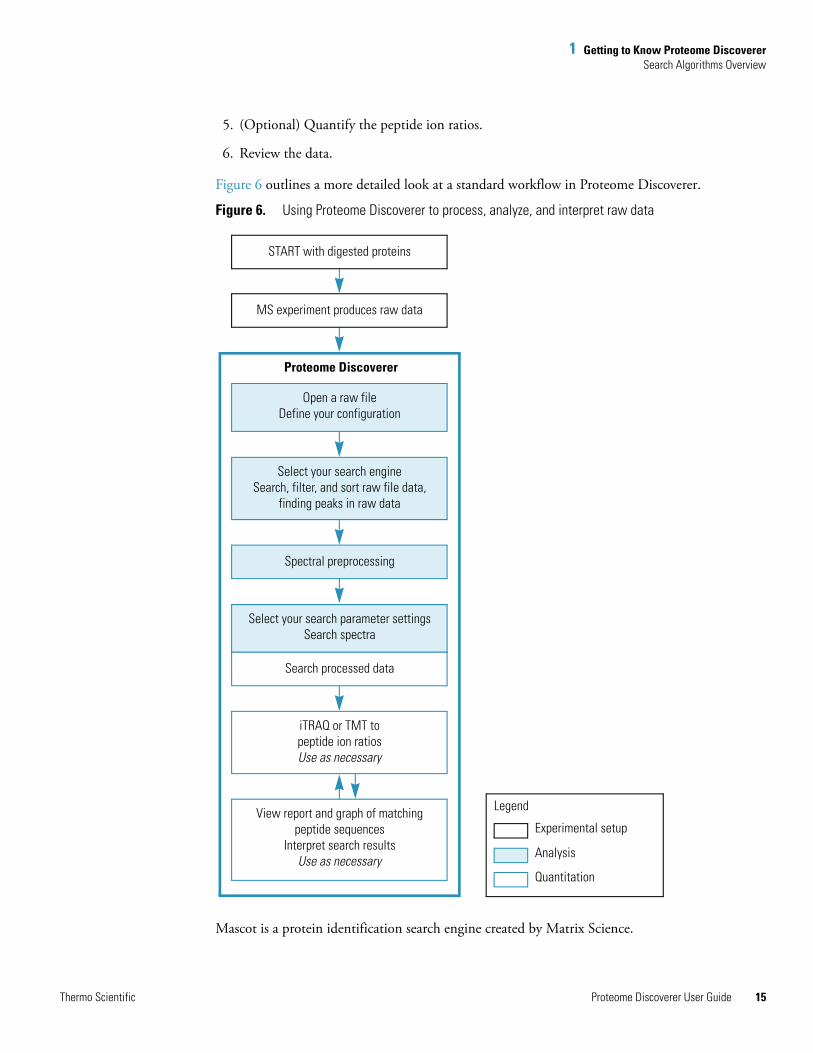
5. (Optional) Quantify the peptide ion ratios.
6. Review the data.
Figure 6 outlines a more detailed look at a standard workflow in Proteome Discoverer.
Figure 6. Using Proteome Discoverer to process, analyze, and interpret raw data
Mascot is a protein identification search engine created by Matrix Science.
Spectral preprocessing
START with digested proteins
Open a raw fileDefine your configuration
Select your search engineSearch, filter, and sort raw file data,
finding peaks in raw data
Select your search parameter settingsSearch spectra
Proteome Discoverer
Experimental setup
Analysis
Quantitation
Legend
MS experiment produces raw data
Search processed data
iTRAQ or TMT to peptide ion ratiosUse as necessary
View report and graph of matching peptide sequences
Interpret search resultsUse as necessary
hermo Scientific Proteome Discoverer User Guide 15

1 Getting to Know Proteome DiscovererSearch Algorithms Overview
16
Mascot Search Algorithm
Mascot uses mass spectrometry data to identify proteins from primary sequence databases. Mascot is unique in that it integrates all of the proven methods of searching. These different search methods can be categorized as follows:
• Peptide Mass Fingerprint: the experimental data are peptide mass values.A mass spectrum of the peptide mixture (an enzyme digested protein) provides a fingerprint of great specificity. So specific, that it is often possible to identify the protein from this information alone.
• Sequence Query: the peptide mass data is combined with amino acid sequence and composition information. When it is difficult determining a complete peptide sequence from an MS/MS spectrum, it can still be possible to find a series of peaks providing three or four residues of sequence data.
• MS/MS Ion Search: uninterpreted MS/MS data from one or more peptides. The MS/MS ions search accepts (mass and intensity pairs) peak lists. Only a single peptide may be searched, but this search mode is much more powerful when analysing an LC-MS/MS run containing data from multiple peptides. If you obtain matches to a number of peptides from a single protein you get a very high level of confidence for a correct result.
For more details on Mascot, visit www.matrixscience.com.
ZCore Search Algorithm
ZCore is specifically developed and optimized to evaluate both high-mass accuracy and nominal-mass accuracy ETD and ECD data. You can use ZCore to identify ETD and ECD MS/MS fragmentation spectra of precursor ions charge states between 2 and 7.
The ZCore search algorithm correlates experimental MS/MS spectra through comparisons to theoretical, in silico, peptide candidates derived from protein databases, even when sample sizes are limited and the signal-to-noise ratio of the spectra is low. ZCore evaluates the quality of the fragmentation spectrum and scores the spectra.
You can extract specific information from your results through the interactive data summary screens. With a click you can examine a fully annotated MS/MS spectrum or view the percent peptide coverage of an identified protein.
ZCore provides excellent search results on data acquired with Thermo Scientific ion trap mass spectrometers. Default search parameters are set in parts per million (ppm). Using accurate mass windows decreases the search time and increases the accuracy of the result, decreasing the false positive rate.
Proteome Discoverer User Guide Thermo Scientific

1 Getting to Know Proteome DiscovererSearch Algorithms Overview
T
To distinguish a correct peptide match from an incorrect peptide match, the ZCore algorithm uses two calculations, a probability-based scoring of the fragment ion distribution and the total fraction of covered fragment ion intensity. The score is reported as a probability (using a -log10 value system) as well as an expectation value.
SEQUEST Search Algorithm
SEQUEST is specifically developed and optimized to evaluate both high-mass accuracy and low-mass accuracy ETD, ECD, and CID data. You can use SEQUEST in combination with automated LC/MS/MS and intelligent data acquisition tools to ensure the routine identification of low-abundance proteins in complex mixtures.
Proteome Discoverer extracts relevant MS/MS spectra from the .raw file and determines the precursor charge state and the quality of the fragmentation spectrum.
The SEQUEST search algorithm correlates experimental MS/MS spectra through comparisons to theoretical, in silico, peptide candidates derived from protein databases. The proprietary cross-correlation identification algorithm at the core of SEQUEST uses a sophisticated scoring system to help assess results. SEQUEST looks for characteristic spectral patterns and then critically evaluates the equivalence of experimental and theoretical MS/MS spectra. The identification algorithm extracts information and correctly identifies proteins even when protein samples sizes are limited and the signal-to-noise ratio of spectra is low.
You can extract specific information from your results through the interactive data summary screens. With a click you can examine a fully annotated MS/MS spectrum, or view the percent peptide coverage of an identified protein.
SEQUEST provides excellent search results on data acquired with Thermo Scientific ion trap mass spectrometers. Default search parameters are set in parts per million (ppm). Using accurate mass windows decreases the search time, increases the accuracy of the result, and decreases the false positive rate.
The Proteome Discoverer probability-based scoring system rates the relevance of the best matches found by the SEQUEST algorithm. With this probability-based scoring, Proteome Discoverer can independently rank the peptides and proteins, and increase the confidence in protein identification. Additionally, this scoring system minimizes the time needed for data interrogation or results review, increasing the overall throughput of the analysis.
You can also determine false discovery rates using reverse databases. Comparison of the results with forward and reversed databases provides an additional means of increasing confidence in protein identification.
hermo Scientific Proteome Discoverer User Guide 17

1 Getting to Know Proteome DiscovererRaw Data, Results, Reports, and Analysis
18
Raw Data, Results, Reports, and AnalysisProteome Discoverer has extensive options for exporting data and results into other file formats such as XML.
You can use reports to analyze and share your results. To create reports, use available file formats such as XML and Excel™. Define your report parameters through your Search Results view.
Databases and Sample Files
Proteome Discoverer includes the FASTA database (see page 62) and example .raw files. Use these files when exploring and learning how to use Proteome Discoverer.
The FASTA databases, supplied with the Proteome Discoverer program, are located in the Xcalibur database folder.
Proteome Discoverer Input and Output File Types
Proteome Discoverer accepts and creates the file types listed in Table 8.
Note If you have Bioworks installed, you can select the option to download the FASTA files.
Table 8. File types
File extension File name definition Description File type
.dta Mass spectral files produced during SEQUEST or ZCore analysis
Contains MSn data for single or grouped scans.
Output
.raw Raw data Raw data collected from an instrument.
Input
.msf Mass spectrum search files Contains relevant information from three separate sources (DTA file data, OUT file data, and setup information) - created by Proteome Discoverer.
Input and output
.out Internal data files Temporary output data file. Output and input
.srf Unified search files Contains relevant information from three separate sources - not used by Proteome Discoverer.
Input only
Proteome Discoverer User Guide Thermo Scientific

1 Getting to Know Proteome DiscovererProteome Discoverer Workflow
T
Proteome Discoverer WorkflowIn the Node Selection pane are five categories of different workflow choices. A typical workflow uses two or more options from these categories shown in Table 9. To start a new workflow, use a node from the Data Input category. See “Discoverer Workflow Nodes Details” on page 57 for detailed descriptions.
Table 9. Workflow nodes (Sheet 1 of 2)
Workflow category Workflow node Notes
Data Input:
Rawfile Selector
Spectrum Selector
SRF File Selector .srf files are for input only.
Spectrum Processing:
ETD Spectrum Charger
Noise Peak Filter
Non-Fragment Filter Removes peaks from an MS/MS spectrum that are not likely to be fragment peaks. Restricted to precursor ion peaks present in ETD and ECD spectra.
Spectrum Grouper Use group spectra from MS2 and MS3 scans together. Set Allow MS Order Mismatch to true; the default is false.
Spectrum Normalizer
Xtract Xtract only works with high-resolution data.
Spectrum Filters:
Scan Event Filter
Spectrum Properties Filter
Spectrum Score Filter
Peptide/Protein ID:
Mascot
SEQUEST
hermo Scientific Proteome Discoverer User Guide 19

1 Getting to Know Proteome DiscovererQuantitation Overview
20
For more information, see “Using the Proteome Discoverer Workflow Editor” on page 49.
Quantitation OverviewThe quantitation section discusses iTRAQ and isobaric tandem mass tag (TMT) quantitation methods. The menu command, Quantitation > Edit Quantitation Method, is reserved only for reports analyzed by a Workflow Editor template that uses the Reporter Ions Quantitizer node.
See “How to Quantify Your Data Using Adminstration and Workflow” on page 67.
About iTRAQ Quantitation
iTRAQ™ is a protein quantitation technique that uses four or eight isobaric aminespecific tags. In single MS mode the differentially labeled versions of a peptide are indistinguishable. In tandem MS mode, where peptides are isolated and fragmented, each tag generates a unique reporter ion. You can derive protein quantitation by comparing the intensities of the four reporter ions in the MS/MS spectra.
Peptide Ratio Calculation
Protein ratios are the median of the peptides of the protein. If you want to recalculate, you must clear the Show Top Match Peptides only option so that all peptides are displayed. By default only unique peptides are considered in the calculation so that only peptides that have no other protein references are considered.
The menu command, Quantitation > Show Peptide Ratios, is reserved only for reports analyzed by a Workflow Editor template with the Reporter Ions Quantitizer node,
(see Figure 7).
ZCore ZCore can only process ETD spectra.
Quantitation:
Reporter Ions Quantitizer
Data Export:
Spectrum Exporter
Table 9. Workflow nodes (Sheet 2 of 2)
Workflow category Workflow node Notes
CAUTION To access the quantitation menu option, you must first run a workflow template that uses the Reporter Ions Quantitizer node
Proteome Discoverer User Guide Thermo Scientific

1 Getting to Know Proteome DiscovererQuantitation Overview
T
Show Reporter Intensities
Protein ratios are the median of the peptides of the protein. If you want to recalculate, you must clear the Show Top Match Peptides only option so that all peptides are displayed. By default only unique peptides are considered in the calculation so that only peptides that have no other protein references are considered.
The menu command, Quantitation > Show Reporter Intensities, is reserved only for reports analyzed by a Workflow Editor template with the Reporter Ions Quantitizer node,
(see Figure 7).
Quantitation Spectrum
The menu command, Quantitation > Show Quantitation Spectrum, is reserved only for reports analyzed by a Workflow Editor template with the Reporter Ions Quantitizer node,
(see Figure 7).
hermo Scientific Proteome Discoverer User Guide 21

1 Getting to Know Proteome DiscovererQual Browser Overview
22
Figure 7. Example of Workflow Editor for reporter ions experiment and quantitation options post search
Qual Browser OverviewWith Qual Browser you can view the entire ion chromatogram and browse individual precursor and MSn data. You can filter the results in a variety of ways, for example, to produce a selected ion chromatogram. When you choose the Tools > Qual Browser command, Proteome Discoverer passes the currently active raw file for Qual Browser operations. See “Using Qual Browser” on page 72 for more information.
Proteome Discoverer User Guide Thermo Scientific

1 Getting to Know Proteome DiscovererInforSense Protein Annotation Discussion
T
InforSense Protein Annotation DiscussionInforSense Protein Annotation is part of the Proteome Discoverer toolset, which automatically determines the biological context of identified peptides.
Annotations are automatically retreived from a public database, such as the National Center for Biotechnology Information (NCBI) (www.ncbi.nlm.nih.gov/sites/entrez) or the Swiss Institute of Bioinformatics ExPASy proteomics server (www.expasy.com), for each protein identification in the results table. Use InforSense Protein Annotation to obtain predicted and known post-translational modifications, amino acid sequences, and biological functions.
See Figure 8, Predefined Thermo Scientific InforSense workflows types, for the different predefined protein identfication workflows.
InforSense Workflow Types
Currently two types of information retrieval are available:
• Gene ontology (GO) annotations for your search results
• Metadata for your search results
Each of these has two different options, resulting in four predefined workflows for you to use on your protein MSn data.
Figure 8. Predefined Thermo Scientific InforSense workflows types
Note When you are in InforSense Protein Annotation application, Proteome Discoverer exports your data into formatted XML files.
hermo Scientific Proteome Discoverer User Guide 23

1 Getting to Know Proteome DiscovererInforSense Protein Annotation Discussion
24
Introduction to GO Ontology
The Gene Ontology (GO) project is a collaborative effort, incorporating community input from database and genome annotation groups to address the need for consistent descriptions of gene products in different databases. The GO project has developed three structured, controlled vocabularies (ontologies) that describe gene products in a species-independent manner.
biological processes
cellular components
molecular functions
Each gene ontology is divided into categories and subcategories called GO terms, which define the protein in more specific terms. For example, chloroplast, a term in the cellular component ontology, is subdivided as follows:
chloroplast [p] chloroplast envelope
[p] chloroplast membrane
[i] chloroplast inner membrane
[i] chloroplast outer membrane
You can obtain more information at the GO Ontology site: www.geneontology.org/.
Introduction to Metadata Retrieval
Two Metadata workflows are available through Proteome Discoverer: Metadata Table NCBI (NCBI Web service) and Metadata Table SwissProt (ExPASy Web server). As noted earlier, each takes an XML output from Proteome Discoverer, extracts the protein accession numbers (translates them if necessary), and submits the corresponding accession numbers to the appropriate Web service. The workflow retrieves descriptive data for each accession submitted and then parses the data into different categories, including the sequence positions for known and potential post-translational modifications and metal binding sites.
Proteome Discoverer User Guide Thermo Scientific

2
Using Proteome Discoverer
Proteome Discoverer offers a variety of tools and features to assist you with spectrum analysis. This chapter discusses options that are most often used in Proteome Discoverer and describes methods of analysis.
The quickest way to get started with Proteome Discoverer is to define your search parameters by using the search wizards.
Contents
• How Proteome Discoverer Fits Into Your Lab Workflow
• Overview of Menu Options
• Working with Search Wizards
• Search Results, Reports, and Analysis
• Using the Proteome Discoverer Workflow Editor
• Working with Reports
• Working with the Search Job Queue
• Using FASTA Database Utilities
• Working with Chemical Modifications
• How to Quantify Your Data Using Adminstration and Workflow
• Using Qual Browser
• Job Queue
• InforSense
Thermo Scientific Proteome Discoverer User Guide 25

2 Using Proteome DiscovererHow Proteome Discoverer Fits Into Your Lab Workflow
26
How Proteome Discoverer Fits Into Your Lab WorkflowFigure 9 depicts a typical protein identification and characterization experimental workflow. Discoverer analyzes spectral data from all Thermo Scientific mass spectrometers.
Figure 9. Flow chart of typical protein identification
Features of Proteome Discoverer used in protein identification and analysis:
• Open .msf files: Multiple open options to evaluate your results.
• Job queue: Used to observe the spectrum search process.
• Workflow Editor: Used in an interactive way to build your search algorithm.
• Chemical modifications: Used to build and maintain the static and dynamic modifications data.
• Ability to quantify and annotate your results.
Protein mixture Peptide mixture Ionized peptide mixture
Desktop publishing Proteome Discovererprotein identification and analysis
Mass spectrum
Yourproteome analysis report
Proteome Discoverer User Guide Thermo Scientific

2 Using Proteome DiscovererOverview of Menu Options
Overview of Menu OptionsProteome Discoverer features a diverse and multi-level user interface. You can choose your user paths, such as opening a report by choosing the menu command, File > Open Report (CTRL+O), or clicking the open reports icon ( ).
This section discusses both the options to graphically display spectra, tables lists, and also procedural methods to access the user interface features when working with raw data, results, reports, and analysis of reports.
The next sections describe the following:
• File Menu
• Working with Search Wizards
• Search Results, Reports, and Analysis
Start Proteome Discoverer
To open Proteome Discoverer
To open Proteome Discoverer from your desktop, choose Start > Programs > Thermo Proteome Discoverer > Proteome Discoverer 1.0.
Proteome Discoverer displays an empty startup window. From this window you can open search results, administer your session, or start a search.
File Menu
The File menu opens saved reports, saves and closes open reports, and imports search results in .srf format. Figure 10 shows details of these options.
Figure 10. File menu options
To open one or more reports
1. Choose File > Open Report.
2. Select a single file of interest or multiple files, using the CTRL key.
Thermo Scientific Proteome Discoverer User Guide 27

2 Using Proteome DiscovererOverview of Menu Options
28
Figure 11. Proteome Discoverer initial view
To exit and close all views and reports
1. Choose File > Save Report to save your changes.
2. Choose Workflow > Save as Template to save your workflow editor.
3. Click the data file Filters tab. Click to save your filter settings.
4. In the Proteome Discoverer window, choose File > Exit.
To change view size
You can turn on the feature to show large images on the tool bar.
1. Right-click anywhere on the tool bar. A shortcut menu appears.
2. Choose Customize…
3. Click the Options tab.
4. Select the desired check boxes.
5. Click OK.
Proteome Discoverer User Guide Thermo Scientific

2 Using Proteome DiscovererWorking with Search Wizards
T
To turn on the animation option
You can turn on the feature to show large images on the tool bar.
1. Right-click anywhere on the tool bar. A shortcut menu appears.
2. Choose Customize…
3. Click the Options tab.
4. Under Menu Animations, select the desired option.
5. Click OK.
Working with Search WizardsYou can access three wizard options from the processing menu: SEQUEST, Mascot, and ZCore. Figure 12 shows details of these options.
Figure 12. Three wizard options from the processing menu
Use the Proteome Discoverer search wizards to set the search parameters, select a database and a search engine, and select the chemical modifications to be used to conduct your search. When using the search wizards, you must define four key settings:
• A .raw file
• An activation type
• A FASTA file
• A unique name for your search results
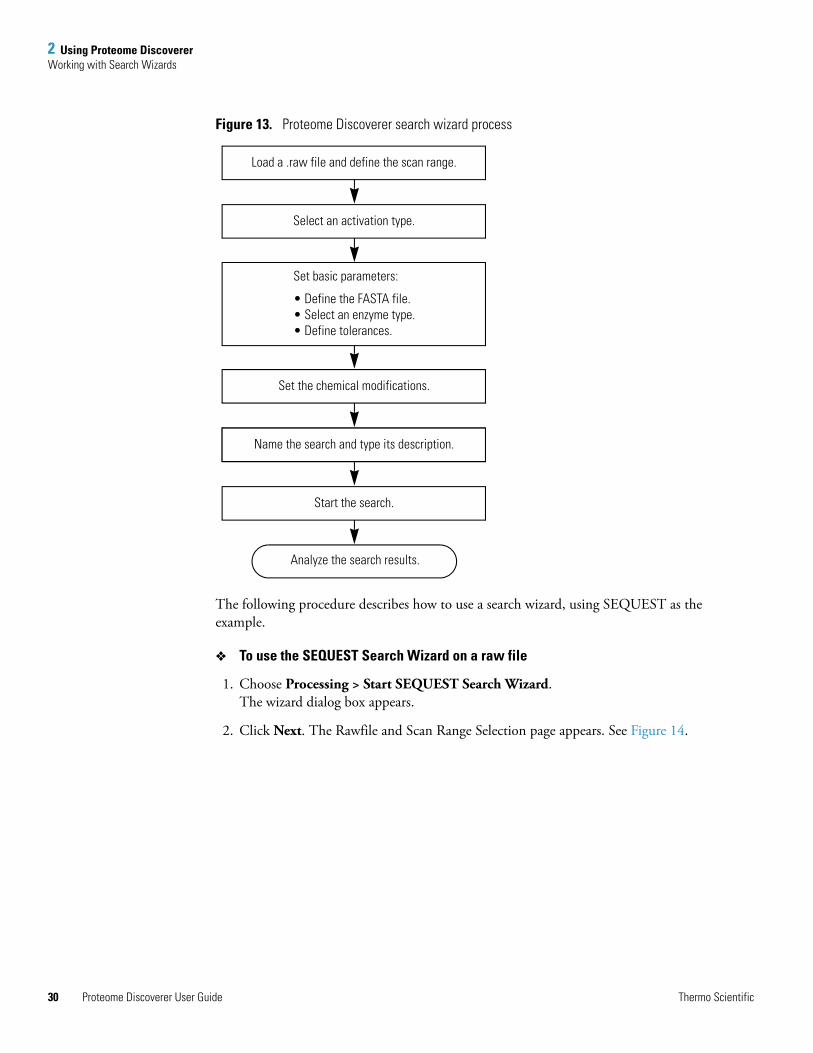
You can also set dynamic and static chemical modifications. Figure 13 defines the logical flow of the search engine wizard.
hermo Scientific Proteome Discoverer User Guide 29
2 Using Proteome DiscovererWorking with Search Wizards
30
Figure 13. Proteome Discoverer search wizard process
The following procedure describes how to use a search wizard, using SEQUEST as the example.
To use the SEQUEST Search Wizard on a raw file
1. Choose Processing > Start SEQUEST Search Wizard. The wizard dialog box appears.
2. Click Next. The Rawfile and Scan Range Selection page appears. See Figure 14.
Load a .raw file and define the scan range.
Select an activation type.
Set the chemical modifications.
Name the search and type its description.
Start the search.
Analyze the search results.
Name the search and type its description.
Set basic parameters:
• Define the FASTA file. • Select an enzyme type.• Define tolerances.
Name the search and type its description.
Proteome Discoverer User Guide Thermo Scientific
2 Using Proteome DiscovererWorking with Search Wizards
T
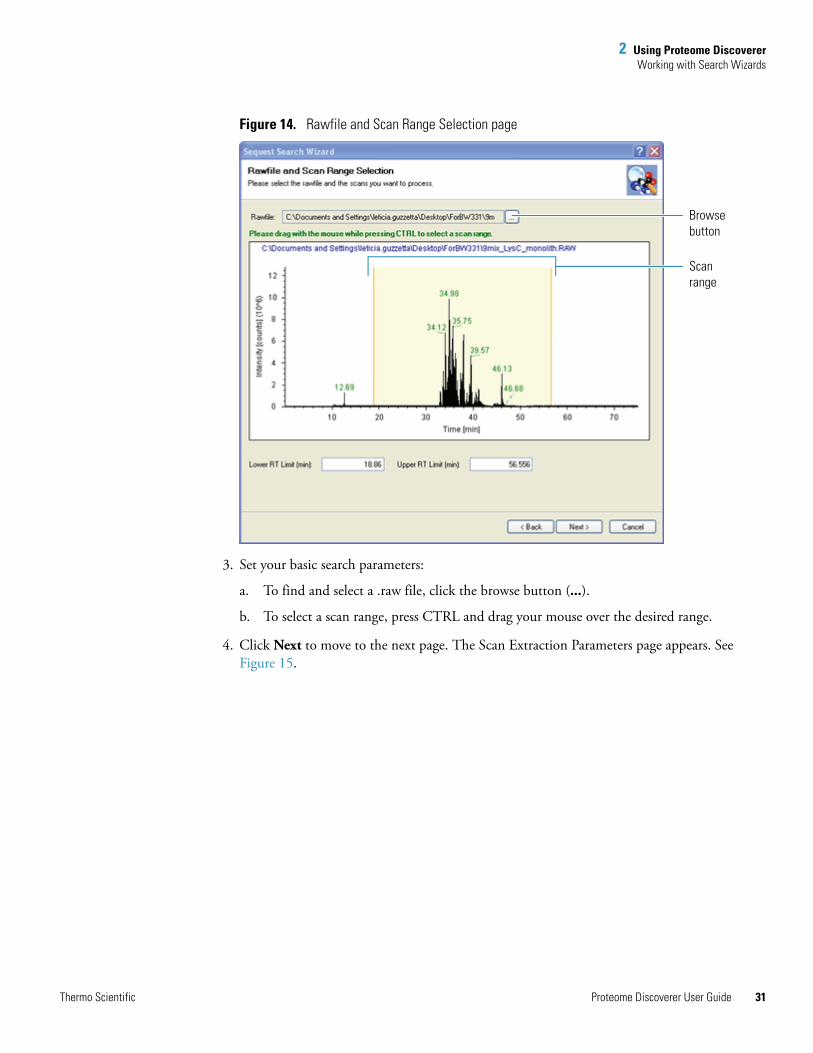
Figure 14. Rawfile and Scan Range Selection page
3. Set your basic search parameters:
a. To find and select a .raw file, click the browse button (...).
b. To select a scan range, press CTRL and drag your mouse over the desired range.
4. Click Next to move to the next page. The Scan Extraction Parameters page appears. See Figure 15.
Browse button
Scan range
hermo Scientific Proteome Discoverer User Guide 31

2 Using Proteome DiscovererWorking with Search Wizards
32
Figure 15. Scan Extraction Parameters page
5. Set the scan extraction parameters:
a. Enter the first and last mass limits.
b. Set the mass units.
c. Select an activation type.
d. Type a value for the intensity threshold.
e. Type a value for the minimum count.
f. Type a value for the signal-to-noise threshold setting.
g. (Optional) Determine your grouping parameters (seeTable 10).
Group spectra
Set activation type Define thresholds
Proteome Discoverer User Guide Thermo Scientific

2 Using Proteome DiscovererWorking with Search Wizards
T
Table 10. Four parameters that define the grouping criteria
Search summary parameter Corresponding Search Wizard parameter Description
Allow Mass Analyzer Mismatch
Not available in the wizards. (Only for scans with the same precursor mass)When set to True, the fragment spectrum is sorted into the same group regardless of mass analyzer and activation type. Example: Both ITMS and FT-MS MS/MS scan are sorted into the same group as long as they have the same precursor mass. When set to ‘False’ the same two scans are added to separate groups.
Maximum Retention Time Difference
Max RT Difference Sets the chromatographic window for the ions which are considered to be the same species, thereby adding to the same group. For example m/z 619 that elutes at 37.76 minutes is different from m/z 619 that elutes at 47.10 minutes
hermo Scientific Proteome Discoverer User Guide 33

2 Using Proteome DiscovererWorking with Search Wizards
34
6. Click Next. The SEQUEST Search parameters page appears.
Precursor Mass Criterion Precursor Mass Criterion • Same Measured Mass-to-Charge: For the chromatographic peak at 37.76 minutes, only MS/MS fragment spectra that have m/z 619 as the precursor mass are grouped (similar for m/z 1236).
• Same Singly Charged Mass: For the chromatographic peak at 37.76 minutes, MS/MS fragment spectra that have 619 or 1236 are grouped because both ions have the same singly charged mass. The charge associated with the combined peak list is the highest charge of the precursors in the group.
Precursor Mass Tolerance Precursor Mass Tolerance Sets the mass window where precursor ions are considered to be the same species, thereby adding to the same group.
Table 10. Four parameters that define the grouping criteria
Search summary parameter Corresponding Search Wizard parameter Description
Proteome Discoverer User Guide Thermo Scientific
2 Using Proteome DiscovererWorking with Search Wizards
T
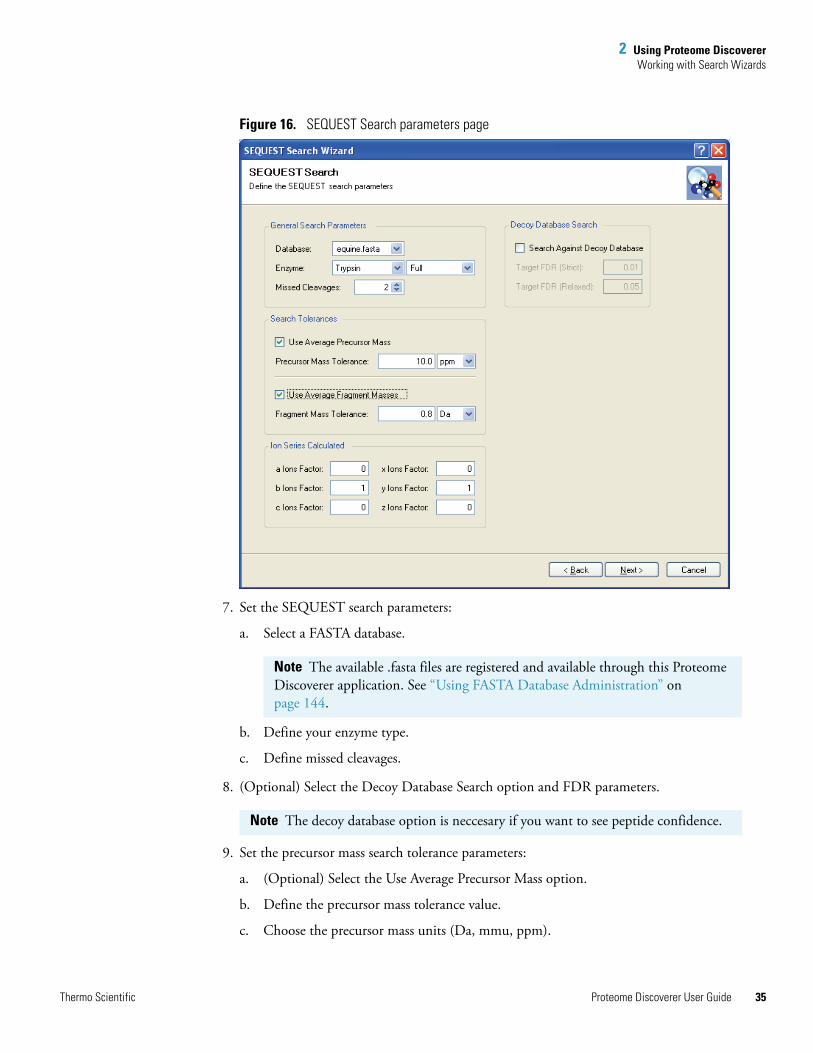
Figure 16. SEQUEST Search parameters page
7. Set the SEQUEST search parameters:
a. Select a FASTA database.
b. Define your enzyme type.
c. Define missed cleavages.
8. (Optional) Select the Decoy Database Search option and FDR parameters.
9. Set the precursor mass search tolerance parameters:
a. (Optional) Select the Use Average Precursor Mass option.
b. Define the precursor mass tolerance value.
c. Choose the precursor mass units (Da, mmu, ppm).
Note The available .fasta files are registered and available through this Proteome Discoverer application. See “Using FASTA Database Administration” on page 144.
Note The decoy database option is neccesary if you want to see peptide confidence.
hermo Scientific Proteome Discoverer User Guide 35

2 Using Proteome DiscovererSearch Results, Reports, and Analysis
36
10. Set the Ions Series, Calculated parameters as necessary for your experiment type.
11. Click Next. The Modifications page appears.
12. Analyze your search results:
a. On the Job Queue page, click Open Report and select your report. Or choose File > Open Report to display your search results.
b. Filter and sort your results. See “Working with Filters” on page 84.
c. Use different views to aid in your analysis. See “Working with the Initial Results Report” on page 78.
Search Results, Reports, and Analysis
You can access search report options from the Search Report menu. Figure 17 shows details of these options.
• Understanding Reports and Views
• Search Summary Page
• Protein Grid
• Peptide Grid
• Search Input Page
• Filters Page
• Peptide Confidence Page
Proteome Discoverer User Guide Thermo Scientific

2 Using Proteome DiscovererSearch Results, Reports, and Analysis
T
Figure 17. Search Report menu options
Understanding Reports and Views
When you open a report, the Proteome Discoverer window displays your search results across multiple pages of descriptive information. Labeled tabs include Proteins, Peptides, Filters, Peptide Confidence, and a summary of the search parameters.
• Click a tab to access the corresponding page.
In the results report, you can navigate to other pages to access detailed information on proteins or peptides. You can also set different types of filtering to sort through your search results.
• Click a row or a cell to access graphical views of the corresponding protein or peptide.
• Click a protein row to access a chromatogram view of the protein or the protein coverage.
Display pop-up of fragment ion detail.
Distribution plot of peptide data
Gives all proteins identified that contain the selected peptide.
Gives pop-up of indicated content.
Export user-defined mass exclusion list.
Export selected MSn spectral.
Export selected ProtXML data.
Gives pop-up for peptide data comparison.
hermo Scientific Proteome Discoverer User Guide 37

2 Using Proteome DiscovererSearch Results, Reports, and Analysis
38
Figure 18. An example of the Results Report
Search Summary Page
The Search Summary page is part of the results report. It provides a text version of the parameters that were set to perform a search. The summary page is divided into three categories that contain information about the .raw file, basic spectrum parameters, and search application-specific parameters. The categories represent the nodes used during the various search phases.
• The RawfileSelector section provides the name of the .raw file and the location of the .raw file used to conduct the analysis.
• The SpectrumSelector section contains the basic spectrum parameters. You defined each of these parameters in the Spectrum Extraction phase of the wizard when you prepared your search settings. The SpectrumSelector section contains the parameters used to select and to retrieve information for additional processing.
• The SpectrumGrouping section contains the parameters that are used to group and average the spectrum information.
IMPORTANT You defined each of these parameters in the Spectrum Extraction phase of the wizard when you were preparing your analysis setting. This section is only available if you select the Group spectra option in the wizard.
Proteome Discoverer User Guide Thermo Scientific

2 Using Proteome DiscovererSearch Results, Reports, and Analysis
T
Protein Grid
The Proteins page displays the proteins and the associated peptides identified during the search results. The Proteins page gives you detailed tabular information, a shortcut menu, and access to the peptide information. Table 11 on page 41 contains descriptions of the available columns in the protein table. To add columns to or remove columns from the table, use the shortcut menu. See “To view the protein grid” on page page 60.
The Proteins page is structured with different levels of access to the protein and peptide results:
• The blue-colored backgound shows rows of identified proteins with the associated statistics.
• The orange-colored background is a second-level table of peptides. Click + to open a protein row to see identified peptides in orange rows.
− The columns in this second-level grid show detailed statistics for the peptide associated with the theoretical top-level protein.
− Each row has a colored dot indicating a confidence level associated with the protein sequence at the top level; green for high confidence, yellow for modest confidence, and red for low confidence.
For a visual explanation of the Protein page, see Figures 19 and 20. For descriptions of the protein results, see Table 11 on page 41.
hermo Scientific Proteome Discoverer User Guide 39

2 Using Proteome DiscovererSearch Results, Reports, and Analysis
40
Figure 19. Protein view
Figure 20. Protein coverage diagram
Double-click any cell to see coverage diagram.
Click + to open the protein row.
Right-click for options.
Double-click a protein cell.
Resulting coverage diagram
Proteome Discoverer User Guide Thermo Scientific

2 Using Proteome DiscovererSearch Results, Reports, and Analysis
T
Creating a Report from Multiple Results
Use Proteome Discoverer to combine the results of multiple individual searches into one multiconsensus report. The combined report compiles information on the peptides and proteins identified in individual searches with the percent coverage combined into a unified results table, a multiconsensus report.
To combine results into a report
1. From the Proteome Discoverer menu bar, choose File > Open Report. A Browse view appears.
2. Browse for the .msf files to upload. The files must all be in the same directory.
3. Hold down the CTRL key and select the files you need to analyze.
4. Click OK. A status message appears as the information is organized to display a combined report. The combined, multiconsensus report appears.
Figure 21. Multi Consensus opening message
The combined results from the individual result files are numbered with alphanumeric labels. The columns and labels are defined as follows:
• A number following a letter, such as A3. The number identifies which search node in the workflow was used to create the result file.
Table 11. Protein table
Feature Description
Accession # Displays the unique identifier used for the protein. Appears in table by default.
Coverage Displays the percent coverage of the protein sequence covered by identified peptides. Appears in table by default.
# Peptides Displays the total number of peptide matches found during the search. Appears in table by default.
#AAs Shows the sequence length of the protein. Appears in table by default.
Score Displays the total score of the protein. The score is the sum of the scores of the individual peptides.
Description Provides the name of the protein excluding the Accession #. Appears in table by default.
hermo Scientific Proteome Discoverer User Guide 41

2 Using Proteome DiscovererSearch Results, Reports, and Analysis
42
• The column headers use labels to designate individual search results.
• Each of the column headers have tooltips that can help to match a search to the correct result column.
On the Proteins page, the individual search identification information, such as protein score, sequence coverage, and number of identified peptides, is displayed side-by-side for each protein (Figure 22). The proteins identified in the individual searches are compared by sequence to align with the results in the report. If the proteins referenced in the individual searches have different accession numbers, the accession number of the first search in the result set is chosen for display.
Figure 22. Multiconsensus report example
On the Peptides page, the results shown depend on the settings chosen through the shortcut menu of the results grid. The default setting shows the top hits per peptide and search engine (Figure 22). For the compiled report, the results are in titled and separate columns for the different searches.
Peptide results fromfirst search report
Peptide results fromsecond search report
Side-by-side results
Proteome Discoverer User Guide Thermo Scientific

2 Using Proteome DiscovererSearch Results, Reports, and Analysis
T
If the display options are set to show the peptide matches grouped by peptide sequence, then the identification information from the individual searches is displayed side-by-side, as shown in Figure 22. The grouped peptides do not represent actual matches found during the search but represent the unified information from all matches found for this particular peptide sequence. The peptide information can be accessed by examining the Proteins page for all peptides associated with a protein, and through the Peptides page for all peptides including those not associated with any protein.
As part of the Protein page, you can view the associated peptides. Click + to the right of the protein row to access the peptide rows. When a peptide is identified multiple times, only the top-match peptides are displayed in the table. Right-click to access the shortcut menu, and choose Show Top Match Peptides Only to display all the peptides. Table 12 describes the features of the peptide row.
Peptide Grid
The Peptides page displays the peptides and associated proteins that are identified during your search. The initial view is the list of peptides. Click + to the left of a peptide row to access the associated proteins. See “To view the peptide grid” on page 60.
Figure 23. Peptides view
hermo Scientific Proteome Discoverer User Guide 43

2 Using Proteome DiscovererSearch Results, Reports, and Analysis
44
Table 12 describes the features of a peptide row.
Table 12. Peptide row (Sheet 1 of 2)
Feature Description
Sequence Displays the peptide sequence.
# Proteins Number of proteins.
# Protein Groups How many protein groups.
Activation Type Displays the activation type of the spectrum where the peptide was identified.
Modifications Displays the static and dynamic modifications identified in the peptide.
Probability Displays the probability score for the peptide.
Score Displays the score that the search algorithm calculated for the match.
XCorr XCorr scores count the number of fragment ions that are common between X and Y and calculate the cross-correlation score for all candidate peptides queried from the database.
Quan Info (Optional) Marking if quantitative analysis is available
115/114 (Optional) Related to Quan Info
116/114 (Optional) Related to Quan Info
117/114 (Optional) Related to Quan Info
Rank Displays the rank ordering of the peptide.
Charge Displays the charge state of the peptide.
MH+(Da) Displays the weight differential of the peptides in Daltons.
ΔM (ppm) Displays the difference between the theoretical mass of the peptide and the experimental mass of the precursor ion.
First Scan Displays the first scan number where the peptide was initially identified.
Last Scan Displays the last scan number in which this peptide match was identified.
RT (minutes) Displays the retention time where the peptide was observed.
Proteome Discoverer User Guide Thermo Scientific

2 Using Proteome DiscovererSearch Results, Reports, and Analysis
T
As part of the Peptides page, you can view the associated proteins. Click + to the left of the peptide row to access the protein rows. Right-click to access the shortcut menu, and choose Show Top Match Peptides Only to display all the peptides.
For a visual explanation of the Peptide page see Figure 23. For descriptions of the protein results, see Table 12 on page 44.
MSOrder Indicates the order of the MS spectrum:
• 1 is a one MS scan • 2 is an MS/MS scan (MS2)• 3 is MS3
The number of stages minus one of precursor ion m/z selection, followed by product ion detection such that MS2 means one stage of precursor ion m/z selection is then followed by product ion detection
m/z Mass-to-charge ratio
Intensity Relative intensity
Ions Matched Displays the number of ions found compared to the theoretical number of ions.
Annotation Provides a location for you to insert and store notes about the search results, your analysis, and quality results.
Shortcut Menu In the header, right-click to access the shortcut menu:
• Show Top Match Peptides Only• Show Peptide Groups• Show Filtered Out Rows• Enable Protein Grouping• Mass Tolerance Unit• Row Numbers Style• Copy, Ctrl+C
Copies the selected rows to the Clipboard. You can then paste the rows in a spreadsheet application such as Microsoft Excel.
• Copy With Column Headers• Export to Excel Workbook.• Enable Row Filters• Show ‘Group By Column’ Panel
Table 12. Peptide row (Sheet 2 of 2)
Feature Description
hermo Scientific Proteome Discoverer User Guide 45

2 Using Proteome DiscovererSearch Results, Reports, and Analysis
46
Peptide Confidence Page
Use the Peptide Confidence page to set the confidence levels for database searches (see “False Discovery Rates and Peptide Confidence Indicators” on page 97). In Proteome Discoverer, the filter settings are used to distribute the confidence indicators for the peptide matches (these are the green, yellow, and red dots attached to each peptide match). Whenever a decoy database search is performed during the database search and filter settings have been applied to achieve the specified target FDRs, the same filters are used to distribute the confidence indicators. Peptide matches that pass the filter associated with the strict FDR are assigned a green confidence indicator, peptide matches that pass the filter associated with the relaxed FDR are assigned a yellow confidence indicator, and all other peptide matches receive a red indicator.
Related Topics
• To view the protein grid
• To view the peptide grid
• Peptide Confidence Page
Search Input Page
The Search Input page displays detailed information for the spectra (mass peak lists) that were created and processed during the search process. If you used the grouping parameters during your search wizard, the grouped spectra are listed in this report. You can also check to see how many peptides (# of identified peptides) were found and which proteins the peptide belongs to. From this report, you can also select spectra to create an Xcalibur exclusion/inclusion list.
Note You can change the default confidence levels to alternative values within the Peptide Confidence page.
Table 13. Search Input parameters (Sheet 1 of 2)
Parameters Description
ID Naming convention
# Identified Peptides Displays the total number of peptide matches found during the search. Displayed in table by default.
Precursor MH+ [Da] Displays the weight differential of the peptides in Daltons.
Precursor Charge The charge for each peptide.
First Scan Displays the first scan number where the peptide was initially identified.
Last Scan Displays the last scan number where this peptide match was identified.
Master Scan(s) Full scan in which this precursor has been selected.
Proteome Discoverer User Guide Thermo Scientific

2 Using Proteome DiscovererSearch Results, Reports, and Analysis
T
Filters Page
Use the Filters page to refine your search results and make your analysis quicker. By using filters, you can sort and filter your results by charge state, modifications, or even peptide probability. You can also create and apply more than one filter to your search results.
The protein and peptide filters have two sets of menu choices shown in Figure 24; the Filters page appears (see Figure 25).
Figure 24. Choices for protein and peptide filters
Scan(s) Displays all scan numbers where this peptide match was identified.
RT (minutes) Displays the retention time where the peptide was observed.
Activation Type Displays the activation type of the spectrum where the peptide was identified.
Mass Analyzer Displays the mass analyzer used to create the .raw file data. Proteome Discoverer recognizes the following mass analyzers:
• ITMS (Ion Trap)• FTMS (Fourier Transform)• TOFMS (Time of Flight)• SQMS (Single Quad)• TQMS (Triple Quad)• SectorMS (Sector Field)
Table 13. Search Input parameters (Sheet 2 of 2)
Parameters Description
hermo Scientific Proteome Discoverer User Guide 47

2 Using Proteome DiscovererSearch Results, Reports, and Analysis
48
Figure 25. Filters page
The different columns of the filter table provide specific information about the current status of the filter settings. See Figure 25 and Table 14.
Applies filters to search results
Saved filters list
Filter settings status Add and remove buttons
Invert the filter - good for disregarding a single property
Selected filter options and current status
Note For an inverted filter example, set the peptide confidence level to low confidence and select the inverted option so that only the modest- and high-confidence levels show in the report.
Table 14. Filter options (Sheet 1 of 2)
Option Description
Active When the check box is selected, the filter is added to the filter set. You must also use Apply Filter to apply the filter setting to your current results. When the check box is not selected, the filter is temporarily removed from the filter set. By default, a newly added filter is selected and active.
Proteome Discoverer User Guide Thermo Scientific
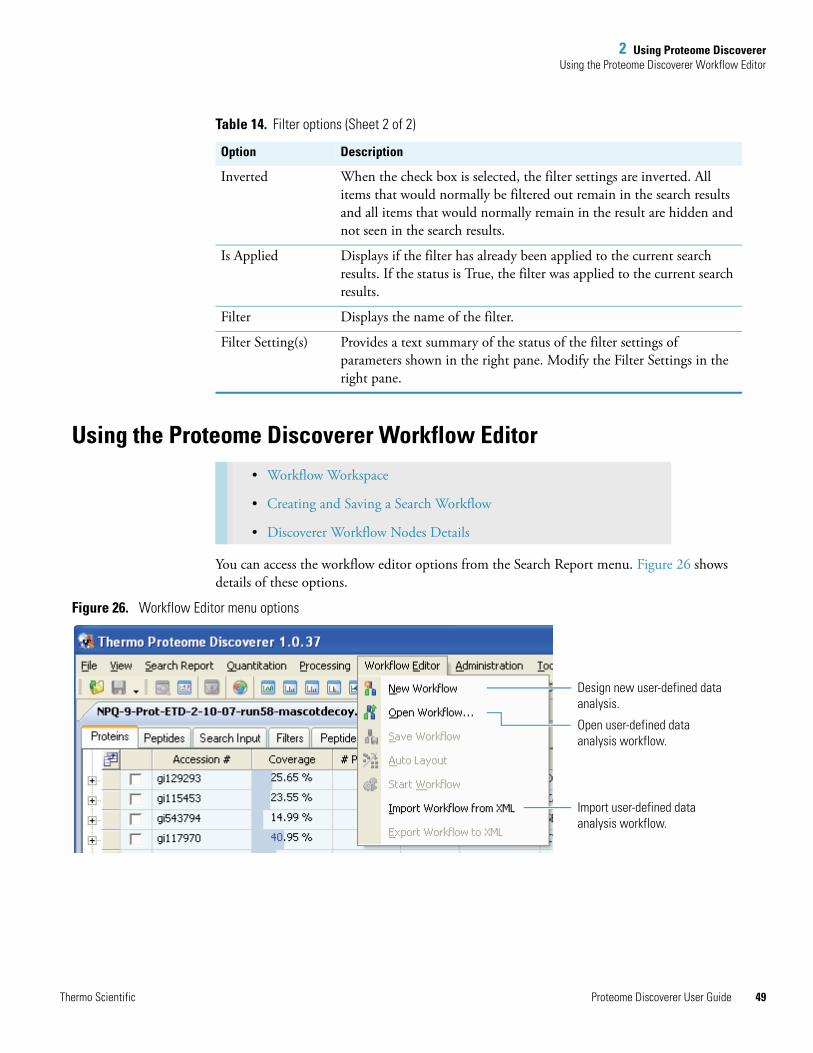
2 Using Proteome DiscovererUsing the Proteome Discoverer Workflow Editor
Using the Proteome Discoverer Workflow Editor
You can access the workflow editor options from the Search Report menu. Figure 26 shows details of these options.
Figure 26. Workflow Editor menu options
Inverted When the check box is selected, the filter settings are inverted. All items that would normally be filtered out remain in the search results and all items that would normally remain in the result are hidden and not seen in the search results.
Is Applied Displays if the filter has already been applied to the current search results. If the status is True, the filter was applied to the current search results.
Filter Displays the name of the filter.
Filter Setting(s) Provides a text summary of the status of the filter settings of parameters shown in the right pane. Modify the Filter Settings in the right pane.
Table 14. Filter options (Sheet 2 of 2)
Option Description
• Workflow Workspace
• Creating and Saving a Search Workflow
• Discoverer Workflow Nodes Details
Design new user-defined data analysis.
Open user-defined data analysis workflow.
Import user-defined data analysis workflow.
Thermo Scientific Proteome Discoverer User Guide 49

2 Using Proteome DiscovererUsing the Proteome Discoverer Workflow Editor
50
The Proteome Discoverer Workflow Editor is a flexible and complex tool to create customized data processing workflows. Instead of using the standard wizards available through the Processing menu, you can develop a workflow specific to your needs. The workflow is the layout of processing nodes, which you then submit to process your data.
You can create a reusable processing workflow template by saving your design to load and use at another time. A unique workflow gives you the ability to set parameters that are normally static settings in the wizard or to use a function that would not normally be available such as Xtract, spectrum export, or cascading searches.
WARNING Prerequisites to using the Proteome Discoverer Workflow Editor are to first learn each “workflow node” functionality. If you do not understand the function (or interconnectivity) of these nodes, you can potentially build a sequence that creates bad results and makes no analytical sense.
Proteome Discoverer User Guide Thermo Scientific

2 Using Proteome DiscovererUsing the Proteome Discoverer Workflow Editor
Workflow Workspace
The unique three-pane layout of the Proteome Discoverer Workflow Editor provides node selections, a workspace, and parameters for each node. See Figure 27. The nodes are like building blocks that you can use to create a unique search sequence. Using the nodes, you can define your own search parameter tolerances and criteria.
Figure 27. Workflow Editor workspace definitions example
Use the three-pane layout of the Proteome Discoverer Workflow Editor to do the following:
• Customize your workflow.
• Add nodes to your workflow.
• Set and define your search parameters (see Table 10).
Node selection pane Workspace pane Parameter pane
Thermo Scientific Proteome Discoverer User Guide 51

2 Using Proteome DiscovererUsing the Proteome Discoverer Workflow Editor
52
To learn the Workflow Editor nodes
1. Drag a node to the workspace.
2. Click the Workflow Node to activate its functions, displayed in the right pane.
3. In the right pane, examine the available options for that node.
4. Delete the node by selecting the node and pressing DELETE.
5. Repeat steps 1 through 4 for each node.
To create a search sequence
1. Drag the Rawfile Selector node to the workspace.
2. Depending on your data needs, drag and drop ideal nodes to the workspace.
3. Organize the nodes to reflect a procedural order from top to bottom, so that the Rawfile selector remains on top.
Joining the nodes together creates a step-wise path for Proteome Discoverer to follow as you feed data into the first node, the Rawfile Selector.
4. To join two nodes, click the node so that a blue handle is activated at the bottom-center of the node. See Figure 28.
Figure 28. Activated node example
5. Drag the blue handle down to the top-center of the node below it (see Figure 29).
Figure 29. Joining two nodes
Note The same options are available in the wizards.
IMPORTANT If the next node appears with a red edge at this point, you cannot connect to the previous node.
Blue handle
Join the top node to the bottom node.
Proteome Discoverer User Guide Thermo Scientific

2 Using Proteome DiscovererUsing the Proteome Discoverer Workflow Editor
6. Once all your chosen nodes are joined, align them. Choose Workflow Editor > Auto Layout.
7. For each node, do the following:
a. Click the node to activate it.
b. In the Show Advanced Parameters pane, review each line item for relevancy and accuracy. Choose and alter as fits the raw file base properties.
8. To save the workflow, choose Workflow Editor > Save Workflow.
Creating and Saving a Search Workflow
To create a search workflow
1. From the Proteome Discoverer toolbar, choose Workflow Editor > New Workflow. The Workflow Editor view opens.
2. Select and drag a Data Input node to the workspace, such as the one shown in Figure 30.
Figure 30. Data Input node Rawfile Selector on Workflow Editor pallette
3. Start creating your new workflow using a node from Data Input.
a. From the Data Input category, drag the Rawfile Selector or SRF File Selector node to the workspace. This is your data input file.
b. If you selected the Rawfile Selector node as your input, drag the Spectrum Selector to the workspace. Figure 31 shows the Rawfile Selector and Spectrum were selected and added to the workspace.
Note You can set the Spectrum Selector node to select which precursor mass to use for a given MSn scan, such as choosing to pick the precursor from the parent scan.
Thermo Scientific Proteome Discoverer User Guide 53

2 Using Proteome DiscovererUsing the Proteome Discoverer Workflow Editor
54
Figure 31. Adding Rawfile Selector and Spectrum Selector to a workflow
4. (Optional) Drag a node from the Spectrum Processing category to the workspace. You can use one or more nodes from the Spectrum Processing category for your workflow.
• Use the ETD Spectrum Charger node to calculate precursor ion charge states for ETD spectra, used for all low-mass accuracy ETD data.
• Use the Xtract node to deconvolve the precursors for all high-mass accuracy data regardless of the fragmentation type.
• Use the Spectrum Grouper node to apply a grouping function to the data set.
• Use the Noise Peak Filter node or the Spectrum Normalizer to define specialized filtering early in the search process.
5. (Optional) Drag a Spectrum Filters node or nodes to the workspace. See Figure 32.
Proteome Discoverer User Guide Thermo Scientific

2 Using Proteome DiscovererUsing the Proteome Discoverer Workflow Editor
Use Scan Event Filter for high-mass accuracy data such as Mascot analysis and SEQUEST analysis of mixed fragmentation mode type data (CID and ETD). It can filter on information such as fragmentation type and mass analyzer identity.
6. Drag a Peptide/Protein ID node to the workspace. Figure 32 shows that the ZCore search engine was selected.
Both Mascot and SEQUEST can search ETD and CID data, whereas ZCore can only search ETD data.
Figure 32. Setting your parameters for your workflow
Thermo Scientific Proteome Discoverer User Guide 55

2 Using Proteome DiscovererUsing the Proteome Discoverer Workflow Editor
56
7. Select a node in the workspace. The available parameters for the node appear in the Parameters pane.
• In the Parameters pane, define your parameters and input file. Complete this step for each node you selected.
8. Link the nodes to develop a workflow:
a. Select the bottom edge of a node in the center.
b. Drag your mouse to connect the two nodes. An arrow appears.
9. In the Name box, enter a unique identifier for the name of your workflow. This name is also the name of your .msf results file.
10. In the Description box, enter a description of your workflow.
11. To start your search, select Workflow Editor > Start Workflow. The Job Queue pane appears, showing the status of your search.
12. Use the Job Queue to check the status of your search. For details, see “Working with the Search Job Queue” on page 60.
To save a search workflow
1. After completing a new search workflow design, see “To create a search workflow” on page 53.
2. Click Save As Template. A dialog box appears.
3. Enter a name which describes the workflow contents.
To open a saved workflow
1. Choose Workflow > Open From Template. The Open Processing WorkFlow Templates page appears.
2. Select a workflow from the list.
3. Click Open. The Workflow Editor window opens with the selected workflow displayed.
Note To view your search results, see Chapter 3, “Interpreting Search Results.”
Proteome Discoverer User Guide Thermo Scientific

2 Using Proteome DiscovererUsing the Proteome Discoverer Workflow Editor
Figure 33. Open WorkFlow page
Discoverer Workflow Nodes Details
This section describes the six categories of workflow nodes. See “Proteome Discoverer Workflow” on page 19 for short definitions.
Figure 34. Workflow nodes
Workflow list Open button
Thermo Scientific Proteome Discoverer User Guide 57

2 Using Proteome DiscovererUsing the Proteome Discoverer Workflow Editor
58
Data Input
A logical workflow contains a sequence of processing steps. Begin with raw spectra data, and then process the data with operators that you can choose from the workflow node selection pane. You can also set the workflow to export the results into other data formats.
You can begin your search flow with two data input nodes. Use either the Rawfile Selector or the SRF File Selector to specify your data input file.
Spectrum Processing
Once you have selected your input data, you can apply several processing functions to the data. Spectrum Processing provides six nodes to define your search parameters:
• ETD Spectrum Charger
• Noise Peak Filter
• Non-Fragment Filter
• Spectrum Grouper
• Spectrum Normalizer
• Xtract
Spectrum Filters
You can filter input data prior to a database search to remove lower quality spectral peak lists from your analysis. This can decrease search times and false positive identifications. The Spectrum Filter nodes provide three types of spectrum filters to use for your search. Use these pre-analysis filters to streamline your search results.
Peptide ID and Protein ID nodes
The Proteome Discoverer Workflow Editor provides an option to use any of the three search engines with the Peptide/Protein ID nodes: Mascot, SEQUEST, or ZCore.
Quantitation
The Proteome Discoverer Workflow Editor provides an option to quantitate your spectra with the Reporter Ions Quantitizer. For instructions to create a quantitation method, see the procedure, “To apply a quantitization node to a workflow” on page 69.
Data Export
The Proteome Discoverer Workflow Editor provides an option to export your spectra with the Spectrum Exporter node.
IMPORTANT You must use Spectrum Selector with the Rawfile Selector.
Proteome Discoverer User Guide Thermo Scientific

2 Using Proteome DiscovererWorking with Reports
T
Working with Reports
To open or load a report (menu)
1. In the Discoverer window, choose File > Open Report.
2. Find the .msf file to upload and click OK. A status page appears as the information is organized to display the report.
3. (Optional) If you receive a .raw file query message, find the corresponding .raw file if it is available.
a. Click Yes to find the .raw file.
b. If it is found, click Open to accept the .raw file.
The search results are displayed in the Proteome Discoverer results window.
To open an .srf file
1. Choose File > Import Search Results from SRF. A wizard appears.
2. Follow the instructions to open the appropriate file.
To save a report
1. In the Proteome Discoverer window, click the appropriate report tab to save your modifications.
2. Choose File > Save Report. The filter settings are stored in the results file (.msf ).
To close a report without saving changes
1. In the Proteome Discoverer window, click the report tab you want to close.
2. Choose File > Close.–or–Right-click the report you want to close, and choose Close from the shortcut menu
Your changes or filter settings are not automatically saved. You must save your changes to keep them for future use.
• Checking Your Job Queue Search Status
• Deleting Items from the Queue List
hermo Scientific Proteome Discoverer User Guide 59

2 Using Proteome DiscovererWorking with the Search Job Queue
60
To view the protein grid
In an open report, click the Protein tab. The protein view of your search report appears.
To view the peptide grid
In an open report, click the Peptide tab. The peptide view of your search report appears.
Related Topics
• To open a Job Queue view
• To open the Qual Browser
Working with the Search Job QueueUse the search queue to check the status of your search or remove search results from the Job Queue list. For detailed job queue information, see page 73.
• Checking Your Job Queue Search Status
• Deleting Items from the Queue List
Checking Your Job Queue Search Status
You can check the status of your search and results, or you can review the result details from the Job Queue view.
To check the search results status from the Job Queue list
1. Choose Administration > Show Job Queue to open the Job Queue view.
Proteome Discoverer User Guide Thermo Scientific

2 Using Proteome DiscovererWorking with the Search Job Queue
Figure 35. Job queue
2. To expand and view the details of the search, click + to the left of the job.
Deleting Items from the Queue List
You can remove search results from the Job Queue list.
To delete items from the Job Queue list
1. Choose Administration > Show Job Queue to open the Job Queue view.
2. Select the box to the left of the row of the job you want to delete. The job is selected.
Click + to expand or - to collapse row details.
Thermo Scientific Proteome Discoverer User Guide 61

2 Using Proteome DiscovererUsing FASTA Database Utilities
62
3. Click Remove on the toolbar of the Job Queue view. A Delete Jobs message appears.
4. Click OK.
The selected job is removed.
Using FASTA Database Utilities
With FASTA Database Utilities you can import your FASTA database files, review the properties of your FASTA file, determine if the database is in a readable format, or modify the way in which the protein titles in the database are parsed. When you select the Tools > FASTA Database Utilities command, Proteome Discoverer displays a view to perform these actions.
The FASTA Files view displays the processed .fasta file properties, such as the file name, file size, and number of proteins stored in the table. For each protein entry, the FASTA file structure is analyzed to determine if the .fasta file meets the requirements for Proteome Discoverer to use in a spectra search. The .fasta file is quickly processed and made available for use.
Click Remove to delete a row.
Select job.
• FASTA Files
• Adding Protein References to FASTA
• Performing a Decoy Database Search
Proteome Discoverer User Guide Thermo Scientific

2 Using Proteome DiscovererUsing FASTA Database Utilities
FASTA Files
This section describes how to add a protein reference to your FASTA database file.
To find a protein reference
1. Choose Tools > FASTA Database Utilities.
2. Click Find Protein Reference. The Find Protein Reference page opens.
Figure 36. Find Protein References page in the FASTA Database Utilities window
3. To find the .fasta file of interest, click the browse button (...).
4. Type the amino acid sequence of interest for a search string.
5. Set the Boolean search operators as needed.
6. Click Start Search. Results appear if the search parameters match the data.
7. (Optional) Select a protein result row. The sequence table below shows the theoretical amino acid results for the selected protein.
Sequence table
Protein results
Boolean search operators
Thermo Scientific Proteome Discoverer User Guide 63
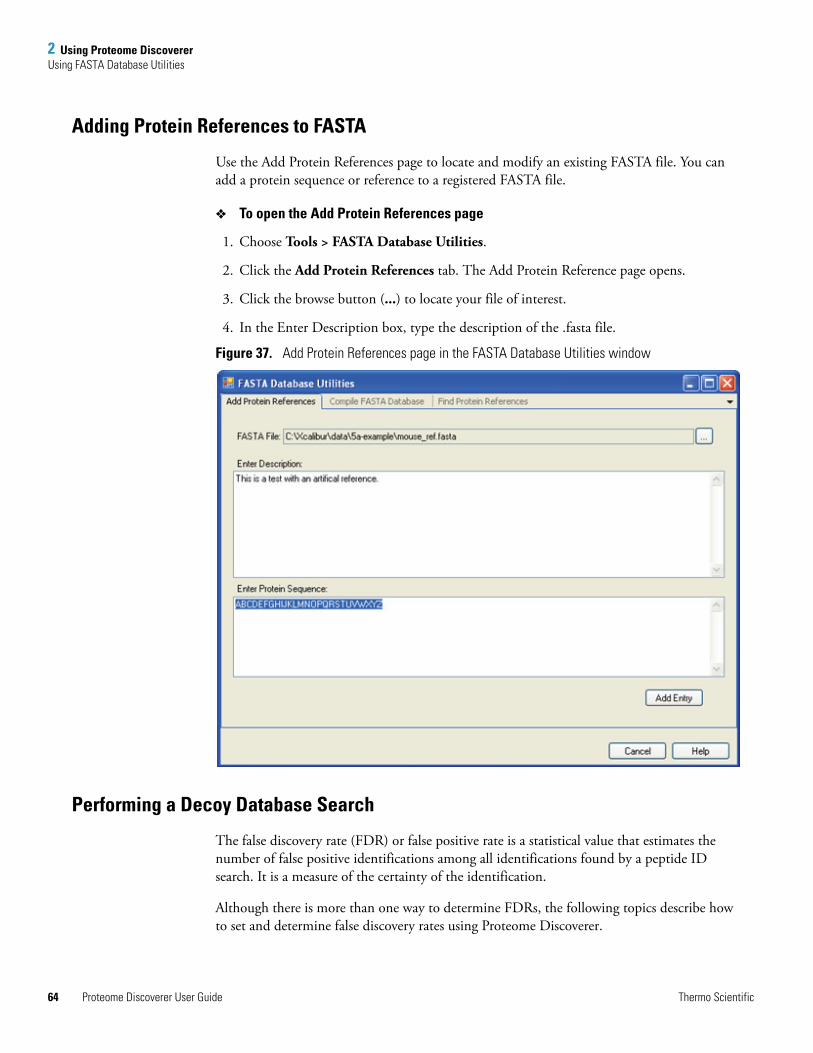
2 Using Proteome DiscovererUsing FASTA Database Utilities
64
Adding Protein References to FASTA
Use the Add Protein References page to locate and modify an existing FASTA file. You can add a protein sequence or reference to a registered FASTA file.
To open the Add Protein References page
1. Choose Tools > FASTA Database Utilities.
2. Click the Add Protein References tab. The Add Protein Reference page opens.
3. Click the browse button (...) to locate your file of interest.
4. In the Enter Description box, type the description of the .fasta file.
Figure 37. Add Protein References page in the FASTA Database Utilities window
Performing a Decoy Database Search
The false discovery rate (FDR) or false positive rate is a statistical value that estimates the number of false positive identifications among all identifications found by a peptide ID search. It is a measure of the certainty of the identification.
Although there is more than one way to determine FDRs, the following topics describe how to set and determine false discovery rates using Proteome Discoverer.
Proteome Discoverer User Guide Thermo Scientific

2 Using Proteome DiscovererUsing FASTA Database Utilities
You can use FDRs to validate MS/MS searches of large data sets, but they are not effective on searches of a small number of spectra, or searches against a small number of protein sequences, because the number of matches will likely be too small to give a statistically meaningful estimate.
The following procedure describes how to use the search wizards to perform a decoy database search to achieve FDRs.
To set a decoy database search
1. Start your search by using the search wizards. See the procedure, “To use the SEQUEST Search Wizard on a raw file” on page 30.
2. On the Search parameters page, select the Search against decoy database option. See Figure 38.
3. Set your target FDR for high and medium confidence.
4. Continue to define your remaining search criteria.
Figure 38. Decoy Database Search parameters
Thermo Scientific Proteome Discoverer User Guide 65

2 Using Proteome DiscovererWorking with Chemical Modifications
66
Working with Chemical ModificationsThe Chemical Modification view is used to build and maintain the static and dynamic modifications data that is available when you define your search settings.
To open the Chemical Modifications view
1. Choose Administration > Chemical Modifications. The Chemical Modifications view appears.
2. Explore the default types of modifications and their corresponding amino acids.
The modifications table contains the modification’s delta mass, amino acids, and substitution. By using the Chemical Modifications view, you can add amino acids to existing modifications and create new modifications.
Figure 39. Chemical Modifications Administration view
Proteome Discoverer User Guide Thermo Scientific

2 Using Proteome DiscovererHow to Quantify Your Data Using Adminstration and Workflow
How to Quantify Your Data Using Adminstration and Workflow
Proteome Discoverer includes a protein identification and quantitation package with SEQUEST and Zcore licenses. You can measure and report the relative quantitation of isotopically-labeled peptides.
Reporter Ion Based Quantitation in Proteome Discoverer
This section introduces reporter ion based quantitation (RIQ). Use the quantitation workflow and the data retrieval and storage process to quantify your results.
The following procedure discusses the reporting side, improvements in the calculation and statistics steps, and improvements for display and validation of quantitation results.
You can quantify all isobaric labeled samples. There are defaults available for iTRAQ-4plex and iTRAQ-8plex. You can also add new methods.
To select a quantitation method
1. Choose Administration > Quantitation Methods. The reporter ion based quantitation methods are available through this option.
2. To activate the methods that are available when designing a Proteome Discoverer workflow, select the respective Method Name check box. See Figure 40.
• Reporter Ion Based Quantitation in Proteome Discoverer
• Assess the Abundance of the Precursor
Thermo Scientific Proteome Discoverer User Guide 67

2 Using Proteome DiscovererHow to Quantify Your Data Using Adminstration and Workflow
68
Figure 40. Quantitation Methods view
To edit a method
1. Choose Administration > Quantitation Methods. The reporter ion based quantitation methods are available through this option.
2. Click of the a Method Name row. An arrow ( ) appears next to the selected name.
The Edit-button is now active (see Figure 41).
Figure 41. Select method to edit
Maintain and editknown quantitiation methods
Condition buttons
Proteome Discoverer User Guide Thermo Scientific

2 Using Proteome DiscovererHow to Quantify Your Data Using Adminstration and Workflow
3. Click
4. The Processing Method Editor appears.
5. Choose each of the following tabs to verify the options are set correctly for your raw data set. See Figure 42.
• Mass Tags
• Ration Calculation
• Protein Quantitation
• Experimental Bias
• Ratio Reporting
Figure 42. Quantitation Processing Method Editor tab options
To apply a quantitization node to a workflow
1. Open a workflow template. See “To create a search workflow” on page 53.
2. Choose Quantitation >Reporter Ions Quantitizer.
3. Drag the node to the workspace.
4. Connect the Rawfile Selector node to the Reporter Ions Quantitizer node.
5. Edit options for each node. See “To learn the Workflow Editor nodes” on page 52.
6. Select Workflow Editor > Save as Template.
Thermo Scientific Proteome Discoverer User Guide 69

2 Using Proteome DiscovererHow to Quantify Your Data Using Adminstration and Workflow
70
Quantitation Summary
You can display the quantitation spectrum of a selected sequence with the quantitation summary view.
To show quantitation spectrum
1. Click the Peptide tab.
2. Select a sequence of interest.
3. Choose Quantitation > Show Quantitation Summary. A Quantitation Spectrum chart appears. See Figure 43.
IMPORTANT To use the quantitation menu options, the raw data file must have been acted on by the Workflow Reporter Ion Qunatitizer node. See “Using the Proteome Discoverer Workflow Editor” on page 49.
Proteome Discoverer User Guide Thermo Scientific

2 Using Proteome DiscovererHow to Quantify Your Data Using Adminstration and Workflow
Figure 43. Quantitation summary with a chromatogram view
The chromatogram shows the retention time when the selected peptide was eluted.
A chromatogram view shows the intensities of masses as a function of time.
The quantitation spectrum of the selected peptide shows the intensities of the detected reporter ions.
Thermo Scientific Proteome Discoverer User Guide 71

2 Using Proteome DiscovererUsing Qual Browser
72
Assess the Abundance of the Precursor
By using the graphically displayed intensity of the peptide, you are able correct for noise and move the baseline noise.
• The peak start and end points as well as the baseline are in blue.
• The peak area and the height values are automatically calculated.
You can use the view to assess the chromatographic peak shape of the associated precursor, and to reference the elution time of the identified peptide. The integrated area under the curve and height of the peak is displayed and can be used to assess the abundance of the precursor.
To magnify a peak
Drag your mouse over the region of interest.
Figure 44. Extracted ion chromatograph
Using Qual BrowserQual Browser automatically displays the elemental composition, theoretical mass, RDB, and delta values for your high-resolution data.
To open the Qual Browser
1. Choose Tools > Open Qual Browser to open the Spectrum window.
2. Right-click and choose Display Options from the shortcut menu.
3. To automatically annotate your peaks, click the Composition tab and select the labels for display.
Proteome Discoverer User Guide Thermo Scientific

2 Using Proteome DiscovererJob Queue
T
Job QueueAfter you set up and start the search project, you can view a list of searches and their states in the Job Queue view. The Job Queue displays the search name, the .raw file name, the date the search was submitted, and the progress of the search and its status.
Using the Job Queue
The following procedure describes how to use the job queue options.
To open a Job Queue view
Choose Administration > Job Queue.
From the Job Queue view, you can do the following:
• Refresh the job queue status.
• Check the status of a job.
• Pause or resume a job.
• Remove or cancel a job.
• Open a report in the Server Job Queue. See “Open a Completed Report From Job Queue” on page 74.
hermo Scientific Proteome Discoverer User Guide 73
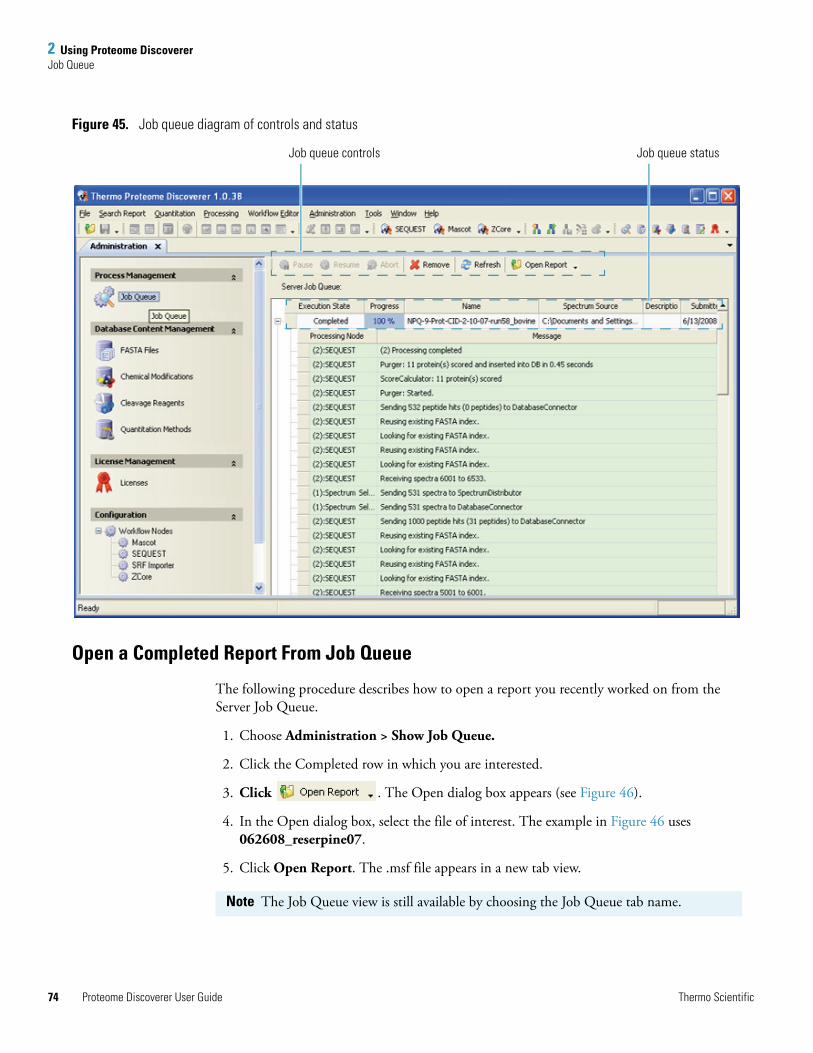
2 Using Proteome DiscovererJob Queue
74
Figure 45. Job queue diagram of controls and status
Open a Completed Report From Job Queue
The following procedure describes how to open a report you recently worked on from the Server Job Queue.
1. Choose Administration > Show Job Queue.
2. Click the Completed row in which you are interested.
3. Click . The Open dialog box appears (see Figure 46).
4. In the Open dialog box, select the file of interest. The example in Figure 46 uses 062608_reserpine07.
5. Click Open Report. The .msf file appears in a new tab view.
Job queue controls Job queue status
Note The Job Queue view is still available by choosing the Job Queue tab name.
Proteome Discoverer User Guide Thermo Scientific

2 Using Proteome DiscovererInforSense
T
Figure 46. Job Queue Open Report option
Related Topics
• To open or load a report (menu)
• To save a report
• To close a report without saving changes.
InforSenseInforSense Protein Annotation is part of the Proteome Discoverer tool set, which automatically retrieves descriptive information, allowing identified proteins to be placed in their biological context. You can use Proteome Discoverer InforSense as another way to look at your search results.
To open InforSense
1. Open an .msf file.
2. Choose Tools >InforSense. A dialog box appears.
3. Select the criteria for your annotation project run.
4. Click Invoke InforSense. The InforSense VM Console appears.
.msf file contents
hermo Scientific Proteome Discoverer User Guide 75

5. In the Workflow pane, click Workflow. The Workflow begins running (see Figure 47).
The bottom frame shows a completeness graph.
Figure 47. InforSense running outside of Proteome Discoverer
IMPORTANT InforSense Protein Annotation comes with InforSense Workflow documentation available through the Help menu.
3
Interpreting Search Results
After Proteome Discoverer completes your search, it creates an .msf file. The .msf file contains data and results from your search. Open this .msf file so that you can access and interpret the search results. You can also display multiple search results within a single report.
The single or multiple results report displays a list of matching peptides and proteins identified by the search engine you specify. From your results report you can do the following:
• Sort and filter your data.
• Match likely proteins to your analyzed data.
• Access isotope, chromatogram, and other graphical views.
• Export your results, report, and views.
• Create reports to export into another file format for peptides and proteins identification or graphical display.
s
Contents
• Working with the Initial Results Report
• Working with Filters
• False Discovery Rates
• Working with the Proteins Grid
• Working with the Peptides Grid
• Working with the Search Input
• Interpreting the Isotope Pattern View
• Interpreting the Spectrum View
• Interpreting the Extracted Ion Chromatogram
• Interpreting the Fragment Match View
• Exporting Data to Other Programs
• Working with InforSense Discussion
Thermo Scientific Proteome Discoverer User Guide 77

3 Interpreting Search ResultsWorking with the Initial Results Report
78
Working with the Initial Results ReportThe results report is the main report that is initially displayed when you upload the search results (.msf file). From this report, click a protein or peptide row to navigate to other tabular and graphical views. The views provide detailed graphical information on your selected peptides. You can display more than one view to do a comparative analysis of your selected peptide or proteins. Use the shortcut menus to alter the details in your report or to copy information. To customize your report, you can move the columns to a different location in the report. You can also do a quick sort of your columns by clicking the column header.
Initial results report procedures:
• Organizing Rows and Columns
• Saving and Applying Results Report Layout Changes
Organizing Rows and Columns
In the initial results report, you can customize your table using these features:
• Grouping peptides in the protein or peptide tables
• Sorting columns by preference
• Adding row index numbering to help you sort
Adding, Removing, and Grouping Columns
In the results report, you can group together peptide identifications with the same underlying sequence under the same collapsible heading. The individual identifications within the group might differ in detected modifications, activation type, and particular search engine result. Use this feature when viewing results from multiple searches in a single report. Entries within the peptide group should still display non-redundant (no duplicate) references.
Note If the Show Only Top Match Peptides option is active, Proteome Discoverer shows only the best matched peptides.
Proteome Discoverer User Guide Thermo Scientific

3 Interpreting Search ResultsWorking with the Initial Results Report
T
To group by columns
1. In the Peptide or Protein table, right-click to display the shortcut menu (see Figure 48).
2. Choose Show Peptides Group. The table displays the peptides in a summary-type view, showing only the best matched peptides.
Figure 48. Shortcut menu
Sorting Columns
You can sort a column by ascending or descending order. The small triangle to the right of the column header shows if the column is in ascending or descending order.
To sort a column
1. Open your search results. See “Understanding Reports and Views” on page 37.
2. Click the column header that you want to sort, as shown in Figure 49. You can also sort on multiple columns by holding down the CTRL key while clicking other column headers.
The information in the column is sorted in descending order.
hermo Scientific Proteome Discoverer User Guide 79

3 Interpreting Search ResultsWorking with the Initial Results Report
80
Figure 49. Column header sorting example
3. Click the column header again to sort the information in ascending order.
Column header sorted
Proteome Discoverer User Guide Thermo Scientific

3 Interpreting Search ResultsWorking with the Initial Results Report
T
Labeling and Identifying Rows
To add or remove row index numbers
1. Right-click the Peptides or Proteins table to display the shortcut menu.
2. Choose Row Numbers. A list of options is displayed.
3. Select the row number style you want to use. Proteome Discoverer applies the row number option instantly.
4. (Optional) You can set the options as follows:
• Number Only Visible Items—Numbers only visible rows from 1 to N.
• Number All Items: (Including Currently Hidden Ones)—Numbers all rows from 1 to N.
• Use Invariant Result Index—Numbers all rows by using an internal ID. (This option is the only numbering tag that remains on after sorting or filtering operations.)
Row number index
hermo Scientific Proteome Discoverer User Guide 81

3 Interpreting Search ResultsWorking with the Initial Results Report
82
Saving and Applying Results Report Layout Changes
Use the Layout menu to save layout changes, create a layout, and apply a layout to your results report. After you have used the Column Chooser options, you can save your changes to a default layout or a special layout for your results report.
To define Column Chooser options
1. In the Protein or Peptide view, in the left corner, click . The Column Chooser appears.
2. Click the columns you want to view on the results page.
To save a results report layout
1. Activate the modified results report with your preferred layout. See “Adding, Removing, and Grouping Columns” on page 78 and “Sorting Columns” on page 79.
2. Ensure the report rows are in the correct layout. See “Labeling and Identifying Rows” on page 81.
3. From the Proteome Discoverer menu, choose Search Report > Layout > Save Layout As to save the column and row changes. See Figure 50.
Figure 50. Save Layout As menu options
Proteome Discoverer User Guide Thermo Scientific

3 Interpreting Search ResultsWorking with the Initial Results Report
T
Figure 51. Saving a layout
4. In the File name list, select or type the name of the layout.
5. Click OK to save the layout with the specified File name. The view closes and your layout properties are stored in a file in the layout folder.
To create a default layout
1. Activate the modified results report with your preferred layout. See “Adding, Removing, and Grouping Columns” on page 78 and “Sorting Columns” on page 79.
2. From the Proteome Discoverer menu, choose Search Report > Layout > Save Layout As Default to save the column and row changes.
You can now apply the row and column properties to any results report. To apply the default layout to any report, use the Apply Default Layout command.
To apply the default layout to your report
1. Click the results report that you want to modify.
2. From the Proteome Discoverer menu, choose Search Report > Layout > Apply Default Layout.
The properties of the default layout are applied to the results report.
To apply a layout to your report
1. Click the results report that you want to modify.
2. From the Proteome Discoverer menu, choose Search Report > Layout > Apply Layout. An Open dialog box appears as shown in Figure 52.
hermo Scientific Proteome Discoverer User Guide 83

3 Interpreting Search ResultsWorking with Filters
84
3. Select the layout you want to apply. The selected layout name appears in the File name box (see Figure 52).
Figure 52. Selecting a layout to apply
4. Click Open to apply the layout to your report. The properties of the selected layout are applied to the results report.
Working with FiltersProteome Discoverer offers powerful capabilities for filtering your search results data by applying the available results filters on the Filters page. It also offers a quick method to filter your tabular search results. The quick filtering is called Row Filters and is accessed from the shortcut menu. These two different methods for filtering data, the results filters and the row filters, provide complementary options.
The filters are defined as follows:
• Results filters—Available on the Filters tab, these filters exclude peptides and proteins from the result set. As an effect, applying these results filters to filter out peptides changes the number of identified peptides and the percentage coverage values of the proteins. The numbers of filtered versus total number of peptides and proteins displayed in the status bar are also affected.
• Row filters—Display filters only. When displaying the filtered out rows, the affected lines for both filters are seen as grayed out rows. Excluding peptides by setting row filters does not change the number of identified peptides and the percentage coverage values of the proteins.
Proteome Discoverer User Guide Thermo Scientific

3 Interpreting Search ResultsWorking with Filters
T
Use the filters feature to selectively hide and sort the visible results of the matched search results. Use the Filter page to separate the proteins and peptides based on the parameters selected from the Filters list. Use the Row Filters option with the Filters page feature to narrow your search results even further.
To filter and sort your results, you can apply any of these features:
• Apply a quick filter (see “Filtering Results” on page 85).
• Sort columns to organize the table (see “Filtering Results” on page 85).
• Add or remove filters (see “False Discovery Rates” on page 93).
• Activate more than one filter (see “False Discovery Rates” on page 93).
• Display the filtered row to do a visual check of the sorted results (see “Filtering Results” on page 85).
Filtering Results
The following procedures describe how to filter your results using two filtering methods. If you save your report, you can save filters that you set using the Filters page with your results report. You cannot, however, save the filters you set using the Row Filters features with your results report. The Row Filters feature only works on the visible table.
To filter your search results using the Filters page
1. Open your search results. See “Understanding Reports and Views” on page 37.
2. Click the tab of the search results you want to filter.
3. Click the Filters tab. The Filters page appears.
4. Select a filter type from either Filters list.
5. Click . The filter is included in the filter table. A message: Filters Changed! appears when a filter has been made active. (see Figure 53).
6. Select the check box to the left of the filter in the Active column.
7. (Optional) Select the check box to the left of the filter in the Inverted column.
Note For an inverted filter example you set the peptide confidence level to low confidence and select the inverted option so that only the modest and high confidence levels show in the report.
hermo Scientific Proteome Discoverer User Guide 85
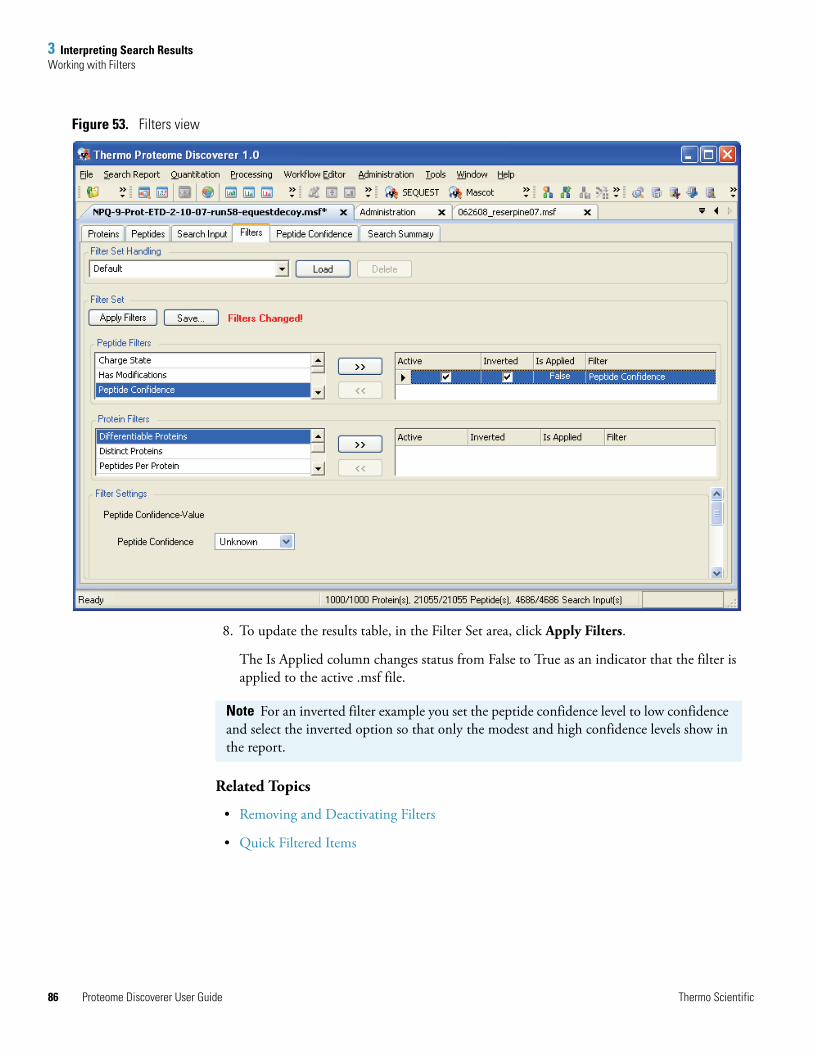
3 Interpreting Search ResultsWorking with Filters
86
Figure 53. Filters view
8. To update the results table, in the Filter Set area, click Apply Filters.
The Is Applied column changes status from False to True as an indicator that the filter is applied to the active .msf file.
Related Topics
• Removing and Deactivating Filters
• Quick Filtered Items
Note For an inverted filter example you set the peptide confidence level to low confidence and select the inverted option so that only the modest and high confidence levels show in the report.
Proteome Discoverer User Guide Thermo Scientific

3 Interpreting Search ResultsWorking with Filters
T
Removing and Deactivating Filters
Use the Filters page to set filter changes to the number of proteins and peptides visible in the Results grid. Add, remove, activate, or deactivate filters so that you can remove unneccessary information as you sort through the search results.
To remove a filter
1. Open your search results. See “Understanding Reports and Views” on page 37.
2. Click the appropriate tab for your search results.
3. Click the Filters tab. The Filters page appears.
4. Click the filter on the filter table to highlight the row.
5. Click . The filter is removed from the filter table. A message: Filters Changed! appears.
6. To update the results table, click Apply Filters.
To deactivate a filter
1. Open your search results. See “Understanding Reports and Views” on page 37.
2. Click the appropriate tab for your search results.
3. Click the Filters tab. The Filters page appears.
4. Clear the check box to the left of the filter in the Active column.
5. To update the results table and disable the filter, click Apply Filter. The filter, however, is not removed from the Filters page.
Related Topics
• Filtering Results
• Quick Filtered Items
hermo Scientific Proteome Discoverer User Guide 87

3 Interpreting Search ResultsWorking with Filters
88
To set a quick filter to your search results using row filters
1. Open your search results. See “Understanding Reports and Views” on page 37.
2. Select the Proteins or Peptides page. This example shows the Peptides page.
3. Right-click the table results to access the shortcut menu. Choose Enable Row Filters. Small funnel icons appear to the right of the column headers as seen in Figure 54.
Figure 54. Funnel filter menu
Small funnel icons Quick filter menu
Proteome Discoverer User Guide Thermo Scientific

3 Interpreting Search ResultsWorking with Filters
T
4. Click a funnel icon. A menu list opens for you to set a row filter for that particular column. In this example, choose Custom. The dialog box to enter filter criteria for a particular view appears (see Figure 55).
Figure 55. Enter filter criteria for MH+ [Da] example
5. From the Operator list, select Greater than or equal to.
6. In the Operand box, type 1100.
7. To display another row in the Enter filter criteria dialog box, click Add a condition.
8. From the next Operator list, select Less than or equal to.
9. In the Operand box, type 1300. The Enter filter criteria dialog box should look like Figure 55.
10. Click OK to accept the filter settings. For this example, only peptides that have a precursor MH+ mass between 1100 and 1300 are displayed.
Note The following steps provide specific details on how to set a precursor mass filter.
hermo Scientific Proteome Discoverer User Guide 89

3 Interpreting Search ResultsWorking with Filters
90
Where this type of filter is active, the color of the column funnel icon is blue as shown in Figure 56.
Figure 56. Blue-colored funnel icon indicating an active column
Blue funnel icon
Proteome Discoverer User Guide Thermo Scientific

3 Interpreting Search ResultsWorking with Filters
T
To remove a quick filter
1. Open your search results. See “Understanding Reports and Views” on page 37.
2. Select the Proteins or Peptides page with the quick filter set.
3. Click the blue funnel icon. A menu list opens for you to set a row filter for that particular column. In this example, choose Custom. The dialog box to enter filter criteria for a particular view appears.
4. In the Operand row of interest, click the condition button to the left of the Operator list. The condition is activated (see Figure 57).
Figure 57. Delete filter criteria for MH+ [Da] example
5. Click Delete Condition.
6. Click OK.
Condition button
hermo Scientific Proteome Discoverer User Guide 91

3 Interpreting Search ResultsWorking with Filters
92
Quick Filtered Items
Quick filters hide rows in the tabular reports so that you can easily assess your results. By using the Show Filtered Out Rows command in the shortcut menu, you can see the hidden rows to do a comparative analysis. The hidden rows are grayed out when you choose Show Filtered Out Rows.
To display quick filtered rows
1. Open your search results. See “Understanding Reports and Views” on page 37.
2. Select the Proteins or Peptides page. This example shows the Peptides page.
3. Click the Peptides tab. The Peptides page appears.
4. Right-click to display the shortcut menu as shown in Figure 58, and choose Show Filtered Out Rows. The grid changes to show filtered and unfiltered rows.
Figure 58. Showing quick filtered out rows
Related Topics
• Filtering Results
• Removing and Deactivating Filters
Proteome Discoverer User Guide Thermo Scientific
3 Interpreting Search ResultsFalse Discovery Rates
T
False Discovery RatesThe false discovery rate (or false positive rate) is a statistical value that estimates the number of false positive identifications among all identifications found by a peptide ID search. It is a measure of the certainty of the identification. This topic describes how to determine false discovery rates with Proteome Discoverer by using the decoy search feature.
A good decoy database should contain entries that look like real proteins, but do not contain genuine peptide sequences. The simplest approach to achieving such a decoy database is to reverse all protein sequences, which is the scheme currently used in Proteome Discoverer. It is a suitable approach for enzymatic MS/MS searches.
There are two ways to perform the decoy database search:
• (more conservative approach) Perform two separate searches, one against the non-decoy database and one against the decoy database. Then count the number of matches from both searches to determine the false discovery rates.
• Create a concatenated database from the non-decoy and the decoy database and then perform the search against this concatenated database.
The difference between the two approaches becomes clear when thinking of a case where two significant matches are found for a given spectrum. The first match is from the non-decoy database and the second one from the decoy database. As only the top matches are considered when calculating the false discovery rates, this is not considered as a false positive in the concatenated database approach, whereas it would count in the separate databases approach. This is why the latter case is considered the more conservative one, and this is the approach that is currently used in Proteome Discoverer.
How to Calculate False Discovery Rates
To calculate the false discovery rate, the matches are counted that pass a given set of filter thresholds from the decoy database and from the non-decoy database. Proteome Discoverer counts only the top match per spectrum, assuming that for any given spectrum only one peptide can be the correct hit.
CAUTION Reversing the database is not suitable for peptide mass fingerprinting, or no-enzyme MS/MS searches. This is especially true with dynamic modifications, because it is possible to get mass shifts at each end of a peptide sequence that transform a genuine y series match into a false b series match or vice versa.
hermo Scientific Proteome Discoverer User Guide 93

3 Interpreting Search ResultsFalse Discovery Rates
94
What are Target False Discovery Rates (FDRs)?
If a false discovery rate target value is set for a decoy database search, Proteome Discoverer determines and applies filter thresholds to identified matches, such that the resulting false discovery rate is not higher than the set target value. The confidence indicators applied to each peptide match are distributed according to these calculated filter thresholds (see “False Discovery Rates and Peptide Confidence Indicators” on page 97).
You must specify two target values for a decoy database search: a strict target FDR and a more relaxed FDR. Figure 59 shows the decoy search setting with target false discovery rates of one percent and five percent, respectively. After completing the search, the system automatically determines two sets of filter settings so that the resulting separate FDRs do not exceed their corresponding target value.
Figure 59. Decoy Database Search in Workflow Editor
Proteome Discoverer User Guide Thermo Scientific

3 Interpreting Search ResultsFalse Discovery Rates
T
Determining False Discovery Rates
With Proteome Discoverer, you can determine the false discovery rate for every available search engine. If the search is set up through a search wizard, there is a single check box on the search parameter page (Figure 60) to enable automatic decoy database searching.
Figure 60. Enabling automatic decoy database searching through the search wizard
When setting up the search with the Workflow Editor, you can find the options to do an automatic decoy database search in the search nodes under the Decoy Database Search pane (Figure 59).
After Proteome Discoverer completes the search and opens a result file (.msf ), you can find the decoy database search result on the Peptide Confidence page (Figure 61). This page shows the two false discovery rates (relaxed and strict) with their corresponding filter settings listed above them.
Setting up a decoy database search
hermo Scientific Proteome Discoverer User Guide 95

3 Interpreting Search ResultsFalse Discovery Rates
96
Use the Peptide Confidence page to do the following:
• Set new filters and recalculate new false discovery rates based on these new filter criteria.
• Set new target false discovery rates and then recalculate new filter settings that, when applied, lead to false discovery rates not worse than the specified ones.
To recalulate the false discovery rates
1. Open a results page and click the Peptide Confidence tab.
2. Change the filter Target setting.
3. Recalculate the false discovery rates, and click Apply Filters.
4. Apply the new filter settings, and click Apply FDRs.
Figure 61. Peptide Confidence view with the actual relaxed and strict false discovery rates given the current filter settings
Note You can change the default confidence levels to alternative values from the Peptide Confidence page.
Filter target setting
Proteome Discoverer User Guide Thermo Scientific

3 Interpreting Search ResultsFalse Discovery Rates
T
False Discovery Rates and Peptide Confidence Indicators
In Proteome Discoverer, the filter settings that determine false discovery rates are used to distribute the confidence indicators for the peptide matches: the green, yellow, and red dots attached to each peptide match (see Figure 62). Whenever a decoy database search is performed and filter settings are applied to achieve the specified target FDRs, the same filters are used to distribute the confidence indicators. Peptide matches that pass the filter associated with the strict FDR are assigned a green indicator of high confidence, peptide matches that pass the filter associated with the relaxed FDR are assigned a yellow indicator of modest confidence, and all other peptide matches receive a red indicator of low confidence.
Figure 62. Decoy search results
hermo Scientific Proteome Discoverer User Guide 97

3 Interpreting Search ResultsWorking with the Proteins Grid
98
Working with the Proteins GridUse the Proteins grid tab to display the list of identified proteins with the associated identified peptides. From this page you can examine the search results in terms of protein identification, as well as access more details about the peptide identifications and corresponding information from the search input.
You can combine the Chromatogram view with other views such as the extracted ion chromatogram (XIC). The following are examples of accessible views:
• Protein identification details view (protein sequence coverage map)
• Fragment match chart
• Peptide ID details view (sub-level view on the protein page)
• Chromatogram view
• XIC view (reconstructed ion chromatogram of precursor)
• Isotope view (full mass spectrum of precursor m/z)
For further discussion regarding the protein grid page, see the following:
• Researching Groups of Proteins
• Interpreting Your Results with the Chromatogram View
• Interpreting Your Results with the Protein Identification Details View
Researching Groups of Proteins
Although MS/MS-based proteomics studies are peptide-centric, you can also explore what proteins are present and their associations through related peptides. Deducing protein identities from a set of identified peptides becomes difficult due to sequence redundancy, such as the presence of proteins that have shared peptides. These redundant proteins are automatically grouped and are not initially displayed in the results report.
In the search results report, you can turn on or off protein grouping. However, protein grouping is an essential feature for the quantitation to help determine peptide uniqueness. By default, the Show Only Top Match Peptides option is set to off, so you can see all peptides considered for calculating protein ratios.
The proteins that are not distinct or differentiable are not displayed. The proteins within a group are ranked according to their protein score. If they have the same score, they are ranked by their sequence coverage. The top protein of a group becomes the master protein of that group. By default, only the master proteins are displayed on the main Proteins page.
Proteome Discoverer User Guide Thermo Scientific

3 Interpreting Search ResultsWorking with the Proteins Grid
To display other proteins belonging to the same protein group
1. Open your search results. See “Understanding Reports and Views” on page 37.
2. On the Proteins page, click anywhere in a protein row.
3. From the Proteome Discoverer toolbar, choose Search Report > Show proteins covered by this set of peptides.
Another Proteins table appears below the Proteins page.
Figure 63. Grouping of proteins
Proteins page (main)
Protein of interest
Proteins page (subset)
Related peptide
Thermo Scientific Proteome Discoverer User Guide 99

3 Interpreting Search ResultsWorking with the Proteins Grid
100
To switch off protein grouping
1. In a protein grid cell or row, right-click to access the shortcut menu.
2. Clear the check mark for Enable Protein Grouping. See Figure 64. Your proteins immediately ungroup.
Figure 64. Protein grid shortcut menu options
Interpreting Your Results with the Chromatogram View
You can display the base peak chromatogram of the original .raw data file with the Chromatogram view. A review of the chromatogram can provide information on the specific peptides and peak shapes as well as the intensity of analytes.
To display the Chromatogram view and peptide elution
1. Open your search results. See “Understanding Reports and Views” on page 37.
2. From the Proteome Discoverer toolbar, choose Search Report > Show Chromatogram View. The Chromatogram view appears.
3. Select a row on the Proteins page. One or more red lines appear in the chromatogram. The red lines indicate the elution time of all identified peptides of the associated protein. See Figure 65.
A yellow range can appear in the chromatogram view. This is the selected retention time range from which spectra are extracted and submitted for peptide identification.
To interpret your results with the Chromatogram view
1. In the Chromatogram view, select one or more proteins, or one or more peptides.
2. Observe the red line on the yellow level of the grid. The red line indicates the elution time of each instance of this peptide.
3. Check to see if the amount and the profile are as expected.
• Where is the peptide eluting in the chromatogram? Is it as expected?
• Is the shape of the chromatogram as expected?
Proteome Discoverer User Guide Thermo Scientific

3 Interpreting Search ResultsWorking with the Proteins Grid
Figure 65. Example of a chromatogram view of proteins
To display the results of Chromatogram and Extracted Ion Chromatogram views
1. Open your search results. See “Understanding Reports and Views” on page 37.
2. From the Proteome Discoverer menu bar, choose Search Report > Show Chromatogram View. The Chromatogram view appears.
3. Click + to the right of the protein row. The peptides associated with the proteins appear.
4. Click a row header in the peptides row. A red line in the chromatogram appears. The red lines indicate the elution time of all identified peptides.
5. From the Proteome Discoverer window, choose Search Report > Show Extracted Ion Chromatogram. The Extracted Ion Chromatogram view corresponding to the m/z precursor of the selected peptide appears.
Thermo Scientific Proteome Discoverer User Guide 101

3 Interpreting Search ResultsWorking with the Proteins Grid
102
To interpret your results with Chromatogram and Extracted Ion Chromatogram views
Select the row header of the peptide results.
• A red line on the Chromatogram view shows the elution position of this particular peptide.
• The view also displays the elution profile of this peptide in the Extracted Ion Chromatogram view.
Figure 66. Chromatogram view and Extracted Ion Chromatogram view of proteins
Interpreting Your Results with the Protein Identification Details View
To display Protein Identification Details
1. Open your search results. See “Understanding Reports and Views” on page 37.
2. Select a row header on the Proteins page.
3. From the Proteome Discoverer menu bar, choose Search Report > Show Details. The Protein Identification Details view appears. You can also access the Protein Identification page by highlighting a column and selecting Show Details.
Proteome Discoverer User Guide Thermo Scientific

3 Interpreting Search ResultsWorking with the Proteins Grid
Figure 67. Example of Protein Identification Details view
The protein sequence coverage bar is colored to indicate the confidence of the peptide sequence identification. The peptides not highlighted were either not detected or not identified.
• Green—Peptides highlighted are of high confidence.
• Yellow—Peptides highlighted are of modest confidence.
• Red—Peptides highlighted are of low confidence.
4. In the protein sequence coverage bar, click a colored bar. The related sequence is highlighted in the same color.
Report Item Distribution Chart
The Report Item Distribution chart provides flexibility to mix and match your search results. You can use the Report Item Distribution to assess different aspects of the search results including scores, delta masses, retention times, and so on by plotting them in relationship to each other. Using the chart, you can plot each property of the identified peptides against each other for comparative analysis.
The Report Item Distribution chart initially plots the score versus delta mass of the identified peptides. To display the extended tooltip information, hover your cursor over a spot in the chart that represents a peptide (as shown in Figure 68). The tooltip information describes the identified peptide, amino acid sequence, charge state, referenced proteins, and so on.
The default display shows the properties of all peptides currently visible. To display the filtered out peptides in the plot, select the Show Filtered Out check box at the bottom of the dialog box. The filtered out peptides are plotted as small red crosses (Figure 68 and Figure 69).
Thermo Scientific Proteome Discoverer User Guide 103

3 Interpreting Search ResultsWorking with the Proteins Grid
104
Figure 68. Report Item Distribution chart with hover text
Proteome Discoverer User Guide Thermo Scientific

3 Interpreting Search ResultsWorking with the Proteins Grid
Figure 69. Report Item Distribution chart with filtered out peptides
The Report Item Distribution chart is interactive, and supports multi-level zooming and panning. Use the zoom options to look at the pattern in greater detail.
To zoom in
Drag your cursor to the left and select the area you want to enlarge in size.
To zoom out
Drag your cursor to the right and select the area you want to reduce in size.
To use the right-click shortcut menu
Right-click anywhere in the Report Item Distribution chart. The shortcut menu appears.
Filtered out peptide Z-axis
Thermo Scientific Proteome Discoverer User Guide 105

3 Interpreting Search ResultsWorking with the Peptides Grid
106
Working with the Peptides GridUse the Peptides grid to accomplish most of your tabular and graphical analyses. From the Peptides grid, you can explore the tabular information of peptides. You can also access the various details views for the peptide matches. Select a row header on the first level (with red background) and select any toolbar icon to access a view such as Details or Spectrum.
On the Peptide page (if the Show Top Match Peptides Only option is active) a non-redundant list of all identified peptides is displayed. All displayed peptides are above the threshold set in any applied filters. Peptides below the threshold can be displayed in a grayed-out form if the Show Filtered Out Rows option is selected from the shortcut menu.
To start a data validation from the Peptides grid, click the Peptides tab above the Results grid. Again, the same two levels of detail associated with a particular peptide sequence are available in the Results grid.
Interpreting Your Results with the Search Reports Views
To view the spectrum
1. In an open report, click the Peptides tab. The peptide view of your search report appears.
2. Select a peptide row.
3. Choose Search Report > Show Spectrum. The Peptide Spectrum view appears.
To view the fragment match spectrum
1. In an open report, click the Peptide tab. The peptide view of your search report appears.
2. Select a peptide row.
3. Choose Search Report > Show Fragment Match Spectrum. The Peptide Fragment Match view appears.
To view the isotope pattern of the selected precursor
1. In an open report, click the Peptides tab. The peptide view of your search report appears.
2. Select a peptide row.
3. Choose Search Report > Show Isotope Pattern. The Isotope Pattern view appears.
Note With quantitation reports the peptide non-redundant list is disabled.
Proteome Discoverer User Guide Thermo Scientific

3 Interpreting Search ResultsWorking with the Peptides Grid
T
To view i the extracted ion chromatogram
1. In an open report, click the Peptides tab. The peptide view of your search report appears.
2. Select a peptide row.
3. Choose Search Report > Show Extacted Ion Chromatogram. The Extacted Ion Chromatogram view appears.
To view the peptide consensus page
1. In an open report, click the Peptides tab. The peptide view of your search report appears.
2. Drag the cursor across boxes for identical peptides.
3. Click . The peptide consensus view appears.
In this view you can see the following:
• Spectra detail as a text header
• Horizontal bars showing mass difference that confirms the presence of residues
• Grid cell color indicating positive identification within tolerance and hue-indicated ion series
• Fragment ion coverage showing which ion type confirms fragmentation
• Theoretical values for ions formed by indicated bond breakage
4. (Optional) Drag your cursor over spectra region to zoom in. Right-click to reset to initial view.
hermo Scientific Proteome Discoverer User Guide 107

3 Interpreting Search ResultsWorking with the Peptides Grid
108
To view the peptide consensus page
1. In an open report, click the Peptides tab. The peptide view of your search report appears.
2. Select a peptide row.
3. Choose Search Report > Show Peptide Consensus View. The Peptide Consensus View appears. See Figure 70.
Figure 70. Peptide Consensus View
Peptide Identification Details
Use the Peptides identification details page to show the analysed spectra of the selected peptide sequence in the peptide grid. You can refer to the following section on fragment ions while choosing your peptide identification details.
Proteome Discoverer User Guide Thermo Scientific

3 Interpreting Search ResultsWorking with the Peptides Grid
T
Fragment Ions
Fragment ions of peptides are produced by a collision-induced dissociation (CID) process in which a peptide ion is fragmented in a collision cell. Low energy CID spectra are generated by MS/MS and ESI, and are sequence specific. The fragment ion spectra contain peaks of the fragment ions formed by cleavage of the N-CR bond and are used to determine amino acid sequence. A fragment must have at least one charge for it to be detected.
The fragment ions produced are identified according to where they are fragmented in the peptide. Fragment ions A, B, and C have a charge on the N-terminal side and fragment ions X, Y, and Z have a charge on the C-terminal side. Fragment ions A*, B*, and Y* are ions that have lost ammonia (-17 Da) and fragment ions Ao, Bo, and Co are ions that have lost water (-18 Da). The subscript next to the letter indicates the number of residues in the fragment ion.1
Table 15 summarizes the fragment ions used in Proteome Discoverer:
1For more information on fragment ions and nomenclature, see Proposal for a Common Nomenclature for Sequence Ions in Mass Spectra of Peptides; Roepstorff, P. and Fohlman, J.; Biomed Mass Spectrum, 11(11) 601 (1984).
Table 15. Fragment ions
Ions Description
A Charge on N-terminal side
B Charge on N-terminal side
C Charge on N-terminal side
Y Charge on C-terminal side
Z Charge on C-terminal side
B* B ion that has lost ammonia (-17 Da)
Y* Y ion that has lost ammonia (-17 Da)
Bo B ion that has lost water (-18 Da)
Yo Y ion that has lost water (-18 Da)
hermo Scientific Proteome Discoverer User Guide 109

3 Interpreting Search ResultsWorking with the Peptides Grid
110
To view the peptide identification details page
1. In an open report, click the Peptides tab. The peptide view of your search report appears.
2. Select a peptide row and double-click a grid cell. The Peptide Identification Details page appears. See Figure 71 and Figure 72 for details.
Figure 71. Peptide identification details
Ions and state charges
Description of the spectra and parameters
b-ions y-ions
Proteome Discoverer User Guide Thermo Scientific
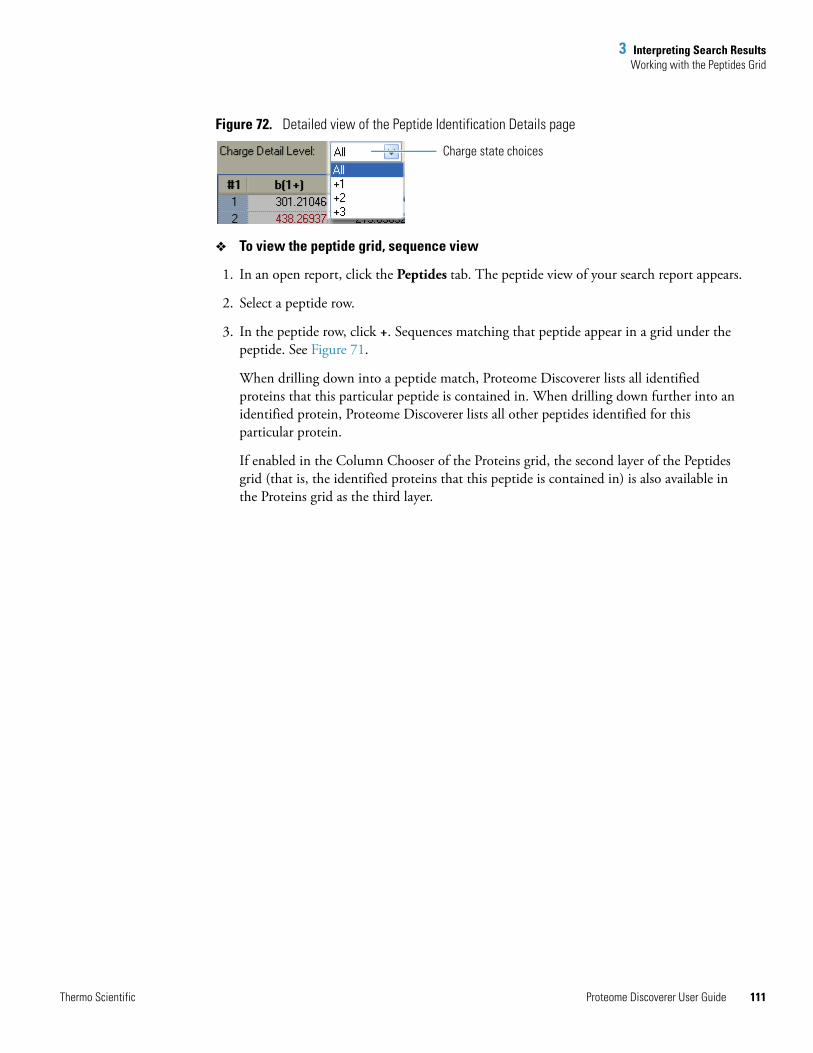
3 Interpreting Search ResultsWorking with the Peptides Grid
T
Figure 72. Detailed view of the Peptide Identification Details page
To view the peptide grid, sequence view
1. In an open report, click the Peptides tab. The peptide view of your search report appears.
2. Select a peptide row.
3. In the peptide row, click +. Sequences matching that peptide appear in a grid under the peptide. See Figure 71.
When drilling down into a peptide match, Proteome Discoverer lists all identified proteins that this particular peptide is contained in. When drilling down further into an identified protein, Proteome Discoverer lists all other peptides identified for this particular protein.
If enabled in the Column Chooser of the Proteins grid, the second layer of the Peptides grid (that is, the identified proteins that this peptide is contained in) is also available in the Proteins grid as the third layer.
Charge state choices
hermo Scientific Proteome Discoverer User Guide 111

3 Interpreting Search ResultsWorking with the Search Input
112
Figure 73. Peptide grid, sequence view
Working with the Search InputUse the Search Input tab to display the grid for all individual peptide results.
• Interpreting the Isotope Pattern View
• Interpreting the Spectrum View
• Interpreting the Extracted Ion Chromatogram
• Interpreting the Fragment Match View
Peptide row details
Matching sequence
Proteome Discoverer User Guide Thermo Scientific

3 Interpreting Search ResultsInterpreting the Isotope Pattern View
T
Interpreting the Isotope Pattern ViewThe Isotope Pattern view displays the isotope pattern of the precursor associated with the identified peptide (Figure 74). The components of this view are as follows:
• The yellow region displays the isolation width of the instrument.
• A red line indicates the monoisotopic precursor mass-to-charge value determined by the instrument during acquisition. This is the isolation mass, which is displayed in the header of the isotope pattern view.
• A blue line marks the calculated monoisotopic precursor mass and represents the re-evaluated monoisotopic m/z value for the detected peptide.
This view can also be used to assess the abundance and intensity of the precursor or to reference the experimentally determined mass of the precursor and its isotopes, the isolation window, or other details.
To display the Isotope Pattern view
1. Open your search results. See “Understanding Reports and Views” on page 37.
2. From the Proteome Discoverer menu bar, choose Search Report > Show Isotope Pattern. The mass spectrum appears.
3. Select a row header on the Peptides page. A blue line and yellow bar in the Isotope Pattern appear. A red line can also appear if the monoisotopic mass was redetermined post-acquisition.
Figure 74. Isotope Pattern view
hermo Scientific Proteome Discoverer User Guide 113

3 Interpreting Search ResultsInterpreting the Spectrum View
114
4. Use the Isotope Pattern to check if the correct monoisotopic mass has been calculated, since the first isotope of a peptide is not always the most intense ion.
Interpreting the Spectrum ViewThe Spectrum view displays the graphical spectrum of the submitted peak list used for the search. This spectrum view might differ from the original spectrum in the .raw file if spectral preprocessing (such as noise filter or special grouping) was applied to tandem mass spectra prior to searching associated with each peptide. Use this view to check the quality of the spectrum.
To display a Spectrum view
1. Open your search results. See “Understanding Reports and Views” on page 37.
2. From the Proteome Discoverer menu bar, choose Search Report > Show Spectrum. The Spectrum view appears.
3. Select a row header on the Peptides page. The spectrum of the individual peptide appears.
4. Use the Spectrum view to check the peptide.
Proteome Discoverer User Guide Thermo Scientific

3 Interpreting Search ResultsInterpreting the Extracted Ion Chromatogram
T
Interpreting the Extracted Ion ChromatogramThis view displays the extracted ion chromatogram of the precursor mass associated with each peptide. The extracted ion chromatogram is a plot of the intensity of an ion versus unit of time. The red line shows when the MS2 spectrum was taken.
To display the Extracted Ion Chromatogram
1. Open your search results. See “Understanding Reports and Views” on page 37.
2. From the Proteome Discoverer menu bar, choose Search Report > Show Extracted Ion Chromatogram. The extracted mass chromatogram view appears. See Figure 75.
3. Select a row on the Peptides page.
4. Note the graphically displayed intensity of the peptide:
• The peak start and end points as well as the baseline are in blue.
• The peak area or the height value is automatically calculated.
You can use the view to assess the chromatographic peak shape of the associated precursor, and to reference the elution time of the identified peptide. The integrated area under the curve and height of the peak is displayed and can be used to assess the abundance of the precursor.
5. Use the graph to determine answers to such questions as
• Is the MS2 spectrum of poor signal-to-noise due to low abundance of the peptide?
• Was the MS2 triggered too early (at the start of the peak) or too late (at the end of the peak)?
6. To magnify a particular peak, drag your cursor over the region of interest.
Figure 75. Extracted ion chromagraph
Interpreting the Fragment Match ViewThe Fragment Match view displays the annotated spectrum of the identified peptide. The matched fragments are colored according to their fragment type, such as blue for b-ions and red for y-ions.
hermo Scientific Proteome Discoverer User Guide 115

3 Interpreting Search ResultsInterpreting the Fragment Match View
116
To display the Fragment Match view
1. Open your search results. See “Understanding Reports and Views” on page 37.
2. From the Proteome Discoverer menu bar, choose Search Report > Show Fragment Match Spectrum. The Fragment Match Spectrum view appears. See Figure 76. Select a row header on the Peptides page.
3. Confirm that all major fragments are assigned and colored coded.
4. Assess the quality of the match between the submitted spectrum peak list and the identified peptide.
Figure 76. Fragment mass view
Peptide row
Major fragments
Proteome Discoverer User Guide Thermo Scientific

3 Interpreting Search ResultsExporting Data to Other Programs
Exporting Data to Other ProgramsProteome Discoverer offers extensive options for exporting data and results into other file formats, such as .xml. You can do the following:
• Export in common, open standard formats.
• Export spectral information in .mgf, mzData, .dta file formats.
• Export analysis results as ProtXML and as Excel files for detailed analysis of your search results.
• Export all grid data by copying and pasting into Excel files.
• Export all charts to the Clipboard to save in various image formats.
You can create a Peptide Report when the peptide information appears in the initial results report table. You can include the following types of information in the Peptide Report:
• The information displayed in the report table, including the peptides identified, XCorr, probability, and other scores.
• Peptide match information, which includes the sequences and scoring information for all the peptide matches identified for each scan.
Copying or Saving a View to an Image
This section describes how to copy your analysis results and save your results to another application.
To copy a view
1. Open a view such as a Chromatogram view.
2. Right-click and choose Copy from the shortcut menu. The view is automatically stored as an image to the Clipboard. You can paste the image into another application.
To save a view in another format
1. Open a view, such as a Chromatogram view.
2. Right-click and choose Save as from the shortcut menu.
3. Select the image type: .emf, .png, .gif, .jpeg, .tiff, or .bmp.
4. (Optional) Select the location to store the image.
5. In the File name box, type the name of the file.
6. Click Save. The image is saved in the format and location you selected.
Thermo Scientific Proteome Discoverer User Guide 117
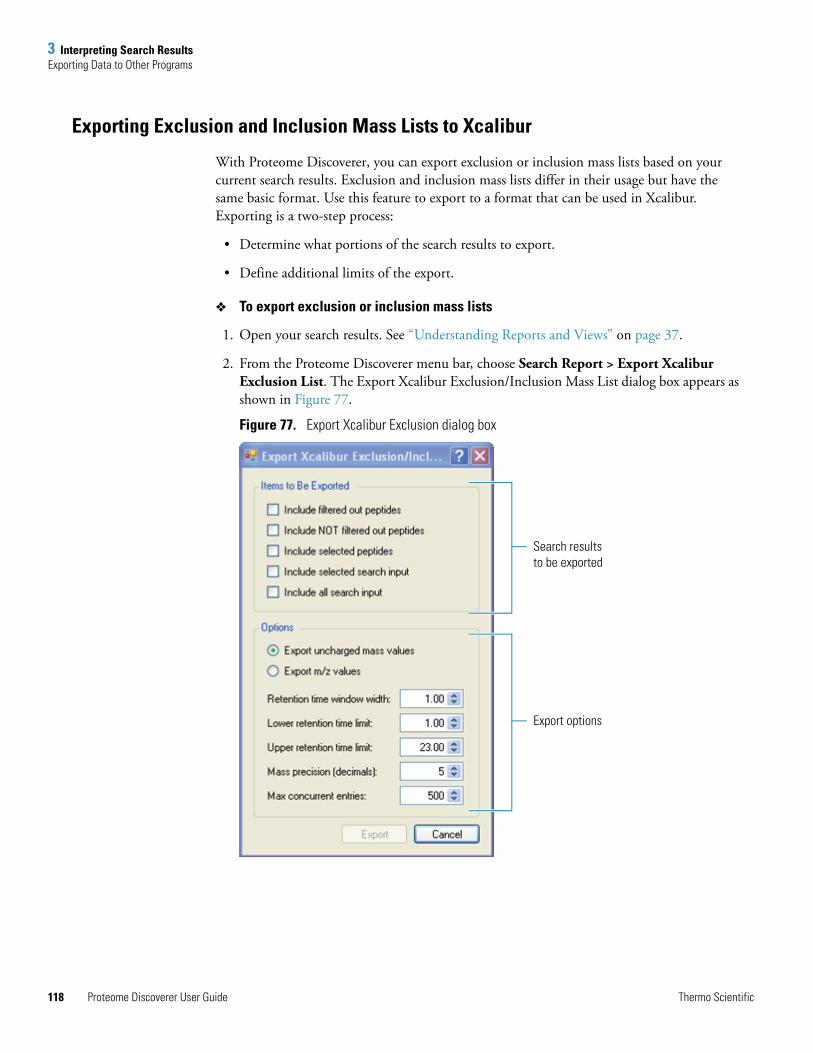
3 Interpreting Search ResultsExporting Data to Other Programs
118
Exporting Exclusion and Inclusion Mass Lists to Xcalibur
With Proteome Discoverer, you can export exclusion or inclusion mass lists based on your current search results. Exclusion and inclusion mass lists differ in their usage but have the same basic format. Use this feature to export to a format that can be used in Xcalibur. Exporting is a two-step process:
• Determine what portions of the search results to export.
• Define additional limits of the export.
To export exclusion or inclusion mass lists
1. Open your search results. See “Understanding Reports and Views” on page 37.
2. From the Proteome Discoverer menu bar, choose Search Report > Export Xcalibur Exclusion List. The Export Xcalibur Exclusion/Inclusion Mass List dialog box appears as shown in Figure 77.
Figure 77. Export Xcalibur Exclusion dialog box
Search resultsto be exported
Export options
Proteome Discoverer User Guide Thermo Scientific

3 Interpreting Search ResultsExporting Data to Other Programs
3. In the Items to Be Exported area, specify which result items should be transferred to the exclusion mass list.
4. In the Options area, select either Export uncharged mass values or Export m/z values.
5. Choose the proper values for your data set for the time value options.
6. Click Export. The Save As dialog box opens.
7. Type the File name for the exported list. A success message appears (see Figure 78).
Figure 78. Export successful message
8. Use a standard text editor to view the resulting exclusion mass list (see Figure 79) from your hard drive.
Figure 79. Exported exclusion mass list example
Export Search Results to Excel
You can export protein and peptide identification results and also the search input and other grids, such as the fragment match matrix, directly into a spreadsheet application, such as Excel.
To export search results to Excel (example for proteins and peptides)
1. Open your search results. See “Understanding Reports and Views” on page 37.
2. Select the Proteins or Peptides tab.
3. On the Proteins or Peptides page, right-click anywhere in the table to display the shortcut menu.
4. Choose Export to Excel Workbook. The Export to Excel Workbook dialog box appears as shown in Figure 80.
Thermo Scientific Proteome Discoverer User Guide 119

3 Interpreting Search ResultsExporting Data to Other Programs
120
Figure 80. Export to Excel Workbook dialog box
Proteome Discoverer User Guide Thermo Scientific

3 Interpreting Search ResultsExporting Data to Other Programs
5. Click browse (...). The Save Grid as Microsoft Excel File dialog box appears.
6. Browse and select a location to save the results file.
7. In the File name box, type the name of your results file.
8. Click Open. The Export to Excel Workbook dialog box appears.
9. To export only the information from the top layer of the current Results grid, select the Export Top Grid Layer Only check box in the Excel Export Settings area.–or–To export further grid layers and also the information from the top layer of the current Results grid, clear the Export Top Grid Layer Only check box, as shown in the next figure.
Thermo Scientific Proteome Discoverer User Guide 121

3 Interpreting Search ResultsExporting Data to Other Programs
122
10. To divide the layers from each other, select the Add Empty Rows Between Each Grid Layer check box.
11. Click Export. The status of the export appears. When the export is complete, you can open your exported file.
See Figure 81 for an example of an exported report with two layers.
Proteome Discoverer User Guide Thermo Scientific

3 Interpreting Search ResultsExporting Data to Other Programs
Figure 81. An exported report with two layers
Exporting Spectra
Use the Export Spectra dialog box to select and save the search results or input them into another format.
To export spectra
1. Open your search results. See “Understanding Reports and Views” on page 37.
2. From the Proteome Discoverer menu bar, choose Search Report > Export Spectra. The Export Spectra dialog box appears as shown in Figure 82.
Figure 82. Export Spectra dialog box
Thermo Scientific Proteome Discoverer User Guide 123

3 Interpreting Search ResultsWorking with InforSense Discussion
124
3. Click the browse button (...). The Save as dialog box appears.
4. In the File name box, type the name of the results file.
5. Click Open. The Export Spectra dialog box appears.
6. Click Export. The status of the export appears. When the export is complete, you can open your exported file.
Working with InforSense DiscussionSearching an LC-MS/MS raw file with a peptide-based search engine produces a list of identified proteins, along with peptide and statistical information. Determining the biological meaning of the results involves searching the literature in some manner to obtain pertinent information on each protein that is identified. InforSense workflows automate the process of searching the databases, which include the National Center for Biotechnology Information (NCBI, www.ncbi.nlm.nih.gov/sites/entrez) and the Swiss Institute of Bioinformatics ExPASy proteomics server (www.expasy.com).
Protein accessions denoted as International Protein Index (IPI), GenBank (GI), and SwissProt accession numbers or with TrEMBL names are all compatible with the workflows. Use of the ExPASy Web server requires that GI and IPI numbers be translated into the SwissProt/Uniprot format prior to submission; the NCBI workflows only needs to translate IPI accessions. The workflows facilitate the translations through the Protein Information Resource (PIR) Web service (http://pir.georgetown.edu/). TrEMBL names have undergone significant revisions in recent years and outdated names are not directly recognized by either of the Web services.
To ensure compatibility of search data obtained with older databases, both workflows submit any TrEMBL names they encounter to the automated ExPASy ID Tracker function (http://beta.uniprot.org/) to translate them into the latest representation prior to submission.
InforSense and the Internet
The InforSense Protein Annotation workflows are Internet intensive. Search speeds are a function of your Web service speed.
• Large result files run slower than small files.
• Higher network speeds result in faster search times.
• Loss of network connection, even intermittently (such as with a wireless connection), results in search failure.
WARNING Only SwissProt/Uniprot, NCBI, or IPI compatible protein databases yield search results compatible with InforSense Protein Annotation workflows.
Proteome Discoverer User Guide Thermo Scientific

3 Interpreting Search ResultsWorking with InforSense Discussion
Data Retrieval Content Levels
The richness of your data retrieval content depends on the content richness of the Web server. Information for each protein annotation searched might not be complete, due to the nature of the biological databases.
Using InforSense Protein Annotation
Proteome Discoverer uses InforSense Protein Annotation to automatically determine the biological context of identified peptides.
To use InforSense
• Choose Tools > InforSense.
InforSense opens a new window where you can choose four predefined workflow options:
• GO Annotation NCBI
• GO Annotation SwissProt
• Metadata Table NCBI
• Meta Table SwissProt
IMPORTANT For a more complete discussion, see the InforSense Protein Annotation Help written for Thermo Fisher Scientific Proteome Discoverer workflows.
Thermo Scientific Proteome Discoverer User Guide 125

3 Interpreting Search ResultsWorking with InforSense Discussion
126
GO Annotation NCBI
GO Annotation NCBI workflow introduction:
Workflow GO Annotation NCBI description
Proteome Discoverer User Guide Thermo Scientific

3 Interpreting Search ResultsWorking with InforSense Discussion
GO Annotation SwissProt
GO Annotation SwissProt workflow introduction:
Workflow GO Annotation SwissProt description
Thermo Scientific Proteome Discoverer User Guide 127

3 Interpreting Search ResultsWorking with InforSense Discussion
128
Metadata Table NCBI
Metadata Table NCBI workflow introduction:
Workflow Metadata Table NCBI description
Proteome Discoverer User Guide Thermo Scientific
3 Interpreting Search ResultsWorking with InforSense Discussion
Meta Table SwissProt
The Meta Table SwissProt workflow introduction:
Workflow Metadata Table SwissProt description
Thermo Scientific Proteome Discoverer User Guide 129


4
Customizing Proteome Discoverer
Proteome Discoverer offers several ways to customize your search analysis experience:
• Customize the toolbar of the main window.
• Customize the quantitation methods available to use during a search.
• Customize the chemical modifications available to use during a search.
• Customize the cleavage reagents by modifying the reagents and their corresponding settings.
• Register a new .fasta file to use for your search.
Customizing the ToolbarProteome Discoverer comes with a number features and tools that are accessible with a click of a toolbar icon. The toolbar provides quick access to most of the commonly used Proteome Discoverer features. The following sections describe how you can change the display and the layout of the toolbar:
• Customizing the Toolbar Layout
• Customizing Toolbar Icons, Fonts, and Tooltips Display
Contents
• Customizing the Toolbar
• Customizing Cleavage Reagents
• Customizing Chemical Modification Settings
• Using FASTA Database Administration
Thermo Scientific Proteome Discoverer User Guide 131
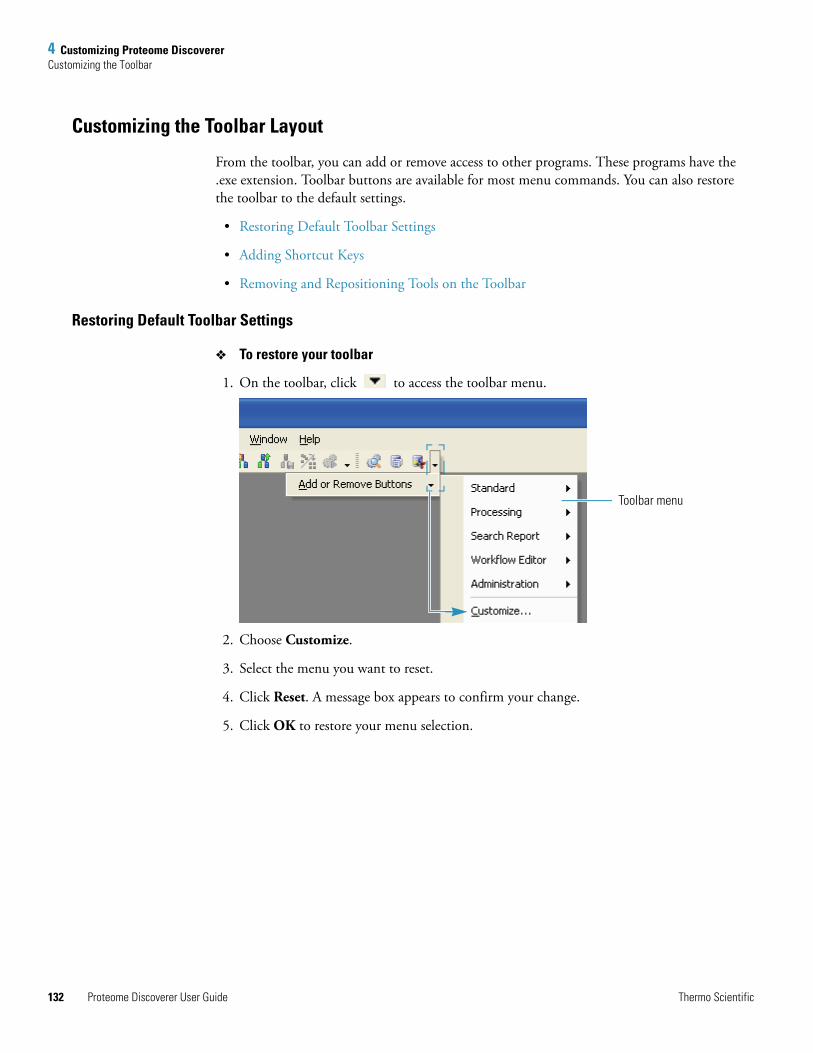
4 Customizing Proteome DiscovererCustomizing the Toolbar
132
Customizing the Toolbar Layout
From the toolbar, you can add or remove access to other programs. These programs have the .exe extension. Toolbar buttons are available for most menu commands. You can also restore the toolbar to the default settings.
• Restoring Default Toolbar Settings
• Adding Shortcut Keys
• Removing and Repositioning Tools on the Toolbar
Restoring Default Toolbar Settings
To restore your toolbar
1. On the toolbar, click to access the toolbar menu.
2. Choose Customize.
3. Select the menu you want to reset.
4. Click Reset. A message box appears to confirm your change.
5. Click OK to restore your menu selection.
Toolbar menu
Proteome Discoverer User Guide Thermo Scientific

4 Customizing Proteome DiscovererCustomizing the Toolbar
Adding Shortcut Keys
To add shortcut keys to a command
1. On the toolbar, click to access the toolbar menu.
2. Choose Customize. The Customize dialog box appears.
3. Click the Commands tab. The Commands page appears.
4. Click Keyboard. The Customize Keyboard dialog box opens.
5. In the Customize Keyboard dialog box, scroll through the Commands menu to find the command and its corresponding keyboard shortcut.
6. From the Specify a Shortcut list, select a shortcut.
7. Below the Specify a Shortcut list, check to see if the shortcut is unassigned.
8. If the shortcut is unassigned, click Assign. The shortcut is now assigned to your command choice.
9. In the Customize Keyboard dialog box, click Close. Your changes are saved.
10. In the Customize dialog box, click Close.
Thermo Scientific Proteome Discoverer User Guide 133

4 Customizing Proteome DiscovererCustomizing the Toolbar
134
Removing and Repositioning Tools on the Toolbar
To remove a set of tools from the toolbar
1. On the toolbar, click to access the toolbar menu.
2. Choose Customize. The Customize dialog box appears.
3. Clear the check box adjacent to the tool you want removed from the toolbar.
The tool is visible in the menu, but the icon is removed from the toolbar.
4. Click Close to close the Customize dialog box.
To remove a single tool icon from the toolbar
1. On the toolbar, click to access the toolbar menu. The active toolbar commands have a checkmark next to them.
Clear the check box to remove a tool from the toolbar.
Access menu Select tool to remove.
Proteome Discoverer User Guide Thermo Scientific

4 Customizing Proteome DiscovererCustomizing the Toolbar
2. Clear the check mark adjacent to the tool you want removed from the toolbar. The tool is visible on the menu but the icon is removed from the toolbar.
To reposition toolbar buttons
1. Select immediately to the right of the toolbar section you want repositioned.
A set of cross arrows ( ) appears when you select the toolbar section.
2. Drag the toolbar section to its new position.
Customizing Toolbar Icons, Fonts, and Tooltips Display
Use the Options page in the Customize dialog box to customize toolbar features. You can resize the toolbar icons and fonts, change your tooltips display to include corresponding icons and shortcut keys, or hide the tooltips display from view.
Figure 83. Customize dialog box
Resizingicons
Customizing tooltips
Thermo Scientific Proteome Discoverer User Guide 135

4 Customizing Proteome DiscovererCustomizing the Toolbar
136
To resize icons on toolbars and menus
1. On the toolbar, click to access the toolbar menu.
2. Choose Customize. The Customize dialog box appears.
3. Click Options.The Options page appears.
4. To increase the size of the menu and toolbar icons, select the Large Icons on Menus option and the Large Icons on Toolbars option.
5. To save your changes and close the Customize dialog box, click Close.
To customize tooltips
1. On the toolbar, click to access the toolbar menu.
2. Choose Customize. The Customize dialog box appears.
3. Click Options.The Options page appears.
4. To display tooltips when you hover over the icons, select the Show ScreenTips on toolbars option.
5. (Optional) To display shortcut keys with the tooltips, select the Show shortcut keys in ScreenTips option. You must select Show ScreenTips on toolbars to use the Show shortcut keys in ScreenTips option.
6. To save your changes and close the Customize dialog box, click Close.
To hide tooltips
1. On the toolbar, click to access the toolbar menu.
2. Choose Customize. The Customize dialog box appears.
3. To hide tooltips when you hover over the icons, clear the Show ScreenTips on toolbars option.
4. To save your changes and close the Customize dialog box, click Close.
Proteome Discoverer User Guide Thermo Scientific

4 Customizing Proteome DiscovererCustomizing Cleavage Reagents
Customizing Cleavage ReagentsIn the Cleavage Reagents view, you can add, remove, and modify the reagents and their corresponding settings. The reagents table contains the cleavage sites, cleavage inhibitors, abbreviations, and cleavage specificities.
To open the Cleavage Reagents view
1. Choose Administration > Cleavage Reagents. The cleavage reagents view appears.
Figure 84. Cleavage reagents displayed in the Proteome Discoverer window
2. To modify the cleavage reagents list, click the Name column cell, Click here to add.
3. Type the information, such as LysN.
4. To save the modification, click Apply.
Thermo Scientific Proteome Discoverer User Guide 137

4 Customizing Proteome DiscovererCustomizing Chemical Modification Settings
138
The following table lists the enzymes and reagents with cleavage properties that you can define when you add a new reagent.
Customizing Chemical Modification SettingsWith Proteome Discoverer, you can update the chemical modifications you use to conduct a peptide identification search. You can import a new list or the latest UNIMOD list. You can also modify the chemical modification list provided by adding amino acids to the modifications, by creating new modifications, or by activating or deactivating existing modifications.
Use the chemical modification feature on the Administration page to customize the chemical modifications you use to do your search. Use the following list of tasks to update the chemical modifications:
• Entering and Deleting Chemical Modifications
• Adding and Removing Amino Acids
• Importing Chemical Modifications
Table 16. Enzymes and reagents with cleavage properties
Parameter Description
Name Specifies the name of the reagent used for the protein digestion.
Cleavage Sites Specifies the position (amino acid) at which to cleave the sequence.
Cleavage Inhibitors Specifies the amino acids that block cleavage when adjacent to the cleavage site.
Offset Specifies whether the cleavage occurs before or after the amino acids listed in the Cleavage Sites column.
• 0 - Cleavage occurs to the left of the amino acid.• 1 - Cleavage occurs to the right of the amino acid.
Abbreviation Specifies the user-defined abbreviation.
Cleavage Specificities You can select more than one cleavage specificity. The available cleavage specificities are as follows:
• Full - Every cleavage must be at the specified cleavage site.• Semi - Only one end of the sequence needs to have the
specified cleavage.• Semi (N-Term) - Only the N-terminal side of the sequence
needs to have the specified cleavage.• Semi (C-Term) - Only the C-terminal side of the sequence
needs to have the specified cleavage.
Note A modification must be active to be usable during a search.
Proteome Discoverer User Guide Thermo Scientific

4 Customizing Proteome DiscovererCustomizing Chemical Modification Settings
Entering and Deleting Chemical Modifications
To add a new modification
1. Choose Administration > Maintain Chemical Modifications. The Chemical Modifications view appears.
2. Click the cell, Click here to add a new record.
An empty row appears.
3. In the empty row, enter the name of the modification, the delta masses, the chemical substitution, the chemical group that is leaving, the position, and the abbreviations of the modifications.
4. To accept the new modifications, click Enter.
5. Add an amino acid to the modifications. See “Adding and Removing Amino Acids” on page 141.
Note Both the substitution and leaving group are for display purposes only.
Click to add a row.
Thermo Scientific Proteome Discoverer User Guide 139

4 Customizing Proteome DiscovererCustomizing Chemical Modification Settings
140
To update an existing modification
1. Choose Administration > Maintain Chemical Modifications. The Chemical Modifications view appears.
2. In the Modification column, click the cell you want to update.
3. Type your changes for the delta masses, the substitution, the group it is leaving, the position, or the abbreviations of the modifications.
4. To accept the changes, click Apply.
To delete a modification
1. Choose Administration > Maintain Chemical Modifications. The Chemical Modifications view appears.
2. Select the row of the modification you want to delete.
3. Click Delete. The row is removed from the chemical modifications table.
Related Topics
• Adding and Removing Amino Acids
• Importing Chemical Modifications
Proteome Discoverer User Guide Thermo Scientific

4 Customizing Proteome DiscovererCustomizing Chemical Modification Settings
Adding and Removing Amino Acids
To add an amino acid to a modification
1. Choose Administration > Maintain Chemical Modifications.
The Chemical Modifications view appears.
2. Click + to the left of the modification row you want to update. The row expands and the associated amino acids appear.
3. Click the cell, Click here to add a new record. An empty row appears.
4. In the empty row, select the amino acid from the list. The amino acid and the one letter abbreviation appear.
5. To save the modifications, click Apply.
Click to expand row. Click to add a row.
Thermo Scientific Proteome Discoverer User Guide 141
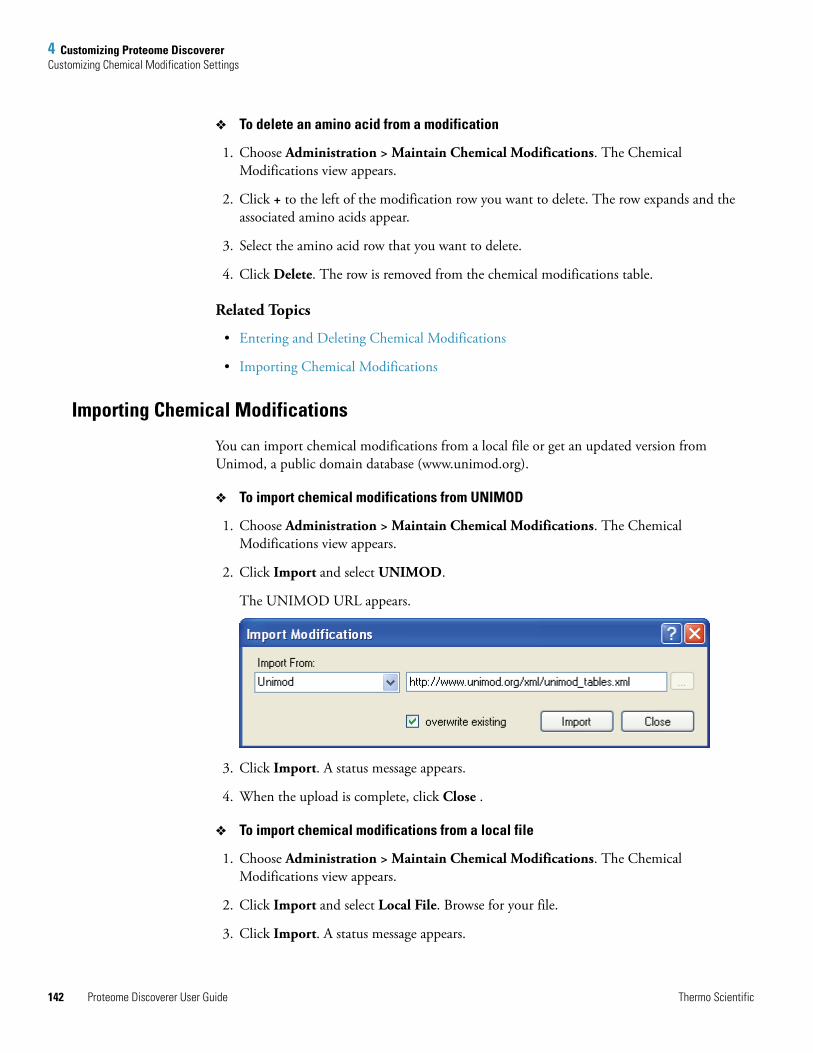
4 Customizing Proteome DiscovererCustomizing Chemical Modification Settings
142
To delete an amino acid from a modification
1. Choose Administration > Maintain Chemical Modifications. The Chemical Modifications view appears.
2. Click + to the left of the modification row you want to delete. The row expands and the associated amino acids appear.
3. Select the amino acid row that you want to delete.
4. Click Delete. The row is removed from the chemical modifications table.
Related Topics
• Entering and Deleting Chemical Modifications
• Importing Chemical Modifications
Importing Chemical Modifications
You can import chemical modifications from a local file or get an updated version from Unimod, a public domain database (www.unimod.org).
To import chemical modifications from UNIMOD
1. Choose Administration > Maintain Chemical Modifications. The Chemical Modifications view appears.
2. Click Import and select UNIMOD.
The UNIMOD URL appears.
3. Click Import. A status message appears.
4. When the upload is complete, click Close .
To import chemical modifications from a local file
1. Choose Administration > Maintain Chemical Modifications. The Chemical Modifications view appears.
2. Click Import and select Local File. Browse for your file.
3. Click Import. A status message appears.
Proteome Discoverer User Guide Thermo Scientific

4 Customizing Proteome DiscovererCustomizing Chemical Modification Settings
4. When the upload is complete, click Close.
By using the Chemical Modifications view, you can add amino acids to existing modifications and create new modifications.
Table 17. Chemical modifications parameters (Sheet 1 of 2)
Parameter Description
Modification Displays the type of modification.
Delta Mass Displays the mass difference associated with the modification.
Delta Average Mass Displays the difference between two adjacent average mass measurements.
Substitution Displays the chemical group substitution that occurs with the modification.
Leaving group Displays the chemical group that is missing.
Position Displays the location where the modification might occur. The selections are Any, Any_C_Terminus, Any_N_Terminus, Protein_C_Terminus, and Protein_N_Terminus.
Abbreviation Displays the abbreviation of the modification displayed in reports.
Thermo Scientific Proteome Discoverer User Guide 143

4 Customizing Proteome DiscovererUsing FASTA Database Administration
144
Using FASTA Database AdministrationWhen you use FASTA Database Utilities options, you can import FASTA files.
You can perform these actions in Proteome Discoverer and customize how your FASTA file is added to the modifications table.
Figure 85. FASTA file management
To add a FASTA file
1. Choose Administration > Maintain FASTA file. The Administration page appears with the FASTA File view.
2. Click .
3. Browse for and select the FASTA file that you want to process.
4. Click OK.
To delete a FASTA file
1. Choose Administration > Maintain FASTA file. The Administration page appears with the FASTA File view.
2. Select at the beginning of a row to activate the row.
3. Click .
Amino Acid Name Lists the amino acids that Proteome Discoverer can apply the modification to.
IsActive Makes modifications available for search parameters.
UniMod Accession # Go to http://www.unimod.org.
One letter code Displays the single letter abbreviation of the amino acid.
Table 17. Chemical modifications parameters (Sheet 2 of 2)
Parameter Description
Add FASTA File button
Remove FASTA File button
Proteome Discoverer User Guide Thermo Scientific

4 Customizing Proteome DiscovererUsing FASTA Database Administration
T
The amount of time it takes to process a FASTA file directly depends on the file size. When a FASTA file finishes processing, the status column displays the message, Available. The FASTA file is now available to be used for a peptide search with Proteome Discoverer.
hermo Scientific Proteome Discoverer User Guide 145


A
Chemistry References
The following tables provide the mass values, the descriptions of enzyme properties, and the descriptions of fragment ions used throughout Proteome Discoverer:
• Amino Acid Mass Values
• Modification Values
• Enzyme Cleavage Properties
• Fragment Ions
Amino Acid Mass ValuesProteome Discoverer uses the amino acids symbols and mass values listed in Table 1 and Table 2.
Table 1. Amino acid mass values (Sheet 1 of 2)
Amino acid One-lettercode
Three-lettercode
Monoisotopicmass
Averagemass
Sumformula
Glycine G Gly 57.02147 57.0517 C2H3NO
Alanine A Ala 71.03712 71.0787 C3H5NO
Serine S Ser 87.03203 87.078 C3H5NO2
Proline P Pro 97.05277 97.1168 C5H7NO
Valine V Val 99.06842 99.1328 C5H9NO
Threonine T Thr 101.04768 101.1051 C4H7NO2
Cysteine C Cys 103.00919 103.145 C3H5NOS
Isoleucine I Ile 113.08407 113.1598 C6H11NO
Leucine L Leu 113.08407 113.1598 C6H11NO
Asparagine N Asn 114.04293 114.1039 C4H6N2O2
Aspartic Acid D Asp 115.02695 115.0885 C4H5NO3
Glutamine Q Gln 128.05858 128.13091 C5H8N2O2
Lysine K Lys 128.09497 128.1745 C6H12N2O
Thermo Scientific Proteome Discoverer User Guide 147

A Chemistry ReferencesModification Values
148
Modification ValuesChemical modifications are listed in Table 3. See “Working with Chemical Modifications.”
Glutamic Acid E Glu 129.0426 129.1156 C5H7NO3
Methionine M Met 131.0405 131.1994 C5H9NOS
Histidine H His 137.05891 137.1414 C6H7N3O
Phenylalanine F Phe 147.06842 147.1772 C9H9NO
Arginine R Arg 156.10112 156.188 C6H12N4O
Tyrosine Y Tyr 163.06332 163.17661 C9H9NO2
Tryptophan W Trp 186.07932 186.2141 C11H10N2O
Table 2. Special amino acids
Amino acid One-lettercode
Three-lettercode
Monoisotopicmass
Averagemass
Sumformula
Avrg. N/D B Bnd 114.53494 114.5962 C4H5NO3
Avrg. Q/E Z Zqe 128.55059 128.62326 C5H7NO3
Unknown acid (X) X Xxx 0 0
Seleno cysteine (U) U Sec 150.0369 144.95959 C3H5NOF
Table 1. Amino acid mass values (Sheet 2 of 2)
Amino acid One-lettercode
Three-lettercode
Monoisotopicmass
Averagemass
Sumformula
Table 3. Modification values (Sheet 1 of 2)
Modification Monoisotopic mass Average mass
Deamidation 0.98402 0.98480
Methylation 14.01565 14.02660
Hydroxylation 15.99492 15.99940
Oxidation 15.99492 15.99940
Formylation 27.99491 28.01010
Acetylation 42.01057 42.03670
Carboxyamidomethylation 57.02146 57.05130
Carboxymethylation 58.00548 58.03610
Propionamide 71.03711 71.07790
Sulfation 79.95682 80.06320
Proteome Discoverer User Guide Thermo Scientific

A Chemistry ReferencesEnzyme Cleavage Properties
Enzyme Cleavage PropertiesTable 4 lists the enzymes and reagents with cleavage properties.
Phosphorylation 79.96633 79.97990
Note Go to www.unimod.org/xml/unimod_tables.xml for more modification values.
Table 3. Modification values (Sheet 2 of 2)
Modification Monoisotopic mass Average mass
Table 4. Cleavage properties of enzymes and reagents
Enzymes/Reagents Cleaves after
Cleaves before Except when
Enzymes for digestion
Trypsin K K P is after K
Trypsin R R P is after R
Trypsin (KR) K or R
Trypsin (KRLNH) K, R, L, N, or H
Trypsin (KR/P) K or R P is after K or R
Trypsin (KRLNH/P) K, R, L, N, or H P is after K, R, L, N, or H
Chymotrypsin F, W, Y, or L
Chymotrypsin (FWY) F, W, or Y P is after F, W, or Y
Clostripain R
Proline_Endopept P
Staph_protease E
GlucC E or D
LysC K
AspN D
Elastase A, L, I, or V P is after A, L, I, or V
Elastase/Tryp/Chymo A, L, I, V, K, R, W, F, or Y P is after A, L, I, V, K, R, W, F, or Y
Chemicals for degradation
Cyanogen Bromide M
Iodobenzoate W
Thermo Scientific Proteome Discoverer User Guide 149

A Chemistry ReferencesFragment Ions
150
Fragment IonsFragment ions of peptides are produced by several different fragmentation techniques such as ECD, ETD, CID, higher-energy C-trap dissociation (HCD), and infrared multiphoton dissociation (IRMPD).
As an example, low energy CID spectra are generated by MS/MS and ESI and are sequence specific. The fragment ion spectra contain peaks of the fragment ions formed by cleavage of the N-CR bond and are used to determine amino acid sequences. A fragment must have at least one charge for it to be detected.
The fragment ions produced are identified according to where they are fragmented in the peptide. Fragment ions A, B, and C have a charge on the N-terminal side, and fragment ions X, Y, and Z have a charge on the C-terminal side. Fragment ions A*, B*, and Y* are ions that have lost ammonia (-17 Da), and fragment ions Ao, Bo, and Co are ions that have lost water (-18 Da). The subscript next to the letter indicates the number of residues in the fragment ion.1
Table 5 summarizes the fragment ions used in Proteome Discoverer.
1For more information on fragment ions and nomenclature, see Proposal for a Common Nomenclature for Sequence Ions in Mass Spectra of Peptides; Roepstorff, P. and Fohlman, J.; Biomed Mass Spectrum, 11(11) 601 (1984).
Table 5. Fragment ions
Ions Description
A Charge on N-terminal side
B Charge on N-terminal side
C Charge on N-terminal side
Y Charge on C-terminal side
Z Charge on C-terminal side
B* B ion that has lost ammonia (-17 Da)
Y* Y ion that has lost ammonia (-17 Da)
Bo B ion that has lost water (-18 Da)
Yo Y ion that has lost water (-18 Da)
Proteome Discoverer User Guide Thermo Scientific

B
FASTA Reference
This FASTA reference contains the mass values, the descriptions of enzyme properties, and the fragment ion descriptions used throughout Proteome Discoverer. It is an overview of the most important FASTA databases and the parsing rules Proteome Discoverer uses to obtain the accession# and the description.
NCBIThis non-redundant database is compiled by the NCBI (National Center for Biotechnology Information) as a protein database for Blast searches. It contains non-identical sequences from GenBank CDS translations, PDB, Swiss-Prot, PIR, and PRF.
http://www.ncbi.nih.gov/BLAST/blast_databases.html
ftp://ftp.ncbi.nih.gov/blast/db/FASTA/nr.gz
A typical NCBI title line follows:
>gi|70561|pir||MYHO myoglobin - horse_i|418678|pir||MYHOZ myoglobin - common zebra (tentative sequence) [MASS=16950]
FASTA ID:• Accession#: gi70561• Description: myoglobin - horse_i
Thermo Scientific Proteome Discoverer User Guide 151

B FASTA ReferenceMSIPI
152
MSIPIMSIPI is a database derived from IPI that contains additional information about cSNPs, N-terminus peptides, and known variants in a format suitable for mass spectrometry search engines. MSIPI is produced by the Max-Planck Institute for Biochemistry at Martinsried and the University of Southern Denmark, and distributed by the European Bioinformatics Institute (EBI).
ftp://ftp.ebi.ac.uk/pub/databases/IPI/msipi/current/
A typical MSIPI title line follows:
>MSIPI:IPI00000001.2| Gene_Symbol=STAU1 Isoform Long of Double-stranded RNA-bin ding protein Staufen homolog 1 lng=577 # CON[595,R,359,A] #
FASTA ID:• Accession#: IPI00000001.2• Description: Isoform Long of Double-stranded RNA-bin ding protein
Staufen homolog 1 lng=577 # CON[595,R,359,A] #
IPIIPI (International Protein Index) is compiled by the EBI to provide a top-level guide to the main databases that describe the human and mouse proteomes: SWISS-PROT, TrEMBL, NCBI RefSeq, and Ensembl.
http://www.ebi.ac.uk/IPI/
ftp://ftp.ebi.ac.uk/pub/databases/IPI/current/
A typical IPI title line follows:
>IPI:IPI00685094.1|SWISS-PROT:Q2KIJ2|ENSEMBL:ENSBTAP00000028878|REFSEQ:NP_001073825;XP_593190 Tax_Id=9913 Gene_Symbol=MGC137286;LOC515210 Uncharacterized protein C1orf156 homolog
FASTA ID:• Accession#: IPI00685094.1• Description: Uncharacterized protein C1orf156 homolog
Proteome Discoverer User Guide Thermo Scientific

B FASTA ReferenceUniRef100
T
UniRef100UniRef, also known as UniProt NREF, is a set of comprehensive protein databases curated by the Universal Protein Resource consortium. UniRef100 contains only non-identical sequences, where as UniRef90, and UniRef50 are non-redundant at a sequence similarity level of 90 percent and 50 percent, respectively.
http://www.ebi.ac.uk/uniref/
ftp://ftp.uniprot.org/pub/databases/uniprot/uniref/uniref100/uniref100.fasta.gz
A typical UniRef100 title line follows:
>UniRef100_Q4U9M9 Cluster: 104 kDa microneme-rhoptry antigen precursor; n=1; Theileria annulata|Rep: 104 kDa microneme-rhoptry antigen precursor -
Theileria annulata
FASTA ID:• Accession#: Q4U9M9• Description: Cluster: 104 kDa microneme-rhoptry antigen precursor;
n=1; Theileria annulata|Rep: 104 kDa microneme-rhoptry antigen precursor - Theileria annulata
SwissProt & TrEMBLThe SwissProt database is developed by the SWISS-PROT groups at SIB and EBI.
TrEMBL is a computer-annotated supplement of SWISS-PROT that contains all the translations of EMBL nucleotide sequence entries not yet integrated in SWISS-PROT.
http://www.expasy.org/sprot/
ftp://ftp.expasy.org/databases/uniprot/knowledgebase/uniprot_sprot.fasta.gz
ftp://ftp.ebi.ac.uk/pub/databases/uniprot/knowledgebase/uniprot_trembl.fasta.gz
A typical SwissProt title line follows:
>Q43495|108_SOLLC Protein 108 precursor - Solanum lycopersicum (Tomato) (Lycopersicon esculentum)
FASTA ID: 108_SOLLC• Accession#: Q43495• Description: Protein 108 precursor - Solanum lycopersicum (Tomato)
(Lycopersicon esculentum)
hermo Scientific Proteome Discoverer User Guide 153

B FASTA ReferenceMSDB
154
MSDBThe MSDB database is compiled by the Proteomics Group at Imperial College London using the following source databases: PIR, Trembl, GenBank, Swiss-Prot, and NRL3D.
http://csc-fserve.hh.med.ic.ac.uk/msdb.html
ftp://ftp.ncbi.nih.gov/repository/MSDB/
A typical MSDB title line follows:
>CBMS Ubiquinol-cytochrome-c reductase (EC 1.10.2.2) cytochrome b - mouse mitochondrion
FASTA ID:
• Accession#: CBMS
• Description: Ubiquinol-cytochrome-c reductase (EC 1.10.2.2) cytochrome
b - mouse mitochondrion
Custom Database SupportProteome Discoverer also has two "general" parsing rules to support custom sequence database formats. The generic parsing rules are applied only if no other parsing rule matches the given FASTA title line.
Custom Parsing Rule A
This parsing rule is used, if the FASTA ID, the accession#, and the description are separated by a pipe ('|') symbol. A typical FASTA title line, which matches this parsing rule, would look like this one:
>tr|Q18FC3|Q18FC3_HALWD IS1341-type transposase - Haloquadratum walsbyi (strain DSM 16790).
FASTA ID: Q18FC3_HALWD• Accession#: Q18FC3• Description: IS1341-type transposase - Haloquadratum walsbyi (strain
DSM 16790).
Custom Parsing Rule B
This parsing rule is used if the accession# and the description are separated by using a whitespace. A typical FASTA title line, which matches this parsing rule, would look like this one:
>HP0001 hypothetical protein {Helicobacter pylori 26695}
FASTA ID:• Accession#: HP0001• Description: hypothetical protein {Helicobacter pylori 26695}
Proteome Discoverer User Guide Thermo Scientific

B FASTA ReferenceCustom Database Support
T
Custom Parsing Rule C
This parsing rule is used if the FASTA title line only contains the accession#. A typical FASTA title line, which matches this parsing rule, would look like this one:
>143B_HUMAN
FASTA ID:
• Accession#: 143B_HUMAN
• Description: 143B_HUMAN
hermo Scientific Proteome Discoverer User Guide 155


I
Index
Symbols.dta 18.msf
introduction 18, 26load 59naming 56
.raw 18
.srfintroduction 18open 59
.xml 117
Aadd a FASTA 144add to a FASTA database file 62, 144adding and removing amino acids 141administration
cleavage reagents, open 137maintain chemical modifications, add 141maintain chemical modifications, add new 139maintain chemical modifications, delete 142maintain chemical modifications, import 142maintain chemical modifications, import from UNIMOD
142maintain chemical modifications, update 140maintain chemical modifications,delete 140maintain FASTA file, add 144maintain FASTA file, delete 144quantitation methods 67, 68
amino acidcorresponding 66mass values 147modification 141, 142modifications table 66
amino acid modificationsadd 141delete 142import from a local file 142import from local file 142import from UNIMOD 142
amino acid symbols 147analysis, detailed 117analyze raw MS data overview 14animation option 29assess the abundance and intensity of the precursor 113
Cchart
chromatogram 100extracted ion chromatogram 101fragment match 115isotope 113peptide distribution 103
chemical modification, customizing 138chemical modifications
delete 140importing 142list 148new 139open 66quick access 9select 29update 140
Chemical Modifications view 143chromatogram
extracted ion chart 101yellow range, selected retention time range 100
chromatogram viewred bars, elution time of all identified peptides 100
CID and ETDsearch algorithm discussion 14
CID, collision-induced dissociation 14cleavage
after 149before 149enzymes and reagent properties 149N-CR bond 109, 150reagents, customizing 137
cleavage inhibitors, definition 138cleavage properties list 149
Thermo Scientific Proteome Discoverer User Guide 157

158
Index
cleavage reagentsquick access 9
cleavage sitescleavage reagents 137definition 138offset 138
close report 28Column Chooser 82complex mixtures 17confidence levels, database searches 46confidence settings, peptide 46, 96configuration
quick access 10copying a view 117create a search workflow 53current job status, quick access 9customize chemical modifications 143customizing
toolbar 131toolbar display 135toolbar layout 132tooltips 136
customizing chemical modification settings 138customizing cleavage reagents 137
Dexample
filter criteria for MH+ 89, 91data
conduct analysis 13exporting 18identification 17summary screens 17
data files 18database
deleting a file 144renaming a file 144
database selection 29deactivate a filter 87decoy database option
peptide confidence 35decoy database search
filter settings 46results 65using 65wizard setting 95
decoy search feature 93
deletingmodification 140toolbar button in Qual Browser 135
detailed analysis 117display filtered rows 92
EECD, electron-capture dissociation 14edit quantitation
overview 20peptide ratios 20quantitation spectrum 21show report intensities 21
enzyme manager, cleavage reagents 137enzyme type, defining in SEQUEST Search Wizard 35enzymes
reagents, cleavage properties of 149enzymes and reagents, list 138ETD
electron-transfer dissociation 14with ECD, and CID data, SEQUEST 17
ETD and CIDsearch algorithm discussion 14
ETD and ECDZCore 16
ETD, electron-transfer dissociation 14example
column header sorting 79exported exclusion mass list 119filter settings 89filter your search results 85gene ontology (GO) three components 24inverted filter 48, 85, 86multiconsensus report 42proteins and peptides export 119retention time difference 33SEQUEST Search Wizard 30Workflow Editor 52Workflow Editor palette 51Workflow Report 38workflow workspace graphic 51
Excel, creating reports 18experimental bias 69export
grids such as fragment match matrix 119protein and peptide identification results 119search input 119
exporting and reporting data, introduction 18exporting data, how to 117extracted example
ion chromagraph graph 72, 115
Proteome Discoverer User Guide Thermo Scientific

Index
extracted ion chromatogramdisplay the results 101view 107XIC 98
Ffalse discovery rate
false positive rate 93FDR 64new target 96SEQUEST 17
false discovery ratesdetermining 95
false positive identifications 64false positive rate
false discovery rate 93FDR 64ZCore 16
FASTA Database Utilities 62, 144FASTA file
add 144deleting 144renaming 144
FASTA filesquick access 9
FDR, false discovery rate 64FDRs
not effective on small data sets 65validate large data sets 65
file types 18files, data 18filter
Active 85change settings 96deactivate 87hide rows 92inverted 85new settings 96quick 92remove 87results 85settings, distribute confidence indicators 46
filtersunderstanding descriptive information 37
filters tab 85fragment ions 150
A, B, and C 109, 150distribution 17
fragment match 115
Ggetting a license viiiGO Annotation NCBI, using 126GO Annotation SwissProt, using 127graphical views, isotope and chromatogram 77grouping
quantitation report, protein grouping is turned off 98search results report, protein grouping 98
Hheight value 72, 115how to use
GO Annotation NCBI 126GO Annotation SwissProt 127Metadata Table NCBI 128Metadata Table SwissProt 129
Iicon sizes 28ImageQuest, getting a license viiiimporting chemical modifications 142InforSense
Protein Annotation 124Virtual Machine (VM) 23, 75workflow discussion 124workflow documentation, complete set 76workflows, compatibility caveat 124
InforSense Protein Annotationcompatible databases 75, 124integrate data 23join databases 23license xusing 125
input files 18instructions to create a quantitation method 69integrate
automatically 115data, InforSense Protein Annotation tasks 23
inverted filter example 48, 85, 86invoke InforSense 75ion trap mass spectrometers, SEQUEST 17isotope pattern chart view 113iTRAQ 4plex 67iTRAQ 4plex method 68iTRAQ 8plex 67iTRAQ 8plex method 68iTRAQ quantitation 20
Thermo Scientific Proteome Discoverer User Guide 159

Jjob queue
controls and status 74description 73introduction 26start workflow 56
join databases, InforSense Protein 23
Llayout menu 82license
getting viiigetting, quick access 10InforSense xother xto enter x
list of cleavage properties 149low-abundance proteins 17
MMascot
high level of confidence with multiple peptides 16peptide mass fingerprint 16
Mascot search algorithm 16mass tags 69mass values
amino acid 147list 147
match likely proteins 77measure and report 67Meta Table, using SwissProt 129Metadata Table
NCBI, using 128missed cleavages, defining in SEQUEST Search Wizard 35modifications
adding 139adding amino acid 141deleting 140deleting amino acid 142importing UNIMOD information from a local file 142importing UNIMOD information from the web 142setting 139updating 140values 148
modify a FASTA database file 62, 144mouse, range definition 31multiconsensus report
creating and viewing 41opening 41
Nnode options
workflow 57nodes
workflow 51
Oopen
one or more reports 27open .srf 59open a report
file menu option 59job queue page option 74
open option 26open Proteome Discoverer workflow 56open report
quick access 9output files 18overview
InforSense Protein Annotation 23, 75process and analyze raw MS data 14Qual Browser 22quantitation 20search algorithms 14
Pparameters 29peak
list 11magnify 72, 115
peak areaautomatically calculated 72, 115
peptideaccess to the protein page 39candidates 17consensus page 107consensus view 108, 110, 111graphical view of distribution 103identification details 107individual results 112intensity display 72, 115isotope pattern of the selected precursor 106quantitation 70ratios 8shortcut menu 45show consensus view 108show top matches only 45view 60view the fragment match spectrum 106view the spectrum 106

Index
peptide confidencedecoy database option 35understanding descriptive information 37
Peptide Confidence page 95peptide confidence settings, change the default 46, 96peptide ID search 93peptide identification view 110peptide sequence match grid 111peptides
understanding descriptive information 37percent converage combined 41PMF, Mascot 16precursor
detailed perspective of the MS scan 7experimentally determined mass 113
precursor view 113probability-based scoring
SEQUEST 17ZCore 17
process raw MS data overview 14processing menu 29protein
add reference 64databases 17grouping 98view 60
protein identificationdetails 98how to quantify 67increasing confidence with reverse database search 17overview 11SEQUEST 17
protein quantitation 69protein sequence
coverage 41protein table 39
proteinsunderstanding descriptive information 37
QQual Browser
about 22using 72
quantitation 20basic feature 67iTRAQ 20menu option choices 8overview 20peptide ratios 20quantitation spectrum 21show report intensities 21spectrum 8TMT tagging 18
quantitation methodsedit 68quick access 9select 67
quantitation overview 58quantitization node, in the workflow 69queue list
checking 60deleting search items 61
quick accessconfiguration search programs 10current job status 9FASTA 10InforSense 10license status 10QualBrowser 10quantitation methods 9quantitation, edit method, edit method 8quantitation, reporter intensities 8quantitation, show peptide ratios 8quantitation, show spectrum 8Workflow Editor 8
quick filtersdisplay 92shortcut menu 92show filtered and unfiltered rows 92
Rratio calculation 69ratio reporting 69raw data 11
results, reports, and analysis 18reagents, enzymes 149recalculate new false discovery rate 96recalculate new filter settings 96red bars, chromatogram 100report
close 59save 59
Report Item Distribution graph 103reporter intensities 8reporter ion based quantitation 67
Thermo Scientific Proteome Discoverer User Guide 161

162
Index
reporter ions quantitizer nodeabout iTRAQ 20show peptide ratios 20show quantitation spectrum 21show reporter intensities, 21
reporting data, introduction 18reports
adding columns 79create 77export 77fragment 115open 27peptides 117removing columns 79save and close 28
resultsinterpret the search overview 14reports and analysis 18validated 67
retention time 100, 103row
hide with quick filters 92
Ssave a search workflow 56save and close reports 28save Proteome Discoverer workflow 56scoring 17search
.msf (mass spectrum search files) 18
.srf (unified search files) 18checking status of 60discussion of analysis 18file menu to import results 5
search algorithmsMascot 16ZCore 16
search engine 29Search Input page 112search parameters 29search progress in percent
description 73how to 60
search queuedescription 73jobs 9
search report menuaccess report options 36table of features 6
search wizardsdiscussion 29process diagram 30to use on a raw file 30
selectchemical modifications 29database 29search engine 29search parameters 29
SEQUESTETD, ECD, and CID data 17false discovery rates 17ion trap mass spectrometers 17probability-based scoring 17
set the database 29set the search parameters 29shortcut keys, creating 133shortcut menu
peptide 45quick filters 92
shortcut menus 4show quantitation spectrum 70size changes 28sort and filter 77start workflow 56
Ttabs
filters 37peptide confidence 37peptides 37proteins 37summary 37
Terminal sideC- 109, 150N- 109, 150
TMTquantitation 18tagging 18
toolbarcustomizing 131customizing layout 132display 135
toolsFASTA Database Utilities 62, 64InforSense 75open Qual Browser 72
tooltipscustomizing 136hiding 136
total fraction 17
Proteome Discoverer User Guide Thermo Scientific

Index
UUNIMOD, importing data of 142user interface change options 28
Vvalidation of quantitation results 67view
peptide consensus 108, 110, 111peptide consensus page 107protein page 60
view size 28
Wwizards
four key settings 29raw file 30
workflowcreate a new Proteome Discoverer search 53develop a specific template 50Discoverer - align 53Discoverer - blue box edge 52Discoverer - open 56Discoverer - rawfile 53Discoverer - red box edge 52InforSense - metadata table NCBI 128InforSense - metadata table NCBI (how to use) 125InforSense - metadata table SwissProt 129InforSense - metadata table SwissProt (how to use) 125InforSense - NCBI 126InforSense - NCBI (how to use) 125InforSense - SwissProt 127InforSense - SwissProt (how to use) 125InforSense discussion 124Proteome Discoverer nodes 57quantitization node 69save a search in Proteome Discoverer 56start in Proteome Discoverer 56
Workflow Editorauto layout 53cautionary note - learn workflow node functions 50introduction to node selections 51join two nodes 52learn 52menu 49with respect to all Discoverer processes 19
working with InforSense Protein Annotation 125workspace 51
XXCorr
counts the number of fragment ions 44report table 117
XICextracted ion chromatogram 98
XML, creating reports 18
Yyellow range, chromatogram view 100
ZZCore
ETD and ECD data 16false positive rate 16
Thermo Scientific Proteome Discoverer User Guide 163

164
Index
Proteome Discoverer User Guide Thermo Scientific