xavier querol, idaea-csicairuse.eu/wp-content/uploads/2015/01/2-xquerol_airuse-qualitat-de... ·...
TRANSCRIPT

QUALITAT DE L AI‘E
Barcelona, 13/07/2015
Xavier Querol, IDAEA-CSIC

ididæididididæaæ aaæInstitute of Environmental Assessment and Water Research
CONSEJO SUPERIOR DE INVESTIGACIONES CIENTÍFICAS SPANISH RESEARCH COUNCIL
http://www.idaea.csic.es/

ididæididididæaæ aaæ
CSIC es un organismo de investigación público multi-disciplinar afiliado al Ministerio de Economía y Competitividad de España, con su propia personalidad legal (Agencia Estatal) y presencia a lo largo del territorio nacional.
Objetivos y función del CSIC (R.D. 140/1993, de 29 de Enero ) :
• Preparar y desarrollar proyectos de investigación científica y tecnológica
• Asesoramiento en la definición de objetivos de investigación científica y tecnológica para apoyar decisiones de la administración sobre cuestiones de innovación científica y tecnológica
• Desarrollar investigación científica básica
• Colaborar con las universidades en aspectos de investigación y de formación
• Desarrollar programas de formación científica y tecnológica
• Colaborar con el Programa Nacional de I+D en tareas de asesoramiento y administración que le sean asignadas
Institute of Environmental Assessment and Water Research

ididæididididæaæ aaæ
Mission:
Study the natural and anthropogenically-induced changes in the ecosystems, mainly those involving toxicity
increases in organisms and humans, by means of chemical and geochemical techniques
Leading roles in the application of:
- analytical chemistry
- geochemistry and hydrology
- molecular biology
- methods for the study of environmental problems
Departamental structure:
2 departments:
- Environmental Chemistry
- Geosciences
IDAEA
Institute of Environmental Assessment and Water Research

ididæididididæaæ aaæ
A. Fuels, combustion and combustion by-products
• Mass balances for trace pollutants in combustion and gasification power plants
• Study of the fate of trace pollutants during waste disposal
DEPARTMENT OF GEOSCIENCES: 2 research lines
B. Atmospheric Geochemistry
• Long term measurements for aerosol-climate studies; increase the number of measuring parameters (EUSAAR,
CIRCE, GRACCIE, ACTRIS)
• Research on urban/industrial aerosols towards health impact assessment (APHEKOM, APHEIS, INTARESE)
• Implementation of new instrumentation for the development of new research lines on aerosol and health.
• Policy implementation assessment (ETC-ACM, national and EU administrations)
Institute of Environmental Assessment and Water Research

ididæididididæaæ aaæ Research team on Geochemistry
Department of Geosciences
28 staff (67 permanent scientists)
Research tools: R&D projects in National and EC calls, & contracts with Administration and private companies
Research focus: Atmospheric pollution Waste management and recycling
Institute of Environmental Assessment and Water Research

ididæididididæaæ aaæ
• Permanent gases, con t>1000 years: N2 (78%v), O2 (21%v) and noble gases
• Variable gaseous species, 100<t>1 years: CO2 (395 ppmv ), CH4, H2, N2O, O3
• Highly Variable gaseous species, t<1 year H2O(v): CO (<1ppmv), NO2, NH3, SO2 (ppbv ), H2S,…..
Residence time (t)
Blue colour due to light dispersion by air molecules
Troposphere: meteorological processes take place, 8km (poles) and 18km (equator) 70% atmosphere weight, T gradient of 6,5°C/km
The atmosphere
ididæididididæaæ aaæ
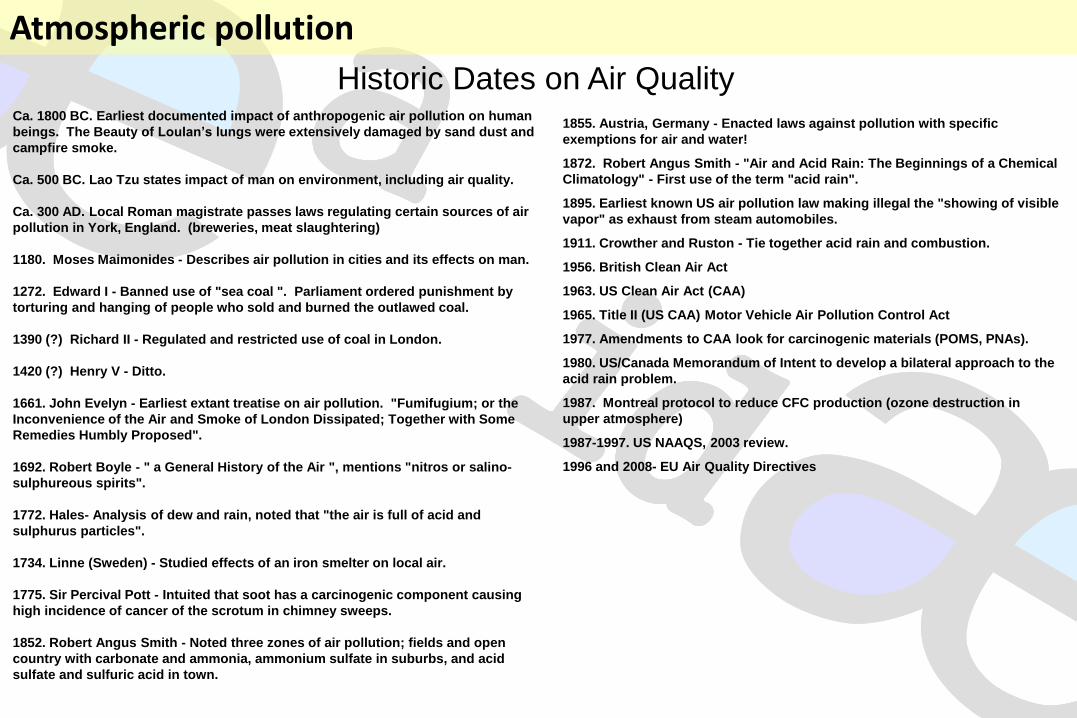
1855. Austria, Germany - Enacted laws against pollution with specific exemptions for air and water!
1872. Robert Angus Smith - "Air and Acid Rain: The Beginnings of a Chemical Climatology" - First use of the term "acid rain".
1895. Earliest known US air pollution law making illegal the "showing of visible vapor" as exhaust from steam automobiles.
1911. Crowther and Ruston - Tie together acid rain and combustion.
1956. British Clean Air Act
1963. US Clean Air Act (CAA)
1965. Title II (US CAA) Motor Vehicle Air Pollution Control Act
1977. Amendments to CAA look for carcinogenic materials (POMS, PNAs).
1980. US/Canada Memorandum of Intent to develop a bilateral approach to the acid rain problem.
1987. Montreal protocol to reduce CFC production (ozone destruction in upper atmosphere)
1987-1997. US NAAQS, 2003 review.
1996 and 2008- EU Air Quality Directives
Ca. 1800 BC. Earliest documented impact of anthropogenic air pollution on human beings. The Beauty of Loulan’s lungs were extensively damaged by sand dust and campfire smoke. Ca. 500 BC. Lao Tzu states impact of man on environment, including air quality. Ca. 300 AD. Local Roman magistrate passes laws regulating certain sources of air pollution in York, England. (breweries, meat slaughtering) 1180. Moses Maimonides - Describes air pollution in cities and its effects on man. 1272. Edward I - Banned use of "sea coal ". Parliament ordered punishment by torturing and hanging of people who sold and burned the outlawed coal. 1390 (?) Richard II - Regulated and restricted use of coal in London. 1420 (?) Henry V - Ditto. 1661. John Evelyn - Earliest extant treatise on air pollution. "Fumifugium; or the Inconvenience of the Air and Smoke of London Dissipated; Together with Some Remedies Humbly Proposed". 1692. Robert Boyle - " a General History of the Air ", mentions "nitros or salino-sulphureous spirits". 1772. Hales- Analysis of dew and rain, noted that "the air is full of acid and sulphurus particles". 1734. Linne (Sweden) - Studied effects of an iron smelter on local air. 1775. Sir Percival Pott - Intuited that soot has a carcinogenic component causing high incidence of cancer of the scrotum in chimney sweeps. 1852. Robert Angus Smith - Noted three zones of air pollution; fields and open country with carbonate and ammonia, ammonium sulfate in suburbs, and acid sulfate and sulfuric acid in town.
Historic Dates on Air Quality
Atmospheric pollution

ididæididididæaæ aaæ
Co pa a ai e de iudades o el ai e de los desie tos y las tierras áridas es como comparar las aguas que son podridas
y turbias con las limpias y puras. En la ciudad, a causa de la
altura de sus edificios, lo angosto de sus calles y de todo lo
ue se vie te desde sus ha ita tes y sus lí uidos…… el ai e se to a esta ado, espeso, u oso y e li oso…
Si el aire se altera alguna vez ligeramente, el estado del
Espíritu Psíquico se á alte ado pe epti le e te.
Maimónides (Rabi Mose Ben MAIMON)
médico sefardí cordobés, 1135-1204
Atmospheric pollution

ididæididididæaæ aaæ
RD, 102/2011, 28th January, for Air Quality & Protection of the Atmosphere:
At ospheric Pollutio : The occurrence in atmosphere of matter, substances or energy that may imply risk or damage for the safety or health of human beings, the environment……..
Atmospheric pollution
Bearing in mind:
• Not all harmful substances in atmosphere are already known
• For some components there is not a threshold for human protection
• Many activities and process (natural and anthropogenic) emit atmospheric pollutants

ididæididididæaæ aaæ The scales of the atmospheric pollution
Planetary-Global: Global warming and climate change Destruction of stratospheric ozone
Macro-meso scale: Transport and acidification Tropospheric ozone
Micro-scale: Urban air quality, local impact of industrial
emissions
Atmospheric pollution

ididæididididæaæ aaæ
Industrial processes, incineration
Chemical, metallurgical, petrochemical, mineral food, incineration
Fe, P, Al,
Si, Ca,..
Cu, Zn, Hg, V, Ni
F-, NH3, As, Pb, Cl-
Stationary sources
combustion
Power plants, heating, industry V, Ni (As, Se,..)
Various
Agriculture, fires, biomass combustion
NH3, K+
CO2, CO, HC, NOx, PM,
Corg+Celem, SO2
H+
Transport
Road, air, rail, fuel storage,………..
UF-PM, Sb,
Ba (Pb), Cl-
Biogenic, re-suspension, marine, lightening, volcanoes, fires
Natural emissions Cl-, Na+
Other: Harbor (shipping) emissions Air transport Construction-demolition Domestic and residential
EMISSION SOURCES AND TRACERS
Atmospheric pollution

ididæididididæaæ aaæ
Emission characteristics
Pollutant load
T and V of emission
High of emission
ATMOSPHERIC DIFUSION OR DISPERSION
Meteorological features
Atmospheric stratification, W-V, W-D, convection
Topographic and local effects
Marine and slope breeze, topographic obstacles
0
2 0
4 0
6 0
8 0
µg
/m3
S O 2 O 3 N O 2
00 12 00 12 00 12 00 12 00 12 00 12 00 12 00 12 00 12 00 12 00 12 00 12
January February March April May June July August September October November December
LLODIO
Atmospheric pollution

ididæididididæaæ aaæ EUROPEAN THEMATIC STRATEGY
Emissions levels
emission sources (natural, anthropogenic..)
primary pollutants (SO2, NOx, HC, PM,…
standards Control measures
1996-1999
minimization strategies
new standards
target levels
new standards
2005-2010
2013-2014 (2020)
Local and global effects Impact on receptors,
epidemiology
measuring (concentration and meteorology)
Levels in ambient air
meteorology, dispersion, transport,...
chemical transformation
(secondary pollutants: O3, PAN, HNO3, H2SO4)
Modelling and integrated assessment
Atmospheric pollution

ididæididididæaæ aaæ ENVIRONMENTAL STRANDARDS FOR AIR QUALITY
Directive 1999/30/EC SO2, NO2, NOx, PM10, Pb (PM2.5??)
Directive 2000/69/EC benzene, CO Directive 2002/03/EC O3
Directive 2004/107/EC PAH, Cd, As, Ni, Hg (PM2.5) Directive Clean Air for Europe and Air Quality, 2008/50/EC & 2004/107/EC
Deadlines: 2005-2010, 2015, 2020
MATHER DIRECTIVE 1996/62/CE
Emission
Ambient air
RD, 102/2011 (Spanish legisltaion)
IPPC Integrated Prevention and Pollution Control, substituted by the Industrial Emissions Directive (IED)
DIRECTIVES 1996/61/EC, 2008/1/EC, 2010/75/EC 2002/51/EC, 2006/120/EC 1998/69/EC, 2002/80/EC, 2007/715/EC 2001/80/CE 2001/81/CE 2014/??/CE
EURO standards for vehicles
Large Combustion Plants National Emission Ceilings Medium scale combustion plants
REVISION IN 2013 & 2014
REVISION OF AQ DIRECTIVE DELAYED UNTIL 2020 EVEN WHEN WHO (REVIHAAP+HRAPIE PROJECTS)
RECOMMENDED CHANGING PM2.5 AND SOME TARGET VALUES TO LIMIT VALUES
Atmospheric pollution

ididæididididæaæ aaæ
CRITICAL PARAMETRES (INFRINGEMENTS)
293 °K , 101,3 kPa,
Directive 2008/50/EC, RD 102/2011 except PM and metals, Evriron. Cond.
Hourly 350 µg/m3 SO2 24 times per year Daily 125 µg/m3 SO2 3 times per year Annual prot. ecos. 20 µg/m3 SO2 not exceeding annual and mean 1 Oct-31 Mar Hourly 200 µg/m3 NO2 8 times per year Annual 40 µg/m3 NO2 not exceeding Annual prot. vegetation 30 µg/m3 NOx (reported as NO2) not exceeding Annual 5 µg/m3 Benzene not exceeding Mean 8-h max. in a day 10 mg/m3 CO not exceeding Annual 500 ng/m3 Pb not exceeding Annual 40 µg/m3 PM10 not exceeding Daily 50 µg/m3 PM10 n<35 per year Annual (25 and 20 (18) µg/m3 PM2.5) not exceeding 2010-2020 (reducing 20% PM2.5 triennial for mean of urban background)
ENVIRONMENTAL STRANDARDS FOR AIR QUALITY
2004/107/EC, RD 102/2011
Annual 6 ng/m3 As not exceeding Annual 20 ng/m3 Ni not exceeding Annual 5 ng/m3 Cd not exceeding Annual 1 ng/m3 Benzo[]pirene not exceeding
Atmospheric pollution

ididæididididæaæ aaæ
AOT40 [expressed in (µg/m3·h] = as sum of the difference between hourly levels exceeding 80 µg/m3 and 80 µg/m3 along a given period using only hourly values measured between 8.00 and 20.00 h, Central Europe Time (CET), for every day.
Target value Protection human health Maximum of 8 h means of a day 120 µg/m3 O3 not exceeding 25 day/year mean for 3 years Target Value Protection of vegetation AOT40, hourly values from Mayo to July 18.000 µg/m3·h O3 not exceeding as a mean of 5 years (c) Information threshold value: hourly 180 µg/m3 O3
Alert threshold value : hourly 240 µg/m3 O3
High levels out of urban agglomerations or in external urban areas
ENVIRONMENTAL STRANDARDS FOR AIR QUALITY
Atmospheric pollution

ididæididididæaæ aaæ GUIDELINES WHO (2005 & 2006)
Atmospheric pollution
2008/50/EC WHO (2006) guide lines RD 102/2011 Hourly 350 µg/m3 SO2 -- 24 times per year Daily 125 µg/m3 SO2 -- 3 times per year Hourly 200 µg/m3 NO2 EC-WHO coincide 18 times per year Annual 40 µg/m3 NO2 EC-WHO coincide not exceeding Annual 5 µg/m3 C6H6 EC-WHO coincide not exceeding Mean 8-h max. in a day 10 mg/m3 CO EC-WHO coincide not exceeding Annual 500 ng/m3 Pb EC-WHO coincide not exceeding Annual 40 µg/m3 PM10 20 µg/m3 PM10 not exceeding Annual 25 µg/m3 PM2.5 10 µg/m3 PM2.5 not exceeding Max 8 h means of a day 120 µg/m3 O3 100 µg/m3 O3 not exceeding 25 day/year mean for 3 years BaP annual 1 ng/m3 BaP 0.12 ng/m3 BaP not exceeding

ididæididididæaæ aaæ
19/11/2014
NO2 annual limit value, 2012
The problem of NO 2

ididæididididæaæ aaæThe problem of NO2
Causas de superación del VLA de NO 2:promedio 2001-2009 (53 estaciones)
63%
29%
3% 2%2% 1%
Heavy traffic
Proximity to a major road
Local industry
Quarrying/mining
Domestic heating
Industrial accident
Non-industrial accident
Natural source
Winter sanding
African dust
Local petrol station
Parking facility
Benzene storage
Industry
0
10
20
30
40
50
60
70
80
90
100
FONERS
BARCELONA
CORNELL
A
STA PERPETU
A
L'HOSPIT
ALET
MONTC
ADA
STA COLO
MA
ST ANDREU
EL PRAT
BADALONA
BARCELONA
ST ADRIÀ
B.
BARCELONA
TERRASSA
MOLL
ET
SABADELL
BARCELONA
BARCELONA
BADALONA
NO
2 (
µg
/m3)
2005 2006 2007 2008 2009 2010CATALUNYA
Valor límite desde 2010
0
10
20
30
40
50
60
70
80
90
100
ALCOBENDAS
MADRID
GETAFE
MADRID
MADRID
COSLA
DA
MADRID
MADRID
MADRID
MADRID
ALCORCÓN
COSLA
DA
GETAFE
MADRID
NO
2 (
µg
/m3)
2005 2006 2007 2008 2009 2010COMUNIDAD DE MADRID
Valor límite desde 2010
0
10
20
30
40
50
60
70
80
90
100
CASTE
LLÓ
VALE
NCIA
VALE
NCIA
VALE
NCIA
VALE
NCIA
LEON
SALA
MANCA
SEGO
VIA
PALE
NCIA
SEVI
LLA
GRAN
ADA
GRAN
ADA
ZARAG
OZA
ZARAG
OZA
AVILES
OVI
EDO
LAS P
ALMAS
A CO
RUÑA
NO
2 (
µg/m
3)
2005 2006 2007 2008 2009 2010CC AA: VALENCIA, CASTILLA Y LEÓNANDALUCÍA, ARAGÓN, ASTURIAS, GALICIA
Valor límite desde 2010
•MADRID, COSLADA, GETAFE, LEGANÉS •BARCELONA, BARBERÀ DEL V., MARTORELL, MONTCADA I R., ST. ANDREU DE LA B., MOLLET DEL VALLÈS, ST ADRIÀ DE BESÒS, SABADELL, STA. COLOMA G., TERRASSA •PALMA DE MALLORCA •GRANADA, SEVILLA
2011
http://www.magrama.gob.es/es/calidad-y-evaluacion-ambiental/temas/atmosfera-y-calidad-del-aire/Informe_evaluaci%C3%B3n_calidad_aire_Espa%C3%B1a_2012_final_v2_tcm7-299046.pdf
2012: ZONAS CON SUPERACIÓN VALOR LÍMITE ANUAL
2013: ZONAS CON SUPERACIÓN VALOR LÍMITE ANUAL

ididæididididæaæ aaæ
• Dosimeter NO2 Palmes
• Molecular diffusion
• Absorbent = 20% TEA in H2O
• Analysis: colorimetry
Length 7.1 cm
Absorber at closed end
Open end for sampling
Length 7.1 cm
Absorber at closed end
Open end for sampling
The problem of NO2

Levels
NO2 MAY-JUNE 2008 (120 PASSIVE
DOSIMETRES)
The problem of NO2

ididæididididæaæ aaæ NO2, high spatial variability
The problem of NO2
Levels

ididæididididæaæ aaæ Fabra - Barceloneta
The problem of NO2 NO2 MAY-JUNE 2008 (120 PASSIVE DOSIMETRES)

ididæididididæ
aæaa
æW
hy so
high
NO
2 ?
The
pro
ble
m o
f NO
2
0 1 2 3 4 5 6
Barcelona
Madrid
València
Amsterdam
Belgrade
Berlin
Bern
Bologna
Budapest
Stockholm
Firenze
Frankfurt
Genoa
Hamburg
Helsinki
London2007
Luxemburg
Milan
Munich
Napoli
Oslo
Praha
Roma
Torino
Wien
Zurich
Cars x 1
00
0 / km
2
Ve
ry high
de
nsity o
f veh
icles (#/km2),
Bu
t also >5
0%
of ve
hicle
s circulatin
g in th
e city co
me
from
ou
tside
0
500
1000
1500
2000
2500
3000
Barcelona
Madrid
València
AmsterdamBelgrade
Berlin
BernBologna
Budapest
Stockholm
FirenzeFrankfurt
Genoa
Hamburg
HelsinkiLondon2007
Luxemburg
MilanMunich
Napoli
Oslo
PrahaRoma
Torino
Wien
Zurich
Cars x1
00
0

ididæididididæaæ aaæ Ámsterdam
Madrid
Barcelona
500m
El Problema de NO2
Napoli
Why so high NO2?
The problem of NO2

ididæididididæaæ aaæ El Problema de NO2 Why so high NO2?
The problem of NO2
ididæididididæaæ aaæ El Problema de NO2
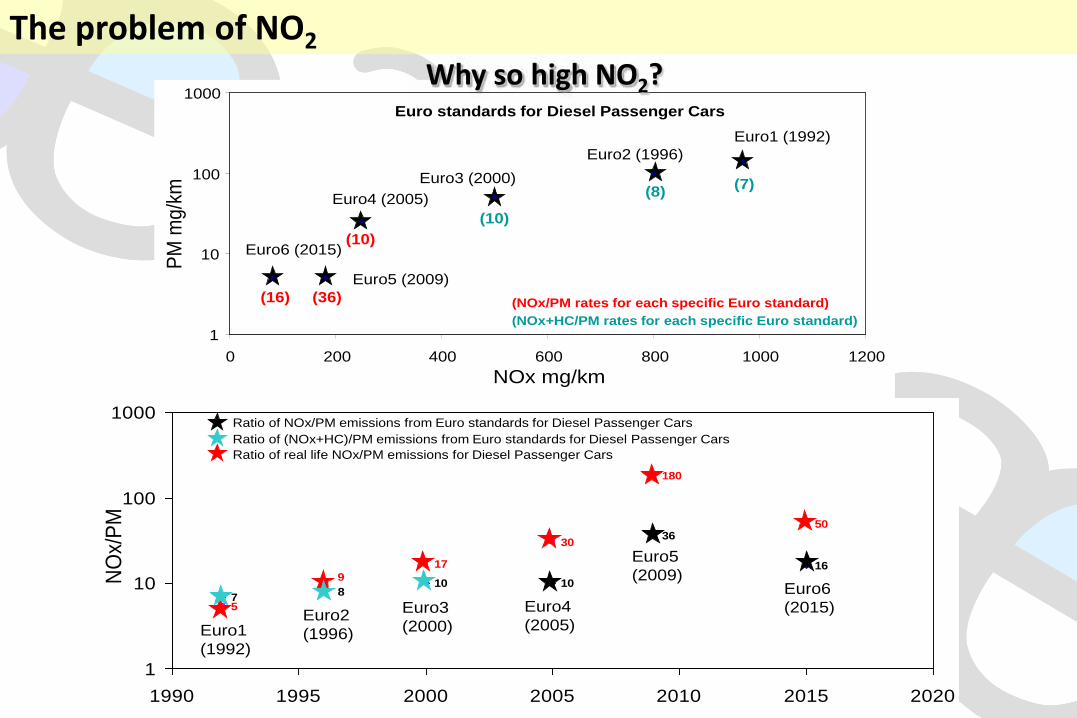
Euro4 (2005)
NOx mg/km
PM
mg/
km
Euro5 (2009)
Euro6 (2015)
Euro2 (1996)
Euro3 (2000)
Euro1 (1992)
(7)(8)
(10)(10)
(36)(16) (NOx/PM rates for each specific Euro standard)
Euro standards for Diesel Passenger Cars
(NOx+HC/PM rates for each specific Euro standard)1
10
100
1000
0 200 400 600 800 1000 1200
7 810 10
36
16
5
9
17
30
180
50
1
10
100
1000
1990 1995 2000 2005 2010 2015 2020
Euro4(2005)
Euro5(2009)
Euro6(2015)Euro2
(1996)
Euro3(2000)Euro1
(1992)
NO
x/P
M
Ratio of NOx/PM emissions from Euro standards for Diesel Passenger Cars
Ratio of real life NOx/PM emissions for Diesel Passenger Cars
98
Ratio of (NOx+HC)/PM emissions from Euro standards for Diesel Passenger Cars
Why so high NO2?
The problem of NO2

ididæididididæaæ aaæThe problem of NO2
0.0
0.2
0.4
0.6
0.8
1.0
1.2
1.4
1.6
EU 0 EU 1 EU 2 EU 3 EU 4 EU 5
NO
x [g
/km
]
NONO2
0.0
0.2
0.4
0.6
0.8
1.0
1.2
1.4
1.6
EU 0 EU 1 EU 2 EU 3 EU 4 EU 5
NO
x [g
/km
]
NONO2
Actual emissions: type approval vs. real world for PC Diesel NEDC Diesel CADC (hot start)
Courtesy: Prof. Dr. S. Hausberger T.U. Graz 0
0.05
0.1
0.15
0.2
0.25
1990 1995 2000 2005 2010 2015 2020
Year
Pass
enge
r car
s NO2
[g/km
]
0
0.5
1
1.5
2
2.5
HDV
NO2
[g/km
]
Passenger cars gasoline
Passenger cars diesel
HDV
NO2 Total effect of NOx and NO2 fleet emission reduction may not be sufficient to reach NO2 air quality targets near roads with high traffic volumes until 2015:
NO2 fleet emission factors in urban traffic (share in mileage for AUT)
NON TECHNOLOGICAL MEASURES ARE NEEDED
FOR URBAN AREAS: REDUCING THE NUMBER OF VEHICLES
(2015!!!!!!)
EU 6

Atmospheric particulate matter (PM): heterogeneous solid and/or liquid material present in suspension into the atmosphere
• Health impact • Ecosystems • Climate change • Building materials • Visibility
The problem of PM

ididæididididæaæ aaæ IPCC, 2013
+3.21
-0.69
The problem of PM

ididæididididæaæ aaæ
Shindell et al (2012) Science 315
The problem of PM

ididæididididæaæ aaæ
Impact on ecosystems
Slamba Poremba, Poland (C. Martin, The Environmental
Picture Library)
PM EFFECTS
The problem of PM

ididæididididæaæ aaæ
Weathering of building materials
The problem of PM
PM EFFECTS

ididæididididæaæ aaæ
26/03/00
26/02/00
VISIBILITY
The problem of PM
PM EFFECTS

ididæididididæaæ aaæ
1. Process of formation: Primary particles: directly emitted to the atmosphere as a solid Secondary particles: produced into the atmosphere from gaseous precursors example: SO2 (g) oxidation SO4
2- (s) 2. Origin: Natural particles Anthropogenic particles (human activities)
CLASSIFICATION OF ATMOSPHERIC PARTICLES
The problem of PM
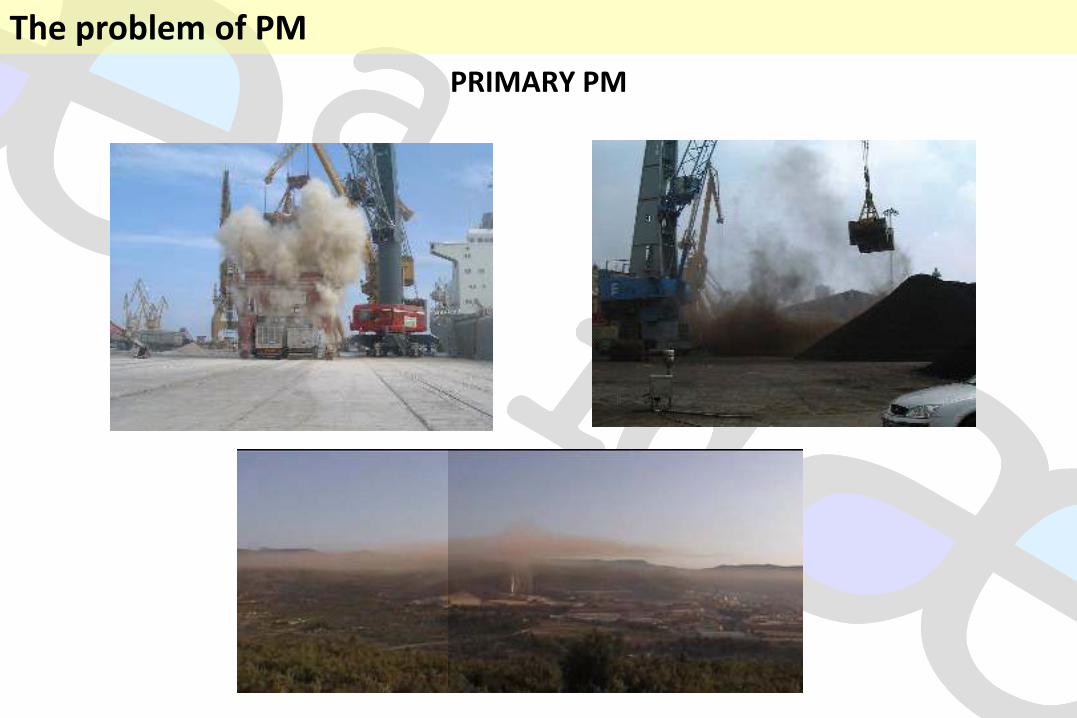
ididæididididæaæ aaæ PRIMARY PM
The problem of PM

ididæididididæaæ aaæ SECONDARY PM
The problem of PM

ididæididididæaæ aaæ FORMATION OF SECONDARY INORGANIC AEROSOLS
Process of oxidation SO2 H2SO4 and NOx HNO3
Homogeneous (gas to particle)
Heterogeneous (gas-H2O-particle)
Maximal velocities (summer, max hv): 6%SO2h-1, 18%NO2h-1 34%SO2day-1, 98%NO2day-1
Dry oxidation (homogeneous) Generation of oxidant radicals
O3+hν (solar) O* O*+H2O 2OH Oxidation
SO2+OH+m HOSO2+m HOSO2+O2 HO2+SO3
SO3+H2O H2SO4
NO+O3 NO2+O2 NO2+OH+m HNO3+m
Reaction
Wet oxidation (dissolution of gases, mainly SO2) (condensation nuclei, fog, precipitation, wet aerosol fil s Oxidants: H2O2 (pH<5), O3 (pH>5), O2 (catalysers, Cl, m) Oxidation
HCOH+hv (solar) H+HCO* HCO*+O2 HO2 + CO* (formaldehyde)
HO2 + HO2 H2O2+O2
2SO2 + 2H2O SO32-+HSO3
-+3H+
HSO3- + H2O2 HSO4
-+H2O
Maximal velocities (summer, max hv): 270%SO2h-1 (H2O2) 410%SO2h-1 (O3)
Nucleation
Condensation
The problem of PM
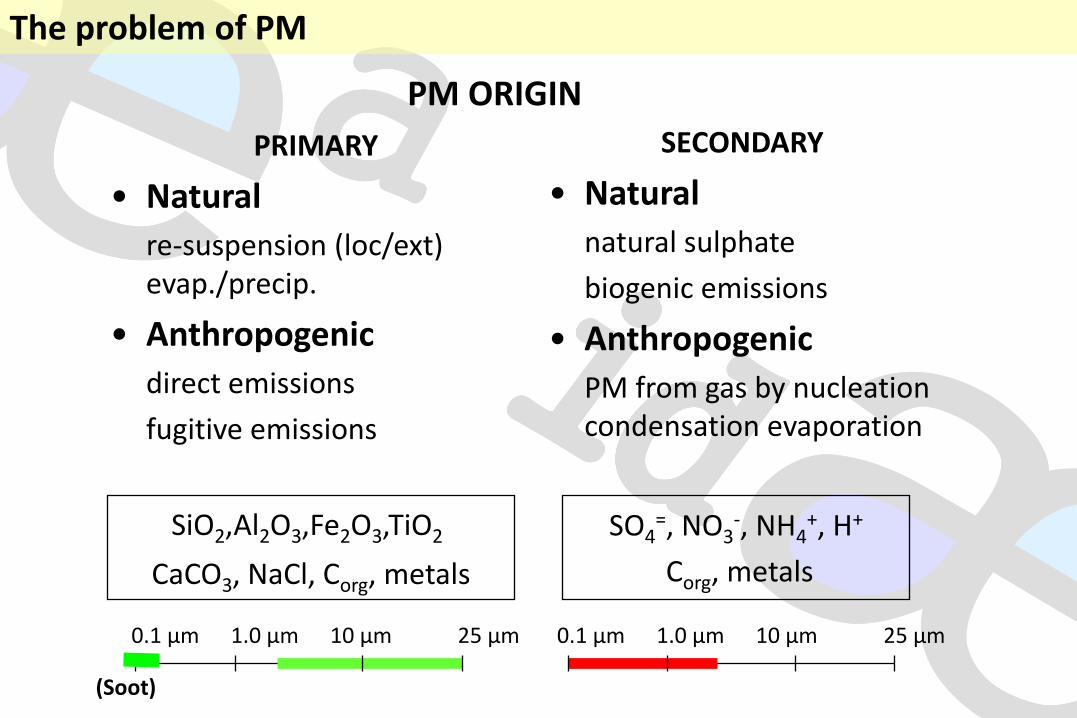
ididæididididæaæ aaæ
PRIMARY
• Natural
re-suspension (loc/ext)
evap./precip.
• Anthropogenic
direct emissions
fugitive emissions
SECONDARY
• Natural
natural sulphate
biogenic emissions
• Anthropogenic
PM from gas by nucleation
condensation evaporation
SO4=, NO3
-, NH4+, H+
Corg, metals
0.1 µm 1.0 µm 10 µm 25 µm
PM ORIGIN
SiO2,Al2O3,Fe2O3,TiO2
CaCO3, NaCl, Corg, metals
0.1 µm 1.0 µm 10 µm 25 µm
(Soot)
The problem of PM
ididæididididæaæ aaæThe problem of PM
Vo
lcanic +
Bio
gen
ic su
lfate,7
8
Bio
ge
nic S
OA
,
25
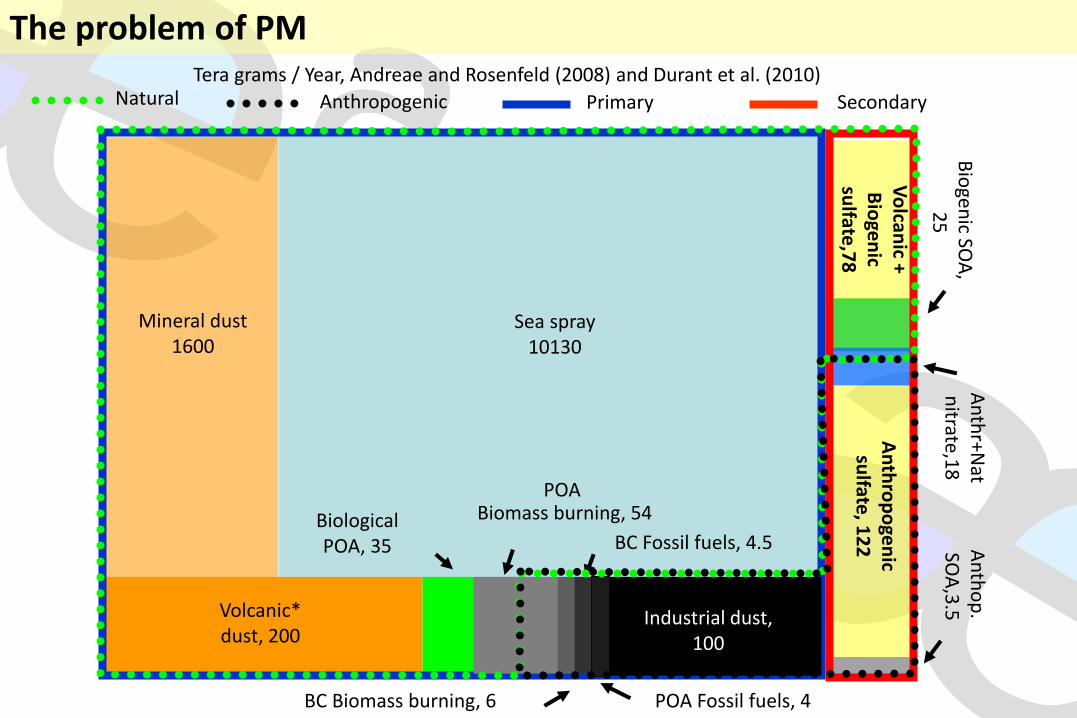
Tera grams / Year, Andreae and Rosenfeld (2008) and Durant et al. (2010)
Mineral dust
1600
Sea spray
10130
Primary A
nth
r+N
at
nitra
te,1
8
An
thro
po
gen
ic su
lfate, 1
22
An
tho
p.
SO
A,3
.5
Secondary
Volcanic*
dust, 200
Biological
POA, 35
BC Biomass burning, 6
POA Biomass burning, 54
POA Fossil fuels, 4
Industrial dust,
100
BC Fossil fuels, 4.5
Natural Anthropogenic

ididæididididæaæ aaæ
Secondary Inorganic aerosols
NH4+
SO42-
NO3-
Crustal-mineral
Al2O3
Mg
Ti
Fe
K
SiO2
CO32-
P
Ca
Sea spray
Na+
Cl-
SO42-
Carbonaceous aerosols (OM and EC)
Trace elements
As, Ba, Bi, Cd, Ce, Co, Cr, Cs, Cu,
Dy, Er, Ga, Gd, Ge, Hf, La, Li, Mn,
Mo, Nd, Ni, Pb, Pr, Rb, Sb, Sc, Se,
Sm, Sn, Sr, Ta, Th, Ti, Tl, U, V, W,
Yb, Zn, Zr
PM ORIGIN
The problem of PM
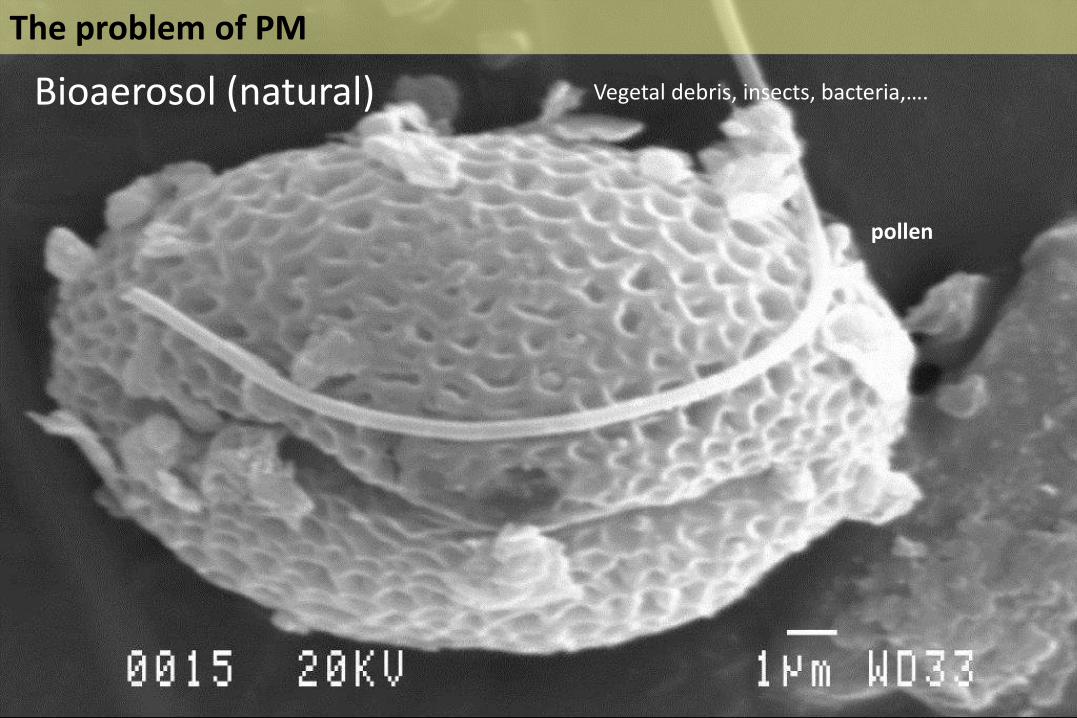
Bioaerosol (natural)
pollen
Vegetal de ris, inse ts, a teria,….
The problem of PM

Sea spray
NaCl
Sodium, potassium, magnesium chloride, sodium, magnesium sulphate ,
DMS
The problem of PM

ididæididididæaæ aaæ
TEM-EDX analysis
The problem of PM

ididæididididæaæ aaæ
Scale = 500nm
fly ash
glass Magnetite
The problem of PM
ididæididididæaæ aaæ
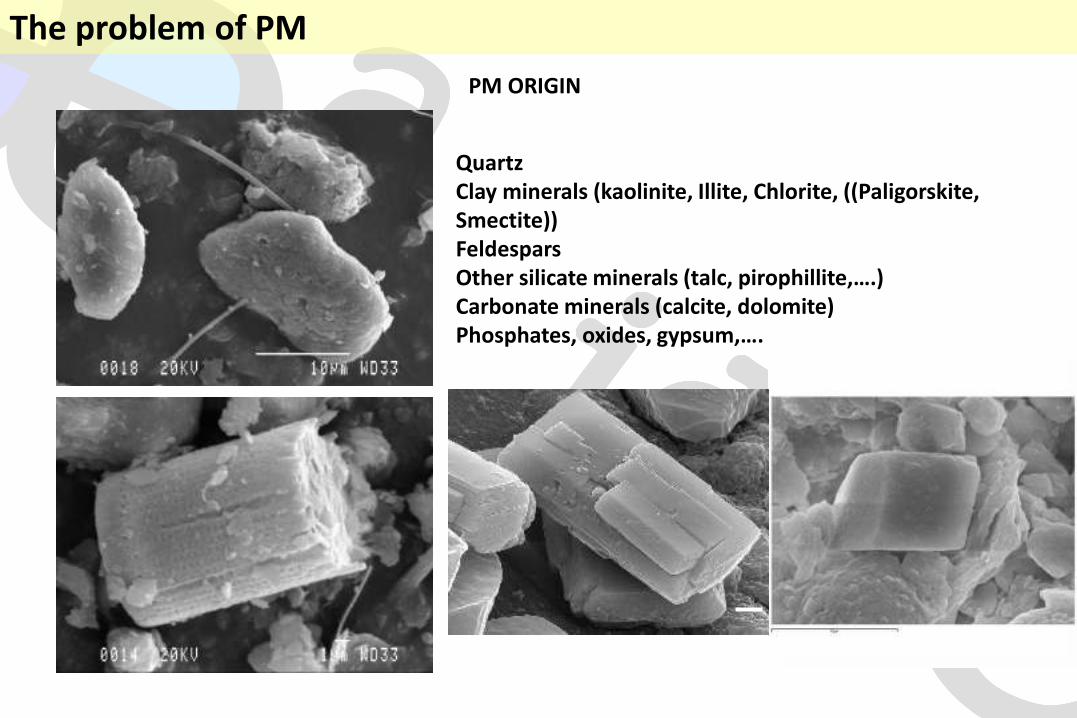
Quartz Clay minerals (kaolinite, Illite, Chlorite, ((Paligorskite, Smectite)) Feldespars Other silicate i erals talc, pirophillite,…. Carbonate minerals (calcite, dolomite) Phosphates, o ides, g psu ,….
PM ORIGIN
The problem of PM
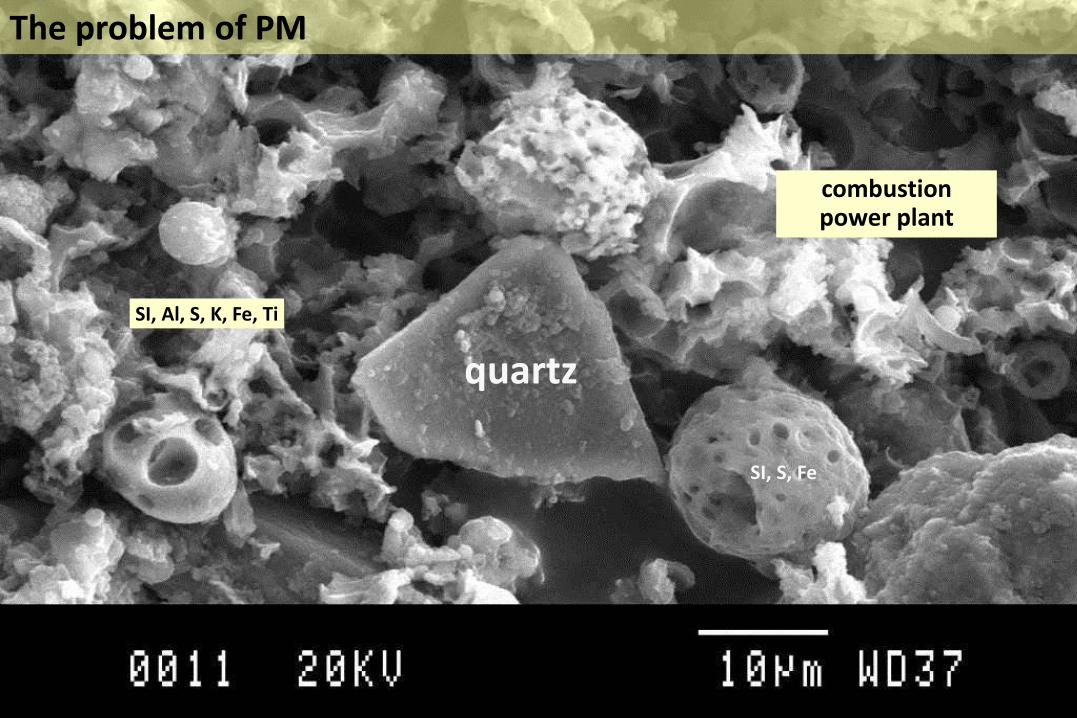
combustion power plant
SI, Al, S, K, Fe, Ti
quartz
SI, S, Fe
The problem of PM

Marine aerosols
Natural minerals
Bioaerosols + biogenic
Natural Background
x
x
x
x
x
x
x
x
NH4NO3
(NH4)2SO4
Long Range Transp.
x
x
Carbonaceous
NH4NO3
(NH4)2SO4
Carbonaceous (Soot, mainly road traffic)
Local emissions
Pavement, demolition, constr.
Carbonaceous (fuel-oil ash)
Heavy metals
Interaction among species
The problem of PM

ididæididididæaæ aaæ
19/11/2014
PM10 daily limit value 2012
The problem of PM

ididæididididæaæ aaæhttp://www.magrama.gob.es/es/calidad-y-evaluacion-ambiental/temas/atmosfera-y-calidad-del-aire/Informe_evaluaci%C3%B3n_calidad_aire_Espa%C3%B1a_2012_final_v2_tcm7-299046.pdf
Zonas con superaciones 2012 valor límite diario
2012: ZONAS CON SUPERACIÓN VALOR LÍMITE DIARIO 2012: ZONAS CON SUPERACIÓN VALOR LÍMITE ANUAL
2013: ZONAS CON SUPERACIÓN VALOR LÍMITE DIARIO
2013
2013: ZONAS CON SUPERACIÓN VALOR LÍMITE ANUAL
The problem of PM

ididæididididæaæ aaæ BaP valor objetivo anual, 2012
19/11/2014
The problem of Benzo-α-pierene

ididæididididæaæ aaæ
Resultados medidas de BaP 2013
Resultados medidas de BaP 2012
The problem of Benzo-α-pierene

ididæididididæaæ aaæ
0
2
4
6
8
10
12
14
16
02/06/2008 02/06/2009 02/06/2010 02/06/2011 02/06/2012 02/06/2013 02/06/2014
ng/m
3
benzo[a]pireno MANLLEU
The problem of Benzo-α-pierene

ididæididididæaæ aaæ
19/11/2014
EMISSIONS EU-28, 2012 The problem of Benzo-α-pierene
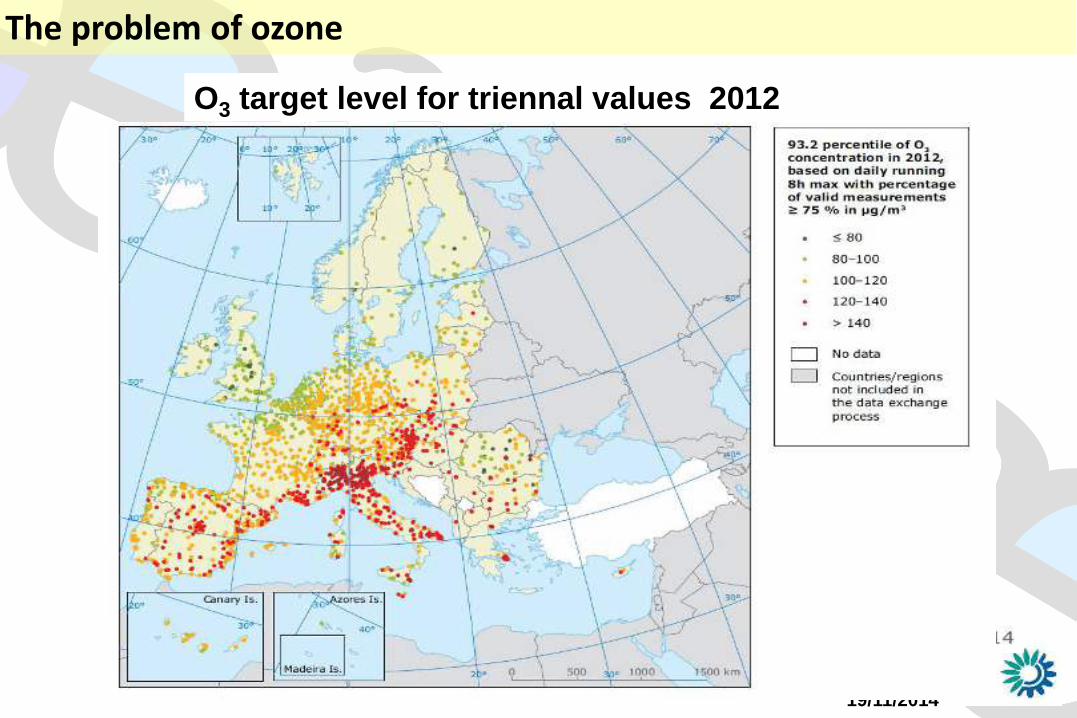
ididæididididæaæ aaæThe problem of ozone
19/11/2014
O3 target level for triennal values 2012

ididæididididæaæ aaæThe problem of ozone

ididæididididæaæ aaæO3
The problem of ozone
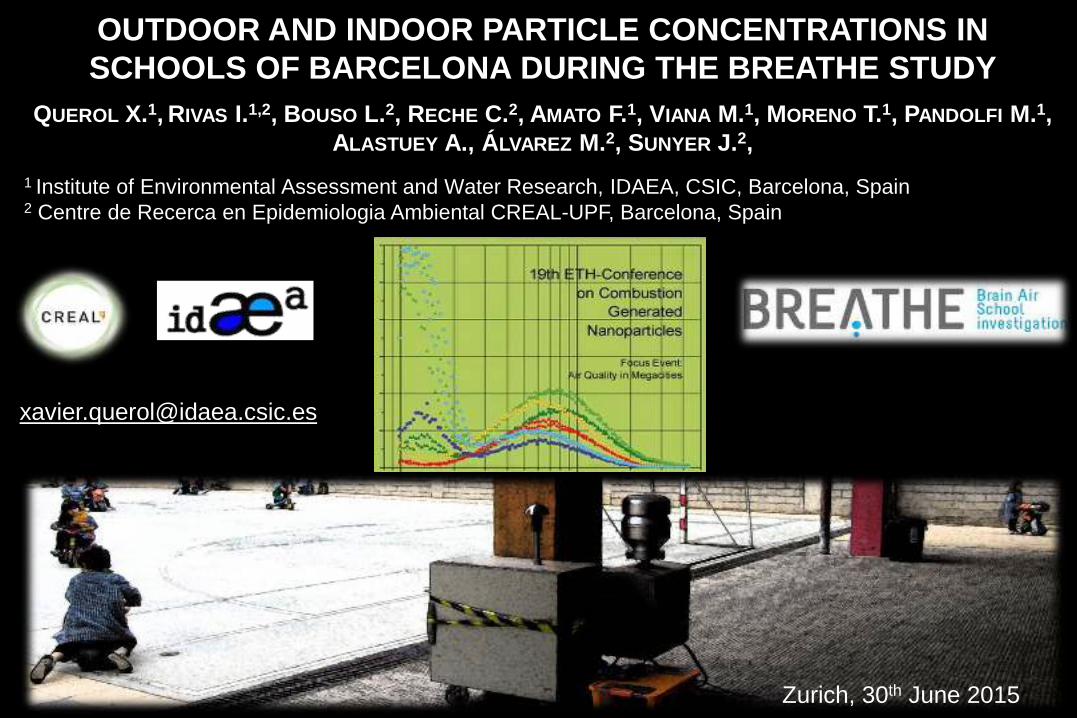
OUTDOOR AND INDOOR PARTICLE CONCENTRATIONS IN SCHOOLS OF BARCELONA DURING THE BREATHE STUDY
QUEROL X.1, RIVAS I.1,2, BOUSO L.2, RECHE C.2, AMATO F.1, VIANA M.1, MORENO T.1, PANDOLFI M.1, ALASTUEY A., ÁLVAREZ M.2, SUNYER J.2,
1 Institute of Environmental Assessment and Water Research, IDAEA, CSIC, Barcelona, Spain 2 Centre de Recerca en Epidemiologia Ambiental CREAL-UPF, Barcelona, Spain
Zurich, 30th June 2015

Objectives of BREATHE
Exposure to air pollution at school
PLoS Med. 2015;12(3):e1001792
Dashed line = high traffic air pollution Continuous line = low traffic air pollution Gray shading = 95% CIs
ERC-Advanced Grant, PI: Jordi Sunyer CREAL

OBJECTIUS
• Characterizing children exposure to urban air pollutants in schools
• Identification and quantification of the main sources of these pollutants affecting
indoor and outdoor environments
• Defining factors affecting PM (including UFP) levels and composition in both
indoor and outdoor environments: road traffic emissions, ventilation and type of
playground
• Characterize children’s daily BC exposure and sources
Objectives on ambient air & exposure
ERC-Advanced Grant , Leader of the exposure studies: Xavier Querol, IDAEA-CSIC

• Two simultaneous schools & a urban
background reference station of
Palau Reial (UB)
• Simultaneously in indoor and outdoor
school environments
• Sampling in teaching hours (9 to 17h),
from Monday to Thursday
• 2 campaigns at each school:
- 1 week/school in winter-spring
- 1 week/school in fall-winter
Monitoring sites
Measurement periods 1. February to June 2012 2. September 2012 to February 2013
Metodology: Measurements
36 schools in Barcelona
3 schools in Sant Cugat

SCHOOLS
DUSTTRAK DRX
HIGH-VOLUME SAMPLERS
MICROAETH® AE51
MINIDISC
GRADKO NO2 TUBES
GRIMM
HIGH-VOLUME
SAMPLERS
MAAP
WCPC
NSAM
GRADKO NO2 TUBES
PM2.5
PM2.5 COMPONENTS
BC
N
SIZE
LDSA
NO2
Metodology: Measurements & sampling
UB REFERENCE SITE

H2O leaching
Ion Chromat.:
NO3-, Cl-, SO4
=
Colorimetry FIA and ICP-AES:
NH4+, K+, Ca2+,
Mg2+,…
Acidic digestion (HF:HNO3:HClO4)
ICP-AES:
Al, Ca, K, Na,
Mg, Fe, Ti, P
ICP-MS:
Li, Ti, V, Cr, Co,
Ni, Cu, Zn, As, Se,
Rb, Sr, Y, Zr, Cd,
Sn, Cs, Ba, La, Ce,
Pr, Nd, Hf, Tl, Pb,
Bi, Th, U
OC, EC
Mass determined: 75-85% PM2.5
Metodology: Chemical analysis
Rivas I., et al ., 2014. Child exposure to indoor and outdoor air pollutants in schools. Env ironment International 69, 200 –212.

Results: Mean levels
NO2 outdoor levels for the rest of schools in Barcelona = 50 µg·m-3
• High levels of PM 2.5 in schools Local (school ) emission of PM 2.5
• Mean levels of pollutants are intermediate between traffic and urban
background sites
INDOOR OUTDOOR UB REF. STATION
Mean SD Mean SD Mean SD
NO2
(µg·m-3) 30 13 47 19 41 20
PM2.5 (µg·m-3)
37 16 29 24 17 8
N (pt·cm-3)
15625 6673 23614 9514 14665 6034
EBC (µg·m-3)
1.3 0.9 1.4 1.1 1.3 0.8

Results: PM2.5 source apportionment

Mineral sources
Results: PM2.5 source apportionment
PM2.5 (µg/m3) Paved playground
Unpaved playground
Reference site 0.6
Schools (outdoor) 2.5 16.0
Schools (indoor) 3.6 9.1
Indoor
resuspension
Increases indoors
PM2.5 by
5-6 µg/m3
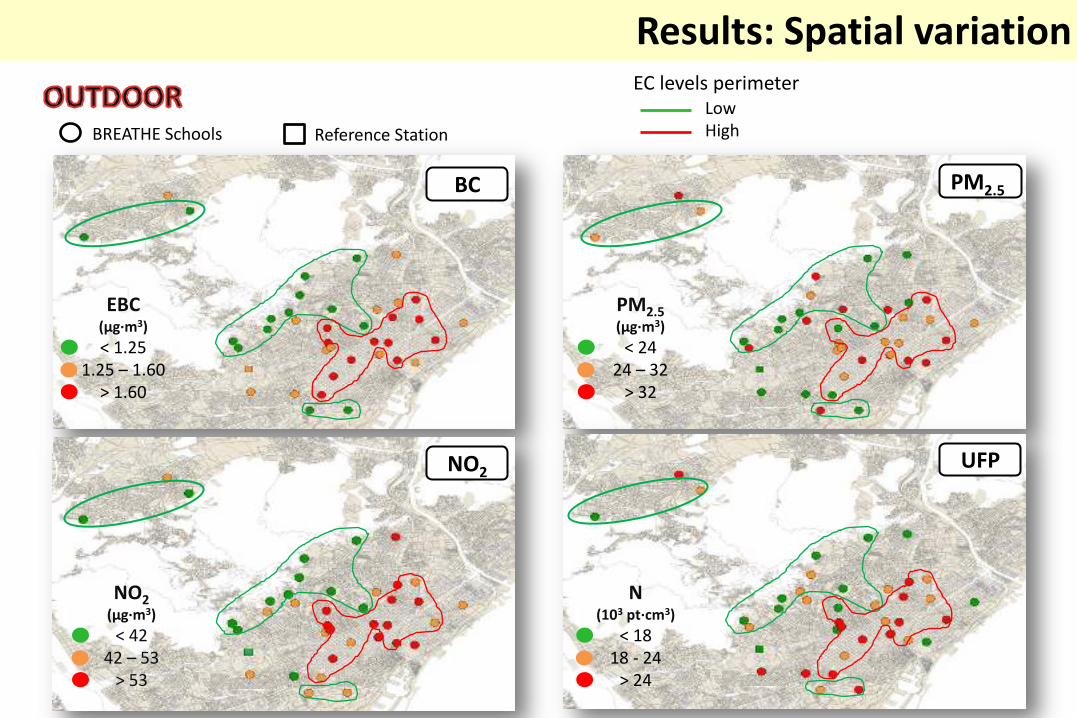
Reference Station BREATHE Schools
EC levels perimeter
Low
High
Results: Spatial variation
PM2.5 BC
NO2 UFP
EBC (µg·m3)
< 1.25
1.25 – 1.60
> 1.60
PM2.5 (µg·m3)
< 24
24 – 32
> 32
NO2 (µg·m3)
< 42
42 – 53
> 53
N (103 pt·cm3)
< 18
18 - 24
> 24

Estació referència Escoles BREATHE
EC levels perimeter
Low
High
Results: Spatial variation
EBC (µg·m3)
< 1.15
1.15 – 1.55
> 1.55
PM2.5 (µg·m3)
< 34
34 – 50
> 50
NO2 (µg·m3)
< 22
22 – 34
> 34
N (103 pt·cm3)
< 13
13 - 18
> 18
PM2.5 BC
NO2 UFP

PERSONAL EXPOSURE TO EBC
- EBC median concentration is higher in
personal monitoring than in the fixed
station (school indoor, school outdoor,
urban background)
classroom playground other commuting home
020
0040
0060
0080
0010
000
EBC from personal monitoring by children location
EB
C (n
g/m
3)
010
0020
0030
00
EBC concentrations
classroom school playground UB personal
EB
C (n
g/m
3)
- Highest EBC median concentrations
found during commuting
Results: Levels of BC Childre s exposure

Results: Levels of BC
1
2
3
4
5
6
7
8
9
10
11
12
13
14
15
16
17
18
19
2022
23
24
25
26
27
28
29
30
31
3233
3435
36
37
38
39
40
4575000
4580000
4585000
4590000
420000 425000 430000 435000long
lat
500
1000
1500
2000
2500
200
400
600
800
1000
1200
1000
1500
2000
2500
3000
3500
200
400
600
800
1000
1200
1000
2000
3000
4000
2000
3000
4000
5000
6000
500
1000
1500
2000
2500
1000
2000
3000
500
1000
1500
500
1000
1500
2000
2500
3000
1000
2000
3000
4000
5000
1000
2000
3000
4000
5000
6000
500
1000
1500
2000
1000
2000
3000
4000
0
500
1000
1500
2000
2500
0 6 12 18 23
1000
2000
3000
4000
5000
500
1000
1500
200
400
600
800
1000
1200
1400
200
400
600
800
1000
1200
1000
1500
2000
500
1000
1500
2000
2500
x
y
40
39
38
1
4 35
7
815
11
14
3 25
5
28
9 23
1327
18
2
31
34
26
12
3632
37
19
29
33
17
10
20
2224
30
500
1000
1500
1000
2000
3000
4000
5000
6000
16
6
Daily cyles from 0 to 23h
EBC Indoor
EBC Outdoor

5000
10000
15000
20000
25000
30000
10000
20000
30000
40000
50000
5000
10000
15000
20000
5000
10000
15000
10000
20000
30000
0 6 12 18 23
10000
20000
30000
10000
20000
30000
40000
0 6 12 18 23
10000
20000
30000
40000
10000
20000
30000
40000
0 6 12 18 2310000
20000
30000
40000
0 6 12 18 23
10000
20000
30000
40000
0 6 12 18 23
10000
20000
30000
40000
0
50000
100000
150000
200000
5000
10000
15000
20000
10000
20000
30000
40000
50000
60000
5000
10000
15000
20000
25000
30000
35000
10000
20000
30000
40000
0 6 12 18 23
5000
10000
15000
20000
5000
10000
15000
20000
10000
15000
20000
25000
30000
35000
5000
10000
15000
20000
25000
30000
35000
10000
20000
30000
40000
6000
8000
10000
12000
14000
16000
18000
4
4
4
4
5000
10000
15000
20000
25000
10000
20000
30000
40000
50000
10000
20000
30000
40000
50000
0 6 12 18 23
5000
10000
15000
20000
10000
20000
30000
40000
Daily cyles from 0 to 23h
Particles/cm3 Indoor
Particles/cm3 Outdoor when outdoor
temperature <20ºC
Particles/cm3 Outdoor when outdoor
temperature >20ºC
Results: Levels of ultrafine particles

0
500
1000
1500
2000
2500
3000
0 2 4 6 8 10 12 14 16 18 20 22
EBC
(µgm
-3)
Hour (lLocal Time)
Outdoor-Schools Indoor-Schools
Start of
school
hours
End of
school
hours
Results: Levels of BC & ultrafine paticles
EBC (µg/m3)
INDOOR
500
1000
1500
2000
500
1000
1500
2000
2500
35%
35%
High traffic
Lowtraffic
Particles/cm3
R2=0.52
Particles/cm3 Outdoor
Pa
rtic
les/
cm3 I
nd
oo
r
1500
020
000
2500
030
000
3500
0
15000
35000
40%
40%
10000
30000
High traffic
Lowtraffic
OUTDOOR
0 500 1000 1500 2000 2500
0
500
1000
1500
2000
2500
3000
510
1520
25
R2=0.75
EBC Outdoor
EB
C I
nd
oo
r

.0
.5
.0
.5
0 20 40 60
1.0
1.5
2.0
2.5
10 20 30 40
R2=0.61 R2=0.32
EB
C (
µg
m-3
)
Percentage of area used for the
road network
Percentage of area used for parks
Results: Levels of BC & ultrafine patyicles
y = 584.1x + 6913.7R² = 0.3082
0
5000
10000
15000
20000
25000
30000
35000
40000
45000
0 5 10 15 20 25 30 35 40 45
Ou
tdo
or
N b
y d
istr
ict
(#cm
-3)
Percentage of roads by district (%)
y = -267.34x + 28128R² = 0.3393
0
5000
10000
15000
20000
25000
30000
35000
40000
45000
0 10 20 30 40 50 60 70 80
Ou
tdo
or
N b
y d
istr
ict
(#cm
-3)
Percentage of green areas by district (%)
Correlation between average EBC levels and ultrafine particle concentrations at different districts of the city of Barcelona and
the percentage of surface area used for the road network and for parks

Closed windows Opened windows
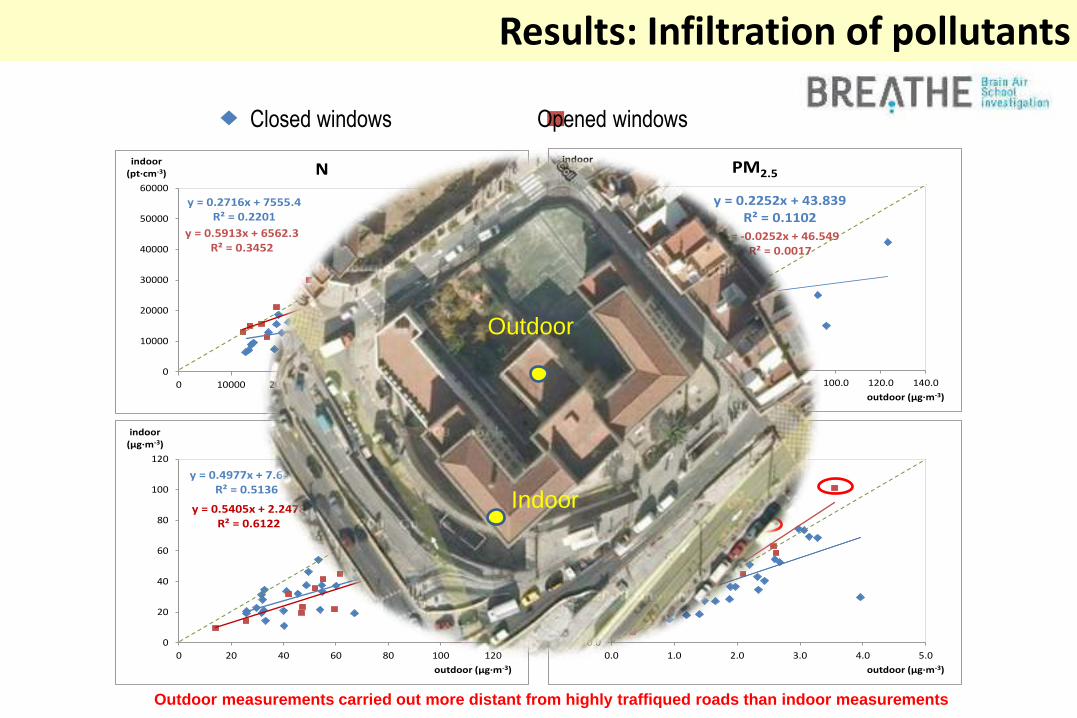
Results: Infiltration of pollutants
y = 0.0489x + 17.26R² = 0.0022
y = -0.0142x + 14.093R² = 0.0001
0
5
10
15
20
25
30
35
0 5 10 15 20 25 30 35
indoor (µg·m-3)
outdoor (µg·m-3)
OC
y = 0.2543x + 8.2251R² = 0.1992
y = 0.0858x + 8.1893R² = 0.0265
0
10
20
30
40
50
60
0 10 20 30 40 50 60
indoor (µg·m-3)
outdoor (µg·m-3)
Mineral (sandy playgrounds)
Closed windows Opened windows
y = 0.4977x + 7.6411R² = 0.5136
y = 0.5405x + 2.2478R² = 0.6122
0
20
40
60
80
100
120
0 20 40 60 80 100 120
indoor (µg·m-3)
outdoor (µg·m-3)
NO2
y = 0.5761x + 0.5922R² = 0.3949
y = 1.1187x - 0.1451R² = 0.9548
0.0
0.5
1.0
1.5
2.0
2.5
3.0
3.5
4.0
4.5
5.0
0.0 1.0 2.0 3.0 4.0 5.0
indoor (µg·m-3)
outdoor (µg·m-3)
EC
y = 0.2716x + 7555.4R² = 0.2201
y = 0.5913x + 6562.3R² = 0.3452
0
10000
20000
30000
40000
50000
60000
0 10000 20000 30000 40000 50000 60000
indoor (pt·cm-3)
outdoor (pt·cm-3)
N
y = 0.2252x + 43.839R² = 0.1102
y = -0.0252x + 46.549R² = 0.0017
0
20
40
60
80
100
120
140
0.0 20.0 40.0 60.0 80.0 100.0 120.0 140.0
indoor (µg·m-3)
outdoor (µg·m-3)
PM2.5
Outdoor measurements carried out more distant from highly traffiqued roads than indoor measurements
Indoor
Outdoor
Results: Infiltration of pollutants

0
20000
40000
60000
80000
100000
120000
140000
160000
180000
200000
3/2/12 4/2/12 5/2/12 6/2/12 7/2/12 8/2/12 9/2/12 10/2/12 11/2/12
N/c
m3
ID 19
0
10000
20000
30000
40000
50000
60000
70000
80000
90000
3/2/12 4/2/12 5/2/12 6/2/12 7/2/12 8/2/12 9/2/12 10/2/12 11/2/12
N/c
m3 ID 32
Indoor
Outdoor
Mon
Opening
Cleaning
Pollutants infiltration: 2 opposite cases
Results: Infiltration of pollutants

• Schools in Barcelona have high levels of pollutants because most of them are very close to highly traffic streets. Outdoor levels are intermediate between those from traffic and urban background air quality monitoring sites
• PM2.5 is an exception, the influence of sand playgrounds as well as indoor organic
emissions from clothes and skin of children accounts for higher PM2.5 levels than in traffic sites
• BC levels are governed by traffic, with 35% higher levels in high traffic schools • UFP increase also by 40% as a mean in high traffic schools, but in most of the schools
photochemically generated secondary UFPs highly contribute at midday when BC is at the lowest. We are currently investigating health effects of primary and secondary UFP
• In spite of this secondary generation of UFP, both UFP and BC show and inverse
correlation with green areas and a direct correlation with 5 of area used by traffic
Conclusions
