wyoming water research program annual technical … report consists of objectives, methods and...
TRANSCRIPT

Wyoming Water Research Program Annual Technical Report
FY 2005
IntroductionThe NIWR/State of Wyoming Water Research Program (WRP) coordinates participation in the NIWRprogram through the University of Wyoming, Office of Water Programs. The primary purposes of theWRP are to support and coordinate research relative to important water resources problems of the Stateand Region, support the training of scientists in relevant water resource fields, and promote thedissemination and application of the results of water-related research. In addition to administrating theWRP, the Director of the Office of Water Programs serves as the University of Wyoming advisor to theWyoming Water Development Commission.
State support for the research program includes direct funding through the Wyoming Water DevelopmentCommission and active State participation in identifying research needs and project selection andoversight. Primary participants in the WRP are the USGS, the Wyoming Water Development Commission(WWDC), and the University of Wyoming. A Priority and Selection Committee (P&SCommittee)--consisting of representatives from agencies involved in water related activities in theState--solicits and identifies research needs, selects projects, and reviews and monitors progress. TheDirector of the Office of Water Programs serves as a point of coordination for all activities and serves toencourage research by the University of Wyoming addressing the needs identified by the P&S Committee.The State also provides direct funding (from the WWDC accounts) for the administration of the WRPthrough the Office of Water Programs, which was approved by the 2002 Wyoming Legislature.
The WRP supports faculty and students in University of Wyoming academic departments. Faculty acquiretheir funding through competitive, peer reviewed grants, submitted to the WRP. Since its inception in theyear 2000, the WRP has funded a wide array of water related projects across academic departments. Eachproject represents the education of one or more students.
Research ProgramThe primary purpose of the Wyoming Institute beginning with FY00 has been to identify and supportwater-related research and education under what has been entitled the Wyoming Water Research Program(WRP). The WRP supports research and education by existing academic departments rather thanperforming research in-house. Faculty acquire funding through competitive, peer reviewed proposals. Agoal of the WRP is to minimize administrative overhead while maximizing the funding allocated towardresearch and education. Another goal of the program is to promote coordination between the University,State, and Federal agency personnel. The WRP provides interaction from all the groups involved ratherthan being solely a University of Wyoming research program.
In conjunction with the WRP, an Office of Water Programs was established by Legislative actionbeginning July 2002. The duties of the Office, which provides for the administration of the WyomingInstitute, are specified by the legislation as: (1) to work directly with the director of the Wyoming water

development office to identify research needs of state and federal agencies regarding Wyomings waterresources, including funding under the National Institutes of Water Resources (NIWR), (2) to serve as apoint of coordination for and to encourage research activities by the University of Wyoming to addressresearch needs, and (3) to submit a report annually prior to each legislative session to the Select WaterCommittee and the Wyoming Water Development Commission on the activities of the office.
The Wyoming Water Research Program (WRP) is a cooperative Federal, State, and University effort. Allactivities reported herein are in response to the NIWR program, with matching funds provided by theWyoming Water Development Commission and the University of Wyoming. While the WRP is physicallyhoused in the Civil and Architectural Engineering Department, the Director reports to the Vice Presidentof Research. A State Advisory Committee (entitled the Priority and Selection Committee) serves toidentify research priorities and select projects for funding. The Director coordinates all activities.

Geochemistry of CBM Retention Ponds Across the PowderRiver Basin, Wyoming
Basic Information
Title: Geochemistry of CBM Retention Ponds Across the Powder River Basin, Wyoming
Project Number: 2003WY10B
Start Date: 3/1/2003
End Date: 2/28/2006
Funding Source: 104B
Congressional District: 1
Research Category: Water Quality
Focus Category: Geochemical Processes, Groundwater, Surface Water
Descriptors: None
Principal Investigators: Katta J Reddy, David E Legg, Richard A Olson
Publication1. Jackson, R.E., K.J. Reddy, R.E. Olson, and D.E. Legg, 2004. Geochemistry of coalbed methane
disposal ponds across the Powder River Basin, Wyoming. In Proceedings of Society of RangeManagement 2004 Annual Meetings, Salt Lake City, Utah.
2. Jackson, R.E., K.J. Reddy, R.A. Olson, and D.E. Legg, 2005. Geochemistry of Coalbed Natural GasProduct Water across Five Wyoming Watersheds. In Proceedings of Soil Science Society of America69th Annual Meetings. Salt Lake City, Utah.

Abstract The Wyoming Water Research Program (2003) funded a project to study geochemical changes of coalbed natural gas (CBNG) disposal pond waters across the Powder River Basin (PRB) in collaboration with the US Geological Survey and the Wyoming Water Development Commission. Objectives of this research were to monitor the geochemical changes and water quality of CBNG disposal ponds in Tongue River Basin (TRB), Powder River Basin (PRB), Little Powder River Basin (LPRB), Belle Fourche River Basin (BFRB), and Cheyenne River Basin (CRB) over a period of 3 years. This report summarizes final results of the project from March 2003 to August 2005. The CBNG product water samples from discharge points and corresponding disposal ponds were collected during the summer months of 2003, 2004, and 2005. In addition, sediment, macroinvertebrate, and plant community composition samples were collected from the CBNG disposal ponds. Water samples were analyzed for pH, dissolved oxygen (DO), electrical conductivity (EC), major cations (e.g., Ca, Mg, Na, and K), major anions (e.g., alkalinity, sulfate, chloride, fluoride, nitrate, and phosphate), and trace elements (e.g., Al, As, Ba, B, Fe, Cd, Cu, Cr, Mn, Mo, Se, Pb, and Zn). Sodium adsorption ratio (SAR) was calculated from the measurements of Ca, Mg, and Na. Results identify how quality of CBNG discharge and disposal pond waters change, predominantly salt concentration, SAR, and trace metals as a function of watershed physical and chemical characteristics. CBNG pond sediment fractionation analysis for 2003, 2004, and 2005 indicate Fe is primarily bound in Fe/Mn oxide sediment fraction, Ba is in exchangeable and carbonate bound fraction, As is Fe/Mn oxide but increasing in exchangeable fraction between years, and Se is in organic fraction. Macroinvertebrates were more abundant and have higher taxa richness in CHR, BFR, and LPR watersheds than in PR and TR watersheds. Similarly, there were more vegetation species encountered in and around ponds in CHR, BFR, and LPR watersheds than in PR and TR watersheds. Water quality data of CBNG produced water obtained over three year period was summarized and disseminated to participating local landowners. Results of this research help water users (landowners, agriculture and livestock producers, and ranchers) and water managers (state, federal, and local agencies) with the planning and management of CBNG product water across five major watersheds of the Powder River Basin. Statement of Critical Regional or State Water Problems Demand for natural gas (methane) is increasing within the United States because of the energy shortage. Further, methane is a clean form of burning fossil fuel. Several states within the United States (e.g., Wyoming, Colorado, Montana, New Mexico, and Utah) are exploring methane extraction from their coal resources. As an example, in the Powder River Basin (PRB) of Wyoming, it is estimated that there are 31.7 trillion cubic feet of recoverable CBM (coalbed methane). Currently, the CBM development in this basin is occurring at a rapid pace as demand for natural gas has increased in the United States (DeBruin et al., 2000). Methane is formed deep in confined coalbed aquifers through biogeophysical processes and remains trapped by water pressure. Recovery of the methane is facilitated by pumping water from the aquifer (product water). It is estimated that a single CBNG well in the Powder River Basin may produce from 8 to 80 L of product water per minute, but this amount varies with aquifer that is being pumped and the density of the wells. At present, more than 16,000 wells are under production in the PRB and this number is expected to increase to at least 30,000. Based on information provided by the Wyoming Geological Survey, approximately 2 trillion L of product water will eventually be produced from CBNG extraction in Wyoming. Commonly 2 to 10 CBNG extraction wells are placed together in a manifold system discharging to a single point and releasing into constructed unlined disposal ponds. These disposal ponds are constructed with initial well pumping. The Wyoming DEQ considers this water as surface water of the state with Class 4C designation. Various metals such as Fe, Ba, As, and Se in the CBNG pond waters are expected to go through several geochemical processes including desorption and dissolution, ion complexation (speciation), and adsorption and precipitation. These processes in turn control the quality of product water in disposal ponds as well as the water that is infiltrating into the shallow ground water. Very little information is available on the geochemistry of CBNG product water and associated disposal ponds in the Powder River Basin (Rice et al., 1999; McBeth et al., 2003a and b). The studies conducted by Rice et al. (1999) only examined the chemistry of CBNG discharge water at wellhead. McBeth et al. (2003a and b) studies examined the chemistry changes of product water both at wellhead and in disposal ponds of the Powder River Basin. However, to our knowledge no studies involved

the monitoring of the geochemical processes that product water undergoes in disposal ponds across the Powder River Basin. The CBNG product water discharged to the surface is managed and regulated by several state and federal agencies. To effectively manage this water resource there is a need to understand the geochemical changes that occur in CBNG disposal ponds over time. This final report outlines results accomplished from data collected from March 2003 to August 2005. This report consists of objectives, methods and procedures, site selection, sample collection and analysis, results, clientele network, presentations, and student education and training. Objectives The overall objectives of this research are to: 1. Collect, analyze, and monitor pH, DO, EC, DOC, major cations (e.g., Ca, Mg, Na, and K), major anions
(e.g., alkalinity, SO42-,Cl-,F-,NO3
-, and PO42-), and trace elements (e.g., Al, As, Ba, B, Fe, Cd, Cu, Cr,
Mn, Mo, Se, Pb, and Zn) from produced water samples at discharge points and disposal ponds over a period of 3 years (2003, 2004, 2005);
2. Identify statistical differences of produced water test parameters between discharge points and associated ponds;
3. Identify statistical differences of produced water test parameters between watersheds of a particular water type (wells and ponds);
4. Predict geochemical changes (speciation, adsorption, and precipitation) for critical metals such as Fe, Ba, As, and Se in the disposal pond from produced water and associated disposal pond sediment;
5. Identify trends in major cation, major anion, and trace element concentrations of produced water at discharge points and associated ponds;
6. Compile a list of aquatic macroinvertebrate and wetland plant species associated with disposal ponds; and
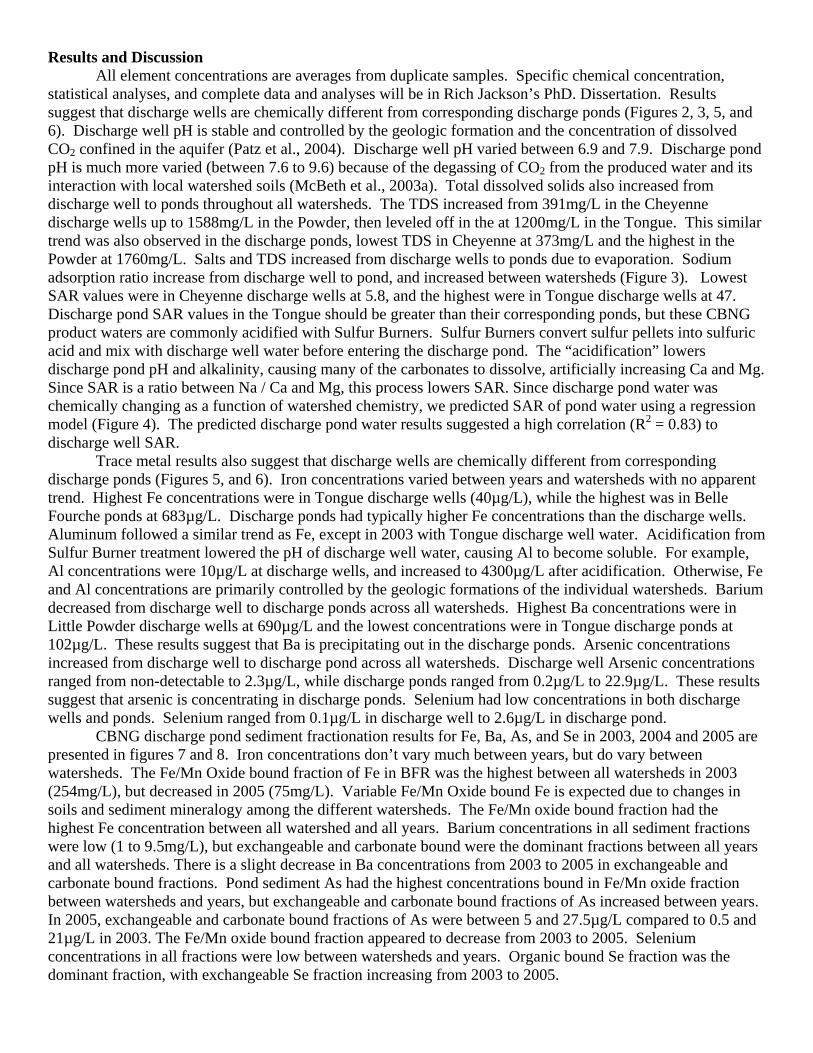
7. Transfer research results to user groups through project demonstrations, workshops, and local meetings. Methods and Procedures Site Selection We selected twenty-six sites within five Wyoming watersheds to obtain CBNG well and associated pond data. Site selection was coordinated with a network of working partners. These working partners include: Wyoming Department of Environmental Quality (WY-DEQ), Wyoming Water Development Commission (WY-WDC), Coalbed Methane Industry, Wyoming Landowners and Citizens, U.S. Geological Survey (USGS), Wyoming State Geological Survey (WYSGS), U.S. Environmental Protection Agency (USEPA), Colorado, and Montana. We sampled seven sites in each of the Little Powder River (LPR) and Powder River (PR) watersheds. We sampled three sites from Cheyenne River (CHR) watershed and four sites from Belle Fourche River (BFR) watershed, and five sites from Tongue River (TR) watershed (Figure 1). Sample Collection and Analysis
Before sample collection, a pilot study was conducted to determine sampling location within the CBNG pond waters. Chemical, plant, and aquatic macroinvertebrates were also examined to determine the sampling locations to obtain a representative sample. CBNG water samples from each well and corresponding ponds were collected during the summer of 2003. Before sample collection, field measurements including pH, conductivity, temperature, ORP, and dissolved oxygen were taken in each well and pond.
CBNG water samples from each discharge well and corresponding pond were collected once during the summers of 2003, 2004, and 2005. Before sample collection, field measurements including pH, conductivity, temperature, ORP (oxidation and reduction potential), and dissolved oxygen were taken from each CBNG discharge well and associated pond with an Orion Model 1230 Multi-Probe. Exact locations for pond measurements were taken directly away from discharge well, and were chosen upon pH stabilization at different distances from discharge point.
Duplicate water samples of discharge wells and ponds were taken from each site. Samples were transported in ice coolers (2o C) to the University of Wyoming Water Quality Laboratory. Each sample was filtered through 0.45µm filter and subdivided: half were acidified to pH of 2.0 with HNO3, and half were left unacidified. Acidified samples were analyzed for Ca, Na, Mg, K, Fe, Al, Cr, Mn, Pb, Cu, Zn, As, Se, Mo, Cd,

Ba and B by Inductively Coupled Plasma-Mass Spectrometry (ICP-MS), and unacidified samples were analyzed for SO4
2-, Cl-, F-, NO3-, and PO4
3- using Ion Chromatography (IC). Total alkalinity on unacidified samples was determined by acid titration method.
The geochemical model MINTEQA2 was used to verify analytical data accuracy and to calculate ion activities (Brown and Allison, 1992). This model uses chemical data, pH, ORP, alkalinity, and redox couples to calculate ion activities, ion complexes, and saturation indices. Sodium adsorption ratios were calculated from Ca, Na and Mg concentrations (Hanson et al., 1993).
The quality control/quality assurances protocols such as duplicate sampling and analysis, trip blanks, and known concentrations of reference standards were included. Standard laboratory procedures were used for all analytical analyses and pH, electrical conductivity, and alkalinity measurements (APHA, 1992). All analyses were performed following CFR 40, Part 1, Chapter 36 procedures (WYDEQ, 2001).
Three statistical tests were used to identify differences between CBNG water samples. Due to a “natural pairing” of the discharge well and associated discharge pond, paired t-tests were used to identify these differences between water types (discharge wells vs. associated ponds) (alpha = 0.05; SAS, 2000). A 5x3 factor analysis was used to identify element differences of a particular water type between watersheds and years, and an analysis of variance with a Tukey mean separation test was used to further identify element differences between years within specific watersheds (alpha = 0.05; SAS, 2000. A simple linear regression was conducted to predict discharge pond SAR from discharge well SAR using MiniTab 13.1 (2000) computer software.
Disposal pond sediments were collected during the summer of 2003, 2004, and 2005 using 4.5cm diameter PVC corer. Sample locations are located directly away from discharge well and were chosen upon pH stabilization at different distances from discharge point. Typically, sediment was collected approximately 3 meters from discharge point and consists of a 20cm core. A sediment core was taken from every pond, placed in a 1L polypropylene bottle, and then completely filled with pond water. Once at the lab, all samples were frozen. Two samples from each watershed (10 total samples) were separated into exchangeable, carbonate bound, Fe/Mn oxide bound, organically bound, and residual mineral fractions to determinate the fate of As, Ba, Fe, and Se. Each fraction was dissolved in an appropriate solution and extracted. The extract was then analyzed for As, Ba, Fe, and Se on ICP-MS as described by Tressier et al. (1979).
Since Wyoming and surrounding states do not have sampling protocols for macroinvertebrates in lentic systems, a minimal effort approach for sampling was selected. Four macroinvertebrate samples (collected from the four cardinal directions) were collected from the water column using a D-net with 1mm mesh and from sediment using an 8cm diameter core sampler. Water column samples were combined as well as sediment samples to form a composite sample for the water column and sediment column for each pond. Samples were taken from 2 ponds in each different watershed (20 total samples) and preserved in 95% ethanol. At the laboratory, samples were sorted from vegetation and debris, and preserved in 75% ethanol (Merrit and Cummins, 1996). Aquatic macroinvertebrate samples were sent to a certified laboratory specializing in analysis of aquatic macroinvertebrate communities (Aquatic Biology Associates, Inc) for identification to lowest taxonomic level. Laboratory data included total taxa present and community richness. Vegetation identification was performed on location for predominant wetland and aquatic plant species in and around ponds. Samples of unknown species were collected and brought back to the lab for identification. Task Completion List 2003, 2004, and 2005 Sample Seasons
Water chemistry completed for all samples (anions, cations, trace metals, DOC) MinteqA2 modeling completed Statistical analysis completed (T-tests, Factorial Analyses, ANOVAs, and Regressions) Compiled CBNG water quality data and contacted participating landowners of results Aquatic macroinvertebrate samples analyzed Vegetation species list completed Sediment Fractionation analysis for all 3 years Project results were disseminated to the public through local, regional, and national meetings and
workshops
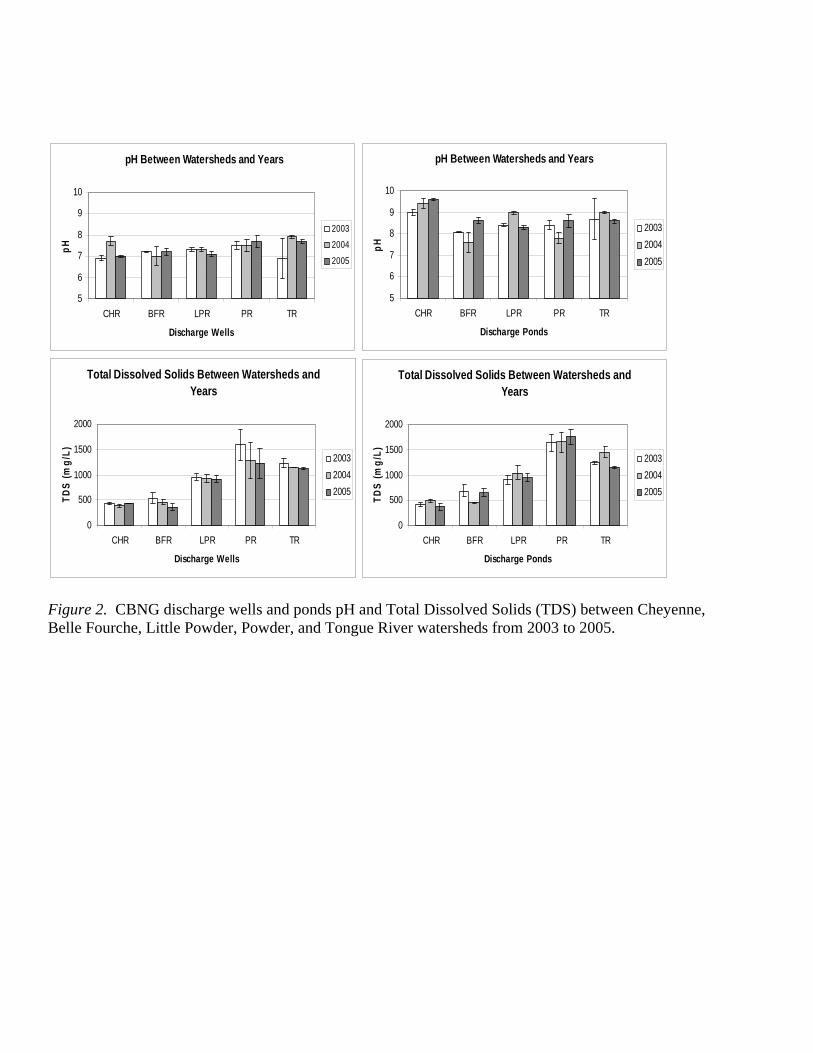
Results and Discussion All element concentrations are averages from duplicate samples. Specific chemical concentration,
statistical analyses, and complete data and analyses will be in Rich Jackson’s PhD. Dissertation. Results suggest that discharge wells are chemically different from corresponding discharge ponds (Figures 2, 3, 5, and 6). Discharge well pH is stable and controlled by the geologic formation and the concentration of dissolved CO2 confined in the aquifer (Patz et al., 2004). Discharge well pH varied between 6.9 and 7.9. Discharge pond pH is much more varied (between 7.6 to 9.6) because of the degassing of CO2 from the produced water and its interaction with local watershed soils (McBeth et al., 2003a). Total dissolved solids also increased from discharge well to ponds throughout all watersheds. The TDS increased from 391mg/L in the Cheyenne discharge wells up to 1588mg/L in the Powder, then leveled off in the at 1200mg/L in the Tongue. This similar trend was also observed in the discharge ponds, lowest TDS in Cheyenne at 373mg/L and the highest in the Powder at 1760mg/L. Salts and TDS increased from discharge wells to ponds due to evaporation. Sodium adsorption ratio increase from discharge well to pond, and increased between watersheds (Figure 3). Lowest SAR values were in Cheyenne discharge wells at 5.8, and the highest were in Tongue discharge wells at 47. Discharge pond SAR values in the Tongue should be greater than their corresponding ponds, but these CBNG product waters are commonly acidified with Sulfur Burners. Sulfur Burners convert sulfur pellets into sulfuric acid and mix with discharge well water before entering the discharge pond. The “acidification” lowers discharge pond pH and alkalinity, causing many of the carbonates to dissolve, artificially increasing Ca and Mg. Since SAR is a ratio between Na / Ca and Mg, this process lowers SAR. Since discharge pond water was chemically changing as a function of watershed chemistry, we predicted SAR of pond water using a regression model (Figure 4). The predicted discharge pond water results suggested a high correlation (R2 = 0.83) to discharge well SAR.
Trace metal results also suggest that discharge wells are chemically different from corresponding discharge ponds (Figures 5, and 6). Iron concentrations varied between years and watersheds with no apparent trend. Highest Fe concentrations were in Tongue discharge wells (40µg/L), while the highest was in Belle Fourche ponds at 683µg/L. Discharge ponds had typically higher Fe concentrations than the discharge wells. Aluminum followed a similar trend as Fe, except in 2003 with Tongue discharge well water. Acidification from Sulfur Burner treatment lowered the pH of discharge well water, causing Al to become soluble. For example, Al concentrations were 10µg/L at discharge wells, and increased to 4300µg/L after acidification. Otherwise, Fe and Al concentrations are primarily controlled by the geologic formations of the individual watersheds. Barium decreased from discharge well to discharge ponds across all watersheds. Highest Ba concentrations were in Little Powder discharge wells at 690µg/L and the lowest concentrations were in Tongue discharge ponds at 102µg/L. These results suggest that Ba is precipitating out in the discharge ponds. Arsenic concentrations increased from discharge well to discharge pond across all watersheds. Discharge well Arsenic concentrations ranged from non-detectable to 2.3µg/L, while discharge ponds ranged from 0.2µg/L to 22.9µg/L. These results suggest that arsenic is concentrating in discharge ponds. Selenium had low concentrations in both discharge wells and ponds. Selenium ranged from 0.1µg/L in discharge well to 2.6µg/L in discharge pond.
CBNG discharge pond sediment fractionation results for Fe, Ba, As, and Se in 2003, 2004 and 2005 are presented in figures 7 and 8. Iron concentrations don’t vary much between years, but do vary between watersheds. The Fe/Mn Oxide bound fraction of Fe in BFR was the highest between all watersheds in 2003 (254mg/L), but decreased in 2005 (75mg/L). Variable Fe/Mn Oxide bound Fe is expected due to changes in soils and sediment mineralogy among the different watersheds. The Fe/Mn oxide bound fraction had the highest Fe concentration between all watershed and all years. Barium concentrations in all sediment fractions were low (1 to 9.5mg/L), but exchangeable and carbonate bound were the dominant fractions between all years and all watersheds. There is a slight decrease in Ba concentrations from 2003 to 2005 in exchangeable and carbonate bound fractions. Pond sediment As had the highest concentrations bound in Fe/Mn oxide fraction between watersheds and years, but exchangeable and carbonate bound fractions of As increased between years. In 2005, exchangeable and carbonate bound fractions of As were between 5 and 27.5µg/L compared to 0.5 and 21µg/L in 2003. The Fe/Mn oxide bound fraction appeared to decrease from 2003 to 2005. Selenium concentrations in all fractions were low between watersheds and years. Organic bound Se fraction was the dominant fraction, with exchangeable Se fraction increasing from 2003 to 2005.

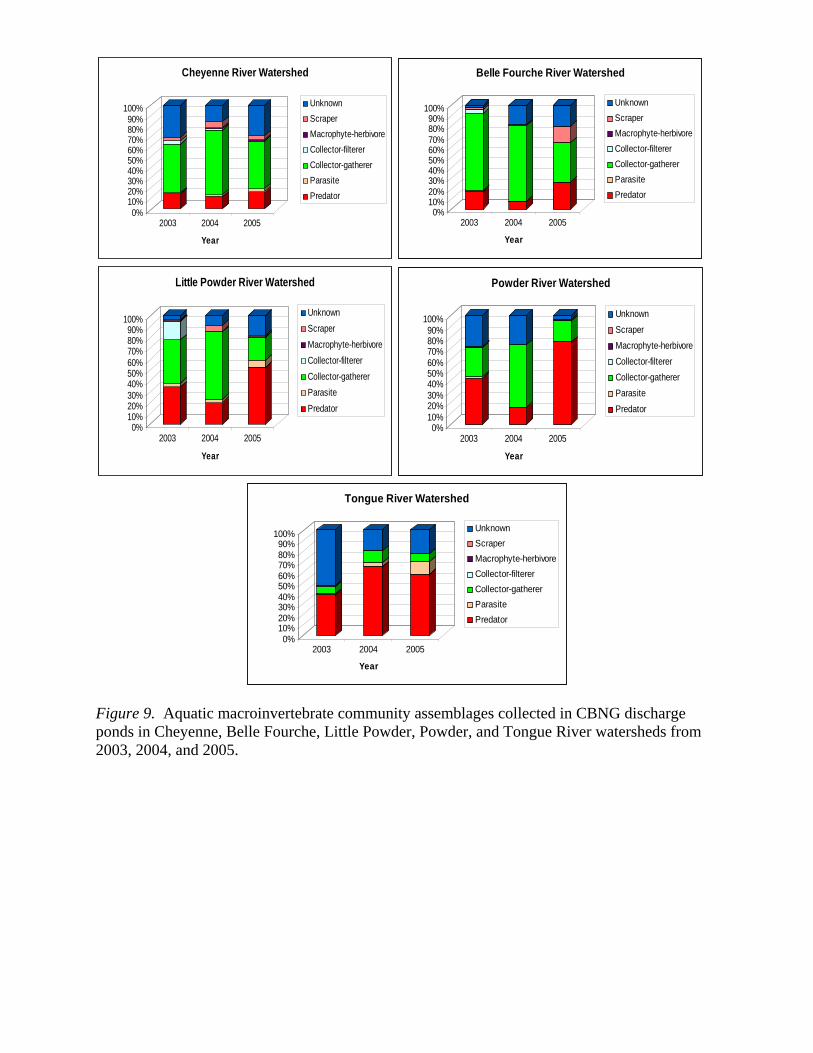
Figure 9 identifies aquatic macroinvertebrate community assemblages for 2003, 2004, and 2005. Collector-gatherers and predators are the most represented functional feeding groups in all watersheds. Macroinvertebrate communities may be a function of the age of discharge pond and the relative wetland vegetation that is present. Table 1 identifies vegetation encountered in and around discharge ponds across all five watersheds. More vegetation species were observed in and around CHR, BFR, and LPR discharge ponds than in PR and TR discharge ponds. This may be a function of pond age. Conclusions Results from this study suggest the following:
• Discharge well water is chemically different than associated discharge pond water across watersheds, • Watersheds (CHR, BFR, LPR, PR, and TR) examined in this study are chemically different from each
other, • During monitoring years from 2003 to 2005, TR, PR, and to some extent LPR were more chemically
reactive when compared to CHR and BFR. • Since discharge pond water was chemically changing as a function of watershed chemistry, we predicted
SAR of pond water using regression model. The predicted discharge pond water results suggested a high correlation (R2 = 0.83) to discharge well SAR.
• Monitoring studies also suggested that SAR of pond water increased between years due to decrease in Ca concentration, except for TR. In TR, produced water is chemically treated to add Ca and to lower SAR.
• Many trace metals increase and accumulate from discharge well to discharge pond. This could become a problem after many years of continual discharge and will require remediation.
• Fe, Ba, and Se are bound in Fe/Mn oxide and organic fractions of CBNG pond sediment and pose little hazard. The As concentration is increasing in exchangeable and carbonate bound fractions, which are can be readily bioavailable and may pose a hazard with continued CBNG discharge.
• Knowledge transfer between university personnel, state/federal agencies, and local landowners is successful when local landowners are given the option to participate and assured anonymity of data collection locations on their property.
• Results of this project are helping WY-DEQ in issuing CBNG discharge permits and local landowners in management of CBNG produced water on their property.
Student Support Rich Jackson, Ph.D. student, majoring in Rangeland Ecology and Watershed Management and Water Resources Michelle Patterson, graduate student in Rangeland Ecology and Watershed Management and Water Resources Jonathan Anderson, graduate student in Soils Cotton Bousman, graduate student in Rangeland Ecology and Watershed Management Amy Groenkie, Soils Department Technician Keri Bousman, undergraduate student in Rangeland Ecology and Watershed Management Don-O-Lynn Weed, SRAP high school student participant Cynthia Milligan, graduate student in Rangeland Ecology and Watershed Management Awards
• James B. Warner Scholarship (2004) from the American Water Works Association • Best Oral Presentation (2004) from University of Wyoming Graduate School
Clientele Network Several contacts were made with different clientele groups to obtain access to the sampling sites and permission to collect samples. These contacts or clientele included WY-DEQ, WY-WDC, CBNG Industry, WY Landowners and Citizens, NRCS personnel, Conservation District personnel, WY Cooperative Extension

Agency, USGS, EPA, Colorado, Montana. Annual meetings along with water quality reports were accomplished for 2003, 2004 and 2005 with individual landowners who participated in this project. Annual presentations were given to Wyoming Water Development Commission as well as Basin Advisory group meetings (Kaycee, 2003 and New Castle, 2006). Information from this project was also disseminated in national and international meetings (Soil Science Society Meetings 2003 and 2005) and regional meeting (Range Society Meetings 2004, CBNG Research, Monitoring, and Applications Conference 2004). Presentations
1. Wyoming Water Development Commission Basin Advisory Group Meeting, April 13th 2006 New Castle, Wyoming.
2. Soil Science Society of America 69th Annual Meetings, November 7th 2005. Salt Lake City, Utah. 3. Wyoming Water Development Commission Annual Meetings, December 4th, 2004, Cheyenne,
Wyoming. 4. 1st Annual Coalbed Natural Gas Research, Monitoring, and Applications Conference. Aug 17-19,
2004. Laramie, Wyoming. 5. University of Wyoming 2003 Graduate Student Symposium March 2nd, 2004, Laramie, Wyoming.
This presentation won Best Project Presentation Award. 6. USDA-CSREES National Water Quality Conference: Integrating Research, Extension and
Education scheduled January 11-14, 2004 in Clearwater, Florida. 7. Wyoming Water Development Commission Annual Meetings, December 4th, 2003, Cheyenne,
Wyoming. 8. Rangeland National Annual Meetings, Water Quality Division, scheduled January 24-30, 2004 in
Salt Lake City, Utah. 9. American Society of Agronomy (Soil and Water Ecology Section) Meetings, Denver, Colorado.
November 5, 2003 10. Wyoming Department of Environmental Quality Meeting, Cheyenne, Wyoming. August 21, 2003. 11. EPA-USGS Meeting for Tongue River and Powder River Long-term Monitoring Network. Sheridan,
Wyoming. June 5, 2003 12. Missouri River Basin Natural Resources Meeting, Benedictine, Kansas. June 2-4, 2003 (invited). 13. American Society of Surface Mining and Reclamation Symposium, Billings, Montana. June 5-6,
2003. 14. Wyoming Water Development Commission, River Basin Advisory Group Meeting, Kaycee,
Wyoming. June 16, 2003. 15. Wyoming Department of Environmental Quality (Water Quality Division) Meeting, Cheyenne,
Wyoming. May 10, 2003. This meeting included represents from U.S. EPA Region VIII, BLM, CBM Industry, Colorado State University.
References American Public Health Association. 1992. Standard methods for the examination of water and wastewater.
American Public Health Association, Washington D.C. DeBruin, R.H., R.M. Lyman, R.W. Jones, and L.W. Cook. 2000. Coalbed methane development in Wyoming.
Information Pamphlet number 7. Wyoming State Geological Survey, Laramie, WY. Brown, D.S. and J.D. Allison. 1992. MINTEQA2: An equilibrium metal speciation model. Environmental
Research Laboratory, Office of Research and Development. U.S. Environmental Protection Agency, Athens, Georgia.
McBeth, I.H., K.J. Reddy, and Q.D. Skinner. 2003a. Chemistry of coalbed methane product water in three Wyoming watersheds. Journal of American Water Resources Association. 39:575-585 .
McBeth, I.H., K.J. Reddy, and Q.D. Skinner. 2003b. Chemistry of trace elements in coalbed methane product water. Journal of Water Research. 37:884-890 .
Merritt, R.W. and K.W. Cummins. 1996. An introduction to the aquatic insects of North America 3rd edition. Kendall/Hunt, Dubuque, Iowa.
Patz, M. J., Reddy, K.J., and Skinner, Q.D.: 2004. Chemistry of coalbed methane discharge

water interacting with semi-arid ephemeral stream changes. Journal of the American Water Resources Association. 40: 1247-1255.
Rice, C.A., Ellis, M.S, and Bullock, J.H., Jr. 1999. Water co-produced with coalbed methane in the Powder River Basin, Wyoming: Preliminary compositional data. Open-File Report 00-372. U.S. Geological Survey, Denver, CO.
Tressier, A., Campbell, P.G.C, and Bisson, M. 1979. Sequential extraction procedure for the separation of particulate trace elements. Analytical Chemistry. 51:844-850.
Wyoming Department of Environmental. 2001. SAP: Water Quality Rules and Regulations, Chapter 1. Department of Environmental Quality and Water Quality Division, Cheyenne, Wyoming.
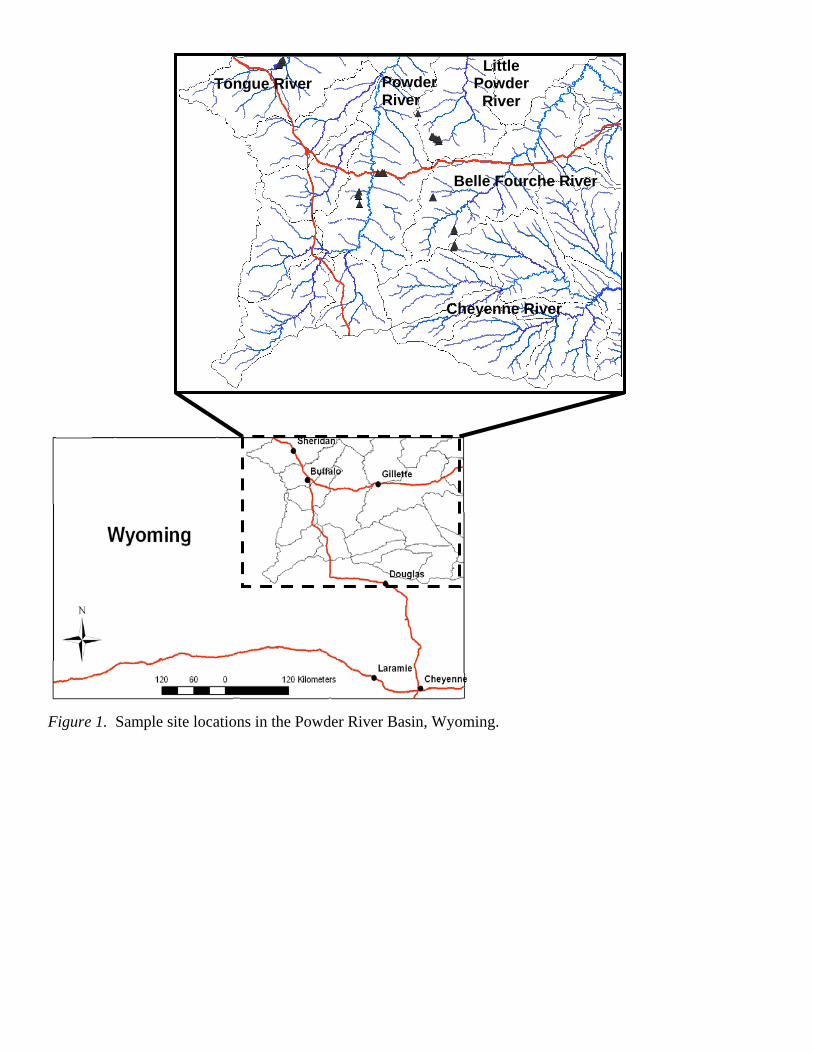
Figure 1. Sample site locations in the Powder River Basin, Wyoming.
Tongue River Powder River
Little Powder River
Belle Fourche River
Cheyenne River
Total Dissolved Solids Between Watersheds and Years
0
500
1000
1500
2000
CHR BFR LPR PR TR
Discharge Wells
TDS
(mg/
L) 200320042005
Total Dissolved Solids Between Watersheds and Years
0
500
1000
1500
2000
CHR BFR LPR PR TR
Discharge Ponds
TDS
(mg/
L) 200320042005
Figure 2. CBNG discharge wells and ponds pH and Total Dissolved Solids (TDS) between Cheyenne, Belle Fourche, Little Powder, Powder, and Tongue River watersheds from 2003 to 2005.
pH Between Watersheds and Years
5
6
7
8
9
10
CHR BFR LPR PR TR
Discharge Wells
pH
2003
2004
2005
pH Between Watersheds and Years
5
6
7
8
9
10
CHR BFR LPR PR TR
Discharge Ponds
pH
200320042005
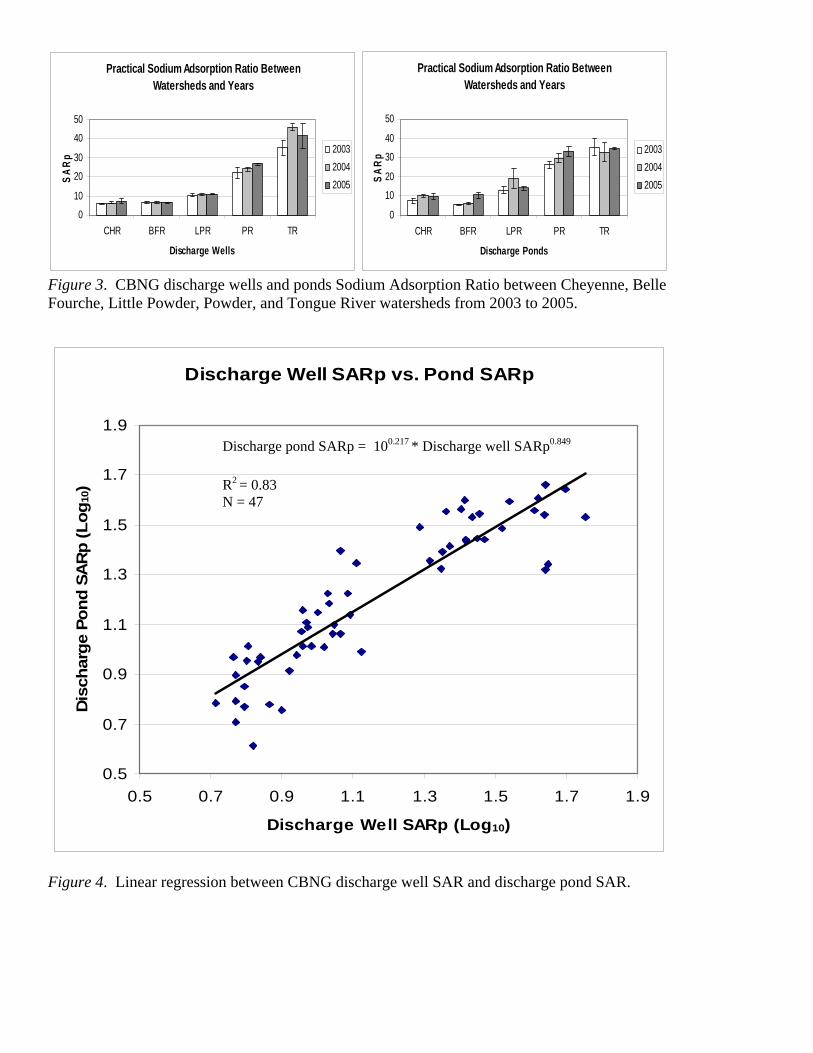
Figure 3. CBNG discharge wells and ponds Sodium Adsorption Ratio between Cheyenne, Belle Fourche, Little Powder, Powder, and Tongue River watersheds from 2003 to 2005.
Figure 4. Linear regression between CBNG discharge well SAR and discharge pond SAR.
Discharge Well SARp vs. Pond SARp
0.5
0.7
0.9
1.1
1.3
1.5
1.7
1.9
0.5 0.7 0.9 1.1 1.3 1.5 1.7 1.9
Discharge Well SARp (Log10)
Dis
char
ge P
ond
SAR
p (L
og10
)
Discharge pond SARp = 100.217 * Discharge well SARp0.849
R2 = 0.83 N = 47
Practical Sodium Adsorption Ratio Between Watersheds and Years
0
10
20
30
40
50
CHR BFR LPR PR TR
Discharge Wells
SARp
200320042005
Practical Sodium Adsorption Ratio Between Watersheds and Years
0
10
20
30
40
50
CHR BFR LPR PR TR
Discharge Ponds
SARp
200320042005

Figure 5. CBNG discharge wells and ponds iron, aluminum, and barium concentrations between Cheyenne, Belle Fourche, Little Powder, Powder, and Tongue River watersheds from 2003 to 2005.
Iron Between Watersheds and Years
050
100150200250300350
CHR BFR LPR PR TR
Discharge Wells
Fe (u
g/L) 2003
20042005
Aluminum Between Watersheds and Years
02000400060008000
1000012000
CHR BFR LPR PR TR
Discharge Wells
Al (u
g/L) 2003
20042005
Iron Between Watersheds and Years
0
200
400
600
800
1000
1200
CHR BFR LPR PR TR
Discharge Ponds
Fe (u
g/L) 2003
20042005
Aluminum Between Watersheds and Years
0
500
1000
1500
2000
2500
CHR BFR LPR PR TR
Discharge Ponds
Al (u
g/L) 2003
20042005
Barium Between Watersheds and Years
0
200
400
600
800
1000
CHR BFR LPR PR TR
Discharge Ponds
Ba (u
g/L) 2003
20042005
Barium Between Watersheds and Years
0
200
400
600
800
1000
CHR BFR LPR PR TR
Discharge Wells
Ba
(ug/
L) 200320042005

Figure 6. CBNG discharge wells and ponds arsenic and selenium concentrations between
Cheyenne, Belle Fourche, Little Powder, Powder, and Tongue River watersheds from 2003 to 2005.
Arsenic Between Watersheds and Years
00.5
11.5
22.5
3
CHR BFR LPR PR TR
Discharge Wells
As
(ug/
L) 2003
2004
2005
Arsenic Between Watersheds and Years
0
10
20
30
40
50
CHR BFR LPR PR TR
Discharge Ponds
As (u
g/L) 2003
20042005
Selenium Between Watersheds and Years
0
1
2
3
4
5
CHR BFR LPR PR TR
Discharge Wells
Se (u
g/L) 2003
20042005
Selenium Between Watersheds and Years
0
1
2
3
4
5
CHR BFR LPR PR TR
Discharge Ponds
Se (u
g/L) 2003
20042005
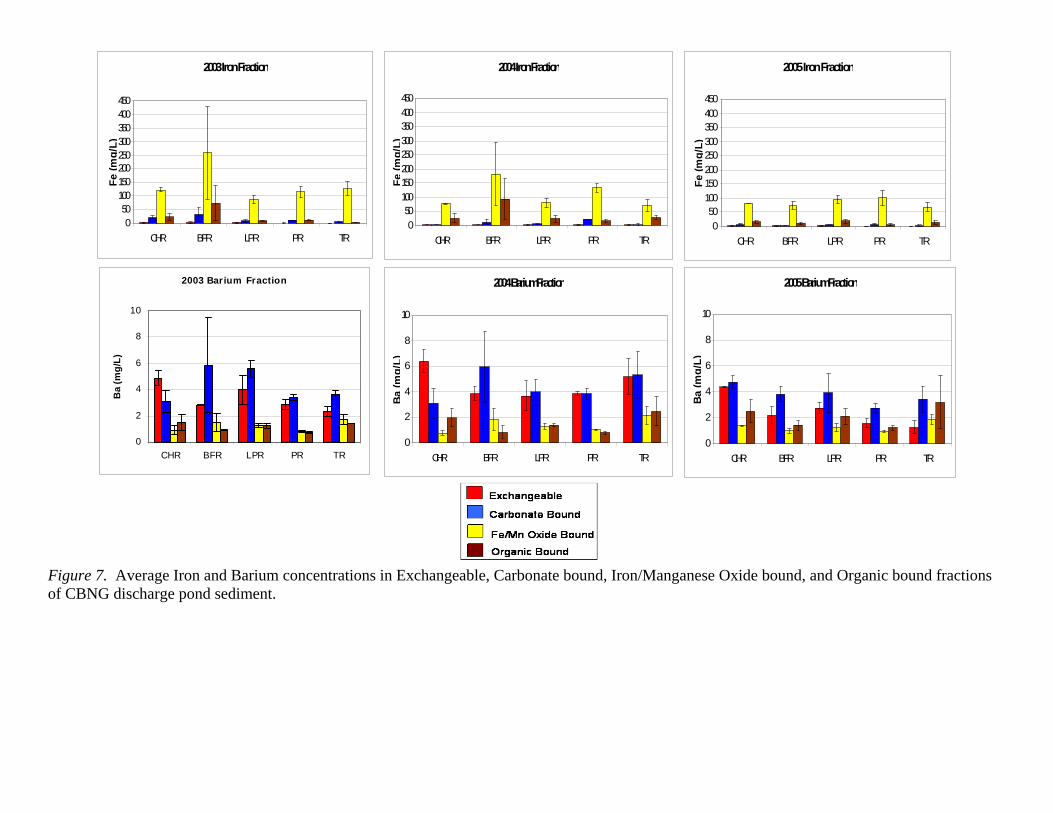
Figure 7. Average Iron and Barium concentrations in Exchangeable, Carbonate bound, Iron/Manganese Oxide bound, and Organic bound fractions of CBNG discharge pond sediment.
2003 Iron Fraction
050
100150200250300350400450
CHR BFR LPR PR TR
Fe (m
g/L)
2004 Iron Fraction
050
100150200250300350400450
CHR BFR LPR PR TR
Fe(m
g/L)
2005 Iron Fraction
050
100150200250300350400450
CHR BFR LPR PR TR
Fe (m
g/L)
2003 Barium Fraction
0
2
4
6
8
10
CHR BFR LPR PR TR
Ba
(mg/
L)
2004 Barium Fraction
0
2
4
6
8
10
CHR BFR LPR PR TR
Ba(m
g/L)
2005 Barium Fraction
0
2
4
6
8
10
CHR BFR LPR PR TR
Ba(m
g/L)

Figure 8. Average Arsenic and Selenium concentrations in Exchangeable, Carbonate bound, Iron/Manganese Oxide bound, and Organic bound fractions of CBNG discharge pond sediment.
2003 Arsenic Fraction
0
10
20
30
40
50
60
CHR BFR LPR PR TR
As
(ug/
L)
2004 Arsenic Fraction
0
10
20
30
40
50
60
CHR BFR LPR PR TR
As
(ug/
L)
2005 Arsenic Fraction
0
10
20
30
40
50
60
CHR BFR LPR PR TR
As
(ug/
L)
2003 Selenium Fraction
0
5
10
15
20
25
CHR BFR LPR PR TR
Se (u
g/L)
2004 Selenium Fraction
0
5
10
15
20
25
CHR BFR LPR PR TR
Se (u
g/L)
2005 Selenium Fraction
0
5
10
15
20
25
CHR BFR LPR PR TR
Se (u
g/L)
0%10%20%30%40%50%60%70%80%90%
100%
2003 2004 2005
Year
Cheyenne River Watershed
UnknownScraperMacrophyte-herbivoreCollector-filtererCollector-gathererParasitePredator
0%10%20%30%40%50%60%70%80%90%
100%
2003 2004 2005
Year
Belle Fourche River Watershed
UnknownScraperMacrophyte-herbivoreCollector-filtererCollector-gathererParasitePredator
0%10%20%30%40%50%60%70%80%90%
100%
2003 2004 2005
Year
Little Powder River Watershed
UnknownScraperMacrophyte-herbivoreCollector-filtererCollector-gathererParasitePredator
0%10%20%30%40%50%60%70%80%90%
100%
2003 2004 2005
Year
Powder River Watershed
UnknownScraperMacrophyte-herbivoreCollector-filtererCollector-gathererParasitePredator
0%10%20%30%40%50%60%70%80%90%
100%
2003 2004 2005
Year
Tongue River Watershed
UnknownScraperMacrophyte-herbivoreCollector-filtererCollector-gathererParasitePredator
Figure 9. Aquatic macroinvertebrate community assemblages collected in CBNG discharge ponds in Cheyenne, Belle Fourche, Little Powder, Powder, and Tongue River watersheds from 2003, 2004, and 2005.
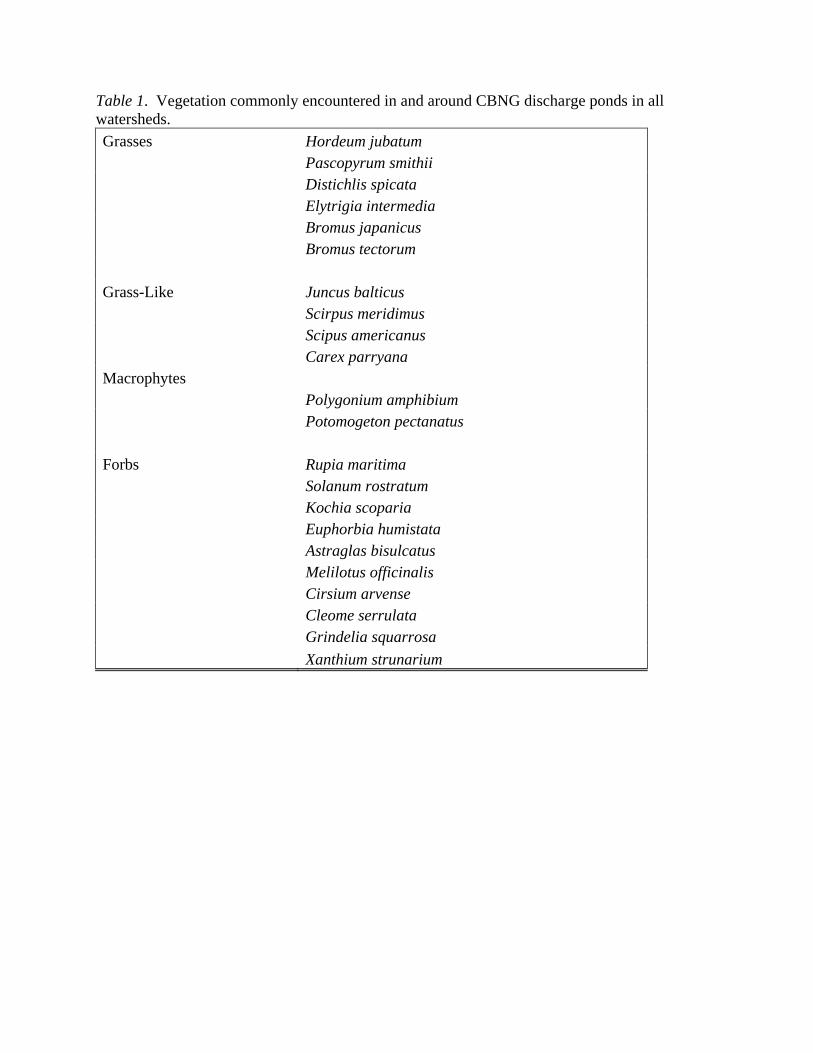
Table 1. Vegetation commonly encountered in and around CBNG discharge ponds in all watersheds. Grasses Hordeum jubatum Pascopyrum smithii Distichlis spicata Elytrigia intermedia Bromus japanicus Bromus tectorum Grass-Like Juncus balticus Scirpus meridimus Scipus americanus Carex parryana Macrophytes Polygonium amphibium Potomogeton pectanatus Forbs Rupia maritima Solanum rostratum Kochia scoparia Euphorbia humistata Astraglas bisulcatus Melilotus officinalis Cirsium arvense Cleome serrulata Grindelia squarrosa Xanthium strunarium
Subsurface Drip Irrigation Systems: Assessment andDevelopment of Best Management Practices
Basic Information
Title: Subsurface Drip Irrigation Systems: Assessment and Development of BestManagement Practices
Project Number: 2003WY11B
Start Date: 3/1/2003
End Date: 2/28/2006
Funding Source: 104B
Congressional District: 1
Research Category: Water Quality
Focus Category: Agriculture, Management and Planning, Non Point Pollution
Descriptors: None
Principal Investigators: Drew W Johnson, George Floyd Vance, Renduo Zhang
Publication1. Hao, X., R. Zhang, and A. Kravchenko, 2005. Effects of Root Density Distribution Models on Root
Water Uptake and Water Flow under Irrigation. Soil Science,170:167-174. 2. Hao, X. and R. Zhang, 2004. A hybrid mass-conservative scheme for simulating variably saturated
flow in soils with large outflow flux. Proceedings of Computational Methods in Water Resources2004 Conference. UNC-Chapel Hill, North Carolina.
3. Hao, X., and R. Zhang, 2005. A Mass-Conservative Switching Method for Simulating Water Flow inSaturated-Unsaturated Soils. J. Hydrology (in press).
4. Youquan Jiang, Drew W. Johnson, George F. Vance and David E. Legg. Subsurface Drip Irrigationfor Alfalfa Production in Wyoming, Transactions of the ASAE, planned submission for August 2006.

Problem and research objectives: Agriculture is the major consumptive use of water resources in the United States,
especially in the arid and semi-arid areas in western U.S. The predominant method of irrigation is flood irrigation. With flood irrigation techniques, water is not effectively used by plants, and fertilizer components are often carried into ground and surface waters with waste runoff generated during water applications (Ayers et al., 1999). Improving irrigation techniques can benefit agricultural and environmental activities. In recent years, best management practices (BMP) for irrigated agriculture has become a focus of research in regions experiencing water shortages and water quality degradation because of agricultural activity. Micro-irrigation, such as subsurface drip irrigation (SDI), offers the opportunity for precise application of water and fertilizers.
Alfalfa is one of the most important forage crops in Wyoming and is Wyoming’s largest cash crop. The harvested area of alfalfa hay in Wyoming in 2005 was 250,000 hectares, with a production value of $112.5 million dollars (Wyoming Agricultural Statistics, 2005).
Efficiency of SDI systems is closely related to its design and layout (Fig. 1), which is mainly determined by factors such as soil properties, crops, and local climate. Design parameters of dripper line lateral spacing, emitter spacing, depth and scheduling of irrigation are manageable factors to control the overlap of wetting fronts. Combinations of these parameters will generate different wetting patterns for a specific field application with different soil properties.
Objecitve of this study were to: (1) evaluate alfalfa biomass production using SDI as compared to sprinkler irrigation (SPK) and (2) to determine SDI system (spacing and depth of driplines) parameters for optimal alfalfa production. Materials and methods:
A field study was conducted to evaluate various subsurface drip irrigation (SDI) parameters on alfalfa production. The study evaluated water use for different SDI system characteristics to better understand the utilization of SDI for improving alfalfa yields in Wyoming. Parameters studied included SDI dripper depth placement (30, 50 and 70 cm) and dripper spacing (60, 90 and 120 cm) on alfalfa yield using 9 treatments in a 2 factorial complete randomized (CRD) design. Biomass of alfalfa and non-alfalfa plants was determined from harvests of individual treatment plots. A comparison was made using sprinkler irrigation (SPK) as a control.
The project site is located on the UW’s Experimental farm in west Laramie. Study site is approximately 90x30 m in size, and has a gently 1 degree southeast slope. The study site was divided into two large zones - a SDI zone of 60x30 m, and a sprinkler irrigation zone (SPK) of 30x30 m. The SDI zone was divided into 9 equal sized plots and the SPK zone was divided into 2 plots (Fig. 1). Trenches were dug at three depths and three lateral spacings. Alfalfa was seeded in mid May 2005 after plowing, rototilling and leveling the study site; seeding density was 20 kg/ha. Sprinkler irrigation was used for initiating seed germination. Alfalfa resulted in excellent germination and crop growth. In addition to the use of herbicides for weed control, weeds were routinely removed by hand throughout the experimental site.
1
30 m60 m
Dot lines divided each plot into 3 subsample plotsSubsurface Drip Irrigation zone
Plot
PlotPlotPlot
Plot Plot Plot
PlotPlotPlot
Plot
Sprinkler Irrigation Zone
90 m15 m15 m20 m20 m20 m
30 m
10 m
10 m
10 m
11
Spacing: 60 cmDepth: 70 cm
6
10
Spacing: 120 cmDepth: 70 cm
3
1
Spacing: 90 cmDepth: 70 cm
8
7
Spacing: 60 cmDepth: 50 cm
9
4
2 5
Spacing: 120 cmDepth: 50 cm
Spacing: 90 cmDepth: 50 cm
Spacing: 60 cmDepth: 30 cm
Spacing: 90 cmDepth: 30 cm
Spacing: 120 cmDepth: 30 cm
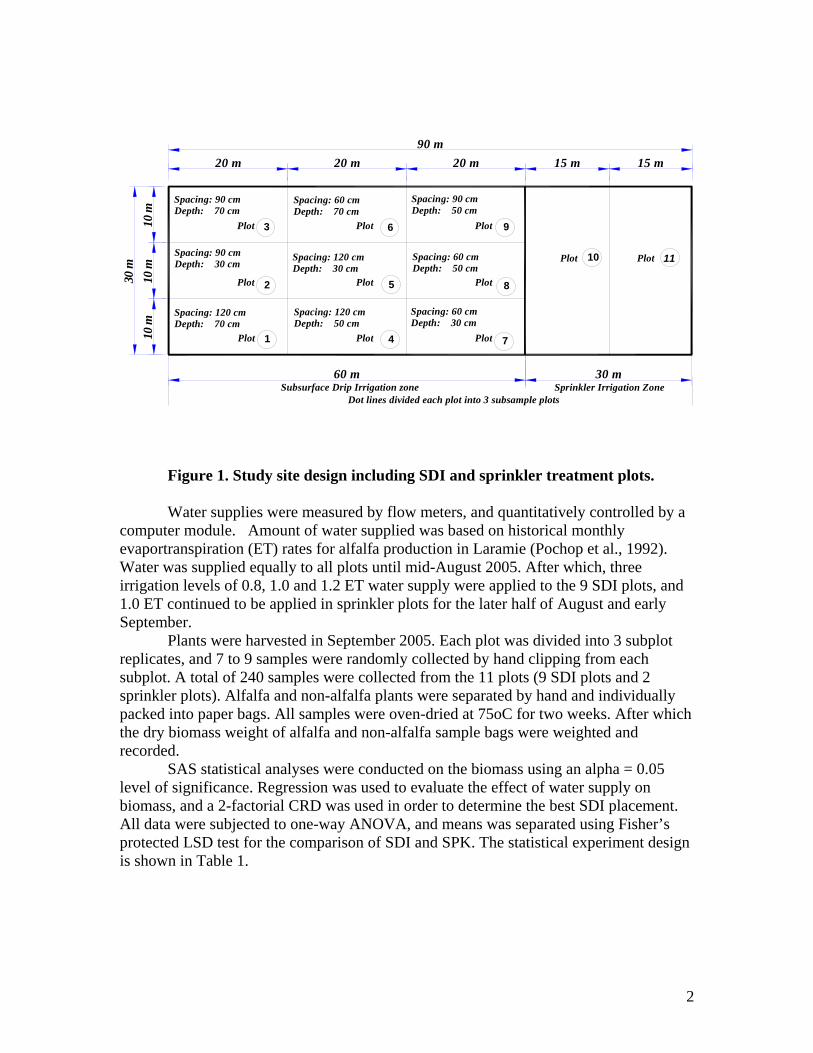
Figure 1. Study site design including SDI and sprinkler treatment plots.
Water supplies were measured by flow meters, and quantitatively controlled by a computer module. Amount of water supplied was based on historical monthly evaportranspiration (ET) rates for alfalfa production in Laramie (Pochop et al., 1992). Water was supplied equally to all plots until mid-August 2005. After which, three irrigation levels of 0.8, 1.0 and 1.2 ET water supply were applied to the 9 SDI plots, and 1.0 ET continued to be applied in sprinkler plots for the later half of August and early September.
Plants were harvested in September 2005. Each plot was divided into 3 subplot replicates, and 7 to 9 samples were randomly collected by hand clipping from each subplot. A total of 240 samples were collected from the 11 plots (9 SDI plots and 2 sprinkler plots). Alfalfa and non-alfalfa plants were separated by hand and individually packed into paper bags. All samples were oven-dried at 75oC for two weeks. After which the dry biomass weight of alfalfa and non-alfalfa sample bags were weighted and recorded.
SAS statistical analyses were conducted on the biomass using an alpha = 0.05 level of significance. Regression was used to evaluate the effect of water supply on biomass, and a 2-factorial CRD was used in order to determine the best SDI placement. All data were subjected to one-way ANOVA, and means was separated using Fisher’s protected LSD test for the comparison of SDI and SPK. The statistical experiment design is shown in Table 1.
2
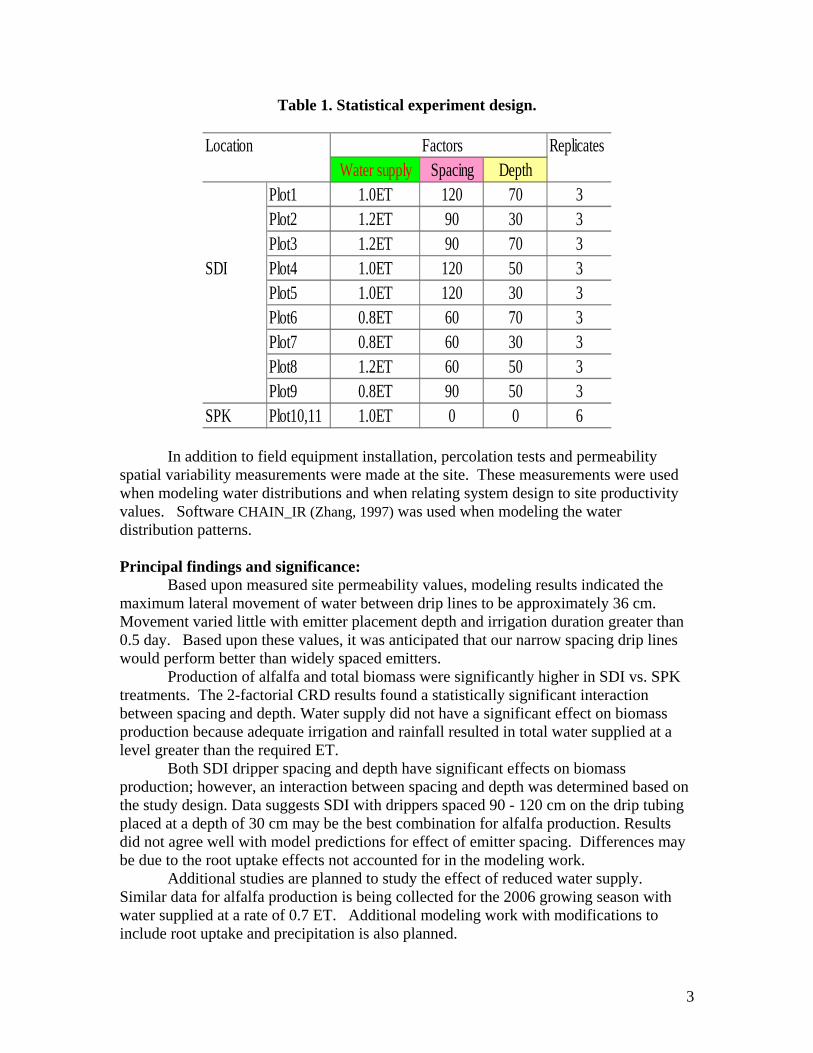
Table 1. Statistical experiment design.
Location Factors ReplicatesWater supply Spacing Depth
Plot1 1.0ET 120 70 3Plot2 1.2ET 90 30 3Plot3 1.2ET 90 70 3
SDI Plot4 1.0ET 120 50 3Plot5 1.0ET 120 30 3Plot6 0.8ET 60 70 3Plot7 0.8ET 60 30 3Plot8 1.2ET 60 50 3Plot9 0.8ET 90 50 3
SPK Plot10,11 1.0ET 0 0 6
In addition to field equipment installation, percolation tests and permeability spatial variability measurements were made at the site. These measurements were used when modeling water distributions and when relating system design to site productivity values. Software CHAIN_IR (Zhang, 1997) was used when modeling the water distribution patterns. Principal findings and significance:
Based upon measured site permeability values, modeling results indicated the maximum lateral movement of water between drip lines to be approximately 36 cm. Movement varied little with emitter placement depth and irrigation duration greater than 0.5 day. Based upon these values, it was anticipated that our narrow spacing drip lines would perform better than widely spaced emitters.
Production of alfalfa and total biomass were significantly higher in SDI vs. SPK treatments. The 2-factorial CRD results found a statistically significant interaction between spacing and depth. Water supply did not have a significant effect on biomass production because adequate irrigation and rainfall resulted in total water supplied at a level greater than the required ET.
Both SDI dripper spacing and depth have significant effects on biomass production; however, an interaction between spacing and depth was determined based on the study design. Data suggests SDI with drippers spaced 90 - 120 cm on the drip tubing placed at a depth of 30 cm may be the best combination for alfalfa production. Results did not agree well with model predictions for effect of emitter spacing. Differences may be due to the root uptake effects not accounted for in the modeling work.
Additional studies are planned to study the effect of reduced water supply. Similar data for alfalfa production is being collected for the 2006 growing season with water supplied at a rate of 0.7 ET. Additional modeling work with modifications to include root uptake and precipitation is also planned.
3

Meetings and Presentations: Youquan Jiang, Drew W. Johnson, George F. Vance and David E. Legg. Subsurface Drip Irrigation for Alfalfa Production in Wyoming, University of Wyoming Graduate Research Symposium, April 2006. Student Support: Youquan Jiang, MS, Renewable Resources, University of Wyoming Xinmei Hao, PhD, Renewable Resources, University of Wyoming Christopher York, BS Civil Engineering, University of Wyoming Diogo Lousa, BS Civil Engineering, University of Wyoming Dan McGillvary, BS Civil Engineering, University of Wyoming Selected References: Ayers, J.E., C.J. Phene, R.B. Hutmacher, K.R. Davis, R.A. Shoneman, S.S. Vail and
R.M. Mead. 1999. Subsurface drip irrigation of row crops: A review of 15 years of research at the Water Management Research Laboratory. Agricultural Water Management 42:1-27.
Pochop, L., T. Teegarden, G. Keer, R. Delaney and V. Hasfurther. 1992. Consumptive Use and Consumptive Irrigation Requirements in Wyoming. Report to the Wyoming Water Resources Center. WWRC 92-06. 59 pp.
Wyoming Agricultural Statistics. 2005. USDA National Agricultural Statistics Service, College of Agriculture, UW.
Zhang, R. 1997. CHAIN_IR, Irrigation simulations of water flow and solute transport with nitrogen transformation. Research Bulletin No. B-0888, College of Agriculture, University of Wyoming, 34pp.
4

Conveyance Losses and Travel Times of Reservoir ReleasesAlong the Bear River from Woodruff Narrows Reservoir toCokeville Wyoming
Basic Information
Title: Conveyance Losses and Travel Times of Reservoir Releases Along the Bear Riverfrom Woodruff Narrows Reservoir to Cokeville Wyoming
Project Number: 2003WY13B
Start Date: 3/1/2003
End Date: 2/28/2006
Funding Source: 104B
Congressional District: 1
Research Category: Climate and Hydrologic Processes
Focus Category: Agriculture, Hydrology, Irrigation
Descriptors: None
Principal Investigators: Drew W Johnson, Greg Kerr
Publication1. Kunz, B.G., Johnson, D. W. and Kerr, G., Return Flows, Re-Diversion, and Irrigation Performance
Measures for Water Taken from the Bear River in Wyoming and Utah, Kunz, W., Johnson, D. W.and Kerr, G. , Journal of Irrigation and Drainage Engineering, Submitted for Publication August2005, notified revisions are required before publication.
2. Franz, T., 2005. A Water Budget Analysis for Predicting Return Flow on the Bear River in Wyomingand Utah, MCE Plan B Paper, Department of Civil & Architectural Engineering, University ofWyoming, Laramie WY.
3. Kunz, W., 2005. Return Flows, Re-Diversion, and Losses Associated With the Bear River InWyoming and Utah, M.S. Thesis, Department of Civil & Architectural Engineering, University ofWyoming, Laramie WY.

Problem and Research Objectives: The Bear River is the longest river in the United States without an ocean outlet. It
originates in the Uinta Mountains of Utah and flows north to Wyoming, Idaho, and back to Utah and releases its water into the Great Salt Lake. With the extreme drought experienced in the late 90’s and early part of the new millennium, the accuracy to which water is allocated has become increasingly important. The Bear River is a vital lifeline to farmers, ranchers, industry and municipalities in Utah, Wyoming, and Idaho; therefore, knowledge of its water losses, gains and general fluctuations are of vital importance. The Bear River between Woodruff Narrows reservoir and Pixley diversion dam is a reach with 17 irrigation diversions that cause enormous amounts of return flow in the system. This study examined many factors that may be of interest to the irrigators in the Bear River region. Estimates for conveyance losses were developed over two irrigation seasons as were approximations of gains, seasonal losses, and re-diversion proportions. Also included in the study are estimates of travel time and return flow timing to aid irrigators in approximating the time that water may become available to them. Methodology: Gage Installation
Analyzing years of historical data made it evident that it would not provide the information needed for this study. The data obtained from the USGS and state water agencies only allowed the region to be sectioned in to one large reach, and did not allow the prediction of return flows that may occur in Utah and prior to the Wyoming state line. More detailed analysis was needed to determine gaining and losing reaches, and what river sections contributed most of the return flows. Historical data only showed that the system experienced large return flow and overall seasonal loss, but could not provide the insight required for a thorough study including the detail necessary for conveyance loss estimates. Due to the lack of data, three new gaging sites were established. The new gages installed on April 27, 2004 allowed the breakdown of the river into four reaches from Woodruff Narrows to Pixley Dam. The new gaging sites were chosen based on the input of Kevin Wilde of Wyoming and Ron Hoffman of Utah, both of which are hydrographers for their respective states. The Cornia, Thornock, and Weston bridges along the Utah section of the Bear River were chosen as the new gaging sites. Bridges were chosen because they allow easy gage access and a solid anchor for the new gages. Also, the bridges were spread out in a way that allowed data collection on the Utah section which would provide the most useful data for determining return flow and loss before the Wyoming state line. Gains and System Losses
A water balance was used to determine total loss, return flows, and re-diversion proportions over irrigation seasons. The system was analyzed on a cumulative basis which allowed the irrigation seasons to be viewed as the reservoir release of one large slug of water from May 1 until July 15, when the majority of diverted flow ceases for the summer. As the slug becomes cumulatively larger on a daily basis, the effects of outflow are incorporated to determine if the slug is losing, gaining, or experiencing re-diverted proportions. Cumulative values were calculated based on two river gages and seventeen diversion gages. Historical data for 1988, and 1993-2003 was analyzed based on the two river gages operated by the USGS that accounted for flow entering and leaving the system. The two USGS river gages that exist on the reach are gage 10020300 located

below the dam at Woodruff Narrows, and gage 1028500 located below Pixley Dam. Flow data for the USGS gage below Pixley are available from the 1940’s to present, while historic data for the gage below the dam at Woodruff Narrows dates back to 1961. For the separate analysis done for 2004 and 2005, three additional gages were installed in the Utah section of the river. Wyoming diversion data was obtained from Wyoming Division IV Hydrographer’s Annual reports. Although this data was available from as far back as the 1970’s, some diversions were missing from several years. Utah diversion data was acquired from the water rights website www.waterrights.utah.gov. The final historical data set included the USGS flow records for both gages on the reach along with all diversion flow for 1988, and1993-2004. Consumed water
Consumptive irrigation requirements (CIR) were calculated over the study period and compared to system loss values in an attempt to estimate how well diverted water was being utilized. CIR values can be calculated as precipitation subtracted from the crop’s evapotranspiration (ET) values. The SCS Blaney-Criddle approach was used to calculate the crop’s ET values. Effective precipitation to the area was determined from weather stations and applying the effective precipitation coefficient of 0.8 provided by the Wyoming State Water Plan for the Bear River Basin. Conveyance losses and travel times
Conveyance losses were calculated based on hydrographs. New hydrographs were developed from the three new gages and allowed the entire reach to be sectioned into shorter reaches that were not as heavily influenced by return flows as the overall system. An incremental approach was used to measure conveyance losses because it helped eliminate the confusion associated with any re-diverted flow that occurred in a reach. The conveyance losses were calculate from difference in the change in inflow and outflow, including diversions, for a given reservoir release for each reach.
Travel times were important to three parts of the study: matching hydrologic events for conveyance loss estimates, estimating reservoir release lag times, and return flow lag times. A graphical approach was used for travel time estimates that involved the matching of increased flow periods that correspond to the same hydrologic event. Typically, the time lag between the maximums on the inflow and outflow hydrographs is estimated by observing the time difference between the visible maximums on the hydrographs. In this particular study, maximums were believed to be shortened by high amounts of diverted flow; therefore instead of comparing lag time to peaks, the difference between the rising limbs in flow were observed and used as the travel time. Diversion Efficiencies
With the installation of the three gages, it was possible to estimate the diversion efficiency of each canal, return flow lag times and return flow quantities for each reach. A GIS analysis was used to find irrigated areas for each canal based on surface runoff by gravity. This allowed an estimate of where return flows entered the system. A water budget analysis was used to estimate volumes of return flow and predict outflow for each reach. The diversion efficiencies were calculated based upon the constraint that total return flows generated by the diversions must match the measured return flows for the connected reaches and in the analysis and timing of return flows generated was assumed to vary with inversely with diversion distance away from the reaches.
Principal Findings and Significance: The re-diversion proportion for wet, average, and dry years was estimated as 84%,
111%, and 153% of inflow, respectively. These proportions were based on cumulative plots that spanned the time period of May 1 – July 15 which is the main period of irrigation. Gains are the amount of positive imbalance to the system that can be mostly attributed to return flows.
The gains for wet, average, and dry years for the historical data examined in this study were 72%, 62% and 44% of diverted flow, respectively. On average, 62% of all diverted flow returns to the main channel of the river. For 2004 Wyoming showed gains of 105% proportional to diverted flow while Utah showed 41% gains. The high gain proportion in Wyoming is likely due to Wyoming’s dependency on Utah return flows, which enter the Wyoming section without being gaged; therefore, making the amount of diverted flow in Wyoming high proportional to inflow.
System losses were calculated for the historical data (1988, 1993-2004) and for wet, average, and dry years were 22%, 41%, and 86% of inflow, respectively. For 2004 system loss by state was determined for Wyoming and Utah as 62%, and 63%, respectively as a proportion of diverted flow. Diverted flow was used to relate the reaches as opposed to inflow because inflow is not a good representation of available water to the Wyoming reach because it is thought that Wyoming uses a great deal of Utah return flows.
Based upon the suitability of the hydrographs for analysis, conveyance losses were determined for two reaches. Reach 3 (Between the Thornock, and Weston bridges) showed conveyance losses of 0.68% and 0.56% per km (1.1% and 0.9% per mile) for first and second releases respectively; therefore, yielding an average loss of 0.62% per km (1.0% per mile). Reach 4 (Between Weston Bridge and Pixley Diversion Dam) exhibited losses of nearly zero which does not agree with the two loss measurements in Reach 3. Due to the repeatability of the loss estimates in Reach 3, and the idealistic nature of its system, the average conveyance loss of 1.0% per mile found in Reach 3 is thought to be the most representative and accurate estimate for conveyance losses in the entire system for 2004. For the 2005 data, the analysis was repeated. However, 2005 was a very wet year; in the analysis for 2005 each reach was found to be a gaining reach with unstable return flows being generated throughout the irrigation season and not enough data was available to make an accurate estimate of conveyance losses. This is most likely explained because of the considerable difference in available water and the increased flow of water in the Bear River during 2005. During the period of May 1 through September 30 the peak flow for 2005 was 1,185 cubic feet per second while in 2004 experienced only 869 cubic feet per second, a difference of over 300 cubic feet per second. Between May 1 and July 14, 2005, 145.3 MCM (118,118 acre feet) of water flowed past the Woodruff Narrows gage, but only 55.7 MCM (45,275 acre feet) flowed past the same gage during the same time period in 2004.
Travel times within the channel in 2004 were estimated for the sections of river from Woodruff Narrows Reservoir to Cornia, Thornock, and Weston bridges, and BQ and Pixley diversion dams; the graphical estimates were 1, 2, 3, 3.8, 4, and 5 days respectively. Return flow lag times were approximated and help show Wyoming’s dependency on Utah’s returns. Although it is believed that Wyoming receives Utah’s returns throughout the irrigation season, the Wyoming reach during 2004 received the majority of returns from Utah after June 23. The lag time was approximately 53 days, or the time from May 1 to June 23. An analysis of 2005 data confirmed this estimate.

The modeling results of the 2004 data resulted in diversion efficiencies (Deff) of around 30%, for all canals which matched the historical values reviewed. Modeling with 2005 data resulted in lower diversion efficiencies of approximately 20% for the larger canals. The wet hydrologic conditions of 2005 resulted in significant gains from the system and the large contributing areas of these larger canals magnified the gains, which lowered the diversion efficiency considerably. Modeling results indicated that return flows occurred primarily within two months in for the drier 2004 data year. The wetter 2005 data year indicated approximately 10% of return flow occurred in the third month after diversion. Further data should be used to verify the model and the capabilities of the model. Students Supported: Nicholas Charles, MS Civil Engineering, University of Wyoming, Current Trenton Franz, M. Civil Engineering, University of Wyoming, Fall 2005 William Kunz, MS Civil Engineering, University of Wyoming, Fall 2005 Meetings and Presentations: “Re-diversion Proportions on the Bear River”, Bear River Advisory Group, Cokeville
Wyoming, October 2004. “Bear Lake Eco Symposium and Annual Meeting of Bear River affiliates” September 2004 “Conveyance Losses on the Bear River” Wyoming State Engineers office, Utah State
Engineers Office, Cokeville Wyoming, January 2004. “Conveyance Losses on the Bear River”, Bear River Advisory Group, Kemmer Wyoming,
July 2003.

Land Use Impacts on Nitrogen Fixation in Jackson Hole Streams
Basic Information
Title: Land Use Impacts on Nitrogen Fixation in Jackson Hole Streams
Project Number: 2005WY23B
Start Date: 3/1/2005
End Date: 2/28/2007
Funding Source: 104B
Congressional District: 1
Research Category: Biological Sciences
Focus Category: Surface Water, Nitrate Contamination, Ecology
Descriptors:
Principal Investigators: Robert O. Hall
Publication

Abstract: Pollution from excess nitrogen (N) threatens many freshwater and marine
ecosystems with eutrophication. Rivers and streams play a central role in N cycling at the landscape scale because rivers provide an avenue to transport N from the terrestrial landscape to downstream ecosystems. Rivers are more than conduits and may play a strong role in transforming or storing N. Changing land use in the Western US may alter how streams transform and process N. Currently we are studying how contrasting land use may affect N cycling in streams in Jackson Hole, WY. We are examining how land use alters the removal and fate of nitrate-nitrogen using experimental addition of 15N tracers. Missing from our studies is an understanding of how N fixation alters stream N budgets and cycling, and how land use may affect N fixation. In these streams, N-fixation (i.e., the creation of biologically available N from atmospheric N2) may be a dominant pathway for N input . We hypothesize that unimpacted streams will have high rates of N-fixation that drives the stream N budget, while hydrologically impacted streams (e.g., irrigation ditches) and streams with elevated nitrate concentrations will have lower N fixation rates. We will measure N fixation in the context of summer stream N budgets in 9 streams in and around Jackson Hole that we are using as part of our larger study. The 3 land use types are reference (unimpacted; streams in Grand Teton National Park), irrigated cattle pasture (streams on the Snake River Ranch), and suburban (Jackson Hole Golf Club and 2 streams in condominium developments). We will measure N fixation rates in each of these 9 streams using the acetylene reduction method calibrated with isotope measures. In 4 streams, we will estimate the importance of N fixation in the context of a stream reach nitrogen budget that considers inputs and outputs of N combined with rates of internal processing. Objectives: 1. Measure how land use and associated physical variables control N fixation rates in 9 streams. Hypothesis: N fixation rates in these high light streams will be highest in streams with low ambient N concentrations. We measured N-fixation in 9 streams in 3 land-use types during summer 2005 and will repeat the 3 highest streams in 2006. We are currently developing experimental protocols to use 15N2 to calibrate the acetylene reduction method; this method has not been attempted in streams. In summer 2006 we will perform an extensive comparison of the 15N2 method with the acetylene reduction method in the 3 streams with the highest N fixation rates. 2. Measure the degree to which N fixation dominates reach-scale N budgets. Hypothesis: In streams with high N fixation, N fixation will constitute a major fraction of the N budget in mid-summer. For 3 of the nine streams, we created a short-term budget of N at the scale of a 500-m stream reach. In each reach we measured N inputs, outputs, and nitrate and ammonium uptake. Much of the data for the N budget will be collected as part of our ongoing LINX project. We have the associated N fixation data for these streams (Fig. 1), but we are currently analyzing the associated budget data collected as part of the LINX experiment. 3. Examine controls of nitrogen and phosphorus on N fixation rates. As a mechanistic test of the effects of high nitrate we will perform the same nutrient addition experiment described below in streams with higher rates of N fixation. The
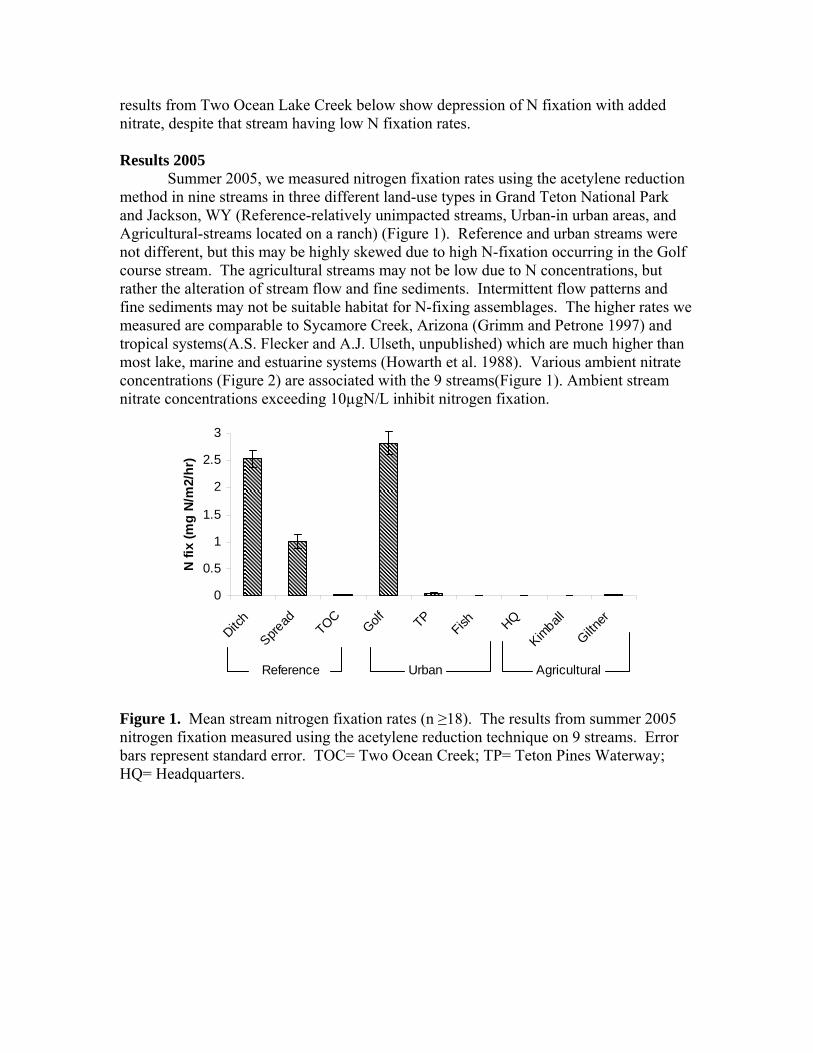
results from Two Ocean Lake Creek below show depression of N fixation with added nitrate, despite that stream having low N fixation rates. Results 2005 Summer 2005, we measured nitrogen fixation rates using the acetylene reduction method in nine streams in three different land-use types in Grand Teton National Park and Jackson, WY (Reference-relatively unimpacted streams, Urban-in urban areas, and Agricultural-streams located on a ranch) (Figure 1). Reference and urban streams were not different, but this may be highly skewed due to high N-fixation occurring in the Golf course stream. The agricultural streams may not be low due to N concentrations, but rather the alteration of stream flow and fine sediments. Intermittent flow patterns and fine sediments may not be suitable habitat for N-fixing assemblages. The higher rates we measured are comparable to Sycamore Creek, Arizona (Grimm and Petrone 1997) and tropical systems(A.S. Flecker and A.J. Ulseth, unpublished) which are much higher than most lake, marine and estuarine systems (Howarth et al. 1988). Various ambient nitrate concentrations (Figure 2) are associated with the 9 streams(Figure 1). Ambient stream nitrate concentrations exceeding 10µgN/L inhibit nitrogen fixation.
0
0.5
1
1.5
2
2.5
3
Ditch
Spread
TOCGolf TP
Fish HQ
Kimball
Giltner
N fix
(mg
N/m
2/hr
)
Reference Urban Agricultural
Figure 1. Mean stream nitrogen fixation rates (n ≥18). The results from summer 2005 nitrogen fixation measured using the acetylene reduction technique on 9 streams. Error bars represent standard error. TOC= Two Ocean Creek; TP= Teton Pines Waterway; HQ= Headquarters.

0
1020
3040
50
6070
80
0 0.5 1 1.5 2 2.5 3
N fixation (mgN/m2*hr)
Nitr
ate
conc
entr
atio
n (u
gN/L
)
ReferenceUrbanAgricultural
-----------------------------------------------------------------------------
Figure 2. Ambient stream nitrate concentrations exceeding 10μgN/L have low nitrogen fixation rates. The only exception from this study would be Headquarters which has 0.7 µgNO3-N/L and 0.002mg N m-2 h-1 nitrogen fixation rate. Headquarters has predominately silt substrate and intermittent flow. To examine nutrient limitation on N-fixing assemblages, nutrient releasing substrates were incubated in Two Ocean Lake Creek at five sites. Four treatments (control, N, P, N+P) were implemented according to Tank and Dodds (2003). Nitrogen fixation was significantly inhibited by the addition of nitrate (Figure 3). It appears as if phosphorus addition stimulates nitrogen fixation, but it is not statistically significant. This stream had low stream nitrogen fixation rates and results from streams with the highest nitrogen fixation rates may show larger increases in N- fixation due to phosphorus stimulation.
00.010.020.030.040.050.060.070.08
C N P N+P
Treatment
N 2-fix
atio
n/C
hl a
(m
g N
/m2 *
hr)/(
ug/c
m2 )
* *
Figure 3. Mean treatment nitrogen fixation rates(n=5). Error bars represent standard error. Addition of nitrogen inhibits N-fixation, while addition of phosphorus may stimulate N-fixation.

Student Support Lisa Neerhof is funded for 2 years towards a Ph.D. in the department of Zoology
and Physiology. Lisa started graduate school in Fall 2004, and has performed one summer of fieldwork on this project. One undergraduate student was hired last summer to assist with field work and lab work. During summer 2005 we hired Jon Hefner, a junior from Nebraska in the Dept. of Zoology and Physiology. Marci Trana, a University of Wyoming student was hired in Fall 2005 to assist with lab work. Additionally using National Science Foundation funds we hired a Leslie Henry, a Research Experience for Undergraduates student who examined how nutrients control N fixation. Leslie is a Biology major at UW from Cody, WY. References Grimm, N.B., and K.C. Petrone. 1997. Nitrogen fixation in a desert stream ecosystem.
Biogeochemistry 37:33-61. Howarth, R.W., R.M. Marino, J. Lane, and J.J. Cole. 1988b. Nitrogen fixation in
freshwater, estuarine, and marine ecosystems.1.Rates and importance. Limnology and Oceanography 33:669-687.
Tank, J.L. and W.K. Dodds. 2003. Nutrient limitation of epilithic and epixylic biofilms in ten North American streams. Freshwater Biology 48:1031-1049.
Real-Time Monitoring of E. Coli Contamination in Wyoming
Basic Information
Title: Real-Time Monitoring of E. Coli Contamination in Wyoming
Project Number: 2005WY24B
Start Date: 3/1/2005
End Date: 2/28/2008
Funding Source: 104B
Congressional District: 1
Research Category: Water Quality
Focus Category: Water Quality, Methods, None
Descriptors:
Principal Investigators: Paul E. Johnson
Publication
Abstract This project will demonstrate the feasibility of economical, simultaneous, real-time
detection of individual Escherichia coli and their viability in surface waters. The Clean Water Act requires states to monitor surface waters for fecal coliforms or specifically for E. coli. Fecal coliform monitoring is an indicator of the sanitary quality of the water and can determine the extent of fecal contamination in the water from warm-blooded animals. A low-cost, portable, highly sensitive, self-contained single cell detection system for E. coli enumeration is being developed for rapid monitoring of surface waters, including streams, rivers, and lakes. With first-year USGS/WWDC funding, the P-I and his team have demonstrated and significantly improved an innovative technique for detection of pathogenic microorganisms in surface water, economically and in real time. This technology is based on LED-induced fluorescence of antibody- and DNA-labeled cells. The project will demonstrate the detection of individual E. coli simultaneously in two wavebands in order to detect and determine viability of individual microorganisms. The suspended bacteria are stained using both an immunofluorescent antibody and a fluorescent cell viability label. The resulting aqueous sample is passed as a stream in front of an LED, which excites the fluorescent labels (Figures 1 and 2). The resulting fluorescence is measured with a CCD or CMOS imager using an innovative integration scheme (called Fountain Flow), giving a dramatically higher signal-to-noise ratio than conventional techniques. In addition, we are investigating the extension of the fountain flow technology to imaging, to provide increased discrimination capability among E. coli, other biological particles, and small geological particles.
The major tasks of this project are to: 1.) fabricate and test a two-color, LED-illuminated detection system in order to simultaneously detect and determine the viability of E. coli, 2.) perform laboratory measurements on quantified E. coli samples to determine the detection efficiency and sensitivity of the two-color monitoring system, 3.) enumerate E. coli in stream and lake water samples using both our proposed method and the standard method currently recommended by the US Environmental Protection Agency, 4.) determine the feasibility of a rare-cell, fountain flow imaging system based on an extension of our current technology, and 4.) fabricate and test a prototype fountain flow imaging system for proof of concept.
Progress Report, First 12 Months of Funding
We are testing and engineering improvements on a low-cost, portable, highly sensitive, self-contained single cell detection system for E. coli in surface waters, which will greatly exceed the current testing procedures in both speed and reliability. The goal of this project is the development of 1) a low-cost, rapid (<< 1 hour test), sensitive (< 5 cells/ml), portable, easy to use system for E. coli detection in raw surface water. Our objectives are to: 1) develop and test a system for simultaneous detection and viability testing of E. coli and 2) develop and test a proof-of-concept prototype for multi-spectral high resolution FF imaging. This proof of concept will allow for the design and fabrication of a remote monitoring system that will automatically screen water in real time. Alternative methods necessitate the shipping of bulk water samples or concentrates to laboratories and labor-intensive screening technologies, which may include bulk water concentration, incubation, and culturing. These factors combine to impede overall routine monitoring for fecal coliforms in the field and preclude widespread, routine screening of surface waters. In the first 12-months of year 1 funding, we have:
• designed and successfully ray-traced a two-color detection system for fabrication, • ordered parts and have begun fabrication of a two-color detection system for testing this
summer,

• performed successful proof of concept experiments for a fountain flow (FF) imaging system, using a syringe pump to consistently stop fluorescent beads in the focal plane of the FFC,
• successfully concluded experiments on a dye combination allowing for the detection of pathogenic amoebae in a natural water samples with high concentrations of chlorophyll bearing organic material,
• submitted a paper on the detection of E. coli in water to the journal Cytometry, • are preparing a paper for submission this spring on the detection of amoebae in natural
river water, against a background of organic detritus, to the Journal of Applied and Environmental Microbiology (AEM), and
• submitted a patent application for the software control of FF. The paper that we have written and are about to submit to AEM concerns the use of
Fountain Flow Cytometry (FFC) for detection of protozoa in raw water with an LED-illuminated FFC system. The system was tested with a flow throughput of 50 ml/minute and amoebae concentrations of 0.06 to 3 amoebae/ml. Two dyes were used, Chemchrome V6, a viability dye, and and R Phycoerytherin immunolabel. Detections were made one color at a time. In addition, water samples for the Laramie River as well as seven French rivers were sampled and tested for background autofluorescence from organic and non-organic material. These experiments, combined with our previous work on E. coli detection in water, showed that two-color simultaneous measurements will allow us to successfully separate living E. coli detections from background detritus.
Figure 1. The Wyoming Biodetection System Fountain Flow Cytometer, shown with peristaltic pump, and sampling reservoir

Flow Cell
X-Y Stage
Camera Lens
Effluent
CMOSCamera
35 mm LED
Illuminator
From PeristalticPump
Figure 2. Schematic diagram of an LED-illuminated epifluorescent Fountain Flow Cytometer. A sample of fluorescently tagged cells flows through the flow cell toward the CMOS camera and fore-optics. The cells are illuminated in the focal plane by an LED. When the cell(s) pass through the CMOS camera focal plane they are imaged by the camera and lens assembly through the transparent flow cell window, and a filter that isolates the wavelength of fluorescence emission. The fluid in which the cells are suspended then passes by the window and out the flow cell drain tube. Student Support
During Year I, the P-I employed one undergraduate Pre-Med student, Chris Havens, and one Pharm. D. student, Tony Deromedi, in this research. The interaction among personnel of varying backgrounds (including microbiology, pharmacy, and physics) has provided a highly educational experience for everyone in research biodetection technology.
Presentations and Products Two invited papers presented at the 2005 Cytometry Development Workshop, Asilomar, California:
1. High-Throughput-Axial Imaging Flow Cytometry with LED illumination 2. Imaging Flow Cytometry
Patents Pending 1. Methods for Separating Microorganisms from a Food Matrix for Biodetection, patent pending,
A. Votaw and P.E. Johnson. 2. High Resolution Imaging Flow Cytometry, patent pending, P.E. Johnson
3. Method and System for Counting Particles in a Laminar Flow with an Imaging Device, patent pending, P.E. Johnson.
Innovative Technology Development to Maximize Beneficial Useof Produced Water from Coal Bed Natural Gas Operations inthe Powder River Basin, Wyoming
Basic Information
Title:Innovative Technology Development to Maximize Beneficial Use of ProducedWater from Coal Bed Natural Gas Operations in the Powder River Basin, Wyoming
Project Number: 2005WY25B
Start Date: 3/1/2005
End Date: 2/28/2007
Funding Source: 104B
Congressional District: 1
Research Category: Biological Sciences
Focus Category: Treatment, Geochemical Processes, Water Use
Descriptors:
Principal Investigators: George Floyd Vance, Girisha K. Ganjegunte, Ronald C. Surdam
Publication1. Vance, G.F., L.A. King and G.K. Ganjegunte. 2004. Coalbed methane co-produced water:
Management options. Reflections, Univ. Wyo., June 2004 issue. pp. 31-34. 2. King, L.A., J. Wheaton, G.F. Vance and Ganjegunte, 2004. Water issues associated with coalbed
methane [natural gas] in the Powder River Basin of Wyoming and Montana. Reclamation Matters.Vol 2. Pp. 7-12.
3. Ganjegunte, G.K., G.F. Vance and L.A. King, 2005. Soil chemical changes resulting from irrigationwith water co-produced with coalbed natural gas. Journal of Environmental Quality 34:2217-2227
4. Ganjegunte, G.K., G.F. Vance and L.A. King, 2004. Impacts of land application disposal ofsaline-sodic coalbed methane water on soil physical and chemical properties in Wyoming. Livingwith Coalbed Methane. Montana Soil and Water Conservation Society Proceedings, Billings, MT.

Abstract Wyoming has experienced rapid growth in the development of its coalbed natural gas
(CBNG), resources. CBNG exploration and production is expected to continue to increase in the Powder River Basin (PRB) as well as other areas of Wyoming. One of the most contentious issues surrounding CBNG production is what to do with all the produced water that must be removed to allow coal seams to degas? Legislation has been proposed within the Wyoming Senate to form “a high level task force investigation into alternative uses of water produced in coal-bed methane production”. Beneficial use of CBNG co-produced waters is therefore essential for enhancing gas production and environmental sustainability. The primary concern with CBNG produced waters is the amount and influence sodium (Na+) (as defined by the sodium adsorption ratio (SAR)) has on soils, vegetation, wildlife and livestock in different environments, e.g., streams, agricultural lands, rangelands, and other PRB ecosystems. We are researching the development of an economic, viable water treatment system based on cation exchange between a natural zeolite and CBNG waters. Research has indicated that there is a significant reduction in the amount of Na+ and a lowering of SAR in CBNG produced waters after these waters are processed with the zeolitic materials. Our research includes three primary tasks: 1) determination of cation exchange capacity (CEC), exchangeable cations, and volumetrics of selected zeolites deposits; 2) evaluation of the potential for cation exchange reactions between CBNG produced water and natural zeolite-rich deposits to reduce CBNG water SAR’s; and 3) design of an economic, viable water treatment scenario based on cation exchange between natural zeolite and CBNG produced waters. Several of the subtasks associated with tasks 1 and 2 have been addressed. Additional research is being conducted on tasks 1 and 2, and research associated with task 3 will be done during the second year of this project. Research is determining the exchange and kinetic reactions between CBNG waters and the Ca-rich zeolite to formalize and quantify the exchange process. Industry, land owners, and downstream users will benefit from this new method of reducing Na+ and lowering SARs of CBNG waters. Introduction
Development of CBNG in the PRB of Wyoming and Montana has increased dramatically in the past 10 years, resulting in significant CBNG and several environmental and regulatory issues (Ayers 2002, RIENR 2005). One of the issues involves the release of copious quantities of groundwater removed to recover the natural gas (King et al. 2004c, Vance et al. 2004). Not only are the thick coals in the PRB rich in natural gas, they are also important regional aquifers (Wheaton and Metesh 2002). In order to produce the absorbed natural gas from the coals, formation pressures must be reduced by removal of water. Existing data strongly suggest that CBNG activities in the PRB will expand west into deeper coals (Figure 1), that the quality of water from the coal will deteriorate, and that the volume of the water per well will increase significantly (BLM 2003). CBNG stakeholders in the PRB have focused on the disposal of the water. As a consequence a very contentious atmosphere has evolved around CBNG activities. Most of the contention surrounding CBNG water would be eliminated if a significant portion of the waters could be put to beneficial use (King et al. 2004c, Vance et al. 2004).
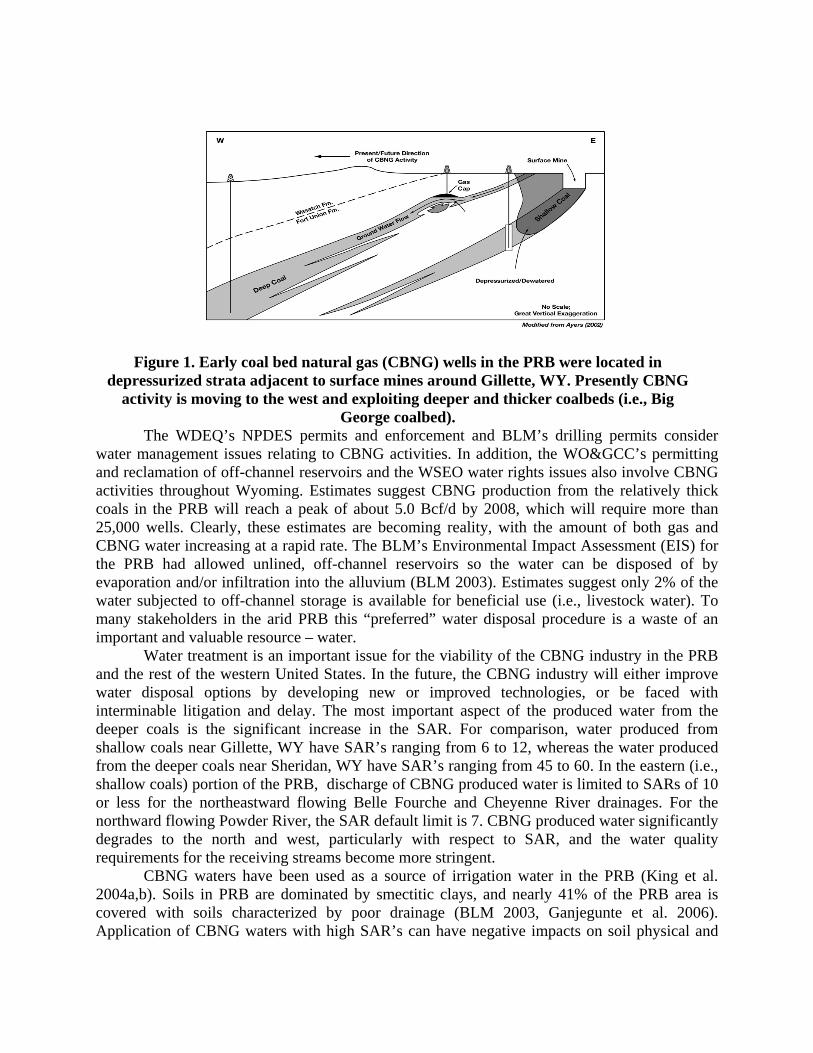
Figure 1. Early coal bed natural gas (CBNG) wells in the PRB were located in
depressurized strata adjacent to surface mines around Gillette, WY. Presently CBNG activity is moving to the west and exploiting deeper and thicker coalbeds (i.e., Big
George coalbed). The WDEQ’s NPDES permits and enforcement and BLM’s drilling permits consider
water management issues relating to CBNG activities. In addition, the WO&GCC’s permitting and reclamation of off-channel reservoirs and the WSEO water rights issues also involve CBNG activities throughout Wyoming. Estimates suggest CBNG production from the relatively thick coals in the PRB will reach a peak of about 5.0 Bcf/d by 2008, which will require more than 25,000 wells. Clearly, these estimates are becoming reality, with the amount of both gas and CBNG water increasing at a rapid rate. The BLM’s Environmental Impact Assessment (EIS) for the PRB had allowed unlined, off-channel reservoirs so the water can be disposed of by evaporation and/or infiltration into the alluvium (BLM 2003). Estimates suggest only 2% of the water subjected to off-channel storage is available for beneficial use (i.e., livestock water). To many stakeholders in the arid PRB this “preferred” water disposal procedure is a waste of an important and valuable resource – water.
Water treatment is an important issue for the viability of the CBNG industry in the PRB and the rest of the western United States. In the future, the CBNG industry will either improve water disposal options by developing new or improved technologies, or be faced with interminable litigation and delay. The most important aspect of the produced water from the deeper coals is the significant increase in the SAR. For comparison, water produced from shallow coals near Gillette, WY have SAR’s ranging from 6 to 12, whereas the water produced from the deeper coals near Sheridan, WY have SAR’s ranging from 45 to 60. In the eastern (i.e., shallow coals) portion of the PRB, discharge of CBNG produced water is limited to SARs of 10 or less for the northeastward flowing Belle Fourche and Cheyenne River drainages. For the northward flowing Powder River, the SAR default limit is 7. CBNG produced water significantly degrades to the north and west, particularly with respect to SAR, and the water quality requirements for the receiving streams become more stringent.
CBNG waters have been used as a source of irrigation water in the PRB (King et al. 2004a,b). Soils in PRB are dominated by smectitic clays, and nearly 41% of the PRB area is covered with soils characterized by poor drainage (BLM 2003, Ganjegunte et al. 2006). Application of CBNG waters with high SAR’s can have negative impacts on soil physical and
chemical properties (Ganjegunte et al. 2005). Irrigating soils with high SAR water can result in dispersion of soil clay particles and organic matter, resulting in surface crusting, reduced infiltration, and lower hydraulic conductivity, which could lead to poor vegetation growth (Vance and Stevens 2003). In order to avoid permanent damage to fragile PRB agricultural and rangeland ecosystem, it is necessary to reduce the Na concentrations in the CBNG water so they can be used safely for irrigation (i.e., crop production) or discharged to natural drainages (i.e., recreation and wildlife).
The technology researched in this project is designed to solve the problem of CBNG Na-rich waters by using natural zeolite as cation exchangers to achieve targeted SAR levels in CBNG produced waters. If this technology is feasible in the PRB, a significant portion of CBNG produced water will be available for beneficial use, objections to CBNG activity will diminish, and the rate of drilling permit issuance will accelerate resulting in maximizing natural gas extraction. As a consequence, the rate and magnitude of the conversion of CBNG resources to energy reserves would increase substantially.
Objectives
The primary objective of our research is to develop an efficient, effective and affordable water treatment alternative that maximizes the beneficial use of CBNG produced water. In order to accomplish this objective, research is being conducted according to three tasks with several subtasks. Our three primary tasks include:
Task 1.0 – Determine cation exchange capacities (CEC), exchangeable cations, and volumetrics of selected zeolite deposits.
Task 2.0 – Evaluation of the potential for cation exchange reactions between CBNG produced water and natural zeolite deposits to reduce CBNG water SAR’s.
Task 3.0 – Design an economic, viable water treatment scenario based on cation exchange between natural zeolite and CBNG produced waters.
Progress Report
The advantages of utilizing material from natural zeolite deposits as a cation exchanger in the treatment of PRB CBNG produced water are as follows: 1) zeolite deposits are at or near the surface and are easy to mine; 2) deposits are generally of large volume; 3) deposits commonly are flat-lying; and 4) deposits are often characterized by high mineral purity (> 80%) (Ratterman and Surdam 1981). Therefore the mining costs of the zeolite deposits are very low (Mumpton 1978). Typically the cost of mining and preparation (i.e., crushing and sizings) of zeolite for the end use application is minor with respect to transportation costs. Therefore, although accurate cost estimates for utilizing zeolite will not be possible until the proposed bench experiments are completed, it is correct to conclude that zeolite is probably the only large volume, low-cost, and easily disposable cation exchanger available. Sample Locations
Zeolite samples were collected at several sites in Nevada, California, and New Mexico. These sites were chosen based on reported chemical analysis and CEC of these zeolite deposits. Two of the sites are active zeolite mines (Ash Meadows, NV and St. Cloud, NM) and one (Mud Hills, CA) has been inactive since 1999, but could be reopened at minimal cost. Following are brief descriptions of the sample locations and their geologic setting and history, along with their chemistry and CEC.
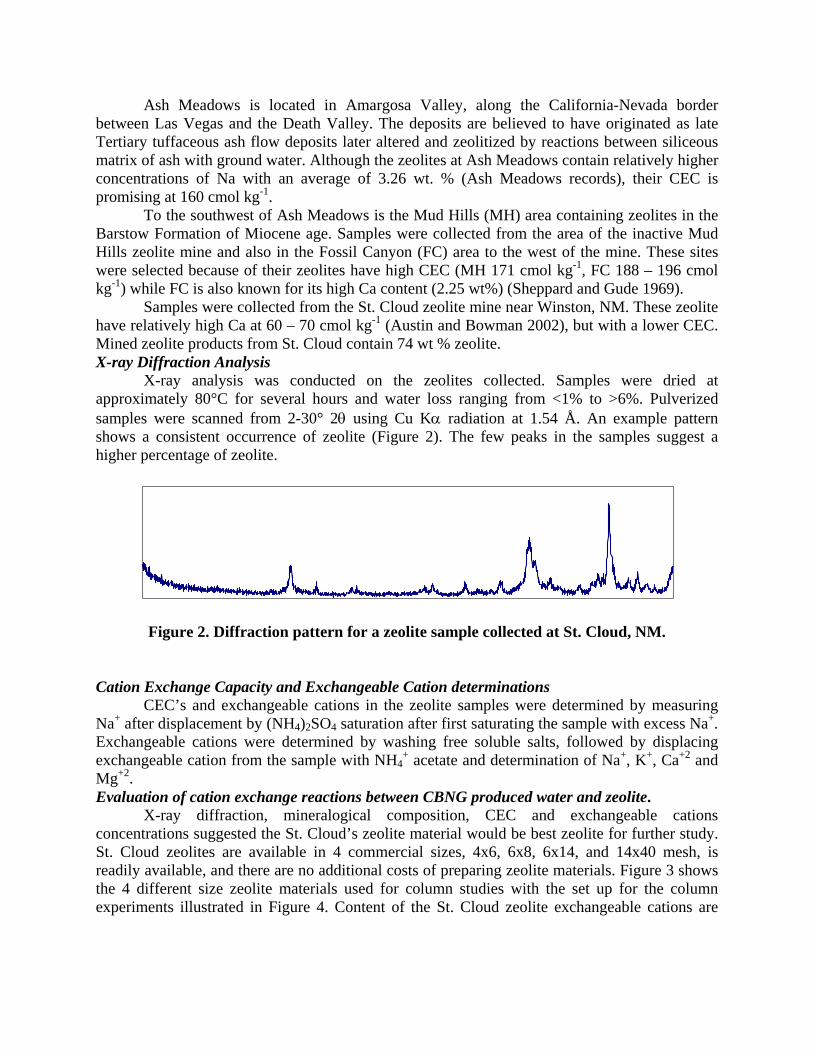
Ash Meadows is located in Amargosa Valley, along the California-Nevada border between Las Vegas and the Death Valley. The deposits are believed to have originated as late Tertiary tuffaceous ash flow deposits later altered and zeolitized by reactions between siliceous matrix of ash with ground water. Although the zeolites at Ash Meadows contain relatively higher concentrations of Na with an average of 3.26 wt. % (Ash Meadows records), their CEC is promising at 160 cmol kg-1.
To the southwest of Ash Meadows is the Mud Hills (MH) area containing zeolites in the Barstow Formation of Miocene age. Samples were collected from the area of the inactive Mud Hills zeolite mine and also in the Fossil Canyon (FC) area to the west of the mine. These sites were selected because of their zeolites have high CEC (MH 171 cmol kg-1, FC 188 – 196 cmol kg-1) while FC is also known for its high Ca content (2.25 wt%) (Sheppard and Gude 1969).
Samples were collected from the St. Cloud zeolite mine near Winston, NM. These zeolite have relatively high Ca at 60 – 70 cmol kg-1 (Austin and Bowman 2002), but with a lower CEC. Mined zeolite products from St. Cloud contain 74 wt % zeolite. X-ray Diffraction Analysis
X-ray analysis was conducted on the zeolites collected. Samples were dried at approximately 80°C for several hours and water loss ranging from <1% to >6%. Pulverized samples were scanned from 2-30° 2θ using Cu Kα radiation at 1.54 Å. An example pattern shows a consistent occurrence of zeolite (Figure 2). The few peaks in the samples suggest a higher percentage of zeolite.
Figure 2. Diffraction pattern for a zeolite sample collected at St. Cloud, NM. Cation Exchange Capacity and Exchangeable Cation determinations
CEC’s and exchangeable cations in the zeolite samples were determined by measuring Na+ after displacement by (NH4)2SO4 saturation after first saturating the sample with excess Na+. Exchangeable cations were determined by washing free soluble salts, followed by displacing exchangeable cation from the sample with NH4
+ acetate and determination of Na+, K+, Ca+2 and Mg+2. Evaluation of cation exchange reactions between CBNG produced water and zeolite.
X-ray diffraction, mineralogical composition, CEC and exchangeable cations concentrations suggested the St. Cloud’s zeolite material would be best zeolite for further study. St. Cloud zeolites are available in 4 commercial sizes, 4x6, 6x8, 6x14, and 14x40 mesh, is readily available, and there are no additional costs of preparing zeolite materials. Figure 3 shows the 4 different size zeolite materials used for column studies with the set up for the column experiments illustrated in Figure 4. Content of the St. Cloud zeolite exchangeable cations are

listed in Table 1, which were analyzed by extracting zeolites with NH4 acetate and quantification by using inductively coupled plasma spectrometry (Suarez 1999).
Table 1. Exchangeable cations concentrations (cmol(-) kg-1) in St. Cloud Zeolite materials.
Exchangeable cation concentrations 4x6 6x8 6x14 14x40
Sodium (Na+) 3 4 3 4 Potassium (K+) 7 11 10 12 Calcium (Ca2+) 61 68 73 77 Magnesium (Mg2+) 17 15 17 18 Effective CEC (cmolc kg-1) 87 97 104 111
The effective CEC of St. Cloud zeolite materials ranged from 87 to 111 cmolc kg-1.
Although this CEC value is less than those obtained for other deposits surveyed in this study, St. Cloud zeolite deposits were naturally enriched with Ca2+, which is the key to reduce SARs in CBNG water.
6 x 8
14 x 40
6 x 14
4 x 6
Figure 4. Column experiment setup used to evaluate the cation exchange kinetics between CBNG water and different sizes of St. Cloud
zeolites.
Figure 3. Different St. Cloud zeolite fractions used for column studies to evaluate cation exchange kinetics with CBNG water base
cations.
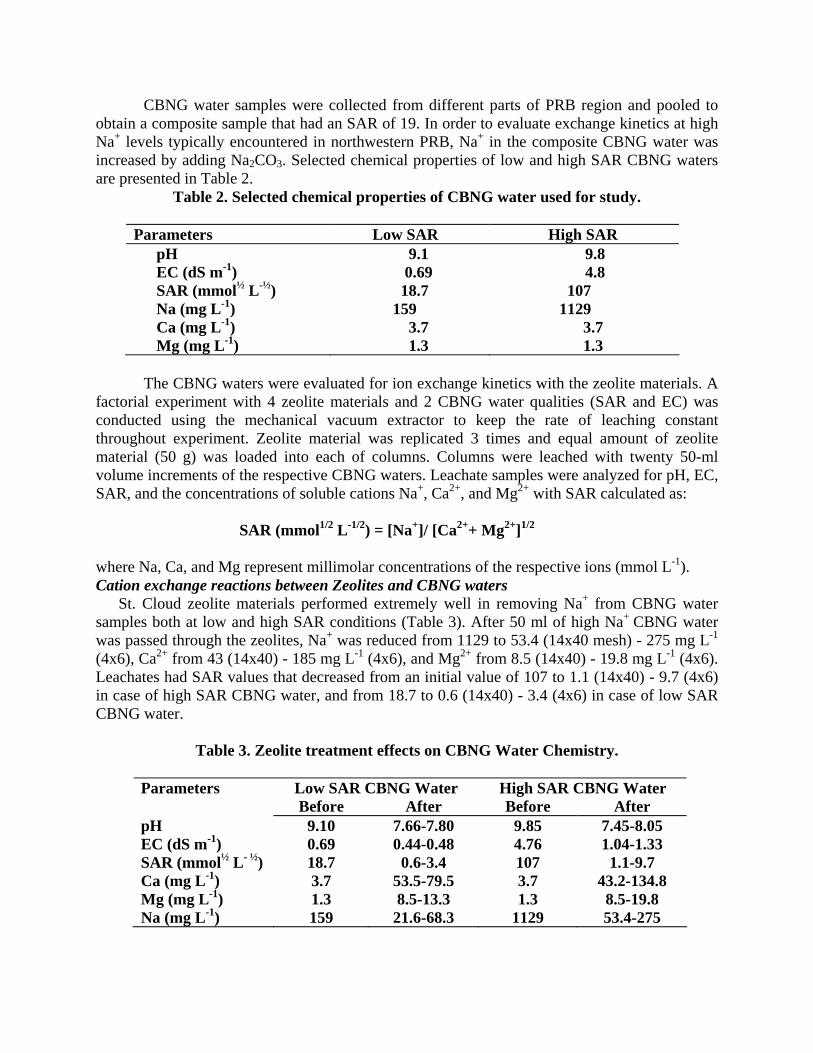
CBNG water samples were collected from different parts of PRB region and pooled to obtain a composite sample that had an SAR of 19. In order to evaluate exchange kinetics at high Na+ levels typically encountered in northwestern PRB, Na+ in the composite CBNG water was increased by adding Na2CO3. Selected chemical properties of low and high SAR CBNG waters are presented in Table 2.
Table 2. Selected chemical properties of CBNG water used for study.
Parameters Low SAR High SAR pH 9.1 9.8 EC (dS m-1) 0.69 4.8 SAR (mmol½ L-½) 18.7 107 Na (mg L-1) 159 1129 Ca (mg L-1) 3.7 3.7 Mg (mg L-1) 1.3 1.3
The CBNG waters were evaluated for ion exchange kinetics with the zeolite materials. A
factorial experiment with 4 zeolite materials and 2 CBNG water qualities (SAR and EC) was conducted using the mechanical vacuum extractor to keep the rate of leaching constant throughout experiment. Zeolite material was replicated 3 times and equal amount of zeolite material (50 g) was loaded into each of columns. Columns were leached with twenty 50-ml volume increments of the respective CBNG waters. Leachate samples were analyzed for pH, EC, SAR, and the concentrations of soluble cations Na+, Ca2+, and Mg2+ with SAR calculated as:
SAR (mmol1/2 L-1/2) = [Na+]/ [Ca2++ Mg2+]1/2
where Na, Ca, and Mg represent millimolar concentrations of the respective ions (mmol L-1). Cation exchange reactions between Zeolites and CBNG waters
St. Cloud zeolite materials performed extremely well in removing Na+ from CBNG water samples both at low and high SAR conditions (Table 3). After 50 ml of high Na+ CBNG water was passed through the zeolites, Na+ was reduced from 1129 to 53.4 (14x40 mesh) - 275 mg L-1 (4x6), Ca2+ from 43 (14x40) - 185 mg L-1 (4x6), and Mg2+ from 8.5 (14x40) - 19.8 mg L-1 (4x6). Leachates had SAR values that decreased from an initial value of 107 to 1.1 (14x40) - 9.7 (4x6) in case of high SAR CBNG water, and from 18.7 to 0.6 (14x40) - 3.4 (4x6) in case of low SAR CBNG water.
Table 3. Zeolite treatment effects on CBNG Water Chemistry.
Parameters Low SAR CBNG Water High SAR CBNG Water Before After Before After pH 9.10 7.66-7.80 9.85 7.45-8.05 EC (dS m-1) 0.69 0.44-0.48 4.76 1.04-1.33 SAR (mmol½ L- ½) 18.7 0.6-3.4 107 1.1-9.7 Ca (mg L-1) 3.7 53.5-79.5 3.7 43.2-134.8 Mg (mg L-1) 1.3 8.5-13.3 1.3 8.5-19.8 Na (mg L-1) 159 21.6-68.3 1129 53.4-275

Volume of CBNG water (Barrels / Ton of Zeolite)
0 100 200 300 400 500 600 700 800
% A
dded
Na
Rem
oved
0
20
40
60
80
100
120
SAR
(mm
ol1/
2 L-1
/2)
0
2
4
6
8
10
12
Sodium SAR
Figure 6. Reduction in cumulative CBNG water Na vs change in SAR using zeolite ion-exchange.
Figure 5 provides information on the cation exchange kinetics with progressive additions of high and low SAR CBNG water leached through zeolite samples. The Ca-rich zeolite materials removed significant amounts of Na+ from CBNG waters both at low and high SAR conditions (Figure 6). Initial leaching of high Na+
CBNG water through the zeolites resulted in a Na+ reduction from 1129 to 53.4 mg L-
1. Leachate SARs decreased from an initial value of 107 to <1.0 in the case of high SAR CBNG water, and from 18.7 to 0.6 in the case of low SAR CBNG waters. Based on column exchange reactions using high Na+ conditions, 1 ton of zeolite material will reduce 750 barrels of CBNG water with an SAR of 34 (typically encountered in m10. Thus the zeolite technology is an efficient, effective and affordable water treatment alternative that maximizes the beneficial use of CBNG water.
any parts of PRB region) to an accepted level of

y = -0.5171x2 - 23.415x + 1087.3R2 = 0.97
y = -0.7781x2 - 8.3806x + 933.24R2 = 0.97
y = -0.2615x2 - 17.455x + 915.95R2 = 0.97
0
200
400
600
800
1000
0.05 0.1 0.15 0.2 0.25 0.3 0.35 0.4 0.45 0.5 0.55 0.6 0.65 0.7 0.75 0.8 0.85 0.9 0.95 1
Volume (L)
mg
L-1
Figure 5. Amounts of Na removed (a, b), Ca (c, d) & Mg (e, f) added and changes in SAR values (g, h) with progressive additions of CBNG water with high and low SAR values.
y = 0.2876x2 - 40.358x + 944.95R2 = 0.98
1200 4x6
6x8
6x14
14x40
y = 0.0149x2 - 2.3121x + 100.58R2 = 0.80
y = -0.272x2 + 5.6183x + 77.055R2 = 0.42
160
y = -0.164x2 + 2.8014x + 99.7R2 = 0.48
y = -0.0114x2 - 2.3202x + 141.93R2 = 0.98
0
20
40
60
80
100
120
140
0.05 0.1 0.15 0.2 0.25 0.3 0.35 0.4 0.45 0.5 0.55 0.6 0.65 0.7 0.75 0.8 0.85 0.9 0.95 1
Volume (L)
mg
L-1
4x6
6x8
6x14
14x40
y = 0.5563x2 - 18.83x + 158.65R2 = 0.96
y = 0.1961x2 - 7.3113x + 65.916R2 = 0.94
y = 0.2839x2 - 8.7099x + 63.326R2 = 0.97
y = 0.2593x2 - 7.4003x + 48.663R2 = 0.93
-20
0
20
40
60
80
100
120
140
160
0.05 0.1 0.15 0.2 0.25 0.3 0.35 0.4 0.45 0.5 0.55 0.6 0.65 0.7 0.75 0.8 0.85 0.9 0.95 1
Volume (L)
mg
L-1
4x6
6x8
6x14
14x40
y = 0.0938x2 - 3.92x + 59.485R2 = 0.88
y = 0.0443x2 - 2.3058x + 57.772R2 = 0.96
y = -0.0113x2 - 0.9192x + 54.636R2 = 0.81
y = 0.0827x2 - 4.0271x + 84.022R2 = 0.93
0
10
20
30
40
50
60
70
80
90
0.05 0.1 0.15 0.2 0.25 0.3 0.35 0.4 0.45 0.5 0.55 0.6 0.65 0.7 0.75 0.8 0.85 0.9 0.95 1
Volume (L)
mg
L-1
4x6
6x8
6x14
14x40
y = 0.0879x2 - 2.7085x + 21.793R2 = 0.99
y = 0.0447x2 - 1.376x + 11.694R2 = 0.97
y = 0.0533x2 - 1.5046x + 10.824R2 = 0.98
y = 0.0424x2 - 1.0717x + 7.8557R2 = 0.81
0
5
10
15
20
25
0.05 0.1 0.15 0.2 0.25 0.3 0.35 0.4 0.45 0.5 0.55 0.6 0.65 0.7 0.75 0.8 0.85 0.9 0.95 1
Volume (L)
mg
L-1
4x6
6x8
6x14
14x40 y = 0.0183x2 - 0.8047x + 11.895R2 = 0.97
y = 0.0029x2 - 0.2586x + 7.0242R2 = 0.90
y = 0.007x2 - 0.3657x + 7.7578R2 = 0.95
y = 0.0217x2 - 0.762x + 8.4859R2 = 0.96
0
2
4
6
8
10
12
14
0.05 0.1 0.15 0.2 0.25 0.3 0.35 0.4 0.45 0.5 0.55 0.6 0.65 0.7 0.75 0.8 0.85 0.9 0.95 1
Volume (L)
mg
L-1
4x6
6x8
6x14
14x40
y = 0.0017x2 + 0.0822x + 0.4075R2 = 0.99
y = 0.0067x2 - 0.0845x + 1.8923R2 = 0.71
y = 0.0105x2 - 0.1727x + 2.6016R2 = 0.56
y = -0.0001x2 + 0.1846x + 1.6915R2 = 0.93
0.0
1.0
2.0
3.0
4.0
5.0
6.0
0.05 0.1 0.15 0.2 0.25 0.3 0.35 0.4 0.45 0.5 0.55 0.6 0.65 0.7 0.75 0.8 0.85 0.9 0.95 1
Volume (L)
SAR
4x6
6x8
6x14
14x40y = 0.1922x2 - 0.2144x + 0.8288R2 = 0.98
y = 0.094x2 + 1.4089x + 1.6718R2 = 0.91
y = -0.1769x2 + 7.9027x - 8.6704R2 = 0.92
y = -0.0313x2 + 4.3035x - 3.5308R2 = 0.88
-10.0
0.0
10.0
20.0
30.0
40.0
50.0
60.0
70.0
80.0
90.0
100.0
0.05 0.1 0.15 0.2 0.25 0.3 0.35 0.4 0.45 0.5 0.55 0.6 0.65 0.7 0.75 0.8 0.85 0.9 0.95 1
Volume (L)
SAR
4x6
6x8
6x14
14x40
Poly
(a) (b)
(c) (d)
(e) (f)
(g) (h)

Research will assess economic pretreatments of the natural zeolite that could increase the effectiveness of Na-Ca cation exchange between CBNG water and zeolite, use of different combinations for optimizing exchange between CBNG water and zeolite and assess economic pretreatments of the natural zeolites that could increase the effectiveness of Na-Ca cation exchange to optimize Na-Ca exchange to reduce CBNG water SAR’s to <10 and design an economic, viable water treatment process.
In summary, results obtained thus far are extremely encouraging. Zeolite technology appears to provide an efficient, effective and affordable water treatment alternative that maximizes the beneficial use of CBNG produced water. We are now working on evaluating suitable low-cost, convenient pretreatments (i.e., concentration of Na through freeze/evaporation process) for optimizing exchange between CBNG water and zeolite. Future research work will cover the following tasks: • Assess economic pretreatments of the natural zeolite that could increase the effectiveness of
Na-Ca cation exchange between CBNG water and zeolite. • Use different combinations of results from subtask 2.4 (Evaluate low-cost, convenient
pretreatments (i.e., concentration of Na through freeze/evaporation process) for optimizing exchange between CBNG water and zeolite) and 2.5 (Assess economic pretreatments of the natural clinoptilolite that could increase the effectiveness of Na-Ca cation exchange between CBNG water and zeolite) to optimize Na-Ca exchange to determine which zeolite material will reduce CBNG water SAR’s to <5, 10 or 15.
• Design economic, viable water treatment scenarios as outlined in Task 3 based on cation exchange between natural zeolite and CBNG produced waters.
Student Support
Three graduate students (1 in Geology and 2 in Soil Science) were involved in this study. The students received training in both field aspects such as zeolite materials collection, estimating volume, collection of CBNG water samples and laboratory analyses of zeolite materials, and CBNG water chemical properties. In addition, technical support has been provided by several undergraduates majoring in Soil Science, Agronomy and Pharmacy. Presentations with Abstracts Ganjegunte, G.K., R.W. Gregory, G.F. Vance and R.C. Surdam. 2005. Innovative technology to
reduce sodium concentrations in saline-sodic coalbed natural gas waters: Use of natural zeolites. Presented at the American Society of Agronomy/Soil Science Society of America Annual Meetings, Salt Lake City, UT. Agronomy Abstracts CD-ROM p. 149
Ganjegunte, G.K., R.W. Gregory, G.F. Vance and R.C. Surdam. 2006. Use of natural zeolites to reduce sodium concentrations in saline-sodic coalbed natural gas waters. To be presented at the 7th International Conference on the Occurrence, Properties and Utilization of Natural Zeolites, Socorro, NM. ICOPUNZ Abstracts.
Ganjegunte, G.K. and G.F. Vance. 2005. Evaluation of changes in soil chemistry from leaching saline-sodic waters through Powder River Basin soils: A column study approach. Presented at the American Society of Agronomy/Soil Science Society of America Annual Meetings, Salt Lake City, UT. Agronomy Abstracts CD-ROM p. 212
Ganjegunte, G.K., G.F. Vance and L.A. King. 2005. Tracking salt and sodium build-up due to irrigating with coalbed natural gas product water: Soil solution lysimeter and soil saturation
paste extract studies. Presented at the 22nd National American Society of Mining and Reclamation Symposium Annual Meetings, Breckenridge, CO. In: R. Barnhisel (ed.) Raising Reclamation to New Heights, Lexington, KY CD-ROM pp. 378-387.
Johnston, C.R., S. Jin, G.F. Vance and G. Ganjegunte. 2006. Impacts on coalbed natural gas co-produced water on cropland irrigated soils in the Powder River Basin, Wyoming. Presented at the Graduate Student Symposium, Laramie, WY. Graduate Student Abstracts University of Wyoming. p. 41
Johnston, C,R., S. Jin, G.F. Vance and G. Ganjegunte. 2006. Impacts of Coalbed Natural Gas Co-Produced Water on Cropland Irrigated Soils in the Powder River Basin, Wyoming. To be presented at the 23nd National American Society of Mining and Reclamation Symposium/Billings Land reclamation Meetings, Billings, MT. In: R. Barnhisel (ed.) Reclamation: Supporting Future Generations, Lexington, KY.
King, L.A., G.F. Vance and G.K. Ganjegunte. 2004. Soil and vegetation impacts from land application of saline-sodic coalbed methane waters. Presented at the Living with Coalbed Methane Meeting. Montana Soil and Water Conservation Society Proceedings, Billings, MT.
King, L.A., G.F. Vance and G.K. Ganjegunte. 2005. Soil and plant responses to land application of coal bed natural gas (CBNG) waters. Presented at the American Society of Agronomy/Soil Science Society of America Annual Meetings, Salt Lake City, UT. Agronomy Abstracts CD-ROM p. 120
King, L.A., G.F. Vance and G.K. Ganjegunte. 2005. Use of coalbed natural gas (CBNG) waters: Soil and plant responses. Presented at the 22nd National American Society of Mining and Reclamation Symposium Annual Meetings, Breckenridge, CO. In: R. Barnhisel (ed.) Raising Reclamation to New Heights, Lexington, KY CD-ROM pp. 607-622.
King, L.A., G.F. Vance and G.K. Ganjegunte. 2005. Saline-sodic water impacts to soils and vegetation. Presented at the 22nd National American Society of Mining and Reclamation Symposium Annual Meetings, Breckenridge, CO. In: R. Barnhisel (ed.) Raising Reclamation to New Heights, Lexington, KY CD-ROM pp. 623-625.
King, L.A., G.F. Vance and G.K. Ganjegunte. 2006. Soil and Vegetation Responses to Land Application with Coalbed Methane Waters. To be presented at the 23nd National American Society of Mining and Reclamation Symposium/Billings Land reclamation Meetings, Billings, MT. In: R. Barnhisel (ed.) Reclamation: Supporting Future Generations, Lexington, KY.
King, L.A., G.F. Vance, G.K. Ganjegunte and B. Carroll. 2004. Vegetation responses to saline-sodic coalbed methane waters in the Powder River Basin. Presented at the Living with Coalbed Methane. Montana Soil and Water Conservation Society Proceedings, Billings, MT. (Invited) King, L.A., G.F. Vance and G.K. Ganjegunte. 2005. Soil and plant responses to land application of coal bed natural gas (CBNG) waters. Presented at the Graduate Student Symposium, Laramie, WY. Graduate Student Abstracts University of Wyoming. p. 13.
Musslewhite, B.D., C. Johnston, G.W. Wendt and G.F. Vance. 2006. Weathering characteristics of saline-sodic minesoils in the southwestern United States. To be presented at the 23nd National American Society of Mining and Reclamation/Billings Land Reclamation Symposium Meetings, Billings, MT. In: R. Barnhisel (ed.) Reclamation: Supporting Future Generations, Lexington, KY.
Vance, G.F., Ganjegunte, G.K., R.W. Gregory, and R.C. Surdam. 2006. Removal of sodium from saline-sodic coalbed natural gas waters using natural zeolites. To be presented at the 7th
International Conference on the Occurrence, Properties and Utilization of Natural Zeolites, Socorro, NM. ICOPUNZ Abstracts
Presentations without Abstracts King, L.A., G.F. Vance and G.K. Ganjegunte. 2006. Soil and plant responses to land application
of coal bed natural gas (CBNG) waters. Presented at the Wyoming BLM 2006 Energy Resource Development Workshop, Cheyenne, WY.
Vance, G.F. 2005. Innovative Technology Development to Maximize Beneficial Use of Produced Water from Coalbed Natural Gas Operations in the PRB, WY. Wyoming Water Development Commission, Cheyenne, WY.
References Austin, G.S. and R.S. Bowman. 2002. St Cloud Mining Company’s Stone House zeolite mine and new
uses for clinoptilotile. In Proceedings of the 2002 SME Annual Meeting, Phoenix, AZ. 9 pp. Ayers, W.B. 2002. Coalbed Gas Systems, Resources and Production and a Review of Contrasting Cases
from the Sans Juan and Powder River Basins: AAPG Bull., V. 86, p.1853–1890. BLM. 2003. Final Environmental Impact Statement and Proposed Plan Amendment for the Powder River
Basin Oil and Gas Project. Volumes 1 to 4, US DOI, Bureau of Land Management, Casper, WY. Cook, L. 2003. Powder River Basin Oil and Gas EIS: Presentation by Wyoming State Geologist to DEQ
Permitting Task Force. Cheyenne, Wyoming. Frenkel, H., J.O. Goertzen and J.D. Rhoades. 1978. Effects of clay type and content, exchangeable
sodium percentage, and electrolyte concentration on clay dispersion and soil hydraulic conductivity. Soil Sci. Soc. Am. J. 42:32-39.
Ganjegunte, G.K. and G.F. Vance. 2006. Deviations from empirical SAR vs ESP relationship in the PRB soils. Soil Science 171 (In Press)
Ganjegunte, G.K., G.F. Vance and L.A. King. 2004. Impacts of land application disposal of saline-sodic coalbed methane water on soil physical and chemical properties in Wyoming. Living with Coalbed Methane. Montana Soil and Water Conservation Society Proceedings, Billings, Mt.
Ganjegunte, G.K., G.F. Vance, L.A. King. 2005. Soil chemical changes resulting from irrigation with water co-produced with coalbed natural gas. Journal of Environmental Quality 34:2217-2227.
King, L.A., G.F. Vance and G.K. Ganjegunte. 2004a. Soil and vegetation impacts from land application of saline-sodic coalbed methane waters. Living with Coalbed Methane. Montana Soil and Water Conservation Society Proceedings, Billings, Mt.
King, L.A., G.F. Vance, G.K. Ganjegunte and B. Carroll. 2004b. Vegetation responses to saline-sodic coalbed methane waters in the Powder River Basin. Living with Coalbed Methane. Montana Soil and Water Conservation Society Proceedings, Billings, Mt. (Invited)
King, L.A., J. Wheaton, G.F. Vance and Ganjegunte. 2004c. Water issues associated with coalbed methane [natural gas] in the Powder River Basin of Wyoming and Montana. Reclamation Matters. Vol 2. Pp. 7-12.
Mumpton, F.A. 1978. Natural Zeolites: A New Industrial Mineral Commodity: in Natural Zeolites, Sand, L.B. and Mumpton, F.A., eds., Pergamon Press, p. 3–27.
Park, C.S. and G.A. O’Connor. 1980. Salinity effects on hydraulic properties of soils. Soil Sci. 130:167-174.
Ratterman, N.G. and R.C. Surdam. 1981. Zeolite Mineral Reactions in a Tuff in the Laney Member of the Green River Formation, Wyoming: Clays and Clay Mineralogy, v. 29, no. 5, p. 365–377.
Ruckelshaus Institute of Environment and Natural Resources (RIENR). 2005. Water production from CBM in WY: Summary of quantity, quality & management options. Final Report. 64 p.
Shainberg, I., M.E. Sumner, W.P.Miller, M.P.W. Farina, M.A.Pavan and M.V. Fey .1989. Use of gypsum on soils: A review. Advances in Soil Science, 9:1-111.

Sumner, M.E. and R. Naidu. 1998. Sodic Soils: Distribution, properties, management and Environmental consequences. Oxford University Press. New York. 207 pp.
Sheppard, R.A. and A.J. Gude. 1969. Diagenesis of Tuffs in the Barstow Formation Mud Hills, San Bernadino County California: U.S. Geol. Survey Professional Paper 634, p. 1–34.
Suarez, D. 1999. Beryllium, Magnesium, Calcium, Strontium, and Barium. p. 575-602. In D.L. Sparks et al. (ed.) Methods of soil analysis. Part 3. 3rd ed. SSSA Book Ser. 5. SSSA, Madison, WI.
Vance, G.F., L.A. King and G.K. Ganjegunte. 2004. Coalbed methane co-produced water: Management options. Reflections. June 2004 issue. Pp. 31-34.
Vance, G.F. and W.B. Stevens. 2003. Soil Characteristics & Planning for Soil Disturbance. In: N. Lohse (ed.) Sharing Solutions for Successful Plantings in the Northern Great Plains: A Resource Guide. Lake DeSmet Conservation District, Buffalo, WY pp. 12-33 (Invited)
Wheaton, J.R. and J.J. Metesh. 2002. Potential ground-water drawdown and recovery for coalbed methane development in the Powder River Basin, Montana. Montana Bureau of Mines and Geology. Open-File Report 4658. 58 pp.

Information Transfer ProgramDuring FY05, information dissemination efforts included reports and presentations by the Director to Stateand Federal entities, Conservation Districts, and the Private sector. The Director reports annually to theWyoming Water Development Commission and to the Select Water Committee (of the WyomingLegislature). Presentations were given throughout the state concerning the research program and projectresults. The Director also serves as the University of Wyoming Advisor to the Wyoming WaterDevelopment Commission and attends their monthly meetings. This provides a means of coordinatingbetween University researchers and Agency personnel.
Publications and other information dissemination efforts were reported by the PIs of the projects fundedunder this program. The project PIs report to the Institutes Advisory Committee on an annual basis.Presentations discussing final results are made by PIs of projects which were completed during the year atthe Committees July meeting. Presentations discussing interim results are made by PIs of continuingprojects at the Committees winter meeting. All PIs are encouraged to publish in peer reviewed journals aswell as participate in state-wide water related meetings and conferences. A number of PIs, of projectspreviously completed, reported at the Basin Advisory Group meetings which are part of the State fundedand supported water planning process. Publications are listed elsewhere in this report.
Director information dissemination activities include the following:
Director Service: UW Advisor to the Wyoming Water Development Commission. Advisor to theWyoming Water Association. Member of the Governors Drought Task Force. UW representative toWyoming Water Forum. Work with the Ruckelhaus Institute (Produced Waters Workshop, Coal BedMethane). Co-sponsor for the regional Produced Waters Workshop in April 2006. Member White Papercommittee on regional water research with Idaho National Water Lab. Wyoming representative to thePowell (Colorado River) Consortium. Committee for the Wyoming Water Development Commission onthe High Savery Dam Dedication. Member of Wyoming Weather Modification Technical AdvisoryGroup.
Director Presentations: Office of Water Programs and Wyoming Water Research Program, WyomingWater Development Commission. Cheyenne, WY., January 12, 2005. Office of Water Programs andWyoming Water Research Program, Legislative-Select Water Committee, Cheyenne, WY., January 13,2005. Office of Water Programs and Wyoming Water Research Program, Mountain West Farm Bureau,Annual Meeting, Laramie, WY., December 12, 2005. Wind River Glaciers, Wind River IndianReservation, Ethete, WY., November 17, 2005. Office of Water Programs and Wyoming Water ResearchProgram, Wyoming Farm Bureau Annual Meeting, Laramie WY., October 3, 2005. Office of WaterPrograms and Wyoming Water Research Program, Bear River Basin Advisory Group meeting, Cokeville,WY., July 11, 2005. Office of Water Programs and Wyoming Water Research Program, Green RiverBasin Advisory Group meeting, Rock Springs, WY., July 12, 2005. Office of Water Programs andWyoming Water Research Program, Snake/Salt River Basin Advisory Group meeting, Alpine, WY., July13, 2005. Office of Water Programs and Wyoming Water Research Program, Wyoming WaterAssociation-Board meeting and tour, Afton, WY., July 14, 2005. Office of Water Programs and WyomingWater Research Program, Wind/Big Horn River Basin Advisory Group meeting, Thermopolis, WY.,August 2, 2005. Office of Water Programs and Wyoming Water Research Program, Northeast WyomingRiver Basin Advisory Group meeting, Kaycee, WY., August 3, 2005. Office of Water Programs andWyoming Water Research Program, Powder/Tongue River Basin Advisory Group meeting, Gillette, WY.,

August 4, 2005. Office of Water Programs and Wyoming Water Research Program, North Platte RiverBasin Advisory Group meeting, Laramie, WY., August 9, 2005. Wind River Glaciers, Wyoming WaterDevelopment Commission/Select Water Committee, Pinedale, WY., August 24, 2005.
Information dissemination activities reported by research project PIs include the following:
Project: Water Scarcity and Economic Growth in Wyoming. Barbier, E.B. and A. Chaudhry, 2005, Waterand Economic Growth, Presented at the 8th Occasional California Workshop on Environmental andResource Economics, University of California at Santa Barbara, Santa Barbara, 28-29 October, 2005.Chaudhry, A. 2005, Water, Public Capital and Growth in Municipalities and Industries, Mimeo,Department of Economics and Finance, University of Wyoming, Chaudhry, A., 2006. Water andEconomic Growth in an Agricultural Economy: Empirical Application to Wyoming Mimeo, Departmentof Economics and Finance, University of Wyoming, (The Wyoming state map describing the predictedforage crop on rangeland was disseminated on the state climatologists web page twice, early and late April2005). Annually at the end of April this map will be published.
Project: Conveyance Losses and Travel Times of Reservoir Releases Along the Bear River from WoodruffNarrows Reservoir to Cokeville Wyoming. Franz, T., (2005), A Water Budget Analysis for PredictingReturn Flow on the Bear River in Wyoming and Utah, MCE Plan B Paper, Department of Civil &Architectural Engineering, University of Wyoming, Laramie, WY. Kunz, W. (2005), Return Flows,Re-Diversion, and Losses Associated With the Bear River In Wyoming and Utah, M.S. Thesis,Department of Civil & Architectural Engineering, University of Wyoming, Laramie, WY.
Project: Geochemistry of Coalbed Natural Gas Produced Water Across Five Wyoming Watersheds. SoilScience Society of America 69th Annual Meetings, November 7th 2005, Salt Lake City, Utah.
Project: Real-Time Monitoring of E. Coli Contamination in Wyoming Surface Waters. Two invited paperspresented at the 2005 Cytometry Development Workshop, Asilomar, California: High-Throughput-AxialImaging Flow Cytometry with LED illumination. Imaging Flow Cytometry.
Project: Innovative Technology Development to Maximize Beneficial Use of Produced Water fromCoalbed Natural Gas Operations in the Powder River Basin,Wyoming. Proceedings and Abstracts withPresentations. Ganjegunte, G.K., R.W. Gregory, G.F. Vance and R.C. Surdam, 2005, Innovativetechnology to reduce sodium concentrations in saline-sodic coalbed natural gas waters: Use of naturalzeolites, Presented at the American Society of Agronomy/Soil Science Society of America AnnualMeetings, Salt Lake City, UT. Agronomy Abstracts CD-ROM p. 149. Ganjegunte, G.K., R.W. Gregory,G.F. Vance and R.C. Surdam, 2006, Use of natural zeolites to reduce sodium concentrations insaline-sodic coalbed natural gas waters, To be presented at the 7th International Conference on theOccurrence, Properties and Utilization of Natural Zeolites, Socorro, NM. ICOPUNZ Abstracts.Ganjegunte, G.K. and G.F. Vance, 2005, Evaluation of changes in soil chemistry from leachingsaline-sodic waters through Powder River Basin soils: A column study approach, Presented at theAmerican Society of Agronomy/Soil Science Society of America Annual Meetings, Salt Lake City, UT.Agronomy Abstracts CD-ROM p. 212. Ganjegunte, G.K., G.F. Vance and L.A. King, 2004, Impacts ofland application disposal of saline-sodic coalbed methane water on soil physical and chemical propertiesin Wyoming, Living with Coalbed Methane. Montana Soil and Water Conservation Society Proceedings,Billings, MT. Ganjegunte, G.K., G.F. Vance and L.A. King, 2005, Tracking salt and sodium build-up dueto irrigating with coalbed natural gas product water: Soil solution lysimeter and soil saturation pasteextract studies, Presented at the 22nd National American Society of Mining and Reclamation Symposium

Annual Meetings, Breckenridge, CO. In: R. Barnhisel (ed.) Raising Reclamation to New Heights,Lexington, KY CD-ROM pp. 378-387. Johnston, C.R., S. Jin, G.F. Vance and G. Ganjegunte, 2006,Impacts on coalbed natural gas co-produced water on cropland irrigated soils in the Powder River Basin,Wyoming, Presented at the Graduate Student Symposium, Laramie, WY. Graduate Student AbstractsUniversity of Wyoming. p. 41. Johnston, C,R., S. Jin, G.F. Vance and G. Ganjegunte, 2006, Impacts ofCoalbed Natural Gas Co-Produced Water on Cropland Irrigated Soils in the Powder River Basin,Wyoming, To be presented at the 23nd National American Society of Mining and ReclamationSymposium/Billings Land reclamation Meetings, Billings, MT. In: R. Barnhisel (ed.) Reclamation:Supporting Future Generations, Lexington, KY. King, L.A., G.F. Vance and G.K. Ganjegunte, 2005, Soiland plant responses to land application of coal bed natural gas (CBNG) waters, Presented at the AmericanSociety of Agronomy/Soil Science Society of America Annual Meetings, Salt Lake City, UT. AgronomyAbstracts CD-ROM p. 120. King, L.A., G.F. Vance and G.K. Ganjegunte, 2005, Use of coalbed naturalgas (CBNG) waters: Soil and plant responses, Presented at the 22nd National American Society of Miningand Reclamation Symposium Annual Meetings, Breckenridge, CO., In: R. Barnhisel (ed.) RaisingReclamation to New Heights, Lexington, KY CD-ROM pp. 607-622. King, L.A., G.F. Vance and G.K.,Ganjegunte, 2005, Saline-sodic water impacts to soils and vegetation, Presented at the 22nd NationalAmerican Society of Mining and Reclamation Symposium Annual Meetings, Breckenridge, CO., In: R.Barnhisel (ed.) Raising Reclamation to New Heights, Lexington, KY CD-ROM pp. 623-625. King, L.A.,G.F. Vance and G.K. Ganjegunte, 2006, Soil and Vegetation Responses to Land Application with CoalbedMethane Waters, To be presented at the 23nd National American Society of Mining and ReclamationSymposium/Billings Land reclamation Meetings, Billings, MT. In: R. Barnhisel (ed.) Reclamation:Supporting Future Generations, Lexington, KY. Musslewhite, B.D., C. Johnston, G.W. Wendt and G.F.Vance, 2006, Weathering characteristics of saline-sodic minesoils in the southwestern United States, Tobe presented at the 23nd National American Society of Mining and Reclamation/Billings LandReclamation Symposium Meetings, Billings, MT., In: R. Barnhisel (ed.) Reclamation: Supporting FutureGenerations, Lexington, KY. Vance, G.F., Ganjegunte, G.K., R.W. Gregory, and R.C. Surdam, 2006,Removal of sodium from saline-sodic coalbed natural gas waters using natural zeolites, To be presented atthe 7th International Conference on the Occurrence, Properties and Utilization of Natural Zeolites,Socorro, NM. ICOPUNZ Abstracts. Presentations without Abstracts: King, L.A., G.F. Vance and G.K.Ganjegunte, 2006, Soil and plant responses to land application of coal bed natural gas (CBNG) waters,Presented at the Wyoming BLM 2006 Energy Resource Development Workshop, Cheyenne, WY. Vance,G.F, 2005, Innovative Technology Development to Maximize Beneficial Use of Produced Water fromCoalbed Natural Gas Operations in the PRB, WY., Wyoming Water Development Commission,Cheyenne, WY.
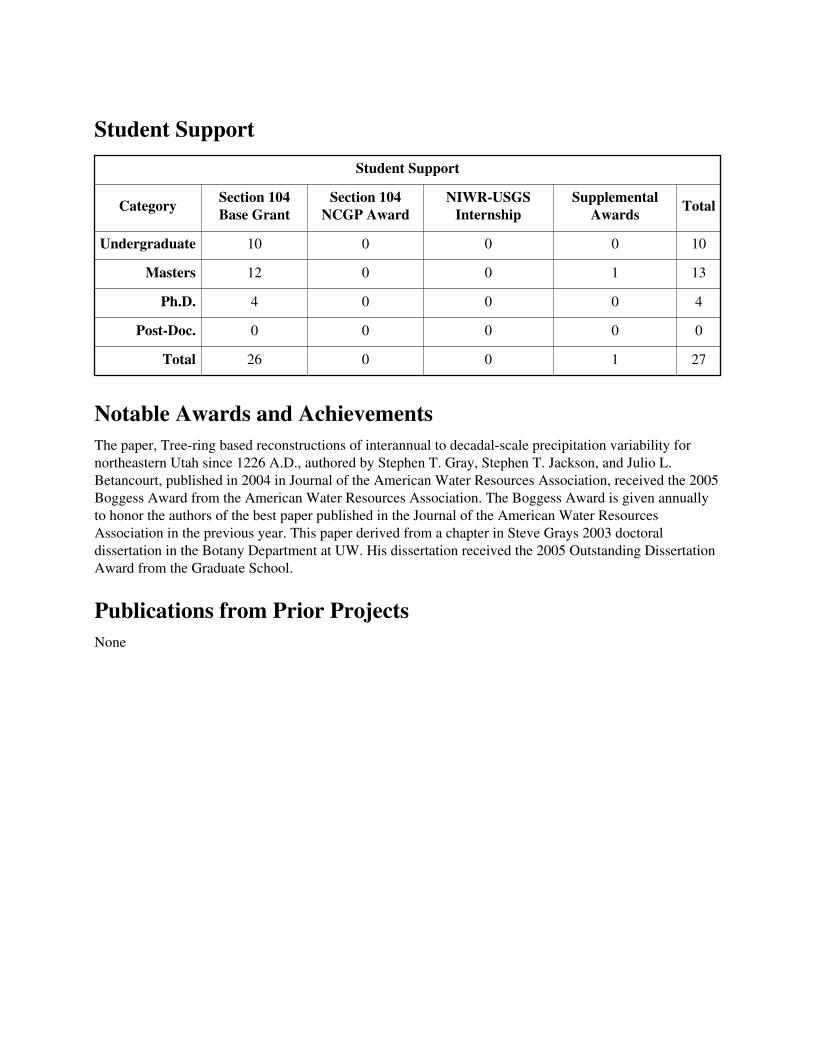
Student SupportStudent Support
Category Section 104Base Grant
Section 104NCGP Award
NIWR-USGS Internship
Supplemental Awards Total
Undergraduate 10 0 0 0 10
Masters 12 0 0 1 13
Ph.D. 4 0 0 0 4
Post-Doc. 0 0 0 0 0
Total 26 0 0 1 27
Notable Awards and AchievementsThe paper, Tree-ring based reconstructions of interannual to decadal-scale precipitation variability fornortheastern Utah since 1226 A.D., authored by Stephen T. Gray, Stephen T. Jackson, and Julio L.Betancourt, published in 2004 in Journal of the American Water Resources Association, received the 2005Boggess Award from the American Water Resources Association. The Boggess Award is given annuallyto honor the authors of the best paper published in the Journal of the American Water ResourcesAssociation in the previous year. This paper derived from a chapter in Steve Grays 2003 doctoraldissertation in the Botany Department at UW. His dissertation received the 2005 Outstanding DissertationAward from the Graduate School.
Publications from Prior ProjectsNone