wtips: funnel charts
TRANSCRIPT

+
+
wTips:Funnel Charts
W-Systems, June 2015

© W-Systems Corp. www.w-systems.com
+
Funnel Charts—Sales Opportunities
Section 1

© W-Systems Corp. www.w-systems.com
Funnel Charts—For Sales
Funnel Charts have traditionally been used to represent progress in the sales process.The funnel chart below shows a common use, opportunities sorted by the opportunity stage

© W-Systems Corp. www.w-systems.com
Funnel Charts—For Sales
Funnel Charts can be created for any of the three report types that allow charts:

© W-Systems Corp. www.w-systems.com
Funnel Charts—For Sales
The Sections of the funnel are determined by the values of the “Define Group By” selection:

© W-Systems Corp. www.w-systems.com
Funnel Charts—Section Order
Sales Stage DropDown Values are used to create the sections of the funnel.Note that the order of the DropDown Values, determines the Order of the Funnel Sections

© W-Systems Corp. www.w-systems.com
Funnel Charts—Section Order
**NOTE: Changing the Order of the DropDown Fields, changes the Order of the Funnel Stages

© W-Systems Corp. www.w-systems.com
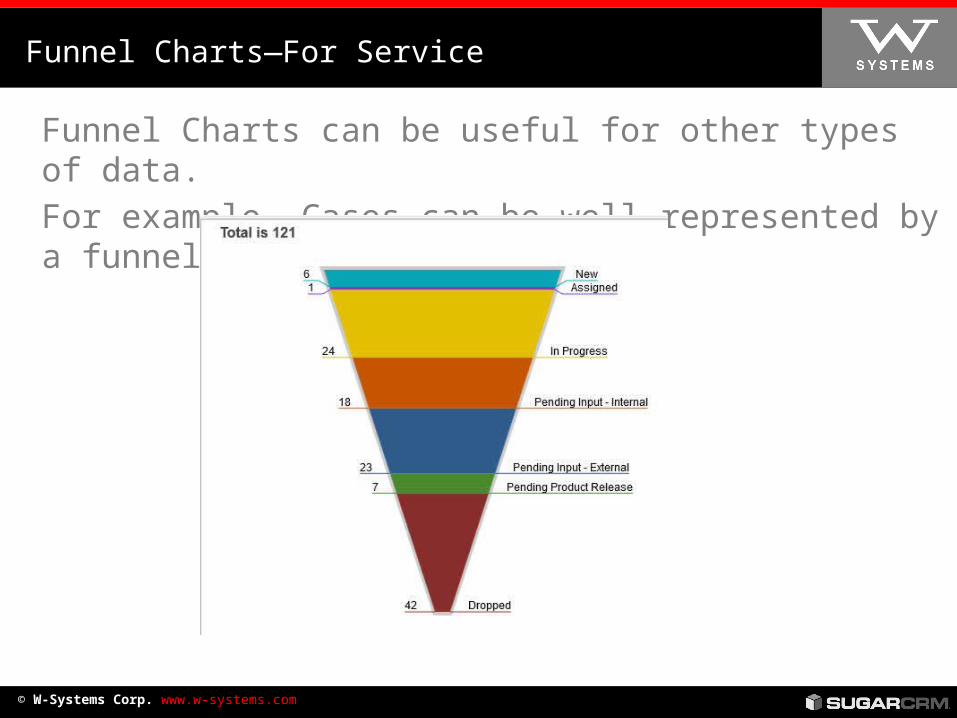
Funnel Charts—For Service
Funnel Charts can be useful for other types of data.For example, Cases can be well-represented by a funnel chart

© W-Systems Corp. www.w-systems.com
Funnel Charts—For Marketing
Lead Funnel Report

© W-Systems Corp. www.w-systems.com
Funnel Charts—Non Dropdown
If a “Define Group” selection is set for a field that is NOT a DropDown field, then the sections are sorted in ascending order, from the top of the funnel to bottom.
This chart uses an “Integer” field as the “Define Group” selection


© W-Systems Corp. www.w-systems.com
Funnel Reports—Summary
Funnel Charts can be used as a option on any report that allows charts:
SummationSummation Report with DetailsMatrix Report
Funnel Charts are guided by the “Define Group By” selectionAlthough Funnel Charts can use any variable as a “Define Group By” selection, DropDown fields generally provide the most informative Funnel Charts