writing equations §2.1 addition subtraction multiplication
TRANSCRIPT

Chapter 2 Notes Algebra 2

2.1 Transformations of Quadratic Functions
Targets:
1. I can describe and graph transformations of quadratic functions.
o I can describe transformations of quadratic functions.
o I can graph transformations of quadratic functions.
o I can write functions that represent transformations of quadratic functions.
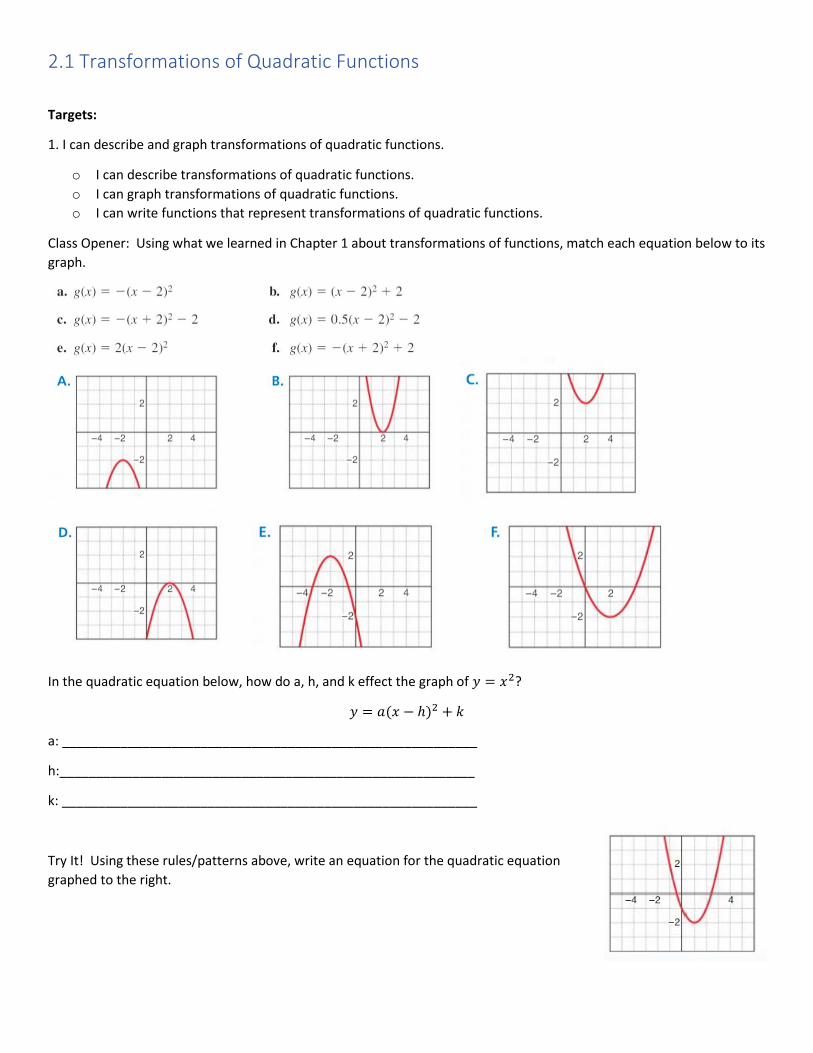
Class Opener: Using what we learned in Chapter 1 about transformations of functions, match each equation below to its
graph.
In the quadratic equation below, how do a, h, and k effect the graph of 𝑦 = 𝑥2?
𝑦 = 𝑎(𝑥 − ℎ)2 + 𝑘
a: _________________________________________________________
h:_________________________________________________________
k: _________________________________________________________
Try It! Using these rules/patterns above, write an equation for the quadratic equation
graphed to the right.
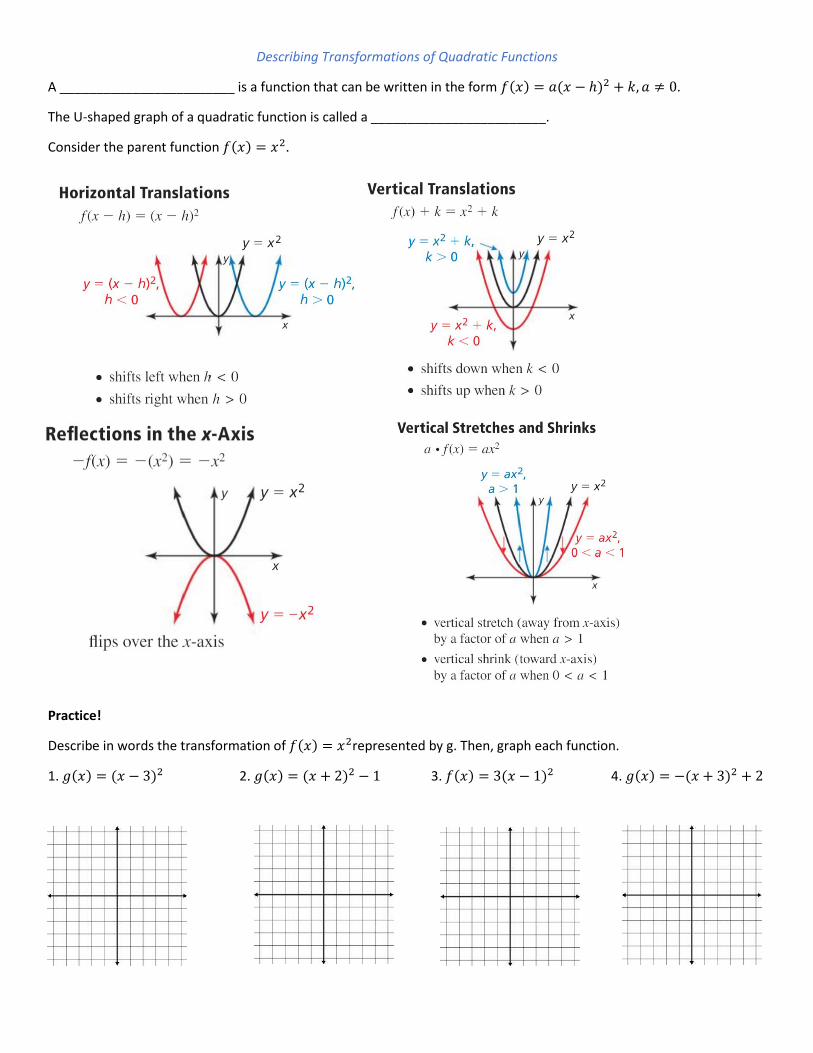
Describing Transformations of Quadratic Functions
A ________________________ is a function that can be written in the form 𝑓(𝑥) = 𝑎(𝑥 − ℎ)2 + 𝑘, 𝑎 ≠ 0.
The U-shaped graph of a quadratic function is called a ________________________.
Consider the parent function 𝑓(𝑥) = 𝑥2.
Practice!
Describe in words the transformation of 𝑓(𝑥) = 𝑥2represented by g. Then, graph each function.
1. 𝑔(𝑥) = (𝑥 − 3)2 2. 𝑔(𝑥) = (𝑥 + 2)2 − 1 3. 𝑓(𝑥) = 3(𝑥 − 1)2 4. 𝑔(𝑥) = −(𝑥 + 3)2 + 2
Writing Transformations of Quadratic Functions
The lowest point on a parabola that opens up or the highest point on a parabola that opens down is called the _______.
The __________________ of a quadratic function is 𝑓(𝑥) = 𝑎(𝑥 − ℎ)2 + 𝑘, 𝑎 ≠ 0, 𝑣𝑒𝑟𝑡𝑒𝑥 (ℎ, 𝑘).
Example: Let the graph of g be a vertical stretch by a factor of 2 and a reflection in the x-axis, followed by a translation 3
units down of the graph of 𝑓(𝑥) = 𝑥2. Write a rule for g and identify the vertex.
Practice: Let the graph of g be a vertical shrink by a factor of ½, followed by a translation 2 units up of the graph of
𝑓(𝑥) = 𝑥2. Write a rule for g and identify the vertex.
Algebra Review
Simplify each expression below.
1. (𝑥 + 2)2 2. (𝑥 − 3)2
3. If 𝑓(𝑥) = 𝑥2 + 5𝑥, find 𝑓(𝑥 + 1).

Application to Transformations
Let the graph of g be a translation 3 units right and 2 units up, followed by a reflection in the x-axis of the graph of
𝑓(𝑥) = 𝑥2 − 5𝑥.
Modeling Real Life
The height (in feet) of water spraying from a fire hose can be modeled by ℎ(𝑥) = −0.03𝑥2 + 𝑥 + 25, where x is the
horizontal distance (in feet) from the fire truck. The crew raises the aerial ladder so that the water hits the ground 10
feet farther from the fire truck. Write a function that models the new path of the water.
2.2 Characteristics of Quadratic Functions Target:
1. I can graph and describe quadratic functions.
o I can use properties of parabolas to graph quadratic functions.
o I can identify characteristics of quadratic functions and their graphs.
o I can use characteristics of quadratic functions to solve real-life problems.
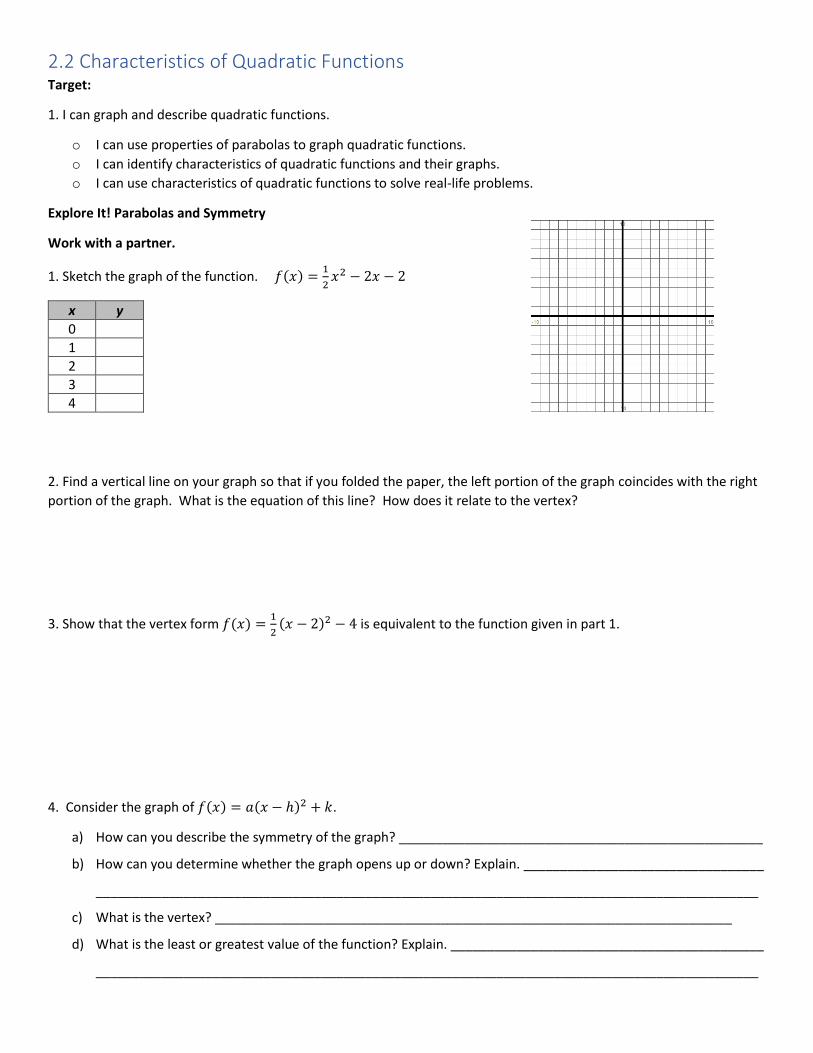
Explore It! Parabolas and Symmetry
Work with a partner.
1. Sketch the graph of the function. 𝑓(𝑥) =1
2𝑥2 − 2𝑥 − 2
x y
0
1
2
3
4
2. Find a vertical line on your graph so that if you folded the paper, the left portion of the graph coincides with the right
portion of the graph. What is the equation of this line? How does it relate to the vertex?
3. Show that the vertex form 𝑓(𝑥) =1
2(𝑥 − 2)2 − 4 is equivalent to the function given in part 1.
4. Consider the graph of 𝑓(𝑥) = 𝑎(𝑥 − ℎ)2 + 𝑘.
a) How can you describe the symmetry of the graph? __________________________________________________
b) How can you determine whether the graph opens up or down? Explain. _________________________________
___________________________________________________________________________________________
c) What is the vertex? _______________________________________________________________________
d) What is the least or greatest value of the function? Explain. ___________________________________________
___________________________________________________________________________________________

Axis of Symmetry is the ________ that divides a parabola into mirror images and passes through the _______________.
Graphing Quadratic Functions: Vertex Form:
𝑓(𝑥) = 𝑎(𝑥 − ℎ)2 + 𝑘 Standard Form (Quadratic Form):
𝑓(𝑥) = 𝑎𝑥2 + 𝑏𝑥 + 𝑐 𝒂 is the vertical stretch/shrink of the function
o When 0a the parabola opens down. The graph has a Maximum value (y-coordinate of vertex).
o When 0a the parabola opens up. The graph has a Minimum value (y-coordinate of vertex).
Vertex of the parabola is ( , )opposite h same as k .
o The x-coordinate of the vertex is when the minimum or maximum happens.
o The y-coordinate of the vertex is the minimum or maximum value of the quadratic function.
Find the 𝑥 coordinate of the vertex using: 𝑥 =−𝑏
2𝑎.
Plug the 𝑥 into the original function to get the
y-coordinate of the vertex (−𝑏
2𝑎, 𝑓 (
−𝑏
2𝑎)).
The y-intercept is 𝒄. So, the point (0, 𝑐) is on the parabola.
Graph each function. Name the vertex and the axis of symmetry.
3. 𝑦 = (𝑥 + 1)2 − 3 4. 𝑓(𝑥) = −1
2(𝑥 − 2)2
Vertex: ____________________ Vertex: ____________________
Axis of Symmetry: ___________ Axis of Symmetry: ___________
5. 𝑓(𝑥) = 2𝑥2 + 16𝑥 + 30 6. 𝑓(𝑥) = 3𝑥2 − 6𝑥 + 1
Vertex: ____________________ Vertex: ____________________
Axis of Symmetry: ___________ Axis of Symmetry: ___________

Find the minimum value or maximum value of the function. Find the domain and the range of the function, and when the function is increasing and decreasing.
7. 𝑓(𝑥) =1
2𝑥2 − 2𝑥 − 1 8. 𝑓(𝑥) = −𝑥2 + 5𝑥 + 9

Graph the Quadratic Function in Intercept Form Graph the function. Identify the 𝒙-intercepts, vertex and axis of symmetry.
9. 𝑓(𝑥) = −2(𝑥 + 3)(𝑥 − 1) 10. 𝑓(𝑥) =1
4(𝑥 − 6)(𝑥 − 2)
𝑥-intercepts: _______________ 𝑥-intercepts: _______________
Vertex: ____________________ Vertex: ____________________
Axis of Symmetry: ___________ Axis of Symmetry: ___________

2.4 Modeling With Quadratic Functions Explore It!
a. Explain what the graph represents.
b. What do you know about the value of a? How does the graph change if a is
increased? decreased? What does this mean in this context? Explain your
reasoning.
c. Write an expression that represents the year t when the comet is closest to the Earth.
d. The comet is the same distance away from Earth in 2012 and 2020. Estimate the year when the comet is closes to the
Earth. Explain your reasoning.
e. What does c represent in this context? How does the graph change if c is increased? decreased? Explain.
f. Assume that the model is still valid today. Is the comet’s distance from Earth currently increasing, decreasing, or
constant? Explain.
g. The table shows the approximate distances y (in millions of miles) from Earth for a planetary object m months after
being discovered. Can you use a quadratic function to model the data? How do you know? Is this the only type of
function you can use to model the data? Explain your reasoning.
h. Explain how you can find a quadratic model for the data. How do you know your model is a good fit?

Target:
Write equations of quadratic functions using given characteristics.
o I can write equations of quadratic functions using vertices, points, and x-intercepts.
o I can write quadratic equations to model data sets.
o I can use technology to find a quadratic model for a set of data.
Writing an Equation Using Vertex and a Point
The graph shows the parabolic path of a performer who is shot out of a cannon, where y is the
height (in feet) and x is the horizontal distance traveled (in feet). The performer lands in a net 90
feet from the cannon. What is the height of the net?
What If?
If the vertex of the parabola was (50,37.5), what is the height of the net?

Try It!
Write an equation of the parabola in vertex form based on the given information.
1. Passes through (1,-7) and has vertex (-2, 5)
2. Passes through (0,8) and has vertex (-10, -3)

Writing an Equation Using a Point and x-intercepts
A meteorologist creates a parabola to predict the temperature tomorrow, where x is the number of hours after midnight
and y is the temperature (in degrees Celsius).
a. Write a function f that models the temperature over time. What is the coldest temperature?
b. What is the average rate of change in temperature over the interval in which the temperature is decreasing?
Increasing? Compare the average rates of change.
Try It!
Write an equation of the parabola that passes through the point (2, 5) and has x-intercepts -2 and 4.
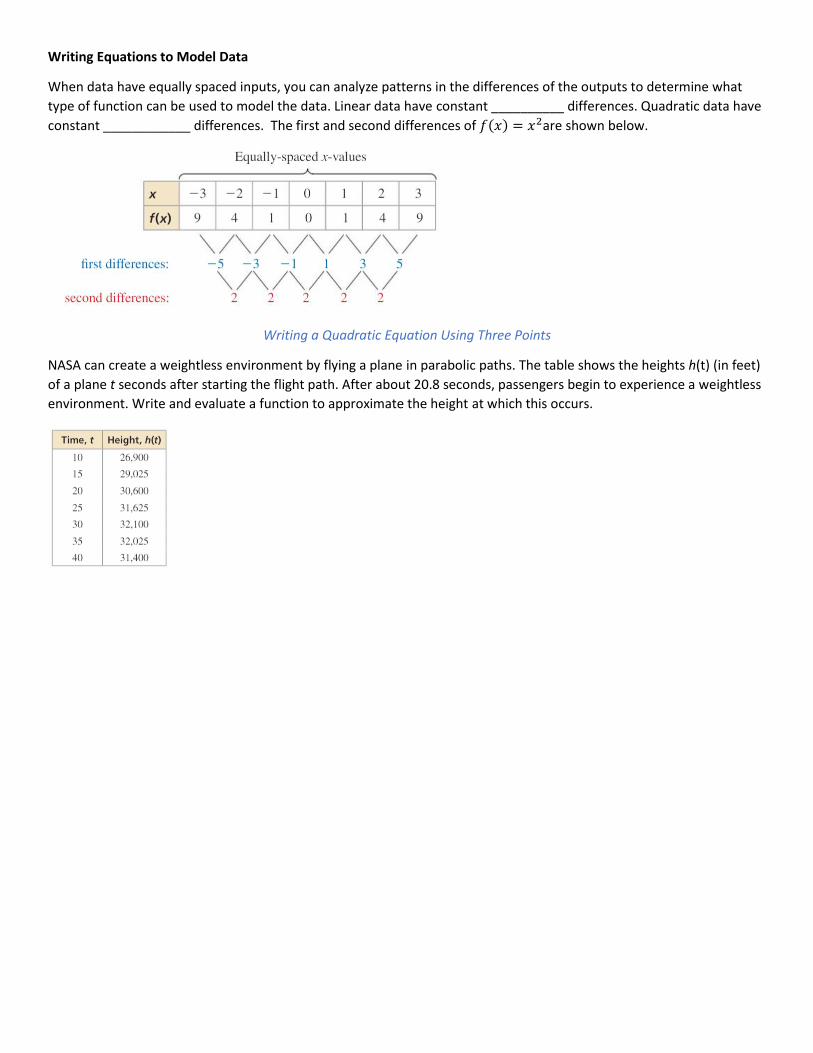
Writing Equations to Model Data
When data have equally spaced inputs, you can analyze patterns in the differences of the outputs to determine what
type of function can be used to model the data. Linear data have constant __________ differences. Quadratic data have
constant ____________ differences. The first and second differences of 𝑓(𝑥) = 𝑥2are shown below.
Writing a Quadratic Equation Using Three Points
NASA can create a weightless environment by flying a plane in parabolic paths. The table shows the heights h(t) (in feet)
of a plane t seconds after starting the flight path. After about 20.8 seconds, passengers begin to experience a weightless
environment. Write and evaluate a function to approximate the height at which this occurs.

Modeling Real Life Data Using Quadratic Regression
Real-life data that show a quadratic relationship usually do not have constant second differences because data are not
exactly quadratic, they are approximately quadratic. Therefore, the data will have second differences that are very
similar in value and you can use a quadratic regression to find a quadratic function that best models the data.
Example
The table shows fuel efficiencies of a vehicle at different speeds. Write a function that models the data. Use the model
to approximate the best gas mileage.
Desmos: TI-84
1. + Table, Enter Data 1. Stat Edit Enter x values into L1, y values into L2
2. 𝑦1~𝑎𝑥12 + 𝑏𝑥1 + 𝑐 2. Stat Calc QuadReg
3. Write out equation using a, b, and c.

Practice!
Write an equation of the parabola that passes through the points (-1, 4), (0, 1), and (2, 7).
The table shows the estimated profits y (in dollars) for a concert when the charge is x dollars per ticket. Write and
evaluate a function to determine the maximum profit.