wrinkling of a-alumina films grown by …clarke/tbc/14.pdf · thermal oxidation—i. quantitative...
TRANSCRIPT

WRINKLING OF a-ALUMINA FILMS GROWN BY
THERMAL OXIDATIONÐI. QUANTITATIVE STUDIES ON
SINGLE CRYSTALS OF Fe±Cr±Al ALLOY
V. K. TOLPYGO and D. R. CLARKE{Materials Department, College of Engineering, University of California, Santa Barbara,
CA 93106-5050, U.S.A.
(Received 2 February 1998; accepted 30 March 1998)
AbstractÐQuantitative measurements of the wrinkling morphology of the alpha-alumina scales formedby thermal oxidation at 10008C and its evolution with oxidation time have been made using atomic forcemicroscopy. The wrinkling wavelength and amplitude, and from these the surface area of the scale, for(110), (100) and (111) oriented single crystals of Fe±Cr±Al alloy as a function of oxidation time arepresented. The residual stress in the scales is determined using piezospectroscopy. Together these resultsprovide the basis for determining the lateral strains associated with the growth of the oxide. Crystallo-graphic orientation of the alloy surface has a pronounced e�ect on both the wrinkling morphology andstress in the scale during the ®rst 20±30 h of oxidation. The presence of the reactive element, yttrium, sup-presses wrinkling and restricts lateral growth but it does not decrease the stress in the oxide. # 1998 ActaMetallurgica Inc. Published by Elsevier Science Ltd. All rights reserved.
1. INTRODUCTION
During oxidation of many Fe±Cr±Al and Ni±Cr±
Al high-temperature alloys, the aluminum oxide
formed on the surface adopts a wrinkled or convo-
luted morphology [1]. This morphology, shown in
Fig. 1(a), develops and changes with time during
oxidation at high temperature and is not a result of
cooling to room temperature. Observations of
cross-sections reveal that the thickness of the oxide
is more or less uniform demonstrating that wrink-
ling is not caused by oxide intrusions or variations
of the oxide growth rate from place to place.
Although the mechanism of wrinkling is not com-
pletely understood, it is believed that wrinkles form
when the oxide expands in the lateral direction par-
allel to the metal surface during oxidation [2]. This
lateral growth, in contrast to ``normal'' growth at
the outer or inner surface, may be a result of oxide
formation within the existing layer [2, 3], or may
simply occur due to volumetric changes when the
metal transforms into the oxide. In either case,
because of the constraint from the underlying
metal, a compressive growth stress develops in the
oxide parallel to the interface and energy is stored
as elastic strain energy. Wrinkling is a deformation
mode by which elastic strain energy can be
reduced [4]. Therefore it may serve as a relaxation
process, concurrent with stress generation during
oxidation, leading to a net decrease in the average
stress in the oxide. Typically, the strains associated
with wrinkling are so large that the change in oxide
morphology necessitates that it deforms by plastic
¯ow.
Although the phenomenon of wrinkling has
been widely recognized for many years, its geo-
metrical evolution and the accompanying stress in
the oxide have not been systematically studied.
The only recently published experimental study by
Hou et al. [5] deals with some aspects of the geo-
metrical parameters of the alumina scale on Fe±
Cr±Al alloys. As for the residual and growth
stresses in the wrinkling scales, to the authors'
knowledge, no reliable results have been presented
so far. The motivation for the present work is
both to provide a detailed description of the mor-
phological instability of oxide wrinkling on a
common Fe±Cr±Al alloy and to relate the wrink-
ling evolution to the growth stress in the oxide.
Both subjects are of general importance to a
much wider range of alloys since wrinkled oxides
invariably exhibit poor adherence during cyclic
oxidation. While particular attention during the
past decade has been given to the e�ects of inter-
facial chemistry on the oxide spalling resistance [6±
8], the importance of oxide con®guration has not
been so thoroughly investigated. An essential
point in this geometrical concept is that wrink-ling, in e�ect, transforms the biaxial stress in a
planar oxide to create a component of stress nor-
mal to the interface thereby providing a force to
separate the oxide from the metal [9±11]. In con-
trast, if the oxide and oxide±metal interface are
¯at, no stresses act in the normal direction.
Acta mater. Vol. 46, No. 14, pp. 5153±5166, 1998# 1998 Acta Metallurgica Inc.
Published by Elsevier Science Ltd. All rights reservedPrinted in Great Britain
1359-6454/98 $19.00+0.00PII: S1359-6454(98)00133-5
{To whom all correspondence should be addressed.
5153

It is well established that small additions of reac-
tive elements such as Y, Ce, Zr to Fe±Cr±Al and
Ni±Cr±Al alloys alter the morphology of the oxide
leading to the formation of a ¯at and adherent
alumina scale [1] [Fig. 1(b)]. Originally, it was sup-
posed that the absence of wrinkles on the yttrium-
containing alloys was due to the growth stresses in
the oxide being smaller [2]. However, recent
measurements have shown that the compressive
growth stress in the oxide on the Fe±Cr±Al±Y alloy
may be as high as 1 GPa at the oxidation
temperature [12]. Yet, the scale remains ¯at during
oxidation and, moreover, can withstand an ad-
ditional compression of the order of 3±5 GPa on
cooling caused by thermal expansion mismatch
between the oxide and the metal. Another expla-
nation of the reactive element e�ect is that yttrium
prevents sulfur segregation at the oxide±metal
interface [6±8] and thereby increases the interfacial
fracture resistance. There is indeed ample evidence
from the literature that, if sulfur segregation is
eliminated, then the oxides are much more adher-
ent. At the same time, it seems remarkable that
oxide wrinkling on the alloys with reactive elements
is also suppressed, and consequently there are no
forces acting to separate the oxide. Which of these
two factors is of major importance and whether
both are interrelated remains to be established.
The single-crystal Fe±Cr±Al alloy was chosen in
order to study the dependence of wrinkling evol-
ution on metal crystallographic orientation. Whilst
the role of yttrium is not speci®cally addressed in
Fig. 1. Typical morphology of the wrinkled a-Al2O3 scale on the Fe±Cr±Al alloy (a) and ¯at a-Al2O3
scale on the Fe±Cr±Al±Y alloy (b) after oxidation at 10008C for 100 h. Both alloys are single crystalswith the surface polished parallel to the (111) b.c.c. plane.
TOLPYGO and CLARKE: WRINKLING OF a-ALUMINA FILMSÐI5154
this work, the ¯at scale on the Fe±Cr±Al±Y alloy,and in particular the residual and growth stresses,
provide an essential comparison to the wrinklingscale observed on the yttrium-free alloy. In theaccompanying paper [13], which considers obser-
vations of oxide separation from the underlyingalloy, its association with the evolution in wrinklingmorphology and the separation sequences leading
up to spalling failure are described.
2. EXPERIMENTAL
Two single-crystal alloys were studied: Fe±19.5%Cr±4.5%Al and Fe±21.7%Cr±5.42%Al±
0.003%Y (wt%). Specimens about 8� 8� 0.5 mm3
in size were cut parallel to either (110), (100) or(111) crystallographic planes of a b.c.c. lattice,
mechanically polished to a 0.1 mm ®nish, andcleaned in acetone. Oxidation experiments were car-ried out in static air at 10008C for times ranging
from 0.1 to 100 h. The heating and cooling rate wasabout 5008C/min. Preliminary experiments haveshown that both materials are pure alumina for-mers, i.e. the only oxide phase growing during oxi-
dation at 10008C is a-Al2O3. Previous studies havealso con®rmed that 30 ppm Y in the alloy is enoughto completely prevent alumina wrinkling and pro-
vide a ¯at scale [14]. Oxide morphology was exam-ined using SEM. The thickness of the scale wasestimated from thermogravimetric results of the
mass change during oxidation assuming that thescale was fully dense a-Al2O3.The wrinkling morphology on the Fe±Cr±Al
alloy was quanti®ed using atomic force microscopy(AFM). Several images of the oxide surface,40�40 mm2 in size, were scanned on each specimen.Since the oxide wrinkles exhibit some periodicity,
analysis of the AFM scans provides quantitativecharacteristics, such as average wavelength andamplitude of the oxide undulations. The character-
istic wavelength was determined from the powerspectral density plot for the whole area of eachAFM image. The amplitude was characterized by
the root-mean-square roughness parameter Rq cal-culated as the standard deviation of the height ofeach point on the surface relative to the averagevalue. In these measurements the AFM images were
digitally processed in such a way that the roughnesscaused by the shape of individual oxide grains was®ltered out.
It should be noted that geometrical parameters,measured in this work, refer only to the outer oxidesurface. As shown below, the oxide±metal interface
on the Fe±Cr±Al alloy does not perfectly match theouter surface. This means that the ``actual'' con-®guration should include parameters of both the
outer and inner surfaces, i.e. correspond to someaverage mid-section of the oxide. However, thestrong adhesion of the oxide on many specimens,especially after short oxidation times, precluded ex-
posure of su�ciently large areas of the metal sur-
face for comparison. Therefore a detailed AFM
study of the interfacial con®guration and its evol-
ution has not been performed, and so only the par-
ameters of the outer surface are used for the
analysis. Nevertheless, when spalling of the scale
exposed the alloy surface, these areas were analyzed
and the results presented below.
The residual stress in the a-Al2O3 was measured
at room temperature using the photo-stimulated
luminescence piezospectroscopy technique [15, 16].
The stress is obtained from the frequency shift, Dn,of the characteristic R-lines of the
Cr3+luminescence relative to the stress-free alumina
according to Refs [16, 17]
D� � 1
3Piisjj �1�
where sjj are the hydrostatic components of the
stress tensor and Pii are the components of the
piezospectroscopic tensor (Pii=7.60 cmÿ1/GPa for
polycrystalline alpha-alumina [17]). The stress-free
frequency was measured on spalled or specially sep-
arated pieces of oxide after di�erent exposures. For
a ¯at scale, the stress is assumed to be biaxial, such
that sxx=syy=s and szz=0 (x and y are in-plane
axes, and z is normal to the surface). Therefore, the
stress can be directly determined from the frequency
shift:
D� � 2
3Piis �2�
or s10. 197Dn, where s is expressed in GPa and
Dn is measured in cmÿ1. When the scale wrinkles,
however, equation (2) is generally not valid because
the component szz normal to the specimen surface
is no longer zero. Moreover, in each given place, its
value depends on the local con®guration of the
oxide and oxide±metal interface. In turn, the in-
plane components sxx and syy should vary from
place to place over the surface depending on the
geometry of the oxide. As a result, the stress in a
wrinkled scale is not readily obtained from the
piezospectroscopic measurements and, generally,
only the frequency shifts can be directly compared.
In those cases below where the wrinkling con®gur-
ation is quanti®ed, the results of ®nite element
analysis [11] will be used to transform the frequency
shift into stress.
On the Fe±Cr±Al±Y alloy, the stress distribution
over the specimen surface was very uniform,
whereas on the Fe±Cr±Al alloy, the frequency shift
measured with a small probe size demonstrated a
large variability because of the oxide wrinkling. For
this reason measurements were performed using an
optimal probe size of about 4±5 mm, which was
found to be large enough to minimize variations of
the frequency shift from place to place. Typically,
15±25 individual measurements were made from
TOLPYGO and CLARKE: WRINKLING OF a-ALUMINA FILMSÐI 5155

di�erent places on each specimen in order to deter-mine an average shift.
A comparison of the luminescence frequencyfrom the spalled oxide with that of a pure (andstress-free) sapphire provides a means to evaluate
the chromium concentration in the scale. Increasingthe chromium concentration in alpha-alumina givesa systematic frequency shift of the luminescence R-
lines. The concentration-related shift (that is oppo-site to the compressive stress shift) is known tobe [15]
D�* � 0:99 � cCr �3�
where chromium concentration, cCr is expressed inwt%.
3. RESULTS
A typical example of the wrinkling morphology
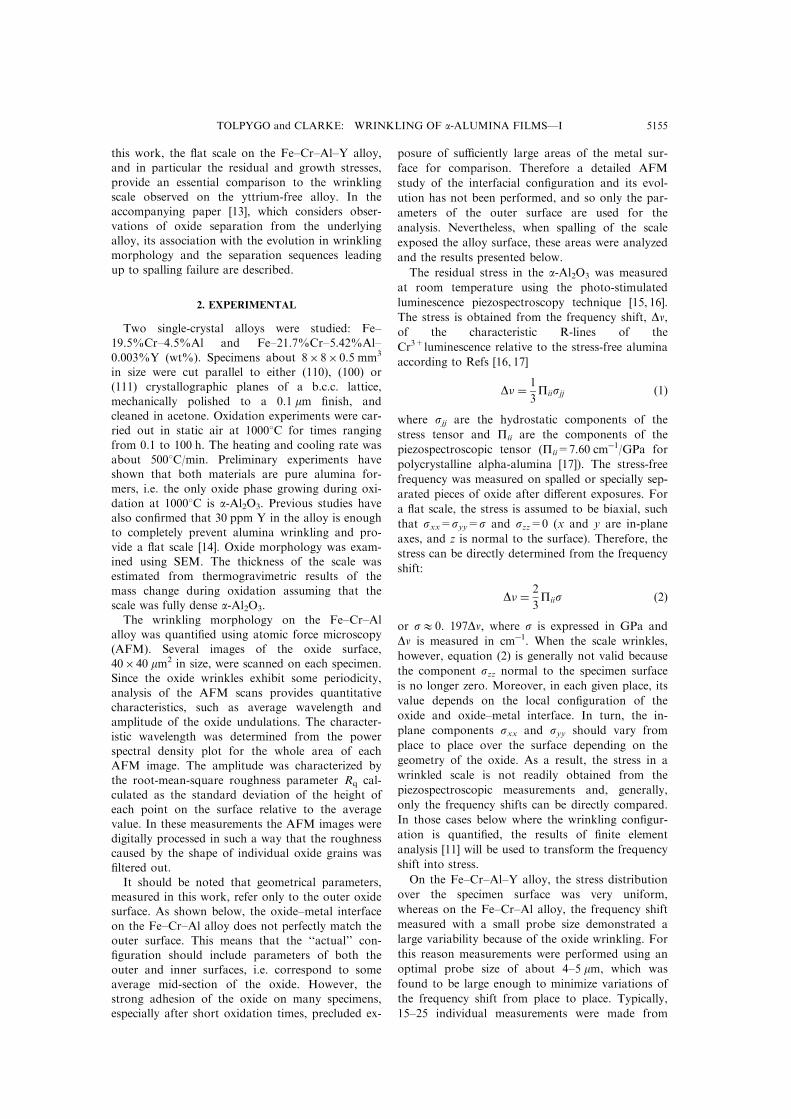
of the scale is presented in Fig. 2. These SEMmicrographs show the oxide surface and alloy sur-face exposed by spalling of the scale after cooling
to room temperature. A closer examination shows[Fig. 2(b)] that the alloy surface is completely cov-ered with imprints of alumina grains indicating thatit remains in contact with the oxide during the scale
Fig. 2. SEM micrographs of the scale and metal surface on the (110) Fe±Cr±Al alloy after oxidation at10008C for 70 h: (a) general view showing that the metal surface, exposed after oxide spalling, exhibitswrinkling similar to the outer oxide surface (OÐoxide, MÐmetal); (b) enlarged view of the scale cross-
section and imprints of alumina grains on the metal surface.
TOLPYGO and CLARKE: WRINKLING OF a-ALUMINA FILMSÐI5156
growth and deforms together with the wrinklingscale. As a result, the con®guration of the oxide±
metal interface is generally similar to that of theouter scale surface. Various studies have shown thatoxide wrinkles are associated, although not exclu-sively, with interfacial cavities or voids which are
believed to be a result of scale decohesion andbuckling during oxidation [1]. In contrast, our ob-servations, as well as other results [5], suggest that,
on a ¯at alloy surface in the absence of polishingscratches or contaminants, voids are very rare andthe scale grows in contact with the alloy. For com-
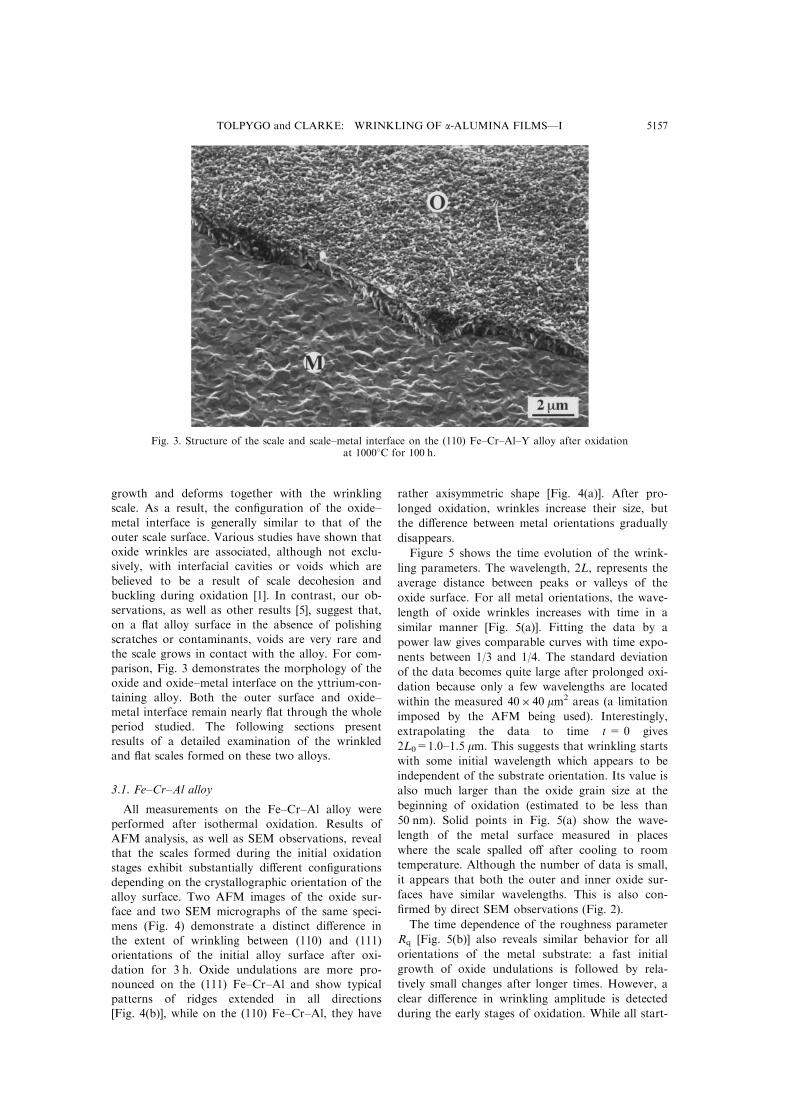
parison, Fig. 3 demonstrates the morphology of theoxide and oxide±metal interface on the yttrium-con-taining alloy. Both the outer surface and oxide±metal interface remain nearly ¯at through the whole
period studied. The following sections presentresults of a detailed examination of the wrinkledand ¯at scales formed on these two alloys.
3.1. Fe±Cr±Al alloy
All measurements on the Fe±Cr±Al alloy wereperformed after isothermal oxidation. Results of
AFM analysis, as well as SEM observations, revealthat the scales formed during the initial oxidationstages exhibit substantially di�erent con®gurations
depending on the crystallographic orientation of thealloy surface. Two AFM images of the oxide sur-face and two SEM micrographs of the same speci-
mens (Fig. 4) demonstrate a distinct di�erence inthe extent of wrinkling between (110) and (111)orientations of the initial alloy surface after oxi-
dation for 3 h. Oxide undulations are more pro-nounced on the (111) Fe±Cr±Al and show typicalpatterns of ridges extended in all directions[Fig. 4(b)], while on the (110) Fe±Cr±Al, they have
rather axisymmetric shape [Fig. 4(a)]. After pro-
longed oxidation, wrinkles increase their size, but
the di�erence between metal orientations gradually
disappears.
Figure 5 shows the time evolution of the wrink-
ling parameters. The wavelength, 2L, represents the
average distance between peaks or valleys of the
oxide surface. For all metal orientations, the wave-
length of oxide wrinkles increases with time in a
similar manner [Fig. 5(a)]. Fitting the data by a
power law gives comparable curves with time expo-
nents between 1/3 and 1/4. The standard deviation
of the data becomes quite large after prolonged oxi-
dation because only a few wavelengths are located
within the measured 40� 40 mm2 areas (a limitation
imposed by the AFM being used). Interestingly,
extrapolating the data to time t= 0 gives
2L0=1.0±1.5 mm. This suggests that wrinkling starts
with some initial wavelength which appears to be
independent of the substrate orientation. Its value is
also much larger than the oxide grain size at the
beginning of oxidation (estimated to be less than
50 nm). Solid points in Fig. 5(a) show the wave-
length of the metal surface measured in places
where the scale spalled o� after cooling to room
temperature. Although the number of data is small,
it appears that both the outer and inner oxide sur-
faces have similar wavelengths. This is also con-
®rmed by direct SEM observations (Fig. 2).
The time dependence of the roughness parameter
Rq [Fig. 5(b)] also reveals similar behavior for all
orientations of the metal substrate: a fast initial
growth of oxide undulations is followed by rela-
tively small changes after longer times. However, a
clear di�erence in wrinkling amplitude is detected
during the early stages of oxidation. While all start-
Fig. 3. Structure of the scale and scale±metal interface on the (110) Fe±Cr±Al±Y alloy after oxidationat 10008C for 100 h.
TOLPYGO and CLARKE: WRINKLING OF a-ALUMINA FILMSÐI 5157

ing material surfaces had approximately the same
roughness (Rq=10 nm), after a short oxidation time
the amplitude is clearly larger on the (111) surface,
smaller on the (100), and smallest on the (110) sur-
face. After about 30 h all amplitudes are approxi-mately equal, and after longer oxidation times the
amplitude is even somewhat smaller on the (111)
orientation. Measurements made after 250 h,
although not presented here, demonstrate only a
slight additional increase of Rq up to 0.5±0.6 mmand support the observation that the wrinkling
amplitude, following an initial fast growth, then
increases slowly with time.
A few data points in Fig. 5(b) characterize the
roughness of the oxide±metal interface (solid
points). Unlike the wavelength, which was quite
similar for both the metal and oxide surfaces
[Fig. 5(a)], the roughness of the metal surface isconsiderably smaller than that of the outer oxide
surface. This result is illustrated in Fig. 6 by two
AFM images of the same (110) specimen oxidized
for 30 h: the oxide surface looks more wrinkled due
to a larger amplitude. As the scale was in contact
with the metal during oxidation and no interfacial
cavities were formed, this necessarily means that the
oxide layer is generally thicker near the peaks andthinner at the valleys of the interface.
An increase of the oxide surface area taken from
the AFM roughness analysis is presented in
Fig. 5(c). These results show a fast initial enlarge-
ment of the surface area as a result of wrinklingand no further increase after about 25±30 h.
The alumina scales formed on all the specimens
after isothermal oxidation were analyzed using opti-
cal piezospectroscopy. The frequency shift, Dn, rela-tive to the stress-free state, is shown in Fig. 7 for all
three orientations of the Fe±Cr±Al alloy. The lar-
gest frequency shift, corresponding to the highest
residual room-temperature stress in the scale, is
observed after short oxidation (less than 1 h). With
increasing time, the shift decreases for all orien-
tations suggesting that the growth stress in rela-tively thick scales is smaller than in thin scales at
the beginning of oxidation. Among the three orien-
tations, the highest shift is detected on the (110)
and the smallest on the (111) specimens. After pro-
longed oxidation (100 h), the frequency shift does
not vary much between the di�erent metal orien-
tations although the data show a relatively largescatter on a given specimen.
The stress axis included in Fig. 7 represents nom-
inal values calculated assuming biaxial compression
of the oxide [equation (2)]. In general, however, therelationship between residual stress and frequency
Fig. 4. SEM micrographs (a), (b) and AFM scans (c), (d) of the oxide surface on the Fe±Cr±Al alloyafter oxidation at 10008C for 3 h. The alloy with (110) initial surface orientation produces axisymmetri-
cal wrinkles (a), (c), while the same alloy with (111) orientation gives elongated ridges (b), (d).
TOLPYGO and CLARKE: WRINKLING OF a-ALUMINA FILMSÐI5158

shift is rather complex [11], and the biaxial approxi-
mation is not valid. Nevertheless, there is a direct
correspondence between frequency shift and elastic
strain energy, so a reduction in frequency shift canbe directly interpreted as a reduction in the average
stress in the scale and vice versa [11]. The results in
Fig. 7 indicate a substantial di�erence in room-tem-
perature residual stress between three orientationsafter short oxidation exposures. Since the thermal
mismatch stress should not depend strongly on the
metal orientation, this di�erence is largely due tothe di�erent values of the growth stresses. An
attempt to quantify the growth stress in the
wrinkled oxide using the piezospectroscopic fre-
quency shift and AFM results is given in theDiscussion (Section 4).
Taken together with the geometrical parameters,
the data in Fig. 7 reveal a striking correlation
between the average stress and the extent of oxide
wrinkling: a higher growth stress on the (110) orien-tation corresponds to a less wrinkled scale.
Conversely, on the (111) orientation, the scale is
more prone to wrinkling while the growth stress islower. After longer oxidation the in¯uence of sub-
strate orientation becomes insigni®cant.
Importantly, the orientation dependence ofwrinkling parameters and residual stress is not
caused by the di�erence between growth rates ofalumina scale. On the contrary, all three orien-
tations of the Fe±Cr±Al alloy show almost identicalparabolic oxidation kinetics (Fig. 8). Chromium
concentration is also very much the same in scalesformed on all orientations of the Fe±Cr±Al alloy
(Fig. 9), and therefore di�erent behavior of the
scales cannot be explained by an e�ect of chromiumon the alumina creep rate. The concentration is sur-
prisingly high in very thin scales after short oxi-dation times. This may be due to the formation of
signi®cant amounts of chromia or spinel phases atthe nucleation stage. However, even after the short-
est time examined (0.1 h). the scale is entirely com-posed of a-Al2O3, i.e. any chromium-containing
oxides initially formed are already dissolved in thealumina. Subsequently, the concentration gradually
decreases probably as a result of less chromium
entering the growing scale and also due to chro-mium evaporation from the scale during oxidation.
Although we have not measured the iron concen-tration, cursory SIMS and RBS results indicate a
general tendency for the concentration of Fe ions tobe similar to that shown in Fig. 9 for Cr ions. The
Fig. 5. Geometrical parameters of the scale wrinkling as afunction of oxidation time at 10008C for the three orien-tations of the Fe±Cr±Al alloy: (a) average wavelength 2L;(b) surface roughness parameter Rq; (c) surface area ratioDS/S0=(Sÿ S0)/S0 where S is the actual three-dimen-sional surface area and S0 is the two-dimensional pro-jected area. Open symbolsÐoxide surface; solid symbolsÐ
metal surface.
Fig. 6. Two AFM images of the oxide surface (a) andmetal surface (b) on the same (110) Fe±Cr±Al alloy afteroxidation at 10008C for 30 h. The roughness parameter Rq
equals 0.35 mm (a) and 0.23 mm (b). Estimated oxide thick-ness Hox is indicated.
TOLPYGO and CLARKE: WRINKLING OF a-ALUMINA FILMSÐI 5159

data for the Fe±Cr±Al±Y alloy, included in Fig. 9
for comparison, will be discussed in Section 3.2.
3.2. Fe±Cr±Al±Y alloy
Unlike the Fe±Cr±Al alloy, measurements on
single-crystalline specimens of the Fe±Cr±Al±Yalloy were performed mainly in the course of cyclicoxidation. Each specimen was repeatedly oxidizedfor di�erent times, examined at room temperature
and oxidized again with a cumulative exposure of100 h. A few specimens were isothermally oxidizedin order to check whether the time evolution of the
residual stress in the oxide was a�ected by inter-mediate cooling and heating during cyclic oxi-dation. No detailed investigation of the oxidation
kinetics has been performed on the Fe±Cr±Al±Yalloy; however, the microscopic observations con-®rm that the oxide thickness is comparable withthat on the Fe±Cr±Al alloy (Figs 2 and 3).
Since the alumina scale on the yttrium-containing
alloy is almost perfectly ¯at, no AFM results are
presented for this alloy. The time dependence of the
residual stress in the scale together with the fre-
quency shift of the R2-line are shown in Fig. 10.
The ¯at con®guration of the oxide and oxide±metal
interface implies that the scale is under a biaxial
compression, so a simple relation [equation (2)]
between the frequency shift and residual stress can
be used. Specimens of all three orientations exhibit
identical residual stress after oxidation for 0.1 h.
The same is observed after 100 h. In between, the
stress is somewhat higher on the (110) orientation
than on the other specimens. The data points show-
ing residual stress after isothermal oxidation ®t well
into the curves for cyclic experiments suggesting
that intermediate cooling does not a�ect time evol-
ution of residual stress, i.e. does not lead to stress
relaxation.
Fig. 7. Frequency shift of the characteristic R2-line of a-Al2O3 scales on di�erent alloy orientations as a functionof oxidation time at 10008C. The second y-axis shows thecalculated residual stress in the scale assuming it to be
under biaxial compression.
Fig. 8. Kinetics of isothermal oxidation of the Fe±Cr±Alalloy at 10008C. Experimental data were obtained as amass gain per unit surface area and then transformed into
oxide thickness.
Fig. 9. Chromium concentration in the a-Al2O3 scalesformed on the Fe±Cr±Al (solid symbols) and Fe±Cr±Al±Y (open symbols) alloys. The concentration was deter-mined from the luminescence frequency shift measured on
the spalled oxide relative to a stress-free sapphire.
Fig. 10. Frequency shift and corresponding residual com-pressive stress in the scales formed on the Fe±Cr±Al±Yalloy during oxidation at 10008C. Estimated value of the
thermal mismatch stress, sT, is indicated.
TOLPYGO and CLARKE: WRINKLING OF a-ALUMINA FILMSÐI5160

In general, the room-temperature residual stressis much higher than expected from the thermal mis-
match alone. This gives a clear indication that theoxide is under compression during oxidation.Similar to the Fe±Cr±Al alloy, the variation of the
residual stress with time means that the growthstress also changes. At this point, we can qualitat-ively estimate that the growth stress in the scale on
the Fe±Cr±Al±Y alloy gradually increases andreaches values of the order of 0.5±1.0 GPa duringoxidation. A slight decrease between 30 and 100 h
may be due to some plastic relaxation, presumablyby metal creep, during oxidation. This process, asrecently demonstrated on a polycrystalline Fe±Cr±Al±Y alloy oxidized at 1100±13008C [12], leads to
measurable elongation of the specimens. For0.4 mm thick rectangular specimens used in thiswork, compressive stress of about 1 GPa in the
1 mm thick oxide on both sides of the plate must bebalanced by a biaxial tension of 5 MPa in themetal. This stress is su�cient for some metal creep
to occur at 10008C, thus leading to a reduction ofthe stress in the scale during oxidation. This relax-ation, however, has not been monitored in the pre-
sent work, because the creep strain was too small tomeasure. Indeed, if caused exclusively by metalelongation, the reduction of oxide stress by 0.1±0.3 GPa between 30 and 100 h (Fig. 10) would cor-
respond to the metal plastic strain of about2�10ÿ4±6� 10ÿ4, which is below our detectionlimits (about 10ÿ3 for a 7±8 mm specimen). Thus,
although the possibility of stress relaxation bymetal creep during oxidation is clear, no measure-ments of this are presented. As for the plastic stress
relaxation after cooling, the same force balancearguments show that the tensile stress in the metalat room temperature does not exceed 20±25 MPa,i.e. cannot produce any plastic deformation of the
specimens. Further analysis and comparison withthe Fe±Cr±Al alloy are presented in Section 4.The chromium concentration in alumina on the
Fe±Cr±Al±Y alloy, determined from the concen-tration-related frequency shifts [equation (3)], isshown in Fig. 9. A decrease of the chromium con-
tent with time is very similar to that on the Fe±Cr±Al alloy although the concentration is slightlyhigher on the yttrium-containing alloy.
Nevertheless, it may be concluded that the di�erentbehavior of the two alloys is not related to di�er-ences in the chromium content in the scale.
4. ANALYSIS AND DISCUSSION
The results described in the previous section indi-cate the presence of substantial growth stresses inoxide formed on both the Fe±Cr±Al and Fe±Cr±
Al±Y alloys. At the same time, the behavior of thescales is very di�erent. On the yttrium-containingalloy, the growth stress gradually increases withtime, but the oxide remains ¯at. In contrast, on the
Fe±Cr±Al alloy, the growth stress generally
decreases with time and the scale plastically deforms
producing wrinkles. In addition, both the growth
stress and wrinkling evolution depend on the crys-
tallographic orientation of the metal.
As the formation of the oxide wrinkles occurs at
high temperature, it is essential to compare the
growth stresses in di�erent scales and determine the
growth stress variation with time. To do this, the
thermal mismatch contribution must be subtracted
from the residual room-temperature stress. For a
¯at oxide layer formed on the Fe±Cr±Al±Y alloy,
the calculation of the thermal stress and growth
stress is straightforward. If the scale is much thinner
than the metal and no plastic relaxation occurs
during cooling, which is apparently the case in the
present experiments, the thermally induced stress,
sT, is given by the following approximate ex-
pression:
sT �ÿaox ÿ am
�DT � Eox
1ÿ �ox �4�
where the metal and oxide thermal expansion coe�-
cients are, respectively, am=14.0�10ÿ6/8C and
aox=8.2�10ÿ6/8C [18], DT is the temperature
change (DT = 9758C), the oxide elastic modulus is
taken to be Eox=400 GPa, and Poisson ratio
nox=0.25. For the Fe±Cr±Al±Y alloy, the thermal
mismatch stress sT is indicated in Fig. 10. In turn,
the growth stress in the scale, sG, can be deter-
mined from
s � sT � Eox
E Tox
� sG �5�
where s is the residual room temperature stress in
the scale and E Tox=350 GPa is the oxide Young's
modulus at 10008C [18]. Note that the compression
is purely biaxial for the scales formed on the Fe±
Cr±Al±Y alloy.
For a wrinkled scale, however, even the thermal
mismatch stress, not to mention the growth stress,
varies with position across the scale and depends on
geometrical parameters of the oxide. As a result, all
the stress components sjj are expected to change
between peaks and valleys of the oxide layer. The
mechanical aspects of such a complex situation
were examined recently using ®nite element
analysis [11], and the results of that study are
applied in the following paragraphs. In particular,
the dependence of the frequency shift on the oxide
wavelength 2L, amplitude A, and thickness H will
be used. In the numerical analysis, the frequency
shift was calculated for di�erent geometrical par-
ameters of the oxide subject to a known elastic ther-
mal mismatch strain. In this work, a reverse
problem is posed: the parameters L, A, H and the
frequency shifts are experimentally determined
whereas the stress (or elastic strain) is the unknown.
TOLPYGO and CLARKE: WRINKLING OF a-ALUMINA FILMSÐI 5161

If the scale con®guration exhibits a symmetry
relative to some mid-plane, it is reasonable to
assume that the average value of the normal com-
ponent, szz, over one wavelength, is essentially zero.
The in-plane components, sxx and syy, can be taken
equal by symmetry. The shear stresses do not con-
tribute signi®cantly to the frequency shift [17]. All
these assumptions simplify the comparison of the
scales of di�erent con®gurations. Once the wrink-
ling parameters are known, each particular geome-
try can be transformed into a ¯at oxide layer
subject to the same (macroscopic) elastic strains as
the wrinkled scale. The frequency shift and stress
that would be obtained from such an equivalent
scale can be found using the results from Ref. [11].
By doing this for all experimental data, all oxide
con®gurations can be adjusted to a quasi-biaxial
compression and hence can be compared with each
other.
For the purpose of comparison, we suppose that
all scales formed on the Fe±Cr±Al alloy assume a
sinusoidal shape where the wrinkling displacement
with time is given by:
z�x,y,t� � A�t� � sin�pxL�t�
�� sin
�pyL�t�
��6�
with the wavelength 2L(t) and amplitude A(t) both
changing with time. For this con®guration, the
wrinkling amplitude is determined by the oxide
roughness parameter as A(t) = 2Rq(t). From the ex-
perimental values of 2L [Fig. 5(a)], Rq [Fig. 5(b)],
and oxide thickness H (Fig. 8), we can ®nd the
dimensionless geometrical parameters L/H and A/H
used in numerical calculations [11] and determine
the frequency shift ratio, k= Dnw/Dnf, correspond-ing to each particular combination of parameters.
Here, Dnw is the average frequency shift that is
measured on a wrinkled scale under a certain set of
elastic strains, and Dnf is the shift that would be
measured on the equivalent ¯at scale. The time
dependence of the parameters L/H and A/H as well
as the frequency shift ratio k are presented in
Fig. 11. Clearly, k 4 1 at the beginning of oxi-
dation when scale is almost ¯at, and k < 1 when
wrinkling occurs. This gives an important con-
clusion: the shift measured on a wrinkled oxide is
always smaller than on a ¯at oxide for the same
mismatch strain.
The frequency shift ratio, k, can be applied to
the experimental values in Fig. 7 in order to ®nd
the frequency shift corresponding to the scale which
is now assumed to be ¯at. This shift is determined
as
D�eq � 1
k� D�exp �7�
where Dnexp denotes experimental results (Fig. 7)
and k is taken from Fig. 11(c) for each given time
and metal orientation. Since the calculated equival-
ent shift, Dneq, refers to a quasi-biaxial stress state,it can be transformed into compressive stress
according to equation (2), and ®nally the oxide
growth stress is obtained using equation (5). With
the above correction [equation (7)] a comparisonbetween wrinkled scales formed on di�erent metal
orientation is possible and, moreover, these data
Fig. 11. Parameters used for the growth stress calculationsin the wrinkling scales on the Fe±Cr±Al alloy: (a) exper-imental values of the wavelength±oxide thickness ratio, L/H; (b) wrinkling amplitude±oxide thickness ratio, A/H; (c)frequency shift ratio, k= Dnw/Dnf, taken from the ®nite el-
ement calculations in Ref. [11].
Fig. 12. Calculated values of the growth stress in the a-Al2O3 scales during oxidation at 10008C of the Fe±Cr±Al(solid symbols) and Fe±Cr±Al±Y (open symbols) alloys.
TOLPYGO and CLARKE: WRINKLING OF a-ALUMINA FILMSÐI5162

can be compared with results for the Fe±Cr±Al±Y
alloy.Figure 12 shows the derived values of the oxide
growth stress for all three orientations of both
alloys. Two opposite tendencies are revealed. Onthe Fe±Cr±Al alloy, a rapid increase of the stress isfollowed by a gradual decline, essentially to zero
after 20±30 h of oxidation. In contrast, on theyttrium-containing alloy the growth stress exhibits a
continuous increase up to about 1 GPa and then aslight decrease after prolonged oxidation, which isbelieved to be a result of metal plastic relaxation, as
indicated previously. Except for the ®rst 2±3 h, thecompressive stress in the oxide on the Fe±Cr±Al±Yalloy is substantially larger than that on the Fe±Cr±
Al alloy. Several other features are worth mention-ing. In all experiments, a growth stress of the order
of 0.3±1.0 GPa is observed in very thin scales afteronly 6 min oxidation. The compression is notablyhigher on the (100) and, especially, (110) specimens
of the Fe±Cr±Al alloy; it is precisely these orien-tations that produce less wrinkled scale initially. Onthe other hand, the (111) Fe±Cr±Al alloy and all
orientations of the Fe±Cr±Al±Y alloy exhibit ap-proximately equal growth stresses at the beginning
of oxidation. Nevertheless the scale wrinkles withinminutes on the former whereas it remains ¯at onthe latter.
The growth stress for the Fe±Cr±Al alloy inFig. 12 seems to decrease and become tensile (posi-tive values) after longer times. This is, most prob-
ably, due to the fact that the scale con®guration isnot exactly symmetrical, so that the assumptions
used for the numerical analysis are not entirelyvalid at long times. In particular, the frequencyshift ratio [equation (7)] is only approximate. The
second possibility is that partial stress relaxation inthe metal occurs during cooling. To this point, theassumption has been made that the metal deforms
elastically when temperature changes. For a ¯atoxide, this appears to be reasonable because of thesmall and uniform thermal stress in the metal, as
mentioned above. The presence of wrinkles, how-ever, should result in a non-uniform stress distri-
bution in the subscale region of the metal withrelatively high stresses in speci®c areas [11]. It ispossible that plastic deformation of the metal
occurs in these areas during cooling, thus leading toa decrease of the average residual stress in theoxide.
A comparison of the results for the Fe±Cr±Aland Fe±Cr±Al±Y alloys in Fig. 12 and the micro-
scopic observations show that the existence of highgrowth stresses is not su�cient alone to causewrinkling. Moreover, even on the same Fe±Cr±Al
alloy, a higher growth stress on the (110) orien-tation does not lead to more extensive wrinkling.This suggests that the scale con®guration is related
to stress relaxation in the oxide but not speci®callyto the magnitude of the growth stress itself. If so,
the rate of alumina plastic relaxation becomes a
critical factor in determining stress in the scaleduring its growth. Fast plastic deformation providesa decrease of the growth stress essentially to zero
on the (111) and (100) Fe±Cr±Al after severalhours. For some reason, it is retarded on the (110)orientation, thus the growth stress remains substan-
tial for much longer times. Certainly, a higher stressin the oxide should lead to a higher creep rate, but
other parameters such as alumina grain size orgrain aspect ratio may well be dominating.One of the consequences of the wrinkling and the
fact that the underlying metal conforms to theoxide is that the surface orientation of the metalchanges with time and becomes more and more ran-
domized as wrinkling proceeds. As a result, the in-itial distinction between the crystallographic
orientations of the specimens becomes smeared outwhen a thin scale is formed. It is therefore likelythat the observed di�erences in residual stress and
wrinkling morphology are determined at the nuclea-tion stage of the scale formation. For instance, if alarger density of alumina nuclei form on the (111)
orientated surface of the Fe±Cr±Al alloy, a smalleroxide grain size will result, thereby facilitating creep
during oxidation. Conversely, a lower nucleationdensity would lead to a larger grain size and hencea more creep resistant oxide. Some preferential
orientation of alumina grains relative to the metal'sinitial orientation is also possible [19], which wouldalso a�ect plastic behavior of the scale and result in
di�erent creep rates.It might be supposed, following the above argu-
ments, that the absence of wrinkling on the Fe±Cr±Al±Y alloy denotes a very slow relaxation, andtherefore the growth stress remains high during oxi-
dation. This assumption looks even more reason-able as the creep rate of alumina has been shown tobe signi®cantly reduced by yttrium doping [20, 21].
However, such a consideration is not completelysatisfactory for the following reason: the oxide onthe Fe±Cr±Al±Y alloy remains ¯at even after very
long oxidation times and the growth stress remainshigh. On the other hand, after prolonged oxidation,
a relatively thick scale on the Fe±Cr±Al alloy con-tinues to deform under small, if any, growth stress,which is evident from the continuous evolution of
the wrinkling wavelength and amplitude (Fig. 5). Inorder to explain the di�erence between the twoalloys, it should be noted that the value of the
growth stress at any given time represents the resultof two concurrent and competing processes in the
scale: stress generation and stress relief. A compari-son of the growth stresses on the two alloys(Fig. 12) has already demonstrated that the exist-
ence of a very high stress in the scale on theyttrium-containing alloy is not su�cient to causewrinkling. Another factor appears to be most sig-
ni®cant in determining whether the oxide remains¯at or assumes a wrinkled con®guration, namely,
TOLPYGO and CLARKE: WRINKLING OF a-ALUMINA FILMSÐI 5163

the lateral growth strain of the oxide. Following the
arguments used to describe the stress generation
during oxidation [12], we suppose that the stresses
develop when the scale grows in the lateral direction
but is constrained by the underlying metal. (The
growth in the direction normal to the surface is not
constrained and produces an increase in oxide
thickness.) While the mechanism of such lateral
growth is not known, the Rhines±Wolf model [3],
suggesting the formation of oxide within the exist-
ing layer, seems to be the most plausible expla-
nation.
Quanti®cation of the scale morphology on the
Fe±Cr±Al alloy makes it possible to determine the
lateral growth from the measured surface area of
the scale. As shown in Fig. 5(c), the surface area of
the wrinkled oxide is substantially larger than the
initially ¯at surface. The increase of the surface
area can be described by a strain, ew, obviously
plastic, which can be obtained from the surface
area ratio:
ew ����������������1� DS
S0
sÿ 1 �8�
where the ratio of surface area increase to the initial
surface area, DS/S0, is taken from the AFM rough-
ness analysis [Fig. 5(c)]. Figure 13 shows the time
variation of the strain ew, de®ned in this way, for
the three orientations of the Fe±Cr±Al alloy. This
experimentally measured strain represents a sum of
the growth strain, egrowth, and elastic strain, eel, inthe scale during oxidation
ew � egrowth � eel �9�In turn, the elastic strain is given by the growth
stress value
eel � sG1ÿ �oxE T
ox
�10�
where the stress sG is determined by equation (5)
and presented in Fig. 12. This strain is taken to be
negative because the oxide is under compression.
Combining equations (8)±(10), the growth strain is:
egrowth �� ���������������
1� DSS0
sÿ 1
�ÿ sG�1ÿ �ox�
E Tox
�11�
Note that all strains are considered at temperature,
therefore the thermal strains are not included. We
also suppose that the oxide morphology does not
change during cooling so the surface area, measured
at room temperature, is the same as at the oxi-
dation temperature.
The growth strain de®ned by equation (11) for
the oxide formed on the Fe±Cr±Al alloy is pre-
sented in Fig. 14. For comparison, the growth
strain for the Fe±Cr±Al±Y alloy is included. The
elastic contribution [the second term on the right-
hand side of equation (11)] is rather small for the
Fe±Cr±Al alloy, whereas it is the only contribution
included for the ¯at oxide on the Fe±Cr±Al±Y
alloy. The di�erence between the oxide growth
strains for the two alloys is remarkable. From the
very beginning of oxidation the growth strain is
substantially larger on the Fe±Cr±Al alloy and
rapidly increases with time reaching a value of 5±
6%, more than an order of magnitude higher than
on the Fe±Cr±Al±Y alloy. After about 20±30 h, the
growth strain does not increase on the Fe±Cr±Al
alloy. Apparently, the oxide wrinkling is not a con-
tinuous process: it takes place during initial stages,
gradually slows down and eventually stops after
prolonged oxidation.
Strictly speaking, there should be additional
terms on the right-hand side of equation (11). First
and foremost, a plastic relaxation in the oxide that
Fig. 13. Lateral strain of the wrinkling a-Al2O3 scale ondi�erent orientations of the Fe±Cr±Al alloy determinedfrom the oxide surface area enlargement according toequation (8). This strain represents plastic deformation as-sociated with oxide wrinkling. The surface area enlarge-ment, DS/S0, is taken from the AFM roughness analysis
[Fig. 5(c)].
Fig. 14. Lateral growth strain of the oxide on the Fe±Cr±Al (solid symbols) and Fe±Cr±Al±Y (open symbols) alloys
calculated according to equation (11).
TOLPYGO and CLARKE: WRINKLING OF a-ALUMINA FILMSÐI5164

occurs without wrinkling should be mentioned. Theexistence of this relaxation mode has been recently
demonstrated for the Fe±Cr±Al±Y alloy oxidized at1100±13008C [12, 22]. The oxide creep, presumablyin the direction normal to the surface, provides a
way to accommodate the lateral growth strain ofthe order of a few percent at higher temperaturesand longer times. Perhaps the columnar grain struc-
ture of the scales with yttrium makes this type ofplastic deformation preferable to wrinkling on theyttrium-free alloy where the oxide grains are
equiaxed. In the present work, we could not quan-tify the oxide creep contribution for the Fe±Cr±Al±Y alloy. However, it might be quite signi®cant asthe growth stress is very high in the scale at
10008C. For the Fe±Cr±Al alloy, an additionaloxide creep normal to the interface is also possible,most probably during initial stages when the growth
stress is high. This correction would shift the curvesof the growth strain, egrowth, in Fig. 14 upwards.Another term describing metal elongation [12]
during oxidation should also be included inequation (11). This strain, however, was too smallto be detected experimentally in this work. As men-
tioned previously, a possible metal elongation thatcould remain undetected is about 10ÿ3. Thus, theactual growth strain values for the Fe±Cr±Al±Yalloy in Fig. 14 may be up to 10ÿ3 higher after
longer times (when the metal elongation might beexpected). For the Fe±Cr±Al alloy this correction isinsigni®cant because, when the oxide becomes rela-
tively thick, the growth stress is already small. Withall the uncertainties indicated, the di�erencebetween the growth strains for the two alloys may
in fact not be quite so large as that presented inFig. 14, but they will nevertheless be substantiallydi�erent.No reliable explanation can be o�ered at this
time as to why the lateral growth of the oxide onthe Fe±Cr±Al alloy apparently terminates after cer-tain oxidation exposure. One possibility is that the
growth strain actually continues to increase, whilethe plastic relaxation occurs not only by oxidewrinkling but also by creep in the direction normal
to the surface. As a result, the growth strain at thisstage can be accommodated without increasing thesurface area. On the other hand, a small growth
stress in the oxide after prolonged oxidation indi-cates that this relaxation is very unlikely.
5. CONCLUSIONS
Measurements of the surface topography of a-Al2O3 scales formed on single-crystalline Fe±Cr±Alalloys during oxidation at 10008C show that thewrinkling of the scale depends on the initial crystal-
lographic orientation of the alloy surface. The re-sidual room-temperature stress in the scales alsodepends on the alloy orientation and varies withoxidation time. These experimental results were
used to evaluate the growth stress in the scale andits evolution during oxidation.
Wrinkling is more extensive on the (111) orien-tation, which leads to fast relaxation of the growthstresses in the scale. Wrinkling is retarded on the
close-packed (110) plane and, correspondingly, thegrowth stress is higher. After oxidation for about30 h, the di�erence between metal orientations
becomes negligible. The time evolution of the geo-metrical parameters describes the process of wrink-ling in terms of the surface area enlargement.
Experimental results show that wrinkling of thescale on the Fe±Cr±Al alloy is apparently a transi-ent process that takes place during 20±30 h at10008C. Further oxidation does not produce ad-
ditional enlargement of the surface area, while theplastic deformation of the scale continues. This fol-lows from a continuous increase of the amplitude
and wavelength of oxide undulations.Except for the ®rst few hours of oxidation, the
growth stress in the scale is higher on the Fe±Cr±
Al±Y alloy than on the yttrium-free alloy.However, no wrinkling occurs, primarily it is con-cluded, because of a smaller growth strain in the
scales in the presence of yttrium.
AcknowledgementsÐThis work was supported by theO�ce of Naval Research under grant N00014-97-1-0190and also made use of the MRL Central Facilities sup-ported by the National Science Foundation under AwardNo. DMR-9123048. The authors are thankful to H. J.Grabke (MPI, DuÈ sseldorf) for providing single-crystal spe-cimens for this study.
REFERENCES
1. Stott, F. H., Wood, G. C. and Stringer, J., Oxid.Metals, 1995, 44, 113.
2. Golightly, F. A., Stott, F. H. and Wood, G. C., Oxid.Metals, 1976, 10, 163.
3. Rhines, F. N. and Wolf, J. S., Metall. Trans., 1970, 1,1701.
4. Suo, Z., J. Mech. Phys. Solids, 1995, 43, 829.5. Hou, P. Y., Cannon, R. M., Zhang, H. and
Williamson, R. L., in Proc. Symp. on FundamentalAspects of High Temperature Corrosion, ed. D. A.Shores, R. A. Rapp and P. Y. Hou. ElectrochemicalSociety, Pennington, NJ, 1997, pp. 28±40.
6. Smeggil, J. G., Mater. Sci. Engng, 1987, 87, 261.7. Grabke, H. J., Kurbatov, G. and Schmutzler, H. J.,
Oxid. Metals, 1995, 43, 97.8. Meier, G. H., Pettit, F. S. and Smialek, J. L.,
Werksto�e Korros., 1995, 46, 232.9. Evans, A. G., Crumley, G. B. and Demaray, R. E.,
Oxid. Metals, 1983, 20, 193.10. Chao, J. and Gonzalez-Carrasco, J. L., Mater. Sci.
Engng, 1997, A230, 39.11. Gong, X.-Y. and Clarke, D. R., Oxid. Metals, 1998,
50, 355.12. Tolpygo, V. K., Dryden, J. R. and Clarke, D. R.,
Acta mater., 1998, 46, 927.
TOLPYGO and CLARKE: WRINKLING OF a-ALUMINA FILMSÐI 5165

13. Tolpygo, V. K. and Clarke, D. R., Acta mater., 1998,46, 0000 (submitted).
14. Tolpygo, V. K. and Grabke, H. J., Oxid. Metals,1994, 41, 343.
15. Ma, Q. and Clarke, D. R., Acta metall. mater., 1993,41, 1811.
16. Lipkin, D. M. and Clarke, D. R., Oxid. Metals, 1996,45, 267.
17. He, J. and Clarke, D. R., J. Am. Ceram. Soc., 1995,78, 1347.
18. Munro, R. G., J. Am. Ceram. Soc., 1997, 80, 1919.19. Smialek, J. L. and Gibala, R., Metall. Trans., 1983,
14A, 2143.20. French, J. D., Zhao, J., Harmer, M. P., Chan, H. M.
and Miller, G. A., J. Am. Ceram. Soc., 1994, 77,2857.
21. Fang, J., Thompson, A. M., Harmer, M. P. andChan, H. M., J. Am. Ceram. Soc., 1997, 80, 2005.
22. Tolpygo, V. K. and Clarke, D. R., Oxid. Metals,1998, 49, 187.
TOLPYGO and CLARKE: WRINKLING OF a-ALUMINA FILMSÐI5166