wright report2 2012
TRANSCRIPT

July - December, 2012
www.WrightRealEstate.us Page 1 (916) 726-8308
Wright Report
Perspectives and Overview of Northern California’s
Residential Real Estate Market:
Including Statistics and Trends for the United States, State of California, and Northern
California Counties. Research, Charts, and Graphs for areas within Sacramento, Placer, Yolo,
El Dorado & San Joaquin Counties.
July to December, 2012
TTHHEE WWRRIIGGHHTT RREEPPOORRTT

July - December, 2012
www.WrightRealEstate.us Page 2 (916) 726-8308
Wright Report
The Wright Report
Prepared by:
Prepared By: Joel Wright
Document Version: Final
Last Updated On: March, 2013

July - December, 2012
www.WrightRealEstate.us Page 3 (916) 726-8308
Wright Report
This work is licensed under the Creative Commons Attribution-ShareAlike 3.0 Unported
License. To view a copy of this license, visit http://creativecommons.org/licenses/by-sa/3.0/
or send a letter to Creative Commons, 171 Second Street, Suite 300, San Francisco,
California, 94105, USA.

July - December, 2012
www.WrightRealEstate.us Page 4 (916) 726-8308
Wright Report
TABLE OF CONTENTS
TABLE OF CONTENTS ....................................................................................................................... 4
EXECUTIVE SUMMARY:.................................................................................................................... 5
THE EXPERTS WEIGH IN: .................................................................................................................. 6
Sacramento Appraiser: Ryan Lundquist ....................................................................... 6
Real Estate Attorney: Stephen Beede .......................................................................... 7
Mortgage Broker: Jeff Marr .......................................................................................... 9
MARKET FOCUS: The Budding Recovery ....................................................................................... 10
MARKET UPDATE: .......................................................................................................................... 14
THE ECONOMY: ............................................................................................................................. 18
BANKING & LENDING: ................................................................................................................... 20
DISTRESSED PROPERTIES: .............................................................................................................. 22
COUNTY STATISTICS: ..................................................................................................................... 25
Sacramento County .................................................................................................... 25
Placer County .............................................................................................................. 26
El Dorado County ........................................................................................................ 28
Yolo County ................................................................................................................ 29
San Joaquin County ....................................................................................................................... 30
HISTORICAL PRICE GRAPHS: .......................................................................................................... 31
PLACER COUNTY: ........................................................................................................................... 32
SACRAMENTO COUNTY: ................................................................................................................ 34
RESOURCES: ................................................................................................................................... 42
July - December, 2012
www.WrightRealEstate.us Page 5 (916) 726-8308
Wright Report
EXECUTIVE SUMMARY:
The current residential real estate market for the greater Sacramento
Metro area is poised for one of the greatest increases in appreciation
ever seen. Not only are rates at all time lows, but rents remain
strong, demand is increasing, and prices are being driven
progressively higher by forces on all sides.
By examining the real estate market, banking, lending, economic
issues, new homes, distressed inventory and sales, and up to date
market statistics one can see that the market is moving upward
rapidly and those who purchase now will realize huge price gains over
the next few years.
The turnaround in the residential market has two causes, both of
which have been artificially created to generate recovery: first, low
interest rates and second, low inventory (low supply and rising
demand). Interest rates are near 3.5%, and inventory is around 3
weeks of homes for sale.
As the two forces play out, prices rise: developers build new homes
and construction results in new jobs; reducing unemployment and
increasing tax revenues which leads to an overall economic recovery.
This situation is occurring not only in Sacramento County but in other
surrounding counties as well: Placer, Yolo, El Dorado, and San Joaquin.
Because of the rapid rise in prices there are numerous offers on each
property with many offers over asking price. It has definitely switched
to a seller’s market and it takes patience, persistence, and a great
team of professionals to navigate a real estate transaction successfully
in this turbulent market place.

July - December, 2012
www.WrightRealEstate.us Page 6 (916) 726-8308
Wright Report
THE EXPERTS WEIGH IN:
Sacramento Appraiser: Ryan Lundquist
The Market Shift in Sacramento
The Sacramento market from July through December 2012 can best be described as having shifted. Housing inventory saw a dramatic decline as the percentage of foreclosures dropped from 31.6% of the market in Q1 of 2012 to only 11% of the market in Q4 2012 in Sacramento County. This alone created heightened competition among buyers, but on top of that investor cash became a very dominant force in the market. By the end of 2012, 35.6% of all sales in Sacramento County were cash sales, and 49% of all sales under $200,000 were cash deals.
Beginning in August 2012 we began to see the private equity fund Blackstone purchase properties in mass in multiple counties surrounding Sacramento, but mostly in first-time buyer neighborhoods in Sacramento County under $200,000. They purchased close to 500 properties on MLS (and many off MLS too). With about 80% of their focus under $200,000, and combined with many other investors entering the market, we began to see buyers make more aggressive offers and even write purchase contracts well over asking price. Essentially we saw the market appreciate rapidly in the last two quarters of the year. One of the other byproducts of the increase of cash in the market was a 10% decline of FHA financing in the first-buyer market, and an increase in conventional financing across the board.
July - December, 2012
www.WrightRealEstate.us Page 7 (916) 726-8308
Wright Report
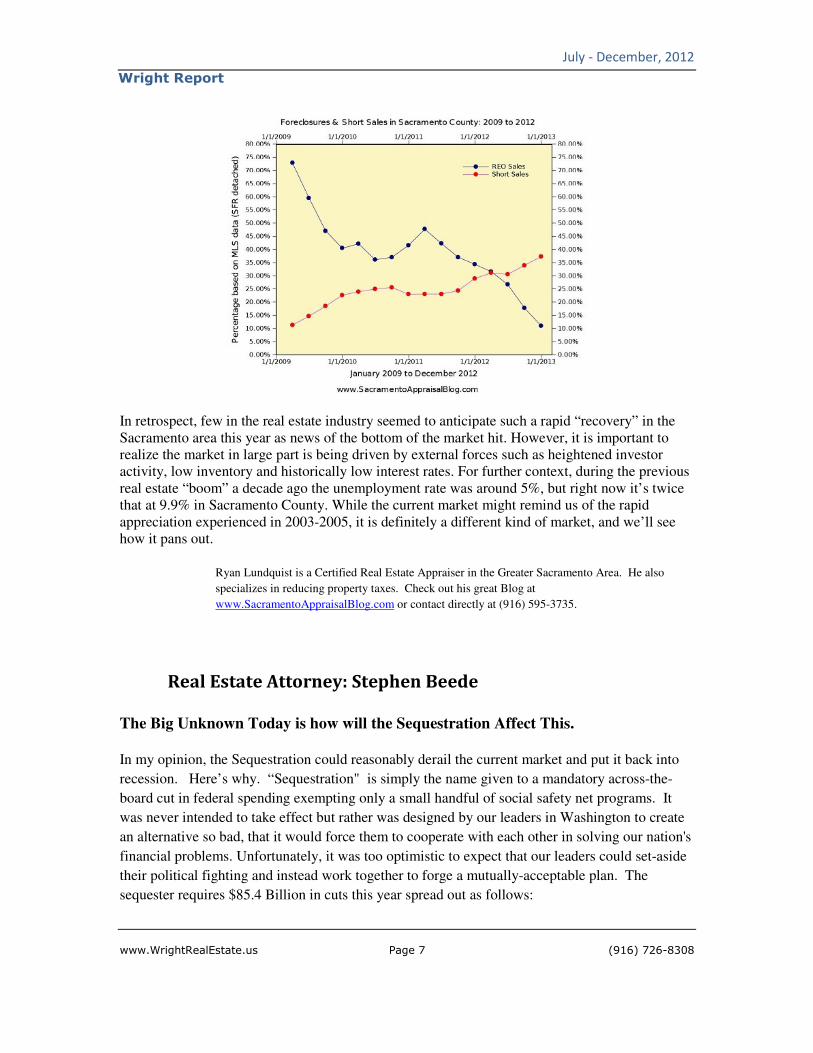
In retrospect, few in the real estate industry seemed to anticipate such a rapid “recovery” in the Sacramento area this year as news of the bottom of the market hit. However, it is important to realize the market in large part is being driven by external forces such as heightened investor activity, low inventory and historically low interest rates. For further context, during the previous real estate “boom” a decade ago the unemployment rate was around 5%, but right now it’s twice that at 9.9% in Sacramento County. While the current market might remind us of the rapid appreciation experienced in 2003-2005, it is definitely a different kind of market, and we’ll see how it pans out.
Ryan Lundquist is a Certified Real Estate Appraiser in the Greater Sacramento Area. He also
specializes in reducing property taxes. Check out his great Blog at
www.SacramentoAppraisalBlog.com or contact directly at (916) 595-3735.
Real Estate Attorney: Stephen Beede
The Big Unknown Today is how will the Sequestration Affect This.
In my opinion, the Sequestration could reasonably derail the current market and put it back into
recession. Here’s why. “Sequestration" is simply the name given to a mandatory across-the-
board cut in federal spending exempting only a small handful of social safety net programs. It
was never intended to take effect but rather was designed by our leaders in Washington to create
an alternative so bad, that it would force them to cooperate with each other in solving our nation's
financial problems. Unfortunately, it was too optimistic to expect that our leaders could set-aside
their political fighting and instead work together to forge a mutually-acceptable plan. The
sequester requires $85.4 Billion in cuts this year spread out as follows:

July - December, 2012
www.WrightRealEstate.us Page 8 (916) 726-8308
Wright Report
Defense - $42.7 Billion (7.9%)
Domestic Programs - $28.7 Billion (5.3%)
Medicare - $9.9 Billion (2%)
Other mandatory cuts - $4 Billion
The administrators running each of those government departments will have the discretion as to
how those cuts will be made within their agencies. Here is an analysis of specifics put out by the
Office of Management and Budget (OMB):
For most of us, none of the above cuts will have a direct impact such as loss of jobs. But the
indirect impacts will touch us all with a trickle-down layering. For example:
1. Every cut in a government program will result in a loss of some employee jobs and a cut of
that departments purchasing. This will reduce the money being spent on everything from
groceries to travel to office supplies and more;
2. This will cause a reduction in income, first to businesses contracting with the government
which in turn will result in their reduction of jobs and spending; and secondarily to all the other
businesses and individuals below as the reductions in spending trickle down through the
economy.
3. The still fragile recovering real estate market is dependent upon jobs to fuel new buyers to
acquire the remaining upside-down properties which still number in the millions. More people
may find themselves unable to hang on. With more homes hitting the market and less buyers
available, price growth will stall and maybe even drop.
Lastly, it is critical to understand that these $85.4 Billion in cuts is just a first step in a 10 year
process to reduce our Federal deficit by $1.5 Trillion by 2021. Under the sequester plan there will
be additional cuts of $109.3 Billion a year from 2014-2021. Overall, the net effect is to reduce the
size of government and reduce our Federal Deficit.
These goals are something that we all may recognize needs to be done, but no-one really wants
the effects to hurt them directly. The reality is however, that whether it is by the Sequester or
some other agreed-upon Plan, every one of us will feel the pain in one way or another. That will
be the price of leaving our grandchildren a Nation that is economically solvent rather than
drowning them in unsustainable debt payments. I personally believe that the future of our nation
rides on the deficit-reducing budget decisions our leaders make. Whether it is organized
negotiation or a messy sequestration, these are steps that we know we must take.
Stephen Beede is a prominent local attorney with very wide experience with residential real estate
that he brings to his law practice. He can be reached online at www.bpelaw.com and
[email protected]. He also keeps an excellent blog at www.stevebeede.com; contact him
directly at (916) 966-2260.

July - December, 2012
www.WrightRealEstate.us Page 9 (916) 726-8308
Wright Report
Mortgage Broker: Jeff Marr
Mortgages and the Fed’s Role.
When I got started in the lending field roughly 9 years ago (early 2005), our economy was on the
tail edge of economic expansion, and one of the most common questions I got was ‘I hear the
Fed’s going to raise rates at their next meeting, should I lock my rate before this happens’? My
common response was ‘the Fed only controls short term rates (primarily the Fed Funds and
Discount rates, which set lending costs for banks needing over-night loans for reserve
requirements), and has no influence on mortgages, which are longer term debts (30 year pay back
periods in most cases). I would then typically go on to explain the factors that DID influence
interest rates, namely the outcome of economic reports indicating whether our economy is
growing or contracting. Though the Fed’s role was very limited back then related to mortgage
rates, this has changed in the past few years, and changed dramatically!
In response to the financial meltdown that occurred, beginning in late 2008, the Fed began taking
some extraordinary measures to boost the economy, purchasing immense amounts of both
mortgage-backed securities (MBS or simply called mortgage bonds), and similar amounts of US
Treasuries. These purchase programs came to be known as ‘Quantitative Easing, or ‘QE’, and the
Fed has performed three rounds of QE so far, accounting for several Trillion dollars-worth of
bond purchases……
When the first round of QE was announced in Nov of 2008, the mortgage market’s response was
immediately positive and rates fell sharply, roughly ¼ % in a single day upon this
announcement….we saw a similar response when QE 2 began in Nov of 2010…..by the time QE
3 was announced in Sept of 2011, which had been widely expected for many months, the impact
on rates wasn’t as dramatic, but has mostly acted as lid for keeping rates low…If we look at
where rates were in late 2008 compared to current levels, we’ve seen them drop roughly 1.5 – 2%
over this period (they were in the 5.5% range, fell as low as 3.5% in late 2012)…and prior to this,
we had never seen sustained levels this low, ever!
So given that our economy, and especially the housing market, seems to be improving, what will
be the impact to mortgage rates when the Fed ends QE 3? There’s been some who expect that QE
3 will end later year, so will rates slowly move higher, or could it happen more abruptly? Or
could we retest the last year’s low rates given all the international economic uncertainty (debt
crisis in Europe, slowing China economy, etc.)? We’ll have to wait and see!
Jeff Marr is a mortgage lender with Alpine Mortgage and a Financial Planner before that. He has
been in Mortgage Lending since 2005 and financial services since 1997. He can be reached at
(916) 947-1312.
July - December, 2012
www.WrightRealEstate.us Page 10 (916) 726-8308
Wright Report
MARKET FOCUS: The Budding Recovery
Sacramento’s growing recovery is, like much of the United States, a
result of two major forces: historically low interest rates & historically
low inventory. Both of these elements are artificially created to force
the housing market to recovery.
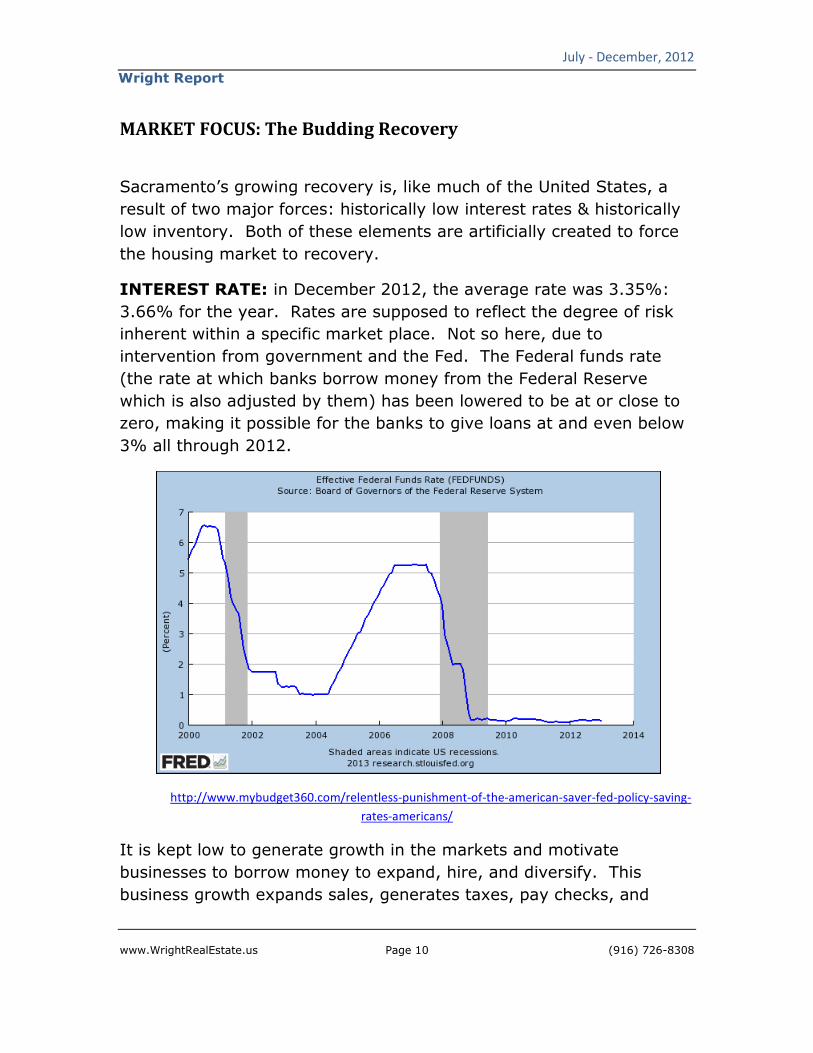
INTEREST RATE: in December 2012, the average rate was 3.35%:
3.66% for the year. Rates are supposed to reflect the degree of risk
inherent within a specific market place. Not so here, due to
intervention from government and the Fed. The Federal funds rate
(the rate at which banks borrow money from the Federal Reserve
which is also adjusted by them) has been lowered to be at or close to
zero, making it possible for the banks to give loans at and even below
3% all through 2012.
http://www.mybudget360.com/relentless-punishment-of-the-american-saver-fed-policy-saving-
rates-americans/
It is kept low to generate growth in the markets and motivate
businesses to borrow money to expand, hire, and diversify. This
business growth expands sales, generates taxes, pay checks, and

July - December, 2012
www.WrightRealEstate.us Page 11 (916) 726-8308
Wright Report
expands the economy. It seems to have mostly benefited home
buyers by creating low monthly payments: the lower the rate, the
lower the payment, regardless of the price.
This has caused affordability to go to all time highs nationally in 2012
and made the possibility of home ownership accessible to most anyone
with good credit and stable employment.
Incidentally the Fed says they expect to keep the rate down into 2014.
INVENTORY: The other side of the equation is lack of inventory.
Inventory is a direct result of supply and demand economics and it has
been driven to historical lows by the restriction of supply and the
increasing demand.
Supply-
The primary factors currently affecting supply are (1) the lack of REO
properties for sale and (2) the lack of Short Sales, (3) Institutional
Investors entering the market and (4) the rise of Bulk Sales.
REO Inventory (homes for sale by banks) has dramatically declined
through 2012, and it is likely to continue to decrease. The reason?
Banks don’t want to own or sell property. The five largest lenders
were hit with a judgment from the robosigning scandal for 25 Billion
dollars, so they are more than hesitant to foreclose and cautious with
the process. They also see the market rising and realize that if they
put foreclosures off they will make back some of their losses.
Foreclosures are also in decline in California due to the “Homeowner’s
Bill of Rights” which states that if the owner is negotiating with the
bank to modify their loan or trying to do a short sale the bank must
stop any foreclosure process. This too will limit foreclosure notices
and sales in CA.
Short Sales are also dropping for several reasons. HARP, the
government’s refinance program for underwater homeowners, made
changes to their criteria in 2012 making it possible for a larger number
of homeowner with negative equity to be able to take advantage of the

July - December, 2012
www.WrightRealEstate.us Page 12 (916) 726-8308
Wright Report
low interest rates and refinance. They came in droves. Also, lenders
are now actively pursuing loan modifications to help delinquent
borrowers get back on track. In addition, the type of homeowners
currently having trouble making payments are very different from
those in 2008. While those in 2008 probably should never have been
given a loan in the first place, owners in trouble in 2012 have
weathered 4 years of a down economy and frequently just need a little
help to get back on their feet. This makes loan modifications and work
outs an efficient way to limit losses for the banks. Also as prices rise
fewer owners are underwater and more can sell at a profit without
short sale.
Institutional Investors are one of the biggest shifts occurring in real
estate this year. It heralds the entrance of Wall Street into the
residential market. Hedge funds, trusts, corporations, pension funds &
private investors are all jumping in. Perhaps the most well know
entrant into residential real estate is Blackstone (NYSE:BX) which
purchased some 17,000 homes during 2012 with an estimated 2.2
Billion dollars. These investors have dominated foreclosure auctions
and are providing stiff competition to homebuyers in under $200,000
neighborhoods. They pay all cash and don’t mind overpaying to get a
property.
The intention of these large investors is to buy, fix and hold as a long
term investment where they can get regular cash flow and eventually
sell for a sizable profit.
Bulk Sales unfortunately have become part of the landscape as
Fannie Mae, Freddie Mac and HUD are testing out the method to rid
themselves of nonperforming loans and undesirable inventory. HUD
plans to sell up to 40,000 delinquent loans over the next year; a
process they began in 2012.
Fannie Mae made a bulk sale of some 3 Billion dollars in homes in
2012. These homes are also intended to be rentals and part of the
agreement stipulates they must hold them for a minimum term so
none will be coming to the market as flips.

July - December, 2012
www.WrightRealEstate.us Page 13 (916) 726-8308
Wright Report
Demand-
The primary factors affecting demand are (1) New household
formation, (2) Boomerang buyers, (3) Bottom bouncers, and (4)
Investors.
New Household Formation. Across the U.S. household creation has
declined since 2006. Young people are postponing marriage and
staying at home after graduation. That is expected to change in 2013
where it is estimated that more than one million new households will
be created. When this occurs they will be looking for a place to live.
Boomerang Buyers are home buyers who previously owned and lost
their houses to foreclosure or short sale between 2007 and 2010. The
process to resurrect their credit takes a minimum of three years (five
years for foreclosure) so many will be coming back into the market in
2013. These are buyers who have already owned and are committed
to home ownership and the benefits it provides.
Bottom Bouncers are buyers who have waited for the bottom to
arrive and now that the market is rebounding are trying to get in as
fast as possible. They try to time the market and are afraid of getting
left behind.
Investors, like the bottom bouncers, they see the benefits of the
rising prices, positive cash flow, and low interest rates and are buying
all they can. They frequently buy all cash, so they are tough
competitors in the market place.

www.WrightRealEstate.us
Wright Report
http://www.doctorhousingbubble.com/all
In addition to all of these
down, or sideways who are also looking to buy in the growing market
of rising prices, low rates, and multiple offers. Together it turns the
market into a feeding frenzy fueling price inflation.
Conclusions: rates and la
industry growth, which will drive the U.S. economic recovery. It is
unlikely that any of the
rapid growth in housing prices and sales
MARKET UPDATE:
The median price across the U.S. hit $176,000 in 2012, up 6.3% from
2011. In January 2013 the median sold price in CA
24% from January 201
2006.
July - December
Page 14
http://www.doctorhousingbubble.com/all-cash-real-estate-buying-trend-all-cash-
2012-2013-cash-trend/
these there are the regular buyers moving up,
who are also looking to buy in the growing market
of rising prices, low rates, and multiple offers. Together it turns the
market into a feeding frenzy fueling price inflation.
Conclusions: rates and lack of inventory are driving the housing
industry growth, which will drive the U.S. economic recovery. It is
unlikely that any of these contributing factors will reverse in 2013 so
rapid growth in housing prices and sales can be expected.
The median price across the U.S. hit $176,000 in 2012, up 6.3% from
January 2013 the median sold price in CA hit $337,040
2012 and down 28.2% from the $469,500 peak in
December, 2012
(916) 726-8308
-buying-record-
are the regular buyers moving up,
who are also looking to buy in the growing market
of rising prices, low rates, and multiple offers. Together it turns the
ck of inventory are driving the housing
industry growth, which will drive the U.S. economic recovery. It is
contributing factors will reverse in 2013 so
The median price across the U.S. hit $176,000 in 2012, up 6.3% from
337,040, up
% from the $469,500 peak in

July - December, 2012
www.WrightRealEstate.us Page 15 (916) 726-8308
Wright Report
Affordability also came to an all time high in 2012 across the nation
due to already low prices and declining interest rates. In CA
affordability hit 48% in Q4-2012, down 1 point from Q3-12 and 7
points from 55% in Q4-11.
In December 2012 NAR (National Association of Realtors) showed price
increases in 135 of 152 metro areas that it tracks. Dataquick showed
price increases in 201 of 361 metro areas it tracks.
According to CAR (California Association of Realtors) the median home
price for California in December 2012 was $366,930; 28.3% higher
than the $285,920 in December of 2011. That median price is up 50%
from the 2009 bottom of $245,000.
In Sacramento County the median price rose to $195,000 in
December, up 21% from the median price in Dec. 2011. The average
sold price for Sacramento County for Dec. 2012 was $224,752; up
21% from the year before.
COUNTY Average Sold Price % Change
Dec-11 Dec-12
Sacramento $186,329 $224,752 20.62%
Placer $298,550 $338,571 13.41%
El Dorado $306,305 $336,308 9.80%
Yolo $268,652 $312,310 16.25%
Since the market turned downward in September 2005 it declined 59%
in median price for single family homes (SFR) with the lowest point
being $160,000 in January 2012. Since that point the market rose
22% through December and is showing strong signs of potential
growth.
In California 36.4% of sales in December were distressed sales (short
sales or REO). In Sacramento County that was 51.4%, down from
63% at the end of 2011. Across the State short sales make up an
average of 25% of sales. In Sacramento County it is 40.7%. REOs
July - December, 2012
www.WrightRealEstate.us Page 16 (916) 726-8308
Wright Report
(foreclosed bank owned sales) made up 11% of sales in CA, and
10.7% in Sacramento County.
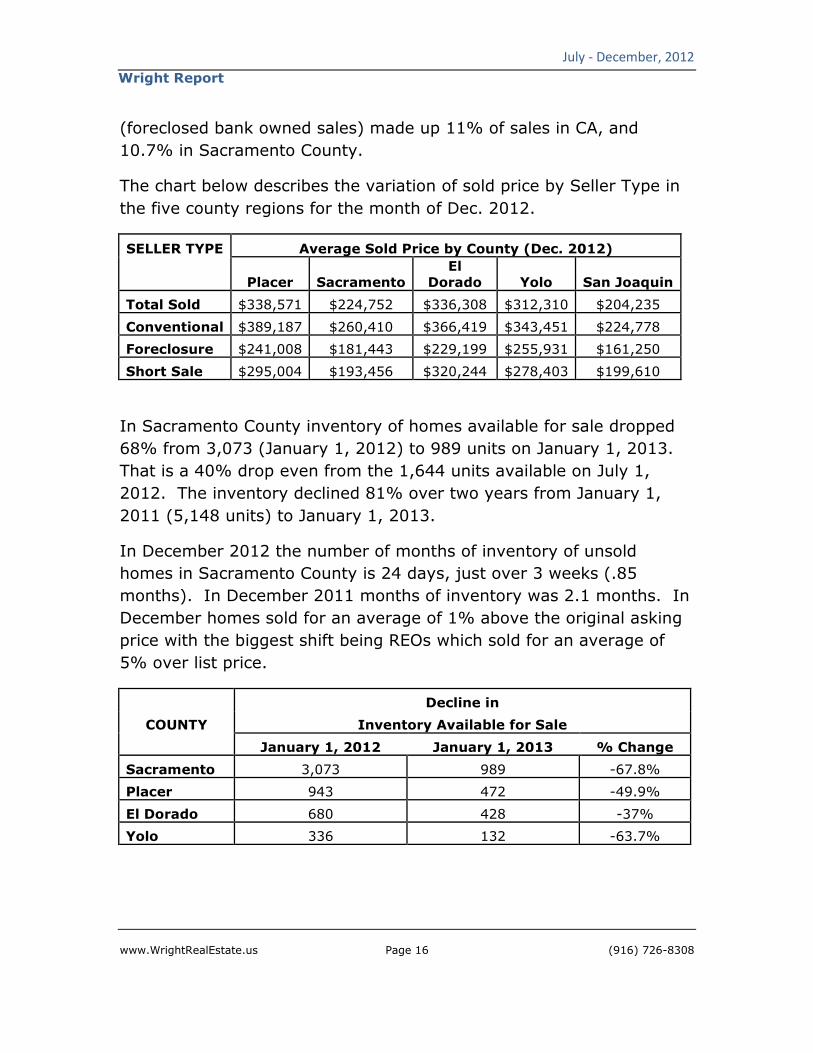
The chart below describes the variation of sold price by Seller Type in
the five county regions for the month of Dec. 2012.
SELLER TYPE Average Sold Price by County (Dec. 2012)
Placer Sacramento El
Dorado Yolo San Joaquin
Total Sold $338,571 $224,752 $336,308 $312,310 $204,235
Conventional $389,187 $260,410 $366,419 $343,451 $224,778
Foreclosure $241,008 $181,443 $229,199 $255,931 $161,250
Short Sale $295,004 $193,456 $320,244 $278,403 $199,610
In Sacramento County inventory of homes available for sale dropped
68% from 3,073 (January 1, 2012) to 989 units on January 1, 2013.
That is a 40% drop even from the 1,644 units available on July 1,
2012. The inventory declined 81% over two years from January 1,
2011 (5,148 units) to January 1, 2013.
In December 2012 the number of months of inventory of unsold
homes in Sacramento County is 24 days, just over 3 weeks (.85
months). In December 2011 months of inventory was 2.1 months. In
December homes sold for an average of 1% above the original asking
price with the biggest shift being REOs which sold for an average of
5% over list price.
COUNTY
Decline in
Inventory Available for Sale
January 1, 2012 January 1, 2013 % Change
Sacramento 3,073 989 -67.8%
Placer 943 472 -49.9%
El Dorado 680 428 -37%
Yolo 336 132 -63.7%

July - December, 2012
www.WrightRealEstate.us Page 17 (916) 726-8308
Wright Report
Inventory continues to remain extremely low, especially distressed
inventory which has declined substantially during the year.
Affordability, on the other hand, is still very high with the affordability
index in Q4-2012 for Sacramento County dropped slightly to 71% (23
points higher than the state). In California affordability dropped 7
percentage points to 48% from Q4-11 to Q4-12, meaning that 48% of
workers can afford the median priced home within the state.
Economists believe that housing will be a primary driver in the 2013
economy and is expected to contribute more than one million jobs to
U.S. employment this year.
Growth in housing construction also raises the manufacturing
industries that support housing, as well as real estate sales, lending,
insurance and other industries directly related to housing. The rest of
the economy will also experience the ripple effect.
http://www.doctorhousingbubble.com/all-cash-real-estate-buying-trend-all-cash-
buying-record-2012-2013-cash-trend/
July - December, 2012
www.WrightRealEstate.us Page 18 (916) 726-8308
Wright Report
Across America there were approximately 367,000 new homes sold in
2012, up 20% from 2011’s all time historical low of 305,000 sales.
New homes also accounted for 8% of all home sales in 2012. 2013 is
expected to rise as much as 23% as sales, starts, prices, permits and
builder confidence all increase with demand.
The boons to new construction are historically low interest rates,
housing affordability and rising household formation. The detractors
are tight lending conditions, inaccurate appraisals, rising material costs
and lack of buildable lots.
Growth will initially be constricted by government fees which have not
reduced much since they rose with the last building cycle. Lack of
redevelopment funds will also postpone building in Sacramento’s
downtown region. Another issue that will arise with increased demand
is the availability of buildable lots.
THE ECONOMY:
U.S. economists predict a continued recovery in 2013 and expect
housing to lead the economic turnaround. Unemployment is expected
to go down, home purchases up, and interest rates to stay the same.
The economy is expected to see a 2.2 – 2.4% increase in 2013, and
the housing market is expected to be an overall contributor. U.S.
growth in 2012 was 2.2% so 2013 will be another recovery year.
The Fed funds rate is expected to remain low, not only for the housing
mortgage market, but to stimulate business borrowing and loans, and
generate internal growth within the economy. Another benefit of
keeping rates low is the U.S. will be to reduce the payment amount on
Federal debt being sold annually to cover the deficit.

July - December, 2012
www.WrightRealEstate.us Page 19 (916) 726-8308
Wright Report
All indicators are that the housing market is recovering and December
showed signs of growth in 201 metro areas across the nation. Prices
are rising and the number of home owners under water is decreasing.
Despite this positivity there are certain difficulties ahead. Major
concerns include the “Fiscal Cliff”, Federal spending cuts, renewed
talks on the debt ceiling, E.U. debt crisis, increased government
regulation, and continued high unemployment all still need to be
resolved.
One major issue for the future is the increasing federal debt. Even
with massive proposed spending cuts the U.S. annual spending still far
exceeds income, and the balance must be made up by selling bonds-
debt obligations. The current short term solution is QE3 (Quantitative
Easing 3) where the Federal Reserve simply buys up all the excess
bonds no one else is willing to purchase with an open checkbook and
unlimited (literally) amount of funds.
Up to January 2013 the Fed has purchased $3,000,000,000,000 (3
Trillion) dollars in U.S. bonds and continues to purchase at the rate of
$85,000,000,000 (85 Billion) dollars per month. That is spending the
U.S. government is doing monthly not covered by taxes or other
buyers of debt. The current government deficit (as of this writing) is
estimated to be around $16,400,000,000,000 (16.4 Trillion) dollars;
and we thought California had a big problem with a $12 Billion deficit.
On a happier note the “Debt Relief Act” was extended to the end of
2013, but it is not likely to be renewed beyond this year because the
real estate market is in a recovery cycle. This act says that the IRS
will not count (it forgives) the amount a seller could have been forced
to show as income as a result of a lender losing money on a short sale.
When a lender loses money at sale they send the borrower a 1099 and
it shows on the borrower’s taxes as a gain in income for the year. The
Act also restored the tax deduction for Mortgage Insurance Premiums
which will directly benefit owners with FHA loans.

July - December, 2012
www.WrightRealEstate.us Page 20 (916) 726-8308
Wright Report
BANKING & LENDING:
The big news in banking is the 11.6 Billion dollar settlement Bank of
America made with Fannie Mae for restitution for the bad loans sold
since 2004. The settlement allows for 1.3 Billion as compensation to
reimburse for servicing issues and 10.3 Billion for repurchases of
defaulted loans and to cover losses from unpaid interest that accrued
on delinquent loans over that time.
It is estimated that the five largest lenders (Wells Fargo, Bank of
America, Citibank, Chase, and Ally financial Inc.) have lost upwards of
84 Billion dollars since 2007 in foreclosures, legal costs and loan
buybacks. Bank of America has paid the lion’s share – 50 Billion –
largely due to its purchase of Countrywide and their toxic loan
portfolio.
Here is the 2012 income for the 4 largest banks in the U.S. Some
doing well, others not so well.
BANK Bank Income for 2012
Quarter 4 Annual
Wells Fargo 5.1 B 18.9 B
Chase 5.7 B 24.4 B
Bank of America .732 B 4.2 B
Citibank 1.2 B 7.5 B
2012 saw a historic high in lending activity with 8.6 million loans
originated. That is a 34% increase over 2011. Much of this is due to
historically low rates, a recovering real estate market, and the
government raising the limits on the HARP refinance program allowing
borrowers to refinance even if they owe more than 125% of the value
of their home. This allows underwater borrowers to refinance their
home at current low rates.
July - December, 2012
www.WrightRealEstate.us Page 21 (916) 726-8308
Wright Report
http://www.doctorhousingbubble.com/negative-equity-home-owners-2013-negative-equity-
california-reo/
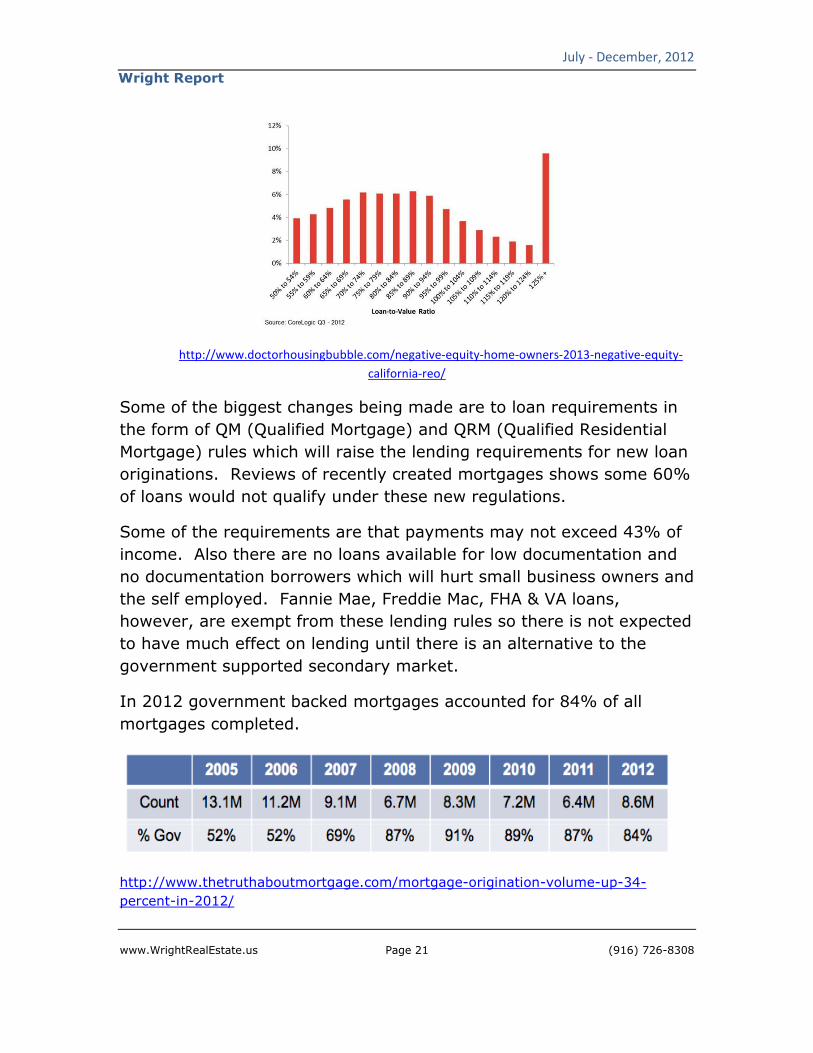
Some of the biggest changes being made are to loan requirements in
the form of QM (Qualified Mortgage) and QRM (Qualified Residential
Mortgage) rules which will raise the lending requirements for new loan
originations. Reviews of recently created mortgages shows some 60%
of loans would not qualify under these new regulations.
Some of the requirements are that payments may not exceed 43% of
income. Also there are no loans available for low documentation and
no documentation borrowers which will hurt small business owners and
the self employed. Fannie Mae, Freddie Mac, FHA & VA loans,
however, are exempt from these lending rules so there is not expected
to have much effect on lending until there is an alternative to the
government supported secondary market.
In 2012 government backed mortgages accounted for 84% of all
mortgages completed.
http://www.thetruthaboutmortgage.com/mortgage-origination-volume-up-34-
percent-in-2012/
July - December, 2012
www.WrightRealEstate.us Page 22 (916) 726-8308
Wright Report
FHA is still struggling with a 9.6% delinquency rate (over 730,000 of
its more than 7,000,000 loans) and because their reserves are far
below the mandated 2% they are raising rates on the required PMI
(Private Mortgage Insurance) on April 1, this year. They are also
keeping the PMI on all new FHA loans for the life of the loan rather
than knocking it off after the loan drops below 80% of the value of
home.
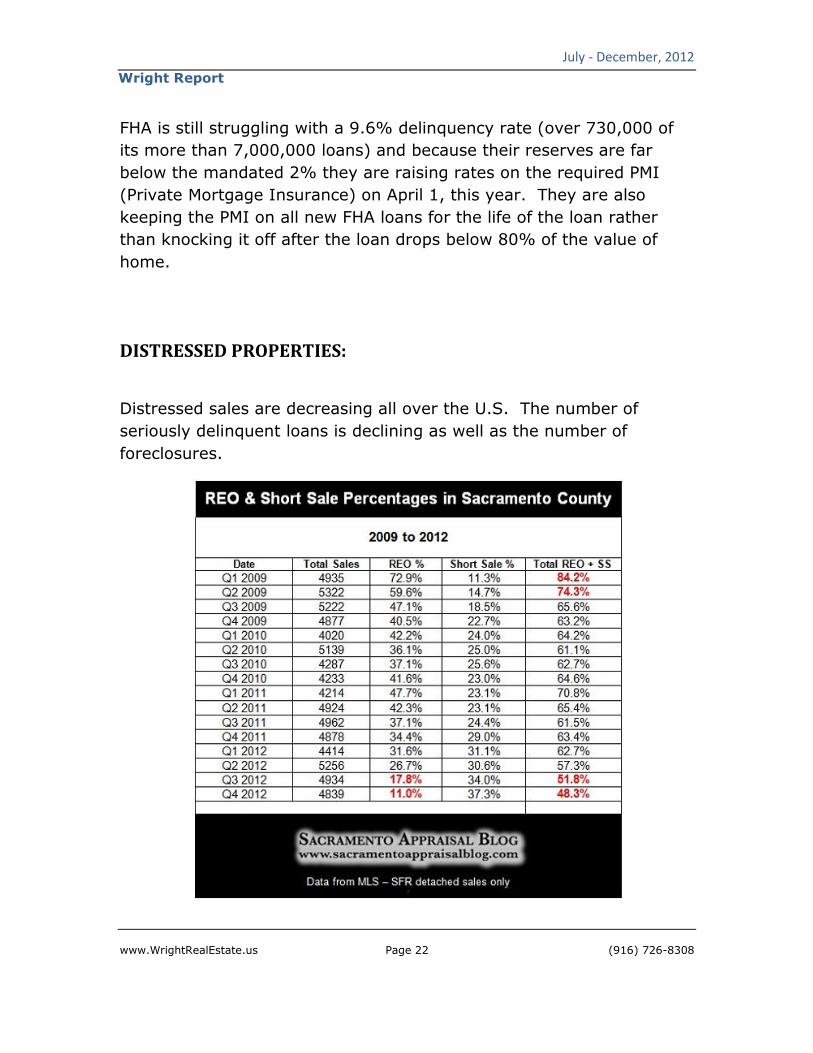
DISTRESSED PROPERTIES:
Distressed sales are decreasing all over the U.S. The number of
seriously delinquent loans is declining as well as the number of
foreclosures.
July - December, 2012
www.WrightRealEstate.us Page 23 (916) 726-8308
Wright Report
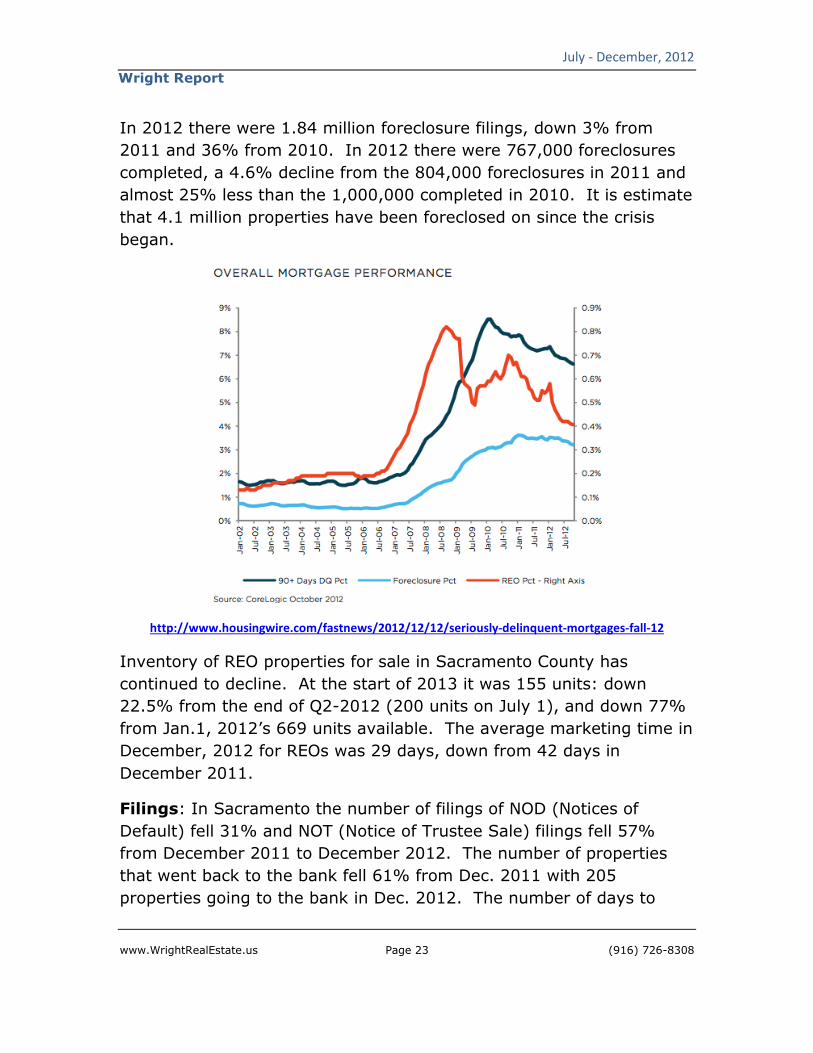
In 2012 there were 1.84 million foreclosure filings, down 3% from
2011 and 36% from 2010. In 2012 there were 767,000 foreclosures
completed, a 4.6% decline from the 804,000 foreclosures in 2011 and
almost 25% less than the 1,000,000 completed in 2010. It is estimate
that 4.1 million properties have been foreclosed on since the crisis
began.
http://www.housingwire.com/fastnews/2012/12/12/seriously-delinquent-mortgages-fall-12
Inventory of REO properties for sale in Sacramento County has
continued to decline. At the start of 2013 it was 155 units: down
22.5% from the end of Q2-2012 (200 units on July 1), and down 77%
from Jan.1, 2012’s 669 units available. The average marketing time in
December, 2012 for REOs was 29 days, down from 42 days in
December 2011.
Filings: In Sacramento the number of filings of NOD (Notices of
Default) fell 31% and NOT (Notice of Trustee Sale) filings fell 57%
from December 2011 to December 2012. The number of properties
that went back to the bank fell 61% from Dec. 2011 with 205
properties going to the bank in Dec. 2012. The number of days to

July - December, 2012
www.WrightRealEstate.us Page 24 (916) 726-8308
Wright Report
foreclosure in Sacramento County dropped 20% to 252 days and the
number of days it took for the banks to sell increased to 247 days on
average.
California NOD filings fell 33% and NOT filings fell 52% from December
to December. The number of properties that went back to the bank
fell 56% during the same period to 3,544 in Dec. 2012.
Inventory: Pre-foreclosure inventory (NOD - Notice of Default) in
Sacramento County went down 38% from 5,359 in Dec. 2011 to 3,340
in Dec. 2012. NOT (Notice of Trustee Sale) inventory went down 33%
for the same period to 2,702 units, and the number of bank owned
inventory (REOs) is down 41% to 2,731 units (Dec. 12), from 4,665
units in December 2011.
California inventory of NODs is also down 35% to 59,208 (Dec. 2012)
from 91,000 (Dec. 2011). NOT inventory is down 29% year over year
to 59,987 units, and the number of bank owned inventory (REOs) is
down 36.4% to 59,781 in Dec. units from 94,000 units in December
2011.
http://www.thetruthaboutmortgage.com/mortgage-origination-
volume-up-34-percent-in-2012/

July - December, 2012
www.WrightRealEstate.us Page 25 (916) 726-8308
Wright Report
COUNTY STATISTICS:
Sacramento County
The year started (January 1, 2012) with 3,073 listings and ended with
989 listing on the market on Jan. 1, 2013. That is a drop of 68% for
the year. REO (foreclosure) inventory is down 77% since Jan. 1, 2012
and Active Short Sales are down 88% over the same period.
Conventional sales inventory is down 44% over the same period.
July - December, 2012
www.WrightRealEstate.us Page 26 (916) 726-8308
Wright Report
Pending: pending sales are down 20.5% from Jan. 1, 2012 to Jan. 1,
2013: from 2,113 to 1,680 homes. Pending foreclosure sales are
down 60.5% and pending short sales are down 46% for the same
period. Pending conventional sales are up 46% to 1,019 pending
homes.
AVERAGE SOLD PRICE by SELLER TYPE Dec. - 2012 Dec. - 2011
Total Sold 1,490 $224752 1,675 $186,329
REO 159 $181,443 567 $144,141
Conventional 725 $260,410 616 $223,053
Short Sale 606 $193,456 492 $188,969
Sold: sales numbers for SFR (Single Family Residence) for December
2012 were 1,490 units sold in Sacramento County. Foreclosures
accounted for 14% of properties on the market in December, and 11%
of sales. Short sales accounted for 13% of all Active inventory, and
41% of sales. Conventional sales accounted for the rest (73%) of
Active inventory and 49% of sales. That is up from 37% of sales in
December of 2011.
Placer County
The year started (January 1, 2012) with 943 listings and ended with
472 homes for sale on Jan. 1, 2013. That is a drop of 50%. REO
(foreclosure) inventory is down 73.5% since Jan. 1, 2012 and Active
Short Sales are down 87% over the same period. Conventional sales
inventory is down 26% over the same period.

July - December, 2012
www.WrightRealEstate.us Page 27 (916) 726-8308
Wright Report
Pending: pending sales are down just 10% from Jan. 1, 2012 to Jan.
1, 2013: from 503 to 454 homes. Pending foreclosure sales are down
56% and pending short sales are down 56% for the same period.
Pending conventional sales are up 90% to 302 pending homes.
AVERAGE SOLD
PRICE by SELLER TYPE Dec. - 2012 Dec. - 2011
Total Sold 459 $338,571 425 $298,550
REO 57 $241,008 74 $251,205
Conventional 245 $389,187 202 $341,600
Short Sale 157 $295,004 149 $263,700
Sold: sales numbers for SFR (Single Family Residence) for December
2012 were 459 units sold. Foreclosures accounted for 8% of
properties on the market in December, and 12% of sales. Short sales
accounted for 8% of all Active inventory, and 34% of sales.
Conventional sales accounted for the rest (84%) of Active inventory
and 53% of sales. That is up from 17.4% of sales in December of
2011.

July - December, 2012
www.WrightRealEstate.us Page 28 (916) 726-8308
Wright Report
El Dorado County
The year started (January 1, 2012) with 680 listings and ended with
428 homes for sale on Jan. 1, 2013. That is a drop of 37%. REO
(foreclosure) inventory is down 61% since Jan. 1, 2012 and Active
Short Sales are down 78% over the same period. Conventional sales
inventory is down 16% over the same period.
Pending: pending sales are down 21% from Jan. 1, 2012 to Jan. 1,
2013: from 259 to 204 homes. Pending foreclosure sales are down
60.4% and pending short sales are down 55.4% for the same period.
Pending conventional sales are up 45% to 135 pending homes.
AVERAGE SOLD PRICE
by SELLER TYPE Dec. - 2012 Dec. - 2011
Total Sold 186 $336,308 226 $306,305
REO 25 $229,199 62 $187,530
Conventional 114 $366,419 93 $353,511
Short Sale 47 $320,244 71 $348,190
Sold: sales numbers for SFR (Single Family Residence) for December
2012 were 186 units sold. Foreclosures accounted for 12.3% of
properties on the market in December, and 13.4% of sales. Short
sales accounted for 10.3% of all Active inventory, and 25% of sales.
Conventional sales accounted for the rest (84%) of Active inventory
and 61.3% of sales. That is up from 41% of sales in December of
2011.

July - December, 2012
www.WrightRealEstate.us Page 29 (916) 726-8308
Wright Report
Yolo County
The year started (January 1, 2012) with 336 listings and ended with
132 homes for sale on Jan. 1, 2013. That is a drop of 61%. REO
(foreclosure) inventory is down 82% since Jan. 1, 2012 and Active
Short Sales are down 76.5% over the same period. Conventional
sales inventory is down 45% over the same period.
Pending: pending sales are down just 6% from Jan. 1, 2012 to Jan.
1, 2013: from 157 to 148 homes. Pending foreclosure sales are down
56% and pending short sales are down 35% for the same period.
Pending conventional sales are up 78% to 91 pending homes.
AVERAGE SOLD PRICE
by SELLER TYPE Dec. - 2012 Dec. - 2011
Total Sold 118 $312,310 145 $268,652
REO 13 $255,931 47 $185,676
Conventional 66 $343,451 52 $373,858
Short Sale 39 $278,403 46 $234,503
Sold: sales numbers for SFR (Single Family Residence) for December
2012 were 118 units sold. Foreclosures accounted for 11% of
properties on the market in December, and 14% of sales. Short sales
accounted for 10% of all Active inventory, and 25% of sales.
Conventional sales accounted for the rest (79%) of Active inventory
and 56% of sales. That is up from 35% of sales in December of 2011.

July - December, 2012
www.WrightRealEstate.us Page 30 (916) 726-8308
Wright Report
San Joaquin County
The year started (January 1, 2012) with 636 listings for sale on Jan. 1,
2013. REOs (foreclosure) are 17% of available inventory on Jan. 1,
2013 and Active Short Sales are 17.5% of active listings.
Conventional sales inventory is 65.5% of total.
Pending: pending sales are 844 units at the end of the year on Jan. 1,
2013. Pending foreclosure sales are 24% of pending properties.
Pending short sales are 24%, and pending conventional sales are up
52% of pending homes.
AVERAGE SOLD PRICE by SELLER TYPE Dec. - 2012
Total Sold 725 $204,235
REO 135 $161,250
Conventional 339 $224,778
Short Sale 251 $199,610
Sold: sales numbers for SFR (Single Family Residence) for December
2012 were 459 units sold. Foreclosures accounted for 18.6% of all
sold properties. Short sales accounted for 35% of all sales.
Conventional sales accounted for the rest 46.8%.

July - December, 2012
www.WrightRealEstate.us Page 31 (916) 726-8308
Wright Report
HISTORICAL PRICE GRAPHS:

July - December, 2012
www.WrightRealEstate.us Page 32 (916) 726-8308
Wright Report
PLACER COUNTY:
July - December, 2012
www.WrightRealEstate.us Page 33 (916) 726-8308
Wright Report

July - December, 2012
www.WrightRealEstate.us Page 34 (916) 726-8308
Wright Report
SACRAMENTO COUNTY:
July - December, 2012
www.WrightRealEstate.us Page 35 (916) 726-8308
Wright Report

July - December, 2012
www.WrightRealEstate.us Page 36 (916) 726-8308
Wright Report
July - December, 2012
www.WrightRealEstate.us Page 37 (916) 726-8308
Wright Report
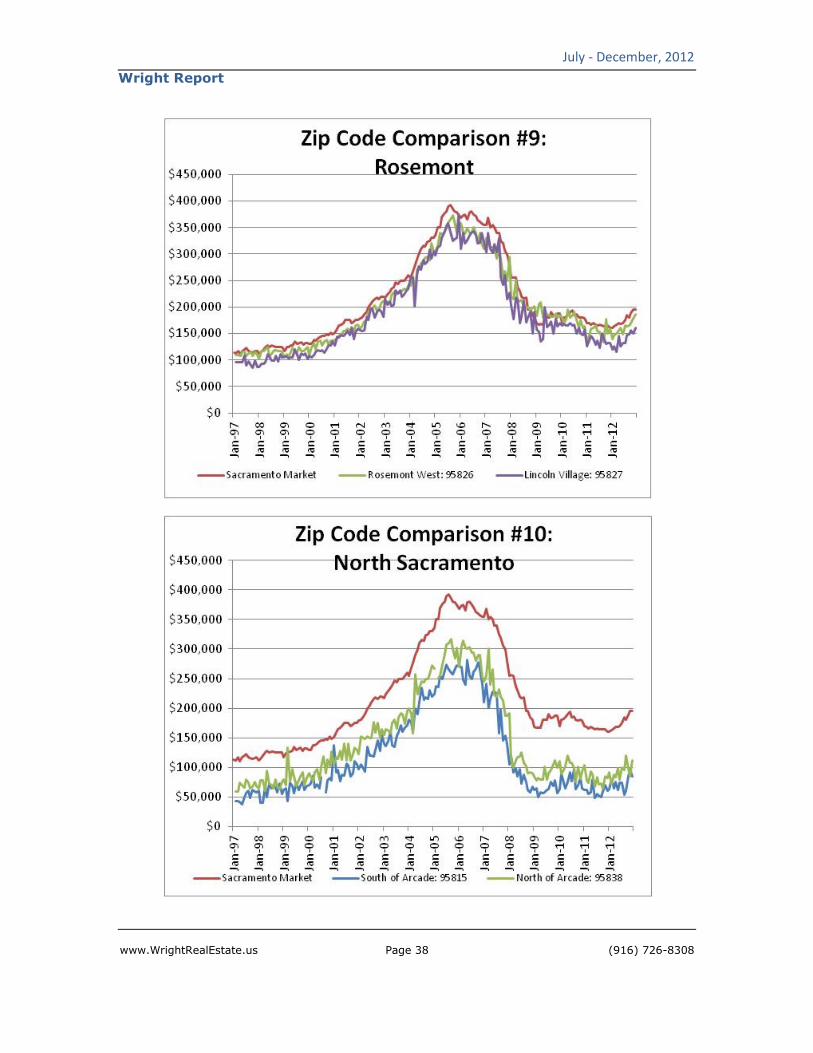
July - December, 2012
www.WrightRealEstate.us Page 38 (916) 726-8308
Wright Report
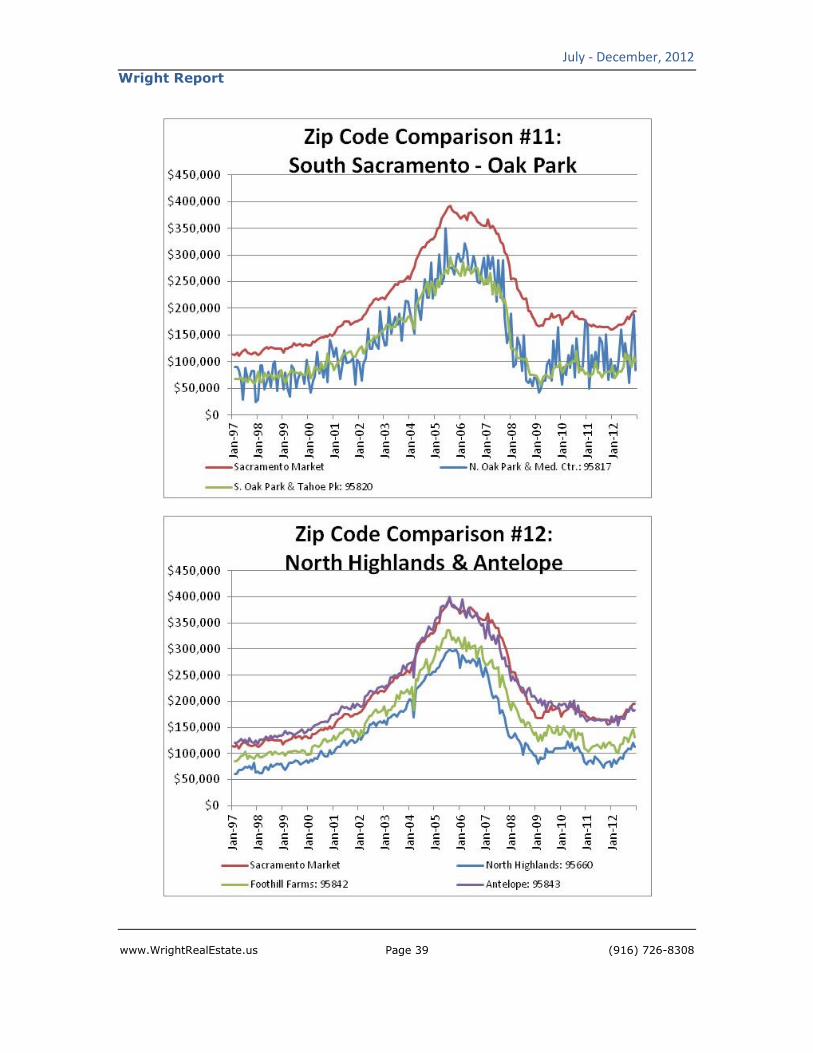
July - December, 2012
www.WrightRealEstate.us Page 39 (916) 726-8308
Wright Report

July - December, 2012
www.WrightRealEstate.us Page 40 (916) 726-8308
Wright Report

July - December, 2012
www.WrightRealEstate.us Page 41 (916) 726-8308
Wright Report

July - December, 2012
www.WrightRealEstate.us Page 42 (916) 726-8308
Wright Report
RESOURCES:
ABREVIATIONS
CAR = California Association of Realtors
HAFA = Home Affordable Foreclosure Alternative
HAMP = Home Affordable Mortgage Program
MLS = Multiple Listing Service
NAR = National Association of Realtors
NOD = Notice of Default
NOT = Notice of Trustee Sale
REO = Real Estate Owned by a bank, or foreclosure
SAR = Sacramento Association of Realtors
WRE = Wright Real Estate
ADDITIONAL RESOURCES
MetrolistMLS.com - to search for properties. www.metrolistmls.com
NorthState Building Industry Association (BIA) www.northstatebia.org
Rental Housing Association (RHA) www.rha.org
Sacramento Association of Realtors (SAR) www.sacrealtor.org

July - December, 2012
www.WrightRealEstate.us Page 43 (916) 726-8308
Wright Report
Serving Sacramento since 2000.
Check out our BLOG and additional STATISTICS on the web at:
www.WrightRealEstate.US
For FREE Information and Consulting Services contact us:
Office: 916.726.8308 [email protected]