worldwide infrastructure security report · pdf filemobile network operators ... attack...
TRANSCRIPT

WORLDWIDE INFRASTRUCTURE SECURITY REPORT
A R B O R N E T W O R K S S P E C I A L R E P O R TV O L U M E X I I

Arbor Networks Special Report
3
Arbor Networks, the security division of NETSCOUT, is driven to protect the infrastructure and ecosystem of the internet. It is the principle upon which we were founded in 2000; and remains the common thread that runs through all that we do today. Arbor’s approach is rooted in the study of network traffic. Arbor’s suite of visibility, DDoS protection and advanced threat solutions provide customers with a micro view of their network enhanced by a macro view of global internet traffic and emerging threats through our ATLAS infrastructure. Sourced from more than 300 service provider customers, ATLAS delivers intelligence based on insight into approximately 1/3 of global internet traffic. Supported by Arbor’s Security Engineering & Response Team (ASERT), smart workflows and rich user context, Arbor’s network insights help customers see, understand and solve the most complex and consequential security challenges facing their organizations. To learn more, please visit arbornetworks.com
About Arbor Networks
—

1
Worldwide Infrastructure Security Report
Introduction 6
Survey Methodology 7
Demographics of Survey Respondents 8Figure 1
Respondent Classification . . . . . . . . . . . . . . . . . . . . . . 8
Figure 2
Service Provider Type . . . . . . . . . . . . . . . . . . . . . . . . 8
Figure 3
Enterprise Verticals . . . . . . . . . . . . . . . . . . . . . . . . . 8
Figure 4
Respondent’s Role in the Organization . . . . . . . . . . . . . . 9
Figure 5
Respondent’s Geographic Information . . . . . . . . . . . . . . 9
Key Findings 10
Service Providers 10
SP Operational Threats . . . . . . . . . . . . . . . . . . . . . . 10
SP DDoS Attacks . . . . . . . . . . . . . . . . . . . . . . . . . . 10
Data Center Operators . . . . . . . . . . . . . . . . . . . . . . 12
Mobile Network Operators . . . . . . . . . . . . . . . . . . . . 12
SP IPv6 . . . . . . . . . . . . . . . . . . . . . . . . . . . . . . . . 12
SP SDN/NFV . . . . . . . . . . . . . . . . . . . . . . . . . . . . . 13
SP Organizational Security . . . . . . . . . . . . . . . . . . . . 13
Enterprise, Government 14 and Education (EGE)
EGE Network Security . . . . . . . . . . . . . . . . . . . . . . . 14
EGE DDoS Attacks . . . . . . . . . . . . . . . . . . . . . . . . . 14
EGE IPv6 . . . . . . . . . . . . . . . . . . . . . . . . . . . . . . . 15
EGE SDN/NFV . . . . . . . . . . . . . . . . . . . . . . . . . . . . 16
EGE Organizational Security . . . . . . . . . . . . . . . . . . . 16
DNS Operators 17
Service Provider 18
Operational Threats 18Figure 6
Service Provider Experienced Threats and Concerns . . . . . 19
Figure 7
Threat Detection Tools and Threat Tool Effectiveness . . . . . 20
Scale and Targeting 21Figure 8
Peak Attack Size . . . . . . . . . . . . . . . . . . . . . . . . . . 22
Figure 9
Attack Target Mix . . . . . . . . . . . . . . . . . . . . . . . . . . 23
Figure 10
Attack Target Customer Verticals . . . . . . . . . . . . . . . . . 23
Figure 11
Attacks Targeting Cloud Services . . . . . . . . . . . . . . . . . 24
1
CON TENTS
Worldwide Infrastructure Security Report

Arbor Networks Special Report
2
ATLAS Special Report 25
Attack Sizes 25Figure AT1
ATLAS Peak Monitored Attack Size (Gbps), 2015 vs . 2016 . . 25
Figure AT2
Growth in Large Attacks Year Over Year . . . . . . . . . . . . 26
Figure AT3
Attack Size Breakout . . . . . . . . . . . . . . . . . . . . . . . . 26
Figure AT4
Average Attack Size (Mbps), 2015–2016 . . . . . . . . . . . . . 26
Figure AT5
Average Attack Frequency, 2015–2016 . . . . . . . . . . . . . 27
Figure AT6
Attack Percentiles Over Time (Mbps), 2016 . . . . . . . . . . . 28
Attack Durations 28Figure AT7
Attack Duration Breakout . . . . . . . . . . . . . . . . . . . . . 28
Target Countries 29Figure AT8
Top Targeted Countries for DDoS Attacks by Percentage . . . 29
Figure AT9
Top Targeted Countries for DDoS Attacks Greater Than 10 Gbps by Percentage . . . . . . . . . . . . . . . . . . . 29
Reflections 30Figure AT10
ATLAS Reflection/Amplification Attacks, Count Per Week . . . 30
Figure AT11
ATLAS Reflection/Amplification Attacks (Percentage), 2016 So Far . . . . . . . . . . . . . . . . . . . . . . . . . . . . . 30
Figure AT12
ATLAS Reflection/Amplification Attacks, Average Attack Size (Mbps) . . . . . . . . . . . . . . . . . . . . . . . . . . . . . 31
Figure AT13
ATLAS Reflection/Amplification Attacks, Average Size Trend . 31
Figure AT14
ATLAS Reflection/Amplification Attacks, Peak Sizes (Gbps) . . 32
Figure AT15
ATLAS Reflection/Amplification Attacks, Peak Size Trends (Gbps) . . . . . . . . . . . . . . . . . . . . . . . . . . . . 32
Type, Frequency and 33 Motivation of DDoS AttacksFigure 12
DDoS Attack Types . . . . . . . . . . . . . . . . . . . . . . . . . 34
Figure 13
Protocols Used for Reflection/Amplification . . . . . . . . . . 35
Figure 14
Multi-Vector DDoS Attacks . . . . . . . . . . . . . . . . . . . . 35
Figure 15
Targets of Application-Layer Attacks . . . . . . . . . . . . . . . 36
Figure 16
Types of Attacks Targeting Encrypted Services . . . . . . . . . 36
Figure 17
Attack Frequency Per Month . . . . . . . . . . . . . . . . . . . 37
Figure 18
Longest Attack Duration (Past 12 Months) . . . . . . . . . . . 37
Figure 19
DDoS Attack Motivations . . . . . . . . . . . . . . . . . . . . . 38
Figure 20
IPv6 DDoS Attacks . . . . . . . . . . . . . . . . . . . . . . . . . 39
DDoS Threat Mitigation 40Figure 21
Attack Mitigation Techniques . . . . . . . . . . . . . . . . . . . 41
Figure 22
Time to Mitigate . . . . . . . . . . . . . . . . . . . . . . . . . . 42
Figure 23
Outbound/Cross-Bound Attack Detection . . . . . . . . . . . 42
Figure 24
Demand for DDoS Detection/Mitigation Services . . . . . . . 42
Figure 25
Business Verticals for DDoS Services . . . . . . . . . . . . . . 43
Data Center Operators 44Figure 26
Data Center Visibility . . . . . . . . . . . . . . . . . . . . . . . . 45
Figure 27
Data Center Traffic Visibility . . . . . . . . . . . . . . . . . . . . 45
Figure 28
Data Center Perimeter Security Technologies . . . . . . . . . 45
Figure 29
Data Center DDoS Attack Frequency . . . . . . . . . . . . . . 46
Arbor Networks Special Report
2

3
Worldwide Infrastructure Security Report
Figure 30
Data Center Service Impacting DDoS Attacks . . . . . . . . . . 46
Figure 31
Data Center DDoS Business Impact . . . . . . . . . . . . . . . 46
Figure 32
Data Center DDoS Cost . . . . . . . . . . . . . . . . . . . . . . 47
Figure 33
Data Center DDoS Targets . . . . . . . . . . . . . . . . . . . . 47
Figure 34
Data Center DDoS Protection Technologies . . . . . . . . . . 48
Mobile Network Operators 49Figure 35
Mobile Subscribers . . . . . . . . . . . . . . . . . . . . . . . . 50
Figure 36
Compromised Subscribers . . . . . . . . . . . . . . . . . . . . 50
Figure 37
DDoS Attacks Per Month Targeting Mobile Infrastructure/Users . . . . . . . . . . . . . . . . . . . 50
Figure 38
Visibility at IP (Gi/SGi) Backbone . . . . . . . . . . . . . . . . . 51
Figure 39
DDoS Attacks Per Month Targeting (Gi/SGi) IP Infrastructure . . . . . . . . . . . . . . . . . . . . . 51
IPv6 52Figure 40
Business Customer IPv6 Service Usage . . . . . . . . . . . . . 52
Figure 41
Subscriber IPv6 Usage . . . . . . . . . . . . . . . . . . . . . . . 52
Figure 42
IPv6 Flow Telemetry . . . . . . . . . . . . . . . . . . . . . . . . 53
Figure 43
Anticipated IPv6 Traffic Growth . . . . . . . . . . . . . . . . . . 53
Figure 44
IPv6 Security Concerns . . . . . . . . . . . . . . . . . . . . . . 54
Figure 45
IPv6 Mitigation Capabilities . . . . . . . . . . . . . . . . . . . . 54
SDN/NFV 55Figure 46
SDN/NFV Deployment . . . . . . . . . . . . . . . . . . . . . . . 55
Figure 47
SDN/NFV Key Barriers . . . . . . . . . . . . . . . . . . . . . . . 56
Figure 48
SDN/NFV Network Domains . . . . . . . . . . . . . . . . . . . 56
Figure 49
NFV Technologies . . . . . . . . . . . . . . . . . . . . . . . . . 57
Figure 50
SDN Technologies . . . . . . . . . . . . . . . . . . . . . . . . . 57
Figure 51
Service Function Chaining . . . . . . . . . . . . . . . . . . . . . 57
Organizational Security 58Figure 52
Dedicated Security Personnel . . . . . . . . . . . . . . . . . . 59
Figure 53
Security Best Practices . . . . . . . . . . . . . . . . . . . . . . 59
Figure 54
DDoS Simulations . . . . . . . . . . . . . . . . . . . . . . . . . 60
Figure 55
OPSEC Team Challenges . . . . . . . . . . . . . . . . . . . . . 60
ASERT Special Report 61
Year of the IoT Botnet 61
What is the IoT? . . . . . . . . . . . . . . . . . . . . . . . . . . 62
IoT Security . . . . . . . . . . . . . . . . . . . . . . . . . . . . . 63
The Rise of the IoT Botnet . . . . . . . . . . . . . . . . . . . . 64
Mitigation . . . . . . . . . . . . . . . . . . . . . . . . . . . . . . 67
Conclusion . . . . . . . . . . . . . . . . . . . . . . . . . . . . . 68
3
Worldwide Infrastructure Security Report

Arbor Networks Special Report
4
ATLAS Special Report 69
IoT Botnet Tracking 69
Infrastructure . . . . . . . . . . . . . . . . . . . . . . . . . . . . 69
Figure AT16
Login Attempts Per Hour . . . . . . . . . . . . . . . . . . . . . 70
Overall Activity . . . . . . . . . . . . . . . . . . . . . . . . . . . 70
Figure AT17
Unique IP’s Per Hour . . . . . . . . . . . . . . . . . . . . . . . 70
Regional Focus . . . . . . . . . . . . . . . . . . . . . . . . . . . 71
Figure AT18
Average Time Between Login Attempts (in Seconds) . . . . . 71
Figure AT19
Average Login Attempts Per Hour Per Region . . . . . . . . . 71
Origins of Compromise Activity . . . . . . . . . . . . . . . . . . 72
Figure AT20
Login Origin Map . . . . . . . . . . . . . . . . . . . . . . . . . 72
Enterprise, Government and Education (EGE) 73
Network Security 73Figure 56
EGE Threats . . . . . . . . . . . . . . . . . . . . . . . . . . . . . 74
Figure 57
EGE Concerns . . . . . . . . . . . . . . . . . . . . . . . . . . . 74
Figure 58
Threat Detection . . . . . . . . . . . . . . . . . . . . . . . . . . 74
DDoS Attacks 75Figure 59
DDoS Attack Frequency Per Month . . . . . . . . . . . . . . . 76
Figure 60
Targets of DDoS Attacks . . . . . . . . . . . . . . . . . . . . . . 76
Figure 61
DDoS Attack Duration . . . . . . . . . . . . . . . . . . . . . . . 77
Figure 62
Attack Category Breakout . . . . . . . . . . . . . . . . . . . . . 77
Figure 63
Targets of Application-Layer Attacks . . . . . . . . . . . . . . . 78
Figure 64
Encrypted Application-Layer Attacks . . . . . . . . . . . . . . . 78
Figure 65
Multi-Vector Attacks . . . . . . . . . . . . . . . . . . . . . . . . 79
Figure 66
DDoS Attack Motivations . . . . . . . . . . . . . . . . . . . . . 79
Figure 67
DDoS Mitigation Techniques . . . . . . . . . . . . . . . . . . . 80
Figure 68
Most Effective DDoS Mitigation Techniques . . . . . . . . . . 81
Figure 69
DDoS Attack Mitigation Time . . . . . . . . . . . . . . . . . . . 81
Figure 70
Business Impacts of DDoS Attacks . . . . . . . . . . . . . . . . 82
Figure 71
Cost of Internet Downtime . . . . . . . . . . . . . . . . . . . . 82
Figure 72
Cost of DDoS Attacks . . . . . . . . . . . . . . . . . . . . . . . 83
Figure 73
DDoS Risk Analysis . . . . . . . . . . . . . . . . . . . . . . . . . 83
IPv6 84Figure 74
IPv6 Service Availability . . . . . . . . . . . . . . . . . . . . . . 84
Figure 75
Internal IPv6 Deployment . . . . . . . . . . . . . . . . . . . . . 85
Figure 76
IPv6 Flow Telemetry . . . . . . . . . . . . . . . . . . . . . . . . 85
Figure 77
IPv6 Security Concerns . . . . . . . . . . . . . . . . . . . . . . 86
Figure 78
IPv6 Impact on IPv4 Services (Dual-Stack Devices) . . . . . . . 86
Arbor Networks Special Report
4
5
Worldwide Infrastructure Security Report
SDN/NFV 87Figure 79
EGE SDN/NFV Deployment . . . . . . . . . . . . . . . . . . . . 87
Figure 80
EGE SDN/NFV Key Barriers . . . . . . . . . . . . . . . . . . . . 87
Figure 81
EGE SDN/NFV Network Domains . . . . . . . . . . . . . . . . . 88
Figure 82
EGE NFV Technologies . . . . . . . . . . . . . . . . . . . . . . . 88
Figure 83
EGE SDN Functions . . . . . . . . . . . . . . . . . . . . . . . . 89
Figure 84
EGE SDN Technologies . . . . . . . . . . . . . . . . . . . . . . 89
Figure 85
EGE Service Function Chaining . . . . . . . . . . . . . . . . . . 89
Organizational Security 90Figure 86
EGE Dedicated Security Personnel . . . . . . . . . . . . . . . . 91
Figure 87
EGE Security Operations Center . . . . . . . . . . . . . . . . . 91
Figure 88
EGE OPSEC Team Challenges . . . . . . . . . . . . . . . . . . . 91
Figure 89
EGE Security Best Practices . . . . . . . . . . . . . . . . . . . . 92
Figure 90
EGE DDoS Simulations . . . . . . . . . . . . . . . . . . . . . . 92
DNS Operators 93
Figure 91
DNS Security Responsibility . . . . . . . . . . . . . . . . . . . . 94
Figure 92
DNS Visibility . . . . . . . . . . . . . . . . . . . . . . . . . . . . 94
Figure 92
DNS Service-Affecting DDoS Attack . . . . . . . . . . . . . . . 95
Figure 92
Service Provider DNS Security Measures . . . . . . . . . . . . 95
Figure 92
Enterprise DNS Security Measures . . . . . . . . . . . . . . . 96
Conclusion 97
About the Authors 99
Glossary 100
5
Worldwide Infrastructure Security Report

Arbor Networks Special Report
6
INTRODUCTIONelcome to our 12th annual Worldwide Infrastructure Security Report (WISR).
The data within this document is based on the collective experiences, observations and concerns of the global operational security community. Arbor Networks has collected this data through a survey conducted in October 2016.
For the past 12 years, Arbor has produced the WISR — collecting detailed information on the threats facing network operators, collating this data and then presenting it as a free-to-access repository of information.
Since its inception, the WISR has been based upon survey data collected from those who are directly involved in day-to-day operational security, and this is our continued approach. The WISR has changed immeasurably in terms of its scope and scale over 12 years, but the core goal is still to provide real insight into infrastructure security from an operational perspective.
W
This document is intended to
highlight the key trends in the
threats facing organizations
today and the ways in which
these organizations are
mitigating those threats.

7
Worldwide Infrastructure Security Report
INTRODUCTION—The 2016 Worldwide Infrastructure Security Report (WISR) is based on a survey comprised of 133 free-form and multiple choice questions. This is a significant decrease from 172 last year.
Beyond the reduction in the number of questions, this year’s survey has specific logic flows that enable service providers and enterprise/government/education respondents to see a different set of questions depending upon their self-classification. The questions we ask diverge depending upon the nature of the respondent. We are again addressing feedback from previous year’s respondents to reduce the number of questions asked.
As in previous years, we have modified the survey questions to reflect changes in the threat landscape and to address responses from last year’s survey. The current survey is divided into sections that address specific topics such as DDoS attacks, corporate network security, IPv6, data centers, mobile networking, etc. Each section establishes the observations and concerns of respondents and, where appropriate, the mechanisms put in place to manage their concerns.
Arbor distributes the WISR survey by specifically targeting individuals within the operational security community to get as accurate a picture as possible. Survey participation remains strong despite additional efforts to encourage recusal of respondents without direct network or security operational experience. Still, we had 356 responses to this year’s survey — up from 354 last year.
Survey Methodology
7

Arbor Networks Special Report
8
Service providers represent the majority of respondents at 64 percent (Figure 1) — a 12 percent increase over last year. The remaining 36 percent come from enterprise, government and education (EGE) network operators. Breaking down the EGE segment, 58 percent are enterprise respondents, with 26 percent and 16 percent representing education and government respectively.
Within the service provider category, tier 2/3 and tier 1 operators are the main groupings, as in previous iterations of this report (Figure 2).
Looking closer at the EGE respondents, we identified a broad representation of verticals (Figure 3). The largest proportion of enterprise respondents are from banking/finance at 32 percent, a significant increase from 18 percent last year. Technology, automotive/ transportation and manufacturing are also well represented, rounding out the top four verticals.
Demographics of Survey Respondents
—
0%
10%
20%
30%
40%
50%
60%
Source: Arbor Networks, Inc.
Service Provider Type
Tier 2/3 provider or regional ISP
Tier 1 service provider
Mobile service provider
Managed service provider/MSSP
Hosting/data center/co-location services
Wireline broadband (MSO, DSL, etc.)
CDN/content delivery (caching, distribution, streaming, etc.)
Cloud service (virtualization, storage, cloud applications, etc.)
DNS registrar/DNS service provider
Other
51%
25%
6% 5%3% 2% 1%
Figure 2 Service Provider Type
Figure 1 Respondent Classification
Figure 3 Enterprise Verticals
Enterprise Verticals
20% Technology
32% Banking/Finance
5% Insurance
3% eCommerce/Retail
7% Energy/Utilities
4% Healthcare
3% Gaming/Gambling
3% Military/Law Enforcement
9% Manufacturing
11% Automotive/ Transportation
3% Other
Source: Arbor Networks, Inc.
Respondent Classification
64%Service Provider
36%Enterprise, Government, Education
Respondent Classification

9
Worldwide Infrastructure Security Report
Two-thirds of all respondents identify as security, network or operations professionals (Figure 4), a similar result to last year. Security professionals are the highest represented demographic, with 40 percent having this background.
The survey garnered wide participation from all regions (Figure 5). The United States and Canada represent the lead region for participation, with Western, Central and Eastern Europe following closely in second place. Participation from Asia Pacific and Oceana increased significantly this year, with small decreases proportionally for Latin America, the Middle East and Africa.
Source: Arbor Networks, Inc.
US AND CANADA
LATIN AMERICA ( including Central and South America)
WESTERN, CENTRAL AND EASTERN EUROPE ( including Russia and Iceland )
MIDDLE EAST AND AFRICA
ASIA PACIFIC AND OCEANIA
US AND CANADA
LATIN AMERICA ( including Central and South America)
WESTERN, CENTRAL AND EASTERN EUROPE ( including Russia and Iceland )
MIDDLE EAST AND AFRICA
ASIA PACIFIC AND OCEANIA
Where is yourorganization
headquarters?
In what region(s) of the world
does your network operate?
Respondent’s Geographic Information
45%
45%
0% 5% 10% 15% 20% 25% 30% 35% 40% 45%
7%
28%
32%
10%
23%
25%
41%
23%
Figure 5 Respondent’s Geographic Information
Figure 4 Respondent’s Role in the Organization
Source: Arbor Networks, Inc.
Respondent’s Role in the Organization
Security professional
Network professional
Manager or director
President or officer (CXO)
Operations professional
Vice President
Other
40%
1%
16%
12%
23%
5%
3%
Source: Arbor Networks, Inc.
Respondent’s Role in the Organization
Security professional
Network professional
Manager or director
President or officer (CXO)
Operations professional
Vice President
Other
40%
1%
16%
12%
23%
5%
3%
Respondent’s Role in the
Organization

Arbor Networks Special Report
10
Service Providers
—
KEY FINDINGS
The largest attack reported this year was 800 Gbps, a 60 percent increase over last year. Other respondents reported attacks of 600 Gbps, 550 Gbps and 500 Gbps. ATLAS data also shows that the frequency of extremely large attacks has increased dramatically this year.
Service provider customers remain the number one target of DDoS attacks, with an increasing proportion of attacks targeting them.
The proportion of respondents seeing attacks targeting cloud-based services has decreased significantly, down from one third last year to only one quarter this year.
OPERATIONAL THREATS
• DDoS attacks against customers remain the most commonly experienced threat among service provider respondents.
• Encouragingly, the percentage seeing infrastructure outages due to failure or misconfiguration continues to fall.
• Looking at security concerns for the next year, DDoS attacks continue to dominate, followed by bandwidth saturation.
• Consistent with previous years, NetFlow analyzers are the most commonly used tools to detect threats, followed by firewall logs. Respondents also indicated increased utilization of SNMP-based tools and inline DDoS detection/mitigation systems.
• NetFlow analyzers remain the most effective way of detecting threats, while firewall logs once again fare poorly in terms of effectiveness.
Arbor Networks Special Report
DDoS ATTACKS
10

11
Worldwide Infrastructure Security ReportWorldwide Infrastructure Security Report
DDoS
It is encouraging to see that many more respondents (83 percent) are using intelligent DDoS mitigation systems (IDMS) to mitigate DDoS attacks this year. Respondents indicated a marked decrease in the use of less effective solutions such as firewalls and load balancers, which is also positive.
• About one third of this year’s respondents reported peak attack sizes over 100 Gbps. One eighth reported attacks over 200 Gbps.
• End-user subscribers once again take the top spot as the most common type of customer targeted by DDoS attacks. Government edged out both finance and hosting this year to take the number two spot.
• For the past two years, we have highlighted a significant increase in the scale and frequency of volumetric attacks around the world. This has continued once again.
• Ninety-five percent of service providers experienced application-layer attacks this year.
• There was increased attack activity on all reflection/amplification protocols this year. DNS remains the most commonly used reflection protocol, with NTP close behind. The results also show heavy use of SSDP, Chargen and SNMP — with the use of Chargen growing most rapidly year over year.
• Sixty-seven percent of service providers experienced multi-vector attacks on their networks — a significant rise from 56 percent last year and 42 percent the year before.
• The most common services targeted by application-layer attacks were DNS, HTTP and secure web services (HTTPS).
• The frequency of DDoS attacks is increasing, as 53 percent of respondents indicated they are seeing more than 51 attacks per month — up from 44 percent last year.
• Online gaming is seen as the top motivation behind DDoS attacks this year. Ideological hacktivism has returned to prominence in second place, with criminals demonstrating attack capabilities following closely in third.
• Thirteen percent witnessed an IPv6 DDoS attack this year — a significant increase from 9 percent last year and 2 percent in 2014.
• The proportion able to mitigate DDoS attacks in less than 20 minutes has increased once again to 77 percent, up from 74 percent last year and 68 percent the year before.
• The trend of increased interest in DDoS detection and mitigation services continues this year, with 78 percent of service providers seeing more demand from customers, up 4 percent over last year. Government and finance are the number one and two verticals driving demand for these services this year.

Arbor Networks Special Report
12
MOBILE NETWORK OPERATORS
• Enhanced security starts with visibility. Mobile operators have been making investments that have driven an across-the-board increase in visibility capabilities.
• This year’s respondents reported increases for both the detection of compromised subscriber devices (37 percent), as well as visibility at Layer 3, 4 and 7.
• Mobile operators are reporting large increases in DDoS attacks targeting their mobile infrastructure/users (74 percent), as well as the Gi/SGi interface (72 percent).
IPV6
• The past year saw a 10 percent increase in the proportion of service providers that have deployed or plan to deploy IPv6 within their networks — now 78 percent.
• The proportions of both business and end-user subscribers using IPv6 services continue to grow.
• This year, the peak IPv6 network traffic level reported was 6 Tbps, a 20 percent increase over last year. Estimated growth rates remain low, despite empirical data showing traffic volumes growing relatively quickly.
• Seventy-six percent of service providers utilize IDMS to mitigate IPv6 attacks, up 9 percent from last year.
DATA CENTER OPERATORS
• Almost two thirds operate managed hosting, co-location and public/private cloud services. The fact that cloud is as common as co-location and managed hosting demonstrates how rapidly cloud-based data and application services are being adopted.
• Almost one quarter saw the cost of a major DDoS attack at above $100K, and 5 percent cited costs of over $1M — illustrating the importance of a good DDoS protection strategy.
• Similar to last year, customers remain the top target of DDoS attacks, with service infrastructure in second place.
• More than 60 percent saw attacks totally saturate data center bandwidth, up from one third in 2014 and around one half last year.
• The proportion using layered intelligent DDoS protection has increased from 51 percent to 56 percent. The proportions using OOB management networks and uRPF have also increased — from 44 percent to 52 percent and from 40 percent to 48 percent respectively.
Arbor Networks Special Report
DDoS attacks are the top IPv6 security concern for service providers.
Sixty percent witnessed DDoS attacks targeting their data centers, up from 55 percent last year.
There has been a substantial increase in attack frequency again this year, with 21 percent seeing more than 50 attacks per month versus only 8 percent last year.
The proportion of respondents using firewalls for DDoS defense has fallen from 71 percent to 40 percent, a huge (and very encouraging) drop.
Forty-three percent witnessed their firewalls or IPS/IDS devices experience or contribute to an outage during a DDoS attack.
KEY FINDINGSService Providers
—
12

13
Worldwide Infrastructure Security Report
SDN/NFV
• Compared to the responses gathered from last year’s survey, we have seen a surprising decrease in the implementation of SDN/NFV technologies in the ISP environment. This year, only 9 percent of respondents have already deployed SDN/NFV technologies in their production network, and around 27 percent are investigating or testing these technologies.
• Looking at barriers preventing the deployment of SDN/NFV technologies across service provider networks, operational concerns are number one at 53 percent, followed by cost at 45 percent and interoperability at 41 percent.
ORGANIZATIONAL SECURITY
• Implementation of anti-spoofing filters is up to 48 percent, from 37 percent last year. Still, we were hoping for a more significant increase, given the continued storm of reflection/amplification DDoS attacks on the Internet.
• Fifty-seven percent carry out DDoS defense simulations, up from 46 percent last year and marking one of the highest levels in the last four surveys. Even more encouraging is the growth in service provider organizations that make time to practice for incident response on at least a quarterly basis.
• Unfortunately, there has been a decrease in those monitoring for route hijacks, down to 29 percent this year from 54 percent last year.
• Lack of resources, difficulty in hiring and OPEX funding are the top challenges faced when building and maintaining an effective operational security (OPSEC) team.
13
Worldwide Infrastructure Security Report
Data centers are the most popular location for SDN/NFV. We have also seen significant growth in interest in deploying SDN/NFV within fixed-line services compared to last year.
Eighty-seven percent of service providers have dedicated security personnel, with around one third having between 1 and 5 people, and one quarter having more than 30. Only 2 percent outsource their SOC.
Participation in global OPSEC groups has decreased dramatically from 41 percent to 26 percent — the lowest level in the last three years.
KEY FINDINGS

Arbor Networks Special Report
14
Enterprise, Government and Education (EGE)
—
KEY FINDINGS
Infrastructure continues to be the most popular attack target reported by EGE respondents.
Nearly 60 percent estimate their downtime costs above $500/minute, with some indicating much greater expense.
Attack frequency is on the rise, with 45 percent experiencing more than 10 attacks per month — a 38 percent year-over- year increase.
NETWORK SECURITY
• DDoS is the most common threat experienced by EGE respondents during this survey period, similar to last year. Accidental data loss, which was the third most commonly reported threat last year, has moved up to second place.
• Looking forward, APT is the number one threat on the mind of over 60 percent of enterprise participants, jumping ahead of DDoS attacks in second place.
• Similar to last year, firewalls, IDS and SIEM are among the most commonly utilized tools to detect threats within EGE respondents’ networks.
• Inline DDoS detection/mitigation systems are in use by nearly half of respondents this year for threat detection, with NetFlow-based analyzers following closely.
Arbor Networks Special Report
DDoS ATTACKS
14

15
Worldwide Infrastructure Security ReportWorldwide Infrastructure Security Report
This year’s results show that 42 percent of enterprise, government and education (EGE) respondents experienced DDoS attacks over the past year, an 8 percent increase over last year. Significantly higher proportions of banking/finance and government respondents also reported attacks.
• One quarter suffered attacks targeting the application layer, a significantly higher level than the 16 percent reported by service providers. Web services (HTTP) are the top target.
• Overall, an understanding of the DDoS threat and the number of organizations deploying both IDMS (44 percent) and best-practice hybrid defense (30 percent) are on the rise. So, too, are the number of organizations utilizing an “always-on” device or service (26 percent).
• Firewalls, load balancers, and CDNs all tied for last place in effectiveness at mitigating DDoS attacks. Nearly half had firewall or IPS devices experience a failure or contribute to an outage during an attack, similar to last year.
• The most commonly perceived motivations behind DDoS attacks are now political/ideological disputes and criminal extortion attempts.
• Survey results indicate a better understanding of the brand damage and operational expense incurred due to successful DDoS attacks, driving focus on DDoS attacks and defensive strategies.
IPv6
• Sixty-seven percent of EGE respondents now offer Internet-facing services over IPv6.
• Nearly half have a moderate or major concern relating to IPv6 attacks against dual-stack devices and the potential impact to related IPv4 services.
There is a significant increase in the proportion of EGE respondents who have deployed IPv6 or plan to deploy it in their networks — up to 38 percent, from only 26 percent last year.
IPv6

Arbor Networks Special Report
16
Arbor Networks Special Report
Difficulty in hiring and lack of resources are the key issues for EGE respondents when building and maintaining an effective OPSEC team.
ORGANIZATIONAL SECURITY
• Ninety-three percent of this year’s EGE respondents have at least some dedicated security personnel, a higher proportion than our service provider respondents. However, a far lower percentage have large security teams.
• Nine percent outsource their SOC, a much higher percentage than service providers.
• Fifty-four percent now carry out DDoS defense simulations, with around 30 percent conducting them at least quarterly.
KEY FINDINGSEnterprise, Government and Education (EGE)
—
SDN/NFV
Around 40 percent of EGE respondents have plans to deploy SDN/NFV technologies, but only 21 percent are investigating or testing solutions now.
EGE respondents have fewer plans to utilize SDN/NFV than their service provider counterparts.
The number one barrier to SDN/NFV deployment within EGE network infrastructure is cost, at 56 percent. Similar to service providers, operational concerns are also high on the list, at 51 percent.
16

17
Worldwide Infrastructure Security Report
17
Worldwide Infrastructure Security Report
Visibility into DNS traffic has improved. Three quarters of this year’s respondents cite visibility at Layers 3/4, up from 63 percent last year.
Firewalls, IPS/IDS and iACLs are still the most popular technologies used to protect DNS infrastructure.
Enterprises are still preferring generic security solutions over those that are specifically designed to protect infrastructure from the DDoS threat.
KEY FINDINGSDNS Operators
—• The percentage with a dedicated
security function for DNS has fallen to 22 percent from 28 percent last year — a significant drop and a disappointing result.
• The proportion seeing service- affecting DDoS attacks targeting their DNS infrastructure has fallen slightly this year to 27 percent, from 30 percent last year. Service providers are far more likely to see attacks, as you would expect.
• For service providers, intelligent DDoS mitigation systems (IDMS) are the most popular security measure used to protect DNS infrastructure, with ACLs and firewalls in second and third place respectively.

Arbor Networks Special Report
18
DoS attacks against customers remain the most commonly experienced threat among
service provider respondents. Encouragingly, the percentage seeing infrastructure outages due to failure or misconfiguration continues to fall. Looking at security concerns for the next year, DDoS attacks still dominate, buoyed no doubt by the rise of IoT botnet-based DDoS attacks. Bandwidth saturation is also notable as a growing concern.
NetFlow analyzers continue to be the most commonly used tool to detect threats, followed by firewall logs. NetFlow analyzers also remain the most effective way of detecting threats, while firewall logs once again fare poorly in terms of effectiveness. Respondents also indicated increased utilization of SNMP-based tools and inline DDoS detection/mitigation systems.
D
OPERATIONAL THREATS
Service Provider
—

19
Worldwide Infrastructure Security Report
In this 12th year of the WISR, once again DDoS attacks are by far the most common threat that service providers experience.
The percentage of service providers witnessing DDoS attacks is up to 86 percent, from 77 percent last year (Figure 6). The ever-increasing percentage of service providers experiencing DDoS demonstrates the sheer number of attacks that are happening and the widespread targets for those attacks.
The leading concern for service providers for the coming year also continues to be DDoS attacks. Bandwidth saturation rose by 7 percent, taking over the second slot from infrastructure outages, which stayed relatively static in percentage terms. Given the IoT botnet trends and continued high-profile attacks, we expect that DDoS attacks will remain top of mind during the coming year.
Source: Arbor Networks, Inc.
DDoS ATTACKS
INFRASTRUCTURE OUTAGES ( partial or complete due to equipment failures or misconfigurations )
BANDWIDTH SATURATION ( streaming, over-the-top services, unique events, flash crowds)
COMPROMISE OF COMMAND AND CONTROL NETWORK
OTHER
DDoS ATTACKS
COMPROMISE OF COMMAND AND CONTROL NETWORK
OTHER
Service Provider Experienced
Threats
Service ProviderConcerns
Service Provider Experienced Threats and Concerns
88%
BANDWIDTH SATURATION ( streaming, over-the-top services, unique events, flash crowds)
46%
0% 10% 20% 30% 40% 50% 60% 70% 80% 90% 100%
46%
37%
86%
12%
3%
29%
2%
INFRASTRUCTURE OUTAGES ( partial or complete due to equipment failures or misconfigurations )
42%
Figure 6 Service Provider Experienced Threats and Concerns

Arbor Networks Special Report
20
Network and security practitioners utilize a wide variety of tools to detect threats against their networks, customers and services (Figure 7). The survey shows strong growth in the usage of NetFlow-based analysis tools, with almost double-digit growth year over year. Respondents also increased their use of SNMP-based tools and inline DDoS detection/mitigation systems. Firewall logs continue to decline in popularity as do IDS/IPS, as more operators have come to the realization that these tools do not provide adequate DDoS protection.
Utilizing effective tools helps reduce the time to detect and mitigate threats on service provider networks. NetFlow tools are the most commonly used by service providers again this year. This makes sense, as they provide extremely high scalability and effectiveness for detecting attacks across a large network. Firewall logs continue to be the second most commonly used detection mechanism despite ranking fifth in terms of effectiveness. These results are very similar to last year.
Threat Detection Tools Threat Tool Effectivness
Threat Detection Tools and Threat Tool Effectiveness
100%
90%
80%
70%
60%
50%
40%
30%
20%
10%
0%
10
9
8
7
6
5
4
3
2
1
0
Source: Arbor Networks, Inc.
NetFlow-based analyzers (e.g. Peakflow SP)
Firewall logs
SNMP-based tools
IDS/IPS
Customer call/help desk ticket
Inline DDoS detection/mitigation system (e.g. Pravail APS)
Service assurance/monitoring solutions
In-house developed scripts/tools
Security information and event management (SIEM) platforms
Other
86%
56%
53%
49%
45%
1%
34%
34%
35%
42%
7.3
5.0
5.7
5.4
4.0
4.54.
9
4.5
6.5
Figure 7 Threat Detection Tools and Threat Tool Effectiveness

21
Worldwide Infrastructure Security Report
21
Worldwide Infrastructure Security Report
of DDoS Attacks
—The largest attack reported this year was 800 Gbps, with other respondents reporting attacks of 600 Gbps, 550 Gbps and 500 Gbps. This continues the trend of significant growth in the top-end size of DDoS attacks that we have seen over the past few years. Data also shows that the frequency of extremely large attacks has also increased dramatically this year. The ability for attackers to generate huge volumes of traffic has never been more evident.
Service provider customers remain the number one target of DDoS attacks, followed by service and network infrastructure. End-user subscribers once again take the top spot as the most common type of customer targeted. Government edged out finance and hosting this year to take the number two spot. The proportion seeing attacks targeting cloud-based services has decreased significantly, down from one-third last year to only one-quarter this year.
The largest DDoS attack reported by a respondent this year was 800 Gbps.
SCALE + TARGETING

Arbor Networks Special Report
22
Throughout this survey period, attackers have continued the trend of using reflection/amplification techniques to exploit vulnerabilities in DNS, NTP, SSDP, Chargen and other protocols to maximize the scale of their attacks. In addition, there has been a marked increase in the exploitation of IoT devices to generate large packet floods, without the use of spoofing or reflection/amplification techniques. The largest attack reported by a respondent this year was 800 Gbps, with other respondents reporting attacks of 600 Gbps, 550 Gbps and 500 Gbps (Figure 8).
Last year, nearly one-quarter reported peak attack sizes over 100 Gbps, emphasizing the breadth of the DDoS problem in relation to large attacks. This year, about one-third witnessed peak attack sizes over 100 Gbps, and one-eighth experienced attacks over 200 Gbps. In general, peak attack sizes and the frequency of large attacks have increased dramatically this year. This is corroborated by ATLAS data (see ATLAS Attack Sizes).
Figure 8 Peak Attack Size (Gbps)
In general, peak attack sizes and the frequency
of large attacks have increased dramatically
this year. This is corroborated by ATLAS data
(see ATLAS Attack Sizes).
24Gbps
100Gbps
309Gbps
800Gbps
Source: Arbor Networks, Inc.
Peak Attack Size
2007 2008 2009 2010 2011 2012 2013 2014 2015 2016
900
800
700
600
500
400
300
200
100
0
22

23
Worldwide Infrastructure Security Report
Figure 9 Attack Target Mix
Looking at the targets of the DDoS attacks monitored by survey participants, customers remain the number one target (Figure 9). Three-quarters of attacks targeted customers this year, compared to only two-thirds last year. The proportions of attacks targeting service and network infrastructure decreased significantly from last year. This indicates that attackers are trending towards attacking their victims directly, rather than relying on collateral damage from indirect attacks.
Again this year, end-user subscribers take the top spot as the most common type of customer targeted (Figure 10). Subscribers are generally targeted as a result of interpersonal conflict or competitive gaming-related attacks. Government edged out finance and hosting to take the number two spot. E-commerce, which garnered third place last year, fell to fifth place in a near tie with gaming.
Figure 10 Attack Target Customer Verticals
Attack Target Customer Verticals
48% Government
69% End-User/Subscriber
41% Financial Services
36% eCommerce
40% Hosting
10% Energy/Utilities
10% Healthcare
35% Gaming
13% Law Enforcement
7% Manufacturing
9% Gambling
7% Other
31% Education
Source: Arbor Networks, Inc.
Attack Target Mix
0%
20%
40%
60%
80%
30%
10%
50%
70%
90%
100%
CUSTOMERS NETWORK INFRASTRUCTURE
(e.g. routers, firewalls, etc.)
SERVICEINFRASTRUCTURE
(e.g. DNS, web portal, etc.)
75%
11% 13%
Customers remain the
number one target, with
three-quarters of attacks
targeting them compared
to only two-thirds last year.

Arbor Networks Special Report
24
Source: Arbor Networks, Inc.
Attacks Targeting Cloud Services
Not Applicable19%
Do Not Know21%
No35%
Yes25%
Attacks Targeting Cloud
Services
Cloud service growth is continuing at a quick pace, with more and more organizations looking to adopt cloud-based applications and services. These services can offer significant performance, flexibility and cost advantages to business; however, their availability is determined by their connectivity to customers. This year, the proportion of respondents seeing attacks targeting cloud-based services has decreased, down from one-third last year to only one-quarter this year (Figure 11). Interestingly, the percentage citing “not applicable” also increased this year. This could indicate some pullback in the use or provision of cloud services by our service provider respondents.
Even though the proportion seeing attacks targeting cloud services has fallen, these services warrant protection from the DDoS threat given their multi-tenant nature. Collateral damage, where attacks targeting one customer impact another unintended victim, represents a significant risk to all customers of a cloud service.
—It only takes an attack on one customer to potentially affect many others.
Figure 11 Attacks Targeting Cloud Services

25
Worldwide Infrastructure Security Report
AT
LA
S
uring this survey period, the ATLAS® system has gathered
statistics from over 500 Arbor Networks SP customers around the world, with 330 customers participating on a daily basis. Statistics are shared hourly and include details of the DDoS attacks monitored, along with summary information on the traffic crossing network boundaries.
Arbor’s team collates and analyzes this unique data set to determine key trends in DDoS attack activity. This data is then released to the broader operational security community in industry conference presentations and research reports.
Arbor has been emphasizing the rapid growth in the scale and frequency of attacks in various forums during 2016, with both reflection/amplification and IoT botnets contributing to attacker capabilities.
The peak confirmed attack monitored by ATLAS during the survey period measured 579 Gbps and targeted a destination in Great Britain. As we have seen from the WISR survey data, this is by no means the largest attack that has occurred this year. What ATLAS does demonstrate is how consistently we are now seeing very large attacks around the world (Figure AT1), with peak attack sizes on a week-by-week basis higher than those seen in 2015.
ATLAS provides a view into approximately one-third of the Internet, and is tracking around 135,000 host misuse DDoS events per week as of December 2016.
D
ATTACK SIZESATLAS Special Report
—
ATLAS Peak Monitored Attack Size (Gbps), 2015 vs. 2016
Source: Arbor Networks, Inc.
2015 2016
0
100
200
300
400
500
600
WEEK 1 WEEK 10 WEEK 20 WEEK 30 WEEK 40 WEEK 50
ATLAS Peak Monitored Attack Size (Gbps), 2015 vs. 2016
Source: Arbor Networks, Inc.
2015 2016
0
100
200
300
400
500
600
WEEK 1 WEEK 10 WEEK 20 WEEK 30 WEEK 40 WEEK 50
579Gbps
579Gbps
Figure AT1 ATLAS Peak Monitored Attack Size (Gbps), 2015 vs. 2016

Arbor Networks Special Report
26
Source: Arbor Networks, Inc.
Growth in Large Attacks Year Over Year
2016
2014
2013
2015
39
159
223
16
558
87
0 100 200 300 400 500 600
Over 100 Gbps Over 200 Gbps
AT
LA
S
The number of very large attacks monitored by ATLAS continued to grow rapidly this year (Figure AT2), with more than double the number of attacks over 100 Gbps tracked in 2016 compared to 2015. In 2016, ATLAS tracked 558 attacks over 100 Gbps versus 223 in 2015, and 87 attacks over 200 Gbps versus 16 in 2015.
The overall mix of attack sizes is shifting up from a percentage perspective. Last year, 16 percent of attacks were over 1 Gbps. This year, the proportion has risen to 20 percent.
However, as we can see in Figure AT3, the vast majority of attacks are still relatively small. In fact, 88 percent are less than 2 Gbps. Attacks between 500 Mbps and 2 Gbps in size are easily capable of saturating the Internet connectivity of many enterprises. Attacks in this category represent around 18 percent of ATLAS-monitored DDoS attacks — over 1.1 million events in 2016.
Average attack size increased to 931 Mbps in 2016, up from 760 Mbps in 2015 — an increase of 23 percent (Figure AT4).
Average Attack Size (Mbps), 2015–2016
Source: Arbor Networks, Inc.
0
200
800
1,000
1,200
1,400
400
600
01/04/15 03/08/15 05/17/15 07/26/15 10/04/15 12/13/15 02/21/16 05/01/16 07/10/16 09/18/16 11/27/16
Figure AT2 Growth in Large Attacks Year Over Year
Figure AT4 Average Attack Size (Mbps), 2015–2016
Figure AT3 Attack Size Breakout
Source: Arbor Networks, Inc.
Attack Size Breakout
Less than 500 Mbps
500 Mbps –1 Gbps
1 Gbps –2 Gbps
2 Gbps –5 Gbps
5 Gbps –10 Gbps
10 Gbps –20 Gbps
20 Gbps –50 Gbps
70%
1%<1%
10%
8%
7%
3%
Source: Arbor Networks, Inc.
Attack Size Breakout
Less than 500 Mbps
500 Mbps –1 Gbps
1 Gbps –2 Gbps
2 Gbps –5 Gbps
5 Gbps –10 Gbps
10 Gbps –20 Gbps
20 Gbps –50 Gbps
70%
1%<1%
10%
8%
7%
3%
Attack Size Breakout
If current growth trends continue, the average attack size will reach nearly 1.2 Gbps by the end of 2017.

27
Worldwide Infrastructure Security Report
AT
LA
S
Attack frequency is growing across the board (Figure AT5), with attack frequencies in the 1–10 Gbps range growing the fastest.
Frequency Trends, Attacks 50–250 Gbps
60
90
120
150
30
Frequency Trends, Attacks 2–10 Gbps
Frequency Trends, Attacks 10–50 Gbps
Source: Arbor Networks, Inc.
0
6,000
9,000
12,000
15,000
3,000
01/04/15 03/08/15 05/17/15 07/26/15 10/04/15 12/13/15 02/21/16 05/01/16 07/10/16 09/18/16 11/27/16
Source: Arbor Networks, Inc.
Source: Arbor Networks, Inc.
0
1,500
2,000
2,500
3,000
1,000
500
2–5 Gbps 5–10 Gbps
10–20 Gbps 20–50 Gbps
50–100 Gbps 100–250 Gbps
01/04/15 03/08/15 05/17/15 07/26/15 10/04/15 12/13/15 02/21/16 05/01/16 07/10/16 09/18/16 11/27/16
001/04/15 03/08/15 05/17/15 07/26/15 10/04/15 12/13/15 02/21/16 05/01/16 07/10/16 09/18/16 11/27/16
Figure AT5 Average Attack Frequency, 2015–2016
Source: Arbor Networks, Inc.
Attack Size Breakout
Less than 500 Mbps
500 Mbps –1 Gbps
1 Gbps –2 Gbps
2 Gbps –5 Gbps
5 Gbps –10 Gbps
10 Gbps –20 Gbps
20 Gbps –50 Gbps
70%
1%<1%
10%
8%
7%
3%
Attacks 2–10 Gbps
Attacks 10–50 Gbps
Attacks 50–250 Gbps

Arbor Networks Special Report
28
Looking at the record of 50th, 75th, 90th and 95th percentile attack sizes over the last year, we can see growth across the board (Figure AT6). The 75th percentile is the one that is growing the fastest, with a doubling time of around 36 weeks based on this year’s data. The 90th percentile attack size is also predicted to double in slightly over one year.
Attack Percentiles Over Time (Mbps), 2016
Source: Arbor Networks, Inc.
0
5,000
4,000
6,000
7,000
8,000
3,000
2,000
1,000
01/04/15 03/06/15 05/15/15 07/24/15 10/02/15 12/11/15
75th90th95th 50th
Figure AT6 Attack Percentiles Over Time (Mbps), 2016
ATTACK DURATIONSThe ATLAS system also tracks the duration of attacks.
Consistent with the previous year, in 2016 ATLAS shows that around 91 percent of attacks lasted less than one hour (Figure AT7). The average duration of an attack in 2016 was 55 minutes, down slightly from the 58 minutes reported last year, which was also consistent with the 2014 results.
It should be noted, however, that although the majority of individual ATLAS-monitored events lasted less than one hour, they can often be part of multi-event campaigns where attackers start/stop the attack sporadically over an extended period. This is done deliberately to make mitigation more complex for organizations that do not operate a layered DDoS defense strategy. Such organizations need to divert their traffic to a service provider or cloud-based DDoS mitigation service for each and every incident.
Source: Arbor Networks, Inc.
Attack Duration Breakout
Less than 30 minutes
30 minutes – 1 hour
1 hour – 3 hours
3 hours – 6 hours
6 hours – 12 hours
12 hours – 1 day
More than 1 day
84%
2%<1%
6%
5%
1%1%
Figure AT7 Attack Duration Breakout
Attack Duration Breakout
AT
LA
S
28

29
Worldwide Infrastructure Security Report
Source: Arbor Networks, Inc.
Top Targeted Countries for DDoS Attacks by Percentage
TURKEY
MALAYSIA
BRAZIL
SOUTH KOREA
FRANCE
CHINA
UNITED STATES
AUSTRALIA
GREAT BRITAIN
BELGIUM
22%
12%
7%
4%
3%
3%
3%
2%
2%
2%
0% 5% 10% 15% 20% 25%
TARGET COUNTRIESLast year, the USA and China were ranked first and second. This year, the USA remains in first place, but China has been knocked into the third spot by South Korea. Although the USA maintains its top ranking, the percentage of attacks targeting the USA has dropped significantly from 32 percent to 22 percent. It should be noted that mapping DDoS source/destination IP addresses to geographical locations is challenging due to techniques, such as IP spoofing, used by attackers to obfuscate their work.
The top targets for attacks greater than 10 Gbps were the USA and Saudi Arabia this year (Figure AT9). The USA saw a similar proportion of these large attacks last year. However, Saudi Arabia saw a huge jump — from 1.4 percent of attacks in 2015 to 9.6 percent this year — and nearly 9,000 attacks over 10 Gbps throughout the year. It is also worth noting that the percentage of attacks targeting Great Britain has increased slightly, while the percentage targeting France has dropped slightly from last year.
This year, we have seen a shift in the top two countries being targeted most often by DDoS attacks (Figure AT8).
The USA and South Korea are the top two countries being targeted by DDoS attacks.
The USA and Saudi Arabia are the top two countries being targeted by DDoS attacks greater than 10 Gbps.
Figure AT8 Top Targeted Countries for DDoS Attacks by Percentage
Figure AT9 Top Targeted Countries for DDoS Attacks Greater Than 10 Gbps by PercentageSource: Arbor Networks, Inc.
Top Targeted Countries for DDoS Attacks Greater Than 10 Gbps by Percentage
KUWAIT
CHINA
AUSTRALIA
SAUDI ARABIA
FRANCE
GREAT BRITAIN
UNITED STATES
CANADA
SOUTH KOREA
GERMANY
20%
10%
8%
7%
7%
5%
4%
4%
3%
3%
0% 5% 10% 15% 20% 25%
AT
LA
S

Arbor Networks Special Report
30
For the past two years, Arbor has included a specific breakout section on reflection/amplification attack vectors to provide additional detail on their evolution and use. During 2016, reflection/amplification attack vectors continued to be leveraged by attackers around the globe, but there were changes (Figure AT10).
The big change this year is the strong resurgence of DNS as the dominant protocol being leveraged for reflection/amplification. Throughout this year, the number of DNS reflection/amplification attacks being tracked per week nearly doubled, from approximately 10,500 to 18,500 — representing a significant shift.
REFLECTIONS
ATLAS Reflection/Amplification Attacks, Count Per Week
Source: Arbor Networks, Inc.
0
10,000
15,000
20,000
25,000
5,000
01/03/15 03/06/15 05/15/15 07/24/15 10/02/15 12/11/15
NTP amplificationDNS amplification SSDP amplification
SNMP amplificationPortmap amplification MSSQL amplification Chargen amplification
Figure AT11 ATLAS Reflection/Amplification Attacks (Percentage), 2016 So Far
Source: Arbor Networks, Inc.
ATLAS Reflection/Amplification Attacks (Percentage), 2016 So Far
DNS amplification
NTP amplification
Chargen amplification
SSDP amplification
SNMP amplification
Portmap amplification
MSSQL amplification
47%
1%<1%
29%
11%
10%
2%
Source: Arbor Networks, Inc.
ATLAS Reflection/Amplification Attacks (Percentage), 2016 So Far
DNS amplification
NTP amplification
Chargen amplification
SSDP amplification
SNMP amplification
Portmap amplification
MSSQL amplification
47%
1%<1%
29%
11%
10%
2%
ATLAS Reflection/
Amplification Attacks
Figure AT10 ATLAS Reflection/Amplification Attacks, Count Per Week
AT
LA
S
Last year, Arbor reported a reduction in the use of SSDP in the latter part of 2015, with attack numbers falling from 10,000 per week at the start of 2015 to around 2,000 per week by the end of the year. This trend continued in early 2016, but SSDP usage picked up again in the latter part of the year. NTP has also seen a cyclical trend this year, with around 10,000-15,000 attacks per week at the start of the year, falling to around 5,000-6,000 by midyear, but back to the 10,000 level at year-end.
Looking at the whole of 2016, DNS, NTP and Chargen represent the top three reflection/amplification attack vectors (Figure AT11).
31
Worldwide Infrastructure Security Report
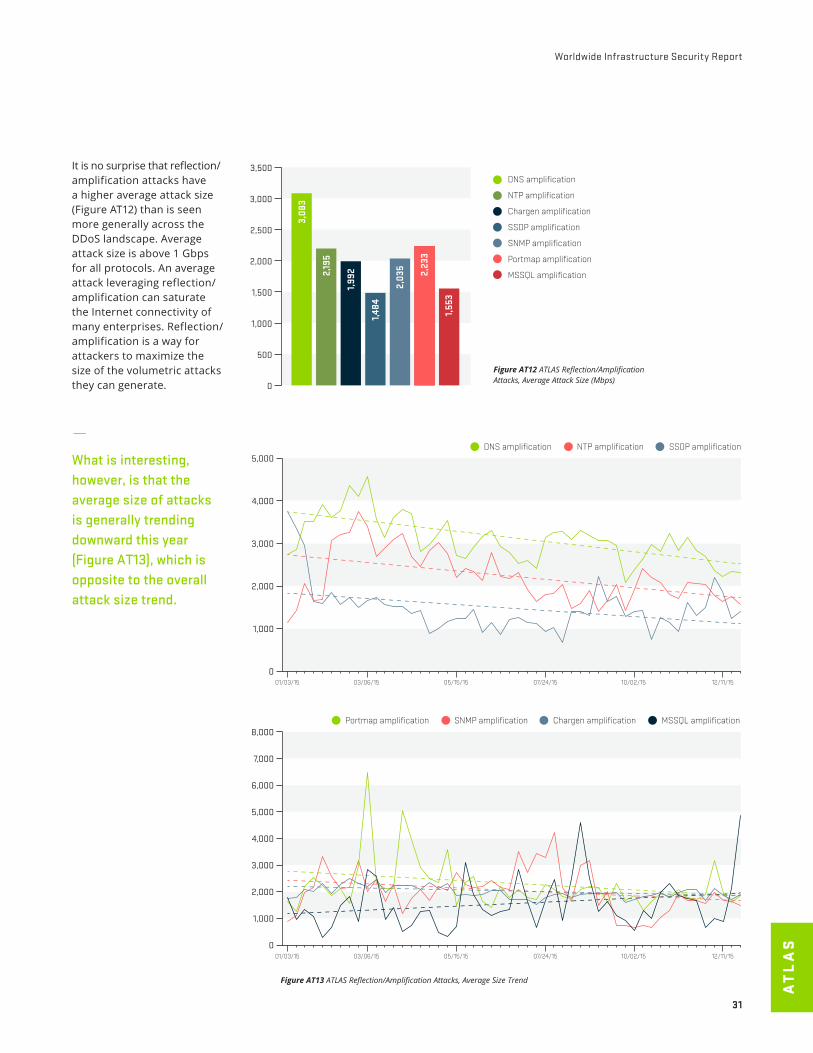
It is no surprise that reflection/ amplification attacks have a higher average attack size (Figure AT12) than is seen more generally across the DDoS landscape. Average attack size is above 1 Gbps for all protocols. An average attack leveraging reflection/amplification can saturate the Internet connectivity of many enterprises. Reflection/amplification is a way for attackers to maximize the size of the volumetric attacks they can generate.
—What is interesting, however, is that the average size of attacks is generally trending downward this year (Figure AT13), which is opposite to the overall attack size trend.
0
2,500
2,000
1,500
1,000
500
3,000
3,500
Source: Arbor Networks, Inc.
ATLAS Reflection/Amplification Attacks, Average Attack Size (Mbps)
DNS amplification
NTP amplification
Chargen amplification
SSDP amplification
SNMP amplification
Portmap amplification
MSSQL amplification
3,08
3
2,19
5
1,992
1,484
2,03
5
1,553
2,23
3
Figure AT12 ATLAS Reflection/Amplification Attacks, Average Attack Size (Mbps)
ATLAS Reflection/Amplification Attacks, Average Size Trend
Source: Arbor Networks, Inc.
0
4,000
5,000
3,000
2,000
1,000
01/03/15 03/06/15 05/15/15 07/24/15 10/02/15 12/11/15
01/03/15 03/06/15 05/15/15 07/24/15 10/02/15 12/11/15
NTP amplificationDNS amplification SSDP amplification
Source: Arbor Networks, Inc.
0
4,000
8,000
7,000
6,000
5,000
3,000
2,000
1,000
SNMP amplificationPortmap amplification Chargen amplification MSSQL amplification
Figure AT13 ATLAS Reflection/Amplification Attacks, Average Size Trend
AT
LA
S

Arbor Networks Special Report
32
AT
LA
S
The largest reflection/amplification attack monitored this year utilized NTP and was 498.3 Gbps in size (Figure AT14).
—This represents a 97 percent jump from last year’s largest monitored attack of 252.64 Gbps, which utilized SSDP. In fact, DNS and NTP both saw peak attacks over 400 Gbps this year, with Chargen used in an attack of over 200 Gbps. However, the trend in peak attack sizes is fairly flat across the year (Figure AT15).
ATLAS Reflection/Amplification Attacks, Peak Size Trends (Gbps)
Source: Arbor Networks, Inc.
0
400
500
300
200
100
01/03/15 03/06/15 05/15/15 07/24/15 10/02/15 12/11/15
01/03/15 03/06/15 05/15/15 07/24/15 10/02/15 12/11/15
NTP amplificationChargen amplification SSDP amplification
Source: Arbor Networks, Inc.
0
100
500
400
300
200
Portmap amplificationDNS amplification SNMP amplification MSSQL amplification
Figure AT15 ATLAS Reflection/Amplification Attacks, Peak Size Trends (Gbps)
0
400
300
200
100
500
600
Source: Arbor Networks, Inc.
ATLAS Reflection/Amplification Attacks, Peak Sizes (Gbps)
NTP amplification
DNS amplification
Chargen amplification
SSDP amplification
SNMP amplification
Portmap amplification
MSSQL amplification
498
480
238
137
101
83
119
Figure AT14 ATLAS Reflection/Amplification Attacks, Peak Sizes (Gbps)

33
Worldwide Infrastructure Security Report
33
Worldwide Infrastructure Security Report
of DDoS Attacks
—
TYPE, FREQUENCY + MOTIVATION
For the past two years, we have highlighted a significant increase in the scale and frequency of volumetric attacks around the world. This trend has continued for a third year.
This year saw increased attack activity on all reflection/amplification protocols. DNS remains the most commonly used reflection protocol, with NTP close behind. The survey results also show heavy use of SSDP, Chargen and SNMP — with the popularity of Chargen growing most rapidly year over year.
The proportion seeing multi-vector attacks on their networks increased significantly this year, up to 67 percent from 56 percent last year. The most common services targeted by application-layer attacks are DNS, HTTP and secure web services (HTTPS).
The frequency of DDoS attacks is also increasing. Last year, 44 percent witnessed more than 51 attacks per month. This year, that proportion has risen to 53 percent.
Online gaming is seen as the top motivation behind DDoS attacks this year. Ideological hacktivism has returned to prominence in second place, with criminals demonstrating attack capabilities following closely in third.
Thirteen percent of this year’s respondents have witnessed IPv6 attacks. This is a significant increase from 9 percent last year and 2 percent in 2014.

Arbor Networks Special Report
34
While DDoS attack vectors vary significantly, cybercriminals are constantly evolving the methodologies they use to evade defenses and achieve their goals. Generally, attack vectors fall into one of three broad categories:
01 —Volumetric Attacks These attacks attempt to consume the bandwidth either within the target network/service, or between the target network/service and the rest of the Internet. These attacks are simply about causing congestion.
02 —TCP State-Exhaustion Attacks These attacks attempt to consume the connection state tables that are present in many infrastructure components, such as load balancers, firewalls, IPS and the application servers themselves. They can take down even high-capacity devices capable of maintaining state on millions of connections.
03 —Application-Layer Attacks These target some aspect of an application or service at Layer 7. They are the most sophisticated and stealthy attacks because they can be very effective with as few as one attacking machine generating traffic at a low rate. This makes these attacks very difficult to proactively detect with traditional flow-based monitoring solutions. To effectively detect and mitigate this type of attack in real time, it is necessary to deploy an in-line or other packet-based component as part of your DDoS defense strategy.
Looking at the mix of attack types experienced by our survey participants, volumetric attacks remain the most common — as in all previous iterations of this report (Figure 12). For the past two years, we have highlighted a significant increase in the scale and frequency of volumetric attacks around the world. This has continued once again. The proportion of attacks that are volumetric in nature has increased to 73 percent, up from 65 percent last year. This is not surprising, given the widely reported uptick we’ve seen in reflection/amplification and IoT-based attacks.
The proportion of attacks targeting the application layer has stayed relatively static this year. However, the proportion of respondents seeing application-layer attacks has continued to increase, up to 95 percent this year from 93 percent last year and 90 percent in 2014.
Source: Arbor Networks, Inc.
DDoS Attack Types
State-Exhaustion
18%
Application- Layer
16%
Volumetric 73%
Figure 12 DDoS Attack Types

35
Worldwide Infrastructure Security Report
This year’s survey asked a specific question about the protocols used to generate volumetric reflection/amplification attacks (Figure 13). Nearly all protocols showed increased activity this year, but DNS and NTP remain the most commonly used vectors. Attackers continue to leverage poorly configured or protected infrastructure to magnify their capabilities. The ATLAS Reflections section of this report drills down into detail on reflection/amplification trends using ATLAS data.
Multi-vector attacks are nothing new, but their increased complexity can still make them more difficult for defenders to successfully mitigate. The proportion of respondents seeing multi-vector attacks on their networks has increased significantly, up to 67 percent this year from 56 percent last year and 42 percent in 2014 (Figure 14). Arbor Networks has seen a dramatic increase in the variety of attack capabilities that are now available in DDoS services/botnets. These growing attack capabilities are likely leading to this increase.
Multi-vector attacks are more difficult to deal with. A layered defense is the best solution. It lets an organization proactively block stealthy attacks closer to the target, while mitigating larger volumetric attacks upstream where sufficient capacity is available.
Source: Arbor Networks, Inc.
Protocols Used for Reflection/Amplification
PORTMAP
QOTD
MSSQL
NTP
SSDP
DNS
CHARGEN
SNMP
BITTORRENT
N/A
OTHER
94%
78%
49%
47%
37%
15%
14%
12%
11%
2%
3%
0% 10% 20% 30% 40% 50% 60% 70% 80% 90% 100%
Figure 13 Protocols Used for Reflection/Amplification
Source: Arbor Networks, Inc.
Multi-Vector DDoS Attacks
Do Not Know23%
No10%
Yes67%
Multi-Vector DDoS Attacks
Figure 14 Multi-Vector DDoS Attacks
35

Arbor Networks Special Report
36
Types of Attacks Targeting Encrypted Services
50%
45%
40%
35%
30%
25%
20%
15%
10%
5%
0%
Source: Arbor Networks, Inc.
Not applicable/do not know
Volumetric attacks targeting SSL/TLS service port
Protocol/connection attacks against SSL service port
Application-layer attacks against underlying service running over SSL/TLS
Attacks targeting the SSL/TLS negotiation
48%
34%
29%
22%
18%
Application-layer attacks are often referred to as stealthy or low-and-slow attacks. This year, DNS is the most common service targeted by application-layer attacks, reported by 81 percent of respondents (Figure 15). HTTP had been the top targeted service prior to last year, and it still remains very close. Over 80 percent are now seeing application-layer attacks targeting DNS and HTTP services, up from 75 percent last year. Additionally, the proportion seeing attacks targeting secure web services (HTTPS) rose from 47 percent last year to 52 percent this year. Unfortunately, decrypting HTTPS is becoming more difficult due to the increased use of cipher suites supporting perfect forward secrecy. While decryption is not always necessary for successful mitigation, PFS requires full proxy for decryption.
Again this year, almost one-fifth experienced attacks in at least one category (Figure 16). Protocol/connection attacks against the SSL/TLS port show the most growth, with 29 percent seeing these attacks — up from 22 percent last year. Given the criticality of many encrypted applications, especially those provided by financial and e-commerce organizations, a successful attack can have significant impact.
Source: Arbor Networks, Inc.
Targets of Application-Layer Attacks
IRC
OTHER
HTTP
HTTPS
DNS
SIP/VOIP
SMTP
81%
80%
52%
19%
17%
6%
7%
0% 10% 20% 30% 40% 50% 60% 70% 80% 90% 100%
Figure 15 Targets of Application-Layer Attacks
Figure 16 Types of Attacks Targeting Encrypted Services
01 / Attacks that target the SSL/TLS negotiation.
02 / Protocol/connection attacks against the SSL/TLS port.
03 / Volumetric attacks that simply flood traffic at service ports.
04 / Application-layer attacks that target the underlying service directly over fully negotiated SSL/TLS connections.
LOOKING IN MORE DETAIL AT ATTACKS TARGETING ENCRYPTED SERVICES, WE CAN ORGANIZE THEM INTO FOUR DIFFERENT CATEGORIES:
36

37
Worldwide Infrastructure Security Report
Source: Arbor Networks, Inc.
Attack Frequency Per Month
Less than 1 per month
1–10 per month
11-20 per month
21–50 per month
51–100 per month
101–500 per month
More than 500 per month
10%
14%
14%
15%
22%
7%
18%
The number of attacks experienced per month by our respondents has increased again (Figure 17). Last year, 44 percent experienced more than 51 attacks per month. This year, that proportion has risen to 53 percent. We are seeing a trend of very rapid attack frequency growth, as just three years ago only 25 percent suffered more than 51 attacks per month.
This trend in the survey data is corroborated by ATLAS data and anecdotal feedback from Arbor customers indicating they have seen significantly more frequent and larger attacks during this survey period.
Attack durations decreased this year (Figure 18). Approximately 25 percent indicated that their longest monitored attack was over 12 hours. This is down significantly from last year, when 37 percent reported that their longest attack was over 12 hours.
As in previous iterations of this survey, we asked respondents what they feel are the common motivations behind the DDoS attacks they monitored on their networks. Last year, the top motivation was criminals demonstrating attack capabilities, with gaming and criminal extortion attempts in second and third place. Groups like DD4BC and the Armada Collective were very active last year and may have led to these results. In prior years, nihilism/vandalism and ideological hacktivism had commonly been cited as the top motivations.
Figure 17 Attack Frequency Per Month
Attack Frequency (Per Month)
Source: Arbor Networks, Inc.
Longest Attack Duration (Past 12 Months)
Less than 1 hour
1–6 hours
7–12 hours
13–24 hours
1–3 days
4–7 days
1–4 weeks
More than 1 month
9%
8%
14%
2%
5% 2%
35%
26%
Longest Attack Duration (Past 12 Months)
Figure 18 Longest Attack Duration (Past 12 Months)
Arbor Networks Special Report
38
Figure 19 DDoS Attack MotivationsSource: Arbor Networks, Inc.
DDoS Attack Motivations
63%
42%
38%
32%
30%
29%
26%
25%
24%
24%
19%
19%
13%
11%
ONLINE GAMING-RELATED
POLITICAL/IDEOLOGICAL DISPUTES (WikiLeaks, nationalism, religious controversy)
CRIMINALS DEMONSTRATING DDoS ATTACK CAPABILITIES TO POTENTIAL CUSTOMERS
INTER-PERSONAL/INTER-GROUP RIVALRIES (individual disputes, schools, sports teams)
NIHILISM/VANDALISM
DIVERSION TO COVER COMPROMISE/DATA EXFILTRATION
ONLINE GAMBLING-RELATED
FINANCIAL MARKET MANIPULATION
MISCONFIGURATION/ACCIDENTAL
FLASH CROWDS
INTRA-CRIMINAL DISPUTES
CRIMINAL EXTORTION ATTEMPT
SOCIAL NETWORKING-RELATED (IRC, chat networks, Facebook, Twitter, Google+)
COMPETITIVE RIVALRY BETWEEN BUSINESS ORGANIZATION
0% 10% 20% 30% 40% 50% 60% 70%
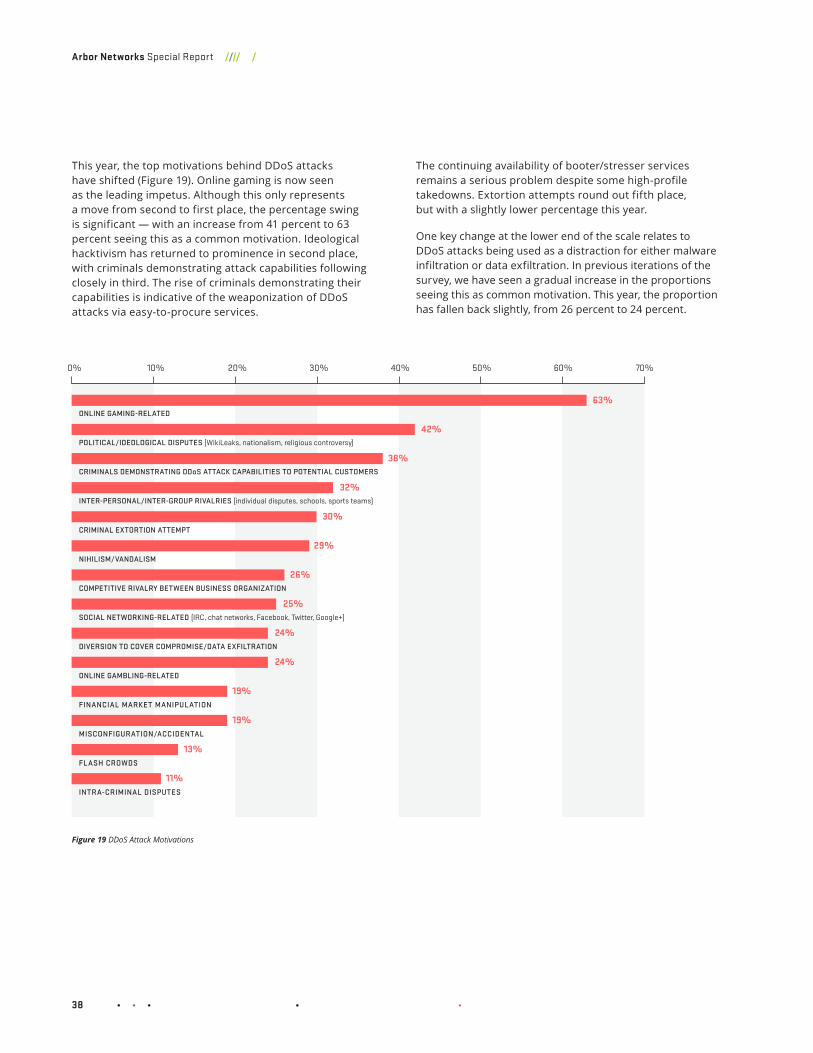
This year, the top motivations behind DDoS attacks have shifted (Figure 19). Online gaming is now seen as the leading impetus. Although this only represents a move from second to first place, the percentage swing is significant — with an increase from 41 percent to 63 percent seeing this as a common motivation. Ideological hacktivism has returned to prominence in second place, with criminals demonstrating attack capabilities following closely in third. The rise of criminals demonstrating their capabilities is indicative of the weaponization of DDoS attacks via easy-to-procure services.
The continuing availability of booter/stresser services remains a serious problem despite some high-profile takedowns. Extortion attempts round out fifth place, but with a slightly lower percentage this year.
One key change at the lower end of the scale relates to DDoS attacks being used as a distraction for either malware infiltration or data exfiltration. In previous iterations of the survey, we have seen a gradual increase in the proportions seeing this as common motivation. This year, the proportion has fallen back slightly, from 26 percent to 24 percent.

39
Worldwide Infrastructure Security Report
Last year, we reported a massive increase in the proportion seeing DDoS attacks targeting IPv6 services, up to 9 percent from just 2 percent in 2014. This year, we see another significant increase, with 13 percent indicating they have indeed witnessed IPv6 attacks (Figure 20).
Source: Arbor Networks, Inc.
IPv6 DDoS Attacks
Not Applicable23%
No64%
Yes13%
IPv6 DDoS Attacks
Figure 20 IPv6 DDoS Attacks
39
—This year we see another significant increase in the number of respondents who have witnessed IPv6 attacks.
39

Arbor Networks Special Report
40
—
Arbor Networks Special Report
DDoS THREAT MITIGATIONIt is encouraging to see that many more respondents (83 percent) are using intelligent DDoS mitigation systems (IDMS) to mitigate attacks this year. Respondents indicated a marked decrease in the use of limited solutions such as firewalls and load balancers, which is also positive.
The proportion able to mitigate attacks in less than 20 minutes has increased once again this year to 77 percent, up from 74 percent last year and 68 percent the year before.
The trend of increased interest in DDoS detection and mitigation services continues this year with 78 percent of service providers seeing more demand from customers, up 4 percent over last year. Government and finance are the number one and two verticals driving demand this year.
77% Respondents able to mitigate attacks in less than 20 minutes
78% Service providers seeing increased demand for DDoS detection and mitigation
40

41
Worldwide Infrastructure Security Report
Respondents indicated a marked decrease in the use of less effective solutions such as firewalls and load balancers.
Respondents continue to evolve their strategies to mitigate DDoS attacks, and this year’s results are very encouraging (Figure 21). IDMS usage has increased considerably to reach a new high of 83 percent, a significant jump over last year. Additionally, respondents indicated a marked decrease in the use of less effective solutions such as firewalls and load balancers. Specifically, the use of firewalls for DDoS mitigation dropped from 43 percent last year to only 28 percent this year. The use of load balancers fell even more precipitously, from 27 percent to just 8 percent. Collectively, these statistics indicate a very positive trend in the application of surgical mitigation technologies.
Last but certainly not least, the proportion of respondents using destination-based blackhole to mitigate attacks has increased — representing another encouraging note. In fact, D/RTBH has moved into second place at 55 percent.
Figure 21 Attack Mitigation Techniques
0% 10% 20% 30% 40% 50% 60% 70% 80% 90% 100%
Source: Arbor Networks, Inc.
Attack Mitigation Techniques
83%
55%
52%
28%
26%
16%
15%
13%
10%
8%
3%
4%
INTELLIGENT DDoS MITIGATION SYSTEMS (IDMS) (Arbor Peakflow or Pravail APS)
DESTINATION-BASED REMOTE TRIGGERED BLACKHOLE (D/RTBH)
ACCESS CONTROL LISTS (ACLS)
FIREWALL (including WAF, Next Gen)
IPS
CONTENT DELIVERY NETWORK (CDN)
LOAD-BALANCER
NONE
OTHER
SOURCE-BASED REMOTE TRIGGERED BLACKHOLE (S/RTBH)
MANAGED SECURITY SERVICE PROVIDER
FLOWSPEC

Arbor Networks Special Report
42
Once again, the proportion able to mitigate attacks in less than 20 minutes has increased — reaching 77 percent this year, up from 74 percent last year and 68 percent the year before (Figure 22). Furthermore, the use of automatic mitigation has risen to 27 percent this year, compared with only 22 percent last year. This demonstrates a continued increase in the use of integrated tools and automation within the customer environment. Average attack durations remain relatively short for DDoS attacks, so service providers have a brief time to act when protecting their customers. Overall, mitigation reaction times are continuing to improve.
Forty-six percent do not detect outbound or cross-bound attacks at all (Figure 23). This is slightly higher than last year and continues to indicate a general lack of visibility in this area. This is a concern, as these attacks can still impact customer aggregation routers, peering and transit capacity. Ideally, organizations should detect and deal with outbound and cross-bound attacks in the same way as inbound attacks.
Interest in DDoS detection and mitigation services continues to grow, with 78 percent of service providers seeing more demand from customers, up 4 percent over last year (Figure 24). A small number indicated less demand for DDoS detection and mitigation services this year, but this may be a result of competing services taking this market share.
Source: Arbor Networks, Inc.
Time to Mitigate
Automatically through scripts/tools
Less than 10 minutes
More than 10 minutes but less than 20 minutes
More than 20 minutes but less than 30 minutes
More than 30 minutes
17%
9%
11%
27%
33%
Figure 22 Time to Mitigate
Time to Mitigate
Source: Arbor Networks, Inc.
Outboud/Cross-Bound Attack Duration
Less than 10%
10–20%
21–50%
More than 50%
We do not monitor outbound or cross-bound attacks
46%
4%
14%
4%
32%
Outbound/ Cross-Bound
Attack Detection
Figure 23 Outbound/Cross-Bound Attack Detection
Figure 24 Demand for DDoS Detection/ Mitigation Services
Demand for DDoS Detection/Mitigation Services
19% The same demand from customers
3% Reduced demand from customers
78% Increasing demand from customers

43
Worldwide Infrastructure Security Report
The survey drilled into the demand for managed DDoS services in more detail to try and establish which verticals are driving the increase (Figure 25). Government and finance take the number one and two positions respectively this year. Interestingly, the proportion citing demand from cloud/hosting companies has dropped 12 percent. This may indicate that these organizations already have solutions in place, given how frequently they are targeted. Thirty-eight percent cited the education vertical driving demand, up from 25 percent last year. This may be due to the growth of online testing in schools.
—Overall, we see an increase in demand across virtually all verticals compared to last year. This indicates that organizations, regardless of their business focus, are now very aware of the DDoS threat and are looking to reduce the risk that they will be the victims of a successful attack.
Figure 25 Business Verticals for DDoS Services
Business Verticals for DDoS Services
62% Financial
63% Government
32% Gaming
21% Healthcare
38% Education
22% Media
20% Small/Medium Business
18% Retail
43% Cloud/Hosting Providers
44% eCommerce
13% Law Enforcement
13% Utilities
10% Gambling
6% Social Networking
43
Worldwide Infrastructure Security Report

Arbor Networks Special Report
44
Arbor Networks Special Report
DATA CENTER OPERATORS—For the first time, this year’s survey asked respondents about the types of services that their data center environments offer. Almost two-thirds of respondents operate managed hosting, co-location and public/private cloud services. The fact that cloud is as common as co-location and managed hosting demonstrates how rapidly data centers are adopting cloud-based data and application services.
Sixty percent witnessed DDoS attacks targeting their data centers, up from 55 percent last year. Once again, attack frequency increased substantially this year, with 21 percent seeing more than 50 attacks per month versus only 8 percent last year. Almost a quarter reported the cost of a major DDoS attack at above $100K, and 5 percent cited costs of over $1M — illustrating the importance of a good DDoS protection strategy.
More than 60 percent experienced attacks that totally saturated data center bandwidth, up from 33 percent in 2014. As with last year, customers are the top target and service infrastructure is second.
The ways companies approach DDoS protection continue to evolve, with both good and bad indicators within the survey data. The proportion of respondents using layered intelligent DDoS protection has increased from 51 percent to 56 percent. The proportions using OoB management networks and uRPF have also increased — from 44 percent to 52 percent, and from 40 percent to 48 percent respectively. The proportion of respondents using firewalls for DDoS defense has fallen from 71 percent to 40 percent, a huge (and very encouraging) drop.
2014 33%2015 50%
2016 61%
Reported DDoS attacks that completely saturated bandwidth to the data center
FIVE PERCENT cited costs of over $1,000,000, illustrating how important a DDoS protection strategy is.
$1,000,000
$100,000TWENTY-FIVE PERCENT reported the cost of a major DDoS attack at above $100,000.
44

45
Worldwide Infrastructure Security Report
Visibility and security go hand in hand.
Worryingly, the proportion with no visibility of intra-data-center and outbound traffic increased from 5 percent last year to 20 percent this year (Figure 27). This number bears watching, as it could be a result of deploying new data center technologies that offer less visibility than traditional technologies. An encouraging sign is the sharp increase in those reporting a good baseline of normal operations, up from 41 percent to 68 percent.
Data center operators use a combination of technologies at their perimeters to defend themselves (Figure 28). The most popular technologies continue to be firewalls, IDS/IPS and application firewalls. The proportion utilizing firewalls and application firewalls has remained fairly consistent. However, IDS/IPS use has dropped significantly from 67 percent to 51 percent.
What is most concerning here is the drop in respondents using iACLs and IDMS solutions. The use of iACLs has dropped from 46 percent to 27 percent, a level slightly lower than that seen in 2014. And, the use of IDMS has decreased from 48 percent to 29 percent, a significantly lower level than the 45 percent seen in 2014 — but still much higher than the 6 percent of 2013. The reduction in use of iACLs and IDMS is a key concern, as both of these stateless techniques are key to dealing successfully with DDoS attacks. This drop-off may be due to a shift towards cloud DDoS mitigation services as the primary means of DDoS protection.
This year, there is mixed news regarding data center traffic visibility (Figure 26). As in previous years, around three-quarters have visibility into their data centers at Layers 3 and 4. However, there has been a significant drop in those with Layer 7 visibility — from 44 percent last year to 21 percent this year.
Data Center Visibility
YES Layer 3/4 OnlyYES Layer 7
NO
Figure 26 Data Center Visibility
12%
21%
77%
Figure 27 Data Center Traffic Visibility
Source: Arbor Networks, Inc.
Data Center Traffic Visibility
Baseline of normal operations
Detection of compromised devices
Service assurance
None
68%
5%
20%
7%
Source: Arbor Networks, Inc.
Data Center Traffic Visibility
Baseline of normal operations
Detection of compromised devices
Service assurance
None
68%
5%
20%
7%
Data Center Traffic Visibility
0%
60%
40%
20%
80%
100%
Source: Arbor Networks, Inc.
Data Center Perimeter Security Technologies
Firewalls
IDS/IPS
Application firewalls
Intelligent DDoS mitigation system (IDMS)
iACL
UTM
Sandboxing system
83%
51%
49%
29%
27%
15%
27%
Figure 28 Data Center Perimeter Security Technologies

Arbor Networks Special Report
46
Source: Arbor Networks, Inc.
Data Center DDoS Attack Frequency
51–10011%
101–5004%500+7%
21–5015%
11–2022%
1–1041%
Source: Arbor Networks, Inc.
Data Center Service Impacting DDoS Attacks
51–1009%
Not Applicable9%
21–509%
11–2017%
1–1057%
Data Center DDoS Attack
Frequency
Data Center Service Impacting
DDoS Attacks
Sixty percent saw attacks targeting their data centers, up from 55 percent last year. DDoS attack frequency continues to rise, with 36 percent witnessing between 11 and 50 attacks per month, up from 22 percent last year (Figure 29). Twenty-one percent experienced more than 50 attacks per month versus only 8 percent last year.
This year, we added a survey question to establish how many DDoS attacks our respondents have seen that actually affected their services (Figure 30). Nearly three-quarters saw between 1 and 20 attacks during the survey period that impacted service, emphasizing the importance of appropriate DDoS protection.
Looking at the business impact of DDoS attacks on our data center respondents, the results are similar to last year, with operational expense being the most common (Figure 31). The proportion experiencing revenue loss is also up, from 33 percent to 42 percent.
Figure 29 Data Center DDoS Attack Frequency
Figure 30 Data Center Service Impacting DDoS Attacks
Figure 31 Data Center DDoS Business Impact
Data Center DDoS Business Impact
80%
70%
60%
50%
40%
30%
20%
10%
0%
Source: Arbor Networks, Inc.
Operational expense
Revenue loss
Customer churn
Employee turnover
Stock price fluctuation
71%
42%
33%
17%
8%

47
Worldwide Infrastructure Security Report
This year, we also added a survey question to try and quantify the cost of major DDoS attacks (Figure 32). More than 23 percent indicated the cost of a major DDoS attack at above $100K, and 5 percent cited the cost at over $1M — illustrating how important it is for organizations to put the right protections in place.
This year’s respondents reported a steady increase in attacks that completely saturated the bandwidth available to the data center. Two years ago, only a third of respondents experienced this. Last year, it was a half. This year, we are up to 61 percent. This ties in with the increase in size and frequency of large attacks documented elsewhere in this report.
To protect the data center from attacks that completely saturate bandwidth, data center operators need to utilize DDoS protection services offered by cloud, service-provider or other upstream networks. It is, therefore, no surprise that cloud/hosting providers are one of the top four organization types expressing interest in DDoS detection/mitigation services from their service providers (see DDoS section). Attacks of this nature can have a huge and costly impact, as they can impact ALL customers, rather than just a specific target.
In terms of DDoS attack targets within the data center, this year’s results are almost identical to last year’s (Figure 33). Customers remain the top target, with data center service infrastructure in second place. Looking in detail at the results, the proportion of respondents seeing attacks targeting customers has dropped 6 percent, but there have also been 6 percent increases in attacks targeting both service and network infrastructure.
Source: Arbor Networks, Inc.
Data Center DDoS Cost
Less than $10,000
$10,000–$25,000
$26,000–$50,000
$51,000–$100,000
$100,000–$1,000,000
More than $1,000,000
18%
5%
9%
5%
18%
45%
Data Center DDoS Cost
Figure 32 Data Center DDoS Cost
Figure 33 Data Center DDoS Targets
Source: Arbor Networks, Inc.
Data Center DDoS Targets
0% 10% 20% 30% 40% 50% 60% 70%
INBOUND ATTACK, DATA CENTER MANAGED HOSTING OR CO-LOCATION CUSTOMER
INBOUND ATTACK, DATA CENTER SERVICE INFRASTRUCTURE ( cloud, web, DNS, SMTP)
INBOUND ATTACK, DATA CENTER INFRASTRUCTURE ( routers, firewalls, load balancers)
OUTBOUND ATTACK, GENERATED FROM SERVERS WITHIN THE DATA CENTER TO EXTERNAL HOST
CROSSBOUND ATTACK ( customer to customer)
56%
40%
64%
28%
12%

Arbor Networks Special Report
48
Data center operators continue to use multiple different technologies and services to protect themselves and their customers from DDoS attack (Figure 34), and the results this year are very positive. The proportion using layered intelligent DDoS protection has increased from 51 percent to 56 percent. The proportions using OoB management networks and uRPF have also increased — from 44 percent to 52 percent, and from 40 percent to 48 percent respectively. The proportion using firewalls for DDoS defense has fallen from 71 percent to 40 percent, a huge (and very encouraging) drop. These are very positive statistics indicating that data center operators are doing the right things to protect themselves from the DDoS threat.
There is, however, some less positive news. The proportion using IDS/IPS has increased from 44 percent to 48 percent, while the proportion using iACLs has dropped from 52 to 44 percent. It is very disappointing to see the reduced use of iACLs, as these allow organizations to use network infrastructure to strip away unwanted traffic very efficiently.
As mentioned above, the drop in the use of firewalls is encouraging, as they can often be targeted or affected directly by DDoS attacks. IDS/IPS devices have a similar issue, which explains the negative statement above around their increased use. This year, 43 percent have seen firewalls or IPS/IDS experience or contribute to an outage during a DDoS attack, illustrating the peril of relying on these devices for DDoS protection.
Many data center operators are leveraging their investments in infrastructure protection to offer DDoS protection services to their customers. Forty percent offer DDoS protection as an additional service, with 12 percent offering multiple tiers of service. Increasingly, customers are looking for availability protection when they procure cloud services. By providing tiered services, data center operators can provide a low-cost service to attract many customers and then upsell more sophisticated services for a premium.
Figure 34 Data Center DDoS Protection Technologies
0% 10% 20% 30% 40% 50% 60% 70% 80%
Source: Arbor Networks, Inc.
Data Center DDoS Protection Technologies
60%
56%
52%
48%
48%
44%
44%
40%
40%
32%
20%
DATA CENTER BACKBONE/PERIMETER INTELLIGENT DDoS MITIGATION SYSTEMS (IDMS) (Arbor Peakflow SP/TMS or Pravail APS)
LAYERED INTELLIGENT DDoS MITIGATION SYSTEMS (IDMS) (Arbor Peakflow SP/TMS and Pravail APS)
SEPARATE PRODUCTION AND OUT-OF-BAND (OOB) MANAGEMENT NETWORKS
IPS/IDS
INTERFACE ACLs (iACLS) ON NETWORK EDGE
FIREWALLS
SOURCE-BASED REMOTE TRIGGERED BLACKHOLE (S/RTBH)
FLOWSPEC ON GATEWAY OR ACCESS ROUTERS
UNICAST REVERSE-PATH FORWARDING (uRPF) AND/OR OTHER ANTI-SPOOFING MECHANISMS
CLOUD-BASED DDoS MITIGATION SYSTEM OR SERVICE
DESTINATION-BASED REMOTE TRIGGERED BLACKHOLE (D/RTBH)

49
Worldwide Infrastructure Security Report
49
Worldwide Infrastructure Security Report
—Enhanced security starts with visibility. Mobile operators have been making investments that have driven an across-the-board increase in visibility capabilities. This year’s survey saw growth in both the detection of compromised subscriber devices as well as visibility at Layers 3/4 and 7.
Mobile operators are reporting large increases in DDoS attacks targeting their mobile infrastructure/users as well as the Gi/SGi interface.
MOBILE NETWORK OPERATORS

Arbor Networks Special Report
50
We asked mobile operators whether they have seen any security incidents on their networks that led to a customer-visible outage. One-third of respondents indicated that this was the case. Customer-visible outages lead to greater call-center activity, higher costs and increased customer churn — none of which are desirable in the competitive mobile service market.
One potential source of incidents is compromised devices on the mobile network. Thirty-seven percent of this year’s respondents can detect compromised user devices, up from 27 percent last year. This improvement in the detection capabilities of mobile providers represents an ongoing positive trend.
Looking at the percentage of compromised subscribers participating in botnets, an increasing proportion of mobile operators reported a higher level (Figure 36). Last year, the majority of respondents indicated that less than 5 percent of their subscribers were compromised. This year, that proportion dropped to 37 percent. Interestingly, 16 percent reported that none of their subscribers have been compromised. This is very unlikely given current trends, and possibly reflects a lingering lack of visibility on the part of these respondents.
Looking more specifically at the DDoS threat to mobile operators, 74 percent have seen attacks targeting their mobile infrastructure/users. This is up from 68 percent last year, which in itself was a massive increase (Figure 37). Twenty-six percent indicated that they are seeing over 20 attacks per month.
This year, 70 percent of our mobile operator respondents have more than 1M subscribers, down from 82 percent last year (Figure 35).
Figure 35 Mobile Subscribers
Figure 36 Compromised Subscribers Source: Arbor Networks, Inc.
Mobile Subscribers
Less than 1 million
1–5 million
6–10 million
11–25 million
26–50 million
51–100 million
Over 100 million
30%
13%
13%
26%
4%
9%
4%
Source: Arbor Networks, Inc.
Compromised Subscribers
None
1–5%
6–10%
11–25%
26–50%
Do not know
16%
21%
16%5%
5%
37%
Source: Arbor Networks, Inc.
Mobile Subscribers
Less than 1 million
1–5 million
6–10 million
11–25 million
26–50 million
51–100 million
Over 100 million
30%
13%
13%
26%
4%
9%
4%
Source: Arbor Networks, Inc.
Compromised Subscribers
None
1–5%
6–10%
11–25%
26–50%
Do not know
16%
21%
16%5%
5%
37%
Mobile Subscribers
Compromised Subscribers
Figure 37 DDoS Attacks Per Month Targeting Mobile Infrastructure/Users
DDoS Attacks Per Month Targeting Mobile Infrastructure/Users
ATTACKS
0
1–10
11–20
21–50
51–100
101–500
500+
%
26%
21%
26%
5%
11%
5%
5%
50

51
Worldwide Infrastructure Security Report
Last year, 15 percent of mobile operator respondents saw DDoS attacks generated by mobile users. This year, the proportion has increased to 21 percent. This problem is only likely to get worse, as more mobile devices (including growing numbers of IoT devices) are becoming compromised and being used to carry out DDoS attacks on mobile networks.
The proportion of mobile operators mitigating outbound attacks has increased substantially. Just over one-quarter of this year’s respondents can now mitigate these attacks, up from 9 percent last year, with just over one-third more planning to start within the next year. For mobile operators, this is not just about being good citizens, as DDoS attack traffic consumes valuable resources on the Gi/SGi interface.
The Gi/SGi interface is a critical part of any mobile operator’s network, and visibility here is key (Figure 38). This year, nearly half reported having visibility at Layers 3/4, up from 41 percent last year. Thirty-five percent have visibility at Layer 7, a big increase from last year’s 22 percent. Increased visibility is a step forward.
When it comes to DDoS attacks targeting the Gi/SGi interface, 72 percent of mobile operator respondents have seen such attacks, up from 59 percent last year. The proportion seeing more than 20 attacks per month has jumped from 28 percent last year to 33 percent this year (Figure 39).
Increased visibility is a step forward.
Figure 39 DDoS Attacks Per Month Targeting (Gi/SGi) IP Infrastructure
Figure 38 Visibility at IP (Gi/SGi) Backbone
DDoS Attacks Per Month Targeting (Gi/SGi) IP Infrastructure
0
28%
ATTACKS
%
51–100
5%
11–20
22%
1–10
17%
500+
11%
21–50
17%
Source: Arbor Networks, Inc.
Visibility at IP (Gi/SGi) Backbone
0% 10% 20% 30% 40% 50%
YES Layers 3/4
YES Layer 7
NO
35%
29%
47%
12% in 2015
21% in 2016
DDoS attacks generated by mobile users.
51

Arbor Networks Special Report
52
For the last two years, we have separated the IPv6 survey into two sections: one for service provider organizations, and the other for enterprise, government and education (EGE) organizations. This enables us to gain better insight into how different sectors deploy IPv6 technology, and to compare and contrast the different approaches.
This year, we have seen considerable growth in the proportion of service providers that have deployed or plan to deploy IPv6 within their networks, up 10 percent to 78 percent. This is in line with the growth in IPv6 traffic volume and connectivity observed across the Internet.
IPv6—
Looking at IPv6 usage, the proportion of business customers has climbed to 84 percent from 80 percent last year (Figure 40). The proportion of subscribers using IPv6 has increased slightly to 73 percent (Figure 41). In general, the adoption of IPv6 for subscribers has been slowly increasing over the past few years.
Source: Arbor Networks, Inc.
Business Customer IPv6 Service Usage
51–754%
26–5013%
None, we do not offer IPv6 service to business customers
16%
1–2564%
76–1003%
Figure 40 Business Customer IPv6 Service Usage
Business Customer IPv6 Service Usage
Source: Arbor Networks, Inc.
Subscriber IPv6 Usage
51–755%
26–5014%
None, we do not offer IPv6 service to business customers
27%
1–2551%
76–1003%
Figure 41 Subscriber IPv6 Usage
Arbor Networks Special Report
Subscriber IPv6 Usage
52

53
Worldwide Infrastructure Security Report
With the increase in IPv6 traffic seen in most service provider networks, IPv6 traffic visibility has taken on added importance. However, this year’s survey shows a 10 percent decrease in the proportion of service providers with good IPv6 visibility into their networks, down to about 60 percent.
Although the percentage having IPv6 visibility has dropped, the proportion of respondents with the ability to generate IPv6 flow telemetry has risen from 43 percent last year to 53 percent this year (Figure 42). The increase in IPv6 flow telemetry support should enable more service providers to leverage their networking equipment for better IPv6 traffic visibility.
0%
40%
30%
20%
10%
50%
60%
Source: Arbor Networks, Inc.
IPv6 Flow Telemetry
Yes, fully supported today
Will soon, they will support Flow for IPv6 in the next 12 months
New hardware, supported but on new hardware only
Partial, some vendors support IPv6 flow telemetry today, some do not
No, support is on a long-term roadmap (greater than 1 year)
No, will not support
5%
1%
12%
19%
11%
53%
Figure 42 IPv6 Flow Telemetry
This year, the peak IPv6 network traffic level reported by a respondent was 6 Tbps, a 20 percent increase over last year. When asked about future IPv6 traffic growth, the result is quite different from last year (Figure 43). Almost 14 percent project no traffic growth, and only around 35 percent expect a 20 percent growth rate. This is down from last year’s 47 percent.
Source: Arbor Networks, Inc.
Anticipated IPv6 Traffic Growth
No growthexpected
14%
19%
3% 3% 3%
20% growthexpected
40% growthexpected
60% growthexpected
80% growthexpected
100% growthexpected
Do notknow
Other
40%
35%
30%
25%
20%
15%
10%
5%
0%
5%
18%
35% As usual, the growth rates anticipated
by our respondents seem to contradict
empirical evidence, which shows IPv6
traffic volumes growing relatively quickly.
Figure 43 Anticipated IPv6 Traffic Growth

Arbor Networks Special Report
54
IPv6 Security Concerns
80%
70%
60%
50%
40%
30%
20%
10%
0%
Source: Arbor Networks, Inc.
Traffic floods/DDoS
Botnets
Misconfiguration
Visibility, cannot see the data today
Inadequate IPv4/IPv6 feature parity
Host scanning
Stack implementation flaws
Subscribers using IPv6 to bypass application rate limiting
Other
1%
22%24
%27%
72%
42%
39%
33%
33%
Figure 44 IPv6 Security Concerns
When asked about the security concerns of operating IPv6-enabled networks, DDoS and botnets are both top of mind among respondents (Figure 44). Seventy-two percent are concerned with IPv6 DDoS, a slight drop from 75 percent last year, while concerns around botnets also decreased slightly to 42 percent.
Intelligent DDoS mitigation systems (IDMS) remain the first choice in DDoS mitigation measures deployed by service providers against IPv6 attacks (Figure 45). The percentage has increased from 67 percent last year to 76 percent this year. Destination-based remote-triggered blackhole has also gained popularity at 54 percent. In addition, the use of FlowSpec as a mitigation measure has increased to 37 percent this year, up 10 percent.
IPv6 Mitigation Capabilities
80%
70%
60%
50%
40%
30%
20%
10%
0%
Source: Arbor Networks, Inc.
Intelligent DDoS mitigation systems (IDMS) such as Arbor TMS
Destination-based remote triggered blackhole (D/RTBH)
Source-based remote triggered blackhole (S/RTBH)
FlowSpec
Access control lists (ACLs)
No plans to mitigate IPv6
Other
2%
5%
76%
54%
27%
37%
49%
Figure 45 IPv6 Mitigation Capabilities

55
Worldwide Infrastructure Security Report
55
Worldwide Infrastructure Security Report
SDN/NFVCompared to the responses gathered from last year’s survey, we have seen a surprising decrease in the implementation of SDN/NFV technologies in the ISP environment (Figure 46). This year, only 9 percent of service provider respondents have already deployed SDN/NFV technologies in their production network, and around 27 percent are investigating or testing these technologies. Both these numbers are lower than those reported in last year’s survey (11 percent and 39 percent respectively). Thirty-eight percent have no plans to implement SDN or NFV in the next few years.
Figure 46 SDN/NFV Deployment
—Over the past few years, SDN/NFV has been one of the hot topics in the ISP environment. This report has been tracking the development and interest in SDN/NFV from the ISP perspective for two years.
Source: Arbor Networks, Inc.Source: Arbor Networks, Inc.
SDN/NFV Deployment
0% 10% 20% 30% 40%
NO
WE ARE INVESTIGATING/TRIALING NOW
PLAN TO IMPLEMENTIN NEXT YEAR
PLAN TO IMPLEMENT IN NEXT 2+ YEARS
WE ARE IN PRODUCTION
38%
27%
13%
13%
9%

Arbor Networks Special Report
56
We asked service providers to identify the barriers to deploying these technologies (Figure 47). Among the responses, operational concerns is the number one barrier at 53 percent, followed by cost at 45 percent and interoperability at 41 percent. These results are similar to last year.
Regarding network locations where SDN/NFV technologies are seeing the most interest, the data center is still the leader (Figure 48). However, this percentage has dropped to 63 percent this year from 75 percent last year. We have seen significant growth among service providers interested in deploying SDN/NFV within fixed-line services compared to last year. In addition, survey results clearly indicate that service providers are increasingly deploying SDN/NFV technologies to support both value-added services for the data center and virtual CPE (for example, as a firewall, IPS, etc.).
Source: Arbor Networks, Inc.
SDN/NFV Key Barriers
PERFORMANCE CONCERNS
SECURITY CONCERNS
COST
INTEROPERABILITY
SCALABILITY
OPERATIONAL CONCERNS
VENDOR SUPPORT
STABILITY
BUSINESS SUPPORT SYSTEM (BSS) INTEGRATION
TELEMETRY ACQUISITION
OTHER
53%
45%
41%
39%
39%
37%
34%
32%
31%
5%
6%
0% 10% 20% 30% 40% 50% 60%
Source: Arbor Networks, Inc.
SDN/NFV Network Domains
Data centerinfrastructure
63%
Virtual CPE value-addedservice infrastructure
(firewalls, IPS)
47%
Data center value-addedservice infrastructure
(firewalls, IPS)
Fixed line serviceproviding network
infrastructure
Mobile networkinfrastructure
45% 44%25%
Figure 47 SDN/NFV Key Barriers
Figure 48 SDN/NFV Network Domains
This could imply that we have not seen a significant breakthrough in these key areas, and that SDN/NFV deployment has not yet become mainstream.

57
Worldwide Infrastructure Security Report
This year’s survey asked service providers about the specific NFV orchestration/management technologies they use (Figure 49). A variety of open source, vendor and in-house solutions seem to be in play. Among those respondents who have settled on a single solution, OpenStack Heat, Cisco NSO and NETCONF/YANG are the top three.
When we asked service providers about SDN technologies and controllers, OpenFlow is a clear leader (Figure 50). Rounding out second and third place are NETCONF/YANG and Juniper Contrail respectively.
Lastly, we asked service providers which service function chaining mechanisms they have deployed or plan to deploy (Figure 51). SDN controllers are the top choice, with VXLAN and VLAN bringing up second and third place respectively.
0%
30%
20%
10%
40%
50%
Source: Arbor Networks, Inc.
SDN Technologies
OpenFlow
NETCONF/YANG
Juniper
OpenDaylight
ONOS
Nokia Nuage
Other
39%
18%
14%
8%
4%
14%
Figure 50 SDN Technologies
Figure 51 Service Function Chaining
Source: Arbor Networks, Inc.
NFV Technologies
OPENCONFIG
CLOUDIFY
CISCO NSO
NETCONF/YANG
OPENSTACK HEAT
VMWARE VREALIZE
OPENSTACK TACKER
NOKIA CLOUDBAND
OTHER
17%
15%
14%
13%
10%
5%
4%
2%
20%
0% 5% 10% 15% 20% 25% 30%
Figure 49 NFV Technologies
32%SDN controller-managed
26% VXLAN
21% VLAN
14% Networks Service Header (NSH)
14% Other
Service function chaining mechanisms

Arbor Networks Special Report
58
Arbor Networks Special Report
ORGANIZATIONAL SECURITY—This year, authentication for BGP, use of out-of-band management networks and use of iACLs to block illegitimate traffic at network borders have all experienced a decline among service provider respondents. However, the proportion of service providers implementing anti-spoofing filters has increased slightly.
Fifty-seven percent carry out DDoS defense simulations, up from 46 percent last year, one of the highest levels in the last four surveys. Even more encouraging is that 38 percent make time for incident response rehearsal at least quarterly.
Unfortunately, the proportion of respondents monitoring for route hijacks has decreased to 29 percent, from 54 percent last year. Participation in global OPSEC groups has also dropped dramatically, to the lowest level in the last three years.
57% Service providers carry out DDoS defense simulations in 2016
38% Service providers make time for incident response rehearsal at least quarterly
58

59
Worldwide Infrastructure Security Report
Only 87 percent of service provider respondents have at least some dedicated security personnel this year (Figure 52) — a significant drop from 95 percent last year. On a more positive note, 25 percent have teams of 30 or more people, compared to only 15 percent for enterprise, government and education (EGE) respondents.
In this section, we asked a broad range of questions on infrastructure security best practices. The results show that service providers are implementing best practices in varying degrees. Last year, we reported an increase in those implementing security infrastructure best practices. That trend has reversed itself (Figure 53). Last year’s top methodologies — authentication for BGP, use of out-of-band management networks and use of iACLs to block illegitimate traffic at network borders — all declined this year.
Figure 52 Dedicated Security Personnel
Source: Arbor Networks, Inc.
Dedicated Security Personnel
0
1–5
6–10
11–15
16–20
21–30
30+
35%
13%
2%
4%
10%
11%
25%
Source: Arbor Networks, Inc.
Dedicated Security Personnel
0
1–5
6–10
11–15
16–20
21–30
30+
35%
13%
2%
4%
10%
11%
25%
Dedicated Security
Personnel
Figure 53 Security Best Practices
0% 10% 20% 30% 40% 50% 70%60%
Source: Arbor Networks, Inc.
Security Best Practices
62%
58%
54%
52%
48%
46%
38%
29%
25%
21%
20%
4%
AUTHENTICATION FOR BGP, IGPS (MD5, SHA-1)
EXPLICITLY FILTER ROUTES ANNOUNCED BY CUSTOMERS
iACLS AT NETWORK EDGES
SEPARATE OUT-OF-BAND (OOB) MANAGEMENT NETWORK OR DATA COMMUNICATION NETWORK (DCN)
EXPLICITLY FILTER ROUTES ANNOUNCED BY BGP PEERS
IRR ROUTE REGISTRATION OF CUSTOMER PREFIXES
BLOCK KNOWN BOTNET COMMAND-AND-CONTROL SERVERS, MALWARE DROP SERVER, ETC.
GENERALIZED TTL SECURITY MECHANISM (GTSM) FOR BGP PEERS
OTHER
BCP38/BCP84 ANTI-SPOOFING AT NETWORK EDGE AND/OR WITHIN DATA CENTER
MONITOR FOR ROUTE HIJACKING
MAINTAIN UP-TO-DATE CONTACTS FOR YOUR PEER, TRANSIT AND/OR CUSTOMER OPSEC TEAMS
On a more positive note, there is continued growth in the adoption of anti-spoofing filters, with nearly half now implementing this best practice. However, given the number of reflection attacks still happening today, we were hoping for a more significant increase. Explicit route filters and other methodologies are also up 10 percent.

Arbor Networks Special Report
60
Successfully dealing with DDoS attacks requires proper training and operational practice. Attack simulations have been proven to greatly improve operator effectiveness when real attacks inevitably occur. We are pleased to see an almost 10 percent growth in organizations that test on a schedule (Figure 54), and an 8 percent drop in organizations that never test. This shows that service providers are taking DDoS incident response more seriously than ever in order to protect their customer’s networks and assets.
Results reveal a significant drop of participation in the global OPSEC community — down to just 26 percent from 41 percent last year. This is a very curious trend, as the OPSEC community has proven to be very helpful during some of the higher profile attacks that took place during the last year.
Lack of resources, difficulty in hiring and OPEX funding are the top challenges faced when building and maintaining an effective OPSEC team (Figure 55). These challenges may be a factor in the drop in OPSEC community outreach as well.
Figure 54 DDoS Simulations
Source: Arbor Networks, Inc.
DDoS Simulations
Daily10%
Weekly6%
Monthly11%
Quarterly10%
Do not do this today, but plan to implement within the next year
14%
Never29%
Yearly19%
DDoS Simulations
0%
30%
20%
10%
40%
50%
Source: Arbor Networks, Inc.
OPSEC Team Challenges
Lack of headcount or resources
Difficulty of hiring and retaining skilled personnel
Operational expenditure (OPEX) funding
Capital expenditure (CAPEX) funding
Lack of management support
Lack of internal stakeholder support
Other
50%
47%
46%
37%
31%
5%
21%
Figure 55 OPSEC Team Challenges

61
Worldwide Infrastructure Security Report
AS
ERT
ASERT Special Report
—
n 2016, a number of highly publicized DDoS attacks used IoT devices to attack websites
and services. These attacks included sustained 540 Gbps attacks against organizations affiliated with an international sporting event in Brazil in August; attacks against security journalist Brian Krebs in September, which peaked at 620 Gbps; and high-profile DDoS attacks against authoritative DNS provider Dyn in November. All were highly effective and persistent. They were performed using botnets consisting of a mix of IoT devices and regular general-purpose computers (PCs).
I
YEAR OF THE IoT BOTNET
540 Gbps Sustained attacks against international sporting event in Brazil
620 Gbps Peak attack size aimed at security journalist Brian Krebs
Arbor’s Security Engineering & Response Team (ASERT) brings a diverse set of expertise, from Fortune 25 Computer Emergency Response Teams (CERTs) to former law enforcement, threat mitigation vendors and well-known malware research organizations. They share operationally viable intelligence with hundreds of international CERTs and with thousands of network operators via intelligence briefs, security content feeds and custom research such as this.
Special thanks to Steinthor Bjarnason for his contributions to this report.

Arbor Networks Special Report
62
AS
ERT
What is the IoT?— According to Wikipedia, the IoT (Internet of Things) is the “internet-working of physical devices, vehicles, buildings, sensors and other items, and network connectivity that enable these objects to collect and exchange data.”1
Connecting devices to networks is nothing new. In 1991, researchers at the University of Cambridge used an IP-enabled webcam to monitor how much coffee remained in the coffee machine located in the old computer laboratory.2
Since then, the number of devices connected to the Internet has increased almost exponentially, already surpassing the number of humans connected to the Internet back in 2008. According to various industry analysts, the number of connected IoT devices is estimated to be approximately six billion in 2016 and at least 20 billion by 2020.
An IoT device (or an embedded device) is essentially a computer with a CPU, memory and network interfaces. Each IoT device is dedicated for a specific role or task.
A FEW EXAMPLES INCLUDE THE FOLLOWING:
01 / WEBCA M
A webcam is a computer with an attached camera and high-speed network interface.
0 2 / WIRELESS ACCESS POINT A wireless access point is a computer with an attached Wi-Fi radio.
0 3 / LIGHTBULB An Internet-enabled lightbulb is a small computer containing a low-powered radio and a relay to turn the light on and off.
0 4 / CPE DE VICE A CPE device is a computer with a number of network interfaces, often converting between fiber/DSL to Ethernet. In many cases, it includes a built-in Wi-Fi radio so it can act as a wireless access point.
0 5 / SM A RT T V A smart TV is a computer with a LARGE display and a number of media interfaces.
The primary difference between an IoT device and a general-purpose computer is that there is no direct interaction with the operating system, the software is usually not updated and they can be online 24x7.
1 en.wikipedia.org/wiki/Internet_of_things
2 en.wikipedia.org/wiki/Trojan_Room_coffee_pot

63
Worldwide Infrastructure Security Report
AS
ERT
IoT Security— The reason why IoT devices are being deployed in such a large scale manner is because they are used to control, monitor and manage almost every piece of technology that we use in our daily lives.
While the typical IoT device has limited capabilities, it must interact with — and be controlled and monitored by — external solutions. To minimize deployment costs, IoT devices are often purposely designed to be easily installed and implemented. Unfortunately, this often results in devices that have limited security capabilities, or in some extreme cases, no security capabilities whatsoever.
THIS CAN MEAN:
01 / Hard-coded usernames
and passwords.
02/ Unnecessary services enabled by default (Chargen, SSDP, DNS forwarder, et al).
03/ Unprotected management services (Web, SNMP, TR-069, et al).
The hardware and software used in a large proportion of current IoT devices come from a very small number of manufacturers based in Asia. In 2014, one of the major manufacturers issued a new software release that solved some of the issues mentioned above. However, these fixes were only made for the English version of the software. The same fixes have still not been released for other languages. This explains why many IoT attacks are coming from countries sharing the same non-English language version of the software.
Once compromised, IoT devices have the potential to become a man-in-the middle. In other words, they can intercept or hijack sessions and data transiting through the device.
However, an even broader issue is that IoT device software is rarely upgraded or patched. Even when software updates are available, users typically do not have the skills needed to install the new software themselves. What’s more, the software rarely has any kind of auto-update capabilities. In some of the more extreme cases, the manufacturer doesn’t even provide a capability to upgrade software on its devices, resulting in millions of unpatched, vulnerable devices connected to the Internet.
In 2009-2010, the Stuxnet worm3 was allegedly used to attack Siemens centrifuge controllers in Iranian nuclear plants using multi-stage, cross-platform vulnerabilities. These vulnerabilities allowed the worm to intercept all communication between the Windows systems and the centrifuge controllers and to access supervisory control and data acquisition (SCADA) databases using a hard-coded database password.
For many years, an increasing number of security researchers have been pointing out that practices such as the use of hard-coded, insecure passwords could lead to serious security issues.
In 2016, all of their predictions came true.
3 en.wikipedia.org/wiki/SCADA
63

Arbor Networks Special Report
64
The Rise of the IoT Botnet— The first bot was created back in 1993, when Robey Pointer created an Internet Relay Chat (IRC) bot called “eggbot” used to manage and protect IRC channels against takeover attempts.4
The bot featured code that allowed multiple bots to share data and act in a coordinated manner when defending against distributed denial of service attacks against the IRC channels. These attacks coined the first use of the term “DDoS” where IRDC DCC and CTCP flooding were used to forcefully remove users from IRC channels. They were also the first recorded instances of application-layer DDoS attacks. In those days, software was usually protected against theft using digital rights management (DRM), and IRC was used to share the software used to break the DRM protection. This coincidentally coined the terms “warez” for cracked software and “0-day” for the first crack capable of breaking the copyright protection.
In 2003, the first unintentional DDoS attack using IoT devices happened due to a flaw in Netgear DSL/cable modems.5 The devices had been hardcoded to use the NTP server for the University of Wisconsin. As more and more devices were deployed (Netgear estimated that 707,147 devices had this flaw), the NTP client traffic destined towards the University increased beyond all reasonable bounds, peaking at 150Mb/250Kpps. The attack was mitigated using ACLs, and Netgear issued a patch for the problem. However, as it was impossible to reach all the owners of these devices, and in some cases customers didn’t update the software on their device, it was decided to ride out the attack — hoping that the devices would eventually go offline as they reached end of life. Looking back, this could be the longest-lasting and largest DDoS attack in the history of the Internet, only dying out when the last device got chucked into the bin.
Until 2013/2014, botnets had primarily consisted of general-purpose computers (PCs) and servers that had been infected by some kind of malware. This allowed bot herders to use the botnets to perform attacks, send spam or meet other nefarious purposes. PCs were popular targets because they were widely available, lacked good protection and had reasonable performance. However, this all changed when PCs began using always-on firewalls, antivirus software and automated updates — making it increasingly difficult to infect PCs unless a 0-day vulnerability could be used.
Until the second half of 2013, most cybercriminals relied on basic traffic flooding to initiate DDoS attacks. More sophisticated attacks had been observed, but only a small number of attackers had the skills required to launch these. When the first booter/stresser services appeared, they made it possible for the less tech-savvy actor to use advanced attacks by simply typing in an IP address and clicking a button. This basically weaponized the more advanced attacks, making them available to the general public. A good analogy is the modern automobile; most people have the skills to drive a car, but only a few have the skills and expertise needed to build one.
The first high-profile DDoS attack using IoT devices that got the attention of the mainstream media happened around Christmas 2013 and was used to interrupt the launch of a prominent game. This attack came from the LizardStresser botnet, consisting primarily of webcams and CPE routers.
IN 2012, AN UNKNOWN RESEARCHER PUBLISHED A REPORT CALLED THE “INTERNET CENSUS OF 2012.”6
The data used in this report was gathered by hacking into an estimated 420,000 CPE devices around the world using default credentials.
AS
ERT
4 en.wikipedia.org/wiki/Eggdrop
5 pages.cs.wisc.edu/~plonka/netgear-sntp/
6 en.wikipedia.org/wiki/Carna_botnet

65
Worldwide Infrastructure Security Report
IN 2016, BOTNET OWNERS BEGAN TO INCREASINGLY USE IoT DEVICES IN THEIR BOTNETS. THE MAIN REASONS FOR THIS SHIFT WERE:
01 / IoT devices are often shipped with default credentials or known security issues.
02/ There are millions of unsecured devices, and new devices come online every day.
03 / IoT devices are online 24x7. Therefore, they are available for use in attacks at any time.
04 / IoT devices are often connected to a high-speed Internet connection, allowing for the generation of large attack volumes.
05/ IoT devices are extremely useful as anonymous proxies, as they are usually unmanaged.
06/ The technology and know-how required to detect, hack and use these devices to perform attacks have been released to the public and are currently used in various booter/stresser services.
AS
ERT7 www.arbornetworks.com/blog/asert/lizard-brain-lizardstresser/
8 krebsonsecurity.com/2016/09/krebsonsecurity-hit-with-record-ddos/
9 krebsonsecurity.com/2016/10/ddos-on-dyn-impacts-twitter-spotify-reddit/
10 thehackernews.com/2016/11/heating-system-hacked.html
Today, the use of IoT devices to perform DDoS attacks is widespread. Consider the following examples:
SUMMER 2016 /During the summer of 2016 in Rio, a botnet using the LizardStresser code with an estimated 10,000 IoT devices (primarily webcams) was used to generate DDoS attacks with a sustained volume of 540 Gbps.7
SEPTEMBER 2016 /In September 2016, a series of DDoS attacks using an estimated number of 14,000 IoT devices were launched against the security reporter Brian Krebs. The attacks lasted for approximately three days, with an estimated traffic volume of up to 620 Gbps.8
OCTOBER 2016 /In October 2016, a number of attacks were made using IoT devices against the authoritative DNS provider Dyn, resulting in outages for various Internet services on the east coast of the USA.9
NOVEMBER 2016 / In November 2016, DDoS attacks were made against the environmental control systems in apartment buildings in Finland, resulting in the systems shutting down and leaving the inhabitants literally in the cold for up to two days.10

Arbor Networks Special Report
66
In November 2016, the source code for the Mirai botnet was made public.11 Mirai is specially designed to infect and control IoT devices and contains the code necessary to manage and build large-scale botnets. Already, various new Mirai variants have been created. One was used in late November 2016 to attack a large service provider in Europe, taking advantage of an NTP server parsing vulnerability in DSL CPEs.
Arbor did a comprehensive threat summary of the Mirai botnet in October 2016. The report is available at www.arbornetworks.com/ blog/asert/mirai-iot-botnet-description- ddos-attack-mitigation/.
Looking farther down the road, most of the IoT devices used in botnets have direct Internet access or allow static or uPnP port-forwarding through NAT. This usually applies to CPE devices or webcams, but there are still hundreds of millions of devices behind NAT that are not reachable directly from the Internet. The current Mirai botnet code scans for Internet-connected devices to infect. It would be simple to adapt the code to scan for internal IoT devices if the compromised device is already behind the NAT gateway or, worst case, is the NAT gateway itself.
This problem could also extend into software defined networking (SDN) solutions that have the potential to simplify network management and decrease deployment costs. In SDN, a centralized controller issues commands to network-enabled devices, controlling their behavior and activity. If care is not taken to secure these deployments, these installations could potentially be subverted into large super-powered botnets.
11 krebsonsecurity.com/2016/10/source-code-for-iot-botnet-mirai-released/
AS
ERT
—Mirai is specially designed to infect and control IoT devices and contains the code necessary to manage and build large-scale botnets.
Arbor Networks Special Report
66

67
Worldwide Infrastructure Security Report
Mitigation— Billions of IoT devices already exist online, with approximately 5.5M more devices added every day.
Even if all IoT vendors suddenly decided to harden their devices and implement proper security measures, all those unsecured devices would still be out there. In addition, some devices simply do not have the hardware or software capabilities to implement security features.
As mentioned earlier, the hardware and software used in a large proportion of current IoT devices come from a very small number of manufacturers based in Asia. Software fixes for a number of issues were only made for the English version of that software in 2014. The same fixes have still not been released for other languages.
Apple HomeKit devices are one noticeable exception. The solution is designed to be secure from the ground up and will use automated software updates. Apple automated software updates have been highly successful for iPhone users — with 60%–70% of all users upgrading within one week.
Looking at best practices for securing IoT devices and defending against DDoS attacks, the following approaches have proven to be successful time after time.
IF YOU HAVE OR USE IoT OR EMBEDDED DEVICES:
Isolate your IoT devices from other services and the Internet. Why would IoT lightbulbs need Internet access?
Find out if your printer needs Internet access. Almost all Chargen reflection DDoS attacks on the Internet use printers that have direct Internet access.
Update the software and firmware on your devices. When did you last update the software on your DVR?
Shut down unnecessary services on your devices. The majority of SSDP reflectors are home CPE routers where SSDP is enabled. Also, DNS reflection attacks often use unsecured CPE devices where DNS forwarding is enabled.
Use devices from manufacturers with a proven record of building secure products, and hold them accountable for the security of their solutions.
Monitor your outgoing bandwidth. Is the reason why your systems are sluggish related to system issues? Or is your WAN router busy launching DDoS attacks?
TAKE THE FOLLOWING STEPS TO PROTECT AGAINST DDoS ATTACKS:
01 / Implement best current practices for ingress filtering.
02/ Isolate management plane traffic from data plane traffic.
03 / Harden devices and shut down unneeded services.
04 / Understand your traffic patterns and know what normal traffic looks like.
05/ Implement layered DDoS mitigation solutions.
AS
ERT

Arbor Networks Special Report
68
AS
ERT
Conclusion— Using embedded network-enabled devices or IoT devices for DDoS attacks is nothing new. The first unintentional DDoS attack using flawed CPEs happened in 2003, and IoT devices have been actively used by attackers since 2010.
In 2016, the number of unsecured IoT devices connected to the Internet reached new heights. Due to the release of IoT malware and booter/stresser services designed to take advantage of IoT vulnerabilities, attacks using IoT devices have become the new norm. Essentially, the number of unsecured IoT devices has reached a critical mass, making them the weapon of choice in the DDoS attacker toolkit.
IoT DEVICES (OR NETWORK-ENABLED DEVICES) ARE BASICALLY SPECIAL PURPOSE COMPUTERS THAT YOU CAN SECURE WITH THE SAME APPROACHES USED IN THE PAST:
01 / Secure the devices themselves. Harden them according to the manufacturers’ guidelines and best practices. Implement authentication and authorization, and ensure that network management protocols are properly separated from data plane traffic.
02/ If the devices cannot be secured as explained above, isolate and segment them from the Internet and other devices. Also, control all device-to-device communication, making sure the devices cannot misbehave.
03/ Follow best practices for defending against DDoS attacks. Such practices have proven successful in the past and will continue to be successful if implemented properly.
04/ Seek help from your service provider or your peering partners. The attacks are getting bigger, and cooperation will be the key to success.

69
Worldwide Infrastructure Security Report
here can be no doubt that IoT botnets have
garnered significant attention through 2016, with numerous large (>200 Gbps) DDoS attacks attributed to them since the attacks that occurred in Brazil during the last Olympic games. Earlier in this report, the issues that make IoT devices ideal targets for building DDoS botnets were discussed.
Infrastructure— To monitor IoT compromise activities, ATLAS has instantiated a network of honeypots around the world within cloud infrastructure. These instances provide presence in Northeast Asia Pacific, Southeast Asia Pacific, Central EU, Western EU, Eastern South America, Eastern U.S. and Western U.S. regions. ATLAS has used multiple honeypot personas to study different aspects of device-compromised behavior.
This section sheds light on how aggressively bad actors are looking for IoT devices to compromise.
THIS SECTION FOCUSES ON TWO PERSONAS:
01 / IoT Easy • Has an open Telnet or SSH port (not both on the same device).• Has a password that is reasonably guessable.• Allows access, and then records activity and analyzes any malware.
02/ IoT Hard As above, with usernames and passwords as per krebsonsecurity.com/wp-content/uploads/2016/10/IoTbadpass-Sheet1.csv.
AT
LA
S
T
IoT BOTNET TRACKING
ATLAS Special Report
—

Arbor Networks Special Report
70
The data shared in this section is a snapshot of the activity observed from November 29 to December 12, 2016.
Throughout this period, the honeypots saw a total of 1,027,543 login attempts, of which 819,198 failed, from a total of 92,317 unique source IP addresses. Overall, we witnessed a peak of 18,054 login attempts per hour during the monitoring period.
Looking at a breakout of attempts across the personas, we can clearly see that Telnet is being targeted more frequently than SSH (Figure AT16). The average rates show the overall trend clearly — 756 versus 2,762 attempts per hour for SSH and Telnet respectively.
Looking at the breakout of unique IP addresses targeting the honeypots, we see a similar trend in activity (Figure AT17).
Login Attempts Per Hour
Unique IPs Per Hour
Source: Arbor Networks, Inc.
Source: Arbor Networks, Inc.
Source: Arbor Networks, Inc.
IoT_easy_ssh
11/30/16 12/01/16 12/02/16 12/03/16 12/04/16 12/05/16 12/06/16 12/07/16 12/08/16 12/09/16 12/10/16 12/11/16 12/12/16
IoT_easy_telnet IoT_hard_ssh IoT_hard_telnet
IoT_easy_ssh IoT_easy_telnet IoT_hard_ssh IoT_hard_telnet
Average Login Attempts Per Hour Per Region
0
2,000
4,000
6,000
8,000
10,000
0
50
100
150
200
250
300
350
400
0
1,000
2,000
3,000
4,000
5,000
0
1,000
2,000
3,000
4,000
5,000
ap_northeast1 eu_central1 eu_west1 ap_southeast1
us_east1 us_west1 us_west2sa_east1
11/30/16 12/01/16 12/02/16 12/03/16 12/04/16 12/05/16 12/06/16 12/07/16 12/08/16 12/09/16 12/10/16 12/11/16 12/12/16
11/30/16 12/01/16 12/02/16 12/03/16 12/04/16 12/05/16 12/06/16 12/07/16 12/08/16 12/09/16 12/10/16 12/11/16 12/12/16
ap_northeast1 eu_central1 eu_west1 ap_southeast1sa_east1 us_east1 us_west1 us_west2
MEA
N: 4
62
MAX
: 3,2
36
MEA
N: 4
16
MAX
: 3,16
9
MEA
N: 3
58
MAX
: 1,9
74
MEA
N: 2
69
MAX
: 1,6
41
MEA
N: 4
83
MAX
: 4,7
52
MEA
N: 3
12
MAX
: 1,8
05
MEA
N: 19
2
MAX
: 2,4
34
MEA
N: 3
28
MAX
: 1,8
81
AT
LA
S
Figure AT17 Unique IPs Per Hour
Figure AT16 Login Attempts Per Hour
Overall Activity—

71
Worldwide Infrastructure Security Report
Regional Focus— A regional breakout of the data shows the variation in the rate of login attempts by geographic area (Figure AT19), with the APAC and South America honeypots seeing higher average and maximum attempt rates. This may be a result of fixes for some IoT vulnerabilities that were only made to English language versions of software. Therefore, regions favoring other languages may be more heavily targeted.
There is also some variation in the frequency of login attempts, with APAC and South America seeing more frequent attempts — more than one per minute, in some cases (Figure AT18).
Login Attempts Per Hour
Unique IPs Per Hour
Source: Arbor Networks, Inc.
Source: Arbor Networks, Inc.
Source: Arbor Networks, Inc.
IoT_easy_ssh
11/30/16 12/01/16 12/02/16 12/03/16 12/04/16 12/05/16 12/06/16 12/07/16 12/08/16 12/09/16 12/10/16 12/11/16 12/12/16
IoT_easy_telnet IoT_hard_ssh IoT_hard_telnet
IoT_easy_ssh IoT_easy_telnet IoT_hard_ssh IoT_hard_telnet
Average Login Attempts Per Hour Per Region
0
2,000
4,000
6,000
8,000
10,000
0
50
100
150
200
250
300
350
400
0
1,000
2,000
3,000
4,000
5,000
0
1,000
2,000
3,000
4,000
5,000
ap_northeast1 eu_central1 eu_west1 ap_southeast1
us_east1 us_west1 us_west2sa_east1
11/30/16 12/01/16 12/02/16 12/03/16 12/04/16 12/05/16 12/06/16 12/07/16 12/08/16 12/09/16 12/10/16 12/11/16 12/12/16
11/30/16 12/01/16 12/02/16 12/03/16 12/04/16 12/05/16 12/06/16 12/07/16 12/08/16 12/09/16 12/10/16 12/11/16 12/12/16
ap_northeast1 eu_central1 eu_west1 ap_southeast1sa_east1 us_east1 us_west1 us_west2
MEA
N: 4
62
MAX
: 3,2
36
MEA
N: 4
16
MAX
: 3,16
9
MEA
N: 3
58
MAX
: 1,9
74
MEA
N: 2
69
MAX
: 1,6
41
MEA
N: 4
83
MAX
: 4,7
52
MEA
N: 3
12
MAX
: 1,8
05
MEA
N: 19
2
MAX
: 2,4
34
MEA
N: 3
28
MAX
: 1,8
81
Average Time Between Login Attempts (in Seconds)
500
450
400
350
300
250
200
150
100
50
0
Source: Arbor Networks, Inc.
IoT_easy_ssh IoT_easy_telnet IoT_hard_ssh IoT_hard_telnet
ap_northeast1 eu_central1
eu_west1
ap_southeast1 sa_east1
us_east1
us_west1
us_west2ap_southeast2ap_northeast2
AT
LA
S
Figure AT19 Average Login Attempts Per Hour Per Region
Figure AT18 Average Time Between Login Attempts (in Seconds)

Arbor Networks Special Report
72
Origins of Compromise Activity—
Looking at the IP locations for the source addresses of login attempts, we can see a distribution of attacking hosts around the world (Figure AT20). This distribution roughly follows that of global population density. The origin map is reasonably consistent, even when looking at attempts per region. This indicates that compromised devices may be consistent in their scanning activity (i.e., it does not appear that subsets of devices are tasked with scanning specific regions).
AT
LA
S
Figure AT20 Login Origin Map (Top Origin Countries for Login Attempts Highlighted)
Top Origin Countries for Login Attempts
COUNTRY
China
Vietnam
Republic of Korea
United States
Brazil
Russia
Taiwan
Hong Kong
Turkey
Romania
NUMBER OF ATTEMPTS
102,975
26,573
19,465
17,062
16,609
13,378
11,697
11,200
10,190
9,856
The distribution of attacking hosts roughly follows that of global population density.

73
Worldwide Infrastructure Security Report
DoS is the most common threat experienced by enterprise, government and education (EGE)
respondents during this survey period, consistent with last year. Looking forward, APT is the number one threat on the mind of over 60 percent of enterprise participants, jumping ahead of DDoS attacks this year.
Firewalls, IDS and SIEM remain among the most commonly utilized tools to detect threats within EGE respondents’ networks, with a 5 percent drop for the latter two. Inline DDoS detection/mitigation systems are in use by nearly half of respondents this year, with NetFlow-based analyzers following closely.
D
NETWORK SECURITY
Enterprise, Government and Education (EGE)
—

Arbor Networks Special Report
7474
DDoS attacks causing internet connectivity and congestion issues are the top threat seen by respondents this year (Figure 56). Accidental data loss, which was the third most commonly reported threat last year, has moved up to second place, closely followed by botted or otherwise compromised hosts. Of note, APT did have a 5 percent increase among threats reported.
EGE organizations reported a 10 percent increase in APT as their number one concern for the next year (Figure 57). This is surprising, given that only 28 percent reported having been impacted by APT over the last year. DDoS attacks are second and malicious insiders third, followed closely by accidental data loss.
Most EGE organizations reported using a defense-in-depth approach, with multiple threat detection tools in use. Firewalls, IDS/IPS and SIEM are the most commonly utilized tools (Figure 58). Inline DDoS detection/mitigation systems are in use by nearly half, edging out NetFlow analyzers by 5 percent. While firewalls are still the number one tool used for threat detection, their usage has dropped 5 percent year over year.
0%
20%
40%
60%
80%
100%
Source: Arbor Networks, Inc.
Threat Detection
Firewall logs
IDS/IPS
Security information and event management (SIEM) platforms
Inline DDoS detection/mitigation system (Pravail APS)
NetFlow-based analyzers (Peakflow SP)
SNMP-based tools
Customer call/help desk ticket
Service assurance/monitoring solutions
In-house developed scripts/tools
Other
82%
72%
55%49%
44%37% 36%
32%
7%
Figure 58 Threat Detection
Figure 56 EGE Threats
EGE Threats EGE Concerns
1. Internet connectivity congestion due to DDoS attack 35%
2. Accidental data loss 34%
3. Botted or otherwise compromised hosts on your corporate network
32%
4. Accidental major service outage 29%
5. Advanced persistent threat (APT) on corporate network 28%
6. Internet connectivity congestion due to genuine traffic growth/spike
27%
7. Exposure of sensitive, but non-regulated data 18%
8. Malicious insider 17%
9. Web defacement 13%
10. Exposure of regulated data 11%
11. Industrial espionage or data exfiltration 8%
12. Theft 8%
13. None of the above 9%
14. Other 8%
1. Advanced persistent threat (APT) on corporate network 61%
2. Internet connectivity congestion due to DDoS attack 51%
3. Malicious insider 47%
4. Accidental data loss 43%
5. Botted or otherwise compromised hosts on your corporate network
43%
6. Exposure of sensitive, but non-regulated data 36%
7. Exposure of regulated data 35%
8. Accidental major service outage 30%
9. Internet connectivity congestion due to genuine traffic growth/spike
29%
10. Industrial espionage or data exfiltration 24%
11. Web defacement 22%
12. Theft 19%
13. Other 4%
Figure 57 EGE Concerns

75
Worldwide Infrastructure Security ReportWorldwide Infrastructure Security Report
This year’s results show a 8 percent increase in enterprise, government and education organizations that experienced a DDoS attack over the past year. Significantly higher proportions of banking/finance and government respondents also reported attacks. The most commonly perceived motivations behind DDoS attacks are now political/ideological disputes and criminal extortion attempts.
Infrastructure continues to be the most popular attack target. Attack frequency is on the rise, showing a 38 percent year-over-year increase among those who experience more than 10 attacks per month. One-quarter reported attacks targeting the application layer, a significantly higher level than the 16 percent reported by service providers, with web services (HTTP) being the top target.
Overall understanding of the DDoS threat and the number of organizations deploying both IDMS and best-practice hybrid defense are on the rise. So, too, are the number of organizations utilizing an “always-on” device or service.
Firewalls, load balancers and CDNs all tied for last place in effectiveness at mitigating DDoS attacks. Nearly half of organizations had firewall or IPS devices experience a failure or contribute to an outage during an attack, similar to last year.
So what’s driving this focus on DDoS attacks and defensive strategies? Possibly a better understanding of the brand damage and operational expense incurred due to successful DDoS attacks. Nearly 60 percent estimate their costs above $500/minute, with some indicating much greater expense.
75
DDoS ATTACKS
01 / Firewall
02/ Load balancers
03/ CDNs
BOTTOM THREE TECHNIQUES
Effectiveness of mitigation techniques.
01 / Intelligent DDoS mitigation systems (IDMS)
02/ Layered/hybrid DDoS mitigation
03/ Cloud-based mitigation
TOP THREE TECHNIQUES
—

Arbor Networks Special Report
76
Source: Arbor Networks, Inc.
Targets of DDoS Attacks
INFRASTRUCTURE (router, firewall, bandwidth)
CUSTOMER-FACING SERVICES AND APPLICATIONS
BUSINESS SERVICES (VPN, email, transaction)
THIRD-PARTY DATA CENTER OR CLOUD SERVICE
64%
32%
13%
70%
0% 10% 20% 30% 40% 50% 60% 70% 80%
Forty-two percent of enterprise, government and education (EGE) respondents experienced DDoS attacks over the past year. Looking specifically at banking/finance, 63 percent witnessed an attack, compared to only 45 percent last year. Government also trended higher, with 53 percent reporting incidents, compared to only 43 percent last year. Fifty percent of e-commerce respondents saw an attack. Interestingly, these results align with the leading verticals that are driving demand for DDoS protection services, as reported by our service provider respondents.
Among EGE respondents who reported attacks, 45 percent suffered more than 10 attacks per month — up sharply from just 28 percent last year (Figure 59). Further, the proportions of respondents reporting 11–20 and 51–100 attacks per month are also up significantly over last year. This ties in with anecdotal reports from Arbor enterprise/ government customers throughout the survey period.
Forty-one percent of EGE respondents reported attacks exceeding their total Internet capacity. This represents a small decrease from last year. Attacks that saturate capacity require the use of a cloud or service provider-based service to mitigate them successfully.
The most common target category, reported by 70 percent of EGE respondents, is now infrastructure (Figure 60). This is up from 56 percent last year, when customer-facing services and applications were the most common target category. More than twice as many respondents reported attacks targeting business services compared to last year. These changes echo a trend seen in attacks targeting service providers, where attackers sought softer targets to achieve their goals.
Source: Arbor Networks, Inc.
DDoS Attack Frequency Per Month
1–10 per month
11-20 per month
21–50 per month
51–100 per month
More than 100 per month
19%
11%
9%
6%
55%
Figure 59 DDoS Attack Frequency Per Month
DDoS Attack Frequency
(Per Month)
Figure 60 Targets of DDoS Attacks

77
Worldwide Infrastructure Security Report
Nearly half of EGE respondents had firewalls or IPS devices experience a failure or contribute to an outage during an attack. Given the increase in the proportion of respondents seeing attacks targeting infrastructure, it is essential that firewalls and IPS are afforded adequate DDoS protection due to their stateful nature.
Looking at the longest DDoS attack duration (Figure 61), 89 percent of EGE organizations indicated that their longest duration attack lasted less than one day. In fact, more than 70 percent reported seeing their longest attack end in seven hours or less.
Source: Arbor Networks, Inc.
DDoS Attack Duration
Less than 7 hours
7-12 hours
13-24 hours
1-3 days
1-4 weeks
6%
11%
9%
2%
72%
Source: Arbor Networks, Inc.
DDoS Attack Duration
Less than 7 hours
7-12 hours
13-24 hours
1-3 days
1-4 weeks
6%
11%
9%
2%
72%
Figure 61 DDoS Attack Duration
DDoS Attack Duration
The differences in observed attack types illustrate why layered DDoS defense is so important for EGE organizations.
01 / Service providers blocking volumetric attacks before they reach their customers.
02/ Service providers not always being aware of the application-layer attacks traversing their networks, given their macroscopic network view.
ONE-QUARTER OF EGE RESPONDENTS SAW ATTACKS TARGETING THE APPLICATION LAYER, A SIGNIFICANTLY HIGHER LEVEL THAN THE 16 PERCENT REPORTED BY SERVICE PROVIDERS. THESE DIFFERENCES ARE LIKELY DUE TO:
Figure 2 IPv6 Flow Telemetry
Source: Arbor Networks, Inc.
Attack Category Breakout
State-Exhaustion
19%
Application- Layer
25%
Volumetric 60%
DDoS attacks can be broken into three main categories: volumetric, state-exhaustion, and application-layer (Figure 62). Of the attacks reported by EGE organizations, 60 percent were volumetric — less than the 73 percent reported by service providers. Figure 62 Attack Category Breakout
Worldwide Infrastructure Security Report
77

Arbor Networks Special Report
7878
We don’t normally include details on attack sizes in the Enterprise DDoS section of this report, but this year one response really stood out. One EGE respondent reported an attack of 250Gbps, a significant volume of traffic even for a service provider, but the truly shocking number is the pps rate — 545.8Mpps of SYN and RST traffic simultaneously targeting a number of load-balancers. This is huge pps rate, and represents possibly the highest confirmed attack pps rate this author has ever seen. What generated the attack? An IoT (Mirai) botnet. This really illustrates the scale of the problem IoT botnets represent.
Looking at application layer attacks, once again, Web services were the primary, with 85 percent reporting attacks targeting HTTP (Figure 63). Over half of EGE respondents experienced application-layer attacks targeting DNS and HTTPS services. Overall, these results are similar to last year, with a slightly higher proportion indicating attacks against web services. Interestingly, service providers have seen DNS and HTTP virtually tied as the targets of application-layer attacks for the past couple of years. The difference here is likely due to the types of infrastructure supported and monitored by the different respondent categories.
Source: Arbor Networks, Inc.
Targets of Application-Layer Attacks
OTHER
HTTPS
DNS
HTTP
SIP/VOIP
85%
63%
59%
30%
9%
9%
0% 10% 20% 30% 40% 50% 60% 70% 80% 90% 100%
Figure 63 Targets of Application-Layer Attacks
DDoS attacks targeting encrypted web services have become increasingly common in recent years (Figure 64). In a massive increase over last year, 57 percent of EGE respondents saw attacks targeting the encrypted service at the application layer, a much higher level than seen in our service provider responses (22 percent). A higher proportion of EGE respondents also witnessed attacks targeting the SSL/TLS protocol, 40 percent compared to just 29 percent of service providers. The variation in results between end user and service provider respondents is, as noted above, likely due to the higher granularity of visibility available when the monitoring solution is closer to the services being attacked. The ability to look inside encrypted traffic may also be a factor. 0%
40%
30%
20%
10%
50%
60%
Source: Arbor Networks, Inc.
Encrypted Application-Layer Attacks
Targeting the serviceat the application layer
Targeting the TCP/UDP port
Targeting the SSL/TLS protocol
Not applicable
40%
14%
48%
57%
Figure 64 Encrypted Application-Layer Attacks
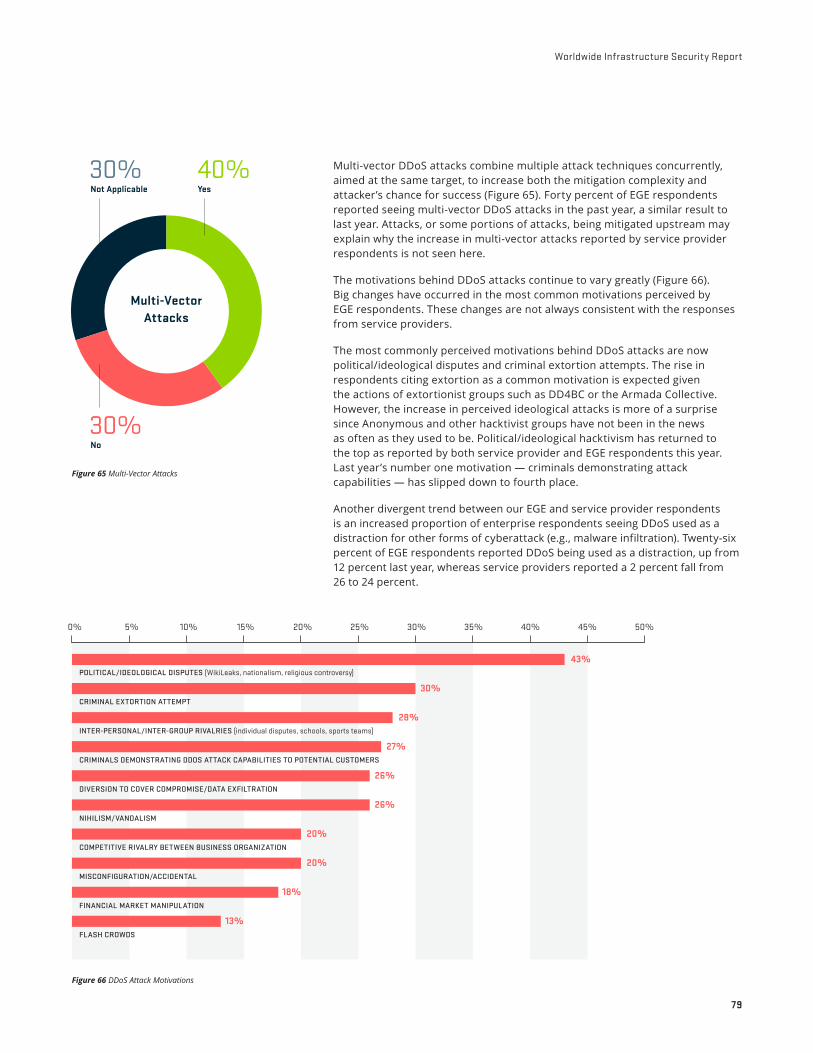
79
Worldwide Infrastructure Security Report
Multi-vector DDoS attacks combine multiple attack techniques concurrently, aimed at the same target, to increase both the mitigation complexity and attacker’s chance for success (Figure 65). Forty percent of EGE respondents reported seeing multi-vector DDoS attacks in the past year, a similar result to last year. Attacks, or some portions of attacks, being mitigated upstream may explain why the increase in multi-vector attacks reported by service provider respondents is not seen here.
The motivations behind DDoS attacks continue to vary greatly (Figure 66). Big changes have occurred in the most common motivations perceived by EGE respondents. These changes are not always consistent with the responses from service providers.
The most commonly perceived motivations behind DDoS attacks are now political/ideological disputes and criminal extortion attempts. The rise in respondents citing extortion as a common motivation is expected given the actions of extortionist groups such as DD4BC or the Armada Collective. However, the increase in perceived ideological attacks is more of a surprise since Anonymous and other hacktivist groups have not been in the news as often as they used to be. Political/ideological hacktivism has returned to the top as reported by both service provider and EGE respondents this year. Last year’s number one motivation — criminals demonstrating attack capabilities — has slipped down to fourth place.
Another divergent trend between our EGE and service provider respondents is an increased proportion of enterprise respondents seeing DDoS used as a distraction for other forms of cyberattack (e.g., malware infiltration). Twenty-six percent of EGE respondents reported DDoS being used as a distraction, up from 12 percent last year, whereas service providers reported a 2 percent fall from 26 to 24 percent.
Source: Arbor Networks, Inc.
Multi-Vector Attacks
Not Applicable30%
No30%
Yes40%
Multi-Vector Attacks
Figure 65 Multi-Vector Attacks
Figure 66 DDoS Attack Motivations
Source: Arbor Networks, Inc.
DDoS Attack Motivations
43%
30%
28%
27%
26%
26%
20%
20%
18%
13%
POLITICAL/IDEOLOGICAL DISPUTES (WikiLeaks, nationalism, religious controversy)
CRIMINAL EXTORTION ATTEMPT
INTER-PERSONAL/INTER-GROUP RIVALRIES (individual disputes, schools, sports teams)
CRIMINALS DEMONSTRATING DDOS ATTACK CAPABILITIES TO POTENTIAL CUSTOMERS
NIHILISM/VANDALISM
FINANCIAL MARKET MANIPULATION
FLASH CROWDS
DIVERSION TO COVER COMPROMISE/DATA EXFILTRATION
MISCONFIGURATION/ACCIDENTAL
COMPETITIVE RIVALRY BETWEEN BUSINESS ORGANIZATION
0% 10% 20%15%5% 30%25% 35% 40% 45% 50%

Arbor Networks Special Report
80
We asked EGE participants whether they have seen DDoS attacks against the cloud services they use. Similar to last year, nearly one-quarter have seen such attacks — nearly identical to the rate reported by service providers.
Looking at the DDoS mitigation techniques deployed in EGE networks, results are broadly similar to last year (Figure 67). Firewalls, IPS/WAF and ACLs remain the most common mechanisms, each being cited by 49 percent of respondents. The continued use of firewalls and IPS/WAF for DDoS mitigation is a concern. It is well known that these devices are susceptible to state-exhaustion DDoS attacks, as evidenced by the 45 percent of respondents who saw their firewalls fail due to DDoS during the survey period.
Encouragingly, 44 percent reported that they use intelligent DDoS mitigation systems (IDMS) — a slight increase over last year. And there is more good news. Thirty-five percent utilize cloud-based DDoS mitigation services, up from 28 percent last year. And, 30 percent use layered/hybrid DDoS protection solutions, up from 23 percent last year.
Figure 67 DDoS Mitigation Techniques
0% 5% 10% 15% 20% 25% 30% 35% 40% 45% 50%
Source: Arbor Networks, Inc.
DDoS Mitigation Techniques
49%
49%
49%
44%
35%
30%
26%
23%
14%
14%
9%
7%
5%
5%
ACCESS CONTROL LISTS (ACLS)
IPS/WAF
FIREWALL
INTELLIGENT DDoS MITIGATION SYSTEMS (IDMS) (Arbor Peakflow or Pravail APS)
LAYERED/HYBRID DDoS PROTECTION SYSTEM (integrated network perimeter and cloud)
SOURCE-BASED REMOTE TRIGGERED BLACKHOLE (S/RTBH)
CONTENT DELIVERY NETWORK (CDN)
FLOWSPEC
QUARANTINE SYSTEM
NONE
OTHER
CLOUD-BASED DDoS MITIGATION SERVICE
DESTINATION-BASED REMOTE TRIGGERED BLACKHOLE (D/RTBH)
LOAD-BALANCER
The increase in the use of defenses specifically designed to deal with the DDoS threat is highly positive.

81
Worldwide Infrastructure Security Report
We also asked our EGE respondents to gauge the effectiveness of mitigation techniques they have deployed (Figure 68). Intelligent DDoS mitigation systems (IDMS) are overwhelmingly viewed as the most effective. Layered/hybrid DDoS mitigation is in second place, with cloud-based mitigation services coming in third. Interestingly, firewalls, load balancers and CDNs all tied for last place in effectiveness at mitigating DDoS attacks.
0%
10%
20%
30%
40%
Source: Arbor Networks, Inc.
Most Effective DDoS Mitigation Techniques
Intelligent DDoS mitigation systems (IDMS) at network perimeter (Pravail APS)
Layered/hybrid DDoS protection system (integrated network perimeter and cloud)
Cloud-based DDoS mitigation service
Destination-based remoted triggered blackhole (D/RTBH)
Access control lists (ACLs)
IPS/WAF
Firewall
Load-balancer
Content delivery network (CDN)
None
34%
20%
12%
7%10%
2%
Figure 68 Most Effective DDoS Mitigation Techniques
Time to mitigate is a key measure in the successful defense against DDoS attacks, as it can be a major factor in determining the cost of an attack to an organization (Figure 69). Just over one-quarter of EGE respondents indicated immediate mitigation via an “always-on” device or service. Impressively, 79 percent can mitigate attacks in less than one hour, and just over half can mitigate in less than 15 minutes.
—Proactive defenses are becoming increasingly important as more organizations become dependent on the Internet for business continuity.
Figure 69 DDoS Attack Mitigation Time
Source: Arbor Networks, Inc.
DDoS Attack Mitigation Time
Immediate mitigation via on-premise device or “always on” cloud
26%
Less than 15 minutes
24%
1–3 hours17%
Less than 1 hour
10%
Less than 30 minutes
19%
DDoS Attack Mitigation Time

Arbor Networks Special Report
82
0%
10%
20%
30%
40%
50%
Source: Arbor Networks, Inc.
Business Impacts of DDoS Attacks
Reputation/brand damage
Operational expense
Specialized IT security remediation and investigation services
Loss of executive or senior management
Revenue loss
Loss of customers
Extortion payments
Regulatory penalties and/or fines
Stock price fluctuation
Increase in cybersecurity insurance premium
Unknown or not applicable
48%
43%
21%
19%
17%
12%
10%
10%
7% 2%
14%
Organizations observed a number of different business impacts due to DDoS attacks during the survey period (Figure 70). Reputation/brand damage and operational expense are the most commonly cited business impacts again this year. The proportion seeing increased operational expense due to DDoS dropped significantly from 64 percent to 43 percent. Conversely, the proportion suffering reputation damage increased from 36 percent to 48 percent. This may indicate that the market now expects companies to have adequate DDoS defenses, so there is greater disappointment when an organization falls victim to an attack.
We asked EGE organizations to estimate the cost of Internet downtime (Figure 71). As before, the majority of respondents didn’t know, even though the majority indicated having had DDoS attacks. This is likely because they do not have a method to quantify the overall cost associated with the loss of Internet connectivity. Among those who did answer the question, 59 percent estimated their costs above $500/minute, with some indicating much greater expense.
0%
10%
20%
30%
40%
50%
Source: Arbor Networks, Inc.
Business Impacts of DDoS Attacks
Reputation/brand damage
Operational expense
Specialized IT security remediation and investigation services
Loss of executive or senior management
Revenue loss
Loss of customers
Extortion payments
Regulatory penalties and/or fines
Stock price fluctuation
Increase in cybersecurity insurance premium
Unknown or not applicable
48%
43%
21%
19%
17%
12%
10%
10%
7% 2%
14%
Figure 70 Business Impacts of DDoS Attacks
Source: Arbor Networks, Inc.
Cost of Internet Downtime
Over $20,001 per minute
18%
$5,001–$10,000per minute
18%
$501–$1,000 per minute
23%
Under $500 per minute
41%Cost of Internet
Downtime (Per Minute)
Figure 71 Cost of Internet Downtime
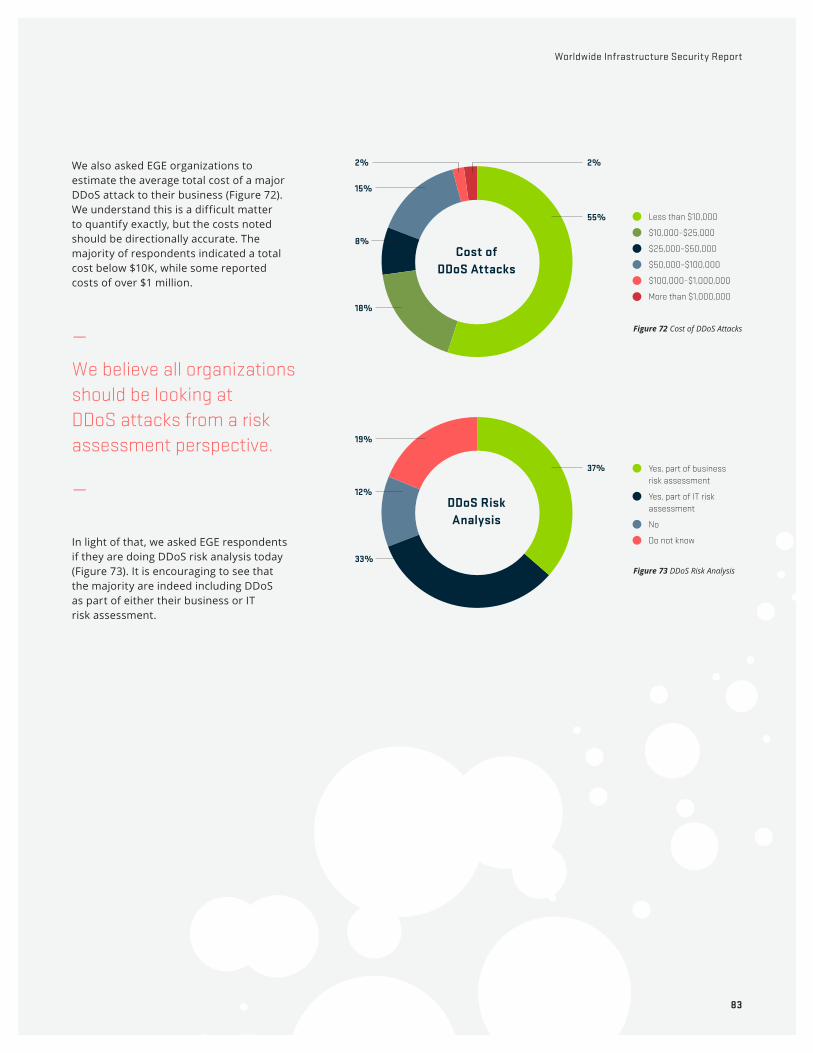
83
Worldwide Infrastructure Security Report
Source: Arbor Networks, Inc.
Cost of DDoS Attacks
Less than $10,000
$10,000–$25,000
$25,000–$50,000
$50,000–$100,000
$100,000–$1,000,000
More than $1,000,000
18%
8%
2%
15%
55%
2%
Figure 72 Cost of DDoS Attacks
Cost of DDoS Attacks
Source: Arbor Networks, Inc.
DDoS Risk Analysis
Yes, part of business risk assessment
Yes, part of IT risk assessment
No
Do not know
33%
12%
19%
37%
DDoS Risk Analysis
Figure 73 DDoS Risk Analysis
Worldwide Infrastructure Security Report
83
We also asked EGE organizations to estimate the average total cost of a major DDoS attack to their business (Figure 72). We understand this is a difficult matter to quantify exactly, but the costs noted should be directionally accurate. The majority of respondents indicated a total cost below $10K, while some reported costs of over $1 million.
—We believe all organizations should be looking at DDoS attacks from a risk assessment perspective.
—
In light of that, we asked EGE respondents if they are doing DDoS risk analysis today (Figure 73). It is encouraging to see that the majority are indeed including DDoS as part of either their business or IT risk assessment.
Source: Arbor Networks, Inc.
Cost of DDoS Attacks
Less than $10,000
$10,000–$25,000
$25,000–$50,000
$50,000–$100,000
$100,000–$1,000,000
More than $1,000,000
18%
8%
2%
15%
55%
2%
Source: Arbor Networks, Inc.
DDoS Risk Analysis
Yes, part of business risk assessment
Yes, part of IT risk assessment
No
Do not know
33%
12%
19%
37%

Arbor Networks Special Report
84
This year’s survey shows a significant increase in enterprise, government and education (EGE) respondents who have deployed IPv6 or plan to deploy it in their networks — 38 percent, up from only 26 percent last year. However, this is still a much lower proportion than seen from our service provider respondents.
Looking at EGE respondents who have deployed IPv6 in their network, 67 percent offer Internet-facing services over IPv6 (Figure 74). This represents considerable growth over the 58 percent of last year. As IPv6 is being adopted more widely by both the end-user and business customers of service providers, it is unsurprising to see more and more services made available.
IPv6—
Source: Arbor Networks, Inc.
IPv6 Service Availability
No, no plans
14%
No, but we are planning
this
19%
Yes
67%
Figure 74 IPv6 Service Availability
84

85
Worldwide Infrastructure Security Report
Another indication of the gradual acceptance of IPv6 in the EGE sector is the proportion running IPv6 in their internal (private) network (Figure 75). This has growth to 67 percent this year, compared to 50 percent last year. Only 12 percent have no plans to deploy IPv6 internally.
On the subject of IPv6 traffic visibility, around 53 percent of EGE respondents can monitor IPv6 traffic on their network. However, only 27 percent of their network infrastructure vendors currently support IPv6 flow telemetry (Figure 76). Both these numbers are slightly less than those reported last year.
Figure 76 IPv6 Flow Telemetry
Source: Arbor Networks, Inc.
IPv6 Flow Telemetry
0% 5% 10% 15% 20% 25% 30%
PARTIAL ( some vendors support IPv6 flow telemetry today, some do not)
YES ( fully supported today)
WILL SOON ( they will support Flow for IPv6 in the next 12 months)
NEW HARDWARE ( supported but on new hardware only)
NO ( support is on a long-term roadmap, greater than 1 year)
27%
25%
29%
10%
7%
NO ( will not support)
2%
Source: Arbor Networks, Inc.
Internal IPv6 Deployment
Yes
No, no plans
No, but we are planning this
67%
12%
21%
Source: Arbor Networks, Inc.
Internal IPv6 Deployment
Yes
No, no plans
No, but we are planning this
67%
12%
21%
Internal IPv6 Deployment
Figure 75 Internal IPv6 Deployment
85
Worldwide Infrastructure Security Report

Arbor Networks Special Report
86
Source: Arbor Networks, Inc.
IPv6 Impact on IPv4 Services (Dual-Stack Devices)
0%
30%
20%
10%
40%
50%
0%
30%
20%
10%
40%
50%
None
8%
Minor
44%
Moderate
33%
Major
15%
LEVEL OF CONCERN
Similar to service providers, the top concerns for EGE respondents around IPv6 security are DDoS attacks and botnets, at 68 percent and 51 percent respectively (Figure 77). Although DDoS attacks are the top concern, only 25 percent of EGE respondents have experienced an IPv6-based DDoS attack in the last 12 months.
We also asked specifically about concerns relating to IPv6 attacks against dual-stack devices, and the potential impact to related IPv4 services (Figure 78). Nearly half of EGE respondents consider this a moderate or major concern.
Figure 77 IPv6 Security Concerns
Figure 78 IPv6 Impact on IPv4 Services (Dual-Stack Devices)
Source: Arbor Networks, Inc.
IPv6 Security Concerns
68%
51%
44%
44%
39%
37%
32%
17%
2%
0% 10% 20% 30% 40% 50% 60% 70%
Traffic floods/DDoS
Botnets
Misconfiguration
Host scanning
Inadequate IPv4/IPv6 feature parity
Visibility, cannot see the data today
Stack implementation flaws
Subscribers using IPv6 to bypass application rate limiting
Other

87
Worldwide Infrastructure Security Report
Around 60 percent of enterprise, government and education (EGE) respondents have no plans to deploy SDN/NFV technologies, and only 21 percent are investigating or testing solutions now (Figure 79). EGE respondents have fewer plans to utilize SDN/NFV than their service provider counterparts.
The number one barrier to SDN/ NFV deployment within the EGE network infrastructure is cost, at 56 percent (Figure 80). Similar to service providers, EGE respondents rank operational concerns high on the list at number two (51 percent). Other major concerns include scalability and vendor support. Interestingly, interoperability seems less of a concern for EGE versus service provider respondents.
Worldwide Infrastructure Security Report
Figure 79 EGE SDN/NFV Deployment
Source: Arbor Networks, Inc.Source: Arbor Networks, Inc.
EGE SDN/NFV Deployment
NO
WE ARE INVESTIGATING/TRIALING NOW
WE ARE IMPLEMENTING NOW
PLAN TO IMPLEMENTIN NEXT YEAR
PLAN TO IMPLEMENT IN NEXT 2+ YEARS
61%
21%
6%
4%
8%
0% 10% 20% 30% 40% 50% 70%60%
87
Source: Arbor Networks, Inc.
EGE SDN/NFV Key Barriers
SECURITY CONCERNS
STABILITY
COST
SCALABILITY
VENDOR SUPPORT
OPERATIONAL CONCERNS
BUSINESS SUPPORT SYSTEM (BSS) INTEGRATION
INTEROPERABILITY
PERFORMANCE CONCERNS
TELEMETRY ACQUISITION
OTHER
51%
56%
36%
31%
39%
37%
34%
32%
22%
4%
7%
0% 10% 20% 30% 40% 50% 60%
Figure 80 EGE SDN/NFV Key Barriers
SDN/NFV—

Arbor Networks Special Report
88
Source: Arbor Networks, Inc.
EGE NFV Technologies
CLOUDIFY
OPENCONFIG
OPENSTACK HEAT
CISCO NSO
VMWARE VREALIZE
NETCONF/YANG
OPENSTACK TACKER
NOT APPLICABLE
OTHER
20%
18%
9%
7%
2%
2%
2%
30%
9%
0% 5% 10% 15% 20% 25% 30%
When asked where they would utilize SDN/NFV within their infrastructure, the data center is the dominant choice among EGE respondents (Figure 81). Almost 80 percent plan to deploy these technologies within their data centers, and nearly 45 percent plan to deploy them in the data center’s value-added service infrastructure. Looking at NFV technologies being deployed in EGE networks, VMware and OpenStack are the clear leaders (Figure 82).
Figure 82 EGE NFV Technologies
Source: Arbor Networks, Inc.
EGE SDN/NFV Network Domains
Data centerinfrastructure
Virtual CPE value-addedservice infrastructure
(firewalls, IPS)
Data center value-addedservice infrastructure
(firewalls, IPS)
Fixed line serviceproviding network
infrastructure
Mobile networkinfrastructure
79%21%
44%18%23%
Figure 81 EGE SDN/NFV Network Domains
VMware is much more popular among EGE respondents than their service provider counterparts.

89
Worldwide Infrastructure Security Report
For NFV functions that are planned for deployment, three different areas — access/VPN, DDoS and firewall — are tied as the most popular choice among EGE respondents (Figure 83).
EGE respondents are generally in agreement with service providers regarding their preferred SDN technology (Figure 84). The overwhelming majority indicated OpenFlow as their first choice, with second place taken by NETCONF/YANG.
Lastly, we asked EGE respondents which service function chaining mechanisms they have or plan to deploy (Figure 85). VLAN is the top choice, with SDN controllers and VXLAN in second and third place respectively.
Source: Arbor Networks, Inc.
EGE NFV Functions
LOAD BALANCING
OTHER
DDoS
FIREWALL
ACCESS/VPN
IPS/IDS
SANDBOX
NOT APPLICABLE
33%
12%
12%
12%
9%
9%
7%
7%
0% 5% 10% 15% 20% 25% 35%30%
Figure 83 EGE NFV Functions
0%
30%
20%
10%
40%
Source: Arbor Networks, Inc.
EGE SDN Technologies
OpenFlow
NETCONF/YANG
OpenDaylight
Juniper
Nokia Nuage
Not applicable
Other
31%
12%10%
7%
2%
12%
26%
Figure 84 EGE SDN Technologies
Figure 85 EGE Service Function Chaining
18%SDN controller-managed
13% VXLAN
53% VLAN
5% Networks Service Header (NSH)
13% Other
EGE service function chaining mechanisms

Arbor Networks Special Report
90
Arbor Networks Special Report
ORGANIZATIONAL SECURITY—Ninety-three percent of enterprise, government and education (EGE) respondents have at least some dedicated security personnel, a higher proportion than our service provider respondents. However, a far lower percentage have large teams.
Nine percent outsource their SOC, a much higher percentage than service providers.
Difficulty in hiring and lack of resources are the key issues for EGE respondents when building and maintaining an effective operational security (OPSEC) team.
Implementation of best-practice security measures is lower across the board when compared to service providers. Of key concern are the relatively low proportions using out-of-band management networks and iACLs at their network edge.
Fifty-five percent now carry out DDoS defense simulations, with around 30 percent carrying them out at least quarterly.
93% EGE respondents with dedicated security personnel
9% EGE respondents outsource their security operations center
90

91
Worldwide Infrastructure Security Report
Ninety-three percent of enterprise, government and education respondents have at least some dedicated security personnel (Figure 86).
EGE respondents are more likely to outsource their SOC function than service providers by a factor of more than three. This may explain why EGE respondents tend to have smaller dedicated security teams. Outsourcing the SOC is an effective way for the enterprise to maintain a secure environment and have the latest tools in the security perimeter while keeping costs and head count down. It is very concerning to see that one-quarter of EGE respondents have no SOC resources at all (Figure 87).
EGE and service provider respondents expressed similar challenges in building an effective OPSEC team. Lack of management support, internal stakeholder support and head count showed similar results to last year. Operational and capital budgets seem easier to get in EGE organizations, but hiring and retaining employees are more difficult (Figure 88).
Figure 86 EGE Dedicated Security Personnel
Figure 87 EGE Security Operations Center
Source: Arbor Networks, Inc.
EGE Security Operations Center
Internal SOC team
No SOC resources
Internal SOC with supplemental third-party (hybrid)
Third-party SOC (outsourced)
46%19%
9%
26%
Source: Arbor Networks, Inc.
EGE Security Operations Center
Internal SOC team
No SOC resources
Internal SOC with supplemental third-party (hybrid)
Third-party SOC (outsourced)
46%19%
9%
26%
EGE Security Operations
Center
0%
40%
30%
20%
10%
50%
60%
Source: Arbor Networks, Inc.
EGE OPSEC Team Challenges
Difficulty of hiring and retaining skilled personnel
Lack of headcount or resources
Lack of management support
Operational expenditure (OPEX) funding
Capital expenditure (CAPEX) funding
Lack of internal stakeholder support
Other
60%
55%
32%
31%
27%
5%
23%
Figure 88 EGE OPSEC Team Challenges
We saw a marked difference in the size of dedicated security teams between service providers and EGE organizations. Nearly one-quarter of service provider respondents reported teams of 30 or more people, compared to only 15 percent for EGE respondents.
Source: Arbor Networks, Inc.
EGE Dedicated Security Personnel
0
1–5
6–10
11–15
16–20
21–30
30+
44%
7%
6%
5%
8%
16%
15%
EGE Dedicated Security
Personnel

Arbor Networks Special Report
92
Figure 89 EGE Security Best Practices
0% 10% 25%5% 20%15% 30% 35% 40% 50%45%
Source: Arbor Networks, Inc.
EGE Security Best Practices
46%
43%
39%
37%
36%
33%
28%
19%
17%
15%
14%
8%
BLOCK KNOWN BOTNET COMMAND-AND-CONTROL SERVERS, MALWARE DROP SERVER, ETC.
AUTHENTICATION FOR BGP, IGPS (MD5, SHA-1)
MAINTAIN UP-TO-DATE CONTACTS FOR YOUR PEER, TRANSIT AND/OR CUSTOMER OPSEC TEAMS
iACLS AT NETWORK EDGES
SEPARATE OUT-OF-BAND (OOB) MANAGEMENT NETWORK OR DATA COMMUNICATION NETWORK (DCN)
EXPLICITLY FILTER ROUTES ANNOUNCED BY BGP PEERS
EXPLICITLY FILTER ROUTES ANNOUNCED BY CUSTOMERS
IRR ROUTE REGISTRATION OF CUSTOMER PREFIXES
OTHER
BCP38/BCP84 ANTI-SPOOFING AT NETWORK EDGE AND/OR WITHIN DATA CENTER
GENERALIZED TTL SECURITY MECHANISM (GTSM) FOR BGP PEERS
MONITOR FOR ROUTE HIJACKING
Implementation of best-practice security measures is lower across the board when compared to service providers. Of key concern are the relatively low proportions of EGE respondents using out-of-band management networks and iACLs at their network edge (Figure 89).
Effectively dealing with DDoS attacks requires personnel who have gone through proper training and have practiced defending against attacks. Running regular training simulations is proven to increase the effectiveness of operations staff in managing real attacks. This is the case for both enterprise and service provider organizations. Even medium and smaller enterprise organizations, which are targeted less frequently, need practice to ensure their response is effective when an attack occurs. We see an across-the-board increase in DDoS readiness compared to last year.
Fifty-five percent of respondents now carry out DDoS defense simulations, with nearly 40 percent carrying them out at least quarterly (Figure 90). However, there is still plenty of room for improvement, as 46 percent do not run simulations today.
Figure 90 EGE DDoS Simulations
Source: Arbor Networks, Inc.
EGE DDoS Simulations
Daily4%
Weekly10%
Monthly10%
Quarterly14%
Yearly16%
Do not do this today, but plan to implement within the next year
46%
EGE DDoS Simulations

93
Worldwide Infrastructure Security Report
DNS OPERATORS
verall, DNS infrastructure continues to be an afterthought for many organizations, be they
service providers or enterprises. The percentage of respondents with a dedicated security function for DNS has fallen to 22 percent from 28 percent last year — a significant drop and a very disappointing and concerning result.
Visibility into DNS traffic has improved, however, with three-quarters citing visibility at Layers 3/4, up from 63 percent last year.
It is no surprise that the security measures used to protect DNS infrastructure differ significantly between service provider and enterprise groupings. For service providers, intelligent DDoS mitigation systems (IDMS) are the most popular choice, with iACLs and firewalls in second and third place respectively. For enterprise respondents, the technologies used are quite different, with firewalls, IPS/IDS and iACLs being the top three choices. Enterprises are still preferring generic security solutions over those that are specifically designed to protect infrastructure from the DDoS threat.
O
The proportion seeing
service-affecting DDoS
attacks targeting their
DNS infrastructure has
fallen slightly this year
to 27 percent, from
30 percent last year.
Service providers are
more likely to see attacks,
as you would expect.

Arbor Networks Special Report
94
Seventy-four percent of respondents indicated that they run DNS infrastructure, up from 70 percent last year. Looking at a breakout by respondent type, approximately three-quarters of service providers run DNS servers, the same result as last year. The proportion of enterprises running DNS servers has increased significantly, up from 65 percent last year to 75 percent this year. It is very surprising to see enterprises taking more control of critical infrastructure such as DNS rather than relying on dedicated DNS providers.
Given the criticality of DNS to network services, we asked our respondents whether DNS security is managed by a dedicated group, by a more generic security function, or by no one (Figure 91). Last year, we saw the proportion of respondents with no security group responsible for DNS fall for the first time in a couple of years, to 22 percent. The proportion has now fallen further to 20 percent, a small but encouraging improvement. The results aren’t all good though, as the proportion with a dedicated security function for DNS has fallen to 22 percent from 28 percent last year — a significant drop.
Source: Arbor Networks, Inc.
DNS Security Responsibility
No security group is responsible for securing DNS infrastructure
20%
Special security group for DNS
22%
Same security group
58%
DNS Security Responsibility
Figure 91 DNS Security Responsibility
Looking at the breakout between enterprises and service providers, some key differences emerge in security protection around DNS. Twenty-seven percent of service providers have a dedicated security function, much higher than the 16 percent of enterprise organizations. This is expected given the criticality of DNS to service providers’ services — and to their business. This makes it all the more disappointing and concerning to see that 23 percent of service providers have no security group responsible for DNS, as opposed to 18 percent of enterprises.
DNS is critical to the availability of network services. Therefore, ensuring the availability of DNS infrastructure is key. DNS servers can both be targeted by DDoS attacks and used to amplify/reflect DDoS attack traffic. This year has seen a resurgence in the use of DNS as a reflection/amplification attack vector, with attacks increasing in both size and frequency (see ATLAS Reflections section). As a result, it is disappointing to see that 18 percent of respondents still do not restrict access to their recursive DNS servers.
Moving on to look at the visibility of DNS traffic (Figure 92), we see a continuation of last year’s trend toward better overall visibility. Three-quarters of respondents now have visibility at Layers 3/4, up from 63 percent last year — and finally surpassing 2013’s result of 67 percent. Historically, there has been a gap in the capabilities of the two groups. This year, three-quarters of both enterprise and service provider respondents reported having visibility at Layers 3/4, indicating that enterprise respondents have improved their capabilities in this area. However, a gap still exists when it comes to Layer 7 visibility, with only 35 percent of enterprises and 42 percent of service providers able to visualize traffic at the application layer. Visibility at Layer 7 is important for DNS traffic because understanding and mitigating attacks, either targeting or utilizing DNS infrastructure, often require application-layer visibility.
Figure 92 DNS Visibility
Source: Arbor Networks, Inc.
DNS Visibility
0% 25% 50% 75%
YES Layers 3/4
YES Layer 7
NO VISIBILITY
42%
12%
75%

95
Worldwide Infrastructure Security Report
The proportion seeing service-affecting DDoS attacks targeting their DNS infrastructure has fallen slightly this year to 27 percent, from 30 percent last year (Figure 93). However, this is still way above the 17 percent seen in 2014. Breaking out the data shows marked differences in the experiences of service provider and enterprise respondents: 39 percent of service providers witnessed service- affecting attacks, a drop from 51 percent last year; and, 13 percent of enterprises experienced a service-affecting attack, up slightly from 11 percent last year.
The reduction in the proportion of respondents seeing service-affecting DDoS attacks targeting DNS infrastructure is encouraging, as ATLAS shows us that the overall number of DNS attacks is increasing.
DDoS attacks are now targeting authoritative DNS servers more frequently than recursive servers. Thirty percent of respondents saw attacks targeting recursive DNS servers, down from 34 percent last year. The data for authoritative DNS servers shows a swing in the other direction, with 34 percent experiencing attacks, up from 29 percent last year.
Service providers are more likely to see attacks, as one would expect, with 43 percent seeing attacks against both authoritative and recursive DNS servers, as opposed to 16 percent and 24 percent respectively for enterprises.
The security measures used by respondents to protect DNS infrastructure differ significantly between service providers and enterprises (Figure 94). For service providers, intelligent DDoS mitigation systems (IDMS) are the most popular choice, with iACLs and firewalls in second and third place respectively. The proportion of service providers using IDMS has increased this year to 64 percent, from 54 percent last year. The popularity and increase in the use of IDMS is very encouraging and demonstrates that service providers are taking the protection of the DNS infrastructure availability very seriously.
Service Provider DNS Security Measures
80%
70%
60%
50%
40%
30%
20%
10%
0%
Source: Arbor Networks, Inc.
Intelligent DDoS mitigation systems (IDMS) (Arbor Peakflow TMS)
Interface ACLs (iACLs) on network edge
Firewalls
Separate production and out-of-band (OOB) management networks
Unicast reverse path forwarding (uRPF) and/or other anti-spoofing mechanisms
IPS/IDS
Destination-based remote triggered blackhole (D/RTBH)
Source-based remote triggered blackhole (S/RTBH)
FlowSpec on gateway or access routers
19%21
%25%
32%
64%
58%
57%
37%
37%Service Provider DNS Security Measures
80%
70%
60%
50%
40%
30%
20%
10%
0%
Source: Arbor Networks, Inc.
Intelligent DDoS mitigation systems (IDMS) (Arbor Peakflow TMS)
Interface ACLs (iACLs) on network edge
Firewalls
Separate production and out-of-band (OOB) management networks
Unicast reverse path forwarding (uRPF) and/or other anti-spoofing mechanisms
IPS/IDS
Destination-based remote triggered blackhole (D/RTBH)
Source-based remote triggered blackhole (S/RTBH)
FlowSpec on gateway or access routers
19%21
%25%
32%
64%
58%
57%
37%
37%
Figure 94 Service Provider DNS Security Measures
Figure 93 DNS Service-Affecting DDoS Attack
Source: Arbor Networks, Inc.
DNS Service-Affecting DDoS Attack
NO
55%
DO NOT KNOW
19%
YES
27%

Arbor Networks Special Report
96
The results for enterprises are quite different with firewalls, IPS/IDS and iACLs being the top three choices of protection technology (Figure 95). Seventy-nine percent of enterprises use firewalls versus only 57 percent of service providers; 64 percent of service providers use IDMS, as opposed to only 31 percent of enterprises.
Enterprises still prefer generic security solutions over those that are specifically designed to protect infrastructure from the DDoS threat.
—However, to end this section on a positive note, the proportion of enterprises using IDMS has increased to 31 percent from 19 percent last year, which does indicate that things are improving.
80%
70%
60%
50%
40%
30%
20%
10%
0%
Enterprise DNS Security Measures
Source: Arbor Networks, Inc.
Firewalls
IPS/IDS
Interface ACLs (iACLs) on network edge
Separate production and out-of-band (OOB) management networks
Intelligent DDoS mitigation systems (IDMS) (Arbor Peakflow TMS)
Unicast reverse path forwarding (uRPF) and/or other anti-spoofing mechanisms
Source-based remote triggered blackhole (S/RTBH)
FlowSpec on gateway or access routers
Destination-based remote triggered blackhole (D/RTBH)
11%14
%
14%19
%
79%
66%
44%
34%
31%
Figure 95 Enterprise DNS Security Measures

97
Worldwide Infrastructure Security Report
CONCLUSIONIn 1926, Nikola Tesla was quoted by Colliers magazine predicting ubiquitous communication and the arrival of the “connected world”:
—
It would be many more years before Tesla’s vision could be truly realized. But in 1990, John Romkey connected a Sunbeam Deluxe Automatic Radiant Control Toaster to the Internet. The toaster was connected to the Internet with TCP/IP networking, and controlled with a Simple Networking Management Protocol Management Information Base (SNMP MIB). Thus was born the “Internet of Things” (IoT).
Cisco predicts that by 2025 there will be 50 billion connected devices. Projections vary, but it’s safe to say that the number of connected IoT devices already outnumbers the humans on earth. While the IoT represents only one of the avenues open to attackers looking to create massive botnets, their proliferation and lack of basic security functionality dramatically increase the potential for bad actors to wreak havoc upon the global Internet.
As we have seen in this year’s report, attackers have used IoT devices to build and weaponize massive botnets of unprecedented size and capability. Volumetric DDoS attacks have not only reached new highs in terms of overall size, but have also increased in frequency. But, IoT botnets aren’t the only game in town. Reflection/amplification DDoS attacks have also continued to see widespread use as a tried-and-tested method for generating huge volumes of attack traffic. In addition, easy-to-use DDoS services have helped make more sophisticated multi-vector DDoS attacks increasingly common.
The good news is that both service providers and enterprises share an increased appreciation of the impact a successful DDoS attack can have. This is leading to the adoption of more effective defenses. In service provider networks, it is now widely accepted that purpose-built intelligent DDoS mitigation systems serving as part of a layered defense are the only effective option for mitigating DDoS attacks. Enterprise, government and education organizations also indicate an increasing understanding of this reality. While many still deploy traditional security technologies for DDoS defense, there is increased acceptance of the shortcomings of these solutions.
“ When wireless is perfectly applied, the whole earth will be converted
into a huge brain, which in fact it is, all things being particles of a real
and rhythmic whole. We shall be able to communicate with one another
instantly, irrespective of distance… and the instruments through which
we shall be able to do this will be amazingly simple compared with
our present telephone. A man will be able to carry one in his vest pocket.”
CISCO PREDICTS BY 2025 THERE WILL BE 50 BILLION CONNECTED DEVICES.

Arbor Networks Special Report
98
As every aspect of our business and personal lives becomes dependent on the connected world, it is interesting to note that online gaming is seen as the top motivation behind DDoS attacks this year. Ideological hacktivism has also returned to prominence, with criminal activity lurking closely behind. The motivations behind attacks are many and varied, but the ease with which anyone can launch attacks for any purpose is a key concern.
DNS continues to be one of the most targeted Internet services, and it remains the Achilles heel of global Internet infrastructure. DNS was not only the most heavily abused protocol for reflection/amplification DDoS attacks this year, but an attack targeting a specific DNS provider was also the cause of the most widespread Internet outage of 2016. Understanding and protecting the increasingly complex mesh of connectivity in which we exist is an ongoing challenge.
This is exacerbated by the global shortage of security professionals, a problem that is only predicted to get worse in the near future. While many organizations pursue outsourcing, machine learning or automation strategies to help fill the gap, increased efficiency and organic growth of internal teams will also prove vital. General network visibility, use of anti-spoofing and rehearsal of DDoS incident-handling processes are all on the rise. And, more service providers are now offering DDoS protection services, given the continued increasing interest in these services among customers across a broad range of verticals. These are all positive trends.
Arbor Networks is proud to release the 12th annual Worldwide Infrastructure Security Report. This report is designed to help network operators understand the breadth of the threats that they face, gain insight into what their peers are doing to address these threats, and comprehend both new and continuing trends. This year’s report features responses from service provider, enterprise, government and education organizations. A good global distribution of respondents rounds out what has been our broadest representation of the Internet community ever.
—We hope that you find the information useful in protecting your business for the coming year.
TOP MOTIVATION BEHIND DDoS ATTACKS
01 / Online gaming
02/ Ideological hacktivism
03 / Criminal activity
TOP TARGETED INTERNET SERVICES
01 / DNS
02/ DNS providers

99
Worldwide Infrastructure Security Report
—Darren Anstee Chief Security Technologist, Arbor Networks [email protected]
Darren Anstee has 22 years of experience in pre-sales, consultancy and support for telecom and security solutions. As Chief Security Technologist at Arbor Networks, Darren works across the research, strategy and pre-sales aspects of Arbor’s traffic monitoring, threat detection and mitigation solutions for service providers and enterprises around the world. Prior to joining Arbor, Darren spent over eight years working in both pre- and post-sales for core routing and switching product vendors.
—Paul Bowen Principal Security Technologist, Arbor Networks [email protected]
Paul Bowen brings 22+ years of experience to his role at the company where his primary focus is on advanced threats. Previously he was an Architect for advanced threat solutions at Fortinet. He also was The Architect for Mandiant Cloud based SIEM, called TAP. Paul spent 2 years as a security and compliance conference speaker for HP as a member of Office for Advanced Solutions, spent 7 years as a principal Engineer for Arcsight and 10 years as a manager of global security for Estee Lauder.
—C.F. Chui Principal Security Technologist, Arbor Networks [email protected]
With more than 20 years of experience in the networking industry, C.F. Chui is a veteran in designing, implementing and supporting highly available network systems and solutions. In his current role with Arbor Networks, C.F. works closely with customers in the Asia Pacific region to develop and optimize approaches for their network security solutions to ensure the most effective deployment and highest customer satisfaction. He is also actively involved in Arbor’s global research projects. Before joining Arbor, C.F. held different regional positions in pre- and post-sales for various large core routing and switching vendors. His expertise lies mainly in the areas of Internet routing technology, network threat detection and network visibility solutions.
—Gary Sockrider Principal Security Technologist, Arbor Networks [email protected]
Gary Sockrider is an industry veteran bringing over 25 years of broad technology experience including routing and switching, mobility, collaboration and cloud but always with an eye on security. His previous roles include security SME, consultancy, customer support, IT and product management. He seeks to understand and convey the constantly evolving threat landscape, as well as the techniques and solutions that address the challenges they present. Prior to joining Arbor in 2012, he spent 12 years at Cisco Systems and held previous positions with Avaya and Cable & Wireless.
AUTHORSAbout the

Arbor Networks Special Report
100
Arbor Networks Special Report
GLOSS ARY
AACL Access Control ListAPT Advanced Persistent ThreatASERT Arbor Security Engineering & Response TeamAT Advanced ThreatATLAS Active Threat Level Analysis SystemAV Anti-Virus
BBCP Best Current PracticeBYOD Bring Your Own Device
CCDN Content Delivery NetworkC&C Command-and-Control
DDCN Data Communication NetworkDNS Domain Name SystemDDoS Distributed Denial of ServiceD-RTBH Destination-based Remotely Triggered BlackholingS-RTBH Source-based Remotely Triggered Blackholing
EEGE Enterprise, Government, Education
GGbps Gigabits-per-secondGi Global InternetGTP-C General Packet Radio Service (GPRS)
tunneling protocol (GTP) GTP-U GPRS Tunnelling Protocol User PlaneGTSM Generalized TTL Security Mechanism
HHTTP Hypertext Transfer ProtocolHTTP/S HTTP SecureiACL Infrastructure ACL
IICMP Internet Control Message ProtocolIDMS Intelligent DDoS Mitigation SystemIDS Intrusion Detection System IGP Interior Gateway ProtocolIoT Internet of ThingsIPS Intrusion Prevention SystemIPv4 Internet Protocol version 4IPv6 Internet Protocol version 6IR Incident ResponseIRC Internet Relay ChatISP Internet Service Provider
100

101
Worldwide Infrastructure Security Report
101
Worldwide Infrastructure Security Report
KKPI Key Performance Indicator
LLTE Long Term Evolution
MMbps Megabits-per-secondMDM Mobile Device ManagementMITM Man in the MiddleMNO Mobile Network OperatorMPC Mobile Packet CoreMSSP Managed Security Service Provider
NNAT Network Address TranslationNFV Network Functions VirtualizationNGFW Next Generation FirewallNMS Network Management SystemNTP Network Time Protocol
OOOB Out of bandOPSEC Operational SecurityOTT Over the Top
PPAT Port Address TranslationPCAP Packet Capture
QQoE Quality of Experience
RRAN Radio Access Network
SSDN Software-defined networkingSEG Security GatewaysSIEM Security Information Event ManagementSIP Session Initiation ProtocolSMTP Simple Mail Transfer ProtocolSNMP Simple Network Management ProtocolSOC Security Operations CenterS/RTBH Source-based Remotely Triggered BlackholingSSDP Simple Service Discovery ProtocolSSL Secure Socket LayerSYN Synchronize
TTLD Top Level DomainTLS Transport Layer SecurityTbps Terabits per second
UUDP User Datagram ProtocoluRPF Unicast Reverse Path ForwardingUTM Unified Threat Management
VVoIP Voice over Internet Protocol
WWAF Web Application FirewallWiMAX Worldwide Interoperability for Microwave AccessNAT Network Address TranslationNFV Network Functions VirtualizationNGFW Next Generation FirewallNMS Network Management SystemNTP Network Time Protocol

Corporate Headquarters76 Blanchard Road Burlington, MA 01803 USA Toll Free USA +1 866 212 7267 T +1 781 362 4300
North America Sales Toll Free +1 855 773 9200
EuropeT +44 207 127 8147
Asia PacificT +65 68096226
Latin and Central AmericaT +52 55 4624 4842
www.arbornetworks.com
©2017 Arbor Networks, Inc. All rights reserved. Arbor Networks, the Arbor Networks logo, ArbOS and ATLAS are all trademarks of Arbor Networks, Inc. All other brands may be the trademarks of their respective owners.