world jewish population, 2012 › content › upload › bjdb › 632 › ... · 2017-05-08 ·...
TRANSCRIPT
CURRENT JEWISH POPULATION REPORTS Reprinted from the American Jewish Year Book 2012
Edited by
Arnold Dashefsky University of Connecticut
Sergio DellaPergola The Hebrew University of Jerusalem
Ira Sheskin University of Miami
Published by
North American Jewish Data Bank
in cooperation with
Jewish Federations of North America
and the
Association for the Social Scientific Study of Jewry
Number 7 - 2012
World Jewish Population, 2012
Berman Institute – North American Jewish Data Bank University of Connecticut
Sergio DellaPergolaThe Hebrew University of Jerusalem
Mandell L. Berman Institute –North American Jewish Data Bank
A Collaborative Project of the Jewish Federations of North America
and the
Center for Judaic Studies and Contemporary Jewish Life
and the
Roper Center for Public Opinion Research
both at the
University of Connecticut
Publication funded in part by a grant from The Mandell L. and Madeleine H. Berman Foundation in support of the Berman Institute – North American Jewish Data Bank.
Data Bank Staff:
Arnold Dashefsky, Director
Ron Miller, Associate Director
Cory Lebson, Associate Director for
Information Technology
Lorri Lafontaine, Program Assistant
Graphic Designer:
Carla Willey
Fact Checker:
Sarah Markowitz
Mandell L. Berman Institute
North American Jewish Data Bank
Center for Judaic Studies and
Contemporary Jewish Life
University of Connecticut
405 Babbidge Rd Unit 1205
Storrs, CT 06269-1205
Web: www.jewishdatabank.org
Email: [email protected]
copyright 2013

1
The American Jewish Year Book This Report derives from Chapter 6 of the 2012 American Jewish Year Book. The American Jewish Year Book is "The Annual Record of Jewish Civilization." This volume is a very important and prestigious annual publication because it has acted as a major resource for academic researchers, researchers at Jewish institutions and organizations, practitioners at Jewish institutions and organizations, the media, both Jewish and secular, educated leaders and lay persons, and libraries, particularly University and Jewish libraries, for up-to-date information about the American and Canadian Jewish communities. For decades, the American Jewish Year Book has been the premier place for leading academics to publish long review chapters on topics of interest to the American Jewish community.
Obtaining The American Jewish Year Book Hard bound and Kindle copies are available at www.amazon.com. Persons with access to University libraries that offer Springer’s eBook Collection can obtain a soft cover copy or an electronic copy for $25.
Table of Contents from the 2012 American Jewish Year Book The 2012 volume is 618 pages. PART ONE: REVIEW ARTICLES Chapter 1 American Jewish Secularism: Jewish Life beyond the Synagogues, Barry
Kosmin and Ariela Keysar Chapter 2 Overview of Canadian Jewry, Morton Weinfeld, Randal F. Schnoor, and
David S. Koffman Chapter 3 National Affairs, Ethan Felson Chapter 4 Jewish Communal Affairs, Lawrence Grossman Chapter 5 Jewish Population in the United States, 2012, Ira M. Sheskin and Arnold
Dashefsky Chapter 6 World Jewish Population, 2012, Sergio DellaPergola PART TWO: JEWISH INSTITUTIONS Chapter 7 Jewish Federations Chapter 8 Jewish Community Centers Chapter 9 National Jewish Organizations Chapter 10 Synagogues, College Hillels, and Jewish Day Schools Chapter 11 Jewish Overnight Camps Chapter 12 Jewish Museums Chapter 13 Holocaust Museums, Memorials, and Monuments
2
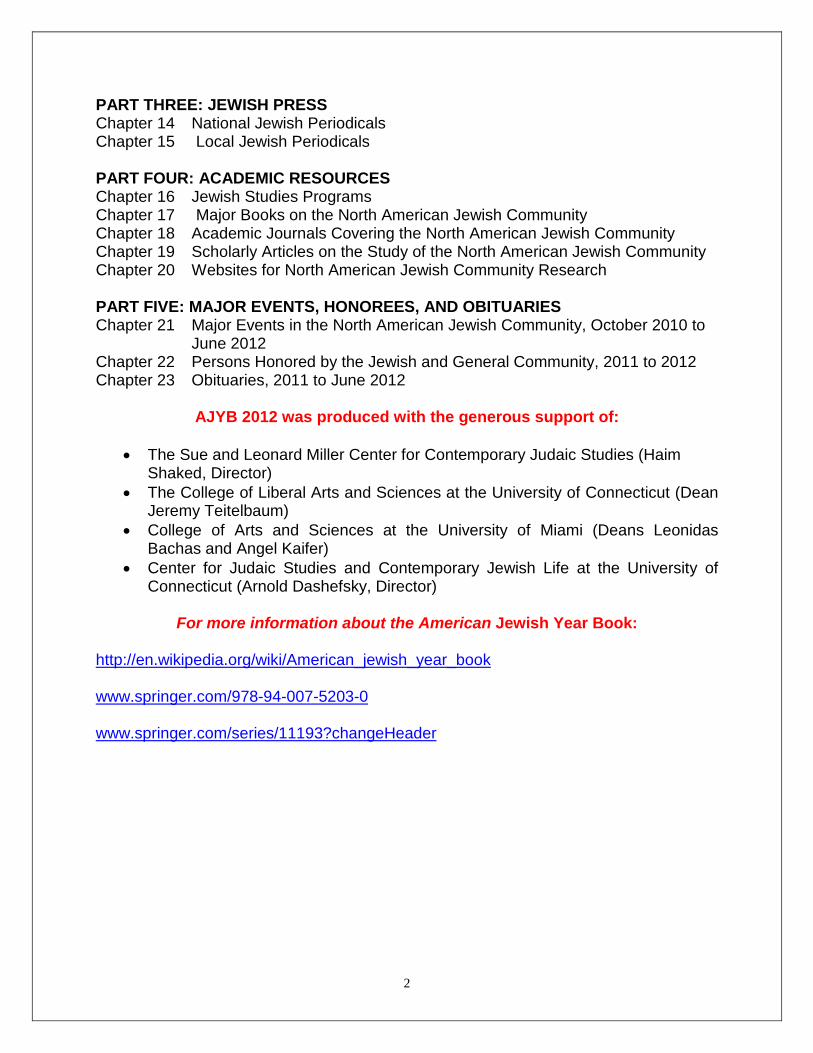
PART THREE: JEWISH PRESS Chapter 14 National Jewish Periodicals Chapter 15 Local Jewish Periodicals PART FOUR: ACADEMIC RESOURCES Chapter 16 Jewish Studies Programs Chapter 17 Major Books on the North American Jewish Community Chapter 18 Academic Journals Covering the North American Jewish Community Chapter 19 Scholarly Articles on the Study of the North American Jewish Community Chapter 20 Websites for North American Jewish Community Research PART FIVE: MAJOR EVENTS, HONOREES, AND OBITUARIES Chapter 21 Major Events in the North American Jewish Community, October 2010 to
June 2012 Chapter 22 Persons Honored by the Jewish and General Community, 2011 to 2012 Chapter 23 Obituaries, 2011 to June 2012
AJYB 2012 was produced with the generous support of:
• The Sue and Leonard Miller Center for Contemporary Judaic Studies (Haim Shaked, Director)
• The College of Liberal Arts and Sciences at the University of Connecticut (Dean Jeremy Teitelbaum)
• College of Arts and Sciences at the University of Miami (Deans Leonidas Bachas and Angel Kaifer)
• Center for Judaic Studies and Contemporary Jewish Life at the University of Connecticut (Arnold Dashefsky, Director)
For more information about the American Jewish Year Book:
http://en.wikipedia.org/wiki/American_jewish_year_book www.springer.com/978-94-007-5203-0 www.springer.com/series/11193?changeHeader
3
World Jewish Population, 2012
Sergio DellaPergola The Hebrew University of Jerusalem
Professor Emeritus
The Shlomo Argov Chair in Israel-Diaspora Relations The Avraham Harman Institute of Contemporary Jewry
Mt. Scopus, Jerusalem 91905, Israel [email protected]
4Bם י ל ש ו ר י ב ת י ר ב ע ה ה ט י ס ר ב י נ ו א ה
5BT H E H E B RE W U N I V E RSI T Y OF J E R US AL E M
4
Acknowledgments The author gratefully acknowledges the collaboration of many institutions and persons in various countries who supplied information or otherwise helped in the preparation of this Report. Special thanks are due to my colleagues at The Avraham Harman Institute of Contemporary Jewry, The Hebrew University of Jerusalem: Uzi Rebhun, Mark Tolts, Shlomit Levy, Dalia Sagi, and Judith Even. I am also indebted to (alphabetically by the respective cities): Chris Kooyman (Amsterdam), the late Ralph Weill (Basel), Jim Schwartz (Bergen County, NJ), Simon Cohn and Claude Kandiyoti (Brussels), András Kovács (Budapest), Ezequiel Erdei and Yaacov Rubel (Buenos Aires), Tally Frankental (Cape Town), Salomon Benzaquen and Tony Beker de Weinraub (Caracas), Frank Mott (Columbus, OH), Heike von Bassewitz and Ellen Rubinstein (Frankfurt a. M.), Frans van Poppel (The Hague), Barry Kosmin and Ariela Keysar (Hartford, CT), Lina Filiba (Istanbul), Steven Adler, Benjamin Anderman, Oren Cytto, Norma Gurovich, Israel Pupko, Liat Rehavi, Marina Sheps, and Emma Trahtenberg (Jerusalem), David Saks (Johannesburg), David Graham and Marlena Schmool (London), Bruce Phillips (Los Angeles), Judit Bokser Liwerant, Susana Lerner, and Mauricio Lulka (Mexico City), Sarah Markowitz and Ira M. Sheskin (Miami), Rafael Porzecanski (Montevideo), Evgueni Andreev and Eugeni Soroko (Moscow), David Bass (Neveh Daniel), the late Vivian Z. Klaff (Newark, DE), and Alberto Senderey, and the late Doris Bensimon-Donat (Paris), Allen Glicksman (Philadelphia), Sidney Goldstein and Alice Goldstein (Providence, RI), Laurence Kotler-Berkowitz (Providence, RI), Erik H. Cohen (Ramat Gan), Gloria Arbib and Alberto Levy (Rome), René Decol and Alberto Milkewitz (São Paulo), Arnold Dashefsky (Storrs, CT), Gary Eckstein (Sydney), Gustave Goldman (Toronto), Jeffrey Scheckner (Union, NJ), Thomas Buettner and Hania Zlotnik (United Nations, NY), Sylvia Barack Fishman, Leonard Saxe, Charles Kadushin, and Benjamin Phillips (Waltham, MA), and Barry R. Chiswick and Carmel U. Chiswick (Washington, DC).
5
TABLE OF CONTENTS PAGE
Executive Summary 6 Fundamentals of Jewish Population Change 8 Definitions 10 Data Sources 14 0BPresentation and Quality of Data 1B15 2BWorld Jewish Population Size and Distribution 3B17 Major Regions and Countries 20 Jews in Major Cities 24 Determinants and Consequences of Jewish Population Change 26 International Migration 26 Marriages, Births, and Deaths 27 Conversions 32 Age Composition 33 Demographic Implications 35 Jewish Population by Country 36 The Americas 36 The United States 36 Canada 42 Central and South America 44 Europe 45 The European Union 46 The Former Soviet Union 49 Other European Countries 51 Asia 51 Israel 51 Other Asian Countries 55 Africa 55 Oceania 56 Dispersion and Concentration 56 Outlook 57 Appendix: Jewish Population by Country, 1/1/2010 59 Author Biography 63 Notes 63
6
WORLD JEWISH POPULATION, 2012
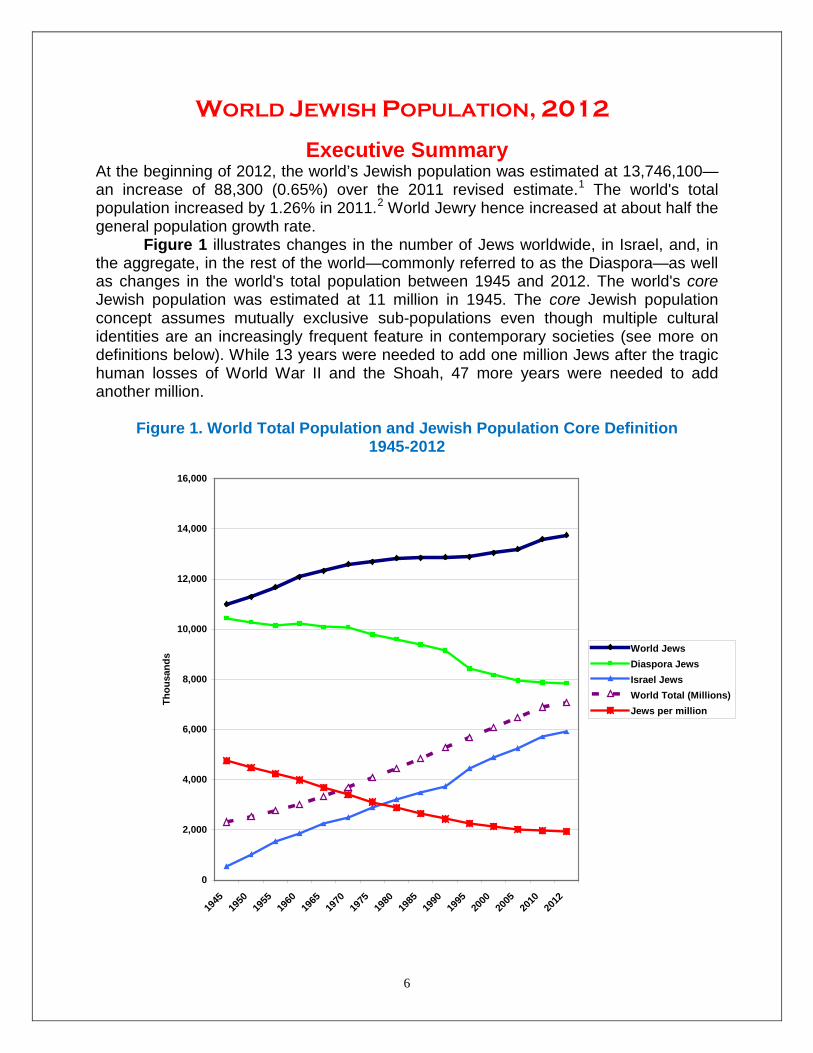
Executive Summary At the beginning of 2012, the world’s Jewish population was estimated at 13,746,100—an increase of 88,300 (0.65%) over the 2011 revised estimate.1 The world's total population increased by 1.26% in 2011.2 World Jewry hence increased at about half the general population growth rate.
Figure 1 illustrates changes in the number of Jews worldwide, in Israel, and, in the aggregate, in the rest of the world—commonly referred to as the Diaspora—as well as changes in the world's total population between 1945 and 2012. The world's core Jewish population was estimated at 11 million in 1945. The core Jewish population concept assumes mutually exclusive sub-populations even though multiple cultural identities are an increasingly frequent feature in contemporary societies (see more on definitions below). While 13 years were needed to add one million Jews after the tragic human losses of World War II and the Shoah, 47 more years were needed to add another million.
Figure 1. World Total Population and Jewish Population Core Definition
1945-2012
0
2,000
4,000
6,000
8,000
10,000
12,000
14,000
16,000
1945
1950
1955
1960
1965
1970
1975
1980
1985
1990
1995
2000
2005
2010
2012
Thou
sand
s
World JewsDiaspora JewsIsrael JewsWorld Total (Millions)Jews per million
7
Since 1970, world Jewry practically stagnated at zero population growth, with some recovery during the first decade of the 21st century. This was the result of the combination of two very different demographic trends in Israel and the Diaspora. Israel's Jewish population increased linearly from an initial one-half million in 1945 to 5.9 million in 2012. The Diaspora, from an initial 10.5 million in 1945, was quite stable until the early 1970s, when it started decreasing to the current 7.8 million. The world's total population increased nearly threefold from 2.315 billion in 1945 to 7.075 billion in 2012. Thus, the relative share of Jews among the world’s total population steadily diminished from 4.75 per 1,000 in 1945 to 1.94 per 1,000 currently.
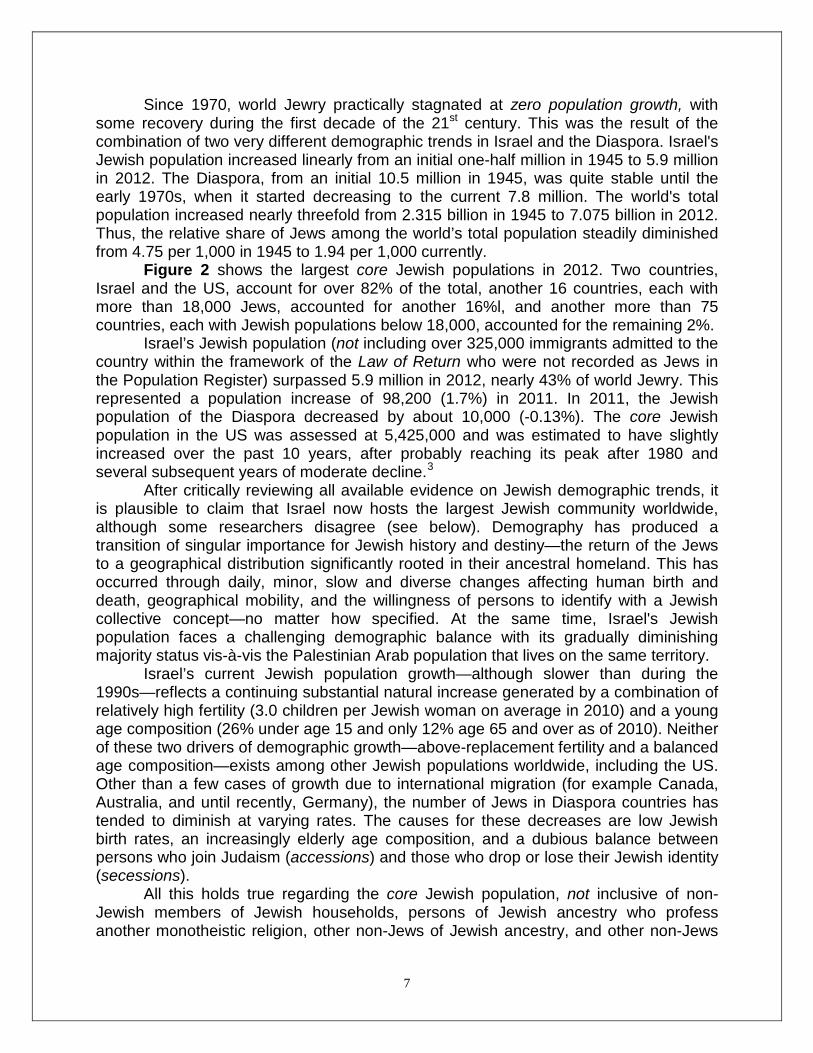
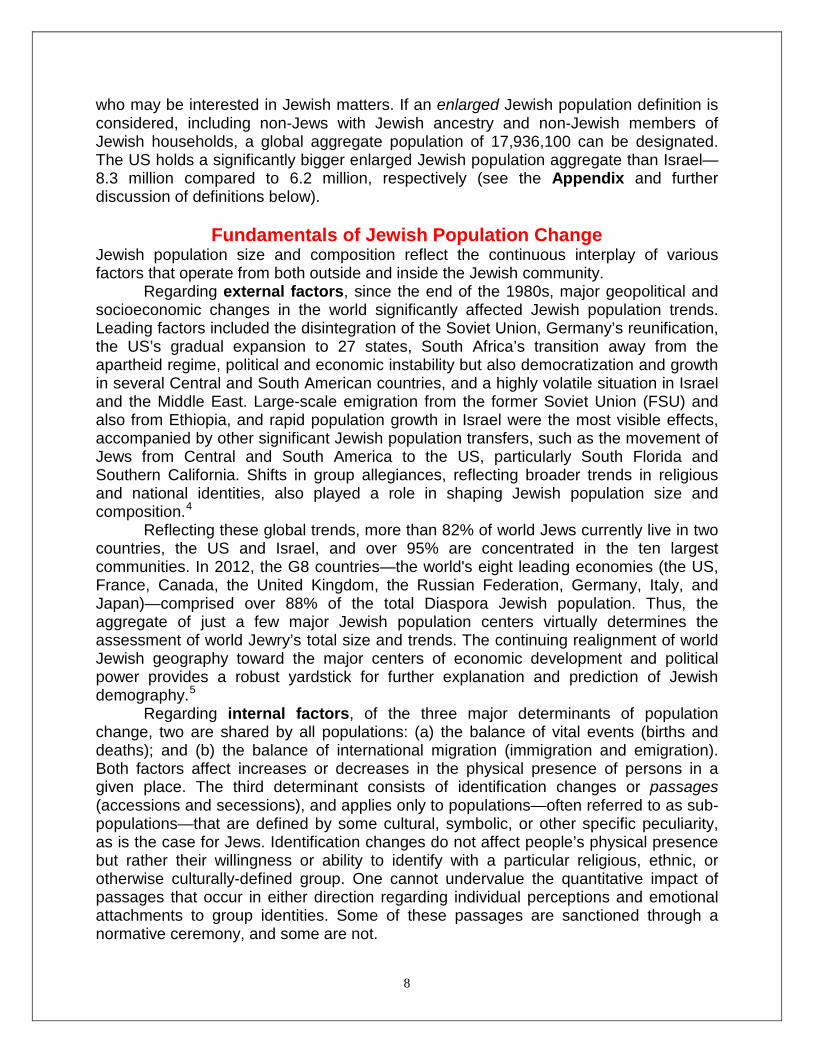
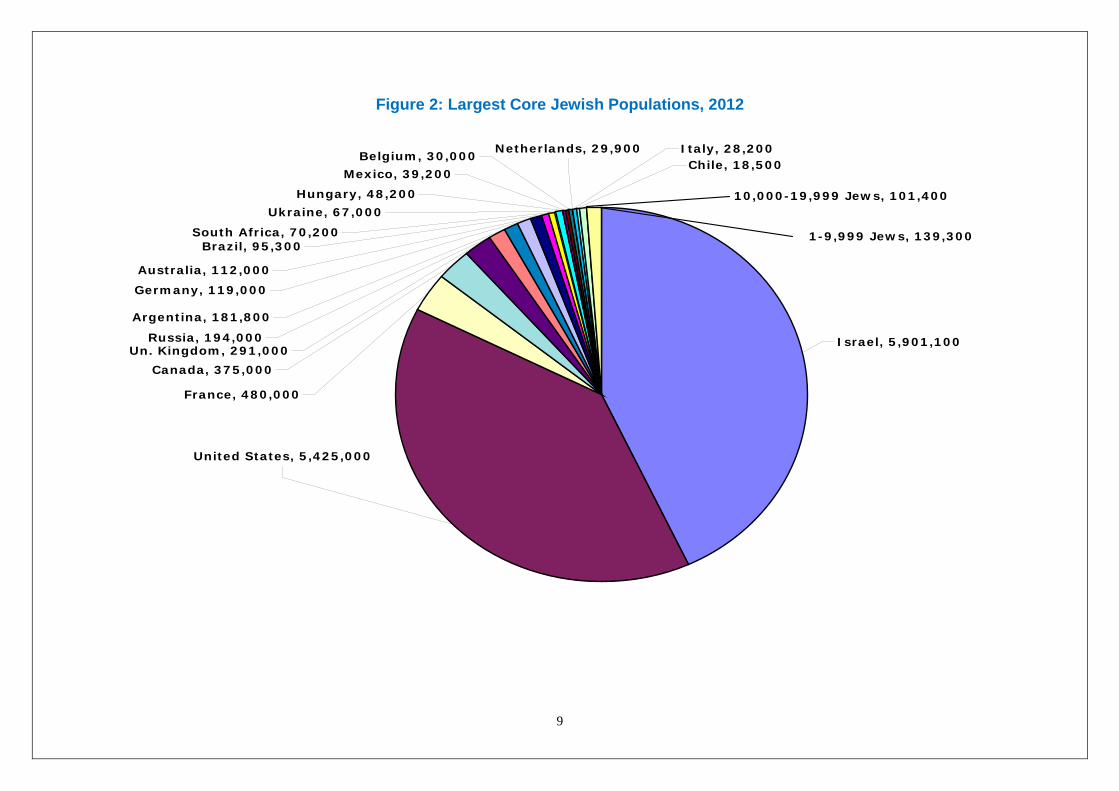
Figure 2 shows the largest core Jewish populations in 2012. Two countries, Israel and the US, account for over 82% of the total, another 16 countries, each with more than 18,000 Jews, accounted for another 16%l, and another more than 75 countries, each with Jewish populations below 18,000, accounted for the remaining 2%.
Israel’s Jewish population (not including over 325,000 immigrants admitted to the country within the framework of the Law of Return who were not recorded as Jews in the Population Register) surpassed 5.9 million in 2012, nearly 43% of world Jewry. This represented a population increase of 98,200 (1.7%) in 2011. In 2011, the Jewish population of the Diaspora decreased by about 10,000 (-0.13%). The core Jewish population in the US was assessed at 5,425,000 and was estimated to have slightly increased over the past 10 years, after probably reaching its peak after 1980 and several subsequent years of moderate decline.3
After critically reviewing all available evidence on Jewish demographic trends, it is plausible to claim that Israel now hosts the largest Jewish community worldwide, although some researchers disagree (see below). Demography has produced a transition of singular importance for Jewish history and destiny—the return of the Jews to a geographical distribution significantly rooted in their ancestral homeland. This has occurred through daily, minor, slow and diverse changes affecting human birth and death, geographical mobility, and the willingness of persons to identify with a Jewish collective concept—no matter how specified. At the same time, Israel's Jewish population faces a challenging demographic balance with its gradually diminishing majority status vis-à-vis the Palestinian Arab population that lives on the same territory.
Israel’s current Jewish population growth—although slower than during the 1990s—reflects a continuing substantial natural increase generated by a combination of relatively high fertility (3.0 children per Jewish woman on average in 2010) and a young age composition (26% under age 15 and only 12% age 65 and over as of 2010). Neither of these two drivers of demographic growth—above-replacement fertility and a balanced age composition—exists among other Jewish populations worldwide, including the US. Other than a few cases of growth due to international migration (for example Canada, Australia, and until recently, Germany), the number of Jews in Diaspora countries has tended to diminish at varying rates. The causes for these decreases are low Jewish birth rates, an increasingly elderly age composition, and a dubious balance between persons who join Judaism (accessions) and those who drop or lose their Jewish identity (secessions).
All this holds true regarding the core Jewish population, not inclusive of non-Jewish members of Jewish households, persons of Jewish ancestry who profess another monotheistic religion, other non-Jews of Jewish ancestry, and other non-Jews
8
who may be interested in Jewish matters. If an enlarged Jewish population definition is considered, including non-Jews with Jewish ancestry and non-Jewish members of Jewish households, a global aggregate population of 17,936,100 can be designated. The US holds a significantly bigger enlarged Jewish population aggregate than Israel—8.3 million compared to 6.2 million, respectively (see the Appendix and further discussion of definitions below).
Fundamentals of Jewish Population Change Jewish population size and composition reflect the continuous interplay of various factors that operate from both outside and inside the Jewish community. Regarding external factors, since the end of the 1980s, major geopolitical and socioeconomic changes in the world significantly affected Jewish population trends. Leading factors included the disintegration of the Soviet Union, Germany’s reunification, the US’s gradual expansion to 27 states, South Africa’s transition away from the apartheid regime, political and economic instability but also democratization and growth in several Central and South American countries, and a highly volatile situation in Israel and the Middle East. Large-scale emigration from the former Soviet Union (FSU) and also from Ethiopia, and rapid population growth in Israel were the most visible effects, accompanied by other significant Jewish population transfers, such as the movement of Jews from Central and South America to the US, particularly South Florida and Southern California. Shifts in group allegiances, reflecting broader trends in religious and national identities, also played a role in shaping Jewish population size and composition.4 Reflecting these global trends, more than 82% of world Jews currently live in two countries, the US and Israel, and over 95% are concentrated in the ten largest communities. In 2012, the G8 countries—the world's eight leading economies (the US, France, Canada, the United Kingdom, the Russian Federation, Germany, Italy, and Japan)—comprised over 88% of the total Diaspora Jewish population. Thus, the aggregate of just a few major Jewish population centers virtually determines the assessment of world Jewry’s total size and trends. The continuing realignment of world Jewish geography toward the major centers of economic development and political power provides a robust yardstick for further explanation and prediction of Jewish demography.5 Regarding internal factors, of the three major determinants of population change, two are shared by all populations: (a) the balance of vital events (births and deaths); and (b) the balance of international migration (immigration and emigration). Both factors affect increases or decreases in the physical presence of persons in a given place. The third determinant consists of identification changes or passages (accessions and secessions), and applies only to populations—often referred to as sub-populations—that are defined by some cultural, symbolic, or other specific peculiarity, as is the case for Jews. Identification changes do not affect people’s physical presence but rather their willingness or ability to identify with a particular religious, ethnic, or otherwise culturally-defined group. One cannot undervalue the quantitative impact of passages that occur in either direction regarding individual perceptions and emotional attachments to group identities. Some of these passages are sanctioned through a normative ceremony, and some are not.
9
Figure 2: Largest Core Jewish Populations, 2012
France, 480,000
Canada, 375,000
United States, 5,425,000
Chile, 18,500
Un. Kingdom, 291,000
Germany, 119,000
Argentina, 181,800
Russia, 194,000 Israel, 5,901,100
Australia, 112,000
Italy, 28,200Netherlands, 29,900
Ukraine, 67,000
South Africa, 70,200
Hungary, 48,200
Belgium, 30,000Mexico, 39,200
Brazil, 95,3001-9,999 Jews, 139,300
10,000-19,999 Jews, 101,400
10
The Jewish population data for 2012 presented in this Report were updated from 2011 and previous years in accordance with known or estimated changes in vital events, migrations, and Jewish identification patterns. In the updating procedure, when data on intervening changes were available, empirically ascertained or assumed, directions of change were applied accordingly and consistently added to or subtracted from previous estimates. If the evidence was that intervening changes balanced one another, Jewish population size was not changed. This procedure has proven highly effective. Most often, when improved Jewish population estimates reflecting a new census or socio-demographic survey became available, our annually updated estimates proved to be on target. The research findings reported here tend to confirm the estimates reported in previous years and, perhaps more importantly, a coherent interpretation of the trends now prevailing in world Jewish demography. 5F
6 Concisely stated, a positive balance of Jewish vital events (births and deaths) is seen in Israel and a negative balance in nearly all other countries; a positive migration balance is seen in Israel, the US, Canada, Australia, very marginally in Germany, and in a few other Western countries, while a negative migration balance prevails in Central and South America, South Africa, Eastern Europe, Muslim countries, and several countries in Western Europe; Israel sees a positive balance of accessions to Judaism over secessions, and an often negative, or, in any event, rather uncertain, balance prevails elsewhere. While allowing for improvements and corrections, the 2012 population estimates highlight the increasing complexity of socio-demographic and identification factors underlying Jewish population patterns. This complexity is magnified at a time of pervasive internal and international migration and increasing transnationalism, sometimes implying bi-local residences and, thus, a double counting of people on the move or who permanently share their time between different places. Even more intriguing can be the position of persons who hold more than one cultural identity and may periodically shift from one to another. Available data sources only imperfectly allow documenting these complexities, hence estimates of Jewish population sizes are far from perfect. Some errors can be corrected at a later stage. Consequently, analysts should resign themselves to the paradox of the permanently provisional nature of Jewish population estimates.
Definitions A major problem with Jewish population estimates produced by individual scholars or Jewish organizations is the lack of uniformity in definitional criteria—when the issue of defining the Jewish population is addressed at all. The problem is magnified when one tries to address the Jewish population globally, trying to provide a coherent and uniform definitional framework to Jews who live in very different institutional, cultural and socioeconomic environments. The study of a Jewish population (or of any other population subgroup) requires solving three main problems:
1) defining the target group on the basis of conceptual or normative criteria aimed at providing the best possible description of that group—which in the case of Jewry is no minor task in itself;
2) identifying the group thus defined based on tools that operationally allow for distinguishing and selecting the target group from the rest of the population—through membership lists, surnames, areas of residence, or other random or non-random procedures; and
11
3) covering the target group through appropriate field work—in person, by telephone, by Internet, or otherwise. Most often in the actual experience of social research, the definitional task is performed at the stage of identification; and the identificational task is performed at the stage of actual fieldwork.
It thus clearly appears that the quantitative study of Jewish populations relies only on operational, not normative, definitional criteria. Its conceptual aspects, far from pure theory, heavily depend on practical and logistical feasibility. The ultimate empirical step—obtaining relevant data from relevant persons—crucially reflects the readiness of people to cooperate in the data collection effort. In recent years, as cooperation rates have decreased in social surveys, the amount, content, and validity of information gathered have been affected detrimentally. These declining cooperation rates reflect the identification outlook of the persons who are part of the target population—that outlook which is itself an integral part of the investigation. No method exists to break this vicious cycle. Therefore, research findings reflect, with varying degrees of sophistication, only that which is possible to uncover. Anything that cannot be uncovered directly can sometimes be estimated through various imperfect techniques. Beyond that, we enter the virtual world of myths, hopes, fears, and corporate interests. No way exists to demonstrate the actual nature of some of these claims—at least not within the limits of a non-fictional work such as this. Keeping this in mind, four major definitional concepts should be considered to provide serious comparative foundations to the study of Jewish demography (Figure 3). In most Diaspora countries, the concept of core Jewish population7 includes all persons who, when asked in a socio-demographic survey, identify themselves as Jews; or who are identified as Jews by a respondent in the same household, and do not have another monotheistic religion. Such a definition of a person as a Jew, reflecting subjective perceptions, broadly overlaps but does not necessarily coincide with Halakhah (Jewish law) or other normatively binding definitions. Inclusion does not depend on any measure of that person’s Jewish commitment or behavior in terms of religiosity, beliefs, knowledge, communal affiliation, or otherwise. The core Jewish population includes people who identify as Jews by religion, as well as others who are not interested in religion but see themselves as Jews by ethnicity or by other cultural criteria. Some others do not even recognize themselves as Jews when asked, but they descend from Jewish parents and do not hold another religious identity. All of these are considered to be part of the core Jewish population which also includes all converts to Judaism by any procedure, as well as other people who declare they are Jewish even without conversion. Persons of Jewish parentage who adopted another monotheistic religion are usually excluded, as are persons of Jewish origin who in censuses or socio-demographic surveys explicitly identify with a non-Jewish religious group without having formally converted out. The core concept offers an intentionally comprehensive and pragmatic approach reflecting the nature of many available demographic data sources. In the Diaspora, such data often derive from population censuses or socio-demographic surveys where interviewees have the option to decide how to answer relevant questions on religious or ethnic identities. In Israel, personal status is subject to the rulings of the Ministry of the Interior, which relies on criteria established by rabbinic authorities and by the Israeli Supreme Court.8 In Israel, therefore, the core Jewish population does not simply express subjective
12
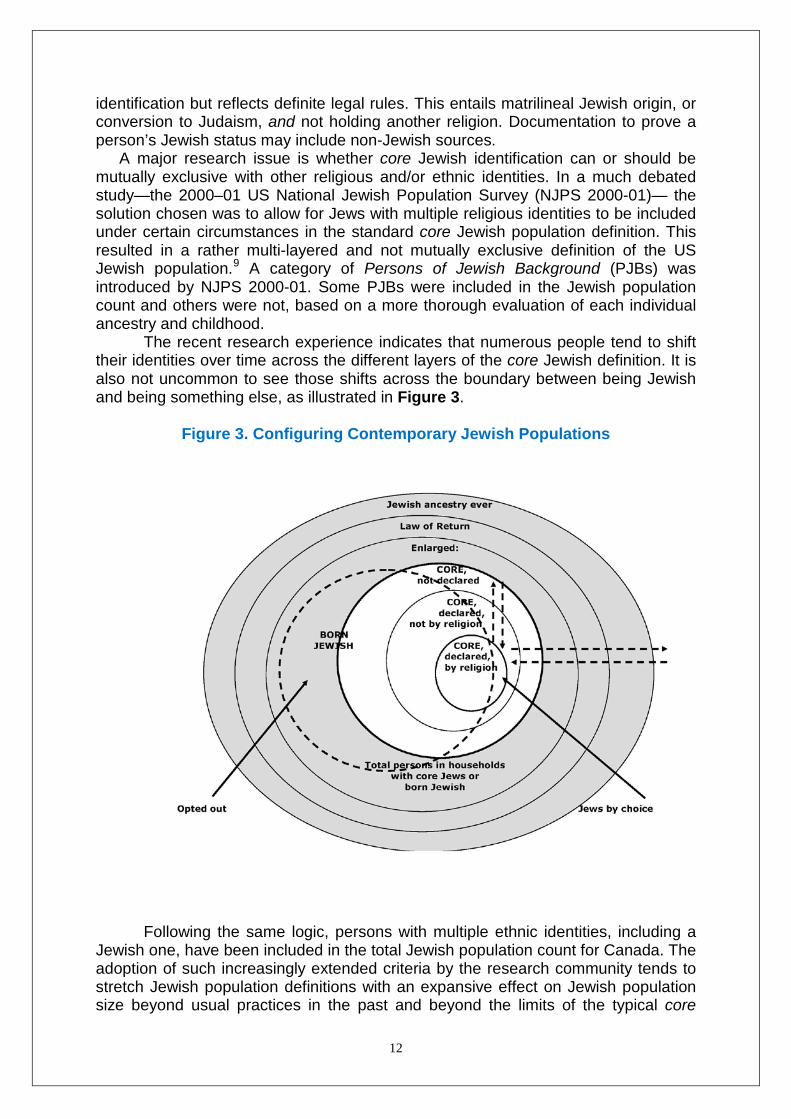
identification but reflects definite legal rules. This entails matrilineal Jewish origin, or conversion to Judaism, and not holding another religion. Documentation to prove a person’s Jewish status may include non-Jewish sources. A major research issue is whether core Jewish identification can or should be mutually exclusive with other religious and/or ethnic identities. In a much debated study—the 2000–01 US National Jewish Population Survey (NJPS 2000-01)— the solution chosen was to allow for Jews with multiple religious identities to be included under certain circumstances in the standard core Jewish population definition. This resulted in a rather multi-layered and not mutually exclusive definition of the US Jewish population.9 A category of Persons of Jewish Background (PJBs) was introduced by NJPS 2000-01. Some PJBs were included in the Jewish population count and others were not, based on a more thorough evaluation of each individual ancestry and childhood. The recent research experience indicates that numerous people tend to shift their identities over time across the different layers of the core Jewish definition. It is also not uncommon to see those shifts across the boundary between being Jewish and being something else, as illustrated in Figure 3.
Figure 3. Configuring Contemporary Jewish Populations
Following the same logic, persons with multiple ethnic identities, including a Jewish one, have been included in the total Jewish population count for Canada. The adoption of such increasingly extended criteria by the research community tends to stretch Jewish population definitions with an expansive effect on Jewish population size beyond usual practices in the past and beyond the limits of the typical core
13
definition. These procedures may respond to local needs and sensitivities but tend to limit the actual comparability of the same Jewish population over time and of different Jewish populations at one given time. The concept of an enlarged Jewish population10 includes the sum of (a) the core Jewish population; (b) all other persons of Jewish parentage who—by core Jewish population criteria—are not currently Jewish (non-Jews with Jewish background); and (c) all respective non-Jewish household members (spouses, children, etc.). Non-Jews with Jewish background, as far as they can be ascertained, include: (a) persons who have adopted another religion, or otherwise opted out, although they may claim to be also Jewish by ethnicity or in some other way—with the caveat just mentioned for recent US and Canadian data; and (b) other persons with Jewish parentage who disclaim being Jewish. As noted, most PJBs who are not part of the core Jewish population naturally pertain under the enlarged definition.11 In this Report, for the first time we have made an effort to evaluate the possible extent of the enlarged Jewish population in each country of the world. The result is a tentative global total of 17,936,100, inclusive of 13,746,100 Jews and 4,190,000 self-described non-Jews, holders of a non-Jewish religion or sometimes a non-Jewish ethnicity, who live in the same households with at least one core Jew. Of these roughly estimated 4,190,000 non-Jews, 2,875,000 (69%) live in the US, 325,000 (8%) live in Israel, 272,700 (6%) live in the republics of the Former Soviet Union, and 717,300 (17%) live in other countries. The Law of Return, Israel’s distinctive legal framework for the acceptance and absorption of new immigrants, awards Jewish new immigrants immediate citizenship and other civil rights. According to the current, amended version of the Law of Return,12 a Jew is any person born to a Jewish mother or converted to Judaism (regardless of denomination—Orthodox, Conservative, Reconstructionist, or Reform), who does not have another religious identity. By ruling of Israel’s Supreme Court, conversion from Judaism, as in the case of some ethnic Jews who currently identify with another religion, entails loss of eligibility for Law of Return purposes. The Falash Mura—a group of Ethiopian non-Jews of Jewish ancestry—must undergo conversion to be eligible for the Law of Return. The law as such does not affect a person’s Jewish status—which, as noted, is adjudicated by Israel’s Ministry of Interior and rabbinic authorities—but only the specific benefits available under the Law of Return. This law extends its provisions to all current Jews, their children, and grandchildren, as well as to their respective Jewish or non-Jewish spouses. As a result of its three-generation and lateral extension, the Law of Return applies to a large population—the so called aliyah eligible—whose scope is significantly wider than the core and enlarged Jewish populations defined above.13 It is actually quite difficult to estimate the total size of the Law of Return population. These higher estimates are not discussed below systematically. Some major Jewish organizations in Israel and the US—such as the Jewish Agency for Israel, the American Jewish Joint Distribution Committee, and the major Jewish Federations in the US—sponsor data collection and tend to influence the rules of research, rendering them more complex. Organizations are motivated by their mission toward their respective constituencies rather than by pure scientific criteria. In turn, the understandable interest of organizations to function and secure budgetary resources tends to influence them to cover Jewish populations increasingly similar to the enlarged and Law of Return definitions rather than to the core definition.
14
Some past socio-demographic surveys, by investigating people who were born or were raised or are currently Jewish, may have reached a population that ever was Jewish, regardless of its present identification. It is indeed customary in socio-demographic surveys to consider the religio-ethnic identification of parents. Some censuses, however, do ask about more distant ancestry. For both conceptual and practical reasons, the enlarged definition usually does not include other non-Jewish relatives who lack a Jewish background and live in exclusively non-Jewish households. Historians might wish to engage in the study of the number of Jews who ever lived and how many persons today are the descendants of those Jews—for example Conversos who lived in the Iberian Peninsula during the Middle Ages. The early Jewish backgrounds of some population groups have been uncovered in recent studies of population genetics.14 These long-term issues and analyses are beyond the purpose of the present Report. The estimates presented below of Jewish population distribution worldwide and in each continent, individual country, and major metropolitan area consistently aim at the concept of core Jewish population (Tables 1-5 and the Appendix). The core definition is indeed the necessary starting point for any admittedly relevant elaboration about the enlarged definition, which as noted is also estimated in the Appendix, or even broader definitions such as the Law of Return.
Data Sources Data on population size, characteristics, and trends are a primary tool in the evaluation of Jewish community needs and prospects at the local level, nationally, and internationally. The estimates for major regions and individual countries reported herein reflect a prolonged and continuing effort to study scientifically the demography of contemporary world Jewry. Data collection and comparative research have benefited from the collaboration of scholars and institutions in many countries, including replies to direct inquiries regarding current estimates.15 It should be emphasized, however, that the elaboration of worldwide estimates for the Jewish populations of the various countries is beset with difficulties and uncertainties.16 The problem of data consistency is particularly acute, given the very different legal systems and organizational provisions under which Jewish communities operate in different countries. In spite of our keen efforts to create a unified analytic framework for Jewish population studies, users of Jewish population estimates should be aware of these difficulties and of the inherent limitations of our estimates. The more recent data on Israel, the US, and the rest of world Jewry reflect updated information on Jewish population that became available following the major rounds of national censuses and Jewish socio-demographic surveys in countries with large Jewish populations from 1999–2011. This new evidence generally confirmed our previous estimates, but sometimes suggested upward or downward revisions. Over the past decades, the data available for a critical assessment of the worldwide Jewish demographic picture have expanded significantly. Some of this ongoing research is part of a coordinated effort aimed at updating the profile of world Jewry.17 While the quantity and quality of documentation on Jewish population size and characteristics are still far from satisfactory, over the past twenty years important new data and estimates were released for several countries through official population censuses and Jewish-sponsored socio-demographic surveys.
15
Since 1991, one or more National censuses have yielded results on Jewish populations in European countries like Austria, Belarus, Bulgaria, Croatia, the Czech Republic, Estonia, Hungary, Ireland, Lithuania, Latvia, Macedonia, Moldova, Poland, Romania, the Russian Federation, Serbia, Switzerland, the United Kingdom, and Ukraine; countries in Asia like Azerbaijan, Georgia, India, Israel, Kazakhstan, Kyrgyzstan, and Tajikistan; countries in Africa like South Africa; countries in the Americas like Canada, Brazil, and Mexico; and countries in Oceania like Australia and New Zealand. Further information will become available from several countries undertaking their national censuses in 2010, 2011, and 2012. Population censuses in the US do not provide information on religion, but have furnished relevant data on countries of birth, spoken languages, and ancestry. Permanent national population registers, including information on Jews as one of several documented religious, ethnic, or national groups, exist in several European countries (Estonia, Finland, Latvia, Lithuania, Norway, and Switzerland) and in Israel. In addition, independent socio-demographic studies have provided valuable information on Jewish demography and socioeconomic stratification, as well as on Jewish identification. Socio-demographic surveys were conducted over the past several years in South Africa (1991 and 1998); Mexico (1991, 2000 and 2006); Lithuania (1993); Chile and the United Kingdom (1995, 2001, and 2011); Venezuela (1998–99); Guatemala, Hungary, and the Netherlands (1999); Moldova and Sweden (2000); France and Turkey (2002); Argentina (2003, 2004, and 2005); and Israel (1990, 1999, and 2011, besides the yearly National Social Survey). In the US, important new insights were provided by several large surveys: the National Jewish Population Survey (NJPS 2000–01, following NJPS 1971 and NJPS 1990), the American Jewish Identity Survey (AJIS 2001 and 2008), and the Heritage, Ancestry, and Religious Identity Survey (HARI 2001-02). Smaller Jewish samples can be obtained from the General Social Survey and similar national studies. Two major national studies including fairly large Jewish samples are the American Religious Identification Survey (ARIS 2008) and the Pew Forum on Religion and Public Life (2008). Moreover, numerous Jewish population studies were separately conducted in major cities in the US18 (notably in Chicago in 2001 and 2010, New York City in 2002 and 2011, Washington, DC in 2003, Miami in 2004, Palm Beach County (FL) in 2005, Boston in 2005—the fifth decennial study in that metropolitan area, and Philadelphia in 2009), as well as in other countries. Additional evidence on Jewish population trends comes from the systematic monitoring of membership registers, vital statistics, and migration records available from Jewish communities and other Jewish organizations in many countries or cities, notably in Buenos Aires, Germany, Italy, São Paulo, and the United Kingdom. Detailed data on Jewish immigration routinely collected in Israel help to assess Jewish population changes in other countries. It is quite evident that the cross-matching of more than one type of source about the same Jewish population, although not frequently feasible, can provide either mutual reinforcement of, or important critical insights into the available data.
Presentation and Quality of Data Estimates in this Report refer to January 1 of the current year. Efforts to provide the most recent possible picture entail a short span of time for evaluation of available information, hence a somewhat greater margin of inaccuracy. Indeed, where appropriate, we revised our previous estimates in light of newly acquired information (Tables 1-2). Corrections were also applied retroactively to the 2010 and 2011 totals
16
for major geographical regions so as to ensure a better base for comparisons with the 2012 estimates. Corrections of the latest estimates, if needed, will be presented in the future.
We provide separate estimates for each country with approximately 100 or more resident core Jews. Estimates of Jews in smaller communities have been added to some of the continental totals. For each country, we provide in the Appendix an estimate of mid-year 2011 total (both Jewish and non-Jewish) country population,19 the estimated January 1, 2012 core Jewish population, the number of Jews per 1,000 total population, and a rating of the accuracy of the Jewish population estimate. The last column provides a rough estimate of the enlarged Jewish population. The quality of such enlarged estimates is usually lower than that of the respective core Jewish populations.
A wide variation exists in the quality of the Jewish population estimates for different countries. For many Diaspora countries, it might be best to indicate a range (minimum, maximum) rather than a definite estimate for the number of Jews. It would be confusing, however, for the reader to be confronted with a long list of ranges; this would also complicate the regional and world totals. The estimates reported for most of the Diaspora communities should be understood as being the central value of the plausible range for the respective core Jewish populations. The relative magnitude of this range varies inversely with the accuracy of the estimate. One issue of growing significance is related to persons who hold multiple residences in different countries. Based on available evidence, we make efforts to avoid double counts. Wherever possible we strive to assign people to their country of permanent residence, ignoring the effect of part-time residents. The three main elements that affect the accuracy of each estimate are: (a) the nature and quality of the base data, (b) how recent the base data are, and (c) the updating method. A simple code combines these elements to provide a general evaluation of the reliability of data reported in the detailed tables below. The code in the Appendix indicates different quality levels of the reported estimates:
(A) Base estimate derived from a national census or reliable Jewish population survey; updated on the basis of full or partial information on Jewish population movements in the respective country during the intervening period.
(B) Base estimate derived from less accurate but recent national Jewish population data; updated on the basis of partial information on Jewish population movements during the intervening period.
(C) Base estimate derived from less recent sources and/or unsatisfactory or partial coverage of a country’s Jewish population; updated on the basis of demographic information illustrative of regional demographic trends.
(D) Base estimate essentially speculative; no reliable updating procedure. In categories (A), (B), and (C), the year in which the country’s base estimate or important partial updates were obtained is also stated. This is not the current estimate's date but the basis for its attainment. An X is appended to the accuracy rating for several countries, notably including the US, whose Jewish population estimate for 2012 was not only updated but also revised in light of improved information.
17
One additional tool for updating Jewish population estimates is provided by several sets of demographic projections developed by the Division of Jewish Demography and Statistics at the Institute of Contemporary Jewry of The Hebrew University of Jerusalem.20 Such projections, based on available data on Jewish population composition by age and sex, extrapolate the most recently observed or expected Jewish population trends over the first decade of the 21st century. Even where reliable information on the dynamics of Jewish population change is not available, the powerful connection that generally exists between age composition, birth rates, death rates, and migration helps provide plausible scenarios for the developments bound to occur in the short term. Where better data were lacking, we used indications from these projections to refine the 2012 estimates against previous years. It should be acknowledged that projections are clearly shaped by a comparatively limited set of assumptions and need to be periodically updated in light of actual demographic developments.
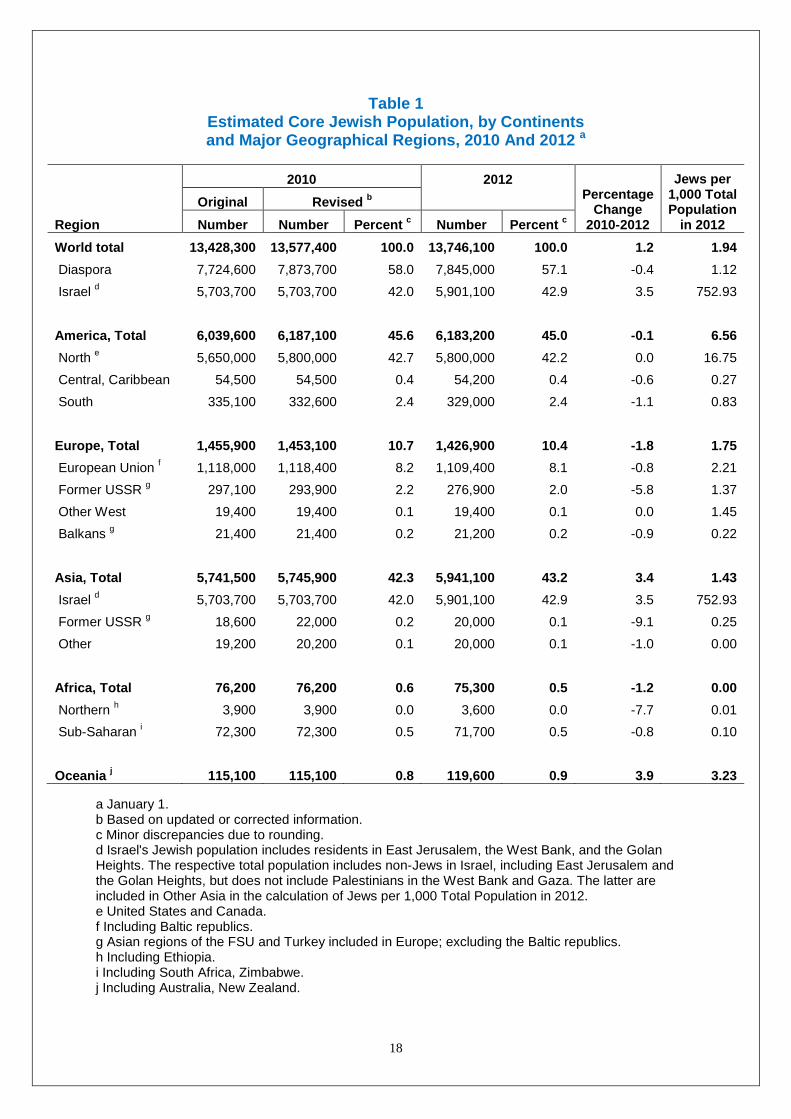
World Jewish Population Size and Distribution The size of world Jewry at the beginning of 2012 was assessed at 13,746,100. World Jewry constituted 1.94 per 1,000 of the world’s total population of 7.075 billion. One in about 514 people in the world is a Jew (Table 1). According to the revised estimates, between January 1, 2011 and January 1, 2012, the Jewish population increased by an estimated 88,300 persons, or about 0.65%. This compares with a total world population growth rate of 1.26% (0.1% in more developed countries, 1.5% in less developed countries). Despite the imperfections in Jewish population estimates, world Jewry continued to be close to zero population growth, with the increase in Israel (1.7%) overcoming the decrease in the Diaspora (–0.13%). Table 1 offers an overall picture of the Jewish population at the beginning of 2012 as compared to 2010. For 2010, the originally published estimates are presented as are somewhat revised estimates that reflect retroactive corrections made in certain country estimates, given improved information. These corrections resulted in a net increase of 149,100 persons in the 2010 world Jewry estimate. Most of the correction concerns the US. Explanations are given below for these corrections. The number of Jews in Israel increased from 5,703,700 in 2010 to 5,901,100 at the beginning of 2012, a bi-annual increase of 197,400, or 3.5%. In contrast, the estimated Jewish population in the Diaspora decreased from 7,873,700 (according to the revised estimates) to 7,845,000—a bi-annual decrease of 28,700, or –0.4%. These changes reflect continuing Jewish emigration from the former Soviet Union and other countries to Israel, and the internal decrease typical of the aggregate of Diaspora Jewry. In 2011, out of a total growth of 98,100 core Jews, 86,700 reflected the balance of births and deaths, and 11,400 the estimated Israel-Diaspora net migration balance (immigration minus emigration, plus a relatively small balance of conversions.21 This estimate includes tourists who changed their status to immigrants and Israeli citizens born abroad who entered Israel for the first time. Therefore, internal demographic change produced nearly 90% of the recorded growth in Israel’s Jewish population as well as most of the Diaspora’s estimated decrease. Israel's population gained a further net migration balance of 3,300 non-Jews under the comprehensive provisions of the Israeli Law of Return and Law of Entrance.22
18
Table 1 Estimated Core Jewish Population, by Continents and Major Geographical Regions, 2010 And 2012 a
Region
2010 2012 Percentage
Change 2010-2012
Jews per 1,000 Total Population
in 2012 Original Revised b Number Number Percent c Number Percent c
World total 13,428,300 13,577,400 100.0 13,746,100 100.0 1.2 1.94 Diaspora 7,724,600 7,873,700 58.0 7,845,000 57.1 -0.4 1.12 Israel d 5,703,700 5,703,700 42.0 5,901,100 42.9 3.5 752.93 America, Total 6,039,600 6,187,100 45.6 6,183,200 45.0 -0.1 6.56 North e 5,650,000 5,800,000 42.7 5,800,000 42.2 0.0 16.75 Central, Caribbean 54,500 54,500 0.4 54,200 0.4 -0.6 0.27 South 335,100 332,600 2.4 329,000 2.4 -1.1 0.83 Europe, Total 1,455,900 1,453,100 10.7 1,426,900 10.4 -1.8 1.75 European Union f 1,118,000 1,118,400 8.2 1,109,400 8.1 -0.8 2.21 Former USSR g 297,100 293,900 2.2 276,900 2.0 -5.8 1.37 Other West 19,400 19,400 0.1 19,400 0.1 0.0 1.45 Balkans g 21,400 21,400 0.2 21,200 0.2 -0.9 0.22 Asia, Total 5,741,500 5,745,900 42.3 5,941,100 43.2 3.4 1.43 Israel d 5,703,700 5,703,700 42.0 5,901,100 42.9 3.5 752.93 Former USSR g 18,600 22,000 0.2 20,000 0.1 -9.1 0.25 Other 19,200 20,200 0.1 20,000 0.1 -1.0 0.00 Africa, Total 76,200 76,200 0.6 75,300 0.5 -1.2 0.00 Northern h 3,900 3,900 0.0 3,600 0.0 -7.7 0.01 Sub-Saharan i 72,300 72,300 0.5 71,700 0.5 -0.8 0.10 Oceania j 115,100 115,100 0.8 119,600 0.9 3.9 3.23
a January 1. b Based on updated or corrected information. c Minor discrepancies due to rounding. d Israel's Jewish population includes residents in East Jerusalem, the West Bank, and the Golan Heights. The respective total population includes non-Jews in Israel, including East Jerusalem and the Golan Heights, but does not include Palestinians in the West Bank and Gaza. The latter are included in Other Asia in the calculation of Jews per 1,000 Total Population in 2012. e United States and Canada. f Including Baltic republics. g Asian regions of the FSU and Turkey included in Europe; excluding the Baltic republics. h Including Ethiopia. i Including South Africa, Zimbabwe. j Including Australia, New Zealand.
19
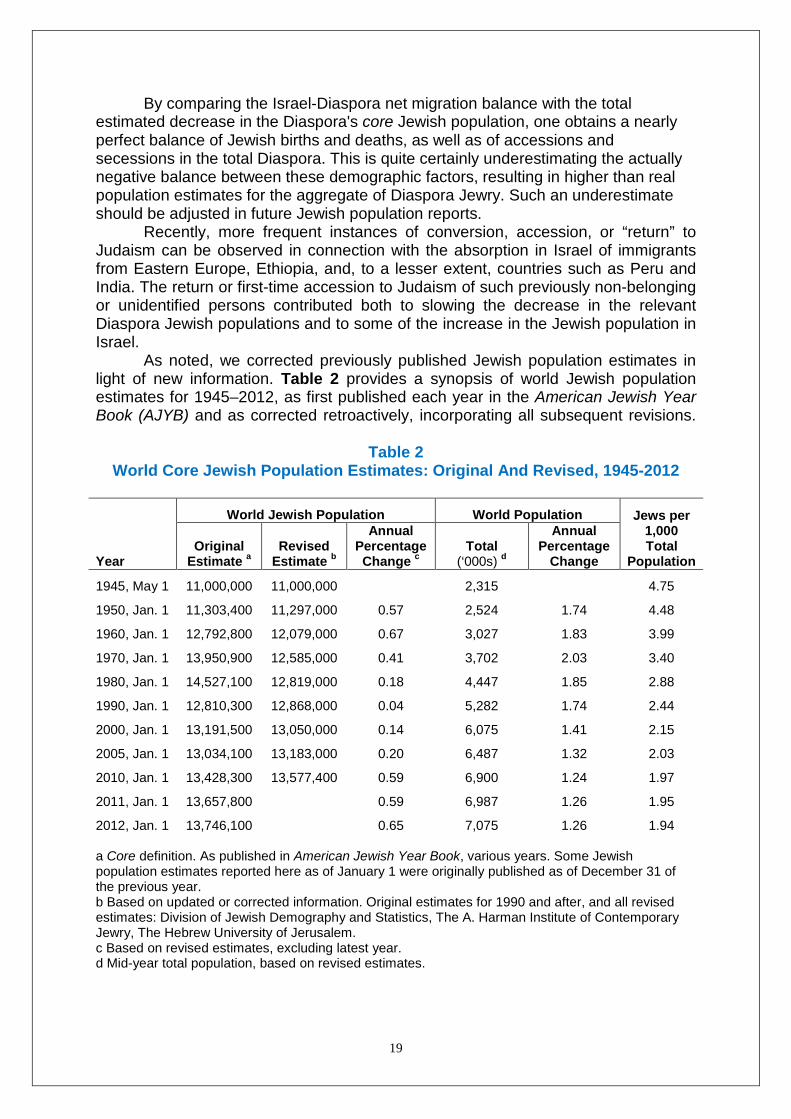
By comparing the Israel-Diaspora net migration balance with the total estimated decrease in the Diaspora's core Jewish population, one obtains a nearly perfect balance of Jewish births and deaths, as well as of accessions and secessions in the total Diaspora. This is quite certainly underestimating the actually negative balance between these demographic factors, resulting in higher than real population estimates for the aggregate of Diaspora Jewry. Such an underestimate should be adjusted in future Jewish population reports. Recently, more frequent instances of conversion, accession, or “return” to Judaism can be observed in connection with the absorption in Israel of immigrants from Eastern Europe, Ethiopia, and, to a lesser extent, countries such as Peru and India. The return or first-time accession to Judaism of such previously non-belonging or unidentified persons contributed both to slowing the decrease in the relevant Diaspora Jewish populations and to some of the increase in the Jewish population in Israel. As noted, we corrected previously published Jewish population estimates in light of new information. Table 2 provides a synopsis of world Jewish population estimates for 1945–2012, as first published each year in the American Jewish Year Book (AJYB) and as corrected retroactively, incorporating all subsequent revisions.
Table 2 World Core Jewish Population Estimates: Original And Revised, 1945-2012
Year
World Jewish Population World Population Jews per 1,000 Total
Population Original
Estimate a Revised
Estimate b
Annual Percentage Change c
Total (‘000s) d
Annual Percentage
Change
1945, May 1 11,000,000 11,000,000 2,315 4.75
1950, Jan. 1 11,303,400 11,297,000 0.57 2,524 1.74 4.48
1960, Jan. 1 12,792,800 12,079,000 0.67 3,027 1.83 3.99
1970, Jan. 1 13,950,900 12,585,000 0.41 3,702 2.03 3.40
1980, Jan. 1 14,527,100 12,819,000 0.18 4,447 1.85 2.88
1990, Jan. 1 12,810,300 12,868,000 0.04 5,282 1.74 2.44
2000, Jan. 1 13,191,500 13,050,000 0.14 6,075 1.41 2.15
2005, Jan. 1 13,034,100 13,183,000 0.20 6,487 1.32 2.03
2010, Jan. 1 13,428,300 13,577,400 0.59 6,900 1.24 1.97
2011, Jan. 1 13,657,800 0.59 6,987 1.26 1.95
2012, Jan. 1 13,746,100 0.65 7,075 1.26 1.94 a Core definition. As published in American Jewish Year Book, various years. Some Jewish population estimates reported here as of January 1 were originally published as of December 31 of the previous year. b Based on updated or corrected information. Original estimates for 1990 and after, and all revised estimates: Division of Jewish Demography and Statistics, The A. Harman Institute of Contemporary Jewry, The Hebrew University of Jerusalem. c Based on revised estimates, excluding latest year. d Mid-year total population, based on revised estimates.
20
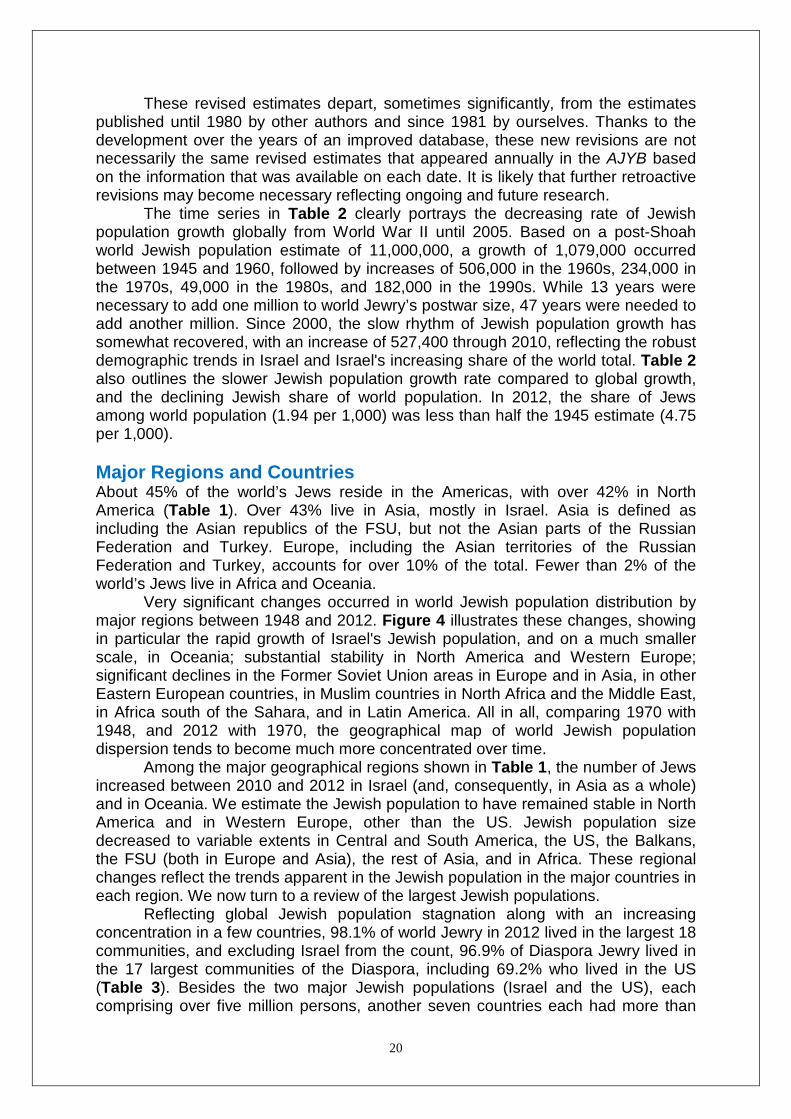
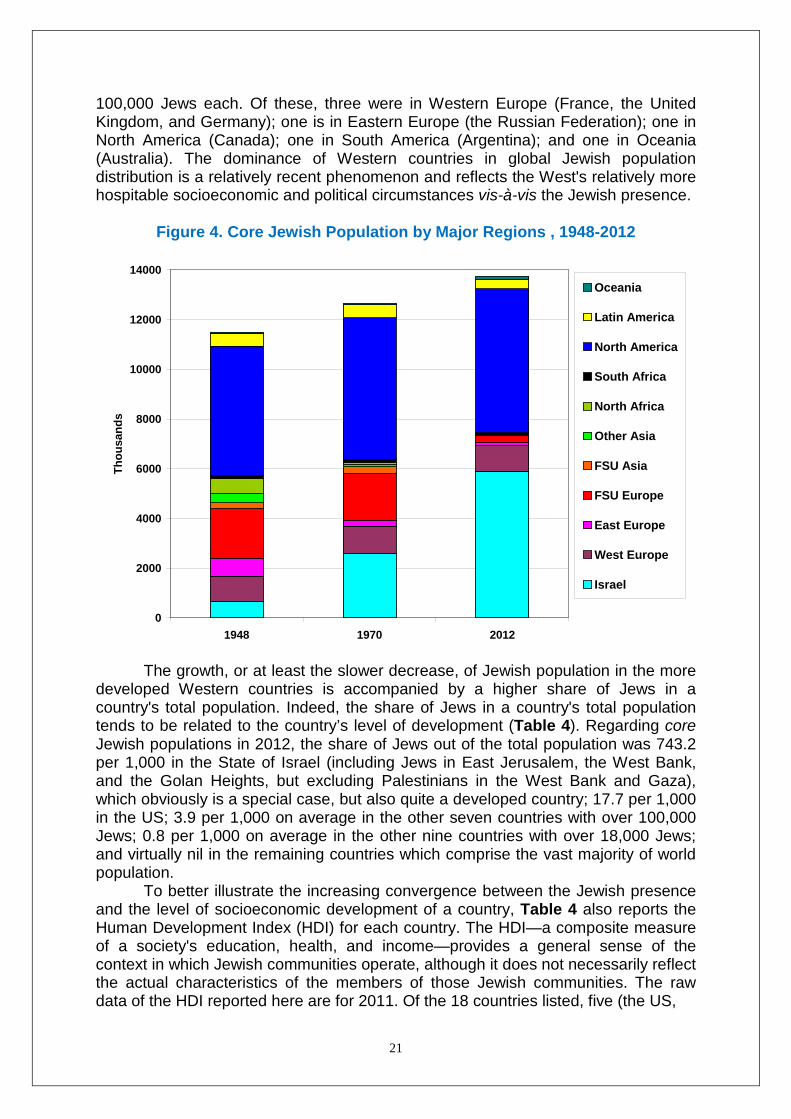
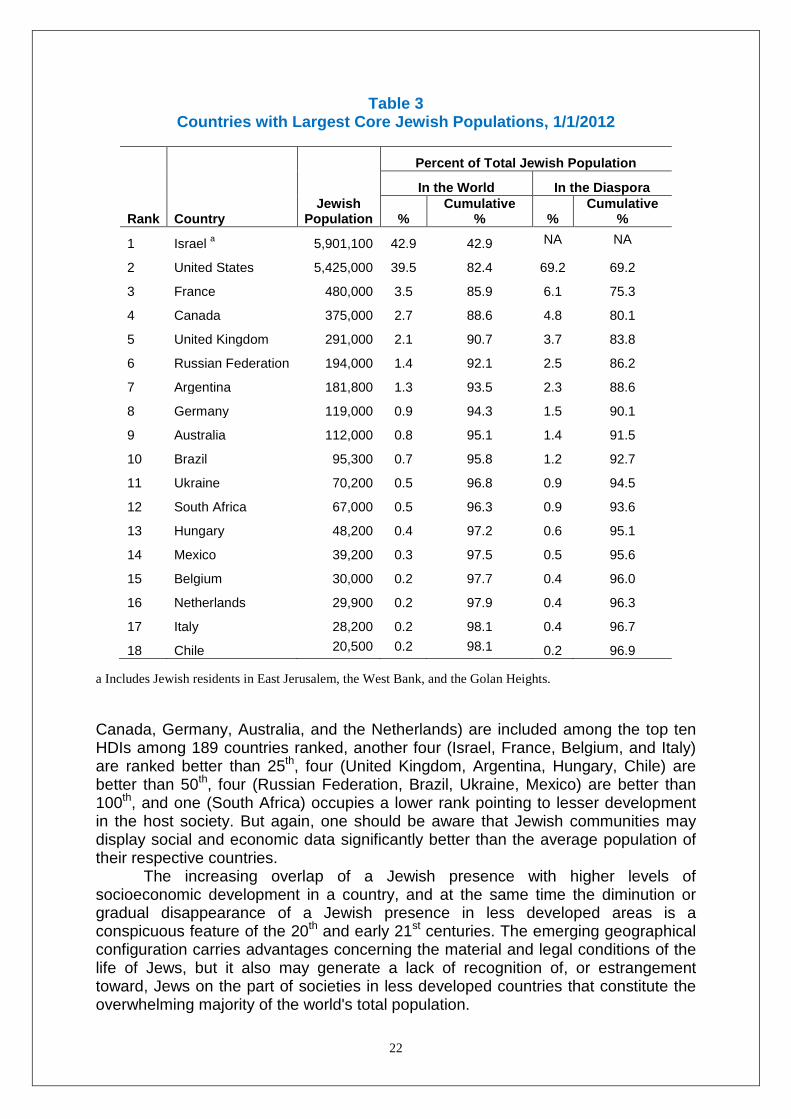
These revised estimates depart, sometimes significantly, from the estimates published until 1980 by other authors and since 1981 by ourselves. Thanks to the development over the years of an improved database, these new revisions are not necessarily the same revised estimates that appeared annually in the AJYB based on the information that was available on each date. It is likely that further retroactive revisions may become necessary reflecting ongoing and future research. The time series in Table 2 clearly portrays the decreasing rate of Jewish population growth globally from World War II until 2005. Based on a post-Shoah world Jewish population estimate of 11,000,000, a growth of 1,079,000 occurred between 1945 and 1960, followed by increases of 506,000 in the 1960s, 234,000 in the 1970s, 49,000 in the 1980s, and 182,000 in the 1990s. While 13 years were necessary to add one million to world Jewry’s postwar size, 47 years were needed to add another million. Since 2000, the slow rhythm of Jewish population growth has somewhat recovered, with an increase of 527,400 through 2010, reflecting the robust demographic trends in Israel and Israel's increasing share of the world total. Table 2 also outlines the slower Jewish population growth rate compared to global growth, and the declining Jewish share of world population. In 2012, the share of Jews among world population (1.94 per 1,000) was less than half the 1945 estimate (4.75 per 1,000). Major Regions and Countries About 45% of the world’s Jews reside in the Americas, with over 42% in North America (Table 1). Over 43% live in Asia, mostly in Israel. Asia is defined as including the Asian republics of the FSU, but not the Asian parts of the Russian Federation and Turkey. Europe, including the Asian territories of the Russian Federation and Turkey, accounts for over 10% of the total. Fewer than 2% of the world’s Jews live in Africa and Oceania. Very significant changes occurred in world Jewish population distribution by major regions between 1948 and 2012. Figure 4 illustrates these changes, showing in particular the rapid growth of Israel's Jewish population, and on a much smaller scale, in Oceania; substantial stability in North America and Western Europe; significant declines in the Former Soviet Union areas in Europe and in Asia, in other Eastern European countries, in Muslim countries in North Africa and the Middle East, in Africa south of the Sahara, and in Latin America. All in all, comparing 1970 with 1948, and 2012 with 1970, the geographical map of world Jewish population dispersion tends to become much more concentrated over time. Among the major geographical regions shown in Table 1, the number of Jews increased between 2010 and 2012 in Israel (and, consequently, in Asia as a whole) and in Oceania. We estimate the Jewish population to have remained stable in North America and in Western Europe, other than the US. Jewish population size decreased to variable extents in Central and South America, the US, the Balkans, the FSU (both in Europe and Asia), the rest of Asia, and in Africa. These regional changes reflect the trends apparent in the Jewish population in the major countries in each region. We now turn to a review of the largest Jewish populations. Reflecting global Jewish population stagnation along with an increasing concentration in a few countries, 98.1% of world Jewry in 2012 lived in the largest 18 communities, and excluding Israel from the count, 96.9% of Diaspora Jewry lived in the 17 largest communities of the Diaspora, including 69.2% who lived in the US (Table 3). Besides the two major Jewish populations (Israel and the US), each comprising over five million persons, another seven countries each had more than
21
100,000 Jews each. Of these, three were in Western Europe (France, the United Kingdom, and Germany); one is in Eastern Europe (the Russian Federation); one in North America (Canada); one in South America (Argentina); and one in Oceania (Australia). The dominance of Western countries in global Jewish population distribution is a relatively recent phenomenon and reflects the West's relatively more hospitable socioeconomic and political circumstances vis-à-vis the Jewish presence.
Figure 4. Core Jewish Population by Major Regions , 1948-2012
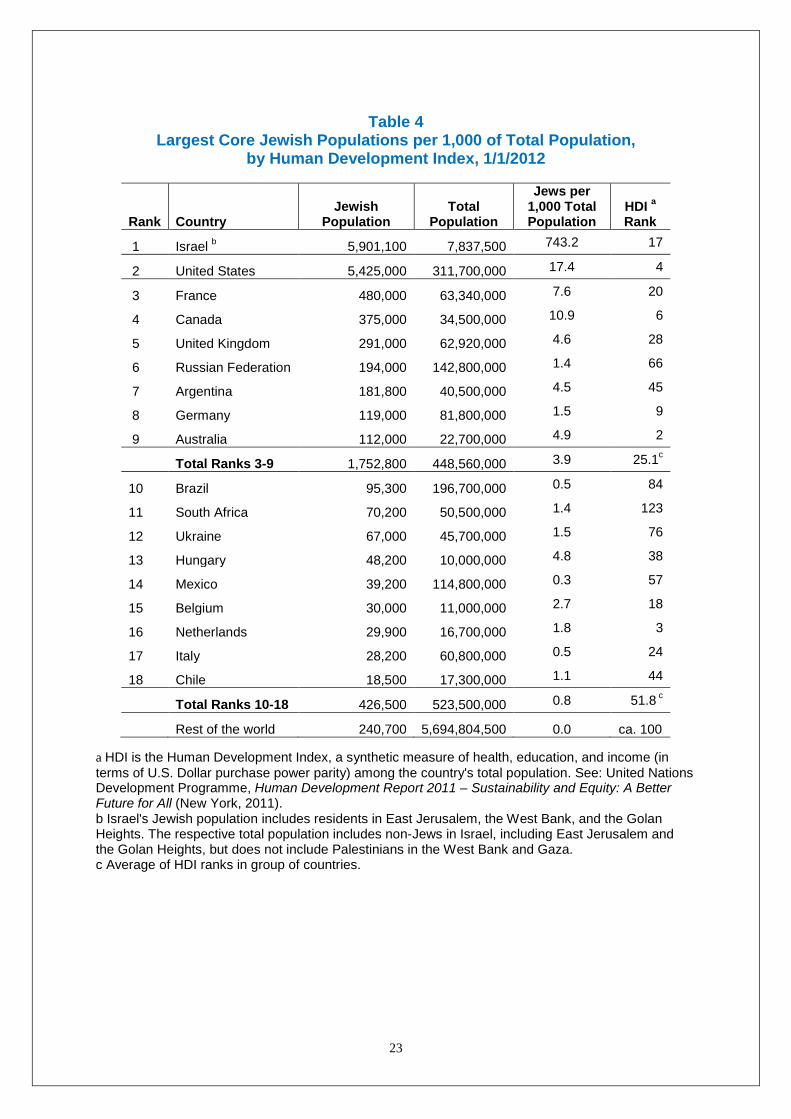
The growth, or at least the slower decrease, of Jewish population in the more developed Western countries is accompanied by a higher share of Jews in a country's total population. Indeed, the share of Jews in a country's total population tends to be related to the country’s level of development (Table 4). Regarding core Jewish populations in 2012, the share of Jews out of the total population was 743.2 per 1,000 in the State of Israel (including Jews in East Jerusalem, the West Bank, and the Golan Heights, but excluding Palestinians in the West Bank and Gaza), which obviously is a special case, but also quite a developed country; 17.7 per 1,000 in the US; 3.9 per 1,000 on average in the other seven countries with over 100,000 Jews; 0.8 per 1,000 on average in the other nine countries with over 18,000 Jews; and virtually nil in the remaining countries which comprise the vast majority of world population. To better illustrate the increasing convergence between the Jewish presence and the level of socioeconomic development of a country, Table 4 also reports the Human Development Index (HDI) for each country. The HDI—a composite measure of a society's education, health, and income—provides a general sense of the context in which Jewish communities operate, although it does not necessarily reflect the actual characteristics of the members of those Jewish communities. The raw data of the HDI reported here are for 2011. Of the 18 countries listed, five (the US,
0
2000
4000
6000
8000
10000
12000
14000
1948 1970 2012
Thou
sand
s
Oceania
Latin America
North America
South Africa
North Africa
Other Asia
FSU Asia
FSU Europe
East Europe
West Europe
Israel
22
Table 3 Countries with Largest Core Jewish Populations, 1/1/2012
Rank Country Jewish
Population
Percent of Total Jewish Population
In the World In the Diaspora
% Cumulative
% % Cumulative
%
1 Israel a 5,901,100 42.9 42.9 NA NA
2 United States 5,425,000 39.5 82.4 69.2 69.2
3 France 480,000 3.5 85.9 6.1 75.3
4 Canada 375,000 2.7 88.6 4.8 80.1
5 United Kingdom 291,000 2.1 90.7 3.7 83.8
6 Russian Federation 194,000 1.4 92.1 2.5 86.2
7 Argentina 181,800 1.3 93.5 2.3 88.6
8 Germany 119,000 0.9 94.3 1.5 90.1
9 Australia 112,000 0.8 95.1 1.4 91.5
10 Brazil 95,300 0.7 95.8 1.2 92.7
11 Ukraine 70,200 0.5 96.8 0.9 94.5
12 South Africa 67,000 0.5 96.3 0.9 93.6
13 Hungary 48,200 0.4 97.2 0.6 95.1
14 Mexico 39,200 0.3 97.5 0.5 95.6
15 Belgium 30,000 0.2 97.7 0.4 96.0
16 Netherlands 29,900 0.2 97.9 0.4 96.3
17 Italy 28,200 0.2 98.1 0.4 96.7
18 Chile 20,500 0.2 98.1 0.2 96.9 a Includes Jewish residents in East Jerusalem, the West Bank, and the Golan Heights.
Canada, Germany, Australia, and the Netherlands) are included among the top ten HDIs among 189 countries ranked, another four (Israel, France, Belgium, and Italy) are ranked better than 25th, four (United Kingdom, Argentina, Hungary, Chile) are better than 50th, four (Russian Federation, Brazil, Ukraine, Mexico) are better than 100th, and one (South Africa) occupies a lower rank pointing to lesser development in the host society. But again, one should be aware that Jewish communities may display social and economic data significantly better than the average population of their respective countries. The increasing overlap of a Jewish presence with higher levels of socioeconomic development in a country, and at the same time the diminution or gradual disappearance of a Jewish presence in less developed areas is a conspicuous feature of the 20th and early 21st centuries. The emerging geographical configuration carries advantages concerning the material and legal conditions of the life of Jews, but it also may generate a lack of recognition of, or estrangement toward, Jews on the part of societies in less developed countries that constitute the overwhelming majority of the world's total population.
23
Table 4
Largest Core Jewish Populations per 1,000 of Total Population, by Human Development Index, 1/1/2012
Rank Country Jewish
Population Total
Population
Jews per 1,000 Total Population
HDI a Rank
1 Israel b 5,901,100 7,837,500 743.2 17
2 United States 5,425,000 311,700,000 17.4 4
3 France 480,000 63,340,000 7.6 20
4 Canada 375,000 34,500,000 10.9 6
5 United Kingdom 291,000 62,920,000 4.6 28
6 Russian Federation 194,000 142,800,000 1.4 66
7 Argentina 181,800 40,500,000 4.5 45
8 Germany 119,000 81,800,000 1.5 9
9 Australia 112,000 22,700,000 4.9 2
Total Ranks 3-9 1,752,800 448,560,000 3.9 25.1c
10 Brazil 95,300 196,700,000 0.5 84
11 South Africa 70,200 50,500,000 1.4 123
12 Ukraine 67,000 45,700,000 1.5 76
13 Hungary 48,200 10,000,000 4.8 38
14 Mexico 39,200 114,800,000 0.3 57
15 Belgium 30,000 11,000,000 2.7 18
16 Netherlands 29,900 16,700,000 1.8 3
17 Italy 28,200 60,800,000 0.5 24
18 Chile 18,500 17,300,000 1.1 44
Total Ranks 10-18 426,500 523,500,000 0.8 51.8 c
Rest of the world 240,700 5,694,804,500 0.0 ca. 100 a HDI is the Human Development Index, a synthetic measure of health, education, and income (in terms of U.S. Dollar purchase power parity) among the country's total population. See: United Nations Development Programme, Human Development Report 2011 – Sustainability and Equity: A Better Future for All (New York, 2011). b Israel's Jewish population includes residents in East Jerusalem, the West Bank, and the Golan Heights. The respective total population includes non-Jews in Israel, including East Jerusalem and the Golan Heights, but does not include Palestinians in the West Bank and Gaza. c Average of HDI ranks in group of countries.
24
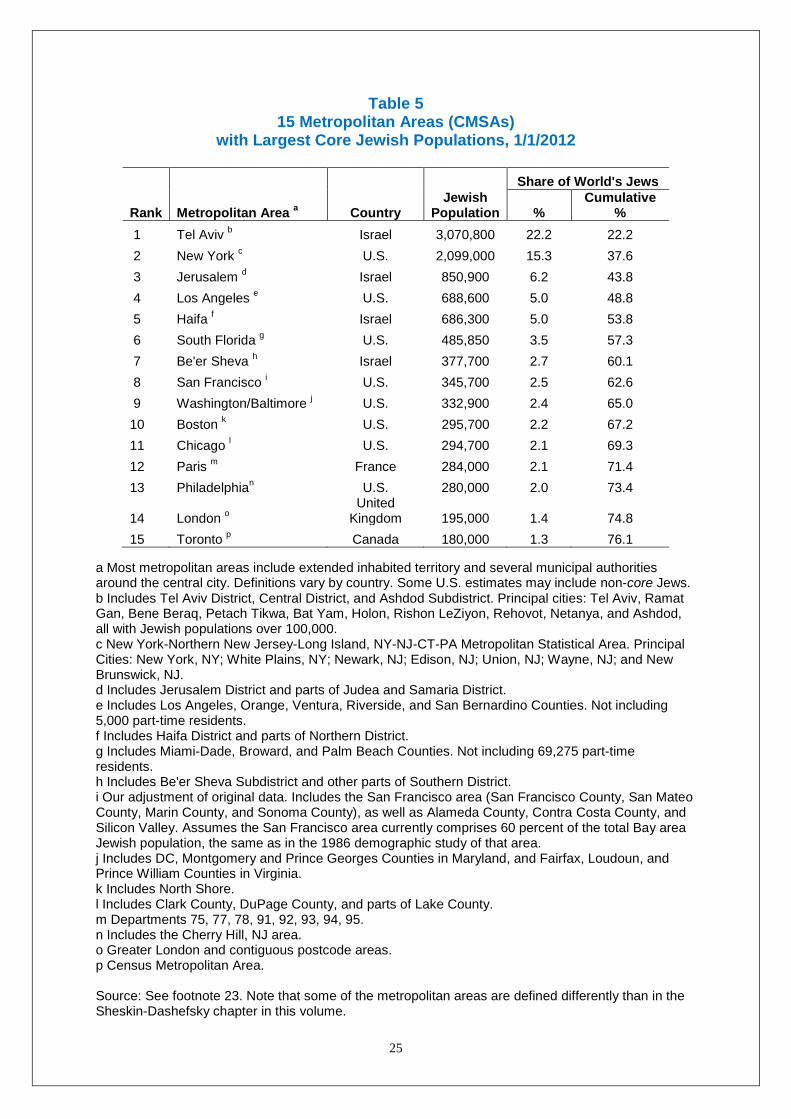
Major Cities Changes in the geographic distribution of Jews have affected their distribution not only among countries, but also within countries. The overwhelmingly urban concentration of Jewish populations globally is shown by the fact that in 2012 more than half (53.8%) of world Jewry lived in only five metropolitan areas.23 These areas—including the main cities and vast urbanized territories around them—were Tel Aviv, New York, Jerusalem, Los Angeles, and Haifa (Table 5). Over two-thirds (67.5%) of world Jewry lived in the five previous areas plus the South Florida, Be’er Sheva, San Francisco, Washington/Baltimore, and Boston areas. The 15 largest metropolitan concentrations of Jewish population encompassed 76.1% of all Jews worldwide.24 The Jewish population in the Tel Aviv urban conurbation, extending from Netanya to Ashdod and having surpassed 3 million Jews by the core definition, now exceeds by far that in the New York Combined Metropolitan Area, extending from southern New York State to parts of Connecticut, New Jersey, and Pennsylvania, with over 2 million Jews. Of the 15 largest metropolitan areas of Jewish residence, eight were located in the US, four in Israel, and one each in France, the United Kingdom, and Canada. Nearly all of the major areas of settlement of contemporary Jewish populations share distinct features, such as being a national or regional capital, having a high standard of living, having a highly developed infrastructure for higher education, and having transnational connections. Unlike our estimates of Jewish populations in individual countries, the data reported here on urban Jewish populations do not fully adjust for possible double counting due to multiple residences. The differences in the US may be quite significant, in the range of tens of thousands, involving both major and minor metropolitan areas. Estimates of part-time residents for the two main receiving areas of South Florida and Southern California are reported in the footnotes to Table 5. The respective estimates of part-year residents were excluded from the estimates in the table. Part-year residency is related to both climate differences and economic and employment factors. Such multiple residences now also increasingly occur internationally. A person from New York or Paris may also hold a registered apartment in Jerusalem or Tel Aviv, or vice versa.
25
Table 5 15 Metropolitan Areas (CMSAs)
with Largest Core Jewish Populations, 1/1/2012
Rank Metropolitan Area a Country Jewish
Population
Share of World's Jews
% Cumulative
% 1 Tel Aviv b Israel 3,070,800 22.2 22.2 2 New York c U.S. 2,099,000 15.3 37.6 3 Jerusalem d Israel 850,900 6.2 43.8 4 Los Angeles e U.S. 688,600 5.0 48.8 5 Haifa f Israel 686,300 5.0 53.8 6 South Florida g U.S. 485,850 3.5 57.3 7 Be'er Sheva h Israel 377,700 2.7 60.1 8 San Francisco i U.S. 345,700 2.5 62.6 9 Washington/Baltimore j U.S. 332,900 2.4 65.0 10 Boston k U.S. 295,700 2.2 67.2 11 Chicago l U.S. 294,700 2.1 69.3 12 Paris m France 284,000 2.1 71.4 13 Philadelphian U.S. 280,000 2.0 73.4
14 London o United
Kingdom 195,000 1.4 74.8 15 Toronto p Canada 180,000 1.3 76.1
a Most metropolitan areas include extended inhabited territory and several municipal authorities around the central city. Definitions vary by country. Some U.S. estimates may include non-core Jews. b Includes Tel Aviv District, Central District, and Ashdod Subdistrict. Principal cities: Tel Aviv, Ramat Gan, Bene Beraq, Petach Tikwa, Bat Yam, Holon, Rishon LeZiyon, Rehovot, Netanya, and Ashdod, all with Jewish populations over 100,000. c New York-Northern New Jersey-Long Island, NY-NJ-CT-PA Metropolitan Statistical Area. Principal Cities: New York, NY; White Plains, NY; Newark, NJ; Edison, NJ; Union, NJ; Wayne, NJ; and New Brunswick, NJ. d Includes Jerusalem District and parts of Judea and Samaria District. e Includes Los Angeles, Orange, Ventura, Riverside, and San Bernardino Counties. Not including 5,000 part-time residents. f Includes Haifa District and parts of Northern District. g Includes Miami-Dade, Broward, and Palm Beach Counties. Not including 69,275 part-time residents. h Includes Be'er Sheva Subdistrict and other parts of Southern District. i Our adjustment of original data. Includes the San Francisco area (San Francisco County, San Mateo County, Marin County, and Sonoma County), as well as Alameda County, Contra Costa County, and Silicon Valley. Assumes the San Francisco area currently comprises 60 percent of the total Bay area Jewish population, the same as in the 1986 demographic study of that area. j Includes DC, Montgomery and Prince Georges Counties in Maryland, and Fairfax, Loudoun, and Prince William Counties in Virginia. k Includes North Shore. l Includes Clark County, DuPage County, and parts of Lake County. m Departments 75, 77, 78, 91, 92, 93, 94, 95. n Includes the Cherry Hill, NJ area. o Greater London and contiguous postcode areas. p Census Metropolitan Area. Source: See footnote 23. Note that some of the metropolitan areas are defined differently than in the Sheskin-Dashefsky chapter in this volume.
26
Determinants and Consequences of Jewish Population Change
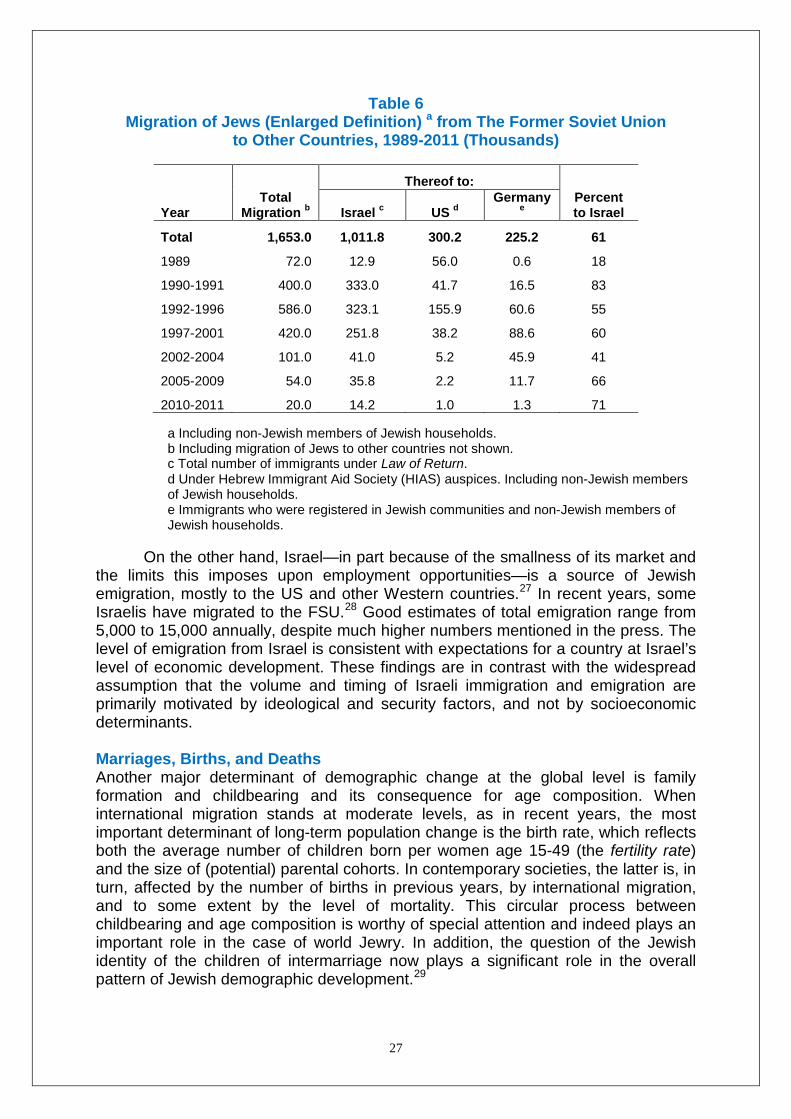
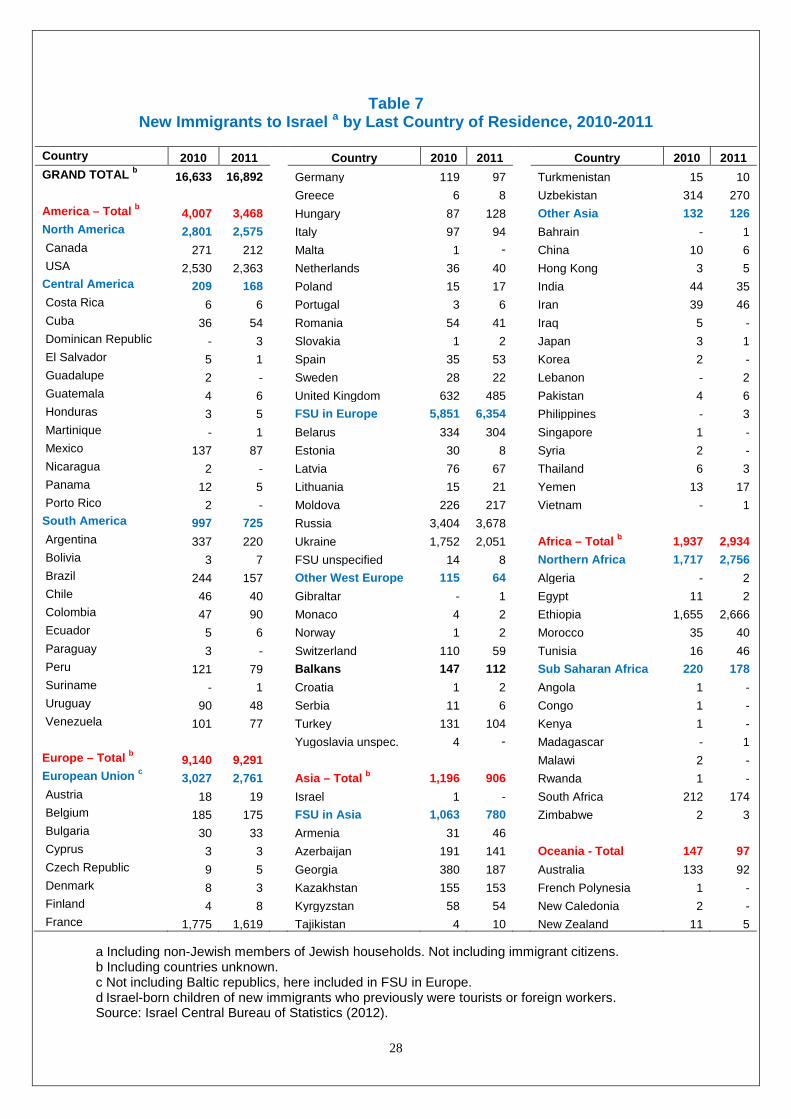
International Migration Shifts in Jewish population size in the major regions of the world were primarily determined by large-scale international migration. Unfortunately, the international migration of Jews is only imperfectly documented. Currently, only Israel annually records Jewish immigrants by country of origin. Israeli data, compared over several successive years, may provide, under certain conditions, a sense of the intensity of parallel migration movements of Jews to other countries, although there also are differences in the timing, volume, direction, and characteristics of migrants. Jewish international migration reached one of its highest peaks ever when the former Soviet Union (FSU) opened its doors at the end of 1989. Table 6 shows a summary of the estimated total number of FSU migrants between 1989 and 2011 by main countries of destination.25 The 1.653 million total migrants include non-Jewish household members. Over one million migrated to Israel, over 300,000 to the US, and over 225,000, to Germany. Israel's share of the total increased from 18% in 1989 to 83% in the peak years 1990-1991. It then decreased to 41% in 2002-2004 and increased again to 71% in 2010-2011. The decrease of the US as a destination for FSU migrants in the first decade of the 21st century is noticeable, as is the parallel decrease in the attractiveness of Germany in the second half of the same decade. These significant increases and decreases reflect the changing incidence of push factors in the FSU during a time of rapid geopolitical and economic change and real or expected disruptions in the environment for Jewish life, namely the relationship between the larger society and Jews. They also reflect the different and significantly variable legal provisions and socioeconomic opportunities in the destination countries. Table 7 shows the number of immigrants to Israel by country of origin in 2010 and 2011. The data reflect the Law of Return, not the core Jewish population, definition. In recent years, Jewish international migration has tended to decrease due to the concentration of Jews in more developed countries. Historically, a negative relationship emerged between the quality of life in a country and the propensity of Jews to emigrate.26 This logical connection helps to predict the continuation of rather low levels of migration, provided current conditions prevail for the foreseeable future. Despite this, in 2011 16,892 new immigrants arrived in Israel, compared to 16,633 in 2010, 14,567 in 2009, and 13,699 in 2008. This represents a reversal of the decreases that had prevailed for several years, although the general immigration level is quite low compared with other periods in Israel's migration history. Notable features in 2011 versus 2012 were increases of some 1,000 immigrants from Ethiopia and 500 from the FSU. Slight declines were noted from North America, the US, and Central and South America. Clearly, this migration decreases the Diaspora Jewish population and increases Jewish population size in Israel, at a time when the Israeli economy has been performing relatively better than in many Western countries, thus making Israel an attractive target for international migration.
27
Table 6 Migration of Jews (Enlarged Definition) a from The Former Soviet Union
to Other Countries, 1989-2011 (Thousands)
Year Total
Migration b
Thereof to: Percent to Israel Israel c US d
Germany e
Total 1,653.0 1,011.8 300.2 225.2 61
1989 72.0 12.9 56.0 0.6 18
1990-1991 400.0 333.0 41.7 16.5 83
1992-1996 586.0 323.1 155.9 60.6 55
1997-2001 420.0 251.8 38.2 88.6 60
2002-2004 101.0 41.0 5.2 45.9 41
2005-2009 54.0 35.8 2.2 11.7 66
2010-2011 20.0 14.2 1.0 1.3 71 a Including non-Jewish members of Jewish households. b Including migration of Jews to other countries not shown. c Total number of immigrants under Law of Return. d Under Hebrew Immigrant Aid Society (HIAS) auspices. Including non-Jewish members of Jewish households. e Immigrants who were registered in Jewish communities and non-Jewish members of Jewish households.
On the other hand, Israel—in part because of the smallness of its market and the limits this imposes upon employment opportunities—is a source of Jewish emigration, mostly to the US and other Western countries.27 In recent years, some Israelis have migrated to the FSU.28 Good estimates of total emigration range from 5,000 to 15,000 annually, despite much higher numbers mentioned in the press. The level of emigration from Israel is consistent with expectations for a country at Israel’s level of economic development. These findings are in contrast with the widespread assumption that the volume and timing of Israeli immigration and emigration are primarily motivated by ideological and security factors, and not by socioeconomic determinants. Marriages, Births, and Deaths Another major determinant of demographic change at the global level is family formation and childbearing and its consequence for age composition. When international migration stands at moderate levels, as in recent years, the most important determinant of long-term population change is the birth rate, which reflects both the average number of children born per women age 15-49 (the fertility rate) and the size of (potential) parental cohorts. In contemporary societies, the latter is, in turn, affected by the number of births in previous years, by international migration, and to some extent by the level of mortality. This circular process between childbearing and age composition is worthy of special attention and indeed plays an important role in the case of world Jewry. In addition, the question of the Jewish identity of the children of intermarriage now plays a significant role in the overall pattern of Jewish demographic development.29
28
Table 7 New Immigrants to Israel a by Last Country of Residence, 2010-2011
Country 2010 2011 Country 2010 2011 Country 2010 2011 GRAND TOTAL b 16,633 16,892 Germany 119 97 Turkmenistan 15 10 Greece 6 8 Uzbekistan 314 270 America – Total b 4,007 3,468 Hungary 87 128 Other Asia 132 126 North America 2,801 2,575 Italy 97 94 Bahrain - 1 Canada 271 212 Malta 1 - China 10 6 USA 2,530 2,363 Netherlands 36 40 Hong Kong 3 5 Central America 209 168 Poland 15 17 India 44 35 Costa Rica 6 6 Portugal 3 6 Iran 39 46 Cuba 36 54 Romania 54 41 Iraq 5 - Dominican Republic - 3 Slovakia 1 2 Japan 3 1 El Salvador 5 1 Spain 35 53 Korea 2 - Guadalupe 2 - Sweden 28 22 Lebanon - 2 Guatemala 4 6 United Kingdom 632 485 Pakistan 4 6 Honduras 3 5 FSU in Europe 5,851 6,354 Philippines - 3 Martinique - 1 Belarus 334 304 Singapore 1 - Mexico 137 87 Estonia 30 8 Syria 2 - Nicaragua 2 - Latvia 76 67 Thailand 6 3 Panama 12 5 Lithuania 15 21 Yemen 13 17 Porto Rico 2 - Moldova 226 217 Vietnam - 1 South America 997 725 Russia 3,404 3,678 Argentina 337 220 Ukraine 1,752 2,051 Africa – Total b 1,937 2,934 Bolivia 3 7 FSU unspecified 14 8 Northern Africa 1,717 2,756 Brazil 244 157 Other West Europe 115 64 Algeria - 2 Chile 46 40 Gibraltar - 1 Egypt 11 2 Colombia 47 90 Monaco 4 2 Ethiopia 1,655 2,666 Ecuador 5 6 Norway 1 2 Morocco 35 40 Paraguay 3 - Switzerland 110 59 Tunisia 16 46 Peru 121 79 Balkans 147 112 Sub Saharan Africa 220 178 Suriname - 1 Croatia 1 2 Angola 1 - Uruguay 90 48 Serbia 11 6 Congo 1 - Venezuela 101 77 Turkey 131 104 Kenya 1 - Yugoslavia unspec. 4 - Madagascar - 1 Europe – Total b 9,140 9,291 Malawi 2 - European Union c 3,027 2,761 Asia – Total b 1,196 906 Rwanda 1 - Austria 18 19 Israel 1 - South Africa 212 174 Belgium 185 175 FSU in Asia 1,063 780 Zimbabwe 2 3 Bulgaria 30 33 Armenia 31 46 Cyprus 3 3 Azerbaijan 191 141 Oceania - Total 147 97 Czech Republic 9 5 Georgia 380 187 Australia 133 92 Denmark 8 3 Kazakhstan 155 153 French Polynesia 1 - Finland 4 8 Kyrgyzstan 58 54 New Caledonia 2 - France 1,775 1,619 Tajikistan 4 10 New Zealand 11 5
a Including non-Jewish members of Jewish households. Not including immigrant citizens. b Including countries unknown. c Not including Baltic republics, here included in FSU in Europe. d Israel-born children of new immigrants who previously were tourists or foreign workers. Source: Israel Central Bureau of Statistics (2012).
29
Low birth rates and relatively high intermarriage rates have prevailed among some European Jewish communities since the beginning of the twentieth century. After World War II, the US and several Western European countries experienced a prolonged rise in fertility, which did not occur in Eastern Europe. These trends were matched by their respective Jewish communities, though at lower levels. Where the baby boom occurred, it generated large age cohorts born between 1945 and 1965, who in turn reached the age of procreation between the 1970s and the 1990s. An “echo effect” of more births might have been expected, but fertility rates, general and Jewish, have decreased sharply since the 1970s. Jews usually anticipated by several years these developments, resulting in lower birth rates across the board. Significant internal differentiation persisted according to religiosity and other social characteristics among Jewish populations, with Orthodox Jews generally maintaining higher fertility rates than other groups.
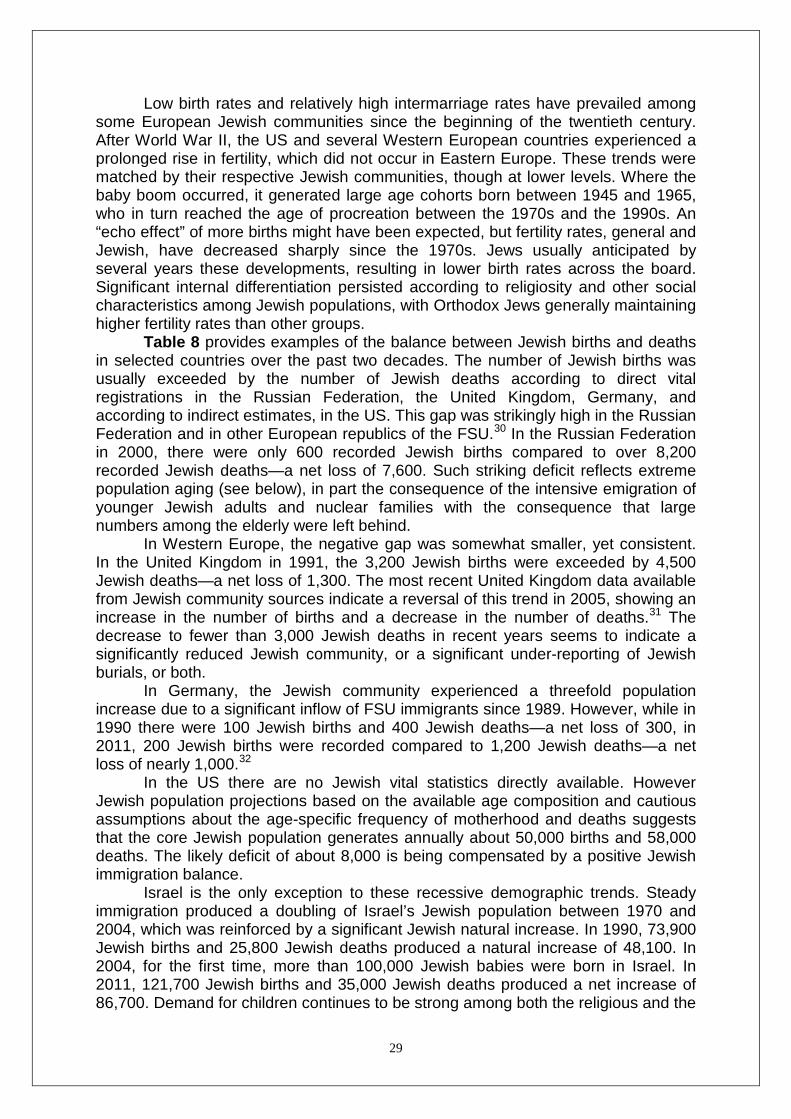
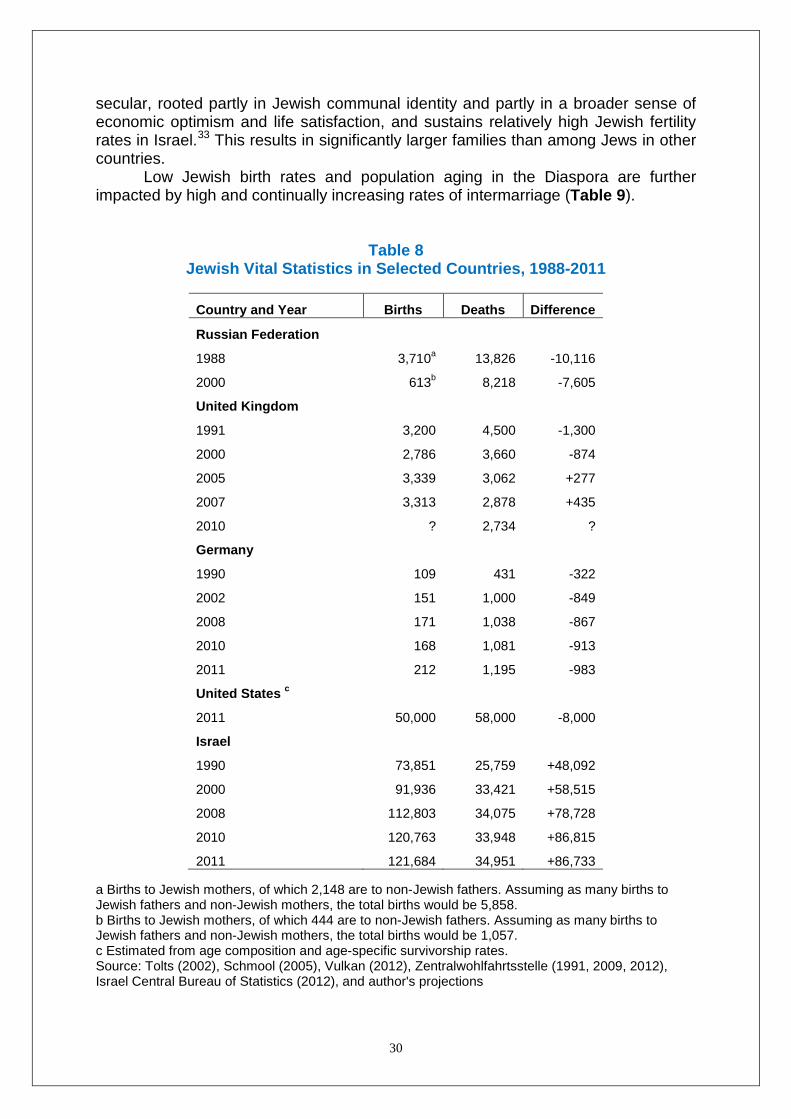
Table 8 provides examples of the balance between Jewish births and deaths in selected countries over the past two decades. The number of Jewish births was usually exceeded by the number of Jewish deaths according to direct vital registrations in the Russian Federation, the United Kingdom, Germany, and according to indirect estimates, in the US. This gap was strikingly high in the Russian Federation and in other European republics of the FSU.30 In the Russian Federation in 2000, there were only 600 recorded Jewish births compared to over 8,200 recorded Jewish deaths—a net loss of 7,600. Such striking deficit reflects extreme population aging (see below), in part the consequence of the intensive emigration of younger Jewish adults and nuclear families with the consequence that large numbers among the elderly were left behind.
In Western Europe, the negative gap was somewhat smaller, yet consistent. In the United Kingdom in 1991, the 3,200 Jewish births were exceeded by 4,500 Jewish deaths—a net loss of 1,300. The most recent United Kingdom data available from Jewish community sources indicate a reversal of this trend in 2005, showing an increase in the number of births and a decrease in the number of deaths.31 The decrease to fewer than 3,000 Jewish deaths in recent years seems to indicate a significantly reduced Jewish community, or a significant under-reporting of Jewish burials, or both.
In Germany, the Jewish community experienced a threefold population increase due to a significant inflow of FSU immigrants since 1989. However, while in 1990 there were 100 Jewish births and 400 Jewish deaths—a net loss of 300, in 2011, 200 Jewish births were recorded compared to 1,200 Jewish deaths—a net loss of nearly 1,000.32
In the US there are no Jewish vital statistics directly available. However Jewish population projections based on the available age composition and cautious assumptions about the age-specific frequency of motherhood and deaths suggests that the core Jewish population generates annually about 50,000 births and 58,000 deaths. The likely deficit of about 8,000 is being compensated by a positive Jewish immigration balance.
Israel is the only exception to these recessive demographic trends. Steady immigration produced a doubling of Israel’s Jewish population between 1970 and 2004, which was reinforced by a significant Jewish natural increase. In 1990, 73,900 Jewish births and 25,800 Jewish deaths produced a natural increase of 48,100. In 2004, for the first time, more than 100,000 Jewish babies were born in Israel. In 2011, 121,700 Jewish births and 35,000 Jewish deaths produced a net increase of 86,700. Demand for children continues to be strong among both the religious and the
30
secular, rooted partly in Jewish communal identity and partly in a broader sense of economic optimism and life satisfaction, and sustains relatively high Jewish fertility rates in Israel.33 This results in significantly larger families than among Jews in other countries.
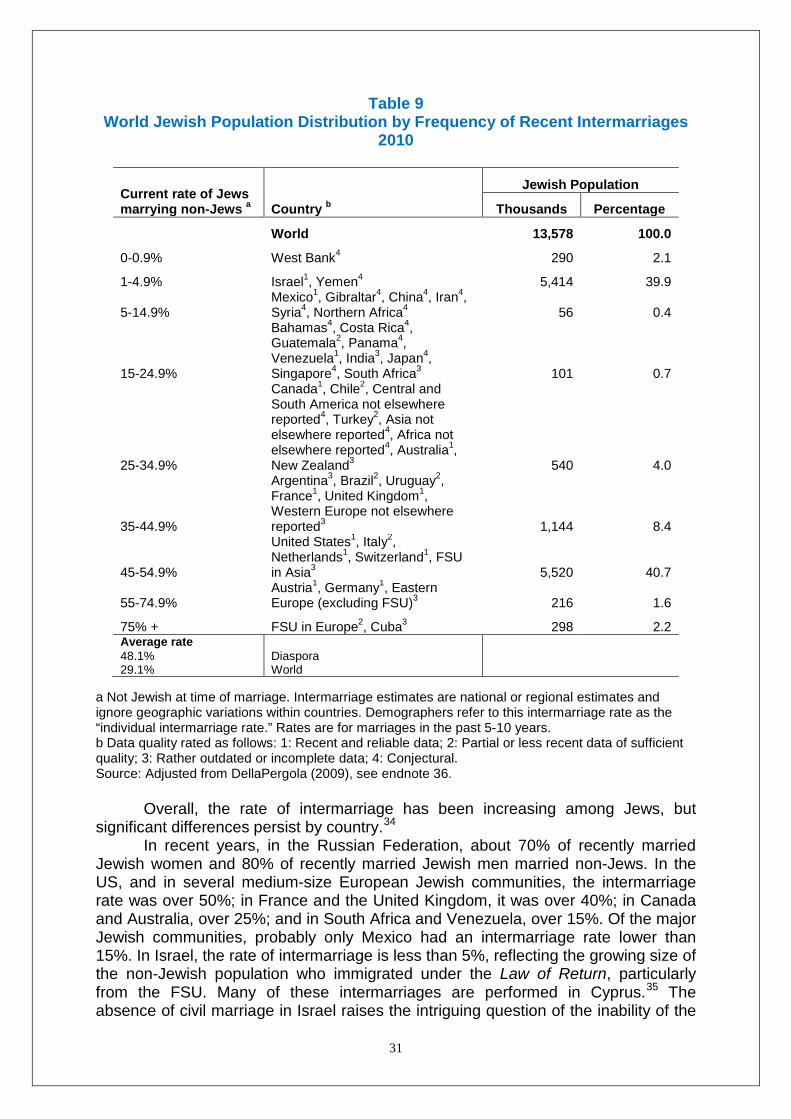
Low Jewish birth rates and population aging in the Diaspora are further impacted by high and continually increasing rates of intermarriage (Table 9).
Table 8 Jewish Vital Statistics in Selected Countries, 1988-2011
Country and Year Births Deaths Difference
Russian Federation
1988 3,710a 13,826 -10,116
2000 613b 8,218 -7,605
United Kingdom
1991 3,200 4,500 -1,300
2000 2,786 3,660 -874
2005 3,339 3,062 +277
2007 3,313 2,878 +435
2010 ? 2,734 ?
Germany
1990 109 431 -322
2002 151 1,000 -849
2008 171 1,038 -867
2010 168 1,081 -913
2011 212 1,195 -983
United States c
2011 50,000 58,000 -8,000
Israel
1990 73,851 25,759 +48,092
2000 91,936 33,421 +58,515
2008 112,803 34,075 +78,728
2010 120,763 33,948 +86,815
2011 121,684 34,951 +86,733 a Births to Jewish mothers, of which 2,148 are to non-Jewish fathers. Assuming as many births to Jewish fathers and non-Jewish mothers, the total births would be 5,858. b Births to Jewish mothers, of which 444 are to non-Jewish fathers. Assuming as many births to Jewish fathers and non-Jewish mothers, the total births would be 1,057. c Estimated from age composition and age-specific survivorship rates. Source: Tolts (2002), Schmool (2005), Vulkan (2012), Zentralwohlfahrtsstelle (1991, 2009, 2012), Israel Central Bureau of Statistics (2012), and author's projections
31
Table 9 World Jewish Population Distribution by Frequency of Recent Intermarriages
2010
a Not Jewish at time of marriage. Intermarriage estimates are national or regional estimates and ignore geographic variations within countries. Demographers refer to this intermarriage rate as the “individual intermarriage rate.” Rates are for marriages in the past 5-10 years. b Data quality rated as follows: 1: Recent and reliable data; 2: Partial or less recent data of sufficient quality; 3: Rather outdated or incomplete data; 4: Conjectural. Source: Adjusted from DellaPergola (2009), see endnote 36.
Overall, the rate of intermarriage has been increasing among Jews, but significant differences persist by country. 33F
34 In recent years, in the Russian Federation, about 70% of recently married
Jewish women and 80% of recently married Jewish men married non-Jews. In the US, and in several medium-size European Jewish communities, the intermarriage rate was over 50%; in France and the United Kingdom, it was over 40%; in Canada and Australia, over 25%; and in South Africa and Venezuela, over 15%. Of the major Jewish communities, probably only Mexico had an intermarriage rate lower than 15%. In Israel, the rate of intermarriage is less than 5%, reflecting the growing size of the non-Jewish population who immigrated under the Law of Return, particularly from the FSU. Many of these intermarriages are performed in Cyprus. 34F
35 The absence of civil marriage in Israel raises the intriguing question of the inability of the
Current rate of Jews marrying non-Jews a Country b
Jewish Population
Thousands Percentage World 13,578 100.0
0-0.9% West Bank4 290 2.1
1-4.9% Israel1, Yemen4 5,414 39.9
5-14.9% Mexico1, Gibraltar4, China4, Iran4, Syria4, Northern Africa4
56
0.4
15-24.9%
Bahamas4, Costa Rica4, Guatemala2, Panama4, Venezuela1, India3, Japan4, Singapore4, South Africa3
101
0.7
25-34.9%
Canada1, Chile2, Central and South America not elsewhere reported4, Turkey2, Asia not elsewhere reported4, Africa not elsewhere reported4, Australia1, New Zealand3
540
4.0
35-44.9%
Argentina3, Brazil2, Uruguay2, France1, United Kingdom1, Western Europe not elsewhere reported3
1,144
8.4
45-54.9%
United States1, Italy2, Netherlands1, Switzerland1, FSU in Asia3
5,520
40.7
55-74.9% Austria1, Germany1, Eastern Europe (excluding FSU)3
216
1.6
75% + FSU in Europe2, Cuba3 298 2.2 Average rate 48.1% 29.1%
Diaspora World
32
Israeli legal system to face the family formation needs of an increasing number of citizens whose religion is not Jewish. On average, based on the 2010 Jewish population distribution and recent intermarriage rates in different countries, about 29% of all recently married Jews worldwide, and 48% of all recently married Jews in the Diaspora, started a new family with a non-Jewish partner. Scattered data on cohabitation among young Jewish adults point to much higher rates of interfaith couples.
A further factor in Jewish population change is the Jewish identity of the children of intermarriages. The percentage of the children of intermarriage being raised as Jews during the early 1990s was about 20% in both the US36 and the Russian Federation.37 In 2001, this percentage had increased in the US to more than one-third,38 but was still well shy of the 50% that would be required so as not to contribute to a decrease in the number of Jews. The non-identification with Judaism of many children of intermarriages, added to low levels of Jewish fertility, produces an even lower “effective Jewish birth rate.”
In addition, non-affiliation among young Jewish adults is a phenomenon comparatively more frequent among the intermarried. This may also be associated with a determination to have fewer children. This whole complex of family-related factors leading to Jewish population erosion is far less significant in Israel than elsewhere. Conversions Given the increasing number of Jewish households (defined as a household containing one or more self-identified Jews) some of whose members are not Jewish, the number of persons converting to Judaism is highly relevant to Jewish population change.
Data on converts through the Israel Conversion (Giyur) Courts from 1999 to 2009 cover passages to Judaism certified through both the civilian and military (Israel Defense Forces) conversion systems. Most civilian conversions were of new Ethiopian immigrants who, in recent years, almost exclusively included over 3,000 Falash Mura annually. Within the military conversion system, the demand for conversion prevailed among young adults mostly born in the FSU or Israel to non-Jewish immigrant mothers. About 500-800 young military were converted annually from 2005 to 2008. Only a small number of converts were civilians from countries other than Ethiopia who immigrated to Israel under the Law of Return. Only in 2005, and again in 2007 and 2008, did Conversion Courts certify somewhat higher numbers of converts. The 2009 estimate was much lower due to reduced immigration from Ethiopia and ongoing controversies within the Israeli Rabbinate about the general validity of conversion procedures. Some members of the Israeli Rabbinate have indeed requested that thousands of conversions performed in the framework of the Israeli Defense Forces be annulled. The matter was eventually settled, but controversy about conversion in Israel remains high.
Overall, from 1999 to 2009, 48,098 persons converted to Judaism through Israeli rabbinical channels. Given the opposition to conversion within some branches of the Israeli Rabbinate, the actual number of gerim (Jewish neophytes) was not low and contributed to Israel's Jewish population growth. However, the total number of “others,” i.e., Law of Return immigrants and their children not registered as Jews, increased from 171,600 in 1999 to 325,000 in 2011. In 2007 and 2008, for the first time, the number of converts to Judaism was greater than the annual increment in the “others” population.
33
Data on conversions to and from Judaism in Diaspora countries exist, but have not been compiled systematically. The consistent evidence from socio-demographic surveys is that more people were born Jewish than consider themselves currently Jewish, reflecting the net effect of accessions and secessions. The main evidence for this loss derives from Jewish population surveys undertaken in the US. One recent source, the 2007 survey of religion,39 compares the percentages of those raised Jewish with those currently Jewish out of the US total population. At least in terms of Jews by religion, the lifetime balance is unequivocally negative–about 0.2% of the country's total population. Assuming the same effects among children as among adults, this would amount to a net lifetime loss of about 600,000 individuals, or well above 10% of a total Jewish population estimated by different authors at between 5 and 6.5 million (see below). It is true that some of these passages occur from/to the unknown/unreported/agnostic/atheist group, rather than from/to another specific religious group. But such data disprove the assumption of a significant ongoing passage from the peripheral toward the central areas of the Jewish identification typology outlined in Figure 3, which would otherwise fuel an increase in the US Jewish population.
Another, admittedly small, example illustrative of a more general trend comes from the 2001 Census of Scotland, the data from which are available separately and in greater detail than the data from other parts of the United Kingdom. In 2001, 8,233 persons in Scotland declared that either they were raised Jewish or their current religion was Jewish. Of these, 5,661 (69%) were both raised Jewish and Judaism was their current religion; 1,785 (22%) were raised Jewish but were not currently Jewish; and 787 (9%) were not raised Jewish but were currently Jewish. Thus, the total number with Jewish upbringing was 7,446, and the number currently Jewish was 6,448, a difference of 998—a net loss of 13%.40 Age Composition Age composition plays a crucial role in population change. Table 11, covering 1970-2011, exemplifies the extreme variations that can emerge in age composition following the transition from higher to lower birth rates and death rates. Jewish populations are classified into five demographic types: traditional, transitional, moderate aging, advanced aging, and terminal.
Traditional Jewish populations, characterized by very high percentages of children, have disappeared. Jews in Ethiopia, here portrayed just before their mass immigration to Israel in 1991, were the last example.
The transitional type occurs as fertility is controlled and mortality is lowered due to better health care. Such populations feature a relatively high percentage of children, an increasing share of adults, and a median age around 30 or under. Israel is today the only Jewish population where the percentages in each major age group tend to decrease regularly from the younger age groups to the older age groups.
In moderately aging communities, the center of gravity moves to age 45-64, but children under age 15 are still more numerous than adults age 65 and over. This type, whose median age is about 35, was still evident during the 1970s and through the 1990s in the US and later in some communities in Central and South America.
More recently, Jewish communities in the US–namely in New York41 –and Canada, major Jewish communities in Western and Central European countries, Central and South American communities like Argentina and Brazil, as well as Australia and Turkey, joined the advanced aging type, where the elderly age 65 and over outnumber children under age 15, and median ages mostly range between 40
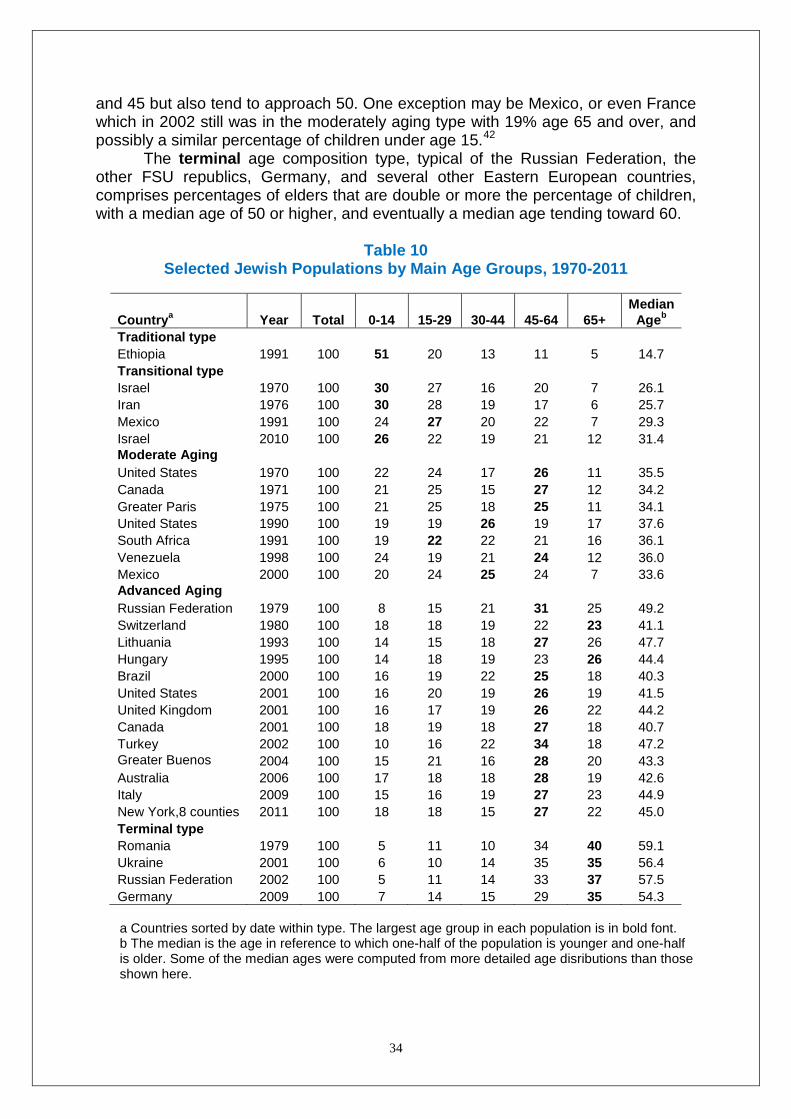
34
and 45 but also tend to approach 50. One exception may be Mexico, or even France which in 2002 still was in the moderately aging type with 19% age 65 and over, and possibly a similar percentage of children under age 15.42
The terminal age composition type, typical of the Russian Federation, the other FSU republics, Germany, and several other Eastern European countries, comprises percentages of elders that are double or more the percentage of children, with a median age of 50 or higher, and eventually a median age tending toward 60.
Table 10
Selected Jewish Populations by Main Age Groups, 1970-2011
Countrya Year Total 0-14 15-29 30-44 45-64 65+ Median
Ageb Traditional type Ethiopia 1991 100 51 20 13 11 5 14.7 Transitional type Israel 1970 100 30 27 16 20 7 26.1 Iran 1976 100 30 28 19 17 6 25.7 Mexico 1991 100 24 27 20 22 7 29.3 Israel 2010 100 26 22 19 21 12 31.4 Moderate Aging
United States 1970 100 22 24 17 26 11 35.5 Canada 1971 100 21 25 15 27 12 34.2 Greater Paris 1975 100 21 25 18 25 11 34.1 United States 1990 100 19 19 26 19 17 37.6 South Africa 1991 100 19 22 22 21 16 36.1 Venezuela 1998 100 24 19 21 24 12 36.0 Mexico 2000 100 20 24 25 24 7 33.6 Advanced Aging
Russian Federation 1979 100 8 15 21 31 25 49.2 Switzerland 1980 100 18 18 19 22 23 41.1 Lithuania 1993 100 14 15 18 27 26 47.7 Hungary 1995 100 14 18 19 23 26 44.4 Brazil 2000 100 16 19 22 25 18 40.3 United States 2001 100 16 20 19 26 19 41.5 United Kingdom 2001 100 16 17 19 26 22 44.2 Canada 2001 100 18 19 18 27 18 40.7 Turkey 2002 100 10 16 22 34 18 47.2 Greater Buenos
2004 100 15 21 16 28 20 43.3
Australia 2006 100 17 18 18 28 19 42.6 Italy 2009 100 15 16 19 27 23 44.9 New York,8 counties 2011 100 18 18 15 27 22 45.0 Terminal type Romania 1979 100 5 11 10 34 40 59.1 Ukraine 2001 100 6 10 14 35 35 56.4 Russian Federation 2002 100 5 11 14 33 37 57.5 Germany 2009 100 7 14 15 29 35 54.3 a Countries sorted by date within type. The largest age group in each population is in bold font. b The median is the age in reference to which one-half of the population is younger and one-half is older. Some of the median ages were computed from more detailed age disributions than those shown here.
35
In the US, because of the lack of a national Jewish population survey in 2010, the ongoing aging process can be portrayed by comparing results of NJPS 1990, with NJPS 2000-01 corrected for under-reporting of young and middle-age adults,43 and with projections of the same corrected figures for 2011 (Table 11). In these projections, death rates were based on Israeli Jews' detailed schedules—Israel being a country with high life expectancies of over 84 years for women and over 80 years for men in 2010. Birth rates reflect varying assumptions about the effective Jewish fertility rate—i.e., estimated average children born, discounted for the non-inclusion of variable shares of the children of intermarriages. The decline in the younger US Jewish cohorts under age 30 is evident (33.4% in 2011 versus 37.4% in 1990), as against an increase in the population aged 60 and over (26.4% in 2011 versus 22.4% in 1990). The whole gamut of Jewish community resources and needs is being significantly reshaped by these demographic changes.
Table 11 Age Composition of U.S. Core Jewish Population–Observed And Projected
1990-2011
Age
1990 2001 2011
NJPS NJPS,
corrected
Projected from NJPS 2001,
corrected
Total 100.0 100.0 100.0
0-14 18.8 16.7 14.1
15-29 18.6 17.2 19.3
30-44 25.3 21.6 15.9
45-59 14.9 24.0 24.3
60-74 13.9 12.0 18.1
75+ 8.5 8.5 8.3
Demographic Implications The corollary of the advanced aging and terminal Jewish age composition types is that the annual number of deaths must outnumber the annual number of births. Such a skewed age composition also clearly reflects the non-incorporation within the Jewish collective of many children of intermarriages, which is bound to lead to a numerical decrease in Jewish population in future years, as in fact has been the case in the Diaspora over the past decades.
Jews in Israel are the notable exception. Their vital rates not only do generate Jewish population growth, but the size of the natural increase is high in comparison with other developed societies, and in fact very similar to that of the world's total population.44 Contemporary Jewish demography is split between an Israeli component that features consistent increase and a Diaspora component which—though some internal variation exists—is bound to decrease.
36
Jewish Population by Country
The Americas The Jewish population in the Americas is predominantly concentrated in the US (5,425,000, or 88% of the continental total), followed by Canada (375,000, 6%), South America (329,000, 5%), and Central America (54,200, 1%) (Appendix). The United States To assess Jewish population size in the US is probably not the most important or exciting, but surely one of the most intriguing, debated, and at times antagonizing chores—not only in demographic studies but more generally in the social scientific study of Jewry. Competing narrative and empirical approaches have generated diverging estimates, with a significant high-low gap of about two million, and opposite interpretations of current and expected trends, ranging between rapid growth and slow decline.45
The following review provides the necessary background when turning to compile and compare national Jewish population estimates in the US. Between 1945, when the total US Jewish population was realistically assessed at 4.4 million,46 and 1990 all the main available estimates tended to agree on the general direction and speed of change, while allowing some high-low gaps. Relatively rapid growth until the late 1960s was followed by slower growth during the following 20 years, and stagnation or incipient decline soon after. As against this, the subsequent fifteen years between 1995 and 2010 were characterized by widely different population estimates and perceptions of the direction of change.
The whole set of available Jewish population sources relies on very different estimation approaches. National compilations of local Jewish communities historically gathered by the American Jewish Year Book and largely based on local Jewish community studies and informant reports regularly stood at the top of the range, through periodical downward corrections were made that mostly reflected new national studies that had become available. The independent critical reviews by the Institute of Contemporary Jewry (ICJ) investigators regularly provided somewhat lower estimates that also manifested smoother change over time.47
A highly coherent time sequence was provided by several forward-backward projections that tried to find whether the various national surveys could be logically related to each other through a set of assumptions inferred from the findings of the same surveys on international migration, age composition, marriage, and fertility.48 Thus, in the light of the then ongoing and expected demographic trends, the over 5 million Jews found in the 1957 Current Population Survey (CPS)49 quite accurately predicted the 5,420,000 Jews found by the NJPS 1971,50 which in turn predicted the 5,515,000 found by NJPS 1990.51 Both NJPS 1971 and NJPS 1990 predicted the Jewish population reduction that was found by two nearly simultaneous and competing studies in 2001.52 Indeed, both the NJPS53 and the American Jewish Identity Survey (AJIS)54 assessed American Jewry at 5.2-5.3 million. Following claims of excessively low respondent rates, selective population undercounts, and other inappropriate procedures during and following the fieldwork, NJPS 2000-01 was submitted to independent professional scrutiny, which concluded that the study—while handicapped by methodological shortcomings such as low response rates, inconsistent survey coverage of relevant population subgroups, and loss of documentation—stood within the range of professionally acceptable research standards and biases.55
37
The mentioned survey-to-survey projections were quite on target with reasonable margins of error not only for the total Jewish population but also for each birth cohort. Such projections were obtained through very detailed matrices compounding all changes occurring in each five year period, within each sex and five-year age group, for each of the relevant components of population change: incoming and outgoing international migration, fertility rates of women at relevant ages, death rates, and accession/secession rates. The puzzle of the growing discrepancy between US Jewish population estimates during the more recent period since 1990 reflects several problems. First and foremost is the inconsistent Jewish population definitions adopted by different sources. For example, the 2001 HARI study56 used a broader definition than NJPS and AJIS in the same year. AJIS used the same definition as NJPS 1990, but NJPS 2000-01 used a broader definition. On the other hand, the demographic trend shown by most national surveys conducted by several independent bodies quite unequivocally pointed to Jewish population decline. The three American Religious Identity Surveys,57 after one incorporates estimates of the child population and a proportional allocation out of the steadily growing share of those among the US total population with religion “none,” unknown, or not reported, provided comparatively lower Jewish population estimates, but the direction of change over time was the same than other national estimates, pointing to decline toward 2000. Evidence of a decrease in Jewish population was also found in a survey for the American Jewish Committee on lifetime religious affiliation changes.58 Examining shifts in religious preference in American society—comparatively more frequent than in other countries—Jews, Catholics and older established Protestant denominations tended to lose, while Evangelical denominations, Eastern cults, and especially the “religiously undefined” tended to gain. All in all, American Jewry neither was gaining nor losing large numbers due to conversions to and from other religions. However, the overall number of secessions from Judaism was double the number of accessions to Judaism.
Among the more recent general surveys, by far the one with the largest national sample was the 2007 Pew Survey (Pew Forum on Religion & Public Life, 2008).59 After assessing weighting procedure, response rates, age and religious composition of the households, and a sampling error of: ±4.5%, a Jewish population range obtained of: 5,240,000-5,734,000, with an average estimate of 5,487,000. To help clarifying the obstacles met in the process of data evaluation, one should remember that much precision is required in projecting survey percentages to population estimates, whereas 1% of the US total population is 3.1 million individuals, 0.1% is 314,000 individuals, and every 0.01% is 31,000 individuals. Most rounded percentages of Jews out of total population produce quite rough estimates, when a difference of a few hundred thousands can be significant in the context of the analytic debate. For example, any figure in the range between 1.75% and 1.84% may be rounded as 1.8%, but the difference between the higher and the lower percent is nearly 300,000 individuals. More significantly, many quite crucial Jewish-non-Jewish demographic differentials are often neglected, like when data for a sample of adults are routinely projected for the population of all ages disregarding possible structural differences, namely the share of children, or when variation in personal religious identifications is ignored in household size estimates and projections, thus incorporating non-Jews in Jewish population estimates.
38
The Brandeis Steinhardt Social Research Institute meta-analysis60 of a large set of general social surveys, each including a small subsample of Jewish respondents, provides a different time series, starting at the same level of NJPS 990, with an estimate higher than NJPS in 2000, and one definitely higher than most other estimates in 2010.61 Interestingly, the initial release of the SSRI meta-analysis provided results highly consistent with the majority of previous and contemporaneous national survey data. Based on a compilation of 74 general social surveys conducted in 1990-2005, the average Jewish population adjusted for non-response and no religion was 5,374,000, quite in line with the major Jewish national surveys.62 Later versions of the SSRI meta-analysis have suggested much higher Jewish population estimates.63 The growth rates suggested by the SSRI-meta-analysis are clearly anomalous and contradict any empirically grounded Jewish demographic or identification process. That the latter increase is very implausible (at least under constant population definitions) is demonstrated by a comparison with the pace of growth of the US total population and of Israel's Jewish population. It does not stand to reason that between 2000 and 2010 American Jewry would be growing faster than the US total population and at a pace similar to that of Israel's Jews. To sharpen this point, the possible contention that more Jews are now "coming out of the closet" is disproven by empirical evidence.64 There are strengths, but also several weaknesses, in the SSRI meta-analysis: 1) Narrowing the analysis to only some of the available surveys deemed to be the
best seriously detracts from the randomness of the data. It is in fact the unbiased collection of as many sources as possible—each with its own strengths, weaknesses, and idiosyncrasies—that constitutes the main advantage of the original SSRI meta-analysis.
2) Surveys included in the SSRI approach asked a question about religion and not ethnicity. Therefore the meta-analysis can only consider persons explicitly identified by religion and then use conjecture to extrapolate the number of Jews by religion to a total estimate of American Jews.
3) General social surveys typically only cover adult respondents. Thus, they do not collect information about each individual in the household; in particular, no information is usually gathered for children under age 18. It is wrong to assume that the percentage of Jews among total respondents can be applied to the percentage of Jews among the total population.
4) While a generic respondent represents other generic members of the household, determining a certain multiplier, a Jewish respondent represents both other Jewish and non-Jewish household members, thus determining a lower multiplier.
5) Age cohort comparisons between the meta-analysis and NJPS 2000-01 are significantly consistent, which comes to the support and not to the detriment of NJPS, with the important exception of one or two baby boom age cohorts, discussed below.
6) On most accounts when an estimate provided by NJPS 2000-01 can be checked against a similar estimate from another source, the comparison usually holds—with the possible exception of Jewish Community Center (JCC) membership. Examples of such good matches are the estimated numbers of children enrolled in Jewish day school compared with actual school enrollment65 and the estimated number of documented immigrants compared with actual institutional data.66
39
7) General social surveys are usually based on individual respondents, and only a few such surveys collect information on a full roster of all household members. Religion is seldom the main focus of investigation of these surveys, and usually only one question on religion is asked. Thus, in most general social surveys not only is no direct knowledge of household size and composition available, but the lack of depth concerning Jewish identity measures also detracts from the possibility to determine the Jewish community's cultural boundaries, and its population size. The SSRI suggestions that US Jewry might comprise 6.0-6.5 million, or perhaps even as many as 7.5 million persons, or that 70,000 Jewish babies are born annually, become plausible only if referring to the enlarged concept of total population in households and not the core concept of individually-identified Jews.67
Here we will note again that Jewish national surveys, with their detailed information on individual identification characteristics, offer good opportunities to assess the grey zones around the more clearly declared Jewish core. In Jewish sponsored surveys, along with a generally lower response rate, significantly fewer than in general surveys do readily admit their Jewishness when defined in terms of religion. On the other hand, quite a few respondents who in the first place may not seem to belong with the core Jewish population can be recovered and incorporated through detailed reading of personal family and life histories. General social surveys, based on population classification by religion, do not offer the same maneuvering opportunity—hence resolution of the non-declared parts of the Jewish core becomes largely conjectural. A sure mistake would be to attribute in general surveys the same rate of non-response/unknown/agnostic as found in Jewish surveys. Facing national sources, the most recent compilations of local Jewish community estimates pointed to an American Jewish population not only larger by one million than reported by the studies mentioned above, but also rapidly expanding—largely an artifact of the local data available.68 There are at least six reasons why the use of local community compilations for national population estimates may be problematic:
1) The US Census Bureau has conducted a decennial national population count since 1790 and has never relied on summing estimates from local authorities or on population updates of older databases. The US Census is expensive, but essential to provide current information for planning. The same rationale should plausibly apply to Jewish population studies.
2) Over time, dozens of local Jewish community studies are completed by different researchers with different sponsors, different purposes and agendas, different Jewish population definitions, different data collection methods, and different contents. Lack of synchronization and consistency constitutes a significant flaw.
3) Some households may be counted in two local Jewish community studies because of the very high geographical mobility of American Jews—mainly from the Northeast and the Midwest to the South and the West. Recent studies of Jewish mobility show that one in six residents moved into their current community within the past five years, and another one in six moved there between five and nine years ago.69
4) Several local studies partially rely on List Samples that tend to reflect the more Jewishly-connected portion of the population, who have a higher Jewish household size, which results in an overestimation of the Jewish
40
population. The Distinctive Jewish Name (DJN) sampling method is superior to List Sampling, but carries its own biases. The better sampling method is random digit dialing (RDD), but it is very expensive. In most studies, RDD sampling is combined with either List Sampling or DJN Sampling, but the methodology for merging and weighting DJN and List Samples with RDD Samples is not perfect.
5) Some local surveys do not adequately distinguish between the core and enlarged Jewish population concepts, thus providing inflated numbers reflecting the broader definition.
6) About 20% of the compiled national Jewish population estimate derived from summing the local studies, reflects estimates provided by local Jewish community informants, such as directors of Jewish Federations and rabbis. While a recent analysis showed that informant estimates may not be as inaccurate as often thought, this remains a significant shortcoming.70
Without detracting from the importance of local Jewish community studies—still the most important tool for Jewish community planning—the methodology of summing the local studies to obtain a national estimate is problematic, as is recognized by Sheskin and Dashefsky.71 Because of the large and diverse database they use, both meta-analysis and local Jewish community summations are at risk of amassing significant amounts of errors and biases when it comes to national Jewish population estimates they were not designed to supply in the first place.
As already noted,72 there remains to be considered the significant issue of a possible undercounting in NJPS 2000-01 of many Jewish adults age 35-44 and age 45-54. In 2001 these adults were born, respectively, between 1957-1966 and 1947-1956. Indeed, a reduction in the number of Jews born in those specific years had already been noted when comparing NJPS 2000-01 with NJPS 1990, and perhaps more interestingly, also when comparing NJPS 1990 with NJPS 1971.73
As mentioned above, the NJPS 1990 data could be projected ten years forward and compared with the findings of NJPS 2000-01. This cohort-wise comparison provided quite crucial evaluative information. The core Jewish population deducted and finally adjusted from NJPS 1990 was 5,515,000. For NJPS 2000-01, actual data processing brought about an estimate of 5,035,468. After imputation of people not actually covered in the survey, such as institutionalized persons in homes for the elderly or in prisons, the estimate finally circulated amounted to 5,200,000. Our independent projection from 1990 to 2000 based on the evaluation of current migration, fertility, mortality, accession, and secession frequencies, provided a higher estimate of 5,367,244. It is important to stress that our projection produced results nearly identical to the actual NJPS 2000-01 regarding two cohorts, born in 1970-1990, and born in 1950 or before. The population actually covered fell short of the one projected by just 1% for those born in 1970-1990, age 0-19 in 1990 and age 10-29 in 2000, and by 1.7% for those born in 1950 or earlier, age 40 and over in 1990 and age 50 and over in 2000. Moreover, the projection estimate of the age group 0-9 in 2000—the births deriving from expected age-specific fertility rates during the inter-survey period—was 514,095 which turned to be nearly identical to the actual number of children of the same ages found in NJPS 2000-01, 515,146—a discrepancy of 0.2 percent. So far, then, the expected and actual data were extraordinarily consistent. However, the situation was different for the 1950-1970 birth cohort, aged 20-39 in 1990 and 30-49
41
in 2000. Here the NJPS 2000-01 found 1,338,527 individuals versus an expected figure of 1,624,543—a significant difference of -286,016 or -17.6 percent.
In other words, this seems to be a real shortcoming of NJPS 2000-01. Whether the significant under-coverage of this specific birth cohort group depended on insufficient efforts or skills at the stage of fieldwork, or on the elusive nature of Jewish identification among this particular generation of adults cannot be adjudicated with absolute certitude. But unquestionably, the data need to be corrected by adding overall a total of 331,776 core Jews to the original NJPS 2000-01 figure (not inclusive of those in institutions). The correction affects not only total Jewish population size, but also age composition with visible effects on the subsequent demographic dynamics of US Jewry. In fact, the addition of nearly 300,000 adults at ages typical for reproduction and family growth could help to generate some Jewish population increase over the decade 2000-2010. Projecting the corrected NJPS 2000-01 to 2010 indeed resulted in a total of 5,425,000 Jews – some 150,000 higher than we had inferred in previous estimates.74 Summing up, combining the findings of the two major surveys, NJPS 2000-01 and AJIS 2001, we had originally suggested a core Jewish population in the 5.2-5.3 million range in 2001. Even accepting the higher estimate, the revised 2001 estimate was about 300,000-400,000 short of the 5.7 million we had projected based on the NJPS 1990 estimate of 5.515 million.75 Indeed, during the 1990s there was an influx of at least 200,000 new Jewish immigrants from the former Soviet Union, Israel, Central and South America, South Africa, Iran, and Western Europe, which was expected to have increased the total US Jewish population. But the core Jewish population apparently decreased because Jewish fertility continued to be low, population continued to age, intermarriage rates continued to increase, and propensities to identify with Judaism among younger adults of intermarriages continued to remain low. The emerging population decrease was more likely the product of actual demographic trends than an artifact of insufficient data.76
If there had been a NJPS 1980, it would probably have shown a peak-ever around 5.6 million Jews in the US, reflecting a first echo of the enhanced baby-boom cohorts. But the Jewish population was aging through the combined effect of postponed marriage, low fertility, more frequent intermarriage, and the non-attribution of Jewish identification to high percentages of the children of one non-Jewish parent. The unavoidable consequence was the stoppage of growth and incipient decline which became more visible between 1990 and 2000. The somewhat late and incomplete entrance of the children of baby-boomers in lifecycle's reproduction stage generated a weak second baby-boom's echo effect, visible in the corrected data of the 2000-2010 decade. Dutifully taking into account survey statistical errors, Jewish population in 2010 could be no less than 5.3 and no more than 5.6 million, with a central value at 5,425,000. However, the impact of such echo-effect was in no way comparable to that of the original baby-boom, and American Jewry was again expected to moderately shrink after 2010.77 In the light of this abundant and intriguing evidence, the US Jewish population estimate of 5,425,000 presented in this Report reflects what seems to be a well documented pattern of recent Jewish population stagnation in the US. As noted, US Jewry is characterized by an aging population composition and low fertility rates well below generational replacement. In addition, a low percentage of children of intermarriage are being raised as Jews78—a feature that might change in the future as suggested by the much higher percentages found by the 2005 Boston study79 and by the Middlesex County, NJ study of 2008.80
42
A reading of the current age composition of US Jewry and other current evidence suggests that about 50,000 Jewish births occur annually in the US versus about 58,000 Jewish deaths. The number of Jewish immigrants to the US has diminished significantly, especially from the former Soviet Union. Current permanent emigration from Israel to the US is limited to a few thousand annually. In 2010 and 2011, a total of 4,893 new immigrants moved from the US to Israel, while a growth in Israeli returning and immigrant citizens from the US was also recorded. We estimate an annual net migration into the US of 5,000 Jews or slightly more. These evaluations provide evidence to support our assumption that the size of the US Jewish population has not changed much since 2001 and will probably not change dramatically for several more years. The assumption of significant growth in American Jewry over the first decade of the 21st century does not look tenable. Following these data and assumptions, our core Jewish population estimate is set at 5,425,000 for 2012. While, by the core concept, the number of Jews in the US today plausibly is lower than the number in Israel, it is beyond dispute that the US has a far larger enlarged and Law of Return population. The former comprises at least 6.8 million persons who are Jewish or have direct Jewish ancestry. The enlarged population of current Jews, other persons who are not Jewish but have Jewish ancestry, and all other non-Jewish members of households with at least one core Jewish member can be evaluated at 8.3 million. We estimate that the rules of the Law of Return—which along with Jews also entitles their non-Jewish children, grandchildren, and the respective spouses to Israeli citizenship—would apply in the US to 10 to 12 million persons. Canada In Canada, the situation is significantly different than in the US concerning both available databases and substantive population trends. In 2011 a new population census was undertaken but its results were not yet publicly available at the time of this writing. The 2006 Census by Statistics Canada, which included a question on ethnic ancestry, provided important new data (Table 12).81 Estimates of Jewish ethnicity, released every five years, can be compared with estimates of religion, released every ten years. Both types of information can be used to provide an estimate of Canada’s core Jewish population. Ethnic Jews, as defined by the Canadian Census, include persons who hold a non-Jewish religion, but these persons are not included in the core concept used herein. On the other hand, persons without religion may declare a Jewish ethnicity in the Canadian Census and are included in the core. The Jewish Federation of Canada defines this as the Jewish Standard Definition. Data on religion and ancestry are collected through open-ended questions, with examples and instructions provided. Since 1981, Canadians can declare either a single or a multiple ethnic ancestry (up to four categories, one for each grandparent). Consequently, people can be ethnically Jewish only, or Jewish and something else, being the descendants of intermarriages or expressing multiple cultural identities.
Following Jewish ethnicity throughout the past decades provides interesting clues on Jewish population and identification in Canada. An initial estimate of 293,000 ethnic Jews in 1981 increased to a peak of 370,000 in 1991, and has since decreased to 349,000 in 2001 and 315,000 in 2006—a decrease of 9.6% in five years.

43
Table 12 Jewish Population in Canada by Different Definitions, 1981-2006
Year
Jewish Ethnicity Jewish
Religion
Core Jewish
Population Total a Single Multiple
1981 293,175 264,025 29,150 296,425 312,060
1986 343,505 245,855 97,650
1991 369,565 245,850 123,725 318,070 356,315
1996 351,705 195,810 155,900
2001 348,605 186,475 162,130 329,995 370,520
2006 315,120 134,045 181,070 a Minor discrepancies due to rounding. Source: Statistics Canada.
More striking changes affected the distribution of Canadians and of the Jews among them between single and multiple ethnicities. Among Canada’s total population in 2006, 5.7 million (31%) of the 18.3 million who provided a single ethnic response declared themselves to be Canadian, and 4.3 million (33%) of the 12.9 million who provided a multiple response did so. All in all, 10 million of a total population of over 31 million reported a Canadian ethnicity—which in other epochs was thought to be a nonexistent construct.82 Most likely, the rapid growth of Canadian as a primary or additional ethnic category affects identification perceptions among Jews. In 1981, 90% of total ethnic Jews declared a single ethnicity, but this share had decreased to 66% in 1991, 53% in 2001, and 43% in 2006. The proportion of Jews (57%) with a multiple ethnicity is today much higher than among the total population (41%).83 Thus, the sharp decrease from 1991 to 2006 in Jewish ethnic identification does not necessarily provide evidence of a decrease in total Jewish population size, although it clearly points to a powerful process of acculturation. Intermarriage is on the increase, but the share of children of intermarriage reported to be Jewish is also increasing. Significant gender differences emerged in this respect: The likelihood of a child of intermarriage being raised Jewish is four times higher with a Jewish mother than with a Jewish father.84 The number of Canada’s Jews according to religion increased from 296,000 in 1981 to 318,000 in 1991 (an increase of 7.3%) and to 330,000 in 2001 (an increase of 3.7%). As noted, an estimate according to religion is not available from the 2006 Census. It should be stressed, though, that between 1991 and 2001, 22,365 Jews immigrated to and were counted in Canada while the Jewish population increase according to religion was only 11,925. Consequently, the Jewish population according to religion would have decreased by 10,440 (a decrease of 3.3%) were it not for this immigration. Emigration from Canada is moderate, with 483 persons moving to Israel in 2010-2011, and an unknown number of others evidently having migrated to the US and possibly other countries. Keeping in mind that some ethnic Jews are not Jewish by religion and that an even greater number of Jews by religion do not declare a Jewish ethnicity, a combined estimate of 312,000 for Canada’s Jewish population in 1981, increasing to 356,000 in 1991 and 371,000 in 2001 seems reasonable.85 Assuming continuing
44
immigration to Canada, but also some internal attrition, we estimate the Jewish population to have increased to 375,000 in 2012, the world’s fourth largest Jewish community. This estimate is not strictly comparable with the concept of core Jewish population as it includes a fast increasing number of persons for whom Jewish is only one among multiple ethnic identities, and some of whom may not readily identify as Jewish if asked. Some of these would probably better be included among the non-Jewish component of the enlarged Jewish population. Taking into account all ethnic Jews who profess a non-Jewish religion, and other non-Jewish household members, an enlarged Jewish population of over 450,000 would probably obtain. Central and South America In Central and South America, the Jewish population generally has been decreasing, reflecting recurring economic and security concerns.86 However, outside the mainstream of the established Jewish community, an increased interest in Judaism appeared among real or putative descendants of Conversos whose ancestors left Judaism and converted to Christianity under the pressure of the Inquisition in Spain and Portugal. Some of these Converso communities have been trying to create a permanent framework for their Jewish identity, in part manifested through formal conversion to Judaism and migration to Israel. In the long run, such a phenomenon might lead to some expansion in the size of some communities, especially smaller ones located in the peripheral areas of Brazil, Peru, Colombia, and other countries. Argentina has the largest Jewish community in Central and South America. Nearly 6,000 Jews emigrated from Argentina to Israel in 2002—the highest number ever in a single year from that country—due to dire economic conditions in Argentina and to special incentives offered by Israel. In 2003, the Argentinean economic situation eased somewhat and Israel restricted its incentives, resulting in much lower levels of emigration. About 1,500 persons left Argentina for Israel in 2003, decreasing steadily to 337 in 2010 and 220 in 2011.87 Based on the experience of previous years, approximately 20% of these migrants were non-Jewish household members. Partial evidence from different sources indicated that less than half of total Jewish emigration from Argentina was to Israel, with most others going to South Florida. Permanence in Israel of the new immigrants was high, at least during the first year after immigration, with an attrition of about 10% emigrating within 3 years.88 In 2004 and 2005, two Jewish population surveys were undertaken in the Buenos Aires metropolitan area (AMBA). Initial claims of a Jewish population of 244,00089 were based on significantly extended definitional criteria. Of the 244,000, 64,000 were Christians and about another 20,000 reported some Jewish ancestry, but did not consider themselves Jewish. Overall, 161,000 people in the AMBA considered themselves as totally or partly Jewish—consistent with our own previous estimate of 165,000. This estimate for the major urban concentration appeared consistent with our national core estimate. The 244,000 estimate would be a good estimate of the enlarged Jewish population (including non-Jewish members of Jewish households) in the Buenos Aires metropolitan area, while over 300,000 persons were identified in the same survey who were in some way of Jewish origin or attached to a person of Jewish origin. Another survey, limited to the City of Buenos Aires, suggested significant aging of the core Jewish population, reflecting the emigration of younger households in recent years.90 The current situation implies an annual loss of about 500-1,000 persons through a negative balance of Jewish births and deaths and emigration. Argentina’s Jewish population is assessed at 181,800 in 2012, the world’s seventh largest Jewish community.
45
In Brazil, the second largest Central and South American Jewish community, the 2000 Census indicated a rather stable Jewish population of 86,828, up from 86,416 in 1991.91 Considering the possible omission of persons who did not answer the Census question on religion, we assessed Brazil’s Jewish population at 97,000 in 2003 and, allowing for moderate emigration (401 persons went to Israel in 2010-2011), at 95,300 in 2012—the world’s tenth largest Jewish community. The Census data were consistent with systematic documentation efforts undertaken by the Jewish Federation of São Paulo that showed 47,286 Jews92 and an assumption that about one-half of Brazil’s Jews live in that city. According to the Census data, the Jewish population in São Paolo decreased from 41,308 in 1980 to 37,500 in 2000.93 Brazil’s enlarged Jewish population (including non-Jewish members of Jewish households) was assessed at 132,191 in 1980 and 117,296 in 199194 and reached 119,430 in 2000.95 It is assessed at 125,000 in 2012. In Mexico, the third largest Jewish community in Central and South America, the 2000 Census reported a Jewish population of 45,260 age 5 and over.96 Of these, 32,464 lived in the Mexico City metropolitan area, while a most unlikely 12,796 were reported in states other than the Federal District and Mexico State—consistent with erratic estimates in past Censuses. Allocation of the 0-4 age group based on a 2000 Jewish survey suggested an estimate of about 35,000 Jews in the Mexico City metropolitan area and 40,000 nationwide. A Jewish population survey undertaken in 2000 indeed provided a national estimate of 39,870 Jews, of whom 37,350 lived in Mexico City,97 confirming the results of a previous 1991 survey.98 A new survey in 2006 confirmed the previous results.99 Mexican Jewry still displayed a relatively young age profile compared to other Jewish populations on the continent, but some aging was visible during the past decade. In 2012, allowing for some emigration to the US and Israel (224 persons moved to Israel in 2010-2011), we estimated the Jewish population at 39,200, the fourteenth largest Jewish community. Chile has the fourth largest Jewish community in Central and South America.100 This relatively stable Jewish population, reassessed at 18,500 in 2012, is now larger than Uruguay.101 The latter country and even more so Venezuela102 experienced significant Jewish emigration in recent years. In 2000, about 20% of the former students of Jewish schools in Uruguay, and over one-third of the adult children of Caracas Jews, lived in a different country. Based on recent evidence, including 138 migrants to Israel in 2010-2011, the Jewish population estimate for Uruguay was reduced to 17,300 in 2020. In Venezuela, where the Jewish community has been under pressure due to the demanding local political circumstances, the estimate was reduced to 9,500 Jews, reflecting significant emigration of 178 persons to Israel, and higher numbers to other countries, particularly South Florida, in 2010-2011. In Central America, Panama's Jewish population was estimated at 8,000 following some Jewish immigration from other Central and South American countries. Costa Rica, as well as Colombia (with 137 migrants to Israel in 2010-2011) and Peru (200 migrants, several of whom recently converted to Judaism), had Jewish populations below 3,000.
Europe The Jewish population in Europe, estimated at 1,426,900 in 2012, is increasingly concentrated in the western part of the continent and within the European Union (EU) (Appendix B). The EU, comprising 27 countries, reached an estimated total of 1,109,400 Jews in 2012 (78% of the continent’s total). The former Soviet republics in
46
Europe outside the EU comprised 276,900 Jews (19%). All other European countries combined comprised 40,600 Jews (3%). The momentous European political transformations since the fall of the Berlin Wall and the end of the Soviet Union brought about significant changes in the structure of Jewish community organizations, with an expanded presence of Israeli and American bodies in Eastern European countries. The latter have played an important role in strengthening or even creating anew the possibilities of Eastern European Jewish life in the fields of religion, education, culture, social service, and support to the needy. The revitalization of Jewish community life may have some impact on demographic trends, primarily through the revival of submerged Jewish identities and the stimulus of greater social interaction with other Jews, possibly leading to Jewish marriages and children. Europe is much more politically fragmented than the US, making it more difficult to create a homogeneous database. Nevertheless several works have attempted to create and expand such analytic frames of reference.103 The European Union (EU) In 2004, the EU expanded from 15 to 25 countries, incorporating the three Baltic FSU republics (Estonia, Latvia, and Lithuania), another five that had been part of the Soviet area of influence in Eastern Europe (the Czech Republic, Hungary, Poland, Slovakia, and Slovenia), and two southern European insular countries (Cyprus and Malta). In 2007, two more countries that had been part of the Eastern Europe sphere of influence of the Soviet Union, Romania and Bulgaria, were admitted to the EU. The EU’s expanded format symbolized an important historical landmark: the virtual boundary between Western and Eastern Europe was erased. Croatia, Macedonia, and possibly Serbia are the next candidates for EU membership. Ongoing disagreements about the future membership of Islamic Turkey reflect a dilemma in the definition of Europe’s own cultural and geopolitical boundaries. The largest Jewish community in Europe is France, where a 2002 national survey suggested 500,000 core Jews plus an additional 75,000 non-Jewish members of Jewish households.104 Jewish population is slowly decreasing, primarily due to emigration, mainly to Israel, but also to Canada, the US, and other countries. Migration to Israel, after surpassing 2,000 annually for several years, stood at 1,775 in 2010 and 1,619 in 2011. Jewish emigration levels reflected the continuing sense of uneasiness in the face of anti-Semitism, including physical violence as exemplified by the tragic murder of Jewish school children and an adult in Toulouse in 2012. A survey of Jewish tourists to Israel from France in 2004 unveiled a remarkable estimate of 125,000 visitors, or more than 30% of all French Jews age 15 and over.105 Much higher percentages have ever been to Israel. Of the 125,000, 23% (about 29,000) affirmed their intention to move to Israel in the near future. The US was a distant second candidate for possible emigration. Migration intentions are not a proxy for actual migration decisions, but in the past such intentions proved quite reliable in the case of French Jews.106 The diminishing feeling of security among French Jewry and the actual movement of thousands of persons is undisputable. Our 2012 estimate for French Jewry, the third largest in the world, was therefore decreased to 480,000. In the United Kingdom, a new census took place in 2001. Pending its results, the 2001 national population census included a voluntary question on religion for the first time since the nineteenth century.107 The total Jewish population of 266,741 for England, Scotland, Wales, and Northern Ireland closely approximated our previous
47
273,500 estimate for 2002. One interesting census finding was that the Jewish population was dispersed over the whole national territory, including all Counties but one—the Isles of Scilly. The presence of Jews in areas lacking Jewish infrastructure suggests a lower degree of affiliation with the organized community than previously assumed. British Jewry is aging, with 16% of persons being under age 15, compared to 22% age 65 and over. As already noted, more detailed data for Scotland (where some census questions were asked differently than in other areas of the United Kingdom) showed 6,448 people currently reporting Jewish religion as compared to a total of 7,446 who said they were raised as Jews—a net lifetime loss of 13%.108 About 23% of the United Kingdom total population reported no religion and another 7% did not answer the question. Note that the organized Jewish community with the possible exception of the Haredi community publicly supported participation in completing the census optional religion question. Detailed tabulations were obtained by the Institute for Jewish Policy Research and the Board of Deputies of British Jews from the Office for National Statistics. An in-depth profile of the socio-demographic profile of British Jewry thus emerged, along with a better evaluation of the quality of Jewish population estimates.109 Analyses of data for detailed geographical precincts allowed for estimates of non-response in areas with higher and lower Jewish shares of the total population. A significant correlation was found between the known Jewish religiosity (in terms of the local presence of very Orthodox Jews) of a ward, and non-response to the religion question. This might raise fears of substantial under-coverage of the Jewish population in those areas. On the other hand, post-census surveys of Jews in London and Leeds did not reveal high percentages declaring they had not answered "Jewish" to the question on religion. Vital statistics routinely collected by the Board of Deputies of British Jews Community Research Unit on the annual number of Jewish births were quite consistent with the Census returns. Comparing the uncorrected Census returns for the age 0-9 group and the recorded number of Jewish births over the past ten years preceding the Census, the discrepancy was only 2.5%. This confirms some undercount, but not on a scale that would significantly impact Jewish population Census estimates. The same vital statistics indicated a continuing excess of Jewish burials over Jewish births until 2004,110 but since 2005 the trends apparently reversed (Table 8).111 The steadily decreasing number of Jewish deaths is an obvious symptom of a shrinking population which loses several hundred people annually through a negative vital balance, and a growing use by Jews of non-Jewish burial societies. Another indicator of the same trend is the declining synagogue membership in the United Kingdom. Household membership decreased by 17.8% between 1990 and 2000, and by 4.5% (about one% annually) between 2001 and 2005.112 This declining membership trend, however, seems to have abated, as in 2010 household membership was 82,963 households, compared to 83,567 households in 2005.113 At the same time, the denominational balance has shifted toward strictly, often called right-wing, Orthodox (whose membership doubled between 1990 and 2010) and Masorti (tending to American Conservative, with an 85% membership increase), as against a reduction in the Central (mainstream) Orthodox (a 30% membership decrease).114 This may plausibly explain the apparent increase in the birth rate. But the decreasing number of recorded burials is most likely explained by an increasing number of families who do not choose Jewish burial societies.
48
We increased the United Kingdom Jewish population estimate from the Census count of 266,741 to 300,000 for 2001 (about 12%), assuming a lower rate of non-response among Jews than in the general population. All in all, this seems a fair resolution. The updating must account for the negative balance of births and deaths, after correcting for under-reporting, as well as a moderate increase in emigration (632 persons went to Israel in 2010 and 485 in 2011). We estimated the United Kingdom’s total Jewish population at 291,000 in 2012, the world’s fifth largest Jewish community. In Germany, Jewish immigration, mainly from the FSU, added over 200,000 Jews and non-Jewish household members between 1989 and 2005 (Table 6). This immigration has now significantly diminished. The German government, under pressure because of growing unemployment and a crumbling welfare system, limited Jewish immigration from the FSU in 2005. On January 1, 2005, the previous special quota immigration law (Kontingentsflüchtlingsgesetz) was replaced by new more restrictive rules (Zuwanderungsgesetz). Jews lost their privileged quota status. The new law elevated integration into German society and good economic prospects above other considerations and required Jews aspiring to immigrate to Germany to first prove that a community would accept them as members. Prior knowledge of the German language was required. Potential Jewish immigrants now also had to prove that they would not be dependent on welfare and were willing to enter the German labor market.115 In 2011, based on German Jewish community sources, 636 Jewish immigrants from the FSU were recorded as new members of German Jewish communities, as compared to 667 in 2010, 704 in 2009, 862 in 2008, 1,296 in 2007, 1,971 in 2006, 3,124 in 2005, 4,757 in 2004, 6,224 in 2003, and 6,597 in 2002.116 Admission criteria to the central Jewish community follow Jewish rabbinical rules. The total number of core Jews registered with the central Jewish community, after increasing consistently since 1989 to a peak of 107,794 in 2006, diminished to 107,330 in 2007, 106,435 in 2008, 104,241 in 2009, 104,024 in 2010, and 102,797 in 2011. Of the current total, only 5,000-6,000 were part of the original community of 28,081 members at the end of 1990. The remainder was mostly recent immigrants and their children. Between 2002 and 2004, the enlarged total of Jews and non-Jewish family members who came to Germany from the FSU was larger than the number of FSU migrants to Israel, but Israel regained primacy as of 2005. The age composition not only of the 5,000-6,000 long-time Jewish residents of Germany but also of the many more newcomers is extremely skewed toward the elderly. In 2011, 212 Jewish births and 1,195 Jewish deaths were recorded by the Jewish community in Germany, a loss of nearly 1,000 Jews. While 382 Jews joined the Jewish communities in 2011, 216 persons emigrated to Israel in 2010-2011 and 997 Jews withdrew membership from German Jewish communities. This explains why the recorded size of the central Jewish community decreased by over 2,000 in spite of immigration. Allowing for delays in joining the organized community on the part of new immigrants and a preference on the part of some Jews not to identify with its official institutions, we assessed Germany’s core Jewish population at 119,000 in 2012, the world’s eighth largest Jewish community. The enlarged Jewish population, inclusive of the non-Jewish relatives of immigrants, is closer to 250,000, and creates new opportunities for Jewish religious, social, and cultural life in Germany. It also suggests significant dependence on welfare and a significant need for elderly services.117
49
In Hungary, our core estimate of 48,200 Jews (the world’s thirteenth largest Jewish community) reflects the negative balance of Jewish births and deaths in a country whose total population’s vital balance has been negative for several years. A Jewish survey in 1999 reported a conspicuously larger enlarged Jewish population than expected.118 However, a demographic extrapolation based on the usually accepted number of post-Holocaust core Jewish survivors and accounting for the known or estimated numbers of births, deaths, and emigrants to Israel and other countries since 1945 closely matches our assessment. The enlarged Jewish population in Hungary is assessed at about 85,000 in 2012. In the 2001 Hungarian Census, only 13,000 reported themselves Jewish by religion. In 2010-2011, 215 persons emigrated to Israel. Belgium’s Jewish population was estimated at 30,000, the world’s fifteenth
largest Jewish community. Quite stable numbers reflected the presence of a traditional Orthodox community in Antwerp and the growth of a large European administrative center in Brussels that has attracted Jews from other countries. However, in 2010-2011, 360 Jews emigrated to Israel, reflecting concerns similar to those of French Jewry. Local Jewish population estimates are quite obsolete in comparison with most other EU countries, but the reported order of magnitude is supported by indirect evidence such as the number of votes collected by Jewish candidates in the 2003 legislative elections.119 The next two largest Jewish communities in the EU, and globally, are in the Netherlands and Italy. In the Netherlands, a 1999 survey estimated a Halakhic Jewish population of 30,072 (which is the basis of our estimate of 30,000), of which perhaps as many as one-third were immigrants from Israel, and an enlarged Jewish population of 43,305.120 In Italy, total Jewish community membership—which historically comprised the overwhelming majority of the country’s Jewish population—decreased from 26,706 in 1995 to 25,143 in 2001 and 24,930 at the end of 2009.121 Our estimate of 28,200 adequately allocates for non-members, also considering a migration to Israel of 191 in 2010-2011. Next in Jewish population size among EU countries are Sweden, estimated at 15,000,122 and Spain, estimated at 12,000.123 No other Jewish community in the EU reaches 10,000 by the core definition. In some EU countries national censuses offered a rough baseline for Jewish population estimates. In Austria, the 2001 Census reported 8,140 Jews, of which 6,988 lived in Vienna.124 We estimated the core community at 9,000. In Romania, the 2002 Census reported a Jewish population of 6,179, but we assessed the community at 9,500. In Poland, where the 2002 Census reported a Jewish population of 1,100, we estimated 3,200. For Austria, Romania, and Poland, available data on Jewish community membership helped improve the estimates. The Former Soviet Union In the Former Soviet Union, Jewish population decrease continued, reflecting an overwhelming excess of Jewish deaths over Jewish births, high rates of intermarriage, low rates of Jewish identification among the children of intermarriages, and significant, though decreasing, emigration. Our 2012 assessment of the total core Jewish population for the 15 republics of the FSU is 308,000, of whom 288,000 lived in Europe and 20,000 in Asia. Almost as many non-Jewish household members created an enlarged Jewish population nearly twice as large as the core.125 A similar number of further eligible persons would probably lead to an estimated Law of Return population approaching one million. The ongoing process of demographic
50
decrease was alleviated to some extent by the revival of Jewish cultural and religious activities, including Jewish education,126 but total migration to Israel from the FSU steadily continued with 6,914 in 2010 and 7,134 in 2011. In the Russian Federation, the October 2002 Census reported 233,600 Jews, compared to our core Jewish population estimate of 252,000 for the beginning of 2003 (derived from a February 1994 Russian Microcensus estimate of 409,000 Jews).127 After the compulsory item on ethnicity (natsyonalnost) on identification documents was canceled, and the Census ethnicity question was made optional for the first time. The October 14, 2010 census of Russia provided a core Jewish population estimated at 157,763, plus another 41,000 undeclared people who most likely pertained to the core Jewish population, for a total of 199,000 in 2010.128 Considering the continuing emigration and negative balance of births and deaths, we evaluate the Russian Federation's Jewish population at 194,000 in 2012, the world’s sixth largest Jewish community. Jewish population size was clearly more stable in Russia than in the other republics of the FSU. This partly reflected Jewish migration among the various republics as well as lower emigration from Moscow and other important urban areas in the Russian Federation.129 Nevertheless, the striking imbalance of Jewish births and deaths, and continuing emigration (3,404 persons to Israel in 2010 and 3,678 in 2011, including non-Jewish household members) implies continuing population decrease and an increasing elderly age composition. The number of births to couples with two Jewish parents decreased from 1,562 in 1988 to 169 in 2000. Births to couples with at least one Jewish parent were estimated at 5,858 in 1988 and 1,057 in 2000. Recorded Jewish deaths were 13,826 in 1988 and 8,218 in 2000. As a result the estimated negative balance of these vital events was -7,978 in 1988 and -7,161 in 2000.130 These changes occur in the context of a general net population decrease being experienced by the Russian Federation, as well as by other European republics of the FSU. In Ukraine, the December 5, 2001 Census yielded an estimate of 104,300 Jews, not significantly different from our estimate of 100,000 on January 1, 2002. Given that our baseline for the latter estimate was the 487,300 Jews counted in the Census of January 1989, the fit between the expected and actual was remarkable.131 Given the dramatic pace of emigration since 1989 and continuing emigration at the end of 2001, the Census fully confirmed our previous assessment of ongoing demographic trends. Adding continuing emigration (1,752 persons to Israel in 2010 and 2,051 in 2011) that, among other things, reflects the instability of Ukraine's politics, we assess the 2012 core Jewish population at 67,000, the world’s eleventh largest Jewish community. Of the other European republics of the FSU, the largest Jewish population is in Belarus. The Belarus Census of October 2009 found 12,926 Jews, with 2.4% of the population not reporting an ethnicity/nationality.132 Our estimate, also considering 668 migrants to Israel in 2010-2011, was adjusted to 12,000 in 2012. Following EU membership in 2004 by the three Baltic republics of Latvia, Lithuania, and Estonia, the Jewish population has been fairly stable. After some adjustments, partly reflecting revisions of the Latvian and Lithuanian national population registers, and accounting for 217 migrants to Israel in 2010-2011, we assessed a combined 11,100 for the three countries in 2012.133
A survey in Moldova found an enlarged Jewish population of 9,240 in 2000.134 The Moldova Census of October 2004 reported 3,628 Jews, although it did not cover the Russian controlled Moldovan territory east of the Dniester River.
51
According to unofficial results of a separate Census of November 2004, about 1,200 Jews lived east of the Dniester River. Considering 443 migrants to Israel in 2010-2011, we assess the core Jewish population of Moldova at 3,900 in 2012. Other European Countries As a result of Hungary, Poland, the Czech Republic, Slovakia, Slovenia, Bulgaria, and Romania joining the EU, only 40,600 Jews lived in Europe outside of the EU and the FSU. Of these, 19,400 lived in Western Europe, primarily in Switzerland (17,500),135 which in 2010-2011 sent 169 migrants to Israel, and 21,200 lived in Eastern Europe and the Balkans, primarily in Turkey and mostly in Istanbul's European neighborhoods. A 2002 survey in Istanbul suggested widespread aging in a community that has experienced significant emigration (235 persons migrated to Israel in 2010-2011). In Istanbul, 10% of the Jewish population was under age 15, compared to 18% age 65 and over.136 Enlarged Jewish populations are significantly higher in Eastern Europe, reflecting the high levels of intermarriage among the dramatically reduced communities following the Shoah and massive emigration.
Asia The Jewish population in Asia is mostly affected by trends in Israel (Appendix). Israel accounts for more than 99% of the total Jewish population in Asia. The former republics of the FSU in Asia and the aggregate of the other countries in Asia each account for less than one-half of one percent of the continental total. Israel After World War II, Israel’s (then still Palestine) Jewish population was just over one-half million.137 This population increased more than tenfold over the next 60 years due to mass immigration and a fairly high and uniquely stable natural increase. Israeli population data are regularly collected by the Israel Central Bureau of Statistics (CBS).138 Israel also has a permanent Population Register maintained by the Ministry of Internal Affairs. Annual data derive from periodic censuses and detailed annual accountancy of intervening events (births, deaths, immigrants, emigrants, and converts). The most recent Census was in December 2008 and, as is usual, resulted in a correction to the current population estimates extrapolated from the previous 1995 Census. Thus, the original Jewish estimate of 5,569,200 for the end of 2008/beginning of 2009 was raised to 5,608,900—a 39,700 person increase. Two main reasons necessitated this update. The first is the normal discrepancy that may occur between repeated population counts. The second is possible delays in the reclassification of persons following conversion to (or from) Judaism. At the beginning of 2012, Israel’s core Jewish population reached 5,901,100, and, when combined with 325,200 non-Jewish members of Jewish households, formed an enlarged Jewish population of 6,226,300.139 For the past several years, the main component of Jewish population growth in Israel has been the natural increase resulting from an excess of births over deaths. In 2004, for the first time, more than 100,000 Jews were born in Israel. In 2011, 121,684 Jewish births and 34,951 Jewish deaths produced a net Jewish natural increase of 86,733 persons. Israel’s Jewish fertility rate increased slightly to nearly 3.0 children per woman, higher than in any other developed country and twice or more the effective Jewish fertility rate in most Diaspora Jewish communities. This reflected not only the large family size of the Jewish population's more religious component, but more significantly a diffused desire for children among the moderately traditional and
52
secular, especially remarkable among the upwardly mobile.140 At the time of this writing the final data on the components of population growth for 2011 were not yet released. In 2011, 16,892 new immigrants, plus presumably 4-5,000 immigrant citizens, arrived in Israel, for a total of 21-22,000 immigrants, of whom 15-16,000 were Jewish.141 Current emigration (estimated at 5-6,000) reduced this to a net migration balance of 15-16,000, of whom about 10,000 were Jewish. In 2010, there were 16,633 new immigrants plus another 6,400 immigrant citizens (i.e. Israeli citizens born abroad who entered the country for the first time) and others in different programs of family reunion, for a total of 23,000, of which 16,100 were Jewish. The net international migration balance was 18,700, of whom 10,200 Jewish, from which a total net emigration estimate can be obtained of 6,900. The net emigration of Jews was 8,500, indicating that among non-Jews the propensity to emigrate was relatively lower. All in all, these data about Israel's international migration balance point to a relatively low level of immigration in comparison to other historical periods, but also to relatively low levels of emigration. The latter observation stands in sharp contrast with the highly spirited debate about an alleged increase of emigration from Israel.142 The number of converts to Judaism remained only a tiny percentage of the non-Jewish members of Jewish households in Israel, especially among recent immigrants. However, evidence from Israel’s Rabbinical Conversion Courts indicates some increase in the number of converts. Overall, between 1999 and 2009, over 48,000, some of whom are not permanent Israeli residents, were converted to Judaism by Rabbinical Conversion Courts. Most converts were new immigrants from the Ethiopian Falash Mura community, but their number has greatly diminished. Consequently, since 2009, the annual number of converts approached 1,500. In 2008, the total number of converts was 6,144, of whom 5,321 were civilians and 823 were processed through the Rabbinate of the Israeli Defense Forces. The respective grand totals were 7,881 in 2007, 4,291 in 2006, and 6,068 in 2005.143 To clarify the intricacies of demographic data in Israel and the territories of the Palestinian Authority, Table 13 reports numbers of Jews, Others (i.e., non-Jewish persons who are members of Jewish households and Israeli citizens by the provisions of the Law of Return), Arabs, and foreign workers and refugees. Each group's total is shown for different territorial divisions: the State of Israel within the pre-1967 borders, East Jerusalem, the Golan Heights, the West Bank, and Gaza. The percentage of Jews (by the enlarged definition) in each division is also shown. Of the 5,901,100 core Jews in 2012, 5,582,000 lived within the State of Israel (as defined by Israel's legal system, without the West Bank). Of these, 5,362,000 lived inside the pre-1967 borders, 200,000 in East Jerusalem, and 20,000 in the Golan Heights. Another 319,000 lived in the West Bank. Of the 325,000 non-Jewish household members included in the enlarged Jewish population, 310,000 lived within the pre-1967 borders, 7,000 in East Jerusalem, 1,000 in the Golan Heights, and 7,000 in the West Bank. Core Jews represented 75.3% of Israel’s total population of 7,837,500, including East Jerusalem, the Golan Heights, and the Israeli population in the West Bank, but not the Arab population in the West Bank and Gaza, nor foreign workers and refugees. Israel's enlarged Jewish population of 6,226,000 represented 79.4% of Israel's total population of 7,837,500. As shown in Table 13, the enlarged Jewish population represented 78.0% of the total within pre-1967 borders, 41.6% in East Jerusalem, 47.7% in the Golan Heights, and 12.7% in the West Bank. If one also considers the Arab population of
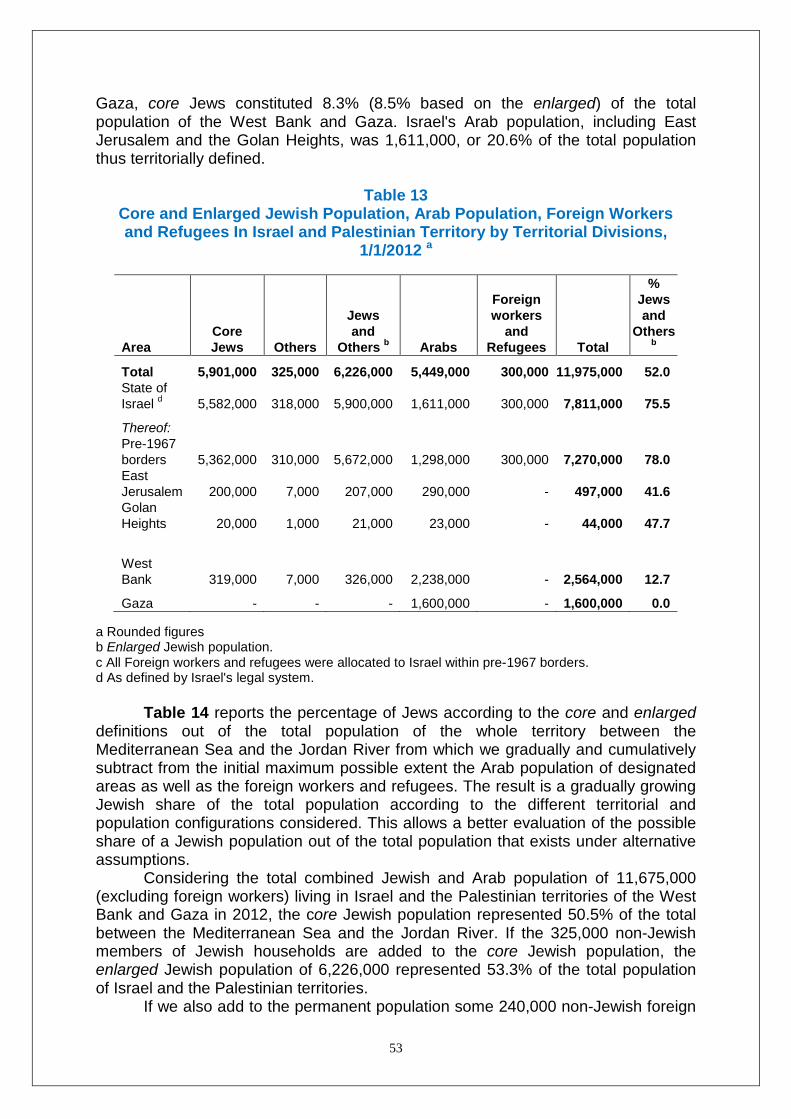
53
Gaza, core Jews constituted 8.3% (8.5% based on the enlarged) of the total population of the West Bank and Gaza. Israel's Arab population, including East Jerusalem and the Golan Heights, was 1,611,000, or 20.6% of the total population thus territorially defined.
Table 13 Core and Enlarged Jewish Population, Arab Population, Foreign Workers and Refugees In Israel and Palestinian Territory by Territorial Divisions,
1/1/2012 a
Area Core Jews Others
Jews and
Others b Arabs
Foreign workers
and Refugees Total
% Jews and
Others b
Total 5,901,000 325,000 6,226,000 5,449,000 300,000 11,975,000 52.0 State of Israel d 5,582,000 318,000 5,900,000 1,611,000 300,000 7,811,000 75.5
Thereof: Pre-1967 borders 5,362,000 310,000 5,672,000 1,298,000 300,000 7,270,000 78.0 East Jerusalem 200,000 7,000 207,000 290,000 - 497,000 41.6 Golan Heights 20,000 1,000 21,000 23,000 - 44,000 47.7
West Bank 319,000 7,000 326,000 2,238,000 - 2,564,000 12.7
Gaza - - - 1,600,000 - 1,600,000 0.0 a Rounded figures b Enlarged Jewish population. c All Foreign workers and refugees were allocated to Israel within pre-1967 borders. d As defined by Israel's legal system. Table 14 reports the percentage of Jews according to the core and enlarged definitions out of the total population of the whole territory between the Mediterranean Sea and the Jordan River from which we gradually and cumulatively subtract from the initial maximum possible extent the Arab population of designated areas as well as the foreign workers and refugees. The result is a gradually growing Jewish share of the total population according to the different territorial and population configurations considered. This allows a better evaluation of the possible share of a Jewish population out of the total population that exists under alternative assumptions. Considering the total combined Jewish and Arab population of 11,675,000 (excluding foreign workers) living in Israel and the Palestinian territories of the West Bank and Gaza in 2012, the core Jewish population represented 50.5% of the total between the Mediterranean Sea and the Jordan River. If the 325,000 non-Jewish members of Jewish households are added to the core Jewish population, the enlarged Jewish population of 6,226,000 represented 53.3% of the total population of Israel and the Palestinian territories. If we also add to the permanent population some 240,000 non-Jewish foreign
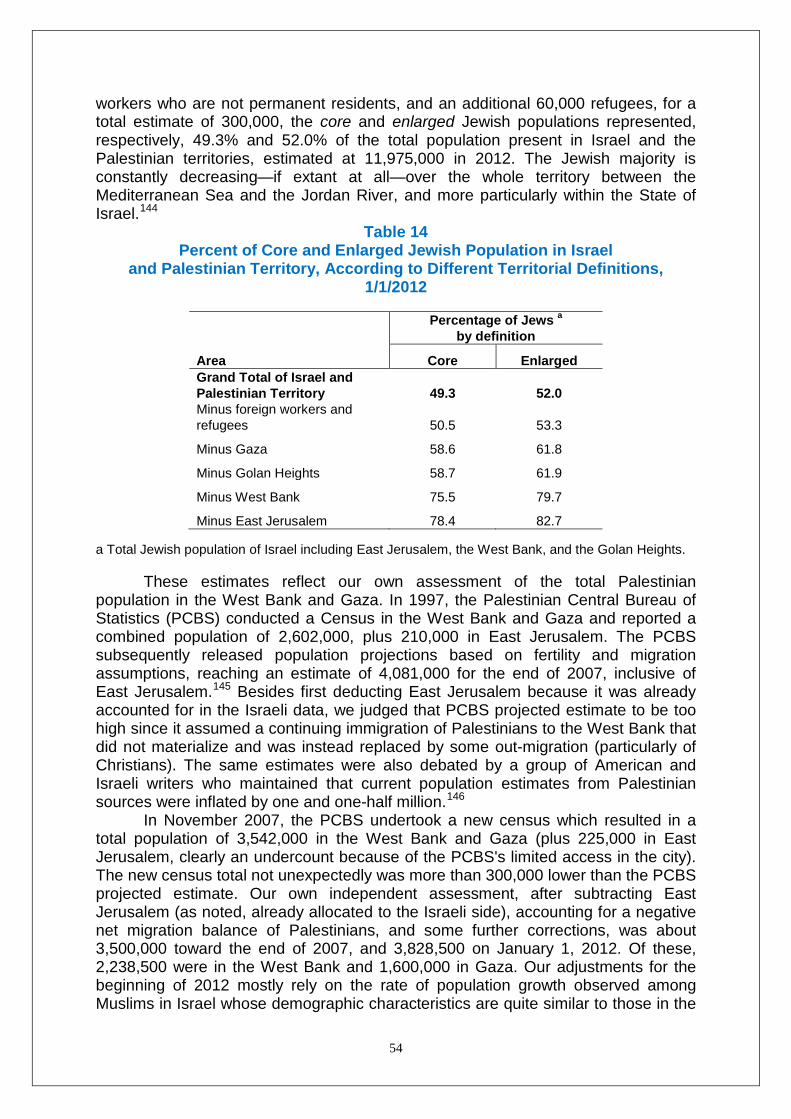
54
workers who are not permanent residents, and an additional 60,000 refugees, for a total estimate of 300,000, the core and enlarged Jewish populations represented, respectively, 49.3% and 52.0% of the total population present in Israel and the Palestinian territories, estimated at 11,975,000 in 2012. The Jewish majority is constantly decreasing—if extant at all—over the whole territory between the Mediterranean Sea and the Jordan River, and more particularly within the State of Israel.144
Table 14 Percent of Core and Enlarged Jewish Population in Israel
and Palestinian Territory, According to Different Territorial Definitions, 1/1/2012
Area
Percentage of Jews a
by definition
Core Enlarged Grand Total of Israel and Palestinian Territory 49.3 52.0 Minus foreign workers and refugees 50.5 53.3
Minus Gaza 58.6 61.8
Minus Golan Heights 58.7 61.9
Minus West Bank 75.5 79.7
Minus East Jerusalem 78.4 82.7 a Total Jewish population of Israel including East Jerusalem, the West Bank, and the Golan Heights.
These estimates reflect our own assessment of the total Palestinian population in the West Bank and Gaza. In 1997, the Palestinian Central Bureau of Statistics (PCBS) conducted a Census in the West Bank and Gaza and reported a combined population of 2,602,000, plus 210,000 in East Jerusalem. The PCBS subsequently released population projections based on fertility and migration assumptions, reaching an estimate of 4,081,000 for the end of 2007, inclusive of East Jerusalem.145 Besides first deducting East Jerusalem because it was already accounted for in the Israeli data, we judged that PCBS projected estimate to be too high since it assumed a continuing immigration of Palestinians to the West Bank that did not materialize and was instead replaced by some out-migration (particularly of Christians). The same estimates were also debated by a group of American and Israeli writers who maintained that current population estimates from Palestinian sources were inflated by one and one-half million.146 In November 2007, the PCBS undertook a new census which resulted in a total population of 3,542,000 in the West Bank and Gaza (plus 225,000 in East Jerusalem, clearly an undercount because of the PCBS's limited access in the city). The new census total not unexpectedly was more than 300,000 lower than the PCBS projected estimate. Our own independent assessment, after subtracting East Jerusalem (as noted, already allocated to the Israeli side), accounting for a negative net migration balance of Palestinians, and some further corrections, was about 3,500,000 toward the end of 2007, and 3,828,500 on January 1, 2012. Of these, 2,238,500 were in the West Bank and 1,600,000 in Gaza. Our adjustments for the beginning of 2012 mostly rely on the rate of population growth observed among Muslims in Israel whose demographic characteristics are quite similar to those in the
55
Palestinian Territories. We assume that the original PCBS figures had been overestimated by counting persons, students, and others who resided abroad for over one year. By our estimates, the 1997-2009 yearly average Palestinian population increase in the aggregate of the West Bank (not including East Jerusalem) and Gaza would be 2.91%. This strictly matches a 2.91% yearly growth rate for Arabs in Israel over the same period.147 The growth rate of Israel's Arab population was slowly declining and in 2011 was 2.36%, as against 1.7% for the Jewish population with immigration and 1.5% without immigration. The Palestinian population's growth rate in the aggregate of the West Bank and Gaza was probably decreasing as well to a level very similar to that of Israel's Arabs. The Arab population of East Jerusalem, which we have included in Israel's population count, was assessed at 290,000 at the beginning of 2012, and constituted 36% of Jerusalem's total population of 803,000.148 By adding East Jerusalem's Arabs to the 3,838,000 who live in the West Bank and Gaza, a total of 4,128,000 would obtain.149 Adding the 1,611,000 Arab population of Israel, including East Jerusalem, and the 3,838,000 Palestinian residents of the West Bank and Gaza, a total of 5,449,000 obtains for the whole territory between the Mediterranean and the Jordan River. In sum, in 2012 Jews (by the core definition) constituted 49.3% of the total population present on the territory between the Mediterranean and the Jordan River, including foreign workers; 50.5% after subtracting foreign workers; 58.6% after subtracting Gaza; 58.7% after subtracting the Arab population of the Golan Heights; 75.5% after subtracting the Arab population of the West Bank; and 78.4% if also subtracting the Arab population of East Jerusalem. If the enlarged rather than the core Jewish population is considered, each of these percentages would increase by 3-4%. Other Asian Countries In the rest of Asia, the Jewish population consisted mainly of the rapidly decreasing communities in the eight Asian FSU republics, the largest of which were Azerbaijan (8,800 Jews in 2012), Uzbekistan (4,200), Kazakhstan (3,300), and Georgia (3,000).150 The largest Jewish population in a single country in Asia besides Israel was Iran. Our estimate of 10,200 Jews in Iran reflects an effort to monitor intensive emigration to Israel, the US, and Europe since the 1979 Islamic Revolution. Large scale emigration, selectively inclusive of younger adults, typically engenders significant aging among the extant remaining communities. Small Jewish populations, partly formed by temporary sojourners, exist in various South Asian and East Asian countries, namely in China. Rapid economic development and increasing relations with Israel render these countries receptive to a small but clearly increasing Jewish presence.
Africa The Jewish population in Africa was mostly concentrated in South Africa (93% of the continental total, Appendix). According to the 2001 Census,151 the white Jewish population was 61,675. Factoring in the national white non-response rate of 14%, led to a corrected estimate of 72,000. Allowing for a certain proportion of actual Jews among the higher self-reported numbers among South Africa’s nonwhites (11,979 blacks, 1,287 coloreds, and 615 Indians, many of whom practice other religions), we
56
assessed the total size of the Jewish community at 75,000 in 2001. Following a continuation of moderate emigration to Israel (386 persons in 2010-2011) and other countries, we estimate South Africa’s Jewish population at 70,200 in 2012, the world’s twelfth largest Jewish community. Our revised estimates for Northern Africa acknowledge the ongoing reduction in the small Jewish communities remaining in Morocco and Tunisia, now assessed with a combined population of 3,400 (and 137 migrants to Israel in 2010-2011). Virtually the entire Jewish population is estimated to have emigrated from Ethiopia. The question that remains open concerns the Falash Mura—a Christian community of Jewish ancestry. Upon migration to Israel, all Falash Mura undergo conversion. Their quest for family reunification creates a never-ending potential stream of often unskilled non-Jewish immigrants and is the subject of continuing public discussion. Since 3,589 Falash Mura went to Israel in 2007, the flow decreased to 1,582 in 2008 and only 239 in 2009. It increased again to 1,655 in 2010 and 2,666 in 2011. Several thousand members of the enlarged community, which we very tentatively assessed at 10,000, are still waiting in Ethiopia hoping to migrate to Israel.
Oceania Continuing immigration produced some increase in Jewish population in Oceania. Australia’s 2006 Census reported a Jewish population of 88,831, up about 5,000 from 2001.152 The new 2011 census reported 97,335 Jews, again an increase of 9.6% in five years.153 Accounting for such factors as continuing immigration, moderate rates of intermarriage,154 non-response to the Census question on religion, and the community’s rather old age composition, we increased the core Jewish population estimate to 112,000 in 2012, an actual upward correction of our previous estimate of 107,500 for 2010. Australia has the world’s ninth largest Jewish population. The 2006 Census of New Zealand suggested a Jewish population increase to 6,858.155 We assessed the total at 7,500 in 2012. The 2011 population census was canceled after a severe earthquake damaged the city of Christchurch.
Dispersion and Concentration In 2012, 93 countries had at least 100 Jews (Table 15). Two countries had Jewish populations of over 5 million each (Israel and the US), another seven had more than 100,000 Jews, three had 50,000 to 99,999, five had 25,000 to 49,999, eight had 10,000 to 24,999, nine had 5,000 to 9,999, 23 had 1,000 to 4,999, and 36 had less than 1,000. The 68 country communities each with less than 10,000 Jews together accounted for 1% of world Jewry.
In only five Diaspora countries did Jews constitute at least 5 per 1,000 (0.5%) of the total population. In descending order by the relative share (not size) of their Jewish population, they were Gibraltar (19.4 Jews per 1,000 inhabitants), the US (17.4), Canada (10.9), France (7.7), and Uruguay (5.1). The case of Israel is evidently different, with a core Jewish population that represents 75.5% of the total population, and an enlarged Jewish population that represents 79.7% of the total population (Table 14). In both Israel and the Diaspora, the percentage of Jews out of the total population is decreasing. By combining the two criteria of Jewish population size and percentage of Jews, we obtain the following taxonomy of the 25 countries with Jewish populations over 10,000 (excluding Israel). Three countries have over 100,000 Jews and at least 5 Jews per 1,000 total population: the US, France, and Canada. Five more countries
57
have over 100,000 Jews and at least 1 Jew per 1,000 total population: the United Kingdom, the Russian Federation, Argentina, Germany, and Australia. One country has 10,000 to 99,999 Jews and at least 5 Jews per 1,000 total population: Uruguay. Nine more countries have 10,000 to 99,999 Jews and at least 1 Jew per 1,000 total population: Ukraine, South Africa, Hungary, Belgium, the Netherlands, Chile, Switzerland, Belarus, and Sweden. Six countries have 10,000 to 99,999 Jews and less than 1 Jew per 1,000 total population: Brazil, Mexico, Italy, Turkey, Spain, and Iran.
Outlook Beyond the many and arguable problems related to Jewish population definitions, and beyond imperfect data availability and accuracy, it is important to recognize that powerful and consistent trends constantly shape and reshape the demographic profile of world Jewry. It is important that we read current data in historical and comparative context. The recent momentum of Jewish population change in the US and in most other countries of the world—at best tending to zero growth—contrasts with that of Israel—characterized by the continuation of significant natural increase. While the transition of Israel to the status of largest Jewish population in the world is grounded on solid empirical foundations, the US remains a very large, culturally and socioeconomically powerful, creative, resilient, and influential center of Jewish life. The aggregate weight of other Jewish communities globally—aside from their continuing cultural relevance—is gradually decreasing. In a Jewish world that has become demographically more bi-polar, but also more individualistic and transnational, the cultural and institutional projection and influence of the two major centers, Israel and the US, tends to become more significant in other geographical areas of Jewish presence.
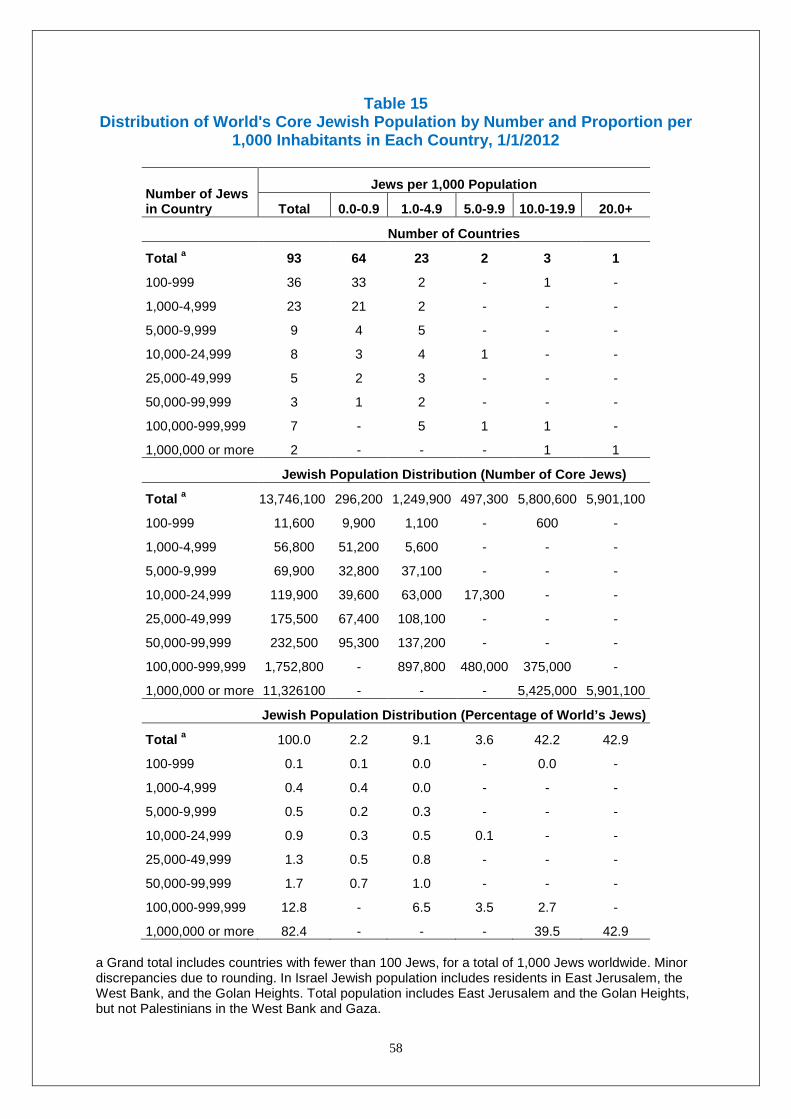
58
Table 15 Distribution of World's Core Jewish Population by Number and Proportion per
1,000 Inhabitants in Each Country, 1/1/2012
Number of Jews in Country
Jews per 1,000 Population
Total 0.0-0.9 1.0-4.9 5.0-9.9 10.0-19.9 20.0+
Number of Countries
Total a 93 64 23 2 3 1
100-999 36 33 2 - 1 -
1,000-4,999 23 21 2 - - -
5,000-9,999 9 4 5 - - -
10,000-24,999 8 3 4 1 - -
25,000-49,999 5 2 3 - - -
50,000-99,999 3 1 2 - - -
100,000-999,999 7 - 5 1 1 -
1,000,000 or more 2 - - - 1 1
Jewish Population Distribution (Number of Core Jews)
Total a 13,746,100 296,200 1,249,900 497,300 5,800,600 5,901,100
100-999 11,600 9,900 1,100 - 600 -
1,000-4,999 56,800 51,200 5,600 - - -
5,000-9,999 69,900 32,800 37,100 - - -
10,000-24,999 119,900 39,600 63,000 17,300 - -
25,000-49,999 175,500 67,400 108,100 - - -
50,000-99,999 232,500 95,300 137,200 - - -
100,000-999,999 1,752,800 - 897,800 480,000 375,000 -
1,000,000 or more 11,326100 - - - 5,425,000 5,901,100
Jewish Population Distribution (Percentage of World’s Jews)
Total a 100.0 2.2 9.1 3.6 42.2 42.9
100-999 0.1 0.1 0.0 - 0.0 -
1,000-4,999 0.4 0.4 0.0 - - -
5,000-9,999 0.5 0.2 0.3 - - -
10,000-24,999 0.9 0.3 0.5 0.1 - -
25,000-49,999 1.3 0.5 0.8 - - -
50,000-99,999 1.7 0.7 1.0 - - -
100,000-999,999 12.8 - 6.5 3.5 2.7 -
1,000,000 or more 82.4 - - - 39.5 42.9 a Grand total includes countries with fewer than 100 Jews, for a total of 1,000 Jews worldwide. Minor discrepancies due to rounding. In Israel Jewish population includes residents in East Jerusalem, the West Bank, and the Golan Heights. Total population includes East Jerusalem and the Golan Heights, but not Palestinians in the West Bank and Gaza.
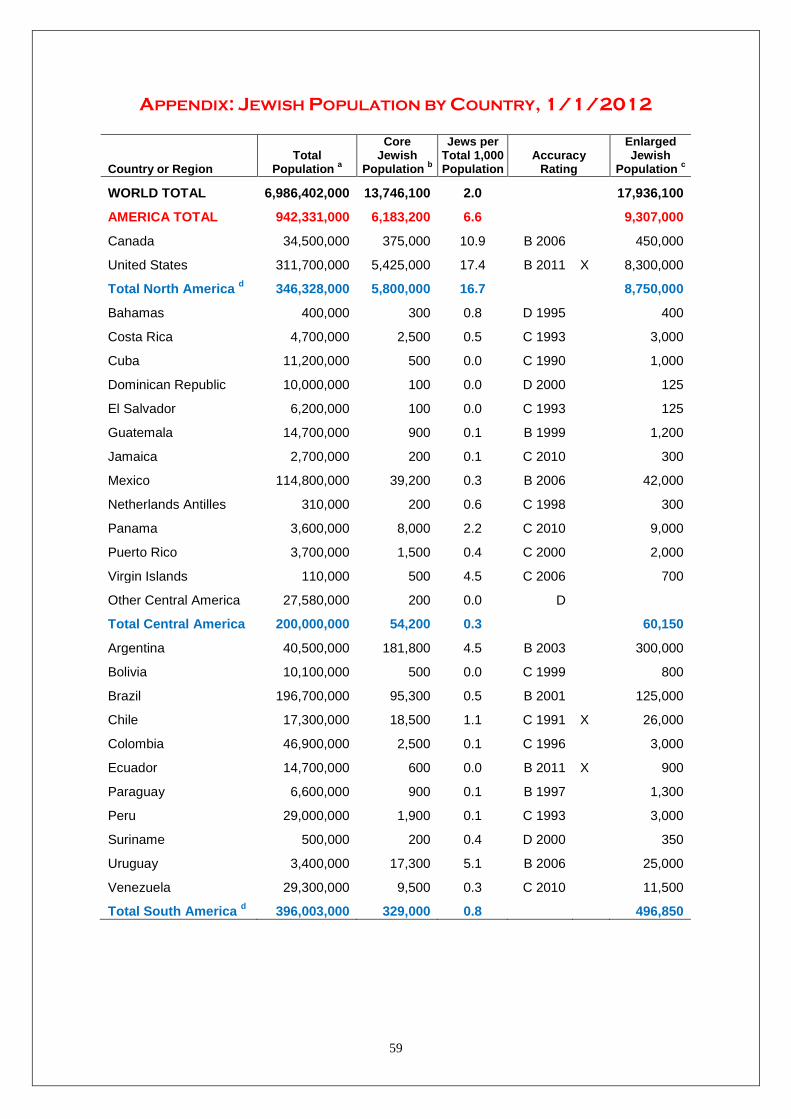
59
APPENDIX: JEWISH POPULATION BY COUNTRY, 1/1/2012
Country or Region Total
Population a
Core Jewish
Population b
Jews per Total 1,000 Population
Accuracy Rating
Enlarged Jewish
Population c
WORLD TOTAL 6,986,402,000 13,746,100 2.0 17,936,100
AMERICA TOTAL 942,331,000 6,183,200 6.6 9,307,000
Canada 34,500,000 375,000 10.9 B 2006 450,000
United States 311,700,000 5,425,000 17.4 B 2011 X 8,300,000
Total North America d 346,328,000 5,800,000 16.7 8,750,000
Bahamas 400,000 300 0.8 D 1995 400
Costa Rica 4,700,000 2,500 0.5 C 1993 3,000
Cuba 11,200,000 500 0.0 C 1990 1,000
Dominican Republic 10,000,000 100 0.0 D 2000 125
El Salvador 6,200,000 100 0.0 C 1993 125
Guatemala 14,700,000 900 0.1 B 1999 1,200
Jamaica 2,700,000 200 0.1 C 2010 300
Mexico 114,800,000 39,200 0.3 B 2006 42,000
Netherlands Antilles 310,000 200 0.6 C 1998 300
Panama 3,600,000 8,000 2.2 C 2010 9,000
Puerto Rico 3,700,000 1,500 0.4 C 2000 2,000
Virgin Islands 110,000 500 4.5 C 2006 700
Other Central America 27,580,000 200 0.0 D
Total Central America 200,000,000 54,200 0.3 60,150
Argentina 40,500,000 181,800 4.5 B 2003 300,000
Bolivia 10,100,000 500 0.0 C 1999 800
Brazil 196,700,000 95,300 0.5 B 2001 125,000
Chile 17,300,000 18,500 1.1 C 1991 X 26,000
Colombia 46,900,000 2,500 0.1 C 1996 3,000
Ecuador 14,700,000 600 0.0 B 2011 X 900
Paraguay 6,600,000 900 0.1 B 1997 1,300
Peru 29,000,000 1,900 0.1 C 1993 3,000
Suriname 500,000 200 0.4 D 2000 350
Uruguay 3,400,000 17,300 5.1 B 2006 25,000
Venezuela 29,300,000 9,500 0.3 C 2010 11,500
Total South America d 396,003,000 329,000 0.8 496,850
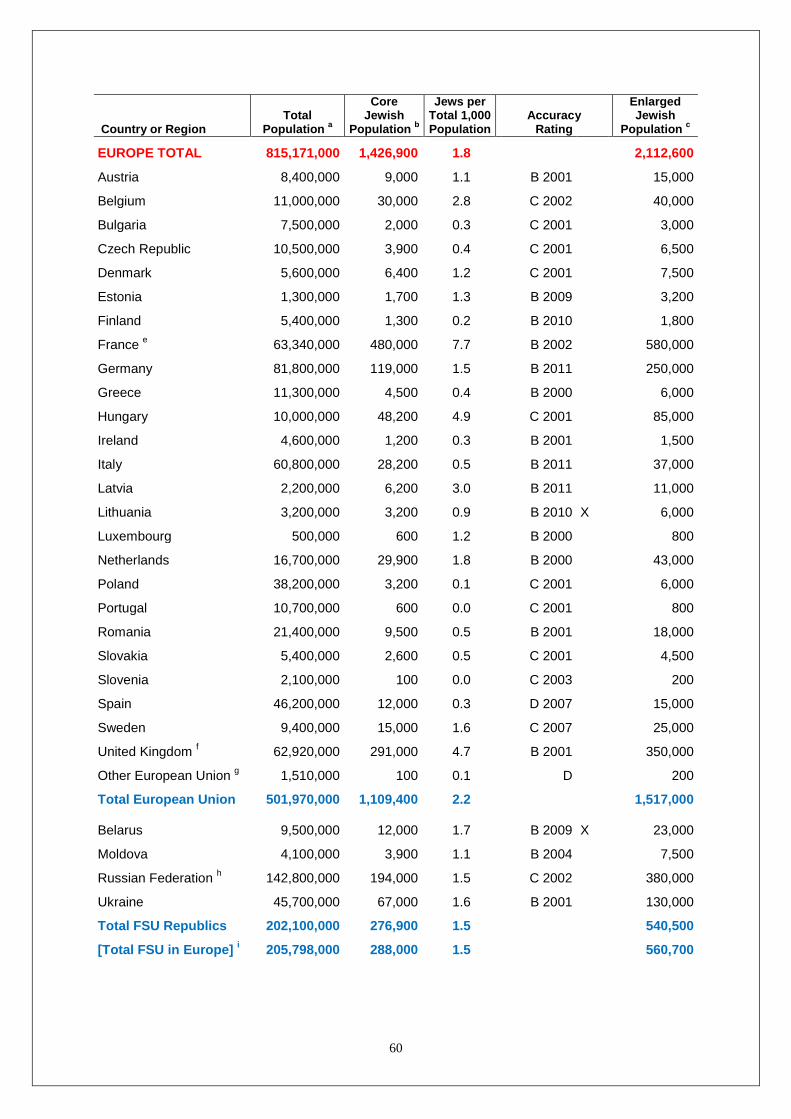
60
Country or Region Total
Population a
Core Jewish
Population b
Jews per Total 1,000 Population
Accuracy Rating
Enlarged Jewish
Population c
EUROPE TOTAL 815,171,000 1,426,900 1.8 2,112,600
Austria 8,400,000 9,000 1.1 B 2001 15,000
Belgium 11,000,000 30,000 2.8 C 2002 40,000
Bulgaria 7,500,000 2,000 0.3 C 2001 3,000
Czech Republic 10,500,000 3,900 0.4 C 2001 6,500
Denmark 5,600,000 6,400 1.2 C 2001 7,500
Estonia 1,300,000 1,700 1.3 B 2009 3,200
Finland 5,400,000 1,300 0.2 B 2010 1,800
France e 63,340,000 480,000 7.7 B 2002 580,000
Germany 81,800,000 119,000 1.5 B 2011 250,000
Greece 11,300,000 4,500 0.4 B 2000 6,000
Hungary 10,000,000 48,200 4.9 C 2001 85,000
Ireland 4,600,000 1,200 0.3 B 2001 1,500
Italy 60,800,000 28,200 0.5 B 2011 37,000
Latvia 2,200,000 6,200 3.0 B 2011 11,000
Lithuania 3,200,000 3,200 0.9 B 2010 X 6,000
Luxembourg 500,000 600 1.2 B 2000 800
Netherlands 16,700,000 29,900 1.8 B 2000 43,000
Poland 38,200,000 3,200 0.1 C 2001 6,000
Portugal 10,700,000 600 0.0 C 2001 800
Romania 21,400,000 9,500 0.5 B 2001 18,000
Slovakia 5,400,000 2,600 0.5 C 2001 4,500
Slovenia 2,100,000 100 0.0 C 2003 200
Spain 46,200,000 12,000 0.3 D 2007 15,000
Sweden 9,400,000 15,000 1.6 C 2007 25,000
United Kingdom f 62,920,000 291,000 4.7 B 2001 350,000
Other European Union g 1,510,000 100 0.1 D 200
Total European Union 501,970,000 1,109,400 2.2 1,517,000 Belarus 9,500,000 12,000 1.7 B 2009 X 23,000
Moldova 4,100,000 3,900 1.1 B 2004 7,500
Russian Federation h 142,800,000 194,000 1.5 C 2002 380,000
Ukraine 45,700,000 67,000 1.6 B 2001 130,000
Total FSU Republics 202,100,000 276,900 1.5 540,500
[Total FSU in Europe] i 205,798,000 288,000 1.5 560,700
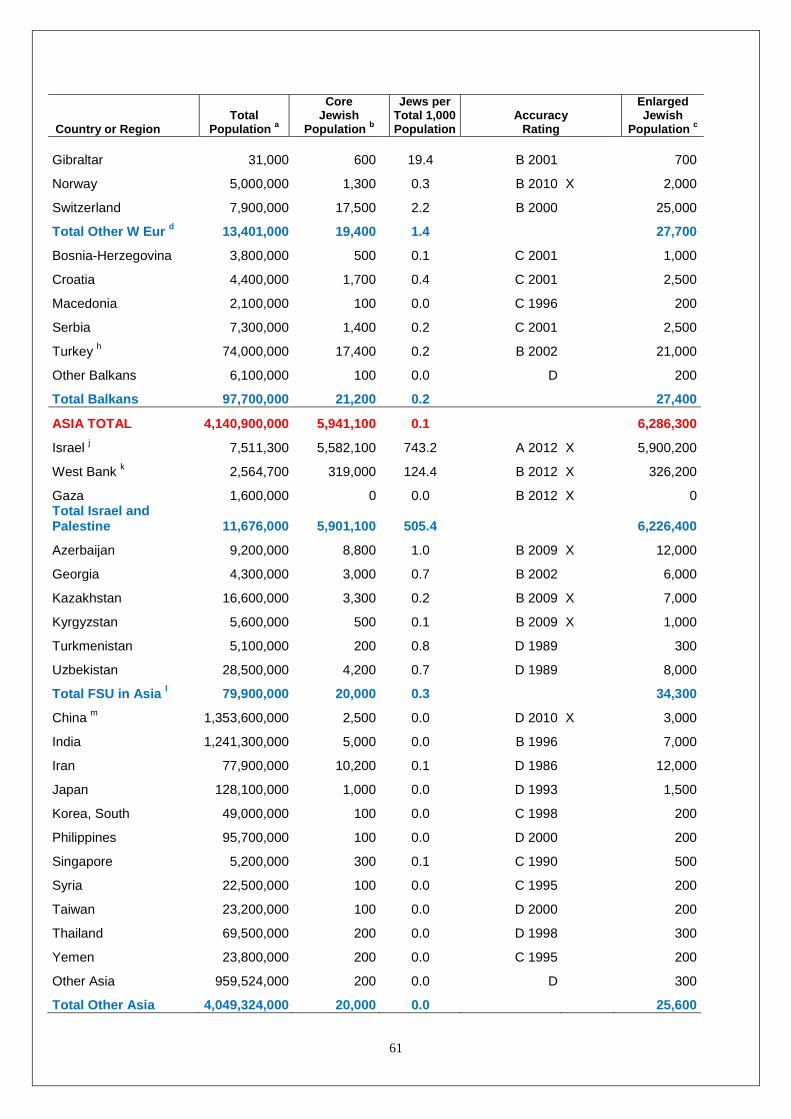
61
Country or Region Total
Population a
Core Jewish
Population b
Jews per Total 1,000 Population
Accuracy Rating
Enlarged Jewish
Population c Gibraltar 31,000 600 19.4 B 2001 700
Norway 5,000,000 1,300 0.3 B 2010 X 2,000
Switzerland 7,900,000 17,500 2.2 B 2000 25,000
Total Other W Eur d 13,401,000 19,400 1.4 27,700
Bosnia-Herzegovina 3,800,000 500 0.1 C 2001 1,000
Croatia 4,400,000 1,700 0.4 C 2001 2,500
Macedonia 2,100,000 100 0.0 C 1996 200
Serbia 7,300,000 1,400 0.2 C 2001 2,500
Turkey h 74,000,000 17,400 0.2 B 2002 21,000
Other Balkans 6,100,000 100 0.0 D 200
Total Balkans 97,700,000 21,200 0.2 27,400
ASIA TOTAL 4,140,900,000 5,941,100 0.1 6,286,300
Israel j 7,511,300 5,582,100 743.2 A 2012 X 5,900,200
West Bank k 2,564,700 319,000 124.4 B 2012 X 326,200
Gaza 1,600,000 0 0.0 B 2012 X 0 Total Israel and Palestine 11,676,000 5,901,100 505.4 6,226,400
Azerbaijan 9,200,000 8,800 1.0 B 2009 X 12,000
Georgia 4,300,000 3,000 0.7 B 2002 6,000
Kazakhstan 16,600,000 3,300 0.2 B 2009 X 7,000
Kyrgyzstan 5,600,000 500 0.1 B 2009 X 1,000
Turkmenistan 5,100,000 200 0.8 D 1989 300
Uzbekistan 28,500,000 4,200 0.7 D 1989 8,000
Total FSU in Asia l 79,900,000 20,000 0.3 34,300
China m 1,353,600,000 2,500 0.0 D 2010 X 3,000
India 1,241,300,000 5,000 0.0 B 1996 7,000
Iran 77,900,000 10,200 0.1 D 1986 12,000
Japan 128,100,000 1,000 0.0 D 1993 1,500
Korea, South 49,000,000 100 0.0 C 1998 200
Philippines 95,700,000 100 0.0 D 2000 200
Singapore 5,200,000 300 0.1 C 1990 500
Syria 22,500,000 100 0.0 C 1995 200
Taiwan 23,200,000 100 0.0 D 2000 200
Thailand 69,500,000 200 0.0 D 1998 300
Yemen 23,800,000 200 0.0 C 1995 200
Other Asia 959,524,000 200 0.0 D 300
Total Other Asia 4,049,324,000 20,000 0.0 25,600
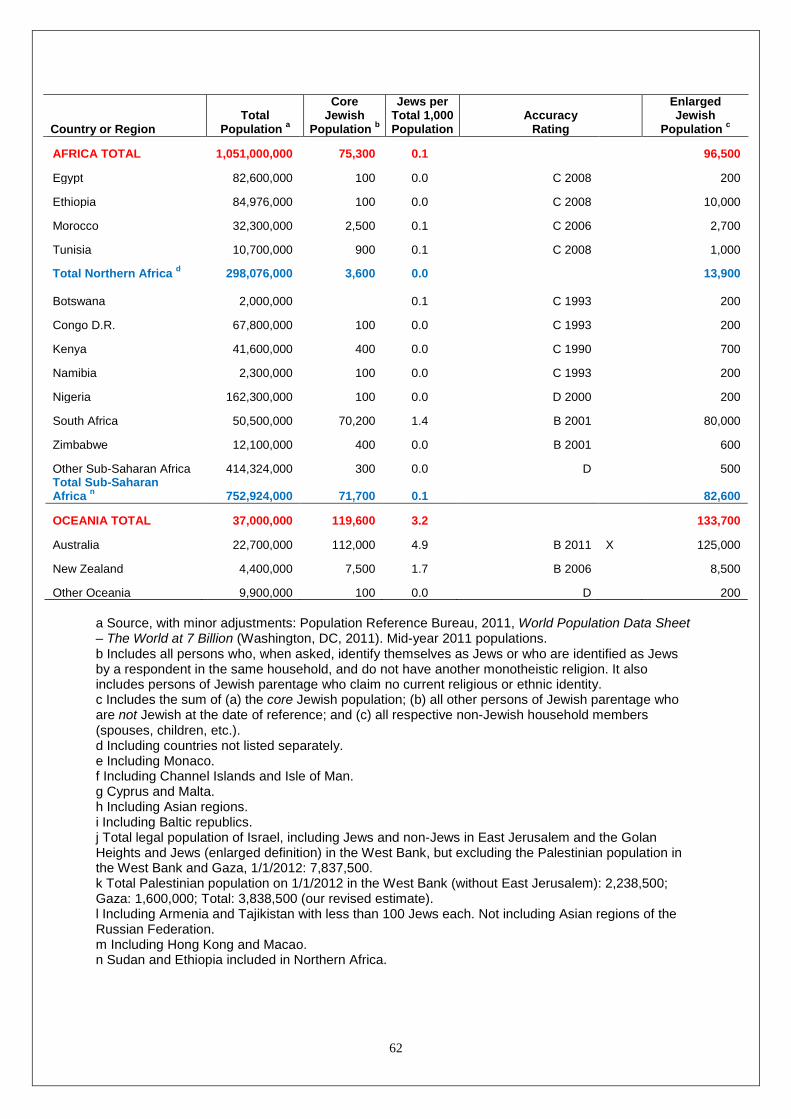
62
Country or Region Total
Population a
Core Jewish
Population b
Jews per Total 1,000 Population
Accuracy Rating
Enlarged Jewish
Population c
AFRICA TOTAL 1,051,000,000 75,300 0.1 96,500
Egypt 82,600,000 100 0.0 C 2008 200
Ethiopia 84,976,000 100 0.0 C 2008 10,000
Morocco 32,300,000 2,500 0.1 C 2006 2,700
Tunisia 10,700,000 900 0.1 C 2008 1,000
Total Northern Africa d 298,076,000 3,600 0.0 13,900 Botswana 2,000,000 0.1 C 1993 200
Congo D.R. 67,800,000 100 0.0 C 1993 200
Kenya 41,600,000 400 0.0 C 1990 700
Namibia 2,300,000 100 0.0 C 1993 200
Nigeria 162,300,000 100 0.0 D 2000 200
South Africa 50,500,000 70,200 1.4 B 2001 80,000
Zimbabwe 12,100,000 400 0.0 B 2001 600
Other Sub-Saharan Africa 414,324,000 300 0.0 D 500 Total Sub-Saharan Africa n 752,924,000 71,700 0.1 82,600
OCEANIA TOTAL 37,000,000 119,600 3.2 133,700
Australia 22,700,000 112,000 4.9 B 2011 X 125,000
New Zealand 4,400,000 7,500 1.7 B 2006 8,500
Other Oceania 9,900,000 100 0.0 D 200 a Source, with minor adjustments: Population Reference Bureau, 2011, World Population Data Sheet – The World at 7 Billion (Washington, DC, 2011). Mid-year 2011 populations. b Includes all persons who, when asked, identify themselves as Jews or who are identified as Jews by a respondent in the same household, and do not have another monotheistic religion. It also includes persons of Jewish parentage who claim no current religious or ethnic identity. c Includes the sum of (a) the core Jewish population; (b) all other persons of Jewish parentage who are not Jewish at the date of reference; and (c) all respective non-Jewish household members (spouses, children, etc.). d Including countries not listed separately. e Including Monaco. f Including Channel Islands and Isle of Man. g Cyprus and Malta. h Including Asian regions. i Including Baltic republics. j Total legal population of Israel, including Jews and non-Jews in East Jerusalem and the Golan Heights and Jews (enlarged definition) in the West Bank, but excluding the Palestinian population in the West Bank and Gaza, 1/1/2012: 7,837,500. k Total Palestinian population on 1/1/2012 in the West Bank (without East Jerusalem): 2,238,500; Gaza: 1,600,000; Total: 3,838,500 (our revised estimate). l Including Armenia and Tajikistan with less than 100 Jews each. Not including Asian regions of the Russian Federation. m Including Hong Kong and Macao. n Sudan and Ethiopia included in Northern Africa.
63
AUTHOR BIOGRAPHY Sergio DellaPergola, born in Italy, has lived in Israel since 1966. He holds a Ph.D. from The Hebrew University of Jerusalem and is former Chairman and Professor of Population Studies at The Hebrew University’s Avraham Harman Institute of Contemporary Jewry, where he has directed the Division of Jewish Demography and Statistics and holds the Shlomo Argov Chair in Israel-Diaspora Relations. An internationally known specialist on the demography of world Jewry, he has published numerous books and over one hundred papers on historical demography, the family, international migration, Jewish identification, and population projections in the Diaspora and in Israel. He has lectured at over 50 universities and research centers worldwide and served as senior policy consultant to the President of Israel, the Israeli Government, the Jerusalem Municipality, and many major national and international organizations. He served on the National Technical Advisory Committee for the 1990 and 2000-01 National Jewish Population Surveys. In 1999 he won the Marshall Sklare Award for distinguished achievement from the Association for the Social Scientific Study of Jewry (ASSJ). He was Visiting Professor at the University of Illinois at Chicago (UIC) in 2009 and at the University of California, Los Angeles (UCLA) in 2010.
Notes
1 Previous estimates, as of January 1, 2010, were published by this author in World Jewish Population, 2010, Current Jewish Population Reports, Report 2010-2 (Storrs, CT, The North American Jewish Data Bank, the Association for the Social Scientific Study of Jewry, and the Jewish Federations of North America, 2010). Previously, such estimates were published annually in the American Jewish Year Book, whose last volume (Vol. 108) in the series issued by the American Jewish Committee appeared in 2008. World Jewish population estimates as of January 1, 2009 as well as of January 1, 2011 were prepared for publication but not issued. The AJYB documented the Jewish world and gave significant attention to Jewish population issues. Since 1981, responsibility for the preparation of annual population estimates for world Jewry was the responsibility of the Division of Jewish Demography and Statistics of the Institute of Contemporary Jewry at The Hebrew University of Jerusalem. The Division was founded by Roberto Bachi in 1959, headed by Uziel O. Schmelz until 1986, and by the present author until 2010. Prof. Uzi Rebhun became Division head in 2010. We express our appreciation to the editors of AJYB during the thirty years of a close collaboration: Morris Fine, Milton Himmelfarb, David Singer, Ruth Seldin, and Lawrence Grossman. The interested reader may consult AJYB volumes for further details on how the respective annual estimates were obtained. See also Sergio DellaPergola, Uzi Rebhun, and Mark Tolts, “Prospecting the Jewish Future: Population Projections 2000–2080,” American Jewish Year Book, 100 (New York, American Jewish Committee, 2000), 103–146. 2Population Reference Bureau, 2010 World Population Data Sheet (Washington, DC, 2010). 3Jewish population estimates in the US have been the subject of a lively debate. This author's findings are further elaborated later in this report. For a different approach,
64
and higher Jewish population estimates, see: Ira M. Sheskin and Arnold Dashefsky, Jewish Population in the United States, 2012, in in Current Jewish Population Reports, Number 6 - 2013 (Storrs, CT: Mandell Berman Institute, North American Jewish Data Bank, The Association for the Social Scientific Study of Jewry, and The Jewish Federations of North America.) 4See below the discussion on intermarriage and conversion. 5See Sergio DellaPergola, Uzi Rebhun, and Mark Tolts, "Contemporary Jewish Diaspora in Global Context: Human Development Correlates of Population Trends” Israel Studies, 11, 1, 2005, 61-95. 6For historical background, see Roberto Bachi, Population Trends of World Jewry (Jerusalem, 1976); U.O. Schmelz, “Jewish Survival: The Demographic Factors,” American Jewish Year Book, 81 (New York, American Jewish Committee,1981), 61–117; U.O. Schmelz, Aging of World Jewry (Jerusalem, 1984); Sergio DellaPergola, "Some Fundamentals of Jewish Demographic History," in Sergio DellaPergola and Judith Even (eds.), Papers in Jewish Demography 1997 (Jerusalem, The Hebrew University, 2001), 11-33; Sergio DellaPergola, “Changing Cores and Peripheries: Fifty Years in Socio-demographic Perspective,” in Robert S. Wistrich (ed.) Terms of Survival: The Jewish World since 1945 (London, 1995), 13-43; Sergio DellaPergola, World Jewry beyond 2000: Demographic Prospects (Oxford, 1999). 7The term core Jewish population was initially suggested in Barry A. Kosmin, Sidney Goldstein, Joseph Waksberg, Nava Lerer, Ariela Keysar, and Jeffrey Scheckner, Highlights of the CJF 1990 National Jewish Population Survey (New York, 1991). 8Michael Corinaldi, The Enigma of Jewish Identity: The Law of Return, Theory and Practice (Srigim-Lion, 2001, in Hebrew). 9In the NJPS 2000-01 version initially processed and circulated by UJC, a Jew is defined as a person whose religion is Judaism, OR whose religion is Jewish and something else, OR who has no religion and has at least one Jewish parent or a Jewish upbringing, OR who has a non-monotheistic religion and has at least one Jewish parent or a Jewish upbringing. See Laurence Kotler-Berkowitz, Steven M. Cohen, Jonathon Ament, Vivian Klaff, Frank Mott, and Danyelle Peckerman-Neuman, with Lorraine Blass, Debbie Bursztyn, and David Marker, The National Jewish Population Survey 2000–01: Strength, Challenge, and Diversity in the American Jewish Population (New York, 2003). The issue of Contemporary Jewry (the scholarly journal of the Association for the Scientific Study of Jewry, edited by Samuel Heilman), 25, 2005, is devoted to critical essays and analyses of NJPS 2000-01 methods and findings. 10The term enlarged Jewish population was initially suggested by Sergio DellaPergola, “The Italian Jewish Population Study: Demographic Characteristics and Trends,” in U.O. Schmelz, P. Glikson, and S.J. Gould, (eds.) Studies in Jewish Demography: Survey for 1969–1971 (Jerusalem-London, 1975), 60–97. 11Kotler-Berkowitz et al., National Jewish Population Survey 2000–01, cit. 12Ruth Gavison, 60 Years to the Law of Return: History, Ideology, Justification (Jerusalem, Metzilah Center for Zionist, Jewish, Liberal and Humanistic Thought, 2009). 13For a concise review of the rules of attribution of Jewish personal status in rabbinic and Israeli law, including reference to Jewish sects, isolated communities, and apostates, see Michael Corinaldi, “Jewish Identity,” Chapter 2 in his Jewish Identity: The Case of Ethiopian Jewry (Jerusalem, 1998).
65
14Michael Hammer et al., "Jewish and Middle Eastern non-Jewish populations share a common pool of Y-chromosome biallelic haplotypes," Proceedings of the National Academy of Sciences, June 6, 2000, 97, 12, 6769–6774; Doron M. Behar et al., "MtDNA evidence for a genetic bottleneck in the early history of the Ashkenazi Jewish population," European Journal of Human Genetics, 2004, 1–10; Doron M. Behar et al., "The genome-wide structure of the Jewish people," Nature, http://www.nature.com/dofinder/10.1038/nature09103, 1-6. 15Many of these global activities are executed by, or in coordination with, the Division of Jewish Demography and Statistics at The A. Harman Institute of Contemporary Jewry (ICJ), The Hebrew University of Jerusalem. 16For overviews of subject matter and technical issues see Paul Ritterband, Barry A. Kosmin, and Jeffrey Scheckner, “Counting Jewish Populations: Methods and Problems,” American Jewish Year Book, 88 (New York, American Jewish Committee, 1988), 204–21; Sergio DellaPergola, “Demography,” in Martin Goodman (ed.), The Oxford Handbook of Jewish Studies (Oxford, 2002), 797–823. 17Among initiatives aimed at strengthening Jewish population research, initiated by the late Roberto Bachi of The Hebrew University and sponsored by major Jewish organizations worldwide, an International Scientific Advisory Committee (ISAC) was established under the chairmanship of Sidney Goldstein. See Sergio DellaPergola and Leah Cohen (eds.), World Jewish Population: Trends and Policies (Jerusalem, 1992). An Initiative on Jewish Demography, sponsored by the Jewish Agency, facilitated data collection and analysis from 2003-2005. Between 2003 and 2009, the Jewish People Policy Planning Institute (JPPPI) provided a framework for Jewish population policy analysis and suggestions. See Sergio DellaPergola, Jewish Demography: Facts, Outlook, Challenges, JPPPI Alert Paper 2 (Jerusalem, 2003); The Jewish People Policy Planning Institute Annual Assessment 2004-2005, Between Thriving and Decline (Jerusalem, 2005); The Jewish People Policy Planning Institute, The Conference on the Future of the Jewish People 2007, Background Policy Documents (Jerusalem, 2007); The Jewish People Policy Planning Institute, Tomorrow (Jerusalem, 2008); Sergio DellaPergola, Jewish Population Policies: Demographic Trends and Options in Israel and in the Diaspora (Jerusalem, forthcoming). 18See a synopsis of the main findings in Ira M. Sheskin, How Jewish Communities Differ: Variations in the Findings of Local Jewish Demographic Studies (New York, City University of New York, North American Jewish Data Bank, 2001) and Ira M. Sheskin Error! Main Document Only.Comparisons of Jewish Communities: A Compendium of Tables and Bar Charts (Storrs, CT: Mandell Berman Institute, North American Jewish Data Bank and the Jewish Federations of North America, 2012) at www.jewishdatabank.org. 19Country data and estimates derived from United Nations, Department of Economic and Social Affairs, Population Division, World Population Prospects: The 2008 Revision. Volume I: Comprehensive Tables (New York, 2009). 20See DellaPergola et al., "Prospecting the Jewish Future," cit., and unpublished tabulations. A new round of population projections undertaken in the light of the latest data helped in the current assessment. 21Israel Central Bureau of Statistics, Statistical Abstract of Israel, 61 (Jerusalem, 2010).
66
22As noted, the Law of Return applies to Jews and their extended families. The Law of Entrance and Law of Citizenship apply to all other foreign arrivals, some of whom ask for Israeli citizenship. 23For definitions of Metropolitan Statistical Areas (MSAs) in the US see: United States, Executive Office of the President, Office of Management and Budget, OMB Bulletin No. 09-91, Update of Statistical Area Definitions and Guidance on Their Uses (Washington, DC, 2008). 24For Israel estimates, see Israel Central Bureau of Statistics, Statistical Abstract of Israel, cit., table 2-16. For US estimates, see Ira M. Sheskin and Arnold Dashefsky, Jewish Population in the United States, 2012, cit. Some of the latter figures refer to different years and roughly compare with each other regarding definitions and methods. 25Israel Central Bureau of Statistics, Statistical Abstract of Israel, cit.; HIAS, Annual Report (New York, annual); Zentralwolfahrtsstelle der Juden in Deutschland (ZWJD), Mitgliederstatistik; Der Einzelnen Jüdischen Gemeinden und Landesverbände in Deutschland (Frankfurt a. M., annual). 26Sergio DellaPergola, "International Migration of Jews," in Eliezer Ben-Rafael and Yitzhak Sternberg (eds.), Transnationalism: Diasporas and the advent of a new (dis)order (Leiden/Boston, Brill, 2009), 213-236. 27See Uzi Rebhun and Lilach Lev Ari, American Israelis: Migration, Transnationalism, and Diasporic Identity (Leiden/Boston, Brill, 2010). 28Yinon Cohen, "Migration to and from Israel," Contemporary Jewry, 29, 2, 2009, 115-125; Mark Tolts, Some Demographic and Socio-Economic Trends of the Jews in Russia and the FSU (Jerusalem, The Hebrew University, The A. Harman Institute of Contemporary Jewry, Division of Jewish Demography and Statistics, 2009). 29Shulamit Reinharz and Sergio DellaPergola, Jewish Intermarriage around the World (New Brunswick-London, Transaction, 2009). 30Mark Tolts, “The Post-Soviet Jewish Population in Russia and the World,” Jews in Russia and Eastern Europe, 1 (52), 2004, 37-63. 31David Graham and Daniel Vulkan, Britain’s Jewish Community Statistics (London, Board of Deputies of British Jews, 2008). 32Zentralwolfahrtsstelle der Juden in Deutschland (ZWJD), Mitgliederstatistik; Der Einzelnen Jüdischen Gemeinden und Landesverbände in Deutschland (Frankfurt a. M., annual). 33Sergio DellaPergola, "Actual, Intended, and Appropriate Family Size among Jews in Israel," Contemporary Jewry, 29, 2, 2009, 127-152. 34Sergio DellaPergola, "Jewish Out-Marriage: A Global Perspective," in Shulamit Reinharz and Sergio DellaPergola (eds.), Jewish Intermarriage around the World, cit., 13-39. 35Nurit Dvorin, "Marriages of Israelis Abroad and the Role of Former Soviet Union Immigrants," Megamot, 44, 3, 2006, 477-506. 36Bruce A. Phillips, Re-examining Intermarriage: Trends, Textures, Strategies. (New York, The Susan and David Wilstein Institute of Jewish Policy Studies, and the American Jewish Committee, The William Petschek National Family Center, 1997). 37Goskomstat (1994) Mikroperepisis' naselenii Rossiiskoi Federatsii 1994. (Moscow, 1995, author's own processing). 38Kotler-Berkowitz et al., The National Jewish Population Survey 2000–01, cit. 39Pew Forum on Religion & Public Life, US Religious Landscape Survey: Religious Affiliation: Diverse and Dynamic, February 2008 (Washington, D.C., Pew Research
67
Center, 2008). 40David J. Graham, The socio-spatial boundaries of an ‘invisible’ minority: a quantitative (re)appraisal of Britain’s Jewish population. Thesis submitted for the degree of DPhil in Geography, St Catherine’s College, University of Oxford, Michaelmas Term, 2008. 41 Steven M. Cohen, Jacob B. Ukeles, and Ron Miller Jewish Community Study of New York: 2011 Comprehensive Report (New York, UJA-Federation of New York, 2012). 42Estimated because of the lack of a fully detailed age distribution. See Erik H. Cohen with Maurice Ifergan, Les Juifs de France: Valeurs et identité (Paris, Fonds Social Juif Unifié, 2002). 43Sergio DellaPergola, "How Many Jews in the US? The Demographic Perspective", paper presented at International Conference on Jewish Demography, Waltham, Mass., Brandeis University, 2011. 44Population Reference Bureau, 2010 World Population Data Sheet (Washington, DC, 2010). 45Sources and findings are reviewed in Sergio DellaPergola, “Was It the Demography? A Reassessment of U.S. Jewish Population Estimates, 1945–2001,” Contemporary Jewry, 25, 2005, 85-131. 46See Ira Rosenwaike, “A Synthetic Estimate of American Jewish Population Movement over the Last Three Decades,” in U.O. Schmelz and Sergio DellaPergola (eds.), Papers in Jewish Demography 1977. (Jerusalem, The Hebrew University, 1980), 83-102. 47U.O. Schmelz and Sergio DellaPergola, “The Demographic Consequences of U.S. Jewish Population Trends,” American Jewish Year Book, 83 (New York, American Jewish Committee, 1983), 141-87; U.O. Schmelz and Sergio DellaPergola, Basic Trends in American Jewish Demography (New York, American Jewish Committee, 1988). 48Sources and findings are reviewed in Sergio DellaPergola, “Was It the Demography?", cit. 49US Census Bureau, “Religion Reported by the Civilian Population in the United States, March 1957,” Current Population Reports, Population Characteristics, Series P-20, No. 79 (Washington, DC, 1958); US Census Bureau, “Tabulations of Data on the Social and Economic Characteristics of Major Religious Groups, March 1957” (Washington, DC, 1968); Paul C. Glick, “Intermarriage and Fertility Patterns among Persons in Major Religious Groups,” Eugenics Quarterly, 7, 1960. 50Fred Massarik, “National Jewish Population Study: A New United States Estimate,” American Jewish Year Book, 75 (New York and Philadelphia, Jewish Publication Society and American Jewish Committee, 1974), 296-304. 51Kosmin et al., Highlights of the CJF 1990 National Jewish Population Survey, cit. 52U.O. Schmelz and Sergio DellaPergola, “The Demographic Consequences of U.S. Jewish Population Trends,” American Jewish Year Book, 83 (New York, American Jewish Committee, 1983), 141-87; U.O. Schmelz and Sergio DellaPergola, Basic Trends in American Jewish Demography (New York, American Jewish Committee, 1988). 53Kotler-Berkowitz et al., The National Jewish Population Survey 2000–01, cit. 54Mayer et al., American Jewish Identity Survey 2001, cit. For a comparison of the two studies see Joel Perlmann, Two National Surveys of American Jews, 2000-01: A
68
Comparison of the NJPS and AJIS, Working Paper No. 501 (Annandale-on-Hudson, The Levy Economics Institute of Bard College, 2007). 55Mark Schulman, “National Jewish Population Survey 2000–01: Study Review Memo,” prepared for United Jewish Communities (New York, 2003). 56Gary Tobin and Sid Groeneman, Surveying the Jewish Population in the United States. Part 1: Population Estimate. Part 2: Methodological Issues and Challenges. (San Francisco, Institute for Jewish & Community Research, 2003). 57Barry A. Kosmin, Egon Mayer, and Ariela Keysar, American Religious Identification Survey 2001 (New York, 2001); Barry A. Kosmin, and Ariela Keysar, American Religious Identification Survey (ARIS 2008) Summary Report (Hartford, CT, Trinity College, 2009). 58Tom W. Smith, Religious Switching Among American Jews (New York, The American Jewish Committee, 2009). 59Forum on Religion & Public Life, U.S. Religious Landscape Survey: Religious Affiliation, cit. 60Elizabeth Tighe, David Livert, Melissa Barnett, and Leonard Saxe, "Cross-Survey Analysis to Estimate Low Incidence Religious Groups" (Waltham, MA, Brandeis University, Steinhardt Social Research Institute, 2009). The project was directed by Leonard Saxe. 61Elizabeth Tighe, Leonard Saxe, and Charles Kadushin, with Raquel Magidin De Kramer, Begli Nurshadenov, Janet Aronson, and Lynn Cherny, Estimating the Jewish Population of the United States: 2000-2010 (Waltham, Brandeis University, Steinhardt Social Research Institute, 2011). 62Our processing of the original data reported in Elizabeth Tighe, Leonard Saxe, Darren Brown, Jennifer Dillinger, Aron Klein, and Ashley Hill, Research Synthesis of National Survey Estimates of the U.S. Jewish Population; Project Summary, Method and Analysis Plan (Waltham, Brandeis University, Steinhardt Social Research Institute, 2005). 63Leonard Saxe, Elizabeth Tighe, and Benjamin Phillips with Ariel Libhaber, Daniel Parmer, Jessica Simon, and Graham Wright, Understanding Contemporary American Jewry (Waltham, MA, Brandeis University, Steinhardt Social Research Institute, 2006). 64Forum on Religion & Public Life, U.S. Religious Landscape Survey: Religious Affiliation, cit. 65Marvin Schick, A Census of Jewish Day Schools in the United States 2003-2004 (Jerusalem, Avi Chai, 2005). For systematic international comparisons at an earlier point in time see Sergio DellaPergola and Uziel O. Schmelz, "Demography and Jewish Education in the Diaspora: Trends in Jewish School-Age Population and School Enrollment," in Harold S. Himmelfarb and Sergio DellaPergola, Jewish Education Worldwide: Cross-Cultural Perspectives (Lanham, MD, University Press of America, 1989), 43-68. 66HIAS, Statistical Report (New York, The Hebrew Immigrant Aid Society, annual). 67Elizabeth Tighe, Charles Kadushin, Leonard Saxe, Jewish Population in the US: 1990 vs. 2000, cit. 68Ira M. Sheskin and Arnold, Dashefsky, Jewish Population in the United States, 2010, Current Jewish Population Reports, Report 2010-1 (Storrs, CT, The North American Jewish Data Bank, the Association for the Social Scientific Study of Jewry, and the Jewish Federations of North America).
69
69Uzi Rebhun and Sidney Goldstein, “Changes in the Geographical Dispersion and Mobility of American Jews, 1990-2001,” The Jewish Journal of Sociology, 48, 1, 5-33, 2006; Sid Groeneman and Tom W. Smith, Moving: The Impact of Geographical Mobility on the Jewish Community (New York, The Jewish Federations of North America, 2009). 70Ira M. Sheskin and Arnold Dashefsky, “Jewish Population of the United States, 2007,” American Jewish Year Book, 107 (New York, The American Jewish Committee, 2007) 136-138 and 198-199. 71Ira M. Sheskin, “Four Questions about American Jewish Demography,” Jewish Political Studies Review, 20, 1-2, 2008, 23-42. 72Leonard Saxe, Elizabeth Tighe, and Benjamin Phillips, with Ariel Libhaber, Daniel Parmer, Jessica Simon, and Graham Wright, Understanding Contemporary American Jewry (Waltham, Brandeis University, Steinhardt Social Research Institute, 2006); Leonard Saxe, Elizabeth Tighe, Benjamin Phillips, Charles Kadushin, with Melissa Barnett, Deborah Grant, David Livert, Ariel Libhaber, Masha Sud Lokshin, Daniel Parmer, David Rindskopf, Jessica Simon, and Graham Wright, Reconsidering the Size and Characteristics of the American Jewish Population: New Estimates of a Larger and More Diverse Community (Waltham, Brandeis University, Steinhardt Social Research Institute, 2007); Tighe, Elizabeth, Kadushin, Charles, and Saxe, Leonard, Jewish Population in the US: 1990 vs. 2000, cit., 2009; Elizabeth Tighe, Leonard Saxe, Charles Kadushin et al., Estimating the Jewish Population of the United States: 2000-2010, cit, 2011. 73DellaPergola, “Was it the Demography?," cit. 74DellaPergola, World Jewish Population, 2010, World Jewish Population, 2010, cit. 75See Kosmin et al., Highlights of the CJF 1990 National Jewish Population Survey, cit. 76Sergio DellaPergola, “Was It the Demography?” cit. 77DellaPergola, "How Many Jews in the U.S.?", cit. 78See the assessment based on both quantitative and qualitative data in Sylvia Barack Fishman, Double or Nothing? Jewish Families and Mixed Marriage (Hanover and London: Brandeis University Press, 2004). See also: Arnold Dashefsky in collaboration with Zachary I. Heller, Intermarriage and Jewish Journeys in the United States (Newton Centre, MA, The National Center for Jewish Policy Studies at Hebrew College, 2008). 79See Leonard Saxe, Charles Kadushin, and Graham Wright, 2005 Boston Jewish Community Study (Waltham, MA, Brandeis University, Steinhardt Social Research Institute, 2006). 80Ira M. Sheskin and Arnold Dashefsky, Jewish Population of the United States, 2010, cit. 81Detailed information on Canadian Census returns is available from Statistics Canada. See http://www.statcan.ca. For the 2006 Census, see, among other links: http://www12.statcan.ca/english/census06/data/highlights/ethnic/pages/Page.cfm?Lang=E&Geo=PR&Code=01&Data=Count&Table=2&StartRec=1&Sort=3&Display=All&CSDFilter=5000 (Ethnic origins, 2006 counts, for Canada, provinces and territories - 20% sample data). 82The growth of a new Canadian ethnic identity from the merger of pre-existing ethnicities is parallel to the development of a new American ethnic identity in the US, discussed by Stanley Lieberson and Mary C. Waters, From Many Strands: Ethnic and Racial Groups in Contemporary America, The Population of the United States in
70
the 1980s, A Census Monograph Series (New York, Russell-Sage, 1988). 83Apparent inconsistencies in the ratio between the number Jews by religion and by ethnicity depend on changes in classification definitions and modes of data processing at Statistics Canada. 84Gustave Goldman, "Intermarriage among Jews in Canada: A Demographic Perspective," in Shulamit Reinharz and Sergio DellaPergola, Jewish Intermarriage around the World, cit, 105-114. 85Charles Shahar, The Jewish Community of Canada (Toronto, 2004). 86For overviews of demographic patterns of Jews on the continent see: U.O. Schmelz and Sergio DellaPergola, "The Demography of Central and South American Jewry," American Jewish Year Book, 85 (New York-Philadelphia, Jewish Publication Society and American Jewish Committee, 1985), 51-102; Sergio DellaPergola, “Demographic Trends of Latin American Jewry” in J. Laikin Elkin and G. W. Merkx (eds.), The Jewish Presence in Latin America (Boston: Allen and Unwin, 1987), 85-133. Sergio DellaPergola, “Autonomy and Dependency: Latin American Jewry in Global Perspective” in Judit Bokser Liwerant, Eliezer Ben-Rafael, Yosef Gorni, and Raanan Rein (eds.), Identities in an Era of Globalization and Multiculturalism: Latin America in the Jewish World (Leiden/Boston, Brill, 2008), 47-80. 87See Israel Central Bureau of Statistics: http://www.cbs.gov.il. 88Shmuel Adler, Emigration among Immigrants from Argentina that Arrived During the Period 1.1.89-31.12.02 (Jerusalem, State of Israel Ministry of Immigrant Absorption, Division of Planning and Research, 2004). 89Adrian Jmelnizky and Ezequiel Erdei, Estudio de Población Judía en Ciudad de Buenos Aires y Gran Buenos Aires (AMBA) (Buenos Aires, Media, Centro de Estudios para las Comunidades Judías de Latinoamérica, American Joint Distribution Committee, 2005). 90Yaacov Rubel, La Población Judía de la Ciudad de Buenos Aires, Perfil Socio-Demográfico (Buenos Aires, Agencia Judía para Israel, Iniciativa de Demografía Judía, 2005). 91See http://www.ibge.br; René D. Decol, “Brazilian Jews: a Demographic Profile,” unpublished paper delivered at the International Conference, Jewish Agency Initiative on Jewish Demography (Jerusalem, 2002). 92Federação Israelita do Estado de São Paulo (FISESP), Recadastramento comunitário 2000–01 (São Paulo, 2002). 93Instituto Brasilero de Geografia e Estatistica IBGE, Population Census (Rio de Janeiro, various years). 94René Decol, Imigraçoes urbanas para o Brasil: o caso dos Judeus (Campinas, Universidade Estadual, 1999, unpublished PhD. dissertation). 95René Daniel Decol, "A Demographic Profile of Brazilian Jewry," Contemporary Jewry, 29, 2, 2009, 99-113. 96See Instituto Nacional de Estadistica, Geografia e Informatica, XII Censo General de Población y Vivienda 2000 (México City, 2002). 97Comité Central Israelita de México, Estudio sobre tendencias de la educación judía en México. Censo socio-demográfico de la comunidad judía de México (México, 2000). 98Sergio DellaPergola and Susana Lerner, La población judía de México: Perfil demográfico, social y cultural (México-Jerusalén, 1995). The project, conducted in cooperation among the Centro de Estudios Urbanos y de Desarrollo Urbano (CEDDU), El Colegio de Mexico, and the Division of Jewish Demography and
71
Statistics of The A. Harman Institute of Contemporary Jewry, The Hebrew University, was sponsored by the Asociación Mexicana de Amigos de la Universidad Hebrea de Jerusalén. 99Comité Central Israelita de México, Estudio poblacional de la comunidad judía de México (México, 2006). 100Gabriel Berger et al., Estudio Socio-Demográfico de la Comunidad Judìa de Chile (Santiago-Buenos Aires, 1995). 101Nicole Berenstein and Rafael Porzecanski, Perfil de los egresados de la Red Formal de Educación Judía Uruguaya (Montevideo, 2001). 102Sergio DellaPergola, Salomon Benzaquen, and Tony Beker de Weinraub, Perfil sociodemográfico y cultural de la comunidad judía de Caracas (Caracas, 2000). The survey was sponsored by the Asociación Israelita de Venezuela, the Union Israelita de Caracas, and the Asociación de Amigos de la Universidad Hebrea de Jerusalén. 103Sergio DellaPergola, "Jews in the European Community: Sociodemographic Trends and Challenges. American Jewish Year Book, 93 (New York, American Jewish Committee, 1993), 25-82; David Graham, European Jewish Identity at the Dawn of the 21st Century: A Working Paper. A report for the American Joint Distribution Committee and Hanadiv Charitable Foundation (Budapest, JPR-Institute for Jewish Policy Research, 2004); Andras Kovacs and Ildiko Barna, Identity à la carte: Research on Jewish identities, participation and affiliation in five European countries. Analysis of survey data (Budapest, The American Joint Distribution Committee, 2010); Sergio DellaPergola, "Jews in Europe: Demographic Trends, Contexts, Outlooks," in Julius Schoeps and Eliezer Ben-Rafael (eds.), European Jewry: A New Jewish Center in the Making? (Potsdam, Moses Mendelssohn Zentrum für europëisch-jüdische Studien, Boston/Leiden, Brill, 2010). 104See Erik H. Cohen with Maurice Ifergan, Les Juifs de France: Valeurs et identité, cit. 105Erik H. Cohen, Les touristes de France en Israël 2004 (Jerusalem, 2005). 106Erik H. Cohen, Heureux comme Juifs en France? Étude sociologique (Jerusalem, Elkana et Akadem, 2007). 107See Barry Kosmin and Stanley Waterman, Commentary on Census Religion Question (London, JPR-Institute for Jewish Policy Research, 2002). The Census is available at http://www.ons.uk. 108United Kingdom, Scotland, General Register Office (Edinburgh, 2002). Also see JPR/News, Spring 2003, 6. 109David Graham, Marlena Schmool and Stanley Waterman, Jews in Britain: A Snapshot from the 2001 Census (London, 2007), JPR Report No. 1; David Graham and Stanley Waterman, "Underenumeration of the Jewish Population in the UK 2001 Census," Population, Space and Place, 11, 2005, 89-102; David Voas, “Estimating the Jewish Undercount in the 2001 Census: a Comment on Graham and Waterman (2005),” Population, Space and Place, 13, 2007, 401-407; David J. Graham and Stanley Waterman, “Locating Jews by Ethnicity: A Reply to David Voas (2007),” Population, Space and Place, 13, 2007, 409-414. 110The Board of Deputies of British Jews, Community Research Unit, Report on Community Vital Statistics 2004 (London, 2005). See also Stephen Miller, Marlena Schmool, and Antony Lerman, Social and Political Attitudes of British Jews: Some Key Findings of the JPR Survey (London, 1996). 111David Graham and Daniel Vulkan, Britain’s Jewish Community Statistics (London, 2007).
72
112Rona Hart and Edward Kafka, Trends in British Synagogue Membership, 1990–2005/6 (London, The Board of Deputies of British Jews, 2006). 113David Graham and Daniel Vulkan, Synagogue Membership in the United Kingdom in 2010 (London, JPR-Institute for Jewish Policy Research and The Board of Deputies of British Jews, 2010). 114Daniel Vulkan and David Graham, Population Trends among Britain’s Strictly Orthodox (London, 2008); Graham and Vulkan, Synagogue Membership, cit. 115Yinon Cohen and Irena Kogan, "Jewish Immigration from the Former Soviet Union to Germany and Israel in the 1990s,” Leo Baeck Institute Year Book L (Berlin, 2005), 249-265; Barbara Dietz, Uwe Lebok and Pavel Polian, "The Jewish Emigration from the Former Soviet Union to Germany," International Migration, 40, 2, 2002; [Simon Erlanger], Jewish People Policy Planning Institute Annual Assessment 2006, Deltas Creating Opportunities and Threats, Executive Report 3 (Jerusalem, JPPPI, 2006). 116Zentralwohlfahrtsstelle der Juden in Deutschland (ZWJD), Mitgliederstatistik; Der Einzelnen Jüdischen Gemeinden und Landesverbände in Deutschland (Frankfurt a. M., annual). is the lower case a, and upper case M correct? 117Julius H. Schoeps, Willy Jasper, and Bernard Vogt (eds.), Ein neues Judentum in Deutschland? Fremd und Eigenbilder der russisch-jüdischen Einwanderer (Potsdam, 1999). 118András Kovács (ed.), Jews and Jewry in Contemporary Hungary: Results of a Sociological Survey, JPR Report No. 1 (London, 2004). The report reconstructs Jewish population changes between the end of World War II and 1995 based on Tamás Stark, A magyar zsidóság statisztikája: Kutatási jelentés (Budapest, 1995). The latter study, however, significantly underestimates emigration over time to countries other than Israel, as well as to Israel, outside the major migration periods. 119Simon Cohn, Résulats elections legislatives (Brussels, 2003, unpublished manuscript). 120Hanna van Solinge and Marlene de Vries (eds.), De Joden in Nederland Anno 2000: Demografisch profiel en binding aan het joodendom (Amsterdam, 2001). The survey was a collaborative effort between the Stichting Joods Maatschappelijk Werk and NIDI (Netherlands Interdisciplinary Demographic Institute). See also Chris Kooyman and J. Almagor, Israelis in Holland: A Sociodemographic Study of Israelis and Former Israelis in Holland (Amsterdam, 1996). 121Unione delle Comunità Ebraiche Italiane, IV Congresso, Relazione del consiglio (Roma, 2002); Yaakov Andrea Lattes, Sull’assimilazione in Italia e i metodi per affrontarla (Ramat Gan, 2005); Unione delle Comunità Ebraiche Italiane, Indagine demografica – Numero degli iscritti delle comunità (Roma, 2010). 122Lasse Dencik, 'Jewishness’ in Postmodernity: the Case of Sweden, Paideia Report (Stockholm, The European Institute for Jewish Studies, 2003) 123Oren Cytto, Jewish Identification in Contemporary Spain – A European Case Study (Jerusalem, European Forum at The Hebrew University, Helmut Kohl Institute for European Studies in collaboration with Konrad Adenauer Stiftung, 2007). 124Statistik Austria, Volkszählung 2001: Wohnbevölkerung nach Religion und Staatsangehörigkeit für Bundesländer (Wien, 2003). 125Mark Tolts, "Contemporary Trends in Family Formation among the Jews in Russia," Jews in Russia and Eastern Europe, 2006, 2 (57), 5-23; Mark Tolts, “Post-Soviet Jewish Demography, 1989-2004,” in Zvi Gitelman and Yaacov Ro’i (eds.), Revolution, Repression, and Revival: The Soviet Jewish Experience (Lanham, MD, Rowman & Littlefield, 2007), 283-311.
73
126Zvi Gitelman, “Becoming Jewish in Russia and Ukraine,” in Zvi Gitelman, Barry Kosmin, and András Kovács (eds.), New Jewish Identities: Contemporary Europe and Beyond (Budapest/New York, 2003), 105-137. 127Mark Tolts, “Post-Soviet Jewish Demography," cit. For a German translation see Menora: Jahrbuch für deutsch-jüdische Geshichte 2004, 15 (Berlin/Wien, 2005), 15-44; Mark Tolts, “The Post-Soviet Jewish Population in Russia and the World,” Jews in Russia and Eastern Europe, 1 (52), 2004, 37-63. 128Dr. Mark Tolts, The Hebrew University of Jerusalem, personal communication. See also: Mark Tolts, "Demography of the Contemporary Russian-Speaking Jewish Diaspora", Paper presented at the Conference on the Contemporary Russian-speaking Jewish Diaspora (Cambridge, Mass., Harvard University, November 13–15, 2011). 129Mark Tolts, “Mass Aliyah and Jewish Emigration from Russia: Dynamics and Factors,” East European Jewish Affairs 33, 2003, 71-96. 130Mark Tolts, “Post-Soviet Jewish Demography," cit.; Mark Tolts, “Demographic Trends among the Jews in the Three Post-Soviet Slavic Republics.” Paper presented at the 14th World Congress of Jewish Studies (Jerusalem, 2005). 131Ukrainian Ministry of Statistics, Population Census 2001 (Kiev, 2002); Mark Tolts, Main Demographic Trends of the Jews in Russia and the FSU (Jerusalem, 2002). 132See http://belstat.gov.by/homep/ru/perepic/2009/vihod_tables/5.8-0.pdf. 133See also Sidney Goldstein and Alice Goldstein, Lithuanian Jewry 1993: A Demographic and Sociocultural Profile (Jerusalem, The Hebrew University, The Institute of Contemporary Jewry, 1997). 134Malka Korazim and Esther Katz, “Patterns of Jewish Identity in Moldova: The Behavioral Dimension,” in Gitelman, Kosmin, and Kovács (eds.), New Jewish Identities, cit, 159-170. 135Bundesamt für Statistik, Wohnbevölkerung nach Religion 2000 (Neuchatel, 2005). 136Data provided through the courtesy of the Istanbul Jewish Community Council. See also Shaul Tuval, The Jewish Community of Istanbul, 1948-1992: A Study in Cultural, Economic and Social Processes (Jerusalem, The Hebrew University, unpublished Ph. D. dissertation, 1999). 137Roberto Bachi, The Population of Israel (Paris, CICRED, and Jerusalem, The Hebrew University, and Demographic Center, Prime Minister's Office, 1977). 138See http://www.cbs.gov.il. 139Israel Central Bureau of Statistics, Statistical Abstract of Israel, cit. See also http://www.cbs.gov.il. 140Sergio DellaPergola, “Fertility Prospects in Israel: Ever Below Replacement Level?” United Nations Expert Group Meeting on Recent and Future Trends in Fertility (New York, United Nations Secretariat, Department of Economic and Social Affairs, Population Division, December 2009). 141Immigrant citizens are the foreign-born children of Israelis on their first-time entrance into the country. Not included are foreign workers and illegal residents. See Israel Central Bureau of Statistics, Statistical Abstract of Israel, cit. 142In this respect see the recent exchange: Ian S. Lustick, "Israel’s Migration Balance: Demography, Politics, and Ideology", Israel Studies Review – An Interdisciplinary Journal, 26, 1, 2011, 33-65; Sergio DellaPergola, "When Scholarship Disturbs Narrative: Ian Lustick on Israel's Migration Balance", Israel Studies Review – An Interdisciplinary Journal, 26, 2, 2011, 1-20.
74
143Personal communication by Rabbi David Bass, Head of Tribunal, Israel Special Rabbinical Conversion Courts. 144For an extensive discussion of the background, thrust, and implications of past and current population changes, see Sergio DellaPergola, “Demographic Trends in Israel and Palestine: Prospects and Policy Implications” American Jewish Year Book, 103 (New York, American Jewish Committee, 2003), 3-68; Sergio DellaPergola, "Population Trends and Scenarios in Israel and Palestine," in Arie M. Kacowicz and Pavel Lutomski (eds.) Population Resettlement in International Conflicts: A Comparative Study (Lanham, MD, Rowman & Littlefield, 2007), 183-207. See also Arnon Sofer and Yevguenia Bistrow, Israel Demography 2004-2020 in the Light of Disengagement (Haifa, 2004, in Hebrew). 145See www.pcbs.org. 146See Bennett Zimmerman, Roberta Seid, Michael Wise, Yoram Ettinger, David Shahaf, Ezra Sohar, David Passig, and Avraham Shvout, Arab Population In the West Bank and Gaza: The Million and a Half Person Gap (Washington, 2005); Bennett Zimmerman, Roberta Seid, and Michael L. Wise, The Million Person Gap: The Arab Population in the West Bank and Gaza (Ramat Gan, The Begin-Sadat Center for Strategic Studies, 2005) Mideast Security and Policy Studies No. 65. For a rebuttal, see Sergio DellaPergola in Azure, 27, 2007, 3-33. 147Israel Central Bureau of Statistics, Statistical Abstract of Israel, cit. 148Israel Central Bureau of Statistics, Statistical Abstract of Israel, cit.; Maya Choshen, Eitan Bluer, Yair Assaf-Shapira, Inbal Doron (eds.), Statistical Yearbook of Jerusalem 2009/2010, 24 (Jerusalem, Jerusalem Municipality and the Jerusalem Institute for Israel Studies, 2010). See also: Sergio DellaPergola, "Demography, Planning and Policy, 2000-2020," in Ora Achimeir and Yaacov BarSimantov (eds.), 40 Years in Jerusalem (Jerusalem, Jerusalem Institute of Israel Studies, 2008, in Hebrew), 39-59. 149The figure of 4.0 million suggested by the Population Reference Bureau, World Population Data Sheet, 2010 (Washington, DC, 2010) for mid-2010 is quite on target. 150Mark Tolts, “Demographic Trends,” cit. 151See David Saks, “Community Stable, Ageing – Census,” South African Jewish Report (Johannesburg, 2003). See also Barry A. Kosmin, Jacqueline Goldberg, Milton Shain, and Shirley Bruk, Jews of the New South Africa: Highlights of the 1998 National Survey of South African Jews (London, 1999); Shirley Bruk, The Jews of South Africa 2005 – Report on a Research Study (Cape Town, 2006). 152Australian Bureau of Statistics, Population Census 2006 (Canberra, 2007); Australian Bureau of Statistics, Population Census 2001 (Canberra, 2002). See also Gary Eckstein, Demography of the Sydney Jewish Community 2001 (Sydney, 2003). 153Australian Bureau of Statistics, Population Census 2011 (Canberra, 2012). 154Gary Eckstein, “Intermarriage among Jewish Australians,” in Shulamit Reinharz and Sergio DellaPergola, Jewish Intermarriage around the World, cit, 139-152. 155Statistics New Zealand, 2006 Census of Population and Dwelling (Auckland, 2007).

Mandell L. Berman Institute –North American Jewish Data Bank
A Collaborative Project of the Jewish Federations of North America
and the
Center for Judaic Studies and Contemporary Jewish Life
and the
Roper Center for Public Opinion Research
both at the
University of Connecticut
Publication funded in part by a grant from The Mandell L. and Madeleine H. Berman Foundation in support of the Berman Institute – North American Jewish Data Bank.
Data Bank Staff:
Arnold Dashefsky, Director
Ron Miller, Associate Director
Cory Lebson, Associate Director for
Information Technology
Lorri Lafontaine, Program Assistant
Graphic Designer:
Carla Willey
Fact Checker:
Sarah Markowitz
Mandell L. Berman Institute
North American Jewish Data Bank
Center for Judaic Studies and
Contemporary Jewish Life
University of Connecticut
405 Babbidge Rd Unit 1205
Storrs, CT 06269-1205
Web: www.jewishdatabank.org
Email: [email protected]
copyright 2013