population geography. 1800=almost 1 billion 1900=2 billion 1965=3.3 billion 2000=6 billion 2011=7...
TRANSCRIPT
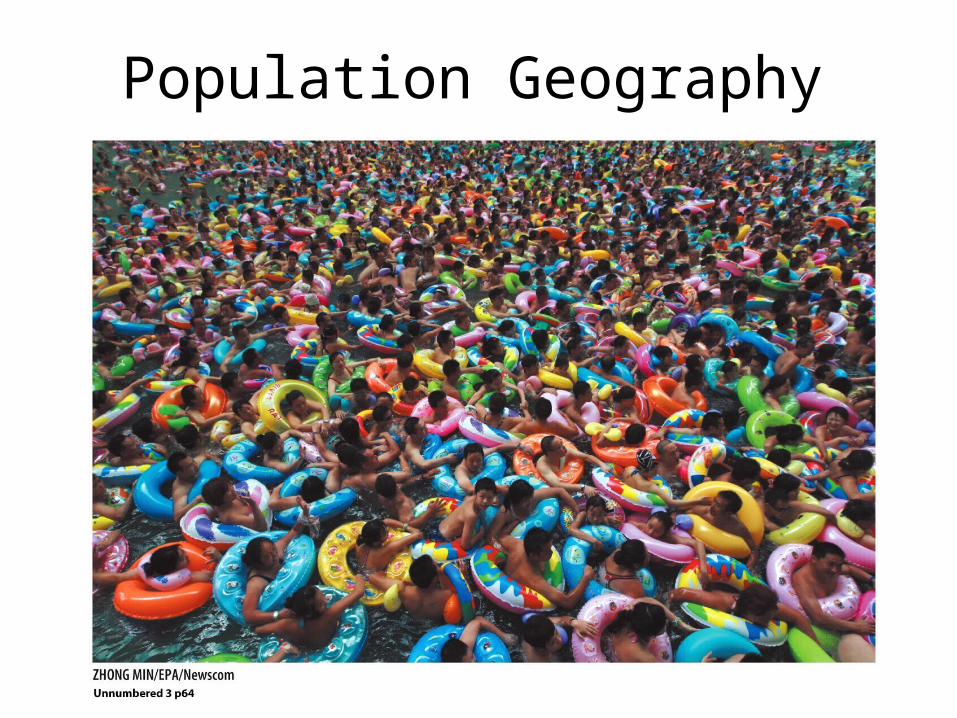
Population Geography
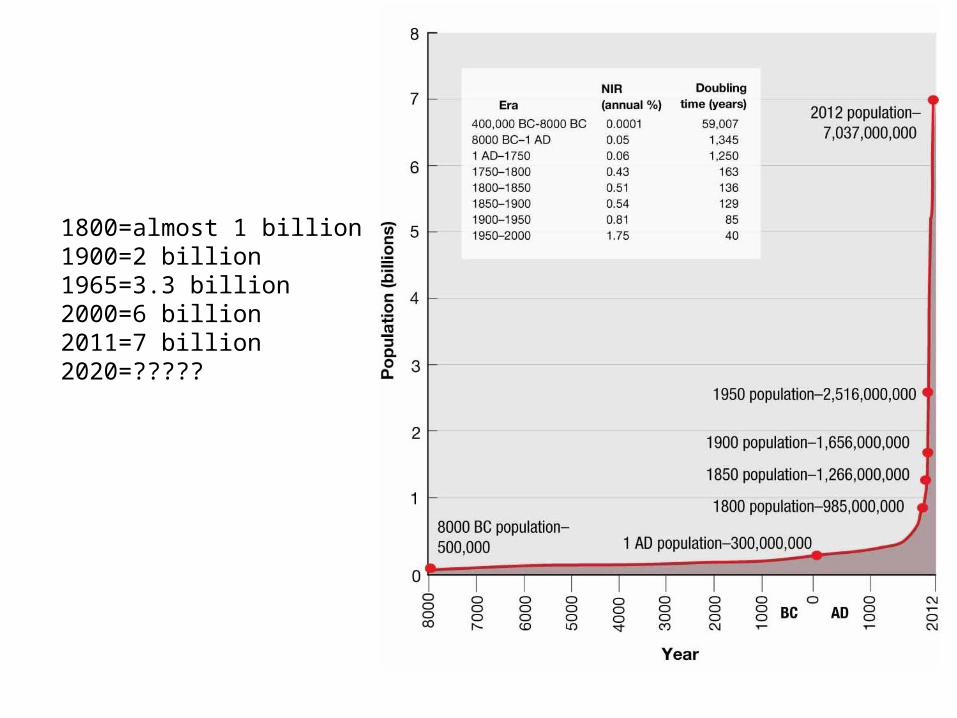
1800=almost 1 billion1900=2 billion1965=3.3 billion2000=6 billion2011=7 billion2020=?????
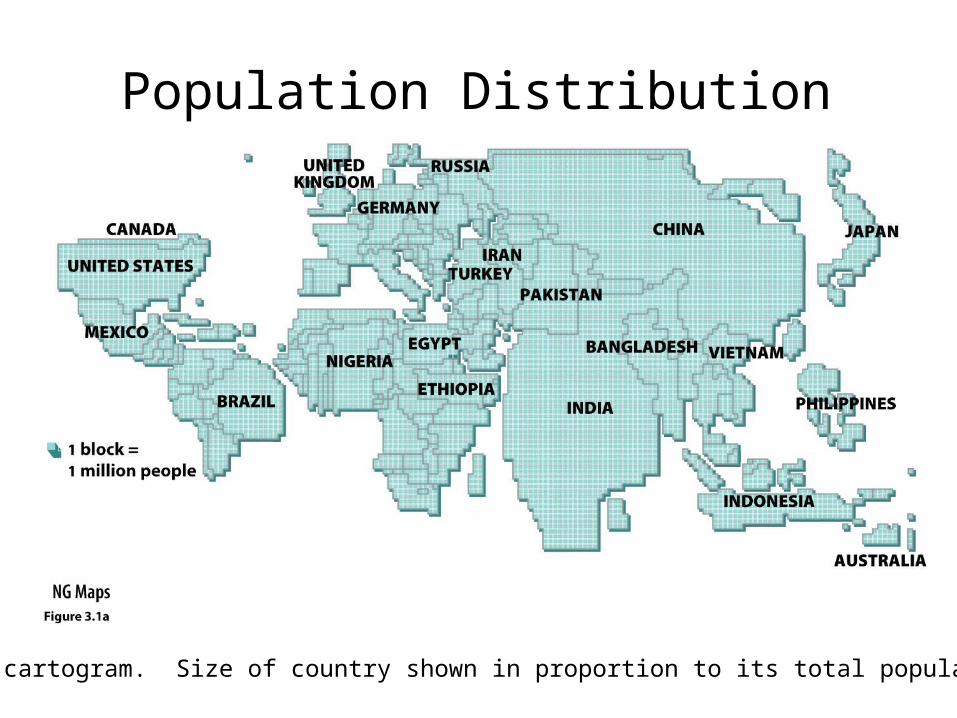
Population Distribution
Population cartogram. Size of country shown in proportion to its total population.
Copyright © 2014 John Wiley & Sons, Inc. All rights reserved.
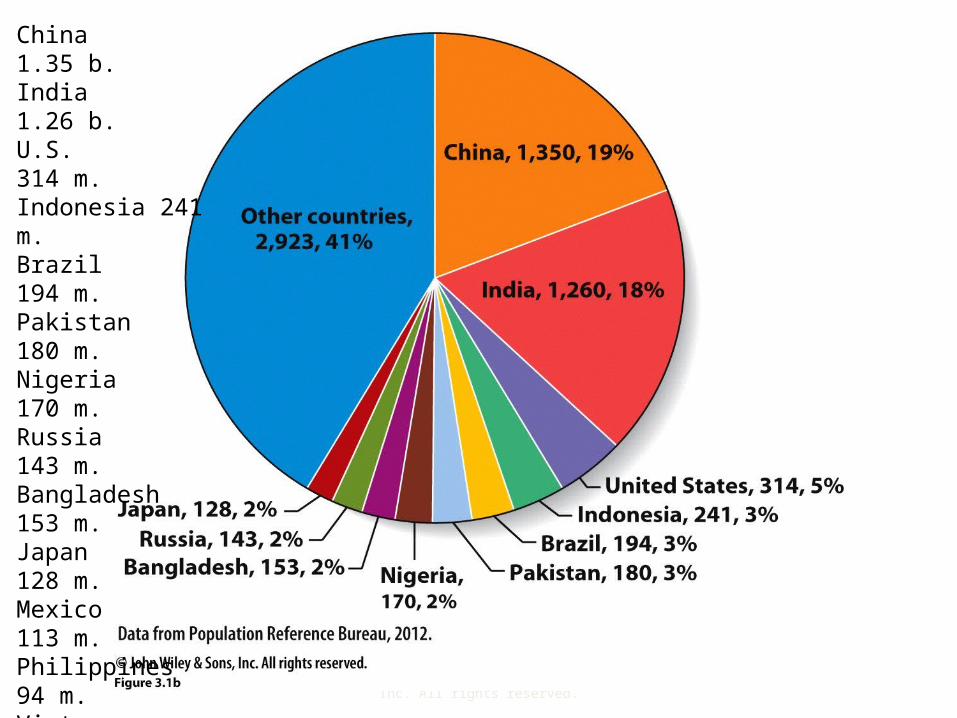
China 1.35 b.India 1.26 b.U.S. 314 m.Indonesia 241 m.Brazil 194 m.Pakistan 180 m.Nigeria 170 m.Russia 143 m.Bangladesh 153 m.Japan 128 m.Mexico 113 m.Philippines 94 m.Vietnam 88 m.
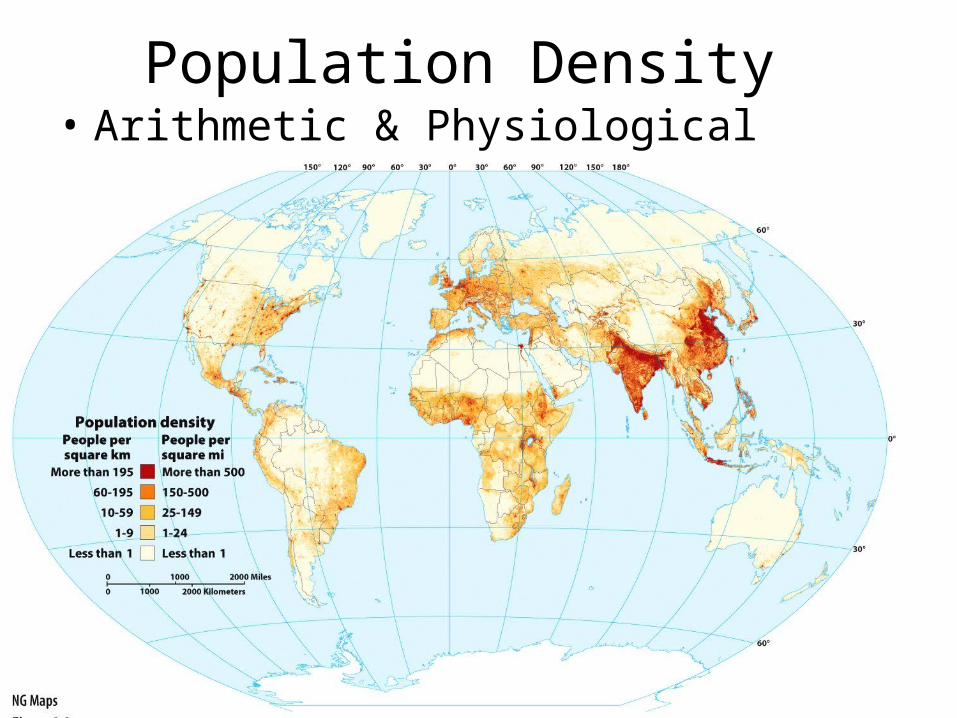
Population Density• Arithmetic & Physiological
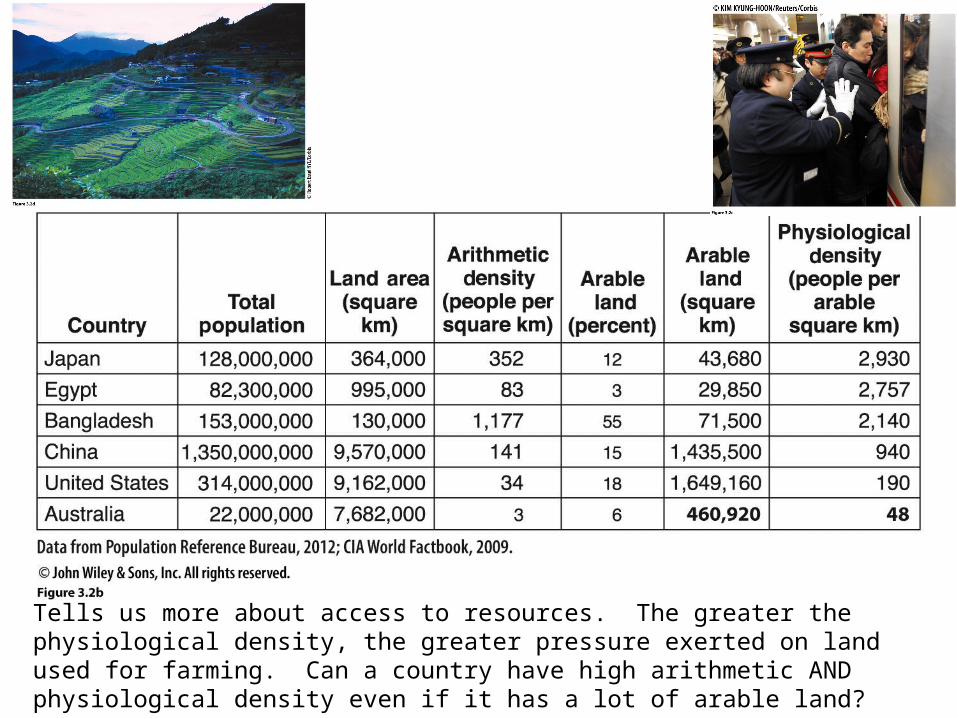
Tells us more about access to resources. The greater the physiological density, the greater pressure exerted on land used for farming. Can a country have high arithmetic AND physiological density even if it has a lot of arable land?
Fertility
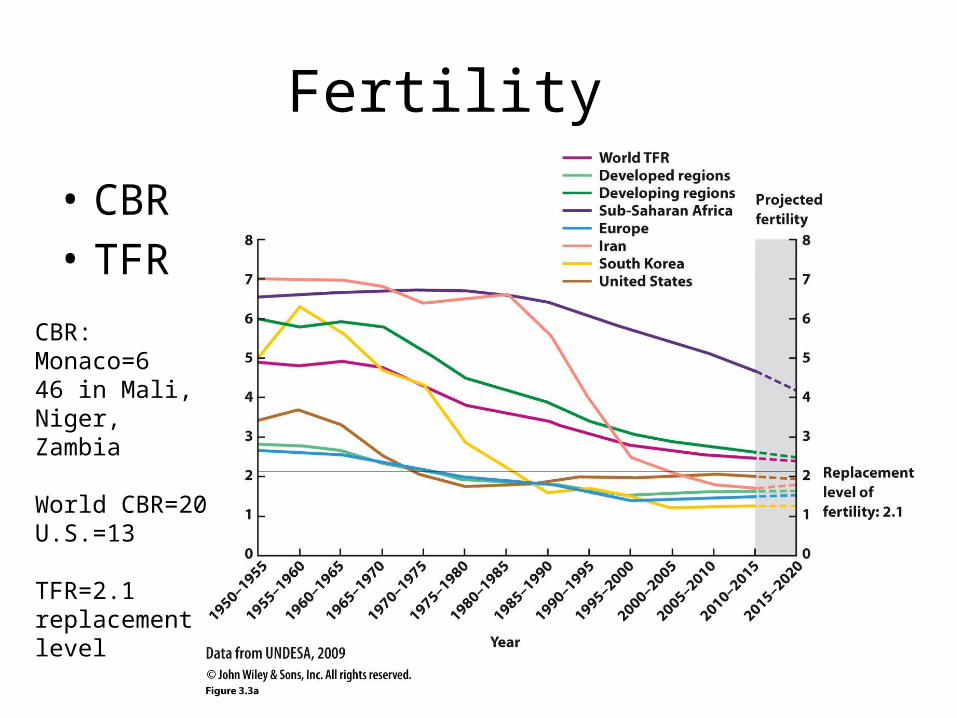
• CBR• TFR
CBR: Monaco=646 in Mali, Niger, Zambia
World CBR=20U.S.=13
TFR=2.1 replacement level
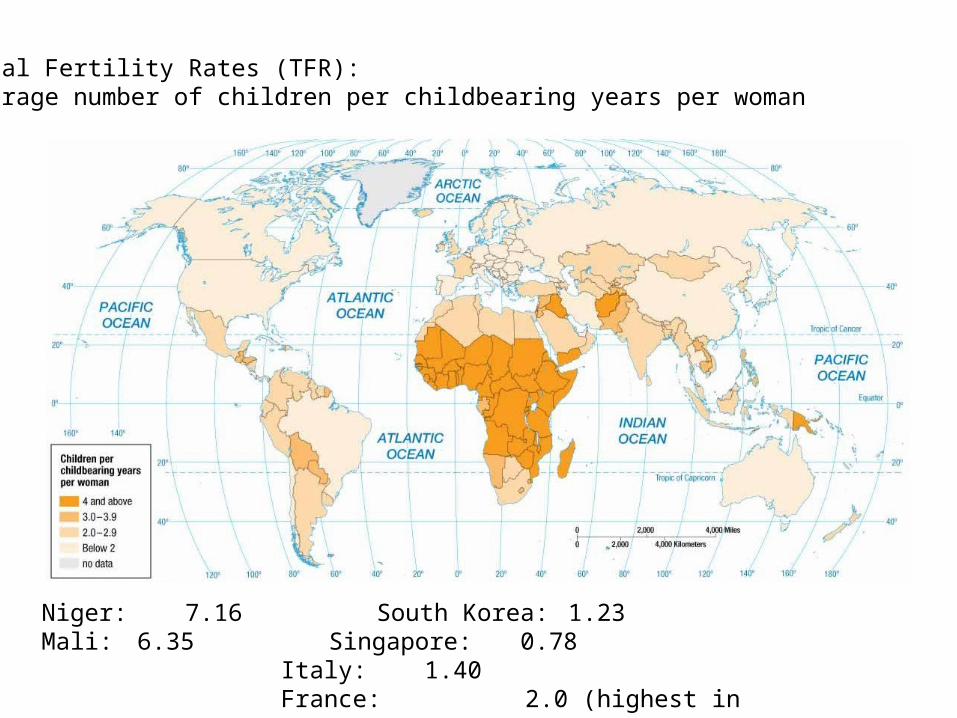
Total Fertility Rates (TFR): average number of children per childbearing years per woman
Niger: 7.16 South Korea: 1.23Mali: 6.35 Singapore: 0.78
Italy: 1.40France: 2.0 (highest
in Europe!)
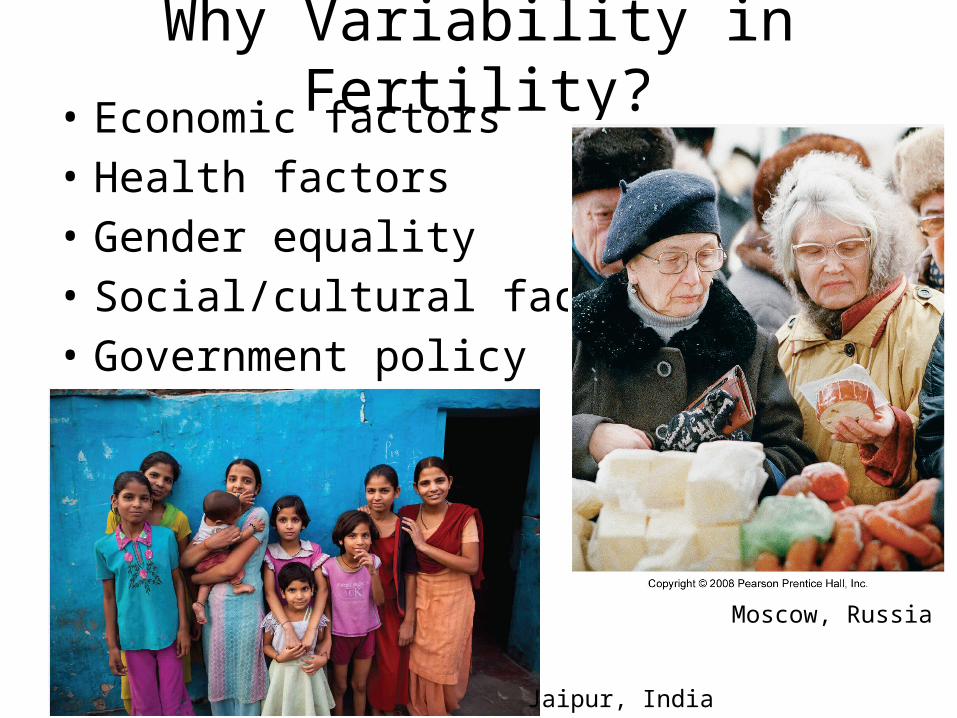
Why Variability in Fertility?• Economic factors• Health factors• Gender equality• Social/cultural factors• Government policy
Jaipur, India
Moscow, Russia
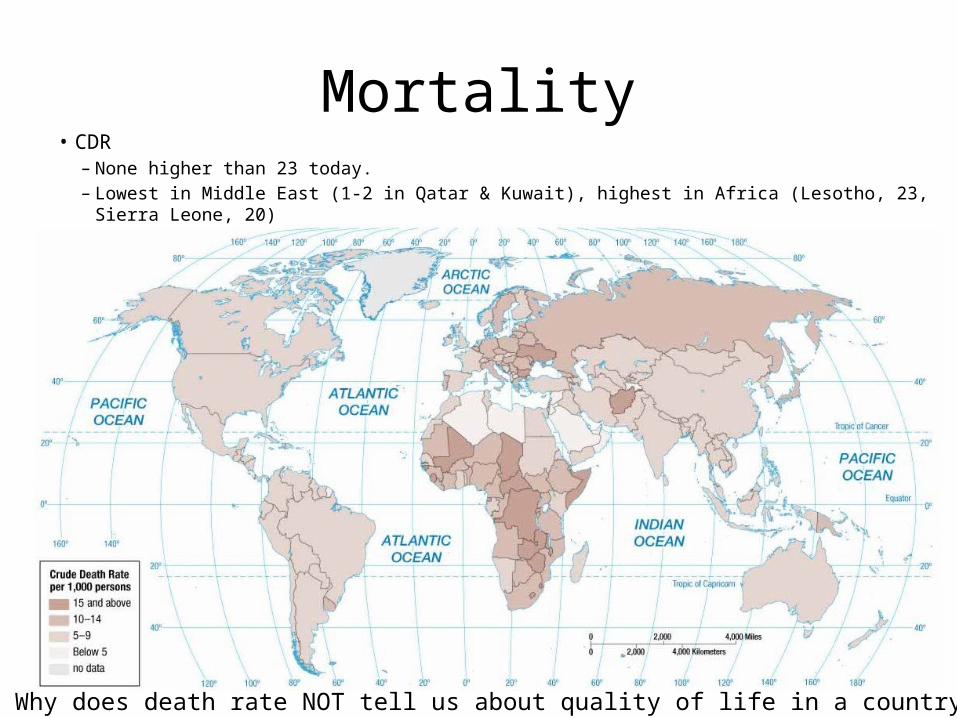
Mortality• CDR
– None higher than 23 today.– Lowest in Middle East (1-2 in Qatar & Kuwait), highest in Africa (Lesotho, 23, Sierra Leone, 20)
Why does death rate NOT tell us about quality of life in a country?
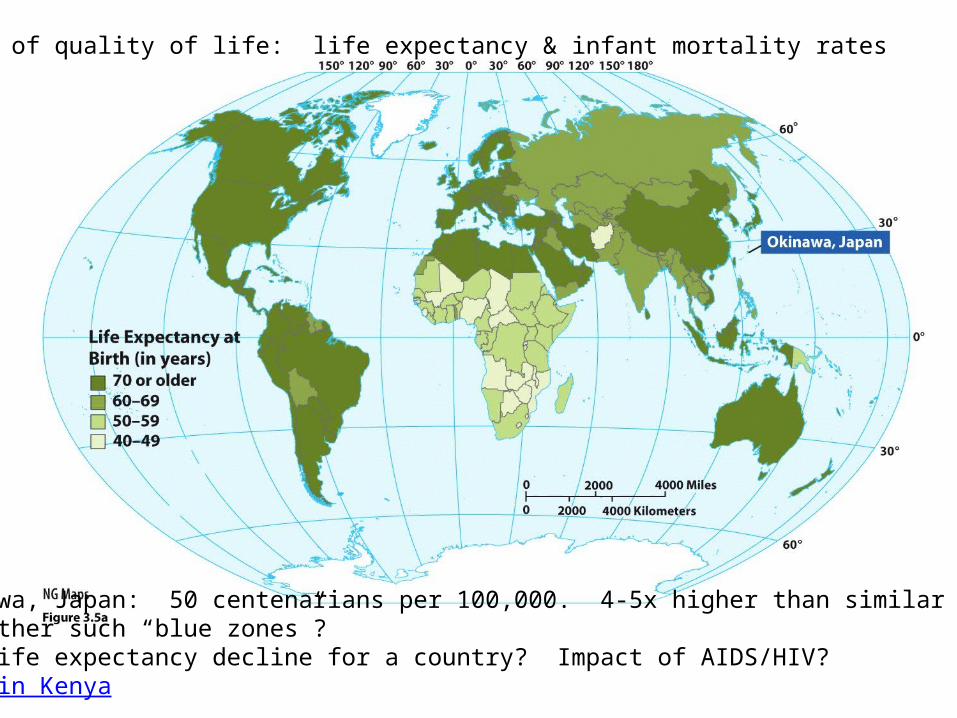
Indicators of quality of life: life expectancy & infant mortality rates
Okinawa, Japan: 50 centenarians per 100,000. 4-5x higher than similar countries.Any other such “blue zones”?Can life expectancy decline for a country? Impact of AIDS/HIV?AIDS in Kenya
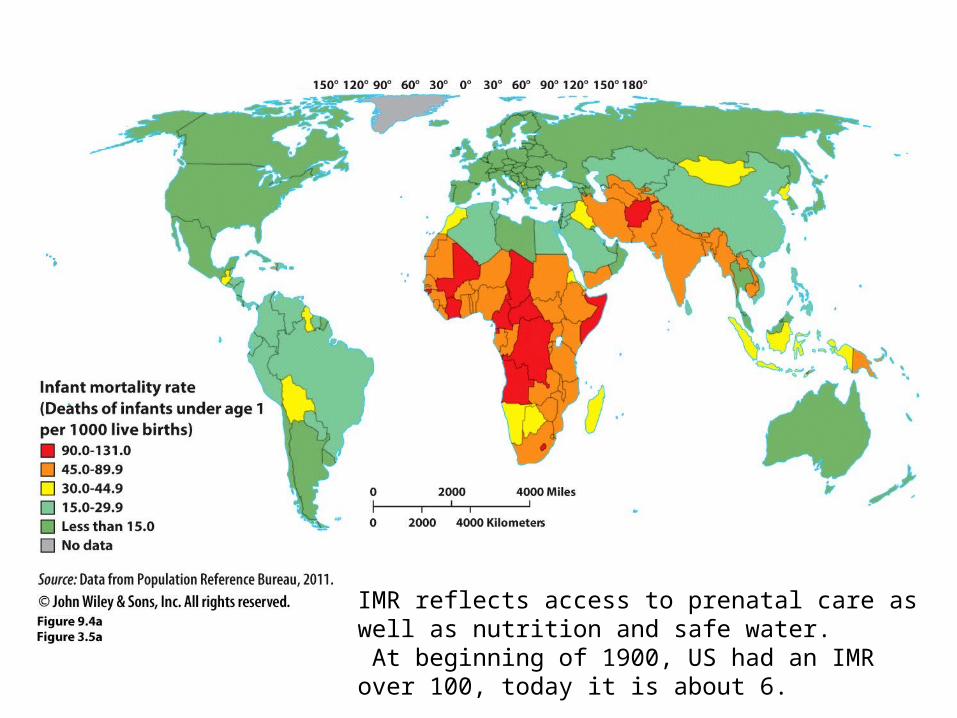
IMR reflects access to prenatal care as well as nutrition and safe water. At beginning of 1900, US had an IMR over 100, today it is about 6.
Population Structure & Change
• Population pyramids: age and sex cohorts• Age dependency ratios
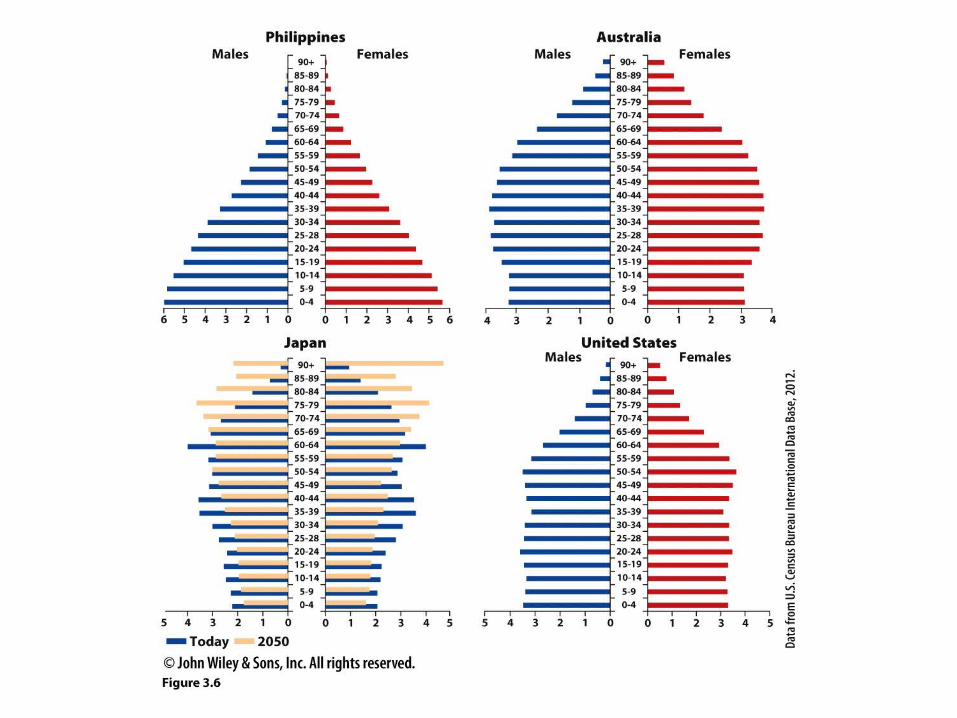
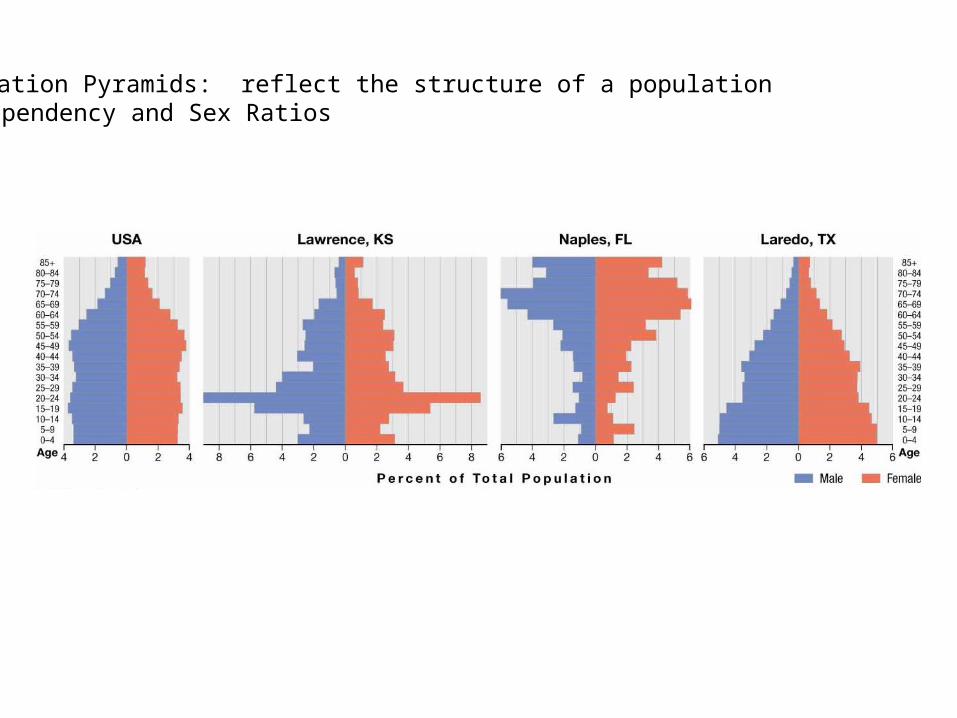
Population Pyramids: reflect the structure of a populationDependency and Sex Ratios
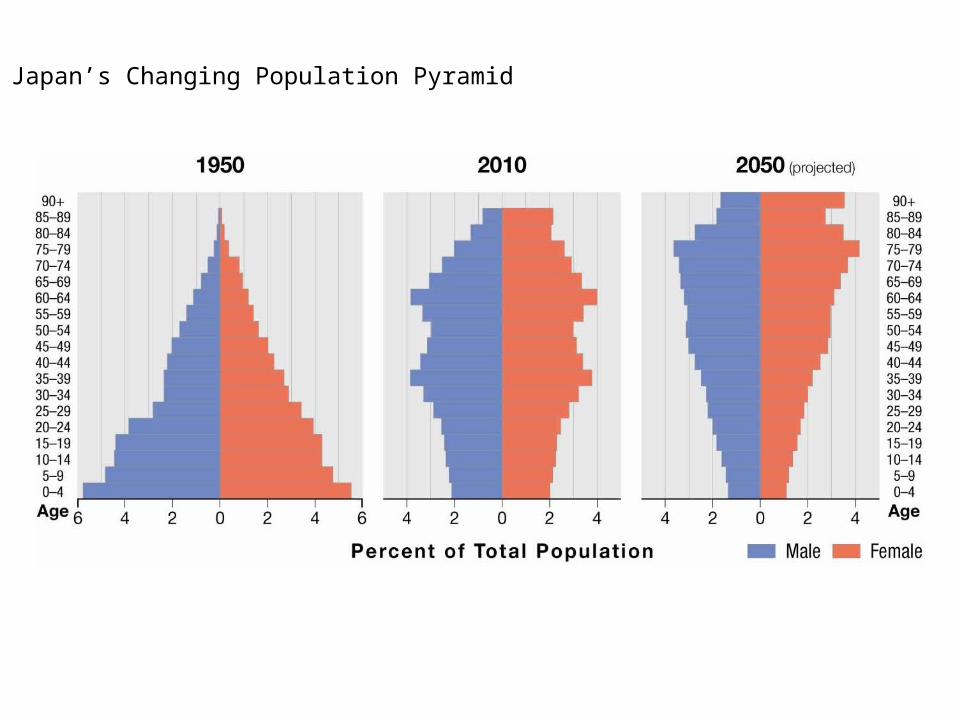
Japan’s Changing Population Pyramid
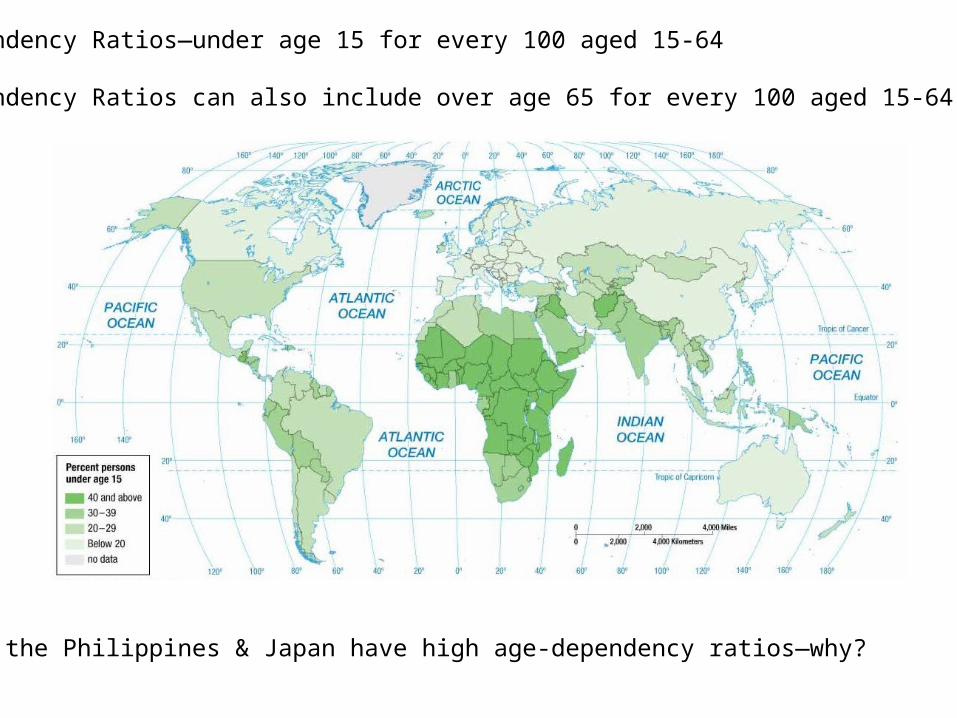
Dependency Ratios—under age 15 for every 100 aged 15-64
Dependency Ratios can also include over age 65 for every 100 aged 15-64.
Both the Philippines & Japan have high age-dependency ratios—why?
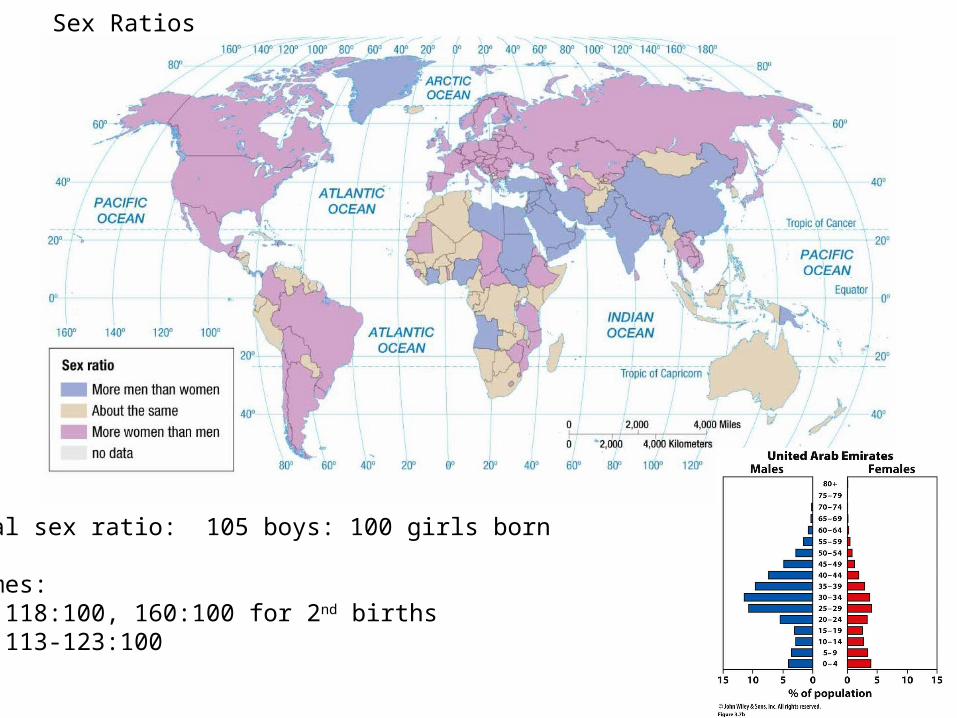
Sex Ratios
Natural sex ratio: 105 boys: 100 girls born
Extremes:China 118:100, 160:100 for 2nd birthsIndia 113-123:100
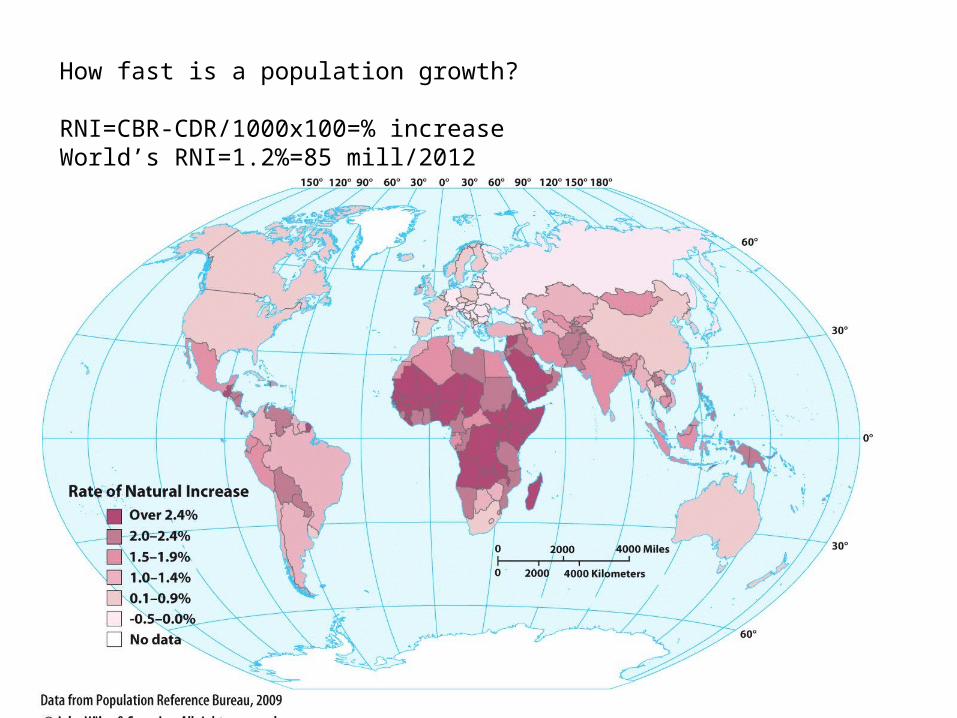
How fast is a population growth? RNI=CBR-CDR/1000x100=% increase World’s RNI=1.2%=85 mill/2012
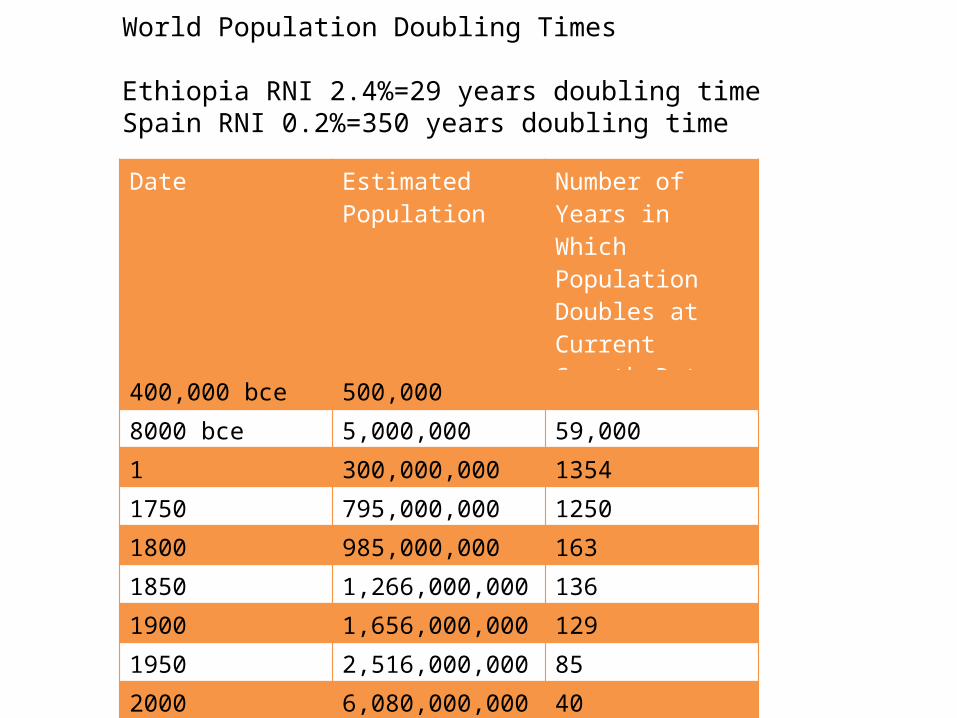
World Population Doubling Times
Ethiopia RNI 2.4%=29 years doubling timeSpain RNI 0.2%=350 years doubling time
Date Estimated Population
Number of Years in Which Population Doubles at Current Growth Rate
400,000 bce 500,000
8000 bce 5,000,000 59,000
1 300,000,000 1354
1750 795,000,000 1250
1800 985,000,000 163
1850 1,266,000,000 136
1900 1,656,000,000 129
1950 2,516,000,000 85
2000 6,080,000,000 40
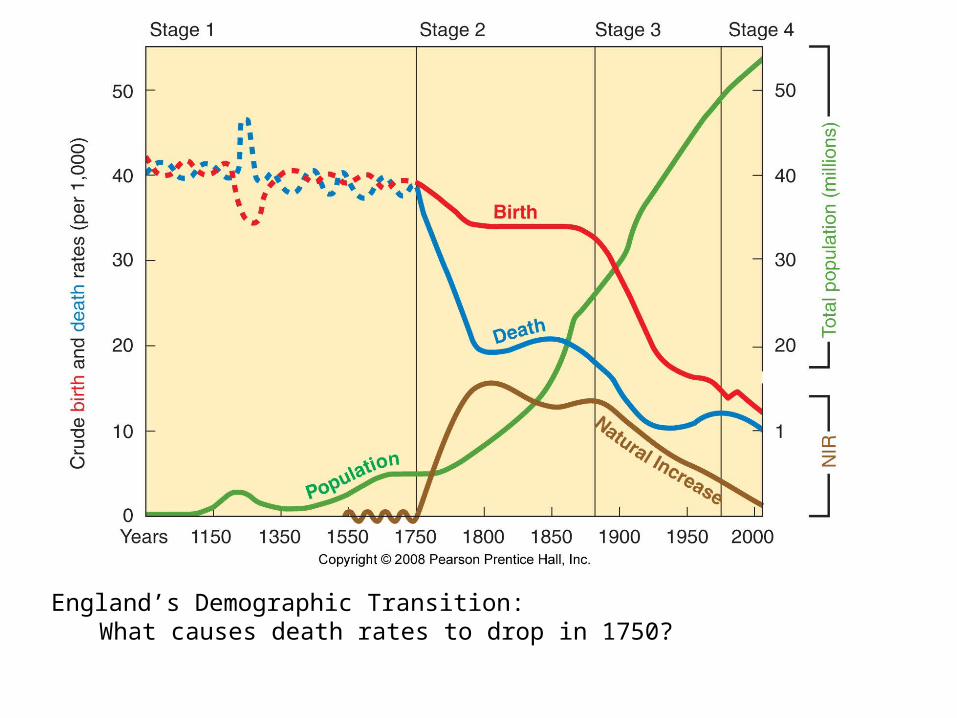
England’s Demographic Transition:What causes death rates to drop in 1750?
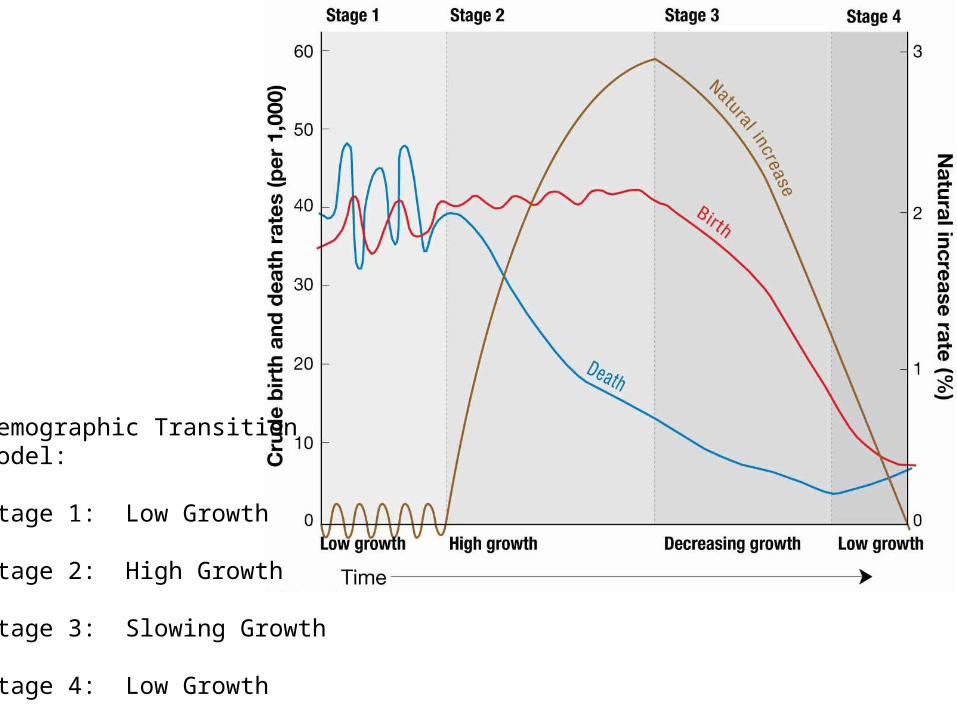
Demographic Transition Model:
Stage 1: Low Growth
Stage 2: High Growth
Stage 3: Slowing Growth
Stage 4: Low Growth
Copyright © 2014 John Wiley & Sons, Inc. All rights reserved.
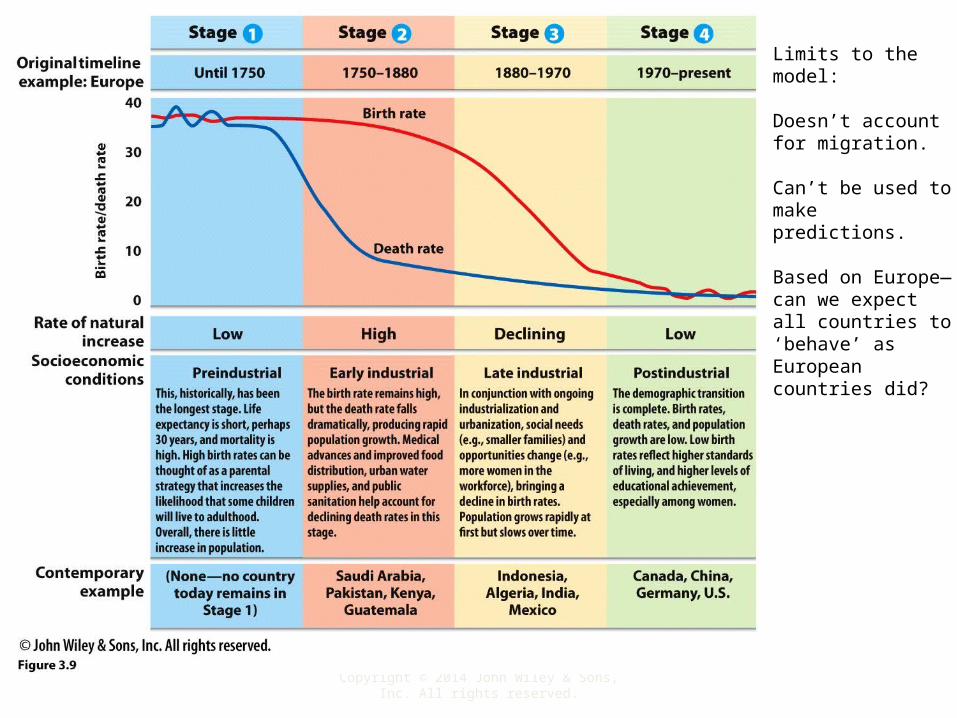
Limits to the model:
Doesn’t account for migration.
Can’t be used to make predictions.
Based on Europe—can we expect all countries to ‘behave’ as European countries did?
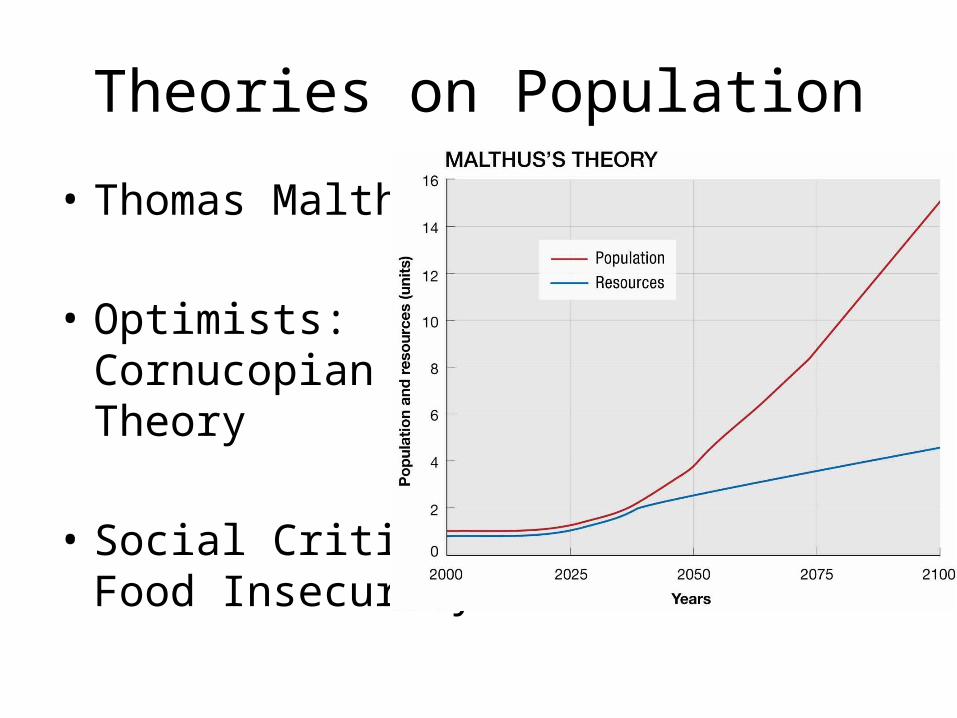
Theories on Population
• Thomas Malthus
• Optimists: Cornucopian Theory
• Social Critics: Food Insecurity
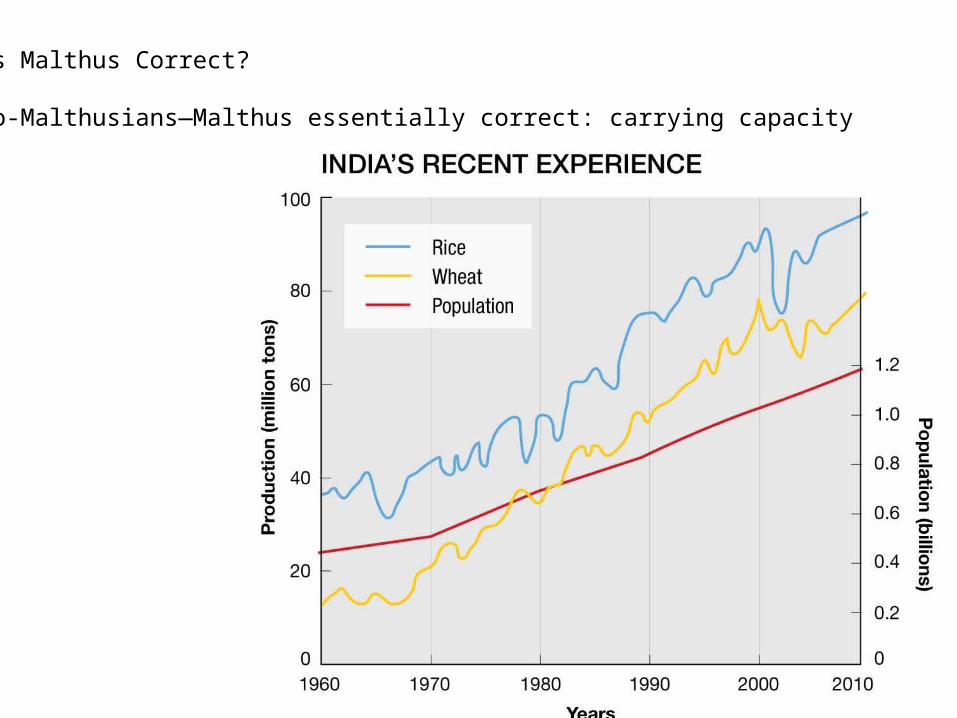
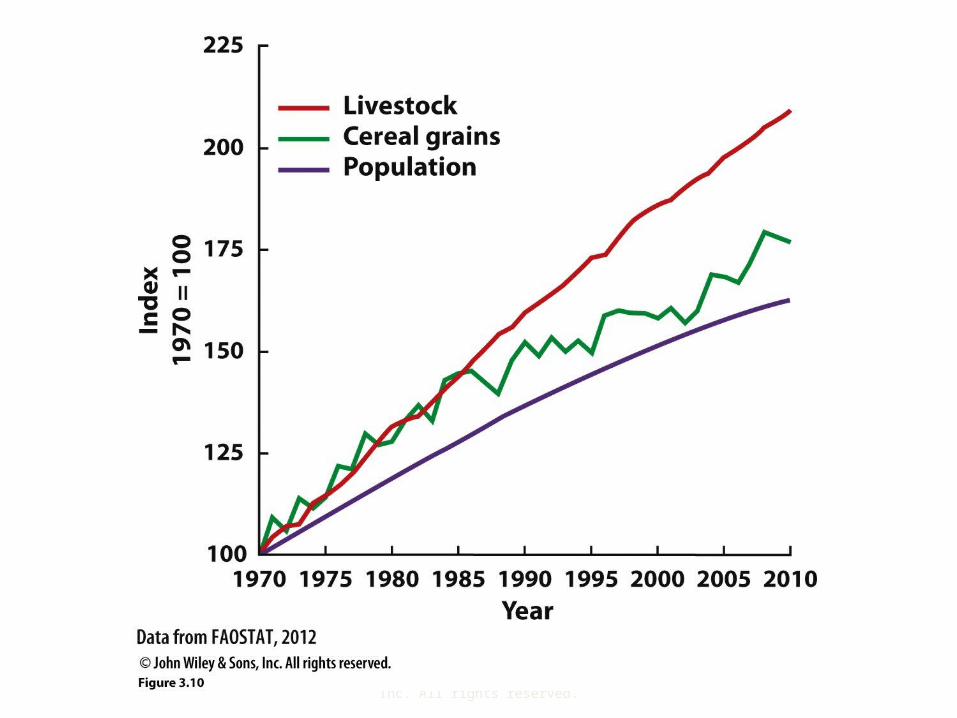
Was Malthus Correct?
Neo-Malthusians—Malthus essentially correct: carrying capacity
Copyright © 2014 John Wiley & Sons, Inc. All rights reserved.
Case Studies
• China’s One Child Policy• Kerala, India’s Social Justice• Romania’s Pro-Natalist Policy

Copyright © 2014 John Wiley & Sons, Inc. All rights reserved.
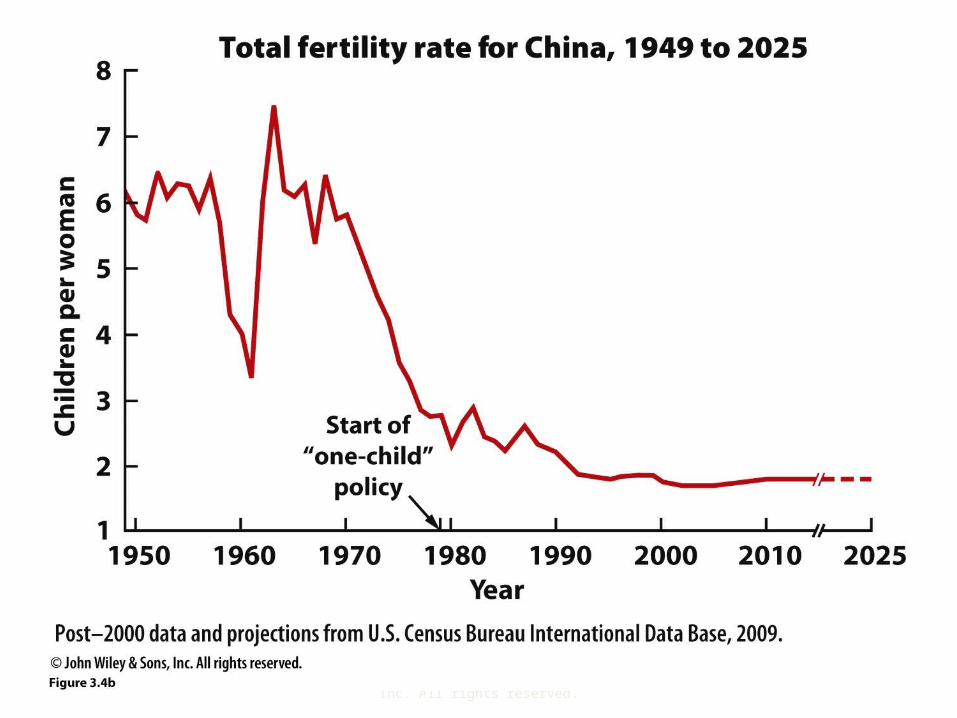
China’s Later, Longer, Fewer Campaign

Copyright © 2014 John Wiley & Sons, Inc. All rights reserved.
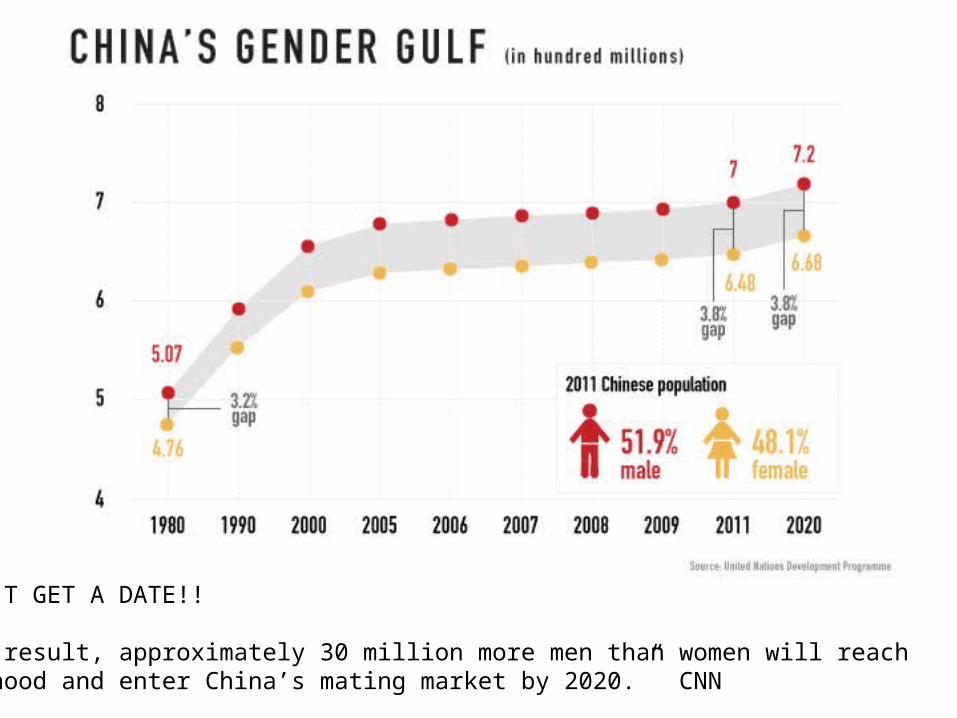
I CAN’T GET A DATE!!
“As a result, approximately 30 million more men than women will reach Adulthood and enter China’s mating market by 2020.” CNN
http://www.cnn.com/2012/11/14/opinion/china-challenges-one-child-brooks
Fareed Zakaria on China’s “Looming Demographic Catastrophe”
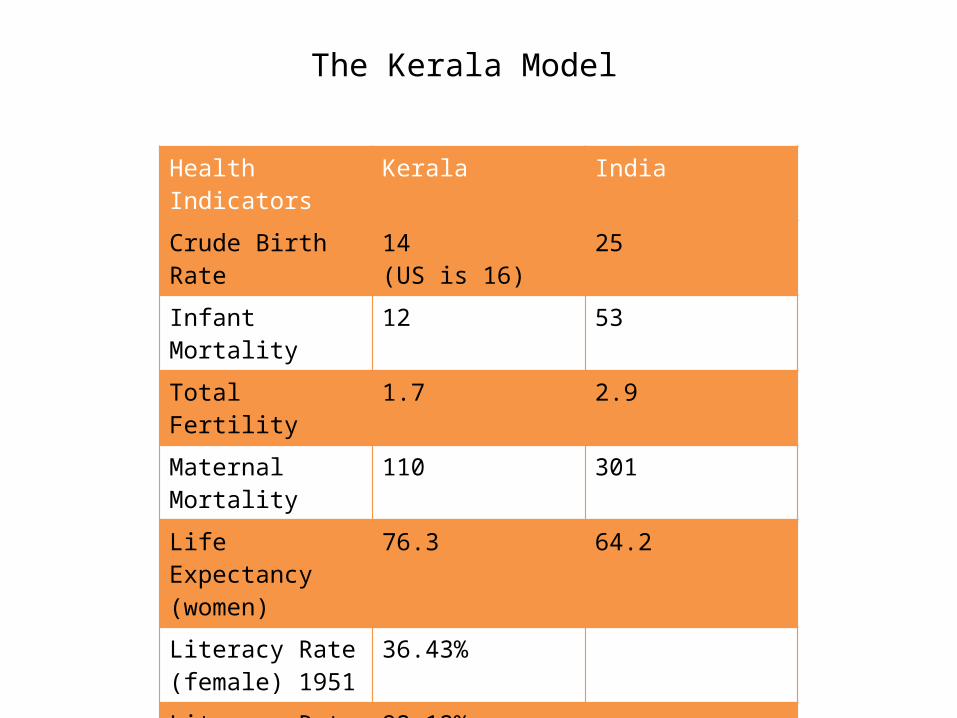
Health Indicators Kerala India
Crude Birth Rate 14 (US is 16)
25
Infant Mortality 12 53
Total Fertility 1.7 2.9
Maternal Mortality 110 301
Life Expectancy (women)
76.3 64.2
Literacy Rate (female) 1951
36.43%
Literacy Rate (female) 2011
92.12%
The Kerala Model