world energy perspective
TRANSCRIPT
3 4 4 5 6 0004b3Y 0 I

-. I nis repoit +!as prepzred 2s an i r cou i i t of work spur-lsored by an agency of the !lnli-o!StatpsGoverii~.ont. Nei!he: ifleil nited StatesGcvc:::rxm? norany ? p n q ti-ieroct. nor any of t i ia i i loyrcs. Takes eny Ia,aii-ai-iiy, express or implied, or assumss any legzl liabili r respoi-isibility for the scruiacy, coinpln:?ness, or usefui::ass of any infoi illation, EOpaiatriS, product, or proc
ts that iis ~ s m x x i l d fiot infrinco privately s.vned rights e C l f i C COrni1iO:l;ial product. piGCCSS or service by tiade ncmc, tradsmark,
manufacturer, or othcr~*~is-. dces not nscsesarily COnStiilrie or iii-iply its endorseine:?:, recommendation. or favol iing by the lJiiiied S!atesSovernment or
of. The VIP~*S and opinions of au'rho,s exprcssec! herein do not nscsssaiiiy siate or reflect !hose ne the United S ia tesGova ix - t x i a i any agency therm!.
-. . . . . . . . . . . . . . . . . . . . . . . . . . . . . . . . . ., . . . . . ., . . . . .

ORNL /TM-9 944
C h e m i c a l Technology D i v i s i o n
WORLD ENERGY PERSPECTIVE
W. R. Gambill
D a t e P u b l i s h e d - F e b r u a r y 1986
P r e p a r e d by the OAK RIDGE NATIONAL LABORATORY Oak R i d g e , Tennessee 37831
operated by MARTIN MARIETTA ENERGY SYSTEMS, IN@.
fo r the U . S . DEPARTMENT OF ENERGY
under Contract No. DE-AC-05-84OR31400
3 4 4 5 b 000’1634 0


TABU OF CONTENTS
LIST OF TABLES AND FIGURES . . e . V
FOREWORD . . . Vii
ABSTRACT . . - e . . ix
1. S C O P E . 0 . . . . . . . 1
2 . PROJECTION METHODOLOGY . . . . . . . . . . . . . . . . . . . 1
3 . OVERALL CAL PROJECTIONS . . . . . . . . . . . . . e . . . . . 4
3 .1 Summary of Global CAL Projections . . . . . . . . . . . 6 3 . 2 Supportive Studies . . . . . . . . . . . . . . . . . . . 6 3.3 Summary of P r e c e d i n g Global P r o j e c t i o n s . . . . . . . . 10
4. THE FLUID FUELS SECTOR . 10
4.1 Oil . . . . . . . . . . . . . . . . . . . . . . . . . . 10 4.2 Natural Gas . . . . . . . . . . . . . . . . . . . . . 14 4 . 3 M e t h a n o l . . . . . . . . . . . . . . . . . . . . . . . . 16
5. THE OUTLOOK FOR TWE DEVELOPING NATIONS . . 16
6 . ECONOMIC IMPLICATIONS . . 19
7 . SUMMATION . . 22
LITERATURECITED . 0 . 25
iii


LIST OF TABLES AND FIGURES
TABLES
Table 1. Projections of Regional Energy Growth Rates . . . . . . . 11 Table 2. Unit Primary Energy Consumption Rates . . . . . . . . . . 23
FIGURES
Figure 1. Deviation of U.S. historical energy consumption data from a logistic approximation . . . . . . . . . . . . . . 3
Figure 2. World and U.S. growth curves for total energy consumption . . . . . . . . . . . . . . . . . . . . . . . 5
Figure 3. World and U.S. growth curves for electriclty generation . 6
Figure 4. Historical trend in the U.S. ratio of G N P f E t . . . . . . 21
V


This perspective was prepared in 1983 for the Program Planning and
Analysis Office of ORNL. The initial draft: report wax3 completed i n
November 1983 and subsequently updated in May 1984. The only changes
since that time have been minor ones of an editorial nature and a few
statistical additions through December 1984. To preserve the content of
the original version, and because the author thinks that subsequent
events have changed none of the primary conclusions, no additional
changes have been raade to the manuscript.
v i i


P r o j e c t i o n s of global t o t a l energy and electrical energy consump-
t i o n rates based on Stewar t ' s mode1 of cycle-ad jus ted- logis t ic growth
are presented and discussed. Time i n t e r v a l s requi red €or supply and
demand i n the U.S. f l u i d f u e l s s e c t o r to balance are estimated.
The p rov i s iona l global energy p ro jec t ion for t h e coming decade is
one of low growth rates accompanied by economic adjustments and d i f -
f i c u l t i e s and f a l l i n g energy pr ices . The p r o j e c t i o n for the f i r s t
q u a r t e r of the twenty- f i r s t century r e f l e c t s a c y c l i c r e v e r s a l t o
sha rp ly increased economic a c t i v i t y , energy demands, f u e l p r i c e s , and
p res su re on the t echnologica l sector to provide an adequate energy
supply
Impl ica t ions €or the developing na t ions and f o r the U . S . and world
economies are b r i e f l y addressed.
ix


The i n t e n t of t h i s s tudy w a s t o project g loba l energy production/
consumption p a t t e r n s , wi th emphas1.s on the next ten years , t ak ing i n t o
coas ide ra t ion t h e s i g n i f i c a n t changes i n these p a t t e r n s t h a t have
occurred over t he pas t f i v e years . A l l long-range energy p ro jec t ions
should be viewed as h s t estimates based on cur ren t knowledge, no t as
f o r e c a s t s or necessa r i ly v a l i d pred ic t ions .
2. PROJECTION METEIoIIOu#Tp
I n t h i s perspect€ve, p ro j ec t ions of f u t u r e t o t a l and electrical
energy consumption depar t from those presented i n most s t u d i e s .
Typica l ly , such energy-growth p ro jec t ions r e s u l t , regard less of the in i -
t i a l assumptions, i n a l o g i s t i c curve - i .e., a pseudo-exponential curve
wi th a growth c o e f f i c i e n t uniformly decreasing with t i m e . When p lo t t ed
on l i n e a r coord ina tes , a l o g i s t i c curve takes the shape of an elongated
"S" curve (a sigmoid o r Gompertz curve). To the ex ten t t h a t such a
curve d e p i c t s how growth can s a t u r a t e over t ime, it is u s e f u l and
r e a l i s t i c . However, such p ro jec t ions always i n d i c a t e mature growth
rates decreasing monotonically with t i m e , and h i s t o r i c a l l y observable
f l u c t u a t i o n s i n energy growth are ignored. One example of how inac-
c u r a t e an informed, convent ional f o r e c a s t can become, e leven years
later, is t h a t of E. R. Linden, published1 i n 1973. This study pro-
j ec t ed a t o t a l primary energy consumption i n the U.S. of 228 quad ( l o i 5 Btu) i n the year 2000. The sub jec t consumption rate is now a n t i c i p a t e d
t o be only 1/3 t o 1/2 of the c i t e d p ro jec t ion , as discussed i n a recent
r e p o r t 2 which emphasized t h e energy f u t u r e of t he United S t a t e s through
t h e year 2020.
An a l t e r n a t i v e p ro jec t ion methodology t h a t a l s o b e t t e r descr ibes
p a s t t r ends has been proposed by Stewart i n h i s book concerning tran-
s i t i o n a l energy p ~ l i c i e s , ~ i n a l a t e r booklet ,b and i n two p a p e r s . 5 ~ ~
His approach is based on the observa t ion that t he growths of both t o t a l
energy and e l e c t r i c a l energy consumption i n the U.S. ( s ince 1850 f o r t he
1

2
Former and 1905 f o r the l a t t e r ) have exh ib i t ed a c y c l i c v a r i a t i o n about
a median l o g i s t i c growth or t rend curve. Stewart p l o t t e d h i s t o r i c a l
annual energy-consumption da ta as 5-year moving-average po in t s and then
developed a compelling c o r r e l a t i o n 3 ,6 of the temporal v a r i a t i o n of the
percentage dev ia t ion of t he d a t a poi.nts From the l o g i s t i c curve, as
shown i n F ig . 1 f o r d a t a through 1988. Over 70% of t he da t a po in t s f a l l
w i t h i n the shaded area - %.e., wPthin a +5% band around a s i n u s o i d a l
curve having an amplitude of 20% about t he l o g i s t i c curve and a period
of 54 years. The sub jec t 130-year period s a w t h e growth of entLre ly new
i n d u s t r i e s and technologies and the d e c l i n e of o ld ones as w e l l as many
s o c i a l and i n s t i t u t i o n a l changes i n t h e s t r u c t u r e of i ndus t ry and
government. This i n d i c a t e s r a t h e r conclus ive ly t h a t energy consumption
grows i n surges o r cyc les r a t h e r than uniformly.
-
Simi la r c o r r e l a t i o n s based on World energy da ta have a l s o been
developed,3 hit it is noted t h a t eva lua ted d a t a a t the g loba l l e v e l t h a t
can be considered reasonably r e l i a b l e extend only from about 1920 f o r
e lectr ical energy and from about 1940 f o r t o t a l primary energy. I n addi-
t i o n , t h e c y c l i c v a r i a t i o n s i n world e l e c t r i c i t y consumption about t h e
g loba l trend curve appear t o be smaller than those f o r the U.S . above
and below the U . S . l o g i s t i c curve. Because of t he varying pos i t i ons o€
d i f f e r e n t na t ions on the l o g i s t i c energy growth curve a t a given t i m e ,
t h i s r e s u l t appears reasonable.
Stewart d i scusses3 ,6 poss ib l e l inkages between h i s work on c y c l i c
v a r i a t i o n s i n energy growth and the a n a l y t i c a l s t u d i e s by Mensch7 of t h e
Un ive r s i ty o f Ber l in (now with Case Western Reserve Univers i ty) and by
Marchet t ia 9 of the I n t e r n a t i o n a l I n s t i t u t e €or Applied Systems Analysis
(IIASA) on a long economic cyc le r e s u l t i n g from the growth, s a t u r a t i o n ,
and s t agna t ion of bas i c i n d u s t r i a l innovations. S imi l a r s t u d i e s of t h i s
type have been conducted by MIT's System Dynamics Grouplo and by the
Science Pol icy Research Unit a t the Un ive r s i ty of Sussex i n England- l l
The growing l i t e r a t u r e concernLng t h e so-called long economic (and,
t h e r e f o r e , energy) wave, which has evolved from t he seminal work of
N. Kondratieff (1920s) and of J. Schumpeter (1930s), i s r e f l e c t e d by a
number of recent paper~.'~-~~ A l l of t hese re la te , a t least i n d i r e c t l y ,

3
ORNL-DWG 82-1284R2 I r I
I
YEAR Figure 1. logistic approximation.6 decline consistent with projections. figure appearing in Transitional Energy Policy,3 Bergamon Press, 1981 .)
Deviation of U . S . historical energy consumption data from a
(This is an updated version of a Note the data points f o r 198Q showing a
4
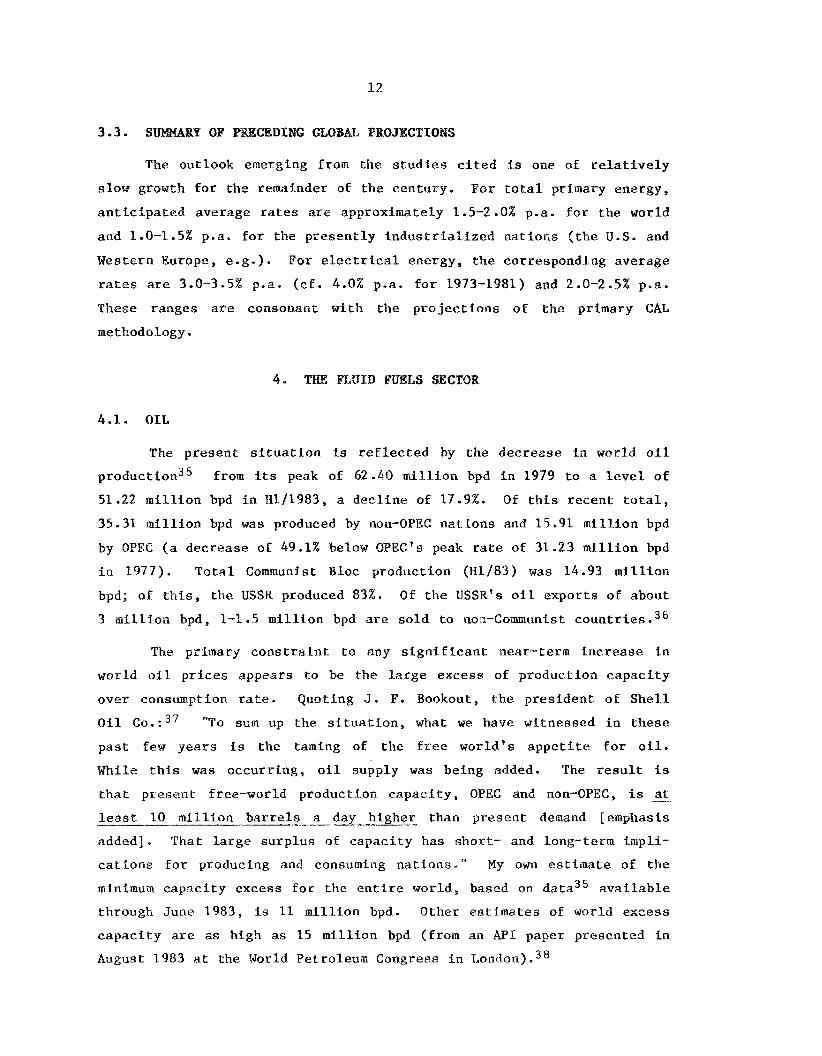
to analyses o f economic movements wi th l i f e spans (per iods) of 40-60
yea r s . The period of 54 years c h a r a c t e r i s t i c of Fig. 1 appears not t o
be co inc iden ta l .
Stewart has appl ied the c y c l i c p a t t e r n of energy growth depic ted i n
Fig. 1 t o p ro jec t ions of f u t u r e U.S. and world energy consamption rates
according t o what he ca1l.s the cycle-ad jus ted- log- l s t ic growth, or CAL
growth. The r e s ~ l t ~ , ~ f o r the U . S . , which is described in some d e t a i l i n
r e f . 2 , i n d i c a t e s a r e l a t i v e l y f l a t t o t a l energy consumption rate u n t i l
about the year 2008 ( a c t u a l l y dec l in ing somewhat u n t i l -19921, with
e lec t r ica l energy growing a t -2.5% p e a . during the same period [ c f . U.S.
power genera t ion growth rates of 7.5% p.a . (1950 t o 1970)3 and of 2.2%
p.a. (1973 t o 1983)20] . The CAL p r o j e c t i o n i n d i c a t e s t h a t t o t a l
primary energy consumption w i l l no t r e t u r n t o i t s 1979 peak of 79 quads
u n t i l about the year 2003. The CAL curve, however, a l s o p r o j e c t s a very
r a p i d energy growth rate between the years 2000 and 2025 t h a t w i l l more
than make up f o r the r e l a t i v e s t agna t ion between 1980 and 2000. Quoting
Stewart: "It is c r u c i a l , though, t h a t s o c i e t y does not g e t complacent
i f t o t a l energy use temporarily l e v e l s ou t ; i .e . , w e must continue t o
plan €or the f u t u r e i n order t h a t we can m e e t our energy needs and
growth after the year 2000." Res ta ted , p a s t overes t imates of present
energy consumptlon r a t e s could change e a s i l y t o cu r ren t underestimates
of f u t u r e (post-2000) consumption rates.
CAT, energy p ro jec t ions3 f o r the world (and t h e U.S.) a r e shown i n
Fig. 2 for t o t a l . e n e r g y consumption t o 2025 and i n Fig. 3 f o r e l e c t r i c -
i t y genera t ion t o 2050. In each f i g u r e , the l o g i s t i c curves (long-term
t r ends ) a r e given by the dashed l i n e s and the GAL pro jec t ions by the
s o l i d l i n e s .
With regard to -I world -- t o t a l -_I- energy consumption (Fig. 2 ) , f i v e major
p o i n t s emerge : 3
Q Energy growth i n the U . S . is more nea r ly approaching s a t u r a t i o n
than i s tha t of the world - t .e., world energy consumption i s on a
h igher growth rate part of the l o g i s t i c curve.

5
- I
t c3 [r: w 2 w A
c a 0 t-
QRNL-DWG 85-19105
2000 2025 YEAR
Figure 2 . World and U . S . growth curves f o r tota l energy consumption. Logistic (dashed) and CAI, ( s o l i d ) .

6
L-DWG 8519104 1 OQ
10
1.6
1940 1960 1988 2020
Figure 3. Logistic (dashed) and CAL ( s o l i d ) .
World and U . S . g r o w ~ h curves FOP e lectricity generation-

7
Q G A L growth rates for t h e per iod 1975 to 2000 are 1.4% p.a. f o r
t h e world and zero f o r t h e U . S . ; f o r t h e per iod 2000-2025, t h e
corresponding rates are 4.1% p . a - and 2.8% p.a- The actual global
growth rate, 1860-1980, w a s 2.3% p.a.
a For the i n t e r v a l 1975-2000, t h e 40% CAL growth ind ica t ed f o r t h e
world sugges ts a 60% growth for t h e world o u t s i d e the U . S . , or a rate of
1.9% p . a . The s u b j e c t energy growth _I f o r t h e rest of t h e world (ROW)
would be g r e a t e r than the t o t a l U . S . energy consumptfon i n 2000.
0 If t he pas t CAL p a t t e r n of energy growth cont inues , the i nc rease
-La t h e ROW w i l l cont inue at a r e l a t i v e l y high rate even i f t h e growth
rate for the U.S. un t i l 2000 is indeed e s s e n t i a l l y zero.
* For t h e high growth rate per iod 2000 t o 2025, nuc lear energy
appears t o be the only assured candida te - of t h e energy technologies
c u r r e n t l y a v a i l a b l e - t o m e e t t he very l a r g e incremental requirements
i nd ica t ed . While a d e c i s i o n for t h e f u r t h e r deployment of nuc lea r
energy may not be necessary in t h e near f u t u r e i n the U.S., t h e need fo r
such a dec i s ion appears t o ar ise earlier f o r t he ROW.
Concerning world electrical energy consumption (Fig. 3), t h e r e are
a l s o five major conclusions : 3
Energy resources requi red f o r power genera t ion w i l l be of long-
t e r m primary importance because of Increas ing e l e c t r i f i c a t i o n - i .e. ,
t h e fract i ton of t o t a l energy consumption used f o r power genera t ion w i l l
cont inue t o inc rease , reaching -50% i n s e v e r a l coun t r i e s by 2000. For
t h e world, the h i s t o r i c a l trendz1 based on IAEA da ta is shown below:
Year 1950 1960 1970 1980
Thermal input to electrical energy consumption, as X ] 12.4 18.6 25.0 29.1 of t o t a l energy consumed
For the U.S., t h e t r end i s similar, t he s u b j e c t f r a c t i o n having
increased from 16% i n 1952 t o 35% i n 1983.
U.S. power genera t ion decreased from 43% of world genera t ion i n
1946 t o 26% In 1962, and the long-term C A L pro jec t ion is t o less than
20% by 2025. Again, likely world energy growth is much l a r g e r than t h a t
f o r the U.S.

8
* The U . S . f r a c t i o n of world i n s t a l l e d nuc lear genera t ing capac-
i t y , which was 36% a t t h e end of 1982 (IAEA data) ,22 w i l l dec l ine , by
CAL projection^,^ t o about 28% i n 2000 and t o 18% i n 2025.
The growth of power consumption, which has f a l l e n sha rp ly rela-
t i v e to t h e 1950-1970 l e v e l , w i l l probably remain s m a l l f o r another
10-12 yea r s (-3.2% p.a. f o r the world). The decreased number of power
s t a t i o n s being planned p r a c t i c a l l y ensures t h i s outcome. The CAL, pro-
j e c t i o n s of world and U.S. ne t a d d i t t o n rates3 (not inc luding replacement
p l a n t s ) - not shown here - f a l l to minimum l e v e l s , around 1990, of 30-50
GWe/year (world) and 3-5 GWe/year (U.S.) .
0, The short-term h i a t u s will l i k e l y be followed, beginning
1995-2000, by a very Parge demand upswing.
3.1. S OF GLOBAL 0% PROJECTIONS
This methodology i n d i c a t e s near-term (1980-2000) consumption growth
rates of approximately 1.4% p.a. f o r world t o t a l energy, 1.9% p.a. f o r
ROW (world o u t s i d e U.S.) t o t a l energy, and 3.2% p . a . f o r world e lectr ical
energy.
3.2. SUPPORTIVE STUDIES
A number of world energy eva lua t ions support t h e r e l a t i v e l y low
growth rates pro jec ted by t h e CAL methodology f o r t he period 1980-2000.
Seve ra l of these p r o j e c t i o n s are described and compared i n the material
t h a t follows *
a. Alcock conducted a c y c l i c a l ana lys i s23 of t h e world economy
based on t o t a l energy consumption p e r c a p i t a r a t h e r than the more usua l
real GNP p e r c a p i t a . The a n a l y s t s w a s based on da ta f o r the 12 l a r g e s t
wealthy na t ions (which accounted f o r 75% of t he world GNP): USA, Canada,
IJK, Prance, FRG, Poland, Czechoslovakia, I t a l y , USSR, Sweden, Japan, and
A u s t r a l i a . The independent v a r i a b l e s were f i v e s i n u s o i d a l cyc les wi th
f ixed per iods and a composite c y c l i c a l index composed of t he f i v e cyc le s
equa l ly weighted. For one pre-WWII i n t e r v a l (1922-1938) and one postwar
period (1958-1966) - a t o t a l span of 32 years - the composite index
accounted f o r 97.5% of t he va r i ance of t o t a l energy consumption p e r
c a p i t a . When appl ied ou t s ide these two t i m e spans used f o r the mul t ip l e

9
r eg res s ion a n a l y s i s t he model accu ra t e ly "predicted" the s teady growth
of t he f o r t i e s and the deep recess ion of 1973-77 ( e spec ia l ly 1973-75).
The average growth rate pro jec ted f o r 1977-2001 (and f o r 1983-1993) i s
0.60 (i-O.1) X p.a.,a rate about one - f i f th of t h a t cha rac t e r i z ing the
per iod 1950-1966, and descr ibed by the author as "slow growth - c l o s e t o
s t agna t ion . **23
The rate of change of t o t a l energy consumption f o r t h i s world sec-
t o r m y be est imated by combining Alcock's rate f o r energy consumption
per c a p i t a with the est imated rate of populat ion growth fo r t he same ( o r
a s i m i l a r ) s ec to r . For the latter f a c t o r , IIASA's populat ion growth
estimate24 f o r its 17 NMOs (na t iona l member organiza t ions) w a s s e l ec t ed
because the coun t r i e s involved are q u i t e s i m i l a r t o those chosen by
Alcock. The NMOs are: Aus t r i a , Bulgar ia , Canada, Czechoslovakia, FRG,
F in land , France, GDR, Hungary, I t a l y , Japan, Netherlands, Poland, Sweden,
USSR, UK, and the USA. For t h i s group of na t ions , t he est imated popula-
t i o n growth rate, 1980-2000, is only 0.60% p.a. This y i e lds a pro jec ted
growth rate of t o t a l energy consumption f o r the "wealthy na t ion sec to r "
of (1.006)(1.006), o r 1.20% p.a. Since the IIASA HMO populat ion is
expected t o c o n s t i t u t e 18% of t h a t of t h e world i n 2000, combination of
t h i s growth rate with the g loba l CAL p r o j e c t i o n of 1.4% p.a. i n d i c a t e s a
"poor na t ion sec to r " growth of 1.44% p.a. This secondary p ro jec t ion
should not be accorded undue s ign i f i cance , however, s i n c e it is based on
two f o r e c a s t s which u t i l i z e q u i t e d i f f e r e n t methodologies.
b. The recent IIASA analysis €or t h e European Community (EC)
Commission of t h e long-term energy f u t u r e of t he coun t r i e s of t he
European Economic Community has been summarized by Wolfgang S a ~ s i n . ~ ~ A
major conclusion is s t a t e d as follows:
"The s tudy found previous i n v e s t i g a t i o n s of t he European energy f u t u r e to be o p t i m i s t i c with regard t o economic growth rates and import oppor tun i t i e s as w e l l as conservat ion poten- t i a l . In IIASA's macroeconomically balanced scenar ios f o r the EC, a s u b s t a n t i a l l y lower economic growth rate Is projec ted , dec l in ing s t e a d i l y over t i m e though remaining pos i t i ve , and It is aga ins t t h i s background t h a t the EC's energy system w i l l have to be res t ruc tured ."

10
For the period 1975-2030 ( t h e only i n t e r v a l f o r which estimates are
p r e s e n t l y a v a i l a b l e ) , growth rates p ro jec t ed f o r t he EC were 1.10% p . a .
f o r f i n a l t o t a l energy, 2.07% p.a. f o r f i n a l e lec t r ica l energy, and
1.57% p . a . f o r real GDP per cap i t a .
C. In IIASA's massive "Energy i n a F i n i t e World" s tudy ,26
published i n 1981, t h e g loba l t o t a l primary energy growth rates f o r
1975-2000 are 2.91% p.a . i n t h e High Scenario, 2.04% p.a. i n t he Low
Scenar io , and 1.75% p.a. i n i t s '*Minimum Scenar io ," which corresponds t o
per-capita t o t a l energy consumption remaining cons tan t during t h e sub-
j e c t per iod . The d i s t r i b u t i o n of f i n a l energy demand through the y e a r
2030 among 6 of t h e 7 world regions considered i n the IIASA study has
been addressed by Khan and H 8 l ~ l . ~ ~ The momentum of the cu r ren t energy
consumption t rend and the other p ro jec t ions c i t e d suggest t h a t the mini-
mum p r o j e c t i o n made by IIASA w i l l prove t o he the most accu ra t e of t he
th ree .
d. S . Hul t in , chairman of t he i n t e r n a t i o n a l execut ive counci l of
t h e World Energy Conference, has proposed28 "an o p t i m i s t i c scenar io"
which corresponds t o a world t o t a l energy growth rate f o r 1978-2000 of
2.21% p.a.
Assuming a r e a l gross world product (GWP) growth rate (1981-2000)
of 3.0% p.a., J. H. L ich tb lau a r r i v e d a t s imilar conclusion^.^^,^^ H i s
p r o j e c t i o n s of average growth rates f o r t o t a l energy consumptlon span a
narrow range: 2.04% p . a . f o r market economies, 2.20% p.a. for t he USSR,
2.46% p . a . for a l l c e n t r a l l y planned economies, and 2.17% p.a. f o r t h e
world.
e. Some r e l a t i v e l y recent p ro jec t ions ( J u l y 1983 forward) f o r
i n d i v i d u a l coun t r l e s , i n no p a r t i c u l a r o rde r , inc lude the following
t abu la t ed va lues :

Table 1. Pro jec t ions of Regional Energy Growth Rates
Consumed Pro jec t ed Reference Nation energy form Time i n t e r v a l growth rate No.
( X pea.)
UK T o t a l 19 82 -2 000 0.7 53
Japana T o t a l 1982-1990 2.2 50 1982 -1 99 5 1.9 31
E. Germany T o t a l 198 6-1990 (1 32
U.S . T o t a l 1982-2000 1 .o 33 E lec t r ical 1982 -2 006) 2.3 33
U.S.b T o t a l 1982 -1 99 5 1 .o 39
I sraelc Electrical 1983-2015 3.8 54
Switzer land Electrical 1983-1990 -3 .O 55
Spain Electrical 1984-1 992 3.3d 34 4.3e 56
W. Europef T o t a l 19 82 -2 000 1.9 57
Tadwan Electr ical 1 9 84 -2 00 0 6.3 58
Ontar io Hydro s e r v i c e area Electr ical 1984-1 998 2.4 59
aJapanese government estimates. bPro jec t ion by Ross of Petroleum Indus t ry Research Associates . , Inc. CForecast by the Horev Commission. dSpanish government estimate. “Pro jec t ion of Spanish u t i l i t i e s a s s o c i a t i o n (UNESA)- fForecas t by Data Resources, Inc.
.
1 2
The outlook emerging f rom the s t u d i e s c i t a is on of re1 t i v e l y
slow growth for t he remainder o f t h e century. For t o t a l primary energy,
a n t i c i p a t e d average rates are approximately 1.5-2 .OX p.a. for t he world
and 1.0-1.5% p.a. for t he p re sen t ly i n d u s t r i a l i z e d na t ions ( t h e U.S. and
Western Europe, e.g.). For electrical energy, t h e corresponding average
r a t e s are 3.0-3.52 p.a . (cf . 4.0% p-a . f o r 1973-1981) and 2.0-2.S% p e a .
These ranges are consonant wi th the p ro jec t ions of t h e primary CAL
methodology.
The p resen t s i t u a t i o n I s r e € l e c t e d by the decrease i n world o i l
production35 from i t s peak of 62.40 mil l ion bpd i n 1979 t o a l e v e l of
51.22 m i l l i o n bpd i n H1/1983, a dec l ine of 17.9%. O f t h i s recent t o t a l ,
35.31 m i l l i o n bpd was produced by non-OPEC na t ions and 15.91 m i l l i o n bpd
by OPEC (a decrease of 49.1% below QPEC's peak rate of 31.23 million bpd
i n 1977). T o t a l Communist Bloc production ( H 1 / 8 3 ) w a s 14.93 mi l l i on
bpd; of t h i s , the USSR produced 83%. O f t h e USSR's a i l expor t s o f about
3 mil l ion bpd, 1-1.5 m i l l i o n bpd a r e so ld t o non-Communist count r ies .36
The primary c o n s t r a i n t t o any s i g n i f i c a n t near-term inc rease i n
world oil. prices appears t o be the l a r g e excess of production capac i ty
over consumption rate. Quoting J. F. Bookout, the p res iden t of S h e l l
O i l C O . : ~ ~ "To sum up t h e s i t u a t i o n , what we have witnessed i n t h e s e
pas t few yea r s i s the taming of the f r e e world's a p p e t i t e f o r o i l .
While t h i s w a s occur r ing , o i l supply was being added. The r e s u l t i s
t h a t present free-world production capac i ty , OPEC and non-OPEC, is at l eas t 10 m i l l i o n b a r r e l s .-.- ___1_1 a day h igher than present demand [emphasis
added]. That l a r g e su rp lus of capac i ty has shor t - and long-term i m p l i -
e a t t o n s f o r producing and consuming na t ions ." My own estimate of t h e
minimum c a p a c i t y excess f o r t he en t Lre world, based on da ta35 a v a i l a b l e
through June 1983, is 11 m i l l i o n bpd. Other es t lma tes of world excess
c a p a c i t y a r e as high as 15 d l l i o n bpd (from an API paper presented i n
August 1983 a t the World Petroleum Congress i n T ,ond~n) .~*
13
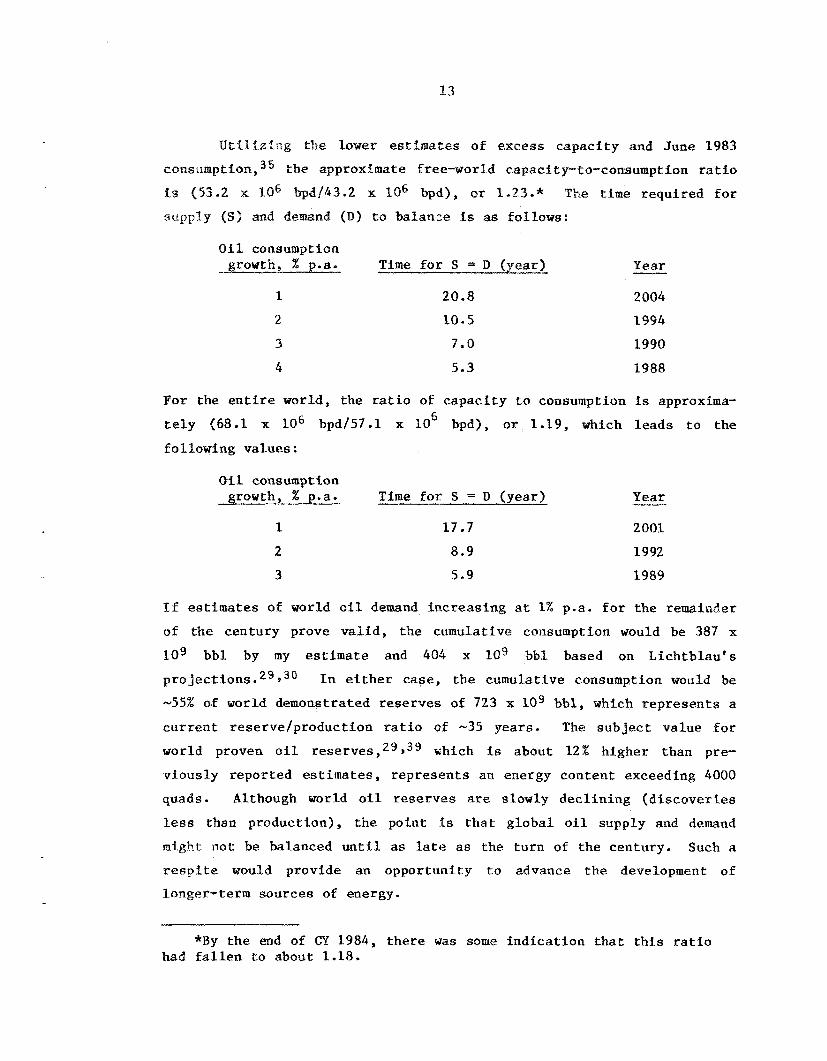
UtilPzing the Lower estimates of excess capac i ty and June 1983
cons omption, the approximate free-world capacity-to-consumption r a t i o
is (53.2 x lo6 bpU43.2 x PO6 bpd), or 1.23.k The t i m e requi red f o r
s u p p l y (S) and demand (D) t o balance is as follows:
Of 1 consumption growth, X p.a- T i m e f o r S = D (year ) Year
20.8
10.5
7.0
5.3
2 004
1994
1990
1988
For the e n t i r e world, the r a t i o of capac i ty t o consumption is approxima-
t e l y (68.1 x 1Q6 bpd/57.1 x IO6 bpd), o r 1.19, which l eads t o the
f'ollowing values :
O i l consumption growth, X p.a. T i m e fo r S = D (yea r ) Year
17.7
8.9
5.9
2 001
1992
1989
I f estimates of world o i l demand increas ing a t 1% p.a. f o r the remainder
of the century prove v a l i d , the cumulative consumption would be 387 x
lo9 bbl by my estimate and 404 x lo9 bbl based on L ich tb l au ' s
p ro j ec t ions . 29 P 30 In e i t h e r case, the cumulative consumption would be
-55% of world demonstrated reserves of 723 x I O 9 bbl, which r ep resen t s a
cu r ren t reserve /product ion r a t i o of -35 years. The sub jec t value €or
world proven o i l reserve^,^^,^^ which is about 12% higher than pre-
v ious ly repor ted estimates, r ep resen t s an energy content exceeding 4000
quads. Although world o i l reserves are slowly dec l in ing (d i scove r i e s
less than product ion) , t h e poin t is t h a t g loba l oil supply and demand
might not be balanced u n t i l as late as the tu rn of t he century. Such a
resp i te would provide an oppor tuni ty t o advance the development o f
longer-term sources of energy.
*By the end of CY 1984, t he re was some ind ica t ion t h a t t h i s r a t i o had f a l l e n t o about 1.18.

14
Representa t ive r ecen t p r o j e c t i o n s of i nc reases i n o i l demand
inc lude the following:
For the U . S . , L i ~ h t b l a u ~ ~ estimates 0% p.a. ( f l a t ) through 2080,
$agget tbo p r o j e c t s 1% p.a. (maximum) f o r 1983-1995, and
~ u s t a f e r r o 3 3 estimates - 0.92 p . a . f o r 1982-2000.
ai For t h e f r e e world, Treat39 estimates 1% p.a. (1983-1993); f o r
t h e e n t i r e world, L i c h t b l a ~ ~ ~ - ~ ~ fo resees an average rate (1981-
2000) of 0.8% p.a-
These pro j e c t i o n s co inc ide semiquantitati .vely wi th the CAI., f o r e c a s t fo r
t o t a l energy consumption and with the p reva i l i ng outlook t h a t growth
rates f o r real GNF and e l e c t r i c a l energy wlll. be about the same, t h a t
f o r t o t a l energy consumption smaller, and t h a t for o i l consumption even
lower. A s Lichtb lau notes: 30 *'. . .oil's r e l a t i v e importance in t he
energy market appears to be on A long-term .... dec l ine . I n t h e c e n t r a l l y
planned economies, t h i s may be due p r imar i ly t o supply cons t r a in t s . I n
t h e market economLes, t h e p r i n c i p a l causes are s t r u c t u r a l changes i n
demand. Io
4.2, N GAS
t n H1/83, world gas production35 was a t a ra te o f 58.3 TCF/year,
63% i n t h e f r e e world and 37% i n communist na t ions . Halbouty r e c e n t l y
,39 t h a t only one thhrd of t h e world's u l t ima te ly recoverable
gas has been discovered and t h a t cu r ren t proven r e se rves t o t a l 3191 TCF,
which r ep resen t s an energy content exceeding 3200 quads. Halbouty, a
1I.S. geo log i s t and independent producer, t h inks t h a t both mature petro-
leum producing areas and t h e f r o n t i e r regions o€ the. world have a high
p o t e n t i a l f o r f u t u r e gas d i scove r i e s , a s well as extens ions and
r e a p p r a i s a l s .
In the USSR, t h e r e se rve base of gas is much g r e a t e r than f o r
- about 65 b i l l i o n b a r r e l s of o f 1 (9-10% of world r e se rves ) cf.
ahout 1165 TCF of gas ( 3 7 4 0 % of t h e world t o t a l ) . Current production/
consumption l e v e l s i n d i c a t e 12-14 years of o i l and over 70 years of gas.
Scan lan of B r i t i s h Petroleum e s z i r n a t e ~ ~ ~ that by 1985, IJSSR gas produc-
t i o n w i l l roughly equal its o i l production i n thermal value, and that

15
the West S i b e r i a d O b Delta complex w i l l be producing gas and a i l equiva-
l e n t t o e i g h t times the hydrocarbon product ion of Alaska or approxi-
mately the equiva len t of t o t a l 1983 hydrocarbon production i n the
Arabian Gulf. LichtblauZ9 p r o j e c t s USSR gas production t o increase a t
5% p.a. t o 1990 and by 3 4 % p.a- during 1990-2000, T h i s may be com-
pared to h i s o the r es t imated growth rates (1981-2000) of 2.37% p.a.
(world), 3.60% p.a. ( c e n t r a l l y planned economies) and 1.67% p . a l (market
economies).
I n the U . S . , t he excess capac i ty i n t he gas s e c t o r is w e l l known.
P o s t e r , a Tenneco v i ce p re s iden t , be l i eves t h a t t he t o t a l U.S. gas 41
su rp lus is -4 TCF/year - i . e . , chat the r a t i o of capac i ty to consumption
is p resen t ly about (22 TCF/18 TCF), o r 1.22,*vhich gives the following
va lues f o r equa l i ty of supply and demand:
Gas consumption Year - growth, % p.a. T ime f o r S = D (year)
10*1
5.1
3.4
1993
1988
1987
The reasons f o r Fos t e r ’ s be l i e f t h a t a domestic gas su rp lus w i l l l a s t
“ u n t i l a t least 1986“ are c l e a r . GustaferroS3 foresees U.S. gas con-
sumption f l a t through 2000 a t -17.9 TCF/year, t he 1982 rate. I n 1983,
t h e U.S. consumed 17.0 TCF of n a t u r a l gas , a l e v e l expected by many t o
rise to -18 TCF wi th in one t o 2 years . The recent OTA assessment of
U.S. gas42 p ro jec t s a broad year-2000 plausible production range of 9 t o
19 TCF; t he higher value corresponds t o a growth r a t e , from 1982, of
0,33% p.a. Most o ther production estimates f o r 2000 are i n t he range
of 11-15 TCF. AGA’s es t imates of domestic gas a ~ a i l a b i l i t y ~ ~ are
higher: 1 7 t o 26.7 TCF (year ZOOO), of which the lower-48 supply is
expected t o be 12 t o 19 TCF/year.
42
As f o r o i l , i t may take some time before supply and demand f o r
domestic gas balance.
*There w a s some ind ica t ion that: by the end of CY 1984, t h i s r a t i o had decl ined to about 1.18.

16
4 . 3 . OL
For t h i s woulld-be f u e l , a global. excess capac i ty a l s o exists, as
r epor t ed recent 1 y . '' An: the end of 1982, t he r a t i o of production capa-
c i t y t o consumptton rate w a s (14.5 x LO6 TPY/11 x lo6 TPY), or 1.32.
T h i s ratio i s projec ted to inc rease , a t end-1986, t o (23.3 x 10 TPY/15
x l o 6 TPY), o r 1.55. In North America, methanol production capac i ty has
increased" by 56% s i n c e 1980 ( l a r g e l y from inexpensive n a t u r a l gas i n
western Canada) t o 2 . 5 x 10 gpy, and demand is 60% o f supply - i.e.,
S/D = 1.67. A sepa ra t e stridy4' by Trichem, Ltd. , of London f o r e c a s t s
expor t s of methanol from a l l t he o i l - and gas-producing coun t r i e s i n t h e
Mideast and North Afr ica t o i nc rease from a 1980 level. of 0.3 m i l l i o n
metric TPY t o 1.8 m i l l i o n metric TPY i n 1990, r ep resen t ing a growth rate
of 19.6% p.a. It appears t h a t a very r ap id growth of methanol use fo r
f u e l would be requi red to balance supply and demand by the end OE t h i s
decade. Tht? cu r ren t surp luses of o i l and gas are counter forces t o such
a t r end , however.
6
9
It is noted i n pass ing t h a t an excess productton c a p a c i t y a l s o
e x i s t s for coa l . For the U . S . , t he National Coal Assac. estimated61 a
production overcapac i ty (end-1983) of -200 x 10 TPY - i .e., S/D =
(980 x lo6 TPY/780 x 106 TPY) = 1.26. E. B. Le isenr ing , chairman of
Westmoreland Coal Co., has pro jec ted a worldwide coa l g l u t through the
1980s and a growth i n U . S . c o a l consumption f o r e l e c t r i c i t y genera t ion
of 2 .5% p .a . For uranium, also, t he l a r g e g loba l excess supply w i l l
l i k e l y take years t o diminish t o the l e v e l of world demand.
6
6 2
The outcome of i n t e r - f u e l competit ion w i l l depend p r imar i ly on
r e l a t i v e f u t u r e p r i c e s - p r i c e s which i n t he s h o r t t o in te rmedia te terms
appear l i k e l y to dec l ine .
5. TEE oumo TEE?, DEVELOPING NATIONS
Because of t he complex i n t e r p l a y of many i n t e r a c t i v e f a c t o r s , and
the cons iderable d i v e r s i t y of the na t ions Involved, t he range of projec-
t Pons and opinions concerning the energy/economic f u t u r e of the devel-
oping na t ions ( t h e less developed coun t r i e s (LDCs), the Third World) i s
broad. For ririich of t h i s s e c t o r , a major problem w i l l be burgeoning

populat ions. IIASA's estiaaatesz4 gz6 of populat ion growth rates
(1980-2000) are i l l u s t r a t i v e :
Region or Sector
World U.S.A OECD EEC LA* A f /SEA* pIE/NAf*
Populat ion Growth, Z p.a.
1.75 0.92 0.60 0.21 2.39 2.33 2.51
Regional d i f f e rences i n populat ion growth are placed i n s t r i k i n g
pe r spec t ive by recent es t imates from t h e Populat ion It
states t h a t from 1960-1980, t h e number of people aged 20 to 40 increased
by 360 mi l l i on in t he developing world and by 60 m i l l i o n i n t h e devel-
oped world - a s f x f o l d d i f f e rence . But Erom 1980-2000, t he r e l a t i v e
increase is expected to be 30-fold, based on increases i n the number of
young a d u l t s of 600 m i l l i o n and 20 mi l l i on , r e spec t ive ly .
One of t he r e l a t i v e l y sanguine f o r e c a s t s is L i ~ h t b l a u ' s , ~ ~ p 3 0 which
assumes a real GNP growth f o r the LoCs (1982-2000) of 4.25% p.a. and
p r o j e c t s a growth of t o t a l energy consumption at least as high. This
s tudy fo resees nuclear power i n t h i s s e c t o r growing sharp ly , but from a
low cu r ren t base, and con t r ibu t ing -6 .7% of e l e c t r i c a l generat ion i n
2000. A g r e a t e r market share i s prevented by capital c o n s t r a i n t s and
inadequate technologica l i n f r a s t r u c t u r e s . With regard t o t o t a l power
demand, H. Laue, Director of =A's Division of Nuclear Power, th inks i t
could inc rease by fou r fo ld by 2000 (8.5% p.a.1. 46 It i s noted t h a t the
t o t a l electrical energy product ian i n t h e 158 developing na t ions
considered46 is -50% of U.S. genera t ion , and t h a t 63% of t h i s power is
developed i n only 7 coun t r i e s and 37% i n the o ther 151. It is d i f f i c u l t
f o r the writer t o envis ion thLs s e c t o r increas ing its power genera t ion
from ha l f t h a t of the U.S. t o double the cu r ren t U.S . l e v e l i n only 17
years .
*LA = L a t i n America; A€/SEA = sub-Sahara Afr ica excluding South Af r i ca + South and Southeast Asia; ME/NAf = Middle East and North Afr ica .
18
My own view is s i g n i f t c a n t l y less o p t i m i s t i c . A c e n t r a l po in t
o f t e n overlooked i n s i m p l e e x t r a p o l a t o r y p r o j e c t i o n s i s t h a t many
markets i n the i n d u s t r i a l world are a t o r near sati.tration, and t h a t T,DC
a c c e s s i b i l . i t y t o c r e d i t markets is con t r ac t ing . These na t ions have
l a r g e p o t e n t i a l markets of a l l k inds - inc luding , e-.g., small (-300 We)
nuclear power r e a c t o r s - but development of t hese markets would requ2re
immense expenditures corresponding to l a r g e inc reases of a l r eady very
h i g h l e v e l s of e x t e r n a l debt. The World Bank, i n a study3' t i t l e d "The
Energy Trans€t€on i n Developing Countries '@ estimates tha t these na t ions
would need t o inves t $1.3 t r i l l i o n over the next decade t o a d j u s t t o
( p r e s e n t l y ) high energy p r i ces . The study a l s o i n d i c a t e s t h a t t he n e t
o i l imports o f t he o€l-importing devel.oping coun t r i e s w i l l continue t o
grow, a t a r a t e o f 1.8% p.a. (1980-1995). The r epor t states t h a t i n
most of t he 18 coun t r i e s f o r which t h e Bank has completed energy
assessments, "it is estimated t h a t t he consumption of woodfuels is
g r e a t l y o u t s t r t p p i n g s u s t a i n a b l e production, sometimes by a f a c t o r of
t h r e e or four." Alcock concludes t h a t the period of slow growth and
s t a g n a t i o n i n energy consumption t h a t h i s a n a l y s i s p r o j e c t s (see p r i o r
d e s c r i p t t o n ) w i l l be accompanied by massive hardship , inc luding star-
va t ion , i n the poorer na t ions , and t h a t " the s a t i s f a c t t o n of t h i r d world
needs cannot be m e t simply by an inc rease i n world G N P + " Leontief has
r e c e n t l y d iscussedb7 another f a c t o r which could opera te t o the detriment
of t he LDCs:
23
en a choice between d i f f e r e n t industries is made, t h e comparatively low wage l e v e l s p reva i l i ng i n t h e less developed c o u n t r i e s obviously favor labor- in tens ive i n d u s t r i e s (simple tex t i les o f f e r a good t r a d i t i o n a l example); and t h e more labor- in tens ive the i ndus t ry i s , the greater w l l l be the less developed "lowwage" coun t r i e s ' competit ive advantage. These cond i t ions a r e , however, being r a d i c a l l y changed by t h e energence o f n e w technology t h a t , as w e have seen, tends t o diminish the role o f l abor , s k i l l e d o r unsk i l l ed , as the most important f a c t o r o f production and, consequently, as t h e major component of t o t a l cos ts . As t he wage c o s t s - as compared wi th the cos t O E other inputs such as r a w ma te r i a l , power, and i n p a r t i c u l a r machines and the i n t e r e s t charges on the inves t - ment i n them - become less important, t he competit ive advan- t age enjoyed by the lowwage coun t r i e s n e c e s s a r i l y diminishes.

19
In the case of f u l l y automated i n s t a l l a t i o n s , it becomes n i l . Product ion of textiles, p a r t t c u l a r l y of t he s impler kind such as grey c l o t h , s h i f t e d i n the p a s t from the developed t o the low-wage, less developed coun t r i e s ; but t he re are s igns that, wi th t h e In t roduct ion of h igh ly automated equipment, t h i s pro- cess has been a r r e s t e d and is even being reversed ,"
Nussbaum goes so far as t o state i n h i s recent bookb8 t h a t of t he
Third World na t ions , only a ha l f dozen - probably B r a z i l , South Korea,
Taiwan, Bong Kong, Israel, and Singapore - w i l l "be able t o make it t o
t h e twenty- f i r s t century" - i -e . , t o succeed i n smoothly making the
t r a n s i t i o n . L i t t l e h i n t is given as t o how Red China, e.g., might be
expected t o r e a c t i n the circumstances descr ibed.
Looking over t h i s poss ib ly deep v a l l e y (low plain?) t o t h e
post-2000 per iod , t he CAL pro jec t ion3 is f o r a very l a r g e increase i n
primary energy consumption from 2000 t o 2025: a growth for the U.S. of
-73 quads (2.8% p.a.1 and a world growth of -676 quads (4.1% p.a.) - an
increment over ninefold g r e a t e r than t h a t f o r t he U.S. This growth
l e v e l may be compared wi th cu r ren t world consumption rates of 105
quads/year of o i l and 60 quads/year of n a t u r a l gas. If t h i s p ro jec t ion
i s c r e d i b l e , t he coming f i f t e e n years would bes t be used t o develop
energy technologies t h a t could be deployed throughout t h e world during
the sub jec t period t o meet the l a r g e energy demands t h a t would then
materialize.
6. ECONOMIC IMPLICATIOPIS
Viewed c o l l e c t i v e l y , most a v a i l a b l e energy p ro jec t ions e i t h e r assume
or fo recas t a r e l a t i v e l y narrow range of real energy p r i c e t r a j e c t o r i e s
over t he next decade. For o i l , e.g., f o r which more estlmates have been
published than for any f u e l , v i r tuaZ ly a l l eonventfonal price change
estimates encompass a range from s l i g h t l y less t o s l i g h t l y more than the
r a t e of genera l p r i c e I n f l a t i o n . The r e l a t i v e r a t e s of change i n the
real prices of competing energy forms w i l l n a t u r a l l y inf luence , and
r a t h e r d i r e c t l y , f u t u r e changes i n t h e i r consumption rates.
Among the more i n t e r e s t i n g - and poss ib ly more accura te - e s t i m a t e s
are those of lower real oil p r i c e s (in 1982 U.S. d o l l a r s ) i n coming

20
years . These include4' DOE'S, from i t s recent annual energy out look,
which p r o j e c t s a minimum of $21/bbl by 1985, and S t e f f e s ' value of
$20/bbl by 1989. More d r a s t i c d e c l i n e s are pro jec ted by Pylant4O (about
$16/bbl hy 1995) and by Marchet:ti9,18 ($12/bbl "during t h e next few
years , " i n t e r p r e t e d by the writer t o mean i n the e a r l y 1990s). The
l a t t e r estimate'' is oE p a r t i c u l a r i n t e r e s t and of p o t e n t i a l importance
because i t : i s based on the empir ical observat ion t h a t s i n c e 1800, real
energy pr ices have spiked upward o r " f l a r ed" i n c l o s e t i m e proxim-hty t o
a primary energy form a t t a i n i n g i t s maximum market share . The I.ast
( f o u r t h ) such peak ( f o r both real p r i c e and market share) w a s presumably
i n 1980-81 f o r world o i l . This p a t t e r n p r o j e c t s t he next peak t o be f o r
world n a t u r a l gas i n 2025 (4-10 s yea r s ) .
Io t h e l i m i t e d t i m e a v a i l a b l e , no p r o j e c t i o n s of real GWP were made.
Data from t h e Worldwatch I n s t i t u t e 6 4 i n d i c a t e the growth i n real GWP
from 1950-1983 averaged 4.3% p.a-; t h e real GWP per c a p i t a over t he same
33-year i n t e r v a l increased a t a rate of 2.5% p.a. Ry e i t h e r measure, a
s e c u l a r dec l ine has occurred, and t h e change i n real GWP per c a p i t a f o r
t h e period 1979-1983 w a s n i l .
For the tJ.S. , p r o j e c t i o n s o f real GNP growth d i f f e r widely.
Conventional assumptions f o r 1982-2000 tend t o c l u s t e r a t a r e l a t i v e l y
high level , as exemplified by t h e rates used by t h e U . S . Department of 3 3 29
Commerce (2.8% p.a . ) , by t h e GRILt9 (2.9% p.a.), and by Lichtb lau
(2.5% p.a.). These rates imply a growth of real GNP per c a p i t a of about
1.6% t o 2.0% p . a . , bracket ing the h i s t o r i c a l (1885-1970) U.S. average of
1.81% p . a . Lower rates are a n t i c i p a t e d , among o t h e r s , by Steffes ," who
expects t h e per iod 1983-1989 t o be charac te r ized by a l t e r n a t i n g economic
recover ies and recess ions and an average real CNP growth rate of 1.0%
p.a. A t t he same (lower) end of t h e spectrum o f estimates are those of
S t ewar t , who appears to d i f f e r from t h e o t h e r s c i t e d i n t h a t he pre-
s e n t s and uses an acceptab le r a t i o n a l e f o r p r o j e c t i n g real GNP growth
r a t h e r than, i n essence, assuming a value. This approach simply com-
b ines t h e CAL estimates of f u t u r e t o t a l energy (Et) consumption races
(previous ly descr ibed) with two t r ends f o r t he r a t i o of real GMP t o
t o t a l energy t o p r o j e c t t he f u t u r e course of real GNP. Figure 4 d e p i c t s
4

21.
25
20
45
10
1920 7948 1960 1980 2000 2020 YEAR
Figure 4. H i s t o r i c a l trend in the U.S. ratio of GNP/Et. The dashed line illustrates a new trend assuming a s t e p improvement beginning 1970,

22
t h e historical t rend i n the (GNB/Et) r a t i o , wi th GNP in cons tan t 1972
d o l l a r s , from 1920 to 1982, with a l i n e a r p r o j e c t i o n t o 2020. It is
f i r s t assumed t h a t t he (GW/Et) curve w i l l follow t h e long-term (low
s lope} trend. I f t h i s eventua tes , t h e real GNP growth f o r t he U.S.
(1980-1990) w i l l average OX p . a . As an a l t e r n a t i v e , i t is assumed t h a t
the (GNP/Et) r a t i o w i l l continue to i nc rease a t the h igher rate charac-
teristic of the shor te r - te rm t rend from 1970 t o 1982. This assumption
g ives an average real G;NP gsrswch for the 1980s of -1.3% p.a+ I th ink
t h i s p r o j e c t i o n is t he most conceptua l ly s a t i s f a c t o r y , f o r the s h o r t
term, of t h e dozens t h a t have been published, The probable degree of
p a r t i t i o n i n g of t h i s P e l a t i v e l y low economhc growth ra te between the
c iv- l l ian and m i l i t a r y s e c t o r s is perhaps a matter b e t t e r addressed i n a
s e p a r a t e study, as are the many a s soc ia t ed implhcations f o r employment
r a t e s a
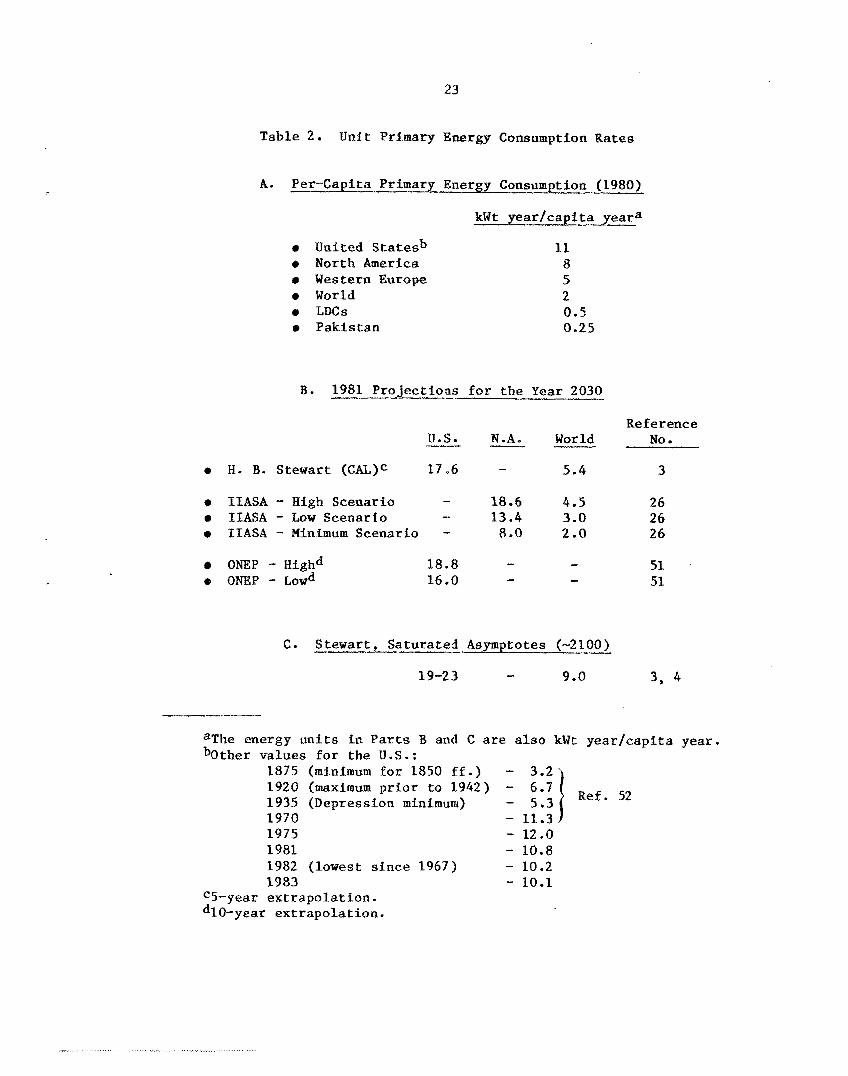
We conclude with Table 2 , which compares per-capita primary energy
consumption rates i n 1988 ( p a r t A) with var ious p ro jec t ions made i n 1981
f o r the year 2030 (part B). Considering the t i m e i n t e r v a l involved, t h e
p r o j e c t i o n s are i n reasonable agreement.
7. s ION
The p rov i s iona l g loba l energy p r o j e c t i o n f o r the coming decade is
one of low growth rates accompanied by economic adjustments and d i f -
f i c u l t i e s and f a l l i n g energy p r i ces . The p r o j e c t i o n f o r t he f i r s t
q u a r t e r of t h e twenty- f i r s t century r e f l e c t s a c y c l i c r e v e r s a l t o
sha rp ly increased economic a c t i v i t y , energy demands, f u e l p r i c e s , and
p res su re on the technologica l s e c t o r t o provide an adequate energy
Supply.
23
Table 2. Unit Primary Energy Consumption Rates
A. Per-Capita Primary Energy Consumption (1980)
e United S t a t e s b
e Western Europe 0 World e LDCs 0 Pakis tan
North AmerPca
kWt yea r / eap i t a yea+
11 8 5 2 0 . 5 0.25
B. 1981 P ro jec t ions f o r the Year 2030
- W.A. World U.S. - 5.4 0 H. B. Stewart (CAL)C 17.6 -
18.6 4.5 13.4 3.0 8.0 2 .o
e IIASA - High Scenario __ 0 IIASA - Low Scenario -- 0 IIASA - Minimum Scenario -
- ONEP - Highd 18.8 - 0 ONEP - Lowd 16.0 - -
Ref e renc e NO
3
26 26 26
51 51
C. S tewar t , Sa tura ted Asymptotes (-2100)
19-2 3 - 9.0 3, 4
aThe energy u n i t s i n P a r t s B and C are a l s o kWt yea r / cap i t a year . values f o r the U.S.:
1875 (minimum f o r 1850 f f . ) - 1920 (maximum p r i o r t o 1942) - 6.7 1935 (Depression minimum) - 5.3 '02/ Ref. 52
1970 - 11.3 1975 - 12.0 1981 - 10.8 1982 (lowest s ince 1967) - 10.2 1383 - 10.1
C5-year ex t r apo la t ion . dlo-year ex t r apo la t ion .


25
1. H. R. Linden, "The Role of SNG in the U . S . Energy Balance," SNG Symposium 1 (March 19731, SNG from Hydrocarbon Liquids, IGT, May 1973.
2. W. R. Gambill, Report on ETGRs and National Needs, OfWL/GCR-83/18, September 1983.
3. H a B. Stewart, Transitional Energy Policy, 1980-2030, Alternative -- Nuclear Technologies, Pergarnor1 Press, 11981.
4 . 8. B. Stewart, Technology Innovation and BtwEaess Growth, Nutevco, 1982.
-
5. H. B. Stewart, "Energy Growth Projections and the Role of the HTGR," paper presented at GCRA Utility/User Conference on the HTGR, San Diego, September 30 - October 1, 1980.
6 . H. B. Stewart, "Economic Growth as Affected by Technologies," paper presented at GGRA Utility/User Conference on the HTGR, Sari Diego, September 10-11, 1981.
7. GI Mensch, Stalemate in Technology, Ballinger Publishing Co., 1979.
8 . C, Marehetti, "'Glimpses into the Pre-Programmed Society: On Energy, Invention, Innovation, and Other Things," IIASA paper, 1980.
9. C. Marchetti, "Society as a Learning System: Discovery, Invention, and Innovation Cycles Revisited," IIASA paper, October 1980; I IASA Publication RR-81-29, November 1981.
10. "A Technology JAg That May Stifle Growth," Business Week, pp. 126- 130, October 111, 1982.
11. C. Freeman, et al., Unemployment and Technical Innovation, A Study of Long Waves and Economic Development, Greenwood Press, 1982.
12. C. Freeman (Ed.), "Technical Innovation and Long Waves in World Economic Development," a collection of thirteen papers, Futures, August 1981 and October 1981.
13. PI. Hyde, "Prospects and Pitfalls: The Petrochemical Outlook," Industrial Chemical News, pp. 1, 26-27, Dec. 1982.
14 . L. A. Girifalco, "The Dynamics of Technological Change," The Wharton Magazine, pp. 31-37, Fall 1982.
15. G. F. Ray, "Energy and the Long Cycles," Energy Economics, pp. 3-8, January 1983.
26
16 rn
17.
18.
19.
20.
21.
22.
23.
2 4 .
25.
26.
27.
28.
29.
30.
31.
3 2 .
33.
ID. DPckson, "Technology and Cycles of Boom and Bust," Science, pp. 833-936, February 25, 1983,
J. Papamareos, 'XsndratPef f Backed by ZIASA, '' Power p . 10, May 1983.
C. Karchetti, "Recession: Ten More Years to Go?", Options, 1983/1, IIASA (Laxenburg, Austria), A p r i l 1983.
G. Bruckmann, "The Long-Wave Debate, a' Options, 1-1 1983/2 IIASA (Laxenburg, Austrla), July 1983.
Anon., -- The Energy ..I Daily, Energy Data Bank Supplement, April 13, 1984.
F. C. Olds, ""Load Forecasting on What Basis?", Power Engineering, - pp. 18 and 22, October 1982 e
F . C. Olds, "Missing: Stronger U.S . Influence on the Fuel Cycle," Power Engineering, p. 16, October 1983.
N. 2. Alcock, "Cyclical Analysis O E Global Economy," Cycles, pp. 77-87, June 1977.
A. Rogers, "Migration and Settlement, '' Options, 1983/1, IIASA (Laxenburg, Austria), April 2983.
---
W. Sassin (ed. by D. Delves), "Fueling Europe in the Future," Options, 1983/1, IXASA (Laxenburg, Austria), April 1983.
A. KcDonald, Energy in a Finite World, Executive Summary, Executive Report 4 , IIASA (Laxenburg, Austria), May 1981.
A. M. Khan and A. R&lzl, "Evslutfon of Future Energy Demands Till 2030 In Different World Regions: An Assessment Hade For The Two I I A S A Scenarios " IIASA RR-82-14, April 1982.
__I The Energy Daily, p. 2, September 2, 1983.
"Energy Demand, Supply, and Needed Development Resources Are Assessed,*' _L__".- O i l ti Gas Journal, pp. 71-73, Sepe. 5 , 1983.
___.-_ The Energy Daill, p. 2, September 6 , 1983.
-..----9 SynFue1.s p. 3 , September 2, 1983.
SynPis:-ll, p. 5, September 30, 1983.
3 . F. Gustaferro, U . S . Energy for the Rest of the Century _II-- - 1983 --..-* Edition Off ice of-Competitive Assessment U.S. Dept. of Commerce, Rept. DOC/OEA/OCA/-5, July 2, 1983.

27
3 4 .
35.
36.
37.
38.
39.
40.
4 1 .
4 2 .
4 3 .
4 4 .
4 5 .
4 6 .
4 7 .
48.
4 9 .
so.
51.
52
Nucleonics Week, p = 7 ,
"Long Decline in World Journal, pp. 57-60 and
December 1, 1983,
Oil Output Begins t o Level Off," Oil & Gas 237, September 12, 1983.
T. Scanlan, "Soviet O i l and Gas in the 1980s," pp. 140-B to 140-0, Hydrocarbon Processing, June 1983.
Y. M. Ibrahim, "A New Game," The Wall Street Journal, p. 1, September 14, 1983.
Chemical Engineering, p. 12, September 19, 1983.
C. H. Vervalin ( E d . ) "HP Impart," Hydrocarbon Processing, pp. 11-25, October 1983.
R. Renrirez, "Oil: pp. 14-17, October 31, 1983.
Which Way W i l l It Go?," Chemical Engineering,
Oil and Gas Journal, pp. 52-53, September 26, 1983.
The Energy Daily, p. 3, October 5 , 1983.
The Energy Daily, p. 3, October 19, 1983.
SynFuels, p. 7, September 30, 1983.
Chemical Engineering, p. 39, October 3, 1983.
The Energy Daily, p. 1, October 31, 1983.
W. Leontief, "Technological Advance, Economic Growth, and the Distribution of Income," Population and Development Review, pp. 403-410, September 1983.
8 . Nussbaum, The World After O i l l : Wealth, Simon and Schuster, N.YO, 1983.
The Shifting Axis of Power and
P. D. HoItberg, et al., 1983 GKI. Baseline Projection of U.S. Energy Supply and Demand, 1982-2000, Gas Research Institute, Chicago, Ill., October 1983.
Wall Street Journal, p. 51, November 17, 1983.
R. S . Livingston, et al., "Toward a Desirable Energy Future," ORNL/ PPA-81/6, July 1981; also A Deslrable Energy Future: A National Perspective, The Franklin Institute Press, 1982.
H. C. Hottel a n d J. B. Howard, New E n e r g y Technology - Some Facts and Assessments, pp. 6-8, The MIT Press, 1971.

28
53 .I
54.
5 5 "
56.
5 7 .
58.
5 9 .
60.
61.
62.
63.
64.
L------- H drocarbon Processing, pp. 19-21, February, 2984.
Nucleonics Week, p. 11, January 12, 1984.
The Energy Daily, p. 3 , March 30 , 1984.
Nucleonics Week, p. 4, Apri l 5 , 1984.
The Energy Daily, p. 3, January 6 , 1984.
Nucleonics Week, p. 3, February 2, 1984.
Nucleonics .-_. Week, p. 10, March 15, 1984.
-- Forbes, pp. 173-174, January 2 , 1984.
The E n e r a .- .- Daily, p . 3 , January 4, 1984.
The Energy Daily, p. 3 , April 18, 1984.
Business Week, p. 12 , July 2, 1984.
_l____l S t a t e of the World II_- 1984, Worldwatch I n s t i t u t e , Norton & Co., W.Y., 1984.
-____-
29
INTERNAL DISTRIBUTION
1. 2. 3. 4 . 5.
6-10. 11. 12. 13. 14. 15. 16. 17. 18. 19. 20.
21-22. 23. 2 4 .
25-26. 27.
T. D. Anderson D. E. Bartine C. W. Forsberg
W. Fulkerson W. R. Gambill P. R. Kasten A. M. Perry
R . Salmon G. Samuels R. A. Strehlow V. C. A. Vaughen
R. G. Wymer A* Zucker Central Research Library Document Reference Section Laboratory Records (RC) Laboratory Records Dept. ORM, Patent Secrion
E. C * FOX
J. 617. Roddy
C- D. West
EXTERNAL DISTRIBUTION
2 0 . Office of Assistant Manager for Energy Research and Development, DOE-ORO, P. 0. Box E, Oak Ridge, TN 37831.
Technical Information Center, Oak Ridge, TN 37830. 29-30.