world development report 2019 - youth economic opportunities · survival. children who don’t...
TRANSCRIPT

WORLD DEVELOPMENT REPORT 2019
THE CHANGING NATURE OF WORK
Federica Saliola
2018 Global Youth Economic Opportunities SummitSeptember 25, 2018

An Open Source and Transparent Process
▪Weekly updated drafts:http://www.worldbank.org/en/publication/wdr2019
▪ 350,000 downloads of the draft as of September 19, 2018
▪ The Report will be published in October 2018.
1
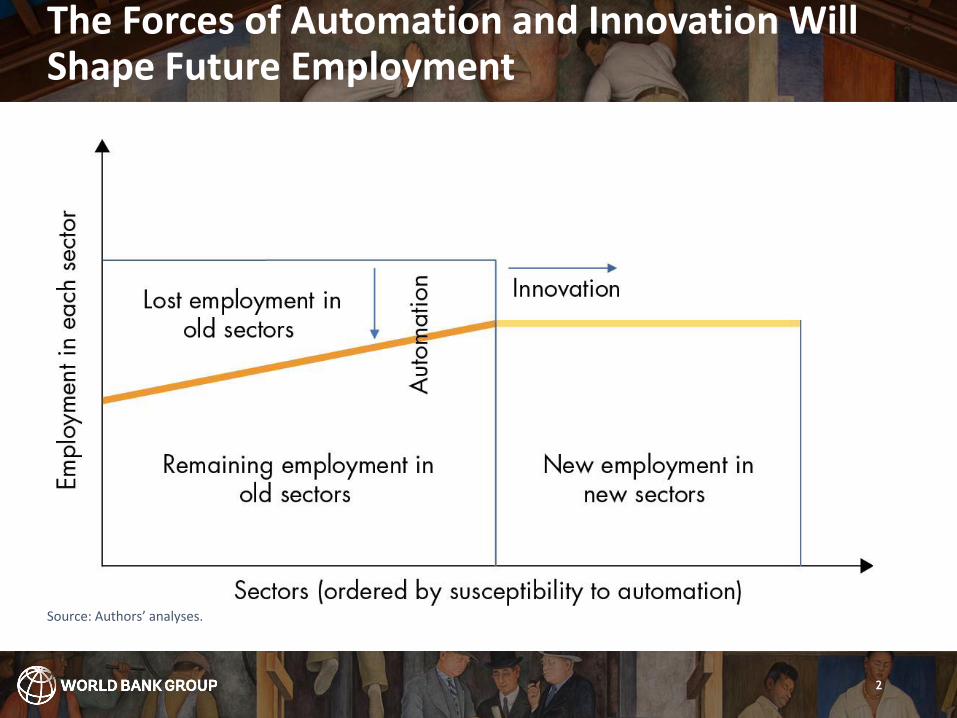
The Forces of Automation and Innovation Will Shape Future Employment
2
Source: Authors’ analyses.

What is Changing in the World of Work?
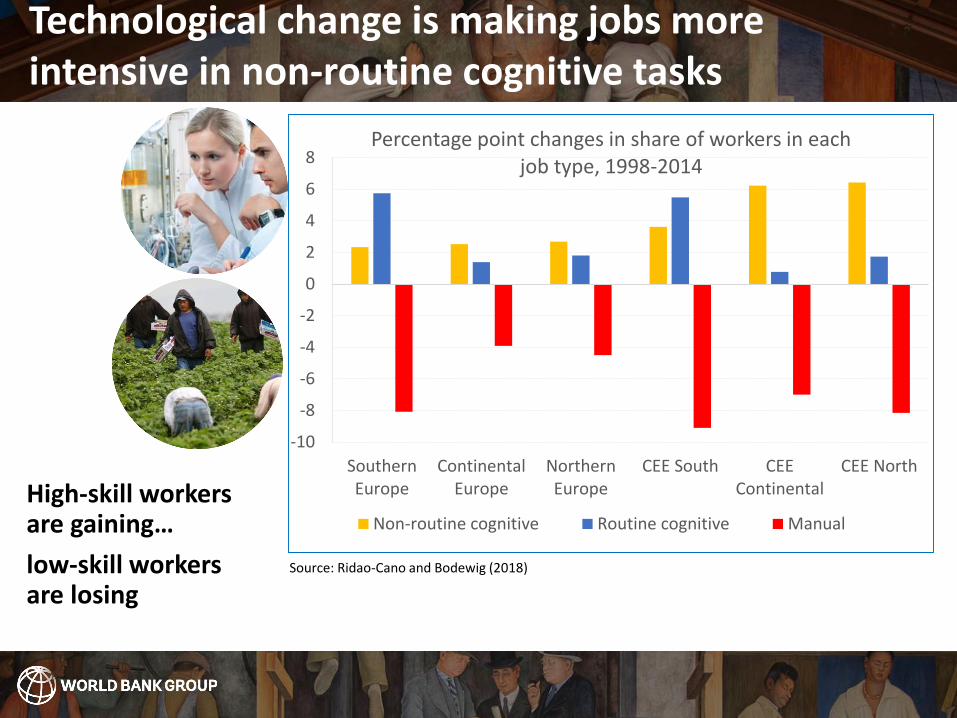
High-skill workers are gaining…
low-skill workers are losing
-10
-8
-6
-4
-2
0
2
4
6
8
SouthernEurope
ContinentalEurope
NorthernEurope
CEE South CEEContinental
CEE North
Percentage point changes in share of workers in each job type, 1998-2014
Non-routine cognitive Routine cognitive Manual
Source: Ridao-Cano and Bodewig (2018)
Technological change is making jobs more intensive in non-routine cognitive tasks

United States and Canada:4,500 Genetic Counselors
• Master’s degree in Genetics• Relevant certification• Empathy• Critical-thinking skills• Decision-making• Communicate complex
findings
India:4 million App Developers
• Degree in Computer Science• Experience in programming languages
and platforms• Keep up-to-date with new technologies• Work effectively as a team member• Analytical, communication and
interpersonal skills
China:100,000 Data Labelers
• Proficient in internet use, data processing, Microsoft suites
• Attention to detail• Willing to learn• Teamwork
Advanced and Socioemotional Skills are Becoming more Important
Source: Ormond et al. 2018; ifeng.com; Business Insider Intelligence, 2016; career websites.

In many developing countries, share of employment in high-skill occupations has increased
6
-40
-30
-20
-10
0
10
20
30Percentage Point
Changes in Employment Share by Occupation Skill Level(circa 2004 - circa 2014)
High-skill occupation Middle-skill occupation Low-skill occupation
High-skill occupations grew, but middle-
and low-skill fell
High- and middle-skill occupations grew, but
low-skill fell
High-skill and low-skill occupations grew, but
middle-skill fell

Recent Technological Advances Accelerate Firm Growth
7
Source: Authors’ analyses based on Walmart Annual Reports, Statista.com, NetEase.com

Technology Is Disrupting the Nature of Firms Posing New Policy Challenges
8
Source: Author’s calculation, based on data from Safaricom, KCB Bank Group, AirBnb, Marriot International Inc., Financial Times.
New Superstar Firms: digital platforms operating globally, existing in the cloud

Technology is changing how people work and the terms on which they work
▪ LESS standard long-term contract
▪MORE short-term work often via online work platforms
▪BUT the numbers are still small: total freelancer population is 84 million, or less than 3 percent of the global labor force
9

Irrespective of Technological Progress, Markets in Emerging Economies Remain Largely Informal
10
Source: Authors’ calculations using household and labor force survey data from the International Income Distribution Database.

What can Governments Do to Ensure Equitable
Access to Opportunities?
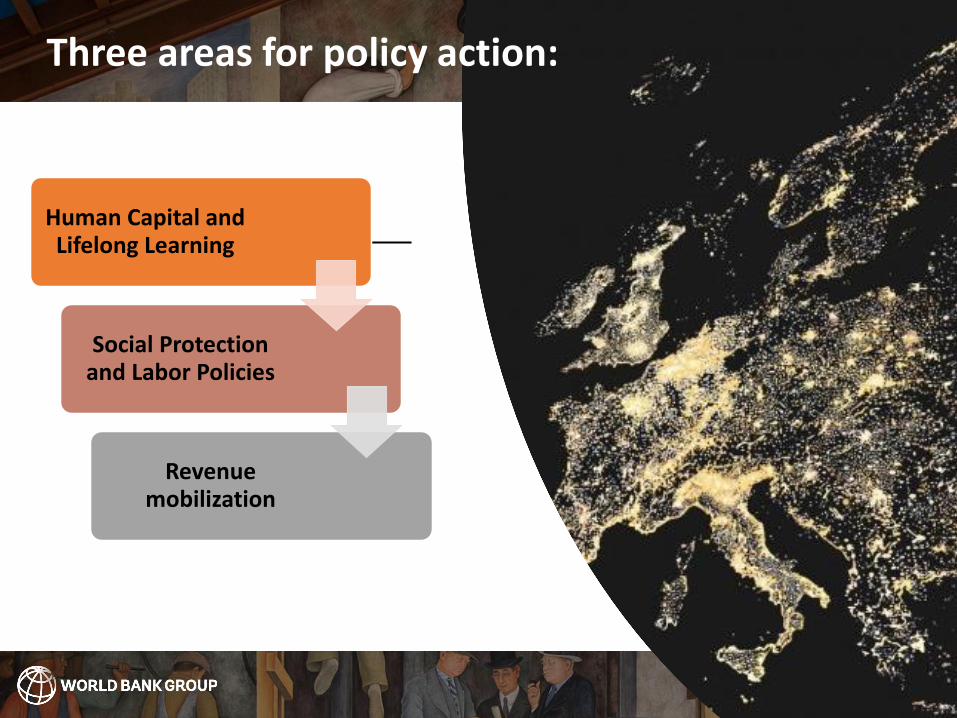
Human Capital and Lifelong Learning
Social Protection and Labor Policies
Revenue mobilization
Three areas for policy action:

Investing in Human Capital Is the Priority
13
Source: Authors’ calculations
WBG Human Capital Indexmeasures the human capital that a child born today can expect to attain by the end of secondary school.

14
Source: World Bank staff calculations

Skills Re-adjustment are a matter of lifelong learning
15

Early Childhood Development Lays the Foundation
16
Source: Authors’ calculations

Adult learning programs are often badly designed
17
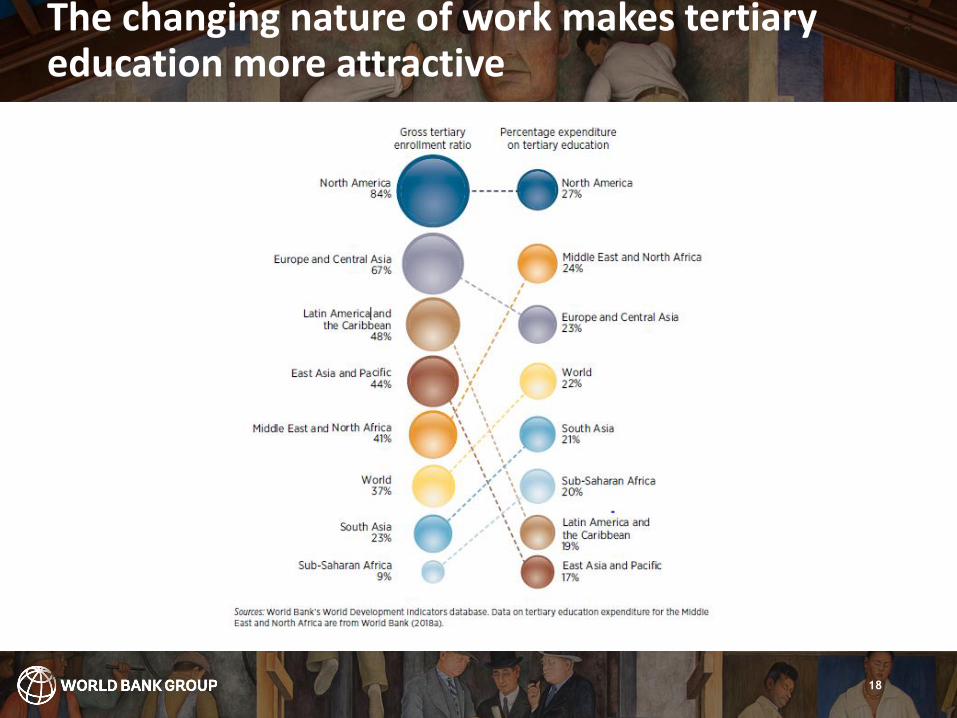
The changing nature of work makes tertiary education more attractive
18

Stronger Social Protection: Protect People, Not Jobs
19
Source: 2019 WDR team.
• Social Assistance (guaranteed social minimum)
• Social Insurance
• Labor Institutions

Social Inclusion Is Costly
20
Source: Authors’ calculations based on World Bank World Development Indicators, World Bank PovcalNet, and United Nations World Population Prospects.
Simulated cost of UBI for closing the poverty gap by country income group (% of GDP)

Little Expansion of Social Insurance Coverage over Time
21
Source: Authors’ calculations based on World Bank pension database and World Development Indicators.
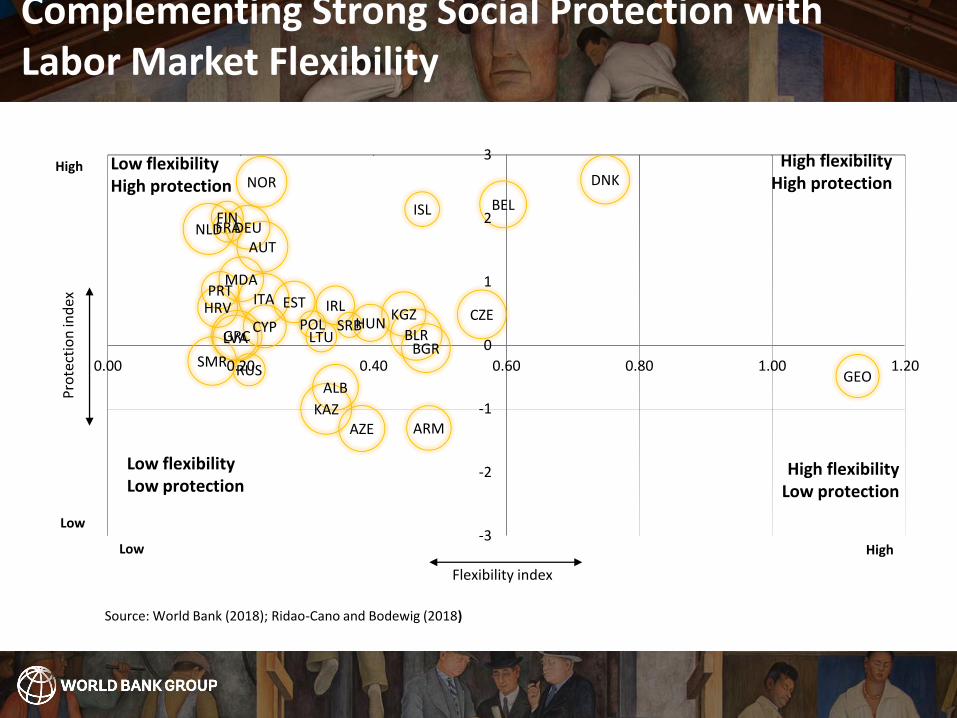
Aspiring to flexicurity…
ALB
ARM
AUT
AZE
BLR
BEL
BGR
HRVCYP
CZE
DNK
EST
FINFRA
GEO
DEU
GRCHUN
ISL
IRLITA
KAZ
KGZ
LVA LTU
MDA
NLD
NOR
POL
PRT
RUSSMR
SRB
-3
-2
-1
0
1
2
3
0.00 0.20 0.40 0.60 0.80 1.00 1.20
Pro
tect
ion
ind
ex
Flexibility index
Low
Low
High
High Low flexibilityHigh protection
High flexibilityLow protection
High flexibilityHigh protection
Low flexibilityLow protection
Source: World Bank (2018); Ridao-Cano and Bodewig (2018)
Complementing Strong Social Protection with Labor Market Flexibility

Costing a New Social Contract
23
Source: Authors’ calculations
Low-income countries would pay more than lower-middle income and upper-middle-income countries for selected elements of a renewed social contract.

Tax Revenues Have to Rise, Especially in Developing Economies
24
Source: Authors’ calculations based on International Centre for Tax and Development (ICTD) and UNU-WIDER Government Revenue Dataset2017.

25
http://www.worldbank.org/en/publication/wdr2019
APPENDIX
26

HUMAN CAPITAL INDEX: CALCULATION
27
SURVIVAL
Children who don’t survive don’t grow up
to become future workers
SCHOOL
Contribution of quality-
adjusted years of school to
productivity of future workers
HEALTH
Contribution of health
(average of adult survival
rate and stunting) to
productivity of future workers
Productivity of a future
worker (relative to
benchmark of complete
education and full health)
X X =

Children from poor families are much less
likely to have access to ECD programs
28
Proportion of children aged 3-4 years in early
education by wealth quintile of selected countries
Source: Black et al. 2017, based on data obtained from UNICEF Multiple Indicator Cluster Survey

Definition
29