world bank document -...
TRANSCRIPT

SPENDMORE,RIGHT &BETTER
INDONESIAHEALTH FINANCING SYSTEM ASSESSMENTP
ublic
Dis
clos
ure
Aut
horiz
edP
ublic
Dis
clos
ure
Aut
horiz
edP
ublic
Dis
clos
ure
Aut
horiz
edP
ublic
Dis
clos
ure
Aut
horiz
ed


INDONESIAHEALTH FINANCING SYSTEM ASSESSMENT
SPENDMORE,RIGHT &BETTER
October 28, 2016


CONTENTS
ACKNOWLEDGMENTS vABBREVIATIONS AND ACRONYMS viEXECUTIVE SUMMARY 1
section one. INTRODUCTION 9
section two. BACKGROUND 15Economic Growth, Poverty and Shared Prosperity 17Macrofiscal Context 23
section three. HEALTH AND UHC OUTCOMES 29Demographics and Population Health Outcomes 31Universal Health Coverage 38
section four. HEALTH SYSTEM 43Health Care Organization and Delivery 45Human Resources 48
section five. HEALTH FINANCING 55Government Budgetary Expenditure on Health 61Social Health Insurance 66Out-of-Pocket Spending for Health 74External Financing for Health 80Efficiency 84
section six. A CASE STUDY ON IMMUNIZATION 89Outcomes and Determinants 93Service Delivery 96Financing and JKN 100Introduction of New Vaccines 104
section seven. DISCUSSION AND POLICY OPTIONS 107Policy Options 113
APPENDIXES 117


v
ACKNOWLEDGMENTSThis report was prepared by a team led by Ajay Tandon (Lead Economist, GHN02) and comprising Eko Pambudi (Research Analyst, GHN02), Pandu Harimurti (Senior Health Specialist, GHN02), Emiko Masaki (Senior Economist, GHN05), Ali Subandoro (Health Specialist, GHN02), Puti Marzoeki (Senior Health Specialist, GHN02), Vikram Rajan (Senior Health Specialist, GHN02), Darren W. Dorkin (Program Coordinator, GOKMU), Amit Chandra (Consultant), Chantelle Boudreaux (Consultant), Melissa Chew (Consultant), and Nugroho Suharno (Consultant). The team received tremendous support from Christina Sukmawati in completing this report
The team would like to thank colleagues from the MFM GP consisting of Yue Man Lee (Senior Economist, GMF10), David Elmaleh (YP, GMF01), Ruth Nikijuluw (Consultant, GMF10), Indira Maulani Hapsari (Consultant, GMF10), Yus Medina Pakpahan (Consultant, GMF10), and Dwi Endah Abriningrum (Research Analyst, GMF10) for data and preliminary analysis. Key contributions for the tobacco section were received from Patricio V. Marquez (Lead Health Specialist, GHN03) and Violeta Vulovic (Consultant, GMF10). The team is grateful for the guidance and resources provided by the Global Solution group on health financing team led by Christoph Kurowski (GSG Lead Health Financing, GHNDR), and consisting of Sarah Alkenbrack (GHN05), and Reem Hafez (GHN05).
The team also received substantive inputs during the decision review process from peer reviewers: John Leigh (DFAT), Mardiati Nadjib (University of Indonesia), Mirja Channa Sjoblom (Senior Economist, GHNGF), Aparnaa Somanathan (Senior Economist, GHN03), Kathleen A. Wimp (Senior Public Sector Specialist, GGO14), Cut Dian Agustina (Economist, GGO14), Robert Wrobel (Senior Social Development Specialist, GSU03), Karrie McLaughlin (Consultant, GSUID), Lluis Vinyals Torres and Phylida Travis (WHO SEARO), Tania
Cernuschi (WHO), Marisa Ricardo (UNICEF, Jakarta), Logan Brenzel (Bill and Melinda Gates Foundation), Mike McQuestion (SABIN), and Michael Borowitz, Gail Steckley, and Di Wu from the Global Fund team.
The team benefited from valuable insights provided by representatives of the Indonesian Government, including Donald Pardede (Senior Adviser to the Minister of Health), Kalsum Komaryani and Widiarti (Center for Health Financing and Insurance - P2JK), Pungkas B. Ali (Bappenas) and the Ministry of Finance, especially from Ronald Pasaribu and Nasrudin Djoko Sarono (Fiscal Policy Board).
During the report writing, the study results have been presented on several occasions and received useful feedback from the audience. The team is grateful to Prastuti Soewondo and her team from TNP2K, and Laksono Trisnantoro and his team from School of Medicine, Gadjah Mada University in Yogyakarta. In addition, Indonesian academics and researchers, Amila Megraini and Ratih Oktarina from University of Indonesia health research institutes contributed through data and useful comments. The report was edited by Chris Stewart. The cover design and layout was done by Indra Irnawan.
The team would also like to acknowledge that this work is funded by PFM MDTF supported by (Canada, European Union, and Switzerland). Additional financial support for this report was provided by the Australian Government’s Department of Foreign Affairs and Trade, and Gavi, The Vaccine Alliance.
Overall guidance was provided by Rodrigo A. Chaves (World Bank Indonesia Country Director, EACIF), Cristobal Ridao-Cano (Program Leader, EACIF), and Toomas Palu (Practice Manager, GHN02).
In memory of Elif Yavuz.

Abbreviations & Acronyms
AEFI Adverse Events Following Immunization
ANC Antenatal Care
APBD Anggaran Pendapatan dan Belanja Daerah (Local Government Budget)
APBN Anggaran Pendapatan dan Belanja Nasional (Central Government Budget)
APBN-P Anggaran Pendapatan dan Belanja Nasional Perubahan (Revised Central Government Budget)
Askes Asuransi Kesehatan (social health insurance scheme for civil servants, now merged into JKN)
ARV Antiretro Viral
Badan POM Badan Pengawasan Obat dan Makanan also referred to as BPOM (National Food and Drug Control Agency)
Bappenas Badan Perencanaan Pembangunan Nasional (National Development Planning Agency)
BCG vaccine Bacillus Calmette-Guérin vaccine
BEONC Basic Emergency Obstetric and Neonatal Care
BIAS Bulan Imunisasi Anak Sekolah (School Children Immunization Month)
BKKBN Badan Koordinasi Kependudukan dan Keluarga Berencana Nasional (National Population and Family Planning Coordination Board)
BPJS Badan Penyelenggara Jaminan Sosial (Social Security Management Agency)
BRICS Brazil, Russia, India, China, South Africa
CBR Crude Birth Rate
DAU Dana Alokasi Umum (General Allocation Fund)
DAK Dana Alokasi Khusus (Special Allocation Fund)
DALYs Disability-adjusted Life Years
DBH Dana Bagi Hasil (Revenue Sharing Fund)
Decon Deconcentration Funds
DJPK Direktorat Jenderal Perimbangan Keuangan (Directorate-General of Fiscal Balance)
DFAT Department of Foreign Affairs and Trade
DHO District Health Office
DOEN Daftar Obat Esensial Nasional (National Essential Drug List)
DPT Diphtheria Pertussis Tetanus
DQS Data Quality Self-assessment
EAP East Asia and Pacific
EPI Expanded Program for Immunization
EVM Effective Vaccine Management
FCTC Framework Convention on Tobacco Control
FORNAS Formularium Nasional (National Formularium)
Gavi Global Alliance for Vaccines and Immunization (Gavi, The Vaccine Alliance)
GDP Gross Domestic Product
GNI Gross National Income
GoI Government of Indonesia
GST General Sales Tax
HDI Human Development Index
HIV/AIDS Human Immunodeficiency Virus/Acquired Immune Deficiency Syndrome
HPV Human Papilloma Virus
HRH Human Resources for Health
IDA International Development Association
IDHS Indonesia Demographic and Health Survey
IDR Indonesian Rupiah
IFLS Indonesia Family Life Survey
IHME Institute of Health Metrics and Evaluation
IMF WEO International Monetary Fund World Economic Outlook
INA-CBG Indonesia Case-based Groups (diagnosis-related groups)
IPV Inactivated Polio Vaccine
ITAGI Indonesian Technical Advisory Group on Immunization

Jamkesmas Jaminan Kesehatan Masyarakat (Community Health Insurance Scheme; government-financed health coverage for poor and near poor, now merged into JKN)
Jamkesda Jaminan Kesehatan Daerah (local government-financed health coverage)
Jamsostek Jaminan Sosial Tenaga Kerja (social health insurance for private sector employees, now merged into JKN)
JE Japanese Encephalitis
JKN Jaminan Kesehatan Nasional (National Health Insurance)
LKPP Lembaga Kebijakan Pengadaan Barang/Jasa Pemerintah (Government Goods and Services Procurement Policy Institute)
MDG Millennium Development Goals
MDR-TB Multidrug-Resistant Tuberculosis
MDTF Multi-donor Trust Fund
MENPAN Kementerian Negara Pendayagunaan Aparatur Negara (Ministry of Administrative and Bureaucratic Reform)
MoH Ministry of Health
MMR Maternal Mortality Ratio
MR Measles Rubella
MSS Minimum Service Standards
MTEF Medium-term Expenditure Framework
NCD Noncommunicable Diseases
NGO Nongovernment Organization
NHA National Health Accounts
NIHRD National Institute for Health Research and Development
NIP National Immunization Program
NTP National Tuberculosis Program
OECD Organisation for Economic Co-operation and Development
OECD CRS OECD Creditor Reporting System
OOP Out-of-pocket
OPV Oral Polio Vaccine
PAD Pendapatan Asli Daerah (Local Government Own-source Revenue)
PBI Penerima Bantuan Iuran (Recipient of government paid preimum)
PEFA Public Expenditure and Financial Accountability
Pentavalent Diphtheria Pertussis Tetanus - Hepatitis B - Haemophilus Influenzae Type B vaccine
PER Public Expenditure Review
PHO Provincial Health Office
PMK Peraturan Menteri Keuangan (Ministry of Finance Regulation)
PNS Pegawai Negeri Sipil (Civil Servant)
PPP Purchasing Power Parity
PTT Pegawai Tidak Tetap (Temporary/Contracted Civil Servant)
Puskesmas Pusat Kesehatan Masyarakat (Community Health Center)
Poskesdes Pos Kesehatan Desa (Village Health Post)
Posyandu Pos Pelayanan Terpadu (Integrated Health Services Post)
Polindes Pondok Bersalin Desa (Village Maternity Clinic)
Rifaskes Riset Fasilitas Kesehatan (Health Facility Research)
RSUD Rumah Sakit Umum Daerah (Local General Hospital)
SARA Service Availability and Readiness Assessment
SDG Sustainable Development Goals
SIKD Sistem Informasi Keuangan Daerah (Subnational Financing Information System)
SJSN Sistem Jaminan Sosial Nasional (National Social Security System)
Susenas Survei Sosial Ekonomi Nasional (National Socioeconomic Survey)
TB Tuberculosis
THE Total Health Expenditure
TNP2K Tim Nasional Percepatan Penanggulangan Kemiskinan (National Team for the Acceleration of Poverty Reduction)
TP Tugas Pembantuan (Co-Administered Tasks)
UHC Universal Health Coverage
UN United Nations
UNICEF United Nations Children’s Fund
USAID United States Agency for International Development
VAT Value-added Tax
VPD Vaccine-preventable Disease
WB World Bank
WEO World Economic Outlook
WHO World Health Organization

viii
HEALTH FINANCING SYSTEM ASSESSMENTspend more . spend right . spend better

EXECUTIVE SUMMARY
1
EXECUTIVE SUMMARY

HEALTH FINANCING SYSTEM ASSESSMENTspend more . spend right . spend better
2
This report assesses Indonesia’s health financing system. As an intrinsic and necessary element of universal health coverage (UHC), health financing is not only about assessing the sufficiency of resources, but also about how equitably and efficiently resources are raised, pooled, and allocated to make progress towards UHC.
Indonesia has made key strides towards attaining UHC in terms of population coverage. In 2015, nearly 160 million individuals, or more than 60 percent of the population, have been covered by Jaminan Kesehatan Nasional, or JKN, one of the largest single-payer social health insurance (SHI) programs in the world; by 2019, everyone in Indonesia is expected to have coverage under JKN. Nevertheless, Indonesia faces key challenges in order to meet its 2019 population coverage target as well as on other, arguably more important, dimensions of UHC, including service coverage and financial protection.
Health financing is not only about assessing the sufficiency of resources, but also about how resources are equitably and efficiently raised, pooled, and allocated to make progress towards UHC.
Indonesians have undoubtedly become healthier in recent decades and important progress has been made on key health indicators. Life expectancy at birth has steadily increased to 69 years in 2014, up from 63 years in 1990 and only 49 years in 1960. The under-five mortality rate has declined from 222 per 1,000 live births in 1960 to 85 in 1990 and 27 in 2015; Infant mortality has declined six-fold since 1960, down to 23 per 1,000 live births in 2015.
Nevertheless, key challenges remain, especially with regard to maternal health, malnutrition, as well as persistent inequalities in health outcomes. The maternal mortality ratio (MMR) remains high at 126/100,000 live births, far above the 2030 SDG target of less than 70 per 100,000 live births. At the same time, 37 percent of under-five children are stunted, while 12 percent are wasted. Large regional and income-related inequalities in health outcomes remain across the country. Albeit still relatively low,

Source World Development Indicators databaseNote y-scales logged
Under-five mortality (left axis)
Infant mortality (left axis)
Life expectancy (right axis)
1960 1970 1980 1990 2000 2015
50
150
25
100
250
50
60
45
55
65
70
75Mortalityrate per
1,000live
births
Years
2010
EXECUTIVE SUMMARY
3
the prevalence of HIV and AIDS is growing; and pockets of the country continue to face challenges of communicable diseases such as malaria and TB. New challenges are rapidly emerging with an ageing population and a rising prevalence of chronic diseases which the health system is ill-equipped to address. A rapid increase in the share of the population ages 65 and above is expected to occur beginning around 2015. Almost 70 percent of the disease burden is now due to noncommunicable diseases (NCDs) and this is expected to grow rapidly in coming years as Indonesia completes its epidemiological transition. Supply-side readiness is a key challenge, especially in the eastern part of the country. Managing, regulating, and integrating a growing private sector under the UHC umbrella is another key issue.
Indonesia is currently classified as a lower-middle-income country with GNI per capita of US$3,238 (US$10,680 in PPP terms) in 2015. Indonesia first transitioned from low-income to lower-middle-income status in 1992. The country was, however, reclassified as a low-income country in 1998 as a result of the 1997-98 Asian financial crisis, but regained its lower-middle-income status in 2003. Indonesia’s relatively strong economic growth (5.5 percent per year since 2000) has been accompanied by a sustained decline in poverty rates: about 46 percent and 16 percent of the
population lived on $3.1-a-day and $1.9-a-day (respectively) in 2010, down from 82 percent and 48 percent (respectively) in 1999.
Despite impressive gains in poverty reduction, the level of informality in the labor market has remained persistently high in Indonesia and income inequality is raising rapidly. The bottom 40 percent of the population saw an average growth in real per capita consumption of only 1-2 percent per year over the period 2003-10; by way of contrast, the top 20 percent increased their consumption by 5-6 percent per year. This has resulted in a dramatic rise in income inequality, one of the largest increases in the East Asia and Pacific (EAP) region. Over 60 percent of those employed continue to be classified as nonsalaried workers. Given declining poverty rates, this indicates a growing share of the nonpoor informal sector in the population.
Health services in Indonesia are delivered through both public and private providers. The public sector generally takes a dominant role in rural areas and for secondary levels of care, but this is not necessarily the case across all health services. Private provision has been increasing rapidly in recent years, including for primary care. The country has 34 provinces, 514 districts/cities, and some 72,000 villages. Public provision is decentralized to the district/city level. As a country with over 6,000 inhabited islands, geography poses a significant obstacle to service delivery.

HEALTH FINANCING SYSTEM ASSESSMENTspend more . spend right . spend better
4
From a health financing perspective, the relatively low quantum of overall health spending in Indonesia is one of the key bottlenecks toward achieving UHC. This is a result of a combination of factors, including relatively low overall government revenue generation, low prioritization for health, high levels of informality, and low utilization rates. Global and regional benchmarks indicate that Indonesia’s health system remains significantly under resourced. At 3.1 percent of GDP, Indonesia’s total health expenditure (THE) levels are among the lowest in the world, and are particularly low when benchmarked against other lower-middle-income countries and across the EAP region.
Although Indonesia is following an SHI model for attaining UHC in principle, in reality, the health system is financed through a combination of sources and disparate flows. The four primary sources of health financing in the country include OOP spending by households, government budgetary supply-side health spending (both at the central and subnational levels), SHI, and external financing. Despite increases in public financing in recent years, the fundamental structure of health financing has remained largely unchanged in Indonesia because of concomitant increases in OOP spending for health.
OOP spending by households–a generally inefficient and inequitable modality–remains the largest source of financing for health. Although there is evidence that OOP spending on health is relatively progressive in Indonesia as the rich paid a higher share of total expenditures as OOP spending, the high levels of OOP spending deter utilization by the poor. Moreover, high levels of OOP spending reduce the potential
redistributive capacity of the health-financing system and are, therefore, undesirable. Although a relatively small share (1 percent) of households face OOP health expenditures that are deemed “catastrophic” (that is, in excess of 25 percent of total household expenditure), 8 percent of all households (an estimated 7 million households) are either impoverished or pushed deeper into poverty as a result of high OOP spending using a national poverty line.
The OOP spending share of THE has remained in excess of 45 percent since 1995. Despite the increasing population coverage by SHI from 15 percent to 60 percent, OOP spending on health is unlikely to decline unless there is significant expansion in JKN coverage, an improvement in supply-side readiness at health facilities, and increased inclusion of branded drugs in the JKN benefits package. Use of branded pharmaceuticals that are not covered by the JKN package is one of the key drivers of OOP spending even among those covered.
Government budgetary supply-side spending is the second largest component of health financing in Indonesia. Despite recent increases, the overall level of public financing remains very low at 1.5 percent of GDP, one of the lowest in the world. This is partly a result of low revenue generation capacity of the country: Indonesia’s revenue share of GDP was only 15 percent in 2015, far lower than the average for lower-middle-income countries (28 percent) and less than one-half the average for the EAP region (38 percent). Health is accorded a generally low priority as reflected in the small share of the national budget. Health’s share of the central government budget has remained less than 3 percent and only in 2016 did it increase to 5 percent. The health share of total government budget at 4.7 percent is low in comparison to several countries in the region, including the Philippines, China and Thailand.
SHI is the third largest source of health financing–although JKN covers more than 60 percent of the population, it accounts for 13 percent of THE. Almost one-half of JKN expenditure is currently sourced from the central government in the form of premium payments for the poor/near-poor and significant cofinancing from government budgetary expenditure remains at public facilities. Although Indonesia has successfully instituted a single-payer SHI system, contribution collection among nonpoor informal
From a health financing perspective, the relatively low quantum of overall health spending in Indonesia is one of the key bottlenecks toward achieving UHC.

EXECUTIVE SUMMARY
5
Cross-cutting Issues affecting the overall performance of Indonesia’s health system.
workers has been difficult (under current regulations, this group must contribute in order to enroll in JKN), thus JKN coverage for this population group has been limited. Few nonpoor informal participants have enrolled to date and those who have are adversely selected, undermining equity, and threatening financial sustainability of JKN. Provider payment mechanisms under JKN are “passive” in that there are no explicit linkages with outputs/outcomes. JKN offers comprehensive benefits, yet JKN’s current reimbursements do not cover the full cost of care.
Although external sources, the fourth largest source of financing, account for only 1 percent of THE, they remain an important source of financing and technical assistance for immunization, HIV, TB, and malaria programs. In 2015, MOH estimated that the external share of the total program spending was high as 60 percent for tuberculosis (TB) , through reduced from around 70 percent in 2014; it is lower for immunization programs at around 10-15 percent, with an increasing trend with the introduction of new vaccines financed by Gavi. The smooth transition of externally financed health programs, such as HIV, TB, malaria and immunization, is crucial to that gains made in recent years are sustained.
The integration of service delivery of externally financed and vertically managed programs into JKN in a decentralized setting has become one of the key policy discussions to ensure the sustainability of these programs. Integrating these programs into the health system, including JKN, will entail more than addressing actuarial matters related to which services should be included. It needs to be discussed within the overall health system context and take into account all the health system pillars. This includes: (i) preparedness to provide included services; (ii) better responsiveness and sensitivity to the needs of specific target population groups; and (iii) provider-payment mechanisms that incentivize providers to reach out to target beneficiaries and retain them in the treatment cascade.
As Indonesia’s health system develops, the key is to improve efficiency of its system and to ensure that health expenditures lead to the greatest improvement in health outcomes. Health expenditures are largely focused on curative and rehabilitative care. Hospital accounts for the largest share of THE, followed by providers of ambulatory care. More than 65 percent of JKN expenditures were for hospital-based inpatient
care (50 percent) and outpatient care (15 percent). About 20 percent of the expenditure was on capitated primary care at puskesmas and empaneled private clinics. A very small amount–less than 1 percent–went towards preventive and promotive activities.
Complex and fragmented interfiscal government transfers in a decentralized system resulted in wide variations of health spending across districts. While the bulk of government health expenditure occurs at the district level, the central government remains the dominant source of revenues. In Indonesia’s decentralized context, interfiscal government transfer is significant, yet the system of intergovernmental transfers to districts is complex and fragmented: some earmarked for inputs while, for the remainder, district governments have discretion over how budgets are allocated and the amount to be spent on health.
The central government does not have mechanisms to incentivize generation of outputs/outcomes from use of resources, nor does it have clear policy levers to influence the allocation of resources at the subnational level. There are wide variations in district-level health expenditures although, in aggregate, districts do spend 10 percent of their budget on health (as required by law). Some districts view health as a revenue-generating sector and have targets for resources generated by user fees at public health facilities; these are pooled with other sources of revenues and allocated across sectors.
There is a fundamental disconnect between the level and geographic distribution of public financing for health and JKN benefits offered, leading to inequities in the incidence of social health expenditure and to implicit rationing. Important challenges remain with regard to mistargeting

HEALTH FINANCING SYSTEM ASSESSMENTspend more . spend right . spend better
6
of the poor and nonpoor, covering nonpoor informal workers and, more generally, the financial sustainability of the JKN program.
The integration of service delivery of externally financed and vertically managed programs into JKN in a decentralized setting has become one of the key policy discussions to ensure the sustainability of these programs. Integrating these programs into the health system, including JKN, will entail more than addressing actuarial matters related to which services should be included. It needs to be discussed within the overall health system context and take into account all the health system pillars. This includes: (i) preparedness to provide included services; (ii) better responsiveness and sensitivity to the needs of specific target population groups; and (iii) provider-payment mechanisms that incentivize providers to reach out to target beneficiaries and retain them in the treatment cascade.
In moving forward, Indonesia can seek several opportunities that exist for improving the efficiency, effectiveness and sustainability of the health system. From a health-financing perspective, some key policy recommendations include: (i) making the benefit package explicit; (ii) improving supply-side readiness; (iii) strengthening primary care; (iv) reducing OOP payments by expanding and deepening coverage; (vi) enhancing the effectiveness of intergovernmental fiscal transfers; (vii) strengthening JKN linkages with externally financed health programs; and (viii) enhancing cross-subsidization from prepaid/pooled health resources.Explicitly defining the benefit package is crucial
to ensure the adequacy of service and financing. In the absence of an explicitly defined benefit package, providers refer to various national clinical guidelines. As a result, there are variations in standards of practice and case management that ultimately results in inefficiency of service delivery. Furthermore, the JKN benefits package needs to be adjusted so that it is commensurate with current public financing resources, economic growth and projected macrofiscal trajectory, and service delivery capacity. Service- readiness, and the capacity of health facilities to provide interventions in key program areas remains major challenge in deliver services under the JKN benefits package. Some 30 percent of puskesmas lacked the ability to do hemoglobin tests and about 50 percent of puskesmas lacked the ability to do urine tests.
Ensure adequate public financing for UHC. Given the very low level of government health spending at 1.5 percent of GDP, it is crucial to increase government health spending as a necessary and critical but not sufficient, condition to progress towards achieving UHC. In acknowledging the challenges of increasing the fiscal space for public financing for UHC, key options that can address this include a combination of: (i) increasing overall government revenues through improved tax collection; (ii) reprioritization of health in the government’s budget; (iii) efficiency gains; (iv) earmarked tobacco taxes; (v) complementary subnational financing; (vi) increasing enrollment of the remaining formal sector; and (vii) incentives to formalize the informal sector.
Increase focus on primary health care, including prevention and promotion. There are concerns that the focus on UHC is for curative and rehabilitative care and is distracting from the focus on improving primary health care and population/public health interventions. Most cost-effective interventions are usually delivered at the population level as well as the primary-care level.
Cover the nonpoor and eliminate mistargeting. Given challenges of public financing, supply-side readiness, equity in, and financial sustainability of, social health expenditure incidence, and implicit rationing, availability of benefits, enrollment of the nonpoor into JKN continues to be a challenge. Expanding the coverage for the nonpoor informal sector and the elimination of mistargeting need to be key priorities.
In order to accelerate progress toward UHC and meeting its population coverage target by 2019, Indonesia would have to Spend More, Spend Right and Spend Better.

Policy Options
SPEND MORE • Make the JKN benefits package explicit so that current public financing gaps can be clearly
identified and estimated.• Adjust the JKN benefits package so that it is commensurate with current public financing
resources, economic growth and projected macrofiscal trajectory, and service delivery capacity.• Raise additional public financing for health by: (i) increasing overall government revenues
through improved tax collection and introduction of higher “sin” taxes including on tobacco; (ii) encouraging labor formality; (iii) reprioritization for health in the government’s budget; and (iv) increasing enrollment of the remaining formal sector.
• Increase and expand coverage of the nonpoor informal sector.
SPEND RIGHT• Focus on primary health care including prevention and promotion.• Reduce mistargeting for the poor and nonpoor and ensure subsidies are spent on the right
people through better targeting.• Integrate supply-side and demand-side financing to improve public and private provider supply-
side readiness.
SPEND BETTER • Increase effectiveness of intergovernmental fiscal transfers by improving subnational government
capacity, ensuring accountability, and incentivizing results.• Adjust JKN provider payment mechanisms to incentivize preventive/promotive services for results.
EXECUTIVE SUMMARY
7
Increase effectiveness of intergovernmental fiscal transfers by improving local government capacity, ensuring accountability, and incentivizing results. Efficiency and effectiveness of Indonesia’s health system can be enhanced by improving local government’s (provincial and district) capacity to prioritize, mobilize, plan, budget, and effectively utilize both supply- and demand-side financing; strengthening the monitoring and evaluation system to make local governments more accountable; and introducing nonfinancial and financial incentives tied to achievement of results.
Stronger and clearer links to JKN is key to the sustainability of externally financed health programs. To transition from externally financing smoothly, Indonesia, needs to focus not only on the quantum
of financing required, but also on the governance and service-delivery mechanisms in place to deliver these services. As JKN expands coverage, the key to financial and institutional sustainability will be for these externally financed health programs to be better integrated within the context of UHC.
Leveraging JKN provider payment mechanisms to incentivize preventive/promotive services for results. Improved socialization of guidelines on use of JKN capitation payments would help as would other mechanisms such as introduction of “strategic” purchasing, e.g., to better integrate JKN provider payment mechanisms with provision of preventive/promotive care so as to improve the efficiency and financial sustainability of public financing for UHC in Indonesia.

HEALTH FINANCING SYSTEM ASSESSMENTspend more . spend right . spend better
8

9
section one. INTRODUCTION
section 1 .
INTRODUCTION

10
HEALTH FINANCING SYSTEM ASSESSMENTspend more . spend right . spend better
This policy paper assesses Indonesia’s health financing system in light of recent reforms and the government’s commitment to attaining universal health coverage (UHC) for its population by 2019. Landmark legislation in 2004 and 2011 has helped realize a potential pathway to UHC in Indonesia and social health insurance (SHI) coverage rates have increased significantly in recent years. As of 2014, when Indonesia merged its various SHI schemes, the country has one of the largest single-payer population coverage programs in the world (Jaminan Kesehatan Nasional, JKN). By 2019, everyone in Indonesia is intended to have coverage under JKN. The overarching goal of this assessment is to identify critical constraints and opportunities facing Indonesia’s health financing system in order to help accelerate and sustain progress towards UHC. As the country gears towards attaining UHC and prepares to gain upper-middle income status, it is also transitioning away from, and integrating, traditional external-financed health programs, such as those for immunization, Human Immunodeficiency Virus (HIV), tuberculosis (TB), and malaria. In order to identify these constraints and opportunities, as well as to assess Indonesia’s overall health financing system, the paper also includes an in-depth examination, using immunization as a case study, both for the context of UHC reforms as well as the country’s impending exit from donor financing.1
Health financing is instrumental for, and intrinsic to, UHC. UHC can be conceptualized as consisting of three key dimensions: (i) population coverage (“breadth” of coverage); (ii) service coverage (“depth” of coverage); and (iii) cost coverage (“height” of coverage)(Figure 1.1). UHC is not only about increasing the number of people having access to health services, although this is clearly one important dimension of UHC, but also about ensuring that services are available and of sufficient quality and
about the extent of financial protection accorded by the health systems.2 Health financing refers to the “function of a health system concerned with the mobilization, accumulation, and allocation of money to cover the health needs of the people, individually and collectively, in the health system…the purpose of health financing is to make funding available, as well as to set the right financial incentives to providers and to ensure that all individuals have access to effective public health and personal health care” (WHO 2000).
All health financing approaches should try to fulfill three basic principles of public finance: (i) raise enough revenues to provide individuals with the intended packages of health services that assure health and financial protection against catastrophic medical expenses caused by illness and injury in an equitable, efficient, and financially sustainable manner; (ii) manage these revenues to pool health risks equitably and efficiently; and (iii) ensure the payment for, or purchase of, health services is carried out in ways that are allocatively and technically efficient.3 In doing so, health financing focuses specifically on two dimensions of the UHC ‘cube’: (i) the height of the cube, representing the extent of financial protection accorded by direct costs at the time and point of seeking care; (ii) the volume of the inner cube, representing the extent of prepaid/pooled financing (a function of all three dimensions of the UHC cube, that is, of the number of people covered, the services covered, and of the extent of financial coverage provided by health systems); and (iii) the volume of the outer cube representing the aggregate amount of total health expenditures (THE) in the country.
Another way to conceptualize the link between health financing and UHC is by using WHO’s “building blocks” framework. WHO defines a health system as “…the sum total of all the organizations, institutions, and resources whose primary purpose is
1 A subsequent policy paper will examine HIV, malaria, and TB in the same contexts, building on previous work done on HIV and reflecting new service delivery data that are being collected from a national sample of public and private primary-care facilities.
2 The three dimensions of UHC (“depth”, “breadth”, and “height”) are neither independent nor mutually exclusive: ensuring depth of coverage has implications for the breadth and height of UHC as well. Universal availability of the benefit package for all–not just those who are well-off and live in urban areas–is a key aspect in ensuring that UHC is not a hypothetical aspiration but a realized policy designed to enhance health and improve social protection. High out-of-pocket (OOP) payments–that is, the low height of UHC–can (and is) often a result of poor depth of coverage if patients have to pay OOP for drugs or seek care elsewhere in private facilities that are outside the network.
3 World Bank, “Financing”, World Bank, http://go.worldbank.org/I9NCO1V9N0, accessed January 4, 2016.

11
section one. INTRODUCTION
Figure 1.2 Results Chain From “Building Blocks” to UHC and Other Health Systems Objective
Source Adapted from WHO (2013)
to improve health” (WHO 2014). WHO conceptualizes health systems as comprising six core “building blocks”: (i) service delivery; (ii) health workforce; (iii) health information systems; (iv) access to essential medicines; (v) financing; and (vi) leadership/governance (WHO 2010a). These six “building blocks” represent inputs and processes that, when combined, generate outputs, outcomes, and impact for attainment of desired objectives such as UHC
4 WHO. 2010a.
(as well as other objectives such as improved responsiveness and enhanced health security) (Figure 1.2)(WHO 2013a).
Sufficiency of financing for UHC is typically a prominent policy consideration across many developing countries, including Indonesia. Resources needed for financing UHC depend in large part on country context, the extent of population coverage,
Figure 1.1 Three Dimensions of UHC4
Service Delivery
Health workforce
Health information systems
Access to essential medicines
Financing
Leadership / Governance
Service access and readiness
Service quality and safety
Service utilization
Financial resources pooled
Crisis readiness
Coverage of interventions
Financial risk protection
Risk factor mitigation
Improved health status
Improved financial well-being
Increased responsiveness
Increased health security
QUANTITY, QUALITY AND EQUITY OF SERVICES
SOCIAL DETERMINANTS
BUILDING BLOCKS OUTPUTS OUTCOMES IMPACT
SERVICES:WHICH SERVICESARE COVERED?
REDUCECOSTSHARINGAND FEES
DIRECT COSTPROPORTIONOF THE COSTCOVERED
POPULATION: WHO IS COVERED?
INCLUDEOTHERSERVICES
EXTEND TONON - COVERED
CURRENTPOOLEDFUNDS

12
HEALTH FINANCING SYSTEM ASSESSMENTspend more . spend right . spend better
the risk profile of beneficiaries and their utilization rates, the costs of inputs, the nature and extent of benefits provided, and how health systems are organized and financed to deliver services. At the same time, resource availability for financing UHC is dependent on the willingness and ability of beneficiaries to contribute, the administrative capacity of countries to collect contributions, the fiscal capacity of governments to subsidize coverage for those who are not able to contribute, and the extent of cross-subsidization from richer to poorer beneficiaries, among other factors.
Health financing, however, is not just about the sufficiency of resources; it is also about the efficiency, equity, and effectiveness of how such resources are raised, pooled, allocated, and utilized to attain the desired health system outcomes, such as UHC (Hsiao 2007). Implications of health-financing strategies can also include assessments related to financial sustainability and the impact of reforms on the broader economy. UHC-related health-financing reforms can potentially improve health outcomes, mitigate household vulnerability, and reduce the risk of impoverishment from catastrophic health spending. Health financing reforms can, however, also have unintended consequences, for example, policies to improve revenue collection may result in increasing labor costs, encouraging informality, as well as unduly raising the fiscal burden on governments (Wagstaff 2010).
Rising health care costs, if not mitigated by strategic purchasing and efficiency improvements, can threaten the financial sustainability of health care reforms. With implementation of UHC in countries that have externally financed programs, there are additional challenges related to whether or not benefits packages adequately stipulate and deliver comparable services to those that were previously externally financed, and to what extent some health programs continue to be managed separately from UHC implementation modalities.
Given this backdrop, the remainder of the paper focuses on describing and analyzing three broad questions and subareas of focus in assessing Indonesia’s health-financing system, namely, how equitable and efficient the health system is in raising, pooling, and allocating resources to purchase health services in Indonesia’s quest to attaining
UHC. These subareas of focus are not necessarily mutually exclusive, and some of the trade-offs and complementarities across the different subareas are acknowledged and addressed as they come up. Equity and efficiency considerations underpin all subareas of focus and are cross-cutting themes throughout the assessment. The paper is structured into seven sections, including this introduction. Section Two (Background) begins with a summary on Indonesia’s country context, including economic growth, poverty, shared prosperity, and a discussion of the macrofiscal

13
section one. INTRODUCTION
5 Whenever the term “national” is used with regard to government-related indicators, this is a reference to both central and subnational taken together
environment within which the country’s health-financing system operates. This is followed by an overview of Indonesia’s attainment of key population health outcomes and progress towards UHC (Section Three). Section Four examines health care organization, delivery and resources. In Section Five, the paper recaps Indonesia’s health-financing system, with a focus on four of the largest sources and
agents of health financing in the country: government budgetary expenditures (both at the central and subnational levels); SHI expenditures; OOP spending on health by households; and external financing. Section Six takes a close look at immunization as a disease-specific context for health financing. Section Seven concludes the paper with a discussion and some policy options for consideration by.5

14
HEALTH FINANCING SYSTEM ASSESSMENTspend more . spend right . spend better

15
section two. BACKGROUND
section 2 .
BACKGROUND

In Summary
1. Indonesia has made significant progress and has a positive macroeconomic outlook with economic growth projected at a respectable 5-6 percent annually for the next five years.
2. Inflation and unemployment are low and Indonesia has manageable levels of debt and fiscal deficit.
3. There has been an overall decline in poverty, but rising income inequality and a persistence in labor market informality.
4. National (central plus subnational) spending is low relative to other countries with comparable income level, and the national revenue collection is also low.
5. Revenue collection is largely centralized, while expenditure and service delivery has been decentralized to the district level. There is a clear disconnect between revenue collection and expenditures.
6. Indonesia’s intergovernmental fiscal transfers of revenues are large, fragmented, and complex.7. Conditional, earmarked capital grants are allocated by central government as an equalizing
mechanism to prioritize some service sectors, including health.
16
HEALTH FINANCING SYSTEM ASSESSMENTspend more . spend right . spend better

17
section two. BACKGROUND
Indonesia has made significant progress since the 1997-98 Asian financial crisis which resulted in a decline in GDP of over 15 percent. With GNI per capita of US$3,238 (US$10,680 in PPP terms) in 2015, Indonesia is currently classified as a lower-middle-income country and ranks next to Swaziland, Bolivia, Philippines and Egypt (and to Dominica, Bosnia, and Egypt in PPP terms). Indonesia first transitioned from low-income to lower-middle-income status in 1992. The country, however, was reclassified as a low-income country in 1998 as a result of the 1997-98 Asian financial crisis, but regained its lower-middle-income status in 2003 (Figure 2.1). In parallel, Indonesia became reeligible for concessionary IDA credits in 1999 as a “blend” country and regained full status with the International Bank for Reconstruction and Development in 2008.6
Indonesia’s GDP grew at an average annual rate of 4.1 percent over the 1995-2015 period, slightly better, but relatively more volatile, than its regional peers, with an average economic growth of 2.8 percent in per capita terms over the same period (Table 2.1). Indonesia’s relatively strong economic growth post 1997-98 Asian financial crisis (5.5 percent per year since 2000 - Figure 2.2) has been accompanied by a sustained decline in poverty rates: about 46 percent and 16 percent of the population lived on $3.1-a-day and $1.9-a-day (respectively) in 2010, down from 82 percent and 48 percent (respectively) in 1999. About 10 percent of the global share of people subsisting on less than $1.9 a day are in 2010 estimated to live in Indonesia. The national poverty rate stands at 11 percent in 2014.
Economic Growth, Poverty and Shared Prosperity
6 The World Bank defines ‘blend’ countries as being IDA-eligible based on per capita income levels and are also creditworthy for some IBRD borrowing
Figure 2.1 GDP per capita and Poverty Trends in Indonesia (1995-2015)
Source World Development Indicators 2016. Note GDP per capita in 2015 constant US$.
$3.1 a-day poverty (right axis)
$1.9 a-day poverty (right axis)
LOWERMIDDLEINCOME
1993 1996 1999 2002 2005 2015
2,000
3,000
1,500
2,500
3,500
20
60
0
40
80
100GDPper
capitaUS$
Share ofpopulation(%)
2008 2011
LOWINCOME
LOWERMIDDLEINCOME
IBRD
BlendIBRD

18
HEALTH FINANCING SYSTEM ASSESSMENTspend more . spend right . spend better
Figure 2.2 Year-on-year Economic Growth (1995-2015)
Source World Development Indicators 2016..
Figure 2.3 Inflation and Exchange Rate (1995-2015)
Source World Development Indicators 2016.
1995 2000 2005 2015
-10
5
-15
0
10
-5
percentage (%)
2010
1995 2000 2005 2015
10
40
0
30
50
6,000
8,000
2,000
20
10,000
12,000
Inflation (%)
2010
60
4,000
IDR per US$
Exchange rate (right axis)
Inflation (leftaxis)

19
section two. BACKGROUND
A broadly conducive macroeconomic environment is expected over the next five years, with economic growth projected at a respectable 5-6 percent per year. A similarly positive outlook is expected for other key macrofiscal variables (World Bank 2015e). While inflation has been slowly trending downwards (to 6 percent in 2015), the exchange rate has been slowly devaluing in recent years (Figure 2.3). With continued and sustained economic growth, Indonesia is likely to transition to upper-middle-income status within the next few years. Indonesia’s overall debt and deficit levels appear to be at manageable levels. Expenditures have generally tracked increasing revenues in real terms up until 2012
Table 2.1 Average Annual Economic Growth (1995-2015)
COUNTRYGDP growth GDP per capita growth
Mean SD Mean SD
Brazil 2.6% 2.5% 1.4% 2.5%
Cambodia 7.0% 2.4% 5.2% 2.6%
China 8.6% 1.5% 8.0% 1.5%
India 6.5% 1.8% 4.9% 1.9%
Indonesia 4.1% 4.6% 2.8% 4.6%
Lao PDR 6.5% 1.1% 4.7% 1.1%
Malaysia 4.7% 3.8% 2.7% 3.9%
Philippines 4.5% 1.9% 2.6% 2.0%
Russia 2.5% 5.0% 2.6% 5.1%
South Africa 2.9% 1.6% 1.4% 1.7%
Sri Lanka 5.3% 3.1% 4.4% 3.3%
Thailand 3.2% 3.8% 2.5% 3.8%
Vietnam 6.3% 1.1% 5.2% 1.1%
East Asia and Pacific 3.9% 4.3% 2.7% 5.6%
Lower-middle-income 4.2% 5.1% 2.8% 5.1%
Source World Development Indicators 2016. Note SD: Standard deviation
7 Indonesia’s fiscal rule was enacted under Peraturan Pemerintah No. 23/2003. Pengendalian Jumlah Kumulatif Defisit Anggaran Pendapatan Dan Belanja Negara, Dan Anggaran Pendapatan Dan Belanja Daerah, Serta Jumlah Kumulatif Pemerintah Pusat Dan Pemerintah Daerah.
and then the gap between revenue and expenditure has begun to widen, with some periods of decline resulting from economic slowdowns (Figure 2.4). Unlike its peer countries by income, such as India and Sri Lanka, Indonesia’s debt and deficit levels are relatively low (in fact, lower than the European Union Maastricht Treaty benchmarks of 60 percent and 3 percent of GDP respectively). The primary deficit has generally been below 1 percent of GDP in recent years (Figure 2.5). This is, in part, because both central and subnational budgets must adhere to the fiscal rule,7 which sets a maximum annual deficit at 3 percent of GDP and maximum accumulated debt at 60 percent of GDP.

20
HEALTH FINANCING SYSTEM ASSESSMENTspend more . spend right . spend better
Figure 2.4 Real Revenues and Expenditures (1995-2015)
Source World Development Indicators 2016. Note Data are in 2015 constant local currency units
Figure 2.5 Fiscal Deficit and Debt Ratio (2012-15)
Source IMF World Economic Outlook database
1995 2000 2005 2015
500
2,000
0
1,500
1,000
IDR Trillions
20101996 1997 19991998 2001 2002 20042003 2006 2007 20092008 2011 2012 20142013
ExpendituresRevenues
0 25 60 150
-10
-20
10
0
Fiscal deficit to GDP ration (%)
100
20
Debt to GDP ratio (%)
Papua New Guinea
Nigeria South AfricaCambodia
Rusia
Solomon Islands
IndonesiaChina
Thailand
Philippines
Malaysia Brazil
Ghana
IndiaSri Lanka
Lao PDR
Vietnam

21
section two. BACKGROUND
Although the industrial sector and service sector are the two biggest contributors to GDP, the service sector remains the biggest source of employment in the country, followed by agriculture sector. The composition of Indonesia’s GDP has changed significantly in recent decades. Agriculture’s share in GDP fell from more than 51 percent in 1960 to just 14 percent in 2015. Over the same period, the services share of GDP rose from 33 percent to 43 percent, manufacturing rose from under 9 percent to 21 percent, and the nonmanufacturing industry share (mining,
Table 2.2 Economic Sector as Share of GDP and Employment
ECONOMIC SECTORGDP Share (%) Employment Share (%)
1960 2015 2014
Agriculture 51 14 34
Services 33 43 45
Manufacturing 9 21 21
Nonmanufacturing Industry 6 19
TOTAL 100 1008 100
Source World Development Indicators 2016. Note (i) Employment share for manufacturing includes nonmanufacturing industry. (ii) Total may not necessarily be 100% due to effects of rounding.
construction, electricity, water, and gas) rose from 6 percent to 19 percent (for a total share of industry in GDP that went from 15 percent to 40 percent) (Table 2.2). The employment shares in 2014 across the three subsectors are different from those of GDP due to differences in value addition: services is 45 percent, agriculture is 34 percent, and industry is 21 percent. At 6 percent in 2014, the contribution of natural resources to GDP was relatively low in Indonesia, in between the average for EAP (5 percent) and for lower-middle-income countries (8 percent) (Word Development Indicator, 2016).
8 The authors make no representation regarding the completeness or accuracy of the data presented in this table.

22
HEALTH FINANCING SYSTEM ASSESSMENTspend more . spend right . spend better
The bottom 40 percent of Indonesia’s population has not gained as much from recent economic growth, resulting in a rise in income inequality and a persistence in labor market informality. The bottom 40 percent of the population saw an average growth in real per capita consumption of only 1-2 percent per year over the period 2003-10; by way of contrast, the top 20 percent increased their consumption by 5-6 percent per year. This has resulted in a dramatic rise in income inequality, one of the largest increases in the EAP region (after China)(World Bank 2015b, 2016b). The bottom 40 percent of the population remains highly vulnerable to shocks–including those related to health–and tends to work in low-productivity, low-pay, nontradable sectors. While 28 million Indonesias live below the poverty line, a further 68 million live less than 50 percent above it (World Bank 2016b). The extent of fiscal redistribution is limited with only a marginal difference between pre- and posttax Gini coefficients (Lustig 2015).
Despite impressive gains in poverty reduction, the level of informality in the labor market has remained persistently high in Indonesia. Over 60 percent of those employed continue to be classified as nonsalaried workers (Figure 2-6). Given declining poverty rates, this indicates a growing share of the nonpoor informal sector in the population. The labor force participation rate is almost 70 percent, with unemployment at a relatively low 6 percent. The average educational attainment in the adult population is 7.5 years (8 years for males and 7 years for females), about the average for what might be expected for Indonesia’s economic status. Educational attainment among the bottom 40 percent, however, remains relatively low and of poor quality and the enrollment rate among them drops significantly after age 15 (World Bank 2013, 2015c).
Figure 2.6 Informal (Nonsalaried) Workers as Share of Employed Population (1995-2013)
Source World Development Indicators database 2016.
1995 2000 2005 2013
20
80
0
60
40
Share of employed population (%)
2010

23
section two. BACKGROUND
National and subnational government budgetary expenditures9 were a relatively low 17 percent of GDP in 2015 (WEO 2016). In terms of size of government–as measured by its share in GDP–Indonesia is a global outlier. The average government expenditure share of GDP in 2015 was 32 percent among lower-middle-income countries. Indonesia’s government share of GDP is low even in comparison with the average for low-income countries (26 percent) and far lower than that for lower-middle-income countries. As discussed below, this is in part a result of relatively low revenue-raising efforts in the country (Figure 2.7).
Indonesia has decentralized the provision of government services to the district level, but a large share of national government expenditure still occurs at the central level. About 50 percent of all national government expenditures occurred at the central level, followed by roughly 38 percent at the district
Macrofiscal Context
level, and the remaining 13 percent at the provincial level (World Bank 2012a). The legal framework for central budgeting was introduced in the wake of the 1997-98 Asian financial crisis and served to introduce transparency and accountability into what had been an opaque and unresponsive process, reflecting the heavy influence of the Dutch colonial budgeting system, in which the budget was conducted internally by the executive branch with little oversight or accountability to either the implementing partners or taxpayers. Between 2000 and 2005, the country made a concerted effort to change this and introduced a series of laws establishing a legal framework for the process, as well as a timeline and mandatory milestones for the annual preparation, approval, and adoption of the budget. These laws also helped to establish the financial relationship between various government agencies, and the roles and responsibilities of regional governments.
9 The national government budget (APBN - Anggaran Pendapatan dan Belanja Negara) and subnational (APBD - Anggaran Pendapatan dan Belanja Daerah).
Figure 2.7 Government Revenues and Expenditures as Share of GDP (2015)
Source IMF World Economic Outlook database
Sri Lanka
Vietnam
China EastAsia &Pacific
10
0
30
20
Percentage of GDP (%)
Indonesia
Cambodia India
Philippines
Malaysia
Thailand
LowerMiddleIncome
LaoPDR
SouthAfrica
Brazil Rusia
ExpendituresRevenues
40

24
HEALTH FINANCING SYSTEM ASSESSMENTspend more . spend right . spend better
To facilitate medium-term planning, both national and regional governments develop five-year plans to coincide with presidential and district heads’ (bupati) terms of office. These five-year plans tend to be broader and more future-oriented than the annual budgets, but outline both the regulatory measures and the budget needed to achieve the stated goals. The five-year plan is operationalized by annual work plans, which are linked to the annual budget. A Medium-term Expenditure Framework (MTEF) supplements these work plans with three-year forecasts at the national level. The government plans to introduce sector-specific MTEFs in the coming years. A 2011 Public Expenditure and Financial Accountability (PEFA) assessment found public financial management to be strong in areas related to transparency and comprehensiveness of budget documentation, having a well-defined and timely-executed budget process, and a budget classification system that complied with international standards. It also found that weaknesses remained with regard to budget execution, financial reporting, and variations between allocations and expenditures (World Bank 2012b).
In terms of expenditure categories, personnel expenditures accounted for 36 percent of all central government expenditures, followed by 26 percent for goods and services spending, 22 percent for capital, and 14 percent for social assistance (Table 2.3).10
On the other hand, the discretionary expenditure share of district expenditures was relatively low: personnel accounted for almost one-half of all district expenditures, with goods and services accounting for 21 percent and capital 26 percent. At the province level, capital and goods and services were the largest shares of expenditure..
Revenue-raising efforts are relatively modest in Indonesia. Indonesia’s national government revenue share of GDP was only about 14.8 percent of GDP in 2015, far lower than the average for lower-middle-income countries (28 percent) and less than one-half the average for the EAP region (38 percent) (Figure 2.7). Somewhat surprisingly, Indonesia’s revenues are even lower than the average for low-income countries (22 percent): Cambodia, India, and Lao PDR are all poorer than Indonesia, but have higher government revenue shares of GDP (Fenochietto and Pessino 2013).13
Almost 90 percent of national government revenues was raised by the central government in 2013. The remaining 6 percent came from provincial own-source (Pendapatan Asli Daerah, PAD) revenue and only 4 percent was district own-source revenue. Under Law No. 28/2009 concerning local taxes and charges, provincial governments are allowed to collect the following taxes: motor-vehicle tax; excise
Table 2.3 All Government Expenditures by Category (2014)
Expenditure CategoryShare (%)
Central Provinces11 Districts12
Personnel 36 21 47
Goods and services 26 29 21
Capital 22 30 26
Social assistance 14 0 0
Other 2 19 6
Total 100 100 100
Source World Bank (2015) and Consolidated fiscal database (March 2016).Note Total may not necessarily be 100% due to effects of rounding.
10 The shares are calculated by excluding expenditures on subsidies and interest payments.11 Excludes intergovernmental transfers to districts, based on budget allocation data.12 Based on 2015 budget allocation data.13 Revenue generated through tax collection (“Tax effort”) is estimated to be only about 50 percent.14 Government of Indonesia (GoI). Law 28/2009: Local Taxation and Charges in Chapter 2 – Article 2 - 93.

25
section two. BACKGROUND
tax for transfer of ownership of motor vehicles; motor vehicle fuel tax; surface water tax; and cigarette taxes. District governments, on the other hand, collect taxes on: hotels; restaurants; entertainment; advertising; street lighting; nonmetal mineral and rock; parking; and land and buildings; as well as acquisition rights on land and building, among others.
Income and value-added taxes (VAT) were the largest sources of revenues for the central government. In 2014, nonoil and gas income tax revenues were 29 percent of central government revenues followed by VAT which was about 26 percent. Oil and gas revenues comprised 20 percent of central government revenues; grants were less than 1 percent (Table 2.4). Estimated numbers for 2015 from budget data shows an increase in the share of revenues from income tax, which is about 36 percent, followed by VAT at 33 percent. In 2015, the decline in the share of revenues from oil and gas taxes is notable. Excise tobacco taxes are 7 percent of central government revenues.
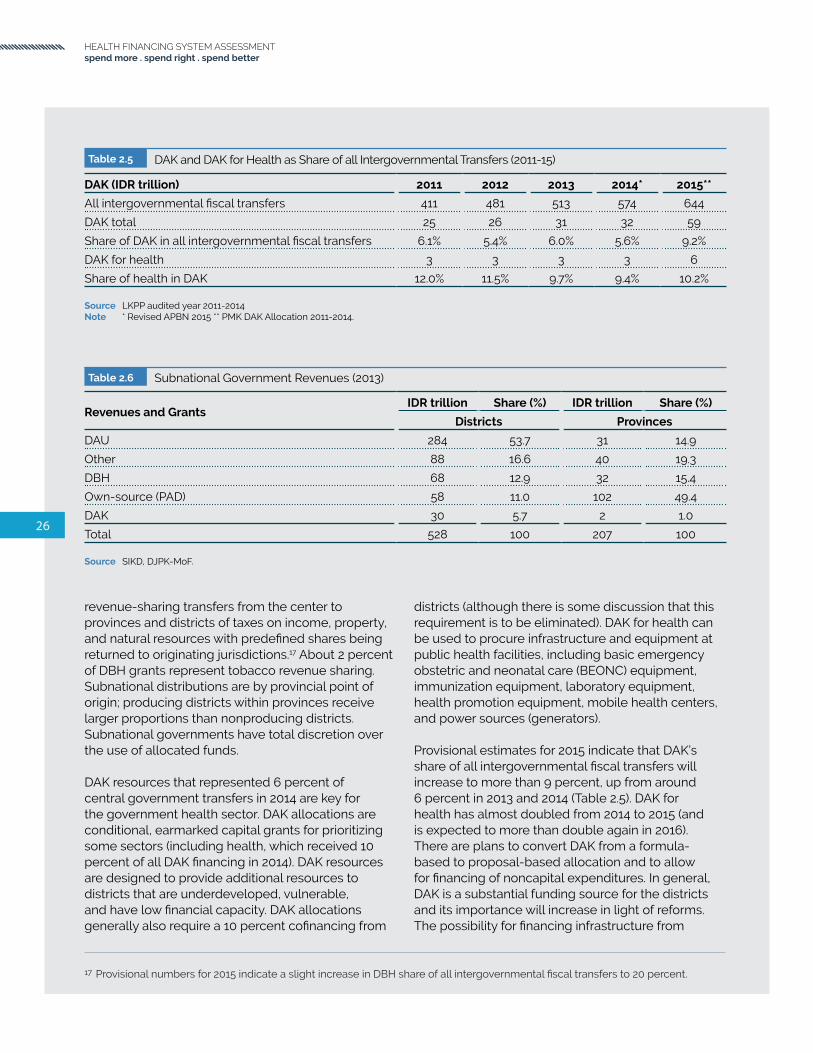
Intergovernmental fiscal transfers of revenues are large, fragmented, and complex. Given the disconnect between largely centralized revenue collection and decentralized expenditures across levels of government, approximately IDR 574 trillion, almost 6 percent of GDP, was transferred from the central to subnational governments in 2014 (Table
2.5). Provisional estimates for 2015 indicate that these transfer amounts will remain about the same as a share of GDP. Several modalities of intergovernmental fiscal transfers exist in Indonesia. Prominent among these are “fiscal balance” transfers comprising three primary components: general allocation funds (Dana Alokasi Umum, DAU), revenue sharing (Dana Bagi Hasil, DBH), and special allocation funds (Dana Alokasi Khusus, DAK).
DAU represented the largest share (60 percent) of total resources transferred to subnational governments in 2014.15 DAU is the unconditional equalizing grant from the center to provinces and districts in the form of a “basic allocation” (based on the total salary of subnational civil servants) and a “fiscal gap” (based on the difference between fiscal requirements and fiscal capacity). Fiscal requirements are determined based on population, land/sea area, a “construction expensiveness index”, the human development index (HDI), and gross regional domestic product while fiscal capacity is based on PAD and DBH revenues.16 Districts receive 90 percent of DAU, with the remaining 10 percent going to provinces. Districts have discretion over how DAU resources that are not tied to civil servant salaries are allocated.
DBH grants totaled 18 percent of intergovernmental fiscal transfers in 2014. These are unconditional
Table 2.4 Central Government Revenues (2013-15)
Revenues and Grants2013 2014 2015
IDR trillion Share (%) IDR trillion Share (%) IDR trillion Share (%)
Income tax (nonoil and gas) 418 29.0 453 29.2 630 35.7
VAT 385 26.8 409 26.4 577 32.7
Excise 109 7.6 118 7.6 146 8.3
Tobacco tax 104 7.2 113 7.3 121 6.9
Oil and gas tax (income and nonincome) 293 20.3 304 19.6 131 7.4
Other 227 15.8 262 16.9 276 15.7
Grants 7 0.5 5 0.3 3 0.2
Total 1,439 100 1,551 100 1,763 100
Source LKPP 2013-2014 and APBN-P 2015.
15 Provisional numbers for 2015 indicate DAU being 55 percent of all intergovernmental fiscal transfers.16 More specifically, a district’s fiscal capacity is determined by the sum of revenues from PAD, DBH, and DAU minus personnel
expenditures divided by the number of poor people in the district.
26
HEALTH FINANCING SYSTEM ASSESSMENTspend more . spend right . spend better
districts (although there is some discussion that this requirement is to be eliminated). DAK for health can be used to procure infrastructure and equipment at public health facilities, including basic emergency obstetric and neonatal care (BEONC) equipment, immunization equipment, laboratory equipment, health promotion equipment, mobile health centers, and power sources (generators).
Provisional estimates for 2015 indicate that DAK’s share of all intergovernmental fiscal transfers will increase to more than 9 percent, up from around 6 percent in 2013 and 2014 (Table 2.5). DAK for health has almost doubled from 2014 to 2015 (and is expected to more than double again in 2016). There are plans to convert DAK from a formula-based to proposal-based allocation and to allow for financing of noncapital expenditures. In general, DAK is a substantial funding source for the districts and its importance will increase in light of reforms. The possibility for financing infrastructure from
Table 2.5 DAK and DAK for Health as Share of all Intergovernmental Transfers (2011-15)
DAK (IDR trillion) 2011 2012 2013 2014* 2015**
All intergovernmental fiscal transfers 411 481 513 574 644
DAK total 25 26 31 32 59
Share of DAK in all intergovernmental fiscal transfers 6.1% 5.4% 6.0% 5.6% 9.2%
DAK for health 3 3 3 3 6
Share of health in DAK 12.0% 11.5% 9.7% 9.4% 10.2%
Source LKPP audited year 2011-2014Note * Revised APBN 2015 ** PMK DAK Allocation 2011-2014.
Table 2.6 Subnational Government Revenues (2013)
Revenues and GrantsIDR trillion Share (%) IDR trillion Share (%)
Districts Provinces
DAU 284 53.7 31 14.9
Other 88 16.6 40 19.3
DBH 68 12.9 32 15.4
Own-source (PAD) 58 11.0 102 49.4
DAK 30 5.7 2 1.0
Total 528 100 207 100
Source SIKD, DJPK-MoF.
revenue-sharing transfers from the center to provinces and districts of taxes on income, property, and natural resources with predefined shares being returned to originating jurisdictions.17 About 2 percent of DBH grants represent tobacco revenue sharing. Subnational distributions are by provincial point of origin; producing districts within provinces receive larger proportions than nonproducing districts. Subnational governments have total discretion over the use of allocated funds.
DAK resources that represented 6 percent of central government transfers in 2014 are key for the government health sector. DAK allocations are conditional, earmarked capital grants for prioritizing some sectors (including health, which received 10 percent of all DAK financing in 2014). DAK resources are designed to provide additional resources to districts that are underdeveloped, vulnerable, and have low financial capacity. DAK allocations generally also require a 10 percent cofinancing from
17 Provisional numbers for 2015 indicate a slight increase in DBH share of all intergovernmental fiscal transfers to 20 percent.

27
section two. BACKGROUND
DAK, for example, is quite significant, including for construction and upgrading of public health facilities.
Other intergovernmental transfers include resources provided to special autonomous regions and transfers to villages. For example, Law No. 06/2014 (or the “Village Law”), that was ratified in early 2014 mandates an annual transfer of approximately US$140,000 from central and subnational government budgets to every village in the country (amounting to about 1 percent of all intergovernmental fiscal transfers in 2015). The government is drafting the implementing regulations and ministerial decrees needed to implement the Village Law. Village Law implementation provides a major opportunity for village governments to substantially increase investments in local development priorities. There is, however, a concern that Village Law financing needs will crowd out already low levels of district government expenditures for health worker outreach, preventative, or promotive care, which village governments have no obligation to replace, or lack the capacity to procure and maintain.
As sources of revenue, DAU is the largest for districts and own-source (PAD) is the largest for provinces. Over one-half of district financing comes from DAU allocations (Table 2-6). In aggregate across all districts, DAK’s share of district revenues is less than 6 percent (although this is likely to be higher in districts with low fiscal capacity). In 2013, about 85 percent of all districts received DAK transfers earmarked specifically for health. Unlike districts, where PAD revenues accounted for only 11 percent of total district revenues, PAD revenues accounted for almost one-half of all provincial revenues.
Many district governments view health as a revenue-generating sector. Some have explicit targets on amounts of resources raised from health-user charges that are then pooled at the district treasury level along with other revenue sources and allocated across sectors. A rapid assessment of 44 districts showed that, in 2013, the biggest source of revenue was from DAU (58 percent) and about 10 percent came from PAD revenue (consistent with aggregated numbers reported in Table 2.6). Over 40 percent of the latter came from the health sector (with one-half from public hospitals).

28
HEALTH FINANCING SYSTEM ASSESSMENTspend more . spend right . spend better
29
section three. HEALTH AND UHC OUTCOMES
section 3 .
HEALTH AND UHC OUTCOMES
In Summary
1. Indonesia’s health status has improved significantly–life expectancy has increased steadily, infant and under-five child mortality rates have declined, and fertility and population growth rates have fallen.
2. The country is facing challenges due to:• Demographic transition: population aged 65 years and above is currently around 5 percent
and is projected to double by 2030 and to reach 25 percent in 2070.• Epidemiological transition: the cause of disease has shifted to NCDs, and the emergence of
overnutrition, while maternal mortality and stunting remain persistently high.• Large inequality: The national average masks regional and widespread income-related
disparity.• Persistent health challenges: especially in maternal health and childhood nutrition.
3. The implementation of national Social Health Insurance (JKN) that aims to cover everyone by 2019 is one of the instruments for Indonesia to attain UHC.
4. Using the WHO-WB UHC monitoring framework to assess country progress towards UHC, Indonesia’s performance is mixed when it comes to preventive/promotive/treatment service coverage and financial coverage indicators.
5. OOP expenditures on health have pushed a significant percentage of the population into poverty or further into poverty.
6. Performance-based financing can serve as a tool to incentivize health systems and health providers to move towards UHC.30
HEALTH FINANCING SYSTEM ASSESSMENTspend more . spend right . spend better

31
section three. HEALTH AND UHC OUTCOMES
With a population of 257 million in 2015, Indonesia is currently the fourth most-populous country in the world. Fertility rate and population growth rates have been steadily declining over the past few decades. The total fertility rate in 2014 was only 2.5 and the population growth rate in 2015 was 1.2 percent. UN population projections estimate that Indonesia’s population will be almost 300 million in 2030, peaking at 325 million by 2070, following which it is projected to decline (United Nations 2015). The age distribution of the population is an important factor influencing the utilization of health services: younger and older subgroups tend to have much higher utilization rates in general. Approximately 29 percent of Indonesians are below 15 years of age and the median age is around 28. While only 5 percent are 65 years of age and above in 2015, this share is expected to increase sharply beginning in 2015, reaching 10 percent of the population by 2030 and 25 percent of the population by 2070 (Figure 3.2).
Demographics and Population Health Outcomes
Indonesians have become healthier over the past several decades. Life expectancy at birth has steadily increased to 69 years in 2014, up from 63 years in 1990 and only 49 years in 1960 (Figure 3.3). The under-five mortality rate has declined from 222 per 1,000 live births in 1960 to 85 in 1990 and 27 in 2015, thereby meeting the MDG under-five mortality rate of 28 per 1,000 by 2015 (UNICEF et al 2014). Nonetheless, Indonesia needs further improvement to meet the SDG target in reducing under-five mortality below 25 per 1,000 live births by 2030. Infant mortality has declined six-fold since 1960, down to 23 per 1,000 live births in 2015. Both life expectancy and infant mortality rates are about the average of what might be expected for Indonesia’s income level (Figure 3.4). Indonesia’s outcomes compare unfavorably to those in better-performing countries such as Vietnam and Sri Lanka.
Figure 3.1 Total Fertility Rate and Population Growth Rate (1960-2015)
Source World Development Indicators 2016.
Population growth rate (right axis)
Total fertility rate (left axis)
1960 1970 1980 1990 2000 2015
3
5
2
4
6Averagenumber of
children
2010
Percentage(%)
1.5
2.5
1
2
3

32
HEALTH FINANCING SYSTEM ASSESSMENTspend more . spend right . spend better
Figure 3.3 Key Population Health Outcomes (1960-2015)
Source World Development Indicators 2016.Note y axis in log scale.
Figure 3.2 Share of Population Aged 65 and Above (1950-2070)
Source UN population projection 2015
China
Vietnam
1950 1970 1990 2010 2030 2070
10
0
20
30Share oftotal
population(%)
2050
ThailandIndonesia
Philippines
Under-five mortality (left axis)
Infant mortality (left axis)
Life expectancy (right axis)
1960 1970 1980 1990 2000 2015
50
150
25
100
250
50
60
45
55
65
70
75Mortalityrate per
1,000live
births
Years
2010

33
section three. HEALTH AND UHC OUTCOMES
Figure 3.4 Life Expectancy and Infant Mortality Relative to Income (2014)
Source World Development Indicators 2016..Note Both x and y axis in log scale.
Figure 3.5 Burden of Disease by Cause (1990-2015)
Source Institute of Health Metrics and Evaluation database (IHME) 2015
South Africa
CambodiaRusiaIndonesia
Thailand
Philippines
Malaysia
Brazil
India
Sri Lanka
Lao PDR
Vietnam
China
Nigeria
Papua New Guinea
Solomon Islands
Ghana
250 500 1000 1000002500
GNI per capita, US$
10000 35000
LOW INCOME HIGH INCOME
LOWERMIDDLEINCOME
UPPERMIDDLEINCOME
South Africa
Cambodia
Rusia
Indonesia
Thailand
Philippines
Malaysia
Brazil
Sri Lanka
Vietnam
China
Nigeria
Papua New Guinea
Solomon Islands
India
Lao PDRGhana
5
1
75
50
125
25
10
2
Infant Mortalityrate per 1,000 live birthsLife Expectancyyears
55
45
75
65
85
250 500 1000 1000002500
GNI per capita, US$
10000 35000
LOW INCOME HIGH INCOME
LOWERMIDDLEINCOME
UPPERMIDDLEINCOME
Injuries
9%
1990
9% 8%7%
43%
33%
27%
56%49% 58% 66%37%
2000 2010 2015
Noncommunicable Communicable

34
HEALTH FINANCING SYSTEM ASSESSMENTspend more . spend right . spend better
Table 3.1 Top Ten Causes of Morbidity and Premature Mortality (1990-2015)
Rank in 2015 Disease/ConditionDALYs lost share (%)
1990 2000 2010 2015
1 Cerebrovascular disease 4.2 6.4 7.6 8.6
2 Ischemic heart disease 3.6 5.4 6.8 7.4
3 Diabetes mellitus 2.0 3.2 4.5 5.3
4 Tuberculosis 5.7 5.5 4.9 4.3
5 Road injuries 3.4 3.7 3.5 3.4
6 Lower back and neck pain 1.8 2.5 3.0 3.3
7 Neonatal preterm birth 5.6 4.6 3.5 3.0
8 Sense organ diseases 1.5 2.1 2.5 2.8
9 Diarrheal diseases 8.0 5.1 3.4 2.7
10 Lower respiratory infections 8.9 5.6 3.7 2.6
DALYs per 100,000 population 45,138 34,725 30,681 29,217
Source Institute of Health Metrics and Evaluation database (IHME) 2015.
Indonesia is undergoing a rapid epidemiological transition. Noncommunicable diseases (NCDs) now account for the largest share of the burden of disease in Indonesia. Whereas in 1990 only about 37 percent of morbidity and mortality in Indonesia was due to NCDs, by 2015 this number had risen to 66 percent (Figure 3.5)(Institute of Health Metrics and Evaluation 2016). This trend is expected to continue in the coming years. Cerebrovascular diseases were responsible for the largest share of the overall disease burden in Indonesia, causing 8.6 percent of all disability-adjusted life years (DALYs) lost due to morbidity and premature mortality in 2015 (Table 3.1).18 Other NCDs such as ischemic heart disease and diabetes have more than doubled as a share of the disease burden in Indonesia over the period 1990-2015. Tuberculosis remains a prominent contributor to the overall burden of disease in the country; however, its share of the overall burden dropped between 2010-15 making it the fourth highest source of morbidity and mortality. The rise in NCDs in Indonesia is a result of changes in several sociodemographic and lifestyle factors. Ageing is one contributory factor, although the
prevalence of NCDs among younger age groups in Indonesia is also increasing. Physical inactivity, unhealthy diets, tobacco use, and child and maternal malnutrition are key risk factors for NCDs. Several of these risk factors–including dietary risks, hypertension, smoking, high fasting plasma glucose level, and physical inactivity–are prominent among the top ten risk factors contributing to the overall disease burden in the country (Table 3.2). The share of dietary risks and high blood pressure as contributors to DALYs lost has more than doubled over the period of 1990-2015. Tobacco use is rising and constitutes one of the most significant public health threats. The government has embarked on the tobacco taxation reform with the motivation to increase revenue from excise tax and, at the same time, curbing smoking prevalence, although the government is facing challenges in its implementation (See Appendix D). Large regional and income-related inequalities remain across the country. The infant mortality rate in West Sulawesi, for example, is two to three times higher than that in some other provinces (Figure 3.6). Moreover, infant and child mortality rates among the poorest wealth quintile of households are more than
18 DALYs refer to aggregated healthy years of time lost at the population level as a result of disease-related morbidity and premature mortality.
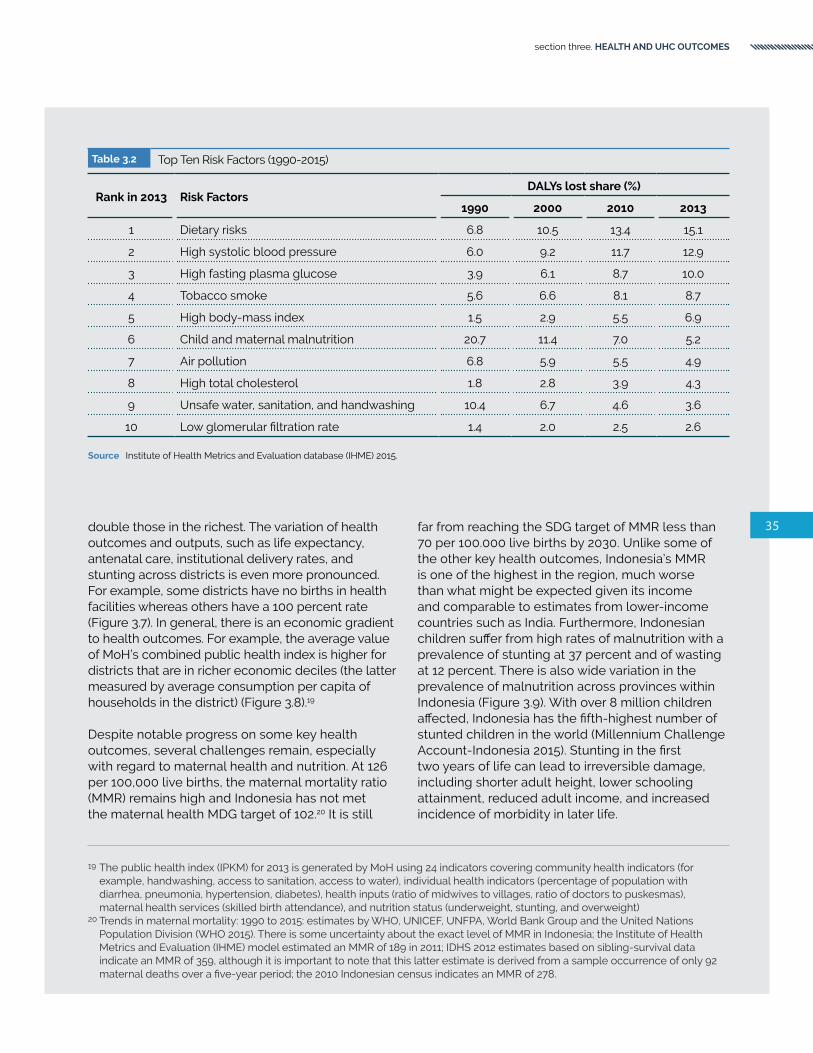
35
section three. HEALTH AND UHC OUTCOMES
Table 3.2 Top Ten Risk Factors (1990-2015)
Rank in 2013 Risk FactorsDALYs lost share (%)
1990 2000 2010 2013
1 Dietary risks 6.8 10.5 13.4 15.1
2 High systolic blood pressure 6.0 9.2 11.7 12.9
3 High fasting plasma glucose 3.9 6.1 8.7 10.0
4 Tobacco smoke 5.6 6.6 8.1 8.7
5 High body-mass index 1.5 2.9 5.5 6.9
6 Child and maternal malnutrition 20.7 11.4 7.0 5.2
7 Air pollution 6.8 5.9 5.5 4.9
8 High total cholesterol 1.8 2.8 3.9 4.3
9 Unsafe water, sanitation, and handwashing 10.4 6.7 4.6 3.6
10 Low glomerular filtration rate 1.4 2.0 2.5 2.6
Source Institute of Health Metrics and Evaluation database (IHME) 2015.
double those in the richest. The variation of health outcomes and outputs, such as life expectancy, antenatal care, institutional delivery rates, and stunting across districts is even more pronounced. For example, some districts have no births in health facilities whereas others have a 100 percent rate (Figure 3.7). In general, there is an economic gradient to health outcomes. For example, the average value of MoH’s combined public health index is higher for districts that are in richer economic deciles (the latter measured by average consumption per capita of households in the district) (Figure 3.8).19
Despite notable progress on some key health outcomes, several challenges remain, especially with regard to maternal health and nutrition. At 126 per 100,000 live births, the maternal mortality ratio (MMR) remains high and Indonesia has not met the maternal health MDG target of 102.20 It is still
far from reaching the SDG target of MMR less than 70 per 100.000 live births by 2030. Unlike some of the other key health outcomes, Indonesia’s MMR is one of the highest in the region, much worse than what might be expected given its income and comparable to estimates from lower-income countries such as India. Furthermore, Indonesian children suffer from high rates of malnutrition with a prevalence of stunting at 37 percent and of wasting at 12 percent. There is also wide variation in the prevalence of malnutrition across provinces within Indonesia (Figure 3.9). With over 8 million children affected, Indonesia has the fifth-highest number of stunted children in the world (Millennium Challenge Account-Indonesia 2015). Stunting in the first two years of life can lead to irreversible damage, including shorter adult height, lower schooling attainment, reduced adult income, and increased incidence of morbidity in later life.
19 The public health index (IPKM) for 2013 is generated by MoH using 24 indicators covering community health indicators (for example, handwashing, access to sanitation, access to water), individual health indicators (percentage of population with diarrhea, pneumonia, hypertension, diabetes), health inputs (ratio of midwives to villages, ratio of doctors to puskesmas), maternal health services (skilled birth attendance), and nutrition status (underweight, stunting, and overweight)
20 Trends in maternal mortality: 1990 to 2015: estimates by WHO, UNICEF, UNFPA, World Bank Group and the United Nations Population Division (WHO 2015). There is some uncertainty about the exact level of MMR in Indonesia; the Institute of Health Metrics and Evaluation (IHME) model estimated an MMR of 189 in 2011; IDHS 2012 estimates based on sibling-survival data indicate an MMR of 359, although it is important to note that this latter estimate is derived from a sample occurrence of only 92 maternal deaths over a five-year period; the 2010 Indonesian census indicates an MMR of 278.

36
HEALTH FINANCING SYSTEM ASSESSMENTspend more . spend right . spend better
Figure 3.6 Infant Mortality (by province)
Source IDHS 2012
Figure 3.7 Distribution of Key Health Indicators Across Districts (2013)
Source Indeks Pembangunan Kesehatan Masyarakat (IPKM), MoH. 2013; Indeks Pembangunan Manusia (IPM), Indonesia Statistic-2013
Mal
uku
Ce
ntr
al K
alim
anta
n
We
st S
ula
we
si
80
0
60
20
Rateper 1,000
livebirths
So
uth
Su
mat
ra
Pap
ua
No
rth
Mal
uku
Jam
bi
So
uth
eas
t S
ula
we
si
Ria
u Is
lan
ds
We
st K
alim
anta
n
Eas
t K
alim
anta
n
No
rth
Su
mat
ra
Ria
u
Ce
ntr
al S
ula
we
si
Be
ng
kulu
So
uth
Su
law
esi
Lam
pu
ng
We
st J
ava
Ban
gka
Be
litu
ng
Indonesia average40
Ban
ten
Eas
t Jav
a
Ce
ntr
al J
ava
We
st P
apu
a
No
rth
Su
law
esi
So
uth
Kal
iman
tan
We
st S
um
atra
Go
ron
talo
We
st N
usa
Te
ng
gar
a
DK
I Jak
arta
Nan
gg
roe
Ace
h
DI Y
og
yaka
rta
Eas
t N
usa
Te
ng
gar
a
Bal
i
Pe
rce
nta
ge
of
dis
tric
ts (%
)
Pe
rce
nta
ge
of
dis
tric
ts (%
)P
erc
en
tag
e o
f d
istr
icts
(%)
Pe
rce
nta
ge
of
dis
tric
ts (%
)
20 1000 8040 60
Institutional delivery rate (%)
20 1000 8040 60
4+ ANC visits (%)
20 800 40 60
Stunting rate (%)
6560 70 75
Life expectancy at birth (year)

37
section three. HEALTH AND UHC OUTCOMES
Figure 3.8 Health Index by District Economic Deciles (2013)
Source World Bank staff calculation
Figure 3.9 Stunting Among Under-five Children (by province
Source Riskesdas 2013
Mal
uku
Ce
ntr
al K
alim
anta
n
We
st S
ula
we
si
10
50
0
40
20
Percentage(%)
So
uth
Su
mat
ra
Pap
ua
No
rth
Mal
uku
Jam
bi
So
uth
eas
t S
ula
we
si
Ria
u Is
lan
ds
We
st K
alim
anta
n
Eas
t K
alim
anta
n
No
rth
Su
mat
ra
Ria
u
Ce
ntr
al S
ula
we
si
Be
ng
kulu
So
uth
Su
law
esi
Lam
pu
ng
We
st J
ava
Ban
gka
Be
litu
ng
Indonesia average30
Ban
ten
Eas
t Jav
a
Ce
ntr
al J
ava
We
st P
apu
a
No
rth
Su
law
esi
So
uth
Kal
iman
tan
We
st S
um
atra
Go
ron
talo
We
st N
usa
Te
ng
gar
a
DK
I Jak
arta
Nan
gg
roe
Ace
h
DI Y
og
yaka
rta
Eas
t N
usa
Te
ng
gar
a
Bal
i
. 6
0
. 5
. 3
Health index(higher is better)
Poorest
. 4
3rd 5th 7th Richest
. 2
. 1
Economic deciles

38
HEALTH FINANCING SYSTEM ASSESSMENTspend more . spend right . spend better
Indonesia plans to attain UHC with everyone covered under its newly unified SHI program, JKN, by 2019. SHI has undergone major reforms in Indonesia in recent years. The universal right to health care was included as an amendment to Indonesia’s constitution in 1999. The impetus for expansion of SHI came a few years later, however, in a piece of landmark legislation in 2004–the Sistem Jaminan Sosial Nasional (SJSN) law–that formed the legal basis for attaining several social protection objectives in the country. In 2011, the government of Indonesia passed a ground-breaking follow-up law (Law No. 24/2011) that defined the administrative and implementation arrangements–the Badan Penyelenggara Jaminan Sosial (BPJS) law–which stipulated that all existing contributory and noncontributory SHI schemes be merged to provide streamlined uniform benefits under a
Universal Health Coverage
single-payer umbrella beginning in 2014. Following institutionalization of the single-payer insurance administrator (BPJS) and the new unified health insurance program (JKN) in 2014, the government plans to incrementally extend coverage to the entire population by 2019.
The WHO-WB’s monitoring framework recommends tracking a mix of preventive/ promotive/ treatment service coverage and financial coverage indicators to assess country progress towards UHC. Recommendations under preventive/promotive coverage include family planning coverage with modern methods, antenatal care, skilled birth attendance, DPT3 immunization coverage, nonprevalence of tobacco smoking, access to improved water sources, access to improved sanitation, and preventive chemotherapy coverage against neglected tropical diseases. Recommended treatment interventions include antiretroviral therapy (ARV) coverage, tuberculosis, hypertension, diabetes, and cataract surgical coverage (WHO and World Bank 2015).
Recommended financial coverage indicators include those derived from levels of OOP health expenditures as a share of total expenditure, as a share of capacity to pay, and as a share of nonfood expenditure. In addition, the UHC framework recommended that financial coverage also be assessed by looking at the share of the population not pushed into poverty (that is, with expenditures net and gross of OOP above an international poverty line/level of subsistence food consumption/multiple poverty lines), share of the population not further pushed into poverty (that is, with expenses below an international poverty line/level of subsistence food consumption/multiple poverty lines), and no OOP, as well as share of the population that are neither pushed nor further pushed into poverty.

39
section three. HEALTH AND UHC OUTCOMES
On the basis of the WHO-WB UHC monitoring framework, and based on available data on coverage, Indonesia’s performance is mixed. In terms of preventive/promotive indicators, deficiencies are notable in: access to modern family planning methods, DPT3 immunization coverage, tobacco nonuse, and access to improved sanitation. Tobacco nonuse is particularly low, almost as low as in Russia. Whereas coverage of preventive/promotive interventions is higher in Indonesia than in Cambodia, Lao PDR, and India, it is far below that of some of the BRICS (Brazil, Russia, China, and South Africa) countries and is notably lower than that of Vietnam (Table 3.3). For treatment indicators, although TB detection and treatment rates are relatively high, ARV treatment and diabetes treatment rates are exceedingly low (although comparable to those in other lower-middle-income and EAP countries).
Performance-based financing can serve as a tool to incentivize health systems and health providers
to move towards UHC. In an attempt to better incentivize providers to attain UHC outcomes such as immunization, many countries have amended their provider payment mechanisms to make the UHC-immunization links more explicit. Some examples from Argentina, Estonia, New Zealand, and the UK that are summarized in Box 3.1 below can provide relevant experiences and lessons for Indonesia.
With regard to financial protection, even though the prepaid/pooled share of THE is relatively low in Indonesia, the incidence of OOP expenditures being greater than 25 percent of total household expenditure is only 1 percent. Nevertheless, because of the bunching of population just above the poverty line and the incidence of OOP expenditures among those below the poverty line, 18 percent of the population was either pushed into poverty or further impoverished as a result of high OOP spending on health (Table 3.4). There is more discussion on this later under the section on OOP spending.
Table 3.3 UHC Indicators: Preventive, Promotive and Treatment (%) (2010-15)21
CountryPreventive/promotive Treatment
Family planning ANC Skilled birth
attendance DPT3 Tobacco nonuse Water Sanitation ARV TB
Brazil 80 96 99 93 83 98 81 46 59
Cambodia 51 89 71 97 76 71 37 71 59
China 85 95 100 99 75 92 65 52 85
India 55 75 67 83 87 93 36 36 50
Indonesia 62 96 83 78 62 85 59 8 28
Lao PDR 50 53 40 88 65 72 65 30 28
Malaysia 49 97 99 97 77 100 96 21 62
Philippines 49 95 73 79 73 92 74 24 73
Russia 68 100 100 97 59 97 70 29 56
South Africa 60 97 94 70 80 95 74 45 53
Sri Lanka 68 99 99 99 85 94 92 19 59
Thailand 79 98 100 99 78 96 93 61 45
Vietnam 78 96 94 95 76 95 75 37 68
East Asia and Pacific 48 90 83 86 71 87 67 38 60
Lower-middle income 46 86 74 86 78 83 59 29 56
Source World Development Indicators database 2016.Note Attainment less than 80 percent is highlighted in blue.
21 Although the WHO-WB recommended UHC indicator for ANC refers to at least four visits during pregnancy, because of limited availability, the data reported in the table are for at least one ANC visit during pregnancy. The TB tracer indicator is a multiplication of two indicators; the treatment success rate and case detection rate in a given year.

40
HEALTH FINANCING SYSTEM ASSESSMENTspend more . spend right . spend better
Table 3.4 UHC Indicators: Financial Protection22
Country Prepaid/pooled share of THE (%)
OOP<25% Total household Consumption (%)
Neither pushed nor further pushed into poverty (%)
Brazil 70 97 97
Cambodia 40 97 83
China 66 87 90
India 42 99 72
Indonesia 54 99 82
Lao PDR 60 100 93
Malaysia 64 100 99
Philippines 43 100 78
Russia 52 100 100
South Africa 93 100 93
Sri Lanka 53 100 99
Thailand 89 100 100
Vietnam 51 95 75
East Asia and Pacific 76 98 87
Lower-middle-income 60 97 84
Source World Development Indicators database 2016.Note Attainment less than 80 percent is highlighted in blue.
22 The prepaid/pooled share of total health expenditure is not a WHO-WB recommended financial protection indicator; nevertheless, this is included in the table because it is generally highly correlated with the incidence of catastrophic health spending.

Box 3.1
Improving Performance for UHC through Provider Payments:Some Global Experience
ESTONIAThrough the Quality Bonus Scheme (QBS)–a joint initiative between the Estonian Health Insurance Fund and the Estonian Family Physician Association–primary care providers receive “points” for achieving coverage targets across weighted domains of: (i) disease prevention (including child immunization, child preventive care, and cardiovascular prevention); (ii) chronic disease management (for example, diabetes and hypertension); and (iii) specific additional activities (for example, primary care provider training, maternity care). Achievement of at least 80 percent of the points allows the providers to receive a pro-rataed lump sum (negotiated annually) in addition to other payment sources (that is, capitation, travel allowance, and fee-for-service payments for diagnostic procedures). Primary-care physicians determine how the bonus is distributed to nurses and other staff.
ARGENTINAArgentina’s Plan Nacer was initiated in 2004 to provide coverage for the poor in provinces located in the northern part of the country. The program is designed to provide results-based financing to provincial governments based on the number of enrollees in the program, as well as performance on a set of basic health indicators. About 60 percent of intergovernmental fiscal transfers from the central government to the provincial governments are based on the number of enrollees and the remaining 40 percent is tied to attainment of ten tracer indicators, such as immunization rates and average weight at birth of newborns. Service delivery is contracted out by the provincial governments to certified public and private providers, with patients free to choose among the providers. The program finances a conditional matching grant from the central government to provinces that pays one-half the average per capita cost of a basic benefit package covering 80 cost-effective maternal and child-health interventions to uninsured mothers and children up to six years of age. The program has built-in incentives for increasing enrollment rates as well as for provision of quality care. Capitation-based and unit-costed payments encourage negotiation with providers and efficiency in delivery of services.
NEW ZEALANDThe Primary Health Organisation (PHO) Performance Programme–which is transitioning into the Integrated Performance and Incentive Framework (IPIF)–incentivizes eligible PHOs to achieve population health and inequality priorities measured via clinical indicators (for example, childhood vaccination; influenza vaccination in the elderly; cervical and breast cancer screening; cardiovascular risk assessment); process/capacity indicators (for example, progress against performance plan); and financial indicators (for example, pharmaceutical and laboratory expenditure against benchmarks) by paying a flat-rate bonus every six months on the basis of percentage attainment of targets.
UNITED KINGDOMProviders receive quarterly payments when they can prove that at least 70 percent of cohorts of children aged two years registered under the providers have completed immunization for certain types of vaccines. Achievement of a 90 percent target enables providers to receive three times the amount providers would have been eligible for if they had achieved a 70 percent target. Providers also receive an additional payment per child, if the registered child has completed all rotavirus, pneumococcal and meningitis C/HiB booster doses. Recent large intergovernmental transfer programs such as Village Fund also provide an opportunity for performance-based mechanisms to improve immunization coverage at the local level.
41
section three. HEALTH AND UHC OUTCOMES

42
HEALTH FINANCING SYSTEM ASSESSMENTspend more . spend right . spend better

43
section four. HEALTH SYSTEM
section 4 .
HEALTH SYSTEM
44
HEALTH FINANCING SYSTEM ASSESSMENTspend more . spend right . spend better
In Summary
1. Outpatient and inpatient utilization have increased, especially among the bottom 40 percent and at inpatient private facilities, although geographic variation remains high.
2. Utilization patterns at facilities suggest that puskesmas were generally pro-poor while public hospitals were pro-rich.
3. The number of hospitals has doubled over the past decade, more than one-half were private hospitals.
4. The bed-density ratio has increased although it is still below the WHO standard of 2.5 per 1,000, and there is maldistribution of beds across the country.
5. There has been little improvement in the readiness to provide key health services since the 2011 health facility census (Rifaskes).
6. Many Indonesians face significant physical and time barriers to accessing health care.

45
section four. HEALTH SYSTEM
Indonesia has mixed public-private provision of health services and dual practice is legal. The public sector generally has a dominant role in rural areas and for secondary levels of care, but this is not necessarily the case across all health services. Private provision has been increasing rapidly in recent years, including for primary care. The country has 34 provinces, 514 districts/cities, and some 72,000 villages, with public provision decentralized to the district/city level. As a country with over 6,000 inhabited islands, geography poses a significant obstacle to service delivery.
Outpatient and inpatient utilization rates have risen steadily, especially among the bottom 40 percent of the population and at private facilities. In 2015, approximately 17 percent of the population reported
Health Care Organization and Delivery
utilizing outpatient services in the last 30 days and almost 4 percent reported utilizing inpatient services in the past 12 months (SUSENAS 2015). These numbers have increased in recent years following a period of decline during and after the 1997-98 Asian financial crisis (Figure 4.1). IDHS data indicates that the number of caesarean sections–another indicator capturing improved access to high-end maternal health services–has tripled: from 4 per 100 deliveries in 1997-2002 to 12 per 100 deliveries in 2012.
The data indicates an increasing trend of outpatient utilization in all type of facilities, although almost one-half of all outpatient utilization occurred at private facilities in 2015. On the other hand, there is an increasing trend, albeit small, for inpatient services in the private sector (Table 4.1).23
23 Inpatient utilization rates refer to the proportion of the population that utilized inpatient care in the past 12 months (SUSENAS).
Figure 4.1 Inpatient and Outpatient Utilization Rates (1995-2015)
Source SUSENAS (various years).
Outpatient
Inpatient
1995 1998 2004 2004 2007 2015
5
15
0
10
20Percentage(%)
2010

46
HEALTH FINANCING SYSTEM ASSESSMENTspend more . spend right . spend better
Nevertheless, the annual inpatient admission rate remains one of the lowest in the region. There are wide variations in utilization rates across the country with provinces in the Java-Bali region generally having much higher utilization rates compared with other provinces; Maluku, Papua, and North Maluku have some of the lowest utilization rates in the country (Figure 4.2).
Figure 4.3 summarizes the organization of Indonesia’s health system and reflects the relationships among
the major actors. Other ministries and public entities involved in the health sector include the Ministry of Home Affairs, the Ministry of National Development Planning/the National Development Planning Agency (Bappenas), BPJS, the National Food and Drug Control Agency (BPOM), the National Population and Family Planning Board (BKKBN), and the Ministry of Villages, Disadvantaged Regions, and Transmigration (Kemendesa). Provincial Health Offices (PHOs) run provincial hospitals and coordinate cross-district issues. All other public facilities are managed
Figure 4.2 Utilization Rates (by province) (2015)
Source SUSENAS 2015
Mal
uku
Ce
ntr
al K
alim
anta
n
We
st S
ula
we
si
5
25
0
20
10
Percentage(%)
So
uth
Su
mat
ra
Pap
ua
No
rth
Mal
uku
Jam
bi
So
uth
eas
t S
ula
we
si
Ria
u Is
lan
ds
We
st K
alim
anta
n
Eas
t K
alim
anta
n
No
rth
Su
mat
ra
Ria
u
Ce
ntr
al S
ula
we
si
Be
ng
kulu
So
uth
Su
law
esi
Lam
pu
ng
We
st J
ava
Ban
gka
Be
litu
ng
inpatientoutpatient
15
Ban
ten
Eas
t Jav
a
Ce
ntr
al J
ava
We
st P
apu
a
No
rth
Su
law
esi
So
uth
Kal
iman
tan
We
st S
um
atra
Go
ron
talo
We
st N
usa
Te
ng
gar
a
DK
I Jak
arta
Nan
gg
roe
Ace
h
DI Y
og
yaka
rta
Eas
t N
usa
Te
ng
gar
a
Bal
i
Table 4.1 Inpatient and Outpatient Utilization Rates (by economic status and at public/private facilities) (2012-15)
FUNCTION 2012 2013 2014 2015
Outpatient utilization (all)National 12.9% 13.5% 15.4% 17.0%
Bottom 40% 11.7% 12.2% 13.9% 16.0%
Outpatient utilization (private)National 8.1% 8.7% 10.4% 8.7%
Bottom 40% 6.4% 7.1% 8.5% 7.6%
Inpatient utilization (all)National 1.9% 2.3% 2.5% 3.6%
Bottom 40% 1.3% 1.6% 1.8% 2.6%
Inpatient utilization (private)National 0.8% 1.0% 1.1% 1.7%
Bottom 40% 0.4% 0.5% 0.6% 0.9%
Source SUSENAS (2012-2015).

47
section four. HEALTH SYSTEM
Figure 4.3 Organization of Indonesia’s Health System
Source Asia Pacific Observatory and WHO 2015
by District Health Offices (DHOs), under the overall purview of district governments. The central MoH operates some tertiary and specialist hospitals but, otherwise, plays more of a stewardship role in terms of regulation and supervision of the health system.
CentralGovernment &
Parliament
Central Hospital
BPJS
Ministry ofHome Affairs Ministry of Health
ProvincialHealth OfficeProvincial
Government & Parliament Provincial
hospitals
DistrictGovernment &
Parliament
DistrictHealth Office
Districthospitals
Public primarycare facilities
Private clinicsand practice
Regulation
Hierarchical
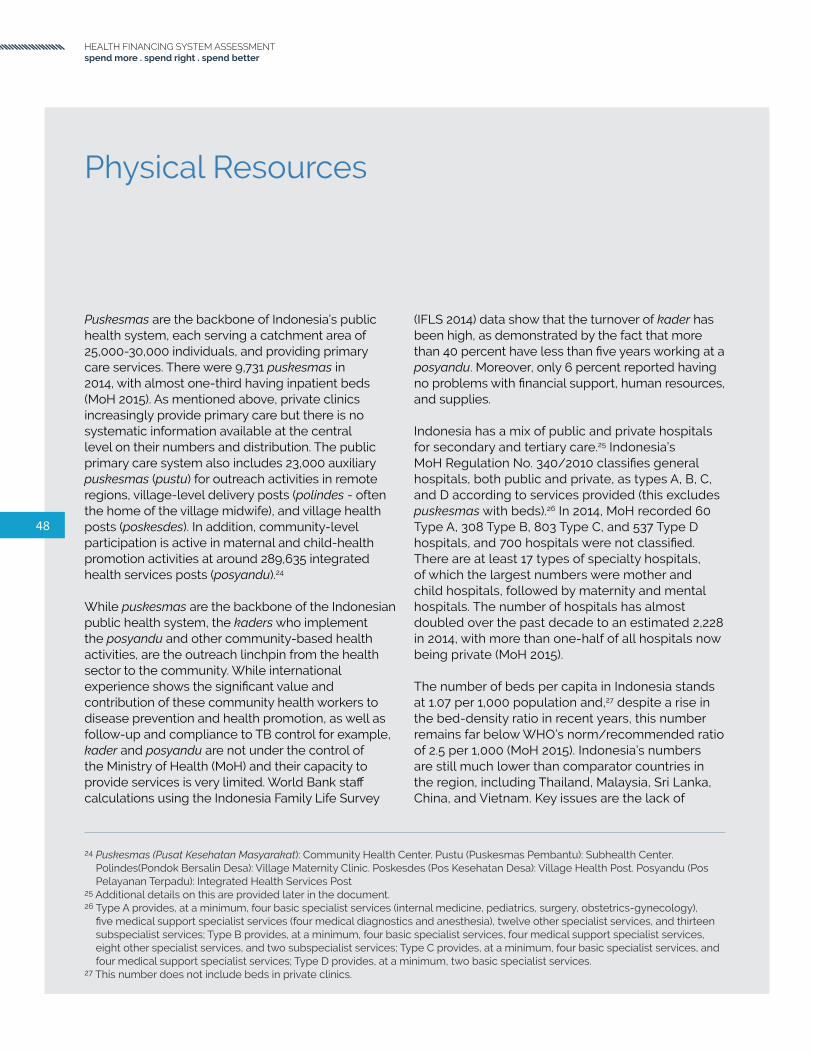
48
HEALTH FINANCING SYSTEM ASSESSMENTspend more . spend right . spend better
Puskesmas are the backbone of Indonesia’s public health system, each serving a catchment area of 25,000-30,000 individuals, and providing primary care services. There were 9,731 puskesmas in 2014, with almost one-third having inpatient beds (MoH 2015). As mentioned above, private clinics increasingly provide primary care but there is no systematic information available at the central level on their numbers and distribution. The public primary care system also includes 23,000 auxiliary puskesmas (pustu) for outreach activities in remote regions, village-level delivery posts (polindes - often the home of the village midwife), and village health posts (poskesdes). In addition, community-level participation is active in maternal and child-health promotion activities at around 289,635 integrated health services posts (posyandu).24
While puskesmas are the backbone of the Indonesian public health system, the kaders who implement the posyandu and other community-based health activities, are the outreach linchpin from the health sector to the community. While international experience shows the significant value and contribution of these community health workers to disease prevention and health promotion, as well as follow-up and compliance to TB control for example, kader and posyandu are not under the control of the Ministry of Health (MoH) and their capacity to provide services is very limited. World Bank staff calculations using the Indonesia Family Life Survey
Physical Resources
(IFLS 2014) data show that the turnover of kader has been high, as demonstrated by the fact that more than 40 percent have less than five years working at a posyandu. Moreover, only 6 percent reported having no problems with financial support, human resources, and supplies.
Indonesia has a mix of public and private hospitals for secondary and tertiary care.25 Indonesia’s MoH Regulation No. 340/2010 classifies general hospitals, both public and private, as types A, B, C, and D according to services provided (this excludes puskesmas with beds).26 In 2014, MoH recorded 60 Type A, 308 Type B, 803 Type C, and 537 Type D hospitals, and 700 hospitals were not classified. There are at least 17 types of specialty hospitals, of which the largest numbers were mother and child hospitals, followed by maternity and mental hospitals. The number of hospitals has almost doubled over the past decade to an estimated 2,228 in 2014, with more than one-half of all hospitals now being private (MoH 2015).
The number of beds per capita in Indonesia stands at 1.07 per 1,000 population and,27 despite a rise in the bed-density ratio in recent years, this number remains far below WHO’s norm/recommended ratio of 2.5 per 1,000 (MoH 2015). Indonesia’s numbers are still much lower than comparator countries in the region, including Thailand, Malaysia, Sri Lanka, China, and Vietnam. Key issues are the lack of
24 Puskesmas (Pusat Kesehatan Masyarakat): Community Health Center. Pustu (Puskesmas Pembantu): Subhealth Center. Polindes(Pondok Bersalin Desa): Village Maternity Clinic. Poskesdes (Pos Kesehatan Desa): Village Health Post. Posyandu (Pos Pelayanan Terpadu): Integrated Health Services Post
25 Additional details on this are provided later in the document.26 Type A provides, at a minimum, four basic specialist services (internal medicine, pediatrics, surgery, obstetrics-gynecology),
five medical support specialist services (four medical diagnostics and anesthesia), twelve other specialist services, and thirteen subspecialist services; Type B provides, at a minimum, four basic specialist services, four medical support specialist services, eight other specialist services, and two subspecialist services; Type C provides, at a minimum, four basic specialist services, and four medical support specialist services; Type D provides, at a minimum, two basic specialist services.
27 This number does not include beds in private clinics.
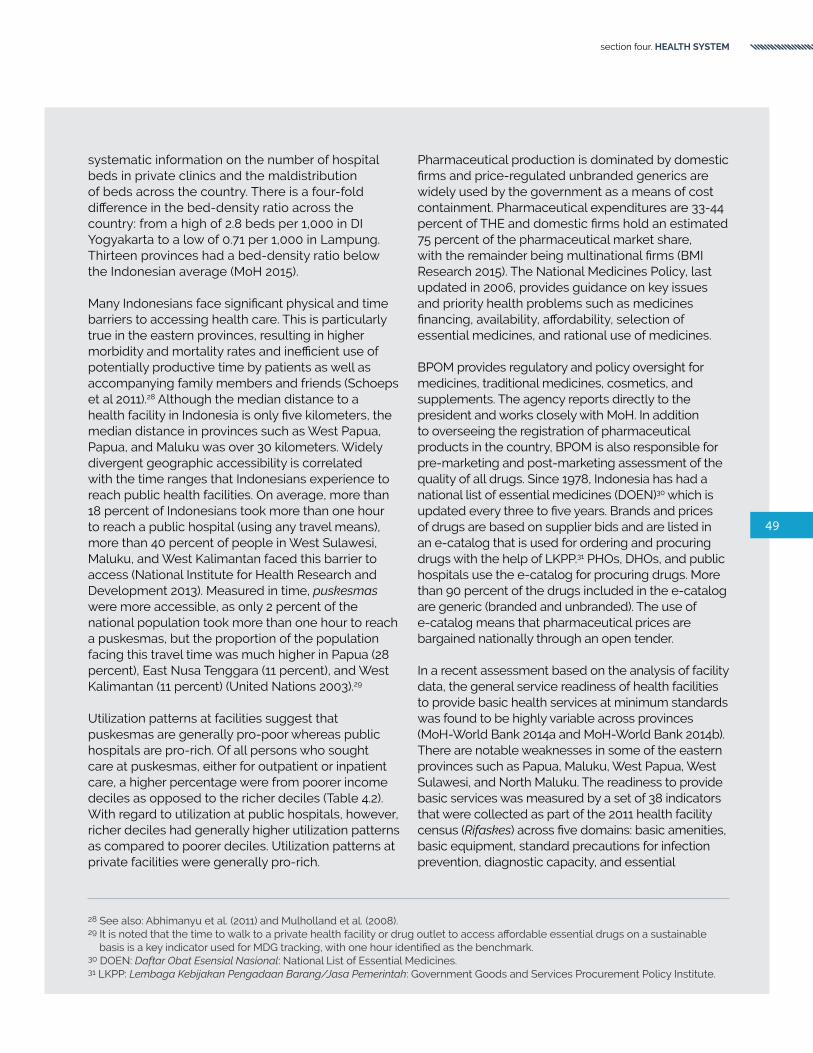
49
section four. HEALTH SYSTEM
systematic information on the number of hospital beds in private clinics and the maldistribution of beds across the country. There is a four-fold difference in the bed-density ratio across the country: from a high of 2.8 beds per 1,000 in DI Yogyakarta to a low of 0.71 per 1,000 in Lampung. Thirteen provinces had a bed-density ratio below the Indonesian average (MoH 2015).
Many Indonesians face significant physical and time barriers to accessing health care. This is particularly true in the eastern provinces, resulting in higher morbidity and mortality rates and inefficient use of potentially productive time by patients as well as accompanying family members and friends (Schoeps et al 2011).28 Although the median distance to a health facility in Indonesia is only five kilometers, the median distance in provinces such as West Papua, Papua, and Maluku was over 30 kilometers. Widely divergent geographic accessibility is correlated with the time ranges that Indonesians experience to reach public health facilities. On average, more than 18 percent of Indonesians took more than one hour to reach a public hospital (using any travel means), more than 40 percent of people in West Sulawesi, Maluku, and West Kalimantan faced this barrier to access (National Institute for Health Research and Development 2013). Measured in time, puskesmas were more accessible, as only 2 percent of the national population took more than one hour to reach a puskesmas, but the proportion of the population facing this travel time was much higher in Papua (28 percent), East Nusa Tenggara (11 percent), and West Kalimantan (11 percent) (United Nations 2003).29
Utilization patterns at facilities suggest that puskesmas are generally pro-poor whereas public hospitals are pro-rich. Of all persons who sought care at puskesmas, either for outpatient or inpatient care, a higher percentage were from poorer income deciles as opposed to the richer deciles (Table 4.2). With regard to utilization at public hospitals, however, richer deciles had generally higher utilization patterns as compared to poorer deciles. Utilization patterns at private facilities were generally pro-rich.
Pharmaceutical production is dominated by domestic firms and price-regulated unbranded generics are widely used by the government as a means of cost containment. Pharmaceutical expenditures are 33-44 percent of THE and domestic firms hold an estimated 75 percent of the pharmaceutical market share, with the remainder being multinational firms (BMI Research 2015). The National Medicines Policy, last updated in 2006, provides guidance on key issues and priority health problems such as medicines financing, availability, affordability, selection of essential medicines, and rational use of medicines. BPOM provides regulatory and policy oversight for medicines, traditional medicines, cosmetics, and supplements. The agency reports directly to the president and works closely with MoH. In addition to overseeing the registration of pharmaceutical products in the country, BPOM is also responsible for pre-marketing and post-marketing assessment of the quality of all drugs. Since 1978, Indonesia has had a national list of essential medicines (DOEN)30 which is updated every three to five years. Brands and prices of drugs are based on supplier bids and are listed in an e-catalog that is used for ordering and procuring drugs with the help of LKPP.31 PHOs, DHOs, and public hospitals use the e-catalog for procuring drugs. More than 90 percent of the drugs included in the e-catalog are generic (branded and unbranded). The use of e-catalog means that pharmaceutical prices are bargained nationally through an open tender.
In a recent assessment based on the analysis of facility data, the general service readiness of health facilities to provide basic health services at minimum standards was found to be highly variable across provinces (MoH-World Bank 2014a and MoH-World Bank 2014b). There are notable weaknesses in some of the eastern provinces such as Papua, Maluku, West Papua, West Sulawesi, and North Maluku. The readiness to provide basic services was measured by a set of 38 indicators that were collected as part of the 2011 health facility census (Rifaskes) across five domains: basic amenities, basic equipment, standard precautions for infection prevention, diagnostic capacity, and essential
28 See also: Abhimanyu et al. (2011) and Mulholland et al. (2008).29 It is noted that the time to walk to a private health facility or drug outlet to access affordable essential drugs on a sustainable
basis is a key indicator used for MDG tracking, with one hour identified as the benchmark.30 DOEN: Daftar Obat Esensial Nasional: National List of Essential Medicines.31 LKPP: Lembaga Kebijakan Pengadaan Barang/Jasa Pemerintah: Government Goods and Services Procurement Policy Institute.

50
HEALTH FINANCING SYSTEM ASSESSMENTspend more . spend right . spend better
medicines (WHO 2013b).32 Across Indonesia, not even one puskesmas reported meeting all 38 indicators available for general service readiness (World Bank 2014).33 While puskesmas, on average, met more than 80 percent of the 38 indicators available in DI Yogyakarta, East Java, and Central Java, only about one-half reported the same level of achievement in Papua and Maluku.
Numerous challenges remain with regard to service-specific readiness, and the capacity of health facilities to provide interventions in key program areas. This includes family planning, antenatal care, basic
obstetric care, routine childhood immunization, malaria, tuberculosis, diabetes, basic surgery, blood transfusion, and comprehensive surgery. In particular, Table 4.3 highlights a snapshot of the deficiencies and variation in provision of key services provided in an analysis of Rifaskes facility data and other sources. These deficiencies are reflective of significant variations in the availability of the JKN benefits package, especially in the eastern parts of the country (MoH-World Bank 2014a and MoH-World Bank 2014b). More recent data (IFLS 2014) reported that there has been little improvement in the readiness to provide key health services (Table 4.3).
Table 4.2 Participation Incidence for Utilization at Public and Private Facilities (2015)
Type of facilityShare OUTPATIENT utilization by income decile (%)(all)
TotalPoorest 2nd 3rd 4th 5th 6th 7th 8th 9th Richest
Public facility 13.2 12.2 13.0 11.4 10.4 9.9 9.4 8.1 7.2 5.2 100.0
Public hospital 6.9 7.8 8.8 8.2 9.1 9.3 10.3 11.4 13.0 15.2 100.0
Puskesmas 14.5 13.1 13.8 12.1 10.7 10.0 9.3 7.5 5.9 3.1 100.0
Private facility 8.6 9.7 9.9 10.4 10.3 10.3 10.3 10.4 10.2 9.9 100.0
Private hospital 3.0 4.2 4.8 5.9 6.4 8.8 10.2 13.1 17.2 26.4 100.0
Private clinic 9.1 10.3 10.4 11.0 10.7 10.5 10.3 10.1 9.6 8.0 100.0
Share INPATIENT utilization by income decile (%) (all)
Public facility 9.2 9.8 10.0 9.6 10.1 10.3 10.7 10.2 10.4 9.7 100.0
Public hospital 8.0 8.3 8.7 9.1 9.9 10.0 11.3 11.2 11.8 11.7 100.0
Puskesmas 13.3 14.3 13.8 11.3 10.7 11.1 8.6 7.7 5.9 3.3 100.0
Private facility 5.0 5.7 5.8 7.1 9.2 9.1 11.3 12.0 15.0 19.8 100.0
Private hospital 3.6 4.8 4.5 6.1 8.0 9.0 11.1 12.3 16.8 23.8 100.0
Private clinic 8.9 8.8 10.0 10.3 13.0 9.1 11.7 11.0 9.5 7.7 100.0
Share INPATIENT utilization by income decile (%) (insured)
Public facility 9.8 9.8 9.7 9.6 9.3 9.9 10.7 10.1 10.8 10.3 100.0
Public hospital 8.4 8.3 8.7 9.2 9.1 9.8 11.3 11.0 12.0 12.2 100.0
Puskesmas 15.5 15.4 13.8 11.4 9.8 10.5 8.7 6.4 5.8 2.7 100.0
Private facility 5.1 5.4 5.2 6.4 8.8 8.4 10.8 11.6 15.8 22.5 100.0
Private hospital 3.9 4.4 4.1 5.6 7.7 8.3 10.8 11.8 17.4 26.0 100.0
Private clinic 9.8 9.4 9.1 9.2 13.7 8.6 10.9 10.8 9.6 8.9 100.0 Source SUSENAS (2015).
32 WHO’s SARA Reference Manual lists 50 indicators for general service readiness while Rifaskes collected data on 38 related indicators.
33 For more information on geographical disparities in public services, see World Bank 2012d.

51
section four. HEALTH SYSTEM
Table 4.3 Deficiencies and Regional Variation in Provision of Key Health Services
Key Health Service
Health Facility Census (2011) Indonesia Family Life Survey (2014)
Family planning
Some 42% of puskesmas lacked one staff member trained in the previous two years in family planning services, and 38% lacked family planning guidelines available at the facility. About 60% of private clinics lacked combined oral contraceptive pills and about 35% lacked injectable contraceptives.
Some 80% of puskesmas lacked one staff member trained in the previous one year in family planning services.About 40% of private clinics lacked combined oral contraceptive pills and about 20% lacked injectable contraceptives.
Antenatal care
In North Sulawesi, Maluku, and Papua, less than 60% of puskesmas were able to diagnose anemia with hemoglobin testing, while urine tests were almost completely unavailable in Gorontalo, North Sulawesi, and Maluku. Only 14% of the 30 private hospitals and 15% of private clinics surveyed were able to conduct hemoglobin or urine tests. This largely explains why only 25% of public hospitals, and none of the 30 private hospitals surveyed maintained all eight antenatal care tracer items.
Some 30% of puskesmas lacked the ability to do hemoglobin tests and about 50% of puskesmas lacked the ability to do urine tests. A total of 90% of private primary care facilities lacked the ability to do urine tests and only one-half of private facilities were able to do hemoglobin tests.
Basic obstetric care
Only 62% of puskesmas mandated to provide BEONC treatment had at least one staff trained in this area in the previous two years. Only 39% of public hospitals, and 3% of the 30 private hospitals surveyed, maintained all 23 basic obstetric care tracer items.
Only about 20% of puskesmas had at least one of their staff trained in safe delivery in the last one year, about 30% lack delivery sets, about one-half of puskesmas and less than one-half of private clinics have uterotonic agents such as oxytocin or ergometrine.
Immunization
More than 20% of puskesmas in Papua, West Papua, and Maluku reported that they did not have measles, DPT, polio, and BCG vaccines, while only about one-quarter of private facilities, and less than 10% of those in the eastern provinces, reported availability of these vaccines.
More than 20% of puskesmas reported that they did not have measles, DPT, polio and BCG vaccines,34 while only about one-quarter of private facilities reported availability of these vaccines.
MalariaAntimalarial medicine was not available in 38% of puskesmas and malaria blood tests were not available in 29% of puskesmas in the 10 provinces with the highest malaria prevalence rates.
Antimalarial medicine was not available in about 60% of puskesmas in areas with the highest malaria prevalence rates.
TBA total of 35% of puskesmas did not have staff trained in TB management, and 27% did not have the capacity to diagnose TB from sputum samples, while crucial first-line treatment was not widely available either in puskesmas or public hospitals.
Some 40% of puskesmas did not have the ability to diagnose TB from sputum samples, and 35% did not have anti-TB medicines.
Diabetes
Only 66% of public hospitals, and 27% of the 30 private hospitals surveyed, maintained all seven diabetes tracer items. Only 54% of all puskesmas reported the ability to test for blood glucose–a crucial aspect in the management of diabetes–and only 47% reported the ability to test urine, with availability of each test well below 20% in six eastern provinces.
Only 70% of all puskesmas reported the ability to do blood glucose tests, and about 65% have medicines such as metformin to control blood sugar.
Basic surgery
Very low availability was evidenced for provision of many key basic surgery items, including nasogastric tubes (16%), guidelines (21%), trained staff (29%), adult and pediatric resuscitators (47%), oxygen (53%), and scalpel handle with blade (56%). Only 53% of public hospitals and 60% of the 30 private hospitals surveyed maintained all 12 basic surgery tracer items.
Not available
Blood transfusion
Only 20% of all public hospitals, and none of the 30 private hospitals surveyed, maintained all six blood transfusion items. Only DI Yogyakarta (47%) and West Sumatra (41%) had more than 40% of public hospitals with all items, while eight provinces had less than 10% of public hospitals with all items. Blood typing capacity was largely unavailable in private hospitals (11%). Hospitals scored very low on sufficient blood supply (public, 41%; private, 13%) and blood supply safety (public, 44%; private 37%).
Not available
Comprehensive surgery
Only 18% of all public hospitals, and 33% of the 30 private hospitals surveyed maintained all nine comprehensive surgery items. Only Bali (62%), DKI Jakarta (47%), and Banten (44%) had more than 40% of public hospitals with all items. In contrast, a large majority of provinces (25 out of 3335 ) had less than 30% of public hospitals with all items, including eight provinces with zero hospitals reaching this target.
Not available
Source Rifakes (Health Facility Cencus) 2011 and IFLS 2014.
34 The question and observation noted the unavailability of vaccines for the past 30 days in the facility.35 There are currently 34 provinces, North Kalimantan province has been created since this census was undertaken.

52
HEALTH FINANCING SYSTEM ASSESSMENTspend more . spend right . spend better
Indonesia has rapidly increased the supply of core human resources for health (HRH) in recent years. The core HRH to population ratio in 2013 was estimated at 2.3 per 1,000, equal to the minimum recommended by WHO as necessary to attain an 80 percent skilled birth attendance rate.36 Of the 2.3 HRH workers, physicians were 0.5, nurses were 1.3, and midwives were 0.5 per 1,000. The nurse-to-physician ratio was 2.6, close to the average observed across OECD countries. Most of the recent rise in HRH has come from increased output of private universities. Indonesia has also made significant investments in improving the quality assurance system of health professional education by strengthening the school accreditation system and introducing nationally standardized competency testing for graduate certification. This was much needed because of the rapidly growing number of health professional schools, especially those that are privately managed.
Despite having attained the minimum WHO norm in terms of aggregate numbers of workers, HRH remains a key challenge for Indonesia’s health sector. Key issues include maldistribution, a shortage of specialists, and poor skills of health workers. Inequalities in the distribution of HRH between geographical regions and provinces, and between urban and rural areas, are stark. For example, the physician-to-population ratio in Kalimantan and Maluku-NTT-Papua is, respectively, one-half and one-third of that in the Java-Bali region. The geographic maldistribution for specialists is even worse than for physicians. Across Indonesia there is an acute shortage of nurses in puskesmas and hospitals compared to MoH standards.37
Human Resources
MoH 2012 data reported large numbers of unfilled posts of nurses at puskesmas (more than 10,000) and hospitals (close to 90,000) (World Bank 2014b). Although midwife and physician availability were similar at around 0.5 per 1,000 population, midwife distribution was much better because of the government policy to deploy midwives down to the villages to improve access to maternal health services. On the other hand, the challenge on the availability and distribution of nutritionists and laboratory technicians at the puskesmas level was still quite significant. Competency of HRH workers is generally low and variable: evidence from vignette responses indicates poor knowledge and awareness of diagnosis and treatment options in several parts of the country.
A large proportion of physicians and midwives are employed in the public sector. Public HRH staff can either be permanent civil servants (PNS) or contract employees (PTT),38 the latter being either physicians or midwives. Despite shortages of nurses in public health facilities, recruitment of nurses, either as PNS or PTT, appears not to be a government priority yet. In principle, deployment of HRH is determined based on a combination of subnational proposals and centralized allocations based on norms. In practice, HRH PNS allocations are based on available slots (formasi) and, since the 1990s, the government has had a zero-growth policy for the civil service and current allocations for PNS HRH are determined largely by central Ministry of Finance (MoF) resources allocated for this purpose channeled through DAU. Formasi in each district is based on attrition only.
36 Indonesia Medical Council and Badan Pengembangan dan Pemberdayaan Sumber Daya Manusia Kesehatan (Badan PPSDMK)(MoH) 2013 data.
37 MoH standards require employment of six nurses for each regular puskesmas and 10 nurses for each puskesmas with beds, while for type A and B hospitals, the standard is one nurse for every bed and for types C and D hospitals, two nurses for every three beds.
38 PNS: Pegawai Negeri Sipil; PTT: Pegawai Tidak Tetap.

53
section four. HEALTH SYSTEM
If a district has special needs (for example, specialists are urgently needed), it can negotiate with the Ministry of Administrative and Bureaucratic Reform (MENPAN) in which case MENPAN will check with MoF regarding resource availability. If, however, the total salary allocation in a given district is already above 55 percent of DAU transfers, not all formasi will be filled. PTT are proposal-based contractual staff deployed at subnational levels and paid for either out of the MoH budget or–in the case of PTT physicians–from the APBD budget. Presidential Regulation No. 81/2004 includes a formula to guide regions in calculating staff need based on workload, but this has never been used.
Most village midwives have been contracted and deployed by the central government, however the government is considering a plan to change this so that current contracted midwives would, become civil servants paid out of APBD (this is a one-off change). Future contract midwives would be paid out of APBD without any guarantees for conversion to civil servant status. These changes could have a significant impact on frontline delivery of health services: on the one hand, this can increase flexibility of districts to hire and deploy village midwives without being constrained by central dictates. On the other hand, this may result in an exacerbation of inequalities given variations in district-level fiscal and managerial capacity as well as in midwife per capita ratios.
Dual practice is legally allowed in Indonesia, and almost 70 percent of physicians and over 90 percent of midwives in puskesmas reported as doing so (Rokx et al. 2010).39 Allowing dual practice represents practical challenges, especially when the system is largely unregulated and unsupervised. Physicians spending more time in private practice is often reported and is an important reason for absenteeism in public facilities. The basic salary for HRH is generally low, but allowances are relatively high. The dual-practice policy also contributes to difficulties in deploying physicians to rural areas where there are less opportunities to earn extra income from private practice.
Since 2013, freshly graduated physicians have to go through an internship with four months at puskesmas and eight months in public hospitals. The MoH has considered task shifting as an option to address HRH availability challenges but this has not yet been formally endorsed/implemented. Article 73 of the 2004 Medical Practice Act, for example, makes it possible for nurses and midwives to perform medical practices as long as they are authorized by regulation. Aside from physicians, family planning and counseling in Indonesia are also provided by midwives.
Indonesia has a long-term strategy for HRH covering the period of 2011-25. Under the overarching objective for everyone to have access to qualified health workers, the strategy has four objectives: (i) strengthening regulation and planning for HRH development; (ii) improving the production/education of HRH to meet service delivery needs; (iii) assuring the equitable distribution, utilization, and development of HRH; and (iv) improving supervision and quality control of HRH. The long-term plan sets strategic goals for HRH indicators, including ensuring that there are 0.96 general physicians per 1,000 population by 2019 and 1.12 by 2025; similarly, medical specialists are to increase to 0.24 per 1,000 in 2019 and to 0.28 per 1,000 in 2025 (MoH 2011).
Despite improvements in coverage and access, the quality of HRH has tended to be low and stagnant in Indonesia. Although some improvements can be observed from comparisons between diagnostic vignettes from the 1997 and 2007 Indonesia Family Life Survey (IFLS), the changes are marginal and overall quality of services remains low, with only around one-half of the health workers responding correctly to standard questions and procedural vignettes.
39 See also World Bank (2008).

54
HEALTH FINANCING SYSTEM ASSESSMENTspend more . spend right . spend better

55
section five. HEALTH FINANCING
section 5 .
HEALTH FINANCING

In Summary
1. Total health spending, and government health spending has increased for the past few years and is expected to increase further to meet the government’s target of 5 percent of General Government Expenditures (GGE) in 2016, however, it remains one of the lowest in the world. The low spending is the result of low prioritization and ability to generate revenue.
2. OOP spending continues to be the largest share of THE, around 45 percent in 2014; partly due to a large population that is still uncovered. The vulnerability to be pushed into poverty due to health shocks remains high.
3. Government spending is around one-third of THE; more than 60 percent spending occurred at the subnational level with complex intergovernmental transfer.
4. JKN is one of the largest SHI schemes in the world covering 57 percent of Indonesia’s population, while it accounts for a small fraction of THE. Challenges of mistargeting and covering nonsalaried, nonpoor workers remain.
5. Comprehensive benefit package without adequate financing leads to limited service availability.6. Indonesia spends two-thirds of THE on curative care; more than 65 percent of JKN expenditures
were for hospital-based inpatient and outpatient care.7. External financing for health remains at a low level (1 percent of THE), but it continues to play a
significant role for several key health programs.
56
HEALTH FINANCING SYSTEM ASSESSMENTspend more . spend right . spend better

57
section five. HEALTH FINANCING
THE per capita was US$126 in 2014, about 3.6 percent of GDP. About 41.4 percent of THE was public (composing government budgetary and social insurance expenditures) with the remainder being private (three-fourths of this is OOP spending by households; the remainder being private/corporate insurance and spending by NGOs). Indonesia is a significant outlier when it comes to health expenditures: its total and public spending share of GDP is one of the lowest in the world, far below what might be expected for its income level and when compared with regional peers (Figure 5.1). In 2014, total (public) health expenditures as a share of GDP was low at 3.6 percent (1.5 percent) in Indonesia, compared to 5.9 percent (3.3 percent) among lower-middle-income countries and 6.6 percent (4.98 percent) in the EAP region. A combination of low levels of national government revenues/expenditures (mentioned earlier), low prioritization of health in the government budget (discussed in more detail below), high levels of informality, and relatively low levels of utilization of health care services (discussed earlier) help explain the low levels of total and public health expenditures in Indonesia. Both total and public expenditure on
health as a share of GDP have been outpacing GDP growth rates since around 2000, with growth in the former generally outpacing the latter (Figure 5.2).
Projected economic growth is likely to increase overall public spending on health. Over 1995-2014, the elasticity of public spending on health (including central, subnational, and SHI) to GDP per capita has been about 1.2, implying that for every 1 percent change in GDP per capita, public spending changed by 1.2 percent on average (Figure 5.3). With an average annual growth rate of GDP per capita of 8.1 percent expected over 2017-21, and assuming the elasticity follows the same trend as it has over the period 1994-2014, this would imply an increase of almost 10 percent per year in public spending on health per capita over the next five years.
As might be expected, elasticity of budgetary health spending varies between central and subnational governments. While the average elasticity for central government health spending to GDP per capita has only been 0.85, implying that a 1 percent increase in GDP per capita has led to an increase in central government health spending of only 0.85 percent on average, post decentralization subnational
Figure 5.1 Total and Public Expenditure on Health as Share of GDP vs Income (2014)
Source World Development Indicators database 2016Note : (i) Indonesia 2014 figure based on NHA country report. (ii) Both x and y axes in log scale.
250 500 1000 1000002500
GNI per capita, US$
10000 35000
LOW INCOME HIGH INCOME
LOWERMIDDLEINCOME
UPPERMIDDLEINCOME
2
.5
20
15
10
5
1
250 500 1000 1000002500
GNI per capita, US$
10000 35000
LOW INCOME HIGH INCOME
LOWERMIDDLEINCOME
UPPERMIDDLEINCOME
2
.5
20
15
10
5
1
Total Health ExpenditureShare
of GDP(%)
Shareof GDP
(%)Public Health Expenditure
South Africa
Cambodia
Rusia
Indonesia
Thailand
Philippines
Malaysia
Brazil
India
Sri Lanka
Lao PDR
Vietnam
China
Nigeria
Papua New Guinea
Solomon Islands
Ghana
South Africa
Cambodia
Rusia
Indonesia
Thailand
Philippines
Malaysia
Brazil
India
Sri Lanka
Lao PDR
Vietnam
China
NigeriaPapua New Guinea
Solomon Islands
Ghana

58
HEALTH FINANCING SYSTEM ASSESSMENTspend more . spend right . spend better
Figure 5.2 Total and Public Expenditure on Health as Share of GDP (1995-2014)
Source World Development Indicators database 2016Note Total and public spending is in 2014 constant IDR.
Figure 5.3 Elasticity of Public Spending on Health (1995-2014)
Note data in IDR millions
1995 20052000 2014
400,000
1,200,000
0
800,000
1,600,000IDRper
capita
2010
Shareof GDP(%)
Total as % share of GDP (right axis)
Public as % share of GDP (right axis)Total per capita (left axis)
Public per capita (left axis)
.5
1.5
0
1
2
2.5
3.5
3
4
Elasticity=1.2
.05
.1
.2
.4
.6Publicexpenditure
on healthper capita
2 3 4 6 10 15 20 30 50
GDP per capita
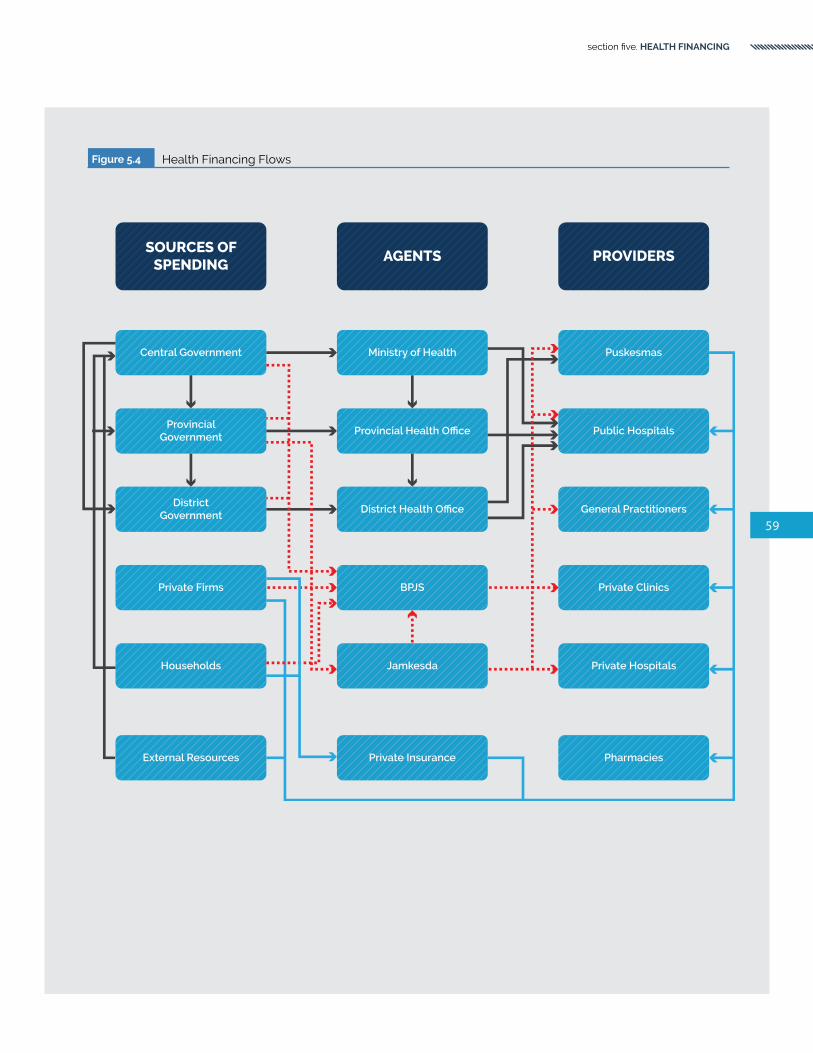
59
section five. HEALTH FINANCING
Figure 5.4 Health Financing Flows
SOURCES OFSPENDING
Central Government
AGENTS PROVIDERS
ProvincialGovernment
DistrictGovernment
Private Firms
Households
External Resources
Ministry of Health
Provincial Health Office
District Health Office
BPJS
Jamkesda
Private Insurance
Puskesmas
Public Hospitals
General Practitioners
Private Clinics
Private Hospitals
Pharmacies

60
HEALTH FINANCING SYSTEM ASSESSMENTspend more . spend right . spend better
government elasticity to GDP has been higher–at 1.3.At 45.3 percent of THE (1.6 percent of GDP), OOP spending by households remains the largest source of health financing for Indonesia. This was followed by general government budgetary expenditures (41.4 percent of THE or 1.5 percent of GDP). SHI accounted for 13 percent of THE (0.5 percent of GDP) in 2014. As with other countries in the region such as the Philippines and Vietnam, in addition to large levels of OOP health spending, Indonesia’s public health financing system is characterized by the coexistence of traditional government budgetary supply-side health financing and demand-side SHI financing. It is not clear why this dual cofinancing modality remains and whether this will change in the near- to medium term.
Figure 5.4 summarizes the prominent financing flows in Indonesia’s health system. Government budgetary funding flows (in black) include the process of
Table 5.1 Key Health Financing Indicators (2014)
CountryTHE expenditure
per capitaShare of GDP (%)
Public share (%)
SHI share (%)
OOP share (%)
External share (%)
Brazil US$947 8.3 46.0 0.0 25.5 0.0
Cambodia US$61 5.7 22.0 0.0 74.2 16.3
China US$420 5.5 55.8 37.7 32.0 0.0
India US$75 4.7 30.0 1.7 62.4 1.0
Indonesia* US$126 3.6 41.4 13.0 45.3 0.8
Lao PDR US$33 1.9 50.5 1.6 39.0 31.8
Malaysia US$456 4.2 55.2 0.6 35.3 0.0
Philippines US$135 4.7 34.3 14.0 53.7 1.4
Russia US$893 7.1 52.2 27.7 45.8 0.0
South Africa US$570 8.8 48.2 1.2 6.5 1.8
Sri Lanka US$127 3.5 56.1 0.0 42.1 1.3
Thailand US$360 6.5 86.0 5.1 7.9 0.0
Vietnam US$142 7.1 54.1 24.1 36.8 2.7
East Asia and Pacific US$217 4.9 49.9 12.1 40.5 6.6
Lower-middle-income US$106 4.2 44.4 8.6 46.5 6.5
Source World Development Indicators database 2016. * Indonesia data is based on the NHA country report, 2014 (Ministry of Health -Center for Health Economic Policy Studies-AIPHSS. 2015)
collection of revenues from households, private firms, and external sources and transfers to subnational governments and health facilities. BPJS is the SHI administrator that collects contributions from the government, private firms, and households into a single national pool and purchases health services from public and empaneled private providers (in orange). Private flows include OOP spending from households and firms at public and private facilities (in blue). Over the past five years, only about 1 percent of THE has come from external sources. From the perspective of per capital spending on health, among comparators, Indonesia’s health financing situation most closely mirrors that of the Philippines and Vietnam (Table 5.1).
The next subsections provide an overview on each of the four major health financing sources: government budgetary spending, SHI, OOP spending, and external financing.

61
section five. HEALTH FINANCING
National government budgetary expenditures on health amounted to IDR 467,959 (~US$39) in per capita terms in 2014 and are the second-largest source of financing for health in Indonesia. In the same year, in aggregate, national government expenditures on health were IDR 118.3 trillion (~US$9.9 billion) in 2014, about 1.1 percent of GDP40 based COFIS data and 1.5 percent of based on the data from the Indonesia NHA country report. Aggregate national expenditures on health have increased by an average of 7 percent per year since the advent of decentralization in 2001. National government health expenditure has also been rising as a share of GDP and as a share of total national government expenditures since the turn of the century, albeit at a somewhat slower pace since
Government Budgetary Expenditure on Health
2008. Provisional estimates indicate a decline in 2015, however, it remains to be seen if this trend is realized (Figure 5.5).
Health’s share of the national (that is, combined central and subnational) budget is relatively small in Indonesia. WHO data indicate that Indonesia’s prioritization for health is on the lower side in global comparisons: several countries including the Philippines, China, South Africa, and Thailand devote a much larger share of the budget to health (Figure 5.6).41 At 4.7 percent, health’s share of the national budget is small relative to that of general government administration (~20 percent), subsidies (~20 percent), education (~20 percent), and infrastructure (~10 percent). The combination of a relatively small overall
40 Data was generated using The Indonesia Consolidated Fiscal dataset (COFIS). The database has been developed by the World Bank COFIS team and contains data on expenditure from the central and subnational (provinces, districts) governments. The data comes from publicly available data sources, managed by the Government of Indonesia (GoI) and, unless indicated otherwise, is audited realized expenditure data.
41 In WHO data, this share is calculated by combining government budgetary expenditures and social health expenditures
Figure 5.5 National Government Budgetary Expenditures on Health (1995-2015)
Source Indonesia COFIS database 2016.Note 2015 numbers are provisional.
1995 2000 2005 2015
1
4
0
3
5
2
Share (%)
2010
6
Share of national government expenditure
Share of GDP

62
HEALTH FINANCING SYSTEM ASSESSMENTspend more . spend right . spend better
Figure 5.6 Health’s Share of National Budget (2014)
Source World Development Indicators database Indonesia using COFIS databse
Figure 5.7 Trends in Government Health Spending by Level of Government (1995-2013)
Source Indonesia COFIS databaseNote Data in 2013 constant IDR
CENTRAL
PROVINCE
DISTRICT
0
200
400
600
800
1000
Rp trillion
1995 2000 2005 2010 2013
China
South Africa
Thailand
Philippines
Lao PDR
Cambodia
Vietnam
Brazil
Russia Sri Lanka
Indonesia
IndiaMalaysia
0
5
10
15
20
25
30
Percentage (%)

63
section five. HEALTH FINANCING
share of government spending as a share of GDP and relatively low prioritization given to health are two reasons why Indonesia’s health expenditure share of GDP is one of the lowest in the world. District governments have taken an increasingly dominant role in government health spending postdecentralization in 2001. Over one-half of national government expenditures on health now occur at the district level, up from an average of less than 10 percent predecentralization (Figure 5.7). The provincial share of government health expenditures has also declined: from an average of over 30 percent predecentralization to just over 15 percent postdecentralization. The level of decentralization as reflected in government expenditures for health is similar to that for education for which, in 2013, 57 percent of spending occurred at the district level, 36 percent at the central level, and 7 percent at the provincial level.
Annual planning and budgeting occurs in parallel top-down and bottom-up streams. The top-down stream creates a national budget and seeks to anticipate and prepare for the financial needs from the central budget, whether for core or noncore functions. To this end, stakeholders must consider the overall government budget and the relative importance of various priorities, including health, in the budget. These competing priorities are considered in the context of revenue forecasts established by the Fiscal Policy Office of the MoF. Bottom-up planning, on the other hand, considers local needs and ability to address these needs in the development of local plans and budgets.
The process undertaken by the health unit, for example, considers the health profile of the population in a given area, and seeks to put into place a plan to address these needs. This plan considers that current status and additional needs of the health system inputs, including the number and mix of health workers, drugs, equipment/supplies, and infrastructure availability. These plans are then integrated with similar plans from other sectors, for example, education and infrastructure, and compiled into a single, integrated district plan. District plans are collated and merged to create provincial plans. In both cases, planning and budgeting follows a specified schedule and culminates in October each year with
the formal approval of the plan by the parliament or the local council for the national and local budgets, respectively. For the past ten years, expenditures for health have closely tracked allocations.
There are some expenditures that occur at the subnational level but are financed centrally and are recorded under APBN and not under APBD. For example, deconcentration funds (DEKON) are allocated by line ministries under APBN (for example, to MoH) but are administered by provincial governments (so for health these are administered by PHOs) and are used to finance nonphysical activities, for example for technical assistance, training, supervision, research, and promotion. Co-Administered Tasks (Tugas Pembantuan, TP) are allocated in line ministries for in-kind grants to districts for vaccines, drugs, and supplies. MoH also pays for the salary of contract physicians and contract midwives (PTT) employed by districts. PTT physicians work in the puskesmas, while PTT midwives are usually based at the village (some districts recruit additional physicians/midwives under PTT using their own resources).
There are budgetary benchmarks for health spending. In 2009, the DPR enacted Law No. 36/2009 stipulating that at least 5 percent of the central budget (APBN) and 10 percent of the district budget (APBD), excluding salaries, be allocated for health. In addition, the law states that at least two-thirds of the health budget from the central and district budgets should be prioritized for public services, in particular health services benefitting the poor, elderly, and disadvantaged children.
By “function”,42 health received less than 2 percent of the central government budget in 2013. The largest share of central government expenditure was for fuel and other subsidies (Table 5-2). Premium payments for health insurance for the poor and near-poor–which are functionally classified under “general public services”–were less than 1 percent of all central government expenditures. A key policy change is that planned expenditures for fuel and other subsidies have declined significantly for 2015: from almost one-fifth of the budget in 2013 and 2014 to only 5 percent in 2015. This has not, however, had an impact on health’s share of the government budget that remains at less than 2 percent
42 The government categorizes budget expenditures into 11 functions.

64
HEALTH FINANCING SYSTEM ASSESSMENTspend more . spend right . spend better
for 2015. The largest beneficiary of the decline in fuel and other subsidies appears to be the economic affairs function and, to a lesser extent, education. By “sector”,44 health’s share of the central government budget was 3 percent in 2013. The government’s sectoral classification for health includes health-related expenditures undertaken by nonhealth line ministries, premium payments for health insurance for the poor and near-poor, as well as interfiscal transfers related to health (for example, DAK). In the 2016 budget and 2017 budget plan, the health share of the central budget reached and stabilized at 5 percent, the legally mandated amount for the sectoral health share of central government expenditures. The changes in 2017 will include another increase of DAK for health following last year’s significant increase that more than doubled from 2015. While the 2017 budget plan maintains the 2016 health share of the central budget at 5 percent, it is against a reduced overall revenue. The budget envelope for the health sector may experience a slight decline in nominal terms in 2017, IDR 103.5 trillion, compared to IDR 104.1 trillion in 2016.
Within the health sector, expenditure allocations can be assessed from an economic as well as a functional perspective. Functional allocations delineate expenditures based on the purpose towards which funding is targeted (for example, individual versus community health care), while an economic classification focuses on the economic characterization of spending (such as, capital versus recurrent). Less than 15 percent of central government expenditures for health were for personnel costs, over 51 percent was for goods and equipment, roughly 11 percent for capital, and 25 percent for social assistance. Although there are no global optimal norms for assessing economic classification shares, comparisons with other countries suggest that both the personnel cost share of government health expenditures and for goods and equipment are on the low side for central government expenditures. By function, most (58 percent) of central government health spending was for individual health care, 10 percent was for drugs and medical supplies, 10 percent for community health, and 9 percent for family planning.
Table 5.2 Central Government Expenditures by Function (2013-15)43
Expenditure Category2013 2014 2015
IDR trillion Share (%) IDR trillion Share (%) IDR trillion Share (%)
General public services 706 62.0 798 66.2 695 52.7
Fuel subsidies 210 18.5 240 19.9 65 4.9
Electricity subsidies 100 8.8 102 8.5 73 5.5
Nonenergy subsidies 45 4.0 50 4.2 74 5.6
Interest payments 113 9.9 133 11.1 156 11.8
Premiums for poor and near-poor 8 0.7 20 1.7 20 1.5
Economic affairs 108 9.5 97 8.1 216 16.4
Defense 88 7.7 86 7.2 102 7.8
Education 115 10.2 123 10.2 156 11.8
Health 18 1.5 11 0.9 24 1.8
Social protection 17 1.5 13 1.1 23 1.7
Other 86 7.6 76 6.3 103 7.8
Total 1,138 100 1,204 100 1,319 100
Source LKPP 2013-2014 Audited.Note Budget revised memorandum 2015.
43 This excludes intergovernmental fiscal transfers.44 Since 2011, some health spending on goods, services and capital items from nonprofit public service agencies (Badan Layanan
Umum), puskesmas, and regional public hospitals (RSUD) has been reclassified into the “General public services” function instead of “Health function”. To make the definition consistent across time, the World Bank developed a new classification of “Sector” that put the above spending back into the health function.

65
section five. HEALTH FINANCING
Table 5.3 Subnational Government Expenditures (2013)
Expenditure CategoryIDR trillion Share (%) IDR trillion Share (%)
Districts Provinces45
Education 179 34.1 21 12.1
General government administration 137 26.1 70 40.5
Infrastructure 88 16.8 36 20.8
Health 53 10.0 18 10.4
Other 68 13.0 28 16.2
Total 525 100 173 100
Source COFIS database; World Bank staff calculations based on MoF data.
Health represents about 10 percent of both district and provincial government expenditures. At least in aggregate across districts, health meets the legally mandated minimum requirement for health expenditures. Education was the biggest share of district expenditures (accounting for more than one-third of the spending). General government administration represented the greatest share of provincial expenditures (Table 5.3).
Aggregate numbers mask huge variations across districts in government budgetary health spending, both in levels and as a share of district expenditures. A rapid assessment across 44 districts showed health’s share of the district budget varies from 3 percent to over 18 percent, with an average of 10 percent in 2013 (Figure 5.8). This translated into fairly large variations in per capita terms.
45 Excludes intergovernmental transfers to districts.
Figure 5.8 Health’s Share of Government Budget and Per Capita Spending Across 44 Districts (2013)
Kab
. De
li S
erd
ang
Kab
. Ban
yuw
ang
i
Ko
ta B
and
un
g
5
0
20
10
Percentage (%)
Ko
ta B
anja
rmas
in
Kab
. Mal
ang
Kab
. Tas
ikm
alay
a
Kab
. Lam
pu
ng
Tim
ur
Kab
. Ban
du
ng
Ko
ta B
anja
r B
aru
Kab
. Lam
pu
ng
Uta
ra
Ko
ta P
adan
g
Kab
. Pe
saw
aran
Kab
. Gar
ut
Kab
. Pe
mal
ang
Be
ng
kulu
Kab
. Tu
ban
Ko
ta B
and
ar L
amp
un
g
Kab
. Og
an K
om
erin
g Il
ir
Kab
. Lan
gka
t
Health share of district government budget (left axis)
Government health expenditure per capita (right axis)
15
Kab
. Jo
mb
ang
Kab
. Bat
u B
ara
Ko
ta S
ura
bay
a
Kab
. Ke
diri
Kab
. Ke
nd
al
Kab
. Lam
pu
ng
Bar
at
Kab
. Lab
uh
an B
atu
Uta
ra
Kab
. Maj
ale
ng
ka
Kab
. Nia
s S
ela
tan
Kab
. Lab
uh
an B
atu
Kab
. In
dra
giri
Hili
r
Kab
. Lu
wu
Kab
. Pe
kalo
ng
an
Kab
. Mu
ara
En
im
Ko
ta C
ileg
on
Kab
. Ace
h J
aya
Ko
ta L
ho
kse
um
awe
Kab
.Lah
at
Kab
. Je
ne
po
nto
Kab
. Waj
o
Kab
. Kau
r
Ko
ta P
asu
ruan
Kab
. Ban
gka
Bar
at
Kab
. Mal
uku
Te
ng
gar
a B
arat
Kab
. Sim
eu
lue
Ko
ta P
are
-Par
e
200
0
800
400
600
IDR thousands

66
HEALTH FINANCING SYSTEM ASSESSMENTspend more . spend right . spend better
SHI expenditures are the third-largest source of financing for the health sector in Indonesia, accounting for 13 percent of THE. BPJS revenue from contributions amounted to almost IDR 52.8 trillion (~US$3.96 billion) in 2015, about 40 percent of national government budgetary expenditure on health. Official BPJS reports indicate that JKN covered 156.8 million individuals (~60 percent of the population) in 2015. This represents an average expenditure of IDR 336,735 (~US$25) per member per year.
BPJS pools contributions from three broad categories of people: (i) the poor and near-poor; (ii) salaried workers in the formal sector; and (iii) nonsalaried, nonpoor workers in the informal sector. Fixed premium contributions of IDR 23,000 (~US$2) per person per month are paid for entirely by the central government for the poor and near-poor. This group was previously covered under the Jamkesmas
Social Health Insurance (SHI)
program). Salaried workers employed in the public and private sector pay 5 percent of their salary (3 percent employer and 2 percent employee for public sector workers; 4 percent employer and 1 percent employee for private sector workers). This group includes those who were previously covered under Askes and Jamsostek, respectively. Nonsalaried, nonpoor workers in the informal sector are expected to pay a voluntary fixed premium contribution (ranging from ~US$36-72 per year) upon enrollment in the program. The local health insurance schemes are expected to fold into the national scheme, JKN, in 2016 which will reduce the opportunity to use local health insurance schemes as a political influence for local election (Pisani, Kok, Nugroho, 2016).
JKN benefits are unified, except for hoteling entitlements which vary by level and type of contribution. JKN membership includes 87.8 million

67
section five. HEALTH FINANCING
Table 5.4 JKN Membership and Contributions by Type (2015)
Classification of Member
Membership Contributions
Number (million)
Share of total (%)
Amount (IDR trillion)
Share of total (%)
Salaried 37.9 24.2 25.8 48.8
Public – – 15.0 28.4
Private – – 10.8 20.5
Nonsalaried 20.0 12.8 4.7 8.9
Informal 15.0 9.6 – –
Unemployed 5.0 3.2 – –
Poor and near-poor 99.0 63.1 22.3 42.2
Central government-financed 87.8 56.0 19.9 37.7
Subnational government financed 11.2 7.1 2.4 4.5
JKN (total) 156.9 100 52.8 100
Source BPJS 2015.
Table 5.5 SHI Expenditure Pre- and Postunification (2013-15)47
SHI ProgramExpenditure per member (Average IDR)
2013* 2014** 2015**
Askes 500,000 – –
Jamsostek 60,000 – –
Jamkesmas 100,000 – –
Askes+Jamkesmas+Jamsostek 132,000 – –
JKN (PBI) – 94,098 100,455
JKN (Non-PBI) – 635,318 539,668
JKN (total) – 249,281 262,344
Source *Annual reports; **Author estimates.
46 Author estimates. It does not include capitation and noncapitation amounts at the primary care level. (Based on Ministry of Health presentation: “Introduction to Constructive Dialog for JKN Improvement”. Jakarta, May 30, 2016
(56 percent of those covered) noncontributory central government-financed poor and near-poor, 37.9 million (24 percent) public and private sector contributory salaried workers, 20 million (13 percent) contributory nonsalaried, nonpoor individuals, and 11.2 million (7 percent) covered under subnational Jamkesda programs administered by
BPJS (the latter are slated for phase-out by 2017)(World Bank 2015d). Salaried workers contribute a larger share to the overall revenues (49 percent) than their share of membership in JKN (Table 5.4). Contribution collection from nonsalaried (informal and unemployed) workers is disproportionately small relative to their share of membership.

68
HEALTH FINANCING SYSTEM ASSESSMENTspend more . spend right . spend better
Table 5.6 JKN Service Coverage
LEVEL OF CARE TYPE OF SERVICE
Primary care Primary care coverage includes: (i) administration services; (ii) promotive/preventive services; (iii) examination, treatment, and medical consultation; (iv) nonspecialist medical treatment, both operative and nonoperative; (v) drug services, medical consumables and materials; (vi) blood transfusion in accordance with medical needs; (vii) laboratory diagnostic primary level; and (viii) primary hospitalization in accordance with medical indications.
Secondary and tertiary care
Secondary and tertiary care coverage includes: (i) administration services; (ii) examination, treatment and specialist consultation by a specialist and subspecialty; (iii) specialist medical treatment in accordance with the medical indications; (iv) drug services, medical consumables and materials; (v) advanced diagnostic services in accordance with medical indications; (vi) medical rehabilitation; (vii) blood services; (viii) forensic medical services; (ix) corpse in health facilities; and (x) nonintensive inpatient care; and (xi) hospitalization in intensive care.
In per-member terms, SHI expenditures have almost doubled between 2013 and 2015.47 While in 2013 Indonesia had several fragmented programs–Askes for the formal public sector, Jamsostek for the formal private sector, and Jamkesmas for the poor and near-poor, each with different benefits and expenditure patterns–implementation of the unified JKN program as of 2014 appears to have resulted in consolidation and a big increase in financing from SHI in Indonesia’s health sector (Table 5.5).
JKN membership coverage has increased significantly. By the end of April 2016, BPJS Health reported 165 million of the population have been covered, a 24 percent increase compared with the end of 2014. The insurance coverage is relatively high among low-income and high-income groups, but it remains relatively low amongst nonpoor informal sector workers (only about 7 percent of the nonpoor informal sector population currently has JKN coverage); hence, Indonesia faces a “missing middle” problem.
JKN’s benefits package is comprehensive and is set and updated by MoH, not BPJS. The benefits package is not explicit in that all medically necessary coverage is automatically deemed to be covered without any copayments, balanced billing, or expenditure caps. JKN benefits include both medical and nonmedical benefits. Medical benefits include comprehensive health services at the primary, secondary, and tertiary levels; nonmedical benefits include accommodation and emergency transportation to health facilities. Medical services include a range of services that
fall under promotive, preventive, curative and rehabilitative services. All registered JKN members are entitled to a range of medical services, including consultation and treatment at a primary health care center (puskesmas or empaneled private clinic). Primary care facilities act as gatekeepers and manage access to higher level services. Service coverage categories are outlined below in Table 5.6.
JKN has a “negative list” that specifies what is not covered. The negative list includes: (i) health services that do not follow stipulated procedures, including referrals; (ii) health services in facilities that are not contracted by BPJS, except under emergencies; (iii) health services that are covered by occupational accidental insurance; (iv) health services abroad, cosmetic procedures, health services for infertility, and orthodontic services; (v) health disorders/diseases caused by drug addiction and/or alcohol; (vi) health problems caused by self-harm; (vii) complementary treatment using alternative/traditional medicine, unless deemed effective by health technology assessments; (viii) experimental procedures, health equipment for households, contraceptives, baby food, and milk; and (ix) health services for disaster situations.
An explicit benefit package is crucial to ensure the adequacy of service and financing. In the absence of an explicit benefit package, providers refer to various national clinical guidelines and from drugs that are included in the national formulary (FORNAS) as JKN’s ‘positive list’. As a result, there are variations in standards of practice and case management, which in
47 The 2013 numbers exclude Jamkesda outlays as this information was not available.

Box 5.1
Covering the Informal Sector: Lessons from Global Experiences
The path to expanded health coverage in lower-middle-income countries generally begins with the dual strategy of enrolling formal-sector workers into contributory schemes while the government fully subsidizes health care for those who qualify as poor. This typical pathway omits nonpoor informal workers, who can be difficult to identify and whose income is both uncertain and often impossible to verify. This has led to the so-called problem of covering the “missing middle” for countries seeking to achieve UHC.
Global experience suggests two basic approaches to providing coverage for nonpoor individuals working in the informal sector: (i) noncontributory schemes in which resources for the poor are extended to the informal sector (as in Thailand); and (ii) contributory schemes, in which schemes targeting the formal sector are extended to the informal sector (as in Indonesia), generally in some tiered form according to ability to pay. Whether a country takes the first, the second, or a mix of the two approaches generally depends on political and economic factors within the country. These include fiscal space capacity and constraints to expanding coverage, the size and make-up of the informal sector within the country, and the institutional capacity to identify and verify the income of informal sector workers.
Turkey provides health coverage for the nonpoor informal sector through its Green Card program, which was initially launched in 1992 as a noncontributory health insurance scheme for the poor. Through a comprehensive health reform–the “Health Transformation Project”–in 2003, Turkey subsequently merged all existing health insurance schemes, including the Green Card program in 2012, into a Universal Health Insurance Scheme managed by the Social Security Institution. Although targeting of the informal sector has historically been difficult, Turkey’s efforts to expand benefits, and improve supply-side readiness, coupled with the establishment of a sophisticated, responsive system to determine contributions from the informal sector (dependent on household income, value or size of property occupied, as well as size and age of car owned) has resulted in expanded coverage for the informal sector. From 2003 to 2008, targeting performance of the Green Card improved and about 70 percent of benefits reached the lowest quintile in 2008, from just 55 percent in 2003, highlighting the effective targeting of the program and improving levels of financial protection and equity in Turkey.
Both the noncontributory and contributory approaches raise issues. Challenges to the former include the fiscal space implications of general revenue financing. While this strategy enables a rapid expansion to the noninsured population, lower-income countries in particular often have very large informal sector employment and may not have the capacity to do so. Unless new taxes are introduced to cover the informal sector, the budget impact is immediate, forcing trade-offs within the health sector or across sectors. This approach may, therefore, work best in countries with relatively small nonpoor informal sectors. Other issues to consider include the concern that general revenue financing may encourage informality (reported in Mexico) and misreporting of income. The latter was a serious issue with the Chilean system, with an audit finding that up to 400,000 persons had misreported their income in order to avoid paying contributions.
Important challenges to the contributory scheme include the difficulty of establishing the income of informal sector workers, and the costs associated with developing the infrastructure to routinely report and monitor income. Identification of eligible individuals can be a challenge in any event, and is exacerbated when potential beneficiaries may seek to avoid contributions. The administrative costs of maintaining a contributory scheme can be quite high, especially as informal workers frequently have fluctuating income and their eligibility for any subsidies must be regularly reviewed. When no additional budget is provided, however, contributions can help to pay for the scheme, and contributory schemes may help to encourage a sense of entitlement, leading patients to advocate for better services.
In addition to considering the premium, insurance schemes must consider whether they will rely on mandatory or voluntary enrollment. This is a particularly important consideration for contributory schemes. Mandatory contributions can be both challenging and costly to implement, while voluntary enrollment schemes typically have low uptake and result in substantial adverse selection. Literature suggests that “…successful initiatives to cover this population group are the ones where the government has abandoned its expectations to derive relatively substantial revenue from it,” and typically offer informal workers a smaller benefit package than that offered to formal-sector employees, but that is accessed at a far lower premium. Although they come at the cost of a fully equitable universal health insurance system, these tiered schemes are designed to encourage accurate income reporting and, thereby, strengthen the financial sustainability of the system.
Source: Bitran 2014.
69
section five. HEALTH FINANCING

70
HEALTH FINANCING SYSTEM ASSESSMENTspend more . spend right . spend better
the end leads to inefficiency in service delivery. There are several examples of countries (such as Chile) that have moved from a model of open-ended “everything is covered” to one in which a basic set of benefits is explicitly covered and guaranteed with adequate financing from public sources (via government budgetary supply-side expenditures and/or social health expenditures).
BPJS provides coverage in public and empaneled private facilities and reimburses claims based on tariffs set by MoH. BPJS reimbursements do not cover the full cost of care and there is significant cofinancing by supply-side government budgetary expenditures in the public sector (nevertheless, reimbursements are the same for both public and private facilities). Primary care is paid by capitation and reimbursements to hospitals are based on diagnosis-related groups (known as INA-CBG). Procurement of medicines and equipment in the
public sector is the purview of DHOs. MoH has a health technology assessment unit that determines changes in medical technology.
There is a national formulary (FORNAS) recommended by an expert group managed by MoH that was adopted in 2013. It is an expanded version of the DOEN that forms the basis for the provision of drugs under JKN. The FORNAS lists the generic name, usage, and formulation of drugs but does not list brand or price. Private clinics that are empaneled by BPJS can also use the abovementioned e-catalog services, however, general practitioners empaneled by BPJS cannot use the e-catalog and must rely on private pharmacies. Not all of the drugs in FORNAS were available through the e-catalog and the e-catalog can list more than one supplier for a drug.
According to the NHA (2014), more than 65 percent of JKN expenditures were for hospital-based inpatient
Table 5.7 Top-ten JKN Outpatient and Inpatient Claims (2014 and 2015)
2014 2015
OUTPATIENT
Other minor chronic disease Other minor chronic disease
Dialysis Dialysis
Cataract Other minor acute disease
Rehabilitation procedure Rehabilitation procedure
Physical therapy and minor musculoskeletal procedure Radiotherapy procedure
Ultrasound gynecology Wound treatment
Other minor acute disease Physical therapy and minor musculoskeletal procedure
Radiotherapy procedure Other major chronic disease
Wound treatment Cataract
Other ultrasound procedure Ultrasound gynecology
INPATIENT
Cesarean section Cesarean section
Other digestive system diagnosis Bacterial and parasitic infection disease
Cardiac failure Other digestive system diagnosis
Bacterial and parasitic infection disease Cardiac failure
Vaginal delivery Nonbacterial infection
Abdominal pain and other gastroenteritis Abdominal pain and other gastroenteritis
Hypertension Vaginal delivery
Simple pneumonia and whooping cough Percutaneous cardiovascular procedures
Respiratory infection and inflammation Simple pneumonia and whooping cough
Bacterial infection Hypertension
Source Siallagan 2015.
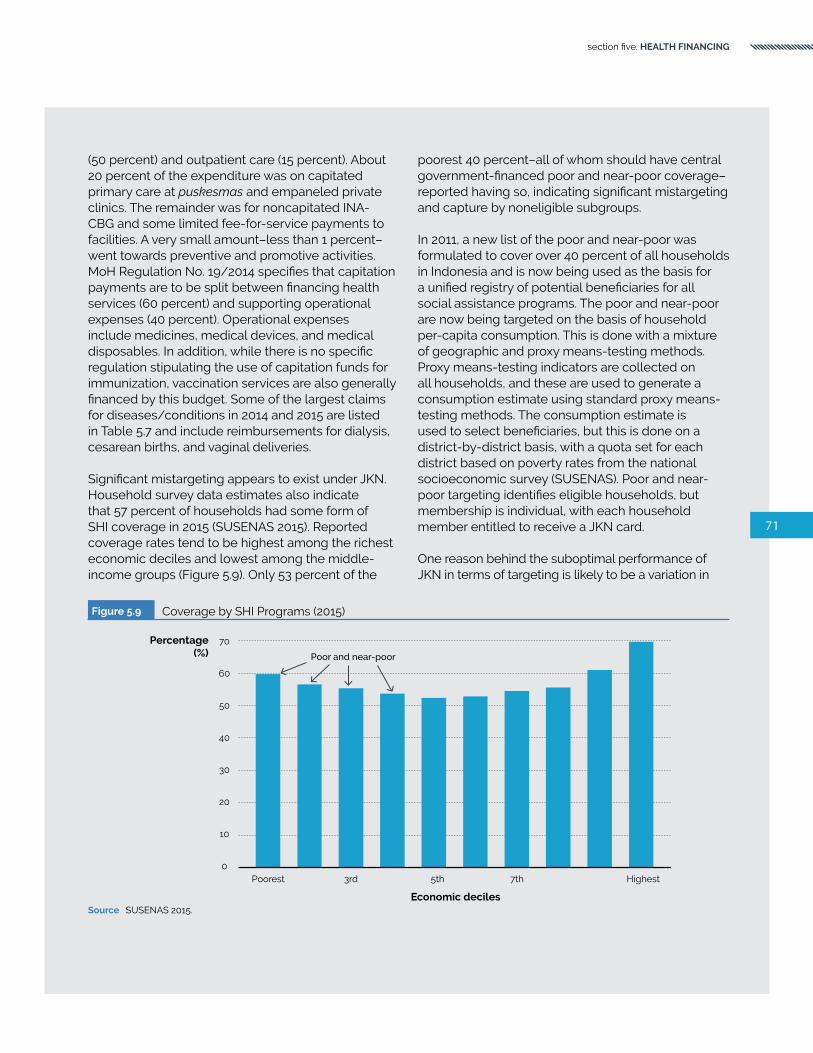
71
section five. HEALTH FINANCING
(50 percent) and outpatient care (15 percent). About 20 percent of the expenditure was on capitated primary care at puskesmas and empaneled private clinics. The remainder was for noncapitated INA-CBG and some limited fee-for-service payments to facilities. A very small amount–less than 1 percent–went towards preventive and promotive activities. MoH Regulation No. 19/2014 specifies that capitation payments are to be split between financing health services (60 percent) and supporting operational expenses (40 percent). Operational expenses include medicines, medical devices, and medical disposables. In addition, while there is no specific regulation stipulating the use of capitation funds for immunization, vaccination services are also generally financed by this budget. Some of the largest claims for diseases/conditions in 2014 and 2015 are listed in Table 5.7 and include reimbursements for dialysis, cesarean births, and vaginal deliveries.
Significant mistargeting appears to exist under JKN. Household survey data estimates also indicate that 57 percent of households had some form of SHI coverage in 2015 (SUSENAS 2015). Reported coverage rates tend to be highest among the richest economic deciles and lowest among the middle-income groups (Figure 5.9). Only 53 percent of the
poorest 40 percent–all of whom should have central government-financed poor and near-poor coverage–reported having so, indicating significant mistargeting and capture by noneligible subgroups.
In 2011, a new list of the poor and near-poor was formulated to cover over 40 percent of all households in Indonesia and is now being used as the basis for a unified registry of potential beneficiaries for all social assistance programs. The poor and near-poor are now being targeted on the basis of household per-capita consumption. This is done with a mixture of geographic and proxy means-testing methods. Proxy means-testing indicators are collected on all households, and these are used to generate a consumption estimate using standard proxy means-testing methods. The consumption estimate is used to select beneficiaries, but this is done on a district-by-district basis, with a quota set for each district based on poverty rates from the national socioeconomic survey (SUSENAS). Poor and near-poor targeting identifies eligible households, but membership is individual, with each household member entitled to receive a JKN card.
One reason behind the suboptimal performance of JKN in terms of targeting is likely to be a variation in
Figure 5.9 Coverage by SHI Programs (2015)
Source SUSENAS 2015.
Poorest 5th3rd Highest
20
60
0
40
7th
Percentage(%)
50
10
30
70
Poor and near-poor
Economic deciles

72
HEALTH FINANCING SYSTEM ASSESSMENTspend more . spend right . spend better
the proxy-means-testing criteria used across districts. The criteria used to identify household characteristics vary across districts; in some districts, village midwives and subdistrict health center officials often distribute health cards according to their own criteria, regardless of economic status (World Bank 2012c). There are no specific incentives in the system to either maximize enrollment or minimize mistargeting. There is some anecdotal evidence and allegations of fraud and political clientelism, but only a few cases have been reported. Since enrollment of the poor and near-poor is not mandatory, there is some evidence that the target beneficiaries enroll only when they need to use health services. The list of eligible beneficiaries compiled by district officials is not subject to validation from the central government, resulting in mismatching, poor coverage, and leakage of health insurance benefits to the nonpoor. Furthermore, poor and near-poor households that were denied the card despite being eligible do not have a clear recourse.
Adverse selection among the nonpoor informal sector is a significant challenge, as are inequities in expenditures. JKN’s overall claims ratio (that is, the ratio of expenditures to revenues) was about 104 percent in 2014 (Table 5.8) (World Bank 2015d). There were, however, wide discrepancies by membership, with the claims ratio among nonsalaried workers being more than 600 percent due to adverse selection, while that for the poor and near-poor and others was closer to 80 percent (Pradiptyo 2015). Even though expenditure per member for the poor and near-poor has almost doubled, large inequities remain across the different subgroups under JKN. There are indications of geographic inequities in claims as well, which is not surprising given the maldistribution of facilities and specialist care across the country. Administrative
Table 5.8 Claims Ratio for Nonsalaried Workers vs Others (2014)
Aspect Nonsalaried workers All Others Total
Membership 9.1 million 124.4 million 133.5 million
Contributions IDR 1.9 trillion IDR 38.8 trillion IDR 40.7 trillion
Expenditures IDR 11.6 trillion IDR 31.0 trillion IDR 42.6 trillion
Claims ratio (%) 617.4 79.9 104.7
Source BPJS
costs of around 6 percent of total premiums collected appears to be reasonable, especially given that JKN is a relatively new SHI program.
There are significant geographic deficiencies in the availability and quality of the basic benefits package, especially for those living in relatively remote and rural locations of the country, and this limits the effective availability of benefits for many JKN beneficiaries. In addition, the architecture of JKN is such that it effectively functions more like a demand-side “top-up” of essentially a (constrained) supply-side system rather than a full-fledged SHI program. JKN does not reimburse the full cost of care: salaries, capital, and some of the operating costs at public facilities continue to be paid for by the government (central, provincial, or district, depending on the type of public facility). Estimates suggest that these subsidies account for upwards of one-half of the full cost of providing care under JKN.
The combination of supply-side constraints and supply-side subsidies reduces the program’s overall effectiveness and will likely impact its future sustainability. Supply-side constraints comprise all the factors that limit health care delivery at the point of service, including the number of doctors, nurses, and midwives; the number of beds; medical equipment and technology; medicine supplies; and other basic amenities. Given Indonesia’s geography, supply-side constraints reflect not only shortages in overall numbers, but also in distribution. Rural and remote areas are disadvantaged in that they not only have fewer health facilities, but also face the difficulties associated with the retention of health personnel, especially doctors.

Box 5.2
Closing the Gap Between What is Medically Possible versus What is Financially Feasible: Chile’s AUGE Reforms
There is an increasing trend for countries to make their benefits packages (a set of services or health conditions covered by a health financing arrangement, such as health insurance) much more explicit. The motivation for adopting explicit benefits packages varies across countries and includes: (i) to reconcile constitutional rights to health or government commitments to universal coverage with available resources; and (ii) to increase funding envelopes for health by linking budget decisions to entitlements. Independent of the immediate financing rationale, these reforms aim more generally to reduce inequalities in access to services, enhance the allocative efficiency of health systems, and improve financial protection.
Chile provides UHC to its 17 million people using a mixed public-private SHI modality. Its SHI system comprises a large public insurer (the National Health Fund, or Fonasa) covering three-fourths of the population, including the indigent and low- and middle-income citizens, providing health services mostly through public providers; and several for-profit private insurers (Isapres) that cover the better-off population, comprising about one-sixth of the total population, providing services almost exclusively in the private sector. Until 2005, the system lacked an explicit benefits package: as a result, large differences in the content and quality of services between Fonasa and the Isapres emerged. Combined with limited financing, the implicit nature of benefits resulted in rationing by queues, (sometimes unofficial) user fees, and poor quality. Rationing in the form of denials and deflection were the prime mechanisms to contain demand.
In response to this situation, the 2005 reform (Universal Access with Explicit Guarantees, acronym AUGE in Spanish) defined an explicit benefit package for all, whether they were enrolled in Fonasa or Isapres. This reform was introduced in response to the fact that benefits were undefined/implicit and served to put in place a coverage floor for all SHI beneficiaries, whether
they relied on public or private insurance. At its launch, AUGE guaranteed access to 56 explicitly defined services for priority problems, with a mechanism for the package to expand over time (in 2010, it went up to 69, and then up to 80). Expansions are done following joint consultations between MoH and MoF. Designation of access under AUGE defines the treatment protocol with an explicit definition of interventions to be guaranteed, and all information is made publicly available on the AUGE website.
AUGE establishes detailed clinical protocols for each of the 80 conditions covered under AUGE. These protocols begin with clinical guidelines on diagnosis and outline the appropriate screening, diagnosis, treatment, and education procedures. They detail who should be screened and how often, what diagnostic tools are appropriate for use, and the appropriate treatment by diagnostic outcome. Therapies are described in detail, including the make and manufacture of drugs covered under AUGE and the maximum wait time patients can queue for services. In addition to ensuring treatment, the reform also put caps on waiting time and OOP payments for treatment. Copayments range between 0-20 percent, depending on the type of beneficiary, and annual limits cap copayments at two months’ salary within a given 12-month period. Beyond this, Fonasa or Isapres are required to cover all remaining costs associated with eligible services.
While services not included in AUGE are not guaranteed, they are also not excluded from care. More than one-half of the Fonasa budget goes to non-AUGE services, and expectations around access to nonguaranteed services are a serious challenge to Chile’s health system. In part due to the reform, Chile has seen improved access to services for all citizens. While AUGE establishes a minimum standard for all beneficiaries, Isapres is working to increase its share of coverage, and offers additional benefits that vary by provider and premium. This has resulted in substantial tension between Fonasa and Isapres and raised concerns that differentials will lead to an “arms race” in which political pressure to increase the AUGE-guaranteed package will undermine the fiscal sustainability of the program, resulting in rationing/queues and reversion to the old system.
Source: Bitran 2013; Missoni 2010.
73
section five. HEALTH FINANCING

74
HEALTH FINANCING SYSTEM ASSESSMENTspend more . spend right . spend better
Despite significant reforms in recent years to its health financing system, OOP remains the predominant source of financing for health in Indonesia. In terms of trends, over the period 1995-2014 and, despite rising SHI coverage, the OOP share of total health spending has remained substantially unchanged, while OOP spending per capita has risen in real terms (Figure 5.10).48 There are three prominent reasons for the continued dominance of OOP spending as a source of health financing in Indonesia: (i) low levels of public health spending on health; (ii) incomplete breadth of coverage under JKN; and (iii) poor supply-side readiness; and (iv) a preference for branded pharmaceuticals (which are not included in the JKN package).
Increases in government budgetary health spending and SHI expenditure in recent years have been matched by increases in OOP spending in Indonesia. Even though publicly financed prepaid/pooled health expenditures have risen, Indonesia has barely made any progress in its “health financing transition”–where countries experience both an increase in their total health spending per capita as well as in the share that is prepaid/pooled as their economies grow and develop (Savedoff et al. 2012).49 The share of OOP in THE remained roughly stable because the growth in coverage as well as prepaid and pooled public financing for health was accompanied by an almost identical increase in OOP health spending per capita. By way of contrast, countries such as Thailand, China, Vietnam, and Brazil have made faster progress in their health financing transitions. Thailand, in particular, has been a clear outlier in terms of the speed with which it has realized its health financing transition (Figure 5.11).
OOP Spending for Health
In 2015, about 40 percent of the population had no SHI coverage. Household survey data indicate annual OOP health spending to be a 2.1 percent share of total household consumption expenditure for all households. Some of the persistence in OOP spending for health can be explained by the fact that 43 percent of households reported having no form of SHI coverage. About 30 percent of all OOP spending reported came from these households. Almost 70 percent of households that reported no SHI coverage were headed by individuals working in the informal sector, 50 percent of whom were in agriculture.
The data also indicate, however, that 70 percent of all OOP spending was incurred by the 57 percent of all households that reported having some insurance coverage. This is despite the fact that JKN does not have any copayment or balanced billing stipulations. A recent study found that respondents with insurance coverage reported higher rates of OOP spending due to the unavailability of medicines at health facilities.50 As a share of total household expenditure, OOP spending was higher among those with coverage than those without (Table 5-9). The latter is likely, at least in part, due to higher utilization rates among those insured.
Although OOP health spending is generally regressive, this is not the case for Indonesia. Most of the OOP spending is incurred by the rich in Indonesia, and the rich paid a higher share of total consumption expenditure as OOP health spending, likely the result of access to, and utilization of, private care in urban areas. While the poor and near-poor are 40 percent of the population, their share of total OOP
48 The methodology used for national health accounts was different prior to 200549 Implicit prepayment and pooling underlies government budgetary expenditures, and social health expenditures are explicitly
prepaid for and pooled.50 Financial sustainability and effectiveness of JKN program coverage: First year assessment” study managed by DJSN, conducted
by CHAMPS, UI and funded by GIZ SPP in 2015

75
section five. HEALTH FINANCING
Figure 5.10 SHI Coverage and OOP Share of Total Health Spending (1995-2014)
Source World Development Indicators database and SUSENAS (various years).Note OOP spending is in 2014 constant IDR.
Figure 5.11 Health Financing Transition (1995-2014)
Source World Development Indicators databaseNote Data are for countries with OOP share of 20% in 1995.
RAPID TRANSITION
Cambodia
REGRESSINGIndonesia
Thailand
Vietnam
China
-5 1050 2015
Annual changein OOP/capita
healthspending
(%)
Annual change in pooled/capita health spending (%)
-10
5
0
20
10
15
-5
Lao PDRBrazil
India
Sri Lanka
SLOW TRANSITION
45 degree line
PhilippinesMalaysia
1995 20052000 2014
200,000
600,000
0
400,000
800,000OOPspending
per capita(IDR)
2010
Percentage(%)
40
0
20
60
OOP spending per capita (left axis)
OOP spending share of THE (right axis)
SHI coverage (right axis)

76
HEALTH FINANCING SYSTEM ASSESSMENTspend more . spend right . spend better
expenditures was only 11 percent; the top 20 percent of the population, on the other hand, accounted for 53 percent of the total OOP spending in the country (Figure 5.12). (Figure 5.13 shows the “Pen’s Parade”51 graph for OOP health spending: the x-axis represents households ranked in terms of consumption per capita; the y-axis represents consumption before and after health spending. As can be seen, most of the impoverishing effects of health spending occur right above the poverty line among the near-poor.
As might be expected, OOP health expenditures are related to the extent of household-level outpatient and inpatient utilization rates, especially the latter. SUSENAS data collect information on utilization rates at the individual level. OOP health expenditures are, however, reported only at the household level, making it difficult to make a direct link between OOP
health expenditure per visit. In addition, households reported outpatient utilization rates in the previous month at the time of the survey, whereas inpatient utilization rates were reported over the previous year. Given these data constraints, a more general relationship can be inferred between OOP health spending at the household level over the past year and aggregate all-member outpatient and inpatient utilization numbers.
OOP health expenditure per capita in households that reported no outpatient or inpatient visits was about IDR 103,339 (~US$8; 0.1 percent of total consumption expenditure). This increased to IDR 209,576 (~US$16; 1.6 percent of total consumption expenditure) for those that reported at least one outpatient visit but no inpatient visits. Those households reporting no outpatient visits but at least one inpatient visit
51 Pen’s Parade is a plot of ordered values versus their ranks; it is useful as a means of showing how incomes, and income distribution change over time.
Table 5.9 OOP Share of Total Consumption Expenditure (2015)
Economic status
Coverage (%)
Outpatient utilization (%) Inpatient utilization (%) OOP health as share of total expenditure (%)
With coverage
Without coverage All With
coverageWithout
coverage All With coverage
Without coverage All
Bottom 40% 56 17.2 14.3 16.0 3.2 1.8 2.6 1.6 1.4 1.5
Middle 40% 54 18.3 16.7 17.6 4.7 2.8 3.9 2.3 1.9 2.1
Top 20% 65 18.3 17.9 18.2 6.3 4.4 5.7 3.2 2.7 3.0
All 57 17.8 15.7 16.9 4.3 2.5 3.6 2.3 1.8 2.1
Source SUSENAS 2015.
Table 5.10 OOP Spending Share of Consumption Expenditure for Those With at Least One Inpatient Visit in Past Year
Economic statusOOP health as share of total expenditure (%)
With coverage Without coverage All
Bottom 40% 6.5 7.7 6.9
Middle 40% 10.5 11.5 10.8
Top 20% 14.9 17.9 15.6
All 10.7 12.1 11.1
Source SUSENAS 2015.

77
section five. HEALTH FINANCING
Figure 5.12 OOP Spending on Health by Economic Decile (2015)
Source SUSENAS 2015
Figure 5.13 Pen’s Parade (2015)
Note Poverty line based on Statistics Indonesia (BPS-March 2015 period)
Decile share oftotal OOP
health spending
OOP healthspending share oftotal consumption
Poorest 3rd 5th 7th Highest
Economic deciles
0
10
20
30
40
percentage(%)
50
Consumption post OOP health spending
Poverty line
1,000
2,500
5,000
10,000
HouseholdComsumption
per capita
25,000

78
HEALTH FINANCING SYSTEM ASSESSMENTspend more . spend right . spend better
incurred OOP health expenditures per capita of about IDR 1,414,947 (~US$109; 8 percent of total consumption expenditure). Not surprisingly, the highest OOP health spending per capita levels were among those households that reported at least one outpatient and at least one inpatient visits: IDR 1,621,736 (~US$124; 9 percent of total consumption expenditure) (Figure 5.14).
Financial protection from SHI coverage is evident at all levels, including among the poorest 40 percent who utilized inpatient services. OOP health spending as a share of total consumption expenditure is slightly higher among uninsured households that had inpatient utilization in the previous year.
The OOP share of THE should generally be below 20-30 percent, in line with levels observed in most high-income OECD countries. Higher levels of the OOP share are strongly correlated with higher incidences of catastrophic health expenditures and of resulting impoverishment rates in the population (OECD 2011). Globally, an increase in the public spending on health share of GDP–either general revenue-financed and/or financed by expansion in SHI–tends to be associated with a decline in the OOP share of THE. It remains to be seen if recent increases in public spending in Indonesia and increases in JKN coverage will be associated with a decline in the OOP share of THE in future (Figure 5.15).

79
section five. HEALTH FINANCING
Figure 5.14 OOP Health Expenditure by Utilization Pattern (2015)
Source SUSENAS 2015.Note Utilization pattern: 00=0 outpatient and 0 inpatient visits; 10=1 or more outpatient and 0 inpatient visits 01=0 outpatient and 1 or more inpatient
visits; 11=1 or more outpatient and 1 or more inpatient visits
Figure 5.15 OOP versus Public Spending on Health (2015)
Source World Development Indicators database
South Africa
Cambodia
RusiaIndonesia
Thailand
Philippines
Brazil
India
Sri Lanka
Lao PDRVietnam
ChinaMalaysia
0 963 1512
OOP share oftotal health
spending(%)
Government health spending share of GDP (%)
0
40
20
80
60
00 10 01Utilization pattern
1,500,000
0
1,000,000
500,000
OOP healthexpenditure
per capita(Rupiah)
11
OOP Health Expenditure
00 10 01Utilization pattern
10
0
8
4
OOP health asshare of total
consumption (%)
11
As Share of Total Consumption
6
2
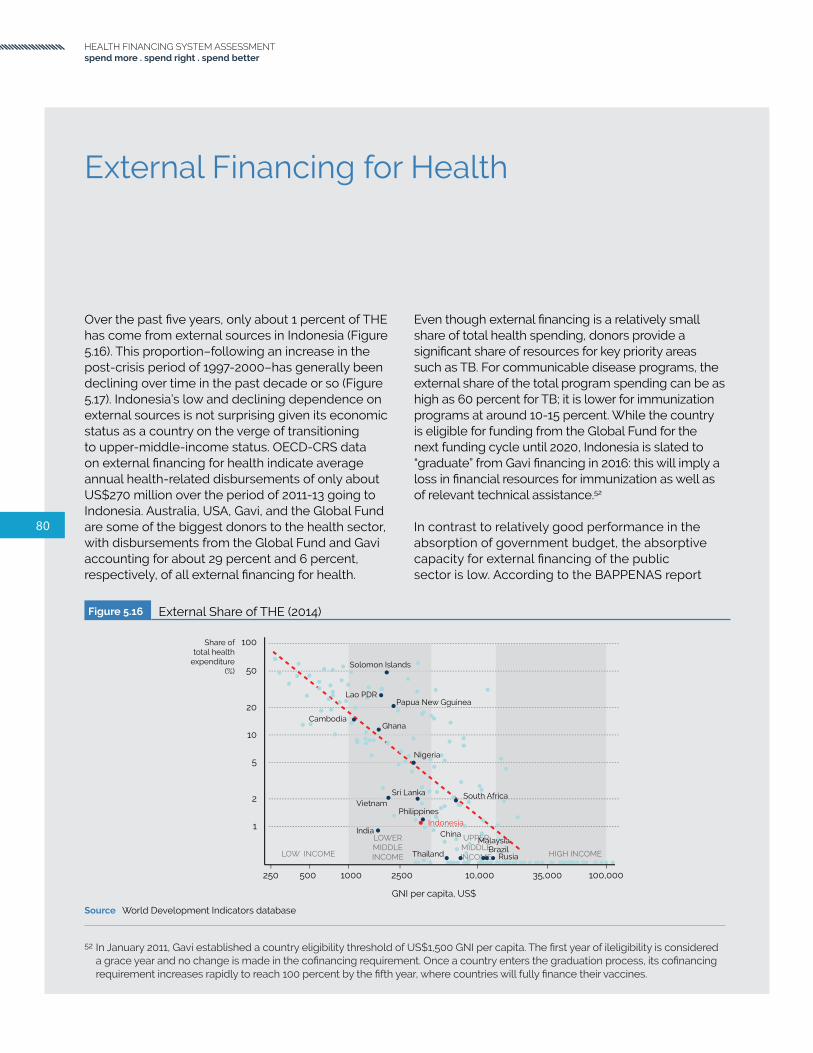
80
HEALTH FINANCING SYSTEM ASSESSMENTspend more . spend right . spend better
Over the past five years, only about 1 percent of THE has come from external sources in Indonesia (Figure 5.16). This proportion–following an increase in the post-crisis period of 1997-2000–has generally been declining over time in the past decade or so (Figure 5.17). Indonesia’s low and declining dependence on external sources is not surprising given its economic status as a country on the verge of transitioning to upper-middle-income status. OECD-CRS data on external financing for health indicate average annual health-related disbursements of only about US$270 million over the period of 2011-13 going to Indonesia. Australia, USA, Gavi, and the Global Fund are some of the biggest donors to the health sector, with disbursements from the Global Fund and Gavi accounting for about 29 percent and 6 percent, respectively, of all external financing for health.
External Financing for Health
Even though external financing is a relatively small share of total health spending, donors provide a significant share of resources for key priority areas such as TB. For communicable disease programs, the external share of the total program spending can be as high as 60 percent for TB; it is lower for immunization programs at around 10-15 percent. While the country is eligible for funding from the Global Fund for the next funding cycle until 2020, Indonesia is slated to “graduate” from Gavi financing in 2016: this will imply a loss in financial resources for immunization as well as of relevant technical assistance.52
In contrast to relatively good performance in the absorption of government budget, the absorptive capacity for external financing of the public sector is low. According to the BAPPENAS report
52 In January 2011, Gavi established a country eligibility threshold of US$1,500 GNI per capita. The first year of ileligibility is considered a grace year and no change is made in the cofinancing requirement. Once a country enters the graduation process, its cofinancing requirement increases rapidly to reach 100 percent by the fifth year, where countries will fully finance their vaccines.
Figure 5.16 External Share of THE (2014)
Source World Development Indicators database
LOW INCOME HIGH INCOME
LOWERMIDDLEINCOME
UPPERMIDDLEINCOME
South Africa
Cambodia
Rusia
Indonesia
Thailand
Philippines
Brazil
India
Sri Lanka
Lao PDR
Vietnam
ChinaMalaysia
Share oftotal health
expenditure(%)
GNI per capita, US$
250 25001000500 100,00035,00010,000
1
20
10
5
2
Papua New Gguinea
Solomon Islands
Ghana
Nigeria
100
50

81
section five. HEALTH FINANCING
Figure 5.17 External Share of THE (1995-2014)
Source World Development Indicators database
Figure 5.18 Development Assistance for Health in Indonesia (2002-14)
Source OECD-CRS Data extracted on 21 Jan 2016 Data include ODA for population & reproductive health
1995 2000 2005 2014
15
0
10
5
Share of total health expenditure (%)
2010
0
50
100
150
200
250
300
350
2002 2003 2004 2005 2006 2007 2008 2009 2010 2011 2012 2013 2014
Millions of 2013 US$
World Health Organisation [WHO]
WFP
UNICEF
UNFPA
UNDP
UNAIDS
International Development Association [IDA]
Global Fund
Global Alliance for Vaccines and Immunization [GAVI]
Food and Agriculture Organisation [FAO]
EU Institutions
AsDB Special Funds
United States
United Kingdom
Switzerland
Sweden
Spain
Poland
Norway
New Zealand
Netherlands
Luxembourg
Korea
Japan
Italy
Ireland
Germany
France
Finland
Denmark
Canada
Belgium
Austria
Australia

82
HEALTH FINANCING SYSTEM ASSESSMENTspend more . spend right . spend better
on Loans and/or Grants Performance for the third trimester of 2015, the actual disbursement for lending programs at the end of September 2015 was only around 37 percent of the annual disbursement target (BAPPENAS 2015). The other measurement that is often used to describe slow disbursement is the amount of commitment fee the borrower has to pay for undisbursed funds, which increased in 2014 compared to 2013. Several factors have been identified as the major drivers for slow disbursement, which include overoptimistic planning, unmet readiness criteria at the time of project implementation, and slow procurement processes. For grants, 22 grants for MoH were recorded in the report with total value of US$121.9 million, and only US$2.4 million disbursed (by the end of the third trimester).
The Global Fund is the largest external donor for health in Indonesia, followed by the Australian government and the US government. Between 2002 and 2015, the Global Fund committed US$729 million, of which US$617 million has been disbursed to date. The latest Global Fund grant was signed for the amount of US$218 million (US$82 million for
HIV, US$85 million for TB, US$43 million for malaria and US$8 million for Health Systems Strengthening). Gavi has disbursed US$121 million since 2002 and US$44 million was spent on the introduction of pentavalent vaccine during 2013-15.
National expenditures on HIV and AIDS have been rising steadily, led by an accelerating rate of domestic expenditure. HIV-related expenditures financed by external sources have declined steadily as a percentage of total expenditures from 2009-14 (Figure 5-19). This trend will have to continue and accelerate. The total HIV program budget in 2014 has increased 8 percent from the previous year, and overall there has been an average 12 percent annual increase over the period 2009 to 2014. The proportion of domestic and international funding has switched from predominantly external to domestic, from 35 percent in 2009 to 64 percent in 2014. The increase of domestic funding was mainly driven by an increase in central government expenses, especially for ARV, while subnational and private contributions continue to be small.
The share of national (a combination of central and subnational government) spending, for the National
Figure 5.19 Annual HIV Expenditures by Source of Funds (2009-14)
Source NASA multiple years.
2009 2010 2011 2012 2013 2014
40
50
60
10
20
30
0
10
0
50
60
70
20
30
40
External Funding for HIV Programs2009 - 2014
HIV Spending 2009 - 2014in US$ millions, current value
2009 2010 2011 2012 2013 2014
40
50
60
10
20
30
0
InternationalDomestic Total
International
%
% externalshare tototal HIVspending

83
section five. HEALTH FINANCING
TB Program has significantly increased between 2009 and 2014. The share of external financing continued to be significant, but the proportion of national budget compared with external sources has changed, from a ratio of approximately 65:35 in 2009, to close to 50:50 in 2014. The data are, at best, patchy and incomplete as the contribution at the subnational level is underrecorded, and the contribution of other development partners and the private sector were not well recorded. The main driver for the increase was that central government started to fully finance the provision of first-line antituberculosis drugs, reagents, and laboratory supplies and consumables. The Global Fund continues to be the main source of external finance and has committed US$61.3 million for 2016-17, followed by USAID for around US$10.5 million per annum for the period of 2015-17. Unfortunately, no information is available for the National Malaria Program.
From an external financing perspective, one of the key challenges facing Indonesia is that of strengthening its health and financing systems to accelerate and sustain progress towards outputs such as HIV, TB and immunization–key WHO-WB recommended tracer indicators of UHC–while effectively managing the transition from external financing. This implies ensuring not just adequacy in terms of levels of domestic-sourced replacement financing for these programs, but also of governance, service delivery, and complementarity or even integration with JKN.
In addition to financing, donors also provide substantial technical assistance to the program that needs to be incorporated into the health system functions for programmatic sustainability. Global organizations such as Gavi also supported countries with technical assistance, including immunization planning, surveillance, communication, Effective Vaccine Management (EVM) and National Regulatory Authority (NRA) development. This implies that these gains from technical assistance need to be sustained through local advocacy efforts and strengthened national technical skills. A recent systematic assessment on 14 graduating countries suggested that, in addition to financial sustainability, a number of challenges could impact the ability of countries to successfully graduate from Gavi support. These include planning and budgeting for vaccine, national procurement practices, performance of national
regulatory agencies, and technical capacity for vaccine planning and advocacy (Saxenian et al. 2014).
Integrating vertical programs such as previously externally funded and vertically managed HIV, TB, malaria and immunization programs into JKN will entail more than addressing actuarial matters related to which services should be included, but will also have to take into account all the health system pillars. This includes: (i) preparedness to provide included services; (ii) being more responsive and sensitive to the needs of specific target population groups; and (iii) provider-payment mechanisms that incentivize providers to reach out to target beneficiaries and retain them in the treatment cascade. Other issues that will have to be addressed include: (i) the existing clause on excluding services for self-inflicted medical conditions; (ii) different interpretations of the benefit package at different service delivery points and JKN branch offices; and (iii) fragmented coverage that discourages use of certain services (for instance, diagnostic tests and pre ARV services in HIV program).
Transition will be a challenge for all program areas that are largely donor dependent, but for different reasons. The extent of financial transition required is the least challenging for the immunization program, given that 85-90 percent of program costs are currently being financed via domestic sources, but the transition must occur more quickly as Indonesia will graduate from Gavi in 2016. As noted earlier, the transition will entail not only replacing Gavi funds, but securing the additional resources needed to be able to push through with upgrading the vaccines being used in the national program as per the current strategic plan. Financial transition may not, however, be the biggest challenge for any of the four programs. Instead, getting more than 500 local governments to implement the policies and programs the way that they were designed at central level in Jakarta may be the biggest challenge. The other programs have larger financial transitions to make, but a longer period of time in which to accomplish the transition insofar as they will be eligible for at least one additional round of the Global Fund grants.

84
HEALTH FINANCING SYSTEM ASSESSMENTspend more . spend right . spend better
As Indonesia’s health system develops, the key is for it to ensure that health expenditures lead to the maximum possible increases in health-adjusted life expectancy rates. This should be heading in a trajectory towards China, Thailand, Sri Lanka, and Vietnam–rather than following a less-efficient expansion route (heading on trajectories towards Brazil, Russia, and South Africa) (Figure 5.20).
Table 5.11 shows several countries in the period of 2013-15 that spent less on health care than Indonesia but attained higher DPT3 coverage rates and had lower MMRs. Clearly, it does not necessarily show that Uzbekistan’s health system is more efficient than Indonesia’s. It could suggest, however, that there might be macrolevel technical and/or allocative efficiency-related problems in Indonesia that are manifest in its relatively poor performance on key indicators such as DPT3 immunization rates and MMR in light of resources expended.
Efficiency
In order to further assess efficiency of Indonesia’s health system, the research team used Data Envelopment Analysis (DEA) to derive estimates (called scores) of relative technical efficiency in transforming inputs into outputs. Healthy Life Expectancy at Birth was used as an output indicator as it conversely represents narrow indicators more directly linked to health institutions and policies, thereby being potentially more relevant for policy recommendation,53 and THE per capita (constant US$) was defined as an input.
Results derived from the DEA analysis suggest that Indonesia can further improve the efficiency of its health system. Although there has been an increase in total health spending per capita, it seems that there is little improvement in Healthy Life Expectancy at Birth (Figure 5.21), and the technical efficiency score has declined from 0.30 in 2000 to 0.16 in 2013.
Table 5.11 Countries With Lower Health Spending, Higher DPT3, and Lower MMRs than Indonesia, (2013-15)
Country THE per capita MMR DPT3 (%)
Indonesia $126 126 78
Uzbekistan $124 36 99
Solomon Islands $102 114 88
Kyrgyz Republic $82 76 96
Tajikistan $76 32 97
53 Efficiency estimates of health care systems, Economic Papers 549 | June 2015, European Union-2015.

85
section five. HEALTH FINANCING
Figure 5.20 Health-adjusted Life Expectancy vs THE (2013)
Source World Development Indicators databaseNote x axis in log scale
Figure 5.21 Health-adjusted Life Expectancy vs THE (2000 and 2013)
Source World Development Indicators databaseNote y=axis: HALE-Healthy life Expectancy at Births (years) x axis: THE Percapita in 2013 Constant US$ Red line = DEA line; Green lline = Distance to DEA line
0
200
150
100
50
0 20015010050
0
200
150
100
50
0 20015010050
2000HALE Country ranked(0=lowest ; 200=highest) 2013HALE Country ranked
(0=lowest ; 200=highest)
THE Percapita Country Ranked(0=lowest ; 200=highest)
THE Percapita Country Ranked(0=lowest ; 200=highest)
South Africa
CambodiaRusiaIndonesia
Thailand
Philippines
Malaysia
Brazil
India
Sri Lanka
Lao PDR
Vietnam
China
South AfricaCambodia
RusiaIndonesia
Thailand
Philippines
Malaysia
Brazil
India
Sri Lanka
Lao PDR
Vietnam China
South Africa
Cambodia RusiaIndonesia
Thailand
Philippines
Brazil
India
Sri Lanka
Lao PDR
VietnamChina
Malaysia
Health-adjustment life expectancy
Total health expenditure per capita, US$
25 25010050 7,5002,5001,000
40
80
70
60
50
86
HEALTH FINANCING SYSTEM ASSESSMENTspend more . spend right . spend better
Despite a rise in the bed-density ratio in recent years, this number remains far below WHO’s norm/recommendation of 2.5 per 1,000 and Indonesia’s numbers remain far below that of comparator countries in the region including Thailand, Malaysia, Sri Lanka, China, and Vietnam. Key issues are the lack of systematic information on the number of hospital beds in private clinics and the maldistribution of beds across the country. There is a four-fold difference in the bed-density ratio across the country: from a high of 3.2 beds per 1,000 in DI Yogyakarta to a low of 0.8 per 1,000 in West Java. Two additional provinces–North Sulawesi and West Papua–exceed the WHO norm of 2.5.
Thirteen provinces had a bed-density ratio below the Indonesian average. Higher bed-density scores were evident in both moderate to large size and sparsely
populated provinces. Occupancy rates in both public and private facilities are low at 55-65 percent, approximately 25 percent lower than occupancy rates in other countries in the region. The average length of stay has been trending upwards and is about six days. The density of health centers in Indonesia of one puskesmas per 26,000 inhabitants is aligned with other low- and middle-income countries. A health center in Nigeria covers 20,000 inhabitants (Ujoh 2014); in Maharashtra, India a health center covers 30,000 inhabitants and in Liberia, a health center covers a population of between 25,000 and 40,000 inhabitants (Ministry of Health and Social Affairs 2008).
In addition to the overall health system performance in Indonesia, the country also faces efficiency challenges in areas that are identified by the WHO as common sources of health system inefficiency (Table 5.12).
Box 5.3
Health System Efficiency
Efficiency, broadly defined for any generic production system, typically implies getting the most out of limited resources. Two components of efficiency are generally differentiated: technical efficiency implies attaining the most output from a given set of inputs; and allocative efficiency implies choosing the optimal set of inputs, given their prices, to maximize output and minimize cost. Subsumed under technical and allocative efficiencies are possible efficiencies related to scale and scope in the health system. Taken together, inefficiencies can be a result of waste (technical inefficiency) and/or due to a suboptimal choice of inputs (allocative inefficiency). In this regard, technical efficiency is often referred to as “doing things right” and allocative efficiency as “doing the right things”. Measuring efficiency requires defining the appropriate decision-making unit (DMU) so as to specify appropriate outputs and inputs.
Measurement of health system efficiency is complex. Broader macrolevel analyses of efficiency of health systems often use countries or subnational administrative units as DMUs. In such cases, outputs are often specified in terms of population health indicators such as the MMR, health-adjusted life expectancy, or as a set of intermediate outputs such as immunization rates and other health service coverage rates. The latter are, arguably, a more direct measure of the output of a health system. Broader population health indicators such as the MMR is often more of a function of additional factors (for example, female education, infrastructure, water and sanitation, and so forth) that are generally outside the purview of health systems. Microlevel analyses of efficiency usually look at case mix-adjusted unit costs in hospitals and health centers as DMUs, with outputs and input indicators reflecting the functions of the specified DMU. Hospital-level efficiency analyses often look at benchmark comparisons of bed occupancy and turnover rates.
Source: Hollingsworth and Peacock (2008).

87
section five. HEALTH FINANCING
Table. 5.12 Ten Major Sources of Inefficiency in Health Systems Worldwide
EFFICIENCY CHALLENGE RELEVANCE TO INDONESIA
Under use of generic drugs and higher-than-necessary prices for medicine.
Regulations require government and JKN-affiliated health facilities to use generics. Although poor supply-side readiness and preference for branded medicines not covered by JKN has led to high OOP spending, prices of branded and patented medicines in Indonesia are higher compared with international reference prices. Local production (most of which are generics) dominates the Indonesian pharmaceutical market.
Use of substandard and counterfeit medicine.
• Much of the financial burden (and health hazards) of substandard and counterfeit medicines is believed to be borne by consumers, however, little data exists documenting this.54 Counterfeit vaccines, including vaccines for routine childhood immunization, have been found being sold in private hospitals and facilities, leading to public health concerns over the government and BPOM’s ability to effectively regulate vaccines and medicines in the country. Commonly counterfeited medicines include antibiotics, antimalarials, painkillers, anesthesia, vaccines and erectile dysfunction medicine.55
• In 2016, a nationwide substandard and counterfeit medicines operation (Pangea IX) seized US$4.2 million worth of substandard and counterfeit medicines across 32 provinces in the country.56
Inappropriate and ineffective use of medicine.
• Inappropriate, ineffective use and self medication of prescription medicines, especially antibiotics, remains widespread in public and private health facilities, and pharmacies, burdening both the government budget and OOP spending.57
• Under JKN, there is evidence of lower number of drug per prescription and higher number of generic drugs prescribed compared with those uninsured; but at the same time an increase in the prescription of nonformulary drugs.
Overuse and oversupply of equipment, investigations, and procedures.
Under JKN scheme, the increase of Cesarean Section has been observed in its two-year implementation. Of 1.5 million delivery claims, more than one-half (54 percent) were by Cesarean Section.58 Although no baseline figure is available, this is much higher than the WHO’s recommended upper limit which is 15%.59
Inappropriate or costly staff mix, unmotivated health workers.
Key issues in HRH incude maldistribution, a shortage of specialists, and poor skills of health workers. Stark inequalities in the distribution of HRH between geographical regions and provinces, and between urban and rural areas have become one of the contributing factors to variable health outcomes.
Inappropriate hospital admissions and length of stay.
For JKN members, readmission is around 10% for hospital inpatient and around 40% of those are questionable; there is also high readmission for outpatient services. Length of stay has increased from four days in 2009 to six days in 2015.
Inappropriate hospital size (low use of infrastructure).
Despite rapid growth of hospital numbers over the past decade, the total hospital bed to population ratio remains low (ranging from 1.07/1,000 compared with a global average of 2.5/1,000).
Medical errors and suboptimal quality.
A study on maternal deaths verbal autopsy found that almost 40% of the decision to refer was made too late and, in more than one-half of the cases, clinical decision making was conducted inappopriately.60
Waste, corruption, and fraud.
Potential fraud practices in JKN claims, including upcoding, unbundling, prescribing drugs outside of catalogue, and false claims are exacerbated by lack of supervision.61
Insufficient mix of health interventions (for example, between prevention and treatment, high vs low value).
The implementation of JKN has raised concerns that the system is focusing more, by spending more, on curative rather than preventive practices. In the absence of Certification of Need (CON) requirements for providing advanced technology medical equipment and more expensive services (for example, diagnostic equipment), has led to supply-induced demand which in the end drove the medical cost up.
Source WHO 2010c (left column)62 and World Bank staff (right column).
54 This is implied from the fact that most types of counterfeit medicines include OTC and self-prescribed medicines, and operation Pangea IX that includes medicines seized from social media and the internet.
55 Badan POM. 201656 Jakarta Globe, 2016.
57 Sources:1. Widawati et al 20112. Hadi et al 20103. Puspita sari et al 20114. Hadi et al 2008
58 Hidayat 201659 Gibbons et al. 2010.60 JHPIEGO Study 2016.61 Pradiptyo 2015. 62 Chisholm 2010

88
HEALTH FINANCING SYSTEM ASSESSMENTspend more . spend right . spend better

89
section six. A CASE STUDY ON IMMUNIZATION
section 6 .
A CASE STUDY ONIMMUNIZATION

In Summary
1. Financial and technical support from external resources is important for the immunization program in Indonesia, however, Indonesia needs to be ready for transitioning from external financing.
2. Indonesia has made progress in increasing coverage rates, although large inequalities across regions and economic status still exist.
3. Vaccine availability in puskesmas was generally good, but several issues remain, such as human resources (availability and expertise) and cold-chain management.
4. At the household level, physical and time barriers pose a challenge to accessing immunization services.
5. The total cost of immunization in Indonesia must also take into account all nonoperational immunization activities.
6. JKN’s benefit package covers routine immunization, but there are concerns about the usage of capitation payments to improve immunization service delivery.
7. New vaccines are currently being planned for introduction and several key factors, such as scientific evidence, financing, production and political support, must be addressed.
90
HEALTH FINANCING SYSTEM ASSESSMENTspend more . spend right . spend better

91
section six. A CASE STUDY ON IMMUNIZATION
This section will apply the HFSA approach to examine the disease-specific context, funding outlook, and essential program functions needed to ensure the financial and institutional sustainability of externally financed programs within the broader health system. The immunization program was chosen as an example, particularly given the context of Indonesia’s graduation from Gavi by the end of 2016. It will focus on assessing the current system and identifying bottlenecks and future challenges for transition of a program. This would inform the transition planning by formulating the necessary activities in a posttransition environment and assessing the government’s capacity to conduct these activities in the absence of donor support.
Indonesia’s population ages 0-1 year–the primary target group for immunization–was 4.3 million in 2013. This number has been declining ever since it peaked at around 4.7 million in 1998. It is projected to decline to 3.9 million by 2030.63 As a consequence, the share of the population ages 0-1 year has declined steadily from around 2.4 percent in 1995 to 1.6 percent in 2013 (Figure 6.1). This share is projected to continue to decline to only about 1.3 percent by 2030. This implies that the financing requirement for the immunization program, given no change in the basic immunization package, will decline. The government plans, however, to introduce several new vaccines in the future, which has implications for an increased resources requirement.
Indonesia’s current immunization schedule covers all of WHO’s recommendations for traditional vaccines, except for the rubella vaccine. The schedule initially included BCG and smallpox, and was later expanded to include DPT. The schedule has undergone several changes since, first with the addition of polio and measles into the program and then, in 1997, Hepatitis B. More recently, in 2013, the pentavalent (DPT-HB-Hib) vaccine was introduced and is set to replace the DPT-HB combination in three staggered phases. Full roll-out of the pentavalent vaccine in all 33 provinces64 was completed in early 2015. Indonesia is planning to launch a combination measles/rubella vaccine in 2017 as a supplementary immunization activity and in 2018 this should be part of the routine immunization package. The schedule is revised annually based on recommendations made by an independent advisory body, the National Immunization Technical Advisory Group.
Indonesia has not yet adopted WHO’s new vaccine recommendations but is in the process of doing so. This is similar to the situation in most comparable countries (Table 6.1). Indonesia has recently introduced IPV (Inactivated Polio Vaccine) into its routine immunization program in accordance with World Health Assembly resolutions related to polio eradication. Other new vaccines such as Japanese Encephalitis (JE), pneumococcal, HPV and rotavirus vaccines are scheduled for introduction by 2019 (MoH 2013).
63 Indonesia age-specific population growth over the years; www.census.gov.64 The 34th province (North Kalimantan) was established in 2012.
Figure 6.1 Population Ages 0-1 Year (1995-2030)
Source www.census.gov
0-1 share of total population (right axis)
1995 2000 2005 2010 2015 2030
4.2
4.6
3.8
4.4
4.8
1.3
2.0
1.0
1.8
2.3
2.5millions percentage(%)
2020 2025
Populationprojection
population4
1.5

92
HEALTH FINANCING SYSTEM ASSESSMENTspend more . spend right . spend better
The burden of disease (BOD) for vaccine-preventable diseases (VPD) for children under five remains high for diseases not yet covered by the routine immunization programs in Indonesia. For example, Table 6-2 indicates that the BOD of diarrheal disease has been continuously high since the 1990s and remains one of the most pressing VPDs that could be easily addressed in Indonesia with a simple
Table 6.1 National Immunization Schedules (2015)
WHO Recommended Routine Vaccines Other
Traditional vaccines New vaccines
BCG HepB Polio DTP Hib Measles Rubella Rotavirus Pneumococcal HPV HepA Influenza JapEnc MeningococcalVitamin
A
Brazil * * ** * * * * * * * * * *
Cambodia * * * * * * * *China * * * * * * * * *India * * * * * * *Indonesia * * * * * * *Lao PDR * * * * * * * * * * * *Malaysia * * * * * * * * * * *Philippines * * ** * * * * * * * * *Russia * * ** * * * * * * * *South Africa * * * * * * * * * * *Sri Lanka * * * * * * * * *Thailand * * * * * * * * * *Vietnam * * * * * * * *
Source WHO.Note Two stars under polio column indicates IPV has been introduced.
Table 6.2 Burden of Disease for VPDs (2013)
Rank in 2013 VPDs in Under 5s in 2013DALYs lost share in Under 5s (%)
1990 2000 2010 2013
1 Diarrheal diseases 10.51 6.70 7.28 6.40
2 Measles 6.00 3.71 2.39 4.06
3 Pertussis 1.40 1.70 1.93 2.13
4 Haemophilus influenza type b meningitis 1.72 1.49 1.37 1.17
5 Pneumococcal meningitis 1.13 0.84 0.87 0.75
6 Encephalitis 0.56 0.61 0.69 0.69
7 Tetanus 3.65 1.00 0.40 0.31
8 Meningococcal meningitis 0.31 0.31 0.23 0.20
9 Tuberculosis 0.31 0.19 0.14 0.12
10 Diphtheria 0.03 0.03 0.04 0.03
DALYs lost per 100,000 population 161,487 101,400 69,494 58,618
Source Institute of Health Metrics and Evaluation database (2015).
rotavirus vaccination. Evidence in Indonesia points to rotavirus as being responsible for at least 60 percent of hospitalization in children due to diarrhea in 2006 (Soenarto et al. 2009). At the same time, the persistently high BOD of other VPDs already covered by the routine immunization program indicates the need for routine immunization services to be continuously supported, improved, and sustained.

93
section six. A CASE STUDY ON IMMUNIZATION
Immunization coverage for Indonesia has increased over the years but the dropout rate remains an issue. There are a variety of estimates of immunization coverage for Indonesia. The latest IDHS data indicate that 66 percent of children 12-23 months were fully immunized in 2012.65 Over the period of 2012-14, and depending on source, estimates of BCG immunization rates ranged from 89 to 97 percent; DPT ranges from 72 to 82 percent; polio immunization rates ranged from 74 to 83 percent; and measles immunization rates were 80-89 percent (Table 6.3). With regard to specific vaccines, IDHS data show that, although the coverage of the first doses of DPT and polio vaccines are relatively high (88 percent and 91 percent, respectively), only 72 percent and 76 percent went on to receive the third dose of DPT and polio respectively. The dropout rate between the first and third doses of vaccines is, therefore, 16 percent for DPT and 15 percent for polio. The main reason for incomplete vaccination is failure to understand the need for return visits and for additional doses for complete immunization.
Outcomes and Determinants
Despite increases in coverage rates in recent decades, Indonesia does not compare favorably to its peers, and large inequalities across regions and economic status exist. For example, Indonesia is richer than Cambodia, the Philippines, and Vietnam, but has significantly lower coverage rates for DPT3 and measles immunization (Figure 6.2). There is as much as a three-fold difference in immunization coverage rates across provinces in Indonesia. DPT3 immunization rates, for example, are almost 90 percent or more in Bali and DI Yogyakarta, less than 50 percent in Maluku, Banten, and West Sulawesi, but only 35 percent in Papua (Figure 6.3). Inequalities are large by economic status as well, and these have sustained over time (Figure 6.4). In 2013, only 39.5 percent of children from lowest income quintile families received full immunization compared with 67.8 percent from the highest quintile. Of particular importance are the hard-to-reach areas that require additional strategy, such as Sustainable Outreach Service, to ensure adequate immunization coverage.
Table 6.3 Immunization Coverage Rates (Various Years)
Vaccine
Source
IDHS2012)
Riskesdas(2013)
SUSENAS(2012-2014)
WHO-UNICEF(2012-2014)
MoH(2012-2014)
BCG 89% 88% 94% 97% 90%
DPT3 72% 76% 73% 82% 77%
Polio3 76% 77% 74% 83% 81%
Measles 80% 82% 89% 82% 84%
Fully immunized 66% 59% 68% – –
65 According to WHO guidelines, children are considered fully immunized when they have received one dose of BCG, three doses each of the DTP and polio vaccines, and one dose of the measles vaccine.

94
HEALTH FINANCING SYSTEM ASSESSMENTspend more . spend right . spend better
Data quality is a major issue, particularly in calculating target populations for coverage estimates. There is a considerable variation in coverage estimates
Figure 6.2 DPT3 and Measles Immunization Coverage vs Income (2014)
Source World Development Indicators databaseNote both y- and x- axes logged
Figure 6.3 DPT Immunization Rates by Province (2012)
Source IDHS 2012
between administrative data and surveys, and between surveys themselves. Coverage data at lower levels are unreliable due to poor reporting
250 500 1000 100000
DPT
2500
70
60
90
80
100
GNI per capita, US$
South Africa
Cambodia Rusia
Indonesia
Thailand
Philippines
Malaysia
Brazil
India
Sri Lanka
Lao PDR
Vietnam
10000 35000
Measles
250 500 1000 1000002500
GNI per capita, US$
10000 35000
70
60
90
80
100
LOW INCOME HIGH INCOME
LOWERMIDDLEINCOME
UPPERMIDDLEINCOME
percentage percentage
South Africa
Indonesia
CambodiaRusia
Thailand
Philippines
Malaysia
Brazil
India
Sri Lanka
Lao PDR
Vietnam
ChinaChina
LOW INCOME HIGH INCOME
LOWERMIDDLEINCOME
UPPERMIDDLEINCOME
Mal
uku
Ce
ntr
al K
alim
anta
n
We
st S
ula
we
si
20
100
0
80
40
Percentage(%)
So
uth
Su
mat
ra
Pap
ua
No
rth
Mal
uku
Jam
bi
So
uth
eas
t S
ula
we
si
Ria
u Is
lan
ds
We
st K
alim
anta
n
Eas
t K
alim
anta
n
No
rth
Su
mat
r a
Ria
u
Ce
ntr
al S
ula
we
si
Be
ng
kulu
So
uth
Su
law
esi
Lam
pu
ng
We
st J
ava
Ban
gka
Be
litu
ng
Indonesia average
60
Ban
ten
Eas
t Jav
a
Ce
ntr
al J
ava
We
st P
apu
a
No
rth
Su
law
esi
So
uth
Kal
iman
tan
We
st S
um
atra
Go
ron
talo
We
st N
usa
Te
ng
gar
a
DK
I Jak
arta
Nan
gg
roe
Ace
h
DI Y
og
yaka
rta
Eas
t N
usa
Te
ng
gar
a
Bal
i

95
section six. A CASE STUDY ON IMMUNIZATION
at village level (posyandu) mostly due to over- or underreporting by village midwives. Data Quality Self-assessment (DQS) reveals that the accuracy of data for reporting from villages to districts level for three antigens (BCG, DPT/HB3, and measles) were very low (below 20 percent). Household surveys lack standardization in survey methods. For administrative data, there is a gap between real population data reported by villages and target/projected population used by DHOs. Districts are obligated by MoH to use data from intercensal surveys, but this may not account for recent migration patterns (rural-urban)/population mobility and differences in Crude Birth Rate estimation between national and district level. Some areas may, therefore, be underestimating coverage (if they have experienced outmigration), while others are overestimating coverage (urban areas). UNICEF surveys in major urban areas highlight this effect by identifying significant numbers of unimmunized and underimmunized children in migrant communities and among the urban poor.
Women with more education were more likely to vaccinate their children, and unvaccinated children are disproportionately concentrated in rural areas in Indonesia. Although only one-half of the country’s population is rural, approximately 63 percent of all unvaccinated children lived in these areas. Analyses suggest that the determinants of vaccination are sharply divided by urban-rural status. For example, while fully immunized and fully unimmunized children show the same wealth gradient in rural areas, the same is not the case for children in urban areas. In
urban areas, while all economic strata are more or less equally likely to initiate vaccination, children from the highest strata are far more likely to complete vaccinations than those from lower economic quintiles.
In addition to education, various factors such as birth order, distance to health facility and ownership of health insurance are among the factors that affect immunization rate. Higher birth order also lowered the odds of being vaccinated. Households who report that distance to the health facility is a serious issue in getting medical help are both less likely to initiate and less likely to complete vaccinations. Similarly, although vaccination is provided at little or no cost through the public system, children who have not received any DPT vaccine were also more likely to be uninsured than children who received three doses of the vaccine.
Recent analysis of data from rural areas suggests a higher rate of immunization among those children whose mothers had antenatal care (Suparmi 2014). Level of development (as measured by the Human Development Index), health sector investment (as measured by Public Health Development Index), and health-worker density (as measured by numbers of doctors) are also positively associated with immunization rates. Outbreaks of disease continue to occur, indicating significant subpopulations of unvaccinated and undervaccinated children among geographically and socially isolated groups (for example, migrants, the urban poor, and people in rural/isolated areas).
Figure 6.4 DPT3 Immunization by Economic Status
Source IDHS (various years)
Top 20%
1995 2000 2005 2010 2015
60
80
20
100DPTcoverage
(%)
Bottom 40%
Middle 40%
40

96
HEALTH FINANCING SYSTEM ASSESSMENTspend more . spend right . spend better
Most children are vaccinated at posyandu in Indonesia. Immunization services–as with several other preventive health services–are offered at several points of contact with the health system in Indonesia: these include integrated health service posts (posyandu), village maternity clinics/village health posts (polindes/poskesdes), health centers (puskesmas), schools, and at government and/or private hospitals or clinics. Indonesia also sometimes conducts national or subnational immunization campaigns. A large majority (almost three-fourths) of all vaccinated children in Indonesia, however, receive their immunization at posyandu, followed by 10 percent at puskesmas, 10 percent at private clinics and hospitals (although this can be as high as 50 percent in some provinces), and the remainder at polindes and other places (including midwives’ homes), emphasizing the importance of posyandu kader and community participation in immunization services.66 Routine immunization is also provided for school children via the School-based Immunization Month (Bulan Imunisasi Anak Sekolah, BIAS) program; the program targets children in the first through third grades in order to boost immunity to measles and diphtheria, as well as to provide future maternal immunity against tetanus.
The central government is responsible for procuring vaccines and district governments are responsible for service delivery. MoH’s National Immunization Program (NIP) that began in 1977 oversees the immunization program and performs forecasting and planning for vaccine procurement. As with other health services, district governments are responsible for service delivery, including immunization equipment and supplies and providing operational
Service Delivery
costs for puskesmas and posyandu for immunization. Unlike for most other health services, however, the central government is responsible for procurement of all vaccines and syringes. NIP also provides technical assistance, guidelines, monitoring and evaluation, quality control, and training, as well as conducts supplementary immunization activities such as campaigns. NIP uses a standardized tool for assessing supply-side readiness for immunization at the subnational government level, annually sampling across provinces and districts. BAPPENAS coordinates the integration of immunization into long-term (20 year), medium-term (five year), and annual plans. BAPPENAS also coordinates with MoH to set targets and to outline activities needed to be financed to achieve them; MoH then prepares the budget for submission to MoF. BAPPENAS has set a target of 95 percent of districts with greater than 80 percent vaccination rates as part of Indonesia’s next five-year plan (RPJMN 2015-2019).
Regulations require all government-procured vaccines to be supplied by PT Bio Farma, a state-owned enterprise.67 Regional health offices coordinate the provision and distribution of vaccines that are in the national immunization schedule. The number of vaccines procured is based on the estimated number of entitled beneficiaries; thus, in principle, Indonesia aims to provide universal immunization coverage. There are national guidelines governing immunization service delivery to ensure safe injection practices, counseling, and waste disposal.
The regulatory authority that oversees PT Bio Farma is BPOM. BPOM has undergone assessments using the WHO NRA assessment tool and is considered
66 National Immunization Coverage Survey 2007.67 PT Bio Farma is a WHO prequalified supplier that also exports to over 133 countries; 40 percent of Bio Farma products are used
domestically, while 60 percent are exported.

97
section six. A CASE STUDY ON IMMUNIZATION
“fully functional” by WHO,68 all vaccine doses are therefore assumed to be of “assured quality”. This functional status must be sustained over time through regular reassessments that require significant resources and expertise on the regulatory agency’s part. While, to date, Bio Farma has been reliably supplying all vaccines used in the Expanded Program for Immunization (EPI) program, past experiences have shown that some delays in the introduction of vaccines were caused by delays in production by Bio Farma (Rubella, JE) (Hadisoemarto et al. 2016).
The price of vaccines in Indonesia is generally comparable to the prices paid by Gavi and UNICEF. The exceptions are BCG and Hepatitis B single-dose vaccines for which Indonesia pays twice (BCG) to four times (Hepatitis B single dose) the price paid by UNICEF. There was a switch in procurement roles in 2014, where the Directorate-General of Pharmaceuticals and Medical Devices took over the responsibility of procuring vaccines, among other program-specific medicines. Anecdotal evidence suggested some initial stock-out problems due to the switch, although it did not affect service provision
due to adequate measures taken to ensure service continuation. Starting 2014, vaccine prices are listed on the e-catalog similar to all other procurement processes by the government. A fixed charge for transportation to provincial drug warehouses is included in the procurement price. The transportation cost is fixed, which means there is no difference between the transport cost for provinces with difficult access, such as Papua, and relatively well-developed provinces with good road access, such as West Java.
Facility data indicate that the availability of vaccines at puskesmas was generally good, but immunization-related training of staff was not. According to the 2011 NIHRD facility census, more than 90 percent of all puskesmas reported availability of government-mandated vaccines such as measles, DPT, polio, and BCG vaccines.69 Service readiness problems were notable in three provinces–Papua, West Papua, and Maluku–where less than 80 percent of puskesmas reported availability of the measles, DPT, polio, and BCG vaccines. These were also some of the aforementioned three eastern provinces with relatively low immunization rates. A notable area of deficiency was with regard to staff training for immunization:
Table 6.4 Vaccine Prices
Vaccine TypeE-Catalog 2016 price per dose (US$) Gavi and UNICEF 2016 prices
per dose (US$)Central prices Provincial prices
BCG 0.23 0.27 0.06-0.16
Diphtheria-tetanus 0.14 0.16 0.14
Tetanus 0.12 0.13 0.07-0.13
Tetanus-diphtheria 0.14 0.15 0.10-0.15
Measles 0.18-0.23 0.25 0.23-0.50
OPV 0.16 0.18 0.18-0.21*
Hepatitis B 1.58 1.86 0.20-0.42
DPT HB-HiB 1.68 1.36 1.15-2.35**
IPV 1.19 NA €0.75 - €2.4***
Source MoH Regulation No. 89/2014, UNICEF, and Gavi.Note *2015 prices. **No price for five doses available at UNICEF and prices are for different packaging size. Central prices include transportation
to central warehouse; provincial prices include transportation to provincial warehouse. UNICEF prices are FCA nearest international airport Incoterms. ***Price for IPV in Euros.
68 BPOM (Indonesia National Agency of Drug and Food Control) was last assessed by WHO on vaccine regulation in June 2012.69 Latest IFLS 2014 data findings show a slightly lower rate than what the NIHRD facility census found: the availability of mandated
6vaccines in the puskesmas is about 80 percent.

98
HEALTH FINANCING SYSTEM ASSESSMENTspend more . spend right . spend better
only 45 percent of puskesmas in the country had at least one staff member trained in EPI in the previous two years. Limitations exist in terms of the number and capacity of staff at national and provincial level to conduct the planned intensive monitoring, technical assistance, and follow-up action. High staff turnover at the district level (midwives, EPI managers, cold-chain technicians, and so forth)–often every three to six months–inhibits continuity, training, development of expertise, and commitment to EPI activities. Limited staffing standards, for example, requirements for health worker expertise in data management is another constraint.
In contrast to puskesmas, the availability of vaccines at private facilities was poor. The IFLS 2014 data showed only about one-quarter of private facilities reported availability of measles, DPT, polio, and BCG vaccines (Table 6.5).
Cold-chain management is functional but needs further improvement to enhance quality. Cold-chain inventory assessments conducted in 2014 found that only 70 percent of cold-chain equipment were functional, 18 percent were working, and 12 percent were working but needed attention. Main issues raised from EVM were temperature management, stock management issues, and low levels of maintenance of equipment. The 2013 EPI review also highlighted these issues, reporting a large proportion of district-level cold-chain equipment due for replacement, inadequate response to temperature deviations, vaccine wastage rates not monitored or used for planning, and inadequate budgeting for
cold-chain and waste disposal. Only 15 percent of cold-chain equipment was reported to be equipped with electronic continuous temperature monitoring (2014 JRF). The MoH is currently piloting the use of the UNICEF Cold Chain Equipment Manager (CCEM) tool in 22 provinces to identify cold--chain needs.
Routine surveillance needs to be strengthened to improve its ability to timely detect and respond to outbreaks. Surveillance and reporting system components consist of routine surveillance, coverage monitoring, immunization safety, and adverse events management. Routine surveillance is conducted through regular monthly reporting of VPDs and weekly for Acute Flaccid Paralysis (AFP). AFP surveillance identifies high-risk areas for wild polio virus and uses a mechanism to monitor polio eradication in Indonesia. The indicator for coverage monitoring is the percentage gap between DPT3 survey coverage and officially reported figures. The central government collects data from all provinces and districts. Declining VPD surveillance performance, large discrepancies between administrative coverage data, limited functioning of laboratory capacity and inadequate AEFI surveillance are some of the issues faced by the surveillance system and requires adequate subnational financial support.
As is the case with other health services, households face physical and time barriers to accessing immunization services. As noted earlier, children living in rural areas and poor households are less likely to be fully immunized, despite the free immunization services for all children provided by
Table 6.5 Availability of Government-mandated Vaccines at Private Clinics70
Facility surveyAvailability of vaccines (%)
Measles DPT Polio BCG
IFLS 2007 23.4 24.8 25.5 22.6
IFLS East 2012 9.7 9.7 9.7 9.7
IFLS 2014 26.1 27.1 26.6 25.6
70 IFLS 2007 and 2014 were provincially representative surveys covering 13 provinces (representing 83 percent of Indonesia’s population): North Sumatra, West Sumatra, South Sumatra, Lampung, DKI Jakarta, West Java, Central Java, DI Yogyakarta, East Java, Bali, West Nusa Tenggara, South Kalimantan, and South Sulawesi. The survey included 952 puskesmas and 1,595 private clinics/practitioners; IFLS East 2012 is a provincially representative survey covering seven provinces (representing 7 percent of Indonesia’s population): East Nusa Tenggara, West Kalimantan, Southeast Sulawesi, Maluku, North Maluku, West Papua, and Papua. The survey included 98 puskesmas and 185 private clinics/practitioners.

99
section six. A CASE STUDY ON IMMUNIZATION
the government. The real costs of accessing health care are the transport and opportunity costs which are not covered by the government. A recent study indicates that increasing the number of posyandu per 1,000 population improves the probability of children receiving complete immunization by 54 percent (Maharani and Tampubolon 2014). This signifies the importance of the policy to promote a more even distribution of posyandu to improve immunization coverage. Better distribution of immunization providers would reduce the distance to health providers which, in turn, would shorten the time needed and lower the financial costs to access services.
Poor knowledge regarding vaccination benefits, schedule frequency, and normal side effects lead to higher-than-expected DPT3 dropout rates. DPT dropouts may also be associated with DPT reactogenicity and inadequate prevaccination counseling on expected adverse reactions by service providers. Kaders often do not have the training to address concerns and objections to vaccination, nor do they routinely track defaulters in their communities. Communication and demand creation is
the responsibility of the Health Promotion Unit of the MoH (PROMKES). Gavi and UNICEF have supported a variety of communication materials for use by health workers. There remains, however, a reported lack of communications strategy aimed at health workers, program managers, and policy makers. Most DHOs periodically identify chronic low coverage or high dropout rate areas for “sweeping” activities that target children who did not show up when expected. This is evidenced from the name-based infant registers maintained by health workers/kaders.
There is a small antivaccination movement in Indonesia, however, overall vaccine refusal is reported to be very low. Refusals stem from religious objection (halal/haram) or pseudoscience beliefs (false autism link). Evidence that some people refuse vaccines on religious grounds is limited. Additional study is required to evaluate this perspective further. Vaccine refusal is considered to be a sensitive subject, and people may not be willing to verbalize their reason for refusal The MoH has responded to antivaccination concerns by engaging religious groups and utilizing social media.

100
HEALTH FINANCING SYSTEM ASSESSMENTspend more . spend right . spend better
Total expenditure on routine immunization from all sources of financing is estimated to be in the range of US$155 million in 2014–less than 1 percent of THE. Routine immunization expenditures have increased significantly in recent years, up from ~US$57 million in 2010.71 Almost all expenditure on routine immunization is generally assumed to be public, amounting to about 2 percent of all public expenditure on health in 2014. Roughly 60 percent of this was central government and 40 percent was by subnational governments. Some of the financing for immunization services comes from JKN.72 The exact magnitude is not, however, easy to compute as there is no direct line to immunization services under JKN. Syringes and safety boxes are financed jointly by the central and subnational governments (80 percent central and 20 percent subnational cost-sharing). Operational costs–including for the cold chain and others related to immunization delivery–are borne by subnational governments. The central government is tasked with monitoring and evaluation of the immunization program, and provides additional on-demand financial support to districts.
External financing plays a relatively important role for immunization in Indonesia. In 2014, ~US$14.3 million–9 percent of government expenditure on immunization–was financed by Gavi, up from ~US$0.2 million in 2011. The Gavi-financed share of government immunization expenditure increased significantly in 2013 because Gavi is cofinancing the introduction of the pentavalent vaccine until 2016, following which Indonesia is expected to graduate from Gavi financing.
Financing and JKN
The national immunization program in Indonesia also receives technical support from UNICEF and WHO. This is in the form of cold-chain evaluation and upgrading; information, education, and communication material (IEC) development; immunization advocacy; and management and logistics training (EVM); as well as surveillance and coverage survey. As noted earlier, even though Indonesia’s dependence on external financing for health is generally low, the external financing share of its immunization program is relatively significant and is crucial to the sustainability of immunization financing and quality service delivery. Programs traditionally supported by external donors, such as health-system strengthening activities, and civil society organization support are at risk of not receiving government funding and oversight as Indonesia graduates from Gavi.
Gavi has disbursed ~US$121 million since 2002 when it became active in Indonesia in supporting the introduction of the Hepatitis B vaccine. Table 6-6 shows type and amount of Gavi support under several windows: new and underused vaccine support (NVS), vaccine introduction grants (VIG), and health system strengthening (HSS). In addition to financing the introduction of the Hepatitis B vaccines, the NVS window–which accounts for 51 percent of the total disbursements to date–is financing the introduction of the pentavalent vaccine over 2013-16. The IPV vaccine is also being introduced in the country via the same support mechanism; IPV is scheduled for a single-phase rollout in July 2016.73 Indonesia received support under the VIG window
71 Ministry of Health, Gavi Annual Progress Report (2010, 2014).72 A specific example is that part of the puskesmas capitation payment that can be used to improve immunization service delivery.73 There are benefits to offering the oral polio vaccines (OPV) because administration does not need a trained medical staff
member; and also because after vaccinating children, the virus continues to be shed and is picked up by other children. The downside, however, is that this form of the virus mutates. Before a country is fully vaccinated, OPV is generally recommended followed by transition to IPV (which is more expensive).
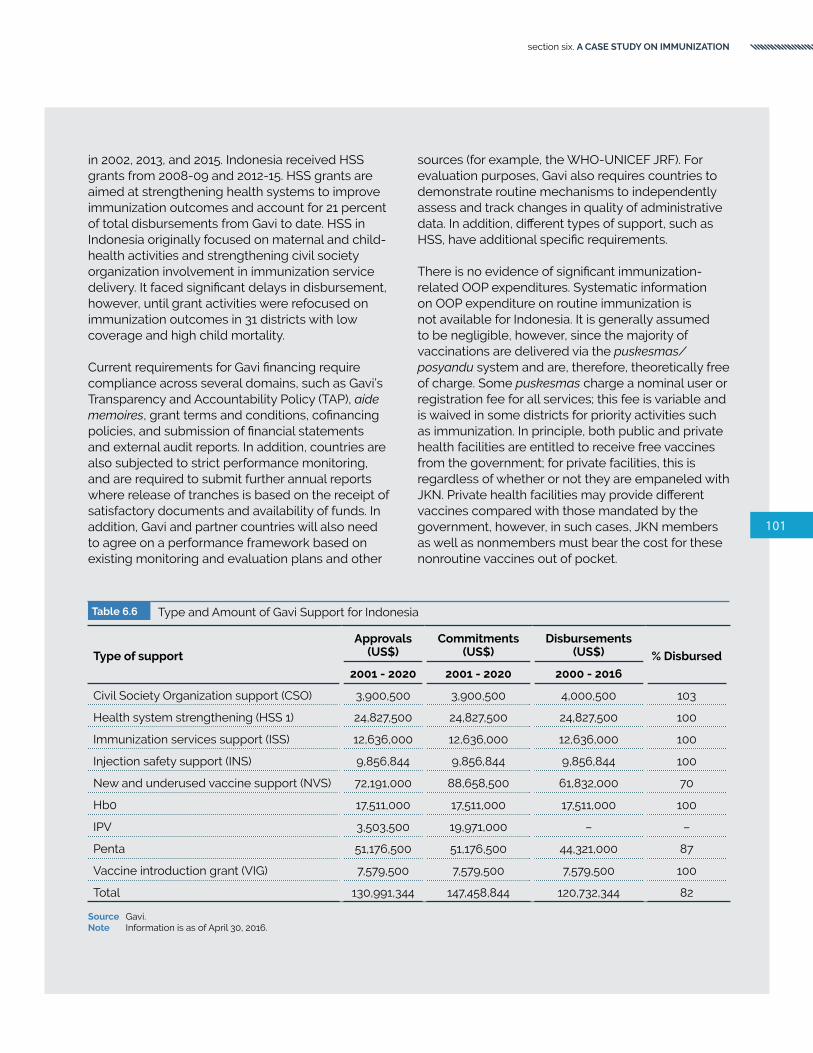
101
section six. A CASE STUDY ON IMMUNIZATION
in 2002, 2013, and 2015. Indonesia received HSS grants from 2008-09 and 2012-15. HSS grants are aimed at strengthening health systems to improve immunization outcomes and account for 21 percent of total disbursements from Gavi to date. HSS in Indonesia originally focused on maternal and child-health activities and strengthening civil society organization involvement in immunization service delivery. It faced significant delays in disbursement, however, until grant activities were refocused on immunization outcomes in 31 districts with low coverage and high child mortality. Current requirements for Gavi financing require compliance across several domains, such as Gavi’s Transparency and Accountability Policy (TAP), aide memoires, grant terms and conditions, cofinancing policies, and submission of financial statements and external audit reports. In addition, countries are also subjected to strict performance monitoring, and are required to submit further annual reports where release of tranches is based on the receipt of satisfactory documents and availability of funds. In addition, Gavi and partner countries will also need to agree on a performance framework based on existing monitoring and evaluation plans and other
sources (for example, the WHO-UNICEF JRF). For evaluation purposes, Gavi also requires countries to demonstrate routine mechanisms to independently assess and track changes in quality of administrative data. In addition, different types of support, such as HSS, have additional specific requirements.
There is no evidence of significant immunization-related OOP expenditures. Systematic information on OOP expenditure on routine immunization is not available for Indonesia. It is generally assumed to be negligible, however, since the majority of vaccinations are delivered via the puskesmas/posyandu system and are, therefore, theoretically free of charge. Some puskesmas charge a nominal user or registration fee for all services; this fee is variable and is waived in some districts for priority activities such as immunization. In principle, both public and private health facilities are entitled to receive free vaccines from the government; for private facilities, this is regardless of whether or not they are empaneled with JKN. Private health facilities may provide different vaccines compared with those mandated by the government, however, in such cases, JKN members as well as nonmembers must bear the cost for these nonroutine vaccines out of pocket.
Table 6.6 Type and Amount of Gavi Support for Indonesia
Type of support
Approvals (US$)
Commitments (US$)
Disbursements (US$) % Disbursed
2001 - 2020 2001 - 2020 2000 - 2016
Civil Society Organization support (CSO) 3,900,500 3,900,500 4,000,500 103
Health system strengthening (HSS 1) 24,827,500 24,827,500 24,827,500 100
Immunization services support (ISS) 12,636,000 12,636,000 12,636,000 100
Injection safety support (INS) 9,856,844 9,856,844 9,856,844 100
New and underused vaccine support (NVS) 72,191,000 88,658,500 61,832,000 70
Hb0 17,511,000 17,511,000 17,511,000 100
IPV 3,503,500 19,971,000 – –
Penta 51,176,500 51,176,500 44,321,000 87
Vaccine introduction grant (VIG) 7,579,500 7,579,500 7,579,500 100
Total 130,991,344 147,458,844 120,732,344 82
Source Gavi.Note Information is as of April 30, 2016.

102
HEALTH FINANCING SYSTEM ASSESSMENTspend more . spend right . spend better
Availability of information on budgeting and expenditure on immunization activities varies by levels of government, but is generally poor when it comes to information from the subnational level. Central government budgeting on immunization programs is easily available, and national coverage and vaccine administrative data are available as they are reported by the JRF and on the MoH website. In addition, regulations state that grants from NGOs must be reported to relevant ministries. As previously noted, however, provincial and district-level budgets and expenditure is not available, nor is it reported to central authorities. At the service level, it is not possible to track immunization resources received beyond vaccine stock and administration monitoring.
In 2016, a new DAK regulation enables more oversight to be given to subnational governments, potentially leading to better funding security for each health program, including immunization. DAK guidelines for 2016 provided detailed guidance and indicators for activity cost components.74 The cost components include puskesmas staff transportation cost for outreach activities to posyandu or home visit; BIAS implementation; introduction of new vaccines; capacity building (EVM, DQS); advocacy; and outreach and coordination. Districts now have to submit a proposal, following which technical verification will be conducted by the EPI unit to ensure all components are included and costed.
Financing of immunization programs in Indonesia must take into account the cost of activities conducted
by other MoH units beyond the EPI subdirectorate. At the national level, much needed nonoperational immunization activities to comprehensively support the NIP, such as surveillance, health promotion, regulatory systems strengthening and laboratory support, are the responsibility of directorates/subdirectorates of MoH beyond the EPI unit. It is also important to note that in Indonesia, through UNICEF and WHO, Gavi has financed catalytic nonoperational immunization activities, for example, technical assistance to conduct assessment for immunization program scale up, evaluation of postvaccine introduction, and data quality assessment. Systematic information on the cost of nonoperational immunization activities is currently unavailable, although essential for further analysis of immunization financing in Indonesia.
Immunization expenditures are projected to increase further as Indonesia experiences economic growth, indicating a need to secure sustainable funding for immunization. Elasticity analysis by Nader et al. (2014) showed that countries spent about US$6.32 for every $100 in GNI increase from 2006 to 2012.75 Ensuring efficiency of spending is also a key issue. An analysis of government immunization program expenditures in 51 lower- and lower-middle-income countries indicated that the mean cost per surviving infant on routine immunization was US$12 in 2006, and US$20 in 2012. In Indonesia, the cost of immunization per surviving infant in 2014 was ~US$33, a significant increase from US$13 in 2013, due to pentavalent vaccine introduction (Table 6.7). Similar to Indonesia, the cost per surviving infant in countries such as
Table 6.7 Cost per Surviving Infant in Select Comparators
CountryCost per surviving infant (US$)
2013 2014
Indonesia 13 33
Cambodia 40 33
Lao PDR 31 –
India 25 –
Sri Lanka 29 18
Vietnam 14 –
Source Gavi Country Annual Progress Reports 2013 and 2014.Note Cost per surviving infant is calculated as total expenditures for immunization divided by number of surviving infants.
74 MoH Regulation No. 82/2015.75 Expenditure data are analyzed from 68 of 73 GAVI Phase-II lower- and lower-middle-income countries over 2006–12.

103
section six. A CASE STUDY ON IMMUNIZATION
Cambodia and Sri Lanka varies by year, which could also be due to new vaccines introduction.
JKN’s benefit package currently covers routine immunizations for children under five and tetanus immunization for pregnant women at primary health facilities. Immunization services are free in public health facilities, regardless of JKN membership status. Unlike in public health facilities, JKN members have to present their JKN card when visiting empaneled private facilities to obtain immunization services to avoid paying fee for service (for example, immunizations provided by the government). According to guidelines, however, immunization services in hospitals are not covered by JKN–routine vaccines are provided free of charge, but the cost to administer the vaccine is not. The MoH is advocating for adding immunization for school-aged children, boosters for children aged 18 months and 24 months in the JKN benefit package to ensure that the entire routine immunization package outlined in the national immunization schedule is covered under JKN. For new vaccines, there is no separate procedure to include the vaccines in JKN benefit package. Any new vaccines included in the routine immunization package, such as IPV, are automatically covered under JKN’s benefit package.
There are concerns about the usage of capitation payments to improve immunization service delivery. Anecdotal evidence suggests that, due to confusion among subnational governments and providers, JKN capitation payments are often prioritized for financing curative care only, even though it is supposed to be used for individual promotive and preventive activities, including for immunization. Forty percent of the capitation payment is meant for operational support, however, it is not clear how the health facility uses it to improve immunization services such as upgrading and maintaining cold chain, availability of equipment (vaccine carrier, temperature monitoring device) and training for vaccinators. The capitation payment is not currently linked to attainment of key health outcomes such as immunization.
The treatment and care of AEFI cases resulting from immunization, is unclear following the introduction of JKN. Prior to JKN introduction, the government covered the costs associated with the management of AEFI cases, including those not covered under any health insurance scheme. In contrast, after JKN implementation, only JKN members are covered for medication and treatment resulting from AEFI cases. This might have implications for the confidence of health care workers to administer the vaccines as well as the willingness of the community to seek immunization services.

104
HEALTH FINANCING SYSTEM ASSESSMENTspend more . spend right . spend better
Expanding access to nontraditional vaccines will considerably increase the funding requirements. As previously mentioned, Indonesia is planning to introduce several new vaccines (Measles Rubella, Japanese Encephalitis, Pneumococcal, Rotavirus, and Human Papilloma Virus) in the next few years. These new vaccines are typically costlier. The financial projection that includes only Pentavalent and excludes other new vaccines, suggests that the country cofinancing will likely increase from US$2.1 million in 2013 to US$32.6 million in 2017.76 The additional funding requirements will also have to take into account the nonvaccine immunization costs (surveillance, quality assurance, training, and so forth).
Rigorous cost-effectiveness analysis, comprehensive financial projections, fiscal space analysis and detailed financial planning for the new vaccines would be useful as part of the transition plan to ensure adequate financial capacity to meet the increased demand for resources. Moreover, as Indonesia is graduating from Gavi, it may limit the access to grants that have been used in the past to support the cost of preintroduction activities, such as health worker training, IEC, social mobilization, and technical assistance. Under the exceptional catalytic funding support, Gavi will support the introduction of JE, MR and HPV in 2017 and the government is expected to fund them going forward. IPV introduction in 2016 receives full support from Gavi until 2018, but will be fully funded by the government in the subsequent years.
Introduction of new vaccines will require systematic service delivery readiness to accommodate the changes in service modalities and the scope of services provided. New delivery technologies and readiness of cold-chain storage and logistic systems may be needed. For example, rotavirus vaccines may require additional cost to expand cold-chain
Introduction of New Vaccines
capacity, because the present packing volume of rotavirus vaccines is approximately 7-18 times greater than the packing volume of traditional vaccines (for example, DPT vaccines). Initiatives to minimize the packing volume may be required and have implications on additional budgeting for cold-chain and logistics systems (Suwantika et al. 2014). Human resources capacity needs to be strengthened in the form of adequate training of health care workers and adjustments of the number of vaccinators as the number of injections per child per session increases. Improved incentive and support from the government to support quality and cost-effective vaccines production by Bio Farma is needed as well as strengthened coordination and cooperation among different stakeholders including manufacture, national regulatory authorities, and NIP.
Learning from the successful introduction of pentavalent in Indonesia, several key factors that include local scientific evidence, financing, production, and political support must be taken into account for the planned introduction of new vaccines. This was evidenced by the successful introduction of pentavalent vaccine in Indonesia where there was an adequate, evidence-based recommendation from WHO and local experts, such as the Indonesian Technical Advisory Group on Immunization (ITAGI) and the Indonesian Pediatric Society, following local cost-effectiveness studies. In addition, there was sufficient government financing for the new vaccine, and Bio Farma was able to produce the required amount of pentavalent vaccine to meet the needs of the country. More importantly, political support was successfully garnered from key stakeholders, including MoH, parliament, and religious societies (Hadisoemarto et al. 2016). Ensuring that all these key factors are in place is key when the government is planning the introduction of new vaccines such as MR, JE, and HPV.
76 Gavi Alliance, estimates as of September 2013 from Saxenian et al. 2014

105
section six. A CASE STUDY ON IMMUNIZATION
106
HEALTH FINANCING SYSTEM ASSESSMENTspend more . spend right . spend better

107
section seven. DISCUSSION AND POLICY OPTIONS
section 7 .
DISCUSSION ANDPOLICY OPTIONS

108
HEALTH FINANCING SYSTEM ASSESSMENTspend more . spend right . spend better
Indonesia has made key strides towards attaining UHC in terms of population coverage. The country has made a commitment to attain UHC by 2019 when everyone in Indonesia is expected to have coverage under JKN. In 2015, nearly 160 million individuals, or more than 60 percent of the population, have been covered by JKN. Nevertheless, Indonesia faces key challenges in order to meet its 2019 population coverage target as well as on other, arguably more important, dimensions of UHC, including service coverage and financial protection.
From a health financing perspective, one of the key bottlenecks to attaining UHC in Indonesia is the relatively low quantum of health spending. There is no clear normative answer to the question of how much a country should spend on health (Savedoff 2003). A substantial body of literature focuses on the issue of sufficiency in terms of assessing deviations, for instance, from a health spending target of 5 percent of GDP or public spending of 15 percent of the government budget. Although spending targets can serve as inputs for estimation of the magnitude of global financing gaps, they are usually not very helpful at the country level, given the wide variations in country and health-system contexts. Resource needs will vary country-by-country, and even the most ambitious expenditure targets will not ensure that UHC will be achieved in all countries. Indeed, many
countries spend more than these targets and have yet to achieve UHC, while others spend less and manage to ensure access to a basic health package for their entire population.
Benchmarking–as opposed to measuring deviations from targets–can be a better way to assess the sufficiency of resources. Global and regional benchmarks indicate that Indonesia’s health system remains significantly underresourced. At 3.6 percent of GDP, Indonesia’s THE levels are among the lowest in the world, and are particularly low when benchmarked against other lower-middle-income countries (5.9 percent of GDP) and across the EAP region (6.6 percent of GDP). Although low levels of health spending can also be a sign of efficiency, as discussed below, this is clearly not the case for Indonesia. The average THE rate among developing countries that have already attained three of health SDGs77 is 6.6 percent of GDP, significantly higher than the amount spent by Indonesia in terms of share of GDP. Actuarial estimates for expanding UHC also indicate underresourcing of Indonesia’s health system, to the extent of at least 1 percent of GDP (Guerard et al 2011). Total health spending in countries such as Malaysia and Thailand–both of which are further along the UHC spectrum than Indonesia–is in the 4-5 percent of GDP range.
77 A neonatal mortality rate of less than 12 per 1,000 live births, an under-five mortality rate of less than 25 per 1,000 live births, and an MMR of less than 70 per 100,000 live births.

109
section seven. DISCUSSION AND POLICY OPTIONS
Although Indonesia is following a SHI model for attaining UHC by 2019 in principle, in reality the health system is financed by a combination of sources and separate flows. The four primary sources of health financing in the country include OOP spending by households, government budgetary supply-side health spending (both at the central and subnational levels), SHI, and external financing. Despite increases in public financing in recent years, the fundamental structure of health financing has remained largely unchanged in Indonesia because of concomitant increases in OOP spending for health.
OOP spending by households remains the largest source of financing for health in Indonesia at 45.3 percent of THE in 2014. OOP payments are an inefficient and inequitable means of financing health systems. OOP payments connect utilization of health services to an individual’s or household’s ability to pay; deter utilization (especially for the poor), thus exacerbating or sustaining inequalities; and expose individuals or households to the risk of impoverishment that results from high levels of health expenditures when they do utilize health
services (constraining spending on other necessary expenditures). Given the general unpredictability and undesirability of health shocks and expenditures, OOP spending should generally only be used as a means for managing overutilization and reducing waste in more advanced health systems, and not as a primary mechanism for resource generation in developing health systems such as Indonesia’s.
High levels of OOP spending are, in large part, a result of relatively low levels of public financing for health in Indonesia. Despite recent increases in public financing–including via the expansion of SHI as well as increases in government budgetary health spending–Indonesia’s health financing transition is stalled because OOP spending has risen at commensurate rates. For OOP spending to decline significantly, public financing for health will have to increase at a rate faster than the rise in OOP spending for health.
No country has attained the SDGs and reduced OOP spending on health to less than 30 percent of total health spending without public expenditures on health being at least 2.7 percent of GDP, much higher
Table 7.1 Indonesia Compared With Countries That Attained Key Health SDGs With an OOP Share of Total Health Spending <30%
CountryGNI per capital (US$)
Total health spending
per capita, (US$)
Total health spending share of GDP (%)
Public spending on health share
of GDP (%)
Neonatal mortality*
Under-five
mortality*
Maternal mortality
ratio*
OOP spending share of
total health spending (%)
Indonesia 3,383 126 3.6 1.1 13.5 27.2 126 45.3
Argentina 12,241 605 4.8 2.7 6.3 12.5 52 30.7
Fiji 4,888 204 4.5 3.0 9.6 22.4 30 23.0
Brazil 11,491 947 8.3 3.8 8.9 16.4 44 25.5
Belize 4,376 279 5.8 3.9 8.3 16.5 28 23.0
Turkey 10,394 568 5.4 4.2 7.1 13.5 16 17.8
El Salvador 3,949 280 6.8 4.5 8.3 16.8 54 28.8
Romania 9,805 557 5.6 4.5 6.3 11.1 31 18.9
Hungary 13,406 1,037 7.4 4.9 3.5 5.9 17 26.6
Jordan 5,359 359 7.5 5.2 10.6 17.9 58 20.9
Thailand 5,648 360 6.5 5.6 6.7 12.3 20 7.9
Samoa 4,042 301 7.2 6.5 9.5 17.5 51 5.9
Costa Rica 10,071 970 9.3 6.8 6.2 9.7 25 24.9
Bosnia and Herzegovina 4,907 464 9.6 6.8 4.0 5.4 11 27.9
Source World Development Indicators database (Income level and health expenditure 2014, SDGs indicators 2015).Note *Mortality rates are per 1,000 live births for neonatal and U5 and per 100,000 live births for MMR. ** Indonesia data is based on the NHA
country report, 2014 (Ministry of Health - Center for Health Economics and Policy Studies - AIPHSS, 2015)

110
HEALTH FINANCING SYSTEM ASSESSMENTspend more . spend right . spend better
than the rate for Indonesia (1.5 percent of GDP in 2014) (Table 7.1). Although this does not mean that if Indonesia were to increase public financing for health to 2.7 percent of GDP, it will then attain the SDGs and reduce OOP spending shares to less than 30 percent. The implications are more so that public financing for health will need to rise significantly beyond current levels in order for Indonesia to make progress on improving service coverage and financial protection. Nevertheless, despite OOP spending for health remaining high, there is evidence that the incidence of catastrophic health expenditures has declined. This is possibly a result of the relative progressivity of OOP spending in Indonesia’s health financing system. In spite of this progressivity, high OOP spending deters utilization by the poor and reduces the redistributive capacity of health financing and is undesirable even if this results in higher levels of OOP spending being incurred by the rich.
Supply-side government budgetary expenditures are the second-largest source of health expenditures in Indonesia (41.4 percent of THE). Given Indonesia’s decentralized governance arrangements, most government health expenditures occur at the district level. Most government revenues are, however, raised at the central level and are transferred to subnational governments using a complex system of intergovernmental fiscal transfers. For the most part, districts have discretion on how much gets spent on health at the local level. Although government budgetary allocations to health are increasing from a relatively low base, they could be made more effective and efficient in achieving policy objectives and health outcomes.
The generally low levels of government budgetary expenditures for health reflect both a low government revenue mobilization effort as well as a relatively low prioritization given to health, especially at the central government level. Recent policy efforts have led to a reprioritization for health at the central level, with health poised to receive the legally mandated 5 percent of government budgetary allocations in 2016. There have also been increases in the intergovernmental fiscal transfers earmarked for health via DAK. Indonesia does not have an explicit results-based orientation in its system of intergovernmental fiscal transfers.
The central government does not have mechanisms to incentivize the generation of outputs/outcomes from use of resources, nor does it have clear policy levers to influence the allocation of resources at the subnational level. Although some of the allocations of resources are based on district characteristics, the capacity of districts to plan for, absorb, and realize outputs/outcomes is not a key determining factor; the focus to date has largely been on ensuring compliance with rules/norms rather than on building the capacity of and/or incentivizing districts to effectively utilize resources in order to improve service delivery. The key policy challenge will be ensuring that these additional resources are absorbed and utilized effectively and that district governments and public facilities are provided with the necessary technical assistance and incentives to do so. Some districts continue to view health as a revenue-generating sector and have revenue-raising targets from user charges that are then pooled at the district treasury level along with other revenue sources.
SHI is the third largest source of, and agent for, health expenditure in the country (13 percent of THE). Almost one-half of all social health expenditure is sourced from the central government in the form of premium payments for the poor and nearpoor. Despite relatively large increases in SHI expenditures in recent years, new concerns have emerged regarding their equity and financial sustainability. Although Indonesia has successfully instituted a single-payer SHI system, contribution collection among nonpoor informal workers has been difficult (under current regulations, this group must contribute in order to enroll in JKN). Few nonpoor informal workers have enrolled to date and those that have are adversely selected, undermining equity, and threatening financial sustainability of JKN.
Since the 2008 Health PER, there has been some significant progress with the implementation of the JKN program. The implementation of JKN has raised expectations for improved access to health care and reduced OOP spending. There is an encouraging trend from 2005 that the share of OOP spending to THE is decreasing, and the government is increasing the budget allocation for health sector. However, OOP expenditure continues to be the biggest source of Indonesia’s health spending and the effect of JKN expansion on the composition of health spending remains to be seen.
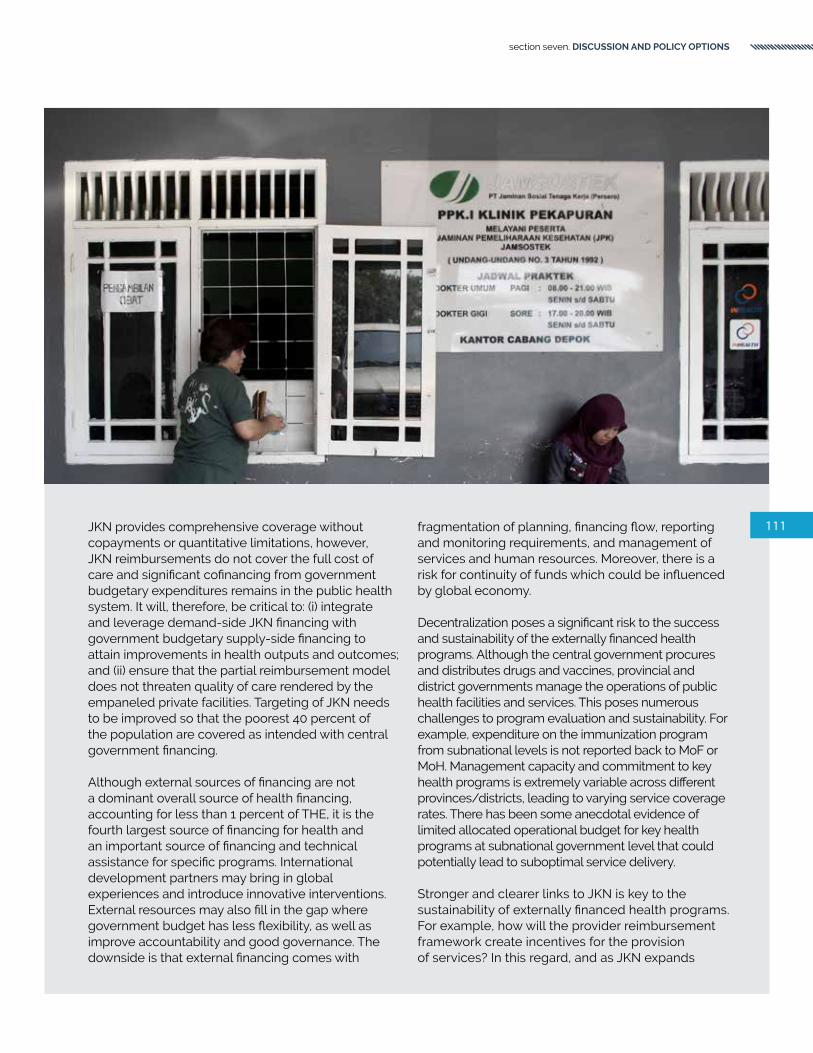
111
section seven. DISCUSSION AND POLICY OPTIONS
JKN provides comprehensive coverage without copayments or quantitative limitations, however, JKN reimbursements do not cover the full cost of care and significant cofinancing from government budgetary expenditures remains in the public health system. It will, therefore, be critical to: (i) integrate and leverage demand-side JKN financing with government budgetary supply-side financing to attain improvements in health outputs and outcomes; and (ii) ensure that the partial reimbursement model does not threaten quality of care rendered by the empaneled private facilities. Targeting of JKN needs to be improved so that the poorest 40 percent of the population are covered as intended with central government financing.
Although external sources of financing are not a dominant overall source of health financing, accounting for less than 1 percent of THE, it is the fourth largest source of financing for health and an important source of financing and technical assistance for specific programs. International development partners may bring in global experiences and introduce innovative interventions. External resources may also fill in the gap where government budget has less flexibility, as well as improve accountability and good governance. The downside is that external financing comes with
fragmentation of planning, financing flow, reporting and monitoring requirements, and management of services and human resources. Moreover, there is a risk for continuity of funds which could be influenced by global economy.
Decentralization poses a significant risk to the success and sustainability of the externally financed health programs. Although the central government procures and distributes drugs and vaccines, provincial and district governments manage the operations of public health facilities and services. This poses numerous challenges to program evaluation and sustainability. For example, expenditure on the immunization program from subnational levels is not reported back to MoF or MoH. Management capacity and commitment to key health programs is extremely variable across different provinces/districts, leading to varying service coverage rates. There has been some anecdotal evidence of limited allocated operational budget for key health programs at subnational government level that could potentially lead to suboptimal service delivery.
Stronger and clearer links to JKN is key to the sustainability of externally financed health programs. For example, how will the provider reimbursement framework create incentives for the provision of services? In this regard, and as JKN expands

112
HEALTH FINANCING SYSTEM ASSESSMENTspend more . spend right . spend better
coverage, the key to financial and institutional sustainability will be for these programs to be better integrated within the context of UHC, both as an indicator of progress towards UHC attainment (as recommended by a recent joint WHO-WB report on this issue) as well as a program element to which a proportion of intergovernmental fiscal transfers and BPJS provider payments could be linked. Although lessons from countries that are more advanced along the UHC pathway suggests that it is not necessary to subsume these programs and services under JKN programs, there are benefits to ensuring closer coordination, integration, and to making the UHC link more explicit. Better coordination of service delivery with empaneled nonpublic providers as well as joint monitoring and evaluation are some of the additional potential efficiency-enhancing benefits of closer UHC integration.
Indonesia continues its commitment to meeting SDG targets and persisting challenges in the availability and readiness of health service delivery systems. This includes addressing chronic challenges in the availability and readiness of health services, with increasing demand due to, and the promise of, JKN implementation. Even with the combined demand-supply financing model, there is a disconnect between public financing for and JKN benefits especially for those living in relatively remote and rural locations of the country, and this limits the effective availability of benefits for many JKN beneficiaries. Supply-side constraints reflect not only shortages in overall numbers, but also in distribution given the geographic context of Indonesia. They comprise all the factors that limit health care delivery at the point of service, including the number of physicians, nurses, and midwives; the number of beds; medical equipment and technology; medicine supplies; and other basic amenities. Although detailed data on the subnational distribution of health expenditures including social health insurance, are not available, there are indications that inequities are prominent.
In order to resolve these persisting issues, financing the health sector will require not only an increase in funding, but also well-targeted allocation and spending, and improved efficiency. Several
opportunities exist for improving the efficiency of Indonesia’s health system. In practical policy terms, efficiency improvements entail looking for opportunities to reduce costs without reducing health services/outcomes and/or improving health services/outcomes for the same costs. The WHO report indicates that, globally, the ten leading sources of inefficiency include: (i) underuse of generic medicines and higher than necessary prices for medicines; (ii) use of substandard and counterfeit medicines; (iii) inappropriate and ineffective use of medicines; (iv) supplier-induced demand and overuse of some services; (v) inappropriate staff mix and unmotivated workers; (vi) inappropriate hospital admissions and length of stay; (vii) low use of infrastructure such as hospital beds; (viii) medical errors and suboptimal quality of care; (ix) waste and fraud; and (x) inefficient mix and inappropriate level of interventions (WHO 2010b).
In Indonesia–as noted at various points in this policy paper–prominent options for enhancing the efficiency of health expenditures include:
• reducing OOP payments by expanding and deepening coverage;
• improving primary care; • improving the distribution and quality of HRH;• enhancing the effectiveness of
intergovernmental fiscal transfers; and• Strengthening linkages between UHC and
priority programs, for example immunization, HIV/AIDS, and tuberculosis.
Results-based incentives for service delivery could be pursued to improve service coverage of key priority programs and to enhance efficiency in spending in the future. From the demand side, Indonesia could build on extensive experiences in implementing household and community conditional cash transfers program that incentivize results at household and local level, respectively, albeit at limited scale. From the supply-side, tying provider payments to attainment of population-level service coverage rates has been tried in other countries and could be piloted as a potentially effective mechanism to improve service readiness.

113
section seven. DISCUSSION AND POLICY OPTIONS
To make substantial progress towards service coverage and financial protection in order to achieve UHC by 2019, Indonesia would have to spend more, spend right, and spend better. The following are some policy options for Indonesia to consider:
Make the JKN benefits package explicit and adjust the package to be commensurate with financing and service delivery capacity: The current JKN’s benefits package is comprehensive and is not explicit in that all medically necessary coverage is automatically deemed to be covered without any copayments, balanced billing, or expenditure caps. All registered JKN members are entitled to a range of medical services, including a range of services that fall under promotive, preventive, curative and rehabilitative services. While the list is comprehensive and specifies a negative list, it does not clearly spell out a positive list of what is covered under the program, the latter being inferred by providers from national clinical guidelines and from drugs that are included in the national formulary. To ensure that JKN’s covered services and benefits are available for all members and the resources (both financial and human) required to deliver the benefits are available, the JKN benefits package needs to be more explicit and adjusted in line with current public financing resources, economic growth and projected macrofiscal trajectory, and service delivery capacity. Indonesia may learn from other countries’ experience, such as Chile, in moving from a comprehensive benefit package to a basic set of explicit benefits guaranteed with adequate financing from public sources (via government budgetary supply-side expenditures and/or social health expenditures). Mechanisms can then be put in place such that subsequent expansions to benefits are made in tandem and commensurate with planned expansions in public financing.
POLICY OPTIONS
Ensure adequate public financing for UHC: While Indonesia has recently increased its government health spending, it remains one of the lowest in the world at 1.5 percent of GDP. No country has attained adequate SDGs and reduced OOP spending on health to less than 30 percent of total health spending without public expenditures on health being at least 2.7 percent of GDP, much higher than the current rate for Indonesia. It is, therefore, crucial to increase government health spending as a necessary and critical but not sufficient, condition to progress towards achieving UHC. Acknowledging the challenges in increasing the fiscal space for public financing for UHC, key options to address this include a combination of: (i) increasing nonoil and gas tax revenues; (ii) central government’s reprioritization of health (including from reduced fuel subsidies); (iii) efficiency gains; (iv) earmarked tobacco taxes; (v) complementary subnational financing; (vi) targeted incentives/penalties for enrolling the informal sector; and (vii) incentives to formalize the informal sector.
Increase focus on primary health care, including prevention and promotion: There are concerns that the focus on UHC is for curative and rehabilitative care and is distracting from the focus on improving primary health care and population/public health interventions. With the epidemiological transition towards NCDs already underway in Indonesia, this will lead to an unsustainable fiscal burden on the JKN, greater OOP for those not covered or even increased numbers of patients foregoing treatment. Most cost-effective interventions are usually delivered at the population level (for example, increasing tobacco taxes to reduce smoking rates which are alarmingly high in Indonesia) as well as the primary-care level (for example, early diagnosis and treatment, community-level outreach, interpersonal communication for behavior change and lifestyle modification).

114
HEALTH FINANCING SYSTEM ASSESSMENTspend more . spend right . spend better
Cover the nonpoor and eliminate mistargeting: Given challenges related to public financing, supply-side readiness, equity in and financial sustainability of social health expenditure incidence, and implicit rationing, the following could be done related to JKN: (i) although improvements in socialization, awareness, and availability of benefits may improve enrollment of the nonpoor in JKN, global experience indicates that this may not be sufficient and alternatives would need to be considered; and (ii) mistargeting needs to be eliminated, and the current system does not incentivize local governments to enroll targeted beneficiaries. One option may be for BPJS to transfer resources to local governments based on verified local numbers rather than on capitation as is currently the case.
Integrate supply-side and demand-side financing to improve public and private provider supply side readiness: At the puskesmas level, where the predominant provider payment method for health facilities is capitation, this payment should be linked either directly or indirectly to the attainment of minimum standards. Facilities should be allowed discretion on how capitation funds are utilized, and reimbursement from BPJS should not become a revenue source for district government for general-purpose use. More generally, as financing gradually shifts from the supply-side to the demand-side in Indonesia’s health system, an appropriate level of autonomy for health facilities–coupled with enhanced capacity to manage revenues–needs to be found for public health facilities. Inclusion of private providers should also focus on ensuring supply-side readiness at these facilities as well as providing adequate capitation amounts to level the playing field with the public sector facilities that also receive supply-side financing. At the hospital level, diagnosis-related group payments could be made conditional on the adequacy of services provided in order to encourage investments in improving service readiness. As the health system evolves, additional measures to mitigate negative incentives inherent in capitation systems–such as overreferral and inappropriate referral to secondary care as well as undertreatment–should be considered.
Increase effectiveness of intergovernmental fiscal transfers by improving local government capacity, ensuring accountability, and incentivizing
results: In Indonesia’s decentralized context, increased government health spending needs to be complemented with system improvements to address the persistently low and unevenly distributed quantity and quality of health services, with a focus on lagging and remote districts. First, improve local government’s (provincial and district) capacity to prioritize, mobilize, plan, budget, and effectively utilize both supply- and demand-side financing, in order to improve availability and utilization of quality health services. Second, strengthen the monitoring and evaluation system to enable provision of an independent assessment of results achievement to make local governments more accountable. Social accountability is another mechanism by which providers could be held accountable, building upon the experience from within and outside of Indonesia. Third, introduce nonfinancial incentives (for example, benchmarking and public notification and rewards) and financial incentives tied to achievement of results by linking intergovernmental fiscal transfers to achievement of results such as minimum service standards for health. Minimum Service Standards as an instrument that could potentially be used as Central government levers to influence sub national level: The most recent amendment to the Decentralization Law in UU 23/2014 states the Minimum Service Standards (MSS) related to the distribution of governance affairs and authority between the central and regional governments (province and district/city), which are regulated based on the criteria of externality, accountability and efficiency. In particular, it is underlined that the central government is responsible for setting the standards to be used by local governments (provincial and district/city) as a reference in the implementation of basic health services. Minimum Service Standard aims to ensure the delivery of essential services and to ensure the accountability of different levels of government with the inclusion of a set of agreed indicators to measure achieved results. As a planning and budgeting tool MSS is expected to serve as the reference for prioritizing budget allocation for these basic health services and is an instrument that could potentially be used as Central government levers to influence sub national level. MSS is expected to be released as a presidential regulation. The mechanism to ensure sub national compliance by holding the

115
section seven. DISCUSSION AND POLICY OPTIONS
head of regions (Governor, Bupatis/Mayors) directly accountable in achieving minimum services targets is a potential game changer, but how the follow-up ministerial regulations and guidelines are implemented will determine the impact of the MSS.
Stronger and clearer links to JKN is key to the sustainability of externally financed health programs: While external financing constitutes a mere one percent of THE, this finances several priority health programs, including HIV and AIDS, TB, malaria, and immunization. To continue progress made on these programs, there needs to be a transition plan to ensure that services continue to be available and scaled up, even after donors transition out of Indonesia. In countries that have not planned their transition, there has been disruption of services, which could have serious implications for health outcomes, such as control of MDR-TB. To transition smoothly, Indonesia needs to focus not only on
the quantum of financing required, but also on the governance and service delivery mechanisms in place to deliver these services. As JKN expands coverage, the key to financial and institutional sustainability will be for these externally-financed health programs to be better integrated within the context of UHC.
Leveraging JKN provider payment mechanisms to incentivize preventive/promotive services for results: Provider payment mechanisms under JKN are “passive” in that there are no explicit linkages with outputs/outcomes. Improved socialization of guidelines on use of JKN capitation payments would help as would other mechanisms such as introduction of “strategic” purchasing, e.g., to better integrate JKN provider payment mechanisms with provision of preventive/promotive care so as to improve the efficiency and financial sustainability of public financing for UHC in Indonesia.

116
HEALTH FINANCING SYSTEM ASSESSMENTspend more . spend right . spend better

117
APPENDIXES
APPENDIXES

118
HEALTH FINANCING SYSTEM ASSESSMENTspend more . spend right . spend better
Appendix AInterfiscal Transfer Diagram
Source Act No. 17, 2003
Natural ResourcesProfit Sharing
Tax Profit Sharing
TRANSFER TO THELOCAL LEVEL
BalanceFunds
Special Autonomyand Adjustment Funds
SpecialAutonomy Funds
Profit Sharine Funds
General Allocation Funds
Special Allocation Funds
PAPUA Special Autonomy Funds
WEST PAPUA Special Autonomy Funds
ACEH Special Autonomy Funds
PAPUA Infrastructure Funds
WEST PAPUA Infrastructure Funds
Additional Teacher Income
Teacher Professional Allowance
School Operational Assistance
Local Incentive Funds
AdjustmentFunds
Property Tax
Income Tax
Tobacco Excise
Geothermal
Fisheries
Forestry
General Mining
Gas and Oil

119
APPENDIXES
Appendix BFlow of Funds
Population / Enterprises
External Donors
External Agencies
Ministry ofFinance Other Ministries
Hospitals(Public, Private, Parallel Health System)
Providers of AmbulatoryHealth Care
(GPs, specialist, Clinics)
Providers ofAncillary Services
Retailers and OtherProviders of Medical Goods
Providers of Preventive Care
Providers of Health Care SystemAdministration and Financing
Rest of Economy
Rest of the World
Other Demand Side Schemes(VHI, NPISH)
Ministry ofHealth
BadanPenyelenggaraJaminan Sosial
KesehatanBPJS Kesehatan
AutonomousLocal Scheme
Provincial HealthOffice (PHO)
ProvincialGovernment
DistrictGovernment
District HealthOffice (DHO)
fiscal balance transfer
nationalbudget
grantsand/orloans
deconcentration &co-administration
mechanism and regionaloffice fund for hospital
localscheme
contribution
grantsand/or
loans
social insurancecontribution
socialinsurancecontribution
localtaxes
nationaltaxes
grants
socialinsurancecontribution
self insured in private companies� out of poc� et payment for direct access to health care
socialinsurancecontribution
localscheme
funds;co=financing
Governmental financing scheme
Social Insurance Financing scheme
Private financing scheme
Transfer between scheme
Providers Private financingPublic financing Donor financing

120
HEALTH FINANCING SYSTEM ASSESSMENTspend more . spend right . spend better
Appendix CFunds Flow of The Global Fund Grants
Reporting
Funding flows
1USD/IDRAccount asapprovedby MoF
3USD/IDRAccount asapprovedby MoF
2USD/IDRAccount asapprovedby MoF
PRINCIPLERECIPIENTS
Sub RecipientsCentral
SSRCentral
GovernmentSpecial Account
Sub RecipientsNGO
SSRNGO
Sub RecipientsProvince
SSR
HealthFacilities
CCM/TWG
FLOW OF FUND AND REPORTINGFROM PR TO SR, SR CENTRAL / NGO AND SSR

121
APPENDIXES
Appendix DTobacco Taxation Reform in Indonesia: Good for Public and Fiscal Health78
Tobacco use is a major but preventable public health risk in Indonesia and, contrary to trends in other middle-income countries, smoking prevalence and its intensity per adult is high and growing. Two out of three adult men smoke, a rate that has been increasing since the 1990s and is one of the highest in the world. According to the 2011 Global Adult Tobacco Survey (MoH and WHO 2012), 67.4 percent of Indonesian men and 4.5 percent of women (comprising 36.1 percent of the population or 61.4 million people) use tobacco in smoked or smokeless form. Tobacco use is more prevalent in rural areas (39.1 percent) compared with urban areas (33.0 percent). Smoking is the main form of tobacco use and more than one-third consume cigarettes. Kretek79 is the most popular kind of cigarette, followed by a wide distance by hand-rolled and white cigarettes. The prevalence of kretek smoking is more common among men, middle-aged groups, and those with lower levels of education.
Annual consumption of cigarettes per adult has made Indonesia the fourth-highest cigarette consuming country in the world. Rising incomes and greater affordability, and cigarette prices that are among the lowest in the world, are factors underlying growing cigarette consumption in Indonesia. The ratio of the retail price of 100 packets of cigarettes to GDP per capita has decreased over time: from 5.8 percent in 2008 to 4.9 percent in 2012. Indonesia maintains one of the most complex tobacco tax structures in the world that promotes downward substitution to more affordable products. There are no nationwide bans on tobacco advertising, promotion, and sponsorship.
HEALTH AND SOCIAL IMPACT OF TOBACCO USE
Tobacco is harmful and kills prematurely almost one-half of its long-term consumers (Jha and Peto 2014). In Indonesia, smoking was the third leading risk factor of avoidable premature deaths (measured in disability-adjusted life years or DALYs) among males in 2013, after dietary risks and high systolic blood pressure. In terms of the number of years of life lost (YLLs) due to premature death, diseases in which smoking is one of the risk factors, such as cerebrovascular and ischemic heart diseases, and lower respiratory infections were the highest ranking causes of mortality in 2013 (IHME 2013).
Tobacco-related deaths as a proportion of total male deaths have been increasing since 1990–from 13 percent to 20 percent in 2013. Even among women, tobacco-related deaths have also increased, from 6 percent in 1990 to 9 percent in 2013. Smoking-related diseases and premature mortality lead to higher health care costs and lower labor productivity, undermining the potential development of the country. For example, using recent health and medical spending surveys in the United States, researchers calculated that 8.7 percent of all health care spending, or US$170 billion a year, is for illness caused by tobacco smoke, and public programs like Medicare and Medicaid paid for most of these costs (Xu et al. 2015). In Indonesia, health care costs for tobacco-related illnesses were estimated to amount to between US$319 million and US$1.2 billion per year (Barber et al. 2008).
78 This policy note was prepared by Patricio V. Marquez, Lead Public Health Specialist (HNP GP), The World Bank Group.79 Kretek is a type of cigarette consumed in Indonesia. It contains a mix of tobacco leaves, cloves, and other additives.

122
HEALTH FINANCING SYSTEM ASSESSMENTspend more . spend right . spend better
Tobacco consumption in middle- and lower-income households also competes with investment in human capital (for example, health, education) which undermines longer-term labor productivity growth. Households with smokers dedicate 11.5 percent of monthly expenditures to tobacco, and such high spending has serious welfare implications. The national nutritional surveillance system reported that paternal smoking is a predictor of an increased probability of short-term and chronic child malnutrition (Xu et al. 2014). In addition, exposure to second-hand smoke has a negative impact on nonsmokers, particularly women and children at the household level. More than 97 million nonsmokers are regularly exposed to second-hand tobacco smoke known to be carcinogenic (CDC 2016).
TOBACCO TAXATION: A WIN-WIN PUBLIC HEALTH AND FISCAL POLICY MEASURE
As the part of the Framework Convention on Tobacco Control (FCTC)(WHO 2003), a global treaty adopted in 2005 and ratified by most countries in the world, WHO has identified six policies–encapsulated in the acronym MPOWER–that can stamp out the tobacco epidemic. These six policies are: (i) monitor tobacco use and prevention policies; (ii) protect people from tobacco smoke; (iii) offer help to quit tobacco use; (iv) warn people about the dangers of tobacco; (v) enforce bans on tobacco advertising, promotion, and sponsorship; and (vi) raise taxes on tobacco. Each letter of the acronym is important and necessary in the fight against the tobacco epidemic. Tobacco taxation is seen as the most cost-effective policy measure to confront tobacco use and prevent its negative health, social, and economic impact.
Taxes on tobacco cost little to implement and lead to a windfall of benefits. The primary motivations for imposing higher tobacco excise tax are to discourage smoking and raise resources to compensate for societal costs of smoking on nonsmokers (for example, due to higher health care costs and adverse health effects from second-hand smoke)((Savedoff and Alwang 2015).80 Higher taxes on tobacco make tobacco products less affordable, helping smokers
who are addicts to quit and preventing nonusers–especially young people, women, and the poor–from ever starting. Higher tobacco taxes also provide countries with additional revenue that can be used to fund vital health programs and other essential public services–a highly relevant option for Indonesia given the size of the current budget deficit that is approaching 3 percent of GDP (Marquez 2016a).81 Indeed, tobacco taxation is an untapped source of domestic financing that will be important for the successful implementation of the Sustainable Development Goals (SDGs) by 2030 as advocated in the Financing for Development (Addis Ababa Action Agenda) of (United Nations, 2015b).
CONSUMERS RESPONSE AND OPTIMAL LEVEL OF TAXATION
Governments generally levy taxes on tobacco that are either excise (which is a selective consumption tax), custom duties (on imports), and/or as a value-added tax (VAT) or general sales tax (GST). The excise tax levied on tobacco can be structured as a monetary amount by quantity (for example, by package, piece, or weight) which is referred to as “specific”; or calculated as a percentage of the price (“ad valorem”). Of these two types of excise tax, lower-income countries tend to use ad valorem excise taxes while higher-income countries tend to use either specific or a mix of both types of excise (WHO 2010b).
The extent to which consumers’ demand for a good changes in response to a price change due to adoption of higher taxes is known as the price elasticity of demand. For example, if a price rise of 10 percent causes the quantity demanded to fall by 5 percent, the elasticity of demand is -0.5. The more price-responsive consumers are, the greater is the elasticity of demand. Evidence from across the world shows that smokers’ demand for tobacco, while inelastic, is nevertheless strongly affected by its price (World Bank 1999). When the price of a good rises, people on low incomes are, in general, more likely to cut back their consumption of that good than people on high incomes and, conversely, when the price falls, they are more likely to increase their consumption.
80 See also WHO 2011 and Jha et al. 2012.81 See also Marquez 2015b and 2016b.

123
APPENDIXES
Estimates of elasticity vary from study to study, but there is reasonable evidence that in low- and middle-income countries, elasticity of demand is greater than in high-income countries. In the United States, for example, researchers have found that a price rise of 10 percent for a pack of cigarettes decreases demand by about 4 percent (an elasticity of -0.4). Studies in China have concluded that a price rise of 10 percent reduces demand by between 6 and 10 percent (elasticity between -0.6 and -1.0). Studies in Brazil and South Africa have produced results in the same range. For low- and middle-income countries as a whole, then, a reasonable estimate of the average elasticity of demand would be -0.8, based on current data. A study by the Centers for Disease Control and Prevention (CDC)(World Bank 1999) found that demand elasticity among young adults aged between 18 and 24 in the United States was -0.6, higher than for smokers overall. Researchers conclude that when prices are high, not only are existing young smokers more likely to quit, but that fewer potential young smokers will take up the habit.
The landmark World Bank report (1999) suggested a pragmatic approach to define the “optimal tax level” for cigarettes by observing the tax levels adopted by countries with comprehensive and effective tobacco control policies. In such countries, the tax component of the price of a pack of cigarettes is between two-thirds and four-fifths of the total retail cost. These levels are currently being used globally as a yardstick for proportionate increases in prices elsewhere, and imply, for example, that if tax is to account for four-fifths of the retail price, this requires prices to be increased by four times the manufacturer’s (untaxed) price per pack.82 The impact on retail price would, of course, vary between countries, depending on retail factors such as the wholesale price, but broadly, an increase of this order would raise the population-weighted price by between 80 and 100 percent in low- and middle-income countries.
Following this commonly accepted approach, therefore, tax increases, using specific excise taxes or a combination of specific and ad valorem excise taxes, should aim to reduce the affordability of tobacco products, decrease consumption, reduce
health risks, and save lives. In many countries, where incomes and purchasing power are growing rapidly, large price increases are required to offset the impact of growth in real incomes on tobacco consumption habits. Strong tax administration is also critical to minimize tax avoidance and tax evasion, to ensure that tobacco tax increases lead to higher tobacco product prices and tax revenues, as well as reductions in tobacco use and its negative health consequences.
Across the globe, several countries have implemented various types and size of tobacco taxes, and have earmarked the additional tax revenue collected to expand the fiscal space to fund priority investments and programs that benefit the entire population, such as the expansion of Universal Health Coverage (WHO 2015). The Philippines is often referred to as a benchmark for Indonesia due to its geographical proximity and similarities in many aspects. After the adoption of the ‘Sin Tax’ at the end of 2012, tobacco excise tax collection has more than doubled from the baseline 0.3 percent of GDP to 0.8 percent of GDP in 2015. In the first three years of implementation of the Sin Tax Law, US$3.9 billion or about 0.5 percent of GDP, in additional fiscal revenues was collected.
Following the tax revenue increase in the Philippines, 85 percent of the additional revenue has been used for health programs, of which 80 percent is to help finance the extension of fully subsidized health insurance for the poorest 40 percent of the population. As a result, PhilHealth nearly tripled the number of families enrolled in the National Health Insurance Program (NHIP) from 5.2 million families in 2013 to 14.7 million families in 2014. Lessons learned from the Philippines success story include the clear focus on health, building strategic alliances and political support, and the use of strategic and effective communication (Kaiser et al. 2016).
TOBACCO TAX STRUCTURE IN INDONESIA
Indonesia applies multiple tax types (excise, customs duties, and VAT/GST) and its tobacco excise tax is
82 For instance, if a nontax price is equal to $0.50, then the tax rate would be 0.5 x 4 = $2. The retail price would be equal to $2.50 ($2 tax plus $0.50 manufacturing cost).

124
HEALTH FINANCING SYSTEM ASSESSMENTspend more . spend right . spend better
structured as a specific tax. By law, the maximum allowable cigarette excise tariff is 57 percent of the corresponding retail price (harga jual eceran–HJE). Other neighboring countries such as the Philippines and Singapore also use specific excise taxes while Myanmar and Vietnam levy ad valorem taxes, and Malaysia and Thailand apply a mixture of both excise taxes. Unlike most other countries such as Australia, South Africa, and Norway which use a single-tiered system, Indonesia applies a multitiered approach in which cigarettes are classified into several categories (World Bank 2015a). The specific rates per cigarette stick vary by type of product–kretek and white cigarettes by machine and kretek cigarette by hand-roll–and by production levels and the retail price. The majority of tobacco users are smokers, and the vast majority of smokers (88 percent) use kretek.
In order to reduce this complexity and existing opportunities for tax avoidance, the government has been implementing a roadmap of tax structure simplification and gradually increasing lower tariffs in each segment of the cigarette market. The number of excise tax tiers decreased from 19 to 13 between 2009 and 2013 and to 12 tiers by 2015 and the differential between the highest and the lowest excise tax rate
has been reduced. Indonesia’s tobacco market is still characterized, however, by a wide range of cigarette prices, specific excise tariffs between and within market segments, and excise taxes as a percentage of cigarette retail prices (Table D.1). Overall, the present multitiered specific system favors smaller producers and those producing hand-rolled kretek–imposing upon them lower excise tariffs per stick and lower excise taxation in relation to the HJE.
The present simplification road map, if implemented, would lead in the coming years to a relatively higher increase in tariffs per cigarette stick of those lower-priced products and, more importantly, to a simple tax structure that will substantially lower the cost of tax administration.
ASSESSING THE POTENTIAL FISCAL IMPACT OF TOBACCO TAX REFORM IN INDONESIA
As an input for the Ministry of Finance, a World Bank Group (WBG) team assessed the impact (2015) of a two-phase approach for reforming the 2015 tobacco tax structure, in terms of consumption reduction and potential fiscal revenue mobilization, while managing the potential negative impact on employment:
Table D.1 Cigarette Consumption by Tier (2014)
Type Volume (billions of sticks)
Banderole price (HJE) (IDR per stick)
Consumption in 2014
(billions of sticks) (percentage of total)
Machine-rolled kretek (SKM)
>= 2 800 and above 212 61.5
< 2588 and above 17 4.9
511-587 21 6.1
White cigarettes (SPM)
>= 2 820 and above 16 4.7
< 2520 and above 2 0.6
425-519 2 0.6
Hand-rolled kretek (SKT)
>= 2825 and above 13 3.8
606-824 40 11.6
0.3 - 2417 and above 5 1.4
385-416 5 1.4
0.05 - 0.3 286 and above 5 1.4
< 0.05 286 and above 7 2.0
TOTAL 345 100
Source Ministry of Finance; World Bank staff calculations 2015.
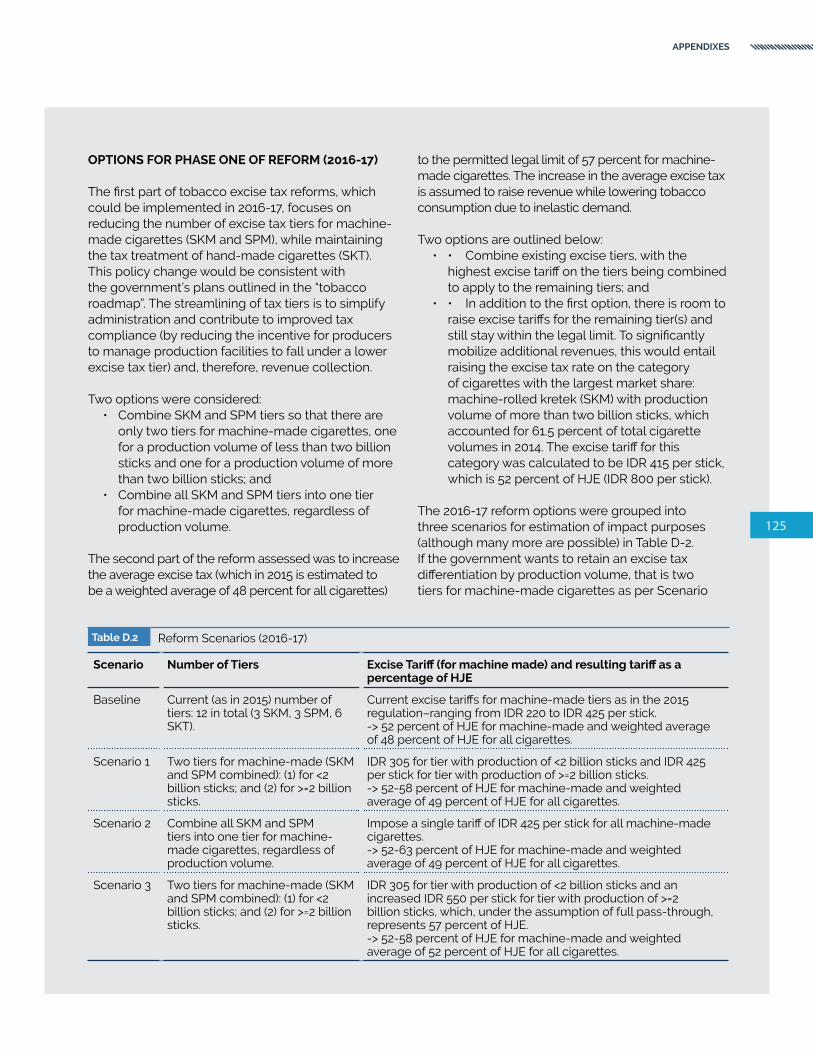
125
APPENDIXES
OPTIONS FOR PHASE ONE OF REFORM (2016-17)
The first part of tobacco excise tax reforms, which could be implemented in 2016-17, focuses on reducing the number of excise tax tiers for machine-made cigarettes (SKM and SPM), while maintaining the tax treatment of hand-made cigarettes (SKT). This policy change would be consistent with the government’s plans outlined in the “tobacco roadmap”. The streamlining of tax tiers is to simplify administration and contribute to improved tax compliance (by reducing the incentive for producers to manage production facilities to fall under a lower excise tax tier) and, therefore, revenue collection.
Two options were considered: • Combine SKM and SPM tiers so that there are
only two tiers for machine-made cigarettes, one for a production volume of less than two billion sticks and one for a production volume of more than two billion sticks; and
• Combine all SKM and SPM tiers into one tier for machine-made cigarettes, regardless of production volume.
The second part of the reform assessed was to increase the average excise tax (which in 2015 is estimated to be a weighted average of 48 percent for all cigarettes)
to the permitted legal limit of 57 percent for machine-made cigarettes. The increase in the average excise tax is assumed to raise revenue while lowering tobacco consumption due to inelastic demand.
Two options are outlined below:• • Combine existing excise tiers, with the
highest excise tariff on the tiers being combined to apply to the remaining tiers; and
• • In addition to the first option, there is room to raise excise tariffs for the remaining tier(s) and still stay within the legal limit. To significantly mobilize additional revenues, this would entail raising the excise tax rate on the category of cigarettes with the largest market share: machine-rolled kretek (SKM) with production volume of more than two billion sticks, which accounted for 61.5 percent of total cigarette volumes in 2014. The excise tariff for this category was calculated to be IDR 415 per stick, which is 52 percent of HJE (IDR 800 per stick).
The 2016-17 reform options were grouped into three scenarios for estimation of impact purposes (although many more are possible) in Table D-2. If the government wants to retain an excise tax differentiation by production volume, that is two tiers for machine-made cigarettes as per Scenario
Table D.2 Reform Scenarios (2016-17)
Scenario Number of Tiers Excise Tariff (for machine made) and resulting tariff as a percentage of HJE
Baseline Current (as in 2015) number of tiers: 12 in total (3 SKM, 3 SPM, 6 SKT).
Current excise tariffs for machine-made tiers as in the 2015 regulation–ranging from IDR 220 to IDR 425 per stick.-> 52 percent of HJE for machine-made and weighted average of 48 percent of HJE for all cigarettes.
Scenario 1 Two tiers for machine-made (SKM and SPM combined): (1) for <2 billion sticks; and (2) for >=2 billion sticks.
IDR 305 for tier with production of <2 billion sticks and IDR 425 per stick for tier with production of >=2 billion sticks.-> 52-58 percent of HJE for machine-made and weighted average of 49 percent of HJE for all cigarettes.
Scenario 2 Combine all SKM and SPM tiers into one tier for machine-made cigarettes, regardless of production volume.
Impose a single tariff of IDR 425 per stick for all machine-made cigarettes.-> 52-63 percent of HJE for machine-made and weighted average of 49 percent of HJE for all cigarettes.
Scenario 3 Two tiers for machine-made (SKM and SPM combined): (1) for <2 billion sticks; and (2) for >=2 billion sticks.
IDR 305 for tier with production of <2 billion sticks and an increased IDR 550 per stick for tier with production of >=2 billion sticks, which, under the assumption of full pass-through, represents 57 percent of HJE.-> 52-58 percent of HJE for machine-made and weighted average of 52 percent of HJE for all cigarettes.
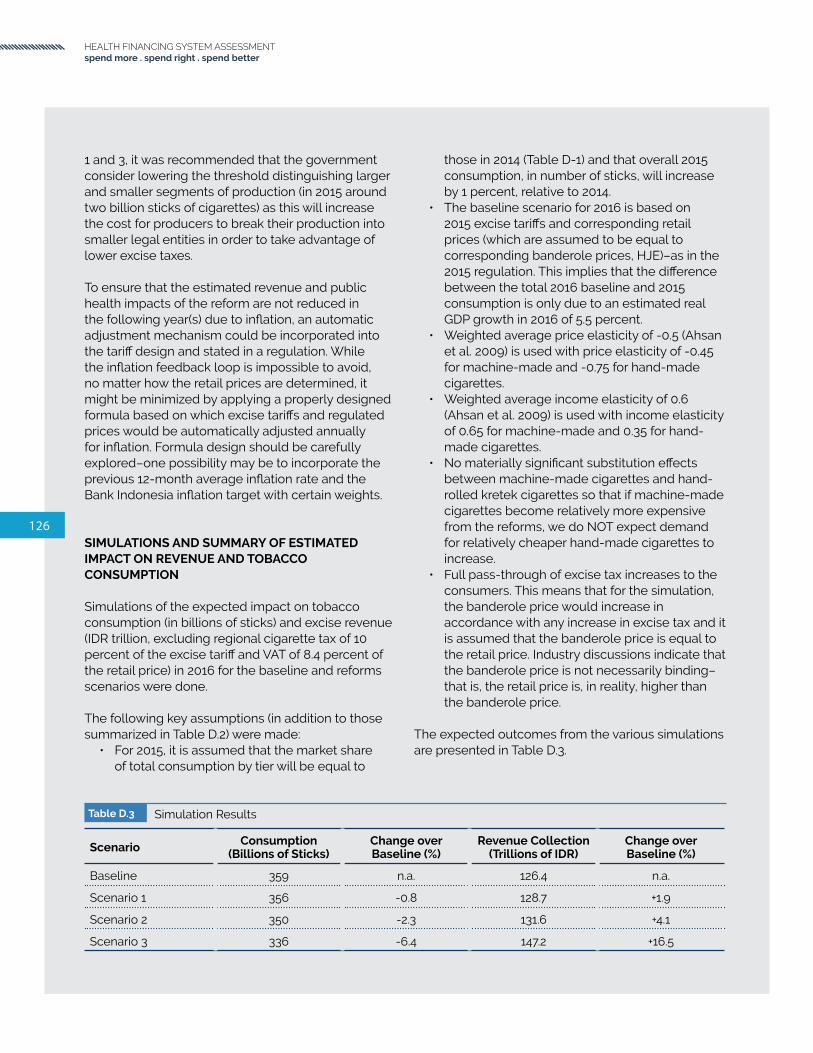
126
HEALTH FINANCING SYSTEM ASSESSMENTspend more . spend right . spend better
1 and 3, it was recommended that the government consider lowering the threshold distinguishing larger and smaller segments of production (in 2015 around two billion sticks of cigarettes) as this will increase the cost for producers to break their production into smaller legal entities in order to take advantage of lower excise taxes.
To ensure that the estimated revenue and public health impacts of the reform are not reduced in the following year(s) due to inflation, an automatic adjustment mechanism could be incorporated into the tariff design and stated in a regulation. While the inflation feedback loop is impossible to avoid, no matter how the retail prices are determined, it might be minimized by applying a properly designed formula based on which excise tariffs and regulated prices would be automatically adjusted annually for inflation. Formula design should be carefully explored–one possibility may be to incorporate the previous 12-month average inflation rate and the Bank Indonesia inflation target with certain weights.
SIMULATIONS AND SUMMARY OF ESTIMATED IMPACT ON REVENUE AND TOBACCO CONSUMPTION
Simulations of the expected impact on tobacco consumption (in billions of sticks) and excise revenue (IDR trillion, excluding regional cigarette tax of 10 percent of the excise tariff and VAT of 8.4 percent of the retail price) in 2016 for the baseline and reforms scenarios were done.
The following key assumptions (in addition to those summarized in Table D.2) were made:
• For 2015, it is assumed that the market share of total consumption by tier will be equal to
those in 2014 (Table D-1) and that overall 2015 consumption, in number of sticks, will increase by 1 percent, relative to 2014.
• The baseline scenario for 2016 is based on 2015 excise tariffs and corresponding retail prices (which are assumed to be equal to corresponding banderole prices, HJE)–as in the 2015 regulation. This implies that the difference between the total 2016 baseline and 2015 consumption is only due to an estimated real GDP growth in 2016 of 5.5 percent.
• Weighted average price elasticity of -0.5 (Ahsan et al. 2009) is used with price elasticity of -0.45 for machine-made and -0.75 for hand-made cigarettes.
• Weighted average income elasticity of 0.6 (Ahsan et al. 2009) is used with income elasticity of 0.65 for machine-made and 0.35 for hand-made cigarettes.
• No materially significant substitution effects between machine-made cigarettes and hand-rolled kretek cigarettes so that if machine-made cigarettes become relatively more expensive from the reforms, we do NOT expect demand for relatively cheaper hand-made cigarettes to increase.
• Full pass-through of excise tax increases to the consumers. This means that for the simulation, the banderole price would increase in accordance with any increase in excise tax and it is assumed that the banderole price is equal to the retail price. Industry discussions indicate that the banderole price is not necessarily binding–that is, the retail price is, in reality, higher than the banderole price.
The expected outcomes from the various simulations are presented in Table D.3.
Table D.3 Simulation Results
Scenario Consumption (Billions of Sticks)
Change over Baseline (%)
Revenue Collection (Trillions of IDR)
Change over Baseline (%)
Baseline 359 n.a. 126.4 n.a.
Scenario 1 356 -0.8 128.7 +1.9
Scenario 2 350 -2.3 131.6 +4.1
Scenario 3 336 -6.4 147.2 +16.5

127
APPENDIXES
OPTIONS FOR PHASE 2 OF REFORM (2017 ONWARDS)
The second phase of the reforms, which could be implemented starting 2017, would continue to implement the tobacco roadmap by simplifying the tax treatment of hand-made kretek cigarettes. This could potentially be accompanied by compensatory measures for tobacco factory workers and tobacco and clove farmers.
As recently proposed by WHO (2016), one option to advance with the tobacco taxation reform agenda in Indonesia would be to move from 12 to four tiers in three years, therefore accelerating the simplification process while at the same time increasing rates and generating more revenues with no major shocks to the industry as a whole.
To this end, the following simplification steps are suggested:
• 2017: merging SKM and SPM creating the group SKM/SPM with a reduction in number of tiers from 12 to nine. These already have similar rates per tier (keeping tiers I, IIA and IIB).
• 2018: removing the price tiers for all groups and merging IIIA and IIIB, keeping tiers by type of cigarette and production volume. The number of tiers falls from nine to five.
• 2019: merging SKT I with SKM/SPM II – there is a fall in the number of tiers from five to four..
Under the WHO proposal, an additional two years would be needed to finalize the simplification to two tiers:
• 2020: merging SKT II and III, keeping a substantially lower rate for this group compared to SKM/SPM group–the number of tiers changes from four to three.
• 2021: merging production tiers in SKM/SPM I with SKM/SPM II and SKT I, the number of tiers changes from three to two.
The consolidation scenarios proposed for Indonesia take into account recent findings documented in an IMF assessment done in Pakistan (Cevik 2016) that show that the structure of cigarette taxes is critical in determining the relative prices of different tobacco products and brands across the price spectrum
and thereby influencing the behavior of consumers within a country. Indeed, while tax policy can help reduce negative externalities associated with tobacco consumption, the taxation model needs to avoid providing incentives to switch down to cheaper cigarette brands in response to tax-related and other price increases. Furthermore, consumers’ price sensitivity and brand-switching behaviour, manufacturers’ pricing strategy including brand repositioning, differential tax shifting, and cross-brand price subsidy, can have potential consequences on tax revenue collection at an aggregate level. To this end, as advised by the IMF, it is of critical importance that Indonesia should adopt a simpler structure of taxation to have a greater influence on the relative prices of different tobacco products across the price bands.
IMPACT ON EMPLOYMENT IN THE TOBACCO INDUSTRY
In Indonesia, it is reported that less than 1 percent of arable land is used for tobacco cultivation, and that most tobacco-growing farmers do not depend solely on tobacco cultivation to make a living (American Cancer Society and World Lung Foundation 2012). Farmers typically cultivate a combination of main crops, including soybeans, corn, tobacco, cassava, peanuts, rice, fruits, and vegetables, to minimize risks. Given this situation, tobacco farmers may not be significantly impacted by the increase in tobacco excise tariff. Moreover, excess production of tobacco leaves may potentially be exported. On the other hand, it is not clear if a similar situation applies for clove-growing farmers. For hand-rolled kretek factory workers, it is not yet clear what the alternative livelihoods for these workers are, and if they will need support, such as training, to transition to other livelihoods.
The World Bank is conducting, over the period from 2016 to mid-2017, tobacco industry employment studies to inform the policy recommendations on reforms to the hand-rolled kretek cigarette segment and options for compensatory measures to workers. The importance of this analytical work followed the President of Indonesia’s statement in June 2016 on the country’s intention to ratify the FCTC. The tobacco industry employment study is expected to be ready by mid-2017.

128
HEALTH FINANCING SYSTEM ASSESSMENTspend more . spend right . spend better
TOBACCO TAX INCREASES AND THE RISK OF ILLICIT TRADE
The tobacco industry and other vested interests argue that tax increases on tobacco products fuel illicit trade. Accumulated international experience, however, exposes the flaws in this argument. While high taxes may create incentives for illicit trade, different country experiences show that illicit trade can be controlled by legal means and by increased law enforcement, controls over the distribution chain, improved technologies, and better use of data help to reduce illicit trade and complement tobacco tax reforms (Marquez 2015a).83
THE WAY FORWARD
Tobacco taxation reform, including the drastic reduction in tax tiers for different categories of cigarettes, is a major potential policy tool for the Government of Indonesia to use to reduce the severe public health burden of smoking-related disease and premature mortality in Indonesia. Tobacco taxation can also be a significant contributor to state revenue collection for expanding the fiscal space to support UHC and other essential investments that benefit all. Given fiscal pressures and of unmet health needs of the population in Indonesia, now is a particularly relevant time to focus on using tobacco taxation increases as a source to raise public revenue over the near and medium term.
83 See also WHO 2013 and van Walbeek et al. 2013.

129
APPENDIXES

130
HEALTH FINANCING SYSTEM ASSESSMENTspend more . spend right . spend better
Abhimanyu, N., S.P Zodpey, S. Ughade, and S.I. Bangdiwala. 2011. “Neonatal morbidity and mortality in tribal and rural communities in central India.” Indian Journal of Community Medicine 36(2): 150-158.
Ahsan, A., S. Barber, S.M. Adioetomo, and D. Setyonaluri. 2009. “Economics of Tobacco Taxation in Indonesia.” Demographic Institute, Faculty of Economics, University of Indonesia, Indonesia.
American Cancer Society and World Lung Foundation. 2012. “Tobacco Atlas.” Fourth Edition.
Asia Pacific Observatory and WHO. 2015. “Health System in Transition, Country Report: Indonesia.” Final draft, unpublished. Country Team, Asia Pacific Observatory and WHO.
Badan POM. 2016. “Badan POM Terus Perangi Peredaran Obat Ilegal di Indonesia”. http://www.pom.go.id/new/index.php/view/pers/316/BADAN-POM-TERUS-PERANGI-PEREDARAN-OBAT-ILEGAL-DI-INDONESIA.html
Barber, S., S.M. Adioetomo, A. Ahsan, and D. Setyonaluri. 2008. “Tobacco Economics in Indonesia.” Paris: International Union Against Tuberculosis and Lung Disease.
Bitran, R. 2013. “Explicit Health Guarantees for Chileans: The AUGE Benefits Package.” UNICO Studies Series 21. Washington DC: World Bank.
Bitran, R. 2014. “Universal Health Coverage and the Challenge of Informal Employment: Lessons from Developing Countries.” HNP Discussion Paper. Washington DC: World Bank.
References
BMI Research. 2015. “Indonesia Pharmaceuticals and Healthcare Report (Q3).” London: BMI Research.
Centers for Disease Control and Prevention (CDC). 2016. “Secondhand Smoke (SHS) Facts.” http://www.cdc.gov/tobacco/data_statistics/fact_sheets/secondhand_smoke/general_facts/
Cevik, S. 2016. “Smoke Screen: Estimating the Tax Pass-Through to Cigarette Prices in Pakistan.” IMF Working Paper WP/16/179. Washington DC: IMF.
Chisholm, D., and D.B. Evans. “Improving health system efficiency as a means of moving towards universal coverage.” World Health Report (2010), Background Paper No. 28. Geneva: World Health Organization.
Cotlear, D., S. Nagpal, O. Smith, A. Tandon, and R. Cortez. 2015. “Going Universal: How 24 Developing Countries Are Implementing Universal Health Coverage Reforms from the Bottom Up.” Washington DC: World Bank.
Fenochietto, R., and C. Pessino. 2013. “Understanding Countries’ Tax Effort.” IMF Working Paper WP/13/244. Washington DC: International Monetary Fund.
Gibbons, L., J.M. Belizán, J.A. Lauer, A.P. Betrán, M. Merialdi and F. Althabe. 2010. “The Global Numbers and Costs of Additionally Needed and Unnecessary Caesarean Sections Performed per Year: Overuse as a Barrier to Universal Coverage.” Background Paper. Geneva: WHO.
Guerard, Y., M. Wiener, C. Rokx, G. Schieber, P. Harimurti, E. Pambudi, and A. Tandon. 2011. “Actuarial Costing of Universal Health Insurance Coverage in Indonesia.” HNP Discussion Paper. Washington DC: World Bank.

131
Hadi, U., van den Broek, P., Kolopaking, E. P., Zairina, N., Gardjito, W., & Gyssens, I. C. 2010. Cross-sectional study of availability and pharmaceutical quality of antibiotics requested with or without prescription (Over The Counter) in Surabaya, Indonesia. BMC Infectious Diseases, 10, 203
Hadi U et al. 2008, Audit of antibiotic prescribing in two governmental teaching hospitals in Indonesia. Clinical Microbiology and Infection, Volume 14 , Issue 7 , 698 - 707.
Hadisoemarto, P.F., M.R. Reich, and M.C. Castro. 2016. “Introduction of pentavalent vaccine in Indonesia: a policy analysis.” Health Policy and Planning.
Harimurti, P., E. Pambudi, A. Pigazzini, and A. Tandon. 2013. “The Nuts & Bolts of Jamkesmas: Indonesia’s Government-Financed Health Coverage Program.” UNICO Studies Series No. 8. Washington DC: World Bank.
Hidayat, B. 2016. “INA-CBG’s claim patterns: Is there any indication of fraudulent practices?” Presentation, August 25, 2016. Jakarta.
Hidayat, B., Mundiharno, J. Nemec, V. Rabovskaja, C.S. Rozanna, and J. Spatz. 2015a. “Financial Sustainability of the National Health Insurance in Indonesia: A First Year Review.” National Social Security Council, GIZ, Policy Brief.
———. 2015b. “Out-of-Pocket Payments in the National Health Insurance of Indonesia: A First Year Review.” Policy Brief. Jakarta.
Hollingsworth, B. and S.J. Peacock. 2008. “Efficiency Measurement in Health and Health Care.” Routledge International Studies in Health Economics. New York: Routledge.
Hsiao, W.C. 2007. “Why Is A Systematic View Of Health Financing Necessary?” Health Affairs 26(4): 950-961.
Institute for Health Metrics and Evaluation. “Indonesia.” http://www.healthdata.org/indonesia.
Institute for Health Metrics and Evaluation (IHME). 2013. “Global Burden of Disease. Country Profile for Indonesia.” Available at http://www.healthdata.org/indonesia
Jakarta Globe. 2016. “Counterfeit Drugs Worth Rp 56 Billion Seized in Special Operation”. http://jakartaglobe.beritasatu.com/news/counterfeit-drugs-worth-rp-65b-seized-special-operation
Jha, P., R. Joseph, D. Li, C. Gauvreau C, I. Anderson, P. Moser, S. Bonu, I. Bhushan, and F.J. Chaloupka. 2012. “Tobacco Taxes: A Win-Win Measure for Fiscal Space and Health.” Mandaluyong City, Philippines: Asian Development Bank. https://www.adb.org/sites/default/files/publication/30046/tobacco-taxes-health-matters.pdf
Jha, P., and R. Peto. 2014. “Global Effects of Smoking, of Quitting, and of Taxing Tobacco.” New England Journal of Medicine 370: 60-68. http://www.nejm.org/doi/full/10.1056/NEJMra1308383.
USAID, JHPIEGO, and Indonesia OBGYN Association. 2015, “Retrospective Review of Factors Associated with 112 Maternal Deaths in 12 Hospitals”, 2015, presented at OBGYN Congress, Bandung.
Kaiser, K., C. Bredenkamp, and R. Iglesias. 2016. “Sin Tax Reform in the Philippines: Transforming Public Finance, Health, and Governance for More Inclusive Development. Directions in Development--Countries and Regions. Washington DC: World Bank. https://openknowledge.worldbank.org/handle/10986/24617
Lustig, N. 2015. “Inequality and Fiscal Redistribution in Middle Income Countries: Brazil, Chile, Colombia, Indonesia, Mexico, Peru, and South Africa.” Commitment to Equity Working Paper No. 31. New Orleans: Tulane University.
Maharani, A. and G. Tampubolon. 2014. “Has Decentralization Affected Child Immunization Status in Indonesia?” Global Health Action 7: 24913.
Marquez, P.V. 2015a. “World No Tobacco Day 2015: On illicit trade and taxes.” http://blogs.worldbank.org/health/world-no-tobacco-day-2015-illicit-trade-and-taxes
———. 2015b. “Making the public health case for tobacco taxation.” http://blogs.worldbank.org/health/making-public-health-case-tobacco-taxation.

132
HEALTH FINANCING SYSTEM ASSESSMENTspend more . spend right . spend better
———. 2016a. “Economic slowdown and financial shocks: Can tobacco tax increases help?” http://blogs.worldbank.org/voices/economic-slowdown-and-financial-shocks-can-tobacco-tax-increases-help
———. 2016b. “Plain packaging & tobacco taxes: an antidote for manipulation and deception.” http://blogs.worldbank.org/health/plain-packaging-tobacco-taxes-antidote-manipulation-and-deception
Millennium Challenge Account - Indonesia. 2015. “Stunting and the Future of Indonesia.” Jakarta: MCA Indonesia.
Ministry of Health (Government of Indonesia). 2011. “Indonesia Human Resources for Health Development Plan Year 2011-2025.” Jakarta: Ministry of Health.
———. 2013. “Annual Gavi Program Progress Report 2013.”
Ministry of Health (Center for Health Economic Policy Studies), AIPHSS. 2015. “Indonesia National Health Account 2014, Final Report.” Jakarta: Australia Indonesia Partnership Health System Strengthening.
Ministry of Health and World Bank. 2014a. “Supply-Side Readiness for Universal Health Coverage: Assessing the Depth of Coverage for Non-Communicable Diseases in Indonesia.” Jakarta: World Bank, Ministry of Health.
———. 2014b. “Universal Maternal Health Coverage? Assessing the Readiness of Public Health Facilities to Provide Maternal Health Care in Indonesia.” Jakarta: World Bank.
Ministry of Health and World Health Organization. 2012. “Global Adult Tobacco Survey: Indonesia Report 2011.” Jakarta: National Institute of Health Research and Development, Ministry of Health, Republic of Indonesia and New Delhi: World Health Organization, Regional Office for South East Asia. http://www.who.int/tobacco/surveillance/survey/gats/indonesia_report.pdf
Ministry of Health, 2015. “Profil Kesehatan Indonesia 2014.”
Ministry of Health and Social Welfare (Republic of Liberia). 2008. “National Health and Social Welfare Policy.”
Missoni, E. and G. Solimano. 2010. “Towards Universal Health Coverage: the Chilean Experience.” World Health Report Background Paper 4. Geneva: WHO.
Mulholland, E.K., L. Smith, I. Carneiro, H. Becher, and D. Lehmann. 2008. “Equity and child-survival strategies.” Bulletin of the World Health Organization 86(5): 321-416.
Nader, A.A., C. de Quadros, C. Politi, and M. McQuestion. 2015. “An analysis of government immunization program expenditures in lower and lower middle income countries 2006–12.” Health Policy and Planning. 30(3): 281-288.
National Institute for Health Research and Development (MoH). 2013. Riset Kesehatan Dasar - Riskesdas.
Organisation for Economic Co-operation and Development (OECD). 2011. “Burden of out-of-pocket health expenditure.” Health at a Glance 2011. OECD Indicators. Paris: OECD.
Pisani, E., M. Kok, and K. Nugroho. 2016. “Indonesia’s road to universal health coverage: a political journey.” Health Policy and Planning (forthcoming).
Pradiptyo, R. 2015. “Error, Fraud and Corruption Prevention to Strengthen Financial Governance and Management in National Healthcare Security.” Presentation at Otoritas Jasa Keuangan Conference in Bali. Department of Economics, Faculty of Economics and Business, Universitas Gadjah Mada.
Rokx, C., G. Schieber, P. Harimurti, A. Tandon, and A. Somanathan. 2009. “Health Financing in Indonesia: A Reform Road Map.” Washington DC: World Bank.
Rokx, C., J. Giles, E. Satriawan, P. Marzoeki, P. Harimurti, and E. Yavuz. 2010. “New Insights into the Provision of Health Services in Indonesia: A Health Workforce Study.” Washington DC: World Bank.

133
Puspitasari, H. P., Faturrohmah, A. and Hermansyah, A. 2011, Do Indonesian community pharmacy workers respond to antibiotics requests appropriately?. Tropical Medicine & International Health, 16: 840–846.
Savedoff, W.D. 2003. “How Much Should Countries Spend on Health?” Discussion Paper No. 2, Geneva: World Health Organization.
Savedoff, W.D., R. Bitrán, D. de Ferranti, V.Y Fan, A. Holly, R. Moreno-Serra, P. Saksena, A.L. Smith, P.C. Smith and K. Xu. 2012. “Transitions in Health Financing and Policies: Final Report of the Transitions in Health Financing Project.” Washington DC: Results for Development Institute.
Savedoff, W.D., and A. Alwang. 2015. “The Single Best Health Policy in the World: Tobacco Taxes.” CGD Policy Paper 062. Washington DC: Center for Global Development. http://www.cgdev.org/publication/single-best-health-policy-world-tobacco-taxes;
Saxenian, H., R. Hecht, M. Kaddar, S. Schmitt, T. Ryckman, and S. Cornejo. 2014. “Overcoming challenges to sustainable immunization financing: early experiences from Gavi graduating countries.” Health Policy and Planning 30(2): 197-205.
Schoeps, A., S. Gabrysch, L. Niamba, A. Sié, and H. Becher. 2011. “The Effect of Distance to Health-Care Facilities on Childhood Mortality in Rural Burkina Faso.” American Journal of Epidemiology 173(5): 492-98.
Siallagan, T. 2015. Challenges in Implementing Indonesia Case-based Groups (INA-CBGs). BPJS Presentation at Otoritas Jasa Keuangan (Financial Service Authority) Conference, Bali, 7-8 September 7-8, 2015.
Soenarto, Y., A.T. Aman, A. Bakri, H. Waluya, A. Firmansyah, M. Kadim, I. Martiza, D. Prasetyo, N.S. Mulyani, T. Widowati, Soetjiningsih, I.P Karyana, W. Sukardi, J. Bresee, and M.A. Widdowson. 2009. “Burden of severe rotavirus diarrhea in Indonesia.” Journal of Infectious Diseases Supplement 1, S188-S194.
Suparmi. 2014. “Antenatal and neonatal visits increase complete immunization status among children aged 12-23 months in rural area of Indonesia.” Health Science Journal of Indonesia 5(2): 73-77.
Suwantika, A.A. and M.J. Postma. 2014. “Expanding access to non-traditional vaccines: a perspective from Indonesia.” Expert Review of Vaccines 13(12): 1419-1421.
Ujoh, F., and F. Kwaghsende. “Analysis of the Spatial Distribution of Health Facilities in Benue State, Nigeria.” Public Health Research 4(5): 210-218.
UNICEF/WHO/World Bank/UN. 2014. “Levels & Trends in Child Mortality: Estimates Developed by the UN Inter-Agency Group for Child Mortality Estimation.” New York: UNICEF.
United Nations. 2003. “Indicators for Monitoring the Millennium Development Goals. Definitions, Rationale, Concepts and Sources.” New York: United Nations.
United Nations (Department of Economic and Social Affairs, Population Division). 2015a. “World Population Prospects: The 2015 Revision, Volume I: Comprehensive Tables.” New York: United Nations.
United Nations. 2015b. “Addis Ababa Action Agenda of the Third International Conference on Financing for Development.” http://www.un.org/esa/ffd/wp-content/uploads/2015/08/AAAA_Outcome.pdf
van Walbeek, C., E. Blecher, A. Gilmore, and H. Ross. 2013. “Price and Tax Measures and Illicit Trade in the Framework Convention on Tobacco Control: What We Know and What Research Is Required.” Oxford Journals: Nicotine & Tobacco Research 15(4):767–76.
Wagstaff, A. 2010. “Social health insurance reexamined.” Health Economics 19(5): 503-517.
WHO and World Bank. 2015. “Tracking Universal Health Coverage: First Global Monitoring Report.” Geneva: World Health Organization.

134
HEALTH FINANCING SYSTEM ASSESSMENTspend more . spend right . spend better
WHO (World Health Organization). 2000. “The World Health Report 2000: Health Systems: Improving Performance.” Geneva: World Health Organization.
———. 2003. “WHO Framework Convention on Tobacco Control.” Geneva: World Health Organization. http://apps.who.int/iris/bitstream/10665/42811/1/9241591013.pdf
———. 2010a. “Monitoring the Building Blocks of Health Systems: A Handbook of Indicators and Their Measurement Strategies.” Geneva: World Health Organization.
———. 2010b. “WHO Technical Manual on Tobacco Tax Administration.” Geneva: World Health Organization. http://www.who.int/tobacco/publications/tax_administration/en/index.html
———. 2010c. World Health Report: Health Systems Financing–The Path to Universal Coverage. Geneva: World Health Organization
———. 2011. “Effectiveness of Tax and Price Policies for Tobacco ControI.” IARC Handbooks of Cancer Prevention: Tobacco Control. Volume 14. Lyon, France: International Agency for Research on Cancer. http://www.iarc.fr/en/publications/pdfs-online/prev/handbook14/handbook14.pdf
———. 2013. “Protocol to Eliminate Illicit Trade in Tobacco Products.” Geneva: World Health Organization. http://apps.who.int/iris/bitstream/10665/80873/1/9789241505246_eng.pdf
———. 2013a. “The World Health Report 2013: Research for Universal Health Coverage.” Geneva: WHO.
———. 2013b. “Service Availability and Readiness Assessment (SARA). An annual monitoring system for service delivery. Reference Manual.” Geneva: World Health Organization.
———. 2014. “Q&As: Health Systems.” http://www.who.int/topics/health_systems/qa/en/.
———. 2015. “WHO report on the global tobacco epidemic, 2015: raising taxes on tobacco.” http://apps.who.int/iris/bitstream/10665/178574/1/9789240694606_eng.pdf?ua=1
———. 2016. “Tobacco Excise Taxation in Indonesia.” Technical brief note shared by The World Health Organization based on bilateral discussions held with the Ministry of Finance, Centre for Fiscal Policy And Department of Customs and Excise, March 11, 2016.
Widayati, A., Suryawati, S., de Crespigny, C., & Hiller, J. E. (2011). Self medication with antibiotics in Yogyakarta City Indonesia: a cross sectional population-based survey. BMC Research Notes, 4, 491.
World Bank. 1999. “Curbing the Epidemic: Governments and the Economics of Tobacco Control.” Washington DC: The World Bank.
———. 2012a. “Indonesia Public Expenditure Review: Optimizing Sub-National Performance for Better Services and Faster Growth.” Jakarta: World Bank.
———. 2012b. “Indonesia: Repeat Public Expenditure and Financial Accountability (PEFA) Report & Performance Indicators.” Jakarta: World Bank.
———. 2012c. “Targeting Poor and Vulnerable Households in Indonesia.” Jakarta: World Bank.
———. 2012d. “Indonesia Economic Quarterly – December 2012: Policies in Focus.” Jakarta: World Bank.
———. 2013. “Spending more or spending better: Improving education financing in Indonesia.” Jakarta: World Bank.
———. 2014a. “Indonesia Economic Quarterly – December 2014: Delivering Change.” Jakarta: World Bank.
———. 2014b. “The Production, Distribution, and Performance of Physicians, Nurses, and Midwives in Indonesia: An Update.” Jakarta: World Bank.

135
———. 2015a. “Indonesia tobacco excise tax reform: Evaluating potential revenue and public health impact of a reform proposal to streamline the excise tax structure and increase the average excise tax rate for machine-made cigarettes: Policy Note.” Jakarta: World Bank.
———. 2015b. “Country Partnership Framework for the Republic of Indonesia for the period FY16 - FY20.” Washington DC: World Bank.
———. 2015c. “Indonesia Systematic Country Diagnostic: Connecting the Bottom 40 percent to the Prosperity Generation.” Washington DC: World Bank Group.
———. 2015d. “In Times of Volatility.” Indonesia Economic Quarterly October 2015. Jakarta: World Bank.
———. 2015e. “Reforming amid uncertainty.” Indonesia Economic Quarterly December 2015. Jakarta: World Bank.
———. 2016a. “Financing: Where does funding for the Health System come from? How are the funds pooled? How are they allocated and spent?” http://go.worldbank.org/I9NCO1V9N0.
———. 2016b. “Indonesia’s Rising Divide.” Jakarta: World Bank.
Xu, X., E.E. Bishop, S.M. Kennedy, S.A. Simpson, and T.F. Pechacek. 2015. “Annual Healthcare Spending Attributable to Cigarette Smoking: An Update.” American Journal of Preventive Medicine, 48:3: 326–333.


SPENDMORE,RIGHT &BETTER
INDONESIAHEALTH FINANCING SYSTEM ASSESSMENT