world bank document · pdf filedocument of the world bank ... 19. participatory approach .13...
TRANSCRIPT
Document ofTHE WORLD BANK
Report No. 17019-ZA
PROJECT APPRAISAL DOCUMENT
1TE REPUBLIC OF ZAMBIA
POWER REHABILITATION PROJECT
January 14, 1998
Energy TeamAfrica Region
Pub
lic D
iscl
osur
e A
utho
rized
Pub
lic D
iscl
osur
e A
utho
rized
Pub
lic D
iscl
osur
e A
utho
rized
Pub
lic D
iscl
osur
e A
utho
rized
Pub
lic D
iscl
osur
e A
utho
rized
Pub
lic D
iscl
osur
e A
utho
rized
Pub
lic D
iscl
osur
e A
utho
rized
Pub
lic D
iscl
osur
e A
utho
rized
CURRENCY EQUIVALENTSCurrency Unit = Kwacha
US$1.00 = Kwacha 1280.00 - 1 Kwacha = US$0.00078SDRI = US$1.36062 - as of August 31, 1997
WEIGHTS AND MEASURES
I Gigawatt hour (GWh) 1,000,000 Kilowatt hoursI Kilovolt (kV) = 1000 VoltsI Kilowatt (kW) 1000 Watts1 Kilowatt hour (kWh) 1000 Watt hourskVA, mVA = Kilovolt Ampere, Megavolt AmpereI Megawatt (MW) = 1000 Kilowatts
ACRONYMS AND ABBREVIATIONS
AfDB African Development BankBSA Bulk Supply AgreementBTF Belgian Trust FundCAS Country Assistance StrategyCFD Caisse Fran,aise de DeveloppementCIDA Canadian Intemational Development AgencyDANIDA Danish International Development AgencyDBSA Development Bank of Southern AfricaDCA Development Credit AgreementEA Environmental AssessmentEIB European Investment BankENPV Economic Net Present ValueERB Energy Regulation BoardERR Economic Rate of ReturnESU Environmental and Social Affairs Unit (ZESCO)FINNIDA Finnish Intemational Development AgencyFNPV Financial Net Present ValueFRR Financial Rate of ReturnGRZ Government of the Republic of ZambiaIBRD International Bank for Reconstruction and DevelopmentICB International Competitive BiddingIDA International Development AssociationIEPS Initial Executive Project SummaryINESOR Institute of Economic and Social ResearchIRR Intemal Rate of ReturnMD Managing DirectorMEWD Ministry of Energy and Water DevelopmentNCB National Competitive BiddingNORAD Norwegian Agency for DevelopmentNPV Net Present ValuePC Performance ContractPCD Project Concept DocumentPD Project DirectorPHRD Policy and Human Resource Development GrantPIRC Privatization and Industrial Reform CreditPIRCTA PIRC Technical AssistancePIU Project Implementation UnitPMU Project Management UnitPRP Power Rehabilitation ProjectREF Rural Electrification FundSIDA Swedish International Development AgencySLA Subsidiary Loan AgreementSOE Statement of ExpenditureZCCM Zambia Consolidated Copper MinesZCCM/PD ZCCM - Power DivisionZESCO Zambia Electricity Supply CorporationZIMCO Zambia Industry and Mining CorporationZRA Zambezi River Authority
Vice President Callisto MadavoDirector Phyllis PomerantzSector Manager Mark TomlinsonStaff Member Donal O'Leary/Bocar Madani Thiam
ZAMBIAPOWER REHABILITATION
PROJECT APPRAISAL DOCUMENT
CONTENTS
Page No.
Project Fmancing Data ................................... 1
BLOCK 1:
Project Description1. Project Development Objetives .22. Project Components ................. 23. Benefits and Target Populaion .34. Institutional and Inplementation Arrangements ................................... 3
BLOCK 2:
Project Rationale5. CAS Objectives Supported by the Project .46. Main Sector Issues and Govemment Strateg .47. Sector issues to be Addressed by the Project and Strategic Choices .48. Project Altematives Considered and Reasons for Rejection .S9. Major Related Projects Finnced by the Bank and/or Other Development Agencies 510. Lessons Learned and Reflected in the Project Design .511. Indicaions of Borrow Commitment and Ownership .512. Value Added of Bank Support .6
BLOCK 3:
Summary Project Assessments13. Economic Assessent .614. Financial Assessment .815. Technical Assessment .1116. InstitutionalAssessment ................... 1117. Social Assessmet .1218. Environmental Assessment .1219. Participatory Approach .1320. Sustainability .1321. Critical Risks .1322. Possible Controversial Aspects .14
iv

BLOCK 4:
Main Loan Conditions23. Effectiveness Conditions ..................... 1424. Other ..................... 15
BLOCK 5:
Compliance with Bank Policies ................... 15
Annexes
Annex 1: Project Design SummaryAnnex 2: Detailed Project DescriptionAnnex 3: Estimated Project CostAnnex 4: Economic AnalysisAnnex 5: Financial AnalysisAnnex 6: Procurement and Disbursement ArrangementsAnnex 7: Project Processing, Budget and ScheduleAnnex 8: Documents in the Project FileAnnex 9: Statement of Loans and CreditsAnnex 10: Zambia at a GlanceAnnex 11: Letter of Sector PolicyAnnex 12: Environmental and Social ConsiderationsAnnex 13: Dam Safety Aspects
Map:
Zambia - IBRD No. 29233
v
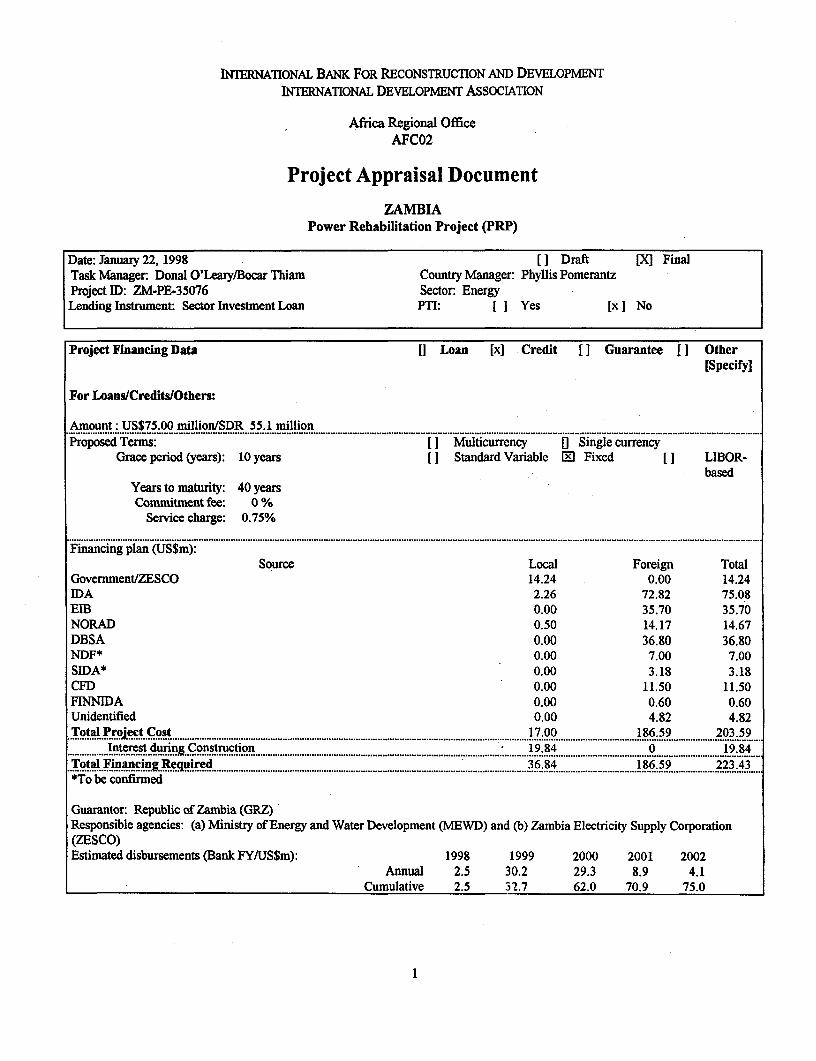
INTERNATIONAL BANK FOR RECONSTRUCTION AND DEVELOPMENTINTERNAIONAL DEVELOPMENT ASSOCIATION
Africa Regional OfficeAFC02
Project Appraisal Document
ZAMBIAPower Rehabilitation Project (PRP)
Date: January 22, 1998 [ Draft [X1 FinalTask Manager: Donal O'Leary/Bocar Thiam Country Manager: Phyllis PomerantzProject ID: ZM-PE-35076 Sector: EnergyLending Instrument: Sector Investment Loan PTI: [ I Yes [x] No
Project Financing Data [I Loan [x] Credit [I Guarantee f I Other[Specify]
For Loans/Credits/Others:
Amount : US$75.00 million./SDR 55.1 million......................... ................................................. ........................................................................................................................................................Proposed Terms: [ ] Multicurrency [] Single currency
Grace period (years): 10 years [ Standard Variable 0M Fixed [] LIBOR-based
Years to maturity: 40 yearsCommitment fee: 0 %
Service charge: 0.75%........................................................................................................................................................................................................................................
Financing plan (US$m):Source Local Foreign Total
Government/ZESCO 14.24 0.00 14.24IDA 2.26 72.82 75.08EIB 0.00 35.70 35.70NORAD 0.50 14.17 14.67DBSA 0.00 36.80 36.80NDF* 0.00 7.00 7.00SIDA* 0.00 3.18 3.18CFD 0.00 11.50 11.50FINNIDA 0.00 0.60 0.60Unidentified 0.00 4.82 4.82Total Project Cost 17.00 186.59 203.59
................................. .......... ................. ........................................................................................................................... ........................................................................... I t r s u i ,C n tu to 9 8 9 8Interest duin Construction 19.84 0 19.84Total Financing Required 36.84 186.59 223.43~~~~~~~~~~~~~................................. ................................ .......................... ..... ............................
*To be confirmed
Guarantor: Republic of Zambia (GRZ)Responsible agencies: (a) Ministry of Energy and Water Development (MEWD) and (b) Zambia Electricity Supply Corporation(ZESCO)Estimated disbursements (Bank FY/US$m): 1998 1999 2000 2001 2002
Annual 2.5 30.2 29.3 8.9 4.1Cumulative 2.5 32.7 62.0 70.9 75.0
1

For Guarantees: 0 Partial Credit [ Partial risk
Proposed coverage:Project sponsor:Nature of udryn lacnTerms offnancing:
Principal amount (US$)Final maturity
Amortization profileFinancing available without guarantee?: l[l Yes [ ] NoIf yes, estimated cost or maturity:Estimated financing cost or maturty with guarantee:
Expected effectiveness date:4/15/1998 Closing date: 12/31/2002
Block 1: Project Description1. Project development objectives (see Annex 1 for key performance indicators):The Project's overall objective is to support the Borrower's aim of enhancing the ability of Zambia's electricity supply industry toprovide electricity at least cost and in an efficient, sustainable manner to stimulate more and inclusive growth in the Zambianeconomy (see section 5). To assist GRZ in realizing this objective, the Project will support:(a) the Borrower's policy of establishing an institutional and regulatory framework conducive to sustainable efficiency and privateparticipation in the power sector,(b) improving the efficiency of ZESCO, the national electricity utility, through capacity-building measures and a commercializationplan based on corporate autonomy and management accountability which will enhance the Company's resource mobilization andinclude such actions as separating the accounting for generation, transmission and distribution;(c) improving technical efficiency and the quality and reliability of supply in ZESCO's physical system through rehabilitation of, andloss reduction in, the existing generation, transmission and distribution systems; and(d) implementing a Rehabilitation and Development Program for the Gwembe-Tonga, a group who were unsuccessfully resettledduring the construction of the Kariba Dam project.
2. Project components (see Annex 2 for a detailed description and Annex 3 for a detailed cost breakdown):
Component Categorv Cost Incl. Contingencies % of Total
(i) Hydropower Stations Rehabilitation(a) Kafue Gorge Physical 20.82 10.23(b) Victoria Falls Physical 23.36 11.47(c) Kariba North Physical 35.25 17.31(d) Kariba Dam Safety Physical 3.53 1.73
(ii) Distribution System Rehabilitation(a) Lusaka Physical 33.19 16.30(b) Copperbelt (Kitwe) Physical 14.50 7.12(c) Copperbelt (Ndola) Physical 10.68 5.25(d) Loss Reduction Physical 3.50 1.72
(iii) Transmission System Rehabilitation Physical 39.99 19.65
(iv) Gwemnbe-Tonga Rehabilitation and Socio-environmental 7.99 3.92Development Program Mitigation/Physical
(v) Environmental-Social Affairs Unit Institution Building 0.59 0.29Strengthening (ZESCO)
2

(vi) ZESCO Capacity Building and Project Institution Building 5.74 2.82Management
(vii) Support to implement Zambia Hydropower Sectoral Reform 2.40 1.18and Transmission Policies
(viii) PPF Refinancing Sectoral Reform/Institution 2.05 1.01Building/Consultancy
Total 203.59 100.003. Benefits and target population:The project benefits derive from: (a) Facilitating power sector reform aimed at putting the power sector on a least cost andfinancially sustainable path, to be achieved by support for: (i) setting tariffs on a cost-recovery basis, (ii) commercializing ZESCO,(iii) operationalizing the Energy Regulation Board (ERB), and (iv) attracting private sector financing for new generation andtransmission projects; (b) Improving the quality and reliability of supply of electricity, primarily for the industrial and commercialconsumers, which account for more than 80 percent of ZESCO's sales; and (c) support for the improvement of the socio-economic/environmental conditions of the Gwembe-Tonga who were displaced by the Kariba dam.
4. Institutional and implementation arrangements:Implementation period: S years
Executing agencies: MEWD and ZESCO
Project coordination: (a) ZESCO has created a project implementation management unit (PIU) headed by a Project Directorreporting directly to ZESCO's Managing Director. The Project Director will be assisted by project managers appointed to carry outgeneration rehabilitation, transmission system rehabilitation and distribution network rehabilitation works (See Section 16b). TheEnvironmental and Social Affairs Unit (ESU) of ZESCO will execute the environmental aspects of the project, except for theGwembe-Tonga Rehabilitation Development Program (see (b) below). A steering comunittee headed by the Managing Director willmaintain coordination with ZESCO management. The steering committee will also facilitate transferringvarious projectcomponents to the relevant ZESCO directorates after their completion.(b) For the Gwembe-Tonga Rehabilitation and Development Program, ZESCO will set up a Project Management Unit (PMU) in thefield, in Siavonga. The PMU will report to a steering committee chaired by the Permanent Secretary of the MEWD. To providecontinuity and transparency for the project, the Vice-Chairman of the Committee would be a distinguished Tonga (eminent person)from the Gwembe valley. In addition, the steering committee will include representatives of the other involved ministries (e.g.agriculture, health, transport), local government, and will have a strong representation from within the community. The PMUManager (from ZESCO) will be assisted by technical specialists, skilled in the areas of road construction, water resourcesdevelopment, land use, rural electrification and health services and an international advisor.(c) The Zambezi River Authority (ZRA) will coordinate the Kariba Dam Safety program.
Project oversight (policy guidance, etc.): The Government of the Republic of Zambia (GRZ), through its Ministry of Energy andWater Development (MEWD) as well as ZESCO's Board.
Accounting, financial reporting and auditing arrangements: ZESCO's accounts, including financial statements, special accountsand statements of expenditures will be audited by an independent auditor acceptable to IDA. For the Gwembe-Tonga Rehabilitationand Development component as well as the implementation of the Zambia Hydropower Development Policy (HPP) component,MEWD has been requested to open a project account. MEWD's project account, special account and statement of expenditures willbe audited by an independent auditor acceptable to the Bank.
Monitoring and evaluation arrangements:(a) AU physical components of the project will be undertaken by competent contractors under the supervision of qualifiedconsultants. All project components, (except the Gwembe-Tonga Rehabilitation and Development component) will be overseen by aZESCO Project Implementation Unit (PIM), headed by a Director, reporting directly to the Managing Director. The PIU will beassisted by an Advisor with international experience in project management. For the Gwembe-Tonga component, this will beoverseen by a ZESCO PMU, reporting directly to the Permanent Secretary of MEWD. The PMU will be assisted by an internationaladvisor, skilled in implementing rural development projects. In addition, the ESU will regularly monitor and report on all theenvironment aspects of the project; and(b) Regular IDA and other Donor missions at least every six months.
3

Block 2: Project Rationale5. CAS objective(s) supported by the project The Zambia CAS report 15761-ZA, dated June 25, 1996 was discussed by the
Board on July 18, 1996.The project supports the GRZ and CAS objective to promote private sector development and greater public sector efficiency tostimulate more and inclusive growth. The Power Rehabilitation Project is included in the lending program of the most recentlydiscussed CAS. The project supports the objective of fostering growth through the rehabilitation of the existing grid and therebyproviding reliable power for Zambia's development and particularly for the copper industry which accounts for some 80 percent ofZambia's export earnings. The Project also promotes private sector development through: (a) facilitating the operationalization ofthe Energy Regulation Board and (b) supporting the preparation of and promulgation by GRZ of a Hydropower Development andTransmission Policy to attract private sector financing of all new major generation and transmission projects. Finally, the projectsupports public sector efficiency through emphasizing the paramount importance of putting the power sector on a sound financialfooting including ZESCO's commercialization.
6. Main sector issues and Government Strategy:Main Sector Issues:.The main issues in Zambia's power sector relate to its efficiency, commercialization, financing and coverage.Efficiency performance is mixed, with transmission performance being good and performance on generation and distribution beinglow, due to low generator availability and high distribution losses respectively.Commercial performance has been extremely poor. ZESCO's rate-of-return (ROR) on revalued assets was unsatisfactory over thelast five years for which audited accounts were available; in three of these years the ROR was negative. ZESCO was unable to settleits debts satisfactorily due to very low tariffs for both the mining and non-mining sectors, poor cost controls and high debt volume.In addition, there is evidence of overstaffing in ZESCO.Financing of new investments in the power sector has been difficult because of ZESCO's very weak financial position and because ofthe many other priorities on the Government's budget.Coverage is low and varies markedly by province. According to the 1990 census, around 14 percent of households use electricity forlighting. ZESCO added about 20,000 consumers during the period 1990/91-1994/95.
Government Strategy:GRZ's strategy for realizing its goal of optimal development of Zambia's electricity supply industry is to establish an institutionaland regulatory environment to enable private sector participation. In the short-term, the aim is to improve sector performance bycommercializing ZESCO in order to enhance resource mobilization. The instruments of the strategy include GRZ's promulgation ofits National Energy Policy (1994), a new Electricity Act which permits private investment (1995) and the Energy Regulation Act(1995) under which an Energy Regulation Board (ERB) was established in 1997. In 1996, the GRZ signed a Performance Contractwith ZESCO which emphasized commercial operation and efficient technical supply. The Performance Contract has proved to be auseful tool for setting and monitoring performance targets in Zambia's power sector. In relation to increasing electricity coverage,GRZ created a Rural Electrification Fund (REF) through a 10 percent levy on electricity sales. Guidelines on the selection of ruralelectrification projects for financing by this Fund were promulgated in January 1995.
To develop a sector restructuring plan, the GRZ, under the preparation of this Project, sponsored a study (undertaken by LondonEconomics) to advise on the restructuring of the Zambian power sector and submit an action plan for consideration. In addition,with assistance provided under preparation of this project, GRZ initiated the formulation of a Hydropower Development andTransmission Policy aimed towards inducing private sector development of major hydroelectric and transmission projects.
7. Sector issues to be addressed by the project and strategic choices:Sector IssuesThe principal sector issues addressed by the project include efficiency; commercialization; and financing.(a) The Project will support regulatory and institutional reform through the following activities:
(i) Support the efficient operation of the ERB and assist in its capacity building; and(ii) Support the preparation and promulgation of a Hydropower Development and Transmission Policy to promote the private
sector,(1) The Project will support the commercialization of ZESCO through supporting:
(iii) Sound tariff policy, including adequate sales arrangements with the mining sector,(iv) Separation of accounts for the generation, transmission and distribution functions; and(v) Capacity building in ZESCO; and
(c) The Project will support the least-cost development of the power sector, through focusing on efficiency improvements, lossreduction, and the rehabilitation of ZESCO's generation, transmission and distribution systems.Strategic ChoicesSection 8 below discusses the key strategic choices made in addressing sectoral issues under the proposed Project.
4
8. Project alternatives considered and reasons for rejection:Alternatives were evaluated for the sectoral reform and restructuring components; for the physical components of the proposedProject (economic analysis); and the possible inclusion of a rural electrification (RE) component.
(a) The issue of private vs. public participation in the proposed Project was considered in the preparation of the sector restructuringcomponent and was addressed by the London Economics Study "Re-structuring Zambia's Power Sector." The finding was thatprivate sector participation will develop once the sector is profitable and it is clear how the sector will be regulated. Therefore,Project actions in this regard will aim at strengthening sector operations and developing an enabling regulatory framework forprivate participation (see Section 7a). In the medium-term, the distribution sub-sector may provide an entry for the private sectorthrough a competitively-bid operations contract.
(b) Economic Evaluation of Alternatives. The economic analysis verifies that the Project meets the aimed objectives better than thealternatives (alternative expansion plans, different technical specifications, scales and timing). See Section 13 and Annex 4.
(c) Rural electrification. The Project does not include a rural electrification component because the GRZ is raising funds for ruralelectrification through its REF (section 6). However, there are some problems with the management of these funds, particularly thecollection and release of funds to ZESCO so that the company can efficiently implement the Rural Electrification program. GRZ hasagreed to prepare an action plan to speed up the collections and release of Rual Electrification funds and ensure efficientmanagement of the Fund.
(d) The project team also considered including a demand-side management component in the project. However, it was decided notto include this component (except for limited training/TA for some exceptional cases) because of the poor prospects for success,given the financial state of many of the potential industry beneficiaries and their imminent transition to private ownership.
9. Major related projects financed by the Bank and/or other dcv elopment agencies (completed, ongoing and planned):The Bank has a long-standing relationship with the Government going back to pre-independence times. Altogether, the Bank hashad 10 operations (loanstcredits) in the energy sector of which five were in the power sector, four in the petroleum sector and one inthe coal mining sector. Over the last twelve years, the Bank approved only one operation in the energy sector: the Petroleum SectorRehabilitation Project (Credit No. 2621). Two years elapsed between Board Presentation and effectiveness of this project. This waspartly due to the fact that it took a long time to sign a contract with a consortium of international oil marketing companies tomanage the oil products terminal in Ndola. No power operation has been prepared for more than twenty years. Under the twoPrivatization and Industrial Reform Credits (PIRCs), (Credit Nos. 2405 and 2523) and the PIRCTA Credit, IDA has supported theinitiation of power sector reform including the dissolution of Zambia Industry and Mining Corporation (ZIMCO); the preparation ofa Performance Contract between the GRZ and ZESCO, that sets out agreed expectations and obligations relating to the performanceof Zambia's power sector; and a detailed training program for, inter alia, stakeholders on issues relating to the institutionalization ofthe Energy Regulation Board.
Several donors including AfDB, CIDA, DANIDA, EIB, FINNIDA, NORAD, SIDA, and the Governmuent of Ireland have providedor are providing financial project support to ZESCO and MEWD.
10. Lessons learned and reflected in the project design: The major lesson learned from the projects in section 9 is the need toaddress sectoral, regulatory, tariff, institutional as well as project policies/issues prior to project approval. (See the Conditions ofEffectiveness set out in Section 23.) The key issue in implementing the physical components relates to the need to minimize start-updelays. Project design addresses this by initiating procurement as early as possible in project preparation. Accordingly, submittal ofdraft bidding documents for all the major project components (except for the rehabilitation of the Victoria Falls Power Station) wasmade a condition of Negotiations.
11. Indications of borrower commitment and ownership:This project has been prepared at the specific request of the Government. Specific actions demonstrate GRZJZESCO commitment tothe project and its objectives. First, though project preparation costs were substantial - reaching approximately US$7 million (SeeAnnex 7 for more detail) -- GRZtZESCO picked up a considerable amount of these costs (estimated at US$1.5 million) when somedonors found it difficult to support project preparation because of concerns about governance issues. Second, ZESCO increasedtariffs by approximately 5 percent, in USS terms, for sales to Zambia Consolidated Copper Mines' Power Division (ZCCM/PD)(effective 1/1/1997) and by approximately 30 percent for all other consumers in Zambia (effective 2/1/1997). ZESCO implemented asecond substantial tariff increase of approximately 40 percent for all consumers (except ZCCM) in Zambia on 7/1/1997 and anotherincrease will become effective from January 1998. As of 12/1/97, ZESCO has implemented a tariff increase of approximately 50percent in US$ terms for sales to the new owners of ZCCM/PD.
5
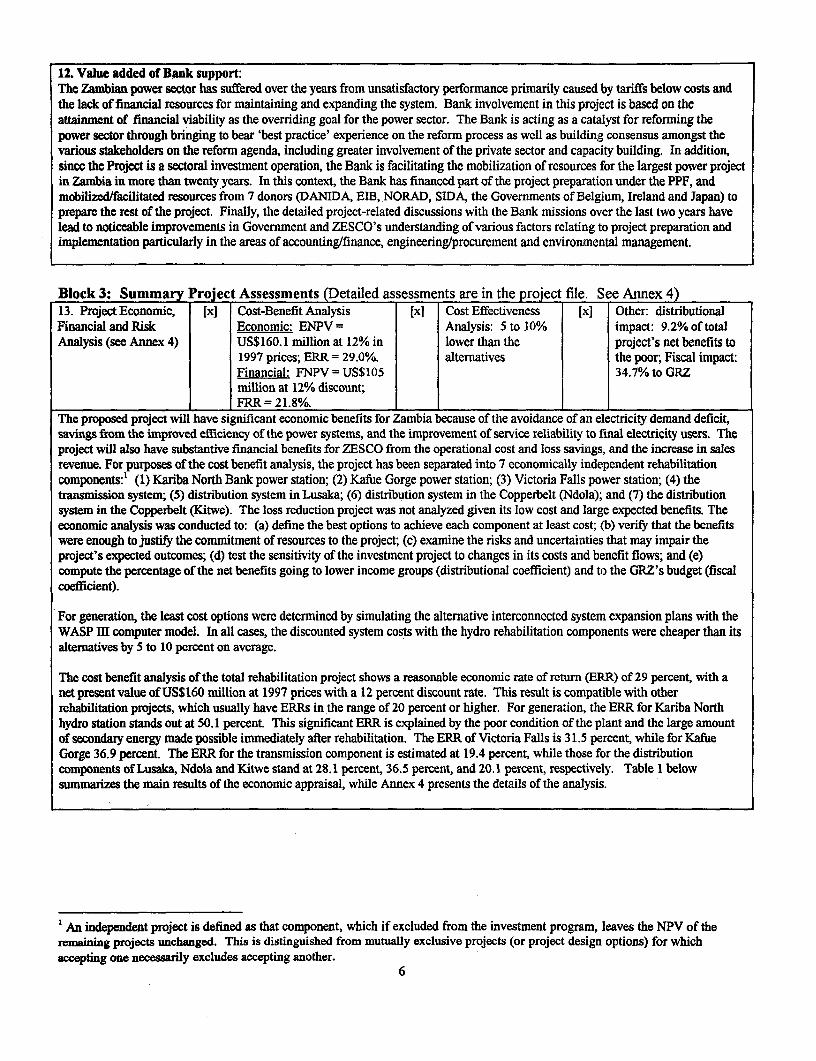
12. Value added of Bank support:The Zambian power sector has suffered over the years from unsatisfactory performance primarily caused by tariffs below costs andthe lack of financial resources for maintaining and expanding the system. Bank involvement in this project is based on theattainment of financial viability as the overriding goal for the power sector. The Bank is acting as a catalyst for reforming thepower sector through bringing to bear 'best practice' experience on the reform process as well as building consensus amongst thevarious stakeholders on the reform agenda, including greater involvement of the private sector and capacity building. In addition,since the Project is a sectoral investment operation, the Bank is facilitating the mobilization of resources for the largest power projectin Zambia in more than twenty years. In this context, the Bank has financed part of the project preparation under the PPF, andmobilized/facilitated resources from 7 donors (DANIDA, EIEB, NORAD, SIDA, the Governments of Belgium, Ireland and Japan) toprepare the rest of the project. Finally, the detailed project-related discussions with the Bank missions over the last two years havelead to noticeable improvements in Govermnent and ZESCO's understanding of various factors relating to project preparation andimplementation particularly in the areas of accounting/finance, engineering/procurement and environmental management.
Block 3: Summary Project Assessments (Detailed assessments are in the project file. See Annex 4)13. Project Economic, [xl Cost-Benefit Analysis [xl Cost Effectiveness [x] Other: distributionalFinancial and Risk Economic: ENPV = Analysis: 5 to 10% impact: 9.2% of totalAnalysis (see Annex 4) US$160.1 million at 12% in lower than the project's net benefits to
1997 prices; ERR = 29.0%. alternatives the poor; Fiscal impact:Financial: FNPV = US$105 34.7% to GRZmillion at 12% discount;FRR = 21.8%. _
The proposed project will have significant economic benefits for Zambia because of the avoidance of an electricity demand deficit,savings from the improved efficiency of the power systems, and the improvement of service reliability to final electricity users. Theproject will also have substantive financial benefits for ZESCO from the operational cost and loss savings, and the increase in salesrevenue. For purposes of the cost benefit analysis, the project has been separated into 7 economically independent rehabilitationcomponents:' (1) Kariba North Bank power station; (2) Kafue Gorge power station; (3) Victoria Falls power station; (4) thetransmission system; (5) distribution system in Lusaka; (6) distribution system in the Copperbelt (Ndola); and (7) the distributionsystem in the Copperbelt (Kitwe). The loss reduction project was not analyzed given its low cost and large expected benefits. Theeconomic analysis was conducted to: (a) define the best options to achieve each component at least cost; (b) verify that the benefitswere enough to justify the commitment of resources to the project; (c) examine the risks and uncertainties that may impair theproject's expected outcomes; (d) test the sensitivity of the investment project to changes in its costs and benefit flows; and (e)compute the percentage of the net benefits going to lower income groups (distributional coefficient) and to the GRZ's budget (fiscalcoefficient).
For generation, the least cost options were determined by simulating the alternative interconnected system expansion plans with theWASP IH computer model. In all cases, the discounted system costs with the hydro rehabilitation components were cheaper than itsalternatives by 5 to 10 percent on average.
The cost benefit analysis of the total rehabilitation project shows a reasonable economic rate of return (ERR) of 29 percent, with anet present value of USS160 million at 1997 prices with a 12 percent discount rate. This result is compatible with otherrehabilitation projects, which usually have ERRs in the range of 20 percent or higher. For generation, the ERR for Kariba Northhydro station stands out at 50.1 percent. This significant ERR is explained by the poor condition of the plant and the large amountof secondary energy made possible immediately after rehabilitation. The ERR of Victoria Falls is 31.5 percent, while for KafueGorge 36.9 percent. The ERR for the transmission component is estimated at 19.4 percent, while those for the distributioncomponents of Lusaka, Ndola and Kitwe stand at 28.1 percent, 36.5 percent, and 20.1 percent, respectively. Table 1 belowsummarizes the main results of the economic appraisal, while Annex 4 presents the details of the analysis.
'An independent project is defined as that component, which if excluded from the investment program, leaves the NPV of theremaining projects unchanged. This is distinguished from mutually exclusive projects (or project design options) for whichaccepting one necessarily excludes accepting another.
6

Table 1Summary Results of the Economic, Financial and Risk Analysis
Economic FinancialComponent ENPV ERR Probability ERR with FNPV FRR Probability FRR with
IUSS 000 of a 75% US$ 000 of a 75%achievement certainty achievement certainty
GenerationVictoria Falls 15,617 31.5% 47% 25.7% 942 13.0% 33% 10.6%Kafue Gorge 16,484 36.9% 49% 30.6% 1,925 14.3% 48% 12.5%KaribaNorth 32,008 50.1% 50% 44.8% 15,957 29.3% 48% 25.9%
Transmission 24,932 19.4% 54% 16.5% 22,191 18.3% 50% 15.1%Distribution* Lusaka 44,960 28.1% 27% 21.1% 41,409 26.6% 28% 20.2%* Ndola 18,196 36.5% 13% 21.2% 16,009 33.2% 8% 18.2%
Kitwe 7,878 20.1% 190/% 12.9% 6,278 18.4% 16% 11.6%Total Project 160,075 29.0% 38% 27.5% 104,712 21.8% 31% 17.3%
Net present values discounted to 1998 with a 12 percent discount rate.
Risk and Sensitivity Analysis: Projects in Zambia face a considerable degree of risk. Several of the risks are associated with themacroeconomic and political uncertainties facing all developing countries. Others, however, are specific to the nature of thecomponents, including the uncertainties related to the effects of the proposed components on the existing generation, transmissionand distribution systems. A risk analysis was performed to estimate the probability associated with each component outcome. AsTable 1 above indicates, the proposed components are robust and have a small likelihood of being uneconomic. The results suggestthat the probability of achieving the overall project ERR of 29 percent is at least 38 percent. If this probability of achievement isconsidered too low, the analysis estimated the ERR of 27.5 percent with a certainty of 75 percent. The assumptions, rationale andresults of the risk analysis for each component are described in more detail in Annex 4.
A sensitivity analysis was undertaken to test the robustness of the ERRs of each project component to changes in key cost and benefitvariables which are subject to risk and uncertainty. The results also confirm that the proposed investments have attractive and robusteconomic indicators, as only with very large increases in costs or substantial decreases in benefits, would the ERRs fall below theopportunity cost of capital of about 12 percent. For instance, the investment costs for the Victoria Falls component would have toincrease by more than 40 percent, for its ERR to drop below 12 percent. Tariffs are the single most important variable affecting theeconomics of the project. If tariffs decline more than 25 percent in real terms, the ERRs of several components would suffer.Therefore, it is critical that the agreed tariff implementation schedule is maintained with as little deviation as possible. A summaryof the changes in the cost and benefit streams of each component that would be required for the ERRs to fall below the 12 percentbenchmark rate is presented in Annex 4.
Table 2Summary Results of the Sensitivity Analysis:
Percentage (%)l Increases in Costs or Reduction in Benefits for a 12 Percent ERRComnponent Project Investment & Systemn WTP Resource Savings Reliability
Op. Costs Costs Improvement
GenerationVictoria Falls 38 59 -40 -55 -102Kafue Gorge 41 63 -42 -58 -109Kariba North 80 85 -57 -83 -85
Transmission 77 72 -56 -1841 -52Distribution
Lusaka 127 82 -37 -2727 -1911Ndola 210 94 -40 -6234 -7544K.itwe 67 56 -24 -8727 8164
7

Financial Analysis: The financial analysis of the components also shows that they have financial rates of return (FRR) higherthan the benchmark 10 percent financial rate. The overall FRR of the project is 21.8 percent, with a net present value of US$105million. The FRRs in generation are: Kariba North hydro station, 29.3 percent; Victoria Falls, 13 percent; and Kafue Gorge, 14.3percent. The FRR for the transmission component is 15.1 percent. The FRRs for the distribution components for Lusaka, Ndolaand Kitwe are 26.6 percent, 33.2 percent, and 18.4 percent, respectively.
The risk analysis of the financial outcomes also confirms that the components profiles are robust against the risks that may affecttheir implementation and operation. As Table 1 above shows, with a 75 percent certainty, all the FRRs of the project componentsare higher than the 10 percent financial benchmark rate. Annex 4 provides the results for the other components.
Distribution Analysis: The distribution analysis of the project flows shows that the income and fiscal distributional impacts of theoverall project are positive. The distribution coefficient of the project (net benefits to unskilled labor and poor residential users as aproportion of the project's net benefits) amounts to 9 percent, while the fiscal coefficient (net fiscal revenue as a proportion ofproject's total net benefits) is 35 percent. The risk analysis suggests that with a 75 percent certainty, the likely distributioncoefficients would decline to 7 percent and 26 percent, respectively.
14. Financial Assessment of ZESCO (see Annex 5.)Detailed analysis of ZESCO's past and current financial performance, tariff issues and future financial projections are included inAnnex 5.
ZESCO's Past and Current Financial Performance. ZESCO's financial performance during the period 1991/2-1996/7 wasunsatisfactory (Table 1, Annex 5).
Sales 199112 199213 199314 199415 199516 199617ZCCM Sales (GWh) 4072 4216 4289 4118 4098 4101Exports(GWH) 2107 120 855 1066 1397 842Oomestik(GWH) 2068 2409 2491 2530 2616 2507Total 8,247.10 6,744.45 7,635.10 7,714.00 8,111.00 7,450.RevenueZCCM Sales (USS million) 14.61 14.00 35.56 43.95 47.30 57.91ExpoWUS$) 14.62 0.75 11,62 15.51 21.62 14.14Domestic(US$) 13.27 24.20 48.56 43.23 39.76 54.63TotalUSS) 42.51 38.95 95,75 102.68 108.69 126.67ProfitabilityTotal Operating Revenue 45.07 41.87 96.61 105.16 110.48 131.23Operating Margin 14.79 8.38 34.97 12.13 25.63 (16.39)Profi/Loss before Taxation (4.32 (28.79 2.20 (6.95) (6.62) (29.01')
ZESCO incurred losses in every year but one during that period. Moreover, these losses are understated as depreciation was basedon the historical cost of assets and the expenditure on maintenance in these years was limited by the availability of funds. The majorcauses of ZESCO's poor financial performance were: (a) Government control of tariffs, set at levels which did not cover costs (seebelow); (b) devaluation of the Kwacha, and as ZESCO's foreign debt and 80 percent of its operating costs are dollar based, thishad a substantial impact; (c) high levels of arrears (see below); and (d) revaluation of Assets led to considerably higherdepreciation charge in FY96. (However, this has also had positive effects on capital structure, as discusssed below.) GRZ andZESCO have recently made several important changes that have already begun to improve ZESCO's financial performance incertain areas, and if maintained will impact well upon ZESCO's future financial position. Changes in tariff setting processaccompanied by appropriate tariff adjustments will have a tremendous impact. In May 1996, a Performance Contract was signedbetween the Govermment and ZESCO. The latter has also introduced operational efficiencies, including the rationalization of itslabor force. Despite these positive changes, in 1996/7 due to a higher depreciation charge on account of revalued assets, ZESCOfailed to cover its operating costs -- recording an operating loss of US$16.3 million, and a total loss of US$29.01 million before tax.On the positive side, stabilization in exchange rates resulted in much lower foreign exchange losses than in previous years (1996/7,US$7 million as compared to 1995/6, US$25 million). The revaluation of fixed assets added US$1,150 million to equity as arevaluation reserve, strengthening ZESCO's equity base and capital structure -- in 1996/7, the debt to equity ratio was only 6percent The 1992 decision to have the ZCCM tariff quoted and paid in US dollars resulted in increased revenues during the periodof major devaluation froml991/2 to 1995/6. As a result of real tariff increases, sales revenues increased during the period 1994/5-1996/97 by 23 percent in dollar terms, from US$103 million to $127 million, an average annual increase of 11.5 percent.
8

ZESCO's Tariff. Before 1991, ZESCO was required to obtain government approval for all tariff increases: it developed tariffrecomnmendations and the Government generally approved less than applied for after a lengthy process. Consequently tariffs didnot cover costs, and tariff increases were below the rate of inflation. In 1991, ZESCO was given the autonomy to review tariffs asneeded. Domestic tariffs increased in dollar terms from USc 1.7/kWh in 1994/5 to USc 2.21/kWh in 1996/7, an average annualincrease of 10 percent. The ZCCM tariff increased from USc 1.067/KWh in 1994/5 to USc 1.4/KWh in 1996/7. Negotiations fortariff increases with ZCCM have always posed a problem as also its late settlement of debt causing significant negative impact onZESCO's cashflow. As a part of the tariff restructuring process, ZESCO has commissioned a Tariff Study, financed by the SwedishInternational Development Agency (SIDA) which will be used as the basis for establishing an appropriate tariff structure. ZESCOhas agreed to implement the reconunendations of the Tariff Study with regards to tariff structure by April 1, 1998. The levels oftariff increase required to achieve the financial objectives are provided in Annex 5.
Historical Tariffs 1991/2 1992/3 1993/4 1994/5 1995/6 1996/7Implied Average Tariff 0.515 0.578 1.254 1.331 1.340 1.70(UScents/kWh)Implied ZCCM Tariff 0.359 0.332 0.829 1.067 1.154 1.40(UScents/kWh)Implied Domestic Tariff 0.642 1.005 1.949 1.709 1.520 2.21(USc/kWh) .Implied Export Tariff 0.694 0.625 1.360 1.455 1.548 1.68(UScents/kWh)
Main Issues.
(a) ZESCO remains exposed to foreign exchange fluctuations and inflation, and will need to manage these variables to avoidnegative results on its financial performance. An agreement has been reached that ZESCO would apply an automatic tariffadjustment mechanism to take account of movements in both local and international exchange rates and inflation. The adjustmentwill be premised on tracking the impact of the above variables on ZESCO's operating costs, and subsequently translating these intoan adjustment factor for tariffs. The adjustment would occur quarterly and will not require Ministry approval. Agreement was alsoreached that the ZCCM tariff would continue to be quoted in US dollars.
(b) Arrears. Cashflow was ZESCO's critical problem during the period 1994/5 to 1996/7. Both the current and quick ratios werebelow one. Collections from ZCCM, Government and other parastatals was a major problem. The position worsened in 1996/7with 218 days of debt outstanding. As a result during this period, ZESCO's overdraft increased from US$1.4 million to US$15million. Strong efforts need to be made for recovery of arrears, and disconnection policy needs to be enforced vigorously. Anagreement has been reached between the Ministry of Finance and ZESCO that a clearing house mechanism would be established toclear outstanding arrears among parastatals and government departments, and ensure that dues owing to ZESCO will not exceedtwo months' billing. It was also agreed that ZESCO would submit semi-annual reports on December 1 and June 1 of each year onits billings and collections. ZESCO would reduce its outstanding balance of electricity sales debts equivalent to 120 days in1998/99, 90 days in 1999/2000, and 60 days thereafter. As of April 1, 1998, ZESCO will levy a late payment charge of 10 percenton bills unpaid on the due date. ZESCO agreed to enforce its disconnection policy which includes disconnecting customers withbills outstanding for 60 days after the due date. Under the project, agreement was reached that ZESCO would maintain a quickratio of one, and a current ratio of 1.5.
(c) Demand and Sales. Of ZESCO's three main customer categories, ZCCM, domestic and exports, ZCCM is the most significant,constituting 54 percent of its energy sales and 46 percent of its revenue in 1996/. ZCCM's relative importance to sales revenue(which increased from 43 percent in 1994/5 to 46 percent in 1996/7) is larger than its importance in volume of sales which havestabilized around 4,100 GWh per annum. As a percentage of ZESCO's sales, ZCCM's share increased modestly from 53 percentin 1994/5 to 54 percent in 1996/7. Although domestic sales increased by 3 percent per annum from 1994/5 to 1996/7 and ZCCMsales stabilized, overall sales decreased from 7717 GWh in 1994/5 to 7707 GWh in 1996/7 due to the loss of about half of the exportmarket (to Zimbabwe). Exports decreased from 1,397 GWh in 1995/6 to 860 GWh in 1996/7, and it is expected that the wholeexport market will be lost in 1997/8 for a few years. The financial projections are sensitive to demand and ZESCO's ability toexpand its domestic market.
(d) Privatization of ZCCM. GRZ is in the process of privatizing ZCCM. A fifteen year bulk sales agreement (BSA) between thenew owner of ZCCM's Power Division (Copperbelt Energy Consortium) and ZESCO has been reached.
9
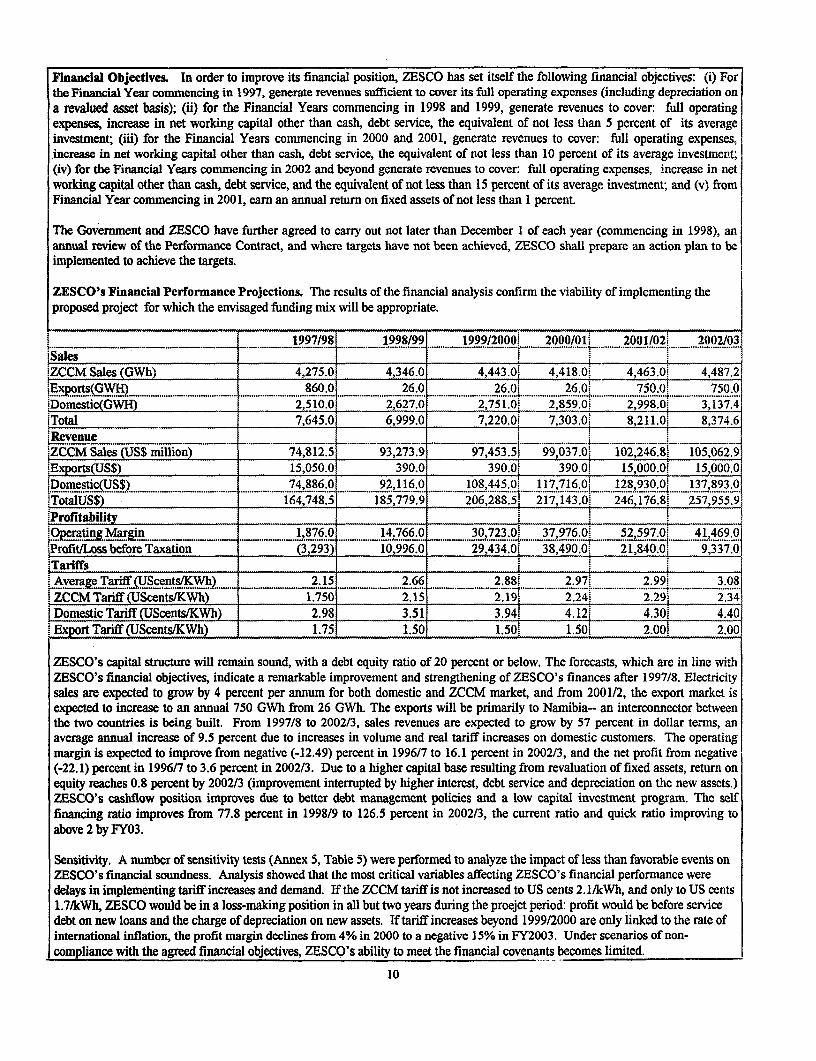
Financial Objectives. In order to improve its financial position, ZESCO has set itself the following financial objectives: (i) Forthe Financial Year commencing in 1997, generate revenues sufficient to cover its full operating expenses (including depreciation ona revalued asset basis); (ii) for the Financial Years commencing in 1998 and 1999, generate revenues to cover: full operatingexpenses, increase in net working capital other than cash, debt service, the equivalent of not less than 5 percent of its averageinvestment; (iii) for the Financial Years commencing in 2000 and 2001, generate revenues to cover: full operating expenses,increase in net working capital other than cash, debt service, the equivalent of not less than 10 percent of its average investment;(iv) for the Financial Years commencing in 2002 and beyond generate revenues to cover: full operating expenses, increase in networking capital other than cash, debt service, and the equivalent of not less than 15 percent of its average investment; and (v) fromFinancial Year commencing in 2001, earn an annual return on fixed assets of not less than 1 percent.
The Government and ZESCO have further agreed to carry out not later than December 1 of each year (commencing in 1998), anannual review of the Performance Contract, and where targets have not been achieved, ZESCO shall prepare an action plan to beimplemented to achieve the targets.
ZESCO's Financial Performance Projections. The results of the financial analysis confirm the viability of implementing theproposed project for which the envisaged funding mix will be appropriate.
1997/98 1998/99 1999/2000 2000/01 2001/02 2002/03.Sales , ._ _
.ZCCM Sales (GWh) 4,275.0 4,346.0 4,443.0. 4,418.0 4 463 0 4,487.2.Exports(.GWHj ._ . . .. . _ .............. ... .. .. 860.0 .26.0 .26.0 26.0 750.0 750.0~~~~~~~~.. ..... .... . . .... ... ... ... ... .. ..... ..... 2 2.( ..... .=............... ------............................... .. ----Domestic(GH)2,510.0 2,627.0 2,751.01 2,859.01 2,998.O0 3,137.4:Total 7,645.0 6,999.0 7,220.0 7 303.0. 8 211.0 8,374.6Revenue
_ ~. _ ............... _ ._ ........... _ ........ ..... ._ ._ ._ ._.........._._...._... _ ....... ...... _.._._......... . . _._...,._..._._._..._ _ _.__... . ..... _
;ZCCM Sales (US$ million) 74,812.5 93,273.9 97,453.5' 99,037.0i 102,246.8 105,062.9.Exports(US$) 15,050.0 390.0 390.0, 390 0 1500.00 15,000.0,Domestic(US$L -.- -74,886.0 92,116.0 108,445.0, 117,716.0. 128 930.0 137,893.0t _ _~~~~~~~~~~~~~~~~~~~~~~~~~~~~~~~~~... ... _._.______Z_ .......... .......... ........ _ ..... ........ ...... .._ ..... ..... ._ .... ....'Tota1US$) 164,748.5 185,779.9 2217,143.0 246=176.8 257,955.9Profitability |
1,876.0 14.766.0 30,723.0, 37 976.0- 525 41,469.0sProftlLoss before Taxation (3,293) 10,996.0 29,434.0 38,490.0. 21840.0 9,337.0Tariffs l _ ,_j _ I
E Average Tariff (UScents/KWh) 2.15 2.66 2.881 2.97. 2.99! 3.08,~~~~~~~~~~~~~~ ... .. ...... . .... .... . ...... . . ....... ... .... ..... ...... . ..... ------ ........ . ......... ....... .......ZCCM Tariff (UScentslKWh) 1.750 2.15 2.195 2.241 2.291 2.34Domestic Tariff (UScents/KWh) 2.98 3.51 3.941 4.121' 4.30: 4.40Export Tariff (UScents/KWh) 1.75 1.50 1.50! 1.501' 2.00i 2.00
ZESCO's capital structure will remain sound, with a debt equity ratio of 20 percent or below. The forecasts, which are in line withZESCO's financial objectives, indicate a remarkable improvement and strengthening of ZESCO's finances after 1997/8. Electricitysales are expected to grow by 4 percent per annum for both domestic and ZCCM market, and from 2001/2, the export market isexpected to increase to an annual 750 GWh from 26 GWh. The exports will be primarily to Namibia-- an interconnector betweenthe two countries is being built. From 1997/8 to 2002/3, sales revenues are expected to grow by 57 percent in dollar terms, anaverage annual increase of 9.5 percent due to increases in volume and real tariff increases on domestic customers. The operatingmargin is expected to improve from negative (-12.49) percent in 1996/7 to 16.1 percent in 2002/3, and the net profit from negative(-22.1) percent in 1996/7 to 3.6 percent in 2002/3. Due to a higher capital base resulting from revaluation of fixed assets, return onequity reaches 0.8 percent by 2002/3 (improvement interrupted by higher interest, debt service and depreciation on the new assets.)ZESCO's cashflow position improves due to better debt management policies and a low capital investment program. The selffinancing ratio improves from 77.8 percent in 1998/9 to 126.5 percent in 2002/3, the current ratio and quick ratio improving toabove 2 by FY03.
Sensitivity. A number of sensitivity tests (Annex 5, Table 5) were performed to analyze the impact of less than favorable events onZESCO's financial soundness. Analysis showed that the most critical variables affecting ZESCO's financial performance weredelays in implementing tariff increases and demand. If the ZCCM tariff is not increased to US cents 2. 1/kWh, and only to US cents1.7/kWh, ZESCO would be in a loss-making position in all but two years during the proejct period: profit would be before servicedebt on new loans and the charge of depreciation on new assets. If tariff increases beyond 1999/2000 are only linked to the rate ofinternational inflation, the profit margin declines from 4% in 2000 to a negative 15% in FY2003. Under scenarios of non-compliance with the agreed financial objectives, ZESCO's ability to meet the financial covenants becomes limited.
10
15. Technical Assessment:The Zambia Power Rehabilitation Project includes a number of physical sub-components which can be grouped into threecategories:
(a) Hydropower plant rehabilitation;(b) Transmission system rehabilitation; and(c) Distribution network rehabilitation.
Due to the lack of adequate maintenance, the almost four-decade-old Zambian power system requires extensive rehabilitation workto ensure its satisfactory operation. The requirements have been defined through the various studies conducted by the consultants.During the studies, these consultants visited Kariba North Power Station, Victoria Falls Power Station, and Kafue GorgeHydropower Station and carried out detailed inspections of the equipment and the civil structures. Similarly, a majority of thetransmission substations and towers were also physically inspected. Physical verification of the condition of the distributionnetwork in Lusaka and Coppeibelt region was also conducted to identify the required rehabilitation works. In addition, in accordwith the Bank's funding requirements for the rehabilitation of hydroelectric dams of more than l5m height, safety assessmentswere undertaken for the Kafue Gorge and Kariba dams.
The seven consultant companies conducting these studies prepared detailed cost estimates, discussed with ZESCO and theconsultants during the Bank's appraisal mission. The total project cost is estimated at US$203.59 million including physical andprice contingencies but excluding taxes and interest during construction. The cost estimates and the assumptions on which they arebased, were considered to be reasonable by the Bank's mission. The physical contingency allowances were found to be adequate.
IDA intends to finance the rehabilitation works on Kafue Gorge hydroelectric plant and part of the transmission and distributionsystems rehabilitation work. IDA will also finance measures required for Kariba Dam Safety Program. IDA also intends to providetechnical assistance for ZESCO's institutional strengthening, the Gwembe-Tonga Rehabilitation and Development program and forimplementation of Zambia's Hydropower and Transmission Policy.
EIB and DBSA have recently completed their appraisals for financing of the Victoria Falls Hydroelectric Station Rehabilitation,and Kariba North Bank hydroelectric plant. NORAD has expressed interest in financing a part of the transmission systemrehabilitation work. SIDA has expressed interest in financing the supervision of the Kafue Gorge rehabilitation scheme. Otherdonors, including CFD, FINNIDA and NDF, have also expressed interest in supporting the project.
The implementation schedules for the various project components were reviewed during the World Bank appraisal mission ofJuly/August 1997 and found to be reasonable.
A Donors Meeting was held in Lusaka on September 17, 1997 to firm up the packaging and procurements arrangements of theproject's generation, transmission and distribution rehabilitation components. The meeting also provided an opportunity for theGovernment to set out in detail its reform agenda for the power sector.
16. Institutional Assessment:a Executing agencies:
(i) The principal project executing agency will be ZESCO, a wholly owned Government corporation, that wasestablished under the Zambia Electricity Supply Act (1970). ZESCO is the national utility of Zambia and will be responsible forexecuting all aspects of the project, except for the Gwembe-Tonga component. ZESCO manages a network consisting of 1608 MWof hydroelectric plant and associated transmission and distribution facilities as well as 16.5 MW of isolated capacity. (Its principalcustomer, ZCCM/PD, manages a smaller network in the Copperbelt that transmits/distributes power to the copper mines and theirtownships. This system is being privatized as part of the overall ZCCM privatization.) ZESCO has been undergoing an upgradingof its management and staff on its own initiative since new management was appointed after the change in Government in 1991.This has included extensive training for management and up to 700 staff. This program was augmented by the ZESCO HumanResources and Capacity Building Study which was carried out in conjunction with project preparation. This study has lead torecommendations for the institutional strengthening of ZESCO, which will be implemented under the project (See Annex 2). WhileZESCO has managed large rehabilitation projects in the past, it has not managed a project of this complexity, involving multiplecomponents and many donors. Suitable arrangements are being put in place to manage the project and minimize projectimplementation risks. Further information on project management are provided below, while project risks are dealt with in Section21:(ii) ZESCO has set up a Project Management Unit (PMU) to implement the Gwembe-Tonga project component at the request ofMEWD, the designated Executing Agency. Further details on those arrangements are given in Section 4 (b); and(iii) Implementation of technical assistance to support implementation of Zambia's Hydropower Development and TransmissionLine Policy will be undertaken by the Private Power Development Cell which will be set upon issuance by GRZ of that Policy.
11

b. Project management: Because of the Project's complexity and magnitude, it has been agreed with ZESCO that it should beimplemented under a special Project Implementation Unit (PIU) headed by a Project Director (PD) reporting directly to theManaging Director (MD). A group of engineers will assist the PD to: (i) monitor the cost and schedule of the project components;(ii) handle procurement and contractual matters; and (iii) advise the PD, in a timely manner, on any cost or schedule overruns. ThePD will implement the project through Project Managers (PMs), who will manage the project on a day-to-day basis with theassistance of engineering/management consultants, as appropriate. One consultant will be appointed to supervise each projectcomponent. Each PM will have a project engineer, stationed in the field, and be required to maintain an appropriate level ofcoordination during project implementation. A Steering Committee, chaired by the MD, will be established to ensure coordinationamong the various ZESCO Directorates and the orderly transfer of the completed project components to the appropriate ZESCODirectorate. An expatriate advisor will be appointed to assist the PD in project implementation. ZESCO has prepared a ProjectImplementation Plan (PIP).17. Social Assessment:The social component of the Project aims to improve the conditions of people unsuccessfully resettled in the first Kariba project.The Bank and the University of Zambia's Institute of Economic and Social Research (INESOR) signed the contract for a study andaction plan for rehabilitation of Kariba-affected peoples in January 1997. That study, "The Rehabilitation and DevelopmentStrategy for the Peoples Affected by the Construction of the Kariba Dam (Gwembe-Tonga)," produced a report (September 1997),incorprating a Rehabilitation and Development program and cost estimate (see Annex 12). The current cost estimate for theRehabilitation and Development Program is US$15.13 million of which ongoing IDA projects, DBSA funding and the RE Fund(Section 8) will be tapped to assure that all the project sub-components are fully financed.
The Rehabilitation and Development Program includes inter alia: (a) the rehabilitation of 365 km of a key road ("the BottomRoad") that connects the three districts that have received the resettled people; (b) water resources development combiningimproved water supply and improving cropping patterns along the margins of the reservoir that are timed to coincide with thepatterns of reservoir drawdown and refilling; (c) improvement of land use through strengthened agricultural extension facilities,including a pilot agriculture scheme. In addition, a fund is to be created to support micro-projects dealing with land use; (d)Upgrading of health facilities and services; and (e) electrification of three of the large villages (Chipepo, CGwembe Boma andSinazeze), as well as the area around the reservoir.
Strengthening the Social Affairs professional staff in ZESCO's recently formed Environment and Social Affairs Unit (ESU) is alsoincluded in the proposed Project (Section 18).
18 Environmental Assessment:A Sectoral Environmental Scoping study for Zambia's power sector, including the proposed Project, was completed in 1995. Themajor recommendations of the Study were to: (a) establish an Environmental and Social Affairs Unit (ESU) in ZESCO; (b)develop a rehabilitation plan for the Kariba Gwembe-Tonga (see Section 17); (c) develop a waste management plan, including forPCBs; (d) undertake sub-basin-wide environmental and social assessments for upcoming hydropower projects; and (e) encouragecommitment to the ESU by ZESCO's Board and senior management. These recommendations will be addressed under the proposedproject.
The major environmental issue identified in project preparation was the treatment of wastes and harmful substances in some of theexisting hydropower plants and transmission lines. An assessment of waste was included in each of the separate rehabilitationcomponents of the Project and their management will be addressed during implementation. A study financed by CIDA will developa comprehensive program for management/disposal of PCBs, and will be coordinated with the Enviromnental Council of Zambia(ECZ) and ZESCO. ZESCO has agreed to implement the study's recommendations.
Strengthening the recently formed ESU, which is responsible for planning and implementation of enviromnental and socio-economic programs associated with ZESCO projects, is a key component in the Project, as is ESU completion of initial training andwork programs. In addition, the ESU will initiate a monitoring and audit program, with monthly reporting requirements. Theprogram will track project progress in relation to the implementation of environmental and socio-economic activities.
Victoria Falls Hydro Station Rehabilitation Environmental Assessment (EA). The EA on Victoria Falls, a World Heritage site dueto its unique geology, was completed in March 1997 in conjunction with the preparation of the rehabilitation study of the VictoriaFalls hydro station. The EA found no additional impacts associated with the Project. However, the EA found that operation of thestation has had negative impacts, including land degradation, PCB contamination, water management issues and associateddegeneration of tourism and aesthetic loss. To address these issues, the proposed Project includes environmental component forVictoria Falls which will enhance the ecology and aesthetic value of the site (see section 22). Zambia is a riparian on the Zambeziriver. While the proposed Victoria Falls Rehabilitation component does not alter the flow regime of the Zambezi and does notrequire notification, GRZ has agreed to notify the Government of Zimbabwe at the request of EIB.
12
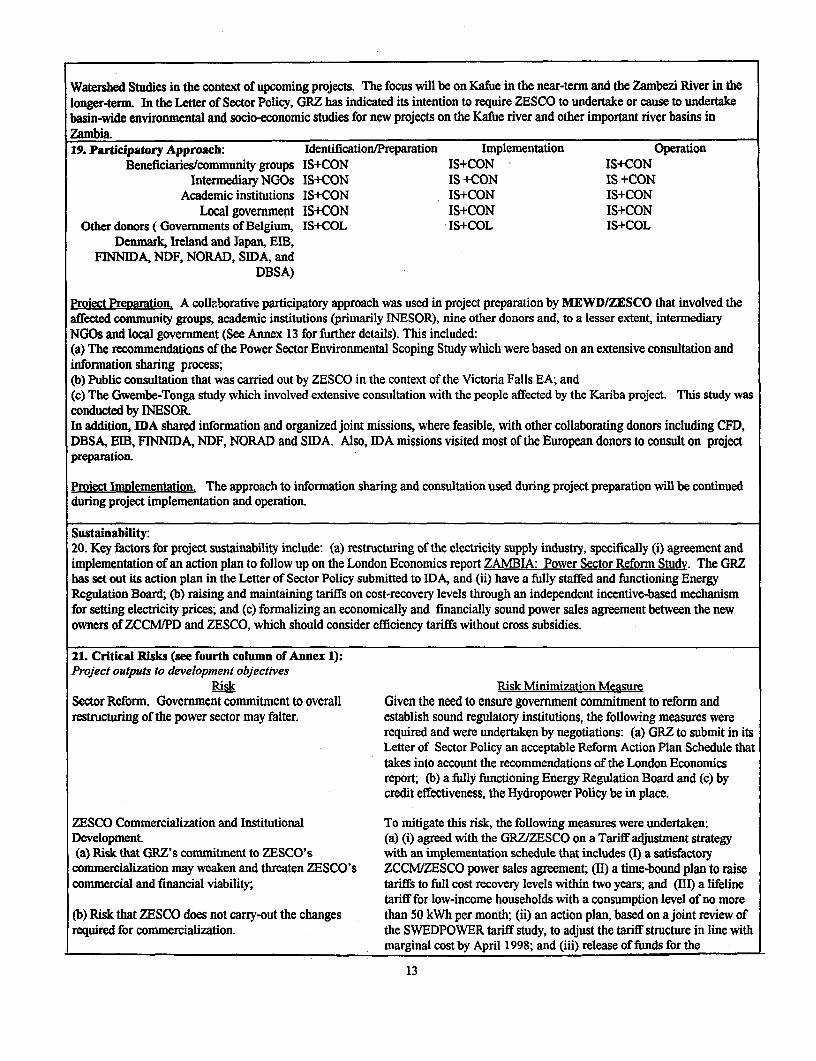
Watershed Studies in the context of upcoming projects. The focus will be on Kafue in the near-term and the Zambezi River in thelonger-term. In the Letter of Sector Policy, GRZ has indicated its intention to require ZESCO to undertake or cause to undertakebasin-wide environmental and socio-economic studies for new projects on the Kafue river and other important river basins inZambia.19. Participatory Approach: Identification/Preparation Implementation Operation
Beneficiaries/community groups IS+CON IS+CON - IS+CONIntermediary NGOs IS+CON IS +CON IS +CON
Academic institutions IS+CON IS+CON IS+CONLocal government IS+CON IS+CON IS+CON
Other donors ( Govermnents of Belgium, IS+COL IS+COL IS+COLDenmark, Ireland and Japan, EIB,
FlNNlDA, NDF, NORAD, SIDA, andDBSA)
Project Preparation. A collaborative participatory approach was used in project preparation by MEWD/ZESCO that involved theaffected community groups, academic institutions (primarily INESOR), nine other donors and, to a lesser extent, intermediaryNGOs and local government (See Annex 13 for further details). This included:(a) The recommendations of the Power Sector Environmental Scoping Study which were based on an extensive consultation andinformation sharing process;lb) Public consultation that was carried out by ZESCO in the context of the Victoria Falls EA; and(c) The Gwembe-Tonga study which involved extensive consultation with the people affected by the Kariba project. This study wasconducted by INESORIn addition, IDA shared information and organized joint missions, where feasible, with other collaborating donors including CFD,DBSA, EIB, FINNIDA, NDF, NORAD and SIDA. Also, IDA missions visited most of the European donors to consult on projectpreparation.
Project Implementation. The approach to information sharing and consultation used during project preparation will be continuedduring project implementation and operation.
Sustainability:20. Key factors for project sustainability include: (a) restructuring of the electricity supply industry, specifically (i) agreement andimplementation of an action plan to follow up on the London Economics report ZAMBIA: Power Sector Reform Studv. The GRZhas set out its action plan in the Letter of Sector Policy submitted to IDA, and (ii) have a fully staffed and functioning EnergyRegulation Board; (b) raising and maintaining tariffs on cost-recovery levels through an independent incentive-based mechanismfor setting electricity prices; and (c) formalizing an economically and financially sound power sales agreement between the newowners of ZCCM/PD and ZESCO, which should consider efficiency tariffs without cross subsidies.
21. Critical Risks (see fourth column of Annex 1):Project outputs to development objectives
Risk Risk Minimization MeasureSector Reform. Government commitment to overall Given the need to ensure govermment commitment to refonn andrestructuring of the power sector may falter. establish sound regulatory institutions, the following measures were
required and were undertaken by negotiations: (a) GRZ to submit in itsLetter of Sector Policy an acceptable Reform Action Plan Schedule thattakes into account the recommendations of the London Economicsreport; (b) a fully functioning Energy Regulation Board and (c) bycredit effectiveness, the Hydropower Policy be in place.
ZESCO Commercialization and Institutional To mitigate this risk, the following measures were undertaken:Development. (a) (i) agreed with the GRZ/ZESCO on a Tariff adjustment strategy(a) Risk that GRZ's commitment to ZESCO's with an implementation schedule that includes (I) a satisfactory
commercialization may weaken and threaten ZESCO's ZCCMIZESCO power sales agreement; (II) a time-bound plan to raisecommercial and financial viability; tariffs to full cost recovery levels within two years; and (III) a lifeline
tariff for low-income households with a consumption level of no more(b) Risk that ZESCO does not carry-out the changes than 50 kWh per month; (ii) an action plan, based on a joint review ofrequired for commercialization. the SWEDPOWER tariff study, to adjust the tariff structure in line with
marginal cost by April 1998; and (iii) release of funds for the
13

transmission component, financed by IDA, will be linked to satisfactoryproject performance by the GRZ/ZESCO over its first two years. Inaddition, (iv) the Borrower shall establish a mechanism, acceptable toIDA, to clear outstanding arrears bi-monthly among parastatals andGovermnent Departments.
(b) (v) ZESCO will implement its manpower rationalization programand recommended company change processes; and (vi) ZESCO willcarry out a review of its performance contract with GRZ on an annualbasis and where targets have not been achieved, shall prepare fordiscussion with IDA and for implementation, an action plan to achievetargets.
Project components to outputsRisk Risk Minimization Measure
Delays in project implementation due to Beneficiary's Implementation of the project through a reduced number of contracts,inexperience, large number of components, complexity and provision of technical assistance in project implementationand multiple funding sources. (including the hiring of competent supervisory consultants) will
mitigate the risk. Careful planning and coordination between co-financing agencies will also be required.
Overall project risk ratingRisk
Sector reforms will not be sustained Release of fimds by IDA for the project's transmission component(about US$20 million) will be linked to satisfactory project performanceover its first two years. Performance indicators will be based on ZESCOcompliance with financial and institutional covenants.
22. Possible Controversial Aspects:Some Zambian tour operators would like to see Victoria Falls Power Station closed, as they believe it negatively alters the dry
season flow of the Falls lowering the aesthetic/tourist value of the Falls. However, the diversion of water in the dry season to theZimbabwe side of the Falls is largely due to geologic conditions. During the EA done to evaluate the problem there was extensiveconsultation with tour operators. Based on this consultation, the EA identified a series of actions to reduce any negative impact ofthe power station and its operation on the environment and aesthetics and, further, to take actions to enhance the Falls aesthetic andtourist appeal. These actions, which are part of the proposed Project under the rehabilitation of Victoria Falls, include: (i)developing a waste management and site restoration program to mitigate ZESCO's historic impact on the National Park area; (ii)relocating the majority of staff housing from the Falls to Livingstone and convert the Falls housing to tourist accommodation; (iii)relocating the intake siphon discharge and reconstruct the original steps to the Falls base; (iv) developing the 1938 power stationinto a museum and interpretive center, (v) developing and implementing a water management plan which optimizes powergeneration, aesthetic beauty for Victoria Falls and public safety; and (vi) initiating a monitoring and audit program to track projectprogress and implementation.
Block 4: Main Loan Conditions23. Effectiveness ConditionsPrior to effectiveness the following actions will have been undertaken:(a) the ZESCO Subsidiary Loan Agreement (SLA) will have been duly authorized or ratified by the Borrower and ZESCO and willbe legally binding upon the Borrower and ZESCO according to its terms;(b) the (cofinanciers) Loan Agreements for NORAD and SIDA would have been duly executed and all conditions precedent to theeffectiveness of the Loan Agreements fulfilled, other than those related to the effectiveness of the DCA;(c) the Project Agreement would have been duly authorized or ratified by ZESCO and be legally binding upon the Borroweraccording to its terms;(d) ZESCO will have hired engineering consultants to assist in the implementation of the following principal project components: (i)
rehabilitation of the Victoria Falls hydroelectric station; (ii) rehabilitation of the Kafue Gorge hydroelectric station; (iii) rehabilita-tion of the Kariba North Bank hydroelectric station; (iv) Kariba Dam safety activities; and (v) the transmission systemrehabilitation;
(e) ZESCO will have adopted a Project Implementation Plan satisfactory to IDA; and(f) GRZ will have promulgated its Hydropower Development and Transmission Line Policy.
14

24. Coditions of Disbursement* Releas of funds by IDA for the project's transmission component (about USS20 million) will be linked to satisfactory project
prfoanance over its first two years; and* Rdease of funds by IDA for the project's Gwembe-Tonga component wil be subject to conclusion of implementation
arran nts, satiaory to IDA.
25. CovenantsIn addition to the standard covenants covering auditing and record-keeping, the Project will use the following covenants:* The Borrower shall apply an automatic adjustment mechanism of tariffs acceptable to 1DA.* The Borrower shaU establish a mechanism, acceptable to IDA, to clear outstanding arrears monthly among parastatals and
Government Departments, and ensure that its dues to ZESCO would not exceed two months billing.* ZESCO shall carry out, with the participation of the Borrower, not later than December 1 of each year, an annual review of the
Perbrmance Contract under terms of reference satisfactory to IDA, and prepare an action plan to achieve the targets, if notachieved.
* ZESCO shall meet the following financial objectives: (i) for fiscal year commencing April 1, 1997, the borrower shall generatervenues to cover full operating expenses (including depreciation on a revalued asset basis); (ii) for fiscal years commencingApril 1, 1998 and 1999, generate revenues to cover full operating expenses (including depreciation on a revalued asset basis), networking capital increases other than cash, debt service and 5 percent of the average of its investment; (iii) for fiscal yearscommencing April 1, 2000 and 2001, generate revenues to cover full operating expenses (including depreciation on a revaluedasset basis ), net working capital increases other than cash, debt service and the equivalent of not less than 10% of the average ofits investment; and (iv) for fiscal year commencing April 1, 2002, generate revenues to cover full operating expenses (includingdepreciation on a revalued asset basis), net working capital other than cash, debt service and the equivalent of not less than 15%of the avcrage of its investment In addition, beginning in fiscal year April 1, 2000, ZESCO shall earn a return on equity of notless than II/a. Accordingly, ZESCO shall implement a tariff increase on April 1, 1998, to meet its FY98 financial objectives.
* The Borrower and the Association shall jointly review semiannually the adequacy of electricity tariffs.* The Borrower shaU submit by May 1 in each year commencing in 1998 ZESCO's draft rolling five year investment program and
ZESCO shaU adopt a power investment program for such Financial Year which shaU be satisfactory to IDA. Thereafter, ZESCOshall not carry out any power investment in excess of US$5 million which is not for the program.
* ZESCO shall, twice yearly, furnish to the Association the status of its billings and collections as of September 30 and March 31each year and will not alow its outstanding customer accounts to exceed 120 days of revenue in fiscal year commencing in 1998,90 days of revenue in fiscal year commencing in 1999, and 60 days in all succeeding financial years. ZESCO shall, according toagreed targets in the Project Agreement, reduce non-technical losses.
* ZESCO shall revalue its fixed assets annually in accordance with indices acceptable to IDA.* ZESCO shall implement by July 1, 1998 the agreed manpower rationalization plan.. ZESCO shall implement the agreed recommendations of the PCB Study, and the execution of interim protective measures by
June 30, 1998.* ZESCO will put in place guidelines for environmental review of projects and determine the types of projects which require ESU
approval or clearance by June 30, 1998.* ZESCO shall implement its disconnection policy. As of April 1, 1998, ZESCO will levy a late payment charge of 10 percent on
bills unpaid on the due date and will disconnect customers with bills outstanding for 60 days after the due date.
Block 5: Compliance with Bank Policies[x ] This project complies with all applicable Bank policies.[1 [The foUowing exceptions to Bank policies are recommended for approval: None. The project complies with all other
applicable Bank policies.]
Task Manager: Donal O'tVarBocar Tha-m Cu ry halliso omerant
15

Annex 1Page 1 of 4
Zambia: Power Rehabilitation ProjectProject Design Summary
Narratve Summary Verifiable Indicators Means of Verification Assumptions/Risks
CAS OBJECrmVE: Increased Annual real GDP per capita National statistics.eeomic rowth gowth
Development Objecdive: Impact Outcomes:1. Stable macro economy.
EffEimi reliable and 1. Energy and power supply is 1. Electricity demand forecastfincally viable power sysem meeting 100% of expected and ZESCO's generation 2. Continued deregulatoryedablisbed and meeting power domestic demand at efficient records. policies.d_mnd at leaodat. prices by 2001.
2. ZESCO's operational 3. Other infiastructure services2. Lncreased electricity records. are improved as well.coverage.
3. ZESCO's records. 4. Other conditions for growth3. Average system losses are created.reduced to 14% by 2000. 4. Consumer surveys.
5. Adequate mobilization of4. ZESCO's annual O&M cosL 5. Project Managemnent resources.
Records.5. ERR for components at start, 6. Adequate tariff increasesmid-term and at the end of 6. ZESCO's records & implemented.project intemational cost data.
6. Cost of supply. 7. ZESCO's financialstatements.
7. ZESCO's annual ROR onrevalued assets and selffinancing ratio. _
Outpdas: Proes Indicators:
1. Power sector reformed 1.1 Action plan implemented 1.1 Monitoring & supervision 1.1 Continued Governmentfor power sector restructuring of TA and policy dialogue. commitment to reform.1.2 Energy Regulation Board 1.2. ERB allowed to operateoperational (ERB). independently.1.3 Policy framework for 1.3. ERB staff adoptprivate sector participation in professionally sound practices.generation and transmission 1.4. NORAD and other donorsestablished. This includes providing additional technicalestablishing a Private Power assistance as agreed.Development Cell (PPDC) or 1.5 PPDC allowed to operateequivalent organization, effectively.1.4 Electricity tariff adjusted 1.6. Government providingbased on economic and adequate budget allocations.
2. ZESCO instional financial requirements. 2.1 Project implementationdevelopment incl. commercial documents. 2.1. Government commitmentoperation, and utility & to commercialization includingfinncial management 2.1 Company change program agreement set out in the
inplemented. Performance Contract with2.2 Manpower restructuring ZESCO.plan inplemented. 2.2 ZESCO management2.3 Staff appraisal scheme conumitmentimplemented. 2.3 NORAD and other donors2.4 Health awareness program provide additional technicaland life insurance scheme assistance as agreed.
3. Financial Sustainability of implemented. 3.1 ZESCO's audited fmancialZESCO. staternents. 3.1 ZCCM tariff negotiated at
3.2 ZESCO's management level to cover cost and give3.1 Tariffwhich cover costs accounts. return on equity.for all consumer categories, and 3.3 Auditors management 3.2 Price elasticity is low.gives a return on equity. letters. 3.3 Commitment by GOZ and3.2 Quick ratio of 1 or more. 3.4 Progress reports. ZESCO.3.3 Implementation and 3.4 Effective implementationconsistent application of of financial management andformula for automatic accounting systems.adjustment oftariffs. 3.5 Effective operation of
16

Page 2 of 4
3.4 Reduction of system losses. clearing mechanism for3.5 Collecions improving from Govemment debt coniset21 days to 60 days. application offoemula for3.6 Timely producion of automatic a4jutment oftarifs.montly management accounta. 3.6 QuaUified and competnt3.7 Establishmnt of cost staffin Finance De _tnt.centres for geeration,disribution and traision.3.8 Payment of dividends.
4. 1 Projec management unit 4. ZESCO commitnetestablishe4.2 Expeft hired to help with 4.1 Projed implementation
4. Project managanat project implementation, document.cpacity is ineaed
5.1 The ESU is caryring out 5.1. Maagemet committedtomonitoring ofthe sound environmental policieLenvironmental mitigation plan 5.1 Supervision mission & 5.2 Staff adapt professionally
5. The pefmane of ofthe project satisfictorily. environental reports produced sound practices.ZESCO's envionmental and by ZESCO.soca affais uit (ESU) incrying out envionental 6.1 Generation and
_ssesmta is inproved 6.1 # of substations refurbished transmission rehabilitated asper year. wel.6.2 # ofsubstations 6.1 Site visits & project
6. The distribution systems in constructed. implementation repots 5.2 The whole network isTuaka, Kitwe, Ndola 6.3 - kms of conductors maintained and operated inrehabilitated. reinforced. accordance with good industry
6.4-bks offaulty or practice.overloaded cables replaced.6.5 # oftrinsformers inIstalled.6.6 SCADA systemrefurbished.
7.1 30,000 meters installed by 7.1 Consumer acceptance.2001. 7.2 Tampering of meters6.2 No of load and power factor eliminated.indicators installed by 2001. 7.1 Site visits & project
7. Repcement and installation implementation records.of consumer mnets and power S. 16,000 km of transmissionfadtor indicators. lines rehabilitated by 2001. S. 1 Generation and distrbution
8.2 # ofsubstations rehabilitated as well.rehabilitated by 2001. 8.2 Adequate and timely
S. Transmission sytetm 8.3 PLC and radio link 8. 1 Site visits & project maintenance of the wholerehabilitated established. inplementation records. system.
9.1 9.1 Transmission andVictoria Falls: distribution rehabilitated as- civil stuctwures maintained well.- electro mechanical equipment 9.2 Adequate hydrology.
9. 3 hydro power plants refurbished. 9.1 Site visits & project 9.3 ZESCO provides adequatereshbilted (Victoria Falls, - protection and staff safety implementation records. funds for O&M expenditure.Kariba North, Kafiue Gorge). equipment rehabilitated.
- environmental action plan 9.4 Consumer demand exist.implemented.
Kariba North:- civil structures rehablitated.- electro mechanical equipmentrefurbished.
. protection and staffsafetyequipment rehabilitated.
Kafue Gorge:* civil structures rehabilitated- electromechanical equipmnetrehabilitated.
- staff safety equipmentrehabilitated.
10.1 Safe drinking wateravailable. 10.1 GwembaTonga
17
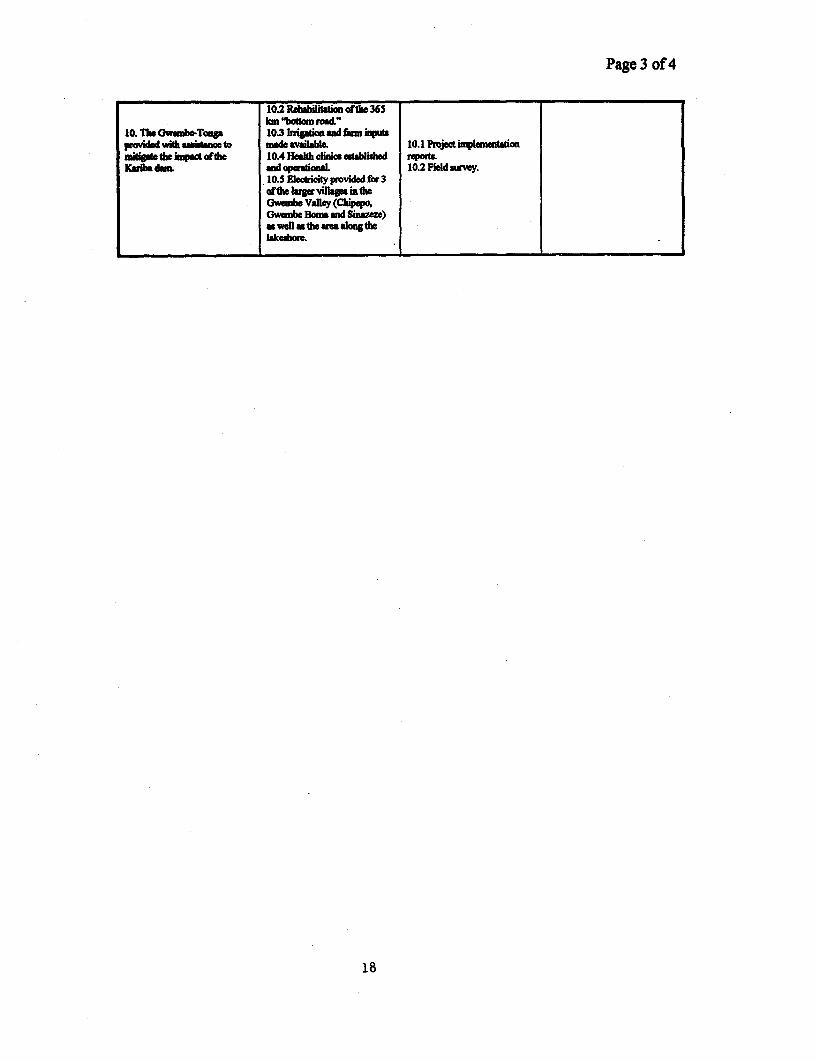
Page 3 of 4
10.2 Rbabdbaitaion of th 365km "botm road."
10. Te Owube-To. 103 bgaion and farm _qmtspovide wid amianceto b ade navaial 10.1 Proje inplemntationsiopge,tde impa ofthe 10.4 Hea cinims edtbihed epoutKRiha dm and opetiol 10.2 Fidd swrvey.
10.5 Eeddciiyprovided for3ofthe kare ib a n do
wenbe Valey (Caipepo,Gwembe Bma and Siam)saswelassteareaalongthe
18
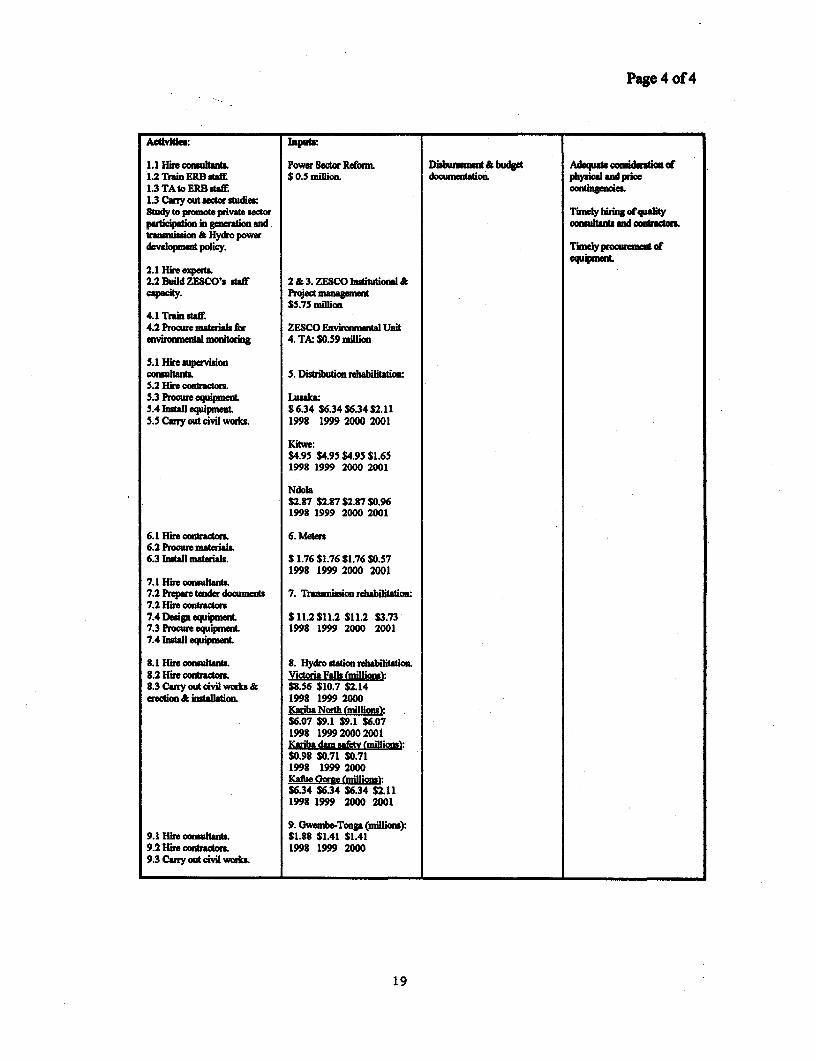
Page 4 of 4
1.1 Hire couaknt. Powe Sector Refom Disbuemet bdg Adeqa conidr Of1.2 Train ERB staf $ 0.5 million docea phscald lce13 TAto ERB saff. contigenie1.3 Cay out sector sudi"s:Study to promte prvate sectr T'nUely hirigof quaitparicipation in gneraiond conslat and conranostrnmission & Hyho powerdevlpme policy. imely prumet of
2.1 Hire epeSrt2.2 Build ZESCO's staff 2 & 3. ZESCO Intuona &
c. Proje _ managematS5.75 million
4.1 Train staE4.2 Proue matwiala for ZESCO Enviromental Unitenviromnen motoring 4. TA $0.59 milLon
5.1 Hire supervisionconultant 5. Distrniuon rehabilitation:5.2 Hir con_rator5.3 Proueequipment Lus1ka:-5.4 Install equippment S6.34 $6.34 $6.34 $2.115.5 camyoutcivilwrbk. 199S 1999 2000 2001
Kitwe:$4.95 $4.95 $4.95 S1.65199S 1999 2000 2001
Ndola$2.87 $2.87 $2.27 $0.961992 1999 2000 2001
6.1 Hire contrctor 6. Meters6.2 Procure mateil6.3 Inall mataials. $ 1.76 $1.76 $1.76 $0.57
1992 1999 2000 20017.1 Hire consuhantL7.2 Preqa tendr documnts 7. Transmission hbiation:7.2 Hire conrator7.4Depignequipent $11.2 $11.2 £11.2 $3.737.3 Procre equipment 1998 1999 2000 20017.4 nsbtall equipment
.1 Hire consulant 8. Hyfro station rehabiltation.8.2 Hir ontactors Victoria Fills (milions)S.3Ca"outcivilworks& $8.56 $10.7 $2.14erection & insalltion. 1998 1999 2000
Kaina North (millions):$6.07 $9.1 $9.1 $6.071998 1999 2000 2001Kariba dam safety (millions):$0.98 $0.71 $0.711998 1999 2000Kafue Goe (miions:$6.34 $6.34 $6.34 $2.111998 1999 2000 2001
9. Gwembe-Tonga (milions):9.1 Hire conutant. $1.88 $1.41 $1.419.2 Hire conrat_ 1998 1999 20009.3 Cayout cvil work
19
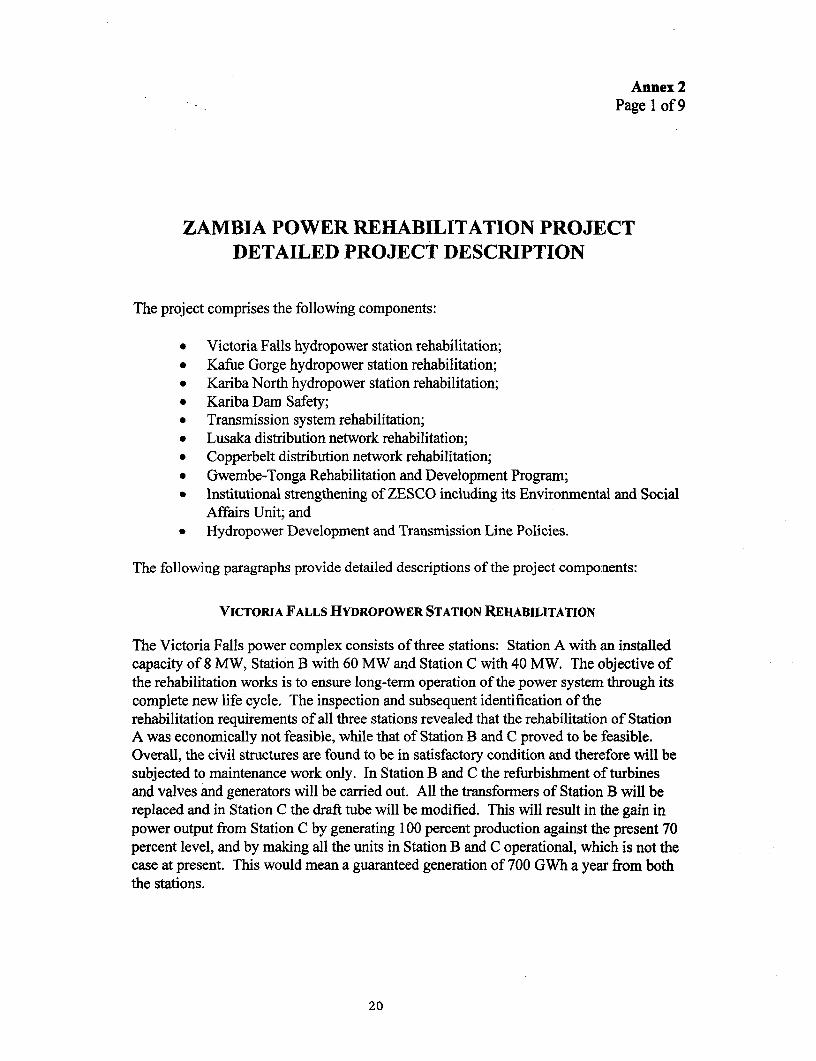
Annex 2Page 1 of 9
ZAMBIA POWER REHABILITATION PROJECTDETAILED PROJECT DESCRIPTION
The project comprises the following components:
* Victoria Falls hydropower station rehabilitation;* Kafue Gorge hydropower station rehabilitation;* Kariba North hydropower station rehabilitation;* Kariba Dam Safety;* Transmission system rehabilitation;* Lusaka distribution network rehabilitation;* Copperbelt distribution network rehabilitation;* Gwembe-Tonga Rehabilitation and Development Program;* Institutional strengthening of ZESCO including its Environmental and Social
Affairs Unit; and* Hydropower Development and Transmission Line Policies.
The following paragraphs provide detailed descriptions of the project components:
VICTORIA FALLS HYDROPOWER STATION REHABILITATION
The Victoria Falls power complex consists of three stations: Station A with an installedcapacity of 8 MW, Station B with 60 MW and Station C with 40 MW. The objective ofthe rehabilitation works is to ensure long-term operation of the power system through itscomplete new life cycle. The inspection and subsequent identification of therehabilitation requirements of all three stations revealed that the rehabilitation of StationA was economically not feasible, while that of Station B and C proved to be feasible.Overall, the civil structures are found to be in satisfactory condition and therefore will besubjected to maintenance work only. In Station B and C the refurbishment of turbinesand valves and generators will be carried out. All the transformers of Station B will bereplaced and in Station C the draft tube will be modified. This will result in the gain inpower output from Station C by generating 100 percent production against the present 70percent level, and by making all the units in Station B and C operational, which is not thecase at present. This would mean a guaranteed generation of 700 GWh a year from boththe stations.
20

Annex 2Page 2 of 9
This component also includes an environmental mitigation plan (below), that partlyreflects the location of the power plant in the Mosi-Oa-Tunya National Park and adjacentto Victoria Falls - a UNESCO World Heritage Site:
(a) development and implementation of a waste management (includingPCBs) and site restoration program;
(b) non-essential staff relocation, the majority of whom will be located inLivingstone and conversion of on-site housing to medium-class touristaccommodation;
(c) relocation of the 48 MW intake scour siphon discharge and reconstructionof the original step to the Falls base;
(d) development of Station A into a Power Station Museum and InterpretiveCenter;
(e) development and implementation of a water management plan whichoptimizes power generation and aesthetic beauty of viewing the Falls;
(f) construction of a tourist trolley; and
(g) technical assistance for project supervision.
KAFUE GORGE HYDROPOWER STATION REHABILITATION
This 900 MW plant with six units of 150 MW each was developed in two stages. Thefirst stage was commissioned in 1971-72 with the operation of four units, the secondstage added two units in 1976-77. Although normally a station of this age does notrequire major refurbishment for at least another 10 years, the March 1989 fire and lack ofadequate maintenance has reduced the energy production far below its designed level.The average annual production of energy is around 5,000 GWh whereas the designedgeneration is calculated to be around 7800 GWh. The present rehabilitation work willincrease the plant availability.
The civil rehabilitation work will include:
* Removal of aquatic weeds;* Stabilization of hillsides by grouting and rock bolts;* Corrosion protection painting of the spillway gates;* Repair of tunnels, shafts in the power house;* Rehabilitation of the cylinder gates;* Upgrading of the weed boom matrix;* Replacement of a floating boom; and
21

Annex 2Page 3 of 9
* Survey of the sediment delta deposits in reservoir.
The electromechanical rehabilitation works will include:
* Refurbishment of the turbines and generators;* Replacement of four single phase transformers;* Overhaul of the 330 kV switchgear;* Replacement of the 17.5 kV switching station;* 330 kV busbar protection system installation; and* Rehabilitation of the relay protection system.
To ensure the safety of plants and personnel, the following rehabilitation works willbe executed:
* Installation of safe escape routes;* Noise reduction measures;* Installation of effective ventilation system; and* Refurbishment of fire cell partitioning.
Technical assistance:
* Technical assistance for project supervision.
KARIBA NORTH HYDROPOWER STATION REHABILITATION
The project component is limited to the refurbishment of the tunnel and the power stationlocated in the northern bank of the Zambezi River (Zambian side). The Kariba damsafety program will be handled separately by the Zambezi River Authority.
Based on the detailed inspection of the power plant including the diagnostic testing of allthe 150 MW four units and on the basis of technical audit carried out in February 1996,the consultant has identified the essential elements of the plant rehabilitation. Therehabilitation is aimed at increasing the availability of units as per original design andextending the economic life of the plant.
The civil rehabilitation work will include:
* Repair of the intake deck and machine hall;* Repair of concrete erosion of the penstock and tailrace tunnels;* Repair of the penstock drainage gallery and the penstock concrete;* Mitigating the effects of the water leakage near the busbars; and* Replacement of duct.
22

Annex 2Page 4 of 9
The refurbishment of the electromechanical equipment will include:
* All the water turbines;* All the generators;* The transformers, guidevanes and governors,* Replacement of control instruments;* Replacement of the trash rake gantry and intake emergency gate gentry;* Repair of isolation valves;* Repair of the draft tube steel lining;* Replacement of the tailrace stopbeams; and* Repair of the mobile crane.
To ensure staff safety, the following rehabilitation work will be done:
* Replacement of the chilling plants;* Replacement of the air conditioners and smoke ventilation in the turbine hall;* The refurbishment of fire protection systems; and* Repair of the power station lift.
Technical assistance:
* .Technical assistance for project supervision.
KARIBA DAM SAFETY
T'he rehabilitation works required in connection with dam safety are:
* Constructing and strengthening the concrete mat downstream and adjacent tothe arch dam with deep anchoring, grouting and concrete toe;
* Providing a developed plunge pool downstream;* Replacing hydromechanical and electrical systems; and* Rehabilitating of stop logs guides.* Technical assistance will also be provided for project supervision as well as
for the preparation of an emergency preparedness plan (EPP). In addition, apanel of experts (POE) will oversee the safety aspects of the work on theKariba and Kafue Gorge dams.
TRANSMISSION SYSTEM REHABILITATION
The rehabilitdtion work covers a large area of the ZESCO transmission system. The total330 (220 kV) line coverage is 2,500 km and 66/132 kV coverage is 3,500 km.Substations in the South, Central, Lusaka and Copperbelt regions will be rehabilitated.The rehabilitation work in telecommunications will be carried to improve system
23
Annex 2Page 5 of 9
operation. All the proposed protection measures will be compatible with the supervisingmonitoring systems.
The general rehabilitation work to be carried out with respect to the high voltage linesand towers will include:
* Re-establishment of the earthing system;* Replacement of the missing members of the towers;* Replacement of the damaged insulated discs;* Repair of the deteriorating concrete in tower foundation; and* Application of a protection paint coating on the towers.
The substations age varies from 15 to 20 years. Therefore, either overhaul or replacementof various equipment in substations such as circuit breakers, battery system, compressorswill be taken up. Construction of oil pits will be also carried out. The control andprotection equipment in Kabwe, Kafue, Kitwe, Leopard's Hill, Luano and Pensulosubstations will be rehabilitated. In the 132 kV system, the control and relay protectionsystem in Coventry Street, Leopard's Hill and Roma substations will be refurbished.Similar rehabilitation works will also be carried out in the 88 kV and 66 kV systems.
Rehabilitation of the transmission system will increase reliability through reduction inoutages and unserved energy. Some loss reduction in transmission is also anticipated.
Technical Assistance
Technical assistance will be provided for project supervision.
DISTRIBUTION NETWORK REHABILITATION
The lack of reliability in supply along with capacity deficits affect the major distributionsystem of ZESCO, which includes the Lusaka region and Copperbelt areas of Kitwe andNdola. The former results in numerous unplanned outages while the latter causesvoltage fluctuations. Rehabilitation of the distribution system in these areas is aimed atimproving the voltage levels and reducing the unplanned outages and thereby improvingthe quality of supply.
Lusaka distribution system rehabilitation:
Almost 45 percent of switchgear in the substations of this area will be replaced and 43percent of power transmissions will be reinforced. The SCADA system will berefurbished. Five new 33/11 kV substations will be constructed and reinforcement workin cables and lines will be carried out. Distribution transformers will be procured toreplace/add in the substations. The reduction in technical losses from 132 kV to the
24

Annex 2Page 6 of 9
consumer level is expected to decrease by 2 percent over project life. Technicalassistance for project supervision will be provided.
Kitwe (Copperbelt) distribution system rehabilitation:
The rehabilitation of the distribution system of this industrial area will include thereplacement of all obsolete switchgear, reinforcement of the 33 kV network, replacementof defective 11 kV cables and construction of the new primary substation to feed theairport and the growing surrounding industries. The work will include:
* Replacement of about 120 switchgears;* Construction of a new 66/11 kV primary substation;* Elimination of overloading the 33 kV system; and* Replacement of faulty and overloaded lines.
The rehabilitation work will also enable the system to supply power to new consumers,expected to increase by 3 percentper annum during the project life. Technical losses areexpected to decrease by 1.5 percent over the project life.
Ndola (Copperbelt) distribution system rehabilitation
The Ndola area is expected to face significant growth in the next few years. This growthin demand will be addressed by the construction of new primary substation at Mushiliand by the reinforcement of the cable and lines rehabilitation. All the faulty 11 kVunderground cable will be replaced.
The rehabilitation work will result in the:
* Replacement of 47 switchgears and 8 ring main units;* Replacement of 2.5 km of 11 kV cable and 68 km of LV line;* Construction of the Mushili substation, including 40 km of 33 kV line, 3 km
of 11 kV cable, and 30 km of 1 1 kV line; and* Establishment of a SCADA system including a control center on Depot Road
conmected to the Skyways, Pamodzi, Depot Road and Mushili substations.
The rehabilitation work will also enable the system to meet the increasing demand, whichis expected to increase by 2 percent per annum. The reduction in technical losses isassumed to be 1 percent due to the project.
Technical assistance for the supervision of the two Copperbelt rehabilitation (Kitwe andNdola) projects will be provided under one contract.
25

Annex 2Page 7 of 9
Loss reduction in the Lusaka area:
The network reinforcement program will have a significant effect on the technical losses.The reduction in the commercial losses will be obtained:
* By the installation of prepaid or standard meters for unmetered householdconsumers;
* From the replacement of unreliable meters; and* From the installation of maximum load and power factor indicators for large
consumers.
It is expected that the metering program will also affect the energy consumption, which,at present, is quite significant. An appropriate education program on energy conservationwill also be launched. About 30,000 domestic meters will be installed. Technicalassistance will be provided for project supervision.
GWEMBE-TONGA REHABILITATION AND DEVELOPMENT PROGRAM:
The construction of the Kariba Dam on the Zambezi river between then Northern andSouthern Rhodesia in 1958 required the resettlement of 57,000 Gwembe-Tonga peoples;34,000 of these were resettled on the north bank -- now Zambian side. In retrospect, it isclear that the resettlement was not sufficiently well planned or well implemented.Consequently, the socio-economic and local environmental conditions of the resettleesand resident hosts have deteriorated to the point where a rehabilitation of the lands andsocial structures will be undertaken by Zambia. This component of the project aims atimproving the life of affected people living in Gwembe valley and its activities are basedon a consultative survey and study of the region prepared by the Institute of Social andEconomic Research (INESOR) of the University of Zambia. The component will balanceinfrastructure needs with food production activities.
* Roads: rehabilitation of the "bottom road" that connects the threeresettlement districts (365 km);
* Water resources development: water quality survey; supply improvementmeasures including tubewells and small dams; and a pilot program for lowcost treatment of water;
* Land use: development of recession agriculture in Kariba lake drawdownareas; a pilot rain harvesting project; and agricultural extension activitiesregarding cropping patterns, grazing, small-scale irrigation, pest control andstorage of food grains -- a fund will be created to support micro-projectsdealing with land use;
* Health: Construction and renovation of health clinics, programs for malaria,bilharzia, cholera and HIV/AIDS; and
26
Annex 2Page 8 of 9
* Rural electrification: Provision of service to three of the large villages(Chipepo, Gwembe Boma and Sinazeze) as well as the area around the lakeshore.
ZESCO INSTITUTIONAL STRENGTHENING
Based on the studies commissioned to identify. the major areas where actions are neededto strengthen ZESCO, the following activities will be undertaken under this component ofthe project:
* Implementation of a company-change-process project which will result indevelopment of new company standards, implementation of a corporatesafety platform, introduction of job guarantee mechanism thereby introducingcreativity, innovation, accountability and risk taking by the staff;
* Establishment of a training center in Ndola including the construction of anew building, supply of equipment (including the setting up of a sub-stationfor training purposes) and the setting up of a Technical Library;
* Introduction of recruitment and assignment plans;* Implementation of manpower planning;* Implementation of Performance Appraisal Scheme;* Implementation of changes to the organization structure;* Preparation/revision ofjob descriptions;* Outsourcing of non-core ZESCO activities, including construction and
transport;* Implementation of project management training and core skill training;* Implementation of health awareness program and life insurance scheme;* Strengthening of capacity of ZESCO's Environmental and Social Affairs
Unit through the provision of training and technical advisory services;* Training in dam safety monitoring; and* Carrying out a feasibility study, by ZESCO engineers (with expatriate
support used on an as and when necessary basis), to enhance the hydropowerengineering capability of ZESCO.
The ZESCO Institutional Strengthening Program will be anchored in the Directorate ofHuman Resources who will be supported by an advisor, located in Lusaka for three years.In addition, an advisor will be hired, for two years, to assist in the establishment of theNdola Training Center.
In view of the diverse nature and number of project components, a project managementexpert will be hired to assist the Project Director implement the project effectively. Inaddition, the project well support the hiring of a Financial Advisor by the FinanceDirectorate. The Gwembe-Tonga project will be facilitated by a establishing a ProjectManagement Unit (PMU) located in that region. The Unit will be supported by an
27

Annex 2Page 9 of 9
advisor to the PMU manager as well as technical experts in roads, water, land/agriculture,health and electrification.
ZAMBIA'S HYDROPOWER DEVELOPMENT AND TRANSMISSION LINE POLICIES
The goal of this technical assistance component is to encourage and facilitate privatesector participation in Zambia's power sector, through developing a "one window"process, an efficient procurement process and enabling framework. To this end, GRZrecently developed its Hydropower Development and Transmission Line Policies. Theactivities undertaken in this component of the PRP will support the effectiveimplementation of the Policies and are listed below:
* Develop the integrated environmental assessment for the Kafue basin, in thecontext of developing Kafue Gorge Lower (KGL);
* Create the organizational framework and procedures for an effective one-window process;
- Develop standard legal documentation necessary for projects pursuant to thePolicies;,
- Develop documentation for Request for Proposal packages for a specifichydropower facility (KGL) and transmission line (Tanzania-ZambiaInterconnector);
* Organize and present Zambia's policies and project proposals to prospectiveprivate developers and investors;
* Provide technical assistance to: a) develop an enabling legal framework forthe implementation and operation of the Hydropower and TransmissionPolicies and b) Zambia's recently formed Energy Regulation Board (ERB) tomeet immediate regulatory needs and to effectively implement the Policies inthose matters where ERB action is involved; and
* Develop the proposed regime for the granting and protection of water rightsnecessary to support the Hydropower Policy, including legislative andadministrative amendments of water rights regime insofar as necessary.
28

Annex 3
ZAMBIA POWER REHABILITATION PROJECT
ESTIMATED PROJECT COST
Local Foreign TotalProject Component US$ Million(i) Hydropower Station Rehabilitation
(a) Kafue Gorge 1.71 19.33 21.04(b) Victoria Falls 0.67 19.18 19.85(c) Kariba North 1.27 25.52 26.79(d) Kariba Dam Safety 0.45 2.55 3.00
(ii) Distribution System Rehabilitation(a) Lusaka 4.14 24.05 28.19(b) Copperbelt (Kitwe) 1.97 10.35 12.32(c) Copperbelt (Ndola) 1.45 7.62 9.07(d) LossReduction -- 3.10 3.10
(iii) Transmission System Rehabilitation 1.36 32.62 33.98(iv) Gwembe-Tonga Environmental Mitigation 1.43 5.51 6.94(v) Environmental and Social Affairs UnitStrengthening 0.5 0.5(vi) ZESCO Capacity Building and Project
Management 4.88 4.88(vii) Implementation of Hydropower and
Transmission Policies 2.04 2.04
Total Baseline Cost 14.45 157.25 171.70Physical Contingencies 1.44 15.72 17.16Price Contingencies 1.11 11.57 12.68PPF Refinancing -- 2.05 2.05
Total Project Cost 17.00 186.59 203.59Interest during Construction 19.84 -- 19.84
Total Finances Required 36.84 186.59 223.43
29
Annex 4Page 1 of 7
ZAMBIA POWER REHABILITATION PROJECTECONOMIC ANALYSIS
Table 4.1: Cost Benefit Analysis Summary(US$ million of 1997)
Discounted Project Flows Distributional Impact*(at 12% to mid-1997)
Economic Financial Poor FiscalBenefits 573.6 519.0Cost 413.5 414.3Project Indicators* NPV (12%) 160.1 104.7 14.7 55.5* IRR 29.0% 21.8% 9.2% 34.7%Probability of Achievement 38% 31% 48% 46%Intemal Rate of Return with a 75% 27.5% 17.3% 8.6% 32.4%Probability of Achievement I_I* Thesefigures correspond to the present value of the net benefits accruing to the poor and to thetreasury, in US$ millions and in percentages of the total net present value of the project, respectively.
A. Overview: The economic analysis was conducted to verify that the Project meets itsobjectives better than its alternatives, and that the benefits justify the costs. The Project comprisesgeneration, transmission, and distribution rehabilitation components.
Cost-benefit analysis was applied sequentially, starting with a simple analysis usingborder prices and conversion factors (CF). We assumed a conservative shadow wage rate of 0.50of the ongoing wage rate for unskilled labor, and a standard conversion factor of 0.875. Thepurpose of the analysis was to produce the project's economic indicators, i.e., ERR and the netpresent value (NPV) of the project. For the NPV calculation, the social opportunity cost of capitalin Zambia, estimated at 12%, was used.
B. Economic Analysis: In what follows we explain first the background of the economicanalysis for the generation rehabilitation subprojects, then for the transmission and last for thedistribution components.
Generation: These components have three basic objectives: (a) to increase supply to meet in themost economical manner the forecast increment in demand by increasing the plant's life andavailability; (b) to improve efficiency by increasing operational performance; and (c) to improvereliability of supply. The rehabilitation thus delays new expansion projects, saves operating costs,and improves quality of supply. The economic analysis first verified that rehabilitation is the leastcost option by comparing the costs of the alternatives to each generation component: (a) KaribaNorth Bank power station; (b) Kafue Gorge power station; and (c) Victoria Falls power station.Second, once the least cost options were determined, the economic analysis verified that therewere enough benefits to justify the commitment of resources to each component.
The market analysis and forecasts were conducted by ZESCO/EKONO. The demandforecasts are based on the most likely evolution of the main explanatory variables: income andoutputs, electricity tariffs, number of connections, etc. For the analysis, the high growth scenarioin ZESCO's twenty year master plan has been used for our base case. Under this scenario,electricity requirements grow at 4.4 percent per annum. This is consistent with IDA's high/basecase projections for Zambia's GDP growth (4%-5% per annum over the period 1996-2006) asset out in the CAS,, dated June 25,1996.
30
Annex 4Page 2 of 7
The least cost option was determined by simulating the alternative expansion planswithin the interconnected system with the WASP model. For each subproject, alternativetechnical specifications, scales and timings were appraised. The least cost analysis indicated thatin all three cases, the proposed subprojects were cheaper than their alternatives by a margin of 5to 10 percent.
Based on the WASP results, a cost-benefit analysis was conducted for each least costoption. On the cost side, are the investment costs and the operation and maintenanceexpenditures. On the benefit side, are the following: (i) willingness to pay (WTP) for theadditional supply (i.e., sales plus consumer surplus associated with the net addition to supplymade possible by each subproject); (ii) the system operation and maintenance costs without thesubproject, which correspond to the resources saved by increasing the availability, operatingefficiency and life of existing assets; and (iii) the improvement in the quality of supply forexisting consumers. Table 4-2 below present a summary of the discounted cost and benefit flowsfor each subproject.
Table 4.2: Discounted Cost Benefit Flows of Generation(US$ million of 1997)
Victoria Falls Kafue Gorge Kariba North Total HydroRehabilitation
C o s t s 41,149 40,076 40,038 121,263* Project Investment 16,642 15,569 30,364 62,575* O&M Costs 24,507 24,507 9,674 58,688Benefits 56,765 56,560 72,046 185,372* Willingness to pay
O Sales 38,162 38,045 53,549 129,7560 Consumer Surplus 1,262 1,257 3,052 5,571
* System Gen. O&M Savings 2,032 2,117 1,147 5,296* Reliability improvement 15,310 15,142 14,297 44,749Total net benefit 15,617 16,484 32,008 64,108ERR % 31.5% 36.9% 50.1% 40.3%Note: Discounted at 12% to mid-1997.
Transmission: The benefits for the "transmission rehabilitation component" are: first, toincrease reliability, through a reduction in outages and unserved energy; second, to increasecapacity and thus prevent supply shortages; and, third, to reduce transmission losses. Theestimates of unserved energy were provided by ZESCO and NorConsult. The expected values ofunserved energy are US¢ 98 per kWh for industry and mining, US¢ 25 per kWh for residentialand agriculture users, and US¢ 49 for services. The increase in net electricity supply wasestimated from the consumers' willingness to pay. The elasticities for each customer class wereassumed based on international experience and the work done by SwedPower. The reduction intransmission losses was valued at the long-run marginal cost (LRMC) estimated by SwedPowerin their revised case (LRMC2). Table 4-3 presents these parameters, while Table 4-4 shows asummary of the discounted cost and benefit flows of the transmission component.
31
Annex 4Page 3 of 7
Table 4.3: Tariffs, LRMCs, Unserved Energy Costs and Elasticities(US$ per MWh)
Users Tariff LRMC UEC ElasticityResidential 24.62 122.40 246.19 -0.20Industrial 30.41 64.04 984.75 -0.50Services 29.14 84.05 492.37 -0.40Agricultural 24.00 65.88 246.19 -0.20Mining 21.00 23.20 984.75 -0.20Weighted Total 21.02 43.31 719.79 -0.22System LRMCsGeneration 16.50Transmission 19.30Distribution 60.20
Table 4.4: Discounted Cost Benefit Flows of Transmission(US$ million of 1997)
Total Hydro RehabilitationCosts 67,411* Project Investment 27,958* Gen. O&M 4,589X System Costs 34,864Benefits 92,343* Willingness to Pay 43,443* Loss Reduction 1,354* Reliability Improvement 47,546Total net benefit 24,932ERR % 19.4%Note: Discounted with a 12% rate to mid-1997.
Distribution: The distribution rehabilitation components intend to increase net capacity, reducelosses and improve reliability in the main urban centers of Lusaka, Kitwe and Ndola. Accordingto census figures, these cities account for about 50 percent of the urban population of Zambia,Lusaka accounting for 23%, Kitwe and Ndola with 12% each. The additional capacity providedby the project will enable to meet the increased demand by consumers, which was valued at theirWTP. The reduction in losses was valued at the LRMC. The improvement in reliability was alsovalued at the expected unserved energy and their values per user class as stated above. Table 4-5shows a summary of the discounted cost and benefit flows of the transmission component.
32
Annex 4Page 4 of 7
Table 4.5: Discounted Cost Benefit Flows of Distribution(US$ million of 1997)Lusaka Ndola Kitwe Total Distribution
RehabilitationC o s t s 80,671 28,097 25,823 134,590* Project Investment 23,013 7,434 10,080 40,527* O&M 2,834 1,223 1,658 5,715* System Costs 54,824 19,439 14,084 88,348Benefits 125,632 46,292 33,701 205,625* Willingness to pay
0 Sales 120,944 44,194 32,508 197,646O Surplus 686 1,565 1,006 3,257
* Loss Reduction 1,649 292 90 2,031* Reliability. improvement 2,353 241 97 2,691Total net benefit 44,960 18,196 7,878 71,034ERR % 28.1% 36.5% 20.1% 27.7%Note: Discounted at 12% to mid-1997.
C. Risk and Sensitivity Analysis: A risk and sensitivity analysis was undertaken, first, toestimate the probability of occurrence of each project indicator, and, second, to evaluate theimpact on the ERR to changes in the key factors affecting the cost and benefit flows. The resultsindicate that the proposed investments have attractive and robust economic indicators. Forexample, the probability of getting at least (or higher) 31.5 percent ERR for Victoria Falls is 47percent. Since this probability might not be acceptable to all investors, we thus estimated theERR that would be obtained with a certainty of 75 percent, which for Victoria Falls is 25.7percent. Similarly, as Figure 4.1 below shows for Victoria Falls, we can state with a 90 percentcertainty that the ERR is in the range between 18.5 percent to 42.2 percent.
Forecast: ERR
500 Trials Frequency Chart 0 Outliers.030 - 15
.023 11.2
:i.01575
.00 i -A7 5 Q
.000 810.0% 20.0% 30.0% 40.0% 50.0%
Certainty is 90.00% from 18.5% to 42.2% %
Figure 4.1: Frequency Distribution of the ERR of Victoria Falls
33

Annex 4Page 5 of 7
The sensitivity analysis also confirms that the subprojects have robust economicoutcomes. Table 4-6 summarizes the main changes in the cost and benefit streams of thesubprojects for their ERRs to drop to the 12 percent benchmark rate.
Table 4-6Summary Results of the Sensitivity Analysis:
Percentage (%) Increases in Costs or Reduction in Benefits for a 12 Percent ERRSubproject Project Investment & System WTP Resource Savings Reliability
Op. Costs Costs Improvement
GenerationVictoria Falls 38 59 -40 -55 -102
Kafue Gorge 41 63 -42 -58 -109Kariba North 80 85 -57 -83 -85
Transmission 77 72 -56 -1841 -52Distribution
Lusaka 127 82 -37 -2727 -1911Ndola 210 94 -40 -6234 -7544Kitwe 67 56 -24 -8727 -8164
Generation Sensitivity Analysis: The 100%- . ...sensitivity analysis shows that the * _._ l lproposed generation investments are 7InxfEti1 I,< ---
Costattractive. Figure 4.2 displays the; 50%- I ... C.......
results for Kariba. The figure displays # 25% ..................in the Y axis the changes in each of the 'cost and benefit streams. The X axis *s 0% . . . . . . * ,Bpresents the resulting ERR with those ' -25% -------------------changes. The point where the curvesintersect along the X axis corresponds - -to the estimiated 50.1 percent ERR. The ~-76..nbflgilIt"-ERR would not drop below our -100%-Svings £- . !-Saigbenchmark rate of 12% unless: (a) Eonomic Rates of Retuminvestment costs increase more than80%; (b) system costs associated with Figure 4.2: Sensitivity Analysis of Karibathe net increase in supply/demandincrease more than 85%; (c) the tariffdeclines more than 57%; (d) the LRMC declines more than 83%; or (e) the value of unservedenergy drops below 85%. When we only consider the additional sales made possible by thissubproject (excluding consumer surplus), the project still is attractive with an ERR above 40percent.
Transmission Sensitivity Analysis: Figure 4.3 details the sensitivity results for the transmissionsubproject, the largest cost component within our project. The point where the curves intersectalong the X axis corresponds to the 19.4 percent ERR calculated for this component. The ERRwould not drop below our hurdle rate of 12% unless: (a) investment costs increase more than75%; (b) system costs associated with the net increase in supply/demand increase more than70%; (c) the tariff declines more than 55%; or (d) the value of unserved energy declines morethan 50%. The benefits regarding loss reduction are negligible.
34
Annex 4Page 6 of 7
Distribution Sensitivity Analysis: The 100% a - .
sensitivity analysis indicates that the *-b-*-l el Mbdlproposed investments in Lusaka, Ndola 75%- , ,Systeco,st,s,-.... I Riatilityand Kitwe are attractive and robust. ' 50% ..EFigures 4.4 illustrates these results with 9 25% .-.-.-... /i-.-.- --.-the sensitivity analysis for Lusaka. The X
*S 0%.ERR of Lusaka would not drop below 2 2 . 3% 5 9% 14% * 38%our hurdle discount rate of 12% unless: ' -25°%h.....3%.5%. 9°h. 14/;..38Yo(a) investment costs increase more than i125%; (b) system costs increase more . ..than 80%; or (c) tariffs declines by -75%--Loss '
more than 35%. The project continues -100% reducyii ,. cp,stto be attractive even if we do not Eonomic Rates of Retumconsider the benefits from reliabilityand loss reduction. Figure 4.3: Sensitivity Analysis of Transmission
D. Financial Analysis: The financial 100% .-.. - Inv .t.n..analysis was based on the cost and * costprices faced by ZESCO. In all cases 75/ . .... . .the financial outcomes were below the O 50°/ ... .../economic ones, since the financial 25%.costs include local taxes (which the .economic costs do not) and the a 0% .
3% 6% 10%/ 538>..economic benefits include consumer 2 .25% ----------------- ...surplus and reliability benefits (which _.the financial benefits do not). The WT P
results of the analysis indicate that all -75% --- ---. -.--- ReHab'li- |b.t1
subprojects have financial rates of *10% 1 .benefit............... *.return (FRR) higher than the hurdle of Eonomic Rates of Return10 percent.
We also conducted a risk analysis to Figure 4.4: Sensitivity Analysis of Lusakathe financial outcomes. The resultsindicate that these subprojects are financially robust. We can state, as Figure 4.5 shows forVictoria Falls, with a 60 percent confidence that the FRR lays between 1 0. 1% and 13.6%.
35 -

Annex 4Page 7 of 7
Forecast: FRR
500 Trials Frequency Chart 1 Outlier.030
023 11.2
2:1 ~~~~~~~~~~~~~~~~~-n
F.015 7.5
.008 1 l 3.75
6.0% 8.8% 11.5% 14.3% 17.0%Certainty is 60.00% from 10.1% to 13.6% %
Figure 4.5: Frequency Distribution of the FRR of Victoria Falls
E. Distribution Analysis: Table 4-7 summarizes the results of the distribution analysis. Theanalysis shows that the income and fiscal distributional impacts of the overall project are positive.The distribution coefficient (net benefits to unskilled labor and poor residential users as aproportion of the project's net benefits) amounts to 9 percent, while the fiscal coefficient (netfiscal revenue as a proportion of project's total net benefits) is 35 percent. The risk analysissuggests that with a 75 percent certainty, the likely distribution coefficients would decline to 7percent and 26 percent, respectively.
Table 4-7: Summary Distribution Analysis (US$ thousand)Private Sector Public Sector Nef
Unskilled UsersLabor Non-poor Poor Taxes Utilities
CostsInvestment costs 3,282 1,217 (135,559) (131,060)O&M 1,728 641 (71,361) (68,993)System Costs 8,895 (8,895) (213,491) (213,491)BenefitsIncreased sales 61,758 308,791 370,549Consumer surplus 9,053 72 9,124Resource savings 98,959 98,959Improved reliability 88,448 745 828 4,965 94,986Net benefit 13,9051 97,501 817 55,548 (7,696) 160,075Distribution Coefficients Probability Coefficients with a 75%Coefficients certaintyPoor 9.2% 48.40% 8.6%Fiscal 34.7% 45.80% 32.4% |a Equal to the economic net present value.
36
ANNEX 5
CONTENTS
Annex 5 FINANCIAL ANALYSISAnnex 5a HISTORICAL FINANCIAL STATEMENTSSa(l) Statistics5a(2) Contribution to Cost and Revenue5a(3) Profit and Loss Account5a(4) Balance Sheet5a(5) Cashflow StatementsAnnex 5b Assumptions to Financial projectionsAnnex 5c Projected Financial Statements5c(1) Profit and Loss Account5c(2) Balance Sheet5c(3) Cashflow Statement5c(4) Key Figures5c(i-iii) Data for Financial projectionsAnnex 5d Analysis of ZESCO Financial Performance over period of BSA5d(1) Profit and Loss Account5d(2) Balance Sheet5d(3) Cashflow5d(4) Key figures
37
Annex 5
FINANCIAL ANALYSIS
INTRODUCTION
1. Over the past six years, as a government entity, ZESCO lacked the autonomy to makecommercial decisions resulting in poor financial performance due to, among other things, lowtariffs which did not cover costs, exacerbated by high inflation and major devaluation of thekwacha. The reliance on one major customer, the Zambia Consolidated Copper Mines (ZCCM),which accounted for over 50 percent of energy sales, and over 40 percent of revenue, madeZESCO vulnerable to ZCCM's ability to pay, and the levels of tariffs negotiated. With cashflow amajor constraint due to poor collection and billing systems, ZESCO had to rely on Governmentfor debt service and on creditors for working capital. The lack of adequate financial managementand accounting systems resulted in qualified audit opinions and lack of accurate and timelymanagement information for decision making.
2. During the last two years, in line with the Government of Zambia's policy ofcommercialization and privatization of public enterprises, ZESCO has enjoyed increasing degreesof autonomy over its financial affairs and progress has been made to make ZESCO financiallyviable. The Government and ZESCO signed a Performance Contract in May 1996 that sets outstringent financial and efficiency objectives for ZESCO over the next five years, and grantsZESCO autonomy in the financial and operational management of the utility. Other areasaddressed include implementation of tariff increases, changing of accounting policies in line withgenerally accepted accounting practice, development of a new financial management andaccounting system, the revaluation of fixed assets, implementation of a Customer Informationand Billing system, improved metering and the development of a financial planning computermodel.
FINANCIAL MANAGEMENT AND ACCOUNTING SYSTEMS
3. ZESCO suffers from the lack of up to date financial information due to outdatedaccounting systems and understaffing in key areas of treasury management, financialplanning/budgeting, financial accounting and credit control. The result has been qualifiedfinancial statements and the auditors noting concerns over the lack of internal controls, accuracyof financial data and the lack of financial information flows including monthly managementaccounts.
4. A computerized accounting system which would address ZESCO's information andinternal control weaknesses is under implementation and scheduled to be fully operational inApril 1998. The selection of consultants for the stock and materials management system is inprogress. At Appraisal, it was agreed that the appointment of consultants for the stock andmaterials system would be a condition for negotiations.
5. ZESCO has filled the key managerial positions in the Finance Department, but support isneeded for the managers and the Finance Director to implement the new accounting and financialmanagement systems and to strengthen the organization skills of finance directorate. ZESCO hasapproached SIDA for support through periodical technical assistance for the managers intreasury, financial planning, financial accounting and credit control. The IDA project will fund an
38

Annex 5
FINANCIAL ANALYSIS
INTRODUCTION
1. Over the past six years, as a govermment entity, ZESCO lacked the autonomy to makecommercial decisions resulting in poor financial performance due to, among other things, lowtariffs which did not cover costs, exacerbated by high inflation and major devaluation of thekwacha. The reliance on one major customer, the Zambia Consolidated Copper Mines (ZCCM),which accounted for over 50 percent of energy sales, and over 40 percent of revenue, madeZESCO vulnerable to ZCCM's ability to pay, and the levels of tariffs negotiated. With cashfiow amajor constraint due to poor collection and billing systems, ZESCO had to rely on Government fordebt service and on creditors for working capital. The lack of adequate financial management andaccounting systems resulted in qualified audit opinions and lack of accurate and timelymanagement information for decision making.
.2. During the last two years, in line with the Government of Zambia's policy ofcommercialization and privatization of public enterprises, ZESCO has enjoyed increasing degreesof autonomy over its financial affairs and progress has been made to make ZESCO financiallyviable. The Government and ZESCO signed a Performance Contract in May 1996 that sets outstringent financial and efficiency objectives for ZESCO over the next five years, and grantsZESCO autonomy in the financial and operational management of the utility. Other areasaddressed include implementation of tariff increases, changing of accounting policies in line withgenerally accepted accounting practice, development of a new financial management andaccounting system, the revaluation of fixed assets, implementation of a Customer Information andBilling system, improved metering and the development of a financial planning computer model.
FINANCIAL MANAGEMENT AND ACCOUNTING SYSTEMS
3. ZESCO suffers from the lack of up to date financial information due to outdatedaccounting systems and undersafing in key areas of treasury management, financialplanning/budgeting, financial accounting and credit control. The result has been qualified financialstatements and the auditors noting concerns over the lack of internal controls, accuracy of financialdata and the lack of financial information flows including monthly management accounts.
4. A computerized accounting system which would address ZESCO's information andinternal control weaknesses is under implementation and scheduled to be fully operational in April1998. The selection of consultants for the stock and materials management system is in progress.At Appraisal, it was agreed that the appointment of consultants for the stock and materials systemwould be a condition for negotiations.
5. ZESCO has filled the key managerial positions in the Finance Department, but support isneeded for the managers and the Finance Director to implement the new accounting and financialmanagement systems and to strengthen the organization skills of finance directorate. ZESCO hasapproached SIDA for support through periodical technical assistance for the managers in treasury,financial planning, financial accounting and credit control. The IDA project will fund an advisor tothe Finance Directorate for a period of two years. The terms of reference for the Advisor wereagreed at Appraisal.
39
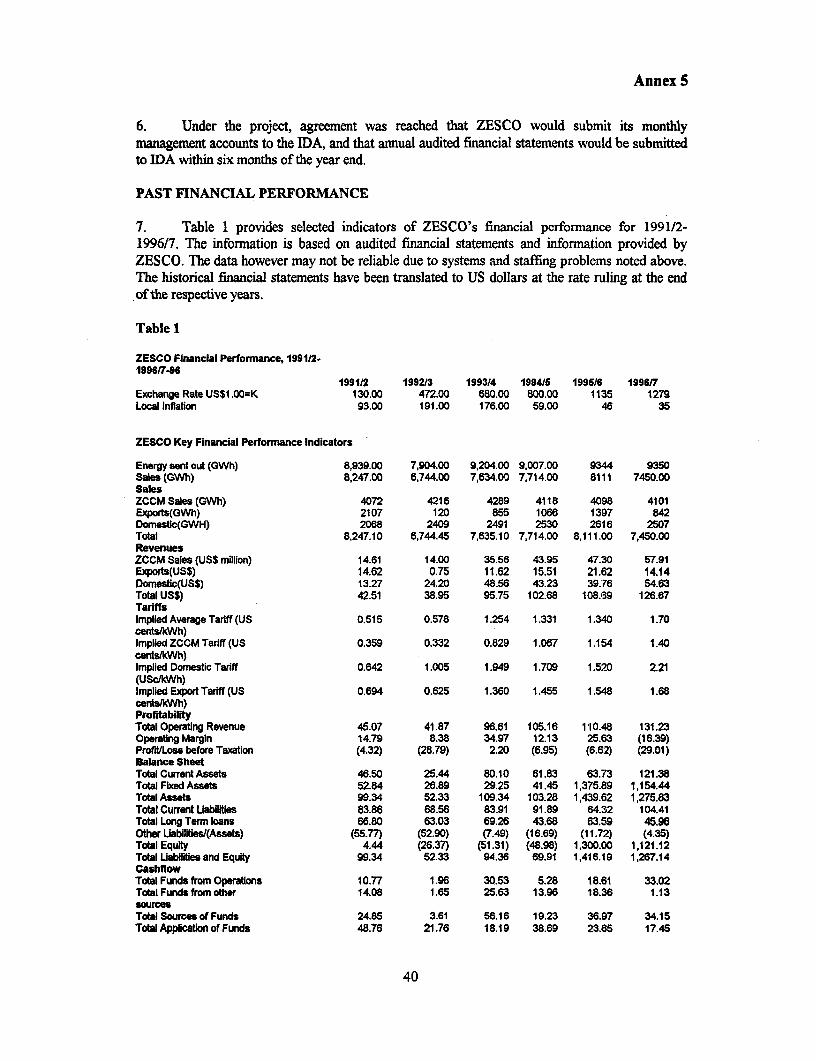
Annex 5
6. Under the project, agreement was reached that ZESCO would subrnit its monthlymanagement accounts to the IDA, and that annual audited financial statements would be submittedto IDA within six months of the year end.
PAST FINANCIAL PERFORMANCE
7. Table I provides selected indicators of ZESCO's financial performance for 1991/2-1996/7. The information is based on audited financial statements and information provided byZESCO. The data however may not be reliable due to systems and staffing problems noted above.The historical financial statements have been translated to US dollars at the rate ruling at the endof the respective years.
Table 1
ZESCO Financial Perfofrance, 1991/2-199617496
199112 199213 1993/4 199416 1996/6 199617Exchange Rate US$1.00=K 130.00 472.00 680.00 800.00 1135 1279Local Infltion 93.00 191.00 176.00 59.00 46 35
ZESCO Key Financial Perfornance Indicators
Energy sent out (GWh) 8,939.00 7,904.00 9,204.00 9,007.00 9344 9350Sales (GWh) 8,247.00 6,744.00 7,634.00 7,714.00 8111 7450.00SalesZCCM Sales (GWh) 4072 4216 4289 4118 4098 4101Exports(GWh) 2107 120 855 1066 1397 842Domestic(GWH) 2068 2409 2491 2530 2616 2507Total 8,247.10 6,744.45 7,635.10 7,714.00 8,111.00 7,450.00RevenuesZCCM Sales (USS million) 14.61 14.00 35.56 43.95 47.30 57.91Exports(USS) 14.62 0.75 11.62 15.51 21.62 14.14Domestic(US$) 13.27 24.20 48.56 43.23 39.76 54.63Total USS) 42.51 38.95 95.75 102.68 108.69 126.67TariffsImplied Average Tariff (US 0.515 0.578 1.254 1.331 1.340 1.70cenWt/kWh)Implied ZCCM Tariff (US 0.359 0.332 0.829 1.067 1.154 1.40cents/kWh)Implied Domestc Tariff 0.642 1.005 1.949 1.709 1.520 2.21(USc/hNh)Implied Export Tariff (US 0.694 0.625 1.360 1.455 1.548 1.68cents/kWh)ProfitabilityTotal Operating Revenue 45.07 41.87 96.61 105.16 110.48 131.23Operating Margin 14.79 8.38 34.97 12.13 25.63 (16.39)Profit/Loss before Taxation (4.32) (28.79) 2.20 (6.95) (6.62) (29.01)Balance SheetTotal Current Assets 46.50 25.44 80.10 61.83 63.73 121.38Total Fixed Assets 52.84 26.89 29.25 41.45 1,375.89 1,154.44Total Assets 99.34 52.33 109.34 103.28 1,439.62 1,275.83Total Current Uabilities 83.86 68.56 83.91 91.89 64.32 104.41Total Long Term loans 66.80 63.03 69.26 43.68 63.59 45.96Other Liabilities/(Assets) (55.77) (52.90) (7.49) (16.69) (11.72) (4.35)Total Equity 4.44 (26.37) (51.31) (48.98) 1,300.00 1,121.12Total Uabllities and Equity 99.34 52.33 94.36 69.91 1,416.19 1,267.14CashfiowTotal Funds from Operations 10.77 1.96 30.53 5.28 18.61 33.02Total Funds from other 14.08 1.65 25.63 13.96 18.36 1.13sourcesTotal Sources of Funds 24.85 3.61 56.16 19.23 36.97 34.15Total AppNlaon of Funds 48.76 21.76 18.19 38.69 23.65 17.45
40

Annex S
Total Working Captal (26.77) (20.89) 37.02 (21.08) 14.91 27.06Increase/(Decrease)Movement In Cash 2.88 2.74 0.95 1.62 (1.59) (10.36)Key IndicatorsAnnual Revenue growth (%) Total 186.00 (7.11) 130.76 8.85 5.07 18.78Operating Revenue/Previous yearOperaUng Margin (%) Operating 32.81 20.02 36.19 11.53 23.20 (12.49)Revenue/Total RevenueProfit margin (%) ProfitLoss before (9.58) (68.76) 2.28 (6.61) (6.00) (22.11)TaxationRetum on Total Assets (%) Profi/Loss (0.05) (37.96) 2.72 (6.54) (0.86) (2.14)before taxaton/Total assetsCurrent Ratio (times) 0.55 0.37 0.95 0.67 0.99 1.16Long term debt/Debt+Equity 93.76 171.91 385.93 (825.00) 4.66 3.94(%)SalesMordng Captal (1.14) (0.90) (25.12) (3.42) (184.12) 7.46Trnes)
Account Receivables (Days) 213.09 92.07 229.43 129.41 155.83 218.52Cashflow frorn operations/Currert 0.13 0.03 0.36 0.06 0.29 0.32Liabilies (Times)Camshfow frorn operations/interest 0.48 0.10 2.17 0.18 2.86 1.74Charges+loan repayments (timesSelf financing Ratio (%) 63.72 67.69 (117.51) 33.04 15.67 (188.94)Retum on revalued fixed 0% -157% 12% -24% -1% -2%assets (%)
Revenues and Profitability
8. As the above summary table indicates, ZESCO's financial performance during the period1991/2-1996/7 was unsatisfactory. ZESCO incurred losses in all but one year since 1991/2.Although the operating profit margin was positive, indicating that ZESCO was generating enoughrevenues to cover its operating costs, these operating costs are understated as depreciation wasbased on the historical cost of assets, and the maintenance costs charged to the profit and lossaccount were limited by the availability of funds. ZESCO's financial performance also sufferedfrom an unsatisfactory tariff policy and the impact of the devaluation of the kwacha on ZESCO'sdebt service and its operating costs, 80 percent of which are dollar based.
9. Salient features of ZESCO's historical financial performance are as follows:
* ZCCM market share. Of ZESCO's three main customer categories, export, ZCCM, anddomestic (including commercial, residential, industrial, and services), ZCCM is the mostsignificant, in 1996/7 contributing 54 percent of ZESCO's energy sales and 46 percent of itsrevenue. ZCCM's relative importance has increased more in relation to revenue where itscontribution to ZESCO's sales revenue has increased from 34 percent in 1991/2 to 46 percentin 1996/7, than in volume of sales which have stabilized around 4,100 GWh per annum, andas a percentage of ZESCO sales, have increased modestly from 49 percent in 1991/2 to 54percent in 1996/7 (Annex 5a(2)). The decision to have the ZCCM tariff quoted and paid inUnited States dollars resulted in increased revenues during the period of major devaluationfrom 1991/2 to 1995/6.
* ZCCM tariff. The ZCCM tariff increased from USc 0.359 in 1991/2 to 1.4 cents in 1996/7.ZESCO's accounting records do not permit an analysis of costs according to customercategories. An attempt was made to arrive at the costs of supplying energy to ZCCM based onan allocation of total operating and finance costs, and an arbitrary 8 percent return on assets.The results indicated the cost coverage ratio to be less than 1 in all but one year, although thesecosts are understated (para 8). The cost coverage ratios -re therefore much lower than
41

Annex 5
reflected. ZESCO was not recovering costs on a significant part of its sales. Negotiations withZCCM for tariff increases have always posed a problem to ZESCO. ZCCM's failure to mnaketimely payment for services has also had a significant impact on ZESCO's cashflow. Thefollowing tariff increases in dollar terns were implemented in the period 1991/2-1996/7:1993/4, 70 percent; 1995/6, 15 percent and 1996/7, 5 percent.
* ZCCM privatization. The Government of Zambia is in the process of privatizing ZCCM. Afifteen year Bulk Sales Agreement (BSA) between the new owner of ZCCM's Power Divisionand ZESCO has recently been finalized. The results of these negotiations will have asignificant impact on ZESCO's future financial performance (see paras 16-18 below).
* Growth in demand. ZESCO's electricity sales were adversely affected by the drought in1992/3, which resulted in a 20 percent reduction in sales from 8472GWh in 1991/2 to6744GWh in 1992/3. Sales steadily increased since then, and in 1995/6 were at 98 percent ofthe pre-drought levels. Apart from exports, which increased up to 1995/6, the other twomarkets, ZCCM and domestic, have generally stabilized, or shown marginal growth in theperiod. This trend illustrates the vulnerability of ZESCO to the loss of the export market,which occurred in 1996/.
* Revenue growth. Sales revenues increased by 198 percent in dollar terms, from US$43million in 1991/2 to US$126.6 million in 1996/7 as a result of real tariff increases and increasein the volume of domestic sales. In dollar terms, from 1991/2 to 1996/7, the ZCCM tariffincreased by 290 percent from UScO.359 to UScl .4, the domestic tariff by 244 percent fromUScO.642 to USc2.21; and the export tariff by 142 percent from UScO.694 to USc1.68.
* Costs of different markets. As the losses incurred by ZESCO illustrate, ZESCO's tariff didnot cover the cost of supplying electricity to its customers which also included someinefficiencies, which ZESCO is now in the process of addressing. Even on the basis of theunderstated historical costs, the average cost coverage ratio is less than 1. The lowest costcoverage was on the domestic market, where the ratio was below 0.5 for the major part of thereview period (Annex 5a(2)).
* Overall ZESCO costs. ZESCO's major costs were the Kariba North costs and salaries; from1996/7, depreciation is the most significant cost. ZESCO leases the Kariba North Bank Powerstation from the Kariba North Bank Company (KNBC) and pays a rental, which coversmaintenance and debt service. The devaluation of the kwacha resulted in major foreignexchange losses on inputs, 80 percent of which are dollar based, as well as the exposure onforeign currency loans. Overall from 1994/5, expenditure has been increasing below the rate ofinflation due to liquidity constraints.
* Profitability. ZESCO covered its operating costs (including depreciation) up to 1995/6, whendue to realistic depreciation values based on revalued assets, the operating margin wasnegative. Finance charges, particularly foreign exchange losses, put ZESCO in a net lossposition. ZESCO made profit in only one out of six years, giving a negative net return onequity. The losses are understated by the underprovision of depreciation and operations andmaintenance costs. In terms of markets, cost coverage was highest on the export tariff, and thedomestic market tariff cost coverage was the lowest. ZESCO will need to adjust its tariffs tomove towards full cost recovery on all its markets.
42

Annex 5
* Tariff Policy. Before 1991, ZESCO was required to develop its electricity tariffrecommendations for Government approval, a lengthy process with approvals less than appliedfor. Consequently tariffs did not cover costs, and increases were below the rate of inflation. In199 1, ZESCO was given the autonomy to review tariffs as needed. There were two major tariffincreases on domestic customers in 1992 (500 percent) and 1993 (220 percent) in kwachaterms, against inflation of 191 percent and 176 percent respectively, and devaluation of about900% between 1991/2 and 1996/7. Other tariff increases have been as follows: July 1994-25%against 59% inflation; July 1995 - 15% against 46% inflation; January and May 1996- 20%and 55% respectively, against inflation of 35%. Only in FY 96 do the tariffs increase in realterms, above the rate of inflation.
Tariff Increases-USc and Kwacha
26.0000
15.0000 F.....-i.I 10.0000 I =Senes2|5.00000.0000I
INFLATION AND TARIFF INCREASES
600
500
40 -2M | =Seriesi
Wt 200
100
0
* Revaluation of Fixed Assets: ZESCO had its fixed assets professionally revalued by Techproof Kent, England, in 1995/6 on a depreciated replacement cost basis, considered mostappropriate given the nature of the assets. The impact has been an increased but realisticdepreciation charge in the profit and loss account, and a more accurate reflection of the networth of ZESCO. To ensure current carrying values of assets, during Appraisal, agreementwas reached on the method ZESCO would use for the annual adjustment to its fixed assets toreflect the higher replacement costs due to movements in macro economic indicators. Fixedassets would be carried in US dollars and translated to kwacha using the closing exchange rate.This would link assets to movements in exchange rates.
* Cashflow and Liquidity: ZESCO's critical problem during the period 1991/2 to 1996/7 wascashflow. Both the current and quick ratios were below 1. ZESCO's cash was tied up in
43

Annex 5
debtors. Collection of the ZCCM, Government and parastatal debt was a major problem. Theaged debtors listing showed old debts some of which are not recoverable, still carried in thebooks. Only small amounts of debts were written off in the profit and loss account, and no baddebt provision was created in the financial statements. The outstanding balance of electricityarrears as at the end of 1995/6 was US$46 million or about 155 days equivalent of its annualsales revenue. The position worsened in 1996/7 with 218 debtor days. During the same period,ZESCO's overdraft increased from US$1.4 million to US$15 million. Strong efforts need to bemade for recovery of arrears, and disconnection policy enforced vigorously.
Capital Structure: While historical financial statements showed ZESCO to beundercapitalized, this was due to failure to accurately reflect the value of assets. Before therevaluation of fixed assets in 1995/6, the financial statements reflected a negative net equityposition as a result of negative revenue reserves due to accumulated losses, the low sharecapital base, and deferred exchange losses. The debt equity ratio was over 100%. Therevaluation of fixed assets added US$1,150 million to equity as a revaluation reserve. This hasstrengthened ZESCO's equity base and its capital structure. In 1996/7, the debt to equity ratiowas only 6%, indicating ZESCO's ability to absorb more debt. ZESCO's capitalization at theend of 1996/7 was as follows:
US $ (million)
Total Fixed Assets 1154.0Current Assets 121.00Current Liabilities 104.00Total Capital Employed 1171.00
Financed by:Equity (37.00)Revaluation reserve 1151.00Long Term Debt 46.00Capital Contributions 7.00Long Term Liabilities 4.0Total Financing 1171.00
Historical Financing Plan
10. ZESCO financed its fixed assets, debt service and working capital requirements throughinternal cash generation and long term loans. It is estimated that ZESCO's accumulated cashflowfrom operations provided 57% of its accumulated cashflow requirements during 1991/2-1996/7.The accumulated cash generation from operations during 1991/2-1996/7 amounted to $100.16million compared to accumulated fund requirements of some US$174.97 million during the period.The rest of the requirements were met by long term loans of U'.$ 63.21 million (366%), and grantsand contributions of US$11.34 million (6%), sale of assets, US$.25 million. As noted inparagraph 9, point 7, the level of expenditure was limited by the availability of cash resources.
44
Annex 5
PRESENT FINANCIAL CONDITION
11. In May 1996, GRZ and ZESCO signed a Performance Contract (PC) setting out financialand efficiency objectives for ZESCO and obligations for the Government to provide anenvironment which would allow ZESCO to achieve its objectives. In the first year of the PC,ZESCO failed to meet the PC targets due to less than budgeted sales (loss of industrial customersand export market), and tariff increases which were below the rate of inflation.
* Export Market: A significant feature of the 1996/7 financial performance is the loss of abouthalf of the export market, with the other half to cease in 1997/8. The commissioning of theinterconnector between Zimbabwe and South Africa has resulted in the loss of the Zimbabwemarket. Export sales declined from 1,397 GWh in 1995/6 to 842Gwh in 1996/7, and the figureis expected to decline to 26 GWh in 1997/8. Total sales declined from 8,111 in 1995/6 to7,450Gwh in 1996/7. In line with the trends in other years, only a modest increase wasrecorded for ZCCM, and domestic sales increased by 3%. The domestic market is assuminggreater importance in terms of both sales and revenues. Domestic sales represented 54% oftotal sales revenue, up from 36% in 1995/6. In spite of the reduction in export sales, revenueincreased by 16% in dollar terms from increases in both the ZCCM and domestic tariff. Thefinancial performance of ZESCO is sensitive to sales volume. To be viable, ZESCO will needto raise the lost revenue through higher tariffs from its remaining market, the domestic marketand ZCCM.
* Operating costs: Due to charging realistic levels of depreciation based on revalued assets(19996/7 - $54 million; 1995/6 - 2 million), ZESCO failed to cover its operating costs,recording an operating loss of US$16.3 million. A stabilization in exchange rates resulted inmuch lower foreign exchange losses than in previous years. A net loss of $29.1 million wasmade after taking account of finance charges. ZESCO has introduced operational efficiencies,including the rationalization of its labor force. Salary levels reflect the changes in skills mix.ZESCO however remains exposed to foreign exchange movements and inflation, and will needto cushion its financial performance from these variables. During Appraisal agreement wasreached that ZESCO would apply an automatic tariff adjustment formula quarterly, withoutthe need for Board and Ministry approval, to take account of movements in both local andinternational exchange rates and inflation. The adjustment is premised on tracking the impactof the above variables on ZESCO's operating costs, and subsequently this is translated into afactor to adjust tariffs. Agreement was reached that the ZCCM tariff would continue to bequoted in US dollars.
* Operating Ratio: Apart from required increases in operations and maintenance costs,ZESCO's costs in 1996/7 reflect the true cost of operations. The operating ratio is 116%. Theaverage tariff was UScl.70/KWh, against average costs UScl.99/KWh. Cost coverage wasonly 85%. With the provision of adequate operations and maintenance costs, the cost coverageratio will be much lower. ZESCO will need to make adjustments to its tariffs to ensure fullcost recovery.
* Debtors and Liquidity: Debtors outstanding of $76 million represent 218 days sales, up from155 days in 1996n7. Domestic debtors are becoming a major component of the debtors due toincreasing tariffs. To reduce its debtor figure, ZESCO is requesting netting off Governmentand parastatal debt against the amount ZESCO owes Government for debt service currently
45
Annex 5
$42 million. During appraisal, agreement was reached between the Ministry of Finance andZESCO that a clearing house mechanism would be established to clear Government andparastatal debt every two months. The Ministry of Finance would withhold the amounts due toMinistries for electricity. Every two months, the bills would be netted off the amount ZESCOowes the Government, and when this amount is repaid, Ministry of Finance would pay ZESCOthe amounts due. ZESCO would submit semi-annual reports on March 31 and September 30of each year on its billings and collections, and ZESCO would be required to maintain theoutstanding balance of electricity sales debts equivalent to 160 days in 1997/8, 120 days in1998/9, 90 days in 1999/00, and 60 days thereafter. Starting from November 1, 1997, ZESCOwill levy a late payment charge of 10% on bills unpaid on the due date. ZESCO agreed toenforce its disconnection policy which includes disconnecting customers with bills outstandingfor 60 days after the due date. Under the project agreement was reached that ZESCO wouldmaintain a quick ratio of 1, and a current ratio of 1.5.
Rural Electrification
12. The Government levies a 10% surcharge on domestic electricity bills towards RuralElectrification, which is collected by ZESCO through its bills. The funds are paid over to theMinistry of Finance for the financing of rural electrification projects. When ZESCO undertakes arural electrification project, the project is supposed to be funded out of the funds at the Ministry ofFinance. ZESCO's financial position has been strained by the financing of Rural Electrificationprojects on behalf of the Goverrnent where the release of funds from Govermnent has laggedbehind the project financing needs. To ensure that these projects are not prefinanced by ZESCO,agreement was reached that GRZ would provide ZESCO with funds in advance out of the RuralElectrification Fund for any investments for rural electrification to be carried out by ZESCO.
Insurance and Risk Management
13. ZESCO has commissioned ESBI of Ireland to carryout an insurance and risk managementstudy in order to assess a)the adequacy of insurance cover and b)the adequacy of rislk managementprovisions. The study was submitted to ZESCO in July 1997, and ZESCO is in the process ofimplementing the recommendations of the study.
Financial Objectives
14. In order to improve its financial viability, ZESCO has set itself the following financialobjectives:
* take any action necessary to ensure that it wili generate revenues sufficient to cover itsfull operating expenses (including depreciation on a revalued asset basis) in 1997/8;
* during 1998/9 and 1999/0 generate revenues to cover full operating expenses(including depreciation on a revalued asset basis), net working capital increases otherthan cash, debt service and the equivalent of not less than 5% of the average of itsinvestment;
* during 2000/1 and 2001/2, generate revenues to cover full operating expenses(including depreciation on a revalued asset basis), net working capital increases otherthan cash, debt service and the equivalent of not less than 10% of the average of itsinvestment;
46
Annex 5
* during 2002/3, generate revenues to cover full operating expenses (includingdepreciation on a revalued asset basis), net working capital increases other than cash,debt service and the equivalent of not less than 15% of the average of its investment;
* from 2000/01 and thereafter, earn a return on assets of not less than 1%.
15. ZESCO has further agreed to (i) before December of each year on the basis of reasonableforecasts, undertake a detailed review of the adequacy of its revenues and provide IDA with a copyof such review; and (ii) implement the adjustments as shall be necessary to achieve the agreedfinancial objectives. As a part of the tariff restructuring process, ZESCO had commissioned aTariff study, financed by the Swedish International Development Agency (SIDA) which would beused as the basis for establishing an appropriate tariff structure. ZESCO agreed by April 1, 1998to implement recommendations of the Tariff Study with regards to the structure.
Negotiation of a Satisfactory Bulk Sales Agreement (BSA) with ZCCM
16. The negotiation of a satisfactory BSA, based on a tariff that covers full costs and a returnon equity is critical to the long term viability of ZESCO. As the BSA is a fifteen year contract, itwas necessary to carry out projections over the same period to review the adequacy of currenttariff proposal of USc2. 1/KWh to be linked to inflation thereafter. The ZESCO historical tariff hasnot covered costs, and if the trend continues, to achieve its stated financial objectives, ZESCOwould have to recover its costs through the domestic customers, effectively subsidizing the coppermnines.
17. An analysis of the average cost of supplying energy to ZCCM was done based on theTariff Study by SwedePower. The analysis calculated the average cost for supply at 220kV in the330/330kV substations. The costs include the existing and the new generation plants and all main(220 and 330kV) transmission lines and 330kV equipment and 330/220kV transforners in mainsubstations of ZESCO. The average costs included in the computation are the operating costs, anda retumn on book value for generation and transmission. Two alternatives were considered, oneincluding cost for new generation plants at Itezhi-Tezhi and Kafue Gorge Lower, and the otherexcluding capital costs, but including costs of electricity purchases at USc1.5/KWh. The results ofthe analysis show the average costs, at 15 per cent return on revalued assets, increasing toUSc2.33/KWh by 2011/2. A 15 per cent return was considered to show cost coverage at a returnwhich would be acceptable rate to private investors. According to the SwedePower Tariff Study,the long run marginal cost (LRMC) including existing system and new expansions is calculated atUSc2.3/KWh at 12% discount rate which corresponds well with the average cost. The average costis taken as the cost of supplying power to ZCCM. The ZCCM tariff would increase toUSc2.8/KWh, thus covering costs. Detailed tables are attached. The cost of USc2.1/KWhcompares favorably with other bulk supply agreements in the region. The ZESA/ZESCOagreement is at UScl.5/KWh, and the ZESCO/SNEL agreement at UScl.46/KWh. Details of thelong term financial performance of ZESCO on the basis of the negotiated price are attached asAnnex 5d.
18. The signing of a satisfactory bulk sales agreement covering costs, satisfactory to IDA, wasa condition of Board Presentation.
47
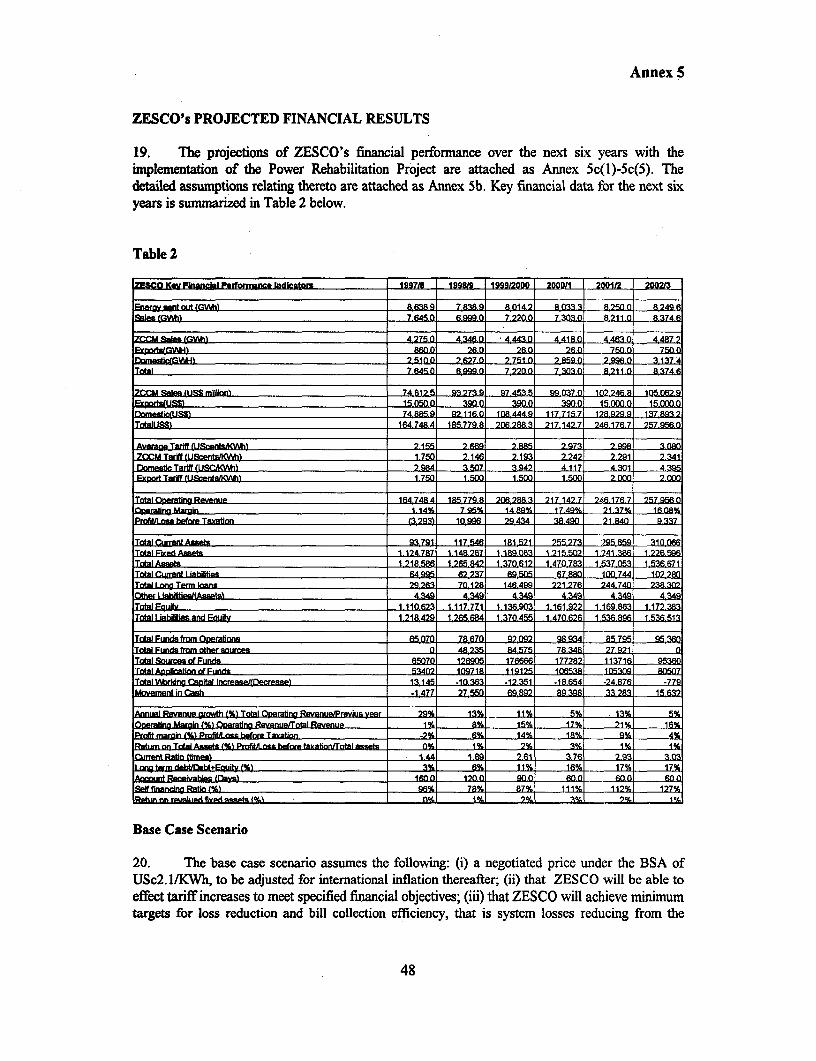
Annex 5
ZESCO's PROJECTED FINANCIAL RESULTS
19. The projections of ZESCO's financial performance over the next six years with theimplementation of the Power Rehabilitation Project are attached as Annex 5c(1)-5c(5). Thedetailed assumptions relating thereto are attached as Annex 5b. Key financial data for the next sixyears is summarized in Table 2 below.
Table 2
ZSCO Kir Fiancial Perfomunca Indlcatom 19971 19M8/9 II9l920 1sssnooo000/ 1 _gwM -naz
Eiw_y nwt out (GWs) &63895 7 838.2 8 014.2 8 033.3 _8 150 0 8 249 ates (GM) T645 6,s.0 7 22Q0 7 303 0 8211c 8.3Z dW
cM Sales MMU) 4 275 c 4 346-0 4-443.0 4, 41 8-0 _ k461 4 487 2Exou m MO_ M 6o 26 n 26.0 750 0 750 DornegfiCGVU H _.0 c A.7 nc 9 2.7fi n 2J .Z59.Q 2.SS998.0 3 137Total - 7 645 c a, 999.0 7 .2MO. 7 Snl o 8-2 1 1.0 8-374
ZCCM Sates (USS million) 74 812.rl 93,273.9 97,453.5 99 037 o 102.24ti. 10 0r.62.5EKPus= 15 0500. - 3so.c -490.n 390.0 15.0s0 0 15-000.e
Domestic(USSM ~~~~~~~~~~~74 885.s 92116.0 108 444.9 117 715.7 128 929 S 137-893;2
TotalUbi 16474s 1857798_2062883 217_ 142_7 '61767 IZ7456.i543A8! ~ ~ I - 21.AJ 2 IiJ
Aveme Tartf (USoenbs]215 7 669 2 885 9.,973- 2.99E 8tZC:cM Twff(USransuKz _ 1750 - 2.A 2,193 2.242 - 1291 2341
Exp Tariff IU E1n&AM 1 75C * so 1 500 t500 2,000 ooc 000
Total Operating Revenue 1647484 77 0654 i B 27, 88.3 717,142. 7246AZ 17A 7 257 9 1
Operbalig Margin 1.14SE 7 95% 14 89% 17 49% 21 37%s MOM8wProfit/Lose before Taxation Q23 10,996 -- 38.490 _21 840 9 337
Total current Asse 93,71 117 546 181,521 255 273 29s.659 310,06Tadal Fr reo Assel t 1i,k 1 11 82 890oa3 1 ,21 5502 1 24i .386 1 226 596Total Asmse ,1,8 1 265 842 1 370,612 1 470 783 1 537 053 1 536 971Total Cuffent Liabilities 64 WA 62,237 69,505 67.8 1oo 744 1027 8tTotal Long Term karu 29 2 70 128 146,499 221 276 244-740 238.302Othe LiabliLs{0.s 4,349 4,349 4,349 4,349 4,349 4,34
Trztal Equily1 A10623 1,117 771 1.136.903 1,161,922 1,169 863 1.17238
TtlLiabillies and Eauity 1 218 429 J,265,684 1,370,455 1.470 626 1 536.896 1.536.513
Total Funds trom Operaforkns 65,070 78,670i 92,t)92 98.934 85 795 95, 6
Total Funds trom other sour es a 48 235 84,575 78 348 27, 921 n
Total Sources of Funds 65070 126905 176666 177282 11 3716 5e
'rotal Appliation of Funds 534021 109718 119125 1065,38 Ir5305 80507
Total VUbrling tCapital Inc ereae(ecrease) 131451 10.363 -12,351 -18.654 -24-876 -775
MovefmrA in Cash -1,477 27,550 69,892 89,398 _33.2& 15.63:
Annual Revenue growth (%) Total O;Jeratg RevanuelPrevius year 29°i 13% 11% 5% 13SI 5°i
Opelatng Marpin (%) Operating Revenue#rrtal Revenuie 1% 8% _ 5% 17% 21°4. 6
Prrdi margin (2%) Prr lULrss beore Taxation -2°i 6% 14% 18% 9% 4%t
Raturn on Toal Assets (%) PDtitosLbefore taxationfrotal awets 0% It% 2%/ 3% - 1 %1 1 %
tCunrr Rabo pimer i 44 1 as 2.61 3.76 2-93 30
IW ermdbQait+Euy (%40M 6X 11% 16% 17%4 17$t
Accoudt Remvble (Days )na 160t 1200 90.0 60.0 6Q0. 60.
Self finareidnt Ratio (S) 96°i 78% 87s% 111 % 112°4 1 27°
Rahn rn mozahled %rd AP-%A MQ 0%1 d° X 9eA so 7% MI
Base Case Scenario
20. The base case scenario assumes the following: (i) a negotiated price under the BSA ofUSc2. I/KWh, to be adjusted for international intlation thereafter; (ii) that ZES CO will be able toeffect tariff increases to meet specified financial objectives; (iii) that ZESCO will achieve miliimumtargets for loss reduction and bill collection efficiency, that is system losses reducing from thie
48

Annex 5
current level of 18% to 14% and bill collection efficiency improving from 85% to 90%. Thesigning of the Performance Contract between the Govermment and ZESCO, and the consequentmeasures taken with the Customer Information and Billing system, installation of new meters,rehabilitation of the system, improved financial management system and the technical assistants tobuild capacity in ZESCO provide grounds for this assumption. A sensitivity analysis of therobustness of ZESCO's present financial situation and projected financial performance undervarious levels of operating conditions and performance improvements has been carried out and isdescribed in para 31 below.
21. Growth in demand is based on ZESCO's twenty year Power System Development Plan forZambia, June 1996, which forecasts annual demand growth of 3.6% in line with forecast nationaleconomic growth. The demand which would result from new customers and increased consumptionby the current consumers would be met from ZESCO's own production and imports.
22. The results of the financial analysis confirm the viability of implementing the proposedproject of US$ 223 million, for which the envisaged funding mix will be adequate, withindebtedness remaining very low as a percentage of equity. The forecasts which are in line with thefinancial objectives indicate a remarkable improvement and strengthening of ZESCO's financesafter 1997/8. Salient features of ZESCO's forecast financial performance are as follows:
= The electricity sales are affected by the reduction in exports (loss of the Zimbabwe market),and after a dip in 1998/9, are estimated to gradually increase from 6,999 GWh in 1998/9 to8,375 GWh in 2002/3 on the basis of a 3.6% projected growth in demand. ZCCM continuesto be the major customer, contributing over 50% of sales. Exports of 724GWh per annum toNamibia are expected to commence in 2001/2 on the commissioning of an interconnectorbetween the two countries in the same year.
- Of significance is the declining contribution of ZCCM to revenue. ZCCM's contribution tosales declines from 54% of total sales in 1997/8 to only 44% in 2002/3, although itsconsumption is still about 54% of ZESCO's energy. By the end of the project period, thedomestic market is the most significant as ihe domestic tariff increases in dollar terms, andimproves its cost coverage ratio.
* To achieve the financial objectives, which aim towards a tariff which covers costs, theaverage tariff is estimated to increase from US cents USc2.15/KWh in 1997/8 toUSc3.08/KWh in 2002/3. The increases per consumer category are as follows: domestic tarifffrom USc2.98/KWh to USc4.40/KWh, ZCCM from USc1.75/KWh to USc2.34/KWh, andthe export tariff from UScl.75/KWh to USc2.00/KWh. For the individual consumer groups,ZCCM cost coverage (at 15% return on revalued assets) ratio moves from 111 % in 1997/8 to124% in 2002/3. The domestic tariff cost coverage ratio moves from 47% in 1997/8 to 76%in 2002/3.
* It is assumed new demand will be met from imports at the Power Pool Price of about USc2.0/KWh. Electricity purchases will commence in 2001/2.
* Financial performance from 2001/2 is affected by the interest on new loans which are chargedto the profit and loss account, rather than capitalized, and from 2002/3, by the depreciation onnew assets commissioned.
49
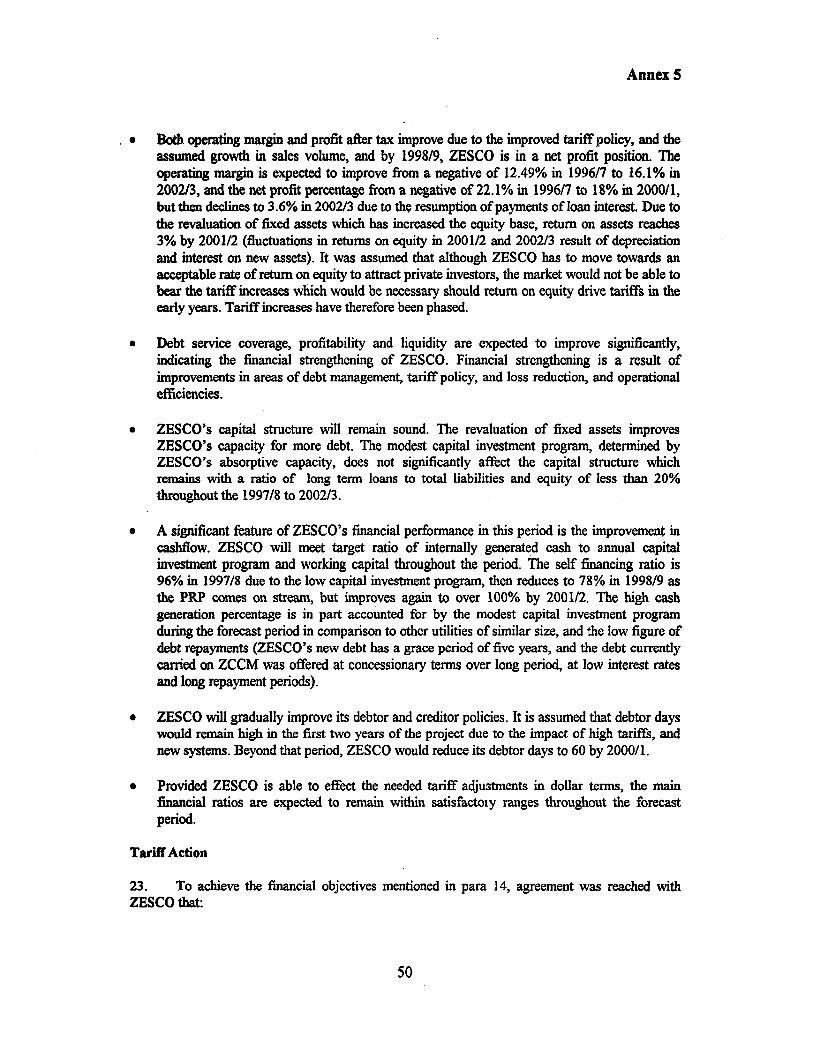
Annex 5
* Both operating margin and profit after tax improve due to the improved tariff policy, and theassumed growth in sales volume, and by 1998/9, ZESCO is in a net profit position. Theoperating margin is expected to improve from a negative of 12.49% in 1996/7 to 16.1% in2002/3, and the net profit percentage from a negative of 22.1% in 1996/7 to 18% in 2000/1,but then declines to 3.6% in 2002/3 due to the resumption of payments of loan interest. Due tothe revaluation of fixed assets which has increased the equity base, return on assets reaches3% by 2001/2 (fluctuations in returns on equity in 2001/2 and 2002/3 result of depreciationand interest on new assets). It was assumed that although ZESCO has to move towards anacceptable rate of return on equity to attract private investors, the market would not be able tobear the tariff increases which would be necessary should return on equity drive tariffs in theearly years. Tariff increases have therefore been phased.
* Debt service coverage, profitability and liquidity are expected to improve significantly,indicating the financial strengthening of ZESCO. Financial strengthening is a result ofimprovements in areas of debt management, tariff policy, and loss reduction, and operationalefficiencies.
* ZESCO's capital structure will remain sound. The revaluation of fixed assets improvesZESCO's capacity for more debt. The modest capital investment program, determined byZESCO's absorptive capacity, does not significantly affect the capital structure whichremains with a ratio of long term loans to total liabilities and equity of less than 20%throughout the 1997/8 to 2002/3.
* A significant feature of ZESCO's financial performance in this period is the improvement incashflow. ZESCO will meet target ratio of internally generated cash to annual capitalinvestment program and working capital throughout the period. The self financing ratio is96% in 1997/8 due to the low capital investment program, then reduces to 78% in 1998/9 asthe PRP comes on stream, but improves again to over 100% by 2001/2. The high cashgeneration percentage is in part accounted for by the modest capital investment programduring the forecast period in comparison to other utilities of similar size, and the low figure ofdebt repayments (ZESCO's new debt has a grace period of five years, and the debt currentlycarried on ZCCM was offered at concessionary terms over long period, at low interest ratesand long repayment periods).
* ZESCO will gradually improve its debtor and creditor policies. It is assumed that debtor dayswould remain high in the first two years of the project due to the impact of high tariffs, andnew systems. Beyond that period, ZESCO would reduce its debtor days to 60 by 2000/1.
* Provided ZESCO is able to effect the needed tariff adjustments in dollar terms, the mainfinancial ratios are expected to remain within satisfactoty ranges throughout the forecastperiod.
Tariff Action
23. To achieve the financial objectives mentioned in para 14, agreement was reached withZESCO that:
50

Annex 5
* ZESCO would maintain tariffs at such levels as would provide revenues necessary tomeet the objectives in para 14.
* ZESCO will be permitted to automatically adjust its tariff to take account of changesin the rates of exchange of the kwacha to the US$, and any other input costs;
* ZESCO would make a semi annual report on the adequacy of tariffs to meet theobjectives in para and submit the reports to by March 31, and September 30 of eachyear to the Government and IDA.
24. To achieve the 1997/8 objectives, ZESCO would need an average increase of about 35%in dollar terms on domestic customers. Management has already implemented a tariff increase ondomestic of about 40% nominal, effective July 1, 1997, with another 30% nominal increase to beimplemented in January 1998. It was assumed the ZCCM tariff would be USc2.1I/KWh effectiveDecember 1, 1997, with the average ZCCM tariff for the year at UScl.75/KWh.
ZESCO's Capital Investment Program
25. ZESCO's capital investment program assumes no new investment in generation. It isassumed that in 2001/2 when demand exceeds supply, the gap would be met through purchaseseither from independent power producers or from imports. The investment program, both the PRPand ZESCO's own program would be rehabilitation of existing infrastructure. The resourcesrequired to implement ZESCO's 1997/8-2002/3 investment program total US $406.42 includinginterest during construction and contingencies. Generation represents the largest share of theinvestment program with of total investment (388%), followed by distribution with 22%. Otherinvestments include transmission.
Table 3
Project Other ZESCO Total
Generation 67.33 85.37 152.7 38Distribution 51.28 37.02 88.30 22Transmission 33.98 8.4 42.38 10Other 21.93 52.20 74.13 18Contingencies 29.07 29.07 7IDC 19.84 19.84 5Total 223.43 182.99 406.42 100
26. To allow IDA to continue to assist in the process of power system investment planning andhelp identify least cost solutions, ZESCO has agreed that it will continue to consult annually withGovernment and IDA on its power investment program. Following these consultations, ZESCO hasagreed to adopt an investment program satisfactory to the Government and IDA and not toimplement any power investment project costing in excess of US$5 million not agreed in theinvestment program without prior consultation with IDA.
51
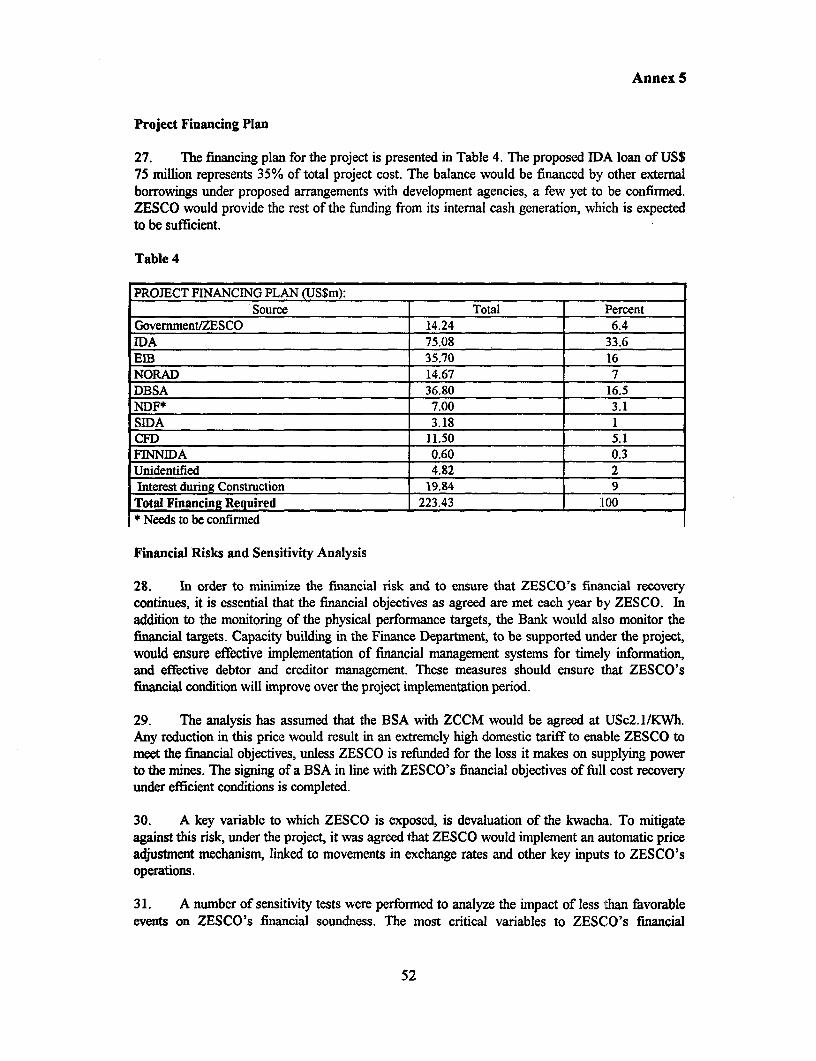
Annex 5
Project Financing Plan
27. The financing plan for the project is presented in Table 4. The proposed IDA loan of US$75 million represents 35% of total project cost. The balance would be financed by other externalborrowings under proposed arrangements with development agencies, a few yet to be confirmed.ZESCO would provide the rest of the funding from its internal cash generation, which is expectedto be sufficient.
Table 4
PROJECT FINANCING PLAN (US$m): =Source Total Percent
Govermnent/ZESCO 14.24 6.4IDA 75.08 33.6EIIB 35.70 16NORAD 14.67 7DBSA 36.80 16.5NDF* 7.00 3.1SIDA 3.18 1CFD 11.50 5.1FINNIDA 0.60 0.3Unidentified 4.82 2Interest during Construction 19,84 9Total Financing Required 223.43 1o0* Needs to be confirmed
Financial Risks and Sensitivity Analysis
28. In order to minimize the financial risk and to ensure that ZESCO's financial recoverycontinues, it is essential that the financial objectives as agreed are met each year by ZESCO. Inaddition to the monitoring of the physical performance targets, the Bank would also monitor thefinancial targets. Capacity building in the Finance Department, to be supported under the project,would ensure effective implementation of financial management systems for timely information,and effective debtor and creditor management. These measures should ensure that ZESCO'sfinancial condition will improve over the project implementation period.
29. The analysis has assumed that the BSA with ZCCM would be agreed at USc2.1/KWh.Any reduction in this price would result in an extremely high domestic tariff to enable ZESCO tomeet the financial objectives, unless ZESCO is refunded for the loss it makes on supplying powerto the mines. The signing of a BSA in line with ZESCO's financial objectives of full cost recoveryunder efficient conditions is completed.
30. A key variable to which ZESCO is exposed, is devaluation of the kwacha. To mitigateagainst this risk, under the project, it was agreed that ZESCO would implement an automatic priceadjustment mechanism, linked to movements in exchange rates and other key inputs to ZESCO'soperations.
31. A number of sensitivity tests were performed to analyze the impact of less than favorableevents on ZESCO's financial soundness. The most critical variables to ZESCO's financial
52

Annex 5
performance are the delay in implementing tariff increases, and demand. If ZESCO does notimplement a tariff increase in October 1997, its profit margin would worsen from a negative of 2%to a negative of 10.1% in FY97/98. If the ZCCM tariff is not increased to USc2.1/KWh, and onlyto about UScl.7/KWh, ZESCO would be in a loss making position in all but three years during theproject period (profit would be in years before ZESCO starts servicing debt on new loans and thedepreciation on new assets). Where tariff increases beyond 1999/0 are only linked to the rate ofinternational inflation, the profit margin declines to a negative 3% in 2002/3, against a positive of3.6% under the base case scenario. Details of the sensitivity analyses are shown in Table 5. Underscenarios of non-compliance with the agreed financial objectives, ZESCO's ability to meet thefinancial covenants becomes lirnited.
Table 5SENSITIVITY ANALYSIS BASE CASE CASE ?* CASE2* CASE 3 CASE 4 CASE 6
TO MEET ZCCM tariff FY97-No addition- Retail tariff- Debtor 1%Financial 1.7c al tariff Increase in inflation daysObi Other tariff November FY97 linked 199910 higher
Increases tariffs as in base onwardssanm case
SCENARIO ASSUMPTIONSRetail Tariff Increase 97/8 (real terms) 35% 35% 10% 35% 35% 35%RetailTarifflncrease98/9 15% 15% 15% 15% 15% 15%Retail Tariff Increase 99/0 10% 10% 10% 0% 10% 10%Retail Tariff Increase 00/01 2.2% 2.2% 2.2% 0% 2.2% 2.2%Retail Tariff Increase 01/02 2.2% 2.2% 2.2% 0% 2.2% 2.2%Retail Tariff Increase 02/03 0% 0% 0% 0% 0% 0%Bill Collection Ratio (days) 97/98 160 160 160 160 200 160BiN Collection Ratio (days) 98/99 120 120 120 120 180 120Bill Colletion Ratio (days) 99/00 90 90 90 90 160 90BiN Collection Ratio (days) 00/01 60 60 60 60 140 60Bill Collection Ratio (days) 01/02 60 60 60 60 120 60Bill Collection Ratio (days) 02/03 60 60 60 60 100 60Sales Growth 3.60% 3.60% 3.60% 3.60% 3.60% 2.00%ZCCM Tariff 1997/98 1.75 1.43 1.75 1.75 1.75 1.75ZCCM Tariff 1998/99 2.15 1.74 2.15 2.15 2.15 2.15ZCCM Tariff 1999/00 2.19 1.78 2.19 2.19 2.19 2.19ZCCM Tariff 000/001 2.24 1.81 2.24 2.24 2.24 2.24ZCCM Tariff 0011002 2.29 1.85 2.29 2.29 2.29 2.29ZCCM Tariff 002/003 2.34 1.9 2.34 2.34 2.34 2.34Retag Tariff 1997/8 2.98 2.98 2.43 2.98 2.98 2.98Retail Tariff 1998/9 3.51 3.51 2.86 3.51 3.51 3.51Retail Tariff 2000/01 4.12 4.12 3.35 3.66 4.12 4.12Retail Tariff 01 /02 4.30 4.30 3.50 3.74 4.30 4.30Retail Tariff 02/03 4.40 4.40 3.58 3.83 4.40 4.40KEY RESULTSAnnual Operating Rev.(US$Ms): 97/98 164,748 151,293 150,881 164,748 164,748 163,077Annual Operating Rev.(US$Ms): 99/00 206,288 187,726 186,206 196,430 206,288 194,8684Annual Operating Rev.(US$Ms): 02/03 257,956 237,944 232,420 240,081 257,956 233,875Surplus Before Tax (US$Ms) : 97198 -3,293 -16,199 -15,175 -3,293 -3,474 -5,073Surplus Before Tax (US$Ms):99/00 29,434 10,187 11,307 20,772 28,727 18,677Surplus Before Tax (US$Ms): 00/03 9,337 -12,058 -15,054 -7,290 8,617 -13,427Retum on revalued assets: 97198 -0.30% -1A0% -1.3% .0.3% -.30% -0.4%Retum on revalued assets : 99/00 2.50% .9% 1% 1.8% 2.5% 1.B%Retum on revalued assets: 02/03 0.80% -1% -1.2% 4.6% .7% -1.1%Debt/Equity % 97/96 6% 6% 6% 6% 6% 6%DebtWEquity% 9900 10% 10% 10% 10% 10% 10%DebtWEquity % 02/03 20% 20% 20% 20% 20% 20%Currentratio97198 1.4 1.2 1.3 1.4 1.4 1.4Current ratio 9900 2.6 2.2 2.3 2.6 2.6 2.5Current ratio 02103 3.0 2.3 2.4 2.8 .3.0 2.7Quick ratio 97/8 1.2 1.0 1.0 1.2 1.2 1.1Quick ratio 99100 2.3 1.8 1.9 2.3 2.3 22Quick ratio 02103 2.8 2.1 2.1 2.6 2.7 2.4* These cases are irrelevant at this stage since BSA has been agreed at US$c2.1, and domestic tariff increase has beenannounced effective January 1, 1998.
53

Annex 5
Accounts and Audit
32. ZESCO has over the last few years made a major effort to change its accounting policiesin line with generally accepted accounting principles. For the first time in 1996/7, ZESCO's auditreport was unqualified. The computerized accounting and financial management and the stock andmaterials management system under implementation would ensure the provision of timely andaccurate financial infornation, and the strengthening of intemal control systems. Under the project,ZESCO has agreed to have accounts, including those of the Special Account and Statement ofExpenditure, audited by an auditor acceptable to the Bank, and audited reports sent to the Bankwithin six months of the close of each fiscal year.
54
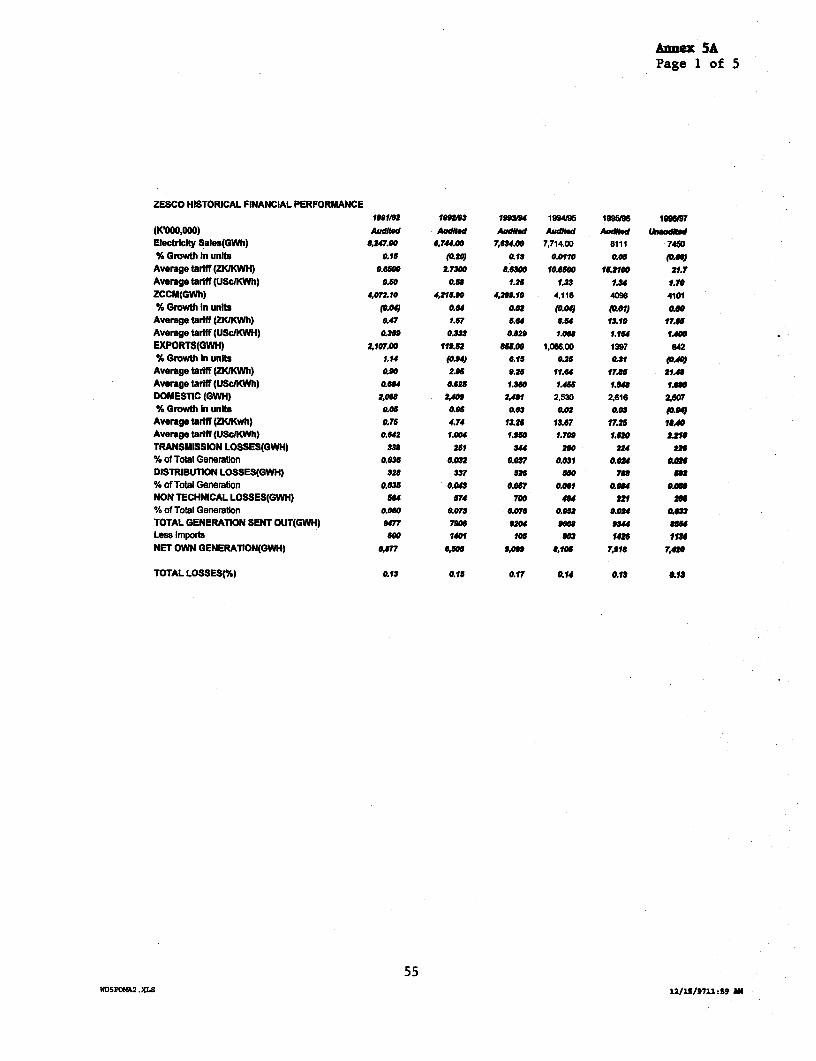
Annex 5APage 1 of 5
ZESCO HISTORICAL FINANCIAL PERFORMANCE191132 1992/9 1S9495 19946R loo 199107
(KOOO,000) AudNed Auditd Audited Auditd AudiedElectricity Sales(GWh) 8,247.00 6,74.00 7,6400 7,714.00 8111 7480% Growth In unIts 0.1o (020) 0.13 0.0110 0.05 8Q0
Average tariff (ZKKWH) 0.600 Z7300 s.aoo 10. 1&2100 21.7Average tariff (USdKWh) 0a0 0.8 1.26 1.33 134 1.70ZCCM(GWh) 4,072.10 4219.90 4289.10 4,118 4098 4101% Growth In units (O4." 0.04 002 (0.0) 001) 0.00
Average tariff (ZKIKWh) 0.47 1.t7 5. 654 13.19 17*9Average tariff (UScMKWH) 0.359 0.333 0.as9 1. 1.1U4 1.40EXPORTS(GWH) z107o00 11.52 8s5.00 1,066.00 1397 842% Growth In units 1.14 (0#94) 9.15 0.25 O. p.40)Average tariff (ZKIKWh) o,03 2.95 9.25 11.64 17.8S 21.0Avemge tariff (UScIKWh) 0.694 0.52 1.390 14W 149 1A0DOMESTIC (GWH) 2,06t 2,09 2,491 2,530 2,616 2.w7% Growth In units 0.05 05 0.03 002 0.03 10.06Average tariff (ZKIKwh) 0.75 4.74 1.26 13.67 17.25 18.40Average tariff (USclKWh) 0.942 1.004 1.950 1.709 1.620 2.0TRANSMISSION LOSSES(GWH) 38 251 34 290 224 226% of Total Generaton 0.026 0.082 0.037 aw1 0.0U am#DISTRIBUTION LOSSES(GWH) 328 337 52 50 7 % of Total Generabon 0.035 o.m Qos.7 0.001 0.004 oaNON TECHNICAL LOSSES(GWH) 5" 574 70 4U 221 2U% of Total Generation noo 0.073 no7s 0.052 0.024 &O.s0TOTAL GENERATION SENT OUT(GWH) S 477 7906 920 900S am Less Imports ceo 1401 106 903 1426 lISANET OWN GENERATION(GWH) S,977 6,505 *,OS9 5,109 7,15 7,ao
TOTAL LOSSES(%) 0.13 0.15 0.17 .14 0.13 01J
55NDSPOMA2 .XLS 12/15/971U:59 3
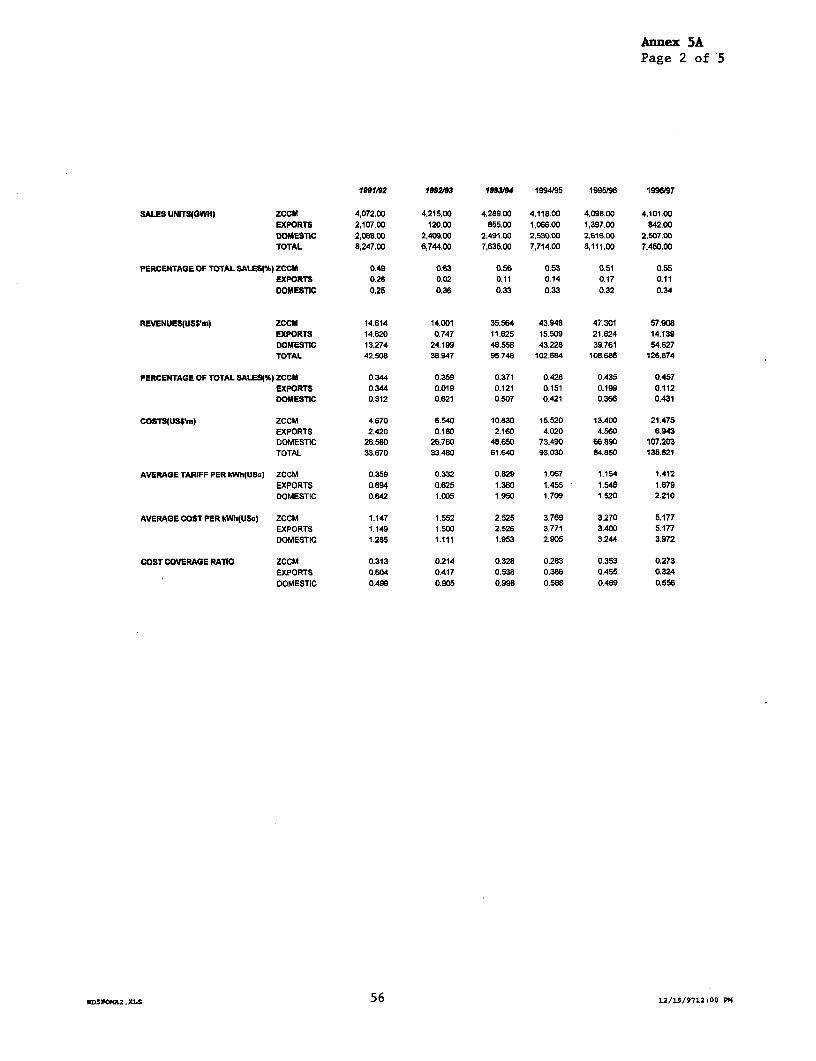
Annex 5APage 2 of 5
1991/92 1992/93 1993/4 1994J95 1995/96 1996/97
SALES UNITS(GWH) ZCCM 4,072.00 4,215.00 4,289.00 4,118.00 4,098.00 4,101.00EXPORTS 2,107.00 120.00 855.00 1,066.00 1,397.00 842.00DOMESTIC 2,068.00 2,409.00 2,491.00 2,530.00 2,6i6.00 2,507.00TOTAL 8,247.00 6,744.00 7,635.00 7,714.00 8,111.00 7,450.00
PERCENTAGE OF TOTAL SALES(%) ZCCM 0.49 0.63 0.56 0.53 0.51 0.55EXPORTS 0.26 0.02 0.11 0.14 0.17 0.11DOMESTIC 0.25 0.36 0.33 0.33 0.32 0.34
REVENUES(USVm) ZCCM 14.614 14.001 35.564 43.948 47.301 57.908EXPORTS 14.620 0.747 11.625 15.509 21.624 14.139DOMESTIC 13.274 24.199 48.558 43.228 39.761 54.627TOTAL 42.508 38.947 95.746 102.684 108.686 126.674
PERCENTAGE OF TOTAL SALES(%) ZCCM 0.344 0.359 0.371 0.428 0.435 0.457EXPORTS 0.344 0.019 0.121 0.151 0.199 0.112DOMESTIC 0.312 0.621 0.507 0.421 0.366 0.431
COSTS(USSm) ZCCM 4.670 6.540 10.830 15.520 13.400 21.475EXPORTS 2.420 0.180 2.160 4.020 4.560 6.943DOMESTIC 26.580 26.760 48.650 73.490 66.890 107.203TOTAL 33.670 33.480 61.640 93.030 84.850 135.621
AVERAGE TARIFF PERkWh(USc) ZCCM 0.359 0.332 0.829 1.067 1.154 1.412EXPORTS 0.694 0.625 1.360 1.455 1.548 1.679DOMESTIC 0.642 1.005 1.950 1.709 1.520 2.210
AVERAGE COST PER kWh(USC) ZCCM 1.147 1.552 2.525 3.769 3.270 5.177EXPORTS 1.149 1.500 2.526 3.771 3.400 5.177DOMESTIC 1.285 1.111 1.953 2.905 3.244 3.972
COST COVERAGE RATIO ZCCM 0.313 0.214 0.328 0.283 0.353 0.273EXPORTS 0.604 0.417 0.538 0.386 0.455 0.324DOMESTIC 0.499 0.905 0.998 0.588 0.469 0.556
WD5FPOH2 .XLS 56 12/15/9712:00 PM

Annex 5aPage 3 of 5
1991/92 1992/93 1993194 1994/95 1995/96 199697
ZESCO HISTORICAL FINANCIAL PERFORMANCEProfit and Loss Account
1991t92 1992t93 1993194 1994095 1995619 1996097Audited Audited Audited Audited Audited Unaudited
Sales revenue US$Sm USSm USSm USSrm USSm US$ZCCM 14.614 14.001 35.664 43.948 47.301 57.908RETAIL 13.274 24.199 48.558 43.228 39.761 54.827EXPORTS 14.620 0.747 11.625 15.509 21.624 14.139Total Sales 42.508 38.947 95.746 102.684 108.686 126.674Interest Receivable 1.140 1.440 0.446 1.605 0.372Seivice connection fees 0.375 0.284 0.275 0.616 0.271 0.299Capital grants and contributions 0.206 0.097 0.126 0.113 0.883 0.762Other Income 0.840 1.099 0.016 0.138 0.271 3.477TOTAL OPERATING INCOME 45.069 41.866 96.609 105.155 110.484 131.231
OPERATING EXPENSESKNBC Costs 11.967 9.978 14.193 19.275 21.038 24.460Eiectzidty Purchases 4.231 4.784 2.013 0.716 6.187 3.684Provision for bad debts 0.271 0.337 1.475 0.378 0.559 1.794Depredlation 0.717 0.168 0.887 2.085 2.297 s4.229Maintenance 2.767 2.780 10.270 15.808 3.174 10.535Salaries 6.444 9.767 26.679 38.875 31.684 37.565Adminisratlon and general expenses 2.475 4.852 4.475 11.223 15.986 9.453Transportation 1.411 0.819 1.652 4.870 3.951 5.901TOTAL OPERATING EXPENSES 30.284 33.483 81.643 93.029 84.855 147.621
OPERATING MARGIN 14.785 8.383 34.966 12.126 25.629 -16.390
FINANCE CHARGES
Interest on loans 4.439 6.831 7.414 9.325 6.518 5.532Realized Exchange Losses 5.368 19.761 15.108 4.901 8.684Unrealised Exchange Losses 0.000 0.000 0.000 4.854 17.052 7.093Armzetion of deferred exchange losses 9.296 10.580 10.248 0.000 0.000TOTAL FINANCE CHARGES 19.103 37.172 32.768 19.080 32.2s4 12.825PROFIT/(LOSS) BEFORE TAX and EXCEPTIONAL -4.318 -28.789 2.198 -6.954 4.625 -29.015Exceptlonalirem 0.000 8.348
TAXATION 0.360 0.158 0.010 0.138 0.089PROFIT/(LOSS) AFTER TAX -4.318 -29.149 2.042 -6.964 .0.12 -29.104DividendsNET PROFIT/(LOSS) -4.318 -29.149 2.042 -6.964 -0.412 -29.104
Annual revenue growth (%)(Total OperatingrevenuelPrevious year 186.00 (7.11) 130.76 8.85 5.07 '18.78
Operating Margin (%)(Operating marginlTotalRevenue 32.81 20.02 36.19 11.53 23.20 (12.49)
Operating Ratio 0.67 0.80 0.64 0.88 0.77 1.12Profit margin (%) (Profitbefore TaxtTotal revenue) (9.58) (68.76) 2.28 (6.61) (6-00) (22.11)Retum on partly revaluedfixed assets (%) (profitbefore Taxlaverage fixed 0% -157% 12% -24% (0.01) (0.02)
Debt Service Coverage (NetIncome after taxes+interest
on LT 0.04 (1.08) 0.74 0.15 1.29 1.81
(Net Income beforetax+interest /averageinvestment In assets) (0.05) (37.96) 2.72 (6.54) (0.86) (2.14)Retum on equity (0.07) (1.10) (0.04) 0.14 (0.00) (0.03)
57WDSFOMA2.XLS 1 o26/M75:38 PM

Annex 5aPage 4 of 5
1991132 199219 1991.9 1994V95 19956 1996/97
ZESCO HISTORICAL FINANCIAL PERFORMANCE
BALANCE SHEET
1991192 1992193 1993194 1994/95 199U96 1996197
Audited Audited Audited Audited Audited Unaudlted
RXED ASSETS USSm USSm USSm USSm USSm USvmASSETS IN SERVICE 20.510 20.521 19.004 44.484 1,380.094 1,208.663DEPRECIATION 3.355 1.076 1.621 3.434 4.202 54.229NETFIXEDASSETS INSERVICE 17.158 19.445 17.383 41.050 1.375.893 1.154.434WORK IN PROGRESS 35.681 7.442 11.737TOTAL FIXED ASSETS 52.837 26.887 29.120 41.050 1,375.893 1,154.434INVESTMENTS 0.000 0.12S 0.401 0.009
52.837 28.887 29.24S 41.451 1.375.893 1,154.443
CURRENT ASSETS
CASH & BANK 3.984 5.226 8.310 6.875 7.421 6.138
TRADE DEBTORS 24.817 9.824 60.182 36.405 48.401 75.839
OTHER DEBTORS 9.130 5.893 5.677 22.800STORES & MATERIALS 8.569 4.500 5.926 18.550 9.905 16.610TOTAL 46.499 25.442 80.096 61.830 f3.727 121.385
CURRENT LIABIUTIESCURRENT PORTION OF LONG TERM LOANS 21.850 20.345 32.744 45.376 15.762 18.895
TRADE CREDITORS 3.036 6.516 16.669 6.030 4.354 33.982BANK OVERDRAFT - UNSECURED 1.403 2.341 5.361 2.743 6.098 15.172INTEREST PAYABLE 3.938 1.734 14.422 15.36f9 7.071 2.732TAXATION 0.000 0.360 0.332
OTHER CREDITORS & ACCRUALS 53.635 37.266 14.379 22.373 31.032 35.833TOTAL 83.862 68.563 83.908 91.890 64.317 104.414
NET CURRENT ASSETSI(LIABILITIES) -37.363 -43.121 43.811 -30.060 -0.590 16,970LIABILITIES PAYABLE OVER ONE YEAR -7.490 -16.686 -11.716 -4.349TOTAL FUNDS EMPLOYED 15.474 -16.234 17.945 -5.295 1,363.586 1,167.073
FUNDS EMPLOYED
EQUITY 1.651 0.455 0.316 0.269 0.189 0,168REVENUE RESERVES -8.689 -31.542 -5.587 -55.859 -31.352 47.011REVALUATION RESERVE 0.795 1,326.166 1,150.760CAPITAL GRANTS & CONTRIBUTIONS 11.482 4.720 4.957 5.816 4.993 7.199LONG TERM DEBT 68.804 63.034 69.260 43.684 63.590 45,958DEFERRED EXCHANGE LOSSES -55.769 -52.900TOTAL FUNDS EMPLOYED 15.478 -16.234 17.946 -5.29 1.363.586 1,167.073
RATIOS
Debt to Equity Ratio (Total debt/equIty) 19.95 (3.16) (1-99) (1.82) 0.06 0.06
Cumrent Ratio (times) 0.55 0.37 0.95 0.67 0.99 1.16
FtecevablsSals (days) 213.09 92.07 229.43 129A1 155.83 218.52QuIck atio 0.45 0.31 0.88 0.47 0.84 1.00
WD5FOMA2.XLS 58 101261975:37 PM
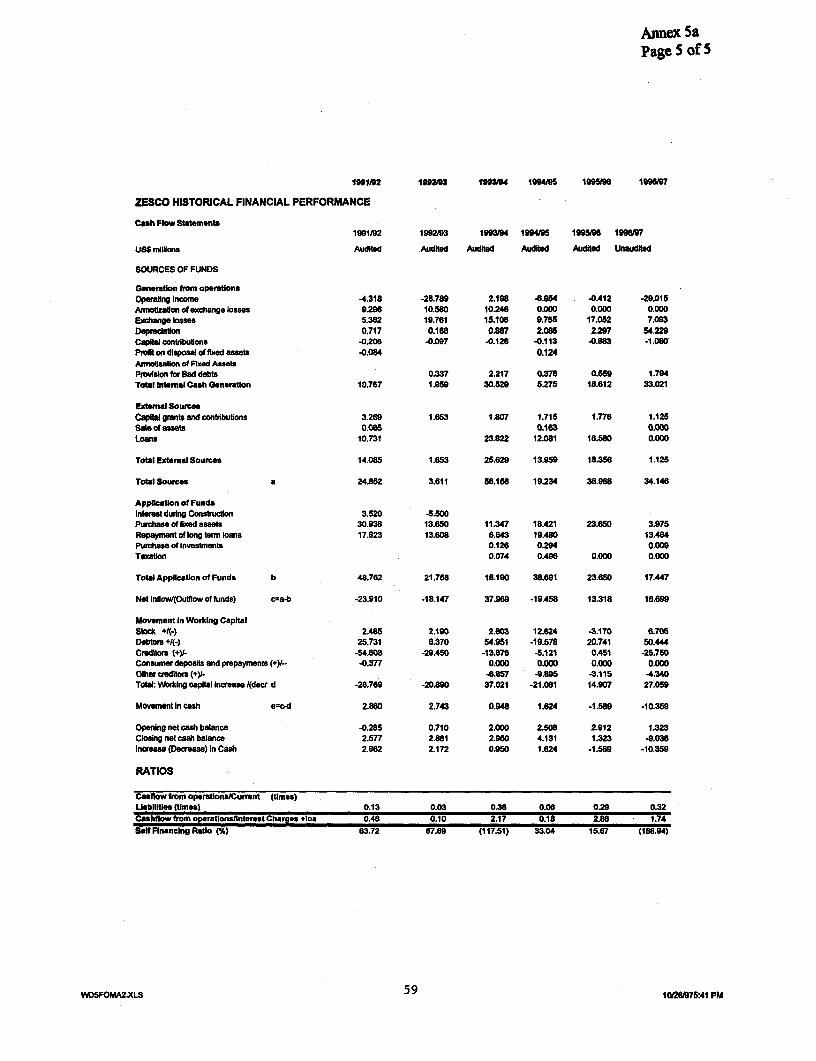
Armex 5aPage 5 of 5
1991/92 19S/ 11934 19iW95 1995196 199697
ZESCO HISTORICAL FINANCIAL PERFORMANCE
C"h Flow Statements1991t92 1992193 1993/94 1994/ 19989 1996/97
US$ millions Audited Audited Audited Audited Audited Uneauditd
SOURCES OF FUNDS
Generation from operAtionsOpwtng Income -4.318 -28.789 2.198 -8.954 -0.412 -29.015Armolizatlon of exchange iosses 9296 10.580 10.248 0.000 0.000 0.000Ex e lWoses 5.362 19.761 15.108 9.755 17.052 7.093Depredaton 0.717 0.1i8 0.887 2.085 2.297 54.229Ctpai contributons 4.0206 -0.097 -0.126 -0.113 -0.883 -1.080PFrofton disposal of fixedassets 4.084 0.124Armioliation of Fied AssebPriion for ad deft 0.337 2.217 0.378 0.559 1.794Total Intemal Cash Generation 10.767 1.959 30.529 5.275 18.612 33.021
Extrnal SouresCapitli gants and contribulions 3.269 1.653 1.807 1.715 1.776 1.125sale of asset 0.085 0.163 0.000Loans 10.731 23.822 12.081 16.580 0.000
Total Externl Sources 14.085 1.653 25.629 13.959 18.36 1.125
Total Sources a 24.852 3.611 58.158 19.234 36.968 34.146
Appication of FundsInteres durng Con*uciion 3.520 -50Purchase of fixed assets 30.938 13.650 11.347 18.421 23.650 3.975Repayment of long term loans 17.823 13.608 8.643 19.480 13.484Purchase of Investments 0.126 0294 0.009Taxafon 0.074 0.A86 0.000 0.000
TotalAppiicatlon of Funds b 48.762 21.758 18.190 38.691 23.650 17.447
Net Inflow/(Outiow of funds) c=a-b -23,910 -18.147 37.969 -19.458 13.318 18.699
Movenent in Working CapitalStock +1(-4 2.485 2.190 2.803 12.624 -3.170 6.705Debtors +/(-) 25.731 6.370 54.951 -19.578 20.741 50.444Cedis (+)f- -54.608 -29.450 -13.875 -5.121 0.451 -25.750Consumer deposits and prepayments (+y- -0.377 0.000 0.000 0.000 0.000Oiher creditos (+Y. -8.857 -9.896 -3.115 4.340Total: Working capital Inrease J(decr d -28.769 -20.860 37.021 -21.081 14.907 27.059
Movement In cash e=cd 2.830 2.743 0.948 1.824 -1.5i9 .10. 59
Opening net cash balance -0.285 0.710 2.000 2.508 2.912 1.323Ciosing net cash balance 2.577 2.881 2.950 4.131 1.323 -9.036Increase (Decrease) In Cash 2.862 2.172 0.950 1.624 -1.589 -10,359
RATIOS
Cawfow from operationslCurrent (times)LiabIlIies (times) 0.13 0.03 0.38 0.08 0.29 0.32Cashfow from operationsainterest Charges +Ioa 0.48 0.10 2.17 0.18 2.86 1.74Self Financing Rato (%) 63.72 67.69 (117.51) 33.04 15.67 (188.94)
WD5FOMA2.XLS 59 128975:41 PM
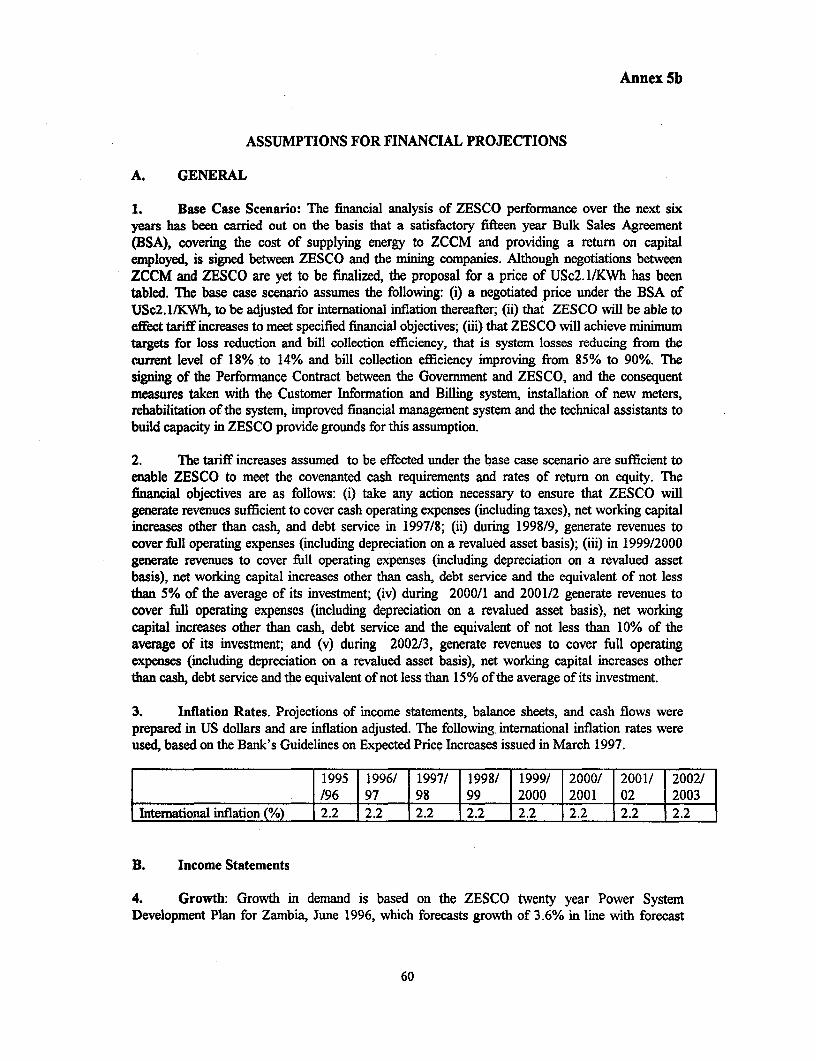
Annex 5b
ASSUMPTIONS FOR FINANCIAL PROJECTIONS
A. GENERAL
1. Base Case Scenario: The financial analysis of ZESCO perfornance over the next sixyears has been carried out on the basis that a satisfactory fifteen year Bulk Sales Agreement(BSA), covering the cost of supplying energy to ZCCM and providing a return on capitalernployed, is signed between ZESCO and the mining companies. Although negotiations betweenZCCM and ZESCO are yet to be finalized, the proposal for a price of USc2.1/KWh has beentabled. The base case scenario assumes the following: (i) a negotiated price under the BSA ofUSc2.I/KWh, to be adjusted for international inflation thereafter; (ii) that ZESCO will be able toeffect tariff increases to meet specified financial objectives; (iii) that ZESCO will achieve minimumtargets for loss reduction and bill collection efficiency, that is system losses reducing from thecurrent level of 18% to 14% and bill collection efficiency improving from 85% to 90%. Thesigning of the Performance Contract between the Government and ZESCO, and the consequentmeasures taken with the Customer Information and Billing system, installation of new meters,rehabilitation of the system, improved financial management system and the technical assistants tobuild capacity in ZESCO provide grounds for this assumption.
2. The tariff increases assumed to be effected under the base case scenario are sufficient toenable ZESCO to meet the covenanted cash requirements and rates of return on equity. Thefinancial objectives are as follows: (i) take any action necessary to ensure that ZESCO willgenerate revenues sufficient to cover cash operating expenses (including taxes), net working capitalincreases other than cash, and debt service in 1997/8; (ii) during 1998/9, generate revenues tocover full operating expenses (including depreciation on a revalued asset basis); (iii) in 1999/2000generate revenues to cover full operating expenses (including depreciation on a revalued assetbasis), net working capital increases other than cash, debt service and the equivalent of not lessthan 5% of the average of its investment; (iv) during 2000/1 and 2001/2 generate revenues tocover full operating expenses (including depreciation on a revalued asset basis), net workingcapital increases other than cash, debt service and the equivalent of not less than 10% of theaverage of its investment; and (v) during 2002/3, generate revenues to cover full operatingexpenses (including depreciation on a revalued asset basis), net working capital increases otherthan cash, debt service and the equivalent of not less than 15% of the average of its investment.
3. Inflation Rates. Projections of income statements, balance sheets, and cash flows wereprepared in US dollars and are inflation adjusted. The following international inflation rates wereused, based on the Bank's Guidelines on Expected Price Increases issued in March 1997.
1995 1996/ 1997/ 1998/ 1 1999/ 2000/ 2001/ 2002//96 97 98 99 2000 2001 02 2003
International inflation (%) 2.2 2.2 2.2 2.2 2.2 2.2 2.2 2.2
B. Income Statements
4. Growth: Growth in demand is based on the ZESCO twenty year Power SystemDevelopment Plan for Zambia, June 1996, which forecasts growth of 3.6% in line with forecast
60

Annex 5b
national economic growth. Growth is expected fromn both new connections and increasedconsumption by current consumers.
Estimates of exports (transmission and distribution) provided by ZESCO as follows:-
GWh 1997/8 1998/9 1999/0 2000/01 2001/02 2002/3ZESA 1,314 0 , .Nanuibia 724 724 724Botswana 5 26 26 26 26 26
ZESCO's investment program includes an interconnecter between Namibia and Zambia. Exportsto Namibia will conmmence in 2000/1 upon the commissioning of the interconnector.
5. Revenue: Based on current discussions between ZESCO and ZCCM, it was assumed thatthe ZCCM tariff would be USc2. 1/KWh effective October 1, 1997, and would increase byinternational inflation thereafter. The ZCCM tariff at USc2.1/KWh is comparable to other bulksupply agreements in the region including the current contract between Zanbia and Zimbabwe at1.5 cents, although the later is negotiated annually. It is assumed the export tariff would be linkedto the Power Pool price of about USc2/KWh. The retail tariff would be adjusted to meet thefinancial objectives in para 2 above. Under the base case scenario, the domestic tariff wouldincrease from USc 2.98/KWh in 1997/8 to USc4.40/KWh in 2002/3, an annual average increase indollar terms of 9.5%.
6. System Losses: It is assumed revenue would be increased due to a reduction in systemlosses. Losses are low as 50% of sales are bulk supply at 330Kv with losses of only about 3%.Losses are assumed to reduce as follows: 1997/8 -13%, 1998/9- 12%, 1999/0 - 11%, 2000/1 -10%, 2001/2 - 9%; and 2002/3 - 8%.
7. Other Income includes the sale of unproductive assets. It has been assumed to increase atthe rate of inflation.
8. Interest Income: It is assumed interest will be received on surplus cash balances at 2%per annum.
9. Operating Expenses:
(a) Disel: It is assumed the cost of diesel will increase by inflation
(b) Salaries: Salaries will increase by the rate of inflation. ZESCO rationalized itswork force in 1995/6, and it is anticipated the current salary levels would notchange significantly.
(c) Operations and Maintenance: Estimated at 2% of gross revalued fixed assetsat the end of each period
(d) Administration: Increase at the rate of inflation
61
Annex 5b
(e) Bad Debts: ZESCO is implementing measures to increase its billing andcollection procedures. The provision for bad debts has been assumed as a
percentage of domestic sales as follows: 1997/8 10%; 1998/9 10%; 1999/0 9%;2000/1 8%; 2001/2 and thereafter 6%. It is assumed that bad debts will increaseduring the first two years of the project due to higher tariffs, and the introductionof new systems which would have initial tart up problems. Thereafter bad debtswould reduce as the improvements starting having a positive effect.
No bad debts were assumed on ZCCM and export sales. The BSA provides fordisconnection of supply 45 days after the due date, and as a private companysupplying the mines, it was assumed payment would be prompt. ZESCO has notexperienced bad debts on its exports to Zimbabwe, and does not anticipate anybad debts from namibia, which has a financially sound electicity utility.
(f) Electricity Purchases: It is assumed ZESCO will purchase electricity to meetboth its domestic demand and export commitments. It is assumed electricity will
be purchased at the pool price of USc2.0/KWh. Purchases will commence in2001/2, and would be 700GWh, and in 2002/3, 795GWh.
(g) Depreciation: On existing assets, based on revaluation, and the estirnatedremaining useful life as follows:
Asset Class Useful Life Estimated Remaining_ _ _ _ _ _ _ _ _ _ _ _ _ _ _ _ _ _ _ _ _ _ _ _ _ _ | L ifeGeneration 50 35Transmission/Distribution 25 16Diesel/Generation 15 10Buildings 45 25Transport 5 3Others 10 5
Depreciation on new assets was provided at an average rate of 4.4% per annumon the value of the assets.
(g) Provision for Drought: A provision for drought of US$2 million per annum wasprovided. This would meet the cost of importing electricity in cases of drought.It is assumed a serious drought would occur every ten years.
(h) Transport costs are assumed to increase at the rate of inflation.
(i) Corporation tax is calculated at 35% of taxable income.
C. Balance Sheets and Cash Flow Statements
10. Fixed Assets: Technical assets were revalued in 1995/6 and 1996/7 and the results of therevaluation were incorporated in ZESCO financial statements. Non-technical asset revaluationdone by ZESCO management - market value used as a basis for all buildings/property.
62

Annex Sb
11. Capital Investment Program: ZESCO's capital inve-.tment program consists of theproposed project and ZESCO's own investment progrm. The following table shows details fbrfixed asset accounts:
Projections11997/98 1998/99 1999100 2000/01 2001/02 2002103
Sdhedule 1 Fixed asset Formation USS 000Gro FLxed Ahus
Opening Balance 1,208,663.0 245,370.0 338,392.9 14 .3 54481.9 1,643,964.8Addition 36,707.0 93,022.9 111,755.4 98,333.5 95,482.9 72,501.1Capition 0.0 0.0 0.0 0.0 0.0 0.0MWor epain expend. 0.0 0.0 0.0 0.0 0.0 0.
Gran Fixed Asst - Hitoical 1,245,370.0 1,338,392.9 1,430,14S3 1,548,481.9 1,643,94.8 1,716,465.9
Amulated depecaionOpeing Balance 54,229 120,592 190,115 261074 332989 402,588Anual Depreciaon 66,363 69,523 70,959 71,915 69,599 87,291Adjfoprevio-uyean 0-_ 0_ 0 0 0 0CosingBalauKeHistorical 120,592 190,115 261,074 332,9S9 402,522 429,879
Net fixd Assts-Historical 1,124,778 1,148,2781 1,189,075 1,215,493 1,241,377 1,226,587
12. Current Assets were estimated as follows:
(a) Stores were calculated at 1.5% of gross fixed assets.
(b) Debtors assumed as follows: 1997/8- 160 days, 1998/9- 120 days, 1999/0 - 90days, 2000/01 and thereafter 60 days. Higher tariffs and new systems will resultinitially in high outstanding debtors.
(c) Other debtors comprise mainly of prepayments on contracts, and staff loans. Itwas assumed other debtors would be 10% of for the year salaries, and 15% ofthe year's capital expenditure program.
(d) Cash. Cash balance is derived from the cashflow statements. It is influenced bydebtor and creditor policy, and the annual investment program.
13. Current Liabilities were esfimated as follows:
(a) Accounts Payable were projected at one month of cash operating expenses andinterest for the year.
(b) Other Pavables are calculated as 1.7% of salaries (pensions), 2.9% of sales(VAT) and 1.7% of sales (Rural Electrification Fund).
(c) Current portion of long term debt prepared in line with the amortization scheduleofthe loans
14. Capital Grants: It was assumed grants would remain constant.
15. Long term Debt and Interest: Borrowings for the proposed project include the proposedIDA credit and related cofinancing. Borrowing costs have been prepared on the basis of tentativeinterests expressed by the financiers participating in the project.
63
Annex 5b
16. Interest During Construction (IDC) is capitalized and added to work in progress, fromwhich it is transferred to fixed assets for project commissioning.
17. Revenue reserves affected by movements in profit & loss account only.
18. Share Capital assumed constant over the period
19. Revaluation Reserve assumed constant.
64
MESCO, Financial Performance - Project Appraisal Document CHANGES.XIA 12tl3/ 6:00 PMPage 1
_ ZESCO Itd
%n ProjectionsP c1997198 1998/9 1999/00 2000/01 2001/02 2002/03
PROFIT & LOSS< Total income 164,748 188,780 206,288 217,143 246,177 267,956
Energy Sales 164,748 185,780 206,288 217,148 246,177 257,956Domestic Sales 74,886 92,116 108,445 117,716 128,930 137,893ZCCM SglIes 74,813 93,274 97,453 99,037 102,247 105,063Exports 16,06>0 390 390 390 16,000 15,000
Other Income 0 0 0 0 0 1 0
Operating Expenses 96,509 101,492 104,605 107,252 123,981 129,196Supply coats 0 0 0 0 15,273 17,728Own production 4,000 4,088 4,178 4,270 4,364 4,460Salaries 39,600 40,471 41,362 42,272 43,201 44,182Operations & Maintena 22,496 23,471 24,840 26,950 27,086 27,382Administration 10,430 10,894 11,379 11,886 12,413 12,966
Bad Debts 11,233 13,817 14,098 14,126 12,893 13,789Provision for Dought 22,0002 2,000 2,000 2,000 2,000
Transport Cost 6,780 6,750 6,750 6,750 6,750 6,780
Depreciation 66,363 69,523 70,959 71,918 69,899 87,291Existing and renewals 66,363 69,523 70,959 71,915 69,599 71,266 urNew Investments 0 0 0 0 0 16,035
Total Operating Expenses 162,872 171,014 175,565 179,167 193,580 216,487Financial Items 5,170 3,770 1,289 -818 30,756 32,132
Interest Existing Debt 5,278 4,139 2,632 2,421 16,937 17,859Interest New Loans 0 0 0 0 17,982 18,925Less IDC chaged toWIP
Intereatincome *108 -369 -1,343 -2,936 -4,163 -4,652
'Profit after financial items -3,293 ] 10,996 29,434 1 38,490 21,840 9,337
Other Income 0 0 0 0 0 0Exceptional Item
Exbnerate lossesIProfit before taxes -3,293 10,996 29,434 | 388490 21,840 9,337
Taxes and Dividends 0 3,849 10,802 19,726 11,193 1 4,788Corporate Tax 0 3,849 10,302 13,472 7,644 33,268]Dividends 0 0 0 6,2551 3,549 j. 5171
Retained profit after taxes .3,293 7,147 19,132 26,019 1 14,196 1 6,069
-ESCO, Finacil Performance . Project Appraisal Document CHANGES.XLS 12113/S7 6:00 PMPage 2
Z ESCO ltdProjections
K4 _ __1997/98 199S/99 1999100 2000/01 2001JW2 2002W03
BALACE SHEET
A setsCurrent Assets 93,791 117,546 ] 181,521 255,278 295,659 310,066
Cash 4,659 32,209 102,101 191,500 224,783 240,415Trade debtors 60,986 47,261 36,768 21,569 27,574 28,614Other debtors 9,466 18,001 20,899 18,977 18,643 15,290Stores 18,681 20.076 21,752 23,227 24,659 25,747
Net Fixed Assets 1,124,787 1,148,28i7 1I9,0 83 1,216,602 1,241,386 1,226,596Existing 1,208,663 1,208,663 1,208,663 1,208,663 1,208,663 1,208.663New Investments 36,707 129,730 241,485 339,819 435,302 507,803Acc. Depr. Exist, 120,592 190,115 261,074 332,989 402,688 473,844Acc. Depr. New. 0 0 0 0 0 16,035Capital WIP |i O 0 0 0 0 0
Investments (financia 9 9 9 9 9 9Total Assets 1,218,586 1,265,842 1,370,612 1,470,76S 1,537,063 1,686,671
LiabilitiesCurrent liabilities 64,996 62,237 69,505 67,850 100,744 102,280
Accounts Payable 31,848 33,492 34,520 35,393 40,914 42,635Other Payables 26,42 21,376 26,781 28,916 65,374 53,207Current portion 16,695 7,369 8,204 3,571 4,456 6,438Bank Overdraft . .
Liabilities over I year 4,349 4,349 4,349 4,349 4,349 4,349Existing Loans 29,263 22,351 15,440 14,035 12,630 11,225New long term loans 0 47,777 131,059 207,241 232,110 227,077
PRP Loans 0 47,777 118,578 194,761 220,264 215,845Other Loans 0 0 12,480 12,480 11,856 11,232
Grants 7,199 7,199 7,199 7,199 7,199 7,199
Provision for drought 2,000 4,000 6,000 8,000 10,000 12,000
Equity 1,110,623 1,117,771 1,136,903 1,161,922 1,169,563 1,172,383Share Capital 168 168 168 168 168 168Revaluation rese 1,150,760 1,150,760 1,150.760 1,150,760 1,150,760 1,160,760Revenue reserve *40,304 -83,157 .14,024 10,994 18,936 21,456
Total Liabiliteis & equity 1,218,586 1,265,842 1,370,612 1,470,788 1,537,053 1,536,671
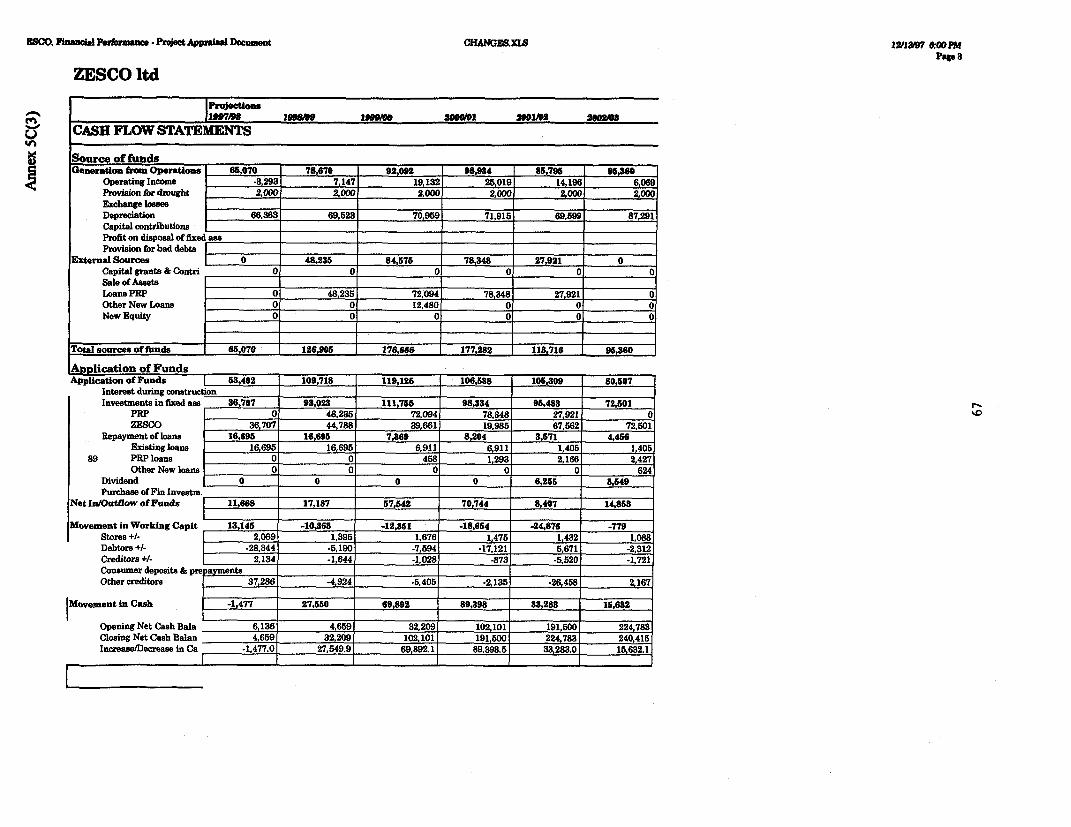
CSCO. FPnan Permans -ProiectApprasl Document CHANGES XL 12/18W97 kOOPMPagea
ZESCO ltd
11997/98 10999 Is9"980 320991 21302 2
CASH FLOW STATEMENTS
Source of fundsGeneration from Operations 65,070 78,670 92,092 98,934 86,795 9586,0
Operating Income -3,293 7,147 19,132 25,019 14,196 6,069Provision for drought 2,000 2,000 2,000 2,000 2,000 2Exchange lossesDepreciation 66,363 69,523 70,969 71,915 69,599 87,291Capital contributions __ _ ._.____Profit on disposal of fixed assProvision for bad debts _
External Sources 0 48,235 84,575 78,348 27,921 0Capital grants & Contri 0 0 0 0 0 0Sale of Assets _Loans PRP 0 48,235 72,094 78,348 27,921 0Other New Loans 0 0 12,480 0 0 0New Equity 0 0 0 0 0 0
Total sources of fimds 65,070 12C,906 176,666 177,282 113,716 95,S60
Agplication of FundsApplication of Funds | 53,402 109,718 119,125 106,538 105,309 80,507
Interest during construction _Investments in fixed ass 36,707 93,023 111,765 98,334 95,483 72,501 r-
PRP 0 ° 48,235 72,094 78,348 27,921 0ZESCO 36,707 44,788 39,661 19,985 67,562 72,601
Repayment of loans 16,695 16,696 7,369 8,204 8,671 4,456Existing loans 16,695 16,695 6,911 6,911 1,405 1,405
89 PRP loans 0 0 458 1,293 2,166 2,427Other New loans 0 0 0 0 0 624
Dividend 0 0 0 0 6,256 3,549Purchase of Fin Investm. . ,
Net In/Outflow of Funds 17,187 57,542 70,744 8,407 14,863
Movement in Working Capit 13,145 -10,363 -12,351 -18,654 -24,876 -779Stores +/- 2,069 1,395 1,676 147 1,432 1,088Debtors +/- -28,344 -5,190 -7,594 -17,121 5,671 -2,312Creditors +1- 2,134 -1,644 -1,028 -873 .5,520 -1,721Consumer deposits & pre ayments _Other creditors 37,286 -4,924 .5,405 .2,135 -26,458 2,167
|Movement in Cash -1,477 27,650 69,892 89,898 38,283 15,632
Opening Net Cash Bala 6,136 4,659 32,209 102,101 191,600 224,788Closing Net Cash Balan 4,659 32,209 102,101 191,500 224,783 240,415Increase/Decrease in Ca -1,477.0 27, 549.9 69,892.1 89,398.5 33,283.0 15,682.1
f _ .~~~
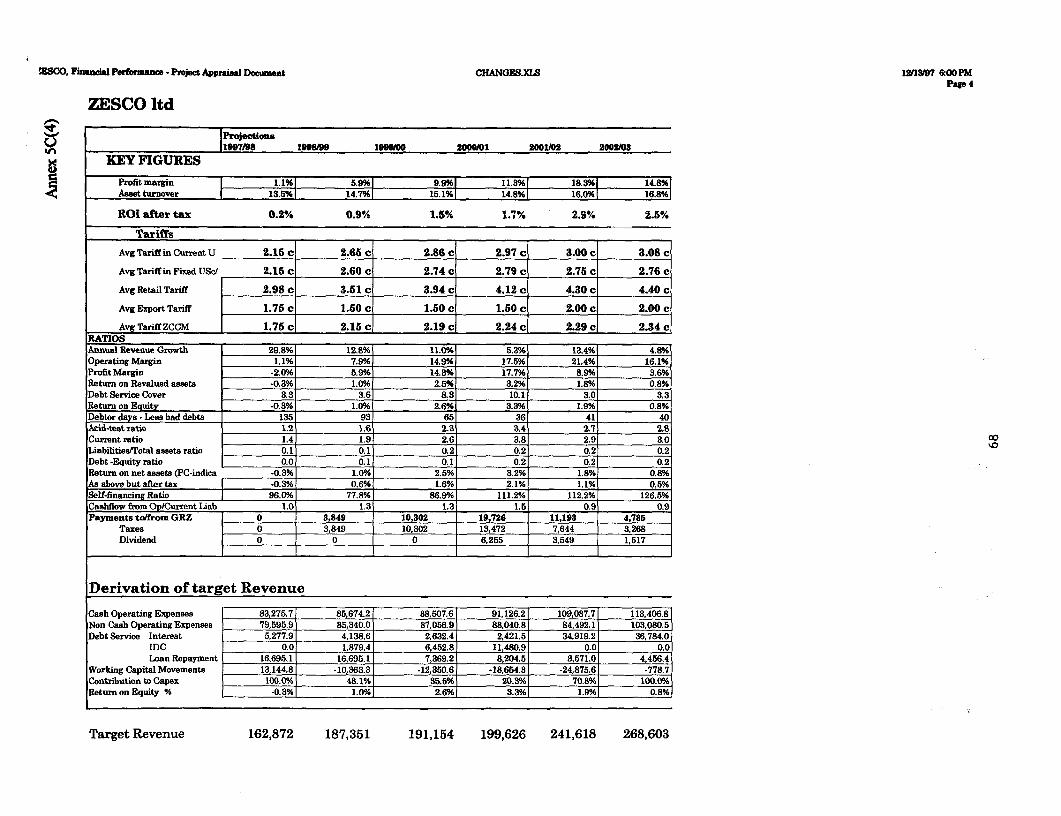
2SCO. Finail Perbtb me . Project Aeprisl Document CHANGES.XLS 12/13a 6.O0 PMPage 4
ZESCO ltd
Projections1997/98 1998/99 199900 2000101 2001V02 2002003
KEY FIGURESProfit margin 1.1%l 5.9%1 9.9%1 11.3%1 18.3% 14.8%Asset turnover 1 13.5%, 14.7%1 15.1%1 14.8%1 16.0%| 16.8%1
ROI after tax 0.2% 0.9% 1.6% 1.7% 2.9% 2.6%
Tariffs
Avg Tsriff in Current U 2.16 c 2.65 c 2.86 c 2.97 c 3.00 c 3.08 c
Avg Tariff in Fixed US&/ 2.15 c 2.60 c 2.74 c 2.79 c 2.75 c 2.76 c
Avg Retail Tariff 2.98 c 3.51 c 3.94 c 4.12 c 4.30 c 4.40 c
Avg Export Tariff 1.75 c 1.50 c 1.50 0 1.50 0 2.00 c 2.00 c
Avg Tariff ZCCM 1.75 c 2.15 el 2.19 c 2.24 c 2.29 c 2.34 cRATIOSAnnual Revenue Growth 29.8% 12.8% 11.0% 5.3% 13.4% 4.8%Operating Margin 1.1% 7.9% 14.9% 17.5% 21.4% 16.1%Profit Margin -2.0% 5.9% 14.3% 17.7% 8.9% 3.6%Return on Revalued assebt 0.3% 1.0% 2.5% 3.2% 1.8% 0.8%Debt Service Cover 3.3 3.6 &3 10.1 3.0 3.3Return on Equity -0.3% 1.0% 2.6% 3.3% 1.9% 0.8%Debtor days. Less bad debts 135 93 65 36 41 40Aidd testratio 1.2 1.6 2.3 34 2.7 2.8Current ratio 1.4 1.9 2.6 3.8 2.9 3.0 00Liabilities/Total assets ratio 0.1 0.1 0.2 0.2 _ 0.2 0.2Debt -Equity ratio 0.0 0.1 0.1 0.2 0.2 0.2Return on net asset (PC-indica .0.3% 1.0% 2.5% 3.2% 1.8% 0.8%As above but after tax .0.3% 0.6% 1.6% 2.1% 1.1% 0.5%Self-financing Ratio 96.0% 77.8% 86.9% 111.2% 112.2% 126.5%Cashfiow from OP/Current Liab 1.0 1.3 1.3 1.5 0.9 0.9Payments to/from GRZ 0 3,849 10,302 19,726 11,193 4,786
Taxes 0 0 3,849 10,302 13,472 7,644 3,268Dividend J 0 0 0 6,255 3,549 1,517
Derivation of target Revenue
Cash Operating Expenses 83,275.7 85,674.2 88,507.6 91,126.2 109,087.7 113,406.8Non Cash Operating Expenses 79,595.9 85,340.0 87,056.9 88,040.8 84,492.1 103,080.5Debt Service Interest 5,277.9 4,138.6 2,632.4 2,421.5 34,919.2 36,784.0
IDC 0.0 1,879.4 6,452.8 11,480.9 0.0 0.0Loan Repayment 16,695.11 16,695.1 7,369.2 8,204.5 3,571.0 4,456.4
Working Capital Movements 13,1
4 4.8
-10,363.3 .12,350.6 -18,654.3 -24,875.6 -778.7Contribution to Capex 100.0% 48.1% 35.5% 20.3% 70.8% 100.0%Return on Equity % .0.3% 1.0% 2.6% 3.3%1 1.9% 0.8%
Target Revenue 162,872 187,351 191,154 199,626 241,618 268,603
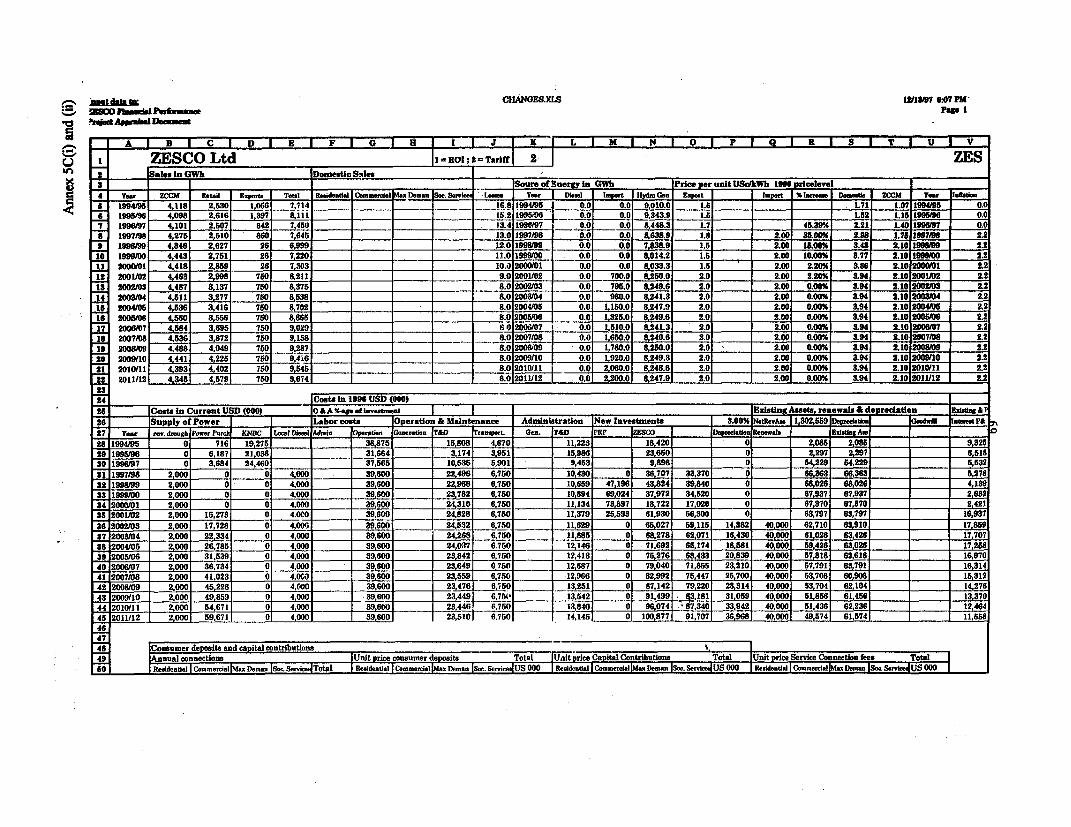
i-. IAial.m CIIANGES.XSI.8 21896.? FM'
.~~ApprtlbasIIheft
ZESCO Ltd II xRwI; =Tariff 2 ZES2 Sales in GWh D3omestic Bsole.
3 1 B~~~~~___ oure of8 j In GWih Price pr unit UJh1966 a,rlcelevel4 Y. I ZCCM Retail Exoarn Total Residential Cam.mxca Max Seoua Saw. Seti- Lemase Yam. Dciasl Impct Hy dro Gen Expat _ I.pwt % 1 Domekk 1OCM Year IaflaIlee5 1994/95 4.118 25630 _I0(6 7.714 __ _-__ 16.8 1904/95 0.0 0.0 9,010.0 1.8 _ 1.71 1.07 1904/95 _ .
6 1995/9 4.098 2.616 1.397 8,111 18.2 199&i964 0.0 0.9 9,343.9 1.5 1.82 1.15 1995/96 007 1996197 4,101 2.507 842 7.480- U___14 1990/97 __ 0.0 __0.0 8,448.3 1.7 45.39% 2.21 1L40 199619 0.0S 1997/98 4,275 2,510 86 7,645 13.0 1997/98 .0.0 __ 0.0 8638.9 1,8 2.60 33.00% 1.98 1.75 1007/90 2.2* 1998/9 4,346 2,627 26 6.999 12.0 1998/99 0.0 0.0 7838.9 1.5 2.60 15.00% 3.43 2.10 1096899 2.210o 19990 -4,443 2.751- 26 7,220 11.0 1999/00 0.0. 0.0 8014.2 1.8- 2.00 10.00% 3.77 2.10 1999/90 2.211 2000/91 4.418 2.859 26 7,303 10.0 2000/01 0.01 0.0 8,033.3 1.8 2.00, 2.20% 3.86 2.10 2000/0 2,212D 200/2 4,463 2,998 780 8,211 ____ _ 9.0 2001/02 ___0.0 -700.0 80250.0 2.0 2.001 2.20% 3.94 2.10 2001/02 2.2
18 2002/93 4,487 3.137 780 8.375 _______ _______ 5.0 2002/03 _____ 0.0 795.0 8,249.6 2.0795 2.00249 0.000 0.94 2.10 32002/0102.214 2003/4 4,511 3,277 780 8.538 ___ __ ______ - 8.0 2008/04 ___0.0 980.0 8,241.3 2.0 2.00 0.00% 3.4 21 20/42215 2004415 4,586 3,416 780 8.702 ___ ___ 8.0 2004/05 __ 0.0 1,180.0 8,247.9 2.0 2.00 0.00% 2.94 2.10 2004195221re 2005/9 4,560 3.556 750 8.865 ________ _ .0 2005/0 0.0 1,325.0 8,249.6 2.0 2.00 0.00% 8.94 2.10 2005/9 2.217 2006/7 4,584 3,695 780 9.029 ________ ___ 1. 20/7 __ 0.0 1,510.0 8 ,24131 2.0 2.00 0.00% 3.94 2.10 2006007 2.2i8 2007/08 4,536 3,872 I 7801 9.1581 ________ ___8.0 2008 0.0 1.650o.0 8240.61 2.0 2.00 0,00% 3.94. 2.1012007/08 2.219 2008/9 4.8 .4 7801 9.2871 _______ 8.0 20o0 __ . 8. 200 2020 .0 .4 21 089 .20- 2009/10 441 4.2225 70 946_______ 8.02091 __0. 1900 84.3 .0.0 000 394 .020/02221 2010/11 433 440 8 9.5451 ____ 1___ ___ _ 8021/1 __00 2000 8286 2020 .0 .4 21 001 .2r2 2011/12 435 4.579 780 964________________ 8021/2 00 0. 270 2020 .0 .4 21 011 .
U9Cot 5in 129 US!) (006) Existing Assets, a d ____c_at28 lCosts in Crrent US)(000) -0 a A %-age o efl.axl,eat I Z 7 - .- _ _%xtnAse.,eewl&deectonalameag P&26 iSupply of Power ________Labor coats 0peratlion & Maintenance Adnx1nistration New Investments 8.00% NatRevAss 1,302,559Deeato odil a,ntP27 Year row, d-mxa&e Part ICNBC Locacl Diem? Adaia Operatin G,uaratio T&D ?rapx. Ge,. r&D PEP ZESCO ___ Depamcaiaao Rensuat28 1994/95 0 716 19,275 __ _38.875 50 4,670 11,223 __ 18.420 0 __ _ 2.085 208829 1995/6 0 687 21,038 ____31084 3 __9_1 15.986 ____ 23.650 _______0 __ _ 2,297 2,297 ,130 1996/917 0 3.684 24,460 ___ ____ 37,86G5 10,535 5.901 9.453 ___ 9,89 & __ 0 54,229 54,229 5__53231 1997/95 2 000 0 ~~ ~~~~0 4.0001 39.600 2246 6.750 10.430 0 36.707 33.370 - 0 6____ 0863 66,582332 1998/9 2.000 0 0 4.0001 39 2296 6.750 ___ 1-0.659 47,196 48.824 39.840 ____ 06___ 88026 68,026 41933 1999/00 2.000 0 0 4.000 39. ___00278 6.750 1894 690224 37,97 34,20 0 7,37 6,97 6234 120000 2,000 01 0 4.000 39 24.310 6.750 11,134 73,397.172 17.20 0 7.70 67_7_24235 12001/02 2.%000 15,273 0 4.0010 __9_000 24,828 6,760 __ 11,379 25.593 61,930 56,300 __ 0 ___ 63.797. 63,797 1,33612002/03 1 2,000 17,728 0 40 39,600 ____ 2,.2 6.750 -11.629 __ 0 65.027 59.118 14,382 40.000 62,710 63,910 1,537 2003/04 2,000 22,334 0 4.000 ___ 39,60 24.260 6.750 ____ 11.885 __ 0 68.278 62.071 16.420 40.000 61.026 63,426 17__70738 2004/05 2,000 26.785 0 4.000 ___ 39600 24,037 6.750. 12.146 ____0 71,692 65.174 18.581 40.000 89,426 63,026 1,539 2005/06 2,000 31,539 0 4.000 8___ 9,60 23,842 6.750 12.413 ____0 78.276 68.433 20.839 40000 87,818 62,618 1,740 2006/07 2.000 36.734 0 4.0 ODO __ 39,60 23649 6 780 12,687 0 79.040 7 1.888 23.210 40.000 57.791 63,791 1,141 2007/08 2 000 41,023 0 4.0 .39.60 23.859 6.750 12.56 ___ 0- 82.9202 78,447 25.700 40.000 83.708 60,908 1.142 2008/9 2,000, 45,228, 0 4.0 ____ 39,60 23.476. 6,780 L___ 1.251 0 87.1421 79.220, 28.314 40.000 53,7041 62 104 12743 2009/10 2,0001 49,8591 0 4.000_6____ J -9,6 3,4491 6,7b1' 13.542 0l 91499 L3I 31,089 40.000 51 886 61,45644 2010111I 2,0001 54,6711 0 400___ J39,60 23,446 8_ ,750 ___ 13,840 ____0 ::04 '8.340 33.4 40.0001 81,4361 62,2361246485011 0 967 .0 ___ 39.60 23,510l 6,750 14,145 ol__ 100 77 91,7071 3_6.968 40.0001 49,5741 61,8741 11____
47
48 ConeuMer deosits ande caital contributions dTT F nrbtos 4. og ntpk evc oncinft oa49 Annual oDnnections Unit Price consmrd teTtUitt is C tall CotitonTta UitrcSrIeCnntonfsTtl
80 Residats Ce ,aa atiaa ScalncaToI RadeCalCa,,colax,,naSa. ocieUS00aa,dxia oaa,cala IeDaSc.Sni,US00,e,daIa Ca,Is..xDrm Sc SriS. S 0

'fltdfSAa- i CHANGES XLS 12/lW? &-WPM'
htfacttAppuhaimiDocument
A I 11 I Y I Z IAA IAB AC I AD IAZ A AG I A Al
I O0Ltd
3 Beal term increase in % Ezsclation fact@res Finn Export Non-Fi Exor4 Year _ __ labo_ __e_w IAIOS. Fue1l Materials 18800 GW U&&JWh OWlh uSc/wh
S 199415 0.0O 0.01__ 0.0 _ 0.0 _ .01.00 .0 1.00 1.00 1.46 0.0 0.001 os99e o.o 0.01__ 0.0 0.0 1.00 1.0 1.T-~ 00 1.00 1.00 13.0 1.55 0.0 0.00
7 199617 0.0 0.0 __ . _ 0.0 1.00 1.tlO 1.00 1.00 1.00 842.0 1.70 __ 0.0 0.50S 99M9 0.0 0.01__ 0.0 0.0 1.00 1.001 1.00 1.00 1.00 860.0 1.76 __ 0.0 0.50* 1998199 0.0 0.0 0.0 0.0 1.0 1.02 1.02 1.02 1.02 26.0 1.50 0.0 0.50
10 1999/0 0.0 0.0 __ 0.0 ___0.0 1.04 1.04 1.0F4 '-X.04 1.0-4 26. 1.50 ____0.0 0.5011 2000/01 0.0 0.0 ___0.0 ___0.0 1.07 1.07 1.07 I 1.07 1.07 26.0.__ 1.50 ___ .0. 0.50
12 2001/02 0.0 0.0 0.0 0.0 1.09 1.00 1.00 1.09 -1.09 750.0 ___2.00 __ 0.01 0.5013 2002/03 0.0 0.0 ___0.0 0.0 1.11 1.11 1.11 1.11 1.11 750.0 ___2.00 __ 0.0 0.514 2003/4 0.0 0.0 ___0.0 ___0.0 1.14 1.14 1.14 1.14 __1.14 750.0 ___2.00 __ 0.0 0.5015 2004/05 0.0 0.0 ___0.0 0.0 1.16 1.10 1.16 1.16 1.1b MA6. __ 2.00 __ 0.0 0.5016 200510 0.0 0.0 ___0.0 ___0.0 __1.19 1.19 1.19 1.19 _ 1.19 750.0 ___2.00 ____0.0 0.5017 2006(07 0.0 0.0 ___0.0 ___0.0 1.22 1.22 1.22 1.22 1.22 750.0 ___2.00 __ 0.0 0.0018 2007/08 0. 0.0 0.0 ___0.0 1.24 1.24 1.24 1.24 1.2 75. 200__ .0 .019 2008109 00 0.0 -0.0 __ 0.0, 1.27 1.2(7 1.27i 1.27 1.7 500 20 __ .0 .0aso 2009(10 00 00 00__ 0.0 1.3 1.30 1.0 15 130 7.0__200__ .0 .021 2010/11 00 0.0 0.01 ___ .0 1.3 1.3 13N.3 1.3 700 20_ _00 0012 2011/12 0.0 0. 0.nn _00 130 13 5 .6 .0 700 200_ _00 00Is14 Loans Equity______IS p__] Return on Selfinan. UJnrecov. No days Stoek in AmortisAtion of Percentage26 _____Inter. WIP EquilyUSD Investme Investor, accounts receivabte Ii of asst ____ Leoans foLrcalcuating27 Year 168.0 % S I I Exiotieg PRP jothsl,ans I OtherPa ables028 1994195 .- 5 100 0.87 150.7 41.7 0 0.0alree 2.5%A
291995/9 ___ 5 100 1.41 156.0 0.72 __0 _ 50 Sal. a 4.4%30 1996/97 0 5 100 3.29 223.7 1.4 16,695 0 5.0 Sales L 2.5%81 11097/98 0 5I 66 15 160.0 1.5 16,695 0 5.0 Percents eo32 1998199 1.879 5 I 100 156 120.0 1.5 16,691 0 5.0 forjcalculating33 1999/0 6,453 5 100 15 00.0 1.5 6 911 455 .0 OtherDbtr84 12000/01 11401 6 100 12 60.0 1.5 6,911 1,293 5.0 Salaries OA 10%36 2001/02 0 6 100 10 50.0 1.5 1,405 2.166 5.0 Cape (Dow 15%36 2002/03 0 7 100 10 60.0 1.5 1,405 2,427 5.037 2003(04 0 1 100 10 60.0 1.5 1,405 4,409 5.088 2004/05 0 8 100 10 60.0 1.5 1,4L05 4,409 5.0So 2005/0 0 8 100 10. 60.0 1.5 1.405 7.858 5.040 2006/7 0 ____ 8 10 10 60.0 1.5 1.405 10,140 5.0 ____
41 2007/0 0 8 100 10 60.0 1.5 1.827 10 140 5.041. 2008(0 0 8 100 10 60.0 1.5 172 10 140 5.043 2009(10 0 8 10oo __ 10 ___60.0 ___1.5 __172 10,140 5.0
442010/11 0 8 100 10 60.0 1.5l 172 J7 i Lfl451201-1/12 0 8 100 10 60_ 0.L...2.10A.140_ 172
41

SOO Finsanal Per6msn-e PmottAppml Doument CNANQRas 12naW :02 PMPep I
. ZESCO ltd.'X 0
PROM & LOSS 10070 loam 10708 200"I SOOAI 200201 200004 200400 2006 2006*7 200708
0 w PROFI & LSTotal InCome 164,748 188,780 206,M 217,14S 246,177 267, 270,142 262,746 206,781 0,"61 S.151Snergy Sales 164,748 186,780 2068 217,148 246177 257.6 270,142 282,746 26781 21] 322,181
Doestic Saba 74,886 92,116 108.445 117,716 128,98D 187,893 147.188 18 166816 177,170 188.732ZCCM Sale 74,813 93,274 97,458 99,087 102,247 105,0S6 107,953 110,920 113,9S5 117,091 118,419Export 16,060 390 390 390 16,000 15,000 1O.O 15,00D 15,000 5,000 15.000
Other Inoome ae0 0 0o 0 eS 0 0 0 0 0
Operating Expenses, ,60 101,492 104,60 107,252 123,981 129,1986 186679 144,128 15 012 160 480 1 8,349Supply ct 0 0 0 16,27S 17,728 2, 26,78U 81,890 16,784 41,02Own production 4000 ,08 4,178 4,S70 4,J84 4,460 4,86 4,668 4,761 4,S6 4,972Salaries J!.O 40,471 41,362 42,272 4S,201 44,152 45,122 46,116 47,11 48,167 49,27Operations & Maintena 22406 22,471 24.40 25,9U 27,086 27,562 27,652 257,902 28,276 2,786 SAdministration 1,UO 10,894 11,879 11H 6 12,413 12,096 18,642 14,145 14,774 16,481 16,11S
3adDs 11,233 13,817 14,098 14,126 12,893 13,789 14,719 15,6583 16882 17,717 18M973P,ovisiu, f,t D,w,ght 2,000 2,000 2,000 00000 2,000 2,000G 2,000 S,00 2,000G 2,000 S,00
Transport Cost 6,760 6,750 6,750 6.760 S,760 6,760 6,750 61,760 S.760 S,760 6,750
Depreciation S8,563 69,62S 70,959 | 71,916 S9699 | 87,291 | S,994 96,086 | 0,S26 | §6,24 107,SS Exibting and renewals ffB,3B3 69,523 70,9591 71,915 69,6991 71,256ff 72,2721 7,397l 74,52Sf 77,5921 75,715
T N Oerlavet mwens 162A72 171,014 175,U6 179,1G7 |oi 216,487 227,673 2J9,1SS3 2615,WS 2ff 28227| 3129
Finacia Item 5 ,170 - 3,770 1 ,2 S l 416 $0,75U $ 2,152 l 1,435 30s,3es 2 9,SII 2 7,101 25,101 Interest Exiting Debt 6,278 4,139 2,632 2,421 16,937 17,859 17,707 17,268 16,970 16814 I68121Interest New Loans 0 0 0 0 17,982 18,925 1,6811 18.279 17,876 17,197 16,380Lou IDC charged toWIP l | | _ | _ | r _
_Innresft ancme t108s -m 8,1,3431 2,9361 _4,1631 4,6521| 49631 .5,2a61 -54681 -5,6101 657221
Poldefinancialitems 4,293 1 10,9S6 29,434 1 88490 1 21,840 9 ,#37 1 11L034 1 1S,281 i 16.069 1 15.10S 1 21,217
Other lIncoxnt 0 -0 A 1 E-eptional ItemllIlllExcane rate losses Profit before taxes 43,293 1 10,996; 29,434 38,490 21,S40 9 ,#7 11,034 13 lS,8 15,069 1 16,10S 1 21,217
Tas and Dividenids | O | S,S9 | 0,302 I 1972B 11,9S 4,7S6.M 5 ,866 |S 6,S07 | 7,71S 7,742 10IO,74 |_ Corporate TakX |1 al8491 10,8021 18,4721 7,6i44 ,B1$61 4,6481 k,7l 62871 7,428
_ Dividends of of O Ol 6,2551 8,5491 1,5171 1,7981 2,1581 A417l 2,461 8,448
=Rtie Prftatrtxs -,9 ,4 9122,1 416 1 60 L 712- ,3 .I 976969 11,9

WSSCO, Financal Performance -Project Appraisal Document CHANGES.XLS IV13t97 6.02 PMPage 2
ZESCO ltd
9 <S ~ ~~~~~~-Projections) Q11997/98 199U99 1999/00 2000/01 200V02 2002t03 2003/04 2004/05 200S/06 2006/07 2007/08
$ B I3ALANCE SHEET
AssetsCurrent Assets 93,791 117,546 181,621 256,273 295,669 310,066 327,705 344,686 357,362 _366,616 376,008
Cash 4,659 32,209 102,101 191,500 224,783 240,415 254,920 268,559 277,760 288,204 288,963Trade debtors 60,986 47,261 36,768 21,569 27,574 28,614 29,688 30,796 31,940 33,120 34,147Other debtors 9.466 18,001 20, 899 18,977 18,643 15,290 16,182 17,135 18,152 19,238 20,398Stores 18,681 20,076 21,752 23,227 24,659 25,747 26,914 28,166 29,510 30,952 32,500
Net Fixed Assets 1,124,787 1,148,287 1,189,083 1,216,502 1,241,386 1,226,696 1,213,402 1,201,886 1,192,119 1,182,436 1,177,941Existing 1,208,663 1,208,663 1,208,663 1,08,63 1,203.663 1,208,663 1,208,663 1,208,663 1,208,663 1,208,663 1,208,663New Investmenta 36,707 129,730 241,485 339,819 435,302 507,803 585.604 669,092 758,683 864,824 957,992Acc. Depr. Exist. 120,592 190,116 261,074 332,989 402,688 473844 64f,117 619,518 694,089 771,681 847,846Acc. Depr. New. 0 0 0 0 0 16,035 34,757 56,395 81,197 109 429 141,377Capital WIP IiI o 0 0 0 00 0 0 0 0 0Investments (financia 9 9 9 9 9 9 9 9 9 9 9
Total Assets 1,218,586 1,266,542 1,370,612 1,470,783 1,637,053 1863671 1,841, 16 1,646,520 1,649 490 16480,9 163988Li,abilities _ _ ____.
Current liabilities 646996 2,237 69,606 67,880 100,744 102,2S0 106,508 111,969 117,468 119,686 122,284Accounts Payable 31,848 83,492 34,520 35,393 40,914 42,635 45,104 47,562 50,164 52,942 65,555Other Payables 16,462 21,376 26,781 28,916 55,374 53,207 53,966 54,511 55,135 54,623 65,763Current portion 16,696 7,369 8,204 8,571 4,456 6,438 6,438 9,886 12,169 12.091 10,936Bank Overdraft
Liabilities over 1 year ___4,349 4,349 4,349 4,349 4,349 4,349 4 349 4,349 4,349 4,849 4,349Existing Loians 29,263 22,351 18,440 __14,036 12,680 11,226 9,820 8,418 7,011 6,683 8,i1New long term loans 0 7 47,777 131,069 207,241 232,110 227,077 222,044 213,862 202,799 192,035 181,271 c 4PRP Loans 0 47,777 118,578 194,761 220,254 215,845 211,436 203,578 193,438 183,298 173,159 r-
Other Loans 0 0 12,480 12,480 11,856 11,232 10,608 9,984 9,360 8,736 8,112Grants 7,199 7,199 7,199 7,199 7,199 7,199 7,199 199 7199 7,199 7,199
Provision for drought 2,000 4,000 6,000 8,000 10,000 12,000 14,000 1000 18,000 120,000 22,e00
Equity 1,110,623 1,117,771 1,136,903 1,161,922 1,169,863 1,172,383 1,178,038 1,184,878 1,192,808 1,199,880 1,211,216Share Capital 168 168 158 188 168 168 168 188 188 168 168Revaluation rese 1,15,60 ,0,760 1.150,760 1,150,760 1,160,760 1,150,760 1,150,760 I 1,160,760 1,150.760 1,16 0,760Revenue reserve -40,304 -38,157 .14,024 10,994 18,936 21,456 27,110 33,950 41,580 48,962 60,289
Total Liabiliteis & equIty _ 1,218,886 1,265,842 1,370,612 1,470,788 1,837,083 1,336,671 1,841,115 1,646,520 1,549,490 1,548,969 1,683,958
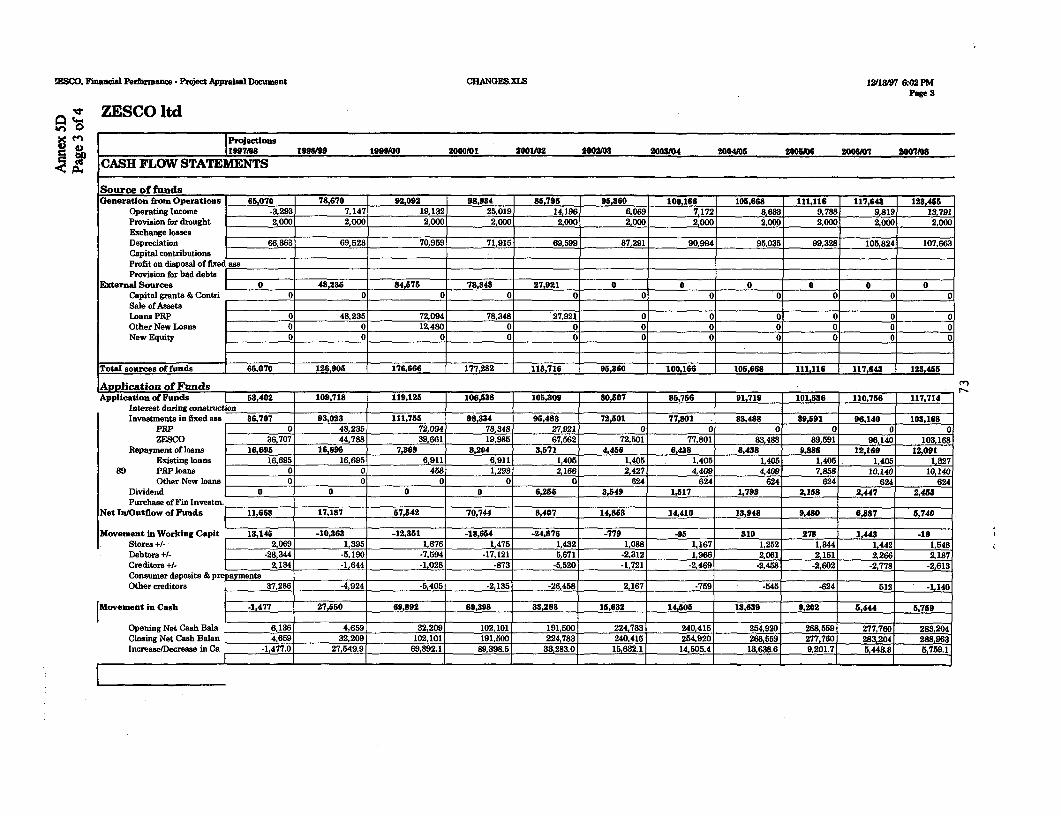
ESCO, Financa Performance. Project Appraisal Document CHANGES.XLS 12/13/7 6:02 PMPage 3
Z ZESCO ltd
Projections2197(08 199899s 1990/00 2000o01 200102 2002(08 200S804 2004e6 2 2006 2006M07 2007(06
! a~ CASH FLOW STATEMENTS
Source of fundsGeneration froin Operations 65,070 78,670 92,092 98,934 85,795 95,360 100,166 105,668 111,116 117,643 123,486
Operating Income .3,298 7,147 19,132 25,019 14,196 6,069 7,172 8,6383 9.788 9.819 13,791Provision for drought 2,000 2,000 2, 000 200,00002,000 2,000 2,000 2,000
Exchange lossesDepreciation 66,368 69,523 70,959 71,915 69,599 87,291 90,994 95,035 99,328 105,824 107,663Capital contributions . ._Profit on disposal of fixed assProvision for bad debts
External Sources 0 48,235 84878 78,348 27,921 0 0 0 0 0 0Capital grants & Contri 0 0 0 0 O O 0 0 0 0 0Sale of AssetsLoans PRP 0 48,235 72,094 78,348 27,921 o 0 0 0 0 0Other New Loans O a 12,480 o o o 0 0 0 0 0New Equity O_ _ C_ a o 0 0 0 o 0 0
Total sources of funds 66,070 126,906 176,666 177,282 113,716 95,360 100,166 106,668 111,116 117,643 123.466
Application of Funds _Application of Funds 1 53,402 109,718 119,126 106,638 105,309 80,507 85,756 91,719 101,636 110,756 117,714
Interest during constructionInvestments in fixed ass 36,707 93,023 111,755 98,334 95,483 72,501 77,801 83,488 89,891 96,140 103,168
PRP 0 48,235 72,094 78,348 27,921 0 0 0 0 0 0ZESCO 86,707 44,788 39,661 19,985 67,562 72,501 77,801 83,488 89,591 96,140 103,168
Repayment of loans 16,695 16,696 7,369 8,204 3,571 4,488 6,438 6,438 9,808 12,169 12,991Existing loans 16,695 16,695 6,911 6.911 1,405 1,405 1,405 1,405 1,405 1,405 1,827
89 PRP loans 0 0 458 1,293 2,166 2,427 4,409 4,409 7,858 10,140 10,140Other New loans 0 0 0 0 0 624 624 624 624 624 624
Dividend 0 0 0 0 6,285 3,549 1,317 1,793 2,188 2,447 2,455Purchase of Fin Investm.
Net In/Outflow of Funds 11,668 17,187 87,842 70,744 8,407 14,863 14,410 13,948 9,480 6,887 5,740
Movement in Working Capit 13,145 -10,363 -12,351 -18,664 .24,876 -779 5-9 310 278 1,443 -19
Stores +/- [IIII 69 1,395 1,676 1,475 1,432 1,088 1,167 1,252 1.344 1,442 1,548Debtors +/- | -5,190 .7,594 -17,121 5,671 .2,312 1,966 2,061 2,161 2,266 2,187Creditors +/- 2 -1,644 -1,028 -873 -5,520 -1,721 -2,469 -2,458 -2,602 -2,778 -2,613Consumer deposits & prepaymentsOther creditors -7,286 4,924 -5,405 .2,135 -26,458 2,167 -759 -545 -624 512 -1,140
|Movement in Cash | 27,650 69,892 89,398 33,283 15,632 14,605 13,639 9,202 5,444 8,769
Opening Net Cash Bala 6,136 4,659 32,209 102,101 191,500 224,783 240,415 254,920 268,559 277,760 283,204Closing Net Cash Balan 4,659 32,209 102,101 191.500 224,783 240,415 254.920 268,559 277,760 2.3,204 288,963Increase/Decrease in Ca -1,477.0 27,549.9 69,892.1 89,398.5 33,283.0 15,632.1 14,605.4 13,638.6 9,201.7 5,448.8 5,759.1
F I
WE-CO. Financial Performnance - Project Appraisal Document CHANGES.XLS 12t/1ts9 6:02 PMPage 4
ZESCO ltd
vA 0 Projections1197198 eNf9l8/ 19990eo 220000l 2001102 2eo2te3 2008104 20e4te6 2008/0 2006/07 2007/08
KEY FIGURES
Profit margin 1.1% 59%1 9.9% 11.3% 18.3% 148%I 14.3%1 138%1 13.2%1 12.2%1 12.3%Asset turnover 13.5%1 14.7%1 16.1%1 14.8%1 16.0%1 16.8%1 17.5% 18.3% 19.1% 20.0% 20.8%
ROI after tax 0.2% 0.9% 1.5% 1.7% 2.9% 2.5% 2.5% 2.5% 2.5% 2.4% 2.6%
Tariffs
Avg Tariff in Current U 2.15 c 2.65 c 2.86 c 2.97 c 3.00 c 3.08 c 3.16 c 3.25c 3.34 c 3.43 c 3.53 c
Avg Tariff in Fixed USc/ 2.15 c 2.60 c 2.74 c 2.79 c 2.75 c 2.76 c 2.78 c 2.79 c 2.80 c 2.82 c 2.84 c
Avg Retail Tariff 2.98 c 3.51 c 3.94 c 4.12 c 4.30 c 4.40 c 4.49 c 4.69 c 4.69 c 4.79 c 4.90 c
Avg Export Tariff 1.75 c 1.50 c 1.50 c 1.50 c 2.00 c 2.00 c 2.00 c 2.00 c 2.00 c 2.00 c 2.00 c
Avg Tariff ZCCM 1.75 c 2.15 c 2.19 e 2.24 c 2.29 c 2.34 c 2.39 c 2.45 c 2.0 c 2.55 c 2.61 cRATIOS__ _ _ _ _ _ _ _ _ _ _ _ _ _ _ _ _ _ _ _ __ _ _ __ _ _ _ _ _ _ _
Annual Revenue Growth 29.8% 12.8% 11.0% 5.3% 13.4% 4.8%1 4.7% 4-7% 4.6% 4.6% 4.5%Operating Margin 1.1% 7.9% 14.9% 17.5% 21.4% 16.1%1 15.7% 15.4% 18.0% 13.9% 14.6%Profit Margin -2.0% 5.9% 14.3% 17.7% &9% 3.6% 4,1% 4.7% 5.1% 4.9% 6.6%Return en Revalued assets -0.3% 1.0% 2.5% 3.2% 1.8% 0.8% 0.9% 1.1% 1.3% 1.3% 1.8%Debt Service Cover 3.3 3, 6 10 8.3 10.1 3a0 Q 3.3 L 1 L4 LReturnon Equity -0.3% 1.0% 2.6% 3.3% 1.9% 0.8% 0.9% 1. 1% 1.3% 1.3% -1.8% 'Debtor days - Less bad debts 135 93 65 36 41 40 40 40 39 39 a_9_
Acid-test ratio 12 1.6 2.3 3.4 2.7 2.8 2.9 2.8 2.8 2.8 2.8
Current ratio 1.4 1.9 2.6 3.8 2.9 3.0 8.1 a 1 3.0 8.1 3.1Liabilities/Total assets ratio 0.1 0.1 0.2 0.2 Q2 0.2 0.2 0.2 0.2 0.2 0.2Debt -Equity ratio 0.0 0.1 0.1 0.2 0.2 0.2 0.2 0.2 0.2 0.2 0.2Return on net assets (PC-indica -0.3% 1.0% 2,6% 3.2% 1.8% 0.8% 0.9% 1.1% 1.3% 1.3% 1.8%As above but after tax F_ -0.3% 0.6%_ 1.6% 2.1% 1. 1% 0.5% 0.6% 0.7% 0.8% 0.8% 1.2%Self-financing Ratio 96.0% 77.8% 86.9% 111.2% 112.2% 126.5% 120.6% 118.5% 112.7% 108.2% 10&0%Cashflow from OP/Current Liab 1.0 1.3 1.3 1.5 0.s 0.9 0.s 0.9 0.9 1 01Payments to/from GRZ 0 3,849 10,802 19,726 11,193 4,785 6,665 6.807 7,718 7,742 10,874
Taxes [ 0 ,849 10,302 13,472 7,644 3,268 3,862 4,648 5,271 5,287 7,426Dividend 0 0 0 6,255 3,549 1.517 1,793 2,158 2,447 2,455 3,448
Derivation of target Revenue
Cash Operating Expenses 83,276.7 85,674.2 |_ _A,507.6 9L, 109,087.7 113,406.8 119,960.2 126,445.8 133,331.0 140,712.8 147,375.9
Non Cash Operating Expenses 79,596.9 85,340.0 87,056.96 58,040.8 84,492.1 103,080.5 107,713.0, 112,717.4 118,009.4 125,541.0 128,636.4Debt Service Interest 5,277.9 4,138.6 2,632,4 2,421.5 34,919.2, 36,784.0 36,388.1 35,536.5 34,845.4 833510.9_ 3L,642.5
IDC 0.0 1,879.4 6,452.8 11,480.9 0.0 0.0 0.0, 0.0 0.0 0.0 0.0LoanvRepayments 13,18 _ 1_6,69531 7,369.2 8,204.5 2,57106 4576.4 6,4380 6,4330 9,886.5 142,168.78 20182
Working Capital Movements 13,144.81 -10,33.31 .72,30.6 9 18,654.3 324,871.6 0778.7 -95-4 309.7 278.6 1,442.8. 12 6Contribution to Capex 100.0% 48.1%, 35.5% 20.3% 70.8%, 100.0% 1009.% 100.0% 100.0% 100.0% 100.0%Return on Equity % -0.3% 1.0%1 2.6%1 3.3%1 1.9%1 0.8% 0.9%1 1.1% 1.3%1 1.3%1 1.8%
Target Revenue 162,872 187,351 191,154 199,626 241,618 268,603 282,169 293,661 309,511 326,355 335,221
Annex 6Page 1 of 4
ZAMBIA: POWER REHABILITATION PROJECT
Procurement and Disbursement Arrangements
Procurement
Procurement methods (Table A)
Procurement for Project Preparation. Twelve major consultancies wereundertaken to prepare this project with the support of the following donors: theGovernments of Belgium, Ireland and Japan (under a Japanese PHRD Grant), DANIDA,EEB, NORAD, IDA (using PPF resources) and SIDA; in addition, ZESCO contributedconsiderable resources to finance the studies when it became clear that a donor was unableto continue supporting project preparation because of governance concerns. Seven of theconsultancies defined the technical project scope for the rehailitation of the Kafue, Karibaand Victoria Falls hydroelectric stations; the ZESCO transmission grid and the distributionsystems in the Copperbelt (Kitwe and Ndola) and Lusaka. In addition, a study wasundertaken to define appropriate safety measures for the Kariba dam. A study was alsoundertaken to identify a Rehabilitation and Development Plan for the Gwembe-Tongapeople who were resettled as a result of the construction of Kariba Dam. Threepolicy/institutional strengthening studies were undertaken: to define the reform agenda forZambia's power sector; to assist in developing Zambia's Hydropower and TransmissionPolicy (aimed at developing a strategy for facilitating private sector financing of majorhydropower and transmission schemes); and the development of a capacity buildingstrategy for ZESCO. The consultants for the rehabilitation studies of Kariba and theLusaka Distribution System were selected on a competitive basis in accord with IDAguidelines. Other project preparation work was contracted following IDA guidelines forthe use of consultants. The summary of proposed procurement arrangements are presentedat Table A.
Procurement under the Project. Total value of IDA-supported consultingassignments will be US$6.1 million. These assignments mainly comprise policy analysis,plamning and design work, specific studies, and design and construction supervision. Thelargest assignment will be for the supervision of the Cooperbelt (Kitwe and Ndola)distribution project. Consultants would be hired in accordance with the Bank's Guidelinesfor Selection and Employment of Consultants (January 1997). Most consultant selectionwill be addressed through competition among qualified short-listed firms in which theselection will be based on Quality-and-Cost-Based Selection (QCBS) by evaluating thequality of the proposal before comparing the cost of the services to be provided. Shortlists for contracts estimated under US$100,000 may be comprised entirely of nationalconsultants if a sufficient number of qualified (at least three) are available at competitivecosts. However, if foreign firms have expressed interest, they will not be excluded. Inaddition, US$2.7 million will be spent on technical assistance (TA), mainly in the form ofhiring of individual long and short-term consultants. For contracts larger than US$0.25million, consultants will be hired on the basis of short lists. Because of the critical natureof these assignments, selection will be on the basis of quality. In addition, TA will beprovided for the preparation of an emergency preparedness plan (EPP), which because ofthe specialized nature of the work, consultant selection will be quality based. Training
75
Annex 6Page 2 of 4
(total value US$0.23m) will comprise hiring short-term consultants and support fortaining programs.
Larger works contracts (individual contract value - local costs and IDA support -US$0.7 million and above) will be awarded on the basis of ICB for an aggregate valueequivalent of approximately US$7.3 million (foreign exchange cost of approximatelyUS$5.1 million). This comprises contracts for the rehabilitation of the Kafue Gorge andVictoria Falls hydroelectric stations; the Kariba Dam; the Copperbelt (Kitwe) distributionsystem and the Ndola Training Centre. Two smaller-value works contracts (individualvalue less than US$0.7 million equivalent) will be awarded on the basis of NCB for anaggregate value of US$ 1.2 million equivalent (of which foreign exchange cost will beUS$0.72 million). It has been agreed that procedures for NCB to be used by ZESCO willbe the same as IBRD procedures; and the tender documents used are based on theStandard Bid Documents of IBRD. Contracts for the procurement of goods supported byIDA (individual value US$250,000 equivalent and above) will be awarded on the basis ofICB, for an aggregate value of US$58.08 million equivalent (of which foreign exchangecost will be US$49.34 million). Smaller value goods procurement contracts (individualvalue less than US$250,000 equivalent) will be awarded on the basis of NCB for anaggregate value of US$3.5 million and less tha $50,000 each by internataional shopping(1.02 million).
The General Procurement Notice will be published in the Development BusinessForum at least 60 days prior to the issue of bid documents and for preparation of shortlists. In addition, specific Procurement Notices will be issued before preparation ofshortlists in respect of consulting contracts above US$200,000. The ProcurementPlanning Schedules for consultancies, goods and works are included in the ProjectImplementation Plan (PIP).
Implementation Arrangements. The project implementation arrangements areset out in Section 16 of the PAD. Except for the Gwembe-Tonga and Hydropower Policyproject components, all procurement for the project will be undertaken by ZESCO'sProject Implementation Unit (PIU). In these tasks, the PIU will be assisted by the variousconsultants, who are responsible for preparing the various components through contractaward. During project preparation, much "on the job" technical assistance was providedto ZESCO in project management and procurement. Training in project management andprocurement will be provided to PIU staff under the project; in addition an expatriateadvisor will be appointed to assist the PIU in project implementation/procurement. Similararrangements will be put in place for the implementation of the Gwembe-Tongacomponent.
Prior review thresholds (Table B)
For procurement of works and goods, all cases valued at US$250,000 or more willrequire prior review by IDA. The Bank will review the selection process for the hiring ofconsultants proposed by the borrower for those consultancy contracts to be awarded tofirms. Contracts worth US$100,000 and above will be subject to IDA prior review; forindividual consultants the prior review threshold will be US$ 50,000. However, theexception to IDA prior review will not apply to the Terms of Reference of such contracts,regardless of value, to single-source hiring, or assignments of a critical nature as
76
Annex 6Page 3 of 4
determined by IDA or to amendments of contracts raising the contact value above the priorreview thresholds. All contracts during the first year of the project, and selective contractsthereafter, will be subject to post-review.
Disbursement
Allocation of credit proceeds (Table C)
The proceeds of the IDA credit would be disbursed against:(a) 100% of foreign expenditures and 90% of local expenditures on civilworks contracts;(b) 100% of foreign expenditures and 90% of local expenditures for vehicles,goods and materials (procured outside of the currently proposed works and supplyand install contracts); and(c) 100% of expenditures for studies, other Consultancy and advisoryservices and training.
As projected by Bank's standard disbursement profiles, disbursement would be completedby four months after project closure. Disbursement would be made against standard IDAdocumentation.
Disbursement categories and projected disbursements are indicated in AnnexAttachment C and Section 1 respectively. Disbursement and withdrawal procedures aredetailed in the World Bank Disbursement Handbook (1992 edition). All disbursements aresubject to the conditions of the Credit Agreement and the procedures defined in theDisbursement Letter. All applications to withdraw proceeds from the Credit account willbe fully documented, except for: (1) expenditures of contracts with an estimated value ofUS$250,000 each or less for works, goods, materials; (ii) US$100,000 or less forconsulting firms; (ii) US$50,000 or less for individual consultants and training which maybe claimed on the basis of Certified Statements of Expenditure (SOE). Documentationsupporting expenditures claimed against SOE's would be retained at ZESCO and MEWDand will be available for review as requested by IDA supervision mission and projectauditors.
Use of statements of expenditures (SOEs):
Disbursement would be made on the basis of statement of expenditure (SOE) for contractsand purchase orders with an individual value less than those requiring IDA's prior review.
Special accounts:
To facilitate disbursements of eligible expenditures. GRZ would open two separate specialaccounts (SA) in a commercial bank to cover local and foreign currencies of IDA's shareof eligible expenditures. The authorized allocation for special account A (ZESCO) wouldbe US$3,000,000 and special account B (MEWD) for US$100,000 covering an estimatedfour months of eligible expenditures financed by IDA. Upon loan effectiveness or asneeded, amounts of US$1,500,000 and US$50,000 respectively would be deposited in thespecial accounts. Subsequent deposits may be requested as needed not exceeding the totalauthorized amount of US$3,000,000 and US$100,000 respectively. Replenishment
77
Annex 6Page 4 of4
applications should be submitted regularly, preferably monthly, after monthly bankstatmnmts are recived and reconciled, with appropriate supportng documents for localand foreign expenditures as required. To the extent possible, all of IDA's share of eligibleexpenditures should be paid through the special accounts.
Project Account:
In order to ensure the timely provision of counterpart funds, it is proposed that both theGovenmunt and ZESCO establish Project Accounts at commercial Banks acceptable to IDA, withinitial balances sufficient for the first quarter by project effectiveness. The Govenmnent and ZESCOwill replenish the Project Account at intervals of not less than 3 months, with sufficient fuids to meetheir shares of expenditures under this project for the ensuing 3 months, and the funds would be appliedonly for this purpose. During negotations, agreement was reached regarding the arrangements forestablishig and operafing the Project Accounts.
78

Table A: Project Costs by Procurement Arrangement(in US$ million equivalent)
Procurement Arrangements International National International Direct Other N.B. F. TotalCompetitive Competitive Shopping Contracting
Bidding Bidding
PPF Refinancing 2.05 2.05(2.05) (2.05)
Civil Works 7.32 1.2 7.46 15.98(7.20) (1.0) (8.20)
Goods and Equipment 58.08 3.50 1.024 103.00 165.60(55.43) (3.02) (1.024) (59.47)
Services-Consultancy Services 6.097 9.73 15.82
(4.697) (4.697)
-Training * 0.23 0.925 1.16(0.23) (0.23)
-Other Services ** 2.16 0.82 2.98(0.43) (0.43)
Total 65.40 4.70 1.02 2.39 8.15 121.93 203.59(62.63) (4.02) (1.02) (0.66) (6.75) (75.08)
Vrocurement to be made based on World Bank sole source guidelines**Includes cost of emergency preparedness plan, Gwembe Tonga Environmental Rehabilitation and Development and cost of Advisoy Services
Note:N.B.F. = Non-Bank FinancedFigures in parenheses are the respective amounts to be financed by IDA
IIft
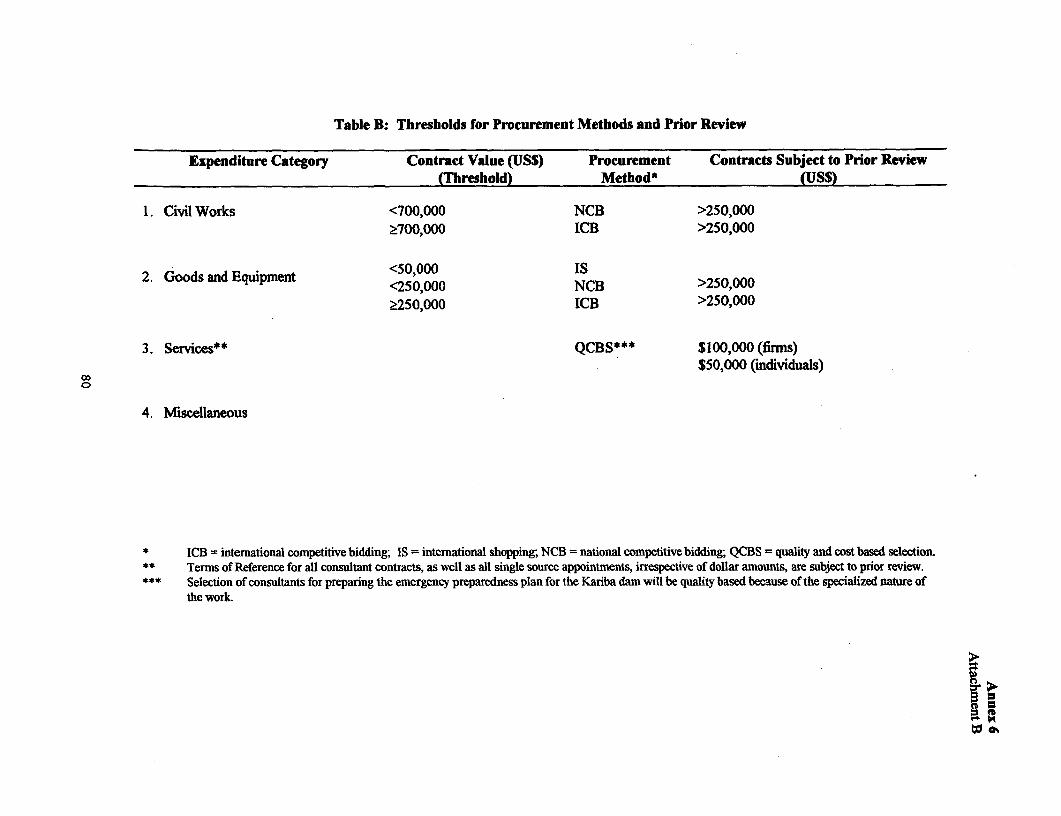
Table B: Thresholds for Procurement Methods and Prior Review
Expenditure Category Contract Value (US$) Procurement Contracts Subject to Prior Review(Threshold) Method* (US$)
1. Civil Works <700,000 NCB >250,000>700,000 ICB >250,000
2. Goods and Equipment <50,000 IS<250,000 NCB >250,0002250,000 ICB >250,000
3. Services* QCBS*** $100,000 (firms)$50,000 (individuals)
0
4. Miscellaneous
* ICB = international competitive bidding; IS = international shopping; NCB = national competitive bidding; QCBS = quality and cost based selection.** Terms of Reference for all consultant contracts, as well as all single source appointments, irrespective of dollar amounts, are subject to prior review.*** Selection of consultants for preparing the emergency preparedness plan for the Kariba dam will be quality based because of the specialized nature of
the work.
3 lN

Annex 6Attachment C
Table C: Allocation of Loan Proceeds
Expenditure Category Amounts in US$ million Financing Percentage
1. Civil Works 7.54 100% foreign and 90% oflocal
2. Goods and Equipment 52.17 100% foreign and 90% oflocal
3. Services
(a) Engineering Services 4.3 100%
(b) Training 0.21 100%
(c) Other Services 0.40 100%
4. Refunding of PPF 2.05 100%
5. Non-allocated 7.50
81
Annex 7Page 1 of 1
ZAMBIA: Power Rehabilitation ProjectProject Processing Budget and Schedule
A. Project Budget (USS000) Planned Actlti
BI Project Schedule Planned Actoal
Time taken to prepare the project (months) 28 months 28 monthsFirst Bank mission (identification) 2/611995 2/6/1997Appraisal mission departure 6/30/1997 6/30/1997Negotiations 9/22/1997 9/29/97Planned Date of Effectiveness 12/31/1997 4/14198
Prepared by: MEWD and ZESCO
Preparation assistance: PPF (US$2 million); PHRD Grants (US$1.25 million); Belgian Trust Fund(US$460,000); Danish Tnrst Fund (US$500,000); Norwegian Trust Fund (US$500,000); EIB(US$250,000); SIDA (US$500,000); the Irish Government (US$400,000) and GRZ/ZESCO (US$1.5million). In addition, NORAD is considering reimbursing Norconsult about US$1 million towards thecosts of their financing of project preparation.
C. Bank staff who worked on the project included:
AFTG1/AFTU1: Donal O'Leazy (Sr. Power Engineer; Task Team Leader); Asamanetch Fantaye (Operations Analyst); Agnieszka Grudzinska (Private Sector Development Specialist); Paivi Koljonen(Energy Economist); Judy Makanda ( Financial Management Specialist); Yuriko Sakairi (Economist); andEnca Hyde and Lucie Iacono (Task Team Assistants);Other Africa: Robert Tillman (Sr. Enviromnental Specialist);CVPs: Luis Gutierrez (Principal Energy Economist) Pierre Savary (Distribution EngineerlDSMSpecialist); Ron White (New and Renewable Energy Specialist);IFC: Frank Sader (Investment Officer, FIAS);Consultants: P.N. Gupta (Principal Dam Engineer); Janak Lal Kannacharya (HydropowerEngineering/Procurement); Reinier Lock (Power Sector Regulation); Diane Minogue (InstitutionalDevelopment); Thayer Scudder (Anthropologist); Joseph Wells (Environmental Scientist);Service Functions: Minneh Karanjah Kane (LEGAF); Steve Gaginis (LEGAF); George Sikazwe(AFMZM);Country Director: Phyllis Pomerantz (AFCO2);Technical Director: Mark Tomlinson (AFTrGI).
D. Project Quality Assurance Team:
Salem Ouahes (Engineering); Cecile Ramsey (Financial Analysis); Alfred Thieme (Economic Analysis).
Note: There was no PCD review. The IEPS review took place in June 1995.
82

Annex 8Page of 3
ZAMBIA POWER REHABILITATION PROJECTDocuments in the Project File
Government of Zambia, Project Implementation Plan
Argonne National Laboratory, Decision and Information Sciences Division. "Zambia:Long-Term Generation Expansion Study." Volume 1: Draft Main Report and Appendixes1 & 2 and Volume 2: Appendixes 3-6. July 1997.
Burns & McDonnell, Dahlgren Group, McKenna & Co. "KGL Independent PowerProject." Final Report. 1997.
Coyne et Bellier. World Bank-Zambezi River Authority. Zambia Power RehabilitationProject. "Kariba Dam Safety Assessment Study." July 1997 Summarized Report.
Coyne et Bellier. World Bank-Zambezi River Authority. Zambia Power Rehabilitationproject. "Kariba Dam Safety Assessment Study. Flood Hydrology Appraisal." July 1997.
Danish Power Consult. "Study on Electricity Distribution System in Ndola and LuanshyaTowns." Inception Report. First Edition. December 1996.
Danish Power Consult. "Study on Electricity Distribution System (Copperbelt) in Ndolaand Luanshya." Draft Detailed Project Report. June 1997.
Danish Power Consult. "Study on Electricity Distribution System (Copperbelt) in Ndolaand Luanshya Towns. Draft Detailed Project Report. Chapter 18, Economic Analysis."First Draft. August 1997.
Ekono Energy. "Zambia - Twenty Year Power System Development Plan." Draft mainreport. January 1996.
Ekono/RKD. "Lusaka Distribution and Rehabilitation Project - ZESCO. Progress ReportNo. 2 for March-April 1997." May 13 1997.
Electricit6 de France. "Feasibility Study of Victoria Falls Power Station RefurbishmentProject." Final Report - 2 Volumes - June 1995.
Electricite de France. "Victoria Falls Power Station Refurbishment Project, AdditionalStudies." Final Report March 1997.
83
Anes 8Page 2 of 3
Energy & Development Group (Cape Town). "Access to Electricity in Southern Africa."July 1995.
ESB International. Zambia Electricity Supply Corporation Ltd. (ZESCO)"Commercialisation Study." Final Report June 1995.
ESB International Ltd. for Zambia Electricity Supply Corporation Ltd. "CopperbeltDistribution Rehabilitation Project: Study in Kitwe, Chingola and Mufulira Regions."Inception Report. January 1997.
Gibb Ltd. and Merz and McLellan Ltd. "Kariba North Hydroelectric Station RehabilitationStudy." Draft Definition Study Report. May 1997.
Government of the Republic of Zambia and ZESCO. "Performance Contract." May 1996.
Government of the Republic of Zambia. Electricity. Chapter 811 of Laws of Zambia.1964. Lusaka.
Government of the Republic of Zambia. Electricity. Chapter 813 of Laws of Zambia.1970. Lusaka.
Government of the Republic of Zambia. Electricity. Higher Authority of Power (SpecialProvisions). Chapter 810 of Laws of Zambia. 1970. Lusaka.
Government of the Republic of Zambia. The Electricity Act, 1995. No. 15 of 1995.Lusaka.
Government of the Republic of Zambia. ZESCO Memorandum and Articles ofAssociation. The Companies Act. Lusaka. 1988.
Government of the Republic of Zambia. The Energy Regulation Act, 1995. No. 16 of1995. Lusaka.
International Resources Group. "Zambia Hydropower Development Policy Frameworkand Package of Incentives for Power Sector." Final Draft. 28 July 1997.
International Resources Group. "Zambia Transmission Line Policy Framework andPackage of Incentives for the Private Sector." Final Draft. 28 July 1997.
International Resources Group. "Zambia: Hydropower Policy and Transnission LinePolicy Working Papers." 25 July 1997.
Kannacharya, J. L. "A Report on the Technical/Institutional Review and Proposal forStrengthening ZESCO." September 1995.
84
Annex 8Page 3 of 3
Komex International. "Environmental Assessment and Management Plan for the VictoriaFalls Power Station Rehabilitation and Refurbishment Program," for ZESCO, 3/1997.
Komex International. "Sectoral Environmental Assessment Scoping and Reconnaissance."1995.
London Economics. "Restructuring the Zambian Power Sector." Final Report. January1997.
Norconsult International. "Study Covering the Development of Human Resources andCapacity Building in ZESCO." Final Report. March 1997.
Norconsult International. "Study Covering the Development of Human Resources andCapacity Building in ZESCO. Manpower Planning, Core Skills Enhancement, NdolaTraining Centre and Outsourcing." Addendum Report. Draft 1. August 1997.
Norconsult. "Transmission System Rehabilitation Project, Investment Plan." March 1997.
Republic of Zambia. Ministry of Energy & Water Development. "Guidelines on Selectionof Rural Electrification Projects for Funding by Government." Lusaka. January 1995.
Scudder, Thayer. "Rehabilitation and Development Strategies for Gwembe-TongaAffected by the Construction of the Kariba Dam in the 1950s." August 1995.
SwedPower. "Electricity Tariff Study." Draft Final Report. May 1997.
SwedPower. "Rehabilitation of the Kafue Gorge Hydro Power Station Report." Draft 2.March 1997.
SwedPower. "Technical Audit of Kariba North Hydro Power Station, Zambia." DraftTechnical and Financial Report. February 1996.
University of Zambia, Institute of Economic and Social Research (INESOR). "TheRehabilitation and Development Strategies for the Peoples Affected by the Constructionof the Kariba Dam." Inception Report. March 1997.
World Bank. "Country Assistance Strategy of the World Bank for the Republic ofZanbia." June 25, 1996.
Zanbezi Riyer Authority. "Kariba Dam's Operation Noah Re-launched." June 1996.
ZESCO. "Revision of Electricity Tariffs Notification." 7 May 1997.
ZESCO. "Power Rehabilitation Project. Draft Project Implementation Plan." August1997.
85
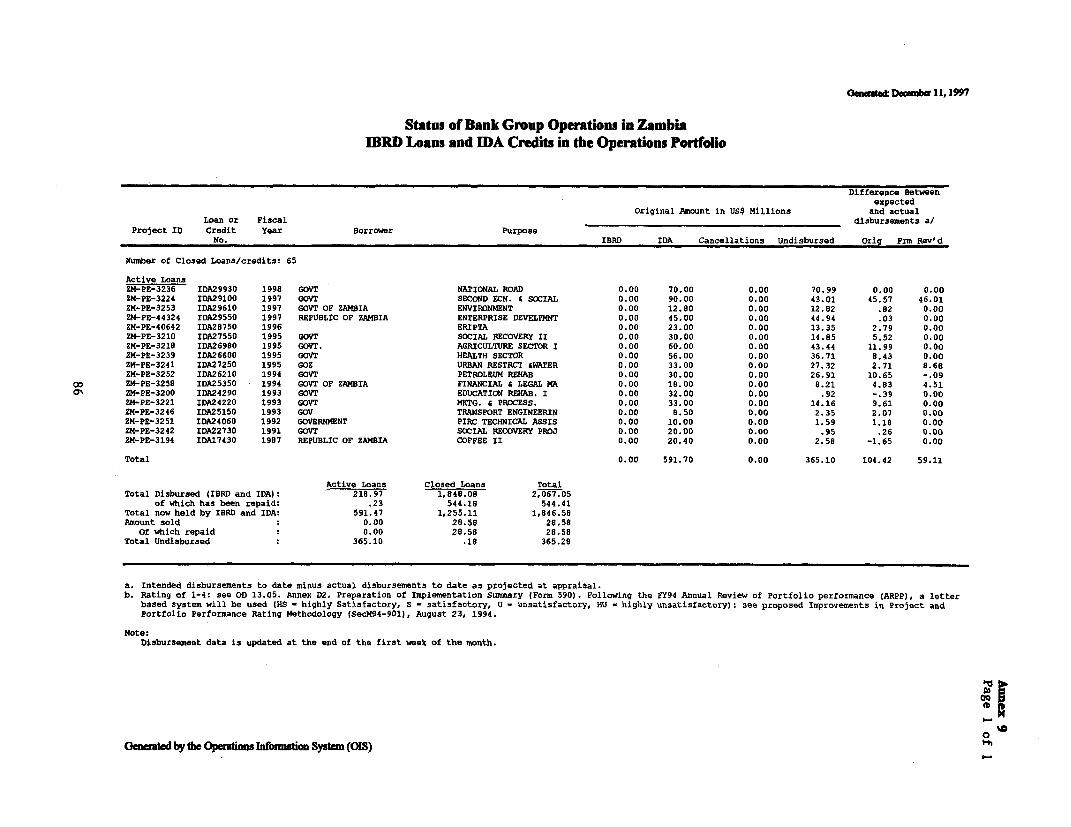
Uat4* Dwnb_ I 1, 1997
Status of Bank Group Operations in ZambiaIBRD Loans and IDA Credits in the Operations Portfolio
Difference Betweenexpected
Original Amount in US$ Millions and actual
Loan or Fiscal disbursements a/
Project ID Credit Year Borrower PurposeNo. IBRD IDA Cancellations Undisbursed orig Frm Rev'd
Number of Closed Loans/credits: 65
Active LoansZM-PE-3236 IDA29930 1998 GOVT NATIONAL ROAD 0.00 70.00 0.00 70.99 0.00 0.00
ZM-PE-3224 IDA29100 1997 GOVT SECOND ECN. & SOCIAL 0.00 90.00 0.00 43.01 45.57 46.01
ZM-PE-3253 IDA29610 1997 GOVT OF ZAMBIA ENVIRONMENT 0.00 12.80 0.00 12.82 .82 0.00
ZM-PE-44324 IDA29550 1997 REPUBLIC OF ZAMBIA ENTERPRISE DEVELPMNT 0.00 45.00 0.00 44.94 .03 0.00
ZM-PE-40642 IDA28750 1996 ERIPTA 0.00 23.00 0.00 13.35 2.79 0.00
ZM-PE-3210 IDA27550 1995 GOVT SOCIAL RECOVERY II 0.00 30.00 0.00 14.85 5.52 0.00
ZM-PE-3218 IDA26980 1995 GOVT. AGRICULTURE SECTOR I 0.00 60.00 0.00 43.44 11.99 0.00
ZM-PE-3239 IDA26600 1995 GOVT HEALTH SECTOR 0.00 56.00 0.00 36.71 8.43 0.00
ZM-PE-3241 XDA27250 1995 GOZ URBAN RESTRCT CWATER 0.00 33.00 0.00 27.32 2.71 8.68
ZM-PE-3252 IDA26210 1994 GOVT PETROLEUM REHAB 0.00 30.00 0.00 26.91 10.65 -. 09
X0 ZM-PE-3258 IDA25350 1994 GOVT OF ZAMBIA FINANCIAL S LEGAL MA 0.00 18.00 0.00 8.21 4.83 4.51
a ZM-PE-3200 IDA24290 1993 GOVT EDUCATION REHAB. I 0.00 32.00 0.00 .92 -. 39 0.00
ZM-PE-3221 IDA24220 1993 GOVT MKTG. a PROCESS. 0.00 33.00 0.00 14.16 9.61 0.00
ZM-PE-3246 IDA25150 1993 GOV TRANSPORT ENGINEERIN 0.00 8.50 0.00 2.35 2.07 0.00
ZM-PE-3251 IDA24060 1992 GOVERNMENT PIRC TECHNICAL ASSIS 0.00 10.00 0.00 1.59 1.18 0.00
ZM-PE-3242 IDA22730 1991 GOVT SOCIAL RECOVERY PROJ 0.00 20.00 0.00 .95 .26 0.00
ZM-PE-3194 IDA17430 1987 REPUBLIC OF ZAMBIA COFFEE II 0.00 20.40 0.00 2.58 -1.65 0.00
Total 0.00 591.70 0.00 365.10 104.42 59.11
Active Loans Closed Loans Total
Total Disbursed lIBRD and IDA): 218.97 1,848.08 2,067.05
of which has been repaid: .23 544.18 544.41
Total now held by IBRD and IDA: 591.47 1,255.11 1,846.58
Amount sold : 0.00 28.58 28.58
Of which repaid : 0.00 28.58 28.58
Total Undisbursed : 365.10 .18 365.28
a. Intended disbursements to date minus actual disbursements to date as projected at appraiSal.
b. Rating of 1-4: see OD 13.05. Annex D2. Preparation of Implementation Summary (Form 590). Following the FY94 Annual Review of Portfolio performance (ARPP), a letter
based system will be used (HS - highly Satisfactory; S - satisfactory, U - unsatisfactory, HU - highly unsatisfactory): see proposed Improvements in Project and
Portfolio Performance Rating Methodology (SecM94-901), August 23, 1994.
Note:Disbursement data is updated at the end of the first week of the month.
0
Geneat by tm Opera0iMs mifmtion System (OIS)
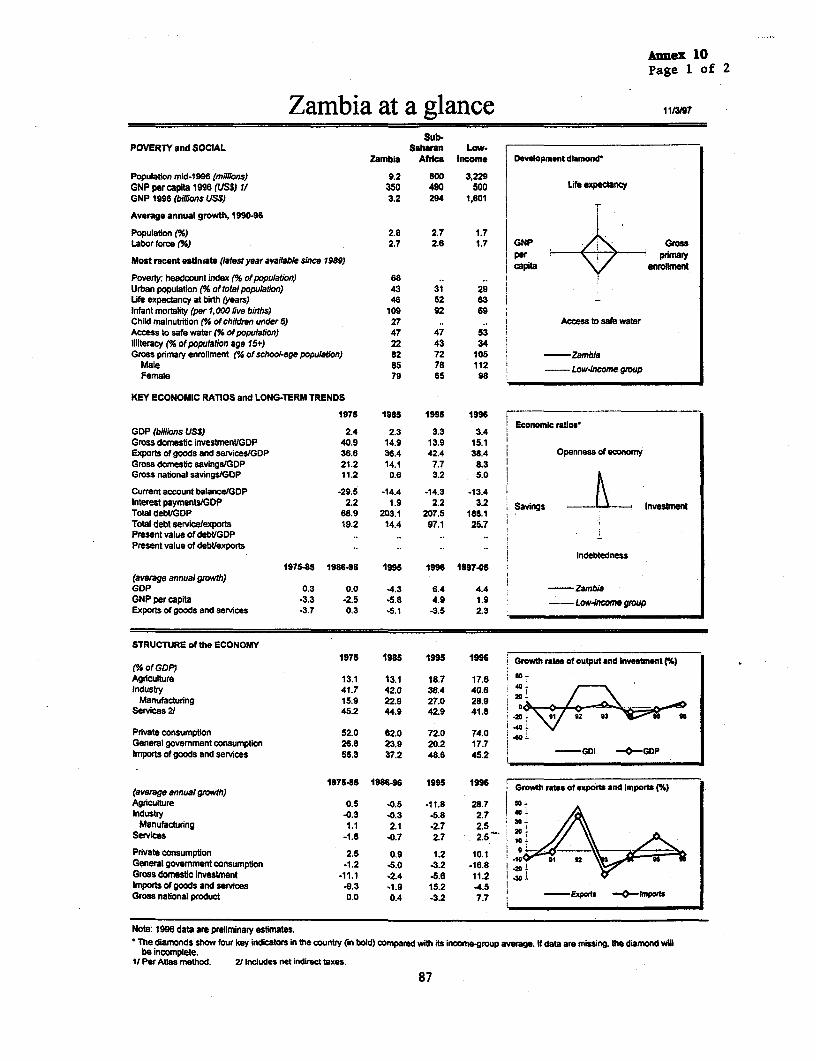
Annex 10Page 1 of 2
Zambia at a glanceSub-
POVERTY and SOCIAL Saharan Low-Zambia Afica income Development diamond
Populaton mid-1996 (mnilifns) 9.2 600 3,229GNP per capita 1996 (USS) I/ 350 490 500 Lit expectancyGNP 1996 (billions US$) 3.2 294 1t601 1
Average annual growth, 1990-96
Population (%) 2.8 2.7 1.7Labor frce (%) 2.7 2.6 1.7 GNP Gross
Iper iprimaryMost recent estimate (latest year avaiable since 1989) capita enrollmentPoverty: headcount index (% of population) 68Urban population (% of total population) 43 31 29Life expectancy at birth (years) 46 52 83 IInfant mortality (per 1,000 live births) 109 92 89 IChild malnutrition (% of children under 5) 27 .. - Access to safe watarAcress to safe water (% of population) 47 47 53Illiteracy (% of population age 15+) 22 43 34Gross primary enrollment (% of school-age population) 82 72 105 - Zambia
Male 85 78 112 |ow4ncomegroupFemale 79 65 98
KEY ECONOMIC RATIOS and LONG-TERM TRENDS
1975 1S85 1S95 1996 EI EcnomIc ratios-
GDP (billions USS) 2.4 2.3 3.3 3.4Gross domestc investmentlGDP 40.9 14.9 13.9 15.1Exports of goods and serviceslGDP 36.6 36.4 42.4 38.4 Openness of economyGross domestic savings/GDP 21.2 14.1 7.7 8.3Gross national savings/GDP 11.2 0.6 3.2 5.0 !Current account balance/GDP -29.5 -14.4 -14.3 -13.4Interest payments/GDP 2.2 1.9 2.2 3.2 Savings InvestmentTotal debVGDP 68.9 203.1 207.5 188.1Total debt service/exports 19.2 14.4 97.1 25.7Present value of deb/GDP .. ..Present value of debVexports ..
Indebtedness197545 1986-96 1995 1996 1997-05
(average annual growth)GOP 0.3 0.0 -4.3 6.4 4.4 - ZambiaGNP per capita -3.3 -2.5 *5.8 4.9 1.9 -- Low-income groupExports of goods and services -3.7 0.3 *5.1 -3.5 2.3
STRUCTURE of the ECONOMY1975 1985 1995 1996 Growth rates of output and Investment(%)
(X of GDP);Agriculture 13.1 13.1 18.7 17. :5Industry 41.7 42.0 38.4 40.6 40
Manufacturing 15.9 22.9 27.0 28.9 0Services 2/ 45.2 44.9 42.9 41.8
Private consumption 52.0 62.0 72.0 74.0General government consumption 26.8 23.9 20.2 17.7 GImports of goods and services 56.3 37.2 48.8 45.2 -GOI GDP
197545 1986-96 1995 1996 Growth rates of exports and Imports (%)(average annual growSh)IAgriculture o.s -0.5 -11.8 28.7 1 oIndustry -0.3 -0.3 -5.8 2.7 40
Manufacturing 1.1 2.1 -2.7 2.5 I 3Services -1.8 -0.7 2.7 2.5 ; 20\
10 ~Private consumption 2.5 0.9 1.2 10.1 4 0General govemment consumption -1.2 -5.0 -3.2 -16.8 _0Gross dorestic investment -11.1 *2.4 -5.6 11.2 IImports of goods and services -9.3 -1.9 15.2 -4.5 EGross national product 0.0 0.4 -3.2 7.7 i E _
Note: 1996 data are preliminary estimates.*he diamonds show four key indicators in the country (in bold) cornpared with its income-group average. If data are missing, tt diamond vwl
be incomplete.11 Per Atlas method. 2r Indudes net indirect taxes.
87

Annex 10Page 2 of 2
Zambia
PRICES and GOVERNMENT FINANCE1975 1985 1995 1996 jnnaton (%)
Domestfc prines
(% change) 200Consumer prices 10.1 37.3 34.9 431 I 15/ImplicitGDPdeflator -14.2 41.1 39.3 35.5 !ooGovernment finance so(% of GDP) .Current revenue 21.9 21.1 20.0 91 92 93 94 99 96Current budget balance 1/ . -11.3 4.6 *2.5 - GDPddt. -- CPIOverall surplustdefici Itt . 4.5 -12.1 4t.1
TRADE1975 1985 1995 1996
(mi/ians USS) iExport and Import levels (mill. US$)Total exports (fob) 803 871 1.233 1.093 i.400 -
Copper 674 840 567 1.200.Zinc I. 9 2 87 10 0Manufactures 0
Total imports (cit) 947 715 1,194 1,199 .mFood .. 23 98 25 40
Fuel and energy 122 41 5 1 F-Capital goods16 72 78
Export price index (1987=100) - 78 135 119 o 91 92 93 94 9s 9Import price index (1987=100) 51 77 132 127 Exports a importsTerms of trade (1987=100) 102 102 94
BALANCE of PAYMENTS
(millions USS) 1975 1985 1995 1996 Current account balance to GOP ratio I%)
Exports of goods and services 868 950 1,383 1,296Imports of goods and services 1,345 970 1,586 1.525 g o0 91 ' 92 93 9; 9* i,Resource balance 477 .20 .203 .229 ' -
Net income -117 -267 -242 .206Net current transfers -127 -38 -20 -17
Current account balance, - _before official capital transfers -721 -324 -465 -452
.20Financing items (net) 651 -132 416 482Changes in net reserves 70 456 49 -30
Memo:Reserves induding gold (rntt. USS) 166 201 208 211Conversion rate (locaIAJSS) 0.6 3.1 866.3 1,208.0
EXTERNAL DEBT and RESOURCE FLOWS1975 1985 1995 1996
(millions USS) Composition of total debt, 1996 (mill. USS)Total debt outstanding and disbursed 1,684 4,576 6,770 68349
IBRD 184 370 155 110IDA 0 105 1.250 1,387 GA3f3
Total debt service 169 138 1,365 339 8-- 8 1387IBRD 16 42 68 59IDA 0 1 10 13
Composition of net resource flows E234Official grants 0 53 318 230 Officialcreditors 156 223 117 61Private creditors 263 12 -25 *83 C 1227Foreign direct investment 0 0 91 132Portfolio equity 0 0 0 0 0D919
Wodd Bank programCommitments 32 129 277 125 j A-IBRO E-BilateralDisbursements 50 109 209 let 8 - IDA 0 - Othr muttilateral F - PrivatePrincipal repayrnents 4 20 52 50 C - IMF G- Short-termNet fiows 46 89 157 131Interest paymnents 11 23 26 22Net transfers 34 66 131 109
Development Economics 11t3t971/ Based on expenditures which include extemal interest payments due before rescheduling.
88

11-DEC-97 17:48 WORLD BANK 268 01 254283 P 11
Page 1 of 5
Td*:W 254M 6%p~w
MEWDll103/3/40REIULIC OF ZAMBIA
MINISTRY OF ENERGY AND WATER DEVELOPMENT0oMcr me MINISUR
P.O. Box 3809LUSAKA
CONFIDENTIAL4 September, 1997
Mr. James D. WolfensonPresidentWorld BankIS ISH Street, NWWashington, DC 20433UNMED STATES OF AMERIA
Dear Mr. Wolfensohn,
RE: LETTER OF POWER SECTOR POLICY
This letter summazises the policy measures which the Government of theRcpublic of Zambia (GRZ) will pursue to support implcmcntation of its PowerRehabilitation Project during the period 1997 - 2002. The Govcrnment's overallobjective is to enhance the ability of 7ambia's electricity supply industry to provideelectricity in an efftcient and sustainable manner to stimulate more and inclusive growthin the Zambian economy. Government's strategy to achieve these objectives includesthe promotion of private investment in the power sector. The goals for the power sectorare consistent with Zambia's Medium Term Financial Framework (1996-1998) underwhich priority spending focuses on those sectors that support stable economic growth,such as electric power.
Energy Sector Policy Frmework and Power Sector Objectives
2. The Government's strategy for realising its goal of optimal development ofZambia's power sector is to establish an institutional and rcgulatory environment toenable private sector participation, and in the short-term, improve sector performance viathe commercialisation of Zambia Electricity Supply Corporation (ZESCO) in order toenhancc rcsource mobilisation, corporate autonomy and managcmcnt accountability. Theinstruments of the strategy include; (a) the Oovcrnmcnt's promulgation of a NationalEnergy Policy (NEP, 1994) and an Energy Regulation Act (1995) under which theFncrgy Regulation Board (F.RB) was established, and; (b) a ncw F.lectricity Act (1995)which permits private investment in the power sector. Restructuring the electricityindustry is an important component ot the NE1P and comprises: transparent legislationand regtilation; liberalisation of entry of other comnpanies in the power sector andccnmmeroialiuation of ZIFSCO operations.
89
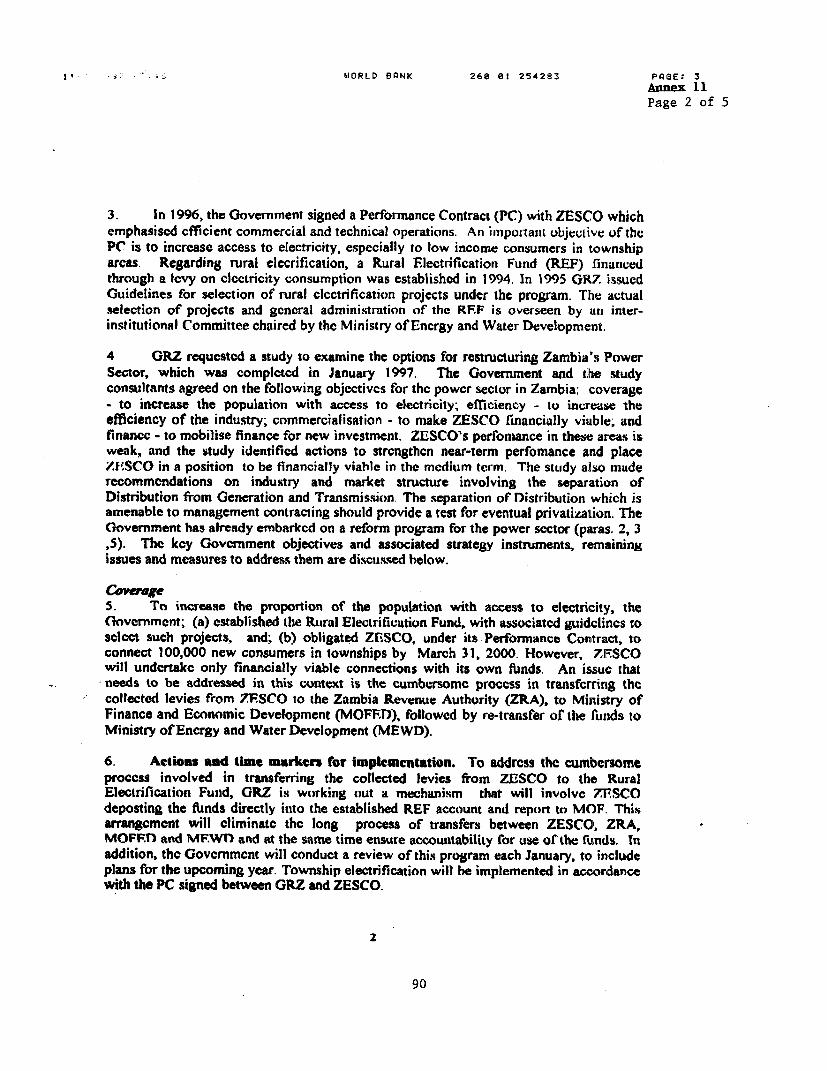
I' * . . ,: . _ WORLD BANK 260 e1 254283 PAGE: 3Annex 11Page 2 of 5
3. In 1996, the Government signed a Performnance Contract (PC) with ZESCO whichemphasiscd cfficient commercial and technical operations. An inipoitait objeutive of thePC is to increase access to electricity, espccially to low income consumers in townshiparcas. Regarding rural clecrification, a Rural Flectrification Funid (REF) fiuiaicedthrough a lcvy on cicetricity consumption was established in 1994. In 1995 GR17 issucdGuidelines for selection of rural clcctrification projects undcr the program. The actualselection of projects and general administration of the RFF is overseen by an inter-institutional Committee chaired by the Ministry of Encrgy and Water Development.
4 GRZ requcsted a study to examine the options for restructuring Zambia's PowerSector, which was complctcd in January 1997, The Government and the studyconsultants agreed on the following objectivcs for thc powcr sector in Zambia: coverage- to increase the population with access to electricity; efriciency - to increase theefficiency of the industry; commercialisation - to make ZESCO rinancially viuble, andflnancc - to mobilise finance for new investment. ZESCO's perfomnance in these areas isweak, and the study identificd actions to strcngthen near-term perfomance and placeZiESCO in a position to be financially viable in the medium term. The study also imuderecommendations on industTy and market structure involving the separation ofDistribution from Generation and Transmission. The separation of Distribution which isamenable to management contracting should provide a test for eventual privatization. TheG,overnment has already embarked on a reform program for the power sector (paras. 2, 3,5). The key Government objectives and associated strategy instruments, remainingissues and measures to address them are discussed below.
Covemae5. To increase the proportion of the population with access to electricity, theirnvernment; (a) established the Rural Electrification Fund, with associated guidclincs to
scicct such projects, and; (b) obligated ZriSCO, under its Performance Contract, toconnect 100,000 new consumers in townships by March 31, 2000. However, ZF.SCOwill undertakc only financially viable connections with its own ffinds. An issue thatneeds to be addressed in this context is the cumbersome process in transfcrring thccollected levies from 7F.SCO to the Zambia Revenue Authority (ZRA), to Ministry ofFinance and Economic Development (MOFET)), followed by re-transfer of the funds toMinistry of Energy and Water Development (MEWD).
6. Actions and time markers for impcmcnstation. To addrcss the cumbersomeprocess involved in transferring the collected levies from ZESCO to the RuralElectrification Fund, GRZ is working out a mechanism that will involvc 7ZTSCOdeposting the ftnds directly into the established REF account and report to MOF. Thisarrangement will eliminate the long process of transfers between ZESCO, ZRA,MOFF.n and MF.Wn and at the same time ensure accountability for use or the funds. Inaddition, the Govcrnmcnt will conduct a review of this program each January, to includeplans for the upcoming year. Township electrification will he implemented in accordancewith the PC signed between GRZ and ZESCO.
2
90

!,vc-S ir: 4~ 7 JLV b4NK4wa is 1 ?54 .3S PAGEs 4
Annex 11Page 3 of 5
Affidency7. Government's objective is to increase the efficiency of the electricity supplyindustry. Important tools in this regard are the regulatory framework and industrystructure established by the Energy Regulation and Flctricity Laws of 1995 as wcll asthe use of cost-recovery tariffs. In the short-term, the PC is designed to improvc thepcrformnance of ZFSCO through management, financial and technical efficiency targets.Thc recent award to the private sector of the Zambia Consolidated Copper Mines(ZCCM) Power Division and on-going negotiations for the sale of the ZCCM Mita andMulungushi powerstations (with combined capacity of 38 MW) is expectcd to contributeto thc cfficiency of the power sector's operations in the Copperbelt and in settingbenchmarks for irnprovcd pcrformance in the rcst of the country.
8. Actions and time markers for implementation. A tariff study is underway andils recommendations on the structurc and the level of the tariff will be taken into accountin the design of the next tariff increase. To ameliorate the impact of the tariffs on lowincome consumers, the tarifr structure will include a lifelinc rate. Regarding theperomanec Contract, not later than February 1 of each year, Government and ZESCOwill review ZESCO's performance and agree on updated targets for the following year;where targets have not been achieved Government and 7ZESCO shall prepare an actionplan to achieve the targets.
ZESCO Co nserieiiatioe9. Trhe program to commercialise ZESCO is aimed al making the Company efficientand financially viablc. A key component of making ZLSCO financially viable will be asound tariff policy that will provide for the setting of economic tariffs which will ensurefull cost recovcry as enshrined in the National Energy Policy. This includes arrangementswith the mining sector through power sales agreements. A related issue will be to reduceZESCO's high levels of accounts receivable.
10. Actions and time markers for implementation. ZESCO will employ anautomatic tariff adjustiment mechanism which will rcflcct key variables. ZESCO will berequired to mcet a series of specific ffnancial benchmarks each year. Ry July 1, 1998,ZESCO will have separate accounts for generation, transmission and distribution.
Fiuanwe11. The Government's objective is to mobilise finance for new investment in thepower sector, with all major new investment in generation and transmission to befinanced by the private sector. A Hydropower Developmcnt Policy and TransmissionLine Policy will be promulgated by the end of 1997 to promote private sector investmentthrough clear rules and incentives.
ERn'dmeauta'l .Stainabfiky12. An Environmental Scoping Study for Zambia's Power sector was undertaken aspart of the preparation of this project. GRZ reviewed and agreed with the majorrecommendations of the study: (a) to establish an environmental and Social Atfairs Unit(ESU) in ZESCO; (b) develop a rehabilitation program for the Owembe-Tonga peoplewho were unsuccessfully resettled during the Kariba Hydroelectric Project, and; (c)
3
91
11-DEC-97 17:58 WORLD BANK 268 01 254283 P Q2E. 5
Aimex 11Page 4 of 5
develop a hazardous waste management program to redress environmental impacisassociated with past power projects. It is also acknowledged that any fiiture developmentof hydropower stations will be carried out on the basis of basin wide and integratedenvironmncntal and social impacts assessments to he implemented within the confines ofthe Environmental Protection and Pollution Control Act (Enviro,nmental ImpactA=ssmen) Rcgulations, 1997 contained in Statutory Instrumcnt No. 28 of 1997. In thecase of Victoria Falls, ZESCO will implement an environmental program which enhancesthe sitc's ecological and acsthetic value in conjunction with the rchabilitation of the plantunder this Project.
13. Action and time markers for implementation. ZESCO has established anEnvironmcntal and Social Affairs Unit in its Engineering Directorate, which is currentlyreceiving technical assistance ror capacity building. ZESCO will put in place guidelinesfor environmcntal review of projects and deterninc the types of projects which requireESU approval or clcarance by July 30, 1998. T'he draft final report on the study andaction plan for the rehabilitation of the Gwembe-Tonga people was submitted onSeptember 1, 1997. A comprehensive assessment of toxic wastes in existing powerplants and lines and an action plan for their management and disposal will be undertaken,in courdination with the Environmental Council of Zambia. ZESCO shall implcment theagreed recommcndations of this study, including the execution of interim protectivemeasures by June 30, 1998.
Reviewing Implementation
14. Since the Power Rehabilitation Project has a large number of components, andincludes important policy reforms, the Government intends to review the program withthe Bank and other donors on an annual basis. At the mid-point of the plannedimplemcntation pcriod, the Government will also undcrtake a more detailed review ofprogress with the Bank and other donors.
4
92

I1-DEC-97 17:50 WORLD BANK 260 81 254283 PAGE: 6
Annex 11Page 5 of 5
1S. 1 trust that the above framework gives confidence that a viable and efficientpower sector is one of Zambia's priorities and that thc Government is commited tocnsuring that this objective is achieved.
As sincerely,
Su Desai; MP* Minister
MINISTRY OF ENERGY AND WATER DEVELOPMENT
* cc: Hon. Ronald D.S. Penza, MPMinister of Finance and Economic Development
\ ~~LUSAKA
,/cC: Mr. Gideon NkojoResident RepresentativeWorld Rank Mission
5
93
Annex 12Page 1 of 9
ZAMBIA: POWER REHABILITATION PROJECTENVIRONMENT AND SOCIAL CONSIDERATIONS
The Zambia Power Rehabilitation Project will not include new facilities and has beengiven a Category B rating. Category B projects do not require a full ELA, but may requirea more limited analysis if the project could have specific environmental impacts. Thespecific environmental problems in this case are associated with existing plants and linesand will be rectified under the Project. The Project will also support building ZESCO'scapacity in environmental management, through ZESCO's recently establishedEnvironmental and Social Affairs Unit (ESU) as well as an environmental managementplan for the Victoria Falls Power Station to be managed by the ESU. Lastly, the Projectwill support the Gwembe-Tonga Rehabilitation and Development Program, a package ofsocio-economic and environmental mitigation measures to redress the consequences ofthe unsuccessful resettlement program associated with the construction of the KaribaDam.
A. INITIAL ENVIRONMENTAL STUDIES AND THEIR RECOMMENDATIONS
1. The initiating study on environmental issues in the power sector was the SectoralEnvironmental Assessment Scoping and Reconnaissance study done by KomexInternational of Calgary in 1995. The study involved Dr. Thayer Scudder, a leadinganthropologist who has been conducting a tracking study of the oustees (Gwembe-Tonga)of the Kariba Dam Project for the past 40 years. The study recommended an action planwhich included three priority actions:
(a) To establish and strengthen an Environmental and Social Affairs Unit(ESU) in ZESCO to build capacity in the environment area;
(b) To develop in ZESCO a participatory consultation process to ensureinvolvement of all project-affected peoples and NGOs.
(c) To complete environmental and social evaluation of major watershedwhere existing and proposed projects are located (i.e., the Kafue andZambezi) to determine environmental and social costs for projectplanning; and
94
Annex 12Page 2 of 9
(d) To address continuing issues associated with past power developments:
(i) An Environmental Assessment and Management Plan for VictoriaFalls Power Station Rehabilitation;
(ii) Gwembe-Tonga study to rehabilitate Kariba-affected peoples; and
(iii) Waste Management, including handling of PCBs.
2. In addition, inventories of PCBs in ZESCO's system were carried-out separatelyunder the studies for the rehabilitation of: the Kafue Gorge Hydropower Station(Swedpower); the Kariba North Hydroelectric Station (Swedpower and Gibb-Merz/McLellan); the ZESCO Transmission System (Norconsult); and the Victoria FallsPower Station (Komex). PCBs were found at Kariba North, in the transmission system atthe Kitwe and Luano substations and Victoria Falls and each Consultant has maderecommendations on the handling of PCBs, except for Kafue Gorge where no PCBs werefound. PCBs are highly toxic and must be handled with great care. To ensure athroughout approach to PCB management, a PCB handling and management plan will bedeveloped under a study to be managed and coordinated jointly with the nationalEnvironmental Council of Zambia (ECZ) and ZESCO..
3. Kafue Gorge Power Station Rehabilitation (KGRP). Swedpower performed apreliminary assessment which they recommend should be used as an input to furtherinvestigation by ZESCO's ESU. The assessment did not identify any new environmentalproblems associated with the rehabilitation. Existing environmental problems areprimarily related to treatment of wastes, harmful substances and occupational health.Swedpower identified eight environmentally dangerous emissions and waste andsuggested mitigation measures for ESU to consider in developing a comprehensivemanagement plan.
B. ACTIONS TAKEN
4. ESU formation and strengthening. ZESCO has established its Environmental andSocial Affairs Unit (ESU) with support from SIDA. ESU has a core group of six personsand the following responsibilities: a) performing environmental and socio-economicassessment of all ZESCO projects; b) developing environmental management plans forexisting ZESCO facilities and operations; c) ensuring ZESCO compliance with allapplicable legislation and regulations; d) monitoring and reporting on all environmentalaspects of ZESCO projects and operations; e) communicating within ZESCO theresponsibilities for corporate environmental management; and f) interacting with otheragencies to ensure that ZESCO programs are understood and integrated into national andlocal programs. The Victoria Falls Rehabilitation Report (see below) recommends: thatZESCO provide ESU with support of the ZESCO Board and senior management to
95

Annex 12Page 3 of 9
ensure that environmental programs are taken seriously; that ZESCO mandate that ESUapproval be required for all ZESCO projects; that ESU is adequately staffed and hasresources to contract personnel to undertake required tasks; that ESU have adequatebudget and internal support; training and TA to enhance ESU capabilities; and ensuringthat ESU is provided technical support in the form of experienced professionals andequipment.
5. Consultation. ZESCO plans to undertake or facilitate, with private investment,the development of several new hydroelectric projects and undertake an expandedtownship electrification program. This will require extensive consultation. The recentlycreated ESU has hired a social scientist; training and TA under the proposed Project willenhance the Unit's capacity to carry out consultation with project-affected peoples,government agencies, NGOs, the private sector and donors.
6. The Victoria Falls Power Station Rehabilitation Environmental Assessment andManagement Program was completed by Komex in March 1997. The RehabilitationProject will refurbish and replace most of the existing facilities and equipment of theVictoria Falls power station complex (3 power stations, with a combined capacity of 108MW). An enviromnental management plan was considered important because theVictoria Falls Power Station is located on the north bank of the Zambezi in Mosi-Oa-Tunya National Park and the Victoria Falls UNESCO World Heritage Site.
7. The environmental assessment reviews existing operations, environmental andsocio-economic data, proposed refurbishment designs, public consultation inputs anddevelops an environmental management plan for the facility. Review of the plannedrefurbishment program indicates no additional impacts (direct) associated with the work.Review of data indicates that the Station's operation has resulted in negative impacts ofthe Falls area: water management, land degradation, PCB-contaminated transformer oil,degeneration of tourism experience, and aesthetic loss.
Proposed Action Plan includes:
8. The proposed Action plan includes:
(a) Strengthen ZESCO's new Environmental and Social Affairs Unit (ESU);
(b) Develop and implement of a waste management and site restorationprogram to mitigate ZESCO's historic impact on the National Park area;
(c) Non-essential staff relocation, relocate the majority of staff to housing inLivingstone and convert on-site housing to medium-class touristaccommodation (ZESCO);
96
Annex 12Page 4 of 9
(d) Relocate the 48 MW intake scour siphon discharge and reconstruction ofthe original steps to the Falls base (being done as part of the RehabilitationEngineering);
(e) Develop Station 'A into a Power Station Museum and Interpretive Center;and
(f) Develop and implement a Water Management Plan which optimizespower generation and aesthetic beauty of viewing the Falls (ESU); .
9. The Rehabilitation and Development Strategy for the Peoples Affected by theconstruction of the Kariba Dam (Gwembe Tonga) Study is nearly complete. The ProjectImplementation Plan (PIP) will be finalized by mid-September by the Institute ofEconomic and Social Research of the University of Zambia- INESOR with the assistanceof ZESCO which has already prepared a Project Implementation Plan for the rest of theproject. The INESOR report outlines the following projects and implementation strategy.
Proposed Projects
10. The proposed projects includes:
(a) Roads. The major effort would be the rehabilitation of the key road thatconnects the three districts which have received the resettled people. Thisroad, known as the "bottom road," is approximately 365 km long androughly follows the curvature of Lake Kariba. The expected sequence ofconstruction would begin with the Siavonga section, that which in theworst condition.
(b) Water Resources Development. In common with many areas in theregion, water supplies are unreliable both as to quality and quantity. Themajor expenditures included here along with other investments currentlyunder way by bilaterals and NGOs, would bring the supply of waterservices up to internationally accepted standards (UNICEF guidelines). Akey component of the water development activities is a major effort toestablish and manage improved cropping patterns along the margins of thereservoir that are timed to coincide with the patterns of lake drawdown andrefilling. This effort would make a major contribution to food security aswell as cash incomes.
(c) Health Facilities And Services. Health care facilities in the area are notadequate and not properly distributed to reach the population. Malaria,bilharzia, and other waterborne diseases are major health threats in thearea. Child mortality rates are higher in Zambia than in Botswana orZimbabwe and are now at about the same level as in 1970. Long traveldistances now seriously affect the ability of the population to obtainneeded services. Construction of one new facility in Sulwegonde, the
97
Annex 12Page 5 of 9
renovation of two existing facilities in Siameja and Chabbobboma and thecompletion of the health post which has been begun by the communityitself in Sinafala will make basic levels of health services more accessibleto the population. In addition, a baseline study and awareness programdealing with HIV/AIDS is included in the workplan.
(d) Land Use. Agriculture extension activities directed at changes in croppingpatterns, improved grazing, small-scale irrigation, and improved storage offood grains represent the majority of the agriculture projects proposed. Inaddition, a fund is to be created to support micro-projects dealing withland use.
(e) Rural Electrification. The area inhabited by the affected peoples haslimited electrical service at its periphery, but in general there is no poweravailable in the project area. Under this program, service would beprovided to three of the larger villages (Chipepo, Gwembe Boma, andSinazeze) as well as the area around the lakeshore.
Proposed Implementation Plan
11. Based on the INESOR Report and past experience, an Implementation Plan forthe program to address resettlement impacts has been proposed. The plan itself isdesigned to contribute to the achievement of the programmatic goal of rehabilitation ofnot only the lands but the social structures of the affected people as well. Oneconsequence of this goal is the need for the rehabilitation processes and actionsthemselves to foster the confidence of the community and to create a high level ofparticipation in the problem definition, solution development, and implementation ofprojects undertaken. Importantly, it is intended that many of these small-scaleinfrastructure projects will feature community contributions, either in-kind or in cash.
12. Key features of the proposal are:
(a) A Steering Committee co-chaired by the Permanent Secretary of theMinistry of Energy and Water Development and a nationally prominentValley Tonga (eminent person). In addition, the Steering Committee willinclude representatives of the other involved ministries (e. g., agriculture,health, transport), local government and should also have strongrepresentation from within the community.
(b) A Project Management Unit (PMU) that is located in the field, probably inSiavonga because of its relatively good telecommunications facilities andgood road access to the major cities in the country will be established. Itwill have its own set of technical advisers including a group of engineers,technical specialists, and an adviser. Except for overseeing the ruralelectrification, it is anticipated that all the other project components willbe undertaken under the umbrella involvement of the concerned
98

Annex 12Page 6 of 9
Government Ministry. It is anticipated that the PMU will play the role ofa program facilitator rather than being responsible for projectimplementation.
(c) Project Liaison offices will be located in each of the three districtsinvolved.
(d) The PMU will handle all liaison activities in Siavonga district and overseethe liaison activities in the other districts.
A proposed project implementation structure is set out on page 9.
Cost Estimate
13. The road rehabilitation costs, including the division between foreign and domesticcomponents, is based on guidelines in the existing World Bank Road SIP. The roadswould be rehabilitated as gravel roads. The total for the roads component isUS$2,408,020. The water supply improvements in the Water Resource Developmentcomponent are based on costs taken from existing projects and from the WaterDevelopment Board. The total cost of the Water Resource Development component is $2,337,000. For the health care facilities, the figures are taken from the on-going WorldBank financed project. . The cost of the Health Facilities and Services component is$470,810. The Land Use/Agriculture activity costs are based on past agricultureextension and other programmatic initiatives in other regions. The Land Use componenttotals $1,430,000. Community Participation costs are based on experience gained inconducting the field work for INESOR Study and other such experience and totals$202,210. All Rural Electrification costs are from ZESCO, all but the Lakeshore areaelectrification have been costed in detail using their normal techniques. The Lakeshorearea estimate represents the expert opinion from within ZESCO. Rural electrificationtotals to $4,309,947. The Technical Assistance and Equipment components are based onWorld Bank experience in providing assistance to Zambia and other countries. The grandtotal for the project, including contingencies is $15,129,189
Financing of the Project
14. The Zambia: Power Rehabilitation Project (PRP) has allocated US$ 5.0 million tothe Gwembe-Tonga Rehabilitation and Development Program of which a preliminaryfinancing plan has allocated US $4.5 million to the DBSA and US$ 0.5 million to IDA.This funding is to be considered "seed money" for the Gwembe-Tonga project. Otherresources will need to be tapped to assure that all the proposed components are fullyfinanced. For example, the Rural Electrification levy is expected to be used to financethe Rural Electrification component. In addition, DBSA has expressed interest inallocating more resources beyond the US $4.5 million already allocated to undertake thisproject.
99
Annex 12Page 7 of 9
C. CONSULTATION AND COORDINATION
15. The recommendations of the Sectoral Environmental Scoping Study were basedon an extensive consultation process with national agencies, national and internationalNGOs and donors.
16. Public consultation was carried out by ZESCO in context of the Victoria FallsPower Station Rehabilitation. A consultation meeting was hosted by ZESCO in July1996, where national, local and traditional officials addressed meeting. Attendeesincluded hospitality industry representatives, conservation groups, ZRA, traditional ruler,Chief Mukuni led the discussion and represented the general public. In addition, a 2-dayVictoria Falls User survey of tourists was conducted to assess impacts on tourism ofcurrent and planned operations at the power station. Lastly, the Report states that afterthe Report's recommendations are discussed with ECZ, meetings will be held with thefollowing stakeholders: National Parks and Wildlife Service; National HeritageConservation Commission; Hotel and Tour Operator Associations; LivingstoneAdministration; and Chief Mukuni.
17. The extensive public consultation in the Gwembe-Tonga Study will be continued.
18. Costs of all environment-related actions to date total approximately US$475,000.
D. ENviRONMENTAL ACTIONS TO BE TAKEN UNDER THE POWER REHABILITATIONPROJECT:
19. ESU will continue to be strengthened through TA and training. A consultationcommunication strategy will be developed. Estimated budget: US$590,000.
20. To ensure ESU's input is obtained and used by ZESCO, during negotiations,ZESCO will put in place guidelines for environmental review of projects and determinethe types of projects which require ESU approval or clearance.
21. Watershed Studies in the context of Upcoming Projects. In a letter of SectoralPolicy from GRZ to ZESCO, GRZ will require ZESCO to do environmental and socio-economic studies for new projects on the Kafue and Zambezi rivers, this will also requiredata aquistion.
22. A Victoria Falls Mitigation Plan will be implemented.
(a) Site Restoration program to mitigate ZESCO's historic impact on theNational Park area (US$50,000);
(b) Non-essential staff relocation, relocate the majority of staff to housing inLivingstone and convert on-site housing to medium-class touristaccommodation (ZESCO's normal; budget);
100
Annex 12Page 8 of 9
(c) Relocate the 48 MW intake scour siphon discharge and reconstruction ofthe original steps to the Falls base (being done as part of the RehabilitationEngineering);
(d) Develop the circa 1938, 8 MW power station into a Power StationMuseum and Interpretive Center (US$400,000);
(e) Develop and implement a Water Management Plan which optimizespower generation and aesthetic beauty of viewing the Falls (ESU willbegin by executing a hydrology study of the Falls area); and
(f) During negotiations, an understanding will be reached with ZESCO inregard to the Victoria Falls Power Station Museum and visitors Center,that a certain percentage of net revenues from these activities would be puttoward conservation efforts in the Victoria Falls area. Estimated Cost:US$450,000.
23. A study will be undertaken to develop a comprehensive program formanagement/disposal of PCBs, as part of the ECZ Study on PCBs. During negotiationsan understanding will be reached regarding implementation of the agreedrecommendations of the Study, and interim protective measures.
24. The Gwembe-Tonga action plan agreed during negotiations and implementedunder the Project.
25. Monitoring and Auditing Program will be initiated by the ESU, with monthlyreporting requirements. The monitoring and audit program will track project progress andimplementation of environmental and socio-economic activities.
101
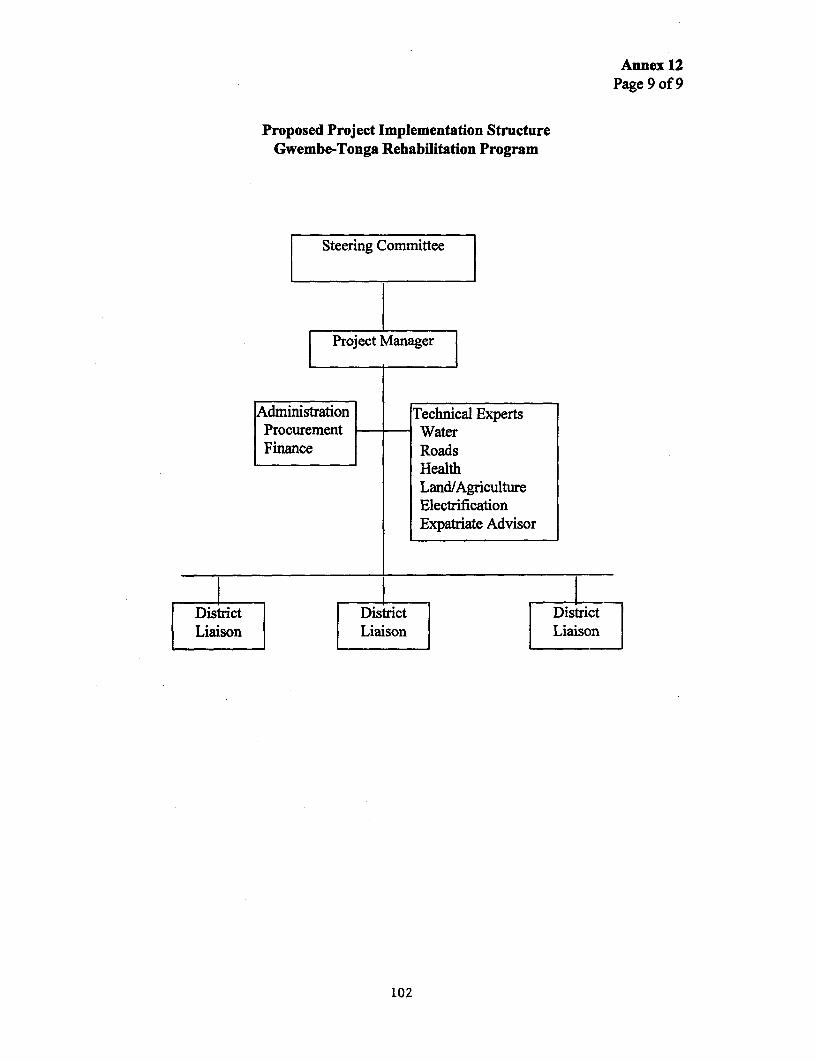
Annex 12Page 9 of 9
Proposed Project Implementation StructureGwembe-Tonga Rehabilitation Program
Steering Committee
Administration Technical ExpertsProcurement WaterFinance Roads
HealthLand/AgricultureElectrificationExpatriate Advisor
District District DisictLiaison Liaison Liaison
102

Annex 13Page I of 8
ZAMBIA POWER REHABILITATION PROJECTDAM SAFETY ASPECTS
In accordance with revised World Bank Darn Safety Guidelines (OPABP 4.37 datedSeptember 1996), when the Bank finances a project which will rely on the performance ofan existing large dam, a review and evaluation is required of: (a) the safety status of theexisting dams (b) the owner's operation and maintenance procedures and (c) the necessityor otherwise of additional dan safety measures, including a review by an independentpanel of experts (POE). The project also provides assistance, if necessary, for: (a) theidentified additional dan safety measures, (b) a dan safety training and monitoringprogram and (c) an emergency preparedness plan (EPP). There are three large existingdams associated with the proposed Power Rehabilitation Project area.
(1) Kariba Dam(2) Kafue Gorge Dam(3) Itezhi-Tezhi Dam
A. Performance of Existing Dams
1 . Kariba Dam. The 128m high Kariba double-curvature arch dam, built between1955-1959 on the Zanbezi River, is on the border between Zambia and Zimbabwe. Thedam creates one of the largest man-made lakes in the world, 250 km long, with 181 kmnstorage at normal water level. These waters supply two power stations with a totalcapacity of 1266 MW, one on the Zambezi north bank in Zambia and the other on thesouth bank in Zimbabwe. Six flood sluices in the central section of the arch, withdownstream Caterpillar gates, having their sill level 33m below the crest, can discharge9500 m'/sec at maximum water level. Water jets are thrown down to a distance more than100m downstream where, over the years, they have progressively scoured a deep, steep-sided plunge pool in the axis of the river bed.
2. The dam is predominantly founded on hard, competent sound gneiss rock, afterremoval of surface weathered rock, the upper part of right abutment being highly jointed.The general behavior of the works is influenced by the complex geological conditions onthe right (south) bank, slow long term dirvementional changes in the concrete and variablehydrological conditions. Comprehensive instrumentation (comprising strainmeters,jointmeters, ceramic targets, thermometers, pendulums, etc.) for dam safety monitoringhad been installed, during construction of the dam, which has further been supplementedbetween 1986-1989. The overall safety of the dam and associated structures has dulybeen monitored by annual inspections by Coyne et Bellier (France), and Gibb engineers(UK) over the years, under the supervision of the Zambezi River Authority (ZRA), theZambia Electricity Supply Corporation (ZESCO), and the Zimbabwe Electricity SupplyAuthority (ZESA). The dam has been well maintained by undertaking requisite safetymeasures as and when necessary, including providing drainage, anchoring and grouting forthe Bank stability; repairing and strengthening the eroded zones (caverns, seams,overhangs) at the plunge pool, by combined diving, anchoring and grouting; and
103

Annex 13Page 2 of 8
rehabilitating the spillway gates guides alignment and protection against Aggregate AlkaliReaction (AAR).
3. Lake-induced seismicity has been recorded since 1962 but the level of seismicactivity is too low to have any consequences on the dam structures.
4. Kafue Gorge Dam. The dam is an earth-and-rockflll dam with an upstreamsloping core of impervious soil, (50m high), with a live storage capacity of only 700million m3, and a total power generation of 900 MW. The reservoir is being fed byadditional re-regulated releases from the upstream Itezhi-Tezhi dam. A large number ofpore water pressure gauges were placed in the dam at the time of construction. Most ofthe gauges are no longer working due to being damaged, blocked or broken.
5. The dam, completed in 1972, though apparently with limited quality ofconstruction, is based on sound rock foundation, and appears to be well maintained. Thespillway with four gates, and discharge capacity of 4,250 m3/sec, though founded on rock,the left hill rock beddings abutting the left abutment of the spillway, dip towards thespillway, thus bringing pressure on the left abutment.
The intake structure for the head race tunnel for the powerhouse penstocks isprovided with structural floating boom which has been repaired and/or replaced as andwhen necessary.
6. The Kafue Gorge Reservoir is shallow and the evaporation losses are quite large.The re-regulated releases from Itezhi-Tezhi and joint operation with Kafue Gorge is thusvery important. The principle of operation is to keep the Kafue Gorge Reservoir elevationat the lowest level possible during August-November, but in the Kafue reservoir shouldhave adequate storage to meet the variation in power generation from day-to-day, week-to-week and month-to-month. However, the relation between evaporation losses andstorage is very unfavorable for Kafue Gorge Reservoir. The percentage lossesper unitvolume for different reservoir elevations, storages and months were estimated during1977, as:
104
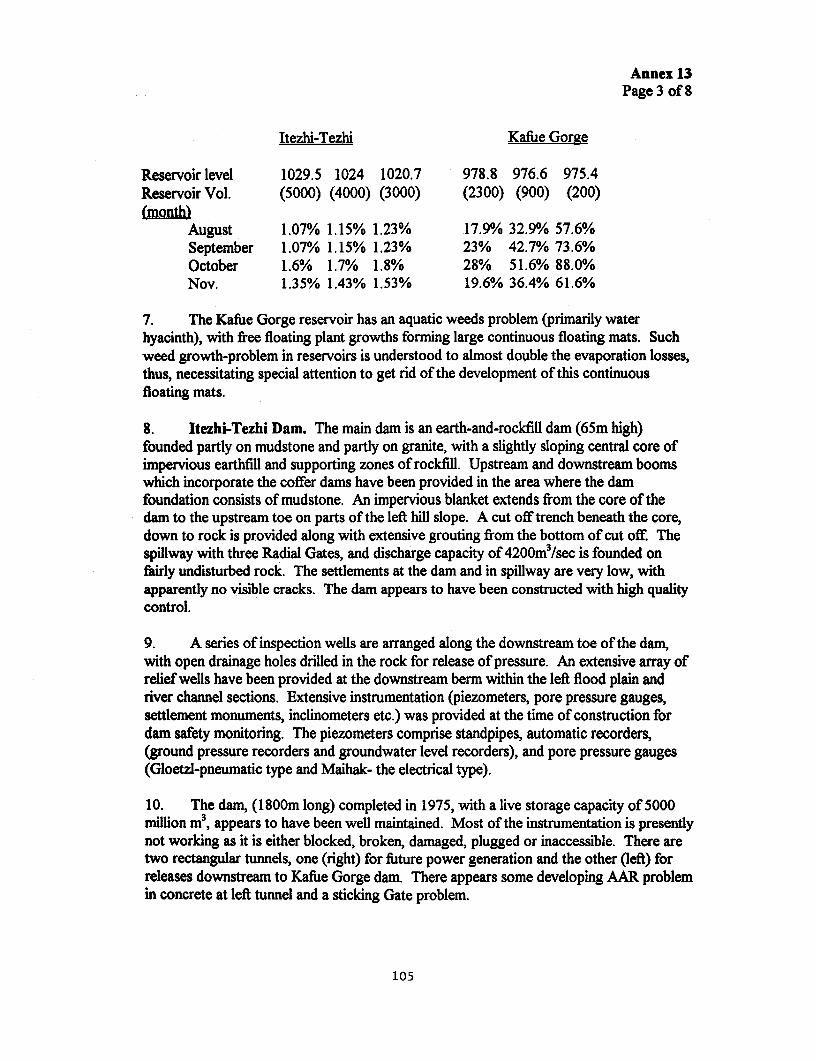
Annex 13Page 3 of 8
Itezhi-Tezhi Kafue Gorge
Reservoir level 1029.5 1024 1020.7 978.8 976.6 975.4Reservoir Vol. (5000) (4000) (3000) (2300) (900) (200)(month)
August 1.07% 1.15% 1.23% 17.9% 32.9% 57.6%September 1.07% 1.15% 1.23% 23% 42.7% 73.6%October 1.6% 1.7% 1.8% 28% 51.6% 88.0%Nov. 1.35% 1.43% 1.53% 19.6% 36.4% 61.6%
7. The Kafue Gorge reservoir has an aquatic weeds problem (primarily waterhyacinth), with free floating plant growths forming large continuous floating mats. Suchweed growth-problem in reservoirs is understood to almost double the evaporation losses,thus, necessitating special attention to get rid of the development of this continuousfloating mats.
8. Itezhi-Tezhi Dam. The main dam is an earth-and-rockfill dam (65m high)founded partly on mudstone and partly on granite, with a slightly sloping central core ofinpervious earthfill and supporting zones of rockfill. Upstream and downstream boomswhich incorporate the coffer dams have been provided in the area where the damfoundation consists of mudstone. An impervious blanket extends from the core of thedam to the upstream toe on parts of the left hill slope. A cut off trench beneath the core,down to rock is provided along with extensive grouting from the bottom of cut off. Thespillway with three Radial Gates, and discharge capacity of 4200m3/sec is founded onfairly undisturbed rock. The settlements at the dam and in spillway are very low, withapparently no visible cracks. The dam appears to have been constructed with high qualitycontrol.
9. A series of inspection wells are arranged along the downstream toe of the dam,with open drainage holes drilled in the rock for release of pressure. An extensive array ofrelief wells have been provided at the downstream berm within the left flood plain andriver channel sections. Extensive instrumentation (piezometers, pore pressure gauges,settlement monuments, inclinometers etc.) was provided at the time of construction fordam safety monitoring. The piezometers comprise standpipes, automatic recorders,(ground pressure recorders and groundwater level recorders), and pore pressure gauges(Gloetzl-pneumatic type and Maihak- the electrical type).
10. The dam, (1800m long) completed in 1975, with a live storage capacity of 5000million m3 , appears to have been well maintained. Most of the instrumentation is presentlynot working as it is either blocked, broken, damaged, plugged or inaccessible. There aretwo rectangular tunnels, one (right) for future power generation and the other (left) forreleases downstream to Kafue Gorge dam. There appears some developing AAR problemin concrete at left tunnel and a sticking Gate problem.
105

Annex 13Page 4 of 8
11. An elaborate seismic network consisting of four observatories equipped withmicro-earthquake recorders and two strong motion Accelerographs are installed tomonitor the post-impoundment seismicity. Seismicity has been very low, with insignificantmagnitudes.
B. Recent Studies, Identifying Additional Dam Safety Measures.
12. Kariba Dam. Coyne et Bellier, who were the original designers for the dam andthe associated structures, have also been monitoring Kariba dam safety over the years.They recently completed a study on the safety assessment of Kariba dam (InceptionReport, July 1997) based on: (a) updating the hydrology, (b) operation of the reservoir,(c) safe operation of the spillway gates, (d) analysis of the plunge pool development, (e)analysis of the developing AAR problem in the dam concrete and jamming of the stop-logsproblem, (f) the required replacement of the hydro-mechanical and electrical systems forassured and dependable operation of the spillway gates stop beams, and the sluices, and(g) the detailed dam safety inspection. The following additional dam safety measures havebeen identified.
(a) Necessity of (i) constructing and strengthening the concrete matdownstream and adjacent to the arch dam with deep anchoring, grouting, andconcrete toe, and (ii) providing developed plunge pool downstream, in order toprovide protection against damage by the spilling nappe, and against furtheruncontrolled development of the pool, and/or other means of stabilizationsupplemented by modeling studies;
(b) Necessity of rehabilitating the stop logs guides and the adjacent concrete inthe dam as a protection against the developing AAR and the jamming of the stopbeams problem;
(c) Necessity of replacing the identified hydro-mechanical and electricalsystems for assured and dependable operation of the spillway gates, stop beams,and the sluices; and
(d) Necessity of training local engineering professionals for dam safety andinstrumentation monitoring, thus building and strengthening ZESCO's owncapacity for dam safety monitoring.
13. The estimated costs for the required additional dam safety measures for Karibadam, including the engineering services as provided under the Project are as below:
(a) Downstream protective measures, and modeling for the(for the plunge pool) (US$)(Estimated Cost) 3,650,000
(b) Rehabilitation of stopbeams and adjacent
106
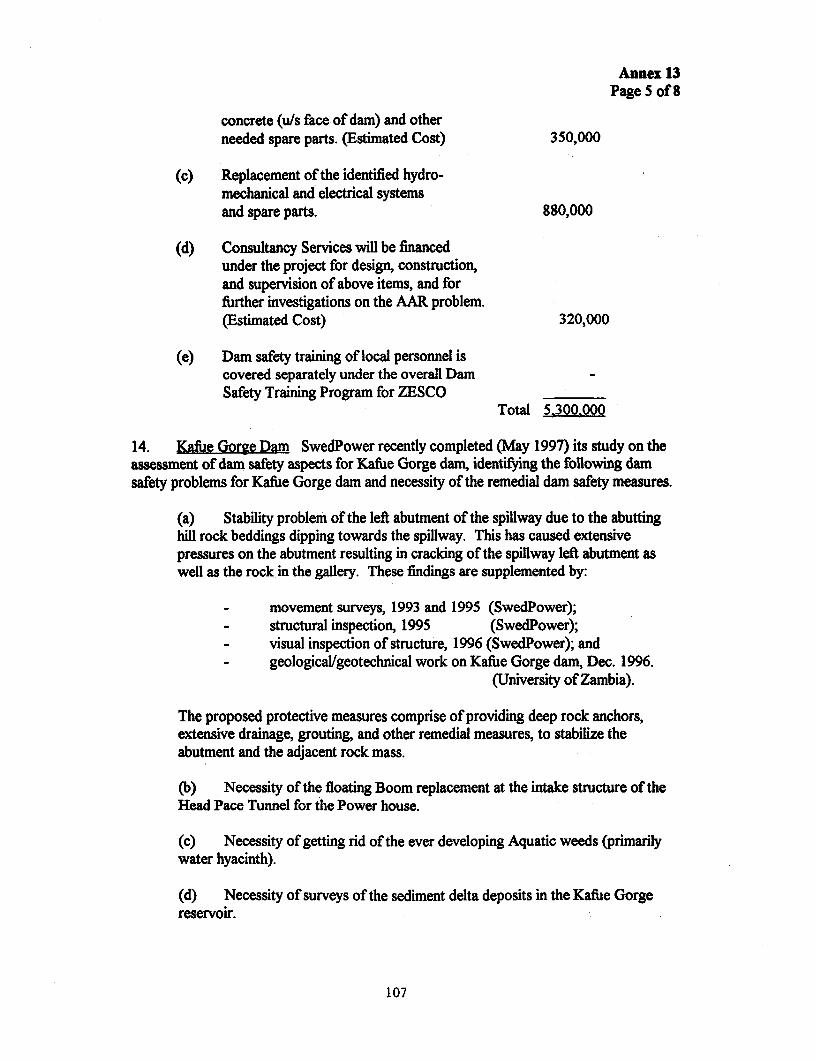
Annex 13Page 5 of 8
concrete (u/s face of dam) and otherneeded spare parts. (Estimated Cost) 350,000
(c) Replacement of the identified hydro-mechanical and electrical systemsand spare parts. 880,000
(d) Consultancy Services will be financedunder the project for design, construction,and supervision of above items, and forfurther investigations on the AAR problem.(Estimated Cost) 320,000
(e) Dam safety training of local personnel iscovered separately under the overall DamSafety Training Program for ZESCO
Total 5.300.000
14. Kafue Gorge Dam SwedPower recently completed (May 1997) its study on theassessment of dam safety aspects for Kafue Gorge dam, identifying the following damsafety problems for Kafue Gorge dam and necessity of the remedial dam safety measures.
(a) Stability problem of the left abutment of the spillway due to the abuttinghill rock beddings dipping towards the spillway. This has caused extensivepressures on the abutment resulting in cracking of the spillway left abutment aswell as the rock in the gallery. These findings are supplemented by:
- movement surveys, 1993 and 1995 (SwedPower);- structural inspection, 1995 (SwedPower);- visual inspection of structure, 1996 (SwedPower); and- geological/geotechnical work on Kafue Gorge dam, Dec. 1996.
(University of Zambia).
The proposed protective measures comprise of providing deep rock anchors,extensive drainage, grouting, and other remedial measures, to stabilize theabutment and the adjacent rock mass.
(b) Necessity of the floating Boom replacement at the intake structure of theHead Pace Tunnel for the Power house.
(c) Necessity of getting rid of the ever developing Aquatic weeds (primarilywater hyacinth).
(d) Necessity of surveys of the sediment delta deposits in the Kafue Gorgereservoir.
107
Annex 13Page 6 of 8
15. The aquatic weeds have been developing very extensively in Kafue Lake, coveringalmost 80-85% of the lake area, resulting in the following dam safety implications:
(a) Weeds jamming against spillway Gates, having impact on
(i) the spillway capacity(ii) pressure on the Gates, seals, and Guides
(b) Weeds jamming against the Boom, having impact on
(i) Boom safety(ii) likely entry of weeds through the intake structure down to
the penstocks, runners, and the turbine blades.
(c) Extensive loss of water due to evapo-transporation.
16. The estimated costs for the required additional dam safety measures for KafueGorge Dam, as provided under the project are as below:
US$(a) Stabilization of spillway left abutment 850,000
and the adjacent rock mass and (estimated cost)replacement of Bridge Bearings.
(b) Replacement of Boom (estimated cost) 170,000
(c) Contract removal of the aquatic weeds (estimated cost) 380,000
(d) Sediment surveys to be done by ZESCO
Total 1,400,000
17. Itezhi-Tezhi Dam: A serious AAR problem appears to be developing at the leftoutlet tunnel resulting in jamming of the Gate. As such, releases from Itezhi-Tezhi toKafue Gorge could not be re-regulated or coordinated. At present uncontrolled water isrunning through the tunnel as the gate could not operated. It is essential to immediatelyexplore the causes ofjamming and rehabilitate the gate, guides, and the adjacent concreteas necessary, work to be undertaken by ZESCO as a priority.
C. Independent Panel of Experts
18. As required, a two-member independent Panel of Experts comprising one archdams expert (including rock anchoring and AAR) and an engineering geologist (including
108

Annex 13Page 7 of 8
expertise in rock mechanics) is being established for review of the Consultants proposalsfor:
(a) Kariba dam proposals for strengthening and protective measuresdownstream for safety against the developing stop beams jamming,
AAR, and the proposed replacement of the hydromechanicalequipment and electrical systems.
(b) Kafue Gorge proposals for stabilization of spillway left abutmentand adjacent rock mass, and replacement of Boom.
(Estimated Cost for 2 trips) 60,000including proposals and final designs.
D. Training in Dam Safety Monitoring
19. With the existence and operation of such large and major dams in Zambia asKariba, Kafue Gorge and Itezhi-Tezhi, it is most essential to have the local engineeringprofessional trained in Dam Safety and instrumentation Monitoring; for overall safety ofthese structures. The project will provide financing for overseas training (2 to 3 months)of four selected engineering personnel from ZESCO to build inhouse dam safetymonitoring expertise. The trained professionals will be responsible for:
(a) Safety monitoring of the existing dams in Zambia, and the futureoncoming projects.
(b) transferring technology and training the other local personnel fordam safety monitoring
(estimated cost): $120,000
E. Emergency Preparedness Plan
20. The project will also provide for preparing Emergency Preparedness Plan (EPP)for Itezhi-Tezhi and Kafue Gorge and to develop a comprehensive program formanagement.
(estimated cost): $85,000
F. Proposed Action Plan
21. The following activities will be undertaken in chronological order as necessitatedwith the dam safety aspects of Kariba, Kafue Gorge, and Itezhi-Tezhi dams:
109
Amnn 13Pagp 8 of 8
(a) estaish the idepenen Panel of Experts (POE) - September 30,1997;
(b) reew the dam uft proposals by POE, - end January 1998;
(c) during ngpdadons, ZESCO to provide assance that KafieGorge lake will be mantained dear of weeds by yearly ranovals,after the overl conta removal under the projet;
(d) final design, for the dam ft Rhbili ion measureDecember 1997 for Kaniba and Kafue Gorge dams;
(e) Select conultants for Dam Safety taining Program, andpreparon of EPP - June 1998; and
(M) Provide list of sdected engineing personnel for Bank's approval- Dece_m 1998
110
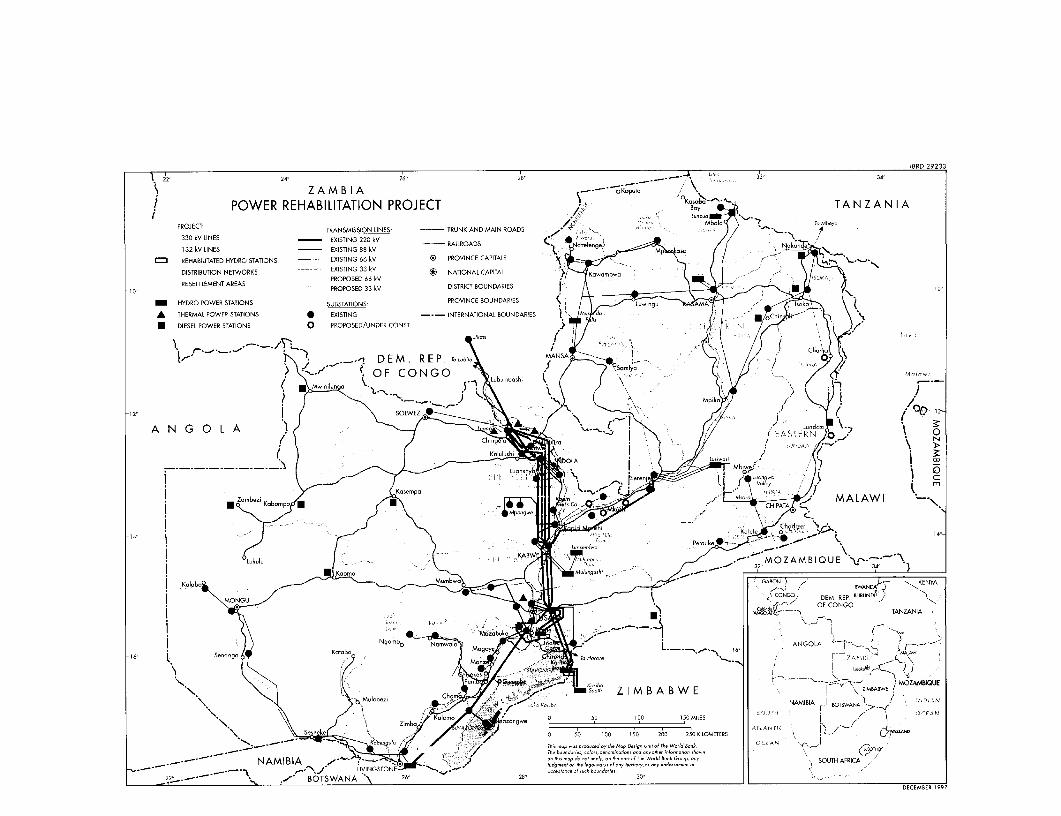
4 ~~~~~~~~~~~~~~~IBRD 29233
1 22- 24 26- 28' _,_.-' -- 32 34-
ZAMBIA oKOpLIO ,'
POWER REHABILITATION PROJECT TANZANIA
PROJECT TRANSMISSION LINES TRUNK AND MAIN ROADS - '' .
330 kV LINES EXISTING 220 kV -- RAILROADS c NoLon
132 kV LINES EXISTING 88 kV
REHABILITATED HYDRO STATIONS EXISTING 66 kV ®) PROVINCE CAPITALS
DISTRIBUT ON NETWORKS EXISIN 66 k NATIONAL CAPITAL Ko1_ < ,,,bw|
RESETTLEMENT AREAS PROPOSED 33 kv DISTRICT BOUNDARIES ! I,HYDRO POWER STATIONS PROVINCE BOUNDARIES L A So,o
A THERMAL POWFR STATIONS * EXISTING INTERNATIONAL BOUNDARIES I do ,
* DIESEL POWER STATIONS 0 PROPOSED/UNDER CONST
* ,_. <. sLk:sjDEM. EP. T/L.s MANSA
l r__.- N \OF CONGO bbh 7;X ,{ Irnw
-12-
A N G O L A 0 tgy> ;; ,OCh,n9 oo I / )~~~~~~~ AIERN ~5
14
I- -/ - - - -- -: - - -TANZANIA---mT
K.b- MALAWI~~- I--
I t Ngoo,o No--o ANGOLA j( , '~
'N 36C19 ZIMBABWE ZIN,BABWE MOZMRBIOZAOBIQU
\ \|. kb MUIZ\ b Zoob 7 9 bNFf / ] NAMIBIA I | w ED$WN *,/
K_,_;gul.Sr fTebon e oodeo sdnoh mmonhw L. GABN KENYAL T
N .D_E-MN,A M I B I A , h = \ > on ,H,, map do "O. ,mpif ON he parl oF T e Wolid 3h , GTD P; B D9 I SOLSUT AFRICA
>S _ -_E,.J LIVINOSTONE ~* 230'OCONGO
22_._-- . ,< BO TSWANA \ 26 ~ 28 30 DECEM3EB 1TZ
'A;IZ, b.k ~ ~ ~ ~ ~ ~ ~ ~ ~ ~ ~ ~ ~ ~ ~ ~ ~~~~~~~~~~OCK9E 9