world bank document municipal action program (programa,cao de a,do municipal) paz microregion action...
TRANSCRIPT

Document of
The World Bank
Report No: 17402-BR
PROJECT APPRAISAL DOCUMENT
ONA
PROPOSED LOAN
IN THE AMOUNT OF US$62.5 MILLION TO THE
FEDERATIVE REPUB3LIC OF BRAZIL
FOR THE
SCHOOL IMPROVEMENT PROJECT -- FUNDESCOLA I
MARCH 16, 1998
Human and Social Development GroupBrazil Country DepartmentLatirn American and the Caribbean Region
Pub
lic D
iscl
osur
e A
utho
rized
Pub
lic D
iscl
osur
e A
utho
rized
Pub
lic D
iscl
osur
e A
utho
rized
Pub
lic D
iscl
osur
e A
utho
rized

CURRENCY EQUIVALENTS(Exchange Rate Effective: March 1, 1997)
Currency Unit= RealR$ 1.00 =US$ 1.14
FISCAL YEAR (FY) SCHOOL YEAR (SY)January I-December 31 March-December
ABBREVIATIONS AND ACRONYMS
CAS Country assistance strategyCOEP State-based Project Executive Coordination (Coordenavo Estadual
Executiva do Projeto)CONSED National Council of State Education Secretaries (Conselho Nacional de
Secretarios Estaduais de EducaX o)cw Center-West region of BrazillDEMEC State-based office of the Ministry of Education and Sports (Delegacia do
MEC)
DGP Central Project Coordination Unit (Dire(wlo Geral do Projeto)FNDE National Education Development Fund (Fundo Nacional de
Desenvolvimento da EducaVao)FUNDESCOLA School Improvement Program (Programa Fundo de Fortalecimento da
Escola)FUNDESCOLA I First School Improvement Project (Primeiro Projeto Fundo de
Fortalecimento da Escola)FVM Fund for the Development and Maintenance of Basic Education and Teacher
Valorization (Fundo de Desenvolvimento e Man utenqao do EnsinoFundamental e Valorizacao do Magisterio)
GDE School Development Group (Grupo de Desenvolvimento Escolar)GT Technical Group (Grupo Tecnico)IBGE Brazilian Census Bureau (Instituto Brasileiro de Geografia e Estatistica)IBRD International Bank for Reconstruction and DevelopmentICB International Competitive BiddingICR Implementation Completion ReportIADB or IDB Inter-American Development Bank,
National Institute for Educational Research and Studies, a MEC-based agency(Instituto Nacional de Estudos e Pesquisas Educacionais)
LCS Least-cost SelectionLDB National Education Law (Lei de Diretrizes e Bases de Educacao Nacional)MEC Brazilian Ministry of Education and SportsMOS Minimum operational standardsMOIP Project Operations and Implementation Manual (Manual de Operages e
Implementaqdo do Projeto)N North region of Brazil2
Comprising the states of Goias (GO), Mato Grosso (MT), and Mato Grosso do Sul (MS), butexcluding the Federal District (see map)
Vice President: S. Javed Burki
Country Manager/Director: Gobind T. Nankani
Sector Manager/Director: Julian SchwveitzerTask Team Leader/Task Manager: Robin Scott Horn

NCB National Competitive BiddingNE Northeast region of Brazil3
NEBE Northeast Basic Education ProjectNGO Non-governmental organizationOECD Organization for Economic Cooperation and DevelopmentPAE State Action Program (Programa,do de A,do do Estado)PAM Municipal Action Program (Programa,cao de A,do Municipal)PAZ Microregion Action Program (Progama,ao de Aqiio Zonal)PDE School Development Plan (Plano de Desenvolvimento da Escola)PE School subproject (Projeto de Melhoria da Escola) initiated under PDE
PNLD National Textbook Program (Programa Nacional do Livro Didatico)PPO Research and Operationalization Program of Education Policies (Programa
de Pesquisa e Operacionliza,do)PRASEM Municipal Education Secretaries Support Program (Program de Apoio aos
Secretarios Municipais de Educa,cdo)PTA Annual Work Plan (Plano de Trabalho Anual)QCBS Quality- and Cost-based SelectionSAEB National System for Basic Education Evaluation (Sistema Nacional de
Avalia,do da Educa,cdo Basica)SIED Integrated Education Information System (Sistema Integrado de Infoma,ces
Educacionais)SPA Computerized Planning and monitoring system (Sistema de Planejamento e
Acompanamento)SEE State Education Secretariat (Secretaria Estadual de Educaqdo)SME Municipal Education Secretariat (Secretaria Municipal de Educa,cao)TOR Terms of Reference (for contracts, studies, missions, and so on)UE School Council (Unidade Executora)UNDIME National Association of Municipal Education Managers (Unido Nacional dos
Dirigentes Municipais de Educa,do)UNICEF United Nations Children's Fund
2Comprising the states of Acre (AC), Amazonas (AM), Amapa (AP), ParA (PA), Rond6nia (RO),Roraima (RR), and Tocantins (TO) (see map)
3Comprising the states of Alagoas (AL), Bahia (BA), Ceara (CE), Maranhao (MA),Pernambuco (PB), Paraiba (PE), Piaui (PI), Rio Grande do Norte (RN), and Sergipe (SE)(see map)


Federative Republic of BrazilSchool Improvement Project - FUNDESCOLA I
TABLE OF CONTENTS
I. PROJECT DEVELOPMENT OBJECTIVE ............................................................................ 2A. PROJECT DEVELOPMENT OBJECTIVE AND KEY PERFORMANCE INDICATORS .................... 2
II. STRATEGIC CONTEXT ............................................................................ 3A. SECTOR-RELATED COUNTRY ASSISTANCE STRATEGY (CAS) GOAL SUPPORTED
BY THE PROJECT ................................................ .. 3B. MAIN SECTOR ISSUES AND GOVERNMENT STRATEGY .4C. SECTOR ISSUES TO BE ADDRESSED BY THE PROJECT AND STRATEGIC CHOICES ...............7
III. PROJECT DESCRIPTION SUMMARY ............................................................................ 9A. PROJECT COMPONENTS ............................................................................ 9B. KEY POLICY AND INSTITUTIONAL REFORMS SUPPORTED BY THE PROJECT ...................... I IC. BENEFITS AND TARGET POPULATION ........................................................................... 12D. INSTITUTIONAL AND IMPLEMENTATION ARRANGEMENTS: ................................................... 12
IV. PROJECT RATIONALE ........................................................................... 14A. PROJECT ALTERNATIVES CONSIDERED AND REASONS FOR REJECTION ............................. 14B. MAJOR RELATED PROJECTS FINANCED BY THE BANK OR OTHER DEVELOPMENT
AGENCIES (COMPLETED, ONGOING, AND PLANNED) ................................................................ 16C. LESSONS LEARNED AND REFLECTED IN THE PROJECT DESIGN ............................................. 17D. INDICATIONS OF BORROWER COMMITMENT AND OWNERSHIP ............................................ 18E. VALUE ADDED OF BANK SUPPORT ........................................................................... 20
V. SUMMARY PROJECT ANALYSIS ........................................................................... 21A. ECONOMIC ........................................................................... 21B. FINANCIAL ........................................................................... 22C. TECHNICAL: ........................................................................... 22D. INSTITUTIONAL: ........................................................................... 23E. SOCIAL: ........................................................................... 24F. ENVIRONMENTAL ASSESSMENT: ........................................................................... 25G. PARTICIPATORY APPROACH ........................................................................... 25
VI. SUSTAINABILITY AND RISKS ........................................................................... 27A. SUSTAINABILITY ........................................................................... 27B. CRITICAL RISKS ........................................................................... 28
VI]. MAIN LOAN CONDITIONS ........................................................................... 29A. EFFECTIVENESS CONDITIONS ........................................................................... 29
VIII. READINESS FOR IMPLEMENTATION .. 29IX. COMPLIANCE WITH BANK POLICIES .............................. 29X. ANNEXES
ANNEX 1: PROGRAM DESIGN SUMMARY .31ANNEX 2: DETAILED PROJECT DESCRIPTION .37ANNEX 3:ESTIMATED PROJECT COSTS .51ANNEX 4:ECONOMIC ANALYSIS .53ANNEX 5: FINANCIAL SUMMARY .71ANNEX 6: PROCUREMENT AND DISBURSEMENT ARRANGEMENTS .75ANNEX 7: MICROREGIONS AND PROJECTS PHASING .83ANNEX 8: SOCIAL ASSESSMENT .93ANNEX 9: PROJECT PROCESSING, BUDGET AND SCHEDULE .97ANNEX 10: SELECTED DOCUMENTS IN THE PROJECT FILE .99ANNEX 11: STATUS OF THE WORLD BANK GROUP OPERATION IN BRAZIL. 101ANNEX 12: BRAZIL AT A GLANCE ........................... 103


Document ofThe World Bank
INTERNATIONAL BANK FOR RECONSTRUCTION AND DEVELOPMENT
Latin American and the Caribbean Regional OfficeCountry Department 1
Project Appraisal DocumentFederative Republic of Brazil
First School Improvement Project -- FUNDESCOLA I
Date: January 26, 1998 Task Manager/Team Leader: Robin S. HornCountry Director: Gobind T. Nankani Sector Manager/Director: Julian SchweitzerProject ID: Sector: Education Program Objective Category: Poverty ReductionBR-PA50762 ILending Instrument: Specific Investment Program of Targeted Intervention: [X] Yes [ ]No
LoanProject Financing [X] Loan [ ]Credit []Guarantee []Other [Specify]Data
For Loans/Credits/Others:
Aimount (US$m/SDRm): US$62.5 millionProposed terms: [] Multicurrency [X] Single currency, US DollarGrace period (years): 5 [] Standard Variable [] Fixed [X] LIBOR-basedYears to maturity: 15Commitment fee: 0.75%Service charge: Variable
Financing plan (US$m):Source Local Foreign TotalGovernment of Brazil 62.5 0.0 62.5IB,RD 56.4 6.1 62.5Total 118.9 6.1 125.0
Borrower: Federative Republic of BrazilGuarantor: n.a.Irnplementing Agency: Brazilian Ministry of Education and Sports (MEC)Estimated disbursements (Bank FY/US$M): 1999 2000 2001Annual 15.0 25.0 22.5Cumulative 15.0 40.0 62.5Piroject Implementation Period April 1998 - December 2000Expected effectiveness date: June 1, 1998 Closing date: June 30, 2001
1

School Improvement Project: FUNDESCOLA I Project Appraisal Document
I. Project Development Objective
A. Project development objective and key performance indicators(see Annex 1)
The development objective of FUNDESCOLA I iS to strengthen primary schoolsand the public institutions that are responsible for them within a coordinated managementframework, in order to increase the participation, promotion and graduation rates, andachievement levels of children in the North and Center-West capital microregions of Brazil.FUNDESCOLA I is the first of several projects that will attend to educational needs in the threepoorest regions of Brazil - the North (N), Northeast (NE), and the Center-West (cw). Theoverall FUNDESCOLA Program' has been agreed to in principle by the World Bank (Bank)and the government of Brazil (Borrower)2, and will be financed through a series of loans.FUNDESCOLAI will contribute to achieving the overall sector goal of ensuring that childrenfrom the poorest regions of Brazil successfully complete a basic eight-grade education. Thiswill help guarantee that these children are better prepared to participate as active andproductive citizens in a democratic society; and will aid in reducing the stark inter-regionaldisparities in educational achievement.
To achieve this development objective, FUNDESCOLA will seek to ensure thatall eligible children are enrolled in schools that: (a) meet Nfinimum Operational Standards,(b) are pursuing school-defined performance goals and projects, designed in partnership withthe community, through participation in a school development process; (c) employprofessionally qualified teachers; and (d) have principals trained in effective and efficientschool management. FUNDESCOLA will provide these schools, in turn, with technical supportfrom municipal and state education secretariat staff trained in facilitating, managing,sustaining, and replicating the school development process. In addition, FUNDESCOLA willprovide the staff in these secretariats with instruments and training in school mapping, andin engaging the community and stakeholders in the education decisionmaking process. Atthe federal level, FUNDESCOLA will support the development and implementation of nationalprograms, including assessment and distance learning and initiatives designed to improveschool quality and attendance.
The key performance indicators for the project objectives (to be achieved byJune 2001) are to:
* increase enrollment rates of children in schools meeting minimum operational standardsfrom an initial estimate of less than 10 to over 50 percent in all participatingmicroregions;
For FUNDESCOLA program objectives and key performance indicators see Annex 1. Fromthis point forward, reference to "FUNDESCOLA" refers to the program as a whole, whilereference to the "Project" or "FUNDESCOLA I " refers to thle first loan for the North andCenter-West capital city microregions.2 See Project Concept Document dated October 16, 1997.
2

School Improvement Project: FUNDESCOLA I Project Appraisal Document
* promote the elaboration and implementation of coordinated municipal or state educationaction programs in at least 50 percent of the participating municipalities;
* increase enrollment rates of children attending schools with implemented schooldevelopment plans from an initial estimate of less than 2 to over 50 percent in allparticipating microregions; and
FUNDESCOLA I will provide funding for FUNDESCOLA program startup, andwill finance, on a pilot basis, all of the program components and activities, with theexception of school construction, in the ten North and Center-West capital citymicroregions. (For a discussion of the "microregion" concept, see below as well as Annex7.) These ten microregions include the eighty municipalities centered around the cities ofBelem (Para), Boa Vista (Roraima), Campo Grande (Mato Grosso do Sul), Cuiaba (MatoGrosso), Goiania (Goias), Macapa (Amapa), Manaus (Amazonas), Palmas (Tocantins),Porto Velho (Rondonia), and Rio Branco (Acre). Consequently, FUNDESCOLA I will financeprogram activities oriented toward approximately 4,200 schools, 24,000 classrooms, and1,350,000 children (aged seven to fourteen).
11. Strategic Context
A. Sector-related country assistance strategy (cAs) goal supported by the projectCAS document number: 16852-BR Date of latest CAS discussion: June 12, 1997
The education sector goal of the CAS is to provide the opportunity for allchildren to complete the eight-year fundamental schooling cycle by 2007, and to improveacademic performance in basic subjects, particularly Portuguese and mathematics.FUNDESCOLA will contribute to these goals by increasing primary school quality andexpanding access to primary school. FUNDESCOLA addresses the goal of improving educationoutcomes by its emphasis on reducing regional disparities in student achievement; it will dothis by targeting the three poorest regions of Brazil. This will contribute to achieving theoverall objective of poverty reduction as stated in the CAS.
Attainment of these goals requires effectively implemented projects thatimprove the quality of teaching and school management, clarify responsibilities betweenmunicipalities and states, and emphasize improved educational opportunities for the poor.FUNDESCOLA is a key component of a national strategy for improving primary educationoutcomes; it seeks to strengthen educational management by promoting the integration andrationalization of municipal and state systems, focusing on the school as the agent ofeducational change, and helping maximize the effects of existing primary education policiesand programs.
3

School Improvement Project: FUNDESCOLA I Project Appraisal Document
B. Main sector issues and government strategy
Improved quality and access of basic education are at the center of socialpolicies in Brazil. The government induced major reforms aimed at helping to ensure that by2007 every Brazilian child will complete his or her primary education at an acceptable levelof academic achievement. In spite of substantial progress and political and societalcommitment, there is still much to be done to attain levels of efficiency and performancecapable of ensuring quality education for all. The following sector issues pose a particularchallenge for reform in the North, Northeast, and Center-West regions.
Low enrollment rates: The North, Northeast, and Center-West regions(excluding the federal district) have the lowest enrollment rates in the country. Thepercentage of children aged seven to fourteen not in school - 15 percent (or 350,000children) in the North; 14 percent (or 1,250,000 students) in the Northeast, and 9.1 percent(or 150,000 children) in the Center-West regions -indicates the size of the gap ineducation services. In the ten capital microregions of the North and Center-Westapproximately 97,000 children aged seven to fourteen (nearly 8 percent of the age group) arenot attending any primary school. Low levels of primary school enrollment and completionhave two main roots: (a) an inadequate or ill-distributed supply of school places; and(b) uneven demand by parents and children for beginning or additional schooling. Supply ofschool places is severely affected by the lack of facilities, the inefficient use of existingschools, and poor planning strategies. Weak demand by parents correlates with poverty-related factors and can be stimulated by increasing school quality and relevance, reducingrepetition (especially in the initial school years), and increasing community involvement.3
High repetition and age-grade distortion: Despite a doubling in nationalprimary school completion rates between 1980 and 1994, aggregate repetition rates in theNorth (over 42 percent), Northeast (approximately 45 percent), and Center-West (over 35percent) regions remain extremely high - especially in comparison with the South(approximately 25 percent). To the extent that evidence from Bank-supported sector workand other studies in Brazil confirm that students are more likely to repeat again and to dropout after having repeated a grade level, low completion rates become inevitable.4 Finally,over 60 percent of primary students are older than they should be for their respective gradelevel nationwide, with this rate reaching 81 percent in the North, 83 percent in the Northeast,and 69 percent in the Center-West. Age-grade distortion is the cumulative result of late-entry to school (especially in rural areas) and a chronic grade repetition syndrome across theBrazilian system. As a result, students spend 11.2 years, on average, to complete themandatory eight-year primary education cycle.5
3 Brazil Ministry of Education, World Bank, and UNICE]F. "A Call to Action: CombatingSchool Failure in the Northeast of Brazil." June 26, 19974ibid.5 See Annex 4 for additional information on the effect of repetition on costs.
4

School Improvement Project: FUNDESCOLA I Project Appraisal Document
Low student achievement level: According to the Brazilian Ministry ofEducation and Sports (MEc)-managed 1995 National System for Basic Education Evaluation(SAEB), the average achievement level (measuring the probability of correct answer tocurricular items on a scale of zero to one hundred) of fourth graders in Portuguese is 44.4percent for the North, 46.4 percent for the Northeast, and 50.7 percent for the Center-Westagainst 51.5 percent for the Southeast. Regional disparities are especially noteworthy foreighth graders in Portuguese, which varies between 57.2 percent in the Northeast, 61.4percent in the North, and 66.4 percent in the Center-West compared with a 69.3 percent inthe Southeast. The most recent SAEB mathematics assessment demonstrated that 49 percentof children who complete fourth grade in the Northeast are unable to perform at theminimum expected level. These children are unable to solve concrete problems, addfractions with the same denominator, or identify the graphic representation of simplefractions. The same proportion of eighth graders in the Northeast does not perform at theexpected level of mathematics mastery. For instance, 49 percent of eighth graders from theNortheast are incapable of solving simple problems involving the four operations, orderingfractions with different denominators, or solving simple problems involving fractions. ForBrazil as a whole, these figures are 35 percent and 26 percent, respectively.
Poorly qualified teachers: In the North, Northeast, and Center-West regions,out of a total of 380,730 primary school teachers, 57,000 primary school teachers have notcompleted primary school, and about 129,000 have an incomplete secondary schooleducation or are not duly certified as teachers. Over 30 percent (or 29,410) of teachers in theNorth and 16 percent (or 11,325) in the Center-West are considered "lay teachers." Almostall of these teachers are in rural areas, where most of the schools belong to municipal schoolsystems that have lower financial capacity. Municipal and state schools compete forunqualified teachers who are underpaid and who often work two or three shifts. The lack ofan attractive career plan, with salaries adequate to attract and maintain adequately qualifiedand educated teachers, affects the entire system.
Poverty-related factors: In 1990, at least 40 percent of Brazilian childrenbelow the age of fifteen were living in poor families (defined as families whose aggregateannual income is less than US$60 per person).6 This widespread poverty directly affects theability of children to go to school, because their parents compare the benefits of anadditional income eamer and household support against future gains from additionalschooling. A 1996 publication by UNICEF and the Brazilian Census Bureau (IBGE) showedthat, relative to children aged ten to fourteen, 20 percent in the North, 20 percent in theNortheast, and 27 percent in the Center-West work outside the home more than forty hoursper week. In Brazil, about 4.6 million children between the ages of ten and seventeen workand attend school, while 2.7 million work rather than go to school. These indicatorsdemonstrate the effect of perceived low benefits from an education system that is marked byhigh repetition, low achievement, and low completion rates.
6 World Bank. Brazil Poverty Report.
5

School Improvement Project: FUNDESCOLA I Project Appraisal Document
Low parental and community participation: There is a strong relationshipbetween student performance and the establishment of a school council or similar school-linked associations with parental participation.7 School periFormance is higher in schools thatroutinely inform parents about their children's progress. Communities with a greaterconcentration of adults with higher levels of schooling have greater expectations regardingeducation, know the mechanisms of the educational system better, and are better able toapply pressure to obtain quality schooling for their children. Active school councils orassociations have not traditionally been part of the education tradition, particularly in theNorth and Center-West, where school authorities do not routinely seek communityinvolvement and views.
Lack offocus on the school: Many municipal and state secretariats do not seethe school as their primary client, but tend to serve other political agencies (such as themayor, governor, or local legislators). The notion of accourntability to the school communityis alien to most mayors' and local politicians' experience. This lack of focus on the school isin part due to expanded numbers of schools and students, which has stretched thesupervisory resources of state and municipal secretaries beyond their limits; in part due tosluggish education planning and scarce information on local needs; and in part due to theconsequence of a patriarchal tradition. High turnover rates in the state and municipaleducation secretariats reduce continuity of personnel and commitment of educationmanagement staff to improving educational quality and student performance at the schoollevel. In addition, there is little incentive for long-term planning or collaboration among themunicipal and state system.
Weak municipal-state system coordination: The presence of a state educationsystem and hundreds of municipal education systems within the states, functioning inparallel but without coordination, makes the administration of public schooling complex.The overlapping of administrative systems makes it difficult to optimize resources,engenders inequality of opportunities, and may pave the vway for political patronage. Oneparticularly critical point is the lack of clear regulations regarding the interaction of theagents participating in this complex two-system web. Until recently there has been littleincentive for long-term planning or collaboration among the municipal and state systems. Inaddition, unlike seasoned state bureaucrats, the newcomers to the municipal systems findthemselves at a loss when faced with increased legal requirements and documentation.8
Government Strategy: The launching of FUNDESCOLA occurs at a propitiousmoment for improving primary education in Brazil (see below, "Key policy and institutionalreforms to be sought"). The federal government has given top priority to primary education,initiating a number of significant reforms including: (a) amendment of the constitution andapproval of a law redefining the roles and responsibilities of each government level toensure a minimum per student expenditure through the redistribution of revenues betweenstates and municipalities and the federal provision to targeted regions of any shortfall in
7 "A Call to Action."Ibid.
6

School Improvement Project: FUNDESCOLA I Project Appraisal Document
educational expenditures; (b) direct transfer of funds to the schools, in an effort to increaseschool autonomy and effectiveness; and (c) improvement of education quality, through anational assessment system (SAEB), a national distance teacher education program, atextbook quality and distribution improvement program, and national standards forcurriculum development. These reforms, designed to decentralize the funding of primaryeducation, diminish regional disparities, and increase coordination among the varioussystems, should have a profound impact on school quality, particularly to the degree thatstates, municipalities, and schools effectively use these resources, and to the degree that thepublic has efficient mechanisms to monitor the application of these finances. TheFUNDESCOLA Program has been designed to help implement these reforms.
C Sector issues to be addressed by the project and strategic choices
(a) Improving School QualityBy improving the quality of schools in terms of available materials, human resources,and school management capacity-building, the project will contribute to improving thequality of the learning process, as measured by completion and promotion rates, andstudent achievement scores. This improvement in the quality of the schools is essentialfor creating an environment for student success. School quality will be addressedprincipally by a dual strategy ensuring that schools meet Minimum OperationalStandards, and promoting and supporting the school development process. The first partof this strategy will ensure that schools in the project regions meet minimal standards interms of basic inputs, services, and infrastructure - prerequisites for children to havethe opportunity to learn at school. The second part of this strategy will ensurecommunity and school collaboration and commitment to school improvement throughthe elaboration and implementation of school development plans and their associatedschool subprojects, and will be financed through the FUNDESCOLA program.
(b) Expanding School AccessAnother issue to be addressed is the unequal distribution of the supply of school places,materials, and facilities. In the North and Center-West regions there is a large deficit ofschool places in rural areas (of the capital-city microregions), with surpluses of schoolplaces in many urban areas. In addition, the rationalization of existing school spaces ineach of the municipalities, the specification and adequate location of new classroomsthrough macro- and micro-planning, and the elaboration of state-by-state standardizedarchitectural models will contribute to an increase in the supply of school facilities in arational and cost-effective fashion.
(c) Improving School and System ManagementFUNDESCOLA I will promote effective management of the school and school system sothat the young population of the targeted regions receives quality education. The projectwill irnprove the school system management, administration, state and municpalcoordination, monitoring, and evaluation at the school, municipal, and state levels, andwill assist in elevating the efficacy and efficiency of resources for priority federaleducation programs and projects. FUNDESCOLA I will: (a) build the management capacity
7

School Improvement Project: FUNDESCOLA I Project Appraisal Document
of education institutions (at the school, municipal, and state levels); (b) provide andsupport specialized training modules and teacher certification programs; (c) fostercommunity support for education; (d) support national systems, programs, and projectmanagement; and (e) strengthen national education information systems.
8

School Improvement Project: FUNDESCOLA I Project Appraisal Document
I][. Project Description Summary
A. Project components9
Component Category Cost Incl. % of Bank- % ofContingencies Total financing Bank-(US$M) (US$M) financing
1. Raising schools to minimum Physical 90.2 72.2% 30.0 48.0%operational standards(a) P'romoting minimum operationalstandards for schools Institution(b) Educating and certifying teachers building(c) Supplying basic furniture andequipment(d) Financing school impovementinvestments(e) Financing school-managedrehabilitation of physical facilities2. Establishing a school Institution 5.3 4.2% 3.0 5.0%development process building(a) I)esigning and supporting schooldevelopment plans(b) Financing school subprojects3. Planning and providing Institution 4.3 3.4% 4.3 7.0%additional school places building(a) Carrying out school microplanningand developing standard architecturalplans(b) Testing standard architectural plans _
4. Strengthening education Institution 25.2 20.2% 25.2 40.0%management and Project buildingAdministration(a) E3uilding management capacity inschools, municipalities, and states Project(b) Providing specialized teaching and managementleaming improvement programs(c) F-ostering community participation(d) Strengthening National Educationinformation systems and programs(e) Financing project management Totl_25_ _ _ _ _ __62_5
______________________ Total 125 100% 62.5 100%
9 See Annex 2 for a detailed description and Annex 3 for a detailed cost breakdown.
9

School Improvement Project: FUNDESCOLA I Project Appraisal Document
la. Operational mechanisms
The three principal operational mechanisms of FUNDESCOLA are the minimumoperational standards model, the school development plan, and the microregional planningmodel.
The minimum operational standards model is an operational instrument-structured as a checklist - that specifies the essential package of inputs and services aschool needs in order to function at a minimal level that will facilitate acceptable studentlearning. Each school is categorized by size, based on the number of students andclassrooms, which determines the corresponding inputs for that school. Schools that areincomplete in any one of the essential elements are considered unable to provide childrenwith the opportunity to learn. FUNDESCOLA will support the institutional responsibility andactions of municipalities and states in identifying substandard schools and will finance theinputs or services necessary to raise these schools to the standard operation level.
The school development plan (PDE) is another key operational mechanismFUNDESCOLA Will apply in carrying out the school development process; this will beaccomplished through capacity building with state and municipal education secretariats. ThePDE is both the result of one process (diagnosis and strategy formulation) and the startingpoint of another (school improvement implementation and monitoring). With respect to thediagnosis and strategy process, the school and its community of parents, teachers, and localleaders meet to identify and prioritize the problems at the school, establish specific schoolimprovement objectives, and to agree on an action plan. The expression of this overalldiagnosis and agreement on actions and targets is the PDE. The PDE will include a sectioncalled the PE indicating the support the school needs to carry out their action plan and toachieve the agreed targets. Schools will use their PEs to inform municipal and stateeducation authorities on which inputs or training they need to help them attain theirobjectives. FUNDESCOLA will finance the inputs and trainingr of the approved PES.
FUNDESCOLA will support a variety of PDES, from the simplest - which maybe little more than an agreement on the part of the school staff and parents to seek specifiededucational outcome targets (such as reduction of repetition or drop-out) - to the morefully developed PDE based on strategic planning or quality management approach. Finally,with respect to the school improvement phase, the PDE will be used as the tool to monitor theimplementation of the school improvement strategy and school subproject, as well as theachievement of the agreed educational outcome targets. The most important outcome of thePDE is not the completion of a PE but rather the process of collaboration, participation, andteamwork among parents and teachers at every stage of project development, the value thateach stakeholder will derive from the experience, and, in the end, the learning dividends ofthe students.
The microregional planning model puts together, through negotiation, theneeds and priorities of all the municipalities involved in each individual microregion.FUNDESCOLA i does not intend to cover all of the 895 municipalities in the North (8.2 percent
10

School Improvement Project: FUNDESCOLA I Project Appraisal Document
of the total in Brazil) and Center-West (8.1 percent) regions. Instead, FUNDESCOLA will workwith a microregional planning model, that is, with groups of municipalities based on theBrazil Census Bureau's microregion grouping. The reason behind this operational approachis the fact that there are no single education systems operating in any state in Brazil. Instead,each state contains a state education system and hundreds of municipal education systems,functioning in parallel and competing for resources. The result is an aggregation ofeducational activities, patched together by a jumble of agreements and conflicting interests,without sufficient regulations regarding the interaction of the participating agents, andwithout either level of government taking the total responsibility for assuring qualityeducation for all.
The microregional planning model permits a more rational and effectivemanagerial option than the traditional dispersion of resources among the individualmunicipalities or the concentration of resources to state governments chronically biasedtoward the state-run school system. Intervention by FUNDESCOLA I in a microregion willcover all of the municipalities in that microregion. Though composed of neighboringmunicipalities sharing many socio-economic interests, the microregion does not constitutean administrative division, but provides a basis for planning and negotiation among othermunicipal governments and the state government
FUNDESCOLA I will initiate implementation of FUNDESCOLA in the capitalmicroregions of the North and Center-West states, which together comprise eightymunicipalities. The decision to focus FUNDESCOLA I implementation in the capital ratherthan the interior is based on both operational and equity concerns. In terms of operationalissues, execution in the capital will allow the state secretariat to work with neighboringmunicipalities on an innovation basis and develop relationships into the state interior duringsubsequent projects. In addition, project startup in the capital will attend to the greatestnumber of poor children in each state. The total school-age population in the capitalmicroregions of the states of Acre, Amapa, Amazonas, Rondonia, and Roraima, is greaterthan that of the remainder of the state. In the remaining states, the capital microregioncontains more students than any other single microregion or group of microregions (seeAnnex 7 for a detailed description of the microregional planning model).
B. Key policy and institutional reforms supported by the project
FUNDESCOLA has been designed to complement key government strategiesand programs and to assist education management at the municipal, state, and federal levelsin meeting the requirements of recent legislation, with special attention to: (a) redistributionof resources as part of the Fund for the Development and Maintenance of Basic Educationand Teacher Valorization (FvM); (b) decentralization of federal resources under the DirectSchool Funding Program; and (c) promotion of collaboration and cooperation among thestate and municipal system as part of the 1996 National Education Law (LDB). The FVM,approved by the national congress in December of 1996, established January 1998 as the
11

School Improvement Project: FUNDESCOLA I Project Appraisal Document
starting point for national FVM implementation within each state.'0 The FVM sets up fixedcriteria for allocating funds with the aim of raising standards of opportunity, quality, andequity of education. The National Education Development Fund (FNDE)-sponsored DirectSchool Funding Program, which was designed to increase school autonomy and reduceinequalities, has expanded rapidly since its inception in 1995, transferring resources on thebasis of school size and community participation. The LI)B stimulates innovation andinitiative on the part of educational agents in order to avoid excessive bureaucratization,give priority to primary education, and strengthen the role of the municipality in theprovision of grades one through eight.
C. Benefits and target populationThe direct beneficiary of FUNDESCOLA I is the primary school-age population
currently in school or entering school in the near future (abouat 1.3 million students) in theNorth and Center-West capital microregions. These children will benefit from an educationsystem endowed with an increased number of school places, adequate learning materials,certified and well-paid teachers, committed parents, and effective management at all levels.
The most important stakeholder group for the FUNDESCOLA program are theeducation decisionmakers, teachers, and other education specialists who manage and directthe primary education schools and system. In the context of decentralization, it is importantthat education managers at all levels be qualified in managing the education process andmaking effective and informed decisions across a wide range of issues. By providingmanagement tools and training in such areas as teacher career planning, school mapping,and architectural plans, the System Planning and Monitoring System (SPA), subprojectprocedures in the school and system, and the school development process, the project willprovide a large number of education professionals with the managerial capabilities they needto run a more autonomous local system (see Summary of Social Assessment, below)
D. Institutional and implementation arrangements:
Implementation period: 3 years, April 1998 through December 2000Executing Agency: Brazilian Ministry of Education and Sports (MEC)
Project coordination: At the federal level, the Central Project CoordinationUnit (DGP) (already in charge of the Northeast Basic Education Projects, NEBE 11, and NEBEiII) has been responsible for the preparation and will be charged with the administration ofFUNDESCOLA. The DGP iS institutionally and technically ready to: (a) serve as the key projectcounterpart to dialogue and participate in negotiation with the World Bank and keygovemment and international agencies; (b) rely on the state-based Project ExecutiveCoordination (coEP) and state-based office of the Ministry of Education (DEMEC) forimplementation and monitoring at the microregional level; (c) analyze and approve state,intra-state, and microregional projects and annual work plans; (d) establish or sign
10 The FVM has already been initiated in the states of Para and Goias, both to be served byFUNDESCOLA 1.
12

School Improvement Project: FUNDESCOLA I Project Appraisal Document
agreements with states, municipalities, and other government and international agencies;(e) determine, together with the states, the definition of minimum operational standards;(f) elaborate the annual implementation program based on the microregional programs;(g) conduct project-related regional, state, and micro-planning studies; (h) analyze andsubmit to the World Bank the relevant documentation for the acquisition of goods andservices and expenditure receipts; (i) define operational norms and standards forFUNDESCOLA operation; () coordinate with the World Bank the general guidelines forFUNDESCOLA (and its project) MoIP; and (k) prepare the progress reports and participate inthe mid-term and final review according to World Bank procedure.
At the state level, FUNDESCOLA will operate by means of the COEP establishedwithin each state education secretariat, which will: (a) serve as the key administrative projectunit at the state level; (b) coordinate project execution across municipalities and state schoolsystems; (c) promote the development of municipal action programs within themicroregions; (d) coordinate communication and cooperation among the local governmentagencies involved in project-related activities; (e) supervise and collaborate on the municipalprograms; (f) support the development of inter-municipal cooperation within themicroregions; (g) assist municipal secretariats in implementing the school development plan;(h) analyze and consolidate the school subprojects submitted by the School DevelopmentGroup (GDE); (i) foster the operation of school councils and community participation;(j) coordinate teacher certification programs; (k) procure goods and services according to theguidelines of the World Bank; (1) record and certify expenditures; (m) prepare progressreports; and (n) monitor and evaluate the outputs and outcomes of FUNDESCOLA in eachstate. As an executive agency, rather than a planning unit, COEP will be established and itsmembers selected and trained at the initiation of the project implementation period.
At the microregional level, FUNDESCOLA has adopted the IBGE-designedconcept of the microregion as the best way to promote collaboration and coordinationbetween municipal and state education management personnel in each of the municipalitiesinvolved, and to maximize efforts and resources within a microregion. The mayors, or theirrepresentatives, in conjunction with the state secretary of education, the DEMEC
representative, and the state president of National Association of Municipal EducationManagers (UNDIME) are members of the microregion forum which operates as a localplanning instance of the project to: (a) negotiate the priorities within and across themunicipal and the state education systems in the microregion; (b) agree on the consolidationof the various municipal action programs into a single, prioritized microregion actionprogram (PAZ), (c) agree on common targets for the microregional action program; (d) planand monitor the implementation of the microregional action program; and (e) and proposethe annual implementation program to be financed by FUNDESCOLA to be approved by theDGP. The microregion forum, is assisted and advised by a technical group, whose role is tocomplete the requisite surveys, the preliminary microregional action program, itsimplementation schedule, and other technical documents. The microregion forums haveundergone extensive training by the DGP and are well established in each of the projectstates. The states of Acre, Amapd, Goias, Para, Mato Grosso do Sul, Tocantins and Roraimahave already submitted the PAZ to the DGP, while the states of Amazonas, Mato Grosso and
13

School Improvement Project: FUNDESCOLA I Project Appraisal Document
Rondonia are currently finalizing their PAZ documentation with technical assistance from theDGP.
At the municipal level, each participating mumicipality, already participatingin the microregional forum, is responsible for: (a) designing the municipal action programand schedule, and the municipal annual implementation schedule; (b) assisting the school indesigning their own school development plan and school subprojects; (c) fostering theoperation of school councils and community participation; (d) actively participating in theirmicroregion forums; (e) developing inter-municipal cooperaltion within the microregion; and(f) monitoring the delivery of goods and services procured by the COEP.
IV. Project Rationale
A. Project alternatives considered and reasons for rejectionlA number of alternatives associated with primary education quality, access,
and management as well as other education levels were discussed. The program componentswere finally chosen as the most suited to maximize eduacational impact and resourceallocation.
Primary Education: Alternatives for improvin,g the quality of basic schoolingfor all included: (a) establishment of a completely bottom-up school-driven method fordetermining needs and resources; and (b) implementation of a entirely top-down model inorder to ensure effective control at the national level. The fully bottom-up alternative wasrejected based on the evaluation of capacity at the school and system level that indicated thatschool directors are not yet politically or technically capable of adequately expressing andrapidly attaining their needs for school inputs within the structure of the current system.High levels of control and centralized management at the federal and state level wouldfurther preclude school directors from taking control and effectively ensuring the bestinterests of the child. Furthermore, project components such as coordination of teachercertification, and assurance of selected school items was found to be more cost-effective ifselected at the local level than if purchased and distributed at the state level. For thesereasons, a more integrated form of project implementation that includes both top-down andbottom-up methods was selected.
The second alternative of a completely top-down method for ensuring schoolquality was rejected as prior project experience and education sector evaluations havedemonstrated that local interests need to be considered in order to ensure effectiveimplementation and use. In the case of school inputs, selection of materials at the schoollevel by means of a survey, followed by definition of minimum standards at the state level,will help to guarantee that school needs are met, while reducing costs due to mass purchaseand distribution. The government has committed itself to decentralization efforts throughsuch programs as direct school transfer programs, school feeding programs, and textbookselection, in order to guarantee local autonomy and greater efficiency in the application ofresources.
14
School Improvement Project: FUNDESCOLA I Project Appraisal Document
As to school access, from the supply side two major alternatives wereexamined: (a) embark in a school-building program; and (b) allow the states and allmunicipalities to design and build their own schools. Although the project regions show thehighest level of school deficit in the country, the first alternative was rejected on threeaccounts: micro-planning could help rationalize the use of existing spaces; school qualitycould attract and retain the incoming population; and the resources were insufficient to meetall the needs of additional physical infrastructure. Due to quality and cost-effectivenessreasons, the second alternative was also rejected. Instead, FUNDESCOLA decided to motivatethe states and municipalities to develop standard architectural plans for the schools of eachstate. Procurement for school construction will be carried out by COEP in future projects. Onthe demand side, an approach similar to Bolsa Escola which gives a minimum salary toneedy families provided that they enroll and maintain their children in school, wasconsidered. However further analysis demonstrates that this type of program has betterchances of success in high quality school systems. Beneficiary assessment analysis andclassroom observation studies (carried out under the "Call to Action" program)demonstrated that children's persistence in school, and their parents' expectations abouteducational attainment, are low when they believe that the school offers a low qualityeducation. Consequently, this alternative was rejected in favor of a project that attacks thesupply-based problems of the project's participating microregions, namely the lack ofplanning, low school quality and insufficient school places.
Competing management forms were examined. Three alternative optionsdeserved more attention: (a) a low-key approach to management in favor of a heavy inputorientation; (b) program delivery by the state education secretariat; and (c) focus on themunicipality as the program work unit. The first approach would repeat mistakes of the pastand therefore was rejected. Management has become a decisive component as the catalyst ofother human, institutional, and financial resources of the program. The second alternativewas eliminated as experience gathered by the Northeast Basic Education Project shows thatan approach combining both state and municipal education secretariats would better servethe mandated decentralization process. The last alternative was promptly discarded given themultiplicity of municipalities with which the DGP would negotiate. The concept ofmicroregion and its forum helped establish a cooperative and mediating instance betweenFUNDESCOLA, federal and state administration, and the hundreds of municipalities involved.
Other Education Levels: Preschool programs. The option of includingpreschool education in the project was rejected as it would have diverted scarce resourcesand diluted the impact on primary education. The importance of preschool educationprograms and their impact on future student success has been examined in Brazil and othercountries. Preschool education is currently under investigation by the government as an areafor future investment.
Adult education: The relationship between the average level of education ofadults in the community and student achievement was found to be three times that of theimpact of the teachers' level of education. The education of the current generation of
15

School Improvement Project: FUNDESCOLA I Project Appraisal Document
students was found to have a greater impact in terms of each dollar spent, as well as agreater length of time in which to realize those returns. The costs associated with adulteducation, in terms of developing facilities, training, and hiring of teachers and incomeforegone are very high. This project is based on the government's affirmation (as indicatedat the 1995 World Conference on Basic Education for All) ihat provision of quality basiceducation to all children is of highest priority.
Secondary Education: Rates of return to primary education were found to behigh, with an average of 13 percent for each additional year of primary school completed.Investment in secondary education in the North and Center-West regions would not at thistime be considered the most equitable or cost-effective investment. Expansion of primaryeducation will provide additional opportunities for children to advance to secondaryeducation, where rates of return are higher (in excess of 20 percent). This may be an addedincentive for children to complete upper primary education, where rates of return are lower.Secondary education is currently under consideration by the government for possible futureinvestment.
B. Major related projects financed by the Bank or other development agencies (completed,ongoing, and planned)
Latest Supervision (Form 590)Sector issue Project Ratings
(Bank-financed projects only)Implementation DevelopmentP'rogress (IP) Objective
(DO)Bank-financedPrimary education access and Northeast Basic completedquality Education IPrimary education quality Urban Basic completed
Education Project,"Monhangara"
Primary education access and Northeast Basic S Squality Education IIPrimary education quality Northeast Basic S S
Education IIIPrimary education quality Innovations in Basic S S
EducationPrimary education quality Parana Education S S
Quality__ _ _ _ _ _ __ _ _ _ _ _
Primary education quality Minas Gerais Pro- S Squality _
16

School Improvement Project: FUNDESCOLA I Project Appraisal Document
Sector Issue Activities Status
Other development agenciesUNICEF Complementary to Bank Projects;
Child Rights focus Support to non-government sector
Ford Foundation Ceara Early Child Development not startedProject
IDB Parand Secondary Education not startedProfessional Education just started
Notes: IP/DO Ratings: HS (Highly Satisfactory), S (Satisfactory), U (Unsatisfactory), HU(Highly Unsatisfactory)
C. Lessons learned and reflected in the project design
Following the lessons learned from the design and implementation process ofthe Northeast Basic Education Project (NEBE ii, FY 1993, Loan 3604-BR and NEBE III,FY1994, Loan 3663-BR), and prior Bank experience in Brazil (including EDURURAL),
FY1980, Loan 1867-BR), FUNDESCOLA will incorporate those project aspects that weresuccessful in achieving their intended objectives, avoiding those aspects that, uponevaluation, were deemed incomplete or unattainable. These lessons primarily include (a) afund design concept for project disbursement; (b) development of specialized trainingmodules for targeted areas, with emphasis on the school; (c) the National Textbook Program(PNLD) evaluation and distribution processes; and (d) training programs for educationmanagers. The focus on primary education is in line wiih the shift in overall World Bankpolicy, under which Bank lending is increasingly focused on primary education.
The design of FUNDESCOLA was heavily influenced by the fund design of theNortheast Basic Education Project, which allows for more efficient institutions to draw uponthe available resources. This process was found to be very effective in reducing waste,promoting effective resource management, and ensuring the arrival of funds to those usingthem to the greatest advantage. As proved in the experience of the Northeast BasicEducation Project, each state, municipality, and school will be accountable to and coordinatewith existing systems managers to ensure successful implementation of the project.
International project experience has also influenced the formation of theFUNDESCOLA program, including (a) the lessons from Chile, Uruguay, and other LatinAmerican countries in promoting school subprojects (PE) for the procurement of context-appropriate materials and increasing stakeholder input; and (b) the Colombian EscuelaNueva program, which achieved effective results in the modular use of textbooks, capacity-building of teachers, student-centered learning, evaluation of student attainment, andcommunity participation for multi-grade schools.
17
School Improvement Project: FUNDESCOLA I Project Appraisal Document
The current nationwide evaluation process of textbooks (PNLD) was adoptedand developed by MEC based on the previous experience of the NEBE I and II, whichintroduced innovative procurement procedures. The purchase of textbooks is now madethrough the teachers' choice based on a guide containing titles recommended by educationspecialists and teachers. This guide classifies the books according to content andpedagogical quality, promoting improvement by the publishers.
Textbook distribution for the entire country has improved significantly sincethe first delivery made under the Northeast Basic Education projects. The books now arriveat the start of the school year, their arrival in the school is being monitored through a specialoperation introduced by MEC, and a new delivery system is being implemented by the postoffice.
To promote effective personnel management of basic education, the projectderives lessons from the positive experience of the Northeast Basic Education Project in thetraining and capacity-building of municipal and state secretaries in the Northeast (MunicipalEducation Secretaries Support Program [PRASEM]). The project coordination unit willcontinue to build upon the success of the Northeast Basic Edlucation Project, especially interms of effective management techniques and built-in accountability requirements.
D. Indications of borrower commitment and ownership
The government has shown extensive commitment to FUNDESCOLA by meansof three principal channels: (a) the new legal, financial, and operational framework of theprimary education sector; (b) concrete goals outlined in the National Plan for Education; and(c) project components and groundwork that are being initiated and implemented prior toproject appraisal.
The legal framework of the education sector is shaped by two main statutes:(a) the National Education Law - LDB (fiscal 1996), which replaces the 1961 LDB andemphasizes basic education universalization and quality, strengthens the autonomy ofmunicipal systems, stresses the adequacy of schooling to meet local demands, and fostersthe creation of evaluation systems; and (b) the Statute for Chiidren and Adolescents (Article227 of the constitution, based on Law 8069/90), which guarantees the right to an educationthat includes personal, citizenship, and vocational development, in addition to outlining theresponsibilities and channels for government, parents, and educators to ensure this right. Thefinancial programs will be shaped by (a) the Fund for the Development and Maintenance ofBasic Education and Teacher Valorization (FvM), which redistributes the financial resourcesfor education; and (b) the direct school transfer program, which rapidly transfers FNDEresources directly to schools. Operational tools include (a) the National Textbook Program(PNLD), which evaluates, selects, buys, and distributes textbooks for all eight grades ofprimary school; (b) the Research and Operationalization Program of Education Policies(PPo), which, in a series of thirteen studies, examined the root causes of student failure in
18

School Improvement Project: FUNDESCOLA I Project Appraisal Document
primary schools. Their findings provide the foundation for the strategies of FUNDESCOLA;(c) the Northeast Basic Education Project, which, since 1993, has expanded, rehabilitated,and built schools, trained teachers, purchased and distributed textbooks, and created newmanagement systems. Its education strategies, research studies, and fund model markedlyinfluenced the design of FUNDESCOLA; (d) the National System for Basic EducationEvaluation - SAEB, which, since 1990, has contributed to the growth of an evaluationculture in the areas of student performance, teaching methods, and school managementpractices; and (e) the Computerized Planning and Monitoring System (SPA), which tracksthe implementation of the Northeast Basic Education Project on-line, and which will beapplied to FUNDESCOLA.
The recently released National Plan for Education outlines the government'sgoals and strategies for education over the next ten years. The proposed initiatives for theprimary education sector include:
(a) increased access and permanence to include all children aged seven to fourteen,with special attention to the Northeast and urban periphery;(b) increased number of graduates by 70 percent, which will require a reduction by 5percent in dropout and repetition rates, and reduction of the average number of yearsit takes to complete primary school to nine years;(c) increase in student performance according to SAEB results;(d) elimination of the category of 'lay teacher';(e) definition of minimum operational standards;(f) guarantee that new schools meet the minimum operational standards;(g) provision of at least four textbooks to every child;(h) assurance that every school offers at least four grades of instruction;(i) provision of transport in rural areas;(j) continuation of the school feeding program;(k) increase in the community's role in the school through school councils, volunteerprograms, and maintenance;(1) promotion of school autonomy;(m) expansion, within five years, of the mandatory primary education to nine yearsof instruction, beginning at six years of age;(n) assurance that within three years there will be at least twenty hours ofinstructional time per week;(o) elimination, within three years, of programs with more than two daily sessionsand one evening session; and(p) expansion of instructional time to a full school day with priority to low achievinggroups and the first few grades of the primary cycle.
In preparation for FUNDESCOLA the DGP has: (a) discussed the project'sproposed design through several meetings with state and municipal education staff in eachof ten capitals of the North and Center-West regions; (b) conducted training for thirty-fourstate and municipal government staff in the application of one of the key instruments for theprogram; (c) held at least thirty meetings with state and municipal representatives to discuss
19

School Improvement Project: FUNDESCOLA I Project Appraisal Document
the project's framework and reach agreements on: the participation of executors, the creationof the microregionalforum, the naming of the project team in each state, and the time-framefor project execution. In addition FUNDESCOLA was formally presented and discussed byparticipating municipal and state secretaries in the three regions through nineteen PRASEMseminars, as well as meetings with the National Council of State Education Secretaries(CONSED) with all state secretaries of Brazil in Gramado (RS) and Belem (PA). Meetingswere also held with World Bank staff in Washington with the project preparation team, thecountry director in Brasilia, the minister of education, and the presidents of UNDIME andCONSED.
The status of preparation of FUNDESCOLA is well advanced, with suchcompleted items as detailed and operational instruments with a schedule for implementation;instruments for macro-planning and micro-planning, including a detailed assessment of eachparticipating school; and instruments for the microregional plan;s (municipal action program(PAM) and microregional action program (PAZ). Much of the initial definition of instrumentswas completed prior to project appraisal, and at the time of this report, many of themicroregions had completed the PAZ and school survey process, demonstrating substantialinitiative and commitment on the part of the project team.
E. Value Added of Bank Support
Informed Cooperation: As the chief external finamcing institution in the areaof basic education over the past ten years, the Bank has had the opportunity of developing awell-informed and close familiarity with the key education issues. More importantly, overthe last few years it has built up a fluent dialogue with the leading education authorities andinstitutions of Brazil. This dialogue has grown despite the presence of ideologicaldifferences between a number of the key actors (including UNDIME, CONSED, UNICEF, MEC,and the universities), and across changes in the political lamdscape, resulting in suchproducts as "A Call to Action," PRASEM and the Ppo. Consequenitly, the Bank is able to playthe role of the "honest broker" in policy dialogue, and provide continuity, critical insupporting the implementation of both development projects ancl policy reform.
Identification of Key Poverty Issues: Bank education and poverty sector workhave facilitated the identification of key poverty and regional imbalance issues, which havecontributed to FUNDESCOLA strategic choices.
Local and Regional Knowledge: The recent cooperation and exchangesdeveloped with the two major national professional associations of education managers ofthe country, the National Council of State Education Secretaries (CONSED) and the NationalAssociation of Municipal Education Managers (uNDIME), have provided the Bank withdetailed information and analytical perception of local, state and regional needs anddemands. Especially important is the Bank's ability to use global knowledge to create localsolutions in the areas of education evaluation and assessmenit, teacher certification andtraining programs, governance reforms and management techniques. Derived fromexperience gathered from supporting basic education projects in other countries in the region
20

School Improvement Project: FUNDESCOLA I Project Appraisal Document
(as well as elsewhere in the world), particularly with regard to school development process,this ability will provide a tremendous benefit to the Borrower.
Readiness to Work in the Developing Regions: Based on the lessons learnedfrom EDURURAL (completed in 1990) and studies and instruments prepared by the ongoingNortheast Basic Education Project, the Bank is well prepared to incorporate povertytargeting into an education project.
Innovation: Although World Bank-financed projects in Brazil differ from oneanother tremendously, all have generated innovation. During the preparation andimplementation of this program, the Bank will leverage the success and experience gatheredfrom these innovations, including textbook development and student performance evaluationfrom the Northeast Basic Education Projects, school strengthening in the Minas Geraisproject, teacher development and accelerated learning in Sao Paulo, and municipalization inParana.
V. Summary Project Analysis"
A. Economic1 2
The starting point of FUNDESCOLA I's economic analysis is the fact that highrepetition rates have clogged the flow of students in such a way that both academicachievement and per student costs depend primarily on increasing approval rates. The highcost of primary education is related to the fact that 19.26 years of enrollment are necessaryto produce one 8i" grade graduate instead of the 8 that would be necessary if the flow ofstudents were perfect. FUNDESCOLA'S main weapon against high repetition is the SchoolDevelopment Plan (PDE) - the other components are responsible primarily for creating theenvironment where PDE s will be fruitful. The two variables that will determine how muchrepetition drops are: (i) the percentage of schools undertaking PDE s, which depends on thenumber of schools raised up to Minimum Operating Standards and (ii) the averageeffectiveness of each PDE.
The cost-benefit analysis of FUNDESCOLA was undertaken in the followingmanner: (i) a flow model was estimated for each participating microregion; (ii) a historicaltrend was applied to project how the flow of students would look without the project; (iii)the impact of the project on this flow was estimated using the two key variables describedabove; (iv) the difference between the two flows was taken; (v) given this difference, thesavings in enrollment and increases in academic achievement were calculated ; (vi) these
11 Detailed assessments are in the project file; see Annex 9.12 See Annex 4.13 In the North, the number is 31.55 and in the Center-West 19.97. The figures refer to 1996educational census. This does not mean that the average 8t grade graduate takes 19 years tofinish school, as enrollment years pertaining to those who drop out before 8th are alsocounted.
21

School Improvement Project: FUNDESCOLA I Project Appraisal Document
savings and increases were converted into two monetary flows up to the year 2012 using perstudent cost and private rate of return to education; and finally (vii) the internal rates ofreturn for each of the two flows were calculated for five to ten and 15 years of project life.
The IRR results are as follows:Scenario Worst Middle Middle Best
Poor GoodSocial IRR after 10 years 1.01% 12.54% 24.26% 39.37%Social IRR after 15 years 9.26% 19.08% 29.23% 42.66%
Even under the most unfortunate and bleak of scenarios, the social rate ofreturn after 15 years is quite satisfactory. The reasons for these impressive results is dismalstate of the flow of students in Northern and Center-Western schools. High repetition ratesmake each student cost from twice to three times what he might under a perfect flow and bydiscouraging students drastically reduces their academic achievement. The consequence isthat even small increases in approval rates can have large effects.
B. Financial' 4
Two issues are important in analyzing the project from the financial point of view:whether it places a burden upon the Federal treasury and whelher it is sustainable.
Annex 5 shows that the fully disbursed project will amount to less that 0.1% of thetotal Federal debt. Counterpart funds for the project will amount to less than 3% of Federaleducation expenditures, showing that these will also not be a weight upon Federal finances.
Sustainability was analyzed in the economic analysis: reduction in retention rates willcause the flow of students to be straightened out and thus reduce the per student cost ofeducation. For example, in a steady state flow model, a hypothetical reduction in retentionrates from 50 to 20 percent will reduce the number of enrollment years to produce a primaryschool graduate from 14.8 to 9.9, a cost reduction of nearly 50 percent.
C Technical:
[X] Summarize issues below (for example, appropriate technology, costing)[]To be defined (indicate how issues will be identified) [ None
During the last three years, curriculum parameters for all lower primary grades wererevised and thoroughly updated and detailed by MEC for use by all schools in the country.These parameters are being completed for all eight grades of primary school. TheFUNDESCOLA teacher and staff development programs, and the education materials to beacquired with FUNDESCOLA support will be evaluated by education experts during project
4 See Annex 5.
22

School Improvement Project: FUNDESCOLA I Project Appraisal Document
preparation and implementation to ensure that they are consistent with these curricularparameters.
The Program of Research and Operationalization of Education Policyconducted structured classroom observations in 140 grade schools in the Northeast. A directobservation methodology was employed, complemented by an observation schedule, ateachers' questionnaire, an interview schedule on the socioeconomic conditions of thestudents, a test of student performance in the Portuguese language, and a card for describingthe school. Among other findings, the study confirmed that the classroom continues to befocused on the teacher and teacher activities, rather than on the student, that there is anemphasis on routine activities in the classroom, that very little actual teaching is beingaccomplished during the school hours, and that educational materials are not being used inthe classroom. These findings will be tested in the North and Center-West regions duringproject startup.
Teacher certification and career planning are crucial aspects of educationpolicy as teacher salaries normally comprise up to 90 percent of the education budget ofeach municipality. As mandated by the 1996 LDB, all teachers must hold at least a teachingcertificate by 2001. A portion of the FVM may be used to fund teacher certificationprograms. The cost of developing, implementing, and coordinating the programs will besupported by FUNDESCOLA. Teacher career planning, another vital issue to both financialsustainability and planning at the municipal level, will also be addressed in the seminars andtraining modules provided to the municipal and state secretaries.
D. Institutional:[X] Summarize issues below (for example, project management, monitoring and evaluationcapacity, administrative regulations)
a. Executing agencies: Much of the success of FUNDESCOLA I will hinge on the willingnessand capacity of the state and municipal secretaries to cooperate within the environment ofthe microregion forum. In assessing the capacity of the municipal and state secretaries tocoordinate with one another, the project's experience in training and collaboration in anumber of FUNDESCOLA instruments has been very telling. In many cases the discussionsgenerated among the state and municipal secretaries were among the first recorded by eitherparty. The microregion forum provided an historic opportunity for state and municipalcoordination, with FUNDESCOLA and the imminent FVM as incentives. The collective abilityof the group of secretaries in terms of planning, monitoring, procurement, and managementis much greater than that of any one municipal secretary, operating independently. The rangeof experience, education, and abilities that each secretary brings to the forum will enrichboth the experience of the forum members and the product of their efforts, the microregionalaction plan.
b. Project management: The Project Coordination Unit has more than five years ofexperience in managing the disbursement of resources of the Northeast Basic EducationProject.
23

School Improvement Project: FUNDESCOLA I Project Appraisal Document
E. Social:FUNDESCOLA I's ability to achieve its educational goals as an equity oriented
project may be somehow affected, both positively and negatively, by identified socialfactors. Three of the most positive factors at play are the solid and increasing politicalsupport provided by the government to basic education, the brand-new and many-facetednational consensus for and commitment to education, and parents' continuing demand foreducational services for their children in spite of serious economic constraints. Four socialfactors, however, may still deter people in the two project regions from taking advantage ofFUNDESCOLA educational opportunities: (a) insufficient supply of primary school places,particularly in rural and Amazon areas (even though 75 percent of the schools but 19 percentof the students in both regions are rural); (b) scarce availability (only 15 percent) of primaryschools offering grades five to eight in the North and Center-West; (c) the direct andopportunity costs of attending school, both for boys and girls; and (d) children's andparents' discouragement and aversion to school, generated by grade repetition(approximately 17 percent or over 730,000 students in the two regions) and overall schoollack of relevance and attractiveness. Within an increasingly flexible productive system andversatile society, the Brazilian basic school has changed in scale without changing in nature.
FUNDESCOLA will address these negative factors by: (a) rationalizing andmaximizing the use of school facilities, rehabilitating existing schools and building schoolscloser to demand, especially in rural and dispersed areas; (b) expanding schools andsystematically adding new grades to the incomplete schools'5 so that grades five througheight can be offered as part of the mandatory eight years of primary education; (c) reducingthe financial costs of education through the provision of more convenient school places orlocation (microplanning) in order to reduce transportation cost or walking distance; and(d) making school more relevant and efficient through quality-oriented inputs. By targetingthe poorest regions of Brazil the FUNDESCOLA program and the FUNDESCOLA I project seekto reinforce socioeconomic reform, reduce interregional disparities, and promote socialequity, cohesion, and stability.
The Program of Research and Operationalization of Education Policyconducted beneficiary assessments in the Northeast region. Interviews with social groupswere used as a data-gathering procedure. The interviews were conducted without a closedinterview schedule; there were only a few selected themes, and considerable freedom wasgiven to the interviewers. The selected themes were the value of the school, the quality ofthe school, the school-family relationship, barriers to schooling, and suggestions for schoolimprovements. The key findings were that parents' aspirations and expectations regardingthe level of schooling their children should attain are limited by their own experiences andknowledge. Children and youth attribute importance to the school, but their vision is lessidealized than that of the adults. They have a low opinion of the utility of what they learn,and their expectations for educational attainment are low. Parents and children alike explainthat low school quality deters children from completing the schooling process.
15 Incomplete schools are mostly those that only offer grades one through four, or less.
24
School Improvement Project: FUNDESCOLA I Project Appraisal Document
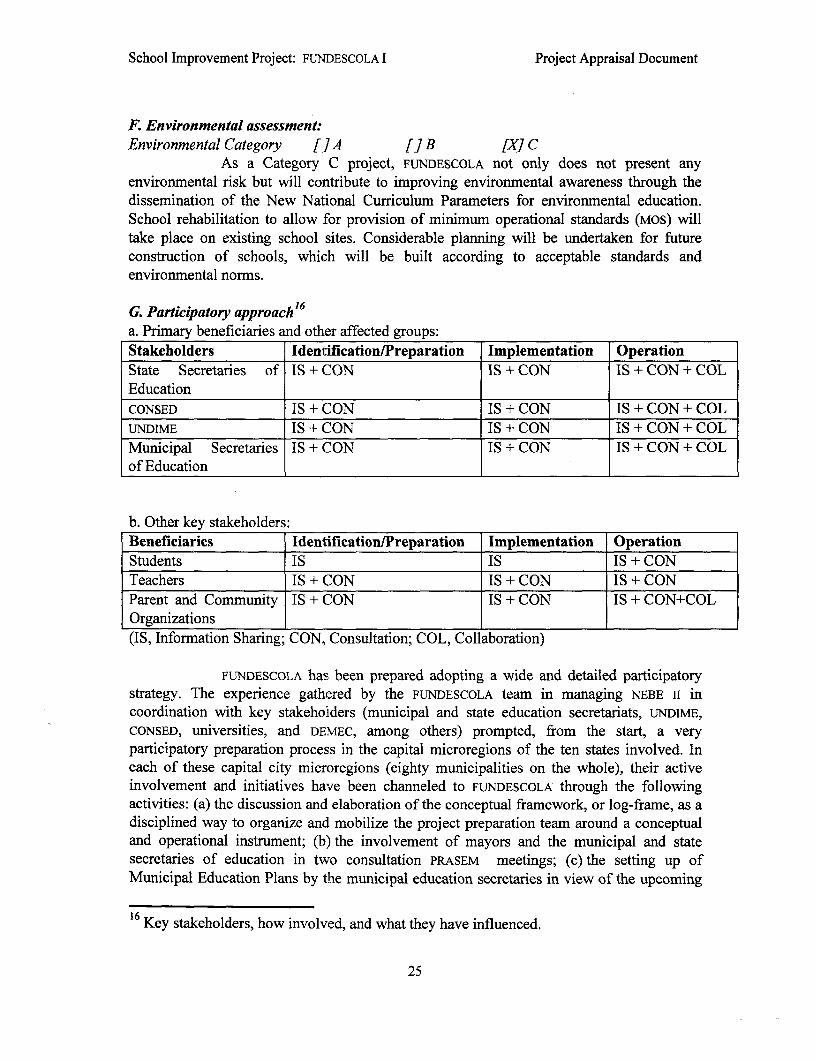
F. Environmental assessment:Environmental Category []A []B [X] C
As a Category C project, FUNDESCOLA not only does not present anyenvironmental risk but will contribute to improving environmental awareness through thedissemination of the New National Curriculum Parameters for environmental education.School rehabilitation to allow for provision of minimum operational standards (Mos) willtake place on existing school sites. Considerable planning will be undertaken for futureconstruction of schools, which will be built according to acceptable standards andenvironmental norms.
G. Participatory approach16
a. Primary beneficiaries and other affected groups:Stakeholders Identification/Preparation Implementation OperationState Secretaries of IS + CON IS + CON IS + CON + COLEducationCONSED IS + CON IS + CON IS + CON + COLUNDIME IS + CON IS + CON IS + CON + COLMunicipal Secretaries IS + CON IS + CON IS + CON + COLof Education
b. Other key stakeholders:Beneficiaries Identification/Preparation Implementation OperationStudents IS IS IS + CONTeachers IS + CON IS + CON IS + CONParent and Community IS + CON IS + CON IS + CON+COLOrganizations I_I_I_I(IS, Information Sharing; CON, Consultation; COL, Collaboration)
FUNDESCOLA has been prepared adopting a wide and detailed participatorystrategy. The experience gathered by the FUNDESCOLA team in managing NEBE II incoordination with key stakeholders (municipal and state education secretariats, UNDIME,CONSED, universities, and DEMEC, among others) prompted, from the start, a veryparticipatory preparation process in the capital microregions of the ten states involved. Ineach of these capital city microregions (eighty municipalities on the whole), their activeinvolvement and initiatives have been channeled to FUNDESCOLA through the followingactivities: (a) the discussion and elaboration of the conceptual framework, or log-frame, as adisciplined way to organize and mobilize the project preparation team around a conceptualand operational instrument; (b) the involvement of mayors and the municipal and statesecretaries of education in two consultation PRASEM meetings; (c) the setting up ofMunicipal Education Plans by the municipal education secretaries in view of the upcoming
16 Key stakeholders, how involved, and what they have influenced.
25

School Improvement Project: FUNDESCOLA I Project Appraisal Document
project; (d) the development, by municipal and state education secretariats, of a thoroughassessment of their schools as compared to the agreed minimum operational standardschecklist; and (e) the participation in a preliminary beneficiary assessment carried out in fiveof the ten project states and which will be completed by further and more factualconsultation with a variety of representative stakeholders,
26

School Improvement Project: FUNDESCOLA I Project Appraisal Document
VI. Sustainability and Risks
A. SustainabilityFinancial Sustainability: Financial sustainability of the first project is
ensured by both the external context and internal composition of FUNDESCOLA. The mostimportant issue of financial sustainability in terms of the external context of FUNDESCOLA isensured by its relationship to the FVM. FUNDESCOLA will operate concurrently with the FVM,
which automatically transfers resources within each state to assure a minimum per-studentexpenditure of R$315 (1997).. With regard to internal composition, financial sustainabilityis ensured by the phasing mechanism of FUNDESCOLA. For school construction, typically thelargest fraction of total project expenditures, FUNDESCOLA requires that microplanning andarchitectural plans be approved prior to school construction, which is expected to occur insubsequent project in the FUNDESCOLA program. The school development processencourages the school to manage its own affairs as well as to look to community and stateresources for support, through the school development plan, which must indicate sources offunding (FUNDESCOLA or otherwise) for current and planned projects.
Institutional Sustainability: The fact that FUNDESCOLA was designed to workin synergy with other major national primary education programs shows that the project isnot an exception in the government's strategy to eliminate regional disparities and promotequality education throughout the country. Several initiatives adopted by the governmenthave made the institutional framework more conducive to sustainability. In addition,FUNDESCOLA I has been designed as a prospective operation with a clear-cut preparatoryrole. Its strategies and components aim to serve as a building block and to create medium-and long-term institutional conditions and instruments for more ambitious subsequentprojects to unfold under the FUNDESCOLA program. These strategies include (a) thedefinition, establishment, and dissemination of minimum operational standards as apernanent yardstick to gauge the several elements of school quality; (b) the managerial andchange-oriented skills, including microplanning and evaluation, to be incorporated into themunicipal and state education secretariats; (c)the focus on school and communityparticipation, including the school council, the school development plan, the schoolsubprojects, and the direct school funding program, all of which point to grassroots identity,local ownership, sustainability, and increased demand for education services and theirquality; and (d) the decentralization of education authority and resources to the municipallevel and, where possible, to the school level, brings crucial decision elements closer to theschool/community context. Its first consequence is the strengthening of the MunicipalEducation Secretariats, possibly the most decisive step toward local school affirmation andcontinuity; and (f) the participatory and vigorous scheme maintained by the NationalCouncil of State Secretaries (CONSED) and the National Association of Municipal EducationManagers (TUNDIME) ensures institutional conditions for permanence. Although themicroregional forum is not a institutional level per se, it plays a powerful role in promotinglocal political representation, cooperation, and planning. Furthermore given the staggerednature of elections in Brazil, the presence of a functioning microregional forum will helpassure that the impact of post-election changes in leadership and institutional instability isminimized.
27

School Improvement Project: FUNDESCOLA I Project Appraisal Document
Additional mechanisms that the project management itself will undertake toensure sustainability vary by each component. Minimurn operational standards will bedefined in accordance with those proposed by MEc in the ten year plan for education. Inaddition the project management will initiate a national campaign to identify and rank topschools according to criteria such as minimum operational standards; promotion, repetition,and drop-out rates; level of teacher and school director education; existence of a schoolcouncil; and other school-quality indicators. School development plans and theiraccompanying school subprojects will benefit from coordination between the existing directschool funding program, such that the mechanisms for F'NDE are used according to MECregulation. Experience in Mato Grosso and elsewhere has shown that once a school and itscommunity become involved in the school development process, they are much more likelyto continue. With respect to the management component, 1the creation of a certification andtraining culture, such that school councils will demand certified, experienced schooldirectors and municipal secretaries of education, will promnote sustainability beyond the lifeof the project.
B. Critical Risks1 7
Risk Risk Rating Risk Minimization MeasureLack of political commitment and technical N Social Marketing fosterssupport of state and municipal education community pressure forsecretariats. change.Low level of cooperation among the state and M Microregional forum andmunicipal systems in operationalizing required cooperation.resources.Lack of commitment of the school team and M Fostering community supportlow community participation. through various media.End of decentralization efforts on the part of N Political awareness of successfederal government. at local level.Failure to implement the Fund for Maintenance M Understanding on the part ofand Development of Primary Education and secretariats of the re-Valorization of Teachers. distributive value of the Fund.Lack of community and political commitment M Social Marketing.for reform including demand for qualityservices, social mobilization, and monitoring. _
Low commitment for improving the M Fostering of social awarenesseducational experience as a means of poverty through publication ofreduction and national development. success of project.Overall Risk Rating M _ ___ ___
Risk Rating - H (High Risk), S (Substantial Risk), M (Modest Risk), N (Negligible or LowRisk)
17 Reflecting assumptions in the fourth column of Annex 1.
28

School Improvement Project: FUNDESCOLA I Project Appraisal Document
VII. Main Loan Conditions
A. Effectiveness Conditions
There are only two effectiveness conditions:1) the signing of at least five Microregional participation agreements, which
govern the relationships and Project-related responsibilities of MEC andthe participating state and municipal governments in each Microregion.
2) the registration of the Loan Agreement by the Central Bank.
VIII. Readiness for Implementation
[ ] The engineering design documents for the first year's activities are complete and readyfor the start of project implementation. [X] Not applicable.[ ] The procurement documents for the first year's activities are complete and ready for thestart of project implementation.[X] The Project Operations and Implementation Manual has been appraised and found to berealistic and of satisfactory quality.[ ] The following items are lacking and are discussed under loan conditions (Section G):
IX. Compliance with Bank Policies
This project complies with all applicable Bank policies, especially those indicated below:[ ] Indigenous peoples [ Riparian water rights[ ] Cultural property [ Financial management[ ] Environmental impacts [ Financing of recurrent costs[ ] Natural habitats [X] Local cost sharingp[X Gender issues [X] Cost-sharing above country three-year average[ ] Involuntary resettlement [X] Retroactive financing above nornal limit[ ] NGO involvement [ ] Disputed territory
[X] Other (provide necessary details)
Task Manager/Team Leader: Robin Scott Horn, LCSHD (
Sector Manager/Director: Julian Schweitzer, LCSHD
Country Manager/Director: Gobind T. Nankani, LCC5C ('X
29


School Improvement Project: FUNDESCOLA I Annex 1Project Logfiame
Annex 1FUNDESCOLA I
Program Design Summary
Key-Ferfotm euSector-related CAS Goal: (from Goal to Bank Mission)
Achieve universal primary 1. Increase net enrollment Sector studies, SAEB Significant commitment oneducation by 2007 and rates by 5%, (currently 90%, results, National Census, the part of the population andimprove academic 95%, and 83%) in the North, and surveys. Government to pursueperformance in basic Northeast and Center-West targeted educational effortssubjects, particularly regions, respectively (MEC that will contribute toPortuguese and 1996); improve educational access,mathematics. completion, and quality
2. Increase the ratio between outcomes for the poor.8 th grade graduates and 1 stgrade enrollments from 12%,13%, and 26% to 20%, 20%,and 30%, in the threeregions, respectively;
3. Increase the proportion of4th graders achieving at theelementary level ofproficiency in mathematicsby 10% (currently 55%,52%, and 60%) in the threeregions, respectively; and theproportion of 4th gradersachieving at the elementarylevel of proficiency inPortuguese by 8% (currentlyfrom 59%, 58% and 62%) inthe three regions,respectively (SAEB 1995).
Program Development (End of Program Indicators, (from Program DevelopmentObjectives: by June 2001) Objectives to CAS Goal):
Strengthen primary schools 1. Increase enrollment rates Project completion report, Continuity of theand thie public institutions of children attending schools official records, surveys governments' commitment toresponsible for the schools that meet Minimum and research studies. implementing the ongoingwithin a coordinated Operation Standards from an educational reforms.management framework. initial estimate of less than
10% to over 50% in allparticipating microregions;
31

School Improvement Project: FUNDESCOLA I Annex IProject Logframe
2. Increase enrollment rates The school-basedof children attending schools development process and thewith implemented School minimum operationalDevelopment Plans from an standards model are adoptedinitial estimate of less than and institutionalized at state,2% to over 50% in all municipal, and school levelsparticipating microregions;
Community and political3. Promote the elaboration commitment continues forand implementation of reform, including demand forcoordinated municipal/state quality services, socialeducation action programs in mobilization, andat least 50% of the monitoring.participating municipalities.
Project I Development (End of Project I Indicators, (from Project I DevelopmentObjectives: by 2000) Objectives to Program
Development Objectives)Strengthen primary 1. Increase enrollment ratesschools, and the public of children attending schools Community and politicalinstitutions responsible for that meet Minimum commitment for reformthe schools, within a Operation Standards from an including demand for qualitycoordinated management initial estimate of less than services, social mobilization,framework within the 10% to over 50% in all and monitoring.capital city microregions in participating microregions;the North and Center-West Continued commitment forstates. 2. Increase enrollment rates improving the educational
of children attending schools experience for all as a meanswith implemented School of poverty reduction andDevelopment Plans from an national development.initial estimate of less than2% to over 50% in allparticipating microregions;
3. Promote the elaborationand implementation ofcoordinated municipal/stateeducation action programs inat least 50% of theparticipating municipalities.
Project I Outputs: (from Project I Outputs toProject I Development
1. Schools with Minimum 1.1 Specification and 1.1.1 DGP Reports. Objectives)Operational Standards quantification of equipment(MOS) met. and materials within the Continued decentralization
Minimum Standards for efforts on the part of thepurchase. federal government.
1.2 Provide equipment and Adequate and timelyfurnishings to at least 80% of implementation of the Fund
32

School Improvement Project: FUNDESCOLA I Annex IProject Logframe
schools (1-8) in targeted 1.2.1 System Planning and for Maintenance andareas. Monitoring Reports (SPA), Development of Primary
and site-inspections. Education and Valorization1.3 Provide didactic of Teachers.materials, teachers' guides,and reading materials for 1.3.1 Ibid. Official and communitygrades 1-8 in 100% of commitment toward raisingschools in targeted regions. school quality.
1.4 Financing of school Municipal and Staterehabilitation, learning and education managers ensureadministrative materials in 1.4.1 Ibid. delivery of school inputs.targeted regions.
1.5 Technical and financialsupport of selected programsto contribute to the 1.5.1 Ibid., as well ascertification of at least 80% National Census.of lay teachers.
2. School-Based 2.1 Definition and testing of 2.1.1 DGP Reports. Political commitment andDevelopment Process strategy and instruments for technical support of state andAdopted. School Development Plans municipal secretariats in
(PDE) and School favor of school qualitySubprojects (PE). improvement.
2.2 School Development 2.2.1 Annual School, Collaboration among thePlans (PDE) elaborated in at Municipal and State state and municipal systemsleast 311 schools. Secretariat reports. in optimizing resources.
2.3 Financing of 31 1 School 2.3.1 System Planning and Commitment of the schoolSubprojects (PE) in targeted Monitoring Reports (SPA), team and communityareas. site-inspections, and participation.
interviews.
3. School places provided. 3.1 Preparation of Micro- 3. 1.1 System Planning and Political and institutionalPlanning/School-Mapping Monitoring Reports (SPA), commitment to assume theirfor new school facilities in site-inspections, and own specific roles in schooleach participating National Census. building and maintenance.microregion.
Adequate acquisition of3.2 Preparation of 3.2.1 Ibid. transportation services, whenArchitectural Plans for new appropriate and costschool facilities in each state. effective.
3.3 Building School 3.3.1 Ibid. Provision for alternativePrototypes school facilities during
construction and_ _____________________ ____________________________ ___________________________ rehabilitation.
4. Administrative and 4.1 Training of: 4.1.1 System Planning and Dialogue between CONSEDmanagement systems, * 85% of school directors, Monitoring Reports (SPA), and UNDIME, the national
33

School Improvement Project: FUNDESCOLA I Annex 1Project Logframe
procedures, and processes municipal secretaries, and and Supervision Reports. associations for educationimproved and operational at state secretaries. manager.the school and system level. * at least 100 technicians at
the federal level. Receptiveness and flexibility* Supply of equipment, of the State and Municipal
information systems, and Education Secretariats tosoftware to select cooperate with one another.education managers.
Willingness of municipalities4.2 Provide specialized to set up inter-municipaltraining and materials in consortia and dialogue.selected areas to 20% ofteachers for grades 1-8. Continuity of commitments
and agreements across4.3 Established strategies for political transitions andsocial marketing for 4.2.1 System Pllanning and administrations.encouraging pro-school Monitoring Reports (SPA).mobilization and the creation Schools able to useof school councils. information from SIED.
4.4 Technical and financialsupport for national 4.3.1 DGP Reports.programs conducted by theMinistry of Education.
4.5 Availability of EducationInformation Systems (SIED)outputs to at least 50% of 4.4.1 System Planning andschools in each participating Monitoring Reports (SPA).state.
4.5.1 School DevelopmentsPlans show use of SIEDinformation. SystemPlanning and MvtonitoringReports (SPA).
Program Components (Inputs: budget for each Financial Reports. Timely availability ofand Subcomponents: component) budgetary resources at the
Disbursement reports, federal level.1. Raising schools to 1. US$ 90.2 million procurement records,minimum operating contracts, and audits. Competence, commitment,standards and continuity of education
Evaluation Reports. personnel at all levels.A. Promoting minimumoperational standards forschoolsB. Educating and certifying Commitment of stateteachers governments to give these
bids a high priority.
34

School Improvement Project: FUNDESCOLA I Annex 1Project Logframne
C. Financing basic furnitureand equipmentD. Financing schoolimprovement investmentsE. Financing school-managed rehabilitationphysical facilities
2. Establishing a school 2. US$ 5.3 million Openness and willingness ofdevelopment process school team and community
to collaborate with oneA. Designing and another.Supporting schooldevelopment plans Continuous community and
political commitment forB. Finamcing school improving education.subprojects
Availability, continuity, andcommitment of technicalstaff, both in the statesecretariat and in municipalsecretariats, trained andequipped to promote andsupport the school-baseddevelopment process.
3. Plarning and providing 3. US$ 4.3 millions Availability of statistical dataadditional school places and maps at the municipal
level.A. Carrying out of schoolmicroplanning and Availability of properlydeveloping of standard defined (including legalschool architectural plans conditions) sites for new
construction.B. Testing standardarchitectural plans Availability of technical staff
(including engineers,architects, and procurementspecialists) to bid andsupervise construction.
Timely availability of otherschool inputs, includinghuman resources andteachers.
Commitment of stategovernments to give thesebids a high priority.
35

School Improvement Project: FUNDESCOLA I Annex IProject Logframe
4. Strengthening education 4. US$ 25.2 million Continuity of technical andmanagement and project administrative personneladministration involved.
A. Building management Availability of minimumcapacity in schools and state and local workingparticipating municipalities, conditions.and states
Continuity of Task andB. Providing specialized Project Management andteaching and learning execution teamsimprovement programs
Assurance of qualifiedC. Fostering community technical human resources.participation
Continued federal support forD Strengthening national the institutionalization of theeducation information Census.systems and programs
E. Financing projectmanagement
36

School Improvement Project: FUNDESCOLA I Annex 2Detailed Project Description
Annex 2
FUNDESCOLAI
Detailed Project Description
FUNDESCOLA Program and Projects
FUNDESCOLA lis the first project within a medium-range and more comprehensiveprimary education FUNDESCOLA program designed to support primary education schools inthe nineteen states of the North, Northeast, and Center-West regions of Brazil. All of theFUNDESCOLA projects, even though targeting different regions, will pursue the sameobjectives. They will consist of approximately the same structure and components, andadopt a similar decisionmaking process.
Summary of Project Objective and Components
FUNDESCOLAI focuses on the ten capital city microregions of the North and Center-West regions. The development objective of FUNDESCOLA is to strengthen primary schoolsand the public institutions that are responsible for them within a coordinated managementframework, in order to increase the participation, promotion and graduation rates, andachievement levels of children in the North and Center-West capital microregions of Brazil.In order to meet this objective, FUNDESCOLA I is based on four interrelated components. Thefirst two components are primarily oriented toward schools, while the remainingcomponents emphasize the systems that support schools, as described below:
1. Raising Schools to minimum operational standardsa) Promoting minimum operational standards for schoolsb) Educating and certifying teachersc) Supplying basic furniture and equipmentd) Financing school improvement investmentse) Financing school-managed rehabilitation of physical facilities
2. Establishing a school development processa) Designing and supporting school development plansb) Financing school subprojects
3. Planning and Providing Additional School Places
a) Carrying out school microplanning and developing standard architecturalplans
b) Testing standard architectural plans
4. Strengthening Education Management and Project Administrationa) Building management capacity in schools, municipalities, and statesb) Providing specialized teaching and learning improvement programsc) Fostering community participationd) Strengthening national education information systems and programse) Financing project management
37

School Improvement Project: FUNDESCOLA I Annex 2Detailed Project Description
Decisionmaking and Implementation Framework
The basic decisionmaking and implementation framework for the FUNDESCOLA Iproject components oriented toward schools is shown in Figure Annex 2-1. The diagrammakes it clear that the school and its community are at the center of the entire project. Asshown here, the schools are supported and served by a school development group (GDE) atthe municipal and state levels; the microregion forum at the microregional level; and theproject executive coordination (COEP) at the state level, and the central project coordinationunit (DGP) at the ministry of education level. The specific ilow of decisionmaking, training,and financing for each subcomponent is described under the corresponding"Implementation Arrangements" segment in the Project Operations and ImplementationManual (MoIP).
Key Institutions Involved in the Decisionmaking Process
COEP The FUNDESCOLA project and coordinating body at the state level, working directlywith SEE, SME, GDE, FORUM, and GT. It is generally located in SEE facilities andstaffed mainly by SEE personnel.
DGP The major planning, implementing, and evaluatinlg FUNDESCOLA project agencydirectly under the responsibility of the ministry of education.
FNDE A semi-autonomous agency under the MEC umbrella, closely associated with theFUNDESCOLA project and responsible for the counterpart funds of the federalgovernment.
FORUM Collective body comprised of the microregion maycors, the state education secretary,a National Association of Municipal Education Mamagers (uNDIME) representativeand a state-based office of the ministry of education (DEMEC) representative.
GDE Municipal-based technical and school-oriented team comprised of municipal andstate representatives which deals directly with schools. It is located in SME facilities.
GT A technical team which works at the microregional ]level as an assistant group to theFORUM and relates mainly with COEP,SEE and SME.
MEC In project-related matters, MEC operates mainly through DGP and FNDE.
SEE Responsible for the state education system and 'headed by the state educationsecretary, who is a FORUM member.
SME Responsible for the municipal education system and headed by the municipaleducation secretary.
UE School level council, fiscal, and administrative unit operated by parents, teachersand the community.
38

School Improvement Project: FUNDESCOLA I Annex 2Detailed Project Description
Description of the Decisionmaking and Implementation Process
The general decisionmaking flow (see Figure 2.1) of the school developmentprocess supported by FUNDESCOLA is described below:
1. DGP prepares instruments and systems and trains COEP in project activities and in theuse of instruments.
a) During the initial implementation phase, DGP also trains GDE.
2. DGP and COEP continue training of, and provide technical assistance to GDE.
3. GDE works with schools to collect data and help them prepare school developmentplans (PDE) and school subprojects (PE).
a) School works with the community, including the UE, in the PDE and PEpreparation process.
4. School submits PDE and PE to GDE for analysis and prioritization of needs.
5. GDE analyzes and submits PE to technical group (GT), which ranks PE in the light ofupdated municipal action plans (PAM), which are included as chapters of themicroregional action program (PAZ).
A) GT submits PE to the microregion FORUM, which on the basis of theFUNDESCOLA funding ceiling for microregion, negotiates the best PE resourceallocation.
6. The FORUM recommends FUNDESCOLA funding for the best PE, and COEP coordinatesthe corresponding annual work plan (PTA) involving the state and themunicipalities.
7. COEP delivers draft PTA to DGP for clearance, approval, and preparation of a contract.
8. DGP submits the contract to state education secretary and mayors for signature.
A description of the implementation arrangements, as well as indicators and targets for eachsubcomponent, can be found in the Project Operations and Implementation Manual (MOIP).
39

School Improvement Project: FUNDESCOLA I Annex 2Detailed Project Description
Communit
8 a~~~~~~~~~3
/ un escolax / Project /9 Management 9 / 6chool 00
\ A _~~~~~A
Secretriat of
SchoolPrQject > > Development r. Tech rorum
Coordination 2 Group , Team
k M4unicipal ,8ecretriat of
lEducation
6
Figure Annex 2 - 1
40

School Improvement Project: FUNDESCOLA I Annex 2Detailed Project Description
Project Components
COMPONENT 1: Raising Schools to Minimum Operational Standards
Objectives
This component will provide inputs and services to assure that the schools in eachmunicipality participating in the project meet minimum operational standards. Thismeans that the schools of the North and Center-West regions will offer at least apre-defined, minimal set of educational materials, teaching staff, equipment,furniture, and facilities. The specific objectives are to:
1 . Define and agree on minimum operational standards objectives and contents;
2. Promote the establishment of minimum operational standards in the participatingschools to assure that for each municipality the GDE:
a) knows what the minimum operational standards are;
b) is able to assess each school with respect to minimum operational standards;
c) is able to mount a strategy to raise all schools to minimum operationalstandards;
d) knows the critical importance of disseminating the minimum operationalstandards model to each school; and
e) is prepared to mount a strategy to involve the schools in self-evaluation andupgrading with respect to these standards.
3. Provide inputs and services to assure that the students in these municipalities areenrolled in schools that meet minimum operational standards.
Operational Framework
Minimum operational standards is an input-based framework for improvingeducational equity with respect to the basic prerequisites of schooling. The rationalefor this approach is based on the existence of a very large number of schools in theproject regions that simply should not be called schools, because they do notprovide even the most minimal conditions for teaching and learning.
The minimum operational standards model is designed to operationalize theconcept of a functioning school. It consists of an agreed-upon, pre-determined set ofessential inputs and conditions needed for a school to be considered "operational."The key instrument for implementing this model is a simple checklist of the inputsand services needed for a school to carry out its basic functions. The items includedin the checklist vary with the size of the school. For example, a very small schoolcan operate without a main office or a school library, whereas a large school wouldneed these facilities in order to function.
A school operating at minimum operational standards is one that is consideredminimally capable of providing satisfactory conditions for student learning. Themodel assumes that a school must have all of the minimum inputs and services
41

School Improvement Project: FUNDESCOLA I Annex 2Detailed Project Description
present in order to achieve the minimum operational standards status. Althoughschools and their secretariats can and should seek to provide improvements abovethese thresholds in order to enrich the learning environment, schools unable to offerthese essential factors are simply cannot provide an opportunity for children tolearn. Furthermore, attainment of minimum operational standards is considered aprerequisite for schools to be capable of preparing a PDE and PE.
Definition of Minimum Operational Standards
FUNDESCOLA defines a school operating at the minimum operational standard as onecharacterized by the following conditions:
I. the school staff and community are informed of the minimum operationalstandards model, are familiar with the checklist, and understand the equityconsiderations associated with this model;
2. all students have access to basic textbooks and reading books, and all teachershave access to teaching guides;1
3. all students have teachers who are minimally qualified under the law;
4. all classrooms have a minimum set of furniture and equipment; the school hasthe facilities and equipment to carry out a school feeding program; and, if theschool has more than three classrooms, it will have a basic set of administrativefurniture and equipment;
5. all classrooms have access to basic teaching materials needed for the teacher toteach;
6. the school offers physical conditions to permit it, at a minimum, to receive ormaintain the inputs and services indicated above,
Subcomponent 1: Promoting minimum operational stand'ards
There are striking disparities between the schools in the North and Center-Westregions as far as teaching and learning conditions and classroom equipment areconcerned. The 1996 National Education Law (art. 4, IX) guarantees that eachpublic school in Brazil meets acceptable operational. minimum standards. However,an operational definition is still needed; its incorporation into the daily life andculture of school and system management becomes imperative. Under thissubcomponent, the project will provide technical assistance, training, materials, andcommunication services to support: (a) the development of minimum operationalstandards instruments and instructional materials; (b) the dissemination of theminimum operational standards model and checklist; and (c) capacity building forstate and municipal education secretariats to develop, implement, monitor, andevaluate their own initiatives to mobilize schools around the minimum operationalstandards model and to raise all schools to these stantdards.
'The ministry of education regularly delivers these teaching inputs which therefore have not been included inthe FUNDESCOLA I project.
42

School Improvement Project: FUNDESCOLA I Annex 2Detailed Project Description
Subcomponent 2: Educating and Certifying Teachers
At the end of the year 2001, it will be illegal under the National Education Law forstates or municipalities to have individuals employed as classroom teachers if theyhave not been certified. In the project's two regions, there are today 40,700uncertified primary school teachers, which is approximately 25 percent of allprimary education teachers in the two regions. This subcomponent will support thenational distance teacher education programs combined with the presence ofeducation strategies designed to upgrade those teachers who do not have the legallyrequired education and training to teach grades one through four.
Subcomponent 3: Supplying Basic Furniture and Equipment
This subcomponent will acquire all of the basic fumiture and equipment, as definedin the minimum operational standards checklist, in the quantity and technicalspecification necessary to allow classrooms, school administration, and schoolfeeding programs to function satisfactorily. The classroom items would includechalkboards, student desks and chairs, teacher desks and chairs, bookshelves, andstorage cabinets. Besides specifications that address durability issues, particularattention will be given to durability and utility of chairs, the flexible use of desks inthe classroom, and possible mobility of the chalkboard. Administrative items, whichwould only be distributed to schools with more than three classrooms, wouldinclude furniture for the principal and a minimal set of office equipment.
Subcomponent 4: Financing School Improvement Investments
The minimum operational standards checklist includes teaching materials, schoolsupplies and other secretarial and minor operational tools that a school needs toadequately conduct its daily work. This would include:
a) supplemental reading materials, instructional materials, bulletin boards, globesand maps, and other audio-visual equipment;
b) administrative supplies;
c) minimal cooking and serving utensils.
This subcomponent will finance the direct acquisition of these teaching andotherwise operational materials, as well as maintenance services, by schools whichcount on UES for these purchases.
Subcomponent 5: Financing School-managed Rehabilitation of Physical Facilities
Under this subcomponent, the project will finance school rehabilitation with the soleobjective of permitting those schools which have UES to maintain or to receive theinputs and services provided under the minimum operational standards.Rehabilitation means, in this case, small and targeted physical repairs andadjustments carried out by the school and the communities to upgrade their facilitiesto the educational and safety criteria as defined by minimum operational standardsprogram.
43

School Improvement Project: FUNDESCOLA I Annex 2Detailed Project Description
COMPONENT 2: Establishing a School Development Process
Objective
This component will promote the development of a planning and decisionmakingprocess for school improvement that is centered on the school. The school team -
composed of teachers, parents, community, and the school council - will worktogether to identify school needs, and formulate a PDE for the improvement ofstudent performance. Under the PDES (which includle financial sources other thanFUNDESCOLA), schools will propose PES to be funded under the FUNDESCOLA I
project, which will finance a subset of the PEs proposed by the schools.
This component will also support the development of instruments (i.e., manuals andtraining materials), and skills for school teams and for state and municipal educationsecretariats to manage the entire process. Therefore, the main objectives of thiscomponent are to: (i) develop within schools a process of educational planning andlocal empowerment to improve school quality and efficiency; (ii) prepare both stateand municipal education secretariats to guide, evaluate, facilitate and supervise thePDE design and implementation processes; and (iii) implement, monitor, andevaluate PES. Under FUNDESCOLA I this component will place special emphasis onthe testing and improvement of school development instruments and processes forfuture FUNDESCOLA projects. SEE and monitors will continue training the GDE andadditional municipalities. The DGP consultants will provide technical assistancewhen necessary.
Operational Framework
The overall framework for this component is the school based managementparadigm, which is being supported by the ministry of education and by a number ofstates and municipalities. This process is being facilitated by direct transfer of fundsto schools that meet certain requirements. Successful experiences of local ownershipand school autonomy are being implemented, for example, in the schools of thestates of Minas Gerais, Mato Grosso, and Sao Paulo. The project will establish orstrengthen institutional capacity at the school and system levels, to prepare or tofacilitate the preparation, execution, and monitoring oi the PDE and the PE.
Subcomponent 1: Designing and Supporting School Development Plans
The school development plan (PDE) is a quality-orienited, multi-year instrument ofstrategic planning aimed at improving school quality and efficiency. Through thePDE the school defines its own values, mission, goals, strategies, educational targetsand responsibilities, with the participation of the community. It also defines theconditions, including financial, needed to meet the school-specified targets. The PDEis the product of one process - diagnosis and strategy formulation-, and theguide for a subsequent process - school improvement.
First the school and its community of parents, teachers, and leaders meet to identifyand prioritize the problems of the school, establish specific school improvement
44

School Improvement Project: FUNDESCOLA I Annex 2Detailed Project Description
targets, agree on a timed action plan, and specify inputs needed to achieve theseresults. Once agreed, the PDE serves as a step-by-step guide to the implementation ofthe school improvement strategy and the derived PES (see below).
In the same way that the minimum operational standards model varies inaccordance with school size, the PDE instrument can take a variety of forms to adjustto differences in school or community capacity or interest. In its simplest form, theinstrument will be an agreement on the part of the school staff and parents to seekspecified educational outcome targets. At its most sophisticated, the PDE will bebased on the strategic planning or quality management approach.
Subcomponent 2: Financing School Subprojects
The school subproject (PE) is a section of the PDE that the school can use to applyfor financing from FUNDESCOLA in order to implement selected actions. Inparticular, the school is entitled to use the PE instrument to indicate which projectinputs, services, or training activities it needs in order to achieve the educationaltargets agreed in the PDE. Just as the minimum operational standards model isdesigned to equalize the school environment, the PE aims to individualize the schoolby responding to school specific initiatives in order to upgrade school attractivenessand classroom performance. FUNDESCOLA will finance those PES that are top-rankedin terms of consistency with project objectives and procedures, coherency with thePDE, focus on student achievement and performance, and anticipated speed ofimplementation. PES are meant to be executed in one year, and is expected that no PEwill exceed US$10,000 in total cost. Only those schools with a UE and a bankaccount are entitled to PES financed by FUNDESCOLA I.
COMPONENT 3: Planning and Providing Additional School Places
Objectives
This component plays a clearly preparatory role in developing planningmethodologies and devising interments which ultimately will contribute to increaseaccess to and student retention in schools of the North and Center-West capital citymicroregions. The rationalization process will seek to assess the available capacityof each municipality, whose deficiencies are indicated either by lack of schoolsclose to demand (a frequent occurrence in the rural areas) or by the repeated dailyuse of school facilities in three- or four-shift schedules (as is the case in urbanzones).
This process will also seek to replace makeshift schools that cannot offer theminimally adequate environment for learning activities and children's safety. Theseschools are frequently small, poorly located as regards population demand, andpoorly built in terms of design and materials. Moreover, these makeshift schoolsprovoke the misleading idea that the surrounding school demand has beeneffectively met. The lack of school planning and rationalization has meant,therefore, a significant waste of scarce resources in the poorest regions of Brazil.FUNDESCOLA I will focus on a planning role and will not finance schoolconstruction.
45

School Improvement Project: FUNDESCOLA I Annex 2Detailed Project Description
Subcomponent 1: Carrying out of School Microplanning and Developing StandardArchitectural Plans
This subcomponent will: (a) provide education secretariats with reliablemicroplanning methodologies and technologies and the respective training on theiruse; (b) promote, on the basis of microplanning results, a school rationalizationprocess.
Subcomponent 2: Testing Standard Architectural Plans
This subcomponent will develop and promote the adoption of standard schoolarchitectural plans to be applied at state level. In addition, this component willsupport the construction of one to three model schools in order to evaluate theviability of the model architectural plans.
COMPONENT 4: Strengthening Education Management and Project Administration
Objectives
This component seeks to raise the quality of management of the schools andintermediary institutions so that they can better achieve their academic functionsand social responsibilities of providing equal access and quality education to thechildren of the capital city microregions of the North and Center-West regions.Planning, administration, monitoring, analysis and evaluation capacities of eachlevel of the system will be developed, from the school level, including communityparticipation and improvement of teaching skills, to the Municipal and StateEducation Secretariats, including fostering the interaction between the two schoolsystems. Technical and financial support for national quality-oriented programs atMEC, and institutional strengthening for project coordination and implementation arealso included. There are five subcomponents.
Subcomponent 1: Building Institutional Capacity in Schools, Municipalities andStates
This subcomponent will develop and support better management levels, withemphasis on the school, municipal education secretariat and state educationsecretariat. The centralized and highly bureaucratic administration of the educationsystem has served for decades to marginalize local management, leaving little roomfor school initiatives. In the management of inputs and classroom-related activities- and they will increase significantly both under the FUNDESCOLA project and thenew MEc programs - schools lack modem management techniques andinstruments regularly used by other comparable social institutions. Under thissubcomponent, the project will provide training, equipment, and technical assistanceto develop professional capability of school principals and managerial and technicalstaff at state and municipal education secretariats. Since the purpose of thissubcomponent is to strengthen the state and municipal secretariats, enabling them tosupport the school-based development process, FUNDESCOLA I will finance only
46

School Improvement Project: FUNDESCOLA I Annex 2Detailed Project Description
those activities that directly support the work being developed under the project.
Subcomponent 2: Providing Specialized Teaching and Learning ImprovementPrograms
This subcomponent will focus on the improvement and provision of speciallydesigned teacher's professional development programs such as "Active School"(Escola Ativa, Escuela Nueva) and "Accelerated Classes" (Classes de Aceleraqdo).This strategy is in response to well-identified problems faced by schools andteachers at the earliest stages of children's schooling, particularly in the poorest andrural areas. Examples are, for instance, children's lack of readiness for school,latecomers to schooling, students who are repeating a grade, and slow learners ingeneral.
Children's early struggles and defeat at school are at the root of most repetition anddropout cases. For several reasons, the decisive first years of schooling need extraprofessional attention and technical expertise. Three additional factors add to theimportance of this subcomponent: (i) the MEC-sponsored implementation of the newcurriculum parameters in the ten project microregions will aggravate the need forteaching improvement in very specific knowledge areas; (ii) the low-performanceprofile of unskilled teachers points to the need for upgrading in crucial aspects ofboth content and methodology; and (iii) the documented difficulties that teachershave in taking advantage of innovations embedded in new educational paradigms,technologies, and approaches demands the kind of stimulus and support provided bythis subcomponent. The subcomponent will selectively address these problems in atargeted number of schools.
Subcomponent 3: Fostering Community Participation
Given the importance and novelty of the focus-on-school strategy (see Component2) and the implementation requirements of FUNDESCOLA itself, a social mobilizationeffort is necessary to involve parents, com munities, political leaders, and eveneducation professionals both in the school development process and theFUNDESCOLA implementation activities. This mobilization will occur by means ofmedia communication, national social marketing campaigns, video production,posters, conferences, socialization activities, and capacity building of interestedgroups.
In order to reach these objectives, this subcomponent is designed around thefollowing three lines of action. (a) First, it will involve community mobilization andclientele building, by helping different segments of society (parents, communities,political leaders, and media professionals) to value basic education and organizethemselves around participation in and strengthening of school life and educationalresults. (b) Second, the project will initiate information dissemination onFUNDESCOLA I objectives, strategies, results , and reciprocity with other MEC
2Such as minimum operational standards, school development plans, and the new focus on school.
47

School Improvement Project: FUNDESCOLA I Annex 2Detailed Project Description
programs, through the media and other communication resources. (c) Finally,FUNDESCOLA I will emphasize the development of informed ownership at the locallevel by parents, surrounding community and local leadership in order to assurepractical involvement in school activities, use of schlool as a community-orientedspace and maintenance and protection of school faclilities. As a consequence, thissubcomponent supports the three FUNDESCOLA I components by increasing theinvolvement of parents, families, and communities in the schooling process of theirchildren (including access to schooling, and remaining in school), support of schoolactivities, participation in their children's learning progress, and participation in theactivities of the school and the UE.
Subcomponent 4: Strengthening National Education Information Systems andPrograms
The project, based on previous and successful experiences, will continue to supportexisting and emerging national MEc-sponsored programs designed to improveschool quality. Two main lines of action will be financed by FUNDESCOLA I: (i)
education evaluation which includes the National System for Basic EducationEvaluation (SAEB),the National Databank (BNI); and initiatives to integrate nationaland international best practice in educational evaluation; (ii) the IntegratedEducation Information System (SIED), the school census, and activieis associatedwith data collection and analysis of educational statistics. Financed by the NEBE II orProjeto Nordeste, SAEB will continue to receive assistance and support fromFUNDESCOLA. SAEB's reports and recommendations, used by education managers,administrators, researchers, and teachers, have provided the states and themunicipalities with information to identify and address problems and improveeducational practice. SIED is an information system that connects schools,municipalities, and states with MEC and enables the collection of information toensure planning and continuous monitoring of the system. An integral part of MEC,
SIED was also financed by NEBE II, and offers society, administrators, and researchersan accurate and detailed look at education at the local, state, and national levels.
Subcomponent 5: Financing Project Management
To effectively reach all the beneficiaries at school, imunicipality and microregionlevels, the FUNDESCOLA I management will rely mainly on central (DGP) and state(COEP) implementation units (see main text of project appraisal document for furtherdetails). Created by MEC to help manage education projects for the poorest regionsof Brazil, the DGP has played a principal role in the FUNDESCOLA projectpreparation. Its primary responsibilities include administration of financial resourcesof the project, operating as the World Bank coumterpart in the preparation,discussion, and negotiation process.
During the implementation process DGP will continue to be the key technicalintermediary between regional and local implementation level and the World Bank.Moreover, DGP will enter into partnership with the other operation levels as themajor responsible for beneficiary assessment, instrument and system designer,human resource trainer, and provider of key inputs and support. The state-based
48

School Improvement Project: FUNDESCOLA I Annex 2Detailed Project Description
project executive coordination (COEP) will be located in the state educationsecretariat and will benefit from its human resources and facilities. On acomplementary basis, DGP can provide COEP with technical assistance andequipment whenever justified. Under this subcomponent, the DGP will finance anongoing and comprehensive study to assess the progress and improve theimplementation and impact of the project and its four components by means ofcontracting researchers, assessments and reviews, and beneficiary surveys.
49


School Improvement Project: FUNDESCOLA I Annex 3Estimated Project Costs
Annex 3Federative Republic of Brasil
School Improvement Project - FUNDESCOLA
ESTIMATED PROJECT COSTS
PROJECT COMPONENT LOCAL FOREIGN TOTALUS $ million
1. Raising Schools to Minimum Operational Standards1.1 - Promoting Minimum School Operational Standards; 200 0 2001.2 - Educating and Certifying teachers; 300 0 3001.3 - Supplying basic furniture and equipment:; 23,000 0 23,0001.4 - Financing school improvement investments; 48,140 0 48,1401.5 - Financing the rehabilitation of school physical facilities. 15,500 0 15,500
Subtotal 87,140 0 87,140
2. Establishing a School Development Process2.1 - Desinging and Supporting School Development Plans; 2,050 0 2,0502.2 - Financing School Subprojects. 3,110 0 3,110
Subtotal 5,160 0 5,160
3. Planning and Providing Additional School Places3.1 - Carrying out School Microplanning and Architectural Plans 4,000 0 4,0003.2 - Testing Standard Architectural Plans 200 0 200
Subtotal 4,200 0 4,200
4. Strengthening Education Management and Project Administration4.1 - Building management capacity in schools, municip. and states; 800 4,000 4,8004.2 - Carrying out of specialized training and learning improvement 635 0 635
programs;4.3 - Fostering community participation; 4,000 0 4,0004.4 - Strengthening national education information systems/programs; 6,000 1,000 7,0004.5 - Financing Project management activities. 7,000 400 7,400
Subtotal 18,435 5,400 23,835
Total 114,935 5,400 120,335
Total Baseline Cost
Phisical Contingencies 2,629 540 3,169
Price Contingencies 1,337 159 1,496
TOTAL PROJECT COST 118,901 6,099 125,000
51

I

School Improvement Project: FUNDESCOLA I Annex 4Economic Analysis
Annex 4
FUNDESCOLA I
Economic Analysis
Part I: Project Context and Description
Primary education projects usually have as their greatest benefit the increase inwages associated with higher levels of academic achievement, resulting from higherenrollment levels. In Brazil, this is important, but it is not the main issue. High repetitionrates have clogged up the flow of students to the extent that both academic achievement andper student costs depend primarily on increasing promotion rates. The high cost of primaryeducation is related to the fact that 19.26 years of enrollment are necessary to produce oneeighth grade graduate,' instead of the eight that would be necessary if the flow of studentswere perfect. Low educational achievement has been shown by many researchers to be aconsequence of multiple repetition and the ensuing high drop-out rate. 2
While repetition, promotion, and drop-out rates figure neither in FUNDESCOLA'Sprogram goals nor in its components because they are neither objectives in themselves norinstruments to achieve them, they are the key indicators that must permeate any economicanalysis of its chances of success or failure.
Another important issue is the relation between the project to be financed byFUNDESCOLA I and the FUNDESCOLA program to be financed by a subsequent loan. Whilethis analysis applies to the project, and will not be affected if for some reason the secondloan is never approved, the actions and effects quantified are continued and improved in thenext stages of the program.
Tlhe remainder of this analysis is divided into three parts. Part II describes the exactmethodology to be used and its relation with project design; Part III describes the
construction of the flow model and the estimation of the fundamental parameters; and PartIV shows the results of various scenarios.
Part II. Project Goals, Project Components, and Economic Analysis Methodology
Any economic analysis must start with the project it is designed to analyze, itsgoals, and the instruments to achieve them. As described in the program design summary(see Annex 1), FUNDESCOLA I 's program goals are the following:
IIn the North, the number is 31.55 and in the Center-West 19.97. The figures refer to the 1996 educationalcensus. This does not mean that the average eighth grade graduate takes nineteen years to finish school, asenrollment years applying to those who drop out before eighth grade are also counted.2 Paes de Barros and Mendonca, "O Fluxo Educacional no Brasir' 1996 IPEA; "Gomes Netto, Fluxo deAlunos, Matriculas e Alguns Indicadores Educacionais no Nordeste Brasileiro" 1992 INEP; Schiefelbein andHeikkinen "Brazil: Access, Repetition and Efficiency in Primary School." 1992 Mimeo.
53

School Improvement Project: FUNDESCOLA I Annex 4Economic Analysis
Table 4-1.FUNDESCOLA I Program Goals
Goal Region From ToIncreasing net enrollment NO 90% 95%
NE 95% 100%CW 83% 88%
Increasing the ratio between 8t' grade graduates NO 12% 20%and I" grade enrollment NE 13% 20%
CW 26% 30%Increasing the proportion of 4t graders achieving Math NO 55% 65%elementary levels in mathematics by 10% and in NE 52% 62%Portuguese by 8% CW 60% 70%
Portuguese NO 59% 67%NE 58% 66%CW 62% 70%
While each of these goals can be easily measured in iheir own terms, the first twoare not direct results of project components. Rather, they are the result of processes whichcan also be measured, which are the result of project components. The effect on studentachievement in standardized tests, while measurable and very important, is not predicabledue to the lack of matching data on inputs and tests scores. Iests scores for the 1997 testinground will provide this data, but they are not yet available.
The impact and measurability of each component vaiies. Component (d) cannot bequantified. Rather, it must be thought of as creating the environment that will allow theother components to be applied. Furthermore, this componerLt will help secretariats to bettermanage their school system as a whole, including secondary schooling and, for the statesecretariats, other microregions. It will therefore have large externalities with relation tothis project. Component (c) will have no quantifiable effect umtil the schools it helps to planare built, which will happen only in the second project. Because this analysis takes intoconsideration only the first project, component (c) will be considered "lost money": it willbe included as a cost of the project, but no benefits will be assigned to it. Components(a) and (b) have immediate impact on the intermediate measures because they are directinputs of the educational process. The table below summarizes which components directlyaffect the program goals as inputs.
Table 4-2. Program Goals, Intermediate Measures, and Components
Goal Intermediate measures ComponentIncreasing net enrollment 0 Access to school places Provision (c)
0 School flux MOS + PDE (a) & (b)Increasing the ratio between eighth grade 0 School flux MOS + PDE (a) & (b)graduates and first grade enrollmentIncreasing the proportion of fourth graders None MOS + PDE (a) & (b)achieving elementary levels in mathematics by10% and in Portuguese by 8%
54

School Improvement Project: FUNDESCOLA I Annex 4Economic Analysis
The table shows that MOS and PDE work together to make schools perform better.While improving material conditions brings about some small improvement in schoolperformance, it is overwhelmed by the improvement brought about by better managementresulting from a successful PDE. The existence of minimum operational standards, however,is a necessary condition for successful implementation of a PDE.
As will be shown below, the two fundamental variables are the number of schoolschoosing to undertake PDE and the average impact of sDPs on promotion rates. The averageimpact of SDPS will be estimated using a sample of schools in Rondon6polis in MatoGrosso, where the FUNDESCOLA methodology was used with great success. Rondon6polis
results - a 6 percent increase in promotion at the end of the first year and a 20 percentincrease at the end of the second year - will be taken as an ideal case scenario; middle andworst case scenarios will be lower percentages.
The percentage of schools implementing SDPs depends on variables beyond theproject's control, such as leadership, but also to a large extent on MOS, which place moreschools in the "PDE basin." Thus, MOS are important in increasing the proportion of schoolscapable of undertaking a PDE.
The cost-benefit analysis of FUNDESCOLA will be undertaken in the followingmanner:
a) a flow model will be estimated for each participating microregion;
b) a historical trend will be applied to project how the flow of students would look without
the project;
c) the impact of the project on this flow will be estimated using the two key variablesdescribed above;
d) the difference between the two flows will be taken;
e) given this difference, the savings in enrollment and increases in academic achievement
will be calculated;
f) these savings and increases will be converted into two monetary flows using per studentcost and private rate of return to education; and finally
g) the internal rates of return for each of the two flows will be calculated using varioustime horizons.
Part III: Estimation of Parameters
Before actually calculating the income flows and internal rates of return, the basic
parameters must be estimated. We will divide this into three sections: parameters forcalculating student flows, parameters for calculating per student costs, and individualeducational rates of return.
55

School Improvement Project: FUNDESCOLA I Annex 4Economic Analysis
i. Student Flow - The first component necessary to estimale the project's impact is a flowmodel with the appropriate parameters and their historical trend.
Making accurate flow models is relatively easy given progression, repetition, anddrop-out rates. Unfortunately, the estimation of these rates is extremely difficult. Apartfrom the fact that the educational census is known to have a relatively high error rate, thecategories "drop-out " and "failed student" as reported in the census are themselvesmisleading. When filling in the forms on student achievement, teachers consider as "failed"a student who stays in school until the last day but is not allowed to go on to the next gradelevel, and "drop-out " a student who does not stay in school until the last day. However, itis a widespread practice for teachers to encourage students to leave school and return nextyear to the same grade level, if they consider the students have little chance of passing; insome cases, the students themselves take this initiative. Thus, most of the drop-out rate isactually a veiled repetition rate.
Several researchers3 have created flow models using' a plethora of auxiliaryinformation, from chain-linked educational census data to household surveys, to estimatethe true repetition and drop-out rates. Unfortunately, these estimates vary considerably as tothe percentage of official drop-out rate that is actually veiled repetition, but they do allagree on one issue - this percentage is relatively stable over time and across regions. Inother words, once the "repetition compensation" is estimated, the school flow may beaccurately estimated using promotion and retention rates, which are subject to much lesssystematic error. A diagram of the basic flow model used by all is shown below:
Drop-outs having completed grade Nl-e
Promotion
a To grade N+1l, year t+lEnrollnentgrde N, year t
I-a Drop-outs having completed grade N-II -r
Retentionr
To grade N, year t+1
The rates of promotion, repetition given retention, aind progression given promotion(p, r, and e) determine the flow. Promotion rates can be estimated directly by using the ratioof students approved to initial enrollment. While this does not take into considerationtransfers between schools, it is quite accurate on an aggregated level.
3 Paes de Barros and Mendonca, "O Fluxo Educacional no Brasil" 1996 IPEA; "Gomes Netto, Fluxo deAlunos, Matriculas e Alguns Indicadores Educacionais no Nordeste Brmsileiro" 1992 INEP; Schiefelbein andHeikkinen "Brazil: Access, Repetition and Efficiency in Primary School." 1992 Mimeo; andKlein and Costa Ribeiro "O censo educacional e o modelo de fluxo: 0 problema da repetencia" in RevistaBrasileira de Estatistica 52 (197/198) pp. 5-45 1995.
56

School Improvement Project: FUNDESCOLA I Annex 4Economic Analysis
As r and e vary according to the methodology used, a choice was imposed. Wechose to use the two whose assumptions on student behavior are least strict and whosecalculations are most up to date: Barros and Mendonca and Schiefelbein. The estimatesconverge at around fourth grade but are quite different for first, second, and third grades.For these grade levels, we took the average and rounded. The coefficients finally arrived atare shown in table 4.3.
Table 4-3. r and e
Grade r eIs! 0.88 0.98
2 ~~0.85 -~0.96
3ru _ _ 0.88 _ _ 0.964 ~ ~ ~ ~ ~ 093_
- 0.80 0.965.( X g 0.967=_ _ 090 0.96
0.90 0.96Source: Barros and Mendonga (1996) and Gomes Neto (1992)
Given the above coefficients and promotion rates, flow models were set up for allten microregions, in order to model future effects in enrollment and final achievement (interms of grade level) due to changes in these rates.
The next issue to consider is the trend on promotion rates. Barros and Mendonca(1996) have calculated a reasonable time series for first to fifth grades showing that theserates have been stable or even decreasing up to 1988, but that since then they have begun aslow but steady climb. This happens at about the same time as the change of mentality fromquantity to quality in the principal regions of the country.
Table 4-4. Evolution of Promotion Rates by Grade Level
Year I st grade 2nd grade 3rd grade 4th grade 5th grade
1981 41 66 70 71 561982 39 63 67 66 521983 40 63 66 66 511984 43 61 66 64 491985 47 60 66 66 511986 47 58 65 64 481987 49 58 65 66 501988 48 58 65 66 511989 50 60 67 68 511990 54 61 67 68 511991 54 61 69 70 531992 53 61 68 71 551993 52 62 69 72 57
Source: Barros and Mendonca (1996)
57

School lmprovement Project: FUNDESCOLA I Annex 4Economic Analysis
Regressing promotion on time from 1988 to 1993 yields the following coefficients,all significant at a 5 percent level: 0.92 percent, 0.63 percent, 0.65 percent, 1.12 percent,and 1.12 percent for first, second, third, fourth, and fifth gracdes respectively. We willassume that this rate of improvement will continue over the next ten or fifteen years. Thisassumption is somewhat optimistic, but not unrealistic given the positive changes that havebeen occurring in education. We will also suppose that sixth through eighth grades willimprove at the average of first through fifth: 0.8 percent per year.
ii. Per Student Cost - To convert changes in flow into savings or costs in Reais (R$), anestimate of each student's marginal cost is necessary. Unfortunately, there are few data onstudent cost, marginal or otherwise, available. The only data available are expenditures onthe budget item Education and Culture. One option would be to run a regression onmunicipal expenditures as compared with enrollment to estimate marginal expenditure andthen equate it to marginal cost. This would have the disadvanitage of confusing the conceptsof cost and expenditure, but would at least allow a rough estimate. Starting January 1, 1998,however, educational expenditures will change drastically as the National SchoolMaintenance and Teacher Valorization Program (FVM - Fundo de Valorizacao doMagist6rio) will come into effect. The fund will not be the only source of income for basiceducation; there are also voluntary transfers and the educatioin tax. Nonetheless, it willaccount for at least 75 percent of first through eighth grade educational expenditures.
FVM provides formula-driven per student transfers for school systems dictating percapita expenditures that are the same in all systems - municipal or state - within a state.This expenditure is subject to two minima:
(a) 15 percent of pooled state and municipal revenues spent on basic education and
(b) R$315 per student per year.
If 15 percent of own tax and transfer revenues do nol: amount to R$3 15 per year, thefederal government will complement the fund up to that amount. In a sense, the marginalcost of an additional student is, by fund definition, equal to average cost. In other words,each additional student will cost (the federal government) R$3 15.
However, of the FUNDESCOLA I states, only Para will receive federalcomplementation. In all others, 15 percent of revenues will atnount to more than R$3 15 perstudent. In this case, increasing enrollment becomes a 'beggar thy neighbor' policy for anygiven school system within a state: each additional student will reduce the per capita for allwhile bringing in an additional revenue to the school system in which the student isenrolled4. If we consider the sum of states and municipalities, each additional student willbring, by definition, zero marginal revenue; if cost is equated to revenue, it will have zeromarginal cost. This reasoning is patently absurd.
4 This is a possible benefit of the FVM, because school systems may begin to compete for students.
58

School Improvement Project: FUNDESCOLA I Annex 4Economic Analysis
How then do we estimate benefits incurred by reducing repetition? Two alternativesare possible.
a) The first is to look from a strictly public finance point of view - savings inenrollment will generate savings in expenditures in Para, but the two will haveno relation anywhere else.
b) The second is to consider that a student is "worth" his FVM per capita value andthat savings in enrollment will generate increases in per student expendituresthat will translate into better paid teachers, better educational inputs, and greaterquality of education.
We will calculate both alternatives and their respective internal rates of return.
In both cases, to estimate savings or cost streams generated by straightening out theflow of students, the value of the fund must be projected into the future. The fund is madeup of 15 percent of the sum of own VAT tax collection and federal governmentconstitutional transfers.5 While predicting future VAT collection is difficult, particularlyconsidering the volatile growth rates of the Northern and Center-Western economies, their4.2 percent average growth rate from 1990 to 1996 can probably be used as a reasonablepTojection.6 Federal constitutional transfers can be expected to grow at the roughly the samerate as the Brazilian economy, which was 2.7 percent from 1990 to 1996.
The best procedure is to suppose that the FVM will increase in each state at theweighted average of the Brazilian economy's 2.7 percent growth rate and that of theNorthern and Center-Western economies: 4.2 percent, where the weights are given by thefund's composition in each state. Finally, the population under age seventeen is growing ata rate somewhat less than 1.4 percent, which will be subtracted from the fund's weightedgrowth rate to yield per capita growth rates. The FVM values in 1996, composition in termsof federal transfers and VAT, and growth rate projections are shown below.
5These transfers amount to 6.75 percent of the income and industrial products tax collection in the entirecountry, distributed in proportion to population and in inverse proportion to income.6The FUNDESCOLA I states had strong economic performances from 1990 to 1996. Their average growth ratewas 4.2 percent, compared to 2.7 percent for the Brazilian economy as a whole. Of the seven best performingstate economies from 1990 to 1996, no less than six - Tocantins, Acre, Mato Grosso do Sul, Rond6nia,Amapa, and Goias - are in the project area. However, the third worst - Amazonas - is also a FUNDESCOLAI state. Both the North and the Center-West are new economies in rapid transition and their future is very hardto predict.
59

School Improvement Project: FUNDESCOLA I Annex 4Economic Analysis
Table 4-5. Fvm Predicted Growth Rate
State 1996per Composition Weighted Per capitacapita Federal VAT Tax Growth GrowthValue Transfers Collection Rate Rate
Rond6nia R$329 57% 43% 3,35% 1.95%Acre R$518 82% 18% 2,98% 1.58%Amazonas R$472 29% 71% 3,77% 2.37%Roraima R$747 70% 30% 3,15% 1.75%Para R$315 66% 34% 3,21% 1.81%Amapa R$577 74% 26% 3,10% 1.70%Tocantins R$320 80% 20% 3,00% 1.60%Mato Grosso do Sul R$346 49% 51% 3,47% 2,07%Mato Grosso R$391 48% 52% 3,48% 2,08%Goias R$322 49% 51% 3,46% 2,06%Sources: 1996 FUNDEF: FNDE; FVM composition: FNDE; regional growdt rates: IPEA/DIPES; population growth:IBGE.
The only issue remaining to be resolved is whether students in different grade levelshave different marginal costs. Adding students to empty classrooms is very cheap becauseno new teachers or construction is necessary, but adding stuidents to overcrowded systemswill be quite expensive. Straightening out the flow will add students in fifth to eighthgrades and reduce enrollment in first to fourth. This is financially more rewarding if first tofourth students cost more, but is less rewarding if fifth to eighth students cost more. Toinvestigate this, the student-classroom ratio was calculated for all microregions for bothfirst to fourth and fifth to eighth students.
Table 4-6. Students per Classroom
Microregion Students / Classroom Dis to 4 5 'Cto 8
Porto Velho 30,83 32,54 1,71Rio Branco 28,17 32,29 4,12Manaus 33,79 41,40 7,62Boa Vista 27,18 30,51 3,33Belem 33,05 41,10 8,04Macapa 27,57 34,43 6,86Porto Nacional 29,17 31,27 2,11Campo Grande 27,16 32,72 5,56Cuiaba 29,87 34,36 4,50Goiania 32,29 41,11 8,82Source: 1996 Educational Census Microdata.
Table 4.7 shows that in all cases fifth to eighth grade classrooms are more crowded,but that the difference is always less than ten. According to federal norms, fifth to eighthgrade classrooms are expected to have on average ten students less than first through fourth
60

School Improvement Project: FUNDESCOLA I Annex 4Economic Analysis
grade.7 This means that we can suppose that the marginal cost of adding students in highergrade levels will be equivalent to marginal savings of reducing enrollment in lower gradelevels.
The final procedure used to calculate savings was the following:
a) enrollment streams for each grade level with and without the project were
calculated and their differences taken;
b) marginal costs for grade levels first through fourth and fifth through eighth were
estimated;
c) FVM values were projected as explained above; and
d) a "strictly public finance" income stream taking into account only Para was
generated and a "quantity = quality" income stream taking into account savings in
all states was also generated.
iii. Rates of Return - Estimation of Coefficents
Given good household surveys, rates of return to education are simple to estimate.
Brazil is fortunate to have the PNADs (Pesquisa Nacional por Amostragem de Domicilios)
that are yearly household surveys with extensive coverage - the sample size for 1995 is
334,263 people, 51,525 of them in the North and Center-West - and accurate to the state
level. We estimated rates of return to education using the standard mincerian earnings
equation: log Y = S di + Age + Age 2,
where Y is the hours-adjusted wage received the week before 8 and di is a dummy
representing whether the person has completed the i-th year of schooling9 so that a person
having completed fourth grade will have: d, = d2 = d3 = d4 = 1 and d5 = d6 ... d12 = 0-
The equation was estimated only for those of working age (sixteen to sixty-five
years), receiving non-zero income the week before, not employed in agriculture or by any
level of government, working at least twenty hours in that week, and knowing their
educational level. This creates an obvious selection bias in the equation, so the equation
was estimated with a Heckman correction term. 0 The ideal procedure would have been to
estimate the wage equation separately for men and women but since the educational census
does not provide gender information, this is not very useful.
7Federal council of education norms state that for first to fourth grades, the desirable number of students perclassroom is from twenty-five to thirty students; for fifth to eighth from thirty-five to forty.8 An education age interaction term was also used, but it never proved significantly different from zero foreducational levels inferior to high school.9In previous PNADs, such as the 1981-90 series, it was impossible to determine highest grade levelcompleted; years spent in school had to be used as a proxy. In the 1992, 1993, and 1995 PNADs the actualhighest grade level completed is determined.'0 A Probit for predicting the probability of being included in the sample was run with the education and agevariables, in addition to two dummies: "head of household" and "male." The resulting inverse Mills ratio wasthen substituted into the wage equation as an independent variable. This procedure provides unbiased butinefficient coefficient estimates. The sample size was too big for full maximum likelihood estimation.
61

School Improvement Project: FUNDESCOLA I Annex 4Economic Analysis
The equation was estimated separately Brazil as a whole, the North, and the Center-West. The North region presents a problem because the PNAD does not cover its rural area,making interregional comparisons not too meaningful, but since those employed inagriculture are excluded, this is not too grievous an oversight. Finally, the coefficients dican be read directly as the marginal log rates of return on the i-th grade level. Thecoefficients for Brazil, the North, and the Center-West are shown below, together with theirrespective estimated errors, for the wage equation estimated both with and without theHeckman correction.
Table 4-7. Marginal Rates of Return - Without Heckman Correctibn
Variable CoefficientsBrazil North Center-West
dl 0.183 0.027 0.146d2 0.188 0.056 0.184d3 0.110 0.159 -0.003d4 0.233 0.132 0.125d5 0.070 0.029 0.096d6 0.129 0.050 0.026d7 0.037 0.075 0.076d8 0.152 0.052 0.100dplus 0.410 0.428 0.532age 0.107 0.109 0.103age2 -0.001 -0.001 -0.001cons 2.433 2.785 2.837Source: PNAD 1995 microdata (rates of return on above 8' educationwere aggregated into the dplus dummy)
Table 4-8. Marginal Rates of Return - With Heckman Correction
Variable CoefficientsBrazil North Center-West
d1 0.181 0.032 0.090d2 0.179 0.016 0.107d3 0.100 0.120 -0.045d4 0.221 0.115 0.079d5 0.049 0.021 0.053d6 0.116 0.023 -0.027d7 0.029 0.058 0.028d8 0.162 0.020 0.039dplus 0.416 0.386 0.401age 0.047 0.079 0.070age2 0.000 -0.001 -0.001invmils -0.158 -0.268 -0.367cons 3.791 4.956 5.881
Source: PNAD 1995 microdata (rates of return on above 8m educationwere aggregated into the dplus dummy)
The presence of negative coefficients for some years in Center-West is due to anincomplete specification of the model. These are regions of high migration and the decisionto migrate is independent neither of education nor of income; a model taking migration into
62

School Improvement Project: FUNDESCOLA I Annex 4Economic Analysis
account would be far too complicated for the purposes of this analysis. We will thusconsider all negative rates of return to be zero.
It is interesting to note that while the Heckman correction has little effect on rates ofreturn in Brazil as a whole, in the Northern and Center-Western rates are considerablylowered. Once again this is probably due to migration and its effects.
One last issue to considered is how to impute earnings to those who, either bychoice or circumstance, are out of the workforce. In particular, many female graduatesnever join the workforce, either choosing or being forced to be full-time mothers andhousewives. Unfortunately, economic theory gives us little choice but to suppose that ifthey have made this choice (or if it has been made for them), the rewards are at least asdesirable as receiving a market wage. Thus, we will attribute to all graduates the rate ofreturn estimated in our equations.
Once in possession of the coefficients, there are two ways to proceed: (a) one is tocalculate the net present value of the expected income streams, given some expectedretirement age; (b) the other is to calculate the stream itself and then calculate internal ratesof return over various time periods.
While conceptually better in principle, the first method has three drawbacks. First,in Brazil, retirement age is a difficult concept to pin down. While the law stipulates that inthe formal labor market, men will retire after thirty-five years of contribution time andwomen after thirty, most retirees do not become inactive after this period but go on toaccumulate pensions and another job, often in the same firm as before. This retirementsystem is patently unsustainable and will be changed far before today's graduates retire, butnobody knows in which direction this change will be. Second, thirty or thirty-five years issuch a long time that any previsions relating incomes towards the end of this period are notmuch better than astrology. Finally, one of the main benefits of the project is to unclog theeducational system by straightening out the flow of students. The effects of this thirty orthirty-five years down the line are so dependent on migration and other demographics so asto be almost impossible to estimate. In order to compare the two project benefits, the netpresent value until retirement is not a very good method.
On the other hand, calculating income streams for the next ten or fifteen years ismuch more trustworthy and easier to do. The procedure used was the following.
a) The number of students leaving school at a certain grade level were estimated withand without the project.
b) The difference of the two estimates was found year by year.c) The rate of return with relation to no schooling (the sum of marginal rates of return
shown above) was applied to all those leaving school after a given grade level, thewage of a sixteen-year old with no schooling being used as the base.
d) Each successive year of experience adds about R$4 to wages, but this does not
63

School Improvement Project: FUNDESCOLA I Annex 4Economic Analysis
vary according to educational level before the end of high school" so the net effect
with or without the project is zero.
e) The difference in income streams is calculated by adding every year each
additional cohort of school leavers to the wages cf those already working.
f) No allowance was made for those continuing further studies. This strongly
underestimates project rates of return as individual rates of return on high schoolare positive and high, but there is no way to remedy this because we have neither areasonable flow model for high school and college nor a time series of progression
and retention trends.
Part IV: Income Flows, Internal Rates of Return, and Sensitivity Analysis
With all assumptions and estimations clear, the income flows until 2012, fifteen
years after project onset, are shown in pages fourteen to sixteen together with internal rates
of return for five to ten and fifteen years of project life.
In order to do sensitivity analysis we identified the two fundamental variables that
deternine project success: the percentage of schools choosing to undertake schooldevelopment plans and the average effectiveness of these plans, once undertaken. We chose
four scenarios to analyze:
Table 4-9. Scenarios
Scenario Percent of schools Average effectivenessparticipating 1' Year Increase 2n" Year Increase
in Promotion in PrcmotionWorst 13% 2.4% 8%
Middle Poor 25% 3% 10%
Middle Good 50% 3% 10%
Best 75% 4% 13.2%
To have an idea of what the numbers mean, the 13 percent coverage of the worstcase mean that only the 311 pilot schools to be directly fimanced in 1998 will undertakeSDPs. Those responsible for the SDPs have stated that they will feel personally failed if SDPresults are below two thirds of Rondon6polis' success, which is our best case scenario.
The IRR results are as follows:
' The age-grade level interaction terms before high school completion are not significantly different fromzero; in other words, in the first through twelfth grades, education and experience are neither complementsnor substitutes.
64

School Improvement Project: FUNDESCOLA I Annex 4Economic Analysis
Table 4-10. Internal Rates of Return
Scenario Worst Middle Poor Middle BestGood
Social IRR after 10 years 1.01 % 12.54 % 24.26 % 39.37 %
Social IRR after 15 years 9.26% 19.08 % 29.23 % 42.66 %
Quantity Quality IRR after 10 years - - -6.35% 2.59%
Quantity Quality IRR after 15 years - -2.07% 4.15% 11.46%
Although from a strictly public finance point of view the project never pays foritself, if the savings in quantity becoming quality argument is accepted, the project pays foritself, even under a not too optimistic scenario. More impressive is the fact that even underthe most unfortunate and bleak of scenarios, the social rate of return after fifteen years isonly slightly below satisfactory.
The reasons for these impressive results is dismal state of the flow of students inNorthern and Center-Western schools. High repetition rates make each student cost fromtwice to three times what he might under a perfect flow; by discouraging students,repetition drastically reduces their academic achievement. The consequence is that evensmall increases in promotion rates can have large effects.
One final comment worth making is how the project fares in terms of its goals undereach scenario. The information to predict the goal relating to standardized testing is notavailable; predictions on net enrollment rates depend heavily on demographic projectionsand new construction, but the ratio of first grade enrollment to eighth grade graduation canbe calculated under each scenario.
Table 4-11. Ratio of first grade enrollment to eighth grade graduation
Scenario Worst Middle Middle Best Project ObjectivesProject Time Poor Good No/NE CW5 years 39% 41% 45% 54% 20% 30%10 years 41% 44% 48% 58% 20% 30%15 years 46% 48% 51% 58% 20% 30%
Once again, even under the worst of scenarios, the project achieves its objectives infive years time. Finally, the rates of return probably underestimate the true returns on theFUNDESCOLA I project.
a) The fact that no allowance for the effects on secondary schooling means a cost isnot counted but even larger social benefits are not counted.
b) The spillover effect of improvements in school system management on schools notundertaking snPs and, for the state system, on schools outside the capitalmicroregion, are not counted.
c) The resources to be spent on preparing provision of school places are counted as
65

School Improvement Project: FUNDESCOLA I Annex 4Economic Analysis
lost money, because this analysis focuses on the project, and not on the program.
d) The Heckman correction considerably lowered rates of return. This attenuation isprobably overestimnated due to interactions between migration and labor forceparticipation decisions.
66

Annex 4
Project Cost and Benefit Streams and Internal Rates of Return Under Different Scenarios
(2) (3) = (2) - (1) (4) (5) = (4) - (1) (6) (7) = (5) + (6) (8)
Federal Savings Govemment Quality Effect Income Stream Social Income 1 st enroll -Project Costs (PA only) Income Stream (all States) with Quailty Social Benefits Stream 8th grad ratio
1997 110,464,000 0 -110,464,000 0 -110,464,000 361,369 -110,102,631 30%1998 14,536,000 4,535 -14,540,535 16,064 -14,519,936 4,320,740 -10,199,196 35%1999 0 49,161 -49,161 377,110 377,110 17,723,227 18,100,337 43%2000 0 94,776 -94,776 2,279,202 2,279,202 35,805,442 38,084,643 50%2001 0 -119,999 119,999 5,786,769 5,786,769 57,421,750 63,208,519 54%2002 0 -729,248 729,248 10,634,524 10,634,524 80,245,819 90,880,343 55%2003 0 -1,489,615 1,489,615 16,187,034 16,187,034 101,406,289 117,593,323 56%2004 0 -2,155,598 2,155,598 21,303,411 21,303,411 121,733,626 143,037,036 56%2005 0 -2,860,838 2,860,838 26,208,948 26,208,948 143,319,549 169,528,497 57%2006 0 -3,814,933 3,814,933 31,732,159 31,732,159 165,968,717 197,700,876 58%2007 0 -5,084,979 5,084,979 37,807,129 37,807,129 185,401,472 223,208,601 58%2008 0 -6,381,930 6,381,930 42,762,823 42,762,823 199,855,627 242,618,450 57%2009 0 -7,422,894 7,422,894 45,914,875 45,914,875 210,473,284 256,388,159 57%2010 0 -8,129,537 8,129,537 47,681,921 47,681,921 218,975,702 266,657,622 57%2011 0 -8,568,352 8,568,352 48,750,327 48,750,327 226,259,906 275,010,232 58%2012 0 -8,840,794 8,840,794 49,454,383 49,454,383 233,144,339 282,598,722 59%
Intemal Rates of Retum after:5 years - 15.27%6 years 24.83%7 years 30.88%8 years -6.18% 34.85%9 years -1.22% 37.54%10 years 2.590/o 39.37%15 years 11.46% 42.66%
Scenario: Best75% of schools undertake PDEsPDEs have 66% of Rondonopolis success
67

Annex 4
Project Cost and Benefit Streams and Internal Rates of Return Under Different Scenarios
(1) (2) (3) =(2) - (1) (4) (5) = (4) - (1) (6) (7) = (5) + (6) (8)
Federal Savings Govemment Quality Effect Income Stream Social Income 1st enroll -Project Costs (PA only) Income Stream (all States) with Quailty Social Benefits Stream 8th grad ratio
1997 110,464,000 0 -110,464,000 0 -110,464,000 273,764 -110,190,236 30%1998 14,536,000 3,436 -14,539,436 12,170 -14,523,830 2,668,343 -11,855,488 34%1999 0 28,301 -28,301 235,248 235,248 9,615,526 9,850,774 39%2000 0 49,298 -49,298 1,237,949 1,237,949 18,792,540 20,030,489 43%2001 0 -53,947 53,947 2,976,405 2,976,405 29,552,035 32,528,439 45%2002 0 -330,915 330,915 5,303,514 5,303,514 40,838,180 46,141,694 46%2003 0 -682,608 682,608 7,923,502 7,923,502 51,554,804 59,478,306 47%2004 0 -1,007,398 1,007,398 10,429,091 10,429,091 61,884,057 72,313,149 47%2005 0 -1,335,261 1,335,261 12,889,530 12,889,530 72,415,512 85,305,042 47%2006 0 -1,747,062 1,747,062 15,455,051 15,455,051 83,299,283 98,754,334 48%2007 0 -2,288,397 2,288,397 18,204,705 18,204,705 93,392,029 111,596,733 49%2008 0 -2,895,214 2,895,214 20,705,686 20,705,686 102,290,036 122,995,722 49%2009 0 -3,458,555 3,458,555 22,877,375 22,877,375 109,378,736 132,256,111 50%2010 0 -3,906,406 3,906,406 24,435,553 24,435,553 114,598,317 139,033,870 50%2011 0 -4,225,279 4,225,279 25,211,099 25,211,099 119,503,510 144,714,609 51%2012 0 -4,439,132 4,439,132 25,850,323 25,850,323 123,139,409 148,989,732 52%
Intemal Rates of Retum after:5 years - -2.90%6 years - 7.20%7 years 13.95%8 years - 18.60%9 years -10.45% 21.89%10 years -6.35% 24.26%15 years 4.15% 29.23%
Scenario: Middle Good50% of schools undertake POEsPDEs have 50% of Rondon6polis success
68

Annex 4
Proiect Cnst and Benefit Streams and Internal Rates of Return Under Different Scenarios
(1) (2) (3) = (2) - (1) (4) (5) = (4) - (1) (6) (7) = (5) + (6) (8)
Federal Savings Govemment Quality Effect Income Stream Social Income 1st enroll -Project Costs (PA only) Income Stream (all States) with Quailty Social Benefits Stream 8th grad ratio
1997 110,464,000 0 -110,464,000 0 -110,464,000 273,764 -110,190,236 30%1998 14,536,000 3,436 -14,539,436 12,170 -14,523,830 2,064,384 -12,459,446 34%1999 0 19,338 -19,338 185,558 185,558 5,841,441 6,026,999 37%2000 0 24,796 -24,796 777,027 777,027 10,653,881 11,430,908 40%2001 0 -35,378 35,378 1,707,178 1,707,178 16,139,106 17,846,284 41%2002 0 -173,980 173,980 2,890,987 2,890,987 21,716,785 24,607,773 42%2003 0 -343,450 343,450 4,142,101 4,142,101 27,022,078 31,164,179 42%2004 0 -502,252 502,252 5,343,430 5,343,430 32,224,302 37,567,732 43%2005 0 -661,453 661,453 6,592,410 6,592,410 37,454,228 44,046,638 43%2006 0 -855,664 855,664 7,837,850 7,837,850 42,697,170 50,535,020 44%2007 0 -1,105,099 1,105,099 9,088,490 9,088,490 47,556,066 56,644,556 44%2008 0 -1,389,254 1,389,254 10,208,173 10,208,173 52,480,114 62,688,287 45%2009 0 -1,665,278 1,665,278 11,492,715 11,492,715 56,675,002 68,167,717 46%2010 0 -1,898,301 1,898,301 12,570,548 12,570,548 59,447,031 72,017,579 46%2011 0 -2,075,018 2,075,018 12,947,263 12,947,263 62,674,057 75,621,320 48%2012 0 -2,200,097 2,200,097 13,422,845 13,422,845 64,378,024 77,800,869 48%
Intemal Rates of Retum after:5 years - -16.42%6 years - -6.21%7 years - 0.91%8 years - 6.02%9 years - 9.76%10 years - 12.54%15 years -2.07% 19.08%
Scenario: Middle Poor25% of schools undertake PDEsPDEs have 50% of Rondon6polis success
69

Annex 4
Project Cost and Benefit Streams and Internal Rates of Return Under Different Scenarios
(1) (2) (3) = (2) - (1) (4) (5) = (4) - (1) (6) (7) = (5) + (6) (8)
Federal Savings Govemment Quality Effect Income Stream Social Income 1st enroll -Project Costs (PA only) Income Stream (all States) with Quailty Social Benefits Stream 8th grad ratio
1997 110,464,000 0 -110,464,000 0 -110,464,000 219,011 -110,244,989 30%1998 14,536,000 2,749 -14,538,749 9,736 -14,526,264 1,418,696 -13,107,568 33%1999 0 10,331 -10,331 127,699 127,699 3,254,094 3,381,792 36%2000 0 5,540 -5,540 451,463 451,463 5,531,181 5,982,644 38%2001 0 -20,599 20,599 931,695 931,695 8,058,907 8,990,602 39%2002 0 -60,750 60,750 1,519,715 1,519,715 10,514,029 12,033,744 40%2003 0 -100,894 100,894 2,086,754 2,086,754 12,835,251 14,922,004 40%2004 0 -136,850 136,850 2,627,616 2,627,616 15,148,156 17,775,772 40%2005 0 -173,709 173,709 3,230,733 3,230,733 17,401,469 20,632,202 41%2006 0 -219,228 219,228 3,775,387 3,775,387 19,513,096 23,288,483 41%2007 0 -274,864 274,864 4,248,638 4,248,638 21,328,887 25,577,525 42%2008 0 -334,860 334,860 4,602,155 4,602,155 23,646,492 28,248,647 43%2009 0 -391,255 391,255 5,264,872 5,264,872 25,758,114 31,022,987 43%2010 0 -438,450 438,450 5,905,849 5,905,849 26,793,444 32,699,293 44%2011 0 -474,653 474,653 5,949,336 5,949,336 28,833,365 34,782,701 46%2012 0 -500,961 500,961 6,270,049 6,270,049 29,249,346 35,519,396 46%
Intemal Rates of Retum after:5 years6 years -19.24%7 years -11.82%8 years -6.30%9 years -2.14%10 years 1.01%15 years 9.26%
Scenario: Worst13% of schools undertake PDEsPDEs have 40% of Rondon6polis success
70

School Improvement Project: FUNDESCOLA I Annex 5Financial Summary
Annex 5
FUNDESCOLA IFinancial Summary
Overview. In the 1990s Brazil has experienced a period of profound social, political and
financial change, opening new and promising opportunities for development. Projected
GDP per capita for 1998 is US$4,970, one of the highest in Latin America. However the
distribution of income, as reported in the World Bank's 1996 Development Report, remains
one of the most unequal in the world. Overcoming the difficulties posed by this unequal
distribution of wealth as well as the low average level of education (5.5 years for men, 5.7
years for women) will be one of Brazil's greatest challenges in the coming decade.
A successful program for monetary stabilization initiated under the Real plan in 1994
brought remarkable results, reducing inflation from near crippling rates of 50% per month
to 7% per year. This adjustment, while introducing stability to a previously uncertain
economy, imposed drastic budgetary restrictions on the public sector. No longer able to use
inflation to deal with the deficit, the public sector has resorted to borrowing, raising the
federal debt from 9.2% to nearly 18% of GDP. State and municipal debt has nearly
doubled from 3.5% to 6.4%. Since most of this debt is held by the Federal Government,
total public sector debt is just under 20%. This debt, however, remains considerably lower
than that of most developing countries or developed countries.
Table 5.1 Government Debt and GDP
(R$ millions)
Year (a) (b) (c) (d)=(c (e) (f)=(c)/(e) (g)=(d)/(e)1(h)=(a)/(e))+(b)l
State and Municipal Debt' Total Public In Percentage of GDPTotal Outside the Federal Sector GDP3 Total Public Total State
Central Bank Debt Debt2 Federal Sector and MunicI_______ ________ Debt Debt Debt
1993 1,920 1,920 4,988 6,908 54,247 9.2% 12.7% 3.5%1994 24,203 6,856 47,470 54,326 545,281 8.7% 10.0% 4.4%1995 37,581 8,476 82,824 91,300 696,211 11.9%1 13.1% 5.4%1996 49,906 15,059 140,187 155,246 782,493 17.9% 19.8% 6.4%'/State and Municipal Debt does not include the State Bank Debt.2 /Public Sector Debt does not include Parastatal debt.3 /GDP is the average of January to December.
The stabilizing effect of these fiscal changes has permitted the government to pay more
attention to a social reform program, with education at the top of the agenda. From
1 France, Belgium, Greece, Italy, Sweden, and the Netherlands all have government debts well over 50% ofGDP.
71

School Improvement Project: FUNDESCOLA I Annex 5Financial Summary
decentralization of the school lunch program to restructuring of the distribution of
textbooks, the federal government has reformed, reviewed, and renewed its commitment to
education. The reform process, as well as additional presswue from the community, has
resulted in better performance and efficiency in the investmrent of available resources as
measured by ever increasing performance when compared to educational expenditures.
When compared to other countries in Latin America, Brazil's expenditures in education are
quite high (see Table 5.2).
Table 5.2 Comparison: Educational Expenditures in Latin America
Country Total Education Expenditures YearAs % of GNP As % of Gov't Expenditures
Argentina 4.5 15.0 1995Brazil 4.5 1989Chile 2.9 14.0 1995Colombia 3.5 12.9 1994Paraguay 2.9 1994Venezuela 5 .2 22.4 1994Source: UNESCO Statistical Yearbook, 1997
In 1995 public expenditure in education in Brazil totaled US$34.8 billion, representing
4.85% of the GNP. As shown in the table 5.3, Brazilian investment in education is
substantial. When total investments from taxes and other scicial sector contributions are
considered, this total came to nearly 6% of GNP.
Table 5.3 Estimated Education Expenditures in 1995 by Sector
Sector US$ Million Percentage of GNP(1995)
Public 34,804 4.85%Federal Government 8,553 1.19%State Government 16,320 2.27%Municipal Government 9,951 1.39%Private 8,056 1.12%Families 6,423 0.90%Non-School business and technical training 1,633 0.22%Total 42,860 5.97%Source: Report on the Evolution of Basic Education in Brazil: 1991-1997, MEC and INEP
The financial implication of FUNDESCOLA 1, when compared to current expenditures in
education or in Brazil as a whole, are decidedly low. The prcject represents approximately
0.1% of the total federal debt and less than 5% of public expenditures on education.
In addition, given the recent shocks in the Brazilian market and the battle to defend the
Real, the further injection of low interest rate World Bank funds into the Brazilian
economy, provide security to ensure future social sector investments.
72

School Improvement Project: FUJNDESCOLA I Annex 5Financial Summary
Table 5.4 Project Cost and Financing(US$ Millions)
Implementation Period Operational Period1999 2000 - 2001 2001 2002
Project Costs (US$million)Investment Costs 17.7 27.7 31.4 24.5 24.5Recurrent Costs 24.1 24.1 -
Total 41.8 51.8 31.4
Financing Sources (% of total project costs)IBRD/IDA 3 5% 49% 71%Government 65% 51% 29% D
Total 100% 100% 100%
73


School Improvement Project: FUNDESCOLA I Annex 6Procurement and Disbursement Arrangements
Annex 6FUNDESCOLA I
Procurement and Disbursement ArrangementsProcurement
1. The procurement methods applicable to the various expenditures categories are summarized in Table A.
Table A: Project Costs by Procurement Arrangementsa(in US$ million equivalent)
Expenditure Category Procurement Method Total Cost(including
contingencies)ICB NCB Other N.B.F
1. Goods
Equipment 6.00 6.00(5.5) (5.5)
Furniture 24.5 24.5(12.2) (12.2)
2. Civil Works 2.5 2.5(0.2) (0.2)
3. School Grants 62.0a' 62.0* (15.3) (15.3)
4. Training and 20.3 20.3Consultants' Services (20.3) (20.3)
5. Administrative 3.0 3.0Expenses** a (3.0) (3.0)
Total 30.5 2.5 85.3 118.3(17.7) (0.2) (38.6) (56.5)
Notes: * School Projects, Allotments for Schools to meet Standards, and Yearly Allotments for Schools toMaintain Standards.**Administrative Expenses means incremental operational costs related to the management andsupervision of the Project, including maintenance and supplies, communication services and spare parts foroffice equipment and vehicles.N.B.F. = Not Bank-financed (not applicable).The detailed procurement arrangements for the item "Other- Consultant Services" are listed inAnnex 6, Table A.Figures in parenthesis are the amounts to be financed by the Bank Loan.
' local shopping
75

School Improvement Project: FUNDESCOLA I Annex 6Procurement and Disbursement Arrangements
Procedures
2. The proposed project will be financed through IBRD and Government funds. All Bank financedprocurement of goods and services under the project will be carried out in accordance with WorldBank Guidelines: Procurement under IBRD Loan and IDA Credits, January 1, 1995, revisedSeptember 1997 and Selection and Employment of Consultants by World Bank Borrowers, January1997, revised September 1997.
3. National Competitive Bidding (NCB) procedures acceptable to IBRD will be used for goodscontracts that cannot be grouped into packages of at least US$ 350,000. NCB proceduresacceptable to IBRD will also be used for civil work contracts above US$350,000 and with amaximum value of US$ 5.0 million for each contract.
4. International Competitive Bidding (ICB) procedures acceptable to the IBRD will be used for allgoods grouped into packages by each state secretariat and the Ministry of Education (for thenational program) into contracts of more than US$350,000.
5. Local Shopping procedures in accordance with provisions of paragraph 3.5 of the Guidelines willbe used for works and goods estimated to cost less than US$1)00,000 equivalent per contract. Thisproject will include two operational initiatives involving small contracts (below US$ 10,000) forapproximately 5,000 schools to school quality investments, including small works, goods, books,and pedagogical materials. The first of these initiatives is to finance the investments needed byschools to meet the defined Minimum Operational Standards through school rehabilitation and aspecial program that promotes maintenance and development of first through eighth gradeeducation. These contracts would be procured at the school level and estimated to cost less thanUS$ 10,000 per contract, with a total aggregate cost of US$ 65.0 million. The second initiative isthe financing of 311 School Projects/School Development Plans -- estimated to cost less thanUS$10,000 per contract, up to a total of US$ 3.1 million.
6. Selection of Consultants procedures based on Quality and Cosit will be used for all estimatedcontracts to cost more than US$200,000. Selection based on Consultants' Qualifications may beused for services to carry out studies on Architectural Models provided that estimated contractvalues do not exceed US$100,000. Consultant services including foreign and local ad hoc expertiseand contractual services - for which individual qualification and experience are the paramountrequirement for the assignment - will be procured under contracts awarded to individualconsultants in accordance with the provisions of paragraphs 5.1 through 5.3 of the ConsultantsGuidelines.
7. Procurement Review - details of the Bank prior review for IC13 and NCB process are shown inTable B.
76

Sclhool Improvement Project: FUNDESCOLA I Annex 6Procurement and Disbursement Arrangements
Documents
8. The following documents will guide the procurement activities:
- For ICB : World Bank Standard Bidding Documents.- For NCB: Standard bidding documents based on Bank's SBD.- For Consultants: Bank's standards forms of contracts; standard requests for proposals.- Other documents include: Bank's standard bid evaluation form and standard general and specificprocurement notices.
Measures to improve MEC's procurement capacity
9. The Central Project Coordination Unit - DGP has experience in procurement management andBank procurement procedures. Procurement specialists have been recruited to provide technicalassistance to the DGP in handling all procurement matters related to works, goods, and services,and will be assisted as needed by specified consultants for the preparation of bidding documentsand bid evaluation. Training of MEC procurement staff, DGP staff and State Education Secretariatstaff in Bank procurement procedures and documents will be carried out. Standard procurementprocessing timetables will be finalized at negotiations. Procurement processing will be carried outaccording to agreed standard processing times.
Annex 6, Table A: Consultant Selection Arrangements(in US$ million equivalent)
Contract Selection Method Total CostCategory QCBS CQ OTHER (including
Contingencies)A. Firms 10,176.0 1,020.0 11,196.0
(10,176.0) (1,020.0) (11,196.0)
B. Individual 9,063.0 9,063.0(9,063.0) (9,063.0)
Total 10,176.0 1,020.0 9,063.0 20,259.0(10,176.0) (1,020.0) (9,063.0) (20,259.0)
Note: QCBS - Quality and Cost Based SelectionCQ - Selection Based on Consultants Qualification
Figures in parenthesis are the amounts to be financed by the Bank Loan
77

School Improvement Project: FUNDESCOLA I Annex 6Prccurement and Disbursement Arrangements
Annex 6, Table B: Thresholds for Procurement Methods and Prior Review
Expenditure Contract Value Procurement Contracts Subject toCategory (Threshold) Method Prior Review
US $ thousands US $ thousands
1. Works >350 and < 5.000 NCE; First two contracts< 350 Three Quotations None
2. Goods > 350 ICB All**>100 and < 350 NCB First two contracts
< 100 Shopping None
3. Services3.1 Firms >200 QCBS All *** (including
technical evaluation)
>100 and < 200 QCBS All *** (except fortechnical evaluation)
<100 CQ Review of TORs only
3.2 Individual > 50 I All***<50
4. Miscellaneous < 100 Shopping None
Note: * Civil works contract will use NCB Standard Bidding Documents. The standardization ofarchitectural models will facilitate prior review by the Bank.** The standardization of: (a) technical specification for ,goods; (b) place of delivery; and (c)bidding documents will facilitate prior review by the Bank.*** The standardization of global TORs and model contract forms will facilitate the prior reviewby the Bank.
78

School Improvement Project: FUNDESCOLA I Annex 6Procurement and Disbursement Arrangements
Disbursement
10. The applications for Withdrawal must be expressed in the currency of expenditures with theexception of the requests for payments made out of Special Account, established in US Dollarsequivalent.
I . In the case of direct school transfers, certification of expenditures will be completed immediatelyupon transfer of funds, and disbursements presented on the basis of Statement of Expenditures(SOEs). Supervision will be conducted by municipal and state secretaries, COEP, and the ProjectCoordination Unitb.
12. Each Application for Withdrawal will be numbered consecutively regardless of the procedure to beused.
13. Applications for Withdrawal will be used to requestthe IBRD for: (i) reimbursement from the LoanAccount; (ii) requests for direct payment to third parties; or (iii) to request replenishment forexpenditures paid with funds from the Special Account for amounts equivalent to 20% of theAuthorized Allocation of the Special Account.
(i) The Borrower should submit an Application for Withdrawal together with Statementof Expenditures (SOE) and/or Summary Sheets (SS). When submitting SS, full supportingdocumentation is required. The application should be expressed in the currency of theexpenditure.
(ii) The Borrower should submit form 1903 with supporting documentation as follows:invoices, receipts, formal bill of sale, copy of checks, or bank orders.
(iii) The Borrower should submit form 1903 with SOE and/or SS, the Special AccountReconciliation and bank statement.
Use of Statement of Expenditures (SOEs):
14. SOEs will be used for payments pertaining to:- Contracts of less than US$5,000,000 equivalent for civil works and less than US$750,000 forgoods;- Consultant contracts of less than US$ 100,000 and US$ 50,000 for firms and individuals,respectively; and- All other expenditures will be disbursed on the basis of SOEs.
Special Account:
15. The Special Account will be denominated in US Dollars.- Authorized allocation is US$ 12.5 million. The implementation process of the project
requires the simultaneous transfer of financial resources to the schools, which are the finalexecutors of the project. These resources are associated with the various components. The
bbThe SPA - Planning and Monitoring System will consolidate the physical and financial actions in each school,municipality and state.
79

School Improvement Project: FUNDESCOLA I Annex 6Procurement and Disbursement Arrangements
amount of funds in the Special Account will be based upon the value of this transfer, and willbe at least 20% of the loan. The timeframe for certification of these resources will guarantee thecontinuity of the subsequent transfers.
- There will be an initial deposit in a commercial bank of US$ 7.5 million uponeffectiveness, which will increase to US$ 12.5 million once disbursement and commitmentsreach US$ 16.0 million.
16. Direct payment: minimum application amount above 20% of Special Account deposit.
17. Disbursement categories and percentages financed are shown in Table C below:
Annex 6, Table C: Allocation of Loan Proceeds
Expenditure Category Amount inUS$ million Financing Percentage
1. Goods
(a) Equipment 5.5 100% of foreignexpenditures and 80% of
local expenditures
(b) Furniture 12.2 100% of foreignexpenditures and 50% of
local expenditures
2. Civil Works 0.2 80% of local--- expenditures
3. School Grants 15.3 25% of the amountsdisbursed by the Borrower
4. Training and Consultants' Services 20.3 100% of allexpenditures
5. Administrative Expenses 3.C 100% of foreignexpenditures and 80% of
local expenditures
6. Unallocated 6.0
TOTAL 62.5
80

School Improvement Project: FUNDESCOLA I Annex 6Procurement and Disbursement Arrangements
Accounting, Financial Reporting and Auditing
18. The Project will maintain project accounts in accordance with sound accounting practicesacceptable to the IBRD, as required by "Financial Account Reporting and Auditing Handbook".
19. An annual audit report of project accounts, and a separate opinion with respect to the Statements ofExpenditures and the Special Account prepared by independent auditors acceptable to the IBRD,and in accordance with the Bank document, "Financial Account Reporting and AuditingHandbook", of January 1995, will be submitted to IBRD no more than six months after completionfor each fiscal year.
20. Project expenditures will be recorded in such a way that all related sources of funds and types ofexpenditures are clearly identified. Each implementing agency and the financial agent will supplyfinancial information on project execution on a quarterly basis to the DGP for consolidation intoannual reports due to the Bank. DGP has established a uniform and consistent financial accountingand reporting system for the project. COEP will maintain all required information and supportingdocumentation for the preparation of the Statements of Expenditures (SOEs). DGP will beresponsible for receiving disbursement information and documents from the implementingagencies; it will aggregate the data and prepare, sign, and submit to the Bank all withdrawapplications regarding expenditures to be financed with the loan proceeds.
81


School Improvement Project: FUNDESCOLA I Annex 7Microregions and Project Phasing
Annex 7
FUNDESCOLA I
Microregions and Project Phasing
FUNDESCOLA and the context of MunicipalizationProponents of decentralization typically cite a number of benefits for passingresponsibilities from higher to lower levels of government, including greater efficiency,greater ownership and accountability by beneficiaries and stakeholders, and development ofthe capacity of local leaders. However the breath and depth of this process of power transferis greatly dependent upon the capacity at the local level. What decentralization is not, andcannot be, is the direct and immediate transfer of all fiscal and political responsibility to thelocal level without regard for the capacity (or will) of the local authorities and benificiariesto undertake the responsibilities that have previously pertained to higher levels ofgovernment.
In Brazil decentralization in education raises some issues of its own. The existing dualsystem, in which both the state and municipal governments are responsible for providingbasic education (grades 1-8), engenders inefficient use of resources (including additionalsystem managers), inequity in the distribution of school places and school quality, andprovides little incentive for coordination between the systems. Add to these parallel anduncoordinated systems the federal government, with its supplementary and re-distributiverole, and it is no great surprise to find a jumble of overlapping responsibilities andinformation.
With the creation of the Fund for the Development and Maintenance of Education andTeacher Valorization (FVM) the municipal education secretary will be assured at leastR$315 (in R$1997) per student, adjusted annually and starting in 1998, with shortfallsprovided on a targeted regional basis by federal funds. The greatest benefit of the FVM, inaddition to its re-distributive nature, is the creation of a council at the municipal level tomonitor the transparent and effective disbursement of educational expenditures.
Municipalities and Project CoordinationGiven these sector changes, as well as the particular requirements of the dual system, anumber of alternatives for project coordination were considered. The broad organizationaloptions included direct (where the project management has a direct relationship with eachmunicipality), indirect (where the project management interacts only with the statesecretariat which in turn coordinate activities with municipalities) and integrated (where theproject management interacts with the school and system managers responsible for schoolswithin a given geographical area).
In assessing the possibilities for direct coordination with the municipalities, a number ofhuman resource, technical, and operational characteristics of the municipalities wereconsidered. In a pre-investment study of the existing human resource capacity of municipalmanagement in the North and Center-West capital city municipalities (80 in total), 30% of
83

School Improvement Project: FUNDESCOLA I Annex 7Microregions and Project Phasing
mayors had not completed secondary education. The education of the municipal secretariesis significantly higher: nearly two thirds had completed tertiary education. In terms oftechnical resources, only 40% of municipal secretariats operated out of their own building,and less than 25% possessed a fax machine. Procurement and contracting, as well as otheroperational requirements in the education sector, are similarly complicated: manymunicipal secretaries are unfamiliar with current legislation and requirements for primaryeducation, as well as the most basic tools involved in the preparation of a teacher careerplan. Finally, working individually with each municipality woiald engender greaterbureaucracy at the federal level and would be nearly impossible to attend to the diverseneeds of the 2,682 municipalities in the North, Northeast, and Center-West Regions.
Project coordination at the state level, with municipal interventions managed by the statesecretariat was also analyzed. While this indirect coordination would facilitate projectimplementation, state cooperation with the municipal level would depend upon the politicalparty or personal relationship between the state and municipal secretariats. Derivinglessons from the experience of the Northeast Basic Education Project, where municipalitieswere largely excluded as funds were controlled almost exclusively at the state level, projectplanners noted that there is little incentive for the state secretariat to look beyond their ownsystem for capital and pedagogical improvements.
Based on this analysis, as well as the need to accompany the mnunicipalization process in abalanced, supportive combination of top-down and bottom-up policies, the project'sdesigners and the Bank looked to an integrated system of project coordination, whichwould attend to the needs of a group of schools within a defined grouping of municipalities.There are at least three existing means of grouping municipalilies, including groups basedon: regional divisions of the state secretariat, regional divisions of UNDIME, and IBGE
microregions.
Organization of the micro-regions based on the state secretariat's directorates was rejectedby FUNDESCOLA's designers as the regional groups are: largely dependent upon the locationof the state system schools, politically motivated, and, in the case of the Northeast BasicEducation Project, have not proved effective in the distribution of resources to themunicipal system. However the implementation of an entirely new system that completelybypasses the state may be politically as well as institutionally difficult. Cooperation at somelevel (i.e. coordination of teacher certification programs, technical support of themicroregional forum, and so on) should be sought as the existing regional offices are oftenbetter equipped than municipal offices (both in human and tec]bnical resources) and couldbe used in implementing FUNDESCOLA.
A second possibility, organization based on the divisions of UNDIME, varies greatly by state.Experience with the Northeast Basic Education Project has shown, for example that inBahia UNDIME regions have been designed in opposition to the state secretariat's DIRECs,in order to give greater voice to municipal secretaries. In Ceari, the president of UNDIME
works closely with the state secretary and UNDIME divisions match those of the statesecretariat. The status of UNDIME in the North is precarious at best, and will be strengthened
84

School Improvement Project: FUNDESCOLA I Annex 7Microregions and Project Phasing
as FUNDESCOLA is implemented.
The project's designers, through collaboration with UNDIME and in consultation withstakeholders, ultimately decided on divisions laid out by the Brazilian Census Bureau(IBGE). These microregions are within state lines, respect municipal divisions, and grouptogether a number of municipalities, usually around a leading municipality such as thecapital or other city. The IBGE microregions were selected as a means of groupingmunicipalities for project implementation as they are transparent (see Figure 7.4 or the IBGE
website at http://www.ibge.gov.br), include both political-administrative and socio-economic divisions, and facilitate data collection as the Household Surveys and othernational census instruments use the microregions.
The microregion model permits a more rational and effective managerial option than thetraditional dispersion of resources among the individual municipalities or the concentrationof resources to state governments chronically biased toward the state-run school system.Intervention in a microregion will cover all of the municipalities in the microregion, and allmunicipalities will participate. The microregion does not constitute an additionaladministrative division, but provides a basis for planning, negotiation, and dialogue amongthe municipal governments and the state government. For these reasons FUNDESCOLA haschosen the IBGE microregion as its key level of project execution.
Initial evidence in support of the Microregion ModelThe microregion concept has already undergone significant testing in the preliminarypreparation of FUNDESCOLA. In each of the capital city microregions of the North andCenter West municipal education secretaries and representatives of the state secretariat havecollaborated in a number of project instruments including a Project Logframe, SchoolAssessment Survey, and Microregion Action Plan. Cooperation in the completion of theserequirements for project participation is independent of party divisions and is based on bothfinancial and operational incentives. For many municipalities, and often the state system,the FVM will result in fewer resources. These jurisdictions are therefore further motivatedby these losses to participate in FUNDESCOLA resources as a significant contribution to theiroverall education budget (See Table 7.1 for estimated losses and gains from the FVM byMicroregion). Municipal and state secretaries have also come to appreciate the advantagesof cooperating in a collective planning exercise. Many net "winners" are municipalitieswith low institutional capacity and welcome the additional assistance for meeting their legalresponsibility to provide basic education to the young population of their municipalities, aswell as navigate an increasingly complex system. In sum, those facing fewer resources aswell as those with greater technical need are equally attracted to project participation.
A positive spin-off of this collaboration, in addition to project instruments that include theinput of all participating municipalities, has been the trading of teachers, student slots, andschool and building facilities among the historically disparate state and municipal systems.The design of the microregion model strongly encourages greater rationalization andeconomies of scale among the municipal and state systems.
85

School Improvement Project: FUNDESCOLA I Annex 7Microregions and Project Phasing
Table 7.1 Estimated Losses and Gains from the FVM4 by Microregion (R$)
State Microregion Municipalities' State Adjustment _ Municipal Budget(MR) in MR Municipal Budget
AC Rio Branco 3,480,409 -6,432,867 -2,952,458 8%AM Manaus 6,863,386 -11,508,664 -4,645,278 3%AP Macapa 315,810 -172,465 -856,656 1%PA Belem -4,294,823 19,921,759 15,626,963 -3%RO Porto Velho -1,370,881 -2746,855 -4,117,735 -3%RR Boa Vista -2,947,193 2,748,015 -199,178 -11%TO Porto Nacional -2,655,226 -777,581 -3,432,808 -5%GO Goiania 1,407,995 2,435,428 3,843,423 1%MS Campo Grande 7,535,907 -2,295,040 5,240,866 12%MT Cuiaba 3,672,367 -1,148,956 2,523,411 4%
Source: FNDE, 1997
Phasing of the FUNDESCOLA program
Each microregion will participate in FUNDESCOLA in two phases. Phase 1 would focus on
the implementation, by the participating states and municipalities of that microregion, of
Components 1 and 4 and institutional development under Components 2 and 3 (see text of
PAD). Consequently, it would raise the schools up to minimum operational standards, and
would include institutional development, systems development, and management training
for managers and technical staff in state and municipal secretariats of education to be
capable of establishing a school-based development process and carrying out programs to
increase school access. It is not expected that school construction or school project
financing would be addressed in any significant way during ithis phase. Phase 2 would
finance Components 2 and 3, and provide follow-up support for Components 1 and 4.
Project 1
FUNDESCOLA I will finance Phase 1 of the FUNDESCOLA program for the 10 capital city
microregions in the North and Center West states. These inc]lude the microregions
surrounding the cities of Belem, Boa Vista, Campo Grande, 'Cuiabd, Goiania, Macapa,
Manaus, Palmas, Porto Velho, Rio Branco. This first project will complete the development
and testing of materials, processes, implementation strategies, and training for the other
components. It will also include the finalization of instrumerLts, mechanisms, and guides for
these processes, the development, training, and trial testing of at least one complete cycle of
the implementation strategy to be carried out under Phase 2, and the pilot testing in a
specified number of municipalities and states of these processes. Finally, it will include
mechanisms to assure the sustainability of the processes initiated in this program.
1 Sum of FVM changes in municipalities within the capital city microregions.
2Calculated by proportion of expenditures allocated to microregion based on total enrollments in stateschools within the microregion.
86

School Improvement Project: FUNDESCOLA I Annex 7Microregions and Project Phasing
Projects 2 and 3It is expected that the second Project to be prepared under the FUNDESCOLA Program willprovide financing for Phase 2 for the same municipal and state schools and school systemssupported under the first Project as well as Phase 1 and 2 for additional microregions. Thisloan could proceed if at least 50% of the loan funds of the first Project are disbursed. Thethird and final Project would finance Phase 2 for the second group of microregions, andPhases 1 and 2 of a final set of microregions.
Capital City Microregions
The capital city microregions, due to a process of rapid urbanization, possess the highestconcentration of population in each state. This is especially true in the North and CenterWest Regions as outside of the capital, few medium to large cites exist. In the case of fivestates, the population of the capital city is larger than the remainder of the state. Thesenumbers also hold true for the number of poor within the capital microregions. The largestnumber of poor families and poor children reside in the capital and the surrounding urbanperiphery.
FUNDESCOLA I will initiate implementation of Phase 1 within the Capital City Microregionsof the North and Center-West states, a decision based on a number of operational andequity criteria, including: 1) the desire to attend to the highest concentration of studentswithin each state, 2) the most effective means of initiating dialogue between the state andmunicipal systems, for replication within the interior in subsequent projects, and 3) the needto test the Program's instruments and operations within an environment that can be moreeasily monitored. Initial implementation within each state capital will allow for training ofthe state secretariat staff and technicians to work directly with municipalities in their closeproximity, and secondly, initiate cooperation among the state and municipal secretariats forfuture project experience.
Criteria for Subsequent ProjectsPreliminary criteria for additional microregions has been established as the following:
In the North and Center West, those microregions whose leading municipality islarger (in terms of population) than 50,000 will enter into the project. For thosemicroregions which border on entering (within a 5% margin) a secondary criteria using thepercentage of poor families, will be used. If the percentage of poor families is greater thanor equal to that of the last microregion to enter the project, then the microregion will enter.
In the Northeast, those microregions whose leading municipality is larger than 100,000inhabitants will enter into the project. For those microregions which border on entering(within a 5% margin) a secondary criteria using the percentage of poor families, will beused. If the percentage of poor families is greater than or equal to that of the lastmicroregion to enter the project, then the microregion will enter. Table 7.2 shows thedistribution of population within the capital city microregions.
87

School Improvement Project: FUNDESCOLA I Annex 7Microregions and Project Phasing
7.2 Distribution of Population by Mieroregion
State Microregion No. of Pop. Of Leading Pop. Of MR MR % of State(MR) Municip. Municipality Population
AC Rio Branco 7 228990 270701 57%AM Manaus 7 1157357 1328995 56%AP Macapa 8 220962 309970 82%PA Belem 6 1144321 1628746 30%
RO Porto Velho 7 294334 339340 28%RR Boa Vista 4 165518 179289 73%
TO Porto Nacional 1 86116 163760 16%
GO Goiania 17 1004098 1493709 33%MS Campo Grande 8 600069 651910 34%MT Cuiaba 5 4333551 667567 30%Source: IBGE 1996, Calculated
Additional criteria that can be considered for selection of microregions include: criteriaconsidering only poverty indicators, preference to those microregions that are farthest fromthe capital (in order to strengthen interior poles), and location of regional state directorate(to best use available technical and human resources). Table 7.3 shows the distribution ofpoor families within the capital city microregions.
Table 7.3 - Distribution of Poor Families by Microregion
State Microregion Total Families Poor Families MR % of Poor(MR) in MR in MR Families in State
AC Rio Branco 50782 8434 47%AM Manaus 224956 13473 40%AP Macapa 41000 3360 71%PA Belem 289517 29027 17%
RR Boa Vista 29051 250 58%TO Porto Nacional4 20263 2663 9%GO Goiania 314997 23542 22%MS Campo Grande 138594 9272 22%MT Cuiaba 133164 9909 23%Source: IBGE 1996, Calculated
3Porto Nacional, the microregion which includes Palmas, the capital of Tocantins is not the largestmicroregion in the state. This is due to the particular demographic and political history of the state,which was created in 1985.
88

School Improvement Project: FUNDESCOLA I Annex 7Microregions and Project Phasing
Poverty Targeting and Variation within and among MicroregionsDue to the well documented income inequalities in Brazil, poverty targeting is a keypriority of Bank social investments. This focus was supported by the most recent CAS,which emphasized the importance of equalizing educational opportunities as a strategy forreducing regional disparities (June 12, 1997). In determining an appropriate criteria toeffectively target poor communities in Brazil, it must be considered that poverty in Brazil iswidespread and not limited to any single municipality or region. This is to say that althoughit is true that the North and Northeastern regions of Brazil have by far the lowest averageper capita income, extreme levels of poverty can be found in many areas of southern statessuch as Sao Paulo and Rio de Janeiro. Regional aggregate indicators of poverty often aremisleading as they can hide the situation at the state and microregional level.
In the same way that comparison between regions sometimes hides the extreme inequalitieswithin them, variation among municipalities within the IBGE microregions can be just asmisleading. There is less variation between microregions than within microregions, that is,the "poorest" municipality within a "rich" microregion is just as poor, and sometimes morepoor than the poorest municipality in a "poor" microregion. This comparison withinmicroregions holds true for the distribution of income using the example of the state ofGoiAs (Figure 7.1) as well as using promotion rates for the microregions within the samestate (see Figure 7.2). In Figure 7.1 it is clear that even though there is a large variation inaverage income within each microregion, all microregions include very poor municipalities(as measured by average income). The same can be concluded by analyzing Figure 7.2:while there is a significant variation in the average promotion rates between microregions,there are municipalities in each and every microregion that have very low promotion rates.
As stated above, the capital city microregions consist of the capital municipality (in nearlyevery case the municipality with the largest population) and its neighboring municipalities.Due to a historical process of urbanization these capitals have attracted significantmigration in search of economic, social, and educational opportunities. Frequently, therecent migrants to the cities are among the poorest. As a result, the highest level ofinequality in any given state occurs in the capital city microregion, whereby the poorestfamilies are just as poor as the poorest in other microregions (in Figure 7. 1, this is shown byGoiania, the longest of all vertical lines in the graph).
A comparison of average income in the capital city microregions in the North and CenterWest (Figure 7.3) reveals that variation of income in all microregions is very large and thatall capital city microregions include municipalities with very low average income. As such,by choosing the capital city microregions as beneficiaries, FUNDESCOLA I will targetgeographical areas with high levels of inequality that contain very poor municipalities.
The poor in Brazil are not limited to any one geographical area. As a result, choosing asingle geographical area to target the poor is not the best way to approach project selectionas high levels of poverty exist in every microregion. However, by choosing to work withthe capital city microregions the project has selected those regions with: 1) the highestconcentration of poor families; 2) the greatest level of inequality within any single
89

School Improvement Project: FUNDESCOLA I Annex 7Microregions and Project Phasing
microregion in each state; and 3) levels of extreme poverty comparable to those of any
other microregion.
90

School Improvement Project: FUNDESCOLA I Annex 7Microregions and Project Phasing
Figure 7.1 Average Income: Variation Within Microregions in Golis'reorest rvMnicipafity
. MR Averagej Ric hest Muniipality
8 0.4 I
0.3 aCU_
0U 2 . vA CC
m oz MicroRegioncro Region
Figure 7.2 Promotion Rates: Variation Within Microregions in GoiNns
0.91
0.8
0.7T
i06 _0.2
0.1 * MR Average0 *Best fAinicipality
Co0~~~~~~~~
cocro Region
Figure 7.3 Average Income: Variation Within Microregions In N and CWI * Iborest KkJniclpalIt
0-9 - * MR Average
07 *Richest MAinicpI01
E 0.6I 80.5
0.4I<0.3
0.20.1
0 IE
0 t~~~~~~~~~&lcro Region 0z
91

School Improvement Project: FUNDESCOLA I Annex 7Mlicroregions and Project Phasing
Figure 7A FUNDESCoLA I Capital City Microregions and Regions
LegendA
LWI capital CityMficroregions
mNorth. Region
Scale nco ~~~~~~~~~~~~~~~crv ~~~~Center Wyvest Region5m ~ ~~~~ ~~~ 1 WU rTi
* L * I *f * I *
EOt lO2Dnla
~~~~~~~~~~~~~~~~~jtlrrv Regioynsml@4C7*ib01W(Notheast, Southand 4 ja l-nA' skon=kiiotSti4MS O cw6palt
and Southeast)
Pw*00,199" Vf-WVJh*0WC A19V*kwl eawm *~4~ ris,, rep
92

School Improvement Project: FUNDESCOLA I Annex 8Social Assesment
Annex 8
FUNDESCOLA I
Social Assessment
1. Capital City Microregions: Social Context and NeedsEach FUNDESCOLA I microregion includes the capital city and a cluster (from five toseventeen, an average eight) of neighboring municipalities, totaling 80. Each one of thesecapital microregions represents a microcosm of its state in terms of geographic anddemographic differences. The population of the capital microregions vary from 163,760(Palmas, Tocantins) to 1,628,746 (Belem, Pard), with an average 703,000. The proportionof the state's population in the microregion ranges from 16 percent in Tocantins (Palmas) to82 percent in Amapa (Macapa).
Poverty affects significant segments of the capital microregion populations. Seventy-onepercent of all families classified as poor in the state of Amapa live in Macapa, the capital.This figure is 58 percent in Boa Vista (Roraima), 47 percent in Rio Branco (Acre); 40percent in Manaus (Amazonas), and between 17 and 9 percent in Tocantins, Para, andRond6nia. In the Center-West states, an average 23 percent of all families classified as poorlive in the capital microregions. Of a total of approximately 1,350,000 children in the 7-14age group in the ten capital microregions, 98,000 (or 7.7 percent) are out of school.
2. Education and Social DevelopmentSocial development means to a large extent economic development. A diverse body ofliterature shows that a country's development requires educated adults, higher individualearnings, and greater agricultural productivity, but also a set of behaviors and attitudes of adistinctive "social" character. According to a study by IBGE, there is a strong relationshipbetween unemployment and education: of the 4.2 million unemployed in Brazil, 51 percenthave less than four years of schooling.
Designed to support social development, FUNDESCOLA I assumes that basic education: (a)forges national unity and social cohesiveness by conveying common values (i.e., the schoolstaff and its community are responsible for educational improvement); (b) is a provenmechanism for social mobility and distribution of collective resources; (c) leads to theadoption of "modern" attitudes--meaning rational and egalitarian beliefs, conducive topluralism and productivity; (d) promotes adaptability of the population to technologicalchange; (e) enhances community development and participation; (f) upgrades the status ofwomen as mothers, labor force members and community leaders; (g) helps reduce women'sfertility, which makes raising the standard of living less difficult; (g) improves domestichygiene and nutritional practices, thus increasing children's survival, psycho-socialdevelopment and school readiness; and (h) encourages parents to send their children toschool, thus reinforcing a "virtuous circle."
93

School Improvement Project: FUNDESCOLA I Annex 8Social Assesment
3. Preliminary Conclusions and Social ExpectationsA review of local studies and the preliminary beneficiary assessment conducted in theNorth,' mainly in two of the capital microregions (Beldm and Manaus), yield the followingconclusions:
* State and municipal education systems are at best not coordinated, and at worst,in conflict with one another;
* Parents and the community hold high, almost idealized, expectations aboutschooling and the possibility that schools can produce outstanding educationalresults despite their social and physical context;
* Poor families look to the school and the education process as their last chance toseek to achieve better living conditions in the future. They are aware that societydoes not normally give the poor a second chance other than school.
* Parents expect that their children will attain higher levels of schooling than theyhad.
* Teachers expect children to begin first grade already having mastered basics ofreading. As a consequence, they do not concentrate on initial literacyacquisition.
* Parents hope that their children's persistence in school despite high levels ofage-grade distortion, learning failures and repetition, may neverthelesscompensate for school deficiencies.
* Classroom strategies and methodologies are often limited to repetitive activitiessuch as copying from the blackboard and didactic, non-interactivemethodologies.
* Schools in which priority is given to educational. achievement contribute tosignificantly raise academic performance, but schools do not often plan for theseobjectives.
X In many conmmunities the school is the most visible social agency. Schools areseen by the students and parents as a place for social communication andexchange. Nevertheless, socialization is not an issue valued by school teachersand other school leaders.Two major reasons are frequently reported by adlolescents for dropping out ofschool: the need to work, and poor school quality. Both factors combine to causea high dropout rates; higher in the North than in the Center-West.
* A great sociological distance exists between the school and the community.This has to do with unmet expectations on both sides. The school does notpromote comrnunity involvement in order that parents can participate in schoollife and their children's education.
As a pilot project, FUNDESCOLA I will develop a full-fledged beneficiary assessment for theNorth and Center-West regions. The methodology has been established and the consultants
Portela, Adelia Luiza. Avaliacgo do Beneficikrio: Estudo Preliminar Realizado nas Regi6es do Norte eNordeste do Brasil., FUNDESCOLA (Unpublished, 1997).
94

School Improvement Project: FUNDESCOLA I Annex 8Social Assesment
selected, so that work can be started immediately following the implementation of theproject. The results will be applied to FUNDESCOLA I and the subsequent FUNDESCOLAprojects. Preliminary data seem to indicate that the North and Center-West needs andexpectations do not differ markedly from those identified in the Northeast and described inthe "A Call to Action" report.2
Beneficiaries and Expected BenefitsThe ultimate beneficiary of FUNDESCOLA I will be the North and Center-West society andeconomy which will reap the advantages of having better equipped and result-orientedschools, and as a consequence, more learned and skilled students who will, in turn, becomeparticipatory and contributing citizens of a democratic society and productive builders of aknowledge-based economy. The immediate beneficiaries are:
Students will benefit most from the following project inputs: (a) the assurance of MinimumOperational Standards in overall school operation; (b) school-selected classroom materials;(c) more motivated teachers to help the students benefit from the learning process; (d) theorganization and innovation implied by the school development plan and the schoolsubprojects; and (e) school principals with higher levels of managerial skills to make schoola more pleasant and efficient place.
Teachers will benefit substantively from: (a) availability of didactic materials to improvetheir work environment and raise the probability of successful results; (b) the specializedteaching improvement programs; (c) the institution of school subprojects as quality-oriented instruments; and (d) availability of quality feedback/evaluation informationprovided by SAEB.
School Principals will benefit from: (a) continuing professional development programs andacquisition of modem managerial skills; (b) the School Development Plan as a keyparticipatory and team-building instrument; (c) the provision of closer technical assistanceby the Municipal Education Secretariat and the School Development Group; (d) thecooperation provided by more motivated and efficient teachers; and (e) closer andmeaningful cooperation provided by more informed parents.
Parents will benefit considerably from: (a) the operation of a more efficient, andaccountable learning environment for their children; (b) cooperative participation in thedesign of the School Development Plan; (c) more skillful and qualified school managers tointeract with; (d) more motivated, professionally developed and community-orientedteachers; and (e) additional information on the social and economic value of schoolingprompting them to retain their children at school and defer immediate economicgratification.
2 Call to Action: Combating School Failure in the Northeast of Brazil. Brasilia: Ministry ofEducation/Northeast Basic Education Project, The World Bank, UNICEF, 1997.
95


School Improvement Project: FUNDESCOLA I Annex 9Project Processing Budget and Schedule
Annex 9
FUNDESCOLA IProject Processing Budget and Schedule
A. Project Budget (US$000) Planned Actual(At final PCD stage)
200,000 140,000
B. Project Schedule Planned Actual(At final PCD stage)
Time taken to prepare the project (months) 14 months 8 monthsFirst Bank mission (identification) 07/01/97 07/01/97Project Concept Paper review meeting 11/15/97 10/23/97Appraisal mission departure 01/16/98 12/01/97Negotiations 04/15/98 02/18/98Board Presentation 06/15/98Signing 08/15/98Planned Date of Effectiveness 08/30/98
Prepared by: Ministry of Education
Preparation assistance: Government of Brazil
C. Bank staff who worked on the project included:
Name SpecialtyRobin Horn Task Management/Education Economics
Ward Heneveld Education/SchoolAlberto Rodriguez Education
Alcyone Saliba EducationBarbara Nunberg Public Management
Chris Parel Economist/Country OfficerJuliana Weissman Social Fund Specialist
Madalena dos Santos EducationSergei Suarez Education Economics
97


School Improvement Project: FUNDESCOLA I Annex 10Documents in Project File
Annex 10FUNDESCOLA I
Documents in the Project File
A. Project Operations and Implementation Manual (MOIP)Will be available on project effectiveness.
B. Other1. Subsidios para a elaboracao do Plano Nacional de Educacao: educacao infantil e ensino fundamental.Instituto Nacional de Estudos e Pesquisas Educacionais - INEP, Brasilia, 1997.2. Evolucao da Educacao BAsica no Brasil: 1991-1997. Instituto Nacional de Estudos e PesquisasEducacionais - INEP, Brasilia, 1997.3. Fundo de Manutencao e Desenvolvimento do Ensino Fundamental e de ValorizacAo do Magisterio:guia para sua operacionalizacao. Ministerio da Educacao e do Desporto -MEC, Fundo Nacional deDesenvolvimento da Educacao - FNDE, Sao Paulo 1997.4. Carta Lei Darcy Ribeiro no. 9.394, de 1996: emendas A constituicao nos. 11 e 14, de 1996 e Lei9.424, de 1996, Diretrizes e Bases da Educacao Nacional. Gabinete do Senador Darcy Ribeiro, Brasilia,1997.5. Sistematica de Financiamento do Ensino Fundamental. Fundo Nacional de Desenvolvimento daEducacao - FNDE, Ministerio da Educacao e do Desporto -MEC, Brasilia, 1997.6. Dinheiro na Escola: procedimentos operacionais. Ministerio da Educacao e do Desporto - MEC,Brasilia. 1997.7. Manual de Orientacao para ConstituicAo de Unidades Executoras. MEC - Secretaria de EducacaoFundamental, Brasilia, 1997.8. Informe Estatistico 1, 1996: Brasil, Norte, Nordeste, Sudeste, Sul, Centro-Oeste. Instituto Nacional deEstudos e Pesquisas Educacionais - INEP, Brasilia, 1997.9. Informe Estatistico 2, 1996: Rond6nia, Acre, Amazonas, Roraima, Amapa, Para, Tocantins. InstitutoNacional de Estudos e Pesquisas Educacionais - INEP, Brasilia, 1997.10. Informe Estatistico 3, 1996: Maranhao, Piauf, Ceara, Rio Grande do Norte, Pernambuco, Alagoas,Sergipe, Bahia. Instituto Nacional de Estudos e Pesquisas Educacionais - INEP, Brasilia, 1997.11. Informe Estatistico 4, 1996: Minas Gerais, Espirito Santo, Rio de Janeiro, Sao Paulo. InstitutoNacional de Estudos e Pesquisas Educacionais - INEP, Brasilia, 1997.12. Informe Estatistico 5, 1996: ParanA, Santa Catarina, Rio Grande do Sul. Instituto Nacional de Estudose Pesquisas Educacionais - INEP, Brasilia, 1997.13. Informe Estatistico 6, 1996: Mato Grosso do Sul, Mato Grosso, GoiAs, Distrito Federal. InstitutoNacional de Estudos e Pesquisas Educacionais - INEP, Brasilia, 1997.14. Sistema Nacional de Avaliagao da Educacao Basica, SAEB/95: resultados estaduais. InstitutoNacional de Estudos e Pesquisas Educacionais - INEP, Brasilia, 1997.15. Ditos sobre a EvasAo Escolar: estudos de casos no estado da Bahia. Paulo Roberto Holanda Gurgel.Ministdrio da EducacAo e do Desporto - MEC, Projeto de Educacao Basica para o Nordeste, Brasilia, 1997.16. Educacao, Escola e Comunidade: estudo piloto no estado da Bahia. Adelia Luiza Portela and EniSantana Barretto Bastos. Ministerio da Educacao e do Desporto - MEC, Projeto de Educacao Basica para oNordeste, Brasilia, 1997.17. Chamada A AcAo: combatendo o fracasso escolar no Nordeste. Projeto Nordeste, Banco Mundial,UNICEF, Brasilia 1997.18. Licbes e Praticas 1-13. Varias Autores, Projeto Nordeste, Banco Mundial, UNICEF, Brasilia1997.19. Guia de Consulta, Programa de Apoio aos Secretarios Municipais de Educacao (PRASEM).Projeto Nordeste, Banco Mundial, UNICEF, Brasilia 1997.
99


School Improvement Project: FUNDESCOLA I Annex 11
Status of Bank Group Operations in BrazilIBRD Loans and IDA Credits in the Operations Portfolio
DifferenceBetween expected
Original Amount in US$ Millions and actual Lest ARPP
Loan or Fiscal disbursements a/ Supervision Rating b/Project ID Credit Year Borrower Purpose
No. IBRD IDA Cancellations Undisbursed Orig Frm Rev'd Dev Obj Imp Prog
Number of Closed Loans/credits: 201
Active LoansBR-PE-6414 IBRD 30430 1989 COMGAS, SAO PAULO NTRL CAS DIST 94.00 0.00 0.00 5.09 5.07 0.00 S SBR-PE-6370 IBRD 30130 1989 FEDERATIVE REPUBLIC OF BR NE IRRI JAIBA 71.00 0.00 0.00 5.58 5.59 0.00 HS SBR-PE-6446 IBRD 31730 1990 FEDERATIVE REPUBLIC OF BR NAT ENVIRONMT 117.00 0.00 0.00 26.59 26.61 0.00 S SBR-PE-6453 IBRD 31700 1990 FEDERATIVE REPUBLIC OF BR NE IRRIG I 210.00 0.00 69.00 31.94 100.96 31.96 S SBR-PE-6473 IBRD 31600 1990 STATE OF SANTA CATARINA LND MGMT II-S. CATAR 33.00 0.00 0.00 5.33 5.38 0.00 S SBR-PE-6492 IBRD 33760 1991 PETROBRAS BRAZI HYDROCARBN TRNSP/PRO 260.00 0.00 0.00 8.81 8.80 0.00 S SBR-PE-6364 IBRD 33750 1991 STATE OF SAO PAULO INNOV BASIC ED 245.00 0.00 0.00 44.24 44.24 0.00 S SBR-PE-6505 IBRD 34920 1992 GOVERNMENT OF BRAZIL MATO GROSSO NAT RES 205.00 0.00 0.00 88.77 88.77 0.00 S SBR-PE-6368 IBRD 3442A 1992 GOVERNMENT WATER SECTOR MODERNI 69.62 0.00 0.00 57.93 225.80 0.00 S SBR-PE-6547 IBRD 36330 1993 FED.REP.OF BRAZIL METRO TRANSP. RIO 81.02 0.00 0.00 .34 37.57 0.00 S SBR-PE-6427 IBRD 36040 1993 MIN. OF EDUCATION N NE BASIC EDUC II 212.00 0.00 0.00 57.96 39.02 0.00 s SBR-PE-6540 IBRD 35540 1993 MINAS GERAIS ST. WTR Q/PLN(MINAS GERA 145.00 0.00 5.00 25.68 30.67 -12.53 S SBR-PE-6378 IBRD 35480 1993 STATE GOVERNMENTS STATE HWY MGMT 38.00 0.00 18.00 6.53 26.76 -1.38 U UBR-PE-6378 IBRD 35470 1993 STATE GOVERNMENTS STATE HWY MGMT 50.00 0.00 0.00 5.58 26.76 -1.38 U UBR-PE-6541 IBRD 35050 1993 S.PAULO/PARANA STS. WTR Q/PLN(SP/PARANA) 117.00 0.00 0.00 49.05 93.17 0.00 S SBR-PE-6541 IBRD 35040 1993 S.PAULO/PARANA STS. WTR Q/PLN(SP/PARANA) 119.00 0.00 0.00 38.54 93.17 0.00 S SBR-PE-6541 IBRD 35030 1993 S.PAULO/PARANA STS. WTR Q/PLN(SP/PARANA) 9.00 0.00 0.00 5.60 93.17 0.00 S SBR-PE-6522 IBRD 37670 1994 ST.OF ESPIRITO SANTO ESP.SANTO WATER 154.00 0.00 0.00 90.30 59.06 0.00 S UBR-PE-6558 IBRD 37660 1994 REPUBLIC OF BRAZIL PARANA BASIC EDUC 96.00 0.00 0.00 29.01 -3.67 0.00 S SBR-PE-6543 IBRD 37330 1994 GOVERNMENT M. GERAIS BASIC EDUC 150.00 0.00 0.00 56.60 13.93 0.00 S SBR-PE-6555 IBRD 37150 1994 STATE GOVTS STE HWY MGT II 79.00 0.00 18.00 7.52 3.67 -21.52 S SBR-PE-6555 IBRD 37130 1994 STATE GOVTS STE HWY MGT II 54.00 0.00 18.00 18.48 3.67 -21.52 S SBR-PE-6452 IBRD 36630 1994 MINISTRY OF EDUCATION NE BASIC EDUC III 206.60 0.00 0.00 88.21 60.34 0.00 S SBR-PE-6546 IBRD 36590 1994 GOVERNMENT AIDS CONTROL 160.00 0.00 0.00 16.40 1.58 0.00 S HSBR-PE-6524 IBRD 36390 1994 ST.OF MINAS GERAIS MINAS MNC.DEVELOPMT 050.00 0.00 5.00 40.23 33.88 0.00 S SBR-PE-38885 IBRD 39190 1995 GOVT OF BRAZIL RURAL POV.-SERGIPE 36.00 0.00 0.00 21.27 1.26 0.00 S SBR-PE-38884 IBRD 39180 1995 GOVT OF BRAZIL RURAL POV.- CEARA 70.00 0.00 0.00 49.77 8.17 0.00 S SBR-PE-35717 IBRD 39170 1995 GOVT OF BRAZIL RURAL POV. (BAHIA) 105.00 0.00 0.00 65.51 8.20 0.00 S SBR-PE-6564 IBRD 39160 1995 FED REPUBLIC/BRAZIL BELO H M.TSP 15.68 0.00 0.00 .36 42.78 0.00 S SBR-PE-6564 IBRD 3916A 1995 FED REPUBLIC/BRAZIL BELO H M.TSP 83.32 0.00 0.00 83.32 42.78 .0.00 S SBR-PE-38882 IBRD 3915A 1995 FED REPUBLIC OF BRAZIL RECIFE M.TSP 98.72 0.00 0.00 98.72 42.80 0.00 S SBR-PE-6436 IBRD 37890 1995 STATE OF CEARA ZIL CEARA UR.DV/WATER CO 140.00 0.00 0 00 111.59 68.92 -2.16 S SBR-PE-37828 IBRD 40600 1996 STATE OF PARANA (PR)R.POVERTY 175.00 0.00 0.00 175.00 67.93 0.00 S SBR-PE-6554 IBRD 40470 1996 FED. REP. OF BRAZIL HLTH SCTR REFORM 300.00 0.00 0.00 261.09 64.41 0.00 S SBR-PE-40028 IBRD 4046A 1996 FEDERATIVE REPUBLIC OF BR RAILWAYS RESTRUCTURG 151.48 0.00 0.00 142.62 .95 0.00 S SBR-PE-6512 IBRD 39240 1996 CVRD ENV/CONS(CVRD) 50.00 0.00 0 .00 31.07 4.93 0.00 S SBR-PE-6547 IBRD 3633A 1996 FED.REP.OF BRAZIL METRO TRANSP. RIO 47.48 0.00 0.00 37.22 37.57 0.00 S SBR-PE-46052 IBRD 41900 1997 CEARA WTR PILOT 9.60 0.00 0.00 9.60 0.00 0.00BR-PE-4887Q IBRD 41890 1997 THE STATE OF MATO GROSSO MT STATE PRIV. 45.00 0.00 0.00 45.00 4.17 0.00 S SBR-PE-6532 IBRD 41880 1997 FEDERAL GOVERNMENT FED HWY DECENTR 300.00 0.00 0.00 300.00 13.34 0.00 HS SBR-PE-43873 IBRD 41690 1997 FED.REP.OF BRAZIL AG TECH DEV. 60.00 0.00 0.00 56.01 6.96 0.00 S SBR-PE-34578 IBRD 41650 1997 RIO GRANDE DO SUL RGS HWY MGT 70.00 0.00 0.00 70.00 4.67 0.00 S SBR-PE-43868 IBRD 41480 1997 STATE OF RGS RGS LAND MGT/POVERTY 100.00 0.00 0.00 97.00 6.87 0.00 S SBR-PE-6475 IBRD 41470 1997 FED. REP. OF BRAZIL LAND RFM PILOT 90.00 0.00 0.00 75.05 -3.85 0.00 S SBR-PE-6562 IBRD 41400 1997 STATE OF BAHIA BAHIA MUN.DV 100.00 0.00 0.00 98.98 5.65 0.00 S SBR-PE-39196 IBRD 41390 1997 STATE OF RIO GRANDE DO SU RGS ST.REFORM 125.00 0.00 0.00 75.00 30.00 0.00 S SBR-PE-42566 IBRD 41220 1997 STATE OF PERNAMBUCO R.POVERTY(PE) 39.00 0.00 0 00 33.61 5.56 0.00 S S
Generated by the Operations Information System (OIS) 101

School Improvement Project: FUNDESCOLA I Annex 11
DifferenceBetween expected
Original Amount in US$ Millions and actual Last ARPP
Loan or Fiscal disbursements a/ Supervision Rating b/
Project ID Credit Year Borrower PurposeNo. IBRD IDA Cancellations Undisbursed Orig Frm Rev'd Dev Obj Imp Prog
BR-PE-43871 IBRD 41210 1997 STATE OF PIAUI (PIAUI)R.POVERTY 30.00 0.00 0.00 26.67 4.17 0.00 S S
BR-PE-38896 IBRD 41200 1997 STATE OF RGN R.POVERTY(RGN) 24.00 0.00 0.00 21.24 2.71 0.00 S S
BR-PE-38947 IBRD 42660 1998 GOVERNMENT OF BRAZIL SC. & TECH 3 155.00 0.00 0.00 155.00 0.00 0.00
BR-PE-6549 IBRO 42650 1998 PETROBRAS GAS SCTR DEV PROJECT 130.00 0.00 0.00 130.00 0.00 0.00
BR-PE-51701 IBRD 42520 1998 STATE OF MARANHAO MARANHAO R.POVERTY 80.00 0.00 0.00 80.00 0.00 0.00
BR-PE-42565 IBRD 42510 1998 STATE OF PARAIBA PAPAIBA R.POVERTY 60.00 0.00 0.00 60.00 0.00 0.00
BR-PE-48357 IBRD 42450 1998 REPUBLIC OF BRAZIL CEN.BANK TAL 20.00 0.00 0.00 20.00 0.00 0.00
BR-PE-6474 IBRD 42380 1998 STATE OF SAO PAULO LAND MGT 3(SP) 55.00 0.00 0.00 55.00 0.00 0.00
BR-PE-35728 IBRD 42320 1998 STATE OF BAHIA BAHIA WTR RESOURCES 51.00 0.00 0.00 51.00 0.00 0.00
BR-PE-39197 IBRD 42110 1998 STATE OF RIO DE JANEIRO RJ ST.PRIV. 250.00 0.00 0.00 250.00 137.50 0.00 S S
Total 6,191.52 0.00 133.00 3,597.01 1,732.42 -28.53
Active Loans Closed Loans Total
Total Disbursed (IBRD and IDA): 2,461.49 14,924.18 17,385.67of which has been repaid: 203.09 12,311.36 12,514.45
Total flow held by IBRD and IDA: 5,855.42 2,663.84 8,519.26Amount sold : 0.00 45.83 45.83
Of which repaid : 0.00 45.83 45.83Total Undisbursed : 3,597.01 51.05 3,648.06
a. Intended disbursements to date minus actual disbursements to date as projected at appraisal.
b. Following the FY94 Annual Review of Portfolio performance (ARPP), a letter based system was introduced (HS = highly Satisfactory, S = satisfactory, U = unsatisfactory,
HU = highly unsatisfactory): see proposed Improvements in Project and Portfolio Performance Rating Methodology (SecM94-901), August 23, 1994.
Mote:Disbursement data is updated at the end of the first week of the month.
Generated by the Operations Information System (OIS) 102

School Improvement Project: FUNDESCOLA I Annex 12Brazil at a Glance
Brazil at a glance 8128f97
Latin Upper-POVERTY and SOCIAL America middle-
Brazil & Carib. Income Development dlamond
Population mid-1996 (millions) 161.2 485 479GNP per capita 1996 (USS) 4,360 3,710 4,540 Ltfe expectancy
GNP 1996 (billions USS) 702.9 1,799 2,173
Average annual growth, 1990-96
Population %)1 4 1.7 1.5 GNGrsLabor force ()1.6 2.3 1.5 e rmr
Most recent estimate (latest year available since 1989) capita enrollment
Poverty: headcount index (% ofpopulation) 17Urban population (% of total population) 78 74 73Life expectancy at birth (years) 67 69 69Infant mortality (per 1,000 live births) 44 Access to safe waterChild malnutrition (% of children under 5) 16Access to safe water (% of population) 92 80 86Illiteracy (% ofpopulation age 15+) 17 13 13Gross primary enrollment (% of school-age population) 114 110 107 - razd
Male - Upper-middle-income groupFemale
KEY ECONOMIC RATIOS and LONG-TERM TRENDS
1975 1985 1995 1996Economic ratioa
GDP (billions US$) 121.8 222.9 716.9 748.7Gross domestic investment/GDP 26 8 192 20.1 19.5Exports of goods and services/GDP 7 5 12.2 6.7 6.6 Openness of economyGross domestic savings/GDP 22.9 24.4 19.2 18.2Gross national savings/GDP 21.1 19 3 17.6 16.3
Current account balance/GDP -5.8 -0.2 -2.5 -3.2 /Interest payments/GDP 17 3.3 1.2 1.7 Savings InvestmentTotal debt/GDP 22.4 46.5 22.2 23.8Total debt servicelexports 43.5 39.1 43.1 46.7Present value of debt/GDP 22.1Present value of debt/exports 270.7
Indebtedness1975-85 1986-96 1995 199 1997-05
(average annual growth) - BrazilGDP 3.1 12 4.1 2.9 4.8GNP per capita 0.2 -0.4 2.8 1.6 4.0 Upper-middle-icome groupExports of goods and services 10.5 6.5 -1.4 61 7 0
STRUCTURE of the ECONOMY
1975 1985 1995 1996(% of GDP) Growth rates of output and Investment 1%)Agriculture 12.1 11.5 14.4 144 10Industry 40.2 45.3 36.5 36.4 s _
Manufacturing 30.3 33.7 23.8 oServices 47.7 43.1 49.1 49.2 93 94 S5 5
Private consumption 66.5 65.8 64.9 65.7 -10General govemment consumption 10.6 9.9 15.9 16.1Importsofgoodsandservices 11.5 7.1 7.6 7.9 - G GDP
1975-85 1986-96 1995 1996(average annual growth) Growth rates of exports and Imports l%)Agriculture 4.3 2.6 4.9 3.1 40
Industry 3.0 -1.1 2.1 213Manufacturing 2.6 -1.5 2.1 20
Services 2.9 2.8 5.3 3.3
Private consumption 3.0 1.8 11.0 4.1 0 9 ,General govemment consumption 1.2 0.7 2.4 0.8Gross domestic investment -2.9 -0.6 9.4 0.0 -20Imports of goods and services -4.0 8.9 36.8 5.9Gross national product 2.5 1.1 4.2 2.9 Exports *lrnports
Note: 1996 data are preliminary estimates. Figures in italics are for years other than those specified.
The diamonds show four key indicators in the country (in bold) compared with its income-group average. If data are missing, the diamond willbe incomplete.
103

School Improvement Project: FUNDESCOLA I Annex 12Brazil at a Glance
Brazil
PRICES and GOVERNMENT FINANCE
1975 1985 1995 1996Domestic prkes IntlatIon (%)
(6 change) 3 000
Consumer prices 25.0 226.9 67.0 15.5 2,500
Implicit GDP deflator 33.9 231.7 74.9 11.1 1,57900jf
Government finance 's o 500(% of GDP) oCurrent revenue .. .. 31.5 32.4 91 92 93 94 95 9ePrimary surplus/deficit . .. 0.4 -0.1 GDPdef -O-CPIOperatonal surplus/deficit .. .. -4.8 -3.9
TRADE
1975 1985 1995 1996(millions US$) Export and Import levels (mill. USS)
Total exports (fob) .. 25,638 46,508 47,746 so.oo0Coffee .. 2,607 1,970 2,059Other food .. 2,545 3,896 4,665Manufactures .. 13,356 25,568 26,247 40.000
Total imports (cif . 13,153 49,663 53,286Food .. .. 3,535 6,044 20,000-&kh iIIFuel and energy .. 6,176 4,649 5,752Capital goods .. 2,480 19,688 19,804
Export price index (1987=100) .. 97 128 126 90 91 92 93 94 95 94Import price index (1987=100) .. 79 124 125 a Exports e ImportsTerms of trade (1987=100) .. 123 103 101
BALANCE of PAYMENTS1975 1985 1995 1996
(millions US$) Current account balance to GOP ratio (%)Exports of goods and services 9,418 27,713 47,960 49,558 1Imports of goods and services 14,323 16,928 54,306 59,355Resource balance -4,905 10,785 -6,346 -9,797 o
Net income -2,106 -11,213 -15,419 -17,402 n 92 3
Net current transfers -10 16 3,973 2,899 TCurrent account balance, -2
before official capital transfers -7,021 -412 -17,792 -24,300
Financing items (net) 5,956 1,826 30,779 32,935Changes in net reserves 1,065 -1,414 -12,987 -8,635 4
Memo:Reserves inciuding gold (mill. USS) 4,166 11,613 51,469 59,663Conversion rate (local/US$) 3.OE-12 2.3E-09 0.9 1.0
EXTERNAL DEBT and RESOURCE FLOWS1975 1985 1995 1996
(millions US$) Composition of total debt, 1995 (mill. USS)Total debt outstanding and disbursed 27,329 103,601 159,130 178,131 A C
IBROD 1045 5,274 6,038 5,876 G 638142 D
IDA 0 0 0 0 30494 3327
Total debt service 4,320 11,470 22,328 .. EIBRD 98 796 1,868 1,638 19451IDA 0 0 0 0
Compositon of net resource flows ()Official grants 9 34 64 ..
Official creditors 1,059 935 -1,378 ..
Private creditors 4,213 149 9,827 ..
Foreign direct investment 1,302 1,348 4,859Portfolio equity 0 0 4,411 F
99678World Bank program
Commitments 538 1,525 404 858 A - IBRO E- BilateralDisbursements 249 765 838 1,500 B- IDA D - Other mutilateral F - PnvatePrincipal repayments 26 406 1,377 1,222 C - IMF G - Short-termNet flows 224 359 -539 278Intereslt payments 72 391 491 416Net transfers 152 -32 -1,031 -138
Development Economics 8/28/97
104

VENEZUELA G ) A 50FR. \ -H < < l~~~~SURINAMEiGUIANA n r n A -71
COLOMBIA j a Z(FR)/ t L I L' Vista0 \ >
'\- t l XRORAIMA \l {~~/ <- AMAPA FUNDESCOLA I PROJECT STATES:\~,AMA PA__ _ _ _ _ _ _ _ _ _
I ' ' ' ' XMacciprJ / NORTH REGION
CENTER WEST REGION.Be em'
? i - <3Manau5 * ? s tll hi Osia .2, <3Siao Luis RIVERS
/ i AM ZOP A R o- Fartalezo 0 STATE CAPITALS
A.AZONAS , ,? ' -- 2MARANHAO Teresina 0 NATIONAL CAPITAL<"' 'l?~Iv CEAA -IO
/jCEARA GRANDE NatalJ . ). (k DO NORTE® STATE BOUNDARIES2 /~~~~~~~~~~~~~~~~~~~~~~~~~~~~~~~~~~
* A / / X (: k :^ t~ P I ARA I 3A REGION BOUNDARIES. ,Pessoa
A C RiE -4J0Porto _7N,4mU / 0 ie --- INTERNATIONAL BOUNDARIES
Bro 0o / . -- AtGA This map as produced by the-10' ( . " :\ ,ALAGOAS
ROND(5N1A"__'1 ~~~~~TOCANTN ArclsMap Design Unit of The World Bonh.- ; /s RONDONIA 7 / CXcu0spr T10 The boundaries, colors,denominotions
P E R U \\ MATO I B A H I A - and anyother information shownon
| .. G. RO50 this map do not imply, an the part ofGROSSO l~~~~~~~~~-.~~~~--~~~'s o ~~~~The World Bank Group, any j,dgosest
? Salvador on the legalstatIus of any territory or
/ *-~~~~~~~~~.... ~~~~~~~any endorsement or accptance ofsuch boundaries.
Cvia b6®.` BRASILIA- r4) ~~~~~~~~~~~~~~~Goienia®
M I N A S /PANAMA VENEZUELA j<GUYANABOLIVIA~~~~~~~~~~~~~~~~~~~~~A 5' I SURINAMEgs .. B O L I V I A > ~' t M I N ~ --. / GERAIS *COLOMBIA (FR ENCH GUIANA (FRi
---. M~~ATO GROSS Belo *
DO SUL Horizonte)ESPiRITO ECUADGv \v
-C20 ( ?jVit6ria t :-20. G) 'A.1a
\~ / ~ 8 l C SAO PAULO ( t / PERU '-i1 'i-r7 ,,~~~~~./- --tJROD JANEIRO20
CHILE! Sao PauloRiodeJane PARAGUAY R e JANEiro BOUVIA
C .ILE. PARANA _- P -- 1
s -ritiba '1"PARAGUAY
CHILE ' ,))) (~~~~~~~7 L ~~t"STA-CATARINA(~'. Florian6polis ARGENTINA)
A RG NT NA 7 t . 57__________RGETIN_j
! A R G E N T I N A 0 250 590 750 1000 KILOMETERS URUGUAY
RIO GRANDE IPrt Aer I s f \ DO SUL E >PartD Alegre U 200 400 600 MItES
I _ 30O * ; \ t . '
80' \70' 60' -URUGUAY ( 5074 20 301aI _ _ _ _ _ _ _ _ _ _ _ _ _ _ _ _ _ _ _ _ __0 0_ C.