report on transactions in municipal securities - … · report on transactions in municipal...
TRANSCRIPT

Report on
Transactions In Municipal Securities
Office of Economic Analysis
Office of Municipal Securities Division of Market Regulation
United States Securities and Exchange Commission
July 1, 2004
This is a report of the Office of Economic Analysis and the Office of Municipal Securities. The Commission has expressed no view regarding the analysis, findings, or conclusions herein.

ACKNOWLEDGEMENTS This report was prepared by Vance Anthony in the Office of Economic Analysis, Martha Mahan Haines in the Office of Municipal Securities, and Murat Aydogdu, formerly in the Office of Economic Analysis and currently an Assistant Professor at Bryant College. Other current and former SEC staff that assisted in the report’s preparation include Alexandra Albright, William Dale, Robert Fischer, Margaret Henry, Michael Piwowar, Mary Simpkins, Jonathan Sokobin, Stephen Weinstein, and Mark Zehner. Hal Johnson and Larry Lawrence at the Municipal Securities Rulemaking Board provided invaluable guidance on the characteristics of the transaction data. Maryrose Carosia at Standard & Poor’s spent countless hours interpreting the KennyBase database and assisting us in developing methods utilizing it to estimate the principal value of municipal securities outstanding.
i

Table of Contents
I. Introduction ........................................................................................................ 1 II. Summary of Findings ......................................................................................... 2 III. Certain Terms Used in This Report .................................................................... 4 IV. Size of the Municipal Securities Market ............................................................ 5 V. Types of Municipal Securities ........................................................................... 6 A. Types of coupons ........................................................................................ 6 B. Types of securities ........................................................................................ 7 VI. Distribution of Municipal Securities Transactions by Type of Contra Party ................................................................................................... 9 VII. Dealer Participation in Municipal Securities Transactions ................................ 10 VIII. Size of Municipal Securities Transactions ......................................................... 11 IX. Distribution of Municipal Offerings by Size and Transaction Activity ............. 15 X. Distribution of Municipal Issuers by Principal Amount and Transaction Activity .................................................................................... 16 XI. Distribution of Municipal Securities by Principal Amount and Transaction Activity ..................................................................................... 19 XII. Distribution of Municipal Securities by Insured Status ...................................... 22 XIII. Distribution of Municipal Securities by Rating ................................................. 23 XIV. Distribution of Municipal Securities by Maturity ............................................... 25 XV. Distribution of Municipal Securities by Sources of Repayment ........................ 27 XVI. Distribution of Municipal Securities by Conduit Status ..................................... 27 XVII. Distribution of Municipal Securities by Federal Income Tax Status .................. 30 XVIII. Spreads ................................................................................................................ 30 XIX. Variability in Customer Transaction Prices ........................................................ 34
ii

XX. Transaction Activity Over the Life of a Municipal Security ............................. 36 A. Time series .................................................................................................... 36 B. Cross-sectional ............................................................................................. 38 C. Maturity ........................................................................................................ 41 Appendices Appendix A: Tables Appendix B: Additional Technical Information Appendix C: Potential Overstatement of Amount of Municipal Securities
iii

I. Introduction In 1994, municipal securities dealers began reporting their inter-dealer transactions in municipal securities to the Municipal Securities Rulemaking Board (the “MSRB”). In 1998, dealers began reporting trades with customers. These transaction data serve as an audit trail for SEC and NASD inspection and enforcement staff and other regulatory agencies. In addition, the MSRB makes the transaction data, as well as summary information on these trades, available to subscribers. These changes have resulted in a somewhat more transparent market for municipal securities. This report is a byproduct of these transaction reporting requirements, which provide a wealth of information about transaction activity in what was once a very opaque market. The MSRB has provided us with the trade records for all transactions in municipal securities between November 1, 1999 and October 31, 2000.
The MSRB obtains information on the characteristics of the securities traded from Standard & Poor’s (“S&P”). S&P maintains a database on outstanding municipal securities, referred to as Standard & Poor’s KennyBase Database Services (the "KennyBase"). The MSRB receives a daily feed from S&P, effectively maintaining an updated version of the KennyBase. To allow Commission staff to put the transaction activity in perspective, S&P graciously gave the MSRB permission to provide the Commission with data from the KennyBase. This data was provided to us in two ways. First, the MSRB attached to each trade record selected characteristics of the security using KennyBase data for early December 2000. Second, the MSRB provided us with a copy of the entire KennyBase on three days in the vicinity of our sample period.1
Information about outstanding municipal securities comes from these
“snapshots.” We also used the snapshots to attach security-specific characteristics to the trade records. For characteristics of a security that were unlikely to change over time, such as the maturity date or the dated date, we used the latest data provided; either the December data attached to the trade record by the MSRB, or the latest snapshot containing information on the traded CUSIP. For information that might have changed during our study period, such as the rating, we used the KennyBase data that was nearest in time to the transaction date. We also used Bloomberg to check the characteristics of several thousand municipal securities.
Appendix B provides a more detailed description of these data sources and our
efforts to use the KennyBase to estimate the amount of outstanding municipal securities. Unless otherwise specified, reference in this report to transaction activity refers to
trades from November 1, 1999 through October 31, 2000. Reference to the number and amount of outstanding municipal securities is as of November 5, 2000.
1 These days are December 12, 1999; February 19, 2000; and November 5, 2000.
1

II. Summary of Findings On November 5, 2000, there were about 51,000 issuers with outstanding municipal
securities.
These issuers had 1,100,000 outstanding municipal securities, with a principal amount of about $2.0 trillion.
There also were about 14,000 derivatives issued in the secondary market, with
a principal amount of about $61 billion. There were about 7 million transactions in about 460,000 securities during our
sample year, with a principal amount traded of about $2.6 trillion. During our sample year, over 1,600 dealers traded municipal securities with
customers.
Five dealers accounted for half of all transaction activity with customers. Thirteen dealers accounted for three-quarters of customer transaction activity.
We identified 16 brokers’ brokers. These dealers were on at least one side of
trades accounting for 56% of all inter-dealer transaction activity. The median size of all municipal securities trades was $30,000.
The median size of trades in variable rate securities, which are popular with
institutions, was more than $1 million. The median size of trades in fixed rate securities was $25,000.
Most transaction activity was in a relatively small number of securities and in the
securities of a relatively small number of issuers.
One-third of issuers had no trades in their securities between December 12, 1999 and November 5, 2000. Two percent of issuers accounted for two-thirds of transaction activity during this period.
About 70% of municipal securities did not trade between December 12, 1999
and November 5, 2000. Less than 1% of securities accounted for half of transaction activity during this period.
The median estimated spread on a customer trade in fixed coupon municipal
securities during our sample period – or the cost of purchasing and then selling a security – was 1.66% of the principal amount traded.
Small trades had higher spreads than large trades.
2

The longer a security’s remaining maturity, the higher the spread.
Usually, the lower a security’s rating, the higher the spread.
There was considerable variability in the size of the spreads on very similar
securities. Different customers purchasing (or selling) the same amount of the same fixed
coupon security on the same day frequently paid (or were paid) substantially different prices.
Different prices were most likely to occur if more than one dealer was buying
or selling the same security on the same day. Individual dealers were unlikely to charge or pay different prices.
Customers making large trades were less likely to experience different prices
than customers making small trades.
Recently offered fixed coupon securities were much more likely to trade than were seasoned fixed coupon securities.
Daily customer turnover of fixed coupon securities averaged 1.5% the week
they were distributed. That is, the par value purchased and sold by customers each day equaled 1.5% of the outstanding par amount. During the rest of the month, daily customer turnover averaged 0.5%. During the second through sixth month, daily customer turnover averaged 0.2%. Fixed coupon securities that were ten years old averaged daily turnover rates of 0.04%.
Variable rate securities showed much less change in turnover as they matured.
During the week they were distributed, variable rate securities averaged daily customer turnover of 3.2%. Variable rate securities that were ten years old averaged daily customer turnover rates of 0.8%.
Large municipal securities had higher turnover rates than small securities.
Among fixed coupon securities in their second through fourth years, securities
with an outstanding principal amount of more than $10 million averaged daily customer turnover of 0.20%. Securities with an outstanding principal amount of $1 million or less averaged daily turnover of 0.05%.
Among variable rate securities in their second through fourth years, securities
with an outstanding principal amount of more than $10 million averaged daily customer turnover of 1.81%. Securities with an outstanding principal amount of $1 million or less averaged daily turnover of 0.27%.
3
III. Certain Terms Used in This Report
This report uses a number of technical terms, sometimes with meanings that are different from those customarily used in the municipal securities industry. When reading this report, it is essential that the reader keep these terms in mind. “CUSIP number” means the unique identifying number assigned to each maturity
of an offering by the CUSIP Service Bureau, Inc. These numbers are universally used in trades to identify the specific municipal securities being bought or sold. CUSIP numbers have nine digits. The first six digits identify the issuer while the next two identify the particular offering and maturity. The last digit is a check digit.
“Distribution day” means the first day in which trading in a particular security occurred. “Dated date” is the day on which interest on the security begins to accrue.
“Issuance offering amount” means the aggregate offering amount of all securities in the same issuance.
“Issuer” means the unit of state or local government, or one of their agencies and instrumentalities, to which a particular six digit CUSIP number has been assigned. “Maturity amount” means the amount of a security that is due and payable at maturity. “Offering” means the collection of municipal securities of an issuer that were part of the same issuance.
“Principal amount” means the amount that is due and payable from the issuer at
maturity, excluding interest. However, the principal amount of zero coupon securities includes accrued compound interest.2 “Securities” means all municipal securities sharing the same nine digit CUSIP number.
“Unrated” depends on context. It may mean securities that are not rated by Moody’s or Standard & Poor’s, or securities that are not rated by Moody’s.
2 The principal amount of an offering of zero coupon bonds is considerably higher than the offering amount because it includes all of the accrued compound interest from its offering date through its maturity date.
4

IV. Size of the Municipal Securities Market On November 5, 2000, a few days after the end of our sample period, the KennyBase contained 1.1 million municipal securities, from about 51,000 issuers, with a principal amount of about $2.0 trillion (see Exhibit 1).3 During our sample period there were over 7 million transactions with an aggregate principal amount of $2.6 trillion.
Exhibit 1 Size of the Municipal Securities Market
Number of Issuers 50,500 Number of Outstanding Offerings1 148,000 Number of Outstanding Securities1 1,096,000 Principal Amount of Outstanding Securities ($Trillions) 1 2.0 Number of Different Securities Traded During Period 463,000 Number of Transactions During Period 7,025,000 Principal Amount Traded During Period ($Trillions) 2.6 1Derivatives created in the secondary market excluded. Sources: KennyBase on November 5, 2000, Bloomberg, and MSRB transaction data November 1, 1999 - October 31, 2000
Unlike the U.S. Government and many corporate markets, most municipal securities offerings contain securities with a number of different maturity dates. An offering might include a number of serial bonds maturing annually for a period of years. The offering might also include several large term bonds with sinking fund requirements. This flexibility allows the issuer control over its debt service schedule and permits it to reach a broader spectrum of the investment community than had it issued only one maturity. In fact, the distribution of maturities offered is often influenced by the demand for a particular maturity at the time of the offering. Exhibit 2 compares some of the characteristics of the municipal securities market with those of the equities market. Clearly the largest difference is the number of securities outstanding. There were about eighty times as many municipal securities as there were equities.4 However, the value of equities outstanding was about nine times the principal amount of municipals, and equity value traded was about 13 times the principal
3We are aware of two other estimates of the amount of municipal securities outstanding, both lower than that created using the KennyBase. The Flow of Funds Section at the Board of Governors of the Federal Reserve System estimated that there were about $1.6 trillion in municipal securities outstanding at year-end 2000. (See Federal Reserve Board, Flow of Funds Accounts of the United States, Z.1 Statistical Release, June 2002, table L.211.) The U.S. Census Bureau estimated that State and local governments had about $1.5 trillion in debt outstanding during 2000. (See http://www.census.gov/govs/www/estimate00.html.) 4 This is a result of the different nature of equity and municipal securities offerings. While corporate issuers generally have a relatively few kinds of equity securities (such as common and preferred stock) and a relatively low number of offerings, issuers of municipal securities commonly have many offerings, each with a number of different securities.
5

amount of municipal securities traded. Note that municipal trading volume is overstated relative to equity volume, because our municipal trading data includes primary market transactions as well as secondary trading.5 Equity trading data do not include primary market transactions. In addition, transferring ownership of a municipal security from one customer to another virtually always requires at least two transactions, a purchase by a dealer from one customer and a sale to another. Among equities, particularly listed securities, some trades take place directly between customers with the dealer merely facilitating the transfer of ownership.
Municipal Securities and Equity Markets ComparedExhibit 2
The number and principal amount of municipal securities outstanding are those outstanding on November 5, 2000 (secondary derivatives excluded). The number of equities is the number of 10Ks filed in 2000; the amount of equities outstanding is from the Flow of Funds Accounts. Average daily volume for municipal securities is that during November 1, 1999 - October 31, 2000; for equities, it is exchange and Nasdaq volume during 2000.
Sources: MSRB, KennyBase, Bloomberg, Board of Governors of the Federal Reserve System, SEC Forms R-31 and Nasdaq
1,095,659
2.010.413,450
17.6 134.2
Number of Securities
Amount Outstanding ($T)
Avg Daily Volume ($B)
Munies Equities Munies Equities Munies Equities
V. Types of Municipal Securities A. Types of coupons Municipal securities can be broadly classified as either fixed coupon, zero coupon, or variable rate securities. Fixed coupon securities pay a specified interest rate over the life of the security. The resulting interest is distributed periodically, typically semi-annually. Zero coupon bonds do not pay any interest to bondholders until maturity. Interest is accrued and compounded until the maturity date, at which time the principal and interest both become due. Variable rate securities pay an interest rate that changes periodically. The rate may be linked to a commonly followed index, or it may be reset
6
5 In addition, we suspect that about 15,000 customer trades with a principal amount of about $23 billion actually were purchases from issuers by dealers during underwritings.

periodically by the issuer or a third party. In many variable rate offerings, investors have the right to put securities back to the issuer, usually at par. Variable rate securities with put rights are very attractive to some institutional investors, particularly money market funds seeking to maintain a portfolio with a short duration. Within this report, it will sometimes be useful to combine fixed coupon and zero coupon securities in order to compare their characteristics with those of variable rate securities. These will collectively be referred to as fixed rate securities.
Exhibit 3 and Table A-1 present the distribution of municipal securities and municipal securities transactions, by coupon type. Most municipal securities (94%) are fixed coupon securities. These securities also account for the majority of the principal amount outstanding (77%). In contrast, variable rate securities comprise only about 15% of the principal amount outstanding but account for 53% of the principal amount traded. These instruments, disproportionately owned by institutions, have a turnover rate six times that of fixed coupon securities.
Sources: MSRB, KennyBase and Bloomberg
This exhibit shows the distribution of outstanding municipal securities and the distribution of their principal amount traded, by the coupon type.
Distribution of Outstanding SecuritiesBy Coupon Type
Distribution of Principal Amount TradedBy Coupon Type
Distribution of Municipal Securities Outstanding and Transactions: By Coupon TypeExhibit 3
Fixed Coupon (93.8%)
Zero Coupon (3.5%)
Variable Rate (2.7%)
Zero Coupon (2.8%)
Variable Rate (52.7%) Fixed Coupon
(44.4%)
B. Types of securities
Municipal securities also can be classified by certain characteristics of the security (see Exhibit 4 and Tables A-2 – A-4). We have identified about 14,000 derivatives created in the secondary market using municipal securities (“secondary derivatives”). These securities are not included in our estimate of the principal amount of municipal securities outstanding.
7
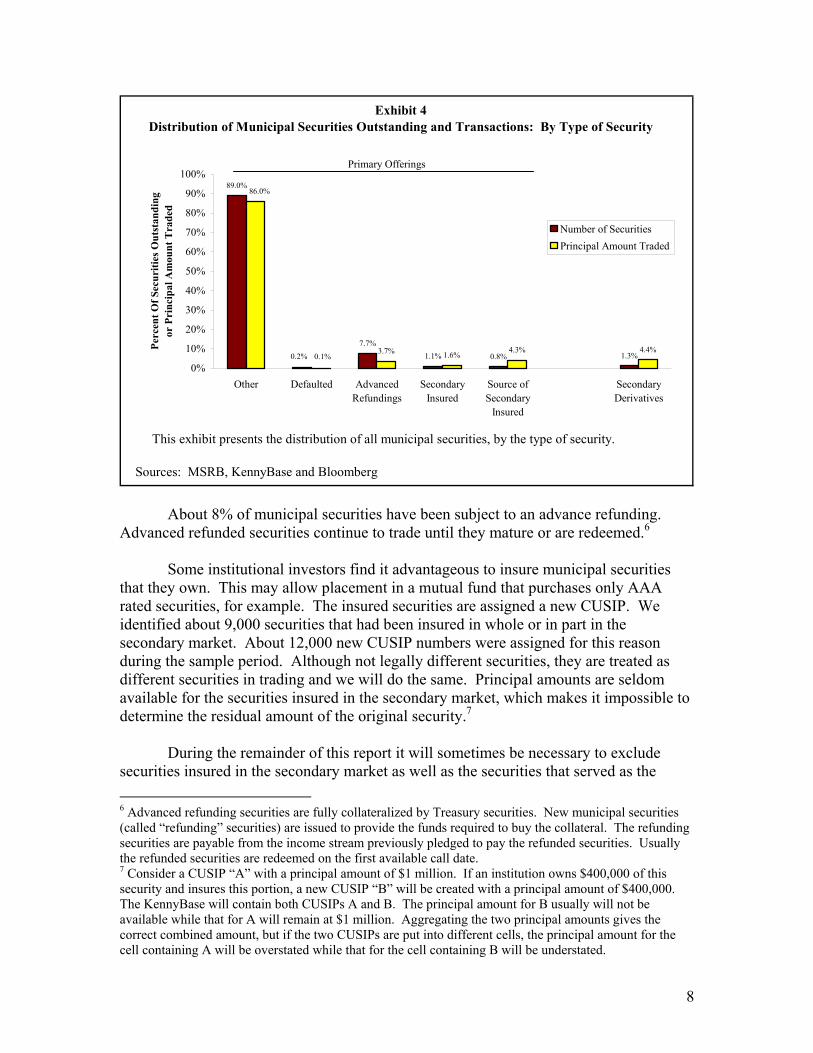
This exhibit presents the distribution of all municipal securities, by the type of security.
Sources: MSRB, KennyBase and Bloomberg
Exhibit 4Distribution of Municipal Securities Outstanding and Transactions: By Type of Security
89.0%
7.7%1.1% 0.8% 1.3%3.7% 1.6%
4.3% 4.4%0.2% 0.1%
86.0%
0%
10%
20%
30%
40%
50%
60%
70%
80%
90%
100%
Other Defaulted AdvancedRefundings
SecondaryInsured
Source ofSecondary
Insured
SecondaryDerivatives
Perc
ent O
f Sec
uriti
es O
utst
andi
ngor
Pri
ncip
al A
mou
nt T
rade
d
Number of SecuritiesPrincipal Amount Traded
Primary Offerings
About 8% of municipal securities have been subject to an advance refunding.
Advanced refunded securities continue to trade until they mature or are redeemed.6 Some institutional investors find it advantageous to insure municipal securities
that they own. This may allow placement in a mutual fund that purchases only AAA rated securities, for example. The insured securities are assigned a new CUSIP. We identified about 9,000 securities that had been insured in whole or in part in the secondary market. About 12,000 new CUSIP numbers were assigned for this reason during the sample period. Although not legally different securities, they are treated as different securities in trading and we will do the same. Principal amounts are seldom available for the securities insured in the secondary market, which makes it impossible to determine the residual amount of the original security.7
During the remainder of this report it will sometimes be necessary to exclude
securities insured in the secondary market as well as the securities that served as the 6 Advanced refunding securities are fully collateralized by Treasury securities. New municipal securities (called “refunding” securities) are issued to provide the funds required to buy the collateral. The refunding securities are payable from the income stream previously pledged to pay the refunded securities. Usually the refunded securities are redeemed on the first available call date. 7 Consider a CUSIP “A” with a principal amount of $1 million. If an institution owns $400,000 of this security and insures this portion, a new CUSIP “B” will be created with a principal amount of $400,000. The KennyBase will contain both CUSIPs A and B. The principal amount for B usually will not be available while that for A will remain at $1 million. Aggregating the two principal amounts gives the correct combined amount, but if the two CUSIPs are put into different cells, the principal amount for the cell containing A will be overstated while that for the cell containing B will be understated.
8
source of these securities. While we can assign an outstanding amount to the aggregate of these securities, we don’t know the amounts of the individual issues. So in cases where the insured and source securities might be assigned to different categories (for example, in presentations by the size of the security) both types of securities will be excluded.
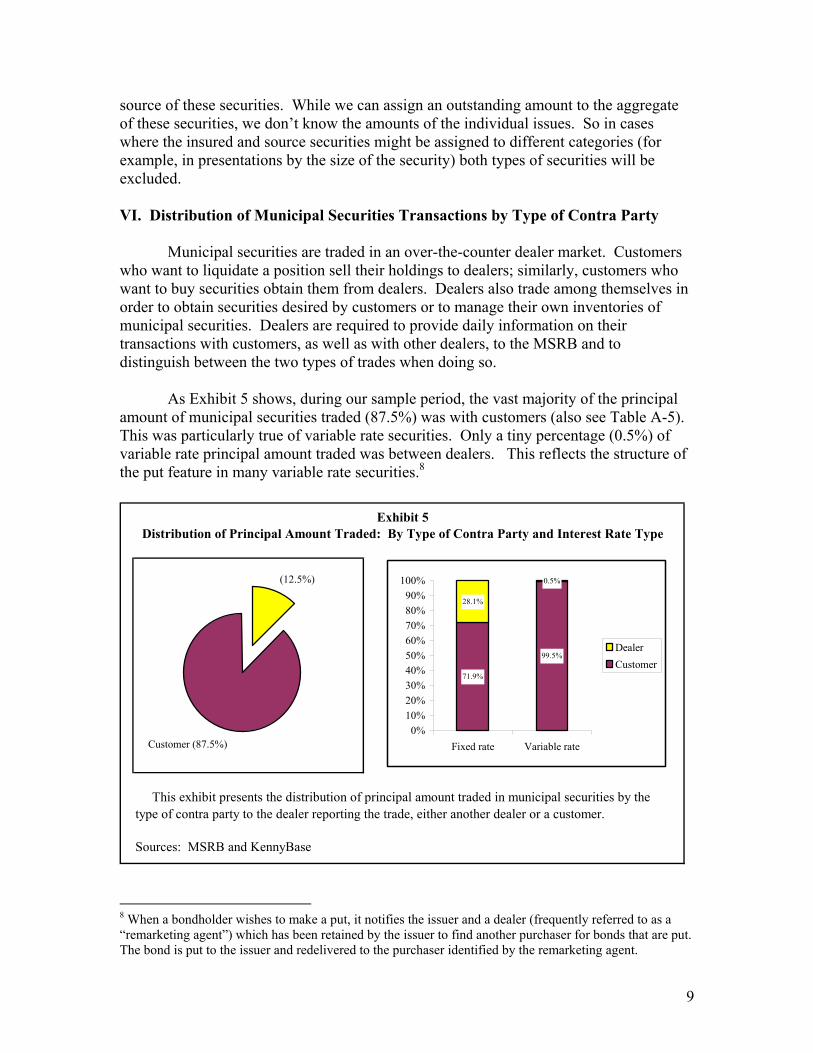
VI. Distribution of Municipal Securities Transactions by Type of Contra Party
Municipal securities are traded in an over-the-counter dealer market. Customers who want to liquidate a position sell their holdings to dealers; similarly, customers who want to buy securities obtain them from dealers. Dealers also trade among themselves in order to obtain securities desired by customers or to manage their own inventories of municipal securities. Dealers are required to provide daily information on their transactions with customers, as well as with other dealers, to the MSRB and to distinguish between the two types of trades when doing so.
As Exhibit 5 shows, during our sample period, the vast majority of the principal amount of municipal securities traded (87.5%) was with customers (also see Table A-5). This was particularly true of variable rate securities. Only a tiny percentage (0.5%) of variable rate principal amount traded was between dealers. This reflects the structure of the put feature in many variable rate securities.8
Sources: MSRB and KennyBase
Exhibit 5Distribution of Principal Amount Traded: By Type of Contra Party and Interest Rate Type
This exhibit presents the distribution of principal amount traded in municipal securities by the type of contra party to the dealer reporting the trade, either another dealer or a customer.
(12.5%)
Customer (87.5%)
71.9%
99.5%
28.1%
0.5%
0%10%20%30%40%50%60%70%80%90%
100%
Fixed rate Variable rate
DealerCustomer
8 When a bondholder wishes to make a put, it notifies the issuer and a dealer (frequently referred to as a “remarketing agent”) which has been retained by the issuer to find another purchaser for bonds that are put. The bond is put to the issuer and redelivered to the purchaser identified by the remarketing agent.
9

This was not the case for fixed rate securities. Dealers may have to go to other dealers to buy or sell fixed rate securities for their customers, or to lay off inventory they have acquired. As a result, inter-dealer trades accounted for over a quarter of the principal amount of fixed rate securities traded.
VII. Dealer Participation in Municipal Securities Transactions Over 1,600 dealers traded municipal securities with customers. But over half of the principal amount of municipal securities traded involved five very large dealers (see Exhibit 6). Thirteen dealers accounted for three-quarters of the principal amount of customer trades. The dominant retail firms in the municipal securities industry are, for the most part, very large full-service securities firms that engage in a wide variety of securities activities including underwriting stocks and bonds, market-making in over-the-counter equity securities, and retailing listed equities. Selling municipal securities is only a small part of their businesses.
Source: MSRB
Exhibit 6Distribution of Customer Principal Amount Traded in Municipal Securities: By Dealer
Municipal securities dealers were sorted (high to low) by their principal amount traded with customers and aggregated as shown.
175 DealersRank 44-218 (8.8%)
Thirty DealersRank 14-43 (14.2%)
Eight DealersRank 6-13 (21.4%)
Five Largest Dealers (54.5%)
Remaining 1,397 Dealers (1%)
Inter-dealer trades typically have as their source an accommodation for customers; dealers purchase securities from other dealers in order to fill customer orders. The inter-dealer trades of some firms typically are part of a riskless principal trade, where the security has been purchased, for example, for delivery in an already arranged sale to a customer. Other firms maintain substantial inventories that they can use to satisfy customer demand as well as demand from other dealers. A few firms specialize in accommodating the customer trades of other dealers. They report very few or no customer transactions, but frequently trade from inventory with other dealers.
10

By far the largest presence on the inter-dealer side, however, are “brokers’ brokers.” These firms effectively act as agents for other municipal securities dealers, finding buyers for parties interested in selling, and sellers for those interested in buying. They do not hold inventory overnight, but instead make daily “roundtrip” transactions. Here, we have defined brokers’ brokers as dealers that resold over 90% of their purchases on the same day they bought the security, did no customer trades,9 and were involved in transactions with an aggregate principal amount of at least $1 billion during the sample period. There were 16 such firms. Brokers’ brokers were on one side of trades accounting for 56% of the inter-dealer principal amount traded during the sample period. No one broker dominated this business (see Exhibit 7).
Source: MSRB
Exhibit 7 Distribution of Inter-Dealer Trading in Municipal Securities: By Brokers' Broker
This exhibit presents the percentage of inter-dealer principal value traded by brokers' brokers that was transacted by each of the 16 brokers' brokers. For example, the left-most column indicates that the most active brokers' broker accounted for about 22% of the total inter-dealer trading of all brokers' brokers. The right-most column indicates that the least active brokers' broker accounted for about one percent of the total.
0%
5%
10%
15%
20%
25%
1 2 3 4 5 6 7 8 9 10 11 12 13 14 15 16Largest
brokers' brokerSmallest
brokers' brokerIndividual Brokers' Brokers Sorted Large to Small
VIII. Size of Municipal Securities Transactions
The median size of all municipal securities trades during our period was $30,000 (see Table A-6). That is, half of all transactions had a principal amount of $30,000 or less, while half had a principal amount of $30,000 or more. The mean (average) trade size was much larger, about $376,000.
Transaction size varied by coupon type and contra party (see Exhibit 8). Trades in fixed rate securities were much smaller, on average, than were trades in variable rate
11
9 We have included one dealer that reported three customer transactions out of 18,000 total trades.

securities. While the median principal amount of trades in fixed rate securities was $25,000, that for variable rate securities was over $1 million. This reflects the large number of small transactions in fixed rate securities with retail investors, whereas the principal buyers and sellers of variable rate securities are institutions.
Sources: MSRB and KennyBase
Exhibit 8Median Size of Trades in Municipal Securities
(Dollars of Principal Amount)
This exhibit shows the median trade size of transactions in municipal securities, classified by the interest rate type and the type of contra party to the dealer reporting the trade.
$25,000 $25,000 $50,000
$1,100,000$1,170,000
$170,000
$0
$200,000
$400,000
$600,000
$800,000
$1,000,000
$1,200,000
$1,400,000
All Trades Customer Dealer All Trades Customer Dealer
Med
ian
Tra
de S
ize
Fixed Rate Securities Variable Rate Securities
Inter-dealer trades in fixed rate securities typically were larger than trades with customers. The median customer trade in a fixed rate security was for a principal amount of $25,000; the median inter-dealer trade was for $50,000. Variable rate securities showed the opposite pattern. The median size of the few inter-dealer trades in these securities was only $170,000 compared to a median of about $1.2 million if the trade was with a customer. Exhibits 9 and 10 present the distribution of customer trades in municipal securities by the size of the transaction and the type of security. (See Table A-7 for the distribution of dealer trades.) As the exhibits show, a substantial percentage of customer trades in fixed rate securities were small. About 87% were for $100,000 or less. Only 2% were for more than $1 million. The largest transactions, however, accounted for the vast majority of principal amount traded. About 60% of principal amount traded was in trades of more than $1 million. Trades of more than $100,000 accounted for 83% of principal amount traded.
12

Sources: MSRB and KennyBase
Sources: MSRB and KennyBase
This exhibit shows the distribution of customer trades and principal value traded, by the size (principal amount) of the trade.
This exhibit shows the distribution of customer trades and principal value traded, by the size (principal amount) of the trade.
Exhibit 9Distribution of Customer Trades in Fixed Rate Securities: By Trade Size
Number of Trades Principal Amount Traded
Number of Trades Principal Amount Traded
Exhibit 10Distribution of Customer Trades in Variable Rate Securities: By Trade Size
Over $10M (0.1%)
$1M - $10M (2.2%)
$100K - $1M (11.0%)
$5K or Less (10.3%)
$25K - $100K (30.2%)
$5K - $25K (46.2%)
$5K or Less (0.3%)
$5K - $25K (4.9%)
Over $10M (16.1%) $25K - $100K
(11.4%)
$1M - $10M (44.0%)
$100K - $1M (23.3%)
$5K or Less (1.5%) $5K - $25K
(4.8%)
$25K - $100K (12.1%)
Over $10M (7.5%)
$1M - $10M (44.1%)
$100K - $1M (30.0%)
$100K or Less (0.3%) $100K - $1M
(4.8%)Over $10M (44.1%)
$1M - $10M (50.8%)
13

Virtually the entire principal amount traded in variable rate securities with customers was the result of large trades. While trades of $100,000 or less accounted for about 18% of trades, they comprised less than 1% of principal amount traded. Over half of transactions and 95% of principal amount traded were in trades of more than $1 million. The distribution of customer trades in fixed rate securities by trade size varied by the age of the security. Exhibit 11 and Table A-8 show the distribution of customer trades by trade size and the security’s dated date. Trades of $100,000 principal amount or less likely are disproportionately retail transactions. Larger trades likely are disproportionately institutional trades. As the exhibit shows, retail clients seem more likely than institutional ones to purchase older securities. For example, about 11% of dealer sales to customers of securities with a dated date in 2000 were for $100,000 or less. By contrast, about 29% of dealer sales to customers of securities with a dated date in 1996 were for $100,000 or less.
Sources: MSRB and KennyBase
This exhibit shows the percentage that dealer purchases (sales) of fixed rate securities from (to) customers with a principal amount of $100,000 or less comprised of all dealer purchases (sales) from (to) customers, by the security's dated date.
Exhibit 11Percent of Customer Principal Value Traded in Transactions of $100,000 or Less
Fixed Rate Securities: By Dated Date
Purchases From Customers Sales to Customers
25.5%
20.4%19.6%
13.7%12.5%
9.7%11.3%
6.3%
2.4%
0.0%
5.0%
10.0%
15.0%
20.0%
25.0%
30.0%
1980
-1984
1985
-1989
1990
-1994
1995
1996
1997
1998
1999
2000
Dated Date
29.3%
26.2%28.3%28.2%29.2%
25.1%25.6%
17.1%
11.3%
0.0%
5.0%
10.0%
15.0%
20.0%
25.0%
30.0%
1980
-1984
1985
-1989
1990
-1994
1995
1996
1997
1998
1999
2000
Dated Date
This pattern was more powerful for dealer purchases, with the percentage of small purchases from customers increasing sharply with the security’s age. For example, only 2% of dealer purchases from customers of securities with a dated date of 2000 were small trades, compared to 12% for securities with a dated date in 1996, and 26% for securities
14

with a dated date in the early 1980s. This is consistent with a “buy-and-hold” investment strategy for retail investors. IX. Distribution of Municipal Offerings by Size and Transaction Activity In this section we present data on offerings, or the collection of securities that were part of the same issuance. When categorizing offerings by size we have used the issuance offering amount. If there are zero coupon bonds included in the offering, the issuance offering amount will be smaller than the aggregate of the principal amounts of all securities originally in the offering. Our measure of the value of outstanding municipal securities in an offering is the principal amount of the remaining securities.
The KennyBase includes fields for the issuance offering amount and the dated date. It is unlikely that an issuer would have more than one issuance with the same dated date for the same amount. So we define the components of an offering as the securities that share the same issuer (six-digit CUSIP), dated date, and issuance offering amount. The issuance offering amount was not provided in about 10% of the records. For these records, issues were defined using issuer and dated date only.
Exhibit 12 and Table A-9 present the distribution of municipal offerings and transaction activity by the size of the offering and transaction activity. About two-thirds of offerings had an issuance offering amount of $10 million or less. These small offerings accounted for a little over 6% of principal amount traded. About half of the principal amount traded over the sample period was in the 5% of offerings that had an issuance offering amount of more than $100 million.
Sources: MSRB, KennyBase and Bloomberg
This exhibit shows the distribution of municipal offerings (defined as securities that were part of the same original offering) by the size of the offering issuance amount and by their principal amount traded.
Distribution of Outstanding OfferingsBy Offering Issuance Amount
Distribution of Principal Amount TradedBy Offering Issuance Amount
Distribution of Municipal Offerings Outstanding and Transactions: By Offering Issuance AmountExhibit 12
$10M - $100M (27.9%)
Over $100M (5.1%)
$1M - $10M (51.5%)
$1 M or less (15.6%) Over
$100M (49.0%)
$10M - $100M
(44.7%)
$1M - $10M (6.1%)
$1 M or less (0.2%)
15

Exhibit 13 shows the distribution of offerings by the number of trades in the securities comprising the offering. Only offerings with securities outstanding on both December 12, 1999 and November 5, 2000 are included in this exhibit. In addition, only transactions between December 12, 1999 and October 31, 2000 are included. This allows for an analysis of transactions in offerings that had securities to trade during the entire period. Over 40% of offerings experienced no transactions during this period. About 9% of offerings had more than 100 trades, and these transactions accounted for almost three-quarters of the principal amount traded.
Number of Transactions in Offering's Securities
Sources: MSRB, KennyBase and Bloomberg
This exhibit shows the distribution of municipal offerings (defined as securities that were part of the same original offering) and principal amount traded in their component securities, by the number of transactions in the securities comprising the offering. Offerings are those with securities outstanding on December 12, 1999 and November 5, 2000. Transactions are those between December 12, 1999 and October 31, 2000.
Distribution of Outstanding Offerings by the Distribution of Principal Amount Traded by theNumber of Transactions in Offering's Securities
Exhibit 13Distribution of Municipal Offerings Outstanding and Transactions: By Number of Transactions
1-5 (14.3%)
26-100 (14.1%)
5-25 (20.4%)
None (42.6%)
Over 100 (8.6%)
1-5 (1.4%)
5-25 (6.1%)
Over 100 (74.6%)
26-100 (17.8%)
X. Distribution of Municipal Issuers by Principal Amount and Transaction Activity
In this section we categorize issuers by the principal amount of their outstanding municipal securities and by transaction activity in their securities. Issuers are defined using the first six-digits of the CUSIP number. Each six-digit CUSIP number is considered to be a separate issuer.10 Exhibit 14 and Table A-10 presents the distribution of outstanding municipal securities and transaction activity by the principal amount of the issuer’s outstanding securities. Most municipal issuers had a small principal amount outstanding. Almost
16
10 In actuality, some very active issuers span more than one 6-digit CUSIP.

two-thirds of municipal issuers had $10 million or less in securities outstanding. Only 7% of issuers had $100 million or more in securities outstanding. However, this latter group was responsible for the vast majority of the principal amount of securities traded (84%).
Sources: MSRB, KennyBase and Bloomberg
This exhibit shows the distribution of issuers and the distribution of their principal amount traded, by the size of the issuer's principal amount outstanding.
Exhibit 14Distribution of Municipal Issuers and Transactions: By Issuer's Principal Amount Outstanding
Distribution of Principal Amount Tradedby Issuer's Principal Amount Outstanding
Distribution of Municipal Issuersby Issuer's Principal Amount Outstanding
$10M - $100M (29.5%)
$100M - $1B
(6.3%)
Over $1B (0.9%)
$1M - $10M (45.6%)
$1 M or less (17.7%)
Over $1B (45.3%)
$10M - $100M (14.1%)
$100M - $1B (38.5%)
$10M or less (2.1%)
Exhibit 15 presents the distribution of issuers by the number of municipal securities they had outstanding.11 About half of all issuers had 10 or fewer securities outstanding. Three percent had 100 or more securities outstanding. About 46% of the principal amount of securities traded was in the securities of these latter issuers. Exhibit 16 shows the distribution of issuers by the number of trades in their securities. The outstanding securities and transactions in this exhibit are limited to issuers with securities outstanding on both December 12, 1999 and November 5, 2000. Only transactions between December 12, 1999 and October 31, 2000 are included. This allows for an analysis of transactions in the securities of issuers that had securities to trade during the entire period. As Exhibit 16 shows, one-third of issuers had no trades in their securities during this ten and a half month period. Two-thirds of all issuers had 25 or fewer trades in their securities. Only 2% of issuers had 1,000 or more trades in their securities. These latter issuers accounted for two-thirds of the principal amount traded.
17
11 Note that defeased bonds are considered to be “outstanding”.
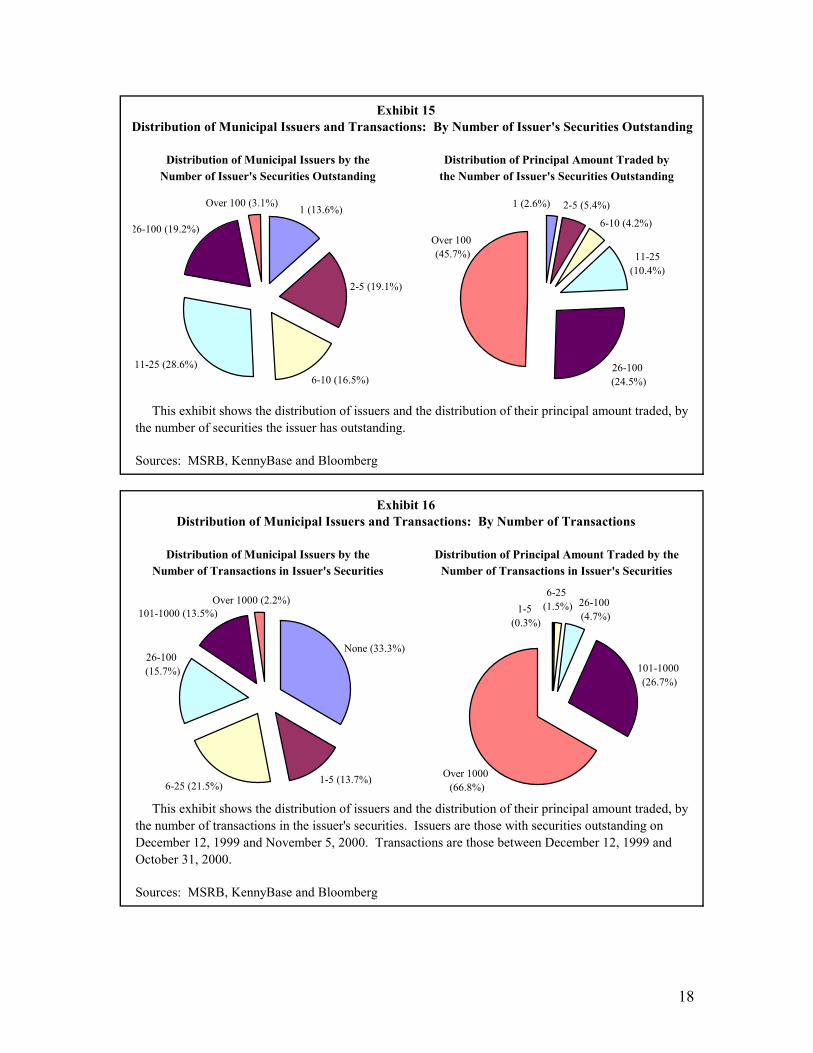
Sources: MSRB, KennyBase and Bloomberg
Sources: MSRB, KennyBase and Bloomberg
This exhibit shows the distribution of issuers and the distribution of their principal amount traded, by the number of transactions in the issuer's securities. Issuers are those with securities outstanding on December 12, 1999 and November 5, 2000. Transactions are those between December 12, 1999 and October 31, 2000.
Distribution of Municipal Issuers by theNumber of Issuer's Securities Outstanding
Distribution of Principal Amount Traded bythe Number of Issuer's Securities Outstanding
Distribution of Municipal Issuers by theNumber of Transactions in Issuer's Securities
Distribution of Principal Amount Traded by theNumber of Transactions in Issuer's Securities
Exhibit 16Distribution of Municipal Issuers and Transactions: By Number of Transactions
Exhibit 15Distribution of Municipal Issuers and Transactions: By Number of Issuer's Securities Outstanding
This exhibit shows the distribution of issuers and the distribution of their principal amount traded, by the number of securities the issuer has outstanding.
1 (13.6%)
2-5 (19.1%)
6-10 (16.5%)11-25 (28.6%)
26-100 (19.2%)
Over 100 (3.1%)
Over 100 (45.7%)
26-100 (24.5%)
11-25(10.4%)
6-10 (4.2%)
2-5 (5.4%)1 (2.6%)
None (33.3%)
1-5 (13.7%)6-25 (21.5%)
101-1000 (13.5%)Over 1000 (2.2%)
26-100 (15.7%) 101-1000
(26.7%)
Over 1000 (66.8%)
6-25 (1.5%)1-5
(0.3%)
26-100 (4.7%)
18

XI. Distribution of Municipal Securities by Principal Amount and Transaction Activity
Municipal securities vary substantially in size. There are numerous serial bonds with principal amounts of less than $100,000, and several term bonds with principal amounts in excess of $1 billion. Exhibit 17 and Table A-11 present the distribution of municipal securities outstanding and transactions in municipal securities by the size of the security.
Sources: MSRB, KennyBase and Bloomberg
Exhibit 17
Distribution of Outstanding SecuritiesBy Principal Amount Outstanding
Distribution of Principal Amount TradedBy Principal Amount Outstanding
This exhibit shows the distribution of municipal securities and the distribution of their principal amount traded, by the principal amount outstanding of the security.
Distribution of Municipal Securities Outstanding and TransactionsBy Principal Amount Outstanding
$10M - $100M (3.8%) Over $100M
(0.1%)$1M - $10M (22.3%)
$1M or Less (73.8%)
$10M - $100M (58.5%)
Over $100M (17.4%)
$1M or Less (3.8%)
$1M - $10M (20.3%)
Almost three-quarters of municipal securities have principal amounts of $1
million or less. These small securities accounted for about 4% of the principal amount traded. About 4% of municipal securities have principal amounts of $10 million or more. These larger securities were responsible for about three-quarters of the principal amount traded. A small minority of municipal securities account for the majority of trading. Exhibit 18 shows the distribution of securities by the number of trades. The securities in this exhibit are limited to those outstanding on both December 12, 1999 and November 5, 2000. Only transactions between December 12, 1999 and October 31, 2000 are included. This allows for an analysis of transactions in securities that were available to trade during the entire period. About 70% of municipal securities did not trade during this ten and a half month period. Another 15% traded five or fewer times. Less than 1% of securities
19

traded more than one hundred times. These latter securities accounted for about half of the principal amount traded.
Sources: MSRB, KennyBase and Bloomberg
Distribution of Principal Amount Tradedby the Number of Transactions in Security
Exhibit 18Distribution of Municipal Securities Outstanding and Transactions: By Number of Transactions
This exhibit shows the distribution of municipal securities and the distribution of their principal amount traded, by the number of transactions in the security. Only securities in existence on December 12, 1999 and November 5, 2000 are included. Transactions are those between December 12, 1999 and October 31, 2000.
Distribution of Outstanding Securitiesby the Number of Transactions in Security
None (70.5%)
26-100 (3.0%)
Over 100 (0.6%)
5-25 (10.9%)
1-5 (14.9%)
1-5 (5.1%)5-25
(15.4%)
26-100 (29.0%)
Over 100 (50.5%)
Exhibit 19 and Table A-12 compare the outstanding principal amount and that
traded of variable rate and fixed rate municipal securities. Variable rate securities are much larger, on average, than are fixed rate securities. For example, about three-quarters of fixed rate securities had an outstanding principal amount of $1 million or less. By contrast, 13% of variable rate securities had an outstanding principal amount of $1 million or less. About 35% of variable rate securities had an outstanding principal amount of $10 million or more, while only 3% of fixed rate securities were that large.
Exhibit 20 and Table A-12 show the same pattern for transaction activity. While
8% of the principal amount traded of fixed rate securities was in securities with an outstanding principal amount of $1 million or less, trading in variable rate securities of this size was negligible. About 55% of trading in fixed rate securities was in securities with an outstanding principal amount of more than $10 million; this compares to 94% for variable rate securities.
20

Sources: KennyBase and Bloomberg
Sources: MSRB, KennyBase and Bloomberg
Distribution of Principal Amount TradedBy Interest Rate Type and Security's Principal Amount Outstanding
This exhibit presents the distribution of the principal amount of fixed rate and variable rate municipal securities traded by the principal amount outstanding of the security.
Exhibit 19Distribution of Municipal Securities Outstanding: By Interest Rate Type and Size
This exhibit presents the distribution of fixed rate and variable rate securities, by the principal amount outstanding of the securities.
Exhibit 20
74.9%
21.8%
3.3%0.1%
13.5%
51.9%
33.0%
1.6%0%
10%
20%
30%
40%
50%
60%
70%
80%
$1M or Less $1M - $10M $10M - $100M Over $100M
Perc
ent O
f Sec
uriti
es O
utst
andi
ng
Fixed RateVariable Rate
Principal Amount Outstanding
8.0%
36.7%
45.3%
10.0%
0.2%6.2%
69.8%
23.8%
0%
10%
20%
30%
40%
50%
60%
70%
80%
$1M or Less $1M - $10M $10M - $100M Over $100M
Perc
ent O
f Pri
ncip
al A
mou
nt T
rade
d
Fixed RateVariable Rate
Principal Amount Outstanding
21

XII. Distribution of Municipal Securities by Insured Status Issuers may choose to have their securities insured when they are offered. The insurance company contracts to pay debt service on the securities when due, in the event of a payment default. In the vast majority of instances, the resulting Moody’s credit rating is Aaa. Since insurance reduces the credit risk to investors, issuers can offer a lower interest rate. Factors in the issuer’s decision to insure a bond include a comparison of the cost of insurance with the present value of the reduced interest rate. Exhibit 21 and Tables A-13 and A-14 present data on the characteristics of municipal securities by their insured status. About 40% of municipal securities (46% of the outstanding principal amount) are insured. Virtually all insured securities were rated Aaa by Moody’s. About 85% of Aaa-rated securities, representing 80% of outstanding principal amount, were insured.
Sources: MSRB, KennyBase and Bloomberg
Exhibit 21Distribution of Aaa-Rated Municipal Securities: By Insured Status
This exhibit shows the distribution of municipal securities rated Aaa by Moody's and their transactions, by whether the security was insured.
0%10%20%30%40%50%60%70%80%90%
100%
Fixed R
ate
Variab
le Rate
Fixed R
ate
Variab
le Rate
Fixed R
ate
Variab
le Rate
Fixed R
ate
Variab
le Rate
Perc
ent I
nsur
ed a
nd U
nins
ured
Not InsuredInsured
Securities Outstanding TransactionsNumber of Securities Principal Amount Number of Trades Principal Amount
Variable rate securities were much less likely to be insured than were fixed rate
securities. This may be attributed to the common use of direct pay letters of credit issued by banks to secure variable rate securities, in which case the securities receive the same rating as the bank. Only 10% of variable rate securities were insured, compared to 40% of fixed rate securities. Insured securities accounted for only 60% of variable rate Aaas, compared to 85% of fixed rate Aaas.
22
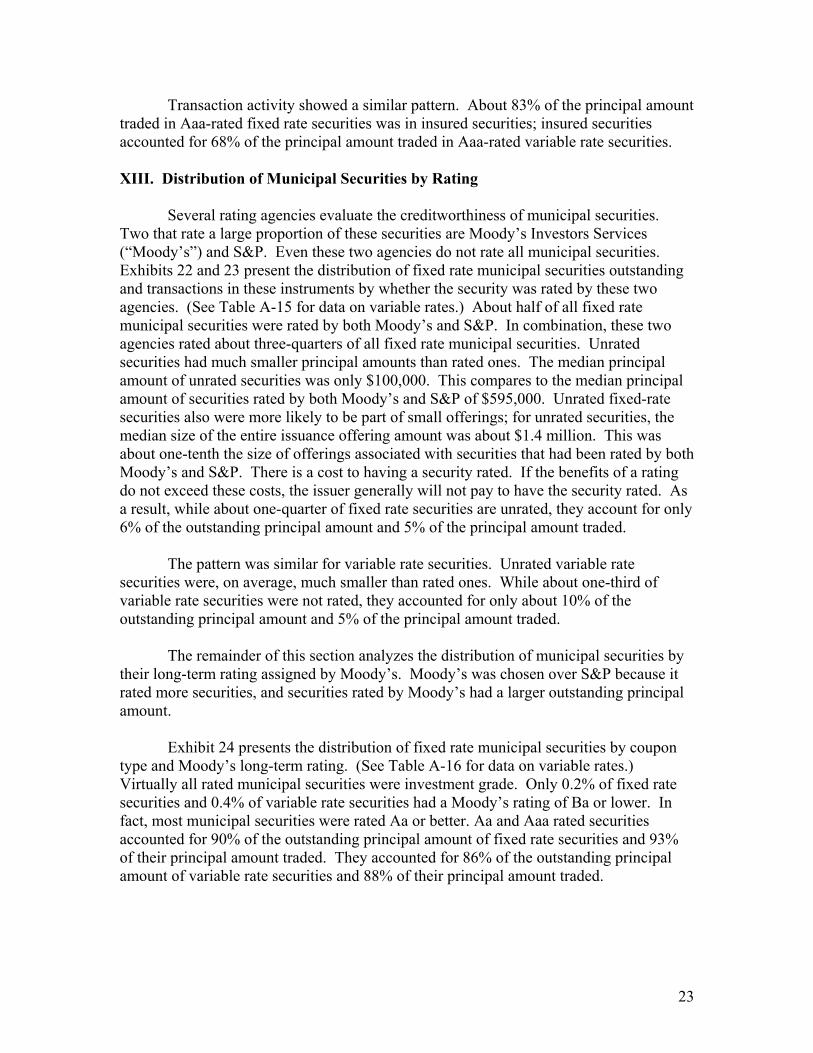
Transaction activity showed a similar pattern. About 83% of the principal amount traded in Aaa-rated fixed rate securities was in insured securities; insured securities accounted for 68% of the principal amount traded in Aaa-rated variable rate securities. XIII. Distribution of Municipal Securities by Rating Several rating agencies evaluate the creditworthiness of municipal securities. Two that rate a large proportion of these securities are Moody’s Investors Services (“Moody’s”) and S&P. Even these two agencies do not rate all municipal securities. Exhibits 22 and 23 present the distribution of fixed rate municipal securities outstanding and transactions in these instruments by whether the security was rated by these two agencies. (See Table A-15 for data on variable rates.) About half of all fixed rate municipal securities were rated by both Moody’s and S&P. In combination, these two agencies rated about three-quarters of all fixed rate municipal securities. Unrated securities had much smaller principal amounts than rated ones. The median principal amount of unrated securities was only $100,000. This compares to the median principal amount of securities rated by both Moody’s and S&P of $595,000. Unrated fixed-rate securities also were more likely to be part of small offerings; for unrated securities, the median size of the entire issuance offering amount was about $1.4 million. This was about one-tenth the size of offerings associated with securities that had been rated by both Moody’s and S&P. There is a cost to having a security rated. If the benefits of a rating do not exceed these costs, the issuer generally will not pay to have the security rated. As a result, while about one-quarter of fixed rate securities are unrated, they account for only 6% of the outstanding principal amount and 5% of the principal amount traded. The pattern was similar for variable rate securities. Unrated variable rate securities were, on average, much smaller than rated ones. While about one-third of variable rate securities were not rated, they accounted for only about 10% of the outstanding principal amount and 5% of the principal amount traded.
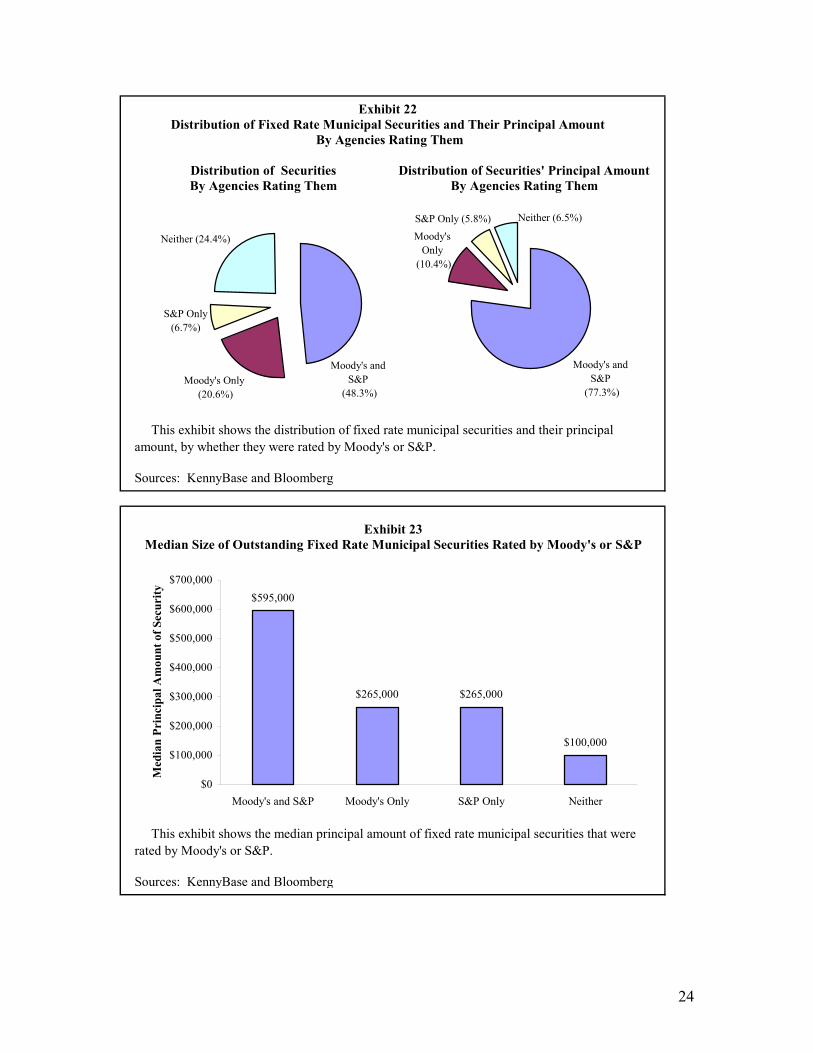
The remainder of this section analyzes the distribution of municipal securities by their long-term rating assigned by Moody’s. Moody’s was chosen over S&P because it rated more securities, and securities rated by Moody’s had a larger outstanding principal amount. Exhibit 24 presents the distribution of fixed rate municipal securities by coupon type and Moody’s long-term rating. (See Table A-16 for data on variable rates.) Virtually all rated municipal securities were investment grade. Only 0.2% of fixed rate securities and 0.4% of variable rate securities had a Moody’s rating of Ba or lower. In fact, most municipal securities were rated Aa or better. Aa and Aaa rated securities accounted for 90% of the outstanding principal amount of fixed rate securities and 93% of their principal amount traded. They accounted for 86% of the outstanding principal amount of variable rate securities and 88% of their principal amount traded.
23
Sources: KennyBase and Bloomberg
Sources: KennyBase and Bloomberg
Exhibit 23Median Size of Outstanding Fixed Rate Municipal Securities Rated by Moody's or S&P
This exhibit shows the median principal amount of fixed rate municipal securities that were rated by Moody's or S&P.
By Agencies Rating Them
This exhibit shows the distribution of fixed rate municipal securities and their principal amount, by whether they were rated by Moody's or S&P.
Distribution of Fixed Rate Municipal Securities and Their Principal AmountExhibit 22
Distribution of SecuritiesBy Agencies Rating Them
Distribution of Securities' Principal AmountBy Agencies Rating Them
S&P Only (6.7%)
Neither (24.4%)
Moody's and S&P
(48.3%)Moody's Only
(20.6%)
Moody'sOnly
(10.4%)
S&P Only (5.8%) Neither (6.5%)
Moody's and S&P
(77.3%)
$595,000
$265,000 $265,000
$100,000
$0
$100,000
$200,000
$300,000
$400,000
$500,000
$600,000
$700,000
Moody's and S&P Moody's Only S&P Only Neither
Med
ian
Prin
cipa
l Am
ount
of S
ecur
ity
24
Sources: MSRB, KennyBase and Bloomberg
This exhibit shows the distribution of municipal securities and the distribution of their principal amount traded, by the Moody's long-term rating of the security.
Exhibit 24Distribution of Fixed Rate Municipal Securities Rated by Moody's
Distribution of Outstanding SecuritiesBy Security's Rating
Distribution of Principal Amount TradedBy Security's Rating
By Moody's Long-term Rating
Aa(18.4%)
A (10.7%)
Baa (3.7%) Not investment grade (0.2%)
Aaa (66.9%) Aaa (71.1%)
Baa (2.5%)Not
investment grade (0.4%)A (3.9%)
Aa (22.1%)
Variable rate securities were less likely than fixed rate securities to be rated Aaa, and more likely to be rated Aa. Municipal security ratings were very stable during our sample period. There were about 372,000 fixed coupon municipal securities with Aaa ratings in our December 12, 1999 snapshot that were still outstanding on November 5, 2000. Only 430 of these securities, or a little over 0.1%, had been downgraded by November 5, most to Aa. Similarly, there were about 375,000 fixed coupon securities with Aaa ratings in our November 5, 2000 snapshot that also had a rating on December 12, 1999. About 2,900 of these securities, or about 0.8%, had been upgraded to Aaa during this period. Most had originally been Aa. XIV. Distribution of Municipal Securities by Maturity Municipal securities typically are long-term instruments (see Exhibits 25 – 26 and Tables A-17 – A-18). Less than 1% of municipal securities had an initial maturity of one year or less while almost 60% had an initial maturity of more than ten years. Principal amount outstanding and traded are even more heavily weighted towards long-term securities. About 82% of the outstanding principal amount and 85% of the principal amount traded were in securities with initial maturities of more than ten years. Variable rate securities are particularly likely to be issued with long maturities. Over half of these securities accounting for three-quarters of the outstanding principal amount had initial maturities of more than twenty years. By contrast, only 12% of fixed rate securities with
25

40% of outstanding principal amount had initial maturities of more than 20 years. Variable rate securities’ floating interest rates and put features reduce the interest rate risk associated with long term maturities.
Sources: MSRB, KennyBase and Bloomberg
Sources: KennyBase and Bloomberg
Exhibit 26Distribution of Municipal Securities: By Interest Rate Type and Original Maturity
This exhibit shows the distribution of fixed rate securities and variable rate securities, by their original maturity.
This exhibit shows the distribution of securities and the distribution of their principal amount traded, by the security's original maturity.
Exhibit 25Distribution of Municipal Securities Outstanding and Transactions: By Original Maturity
Distribution of Outstanding SecuritiesBy Original Maturity
Distribution of Principal Amount TradedBy Original Maturity
1 yr or less (0.5%) 1-5 yrs (10.0%)Over 20 yrs
(12.9%)
10-20 yrs (46.7%)
5-10 yrs (30.0%)
1-5 yrs (3.8%)5-10 yrs (8.7%)
1 yr or less (2.4%)
10-20 yrs (23.9%)
Over 20 yrs (61.2%)
1%
10%
30%
47%
12%
0% 1%6%
36%
57%
0%
10%
20%
30%
40%
50%
60%
70%
1 yr or less 1-5 yrs 5-10 yrs 10-20 yrs Over 20yrs
Perc
ent o
f All
Inte
rest
Rat
e T
ype
Fixed rateVariable rate
26

The distribution of municipal securities by years remaining to maturity is, of course, more weighted towards the short end than that of original maturity. Almost 10% of municipal securities outstanding were scheduled to mature within the next year. Only 27% were scheduled to mature in more than ten years. In Table A-17, we have defined the maturity of an offering as that of the longest maturing security in the offering still outstanding. Offerings have much longer maturities than securities. Over 85% of offerings contain at least one security with a maturity of more than ten years. XV. Distribution of Municipal Securities by Sources of Repayment Municipal securities can be broadly classified as general obligation bonds, revenue bonds, or double barrel bonds. General obligation bonds are backed by the full faith and credit of the issuer. In contrast, the funds used to pay debt service on revenue bonds are limited to specific sources; the securities are secured by this revenue source or sources alone. For example, securities used to finance a highway might be repaid from the stream of toll income. Double barrel bonds have characteristics of both revenue and general obligation instruments. A double barrel bond is secured with a particular revenue stream or streams, frequently those available from a project related to the security issue. If these revenues prove inadequate to service the debt, a government unit is expected to use its resources, including its taxing power, to make up the shortfall. Exhibits 27 and 28 and Table A-19 present the distributions of outstanding municipal securities and transactions, categorized by the source of repayment. About half of all municipal securities are general obligation bonds. But most of the principal amount outstanding and traded is in revenue bonds. Variable rate securities are predominantly revenue bonds. Revenue bonds accounted for about 92% of the outstanding principal amount of variable rate securities and 91% of the principal amount traded. XVI. Distribution of Municipal Securities by Conduit Status
Conduit offerings are offerings of municipal securities by a state or unit of local government or an agency or instrumentality of a state or local government (the “conduit issuer”) not issued for its own use, but to re-lend the proceeds to a private party or, less frequently, to another unit of government (the “conduit borrower”). The conduit borrower is obligated to make loan payments in the amounts and at the times necessary to pay the principal of and interest on the conduit offering as it becomes due. Generally a conduit issuer has no obligation to pay debt service on a conduit offering; it acts solely as a middleman that passes borrower payments along to the bondholders.
27

Sources: MSRB, KennyBase and Bloomberg
Sources: KennyBase and Bloomberg
This exhibit shows the distribution of municipal securities and the distribution of their principal amount traded, by the source of repayment.
Exhibit 27Distribution of Municipal Securities Outstanding and Transactions: By Source of Repayment
Distribution of Outstanding SecuritiesBy Source of Repayment
Distribution of Principal Amount TradedBy Source of Repayment
Exhibit 28Distribution of Principal Amount of Municipal Securities
This exhibit shows the distribution of the principal amount of municipal securities outstanding, by the interest rate type and source of repayment.
By Source of Repayment and Interest Rate Type
Double Barrel (4.7%)
General Obligation
(51.8%)
Revenue (43.5%)
Revenue (76.9%)
Double Barrel (2.7%) General
Obligation (20.3%)
3%
30%
67%
1%6%
93%
0%
10%
20%
30%
40%
50%
60%
70%
80%
90%
100%
Double Barrel General Obligation Revenue
Perc
ent o
f All
Rat
e T
ype
Fixed rateVariable rate
28

In most states, units of state and local government and their agencies and instrumentalities may issue conduit offerings. In essence, conduit offerings for private parties are corporate securities with the benefit of a tax-exempt interest rate. Conduit offerings for the benefit of governmental conduit borrowers are frequently bond pools, which provide lower costs of issuance, some type of credit enhancement, such as a moral obligation pledge, or other benefit to multiple governmental conduit borrowers. The purposes for which conduit offerings may be issued are strictly limited by state law and federal tax law. 12 For example, certain not for profit corporations may borrow in this way to pay for new buildings and other capital improvements. Not for profit hospitals and museums are frequently financed in this way. Federal tax law also allows tax exempt conduit offerings to be issued to encourage economic development, provide rental housing for persons of low and moderate income, make low interest mortgage loans available to first time homeowners and a variety of other purposes. Securities that comprise conduit offerings (“conduit securities”) have varying security and terms; they may bear interest at fixed or variable rates and have short or long term maturities. They are frequently issued as variable rate bonds secured by the direct pay letter of credit of a bank.
Exhibit 29 and Table A-20 present the distribution of municipal securities and transactions in municipal securities by the conduit status of the security. Conduits are an important component of variable rate securities. Conduits comprised about 67% of variable rate securities and 52% of the principal amount traded. Conduits accounted for a much smaller proportion of fixed rate securities.
Sources: MSRB, KennyBase and Bloomberg
Exhibit 29Distribution of Municipal Securities Outstanding: By Conduit Status
This exhibit shows the distribution of outstanding municipal securities by whether the security was a conduit or not
0%
20%
40%
60%
80%
100%
Numberof
Securities
PrincipalAmountTraded
Numberof
Securities
PrincipalAmountTraded
Numberof
Securities
PrincipalAmountTraded
Perc
ent C
ondu
it an
d N
ot C
ondu
it
ConduitNot Conduit
All Securities Fixed-Rate Variable Rate
29
12 The Internal Revenue Code places many complex limits on offerings for non-governmental purposes. See Internal Revenue Code sections 103 and 141-150 and related regulations.

XVII. Distribution of Municipal Securities by Federal Income Tax Status
The primary distinction between municipal securities and other securities is the federal income tax exemption for interest on municipal securities. Exhibit 30 and Table A-21 present the distribution of outstanding municipal securities and transactions by whether the interest on the security was exempt from federal income taxes. The interest on the vast majority of municipal securities outstanding (98%) was exempt from federal income taxes. About 95% of the outstanding principal amount of municipal securities and 96% of the principal amount traded was in tax-exempt securities.
Sources: MSRB, KennyBase and Bloomberg
This exhibit shows the distribution of municipal securities and the distribution of their principal amount traded, by whether the security's interest was subject to federal income taxes.
Exhibit 30Distribution of Municipal Securities Outstanding and Transactions: By Federal Tax Status
Distribution of Outstanding SecuritiesBy Federal Tax Status
Distribution of Principal Amount TradedBy Federal Tax Status
Not taxable (97.6%)
Taxable (2.4%)
Not taxable (95.9%)
Taxable (4.1%)
XVIII. Spreads
Very few (about 1%) of the trades in fixed coupon municipal securities with customers during our sample period included a commission. Instead, dealers received compensation by, on average, selling municipal securities for a higher price than they purchased them for. The difference between the prices dealers pay for securities and those for which they sell them typically is referred to as the spread. The spread is generally interpreted as the “round trip cost” to customers of a trade.
We have estimated spreads for fixed coupon municipal securities by comparing
the average purchase and sell prices for fixed coupon securities bought and sold by
30
customers on the same day.13 We did this by identifying fixed coupon securities that were bought and sold by customers on the same day, and computing the average buy and sell prices for these securities on the relevant days. Spreads for each security-day meeting these criteria are the difference between the equally-weighted average price charged buyers minus the average price charged sellers. 14 Spreads for some security-days appeared too large or small to be anything but data errors, so we sorted security-days by the size of the spread and deleted observations with the largest and smallest 0.5% of spreads. This left us with about 473,000 security-days.
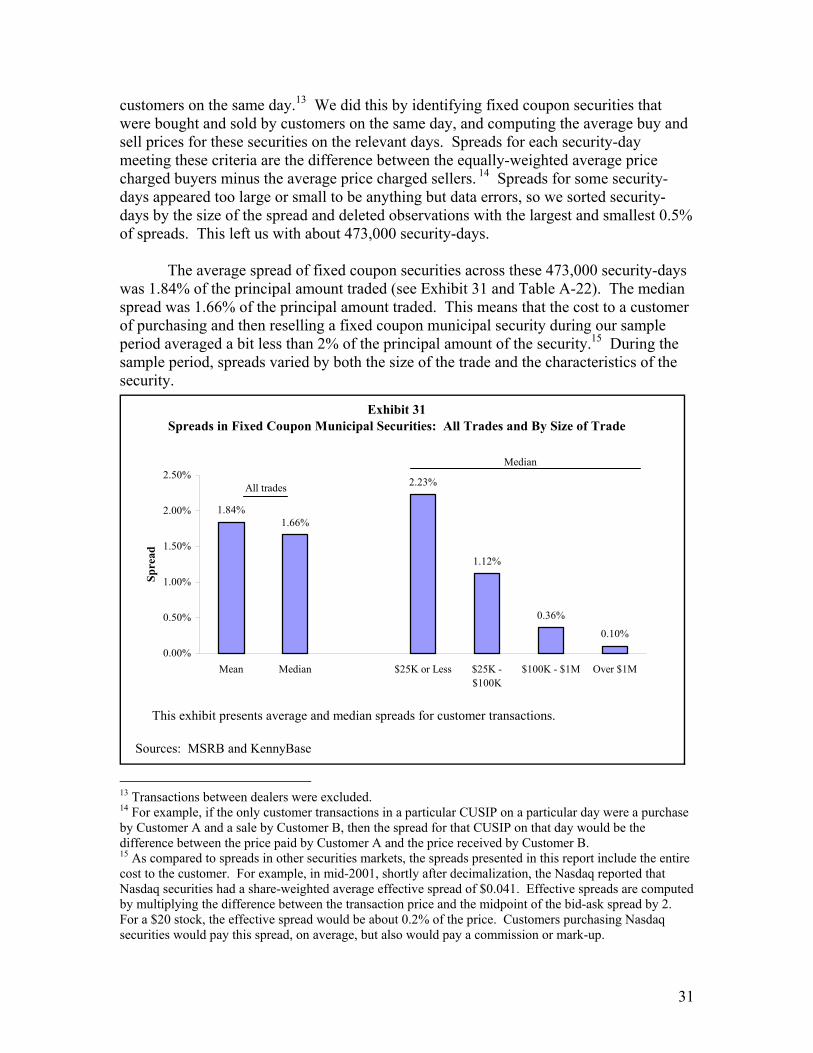
The average spread of fixed coupon securities across these 473,000 security-days
was 1.84% of the principal amount traded (see Exhibit 31 and Table A-22). The median spread was 1.66% of the principal amount traded. This means that the cost to a customer of purchasing and then reselling a fixed coupon municipal security during our sample period averaged a bit less than 2% of the principal amount of the security.15 During the sample period, spreads varied by both the size of the trade and the characteristics of the security.
This exhibit presents average and median spreads for customer transactions.
Sources: MSRB and KennyBase
Exhibit 31Spreads in Fixed Coupon Municipal Securities: All Trades and By Size of Trade
1.84%1.66%
2.23%
1.12%
0.36%
0.10%
0.00%
0.50%
1.00%
1.50%
2.00%
2.50%
Mean Median $25K or Less $25K -$100K
$100K - $1M Over $1M
Spre
ad
Median
All trades
13 Transactions between dealers were excluded. 14 For example, if the only customer transactions in a particular CUSIP on a particular day were a purchase by Customer A and a sale by Customer B, then the spread for that CUSIP on that day would be the difference between the price paid by Customer A and the price received by Customer B. 15 As compared to spreads in other securities markets, the spreads presented in this report include the entire cost to the customer. For example, in mid-2001, shortly after decimalization, the Nasdaq reported that Nasdaq securities had a share-weighted average effective spread of $0.041. Effective spreads are computed by multiplying the difference between the transaction price and the midpoint of the bid-ask spread by 2. For a $20 stock, the effective spread would be about 0.2% of the price. Customers purchasing Nasdaq securities would pay this spread, on average, but also would pay a commission or mark-up.
31

In order to examine the influence of trade size on spreads, we created four datasets using the methodology just described, but limiting trades to those with principal amounts of $25,000 or less; over $25,000 and less than or equal to $100,000; over $100,000 and less than or equal to $1 million; and over $1 million. The $25,000 or less dataset, for example, has as observations all instances where there was at least one customer purchase of principal amount of $25,000 or less and at least one customer sale of principal amount of $25,000 or less on the same day in the same security. The spread for each security-day is the difference in the average buy price and sell price of these small trades. As Exhibit 31 shows, spreads dropped sharply as trade size increased. While the median spread for trades of $25,000 or less was about 2.2% of the principal amount traded, trades of over $1 million were charged about 0.1%, on average.
Dealers typically charge for bearing risk. So we would expect that the riskier a
security, the higher the spread. We have considered only two risk components: time remaining to maturity and bond credit rating.
Everything else equal, the longer a security’s remaining maturity, the greater its
price volatility. So not unexpectedly, the remaining maturity of a security was an important predictor of its average spread. Exhibit 32 presents the median spreads for securities traded during our sample period, categorized by their remaining maturity. Securities with a remaining maturity of one year or less had median spreads of 0.47%. Those with a remaining maturity of more than 20 years averaged spreads of 2.62%. This pattern existed across all transaction size categories.
Sources: MSRB and KennyBase
Exhibit 32Spreads in Fixed Coupon Municipal Securities: By Remaining Maturity
This exhibit presents median spreads for customer trades in fixed coupon municipal securities, categorized by the remaining maturity at the time of the trade.
0.47%
1.00%1.20%
2.00%
2.62%
0.00%
0.50%
1.00%
1.50%
2.00%
2.50%
3.00%
1 year or less 1-5 years 5-10 years 10-20 years Over 20 years
Spre
ad
32

A security’s credit rating also is associated with its potential for price volatility. Securities with low ratings are more sensitive to new information about the issuer than are those with higher ratings. As Exhibit 33 shows, securities with high ratings typically had lower spreads than those with low ratings. For example, municipal securities that were uninsured and rated Aaa by Moody’s had a median spread of 1.03%. Securities that were rated A had median spreads of 1.75%. The exception to this pattern were triple-A insured securities. The spreads for these securities were comparable to those of single-As.
Sources: MSRB and KennyBase
Exhibit 33Spreads in Fixed Coupon Municipal Securities: By Moody's Rating
This exhibit presents median spreads for customer trades in fixed coupon municipal securities, categorized by the Moody's rating of the security.
1.03%
1.86%
1.20%
1.75%
2.18%
2.63%
0.00%
0.50%
1.00%
1.50%
2.00%
2.50%
3.00%
Aaa Not insured Aaa Insured Aa A Baa Not InvestmentGrade
Spre
ad
There was considerable variability in the spreads charged for apparently similar
securities. Exhibit 34 shows the distribution of spreads for transactions of more than $25,000 and less than or equal to $100,000 in securities rated Aa by Moody’s with remaining maturities of more than 10 years but less than or equal to 20 years. There were about 5,100 security-days that met these criteria. The median spread was about 1.4%. That is, in half of these trades, spreads were less than 1.4% and in the other half, spreads were more. About 30% of spreads were 0.50% or less. But about 14% of spreads were 3% or more. About 2% of spreads were more than 4.5%.
33

Sources: MSRB and KennyBase
This exhibit presents the distribution of spreads for customer trades in fixed coupon municipal securities rated Aa by Moody's with a remaining maturity of more than 10 years and less than or equal to 20 years. Only transactions greater than $25,000 and less than or equal to $100,000 are included.
Exhibit 34
Securities Rated Aa With Remaining Maturities Between 10 and 20 YearsTransaction Size of More than $25,000 and Less Than or Equal to $100,000
Distribution of Spreads in Fixed Coupon Municipal Securities
7.4%
22.3%
12.4% 12.5% 12.3%10.1% 9.4%
6.5%
3.8%
1.3% 1.9%
0%
5%
10%
15%
20%
25%
0% orLess
0% -0.50%
0.50% -1.00%
1.00% -1.50%
1.50% -2.00%
2.00% -2.50%
2.50% -3.00%
3.00% -3.50%
3.50% -4.00%
4.00% -4.50%
Over4.50%
Dis
trib
utio
n of
Spr
eads
XIX. Variability in Customer Transaction Prices
Customers purchasing (or selling) fixed coupon municipal securities frequently are charged substantially different prices than other customers purchasing (or selling) the same principal amount of the same security on the same day. Some variability in prices is not unexpected as it may reflect changing expectations regarding interest rates over the course of the day. But some of these price differences seem too large to have likely been the result of intra-day changes in interest rates. To quantify these price differences, we compared the lowest price dealers paid customers to buy a particular fixed coupon security on a given day with the highest price they paid customers to buy the same security. These high-low price differences were categorized by the size of the transaction; either $10,000, $50,000, $100,000, or $1 million principal amount. Differences were further categorized by whether only one dealer, or more than one dealer, purchased the security from a customer that day. Only security-days with two or more transactions were included. Security-days were sorted within each category by the size of the high-low price difference. The largest one percent were excluded in order to eliminate prices that clearly were erroneous. Exhibit 35 presents the results for dealer purchases from customers of $50,000 principal amount. Table A-23 provides this information for the other three transaction size categories and for dealer sales to customers.
34

Sources: MSRB and KennyBase
This exhibit shows the distribution of $50,000 principal amount purchases from customers by the dollar difference between the high price for a security on a given day and the low price on that day. The first pie chart shows the distribution for security-days where more than one dealer purchased from a customer. The second shows the distribution where only one dealer purchased from customers.
Exhibit 35Distribution of Dealer Purchases From Customers of $50,000 Principal Amount
Multiple Dealers Only One Dealer
By Difference Between High and Low Price For Same Fixed Coupon Municipal Security on Same Day
$0.00 (36.9%)
$2.00 - $3.00 (7.6%)
$1.00 - $2.00 (14.5%)
$0.50 - $1.00 (13.0%)
$0.00 - $0.50 (24.8%)
Over $3.00 (3.2%)
$0.00 (87.6%)
$0.50 - $1.00 (2.9%)
$0.00 - $0.50 (8.4%) $1.00 - $2.00
(1.0%)
As Exhibit 35 shows, there was little variability in the prices individual dealers paid their customers for the same security on the same day. For example, 88% of the time a dealer paid the same price to all customers selling $50,000 principal amount of a particular security on a given day. There was considerably more variability in prices among different dealers. That is, customers selling a given municipal security on a given day frequently received different prices from different dealers. For example, for transactions of $50,000 principal amount, customers selling the same security on the same day, but to different dealers, received identical prices only 37% of the time. About 11% of the time one customer received a price that was at least $2 less than that of another customer.16
Price variability was a function of trade size. The larger the transaction the more likely customers were to receive the same or similar prices (see Table A-23). For example, for transactions of $10,000 principal amount, customers selling the same security on the same day, but to different dealers, received identical prices only 17% of the time. For transactions of $1 million principal amount, customers received the same price from different dealers 50% of the time.
35
16 Prices are roughly distributed around $100, so this difference is about 2%.

XX. Transaction Activity Over the Life of a Municipal Security The conventional wisdom is that most transaction activity in municipal securities takes place soon after the offering. That is, turnover is high in the days immediately following the offering, declines over time, and eventually becomes negligible. We have examined this matter using two methods. The first, a time series approach, follows individual offerings over time. Since our data on transactions covers only one year, we use the time series approach only to measure turnover in the first months after the offering. The second, a cross-sectional approach, estimates the turnover of securities in the years after the dated date. A. Time series We identified recently issued municipal securities by selecting securities with a maturity of at least one year, a sale date between December 1, 1999 and March 31, 2000, and a first transaction on or after the sale date and no later than 30 calendar days after the sale date.17 We included only securities that had been completely distributed to customers on this first day of trading.18,19 We call this first day of trading the “distribution day.” Exhibit 36 presents estimates of daily secondary turnover by customers in these 9,139 fixed coupon securities and 221 variable rate securities on the distribution day, on each of the next four trading days, during the rest of the first month, and during each of the next five months.20 Average daily trading volume (principal amount bought and sold by customers) was divided by the aggregate outstanding principal amount of these securities to give a daily turnover rate. The first panel presents estimates of turnover for fixed coupon securities. Secondary turnover on the distribution day for the fixed coupon securities was 2.3%. That is, secondary volume on that day equaled 2.3% of the outstanding principal amount of these issues. Turnover was little changed over the next two days, averaging about 1.9%. Daily turnover fell to about 0.8% during the remainder of the week. During the next three weeks, daily turnover averaged about 0.5%. It averaged about 0.2% during the next five months. The second panel of Exhibit 36 presents estimates of daily turnover for variable rate securities. Daily turnover for variable rate securities was only moderately higher than that of fixed coupon securities in the immediate aftermath of the distribution. Daily
17 We exclude securities that traded before their sale date or whose first trading day was over a month after their sale date. We also exclude zero coupon bonds. 18 We included only securities whose net principal amount sold to customers on the distribution day equaled or exceeded the principal amount of the security. We excluded dealer purchases from customers on the distribution date that exactly equaled the security’s principal amount. We suspect that the underwriters were incorrectly reporting the purchase from the issuer. We excluded securities with net sales to customers in excess of the principal amount of the security on the distribution day. 19 For ease of exposition, we exclude municipal securities that were distributed over more than one day. 20 The principal amount of the security was netted from the principal amount traded on the first day to estimate secondary trading volume on that day. Trading volume on all other days is assumed to be secondary trading.
36

turnover during the first three trading days averaged about 3.5% for variable rate securities, compared to about 2.0% for fixed coupon securities. But, turnover for variable rate securities did not decline as substantially in the aftermath of the distribution. During the second through sixth month after the distribution, turnover for variable rate securities averaged about 1.6% a day, about 7 times that of fixed coupon securities.
Sources: MSRB, KennyBase and Bloomberg
This exhibit presents average daily customer secondary market turnover (principal amount traded as a percent of principal amount outstanding) for 9,139 fixed coupon and 221 variable rate municipal securities distributed during December 1999 - April 2000. Days and months are in reference to the distribution day.
Exhibit 36Daily Customer Secondary Market Turnover In Municipal Securities
Fixed Coupon Securities
Variable Rate Securities
2.3%
1.8%1.9%
0.7%0.9%
0.5%0.3% 0.2% 0.2% 0.2%
0.3%
0%
1%
1%
2%
2%
3%
Distrib
ution
Day
Day2
Day3
Day4
Day5
Rest of
Mon
th1
Month2
Month3
Month4
Month5
Month6
Ave
rage
Dai
ly S
econ
dary
Mar
ket T
urno
ver
3.9%
5.0%
1.8%2.2%
2.9%
1.7%1.3% 1.6%
2.8%
1.3%0.9%
0%
1%
2%
3%
4%
5%
6%
Distrib
ution
Day
Day2
Day3
Day4
Day5
Rest of
Mon
th1
Month2
Month3
Month4
Month5
Month6
Ave
rage
Dai
ly S
econ
dary
Mar
ket T
urno
ver
37

Tables A-24 – A-25 present average daily turnover rates by the size of the security. After the distribution, small fixed coupon securities had much smaller turnover rates than larger securities. From the second through the sixth month, fixed coupon securities with principal amounts of $1 million or less had an average daily turnover rate of about 0.06%. This compares to an average daily turnover rate of 0.26% for larger securities.
This pattern was similar for variable rate securities. The largest variable rate securities – those with principal amounts of more than $10 million – averaged daily customer turnover rates of 1.80% from the second through the sixth month. This compares to 0.67% for variable rate securities with principal amounts of $1 million – $10 million. There were very few variable rate securities with a principal amount of $1 million or less offered during this period. B. Cross-sectional
Securities can be tracked only so far using a time-series methodology, because our transaction data covers just one year. The cross-sectional approach allows for a longer perspective. We classified customer transactions in municipal securities by the number of years since the dated date at the time of the transaction.21 We classified securities outstanding by the number of years between their dated date and November 5, 2000. Dividing the principal amount traded by the principal amount outstanding gives an estimate of customer turnover by years since the dated date.22 As Exhibit 37 shows, turnover of fixed coupon municipal securities declined substantially over time (also see Table A-26). Average daily turnover declined from 0.20% during the second year of a fixed coupon security’s life to 0.04% during its tenth year.23,24 Turnover for variable rate securities showed much less change over time (see Exhibit 38). Turnover for variable rate securities issued in recent years was little different from that of securities issued earlier. Turnover of variable rate municipal securities was much higher than that of fixed coupon securities. In their second year, variable rate securities had a customer turnover rate that was eight-times that of fixed coupon securities. In their tenth year, variable rate securities had a turnover rate that was 19-times that of fixed coupon securities.
21 We excluded zero coupon bonds, secondary derivatives, secondary insured securities, the source securities for secondary insured securities, securities within one year of their dated dates, and securities that were no longer outstanding on November 5, 2000. 22 The dated date can be some time away from the distribution date, so this methodology is not useful in the immediate vicinity of the distribution date. The time series approach presented earlier is more useful in analyzing transaction activity in the immediate vicinity of the distribution. 23 We cannot measure turnover after ten years because the principal amount is missing from a very high proportion of records in the KennyBase for securities issued before 1990, when the principal amount field was introduced in the KennyBase. 24 Annualizing, turnover during the second year of a fixed-coupon security’s life would be about 50%. It would be about 10% during its tenth year.
38

Sources: MSRB, KennyBase and Bloomberg
Sources: MSRB, KennyBase and Bloomberg
This exhibit presents average daily customer turnover (principal amount traded as a percent of principal amount outstanding) for variable rate municipal securities by the number of years since the security's dated date. Years since the dated date are rounded up. For example, a value of "2" is assigned to a security that was between one (exclusive) and two (inclusive) years from its dated date.
Average Daily Customer Turnover by Years Since the Dated DateVariable Rate Municipal Securities at Least One Year After Their Dated Date
Average Daily Customer Turnover by Years Since the Dated DateExhibit 37
Fixed Coupon Municipal Securities at Least One Year After Their Dated Date
Exhibit 38
This exhibit presents average daily customer turnover (principal amount traded as a percent of principal amount outstanding) for fixed coupon municipal securities by the number of years since the security's dated date. Years since the dated date are rounded up. For example, a value of "2" is assigned to a security that was between one (exclusive) and two (inclusive) years from its dated date.
0.20%
0.14%0.11%
0.10%0.08%
0.13%
0.08%0.07%
0.04%
0.00%
0.05%
0.10%
0.15%
0.20%
0.25%
2 3 4 5 6 7 8 9 10
Ave
rage
Dai
ly T
urno
ver
1.71% 1.64%1.49%
2.25%
2.68%
2.39%
1.58%
1.05%
0.78%
0.00%
0.50%
1.00%
1.50%
2.00%
2.50%
3.00%
2 3 4 5 6 7 8 9 10
Ave
rage
Dai
ly T
urno
ver
39

Exhibits 39 and 40 present turnover rates by the size of the security, as well as by the years since the dated date (also see Tables A-27 and A-28). Large fixed coupon securities had higher turnover rates than smaller ones. For example, in their second through fourth years, fixed coupon municipal securities with an outstanding principal amount of more than $10 million averaged daily customer turnover of 0.20%. This compares to 0.05% for fixed coupon securities with outstanding principal amounts of $1 million or less.
Sources: MSRB, KennyBase and Bloomberg
Sources: MSRB, KennyBase and Bloomberg
This exhibit presents average daily customer turnover (principal amount traded as a percent of principal amount outstanding) for variable rate municipal securities by the size of the security and the number of years since the security's dated date.
Average Daily Customer Turnover by Years Since the Dated DateVariable Rate Municipal Securities at Least One Year After Their Dated Date
Average Daily Customer Turnover by Years Since the Dated DateExhibit 39
Fixed Coupon Municipal Securities at Least One Year After Their Dated Date
Exhibit 40
This exhibit presents average daily customer turnover (principal amount traded as a percent of principal amount outstanding) for fixed coupon municipal securities by the size of the security and the number of years since the security's dated date.
0.05% 0.05%0.03%
0.13%
0.09%
0.05%
0.20%
0.14%
0.07%
0.00%
0.05%
0.10%
0.15%
0.20%
0.25%
2-4 Years 5-7 Years 8-10 Years
Ave
rage
Dai
ly T
urno
ver
$1 Million or Less$1-10 MillionOver $10 Million
0.27% 0.36% 0.28%0.53% 0.58% 0.58%
1.81%
2.82%
1.22%
0.00%
0.50%
1.00%
1.50%
2.00%
2.50%
3.00%
2-4 Years 5-7 Years 8-10 Years
Ave
rage
Dai
ly T
urno
ver
$1 Million or Less$1-10 MillionOver $10 Million
40

This pattern was particularly pronounced for variable rate securities. Large variable rate securities had much higher turnover rates than did smaller ones. For example, in their second through fourth years, variable rate securities with outstanding principal amount of more than $10 million averaged daily turnover rates of 1.81%, compared to 0.27% for variable rate securities with outstanding principal amounts of $1 million or less. C. Maturity A fixed coupon security’s original maturity had little effect on its customer trading. That is, securities with different original maturities that had been outstanding the same number of years averaged similar customer turnover rates.
We estimated average daily customer turnover rates for fixed coupon securities by original maturity and years since the dated date. We limited this analysis to securities with a dated date on December 1 of any year.25 Similarly, we used only trades between December 1, 1999 and October 31, 2000 (the end of our sample period). 26 We define the age of a security as the number of years between its dated date and December 1, 2000. So when we talk about the turnover of a 3-year old security, we are referring to customer trading activity in the first 11 months of the security’s third year. Original maturity is rounded up, so a security with a maturity of 4.5 years, for example, would be classified as having a maturity of 5 years.27 We do not include turnover estimates for the first year of a security’s life, since the dated date is an inexact measure of when the security began trading. We further categorize securities by the principal amount outstanding on November 5, 2000.
Exhibit 41 compares the average daily customer turnover rates of securities with
principal amounts outstanding of $1 million to $10 million that had been outstanding for five years, by their original maturity. Tables A-29 and A-30 present this information for all security ages and for securities with principal amounts outstanding of $1 million or less.28 Customer turnover appears to be unrelated to original maturity.
25 We also exclude secondary derivatives, secondary insured bonds and their source securities, securities with dated dates before 1990, and securities that were not in our November 5, 2000 snapshot. 26 Using securities with a dated date on November 1 of any year would exactly match our study data and allow us to use all trades, but very few securities have a dated date on November 1. 27 Since all securities have a dated date of December 1 and were in existence on November 5, 2000, securities in their last year during our sample period all had original maturities of X years and between 11 and 12 months. So 11 months of trading data will be available during their last years and no adjustments need be made to their turnover rates. 28 We do not present turnover estimates for securities with a principal amount outstanding of $10 million or more because of the small number of securities of this size.
41

Sources: MSRB, KennyBase and Bloomberg
Exhibit 41Customer Turnover of Fixed Coupon Municipal Securities During Their Fifth Year
Principal Amount Outstanding Greater Than $1M and Less Than or Equal to $10M
This exhibit shows the average daily customer turnover (principal amount traded as a percent of outstanding principal amount) of fixed coupon securities, with outstanding principal amounts between $1 million and $10 million, during their fifth year, by the securities' original maturities.
By Maturity
0.18%
0.09%
0.13%
0.10%
0.18% 0.18%
0.11%
0.14% 0.13%
0.10%
0.08%
0.11%
0.16%
0.10%
0.07% 0.07%
0.00%
0.02%
0.04%
0.06%
0.08%
0.10%
0.12%
0.14%
0.16%
0.18%
0.20%
5 6 7 8 9 10 11 12 13 14 15 16 17 18 19 20Original Maturity
Ave
rage
Dai
ly T
urno
ver
42

Number Percent $B Percent Number Percent $B Percent
All Securities 1,109,758 100.0% 2,080.1 100.0% 7,024,678 100.0% 2,642.5 100.0%KennyBase Data Not Available 32,063 0.5% 192.1 7.3%Coupon Type Unknown 3,745 0.1% 11.7 0.4%
Coupon Type Known 1,109,758 100.0% 2,080.1 100.0% 6,988,870 100.0% 2,438.7 100.0%Fixed Coupon 1,041,295 93.8% 1,600.6 76.9% 6,228,636 89.1% 1,083.8 44.4%Zero Coupon 38,597 3.5% 169.8 8.2% 365,587 5.2% 68.6 2.8%Variable Rate 29,866 2.7% 309.7 14.9% 394,647 5.6% 1,286.3 52.7%
Number Percent $B Percent Number Percent $B Percent
All Securities 1,109,758 100.0% 2,080.1 100.0% 7,024,678 100.0% 2,642.5 100.0%KennyBase Data Not Available 32,063 0.5% 192.1 7.3%Security Type Unknown 3,731 0.1% 11.7 0.4%
Security Type Known 1,109,758 100.0% 2,080.1 100.0% 6,988,884 100.0% 2,438.7 100.0%Primary offerings 1,095,659 98.7% 2,018.7 97.0% 6,959,169 99.6% 2,331.9 95.6%
Defaulted 1,951 0.2% 3.9 0.2% 11,471 0.2% 1.6 0.1%Advanced Refundings 84,899 7.7% 207.5 10.0% 588,904 8.4% 90.8 3.7%Secondary Insured 11,698 1.1% 0.0 0.0% 242,215 3.5% 38.6 1.6%Source of Secondary Insured 9,302 0.8% 209.1 10.1% 566,277 8.1% 103.7 4.3%Other 987,809 89.0% 1,598.3 76.8% 5,550,302 79.4% 2,097.2 86.0%
Secondary Derivatives 14,099 1.3% 61.4 3.0% 29,715 0.4% 106.8 4.4%
Table A-1Municipal Securities Outstanding and Transactions in Municipal Securities: By Coupon Type
Number of Securities Principal Amount Number of Trades Principal AmountTransactionsOutstanding Securities
Table A-2Municipal Securities Outstanding and Transactions in Municipal Securities: By Security Type
Outstanding Securities TransactionsPrincipal AmountNumber of Securities Principal Amount Number of Trades
Sources: MSRB, KennyBase and Bloomberg
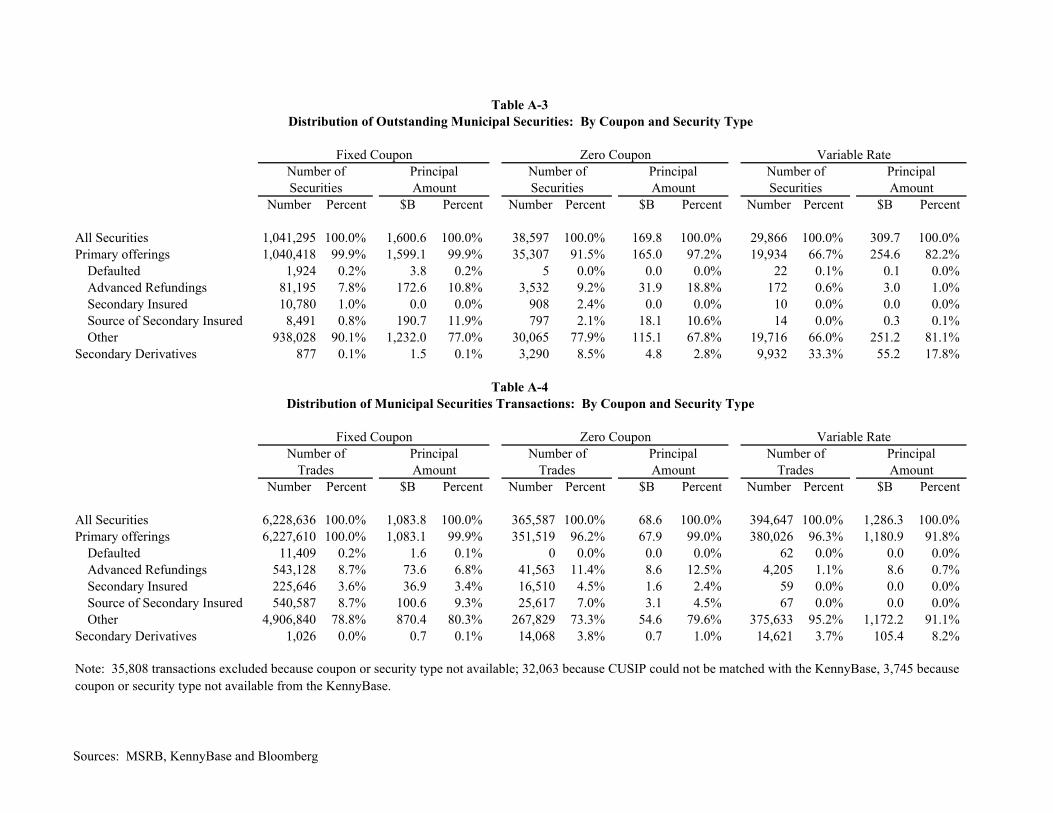
Number Percent $B Percent Number Percent $B Percent Number Percent $B Percent
All Securities 1,041,295 100.0% 1,600.6 100.0% 38,597 100.0% 169.8 100.0% 29,866 100.0% 309.7 100.0%Primary offerings 1,040,418 99.9% 1,599.1 99.9% 35,307 91.5% 165.0 97.2% 19,934 66.7% 254.6 82.2%
Defaulted 1,924 0.2% 3.8 0.2% 5 0.0% 0.0 0.0% 22 0.1% 0.1 0.0%Advanced Refundings 81,195 7.8% 172.6 10.8% 3,532 9.2% 31.9 18.8% 172 0.6% 3.0 1.0%Secondary Insured 10,780 1.0% 0.0 0.0% 908 2.4% 0.0 0.0% 10 0.0% 0.0 0.0%Source of Secondary Insured 8,491 0.8% 190.7 11.9% 797 2.1% 18.1 10.6% 14 0.0% 0.3 0.1%Other 938,028 90.1% 1,232.0 77.0% 30,065 77.9% 115.1 67.8% 19,716 66.0% 251.2 81.1%
Secondary Derivatives 877 0.1% 1.5 0.1% 3,290 8.5% 4.8 2.8% 9,932 33.3% 55.2 17.8%
Number Percent $B Percent Number Percent $B Percent Number Percent $B Percent
All Securities 6,228,636 100.0% 1,083.8 100.0% 365,587 100.0% 68.6 100.0% 394,647 100.0% 1,286.3 100.0%Primary offerings 6,227,610 100.0% 1,083.1 99.9% 351,519 96.2% 67.9 99.0% 380,026 96.3% 1,180.9 91.8%
Defaulted 11,409 0.2% 1.6 0.1% 0 0.0% 0.0 0.0% 62 0.0% 0.0 0.0%Advanced Refundings 543,128 8.7% 73.6 6.8% 41,563 11.4% 8.6 12.5% 4,205 1.1% 8.6 0.7%Secondary Insured 225,646 3.6% 36.9 3.4% 16,510 4.5% 1.6 2.4% 59 0.0% 0.0 0.0%Source of Secondary Insured 540,587 8.7% 100.6 9.3% 25,617 7.0% 3.1 4.5% 67 0.0% 0.0 0.0%Other 4,906,840 78.8% 870.4 80.3% 267,829 73.3% 54.6 79.6% 375,633 95.2% 1,172.2 91.1%
Secondary Derivatives 1,026 0.0% 0.7 0.1% 14,068 3.8% 0.7 1.0% 14,621 3.7% 105.4 8.2%
Note: 35,808 transactions excluded because coupon or security type not available; 32,063 because CUSIP could not be matched with the KennyBase, 3,745 because coupon or security type not available from the KennyBase.
Number ofSecurities
PrincipalAmount
Number ofSecurities
PrincipalAmount
Number ofSecurities
PrincipalAmount
Table A-3Distribution of Outstanding Municipal Securities: By Coupon and Security Type
Fixed Coupon Zero Coupon Variable Rate
Table A-4Distribution of Municipal Securities Transactions: By Coupon and Security Type
Fixed Coupon Zero Coupon Variable RateNumber of
TradesPrincipalAmount
Number ofTrades
PrincipalAmount
Number ofTrades
PrincipalAmount
Sources: MSRB, KennyBase and Bloomberg

Number Percent Value ($B) Percent
All Securities
Total 7,024,678 100.0% 2,642.5 100.0%Inter-Dealer Trades 1,398,180 19.9% 329.7 12.5%Customer Trades 5,626,498 80.1% 2,312.9 87.5%
Purchases from customers 1,736,352 24.7% 979.9 37.1%Sales to customers 3,890,146 55.4% 1,333.0 50.4%
Fixed Rate Securities
Total 6,594,223 100.0% 1,152.4 100.0%Inter-Dealer Trades 1,391,018 21.1% 323.6 28.1%Customer Trades 5,203,205 78.9% 828.7 71.9%
Purchases from customers 1,541,575 23.4% 336.6 29.2%Sales to customers 3,661,630 55.5% 492.1 42.7%
Variable Rate Securities
Total 394,647 100.0% 1,286.3 100.0%Inter-Dealer Trades 6,826 1.7% 5.9 0.5%Customer Trades 387,821 98.3% 1,280.4 99.5%
Purchases from customers 185,141 46.9% 592.1 46.0%Sales to customers 202,680 51.4% 688.3 53.5%
Unclasssified Securities
Total 35,808 100.0% 203.8 100.0%Inter-Dealer Trades 336 0.9% 0.1 0.1%Customer Trades 35,472 99.1% 203.7 99.9%
Purchases from customers 9,636 26.9% 51.2 25.1%Sales to customers 25,836 72.2% 152.5 74.8%
Table A-5Distribution of Municipal Securities TransactionsBy Type of Contra Party and Interest Rate Type
Number of Trades Principal Amount of Trades
Sources: MSRB and KennyBase

Mean Median
All TradesAll Securities 376,180 30,000Fixed Rate Securities 174,756 25,000Variable Rate Securities 3,259,463 1,100,000Unclassified Securities 5,692,089 3,000,000
Customer TradesAll Securities 411,066 25,000Fixed Rate Securities 159,277 25,000Variable Rate Securities 3,301,568 1,170,000Unclassified Securities 5,742,408 3,000,000
Dealer TradesAll Securities 235,792 50,000Fixed Rate Securities 232,658 50,000Variable Rate Securities 867,265 170,000Unclassified Securities 379,917 100,000
Trade Size
Table A-6Average Size of Municipal Securities Transactions
Principal Value Traded in Dollars
Sources: MSRB and KennyBase

Number Percent Amount($B) Percent Number Percent Amount($B) Percent
All TradesTotal 6,594,223 100.0% 1,152.4 100.0% 394,647 100.0% 1,286.3 100.0%$5K or Less 603,311 9.1% 3.0 0.3% 6,197 1.6% 0.0 0.0%$5K - $25K 2,807,659 42.6% 47.8 4.1% 19,595 5.0% 0.3 0.0%$25K - $100K 2,034,758 30.9% 124.2 10.8% 48,767 12.4% 4.0 0.3%$100K - $1M 971,790 14.7% 335.0 29.1% 118,778 30.1% 62.6 4.9%$1M - $10M 168,618 2.6% 492.1 42.7% 172,117 43.6% 653.3 50.8%Over $10M 8,087 0.1% 150.3 13.0% 29,193 7.4% 566.0 44.0%
Customer TradesTotal 5,203,205 100.0% 828.7 100.0% 387,821 100.0% 1,280.4 100.0%$5K or Less 535,910 10.3% 2.7 0.3% 5,924 1.5% 0.0 0.0%$5K - $25K 2,403,198 46.2% 40.6 4.9% 18,507 4.8% 0.3 0.0%$25K - $100K 1,570,241 30.2% 94.2 11.4% 46,991 12.1% 3.9 0.3%$100K - $1M 569,917 11.0% 193.0 23.3% 116,183 30.0% 61.5 4.8%$1M - $10M 116,793 2.2% 364.8 44.0% 171,102 44.1% 650.2 50.8%Over $10M 7,146 0.1% 133.5 16.1% 29,114 7.5% 564.5 44.1%
Inter-Dealer TradesTotal 1,391,018 100.0% 323.6 100.0% 6,826 100.0% 5.9 100.0%$5K or Less 67,401 4.8% 0.3 0.1% 273 4.0% 0.0 0.0%$5K - $25K 404,461 29.1% 7.2 2.2% 1,088 15.9% 0.0 0.3%$25K - $100K 464,517 33.4% 30.0 9.3% 1,776 26.0% 0.1 2.3%$100K - $1M 401,873 28.9% 142.0 43.9% 2,595 38.0% 1.2 19.5%$1M - $10M 51,825 3.7% 127.3 39.3% 1,015 14.9% 3.1 52.5%Over $10M 941 0.1% 16.9 5.2% 79 1.2% 1.5 25.3%
Prin
cipa
l Am
ount
Prin
cipa
l Am
ount
Traded
Note: 35,808 transactions excluded because coupon type not available; 32,063 because CUSIP could not be matched with KennyBase, 3,745 because coupon type not available from KennyBase.
Table A-7Distribution of Municipal Securities Transactions: By Size of Transaction
Prin
cipa
l Am
ount
Fixed Rate Variable Rate
Number of TradesPrincipal Amount
TradedPrincipal Amount
Number of Trades
Sources: MSRB and KennyBase

Dated Date ($B) % ($B) % ($B) % ($B) %
1980-1984 0.3 25.5% 0.8 74.5% 0.3 29.3% 0.8 70.7%1985-1989 1.4 20.4% 5.3 79.6% 1.7 26.2% 4.8 73.8%1990-1994 16.1 19.6% 66.4 80.4% 23.4 28.3% 59.3 71.7%1995 2.4 13.7% 15.0 86.3% 4.9 28.2% 12.6 71.8%1996 3.0 12.5% 20.7 87.5% 7.0 29.2% 16.9 70.8%1997 3.7 9.7% 34.8 90.3% 9.8 25.1% 29.4 74.9%1998 6.8 11.3% 53.1 88.7% 15.9 25.6% 46.3 74.4%1999 3.9 6.3% 58.6 93.7% 15.2 17.1% 74.0 82.9%2000 1.0 2.4% 41.3 97.6% 18.9 11.3% 148.8 88.7%
1Principal amount traded of $100,000 or less2Principal amount traded of more than $100,000
Table A-8Distribution of Customer Trades in Fixed Rate Securities, by Principal Amount Traded and Dated Date of Security
Small Trades1 Large Trades2All Dealer Purchases
Note: 93,579 transactions of $4.0 billion par amount were excluded because the dated date was missing or the year of the dated date was before 1980 or after 2000.
All Dealer SalesSmall Trades1 Large Trades2
Sources: MSRB and KennyBase

Number Percent Amount ($B) Percent Amount ($B) Percent Number Percent Amount ($B) Percent
Total 148,053 100.0% 3,405.1 100.0% 2,018.7 100.0% 7,024,678 100.0% 2,642.5 100.0%
Issuance Offering Amount1
KennyBase Data NA3 32,063 0.5% 192.1 7.3%Issue Information NA4 2,155 0.0% 6.6 0.3%Amount NA5 22,678 15.3% 11.3 0.6% 158,275 2.3% 66.1 2.5%
Data available 125,375 100.0% 3,405.1 100.0% 2,007.4 100.0% 6,832,185 100.0% 2,377.6 100.0%$1 M or less 19,581 15.6% 10.3 0.3% 7.6 0.4% 43,959 0.6% 5.1 0.2%$1M - $10M 64,517 51.5% 285.0 8.4% 220.0 11.0% 859,156 12.6% 144.6 6.1%$10M - $100M 34,944 27.9% 1,117.2 32.8% 851.2 42.4% 3,212,416 47.0% 1,063.8 44.7%Over $100M 6,333 5.1% 1,992.6 58.5% 928.7 46.3% 2,716,654 39.8% 1,164.1 49.0%
Number ofTransactions6
Total 135,164 100.0% 3,138.3 100.0% 1,817.4 100.0% 5,011,513 100.0% 1,583.0 100.0%None 57,565 42.6% 518.3 16.5% 178.5 9.8% 0 0.0% 0.0 0.0%1-5 19,355 14.3% 143.5 4.6% 69.0 3.8% 58,783 1.2% 21.9 1.4%5-25 27,570 20.4% 362.1 11.5% 172.3 9.5% 353,234 7.0% 97.2 6.1%26-100 19,002 14.1% 642.3 20.5% 353.1 19.4% 998,625 19.9% 282.4 17.8%Over 100 11,672 8.6% 1,472.1 46.9% 1,044.6 57.5% 3,600,871 71.9% 1,181.6 74.6%
Note: Secondary derivatives are excluded.
1The issuance offering amount is the amount of monies collected when all securities in the offering were sold.2The principal amount is that of all securities in the offering that were still outstanding on November 5, 2000.3CUSIPs from these transactions could not be matched with the KennyBase.4We could not assign these transactions to offerings because these CUSIPs were not included in any of the three snapshots.5The issuance offering amount was not available for these offerings.6 For offerings with outstanding securities on December 12, 1999 and November 5, 2000, and for transactions between December 12, 1999 andOctober 31, 2000.
Table A-9Distribution of Municipal Offerings: By Offering Size and Transaction Activity
Outstanding Offerings TransactionsNumber of Trades Principal AmountNumber of Offerings Issuance Offering Amount1 Principal Amount2
Sources: MSRB, KennyBase and Bloomberg

Number Percent Amount ($B) Percent Number Percent Amount ($B) Percent
Total 50,534 100.0% 2,018.7 100.0% 6,994,963 100.0% 2,535.7 100.0%
Issuer's PrincipalAmount Outstanding
KennyBase Data NA1 32,063 0.5% 192.1 7.6%Issue Information NA2 230 0.0% 0.5 0.0%Amount NA3 9,006 17.8% 56,012 0.8% 9.0 0.4%
Data available 41,528 100.0% 2,018.7 100.0% 6,906,658 100.0% 2,334.1 100.0%$1 M or less 7,360 17.7% 3.3 0.2% 23,481 0.3% 1.3 0.1%$1M - $10M 18,936 45.6% 80.1 4.0% 355,763 5.2% 46.7 2.0%$10M - $100M 12,248 29.5% 377.8 18.7% 1,606,323 23.3% 329.8 14.1%$100M - $1B 2,614 6.3% 745.5 36.9% 2,525,066 36.6% 899.2 38.5%Over $1B 370 0.9% 812.0 40.2% 2,396,025 34.7% 1,057.2 45.3%
Number of Issuer'sSecurities Outstanding4
1 6,880 13.6% 36.5 1.8% 55,902 0.8% 64.7 2.6%2-5 9,650 19.1% 79.6 3.9% 176,671 2.5% 136.0 5.4%6-10 8,319 16.5% 74.5 3.7% 214,847 3.1% 106.4 4.2%11-25 14,449 28.6% 236.2 11.7% 889,847 12.7% 263.0 10.4%26-100 9,683 19.2% 598.2 29.6% 2,261,587 32.3% 620.8 24.5%Over 100 1,553 3.1% 993.7 49.2% 3,360,403 48.0% 1,159.5 45.7%
Number of Issuer'sTransactions5
Total 48,699 100.0% 1,989.3 100.0% 5,904,111 100.0% 2,111.2 100.0%None 16,239 33.3% 43.4 2.2% 0 0.0% 0.0 0.0%1-5 6,690 13.7% 27.9 1.4% 20,237 0.3% 7.1 0.3%6-25 10,463 21.5% 73.4 3.7% 135,658 2.3% 31.4 1.5%26-100 7,664 15.7% 144.3 7.3% 410,308 6.9% 99.9 4.7%101-1000 6,559 13.5% 565.2 28.4% 1,938,201 32.8% 563.5 26.7%Over 1000 1,084 2.2% 1,135.0 57.1% 3,399,707 57.6% 1,409.4 66.8%
Note: Issuers are defined using the six-digit CUSIP. Secondary derivatives are excluded.
1CUSIPs from these transactions could not be matched with the KennyBase.2We could not assign these transactions to issuers because these issuers were not included in any of the three snapshots.3The principal amount was not available for the securities of these issuers.4Transactions are limited to issuers with securities outstanding on November 5, 2000.5 For issuers with outstanding securities on December 12, 1999 and November 5, 2000, and for transactionsbetween December 12, 1999 and October 31, 2000.
Outstandings Transactions
Table A-10Distribution of Issuers: By Outstanding Muncipal Securities and Transaction Activity
Number of Trades Principal Amount TradedNumber of Issuers Principal Amount
Sources: MSRB, KennyBase and Bloomberg

Number Percent Amount ($B) Percent Number Percent Amount ($B) Percent
Principal Amountof OutstandingSecurities
Total 1,074,659 0.0% 1,809.7 100.0% 6,154,408 100.0% 2,201.3 100.0%Amount NA1 171,580 16.0% 0.0 0.0% 363,860 5.9% 143.0 6.5%
Data available 903,079 100.0% 1,809.7 100.0% 5,790,548 100.0% 2,058.3 100.0%$1M or Less 666,395 73.8% 190.3 10.5% 1,025,542 17.7% 78.2 3.8%$1M - $10M 201,429 22.3% 627.4 34.7% 2,441,411 42.2% 417.9 20.3%$10M - $100M 34,336 3.8% 820.1 45.3% 2,088,893 36.1% 1,203.9 58.5%Over $100M 919 0.1% 171.8 9.5% 234,702 4.1% 358.3 17.4%
Number ofTransactions2
Total 973,396 100.0% 1,605.2 100.0% 4,262,528 100.0% 1,457.6 100.0%None 686,465 70.5% 475.2 29.6% 0 0.0% 0.0 0.0%1-5 145,502 14.9% 190.3 11.9% 431,130 10.1% 74.5 5.1%5-25 106,420 10.9% 354.5 22.1% 1,218,467 28.6% 224.1 15.4%26-100 28,980 3.0% 351.1 21.9% 1,360,181 31.9% 423.3 29.0%Over 100 6,029 0.6% 234.1 14.6% 1,252,750 29.4% 735.7 50.5%
Note: Secondary derivatives and secondary insured securities and their source securities are excluded. Also excludedare 32,063 transactions for which KennyBase information was unavailable.
1The principal amount was not available for these securities.2 For securities outstanding on December 12, 1999 and November 5, 2000, and for transactions betweenDecember 12, 1999 and October 31, 2000.
Table A-11
TransactionsNumber of Trades Principal AmountNumber of Securities Principal Amount
Securities Outstanding
Distribution of Municipal Securities and Transactions: By Size and Transaction Activity
Sources: MSRB, KennyBase and Bloomberg

Number Percent Amount ($B) Percent Number Percent Amount ($B) Percent
Fixed Rate
Principal Amount ofOutstanding Securities
Total 1,054,749 100.0% 1,555.4 100.0% 5,770,769 100.0% 1,008.7 100.0%Amount NA 168,147 15.9% 0.0 0.0% 332,018 5.8% 56.6 5.6%
Data available 886,602 100.0% 1,555.4 100.0% 5,438,751 100.0% 952.1 100.0%$1M or Less 664,176 74.9% 189.4 12.2% 1,020,615 18.8% 76.5 8.0%$1M - $10M 192,875 21.8% 588.0 37.8% 2,372,643 43.6% 349.4 36.7%$10M - $100M 28,896 3.3% 649.9 41.8% 1,851,779 34.0% 431.3 45.3%Over $100M 655 0.1% 128.1 8.2% 193,714 3.6% 94.9 10.0%
Number ofTransactions1
None 676,227 70.7% 403.1 28.9% 0 0.0% 0.0 0.0%1-5 143,208 15.0% 168.2 12.1% 424,898 10.7% 58.8 10.5%5-25 103,850 10.9% 319.7 22.9% 1,185,408 29.9% 152.2 27.2%26-100 27,302 2.9% 308.8 22.1% 1,272,014 32.1% 190.9 34.1%Over 100 5,318 0.6% 195.6 14.0% 1,083,402 27.3% 158.0 28.2%
Variable Rate
Principal Amount ofOutstanding Securities
Total 19,910 100.0% 254.3 100.0% 379,900 100.0% 1,180.9 100.0%Amount NA 3,433 17.2% 0.0 0.0% 28,687 7.6% 76.0 6.4%
Data available 16,477 100.0% 254.3 100.0% 351,213 100.0% 1,104.9 100.0%$1M or Less 2,219 13.5% 0.9 0.4% 4,861 1.4% 1.7 0.2%$1M - $10M 8,554 51.9% 39.5 15.5% 68,709 19.6% 68.3 6.2%$10M - $100M 5,440 33.0% 170.2 66.9% 236,667 67.4% 771.5 69.8%Over $100M 264 1.6% 43.7 17.2% 40,976 11.7% 263.3 23.8%
Number ofTransactions1
None 10,238 58.5% 72.1 34.3% 0 0.0% 0.0 0.0%1-5 2,294 13.1% 22.2 10.6% 6,232 2.1% 15.6 1.7%5-25 2,570 14.7% 34.7 16.6% 33,059 11.1% 71.9 8.0%26-100 1,678 9.6% 42.4 20.2% 88,167 29.7% 232.4 25.9%Over 100 711 4.1% 38.5 18.3% 169,348 57.1% 577.7 64.4%
Note: Secondary derivatives and secondary insured securities and their source securities are excluded. Also excludedare 32,063 transactions for which KennyBase information was unavailable, and transactions for which the coupontype of the security could not be determined.
1 For securities outstanding on December 12, 1999 and November 5, 2000, and for transactions betweenDecember 12, 1999 and October 31, 2000.
Table A-12
TransactionsNumber of Trades Principal AmountNumber of Securities Principal Amount
Securities Outstanding
Distribution of Municipal Securities and Transactions: By Interest Rate Type, Size and Transaction Activity
Sources: MSRB, KennyBase and Bloomberg

Number Percent Number Percent Number Percent Amount ($B) Percent Amount ($B) Percent Amount ($B) Percent
All SecuritiesTotal 1,074,659 100.0% 425,815 39.6% 648,844 60.4% 1,809.7 100.0% 824.2 45.5% 985.5 54.5%Not rated 339,129 100.0% 8,650 2.6% 330,479 97.4% 270.6 100.0% 11.1 4.1% 259.6 95.9%Short-term rating 872 100.0% 14 1.6% 858 98.4% 19.9 100.0% 1.6 8.2% 18.3 91.8%Long-term rating 734,658 100.0% 417,151 56.8% 317,507 43.2% 1,519.1 100.0% 811.5 53.4% 707.6 46.6%
AAA 489,177 100.0% 416,462 85.1% 72,715 14.9% 1,010.6 100.0% 810.2 80.2% 200.4 19.8%Other 245,481 100.0% 689 0.3% 244,792 99.7% 508.6 100.0% 1.4 0.3% 507.2 99.7%
Fixed RateTotal 1,054,749 100.0% 423,825 40.2% 630,924 59.8% 1,555.4 100.0% 768.3 49.4% 787.1 50.6%Not rated 327,889 100.0% 8,576 2.6% 319,313 97.4% 192.2 100.0% 10.3 5.3% 181.9 94.7%Short-term rating 664 100.0% 11 1.7% 653 98.3% 16.8 100.0% 1.6 9.4% 15.3 90.6%Long-term rating 726,196 100.0% 415,238 57.2% 310,958 42.8% 1,346.4 100.0% 756.5 56.2% 589.9 43.8%
AAA 485,965 100.0% 414,552 85.3% 71,413 14.7% 922.2 100.0% 755.1 81.9% 167.1 18.1%Other 240,231 100.0% 686 0.3% 239,545 99.7% 424.1 100.0% 1.3 0.3% 422.8 99.7%
Variable RateTotal 19,910 100.0% 1,990 10.0% 17,920 90.0% 254.3 100.0% 55.9 22.0% 198.4 78.0%Not rated 11,240 100.0% 74 0.7% 11,166 99.3% 78.5 100.0% 0.8 1.0% 77.7 99.0%Short-term rating 208 100.0% 3 1.4% 205 98.6% 3.0 100.0% 0.0 1.2% 3.0 98.8%Long-term rating 8,462 100.0% 1,913 22.6% 6,549 77.4% 172.8 100.0% 55.1 31.9% 117.7 68.1%
AAA 3,212 100.0% 1,910 59.5% 1,302 40.5% 88.3 100.0% 55.0 62.3% 33.3 37.7%Other 5,250 100.0% 3 0.1% 5,247 99.9% 84.5 100.0% 0.0 0.1% 84.4 99.9%
Note: Secondary derivatives and secondary insured securities and their source securities are excluded.
Table A-13Distribution of Municipal Securities Outstanding: By Insured Status and Interest Rate Type
All SecuritiesNumber of Securities Principal Amount
All Securities Insured UninsuredInsured Uninsured
Sources: KennyBase and Bloomberg

Number Percent Number Percent Number Percent Amount ($B) Percent Amount ($B) Percent Amount ($B) Percent
All SecuritiesTotal 6,150,639 100.0% 3,386,261 55.1% 2,764,378 44.9% 2,189.6 100.0% 835.7 38.2% 1,353.9 61.8%Not rated 759,952 100.0% 70,127 9.2% 689,825 90.8% 371.5 100.0% 16.7 4.5% 354.8 95.5%Short-term rating 13,132 100.0% 481 3.7% 12,651 96.3% 51.2 100.0% 3.4 6.7% 47.8 93.3%Long-term rating 5,377,555 100.0% 3,315,653 61.7% 2,061,902 38.3% 1,766.9 100.0% 815.6 46.2% 951.3 53.8%
AAA 3,808,903 100.0% 3,308,031 86.8% 500,872 13.2% 1,056.9 100.0% 813.8 77.0% 243.1 23.0%Other 1,568,652 100.0% 7,622 0.5% 1,561,030 99.5% 710.0 100.0% 1.8 0.3% 708.2 99.7%
Fixed RateTotal 5,770,769 100.0% 3,295,221 57.1% 2,475,548 42.9% 1,008.7 100.0% 530.0 52.5% 478.7 47.5%Not rated 645,835 100.0% 68,539 10.6% 577,296 89.4% 98.2 100.0% 9.6 9.7% 88.7 90.3%Short-term rating 9,255 100.0% 444 4.8% 8,811 95.2% 36.9 100.0% 3.0 8.2% 33.8 91.8%Long-term rating 5,115,679 100.0% 3,226,238 63.1% 1,889,441 36.9% 873.7 100.0% 517.4 59.2% 356.2 40.8%
AAA 3,680,723 100.0% 3,218,672 87.4% 462,051 12.6% 621.1 100.0% 515.8 83.1% 105.3 16.9%Other 1,434,956 100.0% 7,566 0.5% 1,427,390 99.5% 252.6 100.0% 1.6 0.6% 251.0 99.4%
Variable RateTotal 379,870 100.0% 91,040 24.0% 288,830 76.0% 1,180.8 100.0% 305.6 25.9% 875.2 74.1%Not rated 114,117 100.0% 1,588 1.4% 112,529 98.6% 273.3 100.0% 7.1 2.6% 266.1 97.4%Short-term rating 3,877 100.0% 37 1.0% 3,840 99.0% 14.4 100.0% 0.4 3.0% 14.0 97.0%Long-term rating 261,876 100.0% 89,415 34.1% 172,461 65.9% 893.2 100.0% 298.1 33.4% 595.1 66.6%
AAA 128,180 100.0% 89,359 69.7% 38,821 30.3% 435.8 100.0% 298.0 68.4% 137.9 31.6%Other 133,696 100.0% 56 0.0% 133,640 100.0% 457.4 100.0% 0.2 0.0% 457.2 100.0%
Note: Secondary derivatives and secondary insured securities and their source securities are excluded. Also excluded are 32,063 transactions for which KennyBaseinformation was unavailable, transactions for which the coupon type of the security could not be determined, and 30 trades where information on the insuredstatus of the security could not be determined.
Uninsured
Table A-14Distribution of Municipal Securities Transactions: By Insured Status and Interest Rate Type
All SecuritiesNumber of Transactions Principal Amount Traded
All Securities Insured UninsuredInsured
Sources: MSRB and KennyBase

Moody's Moody's S&Pand S&P Only Only Neither
Fixed Rate Securities
Outstanding SecuritiesNumber of Securities 509,488 217,372 70,456 257,433Principal Amount ($B) 1,202 161 91 101Median Principal Amount of Security 595,000 265,000 265,000 100,000Median Offering Issuance Amount 13,200,000 4,915,000 6,485,000 1,355,000
TransactionsNumber of Trades 4,482,810 642,124 292,556 353,279Principal Amount of Trades ($B) 805 106 46 52
Variable Rate Securities
Outstanding SecuritiesNumber of Securities 4,254 4,416 4,739 6,501Principal Amount ($B) 121 55 53 26Median Principal Amount of Security 23,000,000 7,032,500 6,867,500 2,500,000Median Offering Issuance Amount 48,025,000 11,110,000 9,555,000 3,647,500
TransactionsNumber of Trades 204,488 61,267 71,930 42,215Principal Amount of Trades ($B) 724 183 217 57
Note: Secondary derivatives and secondary insured securities and their source securities are excluded. Also excludedare 32,063 transactions for which KennyBase information was unavailable, and transactions for which the coupontype of the security could not be determined.
Rated By
Table A-15Characteristics of Municipal Securities: By Rating Agency and Interest Rate Type
Sources: MSRB, KennyBase and Bloomberg
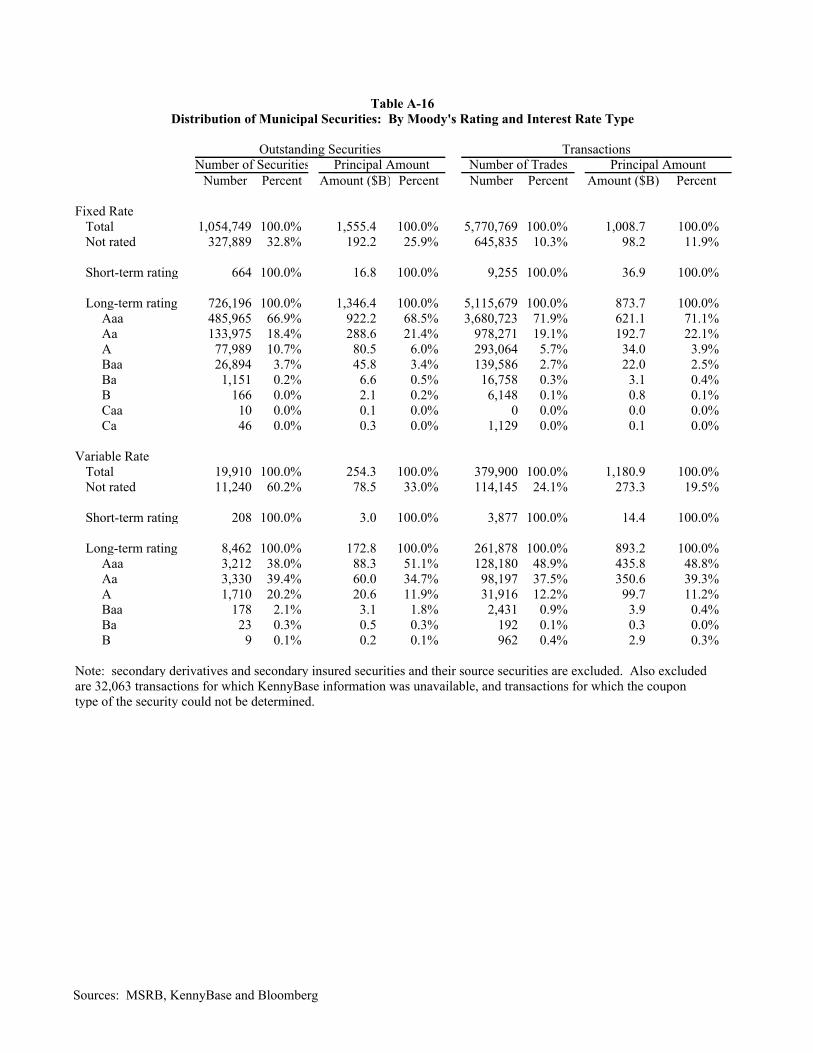
Number Percent Amount ($B) Percent Number Percent Amount ($B) Percent
Fixed RateTotal 1,054,749 100.0% 1,555.4 100.0% 5,770,769 100.0% 1,008.7 100.0%Not rated 327,889 32.8% 192.2 25.9% 645,835 10.3% 98.2 11.9%
Short-term rating 664 100.0% 16.8 100.0% 9,255 100.0% 36.9 100.0%
Long-term rating 726,196 100.0% 1,346.4 100.0% 5,115,679 100.0% 873.7 100.0%Aaa 485,965 66.9% 922.2 68.5% 3,680,723 71.9% 621.1 71.1%Aa 133,975 18.4% 288.6 21.4% 978,271 19.1% 192.7 22.1%A 77,989 10.7% 80.5 6.0% 293,064 5.7% 34.0 3.9%Baa 26,894 3.7% 45.8 3.4% 139,586 2.7% 22.0 2.5%Ba 1,151 0.2% 6.6 0.5% 16,758 0.3% 3.1 0.4%B 166 0.0% 2.1 0.2% 6,148 0.1% 0.8 0.1%Caa 10 0.0% 0.1 0.0% 0 0.0% 0.0 0.0%Ca 46 0.0% 0.3 0.0% 1,129 0.0% 0.1 0.0%
Variable RateTotal 19,910 100.0% 254.3 100.0% 379,900 100.0% 1,180.9 100.0%Not rated 11,240 60.2% 78.5 33.0% 114,145 24.1% 273.3 19.5%
Short-term rating 208 100.0% 3.0 100.0% 3,877 100.0% 14.4 100.0%
Long-term rating 8,462 100.0% 172.8 100.0% 261,878 100.0% 893.2 100.0%Aaa 3,212 38.0% 88.3 51.1% 128,180 48.9% 435.8 48.8%Aa 3,330 39.4% 60.0 34.7% 98,197 37.5% 350.6 39.3%A 1,710 20.2% 20.6 11.9% 31,916 12.2% 99.7 11.2%Baa 178 2.1% 3.1 1.8% 2,431 0.9% 3.9 0.4%Ba 23 0.3% 0.5 0.3% 192 0.1% 0.3 0.0%B 9 0.1% 0.2 0.1% 962 0.4% 2.9 0.3%
Note: secondary derivatives and secondary insured securities and their source securities are excluded. Also excludedare 32,063 transactions for which KennyBase information was unavailable, and transactions for which the coupontype of the security could not be determined.
Number of Securities Principal Amount Number of Trades Principal AmountOutstanding Securities Transactions
Table A-16Distribution of Municipal Securities: By Moody's Rating and Interest Rate Type
Sources: MSRB, KennyBase and Bloomberg
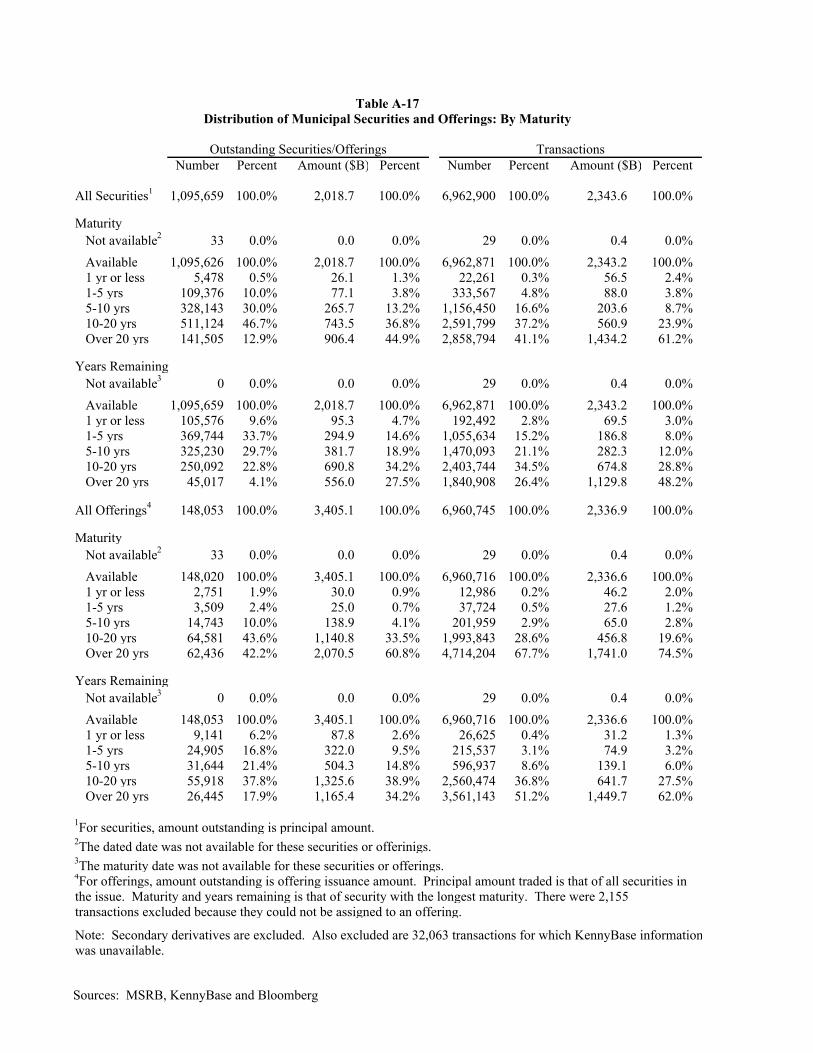
Number Percent Amount ($B) Percent Number Percent Amount ($B) Percent
All Securities1 1,095,659 100.0% 2,018.7 100.0% 6,962,900 100.0% 2,343.6 100.0%
MaturityNot available2 33 0.0% 0.0 0.0% 29 0.0% 0.4 0.0%Available 1,095,626 100.0% 2,018.7 100.0% 6,962,871 100.0% 2,343.2 100.0%1 yr or less 5,478 0.5% 26.1 1.3% 22,261 0.3% 56.5 2.4%1-5 yrs 109,376 10.0% 77.1 3.8% 333,567 4.8% 88.0 3.8%5-10 yrs 328,143 30.0% 265.7 13.2% 1,156,450 16.6% 203.6 8.7%10-20 yrs 511,124 46.7% 743.5 36.8% 2,591,799 37.2% 560.9 23.9%Over 20 yrs 141,505 12.9% 906.4 44.9% 2,858,794 41.1% 1,434.2 61.2%
Years RemainingNot available3 0 0.0% 0.0 0.0% 29 0.0% 0.4 0.0%Available 1,095,659 100.0% 2,018.7 100.0% 6,962,871 100.0% 2,343.2 100.0%1 yr or less 105,576 9.6% 95.3 4.7% 192,492 2.8% 69.5 3.0%1-5 yrs 369,744 33.7% 294.9 14.6% 1,055,634 15.2% 186.8 8.0%5-10 yrs 325,230 29.7% 381.7 18.9% 1,470,093 21.1% 282.3 12.0%10-20 yrs 250,092 22.8% 690.8 34.2% 2,403,744 34.5% 674.8 28.8%Over 20 yrs 45,017 4.1% 556.0 27.5% 1,840,908 26.4% 1,129.8 48.2%
All Offerings4 148,053 100.0% 3,405.1 100.0% 6,960,745 100.0% 2,336.9 100.0%
MaturityNot available2 33 0.0% 0.0 0.0% 29 0.0% 0.4 0.0%Available 148,020 100.0% 3,405.1 100.0% 6,960,716 100.0% 2,336.6 100.0%1 yr or less 2,751 1.9% 30.0 0.9% 12,986 0.2% 46.2 2.0%1-5 yrs 3,509 2.4% 25.0 0.7% 37,724 0.5% 27.6 1.2%5-10 yrs 14,743 10.0% 138.9 4.1% 201,959 2.9% 65.0 2.8%10-20 yrs 64,581 43.6% 1,140.8 33.5% 1,993,843 28.6% 456.8 19.6%Over 20 yrs 62,436 42.2% 2,070.5 60.8% 4,714,204 67.7% 1,741.0 74.5%
Years RemainingNot available3 0 0.0% 0.0 0.0% 29 0.0% 0.4 0.0%Available 148,053 100.0% 3,405.1 100.0% 6,960,716 100.0% 2,336.6 100.0%1 yr or less 9,141 6.2% 87.8 2.6% 26,625 0.4% 31.2 1.3%1-5 yrs 24,905 16.8% 322.0 9.5% 215,537 3.1% 74.9 3.2%5-10 yrs 31,644 21.4% 504.3 14.8% 596,937 8.6% 139.1 6.0%10-20 yrs 55,918 37.8% 1,325.6 38.9% 2,560,474 36.8% 641.7 27.5%Over 20 yrs 26,445 17.9% 1,165.4 34.2% 3,561,143 51.2% 1,449.7 62.0%
1For securities, amount outstanding is principal amount.2The dated date was not available for these securities or offerinigs.3The maturity date was not available for these securities or offerings.4For offerings, amount outstanding is offering issuance amount. Principal amount traded is that of all securities inthe issue. Maturity and years remaining is that of security with the longest maturity. There were 2,155transactions excluded because they could not be assigned to an offering.
Note: Secondary derivatives are excluded. Also excluded are 32,063 transactions for which KennyBase informationwas unavailable.
Outstanding Securities/Offerings Transactions
Table A-17Distribution of Municipal Securities and Offerings: By Maturity
Sources: MSRB, KennyBase and Bloomberg

Number Percent Amount ($B) Percent Number Percent Amount ($B) Percent
Fixed Rate 1,075,725 100.0% 1,764.2 100.0% 6,579,129 100.0% 1,151.0 100.0%
MaturityNot available1 33 0.0% 0.0 0.0% 0 0.0% 0.0 0.0%Available 1,075,692 100.0% 1,764.2 100.0% 6,579,129 100.0% 1,151.0 100.0%1 yr or less 5,459 0.5% 25.6 1.4% 20,728 0.3% 49.8 4.3%1-5 yrs 109,184 10.2% 74.2 4.2% 330,270 5.0% 78.8 6.8%5-10 yrs 326,912 30.4% 255.1 14.5% 1,145,351 17.4% 172.0 14.9%10-20 yrs 504,044 46.9% 696.1 39.5% 2,526,245 38.4% 407.4 35.4%Over 20 yrs 130,093 12.1% 713.1 40.4% 2,556,535 38.9% 443.0 38.5%
Years RemainingNot available2 0 0.0% 0.0 0.0% 0 0.0% 0.0 0.0%Available 1,075,725 100.0% 1,764.2 100.0% 6,579,129 100.0% 1,151.0 100.0%1 yr or less 105,273 9.8% 93.5 5.3% 188,908 2.9% 59.2 5.1%1-5 yrs 367,927 34.2% 285.1 16.2% 1,042,612 15.8% 162.3 14.1%5-10 yrs 321,793 29.9% 358.4 20.3% 1,438,038 21.9% 207.0 18.0%10-20 yrs 242,214 22.5% 614.8 34.9% 2,290,402 34.8% 372.2 32.3%Over 20 yrs 38,518 3.6% 412.3 23.4% 1,619,169 24.6% 350.3 30.4%
Variable Rate 19,934 100.0% 254.6 100.0% 380,026 100.0% 1,180.9 100.0%
MaturityNot available1 0 0.0% 0.0 0.0% 29 0.0% 0.4 0.0%Available 19,934 100.0% 254.6 100.0% 379,997 100.0% 1,180.5 100.0%1 yr or less 19 0.1% 0.5 0.2% 432 0.1% 0.5 0.0%1-5 yrs 192 1.0% 2.8 1.1% 3,033 0.8% 9.2 0.8%5-10 yrs 1,231 6.2% 10.7 4.2% 10,277 2.7% 30.3 2.6%10-20 yrs 7,080 35.5% 47.3 18.6% 65,042 17.1% 152.7 12.9%Over 20 yrs 11,412 57.2% 193.3 75.9% 301,213 79.3% 987.8 83.7%
Years RemainingNot available2 0 0.0% 0.0 0.0% 29 0.0% 0.4 0.0%Available 19,934 100.0% 254.6 100.0% 379,997 100.0% 1,180.5 100.0%1 yr or less 303 1.5% 1.8 0.7% 1,689 0.4% 3.8 0.3%1-5 yrs 1,817 9.1% 9.8 3.8% 12,881 3.4% 24.5 2.1%5-10 yrs 3,437 17.2% 23.3 9.2% 31,561 8.3% 73.6 6.2%10-20 yrs 7,878 39.5% 76.0 29.8% 112,861 29.7% 301.8 25.6%Over 20 yrs 6,499 32.6% 143.7 56.5% 221,005 58.2% 776.8 65.8%
1The dated date was not available for these securities.2The maturity date was not available for these securities.
Note: Secondary derivatives are excluded. Also excluded are 32,063 transactions for which KennyBase informationwas unavailable, and transactions for which the coupon type of the security could not be determined.
Number of Securities Principal Amount Principal AmountNumber of TradesOutstanding Securities Transactions
Table A-18Distribution of Municipal Securities: By Maturity and Interest Rate Type
Sources: MSRB, KennyBase and Bloomberg

Number Percent Amount ($B) Percent Number Percent Amount ($B) Percent
All Securities 1,095,659 100.0% 2,018.7 100.0% 6,959,155 100.0% 2,331.9 100.0%
Not available1 19,269 1.8% 0.8 0.0% 5,502 0.1% 15.7 0.7%
Available 1,076,390 100.0% 2,017.9 100.0% 6,953,653 100.0% 2,316.2 100.0%Double Barrel 50,654 4.7% 57.6 2.9% 168,074 2.4% 63.3 2.7%General Obligation 557,196 51.8% 540.4 26.8% 2,080,105 29.9% 470.9 20.3%Revenue 468,540 43.5% 1,419.9 70.4% 4,705,474 67.7% 1,782.0 76.9%
Fixed Rate 1,075,725 100.0% 1,764.2 100.0% 6,579,129 100.0% 1,151.0 100.0%
Not available1 19,248 1.8% 0.8 0.0% 5,478 0.1% 15.7 1.4%
Available 1,056,477 100.0% 1,763.3 100.0% 6,573,651 100.0% 1,135.3 100.0%Double Barrel 50,549 4.8% 54.8 3.1% 165,755 2.5% 51.9 4.6%General Obligation 555,880 52.6% 524.2 29.7% 2,046,246 31.1% 373.2 32.9%Revenue 450,048 42.6% 1,184.4 67.2% 4,361,650 66.4% 710.2 62.6%
Variable Rate 19,934 100.0% 254.6 100.0% 380,026 100.0% 1,180.9 100.0%
Not available1 21 0.1% 0.0 0.0% 24 0.0% 0.0 0.0%
Available 19,913 100.0% 254.6 100.0% 380,002 100.0% 1,180.9 100.0%Double Barrel 105 0.5% 2.8 1.1% 2,319 0.6% 11.4 1.0%General Obligation 1,316 6.6% 16.2 6.4% 33,859 8.9% 97.7 8.3%Revenue 18,492 92.9% 235.6 92.5% 343,824 90.5% 1,071.8 90.8%
1The source of repayment was not available for these securities.
Note: Secondary derivatives are excluded. Also excluded are 32,063 transactions for which KennyBase informationwas unavailable, and transactions for which the coupon type of the security could not be determined.
Number of Securities Principal Amount Number of Trades Principal AmountOutstanding Securities Transactions
Table A-19Distribution of Municipal Securities: By Source of Repayment and Interest Rate Type
Sources: MSRB, KennyBase and Bloomberg

Number Percent Amount ($B) Percent Number Percent Amount ($B) Percent
All Securities 1,095,659 100.0% 2,018.7 100.0% 6,959,155 100.0% 2,331.9 100.0%Conduit 131,742 12.0% 513.0 25.4% 1,487,974 21.4% 780.7 33.5%Not Conduit 963,917 88.0% 1,505.8 74.6% 5,471,181 78.6% 1,551.2 66.5%
Fixed Rate 1,075,725 100.0% 1,764.2 100.0% 6,579,129 100.0% 1,151.0 100.0%Conduit 118,458 11.0% 362.8 20.6% 1,271,666 19.3% 170.8 14.8%Not Conduit 957,267 89.0% 1,401.3 79.4% 5,307,463 80.7% 980.2 85.2%
Variable Rate 19,934 100.0% 254.6 100.0% 380,026 100.0% 1,180.9 100.0%Conduit 13,284 66.6% 150.1 59.0% 216,308 56.9% 609.9 51.6%Not Conduit 6,650 33.4% 104.5 41.0% 163,718 43.1% 571.0 48.4%
Note: Secondary derivatives are excluded. Also excluded are 32,063 transactions for which KennyBase informationwas unavailable, and transactions for which the coupon type of the security could not be determined.
Number of Securities Principal Amount Number of Trades Principal AmountOutstanding Securities Transactions
Table A-20Distribution of Municipal Securities: By Conduit Status and Interest Rate Type
Sources: MSRB, KennyBase and Bloomberg

Number Percent Amount ($B) Percent Number Percent Amount ($B) Percent
All Securities 1,095,659 100.0% 2,018.7 100.0% 6,959,155 100.0% 2,331.9 100.0%Not available1 15,626 1.4% 0.1 0.0% 3,295 0.0% 12.7 0.5%
Available 1,080,033 100.0% 2,018.7 100.0% 6,955,860 100.0% 2,319.2 100.0%Taxable 26,304 2.4% 93.7 4.6% 102,133 1.5% 95.6 4.1%Not taxable 1,053,729 97.6% 1,925.0 95.4% 6,853,727 98.5% 2,223.6 95.9%
Fixed Rate 1,075,725 100.0% 1,764.2 100.0% 6,579,129 100.0% 1,151.0 100.0%Not available1 15,624 1.5% 0.1 0.0% 3,273 0.0% 12.7 1.1%
Available 1,060,101 100.0% 1,764.1 100.0% 6,575,856 100.0% 1,138.3 100.0%Taxable 24,891 2.3% 67.3 3.8% 75,045 1.1% 29.3 2.6%Not taxable 1,035,210 97.7% 1,696.8 96.2% 6,500,811 98.9% 1,109.0 97.4%
Variable Rate 19,934 100.0% 254.6 100.0% 380,026 100.0% 1,180.9 100.0%Not available1 2 0.0% 0.0 0.0% 22 0.0% 0.0 0.0%
Available 19,932 100.0% 254.6 100.0% 380,004 100.0% 1,180.9 100.0%Taxable 1,413 7.1% 26.4 10.4% 27,088 7.1% 66.3 5.6%Not taxable 18,519 92.9% 228.2 89.6% 352,916 92.9% 1,114.6 94.4%
1The taxable status of the interest on these securities was not available.
Note: Secondary derivatives are excluded. Also excluded are 32,063 transactions for which KennyBase informationwas unavailable, and transactions for which the coupon type of the security could not be determined.
Outstanding Securities Transactions
Table A-21Distribution of Municipal Securities: By Federal Tax Status and Interest Rate Type
Number of Securities Principal Amount Number of Trades Principal Amount
Sources: MSRB, KennyBase and Bloomberg

Number Number Number NumberObserva- of Obser- Median of Obser- Median of Obser- Median of Obser- Median
Securities tions Mean Median vations Spread vations Spread vations Spread vations Spread
All Trades 171,841 473,433 1.84% 1.66% 221,880 2.23% 108,309 1.12% 55,571 0.36% 19,336 0.10%
Remaining Maturity1 year or less 15,974 26,312 0.68% 0.47% 11,485 0.98% 7,600 0.38% 4,273 0.12% 1,800 0.02%1-5 years 45,561 80,072 1.17% 1.00% 36,385 1.58% 20,914 0.72% 11,099 0.30% 2,817 0.08%5-10 years 46,944 89,427 1.41% 1.20% 37,812 2.00% 21,861 0.90% 14,664 0.34% 2,824 0.13%10-20 years 48,336 156,362 2.05% 2.00% 75,971 2.50% 32,795 1.50% 16,504 0.49% 5,982 0.13%Over 20 years 15,026 121,260 2.58% 2.62% 60,227 3.00% 25,139 2.24% 9,031 0.75% 5,913 0.12%
Moodys RatingAaa Not insured 14,994 39,668 1.38% 1.03% 17,748 1.85% 9,072 0.75% 5,659 0.24% 2,489 0.06%Aaa Insured 85,711 257,131 1.96% 1.86% 119,901 2.36% 59,924 1.31% 28,322 0.45% 8,713 0.13%Aa 30,542 78,447 1.52% 1.20% 32,943 2.00% 19,026 0.80% 11,410 0.27% 3,816 0.11%A 11,627 33,851 1.89% 1.75% 18,616 2.09% 7,166 1.10% 3,024 0.33% 880 0.10%Baa 3,847 15,561 2.31% 2.18% 8,065 2.51% 3,142 1.63% 1,293 0.50% 702 0.14%Not Inv. Grade 303 1,812 2.65% 2.63% 850 3.00% 363 2.35% 156 1.65% 118 0.13%
SpreadsOver $1M
Principal Amount of Trade
Spreads were computed for each security-day where there was at least one customer purchase and one customer sale in the same security on the same day. The spread for a security-day is the difference between the equally-weighted average sale and purchase prices in that security on that day. Security-days were sorted by spread and the largest and smallest 0.5% spreads were deleted. Spreads for "All Trades" are the mean and median of the remaining spreads. Spreads by trade size were estimated by identifying security-days where there were both customer purchases and sales of the indicated size, computing the difference between the average sale and purchase prices for these transactions, and taking medians across security-days.
Number of
Table A-22Spreads in Fixed Coupon Municipal Securities
$25K or Less $25K - $100K $100K - $1MAll Trades
Sources: MSRB and KennyBase

Difference BetweenHighest andLowest Price
More Than One More Than One More Than One More Than OneOne Dealer Dealer One Dealer Dealer One Dealer Dealer One Dealer Dealer
0 16.7% 82.8% 36.9% 87.6% 43.9% 86.8% 49.7% 81.2%0 - 0.5 20.8% 9.9% 24.8% 8.4% 29.0% 10.9% 46.8% 18.6%0.5 - 1.0 18.0% 4.8% 13.0% 2.9% 10.3% 2.1% 3.1% 0.2%1.0 - 2.0 23.7% 1.8% 14.5% 1.0% 10.5% 0.3% 0.4% 0.0%2.0 - 3.0 11.8% 0.7% 7.6% 0.0% 4.3% 0.0% 0.0% 0.0%Over 3.0 9.1% 0.0% 3.2% 0.0% 2.0% 0.0% 0.0% 0.0%
Difference BetweenHighest andLowest Price
More Than One More Than One More Than One More Than OneOne Dealer Dealer One Dealer Dealer One Dealer Dealer One Dealer Dealer
0 20.8% 78.4% 25.9% 71.5% 27.4% 72.8% 42.2% 86.2%0 - 0.5 23.1% 11.3% 30.3% 15.0% 34.8% 15.4% 48.6% 13.4%0.5 - 1.0 21.5% 6.3% 21.3% 7.8% 20.2% 7.0% 6.8% 0.4%1.0 - 2.0 23.6% 3.8% 18.0% 5.1% 15.0% 4.7% 2.5% 0.0%2.0 - 3.0 8.1% 0.2% 4.1% 0.6% 2.6% 0.2% 0.0% 0.0%Over 3.0 3.0% 0.0% 0.3% 0.0% 0.0% 0.0% 0.0% 0.0%
This table compares the highest and lowest prices that customers were paid (or paid) for the same fixed coupon municipal security on the same day and of the specified principal amount. Only instances of more than one trade of equivalent principal amount in the same security on the same day are included. Security-days with more than one dealer purchasing (or selling) the same principal amount of the security from a customer are compared separately from security-days where only one dealer made purchases (or sales) of the reported size.
$10K $50K $100K $1M
Dealer Sales
Transaction Size$10K $50K $100K $1M
Transaction Size
Difference Between Maximum and Minimum Prices For the Same Fixed Coupon Municipal Security on the Same DayTable A-23
By Transaction Size and Activity By More Than One Dealer
Dealer Purchases
Sources: MSRB and KennyBase

Outstanding AverageNumber of Principal Daily
Trading Number of Amount Estimated SecondaryDays Bonds ($M) Total Secondary Turnover
First week 5 9,139 10,859 11,673 814 1.50%Rest of first month 16 9,139 10,859 880 880 0.51%Second through sixth month 105 9,139 10,859 2,637 2,637 0.23%
Bond Maturity Value
$1M or LessFirst week 5 7,557 1,649 1,774 125 1.52%Rest of first month 16 7,557 1,649 75 75 0.29%Second through sixth month 105 7,557 1,649 108 108 0.06%
$1M - $10MFirst week 5 1,357 4,686 4,927 240 1.03%Rest of first month 16 1,357 4,686 299 299 0.40%Second through sixth month 105 1,357 4,686 1,275 1,275 0.26%
Over $10 MFirst week 5 225 4,524 4,972 448 1.98%Rest of first month 16 225 4,524 506 506 0.70%Second through sixth month 105 225 4,524 1,254 1,254 0.26%
This table presents turnover rates during the first six months of a fixed coupon security's life. Data are for 9,139 securities that had been issued between December 1, 1999 and March 31, 2000 and that had an initial maturity of at least 1 year.
Traded ($M)
Table A-24Customer Transaction Volume and Turnover During the First Six Months of a Fixed Coupon Security's Life
Principal Amount
Sources: MSRB, KennyBase and Bloomberg

Outstanding AverageNumber of Principal Daily
Trading Number of Amount Estimated SecondaryDays Securities ($M) Total Secondary Turnover
First week 5 221 3,515 4,070 555 3.16%Rest of first month 16 221 3,515 938 938 1.67%Second through sixth month 105 221 3,515 5,881 5,881 1.59%
Bond Maturity Value
$1M or LessFirst week 5 8 6 6 0 0.00%Rest of first month 16 8 6 1 1 1.12%Second through sixth month 105 8 6 2 2 0.34%
$1M - $10MFirst week 5 118 637 676 39 1.23%Rest of first month 16 118 637 93 93 0.92%Second through sixth month 105 118 637 450 450 0.67%
Over $10 MFirst week 5 95 2,872 3,388 516 3.59%Rest of first month 16 95 2,872 844 844 1.84%Second through sixth month 105 95 2,872 5,429 5,429 1.80%
This table presents turnover rates during the first six months of a variable rate security's life. Data are for 221 security's that had been issued between December 1, 1999 and March 31, 2000 and that had an initial maturity of at least 1 year.
Traded ($M)
Table A-25Customer Transaction Volume and Turnover During the First Six Months of a Variable Rate Security's Life
Principal Amount
Sources: MSRB, KennyBase and Bloomberg
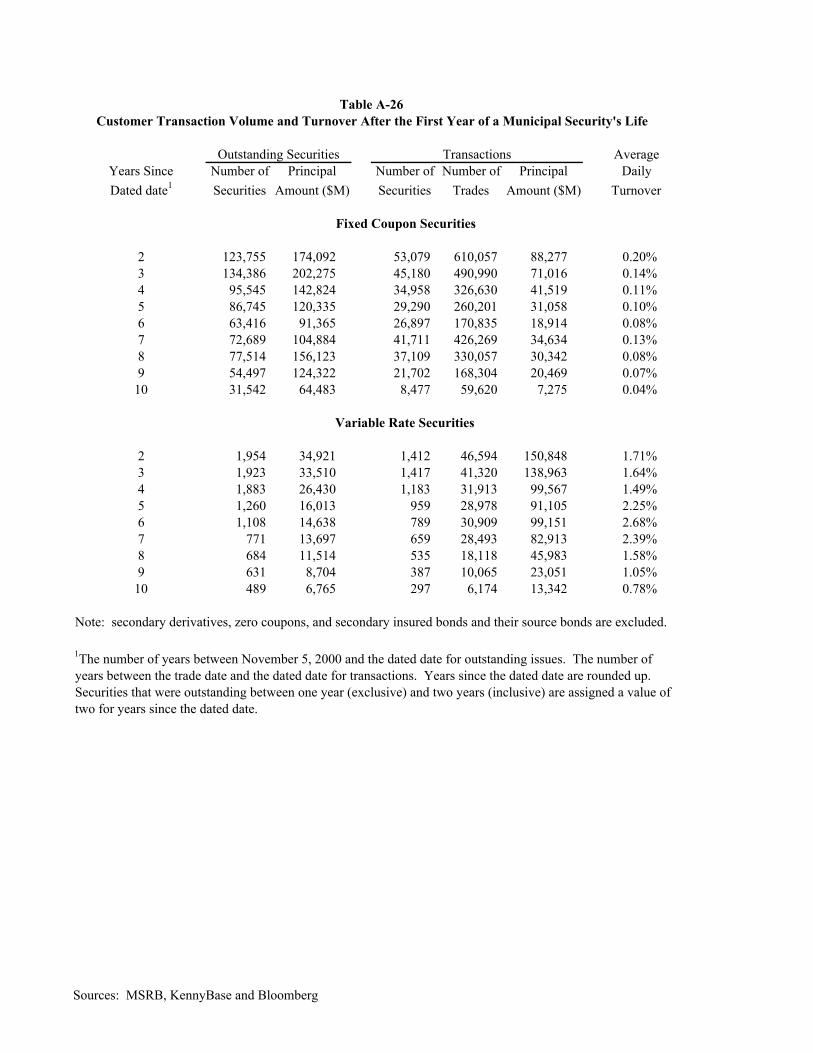
AverageYears Since Number of Principal Number of Number of Principal DailyDated date1 Securities Amount ($M) Securities Trades Amount ($M) Turnover
2 123,755 174,092 53,079 610,057 88,277 0.20%3 134,386 202,275 45,180 490,990 71,016 0.14%4 95,545 142,824 34,958 326,630 41,519 0.11%5 86,745 120,335 29,290 260,201 31,058 0.10%6 63,416 91,365 26,897 170,835 18,914 0.08%7 72,689 104,884 41,711 426,269 34,634 0.13%8 77,514 156,123 37,109 330,057 30,342 0.08%9 54,497 124,322 21,702 168,304 20,469 0.07%
10 31,542 64,483 8,477 59,620 7,275 0.04%
2 1,954 34,921 1,412 46,594 150,848 1.71%3 1,923 33,510 1,417 41,320 138,963 1.64%4 1,883 26,430 1,183 31,913 99,567 1.49%5 1,260 16,013 959 28,978 91,105 2.25%6 1,108 14,638 789 30,909 99,151 2.68%7 771 13,697 659 28,493 82,913 2.39%8 684 11,514 535 18,118 45,983 1.58%9 631 8,704 387 10,065 23,051 1.05%
10 489 6,765 297 6,174 13,342 0.78%
Note: secondary derivatives, zero coupons, and secondary insured bonds and their source bonds are excluded.
1The number of years between November 5, 2000 and the dated date for outstanding issues. The number ofyears between the trade date and the dated date for transactions. Years since the dated date are rounded up.Securities that were outstanding between one year (exclusive) and two years (inclusive) are assigned a value of two for years since the dated date.
Table A-26Customer Transaction Volume and Turnover After the First Year of a Municipal Security's Life
Fixed Coupon Securities
Variable Rate Securities
Outstanding Securities Transactions
Sources: MSRB, KennyBase and Bloomberg
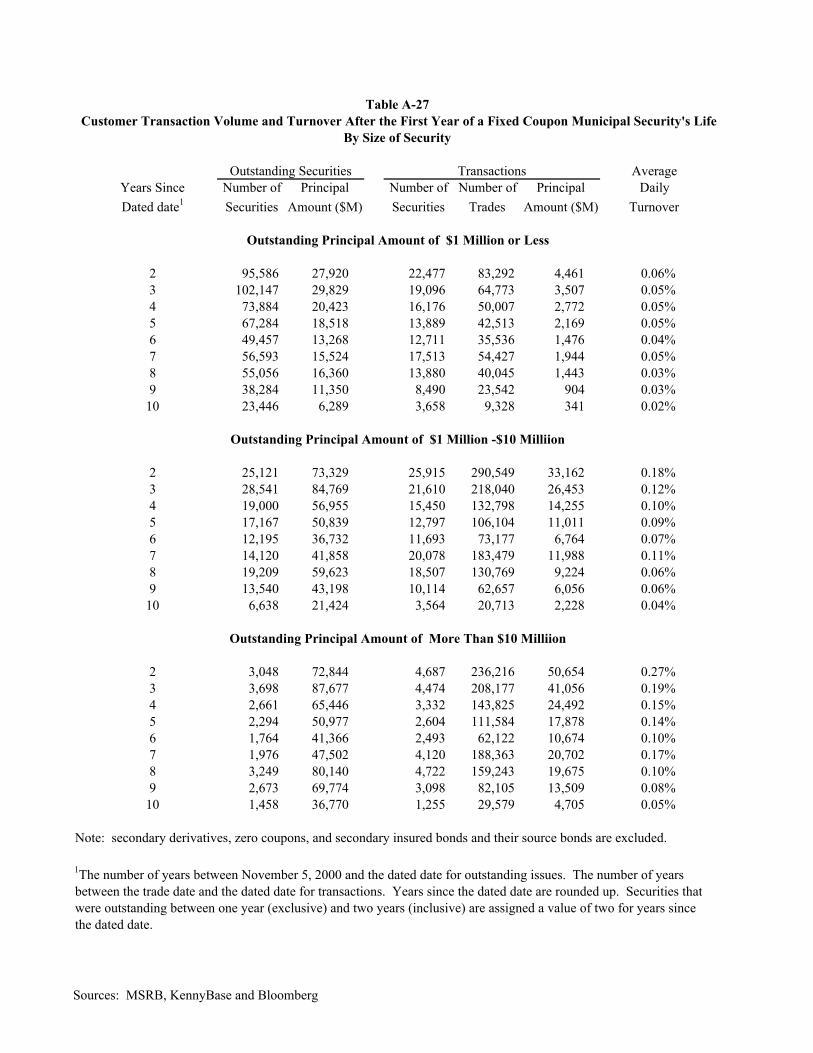
AverageYears Since Number of Principal Number of Number of Principal DailyDated date1 Securities Amount ($M) Securities Trades Amount ($M) Turnover
2 95,586 27,920 22,477 83,292 4,461 0.06%3 102,147 29,829 19,096 64,773 3,507 0.05%4 73,884 20,423 16,176 50,007 2,772 0.05%5 67,284 18,518 13,889 42,513 2,169 0.05%6 49,457 13,268 12,711 35,536 1,476 0.04%7 56,593 15,524 17,513 54,427 1,944 0.05%8 55,056 16,360 13,880 40,045 1,443 0.03%9 38,284 11,350 8,490 23,542 904 0.03%
10 23,446 6,289 3,658 9,328 341 0.02%
2 25,121 73,329 25,915 290,549 33,162 0.18%3 28,541 84,769 21,610 218,040 26,453 0.12%4 19,000 56,955 15,450 132,798 14,255 0.10%5 17,167 50,839 12,797 106,104 11,011 0.09%6 12,195 36,732 11,693 73,177 6,764 0.07%7 14,120 41,858 20,078 183,479 11,988 0.11%8 19,209 59,623 18,507 130,769 9,224 0.06%9 13,540 43,198 10,114 62,657 6,056 0.06%
10 6,638 21,424 3,564 20,713 2,228 0.04%
2 3,048 72,844 4,687 236,216 50,654 0.27%3 3,698 87,677 4,474 208,177 41,056 0.19%4 2,661 65,446 3,332 143,825 24,492 0.15%5 2,294 50,977 2,604 111,584 17,878 0.14%6 1,764 41,366 2,493 62,122 10,674 0.10%7 1,976 47,502 4,120 188,363 20,702 0.17%8 3,249 80,140 4,722 159,243 19,675 0.10%9 2,673 69,774 3,098 82,105 13,509 0.08%
10 1,458 36,770 1,255 29,579 4,705 0.05%
Note: secondary derivatives, zero coupons, and secondary insured bonds and their source bonds are excluded.
1The number of years between November 5, 2000 and the dated date for outstanding issues. The number of yearsbetween the trade date and the dated date for transactions. Years since the dated date are rounded up. Securities thatwere outstanding between one year (exclusive) and two years (inclusive) are assigned a value of two for years sincethe dated date.
Customer Transaction Volume and Turnover After the First Year of a Fixed Coupon Municipal Security's Life
Outstanding Principal Amount of $1 Million or Less
Outstanding Principal Amount of $1 Million -$10 Milliion
Table A-27
Outstanding Principal Amount of More Than $10 Milliion
By Size of Security
Outstanding Securities Transactions
Sources: MSRB, KennyBase and Bloomberg

AverageYears Since Number of Principal Number of Number of Principal DailyDated date1 Securities Amount ($M) Securities Trades Amount ($M) Turnover
2 184 71 54 263 62 0.35%3 169 73 39 467 63 0.34%4 250 99 33 197 35 0.14%5 142 44 33 214 26 0.24%6 144 63 33 194 30 0.19%7 57 31 22 152 52 0.66%8 96 44 34 165 32 0.28%9 108 50 38 317 34 0.27%
10 120 30 45 184 23 0.30%
2 1,045 5,019 583 7,123 7,850 0.62%3 1,054 4,805 628 7,748 7,327 0.60%4 1,041 4,603 577 7,168 4,451 0.38%5 752 3,174 470 5,867 4,168 0.52%6 616 2,529 341 4,155 3,737 0.58%7 383 1,737 263 3,904 2,805 0.64%8 289 1,257 214 2,691 2,263 0.71%9 302 1,336 156 2,377 2,157 0.64%
10 212 976 124 1,294 962 0.39%
2 725 29,832 775 39,208 142,935 1.89%3 700 28,631 750 33,105 131,574 1.82%4 592 21,728 573 24,548 95,081 1.73%5 366 12,795 456 22,897 86,911 2.68%6 348 12,046 415 26,560 95,385 3.13%7 331 11,930 374 24,437 80,056 2.65%8 299 10,213 287 15,262 43,688 1.69%9 221 7,318 193 7,371 20,860 1.13%
10 157 5,759 128 4,696 12,358 0.85%
Note: secondary derivatives, zero coupons, and secondary insured bonds and their source bonds are excluded.
1The number of years between November 5, 2000 and the dated date for outstanding issues. The number of yearsbetween the trade date and the dated date for transactions. Years since the dated date are rounded up. Securities thatwere outstanding between one year (exclusive) and two years (inclusive) are assigned a value of two for years sincethe dated date.
Outstanding Principal Amount of More Than $10 Milliion
By Size of Security
Outstanding Securities Transactions
Customer Transaction Volume and Turnover After the First Year of a Variable Rate Municipal Security's Life
Outstanding Principal Amount of $1 Million or Less
Outstanding Principal Amount of $1 Million -$10 Milliion
Table A-28
Sources: MSRB, KennyBase and Bloomberg
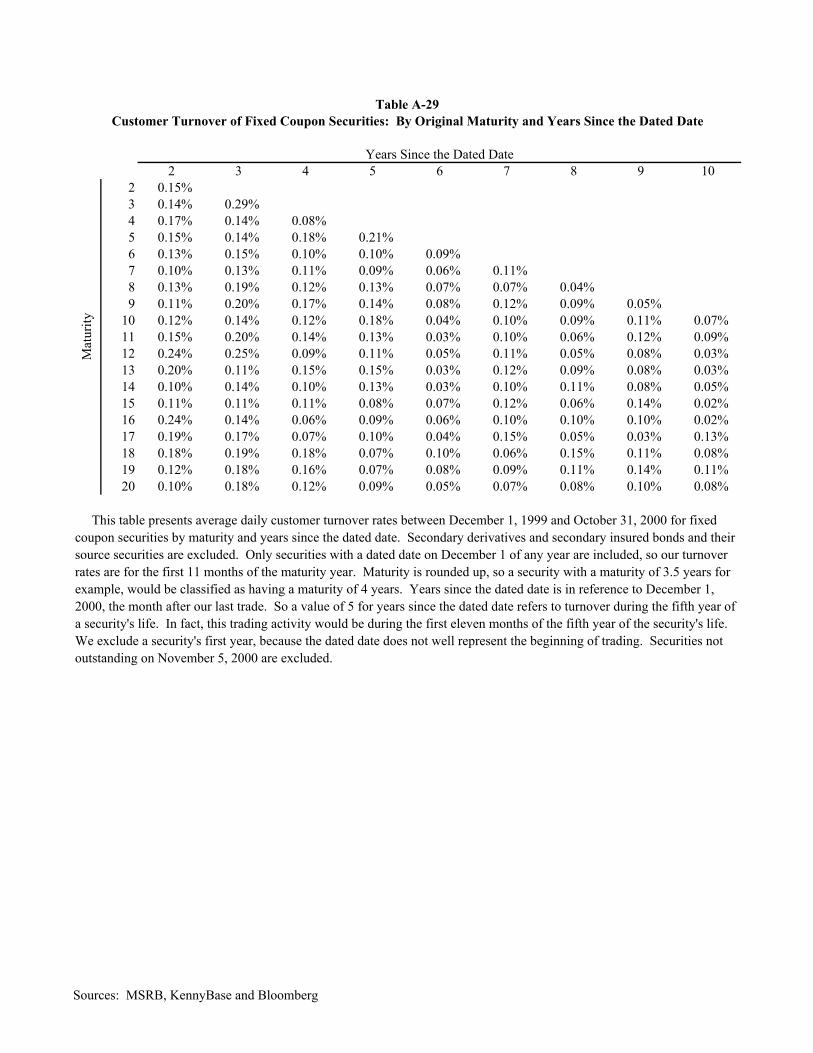
2 3 4 5 6 7 8 9 102 0.15%3 0.14% 0.29%4 0.17% 0.14% 0.08%5 0.15% 0.14% 0.18% 0.21%6 0.13% 0.15% 0.10% 0.10% 0.09%7 0.10% 0.13% 0.11% 0.09% 0.06% 0.11%8 0.13% 0.19% 0.12% 0.13% 0.07% 0.07% 0.04%9 0.11% 0.20% 0.17% 0.14% 0.08% 0.12% 0.09% 0.05%
10 0.12% 0.14% 0.12% 0.18% 0.04% 0.10% 0.09% 0.11% 0.07%11 0.15% 0.20% 0.14% 0.13% 0.03% 0.10% 0.06% 0.12% 0.09%12 0.24% 0.25% 0.09% 0.11% 0.05% 0.11% 0.05% 0.08% 0.03%13 0.20% 0.11% 0.15% 0.15% 0.03% 0.12% 0.09% 0.08% 0.03%14 0.10% 0.14% 0.10% 0.13% 0.03% 0.10% 0.11% 0.08% 0.05%15 0.11% 0.11% 0.11% 0.08% 0.07% 0.12% 0.06% 0.14% 0.02%16 0.24% 0.14% 0.06% 0.09% 0.06% 0.10% 0.10% 0.10% 0.02%17 0.19% 0.17% 0.07% 0.10% 0.04% 0.15% 0.05% 0.03% 0.13%18 0.18% 0.19% 0.18% 0.07% 0.10% 0.06% 0.15% 0.11% 0.08%19 0.12% 0.18% 0.16% 0.07% 0.08% 0.09% 0.11% 0.14% 0.11%20 0.10% 0.18% 0.12% 0.09% 0.05% 0.07% 0.08% 0.10% 0.08%
This table presents average daily customer turnover rates between December 1, 1999 and October 31, 2000 for fixed coupon securities by maturity and years since the dated date. Secondary derivatives and secondary insured bonds and their source securities are excluded. Only securities with a dated date on December 1 of any year are included, so our turnover rates are for the first 11 months of the maturity year. Maturity is rounded up, so a security with a maturity of 3.5 years for example, would be classified as having a maturity of 4 years. Years since the dated date is in reference to December 1, 2000, the month after our last trade. So a value of 5 for years since the dated date refers to turnover during the fifth year of a security's life. In fact, this trading activity would be during the first eleven months of the fifth year of the security's life. We exclude a security's first year, because the dated date does not well represent the beginning of trading. Securities not outstanding on November 5, 2000 are excluded.
Years Since the Dated Date
Table A-29Customer Turnover of Fixed Coupon Securities: By Original Maturity and Years Since the Dated Date
Mat
urity
Sources: MSRB, KennyBase and Bloomberg

Securities With Principal Amount of $1 Million or Less
2 3 4 5 6 7 8 9 102 0.05%3 0.07% 0.04%4 0.05% 0.05% 0.07%5 0.05% 0.05% 0.05% 0.05%6 0.05% 0.07% 0.05% 0.06% 0.04%7 0.05% 0.06% 0.05% 0.04% 0.04% 0.04%8 0.05% 0.06% 0.05% 0.04% 0.05% 0.06% 0.03%9 0.06% 0.07% 0.04% 0.05% 0.03% 0.05% 0.05% 0.05%
10 0.06% 0.06% 0.07% 0.06% 0.03% 0.05% 0.04% 0.05% 0.03%11 0.06% 0.06% 0.08% 0.05% 0.04% 0.03% 0.04% 0.05% 0.03%12 0.06% 0.06% 0.05% 0.05% 0.06% 0.04% 0.04% 0.03% 0.03%13 0.05% 0.06% 0.05% 0.05% 0.04% 0.04% 0.04% 0.03% 0.05%14 0.05% 0.04% 0.04% 0.05% 0.03% 0.04% 0.03% 0.02% 0.03%15 0.05% 0.03% 0.07% 0.05% 0.05% 0.05% 0.03% 0.03% 0.03%16 0.03% 0.05% 0.08% 0.09% 0.02% 0.03% 0.03% 0.04% 0.03%17 0.07% 0.06% 0.05% 0.06% 0.03% 0.03% 0.04% 0.05% 0.02%18 0.07% 0.02% 0.07% 0.06% 0.03% 0.03% 0.02% 0.02% 0.04%19 0.06% 0.08% 0.06% 0.03% 0.04% 0.05% 0.05% 0.02% 0.02%20 0.06% 0.04% 0.09% 0.05% 0.05% 0.05% 0.06% 0.05% 0.04%
Securities With Principal Amount Between $1 Million and $10 Million
2 3 4 5 6 7 8 9 102 0.26%3 0.12% 0.47%4 0.22% 0.15% 0.10%5 0.17% 0.17% 0.18% 0.18%6 0.13% 0.19% 0.12% 0.09% 0.13%7 0.10% 0.14% 0.12% 0.13% 0.06% 0.14%8 0.14% 0.13% 0.14% 0.10% 0.05% 0.06% 0.04%9 0.14% 0.23% 0.09% 0.18% 0.07% 0.14% 0.08% 0.06%
10 0.14% 0.13% 0.12% 0.18% 0.04% 0.14% 0.10% 0.10% 0.11%11 0.19% 0.21% 0.11% 0.11% 0.02% 0.13% 0.05% 0.13% 0.14%12 0.21% 0.19% 0.13% 0.14% 0.05% 0.10% 0.06% 0.07% 0.07%13 0.21% 0.14% 0.21% 0.13% 0.03% 0.07% 0.07% 0.12% 0.04%14 0.12% 0.14% 0.13% 0.10% 0.05% 0.08% 0.09% 0.07% 0.05%15 0.13% 0.15% 0.10% 0.08% 0.03% 0.11% 0.04% 0.05% 0.01%16 0.19% 0.12% 0.07% 0.11% 0.09% 0.06% 0.05% 0.08% 0.02%17 0.19% 0.12% 0.10% 0.16% 0.01% 0.08% 0.05% 0.02% 0.09%18 0.12% 0.22% 0.24% 0.10% 0.20% 0.08% 0.13% 0.11% 0.11%19 0.18% 0.19% 0.18% 0.07% 0.13% 0.06% 0.09% 0.05% 0.16%20 0.09% 0.19% 0.10% 0.07% 0.03% 0.10% 0.09% 0.10% 0.09%
Years Since the Dated Date
See note for previous table. Because of the small number of securities, results for security's with more than $10 million principal amount outstanding are not presented.
Table A-30Customer Turnover of Fixed Coupon Securities: By Original Maturity and Years Since the Dated Date
Years Since the Dated Date
Mat
urity
Mat
urity
Sources: MSRB, KennyBase and Bloomberg
Appendix B: Additional Technical Information A. Data Sources
This report uses two types of data on municipal securities: data on transactions and data on securities outstanding. Transaction data was obtained from the MSRB’s Transaction Reporting System. The identities, characteristics, and values of municipal securities outstanding were obtained from Standard & Poor’s KennyBase Data Service. Bloomberg was used to confirm the characteristics of some securities. Neither the KennyBase nor Bloomberg were designed to estimate the value of municipal securities outstanding. As a result, while we and the staff at S&P put considerable efforts into estimating the value of outstanding municipal securities, this estimate remains inexact. 1. The MSRB’s Transaction Reporting System MSRB Rule G-14 requires that municipal securities dealers report to the MSRB information on their trades with other dealers and with customers.1 The National Securities Clearing Corporation (“NSCC”) acts as the MSRB’s agent in receiving information on inter-dealer trades. As a matter of course, dealers report their inter-dealer municipal securities transactions to the NSCC, a clearing corporation, for comparison and settlement. The MSRB requires that dealers also provide certain other information not required to clear the trade, including, for example, the time of the trade. The NSCC forwards information on these inter-dealer trades to the MSRB. The MSRB also requires that dealers report their trades with customers separately to the MSRB. The MSRB’s transaction database is the combination of the customer and inter-dealer files.
The MSRB makes these data available to subscribers through five different reports: an inter-dealer report, a combined daily report, a trade detail report, a monthly comprehensive report and a daily comprehensive report.2 Subscribers to these reports
1 For additional information on the MSRB transaction reporting system see http://www.msrb.org. 2 The inter-dealer report has been available since January 23, 1995. It contains summary data about reported inter-dealer transactions for issues that traded four or more times in one day ("frequently traded issues"). On August 24, 1998, the Board made the combined report available. It contains summary data for reported transactions in issues that traded four or more times in the inter-dealer and the dealer/customer market. Both of these reports are made available by 7:00 a.m. the day after the transactions were made at a subscription cost of $15,000 per year. These reports contain less information than the reports described below that have been subsequently made available, but there are still a few subscribers. The trade detail report first became available on January 19, 2000 and contained information on each trade used to compile the inter-dealer and combined daily reports for frequently traded issues described above. On June 23, 2003 the trading threshold for this report was completely removed; it now contains information on all reported transactions in municipal securities. It is also made available on the morning of T+1. This report is available to subscribers free of charge. The Board has been making the monthly comprehensive report available since October 25, 2000. It contains information on all reported transactions in municipal securities. It is available to subscribers for $2,000 a year on a delayed basis, once a month, covering the preceding month's trading. This report essentially has been superseded by the daily comprehensive report described below, but there are still a few subscribers.
B-1

include vendors who package this information and make it available to their own subscribers, bond pricing services, alternative transaction systems, dealers, institutional investors and a few academics. The Bond Market Association subscribes to the trade detail report, which is available on T+1, and the daily comprehensive report and makes it available to the public on its website.
The raw data serves as an audit trail for SEC and NASD investigation and enforcement staff.
The MSRB intends that their database contain secondary market inter-dealer trades and trades between dealers and customers. However, some dealers include their purchases from issuers during the offering process in the customer files that they forward to the MSRB. These trades appear as purchases from customers on the distribution day. We estimated that there were about 15,000 trades with a principal amount of $23 billion that likely were purchases from issuers. These trades account for a tiny fraction of one percent of trades and a little less than one percent of the principal amount traded.3 2. Standard and Poor’s KennyBase Data Service S&P maintains a database, the KennyBase Data Service, that contains information on all outstanding municipal securities. The MSRB is a subscriber to this database and receives daily updates on the characteristics of outstanding municipal securities. This allows the MSRB to effectively maintain an updated copy of the KennyBase. S&P graciously allowed the MSRB to provide SEC staff with data from the KennyBase. The MSRB did this in two ways.
First, the MSRB attached selected characteristics of traded securities as of December 2000 to each trade record. These characteristics included the maturity and the dated date, the Moody’s and S&P ratings, and the insured status of the security. Second, the MSRB provided the staff with a copy of the KennyBase at three points in time (“snapshots”) in the vicinity of our transaction period. These dates are December 12, 1999; February 19, 2000; and November 5, 2000. We used these snapshots to modify or expand on the KennyBase variables already attached to the trade records. For characteristics of a security that were unlikely to change over time, such as the dated date or the maturity date, we used the latest KennyBase data available. For these two date fields, the source likely was the December 2000 data already attached to the record. For fields not already attached to the record by the MSRB, such as the taxable status of the interest on the security, the source usually was the November snapshot. For characteristics that might have changed over our study period, such as the security’s rating, we used the KennyBase snapshot that was nearest in time to the date of the trade.
Finally, the Board began making the daily comprehensive report available on November 1, 2001. It contains daily information on all reported transactions in municipal securities that occurred one week ago and is available to subscribers for $2,000 a year. 3While we were able to estimate the number and value of these trades, we were not able to identify most of the specific transactions. So these trades remain in our database.
B-2
The snapshots also allowed us to measure the principal amount of outstanding
municipal securities at these points in time. This was useful for putting transaction activity in context. For example, measures of turnover required knowledge of the outstanding principal amount of municipal securities at a point in time. We were unable to match about 17,000 securities reported for 32,000 customer trades (0.5% of all trades) to any of our snapshots. Some of these securities appear to be corporate or mortgage-backed issues. Some of the CUSIPs may be erroneous. Only 21 inter-dealers trades in 3 securities could not be matched with the KennyBase data.4
Even when we were able to successfully match a trade record with a snapshot, not
all KennyBase variables had values. For example, we were not able to determine the coupon type for 968 securities associated with 3,745 trades that we successfully matched with KennyBase data. 3. Bloomberg Among other products, Bloomberg, L.P. makes available information on many kinds of securities through a proprietary terminal. Our only access to Bloomberg data was through a Bloomberg terminal. We were unable to access this data directly for batch processing. We used Bloomberg primarily to check the characteristics of certain municipal securities.
B. Identifying Outstanding Municipal Securities and Their Value
Tracking municipal securities and their value is not a trivial exercise. While the KennyBase was not designed specifically for this purpose, S&P staff gave generously of their time in an effort to determine how to use the KennyBase to identify municipal securities that were outstanding and the remaining principal amount of these securities. While it could not be used for batch processing, Bloomberg was useful for confirming the characteristics of the largest securities. 1. Zero coupon bonds Zero coupon bonds do not pay a periodic coupon. Instead, investors pay a certain amount (the offering amount) to purchase the bond, and at maturity receive the offering amount plus all accrued interest (the maturity, or par, amount). The KennyBase provides the amount published on the Official Statement for these securities, which may be expressed as the initial amount offered or the accreted maturity value. So for zero coupon bonds, the amount field contains the offering amount for some bonds, and the maturity amount for others.
4 The CUSIPs for inter-dealer trades are vetted, in a sense, as another dealer must report the same number for the trade to clear. No such vetting occurs for the customer trades.
B-3

In 2000, S&P began including a field that indicated whether the reported amount for a zero coupon bond was the offering or maturity amount. While this field usually is populated for securities with dated dates of 1997 or later, most securities offered earlier have no indication as to whether the amount is the offering or the maturity amount. Overall, the amount indicators were included for about 40% of zero coupon bonds.
To estimate the value of zero coupon bonds outstanding, we identified over 900
offerings with large values of zero coupon bonds and selected one zero coupon from each offering. We used Bloomberg to determine whether the amount reported in the KennyBase was the offering or maturity amount, and assigned this categorization to all zero coupon bonds in the offering.5 Bloomberg typically reports both the offering and maturity amounts.
For zero coupon bonds not in an offering specifically categorized using
Bloomberg, we used the KennyBase classification of the amount, if available. If the amounts for one or more zero coupon bonds in an offering were classified by the KennyBase, we classified any remaining zero coupon bonds in the same offering the same way.
The amounts for the remaining zero coupon bonds that we did not classify using
Bloomberg or the KennyBase indicator were assumed to be offering amounts if the amount was not evenly divisible by 1,000.6
For the remaining zero coupon bonds with amounts not evenly divisibly by 1,000,
we computed the total amount reported in the KennyBase for all securities in the offering and compared this value to the amount of the offering, where zero coupons are valued at the offering price. If the sum of the amounts for all securities in the offering exceeded the offering amount, we then assumed that the amounts for the zero coupon bonds were the maturity amount.7
We used Bloomberg again to determine the type of amount reported in the
KennyBase for the CUSIP with the largest amount for each of the remaining offerings. Many of these amounts could not be assigned because Bloomberg did not report the amount, did not have information on the security, or the amount reported by Bloomberg was different that that reported in the KennyBase.
The amounts for the remaining zero coupon bonds were randomly assigned to be
maturity or offering amounts, with one-fourth the remaining amounts assumed to be offering amounts and three-fourths assumed to be maturity amounts.8 5 For zero coupon bonds classified by us as being part of the same offering, it is very rare for the KennyBase to report the maturity amount for one zero coupon bond and the outstanding amount for another zero coupon bond. 6 The vast majority (over 90%) of amounts not evenly divisible by 1,000 that were classified using Bloomberg or the KennyBase amount indicator were classified as offering amounts. 7 Note that about 90% of the time, this methodology gave the same results as that obtained from Bloomberg or the KennyBase amount indicator, when data from these sources were available. 8 This was the ratio we observed for the residual CUSIPs that we were able to classify using Bloomberg.
B-4

The amount types for zero coupon bonds accounting for over 90% of the
outstanding maturity amount were identified using either Bloomberg or the KennyBase code. Only 2% of the outstanding maturity amount of zero coupon bonds was attributable to bonds whose amount type had been assigned randomly as either maturity or offering amount.
The yield was used to determine the maturity amount of securities reported using
the offering amount and the offering amount of securities reported using the maturity amount.9 2. Called Securities The KennyBase includes securities that were redeemed by the issuer before they matured, but also provides a means of identifying these securities. To further enhance the identification of called securities, we used Bloomberg to check about one thousand of the largest securities that did not trade during our sample period. Securities identified as called (by either the KennyBase or Bloomberg) were deleted from our database of outstanding securities as of the effective date of the redemption. Some called securities were not identified as such and remain in the database. This will contribute to an upward bias in our estimate of municipal securities outstanding. 3. Sinking Funds and Partial Calls We used the sinking fund schedules available from the KennyBase to net from the original offering and maturity amounts any scheduled redemptions that occurred on or before the date of a snapshot. Actual redemptions are not available.
We also netted from the outstanding amount the principal amount of any partial calls that took place on or before the date of our snapshot. The amount for about one-third of the partial calls were not available. This will contribute to an upward bias in our estimate of municipal securities outstanding. 4. Partial Refundings In an advanced refunding, issuers sometimes choose to refund only part of a security. The CUSIP Service Bureau’s most common method to reflect a partial refunding is to assign two new CUSIPs. One contains the escrowed amount, the other the remainder. The original CUSIP is no longer used. It was necessary for us to identify these original CUSIPs and delete them from our database. With the assistance of S&P staff, we were able to develop a method of identifying a large number of these partial refundings. We improved the accuracy of our identifications by using Bloomberg to check the status of about 1,000 large securities that the KennyBase had not classified as having been refunded but which shared a characteristic of partially refunded securities
9 The yield for about 2% of zero coupon bonds (accounting for 1% of the reported amount) was missing. Either the offering or the maturity amount could not be determined for these securities.
B-5

and which did not trade during our sample period.10 The original CUSIPs in partial refundings are excluded from our database of outstanding securities as of the effective date of the refunding. Sometimes only one new CUSIP is assigned in partial refundings the escrowed amount. To properly track the value of outstanding municipal securities, one must net the escrowed amount from the original security. We cannot identify these securities using the KennyBase. This will contribute to an upward bias in our estimate of municipal securities outstanding. 5. Remarketed Securities
Remarketed securities sometimes are assigned new CUSIPs. For example, a variable rate security put back to the issuer may be reissued and delivered to another investor, whereupon a new CUSIP may be assigned to the remarketed security. The KennyBase can be used to identify both the security that was created through a remarketing and the source security. If the KennyBase indicated that the security had been completely remarketed, it was considered no longer outstanding as of the remarketing date. Otherwise, we netted the outstanding amount of the remarketed CUSIP from that of the source CUSIP as of the remarketing date.
It is possible that a completely remarketed security will remain in the KennyBase,
while some of the securities that were created with this source security will have matured and been deleted from the database. In these instances, the sum of the remaining securities created through the complete remarketing will not equal the value of the source security, and we will erroneously assume that a partial remarketing took place and net only the value of the remaining remarketed securities from the source security. This will bias upwards our estimates of principal amount outstanding. 6. Secondary Insured Securities
Sometimes an investor will insure its holdings of a municipal security. The insured portion is assigned a new CUSIP. The old CUSIP remains unchanged. The KennyBase seldom obtains information on the size of the insured component, and even when it can it does not revise the amount of the source CUSIP.
We were able to use the KennyBase to identify both the securities that were the
insured component of another security and the source security. The amount of the insured component, when available, was not used when estimating the amount of
10 The KennyBase identifies CUSIPs that are “related” to other CUSIPs. For example, a CUSIP that was created during a partial refunding of another CUSIP would be considered to be related to the original (refunded) CUSIP. We identified securities that were related to another security, were not classified as the original security in a partial refunding by our methodology, and which did not trade during our sample period. We checked the status of the 1,000 largest of these on Bloomberg and classified some as the original CUSIP in a partial refunding.
B-6

outstanding municipal securities, since this amount is already included in that of the source security. 7. Secondary Derivatives
Derivative municipal securities can be created in the secondary market. For example, a securities firm might use a fixed coupon security to create a floating rate instrument and an inverse floater. A firm also might reoffer a security and add a put. If the put is severable, it will have its own CUSIP. Secondary derivatives were identified using the KennyBase. The value of secondary derivatives was excluded when estimating the value of outstanding municipal securities. The KennyBase sometimes does not identify a secondary derivative as such, so some of the securities in our database are not correctly classified as secondary derivatives. This will bias upward our estimates of the principal amount of municipal securities outstanding. C. Checking for Biases in Our Estimate of Outstanding Municipal Securities We suspect that there are two potential sources of serious bias in our estimate of outstanding municipal securities. The first is the inclusion of securities, and principal amount, that are no longer outstanding. The staff at S&P were very helpful and creative in their efforts to use the KennyBase to estimate the value of outstanding municipal securities, but acknowledged that it had not been designed for this purpose. As a result, we may, in particular, have inadvertently included some called, partially refunded, or remarketed securities. We also may have missed some partial calls. It also is possible that we misclassified some secondary derivatives or secondary insured issues. This would bias estimates of the value of outstanding municipal securities upwards. The second source of bias results from the large number of municipal securities in the KennyBase with missing amounts. Excluding their value will bias estimates of the outstanding value of municipal securities downwards. 1. Overstatement of Outstanding Amounts
We measured the magnitude of the first of these biases – the overstatement of outstanding amounts due to the inclusion of securities that were no longer outstanding, the erroneous inclusion of secondary derivatives or secondary insured issues, and the overstatement of the residual principal amount of outstanding securities – using a sample of 197 randomly selected municipal securities. The sample was created by placing each security that we believed to be outstanding (excluding securities created in the secondary market) into a cell based on the size of the security and our prior beliefs about the likelihood of the security actually having been retired. While virtually all securities had a non-zero probability of being included in the sample, we oversampled from those cells that contained large securities and that contained securities that we thought were more
B-7

likely to have, in fact, been retired.11 Appendix C describes the sampling process in more detail.
The staff at S&P very generously agreed to confirm the outstanding principal
amount of each of these 197 securities on November 5, 2000. They determined whether we had properly interpreted the KennyBase data for each of these securities. They also examined the Official Statements to confirm that the amounts reported in the KennyBase were accurate, and that the security was not a secondary derivative or secondary insured issue. Lastly, they contacted the trustee for each of these securities to confirm that the security had been outstanding on November 5, 2000 and to determine the outstanding principal amount on this date.
The staff at S&P determined that 18 of these securities should not have been
included in our database of outstanding municipal securities (exclusive of issues created in the secondary market). Two were secondary derivatives. The other 16 had been called in full before November 5, 2000. In addition, another 13 securities had incomplete information on partial calls or otherwise resulted in our overvaluing the principal amount of the security.
We estimated the magnitude of the bias by extrapolating the overstatement in
each sampled cell to the entire population. The results of this methodology suggest that for securities with a non-missing value for their principal amount, our database overstates the principal amount of municipal securities outstanding by about $85 billion, or 4%. 2. Missing Principal Amounts
The KennyBase did not contain amounts for about 170,000 securities issued in the primary market12, or 16% of all outstanding municipal securities. Only about one-third of the records for securities issued before 1990 had amounts. About 90% of the records for securities issued since 1990 had amounts. We used two methods to estimate the value of municipal securities with missing amounts. The first method involved randomly selecting one thousand securities with missing amounts, obtaining the Bloomberg amount when available, and applying the resulting average to all securities with a missing KennyBase amount. Bloomberg reported that about three percent of the sample of securities with missing amounts had been called or refunded. Bloomberg reported an amount for about one-quarter of the remaining securities with an average principal amount of about $1 million. Assuming that all securities with missing amounts (including those where the amount was also missing in Bloomberg) also averaged a principal amount of $1 million would suggest that the municipal securities with missing amounts in the KennyBase might account for about $170 billion. We suspect that this is an overestimate of the bias since securities whose amounts were identified by Bloomberg likely are larger than those that were not.
11 Securities in 3 of the 41 cells with aggregate principal amounts equal to 0.2% of the total were not sampled. 12 Secondary insured issues and secondary derivatives were excluded.
B-8

B-9
The second method used the transaction activity of securities with missing amounts to estimate the underlying principal amount outstanding that likely generated this activity. We determined the principal amount traded by the year of the dated date13 and the coupon type for all municipal securities, classified by whether the KennyBase amount was available or missing. We estimated the value of the missing KennyBase amount for each year-coupon type by dividing the principal value traded of these securities by the turnover of those securities for which the KennyBase did have amounts. Summing across years and coupon types suggest that our estimate of the principal amount outstanding may be understated by about $100 billion. This method likely understates the bias since securities with small principal amounts have lower turnover rates than those with large principal amounts, and securities with missing amounts are, on average, smaller than those whose amounts were reported in the KennyBase. So we suspect that securities with missing amounts in the KennyBase likely resulted in an understatement of the principal amount outstanding ranging from $100 billion to $170 billion, or about 5%-9% of our estimate of total outstanding principal amount. 3. Summary If we combine our estimate of an approximate 4% upward bias due to the overstatement of outstanding amounts with our estimate of an approximate 5%-9% downward bias due to missing principal amounts, then the net effect is a small downward bias of about 1%-5%. That is, the actual principal amount of municipal securities outstanding may be slightly larger (by a few percent or a few tens of billions of dollars) than the estimates that we have provided.
13 Securities with dated dates before 1990 were grouped into three “year” cells: pre-1980, 1980-1984, and 1985-1989.

Appendix C: Potential Overstatement of Amount of Municipal Securities
We used the KennyBase, as well as S&P staff expertise, to identify the population and principal amount of municipal securities outstanding on November 5, 2000. We also identified those securities that had been created in the secondary market (secondary derivatives and secondary insured securities). We provided an estimate of the principal amount of these securities, excluding those created in the secondary market. This estimate may be overstated if in some cases 1) the KennyBase did not correctly identify securities as having been created in the secondary market; 2) the KennyBase did not capture all retirements, for example, missing calls or remarketings; or 3) the KennyBase overstated the principal amount of outstanding securities as of a certain date, by missing partial calls or partial refundings, for example.
To measure the accuracy of our estimate of the aggregate principal amount of outstanding municipal securities, we provided S&P staff with a random sample of 200 municipal securities from the population of municipal securities that we determined to be outstanding on November 5, 2000, excluding securities that were created in the secondary market. S&P staff reviewed the Official Statements and contacted the trustees for each of these securities to confirm that the securities had not been issued in the secondary market; to determine if they were, in fact, still outstanding on November 5, 2000; and to determine what their principal amounts were on this date. The differences between the actual amounts outstanding for the sampled securities on November 5, 2000 ($0 in the case of securities that had been retired by this date) and those computed using the KennyBase were extrapolated to estimate the bias for our entire population of municipal securities.
The 200 sampled securities were randomly selected; virtually all securities in the
population had a non-zero probability of being selected. These probabilities were not identical across securities, but were instead determined by weighting factors described in detail below. Securities with a higher than average probability of being selected included 1) larger securities and 2) securities with characteristics that indicated an above-average probability that their principal amounts might be overstated.
The population of municipal securities was allocated among 41 cells
corresponding to various combinations of security characteristics (see Exhibit C-1). The first cell contains securities with principal amounts of less than $100,000. While there are about 184,000 of these securities, they accounted for only 0.5 % of the outstanding principal amount. Errors in the principal amounts of these securities will have little affect on the aggregate estimate. We randomly selected 5 municipal securities from the CUSIPs in this cell.
We selected 195 securities from the remaining 40 cells. The number of securities
selected from each cell was proportional to 1) the number of securities in the cell and 2) a weighting factor. Cells that we thought were more likely to contain securities that, in fact, were no longer outstanding had larger weights. Cells that contained larger securities also had larger weights.
C-1

The overall weighting factor was based on 5 sub-weights as described below.
1) Size Weight: Municipal securities were placed into four groups based on their
principal amount on November 5, 2000. Securities with a principal amount of more than $100,000 but less than or equal to $1 million were assigned a sub-weight of 1; those with principal amounts of more than $1 million but less than or equal to $10 million were assigned a sub-weight of 10; those with principal amounts of more than $10 million but less than $100 million were assigned a sub-weight of 100; those with principal amounts of more than $100 million were assigned a sub-weight of 1000. Everything else equal, securities in cells comprised of larger securities were more likely to be selected than securities in cells comprised of smaller securities. This difference is roughly proportionate to the difference in principal amounts. For example, a security with a principal amount of $200 million was 1000 times more likely to be selected for the sample than a security with a principal amount of $200,000, everything else equal.
2) Interest Rate Type Weight: Municipal securities were placed into two groups based
on their interest rate type. Cells containing fixed rate securities were assigned a sub-weight of 1; those containing variable rate securities were assigned a sub-weight of 2. Everything else equal, variable rate securities were more likely to be selected for the sample than fixed rate securities. We suspected that it might be particularly difficult for the staff at S&P to keep track of remarketings, and thought that our population of variable rate securities might contain a greater proportion of retired securities than our population of fixed rate securities.
3) Trade Weight: Municipal securities were placed into two groups based on whether
they traded at least once during the previous year. Cells comprised of securities that traded were assigned a sub-weight of 1, other cells were assigned a sub-weight of 2. Everything else equal, securities that had not been traded during the previous year were twice as likely to be selected for the sample as securities that had been traded. We suspect that securities that have not been traded recently are more likely to have been retired, with this retirement missed by S&P.
4) Age Weight: Municipal securities were placed into three groups based on their age,
with age determined by the dated date. Cells comprised of securities with dated dates after 1995, or that traded at least once during the last year, were assigned a sub-weight of 1. Cells containing securities that did not trade and had dated dates between 1990 and 1994 were assigned sub-weights of 2. Cells containing securities that did not trade and had dated dates before 1990 were assigned sub-weights of 3. Among securities that did not trade recently, everything else equal, older securities were more likely to be selected than more recently issued securities. We suspect that older securities are more likely to have been retired, with this retirement missed by S&P.
C-2

5) Callable Weight: Municipal securities were placed into two groups based on whether or not they were callable. Variable rate securities, securities that were not callable, securities that traded during the last year, or securities that had dated dates after 1994 were assigned a sub-weight of 1. Older fixed rate securities that did not trade and that were callable were assigned a sub-weight of 2. Everything else equal, among fixed rate securities that did not trade during the last year and that had dated dates before 1995, those that the KennyBase identified as being callable were twice as likely to be selected for the sample as those not identified as being callable. We suspect that older callable securities are more likely to have been retired than older non-callable securities, with this retirement missed by S&P.
The overall weight used to determine the number of securities selected from a cell was equal to the product of the sub-weights associated with the cell. For example, a security in the cell containing fixed rate securities with a principal amount outstanding of more than $100,000 and less than $1 million that traded during the previous year (cell 7) would have a weight of 1 [=(size weight of 1)x(interest rate type weight of 1)x(trade weight of 1)x(age weight of 1)x(callable weight of 1)]. A security in the cell containing fixed rate securities with a principal amount outstanding of more than $100 million, that did not trade during the previous year, that had a dated date in the 1980s, and was callable (cell 23) would have a weight of 12,000 [=(size weight of 1,000)x(interest rate type weight of 1)x(trade weight of 2)x(age weight of 3)x(callable weight of 2)]. So a security in cell 23 would be 12,000 times more likely to be selected for the sample than a security in cell 7.
Exhibit C-1 presents information on the different cells, including their population sizes, aggregate principal amounts, weights, and the number of sampled securities. The number of securities sampled from all but the first cell was in proportion to the cell’s overall weight and to the number of securities in the cell. Specifically, the number of cells sampled was equal to 195x(the cell’s overall weight x the cell’s population size) / (the sum of these products across cells), rounded to the nearest integer.1 This resulted in a sample size of 192 (rather than 195) for cells 2-40, so 3 of the 5 cells that otherwise would not have been sampled (because the above ratio rounded to 0) were allocated one sampled security. Five of the 200 sampled securities were identified by S&P staff as secondary derivatives. Information in the KennyBase allows a user to identify 3 of these as secondary derivatives, but miscommunication between us and S&P staff resulted in these securities being incorrectly classified in our database. Our methodology was corrected, and these 3 securities were excluded from the sample. Three cells were not sampled. The 1,800 securities in these two cells accounted for 0.2% of the outstanding principal amount.
1 Because there were modest changes to our population of municipal securities after the sample was created, one unrounded category sample size in Exhibit C-1 is smaller than the sample actually taken from that category.
C-3

C-4
Exhibit C-2 presents the results of S&P staff’s review of the remaining 197 securities. Two of these securities were secondary derivatives; another 16 had been called in full by November 5, 2000. Most of these called securities had dated dates prior to 1990. None had a dated date after 1994. None traded during our sample period. The outstanding amounts we used were overstated for another 13 securities. The sample results were extrapolated to the entire population by computing the ratio for each cell of the actual principal amount determined by S&P staff to the amounts used by us, and applying this ratio to our population estimate for the cell.
Summing the revised cell population estimates resulted in an estimate for the principal amount outstanding of municipal securities on November 5, 2000 of $1,934 billion. Therefore, we believe that our estimate of $2,018.7 billion contains an upward bias of $85 billion, or 4%.