world 200 9 investment report - unctad | homeunctad.org/en/docs/wir2009overview_en.pdfpublication do...
TRANSCRIPT

UNITED NATIONS CONFERENCE ON TRADE AND DEVELOPMENT
WORLDINVESTMENT
REPORT2009
Transnational Corporations, Agricultural Production
and Development
UNITED NATIONS
EMBARGOEMBARGOThe contents of this Report must notThe contents of this Report must notbe quoted or summarized in the press, be quoted or summarized in the press,
pppp
on radio, or on television, before on radio, or on television, before q pq p
17 September 2009 - 17:00 hours GMT17 September 2009 - 17:00 hours GMT
2009
Overv
iew
UNITED NATIONS CONFERENCE ON TRADE AND DEVELOPMENT
WORLDINVESTMENT
REPORT
Transnational Corporations, Agricultural Production
and Development
UNITED NATIONS
New York and Geneva, 2009
NOTE
As the focal point in the United Nations system for investment and technology, and building on 30 years of experience in these areas, UNCTAD, through DIAE, promotes understanding of key issues, particularly matters related to foreign direct investment and transfer of technology. DIAE also assists developing countries in attracting and benefiting from FDI, and in building their productive capacities and international competitiveness. The emphasis is on an integrated policy approach to investment, technical capacity building and enterprise development.
The terms country/economy as used in this Report also refer, as appropriate, to territories or areas; the designations employed and the presentation of the material do not imply the expression of any opinion whatsoever on the part of the Secretariat of the United Nations concerning the legal status of any country, territory, city or area or of its authorities, or concerning the delimitation of its frontiers or boundaries. In addition, the designations of country groups are intended solely for statistical or analytical convenience and do not necessarily express a judgement about the stage of development reached by a particular country or area in the development process. The major country groupings used in this Report follow the classification of the United Nations Statistical Office unless otherwise indicated. These are:
Developed countries: the member countries of the OECD (other than Mexico, the Republic of Korea and Turkey), plus the new European Union member countries which are not OECD members (Bulgaria, Cyprus, Estonia, Latvia, Lithuania, Malta, Romania and Slovenia), plus Andorra, Israel, Liechtenstein, Monaco and San Marino.
Transition economies: South-East Europe and the Commonwealth of Independent States.
Developing economies: in general all economies not specified above. For statistical purposes, the data for China do not include those for Hong Kong Special Administrative Region (Hong Kong SAR), Macao Special Administrative Region (Macao SAR) and Taiwan Province of China.
Reference to companies and their activities should not be construed as an endorsement by UNCTAD of those companies or their activities.
The boundaries and names shown and designations used on the maps presented in this publication do not imply official endorsement or acceptance by the United Nations.
The following symbols have been used in the tables:
Two dots (..) indicate that data are not available or are not separately reported. Rows in tables have been omitted in those cases where no data are available for any of the elements in the row;
A dash (–) indicates that the item is equal to zero or its value is negligible;
A blank in a table indicates that the item is not applicable, unless otherwise indicated;
A slash (/) between dates representing years, e.g., 1994/95, indicates a financial year;
Use of an en dash (–) between dates representing years, e.g., 1994–1995, signifies the full period involved, including the beginning and end years;
Reference to “dollars” ($) means United States dollars, unless otherwise indicated;
Annual rates of growth or change, unless otherwise stated, refer to annual compound rates;
Details and percentages in tables do not necessarily add to totals because of rounding.
The material contained in this study may be freely quoted with appropriate acknowledgement.
ii

ACKNOWLEDGEMENTS
The World Investment Report 2009 (WIR09) was prepared by a team led by Anne Miroux and Masataka Fujita, with Hafiz Mirza and Joachim Karl responsible for Part Two. James Zhan provided overall guidance and direction. The team included Kumi Endo, Thomas van Giffen, Michael Hanni, Fabrice Hatem, Kálmán Kalotay, Ralf Krüger, Guoyong Liang, Padma Mallampally, Nicole Moussa, Abraham Negash, Hilary Nwokeabia, Shin Ohinata, Thomas Pollan, Astrit Sulstarova, Yunsung Tark and Kee Hwee Wee. Kiyoshi Adachi, Bekele Amare, Quentin Dupriez, Hamed El-Kady, Kornel Mahlstein, Nicole Maldonado, Sara Tougard de Boismilon, Elisabeth Tuerk and Jörg Weber also contributed to the Report. Research and statistical support was provided by Mohamed Chiraz Baly, Bradley Boicourt, Jovan Licina, Lizanne Martinez and Tadelle Taye. Ngoc Hanh Dang, Shan He, Cristina Insuratelu, Mari Mo and Tom van Herk assisted as interns at various stages. Production of the WIR09 was carried out by Séverine Excoffier, Rosalina Goyena, Chantal Rakotondrainibe and Katia Vieu. It was edited by Praveen Bhalla and desktop published by Teresita Ventura.
Peter J. Buckley and John H. Dunning served as senior economic advisers to the Report. John Dunning sadly passed away in January 2009 and this year’s Report is dedicated to his memory. He was involved in the conception and realization of the World Investment Reports from the beginning, and during succeeding years played a significant role in their evolution, all the while providing guidance and advice on substantive issues related to research themes and analytical approaches. He acted – where appropriate – as a mentor to many members of the WIR team. His wisdom, valued advice and enthusiasm will be missed.
WIR09 benefited from comments provided by participants at a brainstorming meeting in Geneva in October 2008, an ad hoc expert meeting in Geneva in February 2009, a global seminar in Geneva in May 2009, and three regional seminars on TNCs and agriculture held in April 2009: one in Addis Ababa, Ethiopia (in cooperation with Addis Ababa University), a second one in São Paulo, Brazil (in cooperation with Fundação Dom Cabral and FEARP, São Paulo University), and a third one in Tianjin, China (in cooperation with the Ministry of Commerce of China and Tianjin Municipality).
Inputs were received from Katrin Arnold, Carlos Arruda, Antonio Flavio Dias Avila, Samuel Asuming-Brempong, Jeremy Clegg, Olivier De Schutter, Persephone Economou, Nasredin Hag Elamin, Fulvia Farinelli,
iii

David Hallam, Spencer Henson, Christine Heumesser, Thomas Jost, John Humphrey, Annabel Ipsen, Irina Likhachova, George K. Lipimile, Asad Naqvi, Jeffrey Neilson, Marcos Fava Neves, Frances Nsonzi, Ralf Peters, Luke Peterson, Rebecca Poste, Bill Pritchard, José Parra, Sebastián Senesi, Erwin Schmid, Nicole Simes, Eckart Woertz and Zbigniew Zimny.
Comments and suggestions were received during various stages of preparation from Oluyele Akinkugbe, Rashmi Banga, Peter Baron, Dirk Michael Boehe, Joachim von Braun, Aurelia Calabro, Gloria Carrión, Chantal Chan-Yone, Milasoa Cherel-Robson, Junior Roy Davis, Mamadou Diallo, Martine Dirven, Chantal Dupasquier, Julian Ferdinand, Niels Fold, Torbjörn Fredriksson, Daniel Fuentes, Samuel Gayi, Shunqi Ge, Stephen Gelb, Gary Gereffi, Juliana Gonsalves, Zoe Goodman, Frea Haandrikman, Ute Hausmann, Jonathan Hepburn, Hayley Herman, Ulrich Hoffmann, Gábor Hunya, Moses Ikiara, Nipon Jayamangkala, Anna Joubin-Bret, Mpenga Kabundi, Raphael Kaplinsky, Yong-taek Kim, David King, Harinder Kohli, Hussien Hamda Komicha, Surendra Kotecha, Ronglin Li, Yong Li, Pascal Liu, Marinella Loddo, Jeffrey Lowe, Sarianna Lundan, George Mashinkila, Xinyu Mei, José Otavio Menten, Bruno Varella Miranda, Maiko Miyake, Elibaraki Emmanuel Msuya, Peter Muchlinski, Fiorina Mugione, Irene Musselli, Sanusha Naidu, Jean Ndenzako, Herbert Oberhänsli, Jean-François Outreville, Terutomo Ozawa, Sheila Page, Xavier Manoel Pedrosa, Mike Pfister, Guoqiang Qi, Ruth Rama, Carlos Razo, Ian Richards, Raissa Rossiter, Maria Sylvia Macchione Saes, Leonela Santana-Boado, Michel Henrique R. Santos, Takanori Satoyama, Karl P. Sauvant, Josef Schmidhuber, Xiaofang Shen, Xiaokai Shen, Silas Cezar da Silva, Carin Smaller, Benjamin Smith, Eduardo Leão Sousa, Xuekun Sun, Zhishao Tang, Márcia Tavares, Harmon Thomas, Andrew Thorburn, Guiming Tian, David Tommy, Selma Tozanli, Truong Thi Thu Trang, Rob van Tulder, Peter Utting, Aimable Uwizeye Mapendano, Sietze Vellema, Luiz Carlos Vieira, Paul Wessendorp, Obi Whichard, Susanna Wolf, Larry Chee-Yoong Wong, Zongdi Wu, Stephen Young and Fabiano José Zillo.
Numerous officials of central banks, statistical offices, investment promotion and other government agencies, and officials of international organizations and non-governmental organizations, as well as executives of a number of companies also contributed to WIR09, especially with the provision of data and other information. The Report also benefited from collaboration with Erasmus University, Rotterdam, in the collection of data on the largest 100 TNCs.
The financial support of the Governments of France, Norway and Sweden is gratefully acknowledged.
iv

CONTENTS
Page
KEY MESSAGES 1
OVERVIEW 4
FDI TRENDS, POLICIES AND PROSPECTS 4
TRANSNATIONAL CORPORATIONS, AGRICULTURAL PRODUCTION AND DEVELOPMENT 23
Annex
Table of contents of the World Investment Report 2009:
Transnational Corporations, Agricultural Production and Development 41
List of the World Investment Reports 45
Questionnaire 47
Figures
Figure 1. FDI inflows, by quarter, 2007–2009 5Figure 2. Global FDI flows, top 20 economies, 2007–2008 6Figure 3. Share of agriculture in inward FDI of selected economies,
various years 25Figure 4. Investor and target regions and countries in overseas
land investment for agricultural production, 2006–May 2009 31
Tables
Table 1. Selected indicators of FDI and international production, 1982–2008 9Table 2. National regulatory changes, 1992–2008 12Table 3. FDI flows, by region and selected countries, 1995–2008 14Table 4. Estimated FDI in agriculture, forestry and fishing, and food and
beverages, various years 24Table 5. Top 25 TNCs in agribusiness industries,
ranked by foreign assets, 2007 29
v

vi

KEY MESSAGES
FDI Trends, Policies and Prospects
Global FDI flows have been severely affected worldwide by the economic and financial crisis. Inflows are expected tofall from $1.7 trillion in 2008 to below $1.2 trillion in 2009, with a slow recovery in 2010 (to a level up to $1.4 trillion) and gaining momentum in 2011 (approaching $1.8 trillion).
The crisis has changed the FDI landscape: investments to developing and transition economies surged, increasing their share in global FDI flows to 43% in 2008. This was partly due to a concurrent large decline in FDI flows to developed countries (29%). In Africa, inflows rose to a record level, with the fastest increase in West Africa (a 63% rise over 2007); inflows to South, East and South-East Asia witnessed a 17% expansion to hit a new high; FDI to West Asia continued torise for the sixth consecutive year; inflows to Latin America and the Caribbean rose by 13%; and the expansion of FDI inflows to South-East Europe and the CIS rose for the eighth year running. However, in 2009 FDI flows to all regions will lsuffer from a decline.
The agriculture and extractive industries haveweathered the crisis relatively well, compared with business-cycle-sensitive industries such as metal manufacturing. Inaddition, there is a better outlook for FDI in industries such as agribusiness, many services and pharmaceuticals.
With regard to the mode of investment, greenfield investments were initially more resilient to the crisis in 2008,but were hit badly in 2009. On the other hand, cross-border M&As have been on a continuous decline, but are likely to lead the future recovery. Divestments were particularly significant during the crisis.
There was a marked downturn in FDI by private equity funds as access to easy financing dried up. Endowed withsizeable assets, sovereign wealth funds attained a record FDI
2009
Overv
iew

high in 2008, though they too faced challenges caused by falling export earnings in their home countries.
Overall policy trends during the crisis have so far been mostly favourable to FDI, both nationally and internationally. However, in some countries a more restrictive FDI approach has emerged. There is also growing evidence of “covert” protectionism.
TNCs in Agricultural Production and Development
Foreign participation can play a significant role in agricultural production in developing countries, which are in dire need of private and public investment, thereby boosting productivity and supporting economic development and modernization.
FDI flows in agricultural production tripled to $3 billion annually between 1990 and 2007, driven by the food import needs of populous emerging markets, growing demand for biofuel production, and land and water shortages in some developing home countries. These flows remain small compared to the overall size of world FDI, but in many low-income countries agriculture accounts for a relatively large share of FDI inflows; and the latter are therefore significant in capital formation in the industry. Moreover, FDI in the entire agricultural value chain is much higher, with food and beverages alone representing more than $40 billion of annual flows.
Contract farming activities by TNCs are spread worldwide, covering over 110 developing and transition economies, spanning a wide range of commodities and, in some cases, accounting for a high share of output.
Developed-country TNCs are dominant in the upstream (suppliers) and downstream (processors, retailers, traders) ends of the agribusiness value chain. In agricultural production, FDI from the South (including South-South flows) is equally significant as FDI from the North.
TNC participation in agriculture in the form of FDI and contract farming may result in the transfer of technology, standards and skills, as well as better access to credit and markets. All of these could improve the productivity of the industry – including the farming of staple foods – and the economy as a whole. Moreover, TNCs’ contribution to food security is not just about food supply; it
World Investment Report 2009: Transnational Corporations,
2 Agricultural Production and Development
also includes enhanced food safety and affordability. These depend on the right policies for host countries to maximize benefits and minimize the costs of TNC participation.
Governments should formulate an integrated strategic policy and regulatory framework for TNC activities in agricultural production. This should include vital policy areas such as infrastructure development, competition, trade and trade facilitation, and R&D. It is equally important to address social and environmental concerns regarding TNC involvement.
Governments could also promote contract farming between TNCs and local farmers in the direction of enhancing farmers’ predictable income, productive capacities and benefits from global value chains. To protect the interests of farmers, governments could develop model contracts for them to use or consider when negotiating with TNCs.
To ensure food security in host countries as a result of export-oriented FDI in staple food production by “new investors”, home and host countries could consider output-sharing arrangements.
In order to address the concern about “land grab”, the international community should devise a set of core principles that deal with the need for transparency in large-scale land acquisitions, respect for existing land rights, the right to food, protection of indigenous peoples, and social and environmental sustainability.
Public-private partnerships can be an effective tool for bringing a “new green revolution” to Africa. One initiative in this regard is seed and technology centres that adapt seeds and related farming technologies to local needs and conditions, distribute them to local farmers, and build long-term indigenous capacities.
Overview 3
OVERVIEW
FDI TRENDS, POLICIES AND PROSPECTS
Amid a sharpening financial and economic crisis, global FDI inflows fell from a historic high of $1,979 billion in 2007 to $1,697 billion in 2008, a decline of 14%. The slide continued into 2009, with added momentum: preliminary data for 96 countries suggest that in the first quarter of 2009, inflows fell a further 44% compared with their level in the same period in 2008. A slow recovery is expected in 2010, but should speed up in 2011. The crisis has also changed the investment landscape, with developing and transition economies’ share in global FDI flows surging to 43% in 2008.
The decline posted globally in 2008 differed among the three major economic groupings – developed countries, developing countries and the transition economies of South-East Europe and the Commonwealth of Independent States (CIS) – reflecting an initial differential impact of the current crisis. In developed countries, where the financial crisis originated, FDI inflows fell in 2008, whereas in developing countries and the transition economies they continued to increase. This geographical difference appears to have ended by late 2008 or early 2009, as initial data point to a general decline across all economic groups (figure 1).
The 29% decline in FDI inflows to developed countries in 2008 was mostly due to cross-border M&A sales that fell by 39% in value after a five-year boom ended in 2007. In Europe, cross-border M&A deals plummeted by 56% and in Japan by 43%. Worldwide mega deals – those with a transaction value of more than $1 billion – have been particularly strongly affected by the crisis.
In the first half of 2008 developing countries weathered the global financial crisis better than developed countries, as their financial systems were less closely interlinked with the hard-hit banking systems of the United States and Europe. Their economic growth remained robust, supported by rising commodity prices. Their FDI inflows continued to grow, but at a much slower pace than in previous years, posting a 17% to $621 billion. By region, FDI inflows increased considerably in Africa (27%) and in Latin America and the Caribbean (13%) in 2008, continuing the upward trend of the preceding years for both regions. However, in the second half
World Investment Report 2009: Transnational Corporations,
4 Agricultural Production and Development
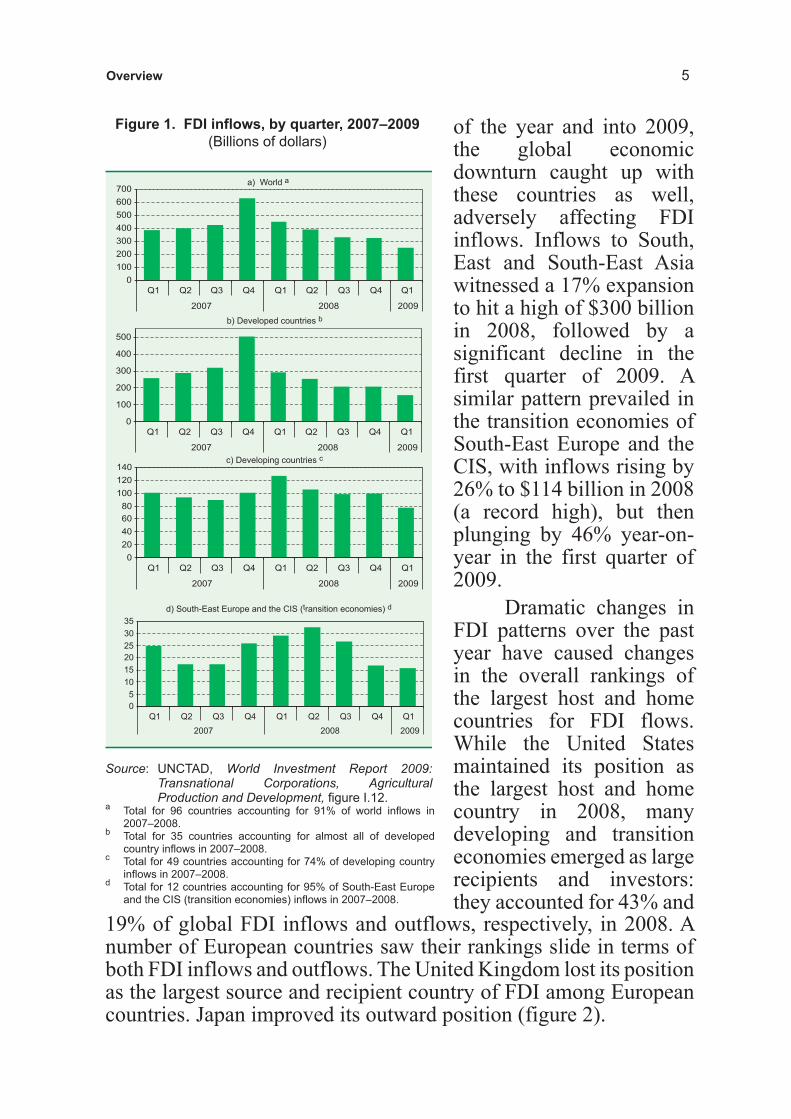
Figure 1. FDI inflows, by quarter, 2007–2009
(Billions of dollars)
Source: UNCTAD, World Investment Report 2009: Transnational Corporations, Agricultural Production and Development, figure I.12.
a Total for 96 countries accounting for 91% of world inflows in 2007–2008.
b Total for 35 countries accounting for almost all of developed country inflows in 2007–2008.
c Total for 49 countries accounting for 74% of developing country inflows in 2007–2008.
d Total for 12 countries accounting for 95% of South-East Europe and the CIS (transition economies) inflows in 2007–2008.
of the year and into 2009, the global economic downturn caught up with these countries as well, adversely affecting FDI inflows. Inflows to South, East and South-East Asia witnessed a 17% expansion to hit a high of $300 billion in 2008, followed by a significant decline in the first quarter of 2009. A similar pattern prevailed in the transition economies of South-East Europe and the CIS, with inflows rising by 26% to $114 billion in 2008 (a record high), but then plunging by 46% year-on-year in the first quarter of 2009.
Dramatic changes in FDI patterns over the past year have caused changes in the overall rankings of the largest host and home countries for FDI flows. While the United States maintained its position as the largest host and home country in 2008, many developing and transition economies emerged as large recipients and investors: they accounted for 43% and
19% of global FDI inflows and outflows, respectively, in 2008. A number of European countries saw their rankings slide in terms of both FDI inflows and outflows. The United Kingdom lost its position as the largest source and recipient country of FDI among European countries. Japan improved its outward position (figure 2).
Overview 5

Figure 2. Global FDI flows, top 20 economies, 2007–2008 a
(Billions of dollars)
Source: UNCTAD, World Investment Report 2009: Transnational Corporations, Agricultural Production and Development, annex table B.1.
aRanked on the basis of the magnitude of 2008 FDI inflows.
FDI flows increased to structurally weak economies in 2008, including least developed countries (LDCs), landlocked developing countries (LLDCs) and small island developing States (SIDS) by 29%, 54% and 32% respectively. However, due to the distinctive characteristics of these three groups of economies, including their dependence on a narrower range of export commodities that were hard hit by falling demand from developed countries, the current crisis has exposed their vulnerabilities in attracting inward FDI. These economies may therefore, wish to consider promoting FDI in industries which are less prone to cyclical fluctuations, such as agriculture-related industries, particularly food and beverages, as part of a diversification strategy.
Structural features of the decline in FDI
In late 2008 and the first few months of 2009, significant declines were recorded in all three components of FDI inflows: equity investments, other capital (mainly intra-company loans)
World Investment Report 2009: Transnational Corporations,
6 Agricultural Production and Development
and reinvested earnings. Equity investments fell along with cross-border M&As. Lower profits by foreign affiliates drove down reinvested earnings, contributing to the 46% drop in FDI outflows from developed countries in the first quarter of 2009. In some cases, the restructuring of parent companies and their headquarters led to repayments of outstanding loans by foreign affiliates and a reduction in net intra-company capital flows from TNCs to their foreign affiliates. Critically, the proportionate decline in equity investments today is larger than that registered during the previous downturn.
Since mid-2008, divestments, including repatriated investments, reverse intra-company loans and repayments of debt to parent firms, have exceeded gross FDI flows in a number of countries. For instance, divestments amounted to $110 billion in the case of FDI outflows from Germany, accounting for 40% of its gross FDI flows in 2008. In the first half of 2009, nearly one third of all cross-border M&A deals involved the disposal of foreign firms to other firms (whether based in a host, home or third country). This depressed FDI flows further. While divestments are not uncommon (affecting between one quarter and four fifths of all FDI projects), they became especially noticeable during a crisis. Indeed the motivations for divestment have been heightened during this crisis as TNCs seek to cut operating costs, shed non-core activities, and in some cases take part in industry-wide restructuring. Greenfield investments (new investments and expansion of existing facilities) were resilient overall in 2008, but have also succumbed to the crisis since late 2008.
Available cross-border M&A data by sector indicate that companies in a limited number of industries increased their FDI activities in 2008. Industries exhibiting rising cross-border M&A sales (by value) during the year included food, beverages and tobacco, buoyed by the $52 billion purchase of Anheuser Busch (United States) by Stichting Interbrew (Belgium); precision instruments; mining, quarrying and petroleum; motor vehicles and other transportation equipment; business services; other services; agriculture, hunting, forestry and fisheries; coke, petroleum and nuclear fuel; and public administration and defence. In general, the primary sector witnessed a growth of 17% in the value of M&A sales in 2008; whereas manufacturing and services – which account for the largest proportion of world inward FDI stocks – reported declines of 10% and 54% respectively.
Overview 7
The financial and economic crisis had varying impacts on FDI carried out by special funds, such as sovereign wealth funds (SWFs) or private equity funds. Private equity funds were hit especially hard, as the financial crisis struck at their lifeblood: easy capital, which shrank as lenders became more risk conscious. Cross-border M&As by these funds fell to $291 billion in 2008, or by 38%, from a peak of $470 billion in 2007. The main reason for the sharp decline was that the financing of leveraged buyouts – that contributed most to the dynamic growth of cross-border M&As by these funds in previous years – nearly dried up in the second half of 2008.
SWFs, on the other hand, recorded a rise in FDI in 2008, despite a fall in commodities prices, the export earnings of which often provide them with finance. Compared with 2007, the value of their cross-border M&As – the predominant form of FDI by SWFs – was up 16% in 2008, to $20 billion, a small amount in proportion to the size of FDI and other assets under their management. This increase bucked the downward trend in global FDI as a whole. However, during the course of 2008, the sharp economic downturn in developed countries and the worldwide slump in stock prices led to large losses in SWFs’ investments (partly because of a high concentration of investments in financial and business services industries), which depressed the pace of growth of their cross-border M&A deals. Moreover, the large size of SWFs and their perceived non-economic intentions have aroused concerns in a number of countries. To counter this concern, in October 2008 a number of SWFs agreed on a set of Generally Accepted Principles and Practices (GAPP) – the so-called Santiago Principles. Prospects for further increases in cross-border M&As by SWFs have deteriorated dramatically, judging by data on M&As for the first half of 2009.
TNCs in international production
Today, there are some 82,000 TNCs worldwide, with 810,000 foreign affiliates. These companies play a major and growing role in the world economy. For example, exports by foreign affiliates of TNCs are estimated to account for about a third of total world exports of goods and services, and the number of people employed by them worldwide totalled about 77 million in 2008 – more than double the total labour force of Germany. However, their international stature has not insulated them from the worst global recession in a generation. The 4.8% reduction in inward FDI stock worldwide was
World Investment Report 2009: Transnational Corporations,
8 Agricultural Production and Development
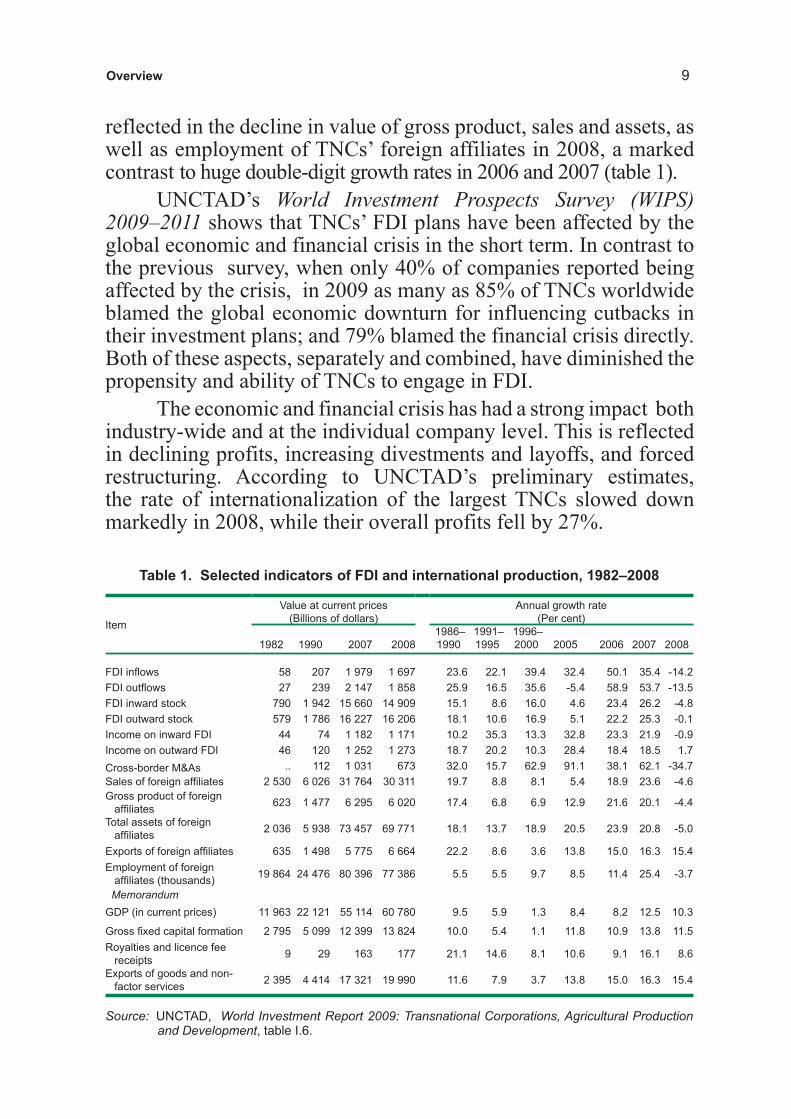
reflected in the decline in value of gross product, sales and assets, as well as employment of TNCs’ foreign affiliates in 2008, a marked contrast to huge double-digit growth rates in 2006 and 2007 (table 1).
UNCTAD’s World Investment Prospects Survey (WIPS) 2009–2011 shows that TNCs’ FDI plans have been affected by theglobal economic and financial crisis in the short term. In contrast to the previous survey, when only 40% of companies reported being affected by the crisis, in 2009 as many as 85% of TNCs worldwide blamed the global economic downturn for influencing cutbacks in their investment plans; and 79% blamed the financial crisis directly. Both of these aspects, separately and combined, have diminished the propensity and ability of TNCs to engage in FDI.
The economic and financial crisis has had a strong impact both industry-wide and at the individual company level. This is reflected in declining profits, increasing divestments and layoffs, and forced restructuring. According to UNCTAD’s preliminary estimates, the rate of internationalization of the largest TNCs slowed down markedly in 2008, while their overall profits fell by 27%.
Table 1. Selected indicators of FDI and international production, 1982–2008
Item
Value at current prices
(Billions of dollars)
Annual growth rate
(Per cent)
1982 1990 2007 2008
1986–
1990
1991–
1995
1996–
2000 2005 2006 2007 2008
58 207 1 979 1 697 23.6 22.1 39.4 32.4 50.1 35.4 -14.2
27 239 2 147 1 858 25.9 16.5 35.6 -5.4 58.9 53.7 -13.5
FDI inward stock 790 1 942 15 660 14 909 15.1 8.6 16.0 4.6 23.4 26.2 -4.8
FDI outward stock 579 1 786 16 227 16 206 18.1 10.6 16.9 5.1 22.2 25.3 -0.1
Income on inward FDI 44 74 1 182 1 171 10.2 35.3 13.3 32.8 23.3 21.9 -0.9
Income on outward FDI 46 120 1 252 1 273 18.7 20.2 10.3 28.4 18.4 18.5 1.7
Cross-border M&As .. 112 1 031 673 32.0 15.7 62.9 91.1 38.1 62.1 -34.7
2 530 6 026 31 764 30 311 19.7 8.8 8.1 5.4 18.9 23.6 -4.6
Gross product of foreign 623 1 477 6 295 6 020 17.4 6.8 6.9 12.9 21.6 20.1 -4.4
Total assets of foreign 2 036 5 938 73 457 69 771 18.1 13.7 18.9 20.5 23.9 20.8 -5.0
635 1 498 5 775 6 664 22.2 8.6 3.6 13.8 15.0 16.3 15.4
Employment of foreign 19 864 24 476 80 396 77 386 5.5 5.5 9.7 8.5 11.4 25.4 -3.7
Memorandum
GDP (in current prices) 11 963 22 121 55 114 60 780 9.5 5.9 1.3 8.4 8.2 12.5 10.3
2 795 5 099 12 399 13 824 10.0 5.4 1.1 11.8 10.9 13.8 11.5
Royalties and licence fee
receipts 9 29 163 177 21.1 14.6 8.1 10.6 9.1 16.1 8.6
Exports of goods and non-
factor services2 395 4 414 17 321 19 990 11.6 7.9 3.7 13.8 15.0 16.3 15.4
Source: UNCTAD, World Investment Report 2009: Transnational Corporations, Agricultural Production and Development, table I.6.
Overview 9
Even so, the 100 largest TNCs worldwide continue to represent a sizable proportion of total international production by the universe of TNCs. Over the three years from 2006 to 2008 these 100 companies accounted for, on average, 9%, 16% and 11% respectively, of estimated foreign assets, sales and employment of all TNCs. And their combined value-added accounted for roughly 4% of world GDP, a share that has remained relatively stable since 2000.
In terms of the sectoral composition of the top 100 list for 2007, the majority of the largest TNCs continued to be in manufacturing. General Electric, Toyota Motor Corporation, and Ford Motor Company were among the biggest manufacturers. TNCs from the services sector, however, have been steadily increasing their share among the top 100. There were 26 companies on the 2008 list, as opposed to 14 in 1993, with Vodafone Group and Electricité de France among the biggest. Primary sector TNCs — such as Royal Dutch/Shell Group, British Petroleum Company, and ExxonMobil Corporation — ranked high in the list, buoyed by swelling foreign assets. As for TNCs from developing countries, 7 featured in the list, among them large diversified companies such as Hutchinson Whampoa and CITIC Group, as well as important electronics manufacturers like LG Corporation and Samsung Electronics.
The operations of the 50 largest financial TNCs were more geographically spread in 2008 than ever before; however it is not clear what the ultimate consequences of the hiatus of late 2008 and early 2009 will be. With massive government interventions in banking and financial services, some developed-country governments have become the largest or sole shareholders in several of the biggest financial TNCs. This dramatic change, together with the downfall of some of the largest financial TNCs, will strongly reshape FDI in financial services in the coming years.
FDI Prospects
Global FDI prospects are set to remain gloomy in 2009, with inflows expected to fall below $1.2 trillion. However, recovery of these flows is expected to begin slowly in 2010 to reach up to $1.4 trillion, and will gather momentum in 2011 when the level could approach an estimated $1.8 trillion – almost the same as in 2008.
World Investment Report 2009: Transnational Corporations,
10 Agricultural Production and Development
In the short run, with the global recession extending into 2009 and slow growth projected for 2010, as well as the drastic fall of corporate profits, FDI is expected to be low. TNCs appear hesitant and bearish about expanding their international operations.
This is confirmed by the results of WIPS: a majority (58%) of large TNCs reported their intentions to reduce their FDI expenditures in 2009 from their 2008 levels, with nearly one third of them (more than 30%) even anticipating a large decrease. Considering the 44% fall in actual FDI inflows worldwide in the first quarter of 2009, compared to the same period last year, 2009 could end with much lower flows than in 2008.
The medium-term prospects for FDI are more optimistic. TNCs responding to WIPS expect a gradual recovery in their FDI expenditures in 2010, gaining momentum in 2011; half of them even foresee their FDI in 2011 exceeding the 2008 level.
The United States, along with China, India, Brazil and the Russian Federation (the so-called BRIC countries) are likely to lead the future FDI recovery, as indicated by the responses of large TNCs to WIPS. Industries that are less sensitive to business cycles and operate in markets with stable demand (such as agribusiness and many services), and those with longer term growth prospects (such as pharmaceuticals) are likely to be the engine for the next FDI boom. Furthermore, in the immediate aftermath of the crisis, when the global economy is on its way to recovery, the exit of public/government funds from ailing industries will possibly trigger a new wave of cross-border M&As.
Recent developments in investment policies at national and international levels
In 2008 and the first half of 2009, despite concerns about a possible rise in investment protectionism, the general trend in FDI policies remained one of greater openness, including lowering barriers to FDI and lowering corporate income taxes. UNCTAD’s annual Survey of Changes to National Laws and Regulations related to FDI indicates that during 2008, 110 new FDI-related measures were introduced, of which 85 were more favourable to FDI (table 2). Compared to 2007, the percentage of less favourable measures for FDI remained unchanged.
Overview 11

Table 2. National regulatory changes, 1992–2008
Annual average
Item 1992–1994 1995–1999 2000 2001 2002 2003 2004 2005 2006 2007 2008
Number of countries that introduced change 49 66 70 71 72 82 103 92 91 58 55
Number of regulatory changes 95 132 150 207 246 242 270 203 177 98 110
More favourable 94 121 147 193 234 218 234 162 142 74 85
Less favourable 1 11 3 14 12 24 36 41 35 24 25
Source: UNCTAD, World Investment Report 2009: Transnational Corporations, Agricultural Production and Development, table I.14.
The trend of scrutinizing foreign investments for national security reasons continued. Regulations to this end were adopted in some OECD countries. They expanded the scope of compulsory notification rules or enabled governments to block acquisitions of stakes in domestic companies. There was also a continuing trend towards nationalization of foreign-owned entities in extractive industries, particularly in parts of Latin America.
The most recent survey of investment policy developments in the 42 countries of the G-20 conducted by the UNCTAD secretariat shows that the overwhelming majority of policy measures specific and/or related to investment, taken by these countries in the period November 2008 to June 2009 were non-restrictive towards foreign inward and domestic outward investment. In fact, a substantial number of the policy changes surveyed were in the direction of facilitating investment, including outward investment. There were, however, also a few policy measures that restrict private (including foreign) investment in certain highly sensitive sectors, or introduce new criteria and tests for investments that cause national security concerns.
During 2008, the network of international investment agreements (IIAs) continued to expand: 59 new bilateral investment treaties (BITs) were concluded, bringing the total number to 2,676. Also, the number of double taxation treaties (DTT) increased by 75 to a cumulative total of 2,805, and the number of other international agreements with investment provisions (mostly free trade agreements containing binding obligations on the contracting parties with regard to investment liberalization and protection) reached 273 by the end of 2008. In contrast, until the end of 2008, six BITs were terminated. In parallel with the expansion of the IIA universe, the number of investor-State disputes has also continued to increase, totalling 317 at the end of 2008.
World Investment Report 2009: Transnational Corporations,
12 Agricultural Production and Development

Impact of the crisis on FDI-related policies
So far, the current financial and economic crisis has had no major impact on FDI policies per se, since FDI is not the cause of this crisis. However, some national policy measures of a more general scope (national bailout programmes, economic stimulus packages) introduced in response to the crisis are likely to have an impact on FDI flows and TNC operations in an indirect manner. They may have a positive effect on inward FDI, as they could help stabilize, if not improve, the key economic determinants of FDI. On the other hand, concerns have been expressed that country policy measures could result in investment protectionism by favouring domestic over foreign investors, or by introducing obstacles to outward investment in order to keep capital at home.
There are also signs that some countries have begun to discriminate against foreign investors and/or their products in a “hidden” way using gaps in international regulations. Examples of “covert” protectionism include favouring products with high “domestic” content in government procurement (particularly huge public infrastructure projects), de facto preventing banks from lending for foreign operations, invoking “national security” exceptions that stretch the definition of national security, or moving protectionist barriers to subnational levels that are outside the scope of the application of international obligations (e.g. in matters of procurement).
Looking to the future, a crucial question is which FDI policies host countries will apply once the global economy begins to recover. The expected exit of public funds from flagship industries is likely to provide a boost to private investment, including FDI. This could possibly trigger a new wave of economic nationalism to protect “national champions” from foreign takeovers. IIAs have a role to play in ensuring predictability, stability and transparency of national investment regimes. Policymakers should also consider strengthening the investment promotion dimension of IIAs through effective and operational provisions. Investment insurance and other home-country measures that encourage outward investment are cases in point where continued international cooperation can be useful.
All of these developments, as well as impacts of the crisis on FDI flows and TNC activities, have had different effects on the pattern of FDI by region (table 3).
Overview 13

Tab
le 3
. F
DI fl
ow
s, b
y r
eg
ion
an
d s
ele
cte
d c
ou
ntr
ies, 1995–2008
(B
illio
ns o
f dolla
rs a
nd p
er
cent)
Re
gio
n/e
co
no
my
19
95
–2
00
02
00
32
00
42
00
52
00
62
00
72
00
81
99
5-2
00
02
00
32
00
42
00
52
00
62
00
72
00
8
(A
nn
ua
l
av
era
ge
)
(A
nn
ua
l
av
era
ge
)
De
ve
lop
ed
eco
no
mie
s 5
34
.9 3
61
.3 4
14
.2 6
13
.1 9
72
.81
35
8.6
96
2.3
62
6.3
50
7.2
79
5.1
74
2.0
1 1
57
.91
80
9.5
1 5
06
.5
Eu
rop
e 3
23
.3 2
79
.8 2
27
.7 5
06
.1 6
31
.7 8
99
.6 5
18
.3 4
46
.2 3
06
.9 4
11
.5 6
89
.9 7
99
.61
27
0.5
94
4.5
Eu
rop
ea
n U
nio
n 3
10
.0 2
59
.4 2
23
.3 4
98
.4 5
90
.3 8
42
.3 5
03
.5 4
16
.9 2
85
.0 3
77
.3 6
09
.7 6
97
.21
19
2.1
83
7.0
Ja
pa
n 4
.6 6
.3 7
.8 2
.8-
6.5
22
.5 2
4.4
25
.1 2
8.8
31
.0 4
5.8
50
.3 7
3.5
12
8.0
Un
ite
d S
tate
s 1
69
.7 5
3.1
13
5.8
10
4.8
23
7.1
27
1.2
31
6.1
12
5.9
12
9.4
29
4.9
15
.4 2
24
.2 3
78
.4 3
11
.8
Oth
er
de
ve
lop
ed
co
un
trie
s 3
7.2
22
.0 4
2.8
- 0
.6 1
10
.4 1
65
.3 1
03
.4 2
9.2
42
.1 5
7.7
- 9
.1 8
3.8
87
.1 1
22
.3
D
eve
lop
ing
eco
no
mie
s 1
88
.3 1
84
.0 2
90
.4 3
29
.3 4
33
.8 5
29
.3 6
20
.7 7
4.5
45
.5 1
20
.4 1
22
.7 2
15
.3 2
85
.5 2
92
.7
Afr
ica
9.0
20
.9 2
2.1
38
.2 5
7.1
69
.2 8
7.6
2.4
1.3
2.1
2.3
7.2
10
.6 9
.3
La
tin
Am
erica
an
d t
he
Ca
rib
be
an
72
.9 4
5.8
95
.1 7
7.1
93
.3 1
27
.5 1
44
.4 2
1.1
21
.3 2
8.0
36
.0 6
3.6
51
.7 6
3.2
Asia
an
d O
ce
an
ia 1
06
.4 1
17
.3 1
73
.2 2
14
.0 2
83
.4 3
32
.7 3
88
.7 5
1.0
23
.0 9
0.4
84
.4 1
44
.5 2
23
.1 2
20
.2
Asia
10
5.9
11
6.9
17
2.9
21
3.8
28
2.1
33
1.4
38
7.8
51
.0 2
2.9
90
.3 8
4.3
14
4.4
22
3.1
22
0.1
We
st A
sia
3.3
11
.3 2
0.5
43
.6 6
7.6
77
.6 9
0.3
0.9
- 1
.4 8
.1 1
2.9
24
.0 4
8.3
33
.7
Ea
st A
sia
70
.7 7
2.7
10
6.3
11
6.2
13
1.8
15
0.4
18
7.0
39
.6 1
7.4
62
.9 4
9.8
82
.3 1
11
.2 1
36
.2
Ch
ina
41
.8 5
3.5
60
.6 7
2.4
72
.7 8
3.5
10
8.3
2.0
2.9
5.5
12
.3 2
1.2
22
.5 5
2.2
So
uth
Asia
3.9
8.2
10
.7 1
4.4
27
.8 3
4.0
50
.7 0
.3 1
.6 2
.3 3
.5 1
4.9
17
.8 1
8.2
So
uth
-Ea
st A
sia
28
.0 2
4.7
35
.5 3
9.6
55
.0 6
9.5
59
.9 1
0.2
5.3
17
.0 1
8.1
23
.3 4
5.8
32
.1
Oce
an
ia 0
.5 0
.4 0
.3 0
.2 1
.3 1
.3 0
.9 0
.0 0
.0 0
.1 0
.1 0
.0 0
.0 0
.1
S
ou
th-E
ast
Eu
rop
e a
nd
CIS
(Tra
nsitio
n e
co
no
mie
s)
7.3
19
.9 3
0.3
30
.9 5
4.5
90
.9 1
14
.4 2
.0 1
0.7
14
.1 1
4.3
23
.7 5
1.5
58
.5
So
uth
-Ea
st
Eu
rop
e 1
.2 4
.1 3
.5 4
.8 9
.9 1
2.8
10
.9 0
.1 0
.1 0
.4 0
.3 0
.4 1
.4 0
.6
CIS
6.1
15
.8 2
6.8
26
.1 4
4.7
78
.1 1
03
.5 1
.9 1
0.6
13
.8 1
4.0
23
.3 5
0.1
57
.9
Wo
rld
73
0.5
56
5.2
73
4.9
97
3.3
1 4
61
.11
97
8.8
1 6
97
.4 7
02
.8 5
63
.4 9
29
.6 8
79
.01
39
6.9
2 1
46
.51
85
7.7
Me
mo
ran
du
m:
pe
rce
nta
ge
sh
are
in
De
ve
lop
ed
eco
no
mie
s 7
3.2
63
.9 5
6.4
63
.0 6
6.6
68
.7 5
6.7
89
.1 9
0.0
85
.5 8
4.4
82
.9 8
4.3
81
.1
De
ve
lop
ing
eco
no
mie
s 2
5.8
32
.6 3
9.5
33
.8 2
9.7
26
.8 3
6.6
10
.6 8
.1 1
3.0
14
.0 1
5.4
13
.3 1
5.8
So
uth
-Ea
st
Eu
rop
e a
nd
CIS
(Tra
nsitio
n e
co
no
mie
s)
1.0
3.5
4.1
3.2
3.7
4.6
6.7
0.3
1.9
1.5
1.6
1.7
2.4
3.1
Sourc
e:
UN
CTA
D,
World I
nvestm
ent
Report
2009:
Tra
nsnational
Corp
ora
tions,
Agricultura
l P
roduction a
nd D
evelo
pm
ent, a
nnex t
able
B.1
and .
FD
I data
base
(ww
w.u
ncta
d.o
rg/fdis
tatistics).
World Investment Report 2009: Transnational Corporations,
14 Agricultural Production and Development

Regional trends
FDI inflows into Africa rose to $88 billion in 2008 – another record level, despite the global financial and economic crisis. This increased the FDI stock in the region to $511 billion. Cross-border M&As, the value of which more than doubled in 2008, contributed to a large part of the increased inflows, in spite of global liquidity constraints. The booming global commodities market the previous year was a major factor in attracting FDI to the region. The main FDI recipients included many natural-resource producers that have been attracting large shares of the region’s inflows in the past few years, but also some additional commodity-rich countries.
In 2008, FDI inflows increased in all subregions of Africa, except North Africa. While Southern Africa attracted almost one third of the inflows, West African countries recorded the largest percentage increase (63%). Developed countries were the leading sources of FDI in Africa, although their share in the region’s FDI stock has fallen over time.
A number of African countries adopted policy measures to make the business environment in the region more conducive to FDI, although the region’s overall investment climate still offers a mixed picture. For example, some African governments established free economic zones and new investment codes to attract FDI, and privatized utilities. However, some countries also adopted less favourable regulations, such as tax increases.
At the bilateral level, African countries have continued to adopt investment-related measures. In 2008, 12 countries signed 13 BITs, and 6 signed 9 DTTs, raising the total number to 718 and 467 respectively. As in the past, most of the BITs (8) and DTTs (4) concluded in 2008 were with developed countries. At the subregional and regional levels, the Economic Community of West African States (ECOWAS) adopted three acts relating to investment rules and the modalities for their implementation, and the Southern African Customs Union (SACU) and the East African Community (EAC) concluded agreements with the United States.
In 2009, there is likely to be a decline in FDI inflows into Africa following six years of uninterrupted growth. The main reasons for this are the slowdown in the global economy, lower global commodity prices and a worsening of the financial crisis in many developed and fast-growing developing economies. However,
Overview 15

the optimistic prospects for global commodity prices might have a positive effect on inflows in the medium term. This prognosis is supported by the results of WIPS.
South, East and South-East Asia continued to register strong growth in FDI inflows in 2008 (17%), reaching a new high of $300 billion. But available data in early 2009 point to a significant downturn, and cast doubts about FDI prospects in the short term.
At the subregional level, year-on-year FDI growth varied: 49% in South Asia, 24% in East Asia, and -14% in South-East Asia, with inflows amounting to $51 billion, $187 billion and $60 billion respectively. Inflows into the major economies in the region varied significantly as well: they surged in China, India and the Republic of Korea; continued to grow in Hong Kong (China); dropped slightly in Malaysia and Thailand; and fell sharply in Singapore and Taiwan Province of China. China, with inflows reaching a historic high ($108 billion), became the third largest FDI recipient in the world. India, with inflows of $42 billion, ranked the 13th largest FDI recipient. Against the backdrop of the global financial crisis, the ability of these two largest emerging economies to attract FDI has reshaped the landscape of global FDI flows. Inflows to the two are inevitably affected by the crisis, but their medium- to long-term prospects remain promising. This is confirmed by WIPS: respondents to the survey ranked China and India as first and third, respectively, among the most attractive locations for FDI.
FDI inflows in services continued to gain momentum in South, East and South-East Asia in 2008. This is reflected in the rising value of cross-border M&A sales in the region’s services sector. This sector accounted for the major share of FDI in some economies, although investments in banking dropped as a result of the global financial crisis. FDI to the services sector in China and India rose, particularly in such services as infrastructure and the retail industries. In India, Wal-Mart (United States) opened its first store in 2008, and plans to open 15 more over the next few years.
Outward FDI from South, East and South-East Asia rose by 7%, to $186 billion in 2008, due mainly to large outflows from China. India is becoming an important investor, though FDI outflows remained almost at the same level as in 2007. China gained ground as an important source of FDI: it ranked 13th in the world and 3rd among all developing and transition economies in 2008.
World Investment Report 2009: Transnational Corporations,
16 Agricultural Production and Development

FDI from China reached $52 billion in 2008, 132% up from 2007. In early 2009, outflows from the country continued to rise. Indeed, significant exchange-rate fluctuations and falling asset prices abroad as a result of the crisis have created M&A opportunities for Chinese companies. In contrast, FDI outflows from other major economies in the region generally slowed down in early 2009, as the crisis has largely reduced the ability and motivation of many TNCs from these economies to invest abroad.
Cross-border M&As undertaken by firms from South, East and South-East Asia in developed countries continued to increase. In the primary sector, in addition to oil companies, large mining and metal companies from China and India have become increasingly aggressive in acquiring overseas assets. For example, in cooperation with Alcoa (United States), Chinalco (China) acquired a 12% stake in Rio Tinto plc (United Kingdom) for $14 billion in 2008. In manufacturing, a recent case was the $2.3 billion acquisition of Jaguar Cars (United Kingdom) by Tata Motors (India). In services, large deals included, for example, investment by Temasek Holdings (Singapore) in Merrill Lynch (United States).
Changes in national policies and legislation favourable to FDI took place in some countries, for instance by raising or abolishing FDI ceilings or streamlining approved procedures. This has led to the further opening up of markets in the region and a more enabling business environment for foreign investors. A few other countries introduced new policies and laws to protect sensitive industries. The region concluded 19 BITs and 13 DTTs in 2008, and continued to be the most active developing region with 10 new agreements other than BITS and DTTs signed. Singapore concluded FTAs with the the Gulf Cooperation Council (GCC), China and Peru, while China concluded agreements with New Zealand and Peru. ASEAN countries concluded an FTA with Japan, Australia and New Zealand; and Viet Nam concluded an FTA with Japan.
FDI inflows into West Asia increased in 2008 for the sixth consecutive year. They rose by 16%, to reach $90 billion, largely due to a significant growth of inflows to Saudi Arabia (57%, to $38 billion), especially to real estate, petrochemicals and oil refining. This consolidated the country’s position as the region’s leading recipient. FDI growth was uneven among the other countries of the region. For example, it was negative in the second and third recipient countries: Turkey and the United Arab Emirates. In Turkey
Overview 17

inflows fell to $18 billion, down by 17%, after the exceptional level reached in 2007, when a number of mega-cross border M&A deals took place in the financial industry. In the United Arab Emirates, they decreased by 3%, to $14 billion, as Dubai’s tourism, real estate and banking industries were particularly badly affected by the global economic and financial crisis.
Since the third quarter of 2008, the sharp fall in oil prices and the steadily worsening outlook for the world economy have dampened the optimism that had pervaded the region over the previous six years. Development projects across the region are being hit hard by the tightening global credit markets. The number of international banks willing to lend to projects in GCC countries has shrunk sharply. As a consequence, key oil and gas, industrial and infrastructure projects, which had substantial FDI, have been delayed. This is likely to reduce the level of FDI inflows in 2009.
Real estate, petrochemicals, refining, construction and trade were the main drivers of FDI inflows in the two leading recipient countries of the region: Saudi Arabia and Turkey. Together, they attracted 63% of total FDI inflows to the region in 2008. Inflows increased in real estate by 120% to $10.9 billion, in oil refining and petrochemicals by 37% to $12 billion, in construction by 104% to $3.7 billion and in trade by 154% to $2.9 billion.
FDI outflows from West Asia declined by 30% in 2008, to $34 billion, largely due to the significant fall (of 45%) in the value of net cross-border M&A purchases by West Asian TNCs. The sharpest decreases occurred in Saudi Arabia (from $13 billion to $1 billion) and in Qatar (from $5.3 billion to $2.4 billion). As a consequence of the large losses suffered from the global crisis, outward investors have become more risk averse, and some have turned their spending to their own crisis-hit economies. On the other hand, the fall in global equity markets has offered new investment opportunities for government-controlled entities. Some, such as SWFs of the Abu Dhabi Emirate, have already begun to make small acquisitions that support their national economic development objectives. This portends an increase in FDI outflows in 2009.
The trend towards a more liberal FDI-related policy continued in 2008 in a number of countries. Examples include reductions in the rate of tax levied on foreign companies, privatization of State-owned enterprises, liberalization of the exchange rate
World Investment Report 2009: Transnational Corporations,
18 Agricultural Production and Development

regime, improved access to financing by investors and investment facilitation. The region concluded 15 new BITs, and 12 new DTTs in 2008. Furthermore, FTAs with investment provisions were concluded between Turkey and Chile, as well as between the GCC and Singapore.
In Latin America and the Caribbean, FDI inflows increased in 2008 by 13% to $144 billion, despite the global economic and financial crisis. The growth was uneven among the subregions: it was up by 29% in South America – where 49% of the $92 billion worth of inflows targeted Brazil – and down by 6% in Central America and the Caribbean. This divergence was due to the differing impact of the crisis on the economies of the two subregions: Central America and the Caribbean were directly affected by the slowdown of the United States economy, while South America – which relies more on commodity export earnings – was affected later via the drop in commodity prices.
Natural-resource-related activities continued to be the main attraction for FDI in South America, and they are increasingly becoming a significant FDI target in Central America and the Caribbean. In particular, FDI in the metal mining industry boomed in 2008: cross-border M&As targeting this industry reached $9 billion in net value – an eightfold increase from the previous year. In contrast, the value of cross-border M&A sales in the oil and gas industry turned negative, indicating divestments by foreign firms as well as nationalizations in this industry. FDI to the manufacturing sector declined due to a sharp drop in flows to Central America and the Caribbean, where foreign-owned export-oriented manufacturing activities are closely tied to the United States economic cycle. In South America, FDI inflows in manufacturing, which are highly concentrated in natural-resource-related activities and more oriented to the internal market and to export destinations other than the United States, were more or less stable.
FDI outflows from Latin America and the Caribbean increased in 2008 by 22% to $63 billion, due to soaring outflows from South America (up by 131%), which offset the 22% decline in outflows from Central America and the Caribbean. The strongest increase was registered in Brazil (189%), where outflows reached $20 billion, while outflows from Mexico plummeted to $686 million from the previous $8 billion. The value of net cross-border acquisitions by
Overview 19
Mexican firms was negative in 2008 (-$358 million), indicating that sales of existing foreign affiliates of Mexican-based TNCs were higher than the purchases of foreign firms by Mexican-based TNCs.
The shift towards a bigger role for the State in the economy continued in a number of countries and extended to new activities. This resulted in more nationalizations in the oil and gas industry.Some countries took measures to strengthen national champions. Latin America and the Caribbean concluded only 6 BITs and 8 DTTs in 2008. The CARIFORUM States concluded the Economic Partnership Agreement with the European Union (EU), thereby agreeing to the progressive, reciprocal and asymmetric liberalization of investment.
In Latin America and the Caribbean, FDI inflows and outflows are expected to decline in 2009, as the impacts of the economic and financial crisis spread across the region.
FDI inflows to South-East Europe and the CIS increased for the eighth consecutive year, reaching $114 billion – a record level – in spite of financial turmoil and conflicts in certain parts of the region. FDI inflows grew rapidly in both subregions, especially in the first half of 2008. While in South-East Europe most of the FDI inflows were still driven by the privatization of remaining State-owned assets, in the CIS investment by TNCs was motivated by a desire to gain access to growing local consumer markets and to benefit from business opportunities arising from the liberalization of selected industries. FDI inflows continued to be unevenly distributed, with three countries (the Russian Federation, Kazakhstan and Ukraine, in that order) accounting for 84% of the region’s total. Large investments in the liberalized power-generation industry, as well as in automotives and real estate, contributed to large FDI inflows into the Russian Federation, although the bulk of FDI in the country continued to be in natural-resource-related projects. FDI in oil and natural gas projects in Kazakhstan and large investments in the banking and steel industries in Ukraine drove 2008 flows upwards in both countries.
Outward FDI flows in 2008, again dominated by Russian TNCs but also by some investment from Kazakhstan, maintained their upward trend, despite some divestments in the Russian Federation that took place in the second part of 2008. With the slowdown in foreign demand for their products, TNCs from the region shifted
World Investment Report 2009: Transnational Corporations,
20 Agricultural Production and Development
their strategies from expanding markets for their products abroad to gaining access to technological innovations and advanced marketing and management know-how.
Good market opportunities resulted in an increase in cross-border M&A sales of firms in the region’s manufacturing industries that are not deemed “strategic” (mainly in the automotive and metallurgical industries). Cross-border investment projects in the primary and services sectors marked a pause following exceptionally high values in 2007. However strategic investors continue to invest in the exploitation of vast and complex oil and gas fields.
In 2008, countries in South-East Europe and the CIS continued to liberalize their FDI regulations in certain industries such as electricity generation, banking, retail and telecommunications. Conversely, some natural-resource-rich countries introduced certain policy changes less favourable to foreign investors, such as strengthening their control over natural resources through legislation. Countries in the region concluded 25 DTTs and 19 BITs in 2008.
The slowdown of economic growth in all the countries of South-East Europe and the CIS, and the fall in commodity prices, coupled with the near-exhaustion of major privatization opportunities, is likely to lead to a large decline in FDI in the region. Preliminary data for FDI and cross-border M&As in the first quarter of 2009 and investors’ sentiments – as reflected in the results of UNCTAD’s WIPS – support this forecast.
As the economic and financial crisis and the accelerating economic downturn seriously affected all the major economies of the world, FDI flows to and from developed countries fell sharply in 2008, after reaching historic peaks in 2007. Inward FDI flows fell by 29% to $962 billion, and these declines occurred in all major host countries except the United States. FDI flows into the EU-27 countries fell by 40% in 2008, to $503 billion, as the financial crisis and the economic downturn contributed to a decline in inward FDI in the majority of them. In contrast, FDI inflows into the United States, mainly from European investors, rose by 17%, to reach an all-time high of $316 billion.
The fall in FDI inflows into developed countries was more pronounced in the manufacturing and services sectors, judging from data on cross-border M&As, while the consolidation process in the mining and quarrying industries and the increasing participation of
Overview 21
large companies from developing countries (notably from China) contributed to the rise of FDI in the primary sector in 2008.
The decline of reinvested earnings, due to falling profits and the re-channelling of loans from foreign affiliates to the headquarters of TNCs, depressed FDI outflows from developed countries in 2008 by 17%, to $1.5 trillion. However, as in the past, developed countries as a group retained their position as the largest net outward investors. Among the biggest FDI source countries, only Japan, Switzerland, Canada and the Netherlands, in that order, saw a rise in their FDI outflows in 2008, while the United States maintained its position as the largest outward investor.
In 2008, FDI policy environments in developed countries were influenced by the continuing public debate about the cross-border investments of SWFs, and fears of new investment protectionism in reaction to the financial and economic crisis. Concerns about possible discriminatory measures vis-à-vis SWFs led to the establishment of the International Working Group of Sovereign Wealth Funds and to agreement on the Santiago Principles. In addition, some developed countries have adopted or amended rules concerning the review of foreign investment on national security grounds, while others have adopted measures aimed at further liberalization of their investment regimes, or have changed tax policies and other incentives to promote foreign investment. In 2008, developed countries concluded 38 BITs (most of them with developing countries), 63 DTTs and 15 other IIAs.
FDI to and from developed countries is expected to fall in 2009 because of the continuing effects of the financial crisis and weaker economic growth in these economies. TNCs are expected to reduce their investment programmes because of declining corporate profits, limited access to financial resources and the higher cost of finance. Indeed, FDI inflows in the first quarter of 2009 were 24% lower than in the last quarter of 2008, while cross-border M&As in the first half of 2009 declined by more than 40% compared to their level in the second half of 2008. This is confirmed by WIPS.
World Investment Report 2009: Transnational Corporations,
22 Agricultural Production and Development
TRANSNATIONAL CORPORATIONS,
AGRICULTURAL PRODUCTION AND
DEVELOPMENT
Agriculture is central to the provision of food and the eradication of poverty and hunger. Not only does it provide significant mass and rural employment, it is also a major contributor to national economic growth and a considerable foreign exchange earner for many developing countries. Given the fundamental importance of agriculture to most developing economies, its chronic neglect by many of them has been of utmost concern for some time. However, several factors, which are not mutually exclusive, have resulted in a recent upswing in domestic private and foreign participation in agricultural industries in a significant number of developing countries. Most of these factors are of a structural nature, and are expected to drive agricultural investment in the foreseeable future. In this context foreign participation, as well as domestic investment, can play a critical part in agricultural production in developing countries, boosting productivity and supporting economic development.
The main drivers of agricultural investment include the availability of land and water in target locations, combined with fast growing demand and rising imports of food crops in various countries, including both the more populous emerging countries, such as Brazil, China, India and the Republic of Korea, and land- and water-scarce developing regions, such as member States of the Gulf Cooperation Council (GCC). International demand for agricultural commodities has been further spurred by other factors, such as biofuel initiatives around the world, resulting in a spate of investments in developing countries in the cultivation of sugarcane, grains (such as maize) and oilseeds (such as soya beans), as well as non-food crops such as jatropha. These trends are intertwined with a rapid rise in food prices over the past few years and subsequent shortages in commodities such as rice, which has spawned a number of “new investors”, and also triggered a number of speculative direct investments in agriculture and land.
Significance of FDI, by country, commodity and region
FDI in agriculture is on the rise, although its total size remains limited (inward FDI stock in 2007 was $32 billion) and is small
Overview 23
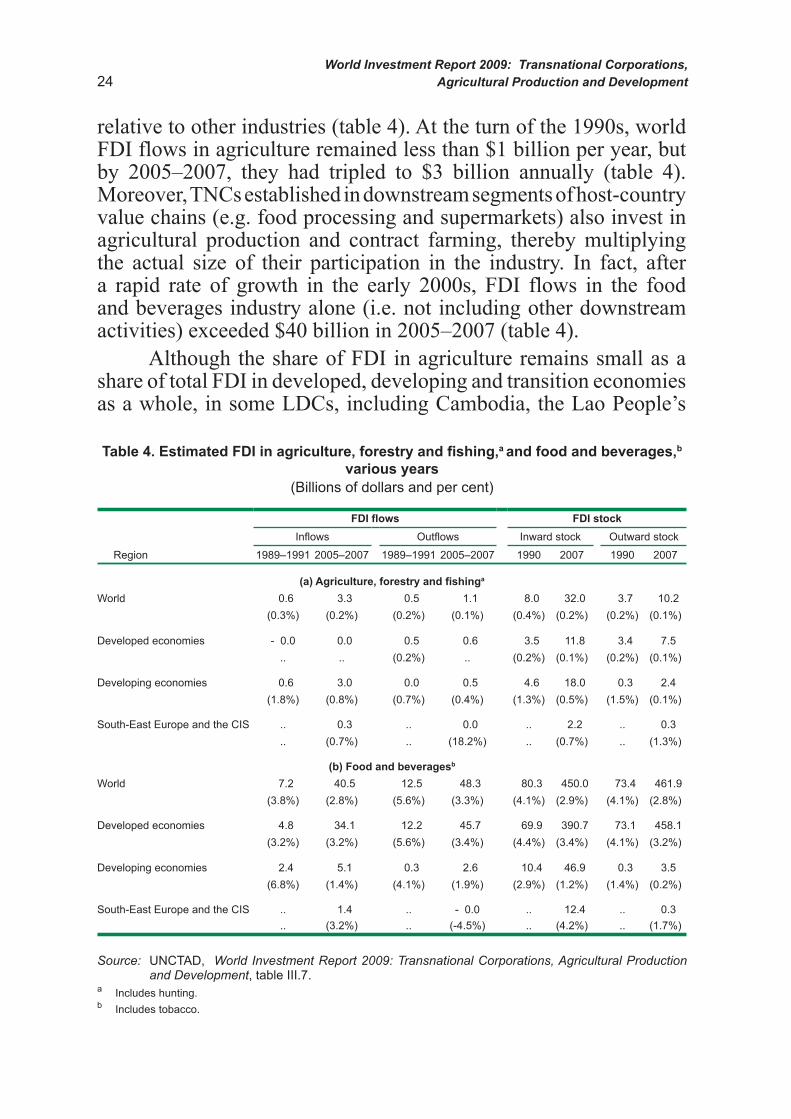
relative to other industries (table 4). At the turn of the 1990s, world FDI flows in agriculture remained less than $1 billion per year, but by 2005–2007, they had tripled to $3 billion annually (table 4). Moreover, TNCs established in downstream segments of host-country value chains (e.g. food processing and supermarkets) also invest in agricultural production and contract farming, thereby multiplying the actual size of their participation in the industry. In fact, after a rapid rate of growth in the early 2000s, FDI flows in the food and beverages industry alone (i.e. not including other downstream activities) exceeded $40 billion in 2005–2007 (table 4).
Although the share of FDI in agriculture remains small as a share of total FDI in developed, developing and transition economies as a whole, in some LDCs, including Cambodia, the Lao People’s
Table 4. Estimated FDI in agriculture, forestry and fishing,a and food and beverages,b
various years
(Billions of dollars and per cent)
FDI flows FDI stock
Inflows Outflows Inward stock Outward stock
Region 1989–1991 2005–2007 1989–1991 2005–2007 1990 2007 1990 2007
(a) Agriculture, forestry and fishinga
World 0.6 3.3 0.5 1.1 8.0 32.0 3.7 10.2
(0.3%) (0.2%) (0.2%) (0.1%) (0.4%) (0.2%) (0.2%) (0.1%)
Developed economies - 0.0 0.0 0.5 0.6 3.5 11.8 3.4 7.5
.. .. (0.2%) .. (0.2%) (0.1%) (0.2%) (0.1%)
Developing economies 0.6 3.0 0.0 0.5 4.6 18.0 0.3 2.4
(1.8%) (0.8%) (0.7%) (0.4%) (1.3%) (0.5%) (1.5%) (0.1%)
South-East Europe and the CIS .. 0.3 .. 0.0 .. 2.2 .. 0.3
.. (0.7%) .. (18.2%) .. (0.7%) .. (1.3%)
(b) Food and beveragesb
World 7.2 40.5 12.5 48.3 80.3 450.0 73.4 461.9
(3.8%) (2.8%) (5.6%) (3.3%) (4.1%) (2.9%) (4.1%) (2.8%)
Developed economies 4.8 34.1 12.2 45.7 69.9 390.7 73.1 458.1
(3.2%) (3.2%) (5.6%) (3.4%) (4.4%) (3.4%) (4.1%) (3.2%)
Developing economies 2.4 5.1 0.3 2.6 10.4 46.9 0.3 3.5
(6.8%) (1.4%) (4.1%) (1.9%) (2.9%) (1.2%) (1.4%) (0.2%)
South-East Europe and the CIS .. 1.4 .. - 0.0 .. 12.4 .. 0.3
.. (3.2%) .. (-4.5%) .. (4.2%) .. (1.7%)
Source: UNCTAD, World Investment Report 2009: Transnational Corporations, Agricultural Production and Development, table III.7.
a Includes hunting.b Includes tobacco.
World Investment Report 2009: Transnational Corporations,
24 Agricultural Production and Development

Democratic Republic, Malawi, Mozambique and the United Republic of Tanzania, the share of FDI in agriculture in total FDI flows or stocks is relatively large (figure 3). This is also true for some non-LDCs, such as Ecuador, Honduras, Indonesia, Malaysia, Papua New Guinea and Viet Nam. The high share in these countries is due to factors such as the structure of the domestic economy, availability of agricultural land (mostly for long-term lease), and national policies (including promotion of investment in agriculture).
Figure 3. Share of agriculture in inward FDI of selected economies, various years
(Per cent)
Source: UNCTAD, World Investment Report 2009: Transnational Corporations, Agricultural Production and Development, figure III.6.
a) Flows, 2005–2007 or latest available three-year period average b) Stock, 2007 or latest year available
0 1 2 3 4 5 6 7 8 9 10
The FYR of Macedonia
Bangladesh
Egypt
Mongolia
Mauritius
Czech Republic
Albania
Tunisia
Serbia
Poland
Bulgaria
Republic of Moldova
Lithuania
Romania
Nicaragua
Estonia
Latvia
Greece
China
Jordan
Russian Federation
Islamic Republic of Iran
Brazil
Madagascar
Costa Rica
Chile
Fiji
Vanuatu
Viet Nam
Ethiopia
Ukraine
Indonesia
Honduras
Peru
Mozambique
United Republic of Tanzania
Ecuador
Malaysia
Lao People's Democratic Republic
Cambodia 15.1
12.0
10.9
10.0
0 1 2 3 4 5 6 7 8 9 10
Bolivarian Rep. of Venezuela
Czech Republic
Italy
Philippines
Canada
Syrian Arab Republic
Brazil
Poland
Bulgaria
Morocco
Hungary
Mongolia
Lithuania
Republic of Korea
Estonia
Romania
Uganda
Republic of Moldova
Bangladesh
Madagascar
Russian Federation
Colombia
El Salvador
Peru
Chile
Latvia
China
Ukraine
Myanmar
Gambia
Namibia
Paraguay
United Republic of Tanzania
Viet Nam
Cambodia
Papua New Guinea
Zambia
Malawi
Swaziland 15.2
13.1
11.7
The FYR of Macedonia
Overview 25

FDI is relatively large in certain cash crops such as sugarcane, cut flowers and vegetables. The bulk of inward FDI in developing regions is aimed at food and cash crops. There is also a growing interest in crops for biofuel production through projects related to oil-seed crops in Africa and sugarcane in South America, for instance. In terms of the main produce targeted by foreign investors in developing and transition economies, some regional specialization is apparent. For example, South American countries have attracted FDI in a wide range of products such as wheat, rice, sugarcane, fruits, flowers, soya beans, meat and poultry; while in Central American countries, TNCs have focused mostly on fruits and sugarcane. In Africa, foreign investors have shown a particular interest in staple crops such as rice, wheat and oil crops; but there is also TNC involvement in sugarcane and cotton in Southern Africa, and in floriculture in East Africa. In South Asia, foreign investors have targeted the large-scale production of rice and wheat, while their activities in other Asian regions are concentrated more in cash crops, meat and poultry. Finally, TNCs in the transition economies are largely involved in dairy products, although more recently they are also seeking to invest in wheat and grains.
Significance of contract farming in developing countries
Contract farming is a significant component of TNCs’ participation in agricultural production, in terms of its geographical distribution, intensity of activity at the country level, coverage by commodities and types of TNCs involved. In this context contract farming can be defined as non-equity contractual arrangements entered into by farmers with TNC affiliates (or agents on behalf of TNCs) whereby the former agree to deliver to the latter a quantity of farm outputs at an agreed price, quality standard, delivery date and other specifications. It is an attractive option for TNCs, because it allows better control over product specifications and supply than spot markets. At the same time it is less capital-intensive, less risky and more flexible than land lease or ownership. From the perspectives of farmers, contract farming can provide predictable incomes, access to markets, and TNC support in areas such as credit and know-how.
TNCs engaged in contract farming activities and other non-equity forms are spread worldwide in over 110 countries across Africa, Asia and Latin America. For example, in 2008 the
World Investment Report 2009: Transnational Corporations,
26 Agricultural Production and Development

food processor Nestlé (Switzerland) had contracts with more than 600,000 farms in over 80 developing and transition economies as direct suppliers of various agricultural commodities. Similarly, Olam (Singapore) has a globally spread contract farming network with approximately 200,000 suppliers in 60 countries (most of them developing countries).
Contract farming is not only widespread, but also intensive in many emerging and poorer countries. For instance, in Brazil, 75% of poultry production and 35% of soya bean production are sourced through contract farming, including by TNCs. In Viet Nam the story is similar, with 90% of cotton and fresh milk, 50% of tea and 40% of rice being purchased through farming contracts. In Kenya, about 60% of tea and sugar are produced through this mode.
Moreover, contract faming arrangements cover a broad variety of commodities, from livestock through staple food produce to cash crops. For example, Olam sources globally for 17 agricultural commodities (including cashew nuts, cotton, spices, coffee, cocoa and sugar). Similarly, agricultural crops make up two thirds of Unilever’s (United Kingdom/Netherlands) raw materials, and include palm and other edible oils, tea and other infusions, tomatoes, peas and a wide range of other vegetables. These are sourced from 100,000 smallholder farmers and larger farms in developing countries, as well as third-party suppliers.
Contractual farming arrangements enable different types of TNCs in the downstream stages of agribusiness value chains, including food manufacturers, biofuel producers, retailers and many others, to secure agricultural inputs from local farmers in different host countries.
The universe of TNCs participating in agricultural production
The 25 largest agriculture-based TNCs (i.e. companies which are primarily located in the agricultural production segmentof agribusiness, such as farms and plantations) differ from the top agriculture-related TNCs (i.e. those primarily in upstream or downstream stages of these value chains): the former have a significant number of developing-country firms among their ranks, while the latter do not (table 5). In terms of foreign assets, the number of agriculture-based TNCs is split almost evenly between developed-
Overview 27

and developing-country firms, indicating that firms from developing countries are also emerging as important players in global food and non-food agricultural production. However, developed-country firms still dominate among agriculture-related TNCs. Twelve out of the top 25 agriculture-based TNCs are headquartered in developing countries and 13 in developed countries. Indeed, the top position in the list is occupied by a developing-country TNC, Sime Darby Berhad (Malaysia), while United States firms (Dole Food and Del Monte) occupy the second and third positions (table 5).
The universe of agriculture-related TNCs includes food processors/manufacturers, retailers, traders and suppliers of inputs. These TNCs are usually larger than agricultural TNCs. For example, the world’s largest food and beverages TNC, Nestlé (Switzerland), controls $66 billion in foreign assets, and the largest food retailer, Wal-Mart (United States), controls $63 billion. In contrast, the largest agricultural TNC, Sime Darby (Malaysia), has only $5 billion of foreign assets. The list of the largest TNC input suppliers to agriculture comprises only developed-country firms. In food processing, 39 of the top 50 firms are headquartered in developed countries. Compared to other TNCs in agribusiness, those in food and beverages are very large: the nine largest, all headquartered in developed countries, control about $20 billion of foreign assets each; together, they represent more than two thirds of the foreign assets of the top 50 firms. Retailing and supermarket TNCs also play a major role in international agricultural supply chains. The majority of the 25 largest TNCs in this industry (22) are again from developed countries (table 5).
Apart from traditional TNCs involved in agriculture, newcomers, such as State-owned enterprises, sovereign wealth funds and international institutions, are increasingly active in agriculture. The main drivers of (or motives for) the new investors are the intertwined twins of threat and opportunity. For example, Agricapital (a State-owned fund based in Bahrain) is investing in food crops overseas to support its government’s food security policies. At the same time, supplying food to the world’s burgeoning markets is seen as a lucrative opportunity by other actors, thereby spurring international investment in agriculture by companies and funds such as Vision 3 (United Arab Emirates) and Goldman Sachs (United States).
World Investment Report 2009: Transnational Corporations,
28 Agricultural Production and Development
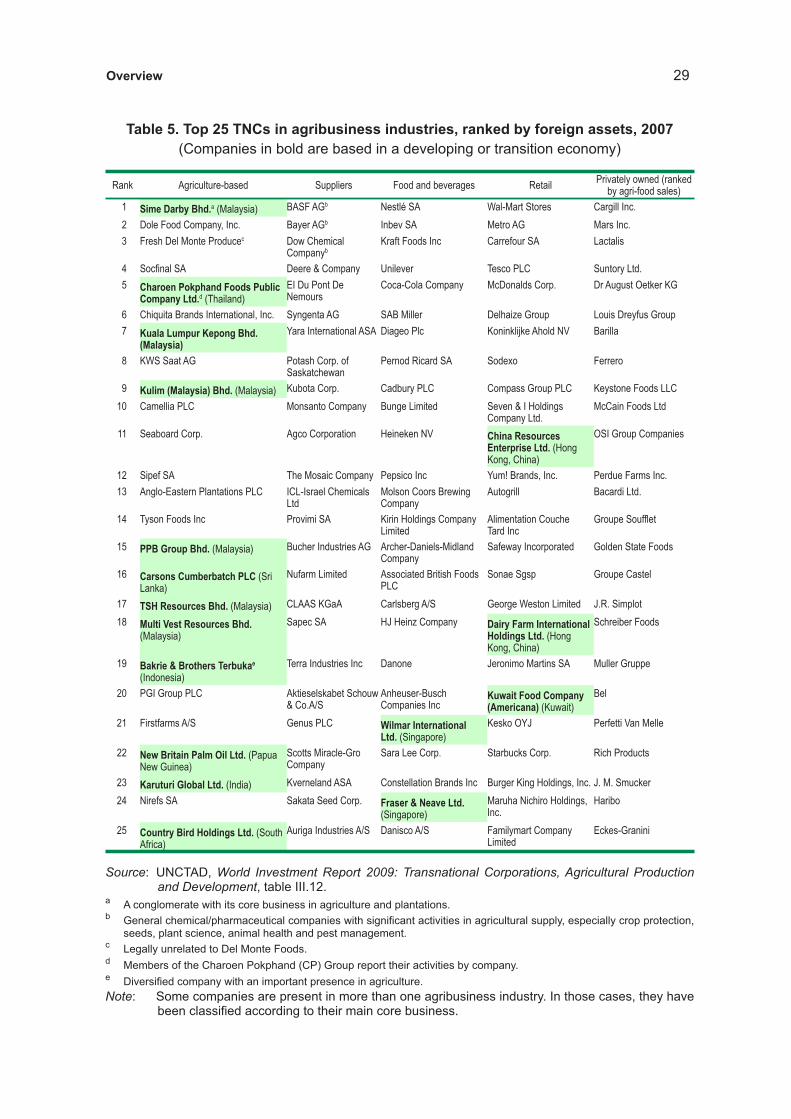
Table 5. Top 25 TNCs in agribusiness industries, ranked by foreign assets, 2007
(Companies in bold are based in a developing or transition economy)
Rank Agriculture-based Suppliers Food and beverages RetailPrivately owned (ranked
by agri-food sales)
1 Sime Darby Bhd.a (Malaysia) BASF AGb Nestlé SA Wal-Mart Stores Cargill Inc.
2 Dole Food Company, Inc. Bayer AGb Inbev SA Metro AG Mars Inc.
3 Fresh Del Monte Producec Dow Chemical Companyb
Kraft Foods Inc Carrefour SA Lactalis
4 Socfinal SA Deere & Company Unilever Tesco PLC Suntory Ltd.
5 Charoen Pokphand Foods Public Company Ltd.d (Thailand)
EI Du Pont De Nemours
Coca-Cola Company McDonalds Corp. Dr August Oetker KG
6 Chiquita Brands International, Inc. Syngenta AG SAB Miller Delhaize Group Louis Dreyfus Group
7 Kuala Lumpur Kepong Bhd. (Malaysia)
Yara International ASA Diageo Plc Koninklijke Ahold NV Barilla
8 KWS Saat AG Potash Corp. of Saskatchewan
Pernod Ricard SA Sodexo Ferrero
9 Kulim (Malaysia) Bhd. (Malaysia) Kubota Corp. Cadbury PLC Compass Group PLC Keystone Foods LLC
10 Camellia PLC Monsanto Company Bunge Limited Seven & I Holdings Company Ltd.
McCain Foods Ltd
11 Seaboard Corp. Agco Corporation Heineken NV China Resources Enterprise Ltd. (Hong Kong, China)
OSI Group Companies
12 Sipef SA The Mosaic Company Pepsico Inc Yum! Brands, Inc. Perdue Farms Inc.
13 Anglo-Eastern Plantations PLC ICL-Israel Chemicals Ltd
Molson Coors Brewing Company
Autogrill Bacardi Ltd.
14 Tyson Foods Inc Provimi SA Kirin Holdings Company Limited
Alimentation Couche Tard Inc
Groupe Soufflet
15 PPB Group Bhd. (Malaysia) Bucher Industries AG Archer-Daniels-MidlandCompany
Safeway Incorporated Golden State Foods
16 Carsons Cumberbatch PLC (Sri Lanka)
Nufarm Limited Associated British Foods PLC
Sonae Sgsp Groupe Castel
17 TSH Resources Bhd. (Malaysia) CLAAS KGaA Carlsberg A/S George Weston Limited J.R. Simplot
18 Multi Vest Resources Bhd.(Malaysia)
Sapec SA HJ Heinz Company Dairy Farm International Holdings Ltd. (Hong Kong, China)
Schreiber Foods
19 Bakrie & Brothers Terbukae
(Indonesia)
Terra Industries Inc Danone Jeronimo Martins SA Muller Gruppe
20 PGI Group PLC Aktieselskabet Schouw & Co.A/S
Anheuser-BuschCompanies Inc
Kuwait Food Company (Americana) (Kuwait)
Bel
21 Firstfarms A/S Genus PLC Wilmar International Ltd. (Singapore)
Kesko OYJ Perfetti Van Melle
22 New Britain Palm Oil Ltd. (Papua New Guinea)
Scotts Miracle-Gro Company
Sara Lee Corp. Starbucks Corp. Rich Products
23 Karuturi Global Ltd. (India) Kverneland ASA Constellation Brands Inc Burger King Holdings, Inc. J. M. Smucker
24 Nirefs SA Sakata Seed Corp. Fraser & Neave Ltd.(Singapore)
Maruha Nichiro Holdings, Inc.
Haribo
25 Country Bird Holdings Ltd. (South Africa)
Auriga Industries A/S Danisco A/S Familymart Company Limited
Eckes-Granini
Source: UNCTAD, World Investment Report 2009: Transnational Corporations, Agricultural Production and Development, table III.12.
a A conglomerate with its core business in agriculture and plantations.b General chemical/pharmaceutical companies with significant activities in agricultural supply, especially crop protection,
seeds, plant science, animal health and pest management. c Legally unrelated to Del Monte Foods.d Members of the Charoen Pokphand (CP) Group report their activities by company.e Diversified company with an important presence in agriculture.
Note: Some companies are present in more than one agribusiness industry. In those cases, they have been classified according to their main core business.
Overview 29

The rise of South-South FDI
There are indications that South-South investment in agricultural production is on the rise, and that this trend is set to continue in the long term. Investors from developing countries became major sources of cross-border takeovers in 2008. Their net cross-border M&A purchases, amounting to $1,577 million, accounted for over 40% of the world total ($3,563 million). Examples of South-South investment projects include Sime Darby’s (Malaysia) $800 million investment in a plantation in Liberia in 2009; Chinese investments and contract farming in commodities such as maize, sugar and rubber in the Mekong region, especially in Cambodia and the Lao People’s Democratic Republic; the regional expansion of Zambeef (Zambia) into Ghana and Nigeria; and the expansion by Grupo Bimbo (Mexico) across Latin America and the Caribbean.
In addition to commercial investment in agriculture – a common feature of developed- and developing-country TNCs – in the wake of the food crisis, food security has also become a major driver of new investors. These include companies and funds (some State-owned or backed) from a variety of countries, especially the Republic of Korea and GCC countries. To varying degrees, the governments of these source countries have decided that investment in target host countries, giving them control over crop production and export of the output back to their home economy, is the most effective way of ensuring food security for their populations. For many of these countries, the most crucial factor or driver behind outward FDI in agriculture is not land per se, but rather the availability of water resources to irrigate the land. Most of their investment is in other developing countries.
The scale of South-South FDI driven by food security concerns is not easy to determine because many relevant deals have only recently been signed, although others are being considered or in negotiation. Of the definite larger scale investments involving land acquisitions (i.e. outright ownership and long-term leases) undertaken thus far, the largest investing countries from the South include Bahrain, China, Qatar, Kuwait, the Libyan Arab Jamahiriya, Saudi Arabia, the Republic of Korea and the United Arab Emirates. The most important developing host countries are in Africa, with
World Investment Report 2009: Transnational Corporations,
30 Agricultural Production and Development
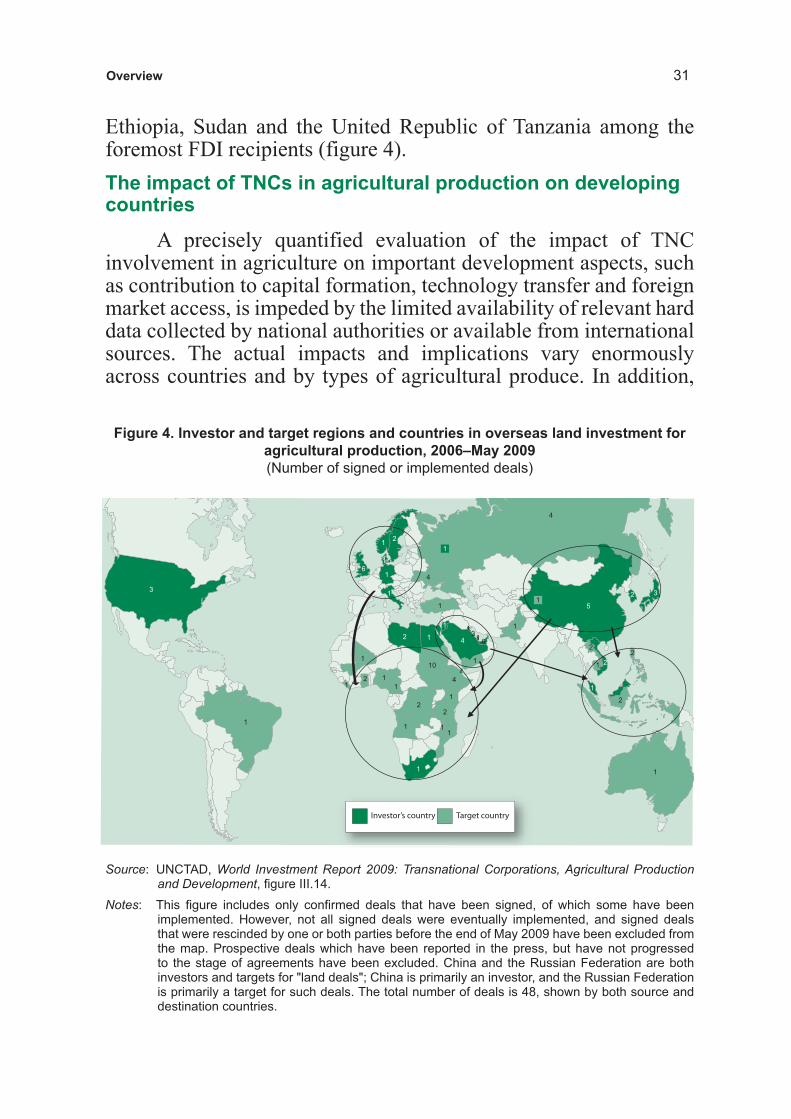
Ethiopia, Sudan and the United Republic of Tanzania among the foremost FDI recipients (figure 4).
The impact of TNCs in agricultural production on developing countries
A precisely quantified evaluation of the impact of TNC involvement in agriculture on important development aspects, such as contribution to capital formation, technology transfer and foreign market access, is impeded by the limited availability of relevant hard data collected by national authorities or available from international sources. The actual impacts and implications vary enormously across countries and by types of agricultural produce. In addition,
Figure 4. Investor and target regions and countries in overseas land investment for
agricultural production, 2006–May 2009
(Number of signed or implemented deals)
Source: UNCTAD, World Investment Report 2009: Transnational Corporations, Agricultural Production and Development, figure III.14.
Notes: This figure includes only confirmed deals that have been signed, of which some have been implemented. However, not all signed deals were eventually implemented, and signed deals that were rescinded by one or both parties before the end of May 2009 have been excluded from the map. Prospective deals which have been reported in the press, but have not progressed to the stage of agreements have been excluded. China and the Russian Federation are both investors and targets for "land deals"; China is primarily an investor, and the Russian Federation is primarily a target for such deals. The total number of deals is 48, shown by both source and destination countries.
3
1
1
11
1
4
10
1
1
11
1
6
22
2
1
124 6
13
11
1
1
1
1
12
4
4
5
1
132
2
22
2
1
1
1
1
Investor’s country Target country
Overview 31
they are influenced by a range of factors, including the type of TNC involvement, the institutional environment and the level of development of the host country. A number of salient observations of TNCs’ involvement in agriculture for developing countries nevertheless emerge.
Overall, TNC involvement in developing countries has promoted the commercialization and modernization of agriculture. TNCs are by no means the only – and seldom the main – agent driving this process, but they have played an important role in a significant number of countries. They have done so not only by investing directly in agricultural production, but also through non-equity forms of involvement in agriculture, mostly contract farming. Indeed, non-equity forms of participation have been on the rise in recent years. In many cases, they have led to significant transfers of skills, know-how and methods of production, facilitated access to credit and various inputs, and given access to markets to a very large number of small farmers previously involved mostly in subsistence farming.
Although TNC involvement in agriculture has contributed to enhanced productivity and increased output in a number of developing countries, there is lack of evidence on the extent to which their involvement has allowed the developing world to increase its production of staple foods and improve food security. Available evidence points to TNCs being mostly involved in cash crops (except for the recent rise of South-South FDI in this area). Such a finding reveals the development challenges for developing countries in promoting TNC participation in their agricultural industry to improve food security. However, food security is not just about food supply. TNCs can also have an impact on food access, stability of supply and food utilization and, in the longer run, their impacts on these aspects of food security are likely to prove more important for host economies.
Positive impacts of TNC involvement in agriculture are not gained automatically by developing countries. While TNCs have at times generated employment and improved earnings in rural communities, no clear trend is discernible. To the extent that TNCs promote modernization of agriculture and a shift from subsistence to commercial farming, their long-term impact is likely to accelerate the long-term reduction in farm employment while raising earnings.
World Investment Report 2009: Transnational Corporations,
32 Agricultural Production and Development

Only a limited number of developing countries have also been able to benefit from transfers of technologies. In particular, the R&D and technological innovations of the large TNCs are typically not geared towards the staple foods produced in many developing countries.
Apart from the potentially large benefits that developing countries can derive from TNC participation in their agriculture, past experiences and evidence indicate that governments need to be sensitive to the negative impacts that can arise. A particular concern is that of the asymmetry in the relationship between small farmers and a restricted number of large buyers, which raises serious competition issues.
Recent experiences also underscore that developing-country governments need to be aware of the environmental and social consequences of TNCs involvement in agriculture, even though there is no clear and definite pattern of impact. Case studies show that TNCs have the potential to bring environmentally sound production technologies, but their implication in extensive farming has also raised concerns, together with their impact on biodiversity and water usage. Similarly, TNCs’ involvement raises significant social and political issues whenever they own or control large tracts of agricultural land.
Developing countries’ strategies towards TNC participation in their agriculture industries
The expansion of agricultural production is vital for developing countries, both to meet rising food needs and to revitalize the sector. Therefore, policymakers need to promote more investment in this sector, both private and public, and domestic and foreign. Given the financial and technological constraints in many developing countries, policymakers should devise strategies for agricultural development and consider what role TNCs could play in implementing them. The challenge is considerable, as agriculture is a sensitive industry. There is a need to reflect the interests of all stakeholders, especially local farmers, and include them, as far as possible, in the policy deliberation and formulation process.
The key challenge for policymakers in developing countries is to ensure that TNC involvement in agricultural production generates development benefits. Both FDI and contractual arrangements between TNCs and local farmers can bring specific benefits to the
Overview 33
host country, such as transfer of technology, employment creation and upgrading the capacities of local farmers, together with higher productivity and competitiveness. Therefore, policies need to be designed with a view to maximizing these benefits.
It is equally important for policymakers to address social and environmental concerns with regard to TNC involvement. Social and environmental impacts need to be assessed carefully, and particular attention paid to possible implications for domestic agricultural development and food security in the long run. Negotiations with foreign investors should be transparent with regard to the land involved and the purpose of production, and local landholders should be encouraged to participate in the process. Policies should be designed to protect traditional land tenure rights of local farmers in order to avoid abuses of what might be considered underutilized or underdeveloped land, and to make possible local farmers’ access to courts in case of dispossession. Care needs to be taken to secure the right to food for the domestic population and to protect the rights of indigenous peoples.
Promoting FDI and contractual arrangements between TNCs and farmers in agricultural production
Numerous developing countries have started to actively encourage FDI in agricultural production. A survey jointly undertaken by UNCTAD and the World Association of Investment Promotion Agencies (WAIPA) on the role of investment promotion agencies (IPAs) in attracting FDI in agricultural production revealed that the majority of respondents, in particular those in developing countries, promote FDI in this sector. Moreover, these respondents anticipate a still greater role for FDI in this area in the future. TNCs are mainly expected to make new technologies, finance and inputs available to the sector and to improve access to foreign markets for cash crops.
Overall, developing countries are relatively open to TNC involvement in agricultural production, although there are considerable differences between individual countries based on cultural, socio-economic and security-related considerations. The most frequently found restriction for foreign investment in agricultural production relates to land ownership, but in many cases foreign investors are allowed to lease land.
World Investment Report 2009: Transnational Corporations,
34 Agricultural Production and Development
Aside from promoting FDI in agricultural production, host countries should pay particular attention to promoting contractual arrangements between TNCs and local farmers, such as contract farming, which would enable the latter to enhance their capacities and become part of national or international food value chains. However, in pursuing such strategies host countries should be aware that, in general, TNCs are more interested in contractual arrangements concerning the production of cash crops. This means that promoting contract farming for alleviating the food crisis remains a big challenge.
In this context, governments should address the specific obstacles to efficient cooperation between TNCs and local farmers, such as (1) lack of capacity of smallholders to supply products in a consistent and standardized manner; (2) lack of availability of adequate technology; (3) lack of capital; (4) remoteness of production and capacity for timely delivery; (5) limited role of farmer organizations; and (6) lack of adequate legal instruments for dispute settlement. Various policy options exist for tackling these bottlenecks. Among them are education and training programmes for local farmers, the provision of government-led extension services, the establishment of standards and certification procedures, the granting of financial aid, matchmaking services to connect local farmers to TNCs, support for the establishment of farmer organizations, and improving the domestic court systems to increase legal security. Governments could also consider the development of model contracts to protect the interests of farmers in negotiating with TNCs.
Leveraging TNC participation for long-term agricultural development: an integrated policy approach
Notwithstanding some reservations about FDI in agricultural production, host countries should not underestimate the potential of this form of TNC involvement for enhancing development objectives. In particular, in light of the recent interest in outward FDI to secure domestic food supply there is potential for host countries to benefit from such investment for their own staple food needs, provided that the amount of production is shared between home and host countries. The challenge for host countries is to match inward FDI with existing domestic resources, such as abundant labour and available land, and to create positive synergies to promote long-term agricultural development and increase food security.
Overview 35

Key instruments for maximizing the contribution of FDI to sustainable agricultural and rural development are the domestic legislative framework and, especially as far as major land acquisitions are involved, investment contracts between the host government and foreign investors. These contracts should be designed in such a way as to ensure that benefits for host countries and smallholders are maximized. Critical issues to be considered include, in particular, (1) entry regulations for TNCs, (2) the creation of employment opportunities, (3) transfer of technology and R&D, (4) welfare of local farmers and communities, (5) production sharing, (6) distribution of revenues, (7) local procurement of inputs, (8) requirements of target markets, (9) development of agriculture-related infrastructure, and (10) environmental protection. To ensure food security in host countries as a result of FDI in staple food production by “new” investors, home and host countries could consider output-sharing arrangements. Before concluding an investment contract with foreign investors, governments should conduct an environmental and social impact assessment of the specific project. After the investment has been made, monitoring and evaluating its impact on the host country’s overall development process is critical.
IIAs can be an additional means to promote TNC participation in agricultural production, but careful formulation is crucial with a view to striking a proper balance between the obligations to protect and promote foreign investment, on the one hand, and policy space for the right to regulate, on the other hand. This is particularly important in the case of agriculture, as the sector is highly regulated and sensitive, and government agricultural policies may be controversial and subject to change.
There are several other policy areas relating to a broader economic agenda that are determinants for TNC participation in agricultural production and their development impact in the host country. These therefore should be integrated into host-country strategies aimed at attracting TNCs to agricultural production. Among them are those related to infrastructure development, competition, trade and R&D.
Infrastructure development is critical as a means of trade facilitation for agricultural goods. This includes improving existing transportation systems, investing in trade facilitation, providing sufficient post-harvest storage facilities and renovating outdated
World Investment Report 2009: Transnational Corporations,
36 Agricultural Production and Development

water irrigation infrastructure. Given the high costs involved and the limited ODA available, policymakers may wish to require TNCs to contribute to infrastructure development when permitting large-scale projects.
Since farmers are generally the weakest link in the supply chain, competition policy can play a vital role in protecting them against potential abuses arising from the dominant position enjoyed by TNCs.
Tariffs and non-tariff barriers as well as subsidies maysubstantially influence TNC involvement in agricultural production. These kinds of policy measures in developed countries could discourage investment and contract farming in developing countries where the subsidizing country and the potential developing host country produce identical agricultural products or close substitutes. Reducing subsidies in developed countries could encourage FDI to poor countries.
Economies of scale is another challenge, particularly for small developing countries. In their case, regional integration can be an important instrument in making them more attractive for TNCs involved in agricultural production and exports.
Host countries should also consider the role of R&D activities and intellectual property rights for increasing agricultural production and adapting the development of seeds and agricultural products to local and regional conditions. Policies should aim at domestic capacity-building to develop strong counterparts to TNCs in the host country – private or public. In this regard, public-private partnerships (PPPs) for R&D can serve as models for fostering innovation, for adapting the development of seeds and products to local and regional conditions, for making agricultural R&D more responsive to the needs of smallholders and to the challenges of sustainability, for reducing costs, and for mitigating the commercial and financial risks of the venture through risk-sharing between the partners.
Developing home countries’ FDI strategies to secure food supplies
In the wake of recent food price hikes and export restrictions by agricultural exporter countries, some food-importing countries have established policies aimed at the development of overseas food
Overview 37
sources for their domestic food security. Despite some concerns that these policies may aggravate food shortage in host countries, they have the potential for increasing global food production and mitigating food shortages in both home and host developing countries. Past attempts by some governments to invest in overseas agriculture have not always met their expectations. Indeed, there are lessons to be learnt. In addition to outward FDI, home countries could consider whether overseas food production in the form of contract farming may be a viable and less controversial alternative to FDI. Besides focusing on agricultural production itself, another option is to invest in trading houses and in logistical infrastructure such as ports.
Developing an internationally agreed set of core principles for large-scale land acquisitions by foreign investors in agricultural production
Agriculture and food security have gained considerable importance on the international policy agenda, both at the multilateral and regional level. A major development was the establishment of the United Nations High-Level Task Force on the Global Food Security Crisis (HLTF) in April 2008. The aim of the HLTF was to create a prioritized plan of action for addressing the global food crisis and coordinate its implementation. The HLTF thus developed the Comprehensive Framework for Action (CFA) – a framework for setting out the joint position of HLTF members on proposed actions to address the current threats and opportunities resulting from food price rises; create policy changes to avoid future food crises, and contribute to country, regional and global food and nutritional security. A number of initiatives to boost agricultural productivity have also been taken at the regional level, including the Comprehensive Africa Agriculture Development Programme (CAADP) under the New Partnership for Africa’s Development (NEPAD). The G-8 Summit in L’Aquila, Italy, in July 2009 made a commitment to mobilizing $20 billion over the next three years for a comprehensive strategy for sustainable global food security and for advancing by end 2009 the implementation of a Global Partnership for Agriculture and Food Security. When deciding how to make best use of these new ODA funds, consideration could be given to agricultural development strategies that combine public investments with maximizing benefits from TNC involvement. With regard to
World Investment Report 2009: Transnational Corporations,
38 Agricultural Production and Development
possible future international initiatives, consideration should be given to developing a set of core principles concerning major land acquisitions, including rules on transparency, respect for existing land rights, the right to food, protection of indigenous peoples and social and environmental sustainability.
Investing in a new green revolution
TNC participation in agriculture in developing countries through FDI, contract farming and other forms has helped a number of pioneering countries, including Brazil, China, Kenya and Viet Nam, meet the challenge of boosting investment in their agriculture, thereby making the industry a lynchpin for economic development and modernization. The route has not been easy, with costs and benefits arising from TNC involvement. For most developing countries many development challenges still remain in the quest for agricultural development, food security and modernization. Among these challenges is how to build and reinforce domestic, regional and international value chains, as well as harness technology in agriculture. It is clear that for LDCs and other poor countries, in Africa and elsewhere, a “new green revolution” is urgent, and an essential question to ask is whether TNCs can play a role in its fulfilment.
This year’s World Investment Report reveals a real and rising interest by TNCs – from the South as well as the North – for investment in developing countries’ agricultural industries. Moreover, a large proportion of this interest is in poorer regions, such as Africa. TNCs vary along the value chain, but overall they have the technological and other assets available to support developing countries’ strategies towards intensifying take-up of the green revolution. The Report also demonstrates examples of this occurring through partnerships and alliances with farmers, public research entities and others. More needs to be done, but the building blocks are in place for striking a new “grand bargain” to harness the green revolution in the service of Africa’s poor and hungry, as well as the wider objectives of development. Central to this programme are, first, investing in trade and investment facilitation and, secondly, creating institutional arrangements such as PPPs to advance the green revolution in the region by encouraging and boosting critical flows of capital, information, knowledge and skills from partners to
Overview 39
the countryside. An important initiative in this regard would be the establishment of seed and technology centres in the form of PPPs, mandated with the task of fostering channels to adapt relevant seed and farming technologies to make them suitable to local conditions, distributing seeds to farmers, and, in the longer term, building and deepening indigenous capacity.
Geneva, July 2009 Supachai Panitchpakdi
Secretary-General of the UNCTAD
World Investment Report 2009: Transnational Corporations,
40 Agricultural Production and Development

ANNEX
World Investment Report 2009: Transnational Corporations,
Agricultural Production and Development
TABLE OF CONTENTS
PREFACE
ACKNOWLEDGEMENTS
ABBREVIATIONS
KEY MESSAGES
OVERVIEW
PART ONE
FDI TRENDS, POLICIES AND PROSPECTS
CHAPTER I. GLOBAL TRENDS: FDI FLOWS IN DECLINE
A. THE FINANCIAL CRISIS, ECONOMIC DOWNTURN AND FDI FLOWS
1. Global slowdown in FDI flows, prompted by the crisis2. The transmission channels of the crisis3. Key features of the FDI downturn and underlying factors
a. The role of divestments
b. Mode of investment
4. Uneven impact of the crisis on different regions and sectors
B. HOW THE LARGEST TNCs ARE COPING WITH THE GLOBAL CRISIS
1. The 100 largest non-financial TNCsa. A slowdown of internationalization in 2008
b. The impact of the global crisis on the top 100 TNCs
2. The top 100 TNCs from developing economiesa. A growing role in the world economy
b. The impact of the global crisis on developing-country TNCs
3. The top 50 financial TNCsa. Internationalization of the top 50 financial TNCs in 2008
b. The impact of the global crisis on the top 50 financial TNCs
4. Conclusion
C. FDI BY SPECIAL FUNDS
1. Declining FDI by private equity funds2. FDI by sovereign wealth funds on the rise despite the crisis3 FDI by private equity funds and sovereign wealth funds compared
D. NEW DEVELOPMENTS IN FDI POLICIES
1. Developments at the national levela. Major policy trends
b. Policies introduced in response to the financial crisis and their potential impact on FDI
2. Developments at the international levela. Bilateral investment treaties
b. Double taxation treaties c. International investment agreements other than BITs and DTTs
Annex 41
d. Investor-State dispute settlement e. International investment agreements and the financial crisis
E. PROSPECTS
CHAPTER II. REGIONAL TRENDS
INTRODUCTION
A. DEVELOPING COUNTRIES
1. Africaa. Geographical trends
b. Sectoral analysis: FDI focused on manufacturing c. Policy developments
d. Prospects: the global economic slowdown could hurt FDI growth, especially in LDCs
2. South, East, South-East Asia and Oceania a. Geographical trends b. Sectoral trends c. Policy developments
d. Prospects: downturn is looming
3. West Asia a. Geographical trends
b. Sectoral trends: manufacturing up c. Policy developments d. Prospects: fall in inflows, but a possible rise in outflows
4. Latin America and the Caribbeana. Geographical trends
b. Sectoral analysis: continued interest in natural resources and related activities c. Policy developments
d. Prospects: gloomy in short term, improving in medium term
B. SOUTH-EAST EUROPE AND THE COMMONWEALTH OF INDEPENDENT STATES
1. Geographical trendsa. Inward FDI: the upward trend continued
b. Outward FDI: more moderate growth
2. Sectoral trends: manufacturing attracted market-seeking FDI3. Policy developments4. Prospects: slowdown expected
C. DEVELOPED COUNTRIES
1. Geographical trendsa. Inward FDI: strong decline as the financial and economic crisis unfolds
b. Outward FDI: moderate but a widespread decline
2. Sectoral trends: robust FDI growth in the primary sector3. Policy developments4. Prospects: FDI flows expected to fall further
PART TWO
TNCs, AGRICULTURAL PRODUCTION AND DEVELOPMENT
INTRODUCTION
CHAPTER III. TNCs AND AGRICULTURAL PRODUCTION
IN DEVELOPING COUNTRIES
A. INTRODUCTION
B. AGRICULTURE IN DEVELOPING COUNTRIES: CHARACTERISTICS,
SIGNIFICANCE AND SALIENT ISSUES
1. Characteristics of agricultural productiona. A diverse industry
42 World Investment Report 2008: Transnational Corporations and the Intrastructure Challenge
b. Agricultural inputs, technology and institutions
c. Environment and biodiversity
2. The significance of agriculture in developing countriea. General importance
b. Agriculture as a neglected motor for development
3. Salient issues influencing investment in agriculture
a. The food crisis and the drive for food security
b. Investment to meet MDG targets
c. The rise of biofuel production
C. TNC PARTICIPATION IN AGRICULTURE: HISTORICAL AND
CONCEPTUAL INSIGHTS
1. Historical developments: from plantations to value chain coordination2. Conceptual overview
D. TRENDS IN FDI AND OTHER FORMS OF TNC PARTICIPATION IN AGRICULTURE
1. FDI trends and patterns a. FDI
b. Cross-border M&As
c. Geographical patterns
2. Contract farming3. Trends in South-South investment in agriculture
E. MAJOR TNCs IN AGRICULTURE AND RELATED ACTIVITIES
1. Agriculture-based TNCs
2. TNCs from other segments of the value chain3. New investors in agriculture
F. CONCLUSIONS
CHAPTER IV. DEVELOPMENT IMPLICATIONS OF TNC INVOLVEMENT IN AGRICULTURE
A. INTRODUCTION
B. IMPACT ON AGRICULTURAL PRODUCTION
IN HOST DEVELOPING ECONOMIES
1. Financing and investmenta. Contributing capital and increasing investment through FDI
b. Easing financial constraints through contract farming
2. Technology and innovationa. TNC participation and technology transfer
b. TNC participation and the agricultural innovation system in host countries
3. Employment and skillsa. Employment creation
b. Skills enhancement
4. Standards and supply chain managementa. Diffusion of standards
b. Use of contract farming and specialized procurement agents c. Agribusiness TNCs’ supply chains and the decline of small farmers
5. Foreign-market access and exportsa. Trading TNCs and exports of traditional agricultural commodities
b. TNCs and exports of non-traditional agricultural products
6. Competition and market power7. Implications for the host economy
Annex 43

C. BROADER IMPLICATIONS
1. Impact on the environment2. Social effects and political implications3. Implications for food security in host and home developing countries
a. Implications for host countries
b. Implications for home countries
D. CONCLUSIONS
CHAPTER V. POLICY CHALLENGES AND OPTIONS
A. THE MAIN POLICY CHALLENGES
B. HOST-COUNTRY POLICY OPTIONS FOR TNC PARTICIPATION
IN AGRICULTURAL PRODUCTION
1. Openness to FDI in agricultural productiona. Entry conditions
b. Land and water use
c. Investment promotion and protection
2. Maximizing development benefits from TNC participationa. Leveraging FDI for long-term agricultural development
b. Promoting contractual arrangements between TNCs and local farmers
3. Addressing environmental and social concerns a. Sustainable agriculture and environmental policies b. Social policies
c. Corporate social responsibility
4. Other relevant policies
a. Infrastructure policies
b. Competition policies
c. Trade policies
d. R&D-related policies5. Concluding remarks
C. HOME-COUNTRY POLICIES TO ENCOURAGE OUTWARD FDI
IN AGRICULTURAL PRODUCTION
1. General promotion policies2. Challenges related to overseas agricultural production to secure food supply3. Policy implications
D. INTERNATIONAL POLICIES RELATED TO FDI
IN AGRICULTURAL PRODUCTION
1. Major international policy initiatives2. International investment agreements
E. CONCLUSIONS AND POLICY OPTIONS
EPILOGUE
REFERENCES
ANNEXES
SELECTED UNCTAD PUBLICATIONS ON TNCs AND FDI
QUESTIONNAIRE
44 World Investment Report 2008: Transnational Corporations and the Intrastructure Challenge
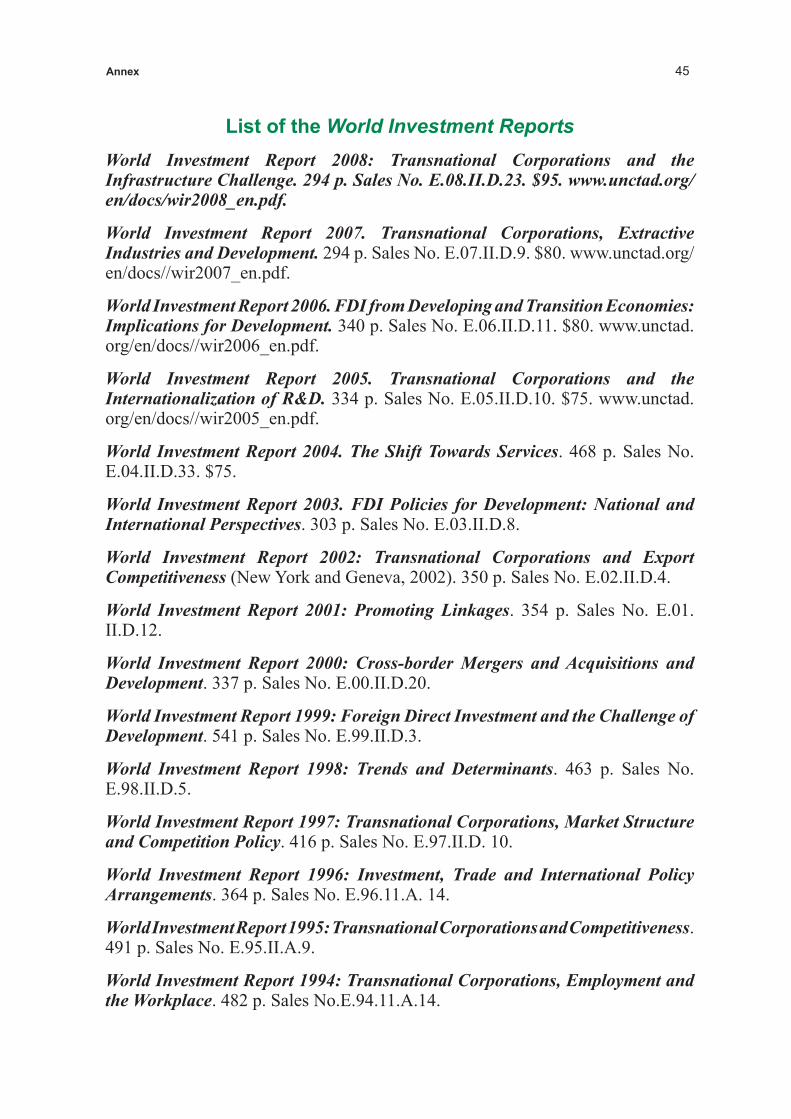
List of the World Investment Reports
World Investment Report 2008: Transnational Corporations and the Infrastructure Challenge. 294 p. Sales No. E.08.II.D.23. $95. www.unctad.org/en/docs/wir2008_en.pdf.
World Investment Report 2007. Transnational Corporations, Extractive Industries and Development. 294 p. Sales No. E.07.II.D.9. $80. www.unctad.org/en/docs//wir2007_en.pdf.
World Investment Report 2006. FDI from Developing and Transition Economies: Implications for Development. 340 p. Sales No. E.06.II.D.11. $80. www.unctad.org/en/docs//wir2006_en.pdf.
World Investment Report 2005. Transnational Corporations and the Internationalization of R&D. 334 p. Sales No. E.05.II.D.10. $75. www.unctad.org/en/docs//wir2005_en.pdf.
World Investment Report 2004. The Shift Towards Services. 468 p. Sales No. E.04.II.D.33. $75.
World Investment Report 2003. FDI Policies for Development: National and International Perspectives. 303 p. Sales No. E.03.II.D.8.
World Investment Report 2002: Transnational Corporations and Export Competitiveness (New York and Geneva, 2002). 350 p. Sales No. E.02.II.D.4.
World Investment Report 2001: Promoting Linkages. 354 p. Sales No. E.01.II.D.12.
World Investment Report 2000: Cross-border Mergers and Acquisitions and Development. 337 p. Sales No. E.00.II.D.20.
World Investment Report 1999: Foreign Direct Investment and the Challenge of Development. 541 p. Sales No. E.99.II.D.3.
World Investment Report 1998: Trends and Determinants. 463 p. Sales No. E.98.II.D.5.
World Investment Report 1997: Transnational Corporations, Market Structure and Competition Policy. 416 p. Sales No. E.97.II.D. 10.
World Investment Report 1996: Investment, Trade and International Policy Arrangements. 364 p. Sales No. E.96.11.A. 14.
World Investment Report 1995: Transnational Corporations and Competitiveness.491 p. Sales No. E.95.II.A.9.
World Investment Report 1994: Transnational Corporations, Employment and the Workplace. 482 p. Sales No.E.94.11.A.14.
Annex 45

World Investment Report 1993: Transnational Corporations and Integrated International Production. 290 p. Sales No. E.93.II.A.14.
World Investment Report 1992: Transnational Corporations as Engines of Growth. 356 p. Sales No. E.92.II.A.24.
World Investment Report 1991: The Triad in Foreign Direct Investment (New York, 1991). 108 p. Sales No. E.9 1.II.A. 12. $25.
HOW TO OBTAIN THE PUBLICATIONS
The sales publications may be purchased from distributors of United Nations publications throughout the world. They may also be obtained by writing to:
United Nations Publications or United Nations PublicationsSales and Marketing Section, Sales and Marketing Section, DC2-853 Rm. C. 113-1
New York, N.Y. 100 17 Palais des NationsU.S.A. CH-1211 Geneva 10Tel.: ++1 212 963 8302 or 1 800 253 9646 SwitzerlandFax: ++1 212 963 3489 Tel.: ++41 22 917 2612E-mail: [email protected] Fax: ++4122 917 0027
E-mail: [email protected]
INTERNET: www.un.org/Pubs/sales.htm
For further information on the work on foreign direct investment and transnational corporations, please address inquiries to:
Division on Investment and Enterprise United Nations Conference on Trade and Development
Palais des Nations, Room E-10052CH-1211 Geneva 10 Switzerland
Telephone: ++41 22 907 4533Fax: ++41 22 907 0498
INTERNET: www.unctad.org/en/subsites/dite
46 World Investment Report 2008: Transnational Corporations and the Intrastructure Challenge

QUESTIONNAIRE
World Investment Report 2009:
Transnational Corporations, Agricultural Production
and Development
Overview
In order to improve the quality and relevance of the work of the UNCTAD Division on Investment and Enterprise, it would be useful to receive the views of readers on this and other similar publications. It would therefore be greatly appreciated if you could complete the following questionnaire and return it to:
Readership SurveyUNCTAD, Division on Investment and Enterprise Palais des NationsRoom E-10054CH-1211 Geneva 10SwitzerlandOr by Fax to: (+41 22) 907.04.98
1. Name and professional address of respondent (optional):________________________________________________________________________________________________________________________________________
2. Which of the following best describes your area of work?
Government Public enterprisePrivate enterprise institution Academic or researchInternational organization MediaNot-for-profit organization Other (specify)
3. In which country do you work?
4. What is your assessment of the contents of this publication?Excellent AdequateGood Poor
5. How useful is this publication to your work?Very useful Of some use Irrelevant
This questionnaire
is also available to be
filled out on line at:
www.unctad.org/wir.
Annex 47
6. Please indicate the three things you liked best about this publication and how are they useful for your work:
________________________________________________________________________________________________________________________________________
7. Please indicate the three things you liked least about this publication:________________________________________________________________________________________________________________________________________
8. On the average, how useful are these publications to you in your work?
Very useful Of some use Irrelevant
9. Are you a regular recipient of Transnational Corporations (formerly The CTC Reporter), the Division’s tri-annual refereed journal?
Yes No
If not, please check here if you would like to receive a sample copy sent to the name and address you have given above. Other title you would like to receive instead (see list of publications):
_________________________________________________________________ _________________________________________________________________
10. How or where did you obtain this publication:
I bought it In a seminar/workshopI requested a courtesy copy Direct mailing Other
11. Would you like to receive information on UNCTAD’s work in the area of Investment and Enterprise Development through e-mail? If yes, please provide us with your e-mail address:
____________________________________________________________________
____________________________________________________________________
48 World Investment Report 2008: Transnational Corporations and the Intrastructure Challenge