joint programme document for - unctad | homeunctad.org/sections/un_ceb/docs/ceb_2015_03_rwand… ·...
TRANSCRIPT

Page 1
JOINT PROGRAMME DOCUMENT
FOR
SUPPORT TO THE DEVELOPMENT AND IMPLEMENTATION OF VALUE CHAINS
PROGRAMME IN RWANDA
GOVERNMENT OF RWANDA
AND
ONE UNITED NATIONS – RWANDA
2014-2018

Page 2
Country: Rwanda
Programme Title: Support to the Development and Implementation of Value Chains Joint Programme in
Rwanda
Joint Programme Outcome (UNDAP Result): Inclusive Economic Transformation
Outcome 1: Pro-poor growth and economic transformation enhanced for inclusive economic
development and poverty reduction
Outcome 2: Diversified economic base allows Rwandans to tap into and benefit from expanded
international, regional and local markets, and improved agriculture value-chains.
Project funds:
Programme Duration:
years
Anticipated start/end
dates: 2014 to 2018
Fund Management
Option(s): Parallel
Co-chairs: UNIDO - FAO
Total estimated budget*: $ 23,821,994
Out of which:
1. Core fund: $US 3,275,666
2. No core: $US 16,546,327
3. One UN funds: $US 4,000,000
4. GoR contribution (in kind): $US 0
* Total estimated budget includes both programme costs
and indirect support costs

Page 3
Names and signatures of participating UN organizations and (sub) national counterparts
UN organizations National Coordinating Authorities
Mr. Lamin Momodou Manneh
ONE UN – Rwanda
Signature:____________________
Date and Seal
Hon. Minister Claver Gatete
Ministry of Finance and Economic Planning
Signature :_______________________
Date and Seal
Mr. Attaher Maiga
FAO - Rwanda
Signature: ___________________
Date & Seal
Hon. Minister Geraldine Mukeshimana
Ministry of Agriculture and Animal Resources
Signature:_______________________
Date & Seal
Mr. Jean Bakole
Regional Director UNIDO
Signature: ___________________
Date & Seal
Hon. Minister François Kanimba
Ministry of Trade and Industry
Signature:_________________________
Date & Seal
Mr. Auke Lootsma
UNDP – Rwanda
Signature: ___________________
Date& Seal
Hon. Minister Valentine Sendanyoye Rugwabiza
Ministry of East African Community
Signature:_________________________
Date & Seal
Mr. Jean Pierre de Margerie
WFP – Rwanda
Signature: ___________________
Date& Seal
Hon. Minister Agnes Binagwaho
Ministry of Health
Signature:_________________________
Date & Seal
Mr. Martin Ovberedjo
WHO - Rwanda
Signature: ___________________
Date& Seal
Hon. Francis Gatare
CEO Rwanda Development Board
Signature:_________________________
Date & Seal
Mr. Petko Draganov
Deputy Director General of UNCTAD
Signature:___________________
Date& Seal
Mr. Antonio Pedro
UNECA
Signature: ___________________
Date& Seal
Ms. Diana Ofwona
UNWomen - Rwanda
Signature: ___________________
Date& Seal
…………..
Regional Director ILO
Signature: ____________________
Date& Seal
Ms. Arancha González.
Executive Director, ITC
Signature: ___________________
Date& Seal
Ms. Judith Karl……………….
Executive Secretary, UNCDF
Signature: ___________________
Date& Seal
Page 4
EXECUTIVE SUMMARY
Rwanda registered very positive development results during the past decade and a half. These gains were
particularly pronounced during the period (2008 – 2013) of the first Economic Development and Poverty
Reduction Strategy (EDPRS I), when the country accelerated implementation of its Vision 2020, which
aims at achieving middle-income status by 2020., while maintaining its strong commitment to attaining
the MDGs. The positive development results the country attained during this period are reflected in the
high levels of sustained and inclusive economic growth, expanded basic social services, significant
poverty reduction, gender empowerment and notable progress towards the MDGs.
In the period 2008-2013, GDP growth averaged 8.2% annually, which translated into an annual GDP per
capita growth of 5.4%, both of which were significantly higher than the averages for Sub-Saharan Africa.
Income per capita reached US$696 in 2013, the 2nd highest in East Africa. Although Rwanda sustained a
prudent macro-economic management regime, which kept inflation within the single-digit limit and the
exchange rate remained relatively stable, it actively utilized the fiscal space approach in its growth and
poverty reduction strategies. It also reinforced the broad macro-economic reforms by sustained
improvements in the business environment, which were reflected in a dramatically improved ranking in
the World Bank’s “Doing Business” Report, from 150th (2008) to 45th position (2012), making Rwanda
the 2nd most reforming economy in the world and stimulating a budding entrepreneurial revolution in the
country.
Increasing small holder productivity, particularly in the rural areas and expanding provision of inclusive
financial services constituted key components of the Government’s broad-based growth and poverty
reduction strategies in 2012-2013. The former included measures such as land consolidation, input
provision and better extension services as well as strengthening farmer cooperatives that resulted in
significant production of both staple food and export commodities notably tea and coffee. Initiatives
taken in the area of inclusive financial services resulted in 72% of the population having access to basic
financial services.
The UN Country Team in Rwanda contributed significantly to the achievements realized under its United
Nations Development Assistance Framework (UNDAF) that was closely aligned to the EDPRS I;

Page 5
Notwithstanding Rwanda’s rapid economic growth during the past five years, its productive base
remained narrow. The economic structure was dominated by agriculture (approximately 32% of GDP in
2013) and the services sector (approximately 47%). The industrial sector accounted for only 15% of GDP
formation. The competitiveness of the country’s industrial exports continued to be challenged by its
narrow domestic market and land-locked position, which renders transportation costs high.
Furthermore, despite gains in agricultural output, a 2012 study found that 21% of Rwandan households
were food insecure, with the highest prevalence (42%) in the Western province. Low-income
agriculturalists, farm workers and unskilled daily laborers are most prominently food insecure. For many
of the agriculturalists, who account for 85% of the population, access to productive land is a problem,
with some 60% of farming households cultivating plots smaller than half a hectare. Households in the
two poorest wealth quintiles account for 73% of food insecure households in the country. In addition,
owing to heavy reliance on rain-fed agriculture both for rural livelihoods and major exports, Rwanda
remains highly vulnerable to climate change.
From the foregoing, it was evident that by the end of the EDPRS I period, sustaining Rwanda’s strong
economic growth and poverty reduction performance would require acceleration of the transformation
process of the economy and significant enhancement of export penetration. The Government recognized
this and fully embraced economic transformation as one of the main strategic pillars of the second
Economic Development and Poverty Reduction Strategy (EDPRS II). Development of regional and
global value chains has in turn been identified as an important instrument for economic transformation,
inclusive growth and deeper poverty reduction, with development of the agro-industrial, manufacturing
and tourism sectors particularly targeted for this purpose.
Industrialization and development of agribusiness and agro-industries entails promoting effective value
chains as a means of promoting accelerated industrialization and targeted interventions to support
inclusive economic growth and poverty reduction. The development of such chains has a positive impact
on employment in both rural and urban areas, through direct and indirect multiplier effects. It also offers
market access to smallholders and creates business linkages to SMEs. In addition, it helps to build up
responsible and sustainable relationships among chain actors. EDPRS II, in its Pillar I, Economic
Transformation, emphasizes the diversification of the economic base through accelerating the economic
growth with value addition and improved agriculture, restructuring of the economy towards more

Page 6
services delivery and industry development to move towards middle income country status. The focus is
also put on diversification of services, targeting the reduction of post-harvest losses, marketing, input
distribution networks, advisory services, mechanization services, manufacturing, tourism, etc. In
addition, the enhanced role of the private sector and infrastructure development are also key targets.
These priority areas under EDPRS II are clearly to be addressed under a value chain development
approach.
For the agricultural sector, EDPRS II highlights the following challenges: low quality and quantity of
raw materials and inputs; limited rural infrastructure leading to high costs; lack of working capital and
long term credit; low human capacity; limited sector innovation and small existing base of agro-
processing.
To address these challenges, EDPRS II underscores the need for enterprise development, enhancement of
product quality and safety, quantitative measurement of value addition along the chain, promotion of
coordinated linkages among producers, processors and retailers, and improvement of the competitive
position of individual enterprises in the marketplace.
Furthermore, the development of effective and sustainable value chains in Rwanda is highly dependent
on a deeper level of regional integration, which appears as the only viable avenue for countering the
disadvantages of being a landlocked country. To this end, Rwanda already plays an extremely active role
as part of regional communities like the East African Community (EAC), the Common Market for East
and Southern Africa (COMESA) and the Economic Community of the Great Lakes Countries (CEPGL).
Deeper regional integration also provides a forum for Rwanda to address and advocate for the
implementation of priority trans-boundary projects such as the regional railway lines aimed to facilitate
regional and international trade.
As a way to enhance impacts and contributions of planned value chains towards socio-economic
transformation in Rwanda, inter-linkages between productive sectors such as agriculture (linkages
between small producers and buyers) and tourism need to be further acknowledged and strengthened. It is
well-known that most community based tourism enterprises in the rural areas provide handicrafts, food
and beverages for purchase by visitors and tourists, a significant source of local livelihoods.

Page 7
The One UN Country Team is committed to support the implementation of this priority area through this
Joint Programme under its new support framework: the United Nations Development Assistance Plan
(UNDAP) 2013-2018. The joint programme will contribute to a number of development objectives
including (1) increasing agriculture productivity and promoting agro-tourism development; (2)
supporting value addition capacities of enterprises in relation to post harvest technologies and processing
; (3) supporting agribusiness supplier development programmes; (4) improving employment
opportunities; (5) increasing product quality and safety standards and market compliance; and (6)
addressing cross-cutting issues such as gender, human rights, youth, and environment in order to foster
sustainable value chain development and (7) promoting the reduction of food losses along the value
chains.
The participating UN agencies will implement this jt joint programme through the following action entry
points: policy and regulatory analysis; strengthening supporting institutional frameworks; direct
assistance to farmers, enterprises and tourism operators; agriculture modernization and tourism
promotion; market access promotion and regional integration and private sector development initiatives.
These strategies will be implemented through joint programming (from planning, during implementation
and reporting with a closer collaboration with the Implementing Partners). Monitoring and Evaluation
will be conducted with the participation of all the stakeholders.

Page 8
Contents
EXECUTIVE SUMMARY ................................................................................................................................................. 4
List of figures ............................................................................................................................................................... 9
List of tables ................................................................................................................................................................. 9
1. SITUATION ANALYSIS ......................................................................................................................................... 10
1.1 Achievements under EDPRS 1 and remaining challenges of Transformation ................................................. 11
1.1.1 Agriculture and agribusiness .................................................................................................................... 11
1.1.2 Regional Integration, Trade and Tourism ................................................................................................. 11
1.1.3 Manufacturing and private sector development ....................................................................................... 12
1.2 Outstanding Challenges for EDPRS 2 ............................................................................................................. 18
1.3 UN INTERVENTIONS IN RWANDA’S ECONOMIC AGENDA ............................................................... 20
2. STRATEGY .......................................................................................................................................................... 22
2.1 Background ..................................................................................................................................................... 22
2.2. Lessons learned .............................................................................................................................................. 23
2.3 The proposed joint programme ....................................................................................................................... 25
2.3.1 Policy and regulatory review, analysis and designing strategic implementation plans ............................ 27
2.3.2 Agriculture modernization, agribusiness including agro-tourism, agro-industries and value chains
addition promotion ............................................................................................................................................ 27
2.3.4 Private sector development ....................................................................................................................... 28
3. SUSTAINABILITY OF RESULTS ...................................................................................................................... 29
4. RESULTS FRAMEWORK ................................................................................................................................... 30
5. MANAGEMENT AND COORDINATION ARRANGEMENTS ...................................................................................... 38
5.1 Program and activities planning ...................................................................................................................... 38
5.2 Parallel implementation ................................................................................................................................... 38
5.3 Joint reporting .................................................................................................................................................. 38
5.4 Lead UN agencies and Government chairmanship ......................................................................................... 38
6. FUND MANAGEMENT ARRANGEMENTS ................................................................................................. 40
7. MONITORING, EVALUATION AND REPORTING .................................................................................... 41

Page 9
List of figures
Figure 1: Result framework value chain development flagship ......................................................................................... 33
Figure 2: Joint Programme Monitoring Framework (JPMF) ............................................................................................. 42
List of tables
Table 1: Sector outputs and shares of the GDP under the EDPRS1 .................................................................................. 14
Table 2: Schematic approach to value chain development under this flagship .................................................................. 26

Page 10
1. SITUATION ANALYSIS
Rwanda has accomplished tremendous progress over the last decade and a half. The very positive
development results were especially pronounced during the implementation period of the country’s first
Economic Development and Poverty Reduction Strategy (EDPRS1). The country exceeded both its real
growth and poverty reduction targets by registering real economic growth of 8.2% on average, one of the
highest globally, and reducing poverty from about 56.7% of population in 2005/6 to 44.9% in 2010/11,
while extreme poverty was reduced from 35.8% to 24.1% (EICV III). Acute malnutrition rate also
declined from 5% in 2005 to 3% in 2010 but chronic malnutrition or stunting remains pervasive at 44%
nationally while households with chronic food insecurity declined from 34.6% of the population to
21.5% in 2012.
While significant achievements have been registered in the areas of growth and poverty reduction, thanks
to growth in agriculture and exports earnings including tourism, there is still a multitude of challenges
that need to be resolved in order for the country to sustain its robust economic and social performance
over the years through to the end of its Vision 2020 period as highlighted above.
To address these challenges, and in line with the country’s Vision 2020, the Government, formulated in a
very participatory manner a comprehensive transformational agenda in 2013, which is set out in the
EDPRS II (2013 – 2018). In the context of this strategy, the Government’s plan is to move the economy
over the next five years from that of an agrarian economy to a knowledge-based one, underpinned by an
annual economic growth of 11.5%. It also aims at a much transformed economy based on increased
industrial production and exports and expanded services and tourism sectors. Investments into all these
sectors are intended to be considerably increased and important skills gaps filled. Another important
element of this strategy is the leveraging of an increasing integration in the East African Community as
well as in the broader regional and global markets, in order to overcome serious constraints related to its
small market size and land-locked position.

Page 11
1.1.1 AGRI CUL T URE AND AGRI B US I NE S S
Agriculture and agribusiness remain the backbone of the Rwandan economy and continue to be a key
catalyst for growth and poverty reduction. Over the period of EDPRS1, the sector grew at 5.4 %,
sustained by higher than expected expansion of food production, attributed to scaled-up public
investments such as the crop-intensification programme (CIP). During the same period, the agriculture
sector contributed 32-34 percent of GDP and 27 percent of total growth.
In the recent past, there was significant expansion of interventions which drove productivity gains,
including successful land consolidation, increased areas under irrigation and protected land against soil
erosion. Access to important services including agricultural financing and proximity extension services
was improved, and farmers are now more likely to use specific crops according to agro-climatic zones.
There has also been an increase in the use of inputs, including agrochemicals and improved seeds.
Distribution of livestock through programs such as Girinka has expanded the animal resource sector.
Since the implementation of the CIP, yields have grown significantly. Post-harvest infrastructure
investments and subsidized transport has improved product quality and market accessibility. As a result
of these interventions, production of maize, wheat, roots and tubers, soybeans, rice and cassava as well as
meat, milk and horticulture products rose to the ambitious national levels predicted in EDPRS 1.
However, agriculture still remains on the threshold of subsistence due to the fact that a large number of
rural households’ farm plots are too small to support commercial production under present productive
systems and agro-processing remains underdeveloped. But, the overall goal under EDPRS 2 is to move
Rwandan agriculture from a largely subsistence to a modernized, nationally-integrated and knowledge-
intensive sector with more emphasis on diversification, agro-processing, productivity-enhancement, and
capacity development.
1.1.2 RE GI ONAL INT E GRAT I ON , TRADE A ND TOURI S M
With regards to trade and regional integration, one of the notable achievements that occurred during
EDPRS1 period was Rwanda’s entry into the EAC in 2007 and the commencement of the EAC Common
Market Protocol in July 2010, which legalized the free movement of people, goods and capital within the

Page 12
EAC. This has made the EAC one of the most integrated regional communities in the world. Since 2007,
large East African groups have invested heavily in Rwanda’s finance and manufacturing sectors.
Outside the EAC region, trade with the Democratic Republic of Congo (DRC) has increased rapidly.
Formal and informal cross-border trade has increased dramatically over the past five years. DRC has
been the fastest growing destination for Rwandan non-commodity products, in particular of Rwanda’s
manufacturing sector.
To ensure more quality standards, in addition, the Rwanda Standards Board is working together with the
Ministry of Agriculture and Animal resources to develop a one-stop-shop for export standards, including
sanitary and phytosanitary testing, and certificates of origin. However, further work is needed to provide
potential exporters with clearer information on the standards that they need to meet coupled with direct
support for meeting those standards.
Moreover, through a comprehensive and detailed analysis designed to identify alternate industries for
growth and diversified exports, the RDB identified three manufacturing clusters of silk textiles, fruits and
vegetable processing and dairy as priority sectors to be further developed.
According to the World Travel and Tourism Council (WTTC), Travel and Tourism (T&T) is a significant
sector in Rwanda’s economy, contributing 9.3% of total GDP, 8.1% of total employment and accounting
for 8.5% of total investments in 2013 (considering total contribution through direct, indirect and induced
channels). In the same year, visitor exports (i.e. foreign visitor spending or international tourism receipts)
accounted for 33.9% of total exports of goods and services. Business spending was noted to be higher
than leisure spending while foreign visitor spending was much greater than domestic spending. The
indirect effects of T&T spending are slightly higher than the direct ones and twice the magnitude of the
induced impacts. Supply chains are a significant component of the indirect effects. Besides other
linkages, supply chains need to be strengthened in order to enhance the contribution of tourism to Gross
Domestic Product.
1.1.3 MANUFACT U RI NG AND PRI V AT E S E CT OR DE V E L OPM E NT
The industrial sector grew at an average rate of 10.4% per year during EDPRS 1, driven by a rapid
expansion of construction, which grew at 15.0% annually. The industrial sector produced 14-16% of
national output. Large flows of investment for construction from the diaspora have been an important

Page 13
contributor. The rapid growth was achieved despite the sector - in particular construction - being hit hard
by the global downturn in 2009. Industrial growth contributed to 20% of total growth during EDPRS 1.
The highest growth rate was experienced in the industrial sector during EDPRS 1, but services made up a
large part of GDP, and remained the main contributor to growth. Despite high rates of growth, structural
transformation of the economy was limited during the EDPRS 1 period. Of particular concern is the
extent to which a strong manufacturing sector has failed to emerge. Indeed, measured as a percentage of
GDP, the share of manufacturing has decreased from 7.0 percent in 2000 to just 4.8 percent in 2013.
Moreover, foreign direct investment (FDI) has failed to respond to the pro-business reforms instituted by
the government to the scale that was hoped for - despite substantial increases over the last decade.
Prudent and stable macro-economic and market-oriented policies have certainly sustained business
confidence. Regulatory frameworks have been improved and enforced, thereby facilitating business
activity, providing transparency in government-private sector interactions. A strong anti-corruption
stance has simplified and reduced the cost of business transactions. And high levels of consumption and
public investment fuelled economic activity.
In the recent World Bank’s Doing Business Report, Rwanda progressed steadily in the ease of doing
business rankings worldwide. This performance makes Rwanda the 2nd most reformed economy in the
world over the last five years, and the 3rd easiest for doing business in Africa, as well as being the 1st in
the East African Community (EAC).
Underpinning the strong growth performance, investment (as reflected in Gross Fixed Capital Formation)
has increased from 13.4 percent of GDP in 2000 to 24.4 percent in 2012. However, this is still short of
the 25 percent of GDP which the Spence Commission (2008) considered to be required to achieve
sustained economic convergence with high income economies. Under the EDPRS 2, the government
expects investment as a percentage of GDP to increase to 29.7 percent in 2017. Outside of the
construction sector, however, private sector investment has been fairly weak. Indeed, over the last decade
public investment has dominated gross capital formation – accounting for 50-65 percent of capital
formation.
Growth over the medium term is expected to be driven by a scaling up of public investment and measures
taken to encourage private investment, through public support of several strategic investment projects,

Page 14
such as the Bugesera International Airport, the regional railway project, the bulk petroleum storage
facility, and an oil pipeline. In this way, the government is aiming to 'crowd-in' greater private sector
investment.
Table 1: Sector outputs and shares of the GDP under the EDPRS1
The overall goal of the EDPRS 2 (derived from the vision 2020 long term goal of creating a productive
middle class and fostering entrepreneurship) is to accelerate progress to middle income status and better
life for all Rwandans through sustained growth of 11% and accelerated reduction of poverty to less than
30% of the population.
The EDPRS 2 states that Rwanda is at a point in its economic development where Economic
Transformation is not anymore a remote possibility; it is an inevitable and desirable process that has
already been set in motion. It is a process that encompasses all the sectors of the economy, and that is
impossible to achieve without sustained rural development, improvements in skills and labor
productivity, and accountable governance.

Page 15
The EDPRS 2 document also suggests that the economic transformation objective will be achieved
through improved infrastructure, exports, and more integrated supply-chains, while accelerating demand
in the energy sector, planting the seeds of a green economy, and better managing the process of
urbanization.
For a large part of the world’s growing population, the increasing integration of the global economy has
provided the opportunity to achieve significant prosperity gains. And for developing countries, the
globalization of manufacturing has opened up new prospects of upgrading their industrial and service
sectors. It also holds the promise of higher incomes, increasingly differentiated final products and a
greater availability of quality goods. Most notably, free trade agreements and other accords have created
new export opportunities – mainly for food products – as the demand for variety continues to grow in
developed countries.
These market changes have encouraged governments and investors, including farmers, to expand agro-
industrial activities and linkages to export markets as a means of increasing local food production,
employment, business development and international trade. This has led to competition among producers
to meet export market demands in terms of cost, quality and delivery times. At the same time, policies,
regulations, support services, tax and trade instruments and their associated actors and institutions have
also developed to become intrinsic parts of the so-called “value chains.”
It is in this context that value chain development is considered in EDPRS 2 as a very useful tool for
private sector promotion, as it makes it easy to analyze barriers to and opportunities for social and
economic development in very diverse settings, and to assist conceptualizing and implementation
effective. Promoting value chain development is also increasingly being recognized as a promising
approach to address not only economic development, job creation and inclusive growth, but also a wider
range of social and environmental development issues.
From a processing/transformation point of view, value chain development involves the entire range of
activities undertaken to bring a product from the initial input-supply stage, through various phases of
processing, to its final market destination, and it includes its disposal after use. However, many value
chain development programmes in the developing countries only focus on primary production tasks and
market/trade related issues while neglecting other tasks with higher value addition. Aspects often

Page 16
neglected in these programmes include the governance of the chain, sustainable production and energy
use, access to finance and the business environment and policy context.
One of the key priorities of EDPRS 2 is to increase the external connectivity of Rwanda’s economy and
to boost export as a powerful tool to spur economic growth, raise living standards and reduce poverty.
Key interventions in that area include investing in soft and hard sector-specific infrastructure to
accelerate growth in the commodity and tourism sectors, and to facilitate the increasing export orientation
of firms in Rwanda’s manufacturing and agro-processing sectors and this can be achieved under a value
chain approach.
With regards to agriculture development and agribusiness, they will require a progressive shift in the
roles of the public and private sectors. The latter needs to take greater responsibility for value chain
improvements including investment, management of facilities, quality and safety control, along with
farmer advisory services and input marketing. At the same time, the public sector needs to play a strong
monitoring and regulatory role and act as a facilitator for partnerships and key actions that include the
promotion of coordinated linkages among producers, processors and retailers.
Agro-value chains encompass activities that take place at various levels (farm, rural and urban), starting
with input supply and continuing through product handling, processing, distribution and recycling. As
products move successively through the various stages, transactions take place between multiple chain
actors, money and information are exchanged and value is progressively added.
Value chain development is closely linked to Rwanda’s Trade Policy mission: “Growing sustainable and
diversified products and services meant for local, regional and international trade, with the aim of
creating jobs, increasing incomes, and raising the living standards of Rwandans.” This is articulated in
the National Export Strategy that provides key guiding principles including: Increasing export revenues
through quantity and value addition, as well as export diversification; improving the understanding and
compliance of international standards and requirements; improving and leveraging human capital,
innovation, and technology investments; and supporting broader areas of social development such as
gender equality, youth development, environmental sustainability, and inclusion of vulnerable groups.
For Rwanda, deeper regional integration is the only viable option to counter the disadvantages of being a
landlocked country. To this end, Rwanda already plays an extremely active part of regional communities

Page 17
like the East African Community (EAC), Common Market for East and Southern Africa (COMESA) and
the Countries of the Great Lakes (CEPGL). Rwanda's diversified non-traditional exports are already
dominated by exports to neighboring countries (particularly DRC and Burundi). A host of new markets
and opportunities could be opened up if Rwanda invests in the right infrastructure for increased
connectivity. Deeper regional integration also provides a forum for Rwanda to address and advocate for
the implementation of priority projects like the regional railway that will facilitate regional and
international trade.
In this context, The EDPRS 2 target will be to exploit the increased access to trade, finance, legislation,
health regulation, agricultural standards, environmental safeguards and education qualifications. Typical
avenues in the value chain development approach include the fields of trade capacity building (helping
countries to respond to market quality standards requirements and regulations); and investment and
technology promotion (which entails the creation of a Network with established Investment and
Technology Promotion Offices that can assist companies at different stages in the value chain to develop
investment proposals on value chain upgrading).
In addition, Subcontracting and Partnership Exchange Centers (SPXs) offer services in the area of
supplier-buyer match-making and fostering the creation of linkages with manufacturing companies that
are situated further downstream in the value-chain. The SPX company benchmarking tool helps also
companies in the value chain to gauge their competitiveness vis-à-vis global best practice and provides
the basis for focused and prioritized interventions.
With regards to industrial policy, it is crucial to capture the importance of sectoral prioritization and
value within the chain. The value chain analysis helps to identify bottlenecks and opportunities to
pinpoint sector-specific recommendations to policy-makers. It places particular emphasis on the
marketability of products as a demand stimulus as well as the impact on sustainability (greening the value
chain) and on poverty (pro-poor value chains).
EDPRS 2 also emphasizes the importance of promoting a supplier development program in the
hospitality and tourism sectors through RDB. The purpose is to work with large domestic and foreign
owned companies to identify opportunities that address existing supply constraints through a combination
of company support and FDI promotion that would enhance the ability to compete in the EAC and the
wider global market. With respect to the Tourism Policy, its main objective is to increase tourism

Page 18
revenues in a sustainable manner and generate profits for reinvestment and jobs. This is to be achieved
through the following means: product development and diversification; access to finance and investment
and capacity building and skills development.
Specifically, EDPRS 2 highlights various challenges facing agriculture and agribusiness value chains as
follows:
Climate change and high dependency on rain fed agriculture
Land scarcity, soil erosion and land degradation
Small farmers dominate production with low productivity High population density leading to land
scarcity and degradation
High level of post-harvest losses
Low levels of value addition
Limited rural infrastructure with high costs and limited access to markets
Low quality, quantity, and high costs of raw materials and inputs
Limited access to agricultural services and control of resources by women
Lack of working capital and long term credit
Limited sector innovation and use of new technologies
Limited private sector investment due to perceived high risks in agriculture
Other specific challenges that confront Rwanda’s agriculture and agribusiness development include, but
are not limited to:
Existing agricultural markets that are unable to address adequately (prices, post-harvest management
issues) increased productivity resulting from intensification;
High cost of inputs including electricity and rural wage rates;
High international transport cost associated with long distances to and from the sea ports;
And coordination issues at different levels of the commodity value chains
In the tourism sector the following challenges may be noted specifically in agro-tourism:
Lack or limited knowledge about the agro-tourism;
Weak communication skills and lack of commercial approach of the small farmers,
Lack of capital to develop basic infrastructure for the agro-tourism;
Limited knowledge of the farmers regarding such type of activities;

Page 19
Poor organization as regards the agri-tourism industry including ensuring hygiene and other basic
requirements considering urban visitors;
On the trade side, specific challenges to trade growth are the following:
The absence of an effective market information system;
Rwanda is substantially dependent on its neighbors for land transportation of goods from Mombasa
and Dar es Salaam which is still impacted by the persistence of Non-Tariff Barriers;
Gender-based violence and sexual harassment faced by women in informal cross border trade
contrary to the International Convention on the Elimination of Discrimination Against Women;
The limited competitiveness of local products and enterprises;
The low value addition to local products;
The availability and diversity of exports: export growth constrained by limited /lack of production
and availability of services to export;
The majority of firms export to regional markets but fail to diversify beyond the region;
The size of firms matters: need for large-scale exporters so as to be able to compete and survive in
exports markets;
Availability and affordability of finance, with difficult access to credit for the private sector and high
interest rate spreads;
The stimulation of export growth above and beyond the rate of expansion of imports;
The vulnerability to terms of trade shocks;
Rwanda’s internal trade and the competitiveness of its exports are constrained by an insufficient
logistics system that has not grown in parallel with the increasing demand for trade;
Despite bold investments to support the national carrier RwandAir, air transport is still constrained by
costly and limited air connectivity.
With regard to manufacturing and private sector development a number of challenges arises, especially
the following:
The private sector growth and competitiveness is constrained by low skills and labour productivity in
all sectors of the economy
The number of formal sector firms reporting inadequate skills as a major constraint has doubled since
2006, indicating that this is a growing problem.

Page 20
The 2009 National Skills Audit (MIFOTRA 2009) reported an average 61.5% skills deficit and severe
skills gaps in the private sector in Rwanda.
The Rwanda’s private sector remains small and nascent, dominated by micro and small enterprises
(99.5% of firms) which provide low returns to investment, and do not generate many jobs and
struggle to grow.
The activities of the private sector are highly undiversified and over 90% of Rwanda’s exports are
concentrated on a few traditional commodity products (tea, coffee, mining).
Private firms and the process of structural transformation are constrained by key infrastructure gaps.
The most significant infrastructure constraint to all sizes of firms relates to electricity, which is costly
by comparison to the region (at $0.24/kwh compared to Kenya’s $0.15/kw/h, Uganda’s $0.17/kwh,
and Tanzania’s $0.05/kwh) and insufficient in quantity.
The country’s low export diversification is reflective of the small size of Rwanda’s manufacturing and
agro-processing sectors. Although EDPRS 2 emphasizes gender equality as a key driver of economic
transformation, in the agricultural sector for instance, important steps need to be taken in programs to
promote gender equality, such as recruiting more female extension agents, taking gender preferences and
requirements into account in agricultural research programs, building women skills and knowledge and
increasing their access to financial instruments and marketing.
Under the Delivering as One framework, United Nations Development Assistance Plan (UNDAP) has
been elaborated as the business plan of all the UN agencies for funding the pertinent programmes in
Rwanda for the period July 2013 to June 2018. UNDAP Rwanda supports the realization of the
Millennium Declaration, the related Millennium Development Goals (MDGs) and the other international
development aspirations, the transition from the MDGs and the post-2015 framework, the country’s
medium-term national development priorities as set out in the Economic Development and Poverty
Reduction Strategy (EDPRS 2) for the period 2013-2018, as well as the Rwanda Vision 2020. It is also
intended to support the promotion in the country of all the international human rights that have been
ratified by Rwanda, including the right to humanitarian assistance for refugees.
In line with the UN Quadrennial Comprehensive Policy Review (2012), the UNDAP is strategic and
results-oriented and it clearly reflects the UN’s increased focus on delivering upstream support in the

Page 21
national planning and implementation processes, capacity development, high quality policy advice and
technical expertise based on best practices while aligning itself to national systems.
In relation to this Joint Program, UNDAP lines of actions cover the following strategic interventions:
1. Supporting industrial and trade competitiveness;
2. Promote regional integration implementation and coordination;
3. Address challenges facing tourism sector;
4. Strengthen institutional regulatory framework;
5. Promote technical know-ho of private sector operators including cooperatives, organization,
forum and women farmers; and
6. Improve industrial productivity, among others
Page 22
2. STRATEGY
Agriculture is the mainstay of the economy particularly in the rural areas where incomes and employment
are mainly dependent on the sector. The sector may be strengthened by increasing agricultural market
demand, identifying needs of buyers, mapping supply chains, enhancing agricultural supplies to tourism
markets, matching supply and demand, and developing business plans, among others. Agro-tourism
activities may cover farm-stays and tea/coffee/flower estate tourism. Most community based tourism
enterprises in the rural areas provide handicrafts, food and beverages for purchase by visitors.
The economic transformation theme is based on the belief that the broader EAC region will be one of the
fastest growing regions of the world over the next decade. Therefore, EDPRS 2 prioritizes deeper
regional integration within the EAC community and will focus investments on increasing connectivity to
Rwanda’s economic neighborhood including DRC and Burundi. On the international stage, a strategic
decision under EDPRS 2 is to deepen investment and export promotion ties with the broader East and
Southern Asia region, while continuing to invest in growing ties with existing financial hubs.
The linkage of the tourism sector with the rest of the economy needs to be strengthened so as to enhance
the value chains. The ratio of non-direct to direct contribution of the tourism sector to the economy is
1.53 which is much lower than the global 2.25. Linkages between tourism sub-sectors can be
strengthened by linking suppliers to tourism enterprises, developing partnerships between wholesalers
and local tourism operators, promoting agro-tourism and other related activities, and disseminating
information on tourism investment opportunities.
Rwanda’s current Sustainable Tourism Master Plan (STMP) recommends the formation of business
linkages across the supply chains, especially for agricultural produce and handicrafts from the rural
sector, in order to spread the benefits of tourism more widely. However, the cost of finance is perceived,
by the private sector, as being too high to enable the development of the sector. This assessment
coincides with conclusions of the Strategic Action Plan for the development of the East Africa
Tourism Platform which identifies access to finance as a challenge to further development of the
sector.

Page 23
Rwanda participates in the East African Tourism and Wildlife Conservation Agency (EATWCA)
and the East Africa Tourism Platform (EATP) where the private sector is brought together at the
regional level. In order to maximizing on the existing regional frameworks, a more systematic
approach of identifying comparative advantages at this level is necessary.
Manufacturing sector in Rwanda is beyond looking at sectors in isolation to scrutinize interactions and
synergies with other actors and the business as well as policy environment. In addition, these strategic
actors bring together the various levels and components of potentially upgrading chain interventions
while completing the value chain development. This makes the value chain approach a complex
challenge within the realm of private sector development and beyond but it is a powerful instrument that
makes the markets more inclusive by bringing benefits to all actors including small scale growers, and
small SMEs.
In supporting the above key Government priorities, the UN agencies will explore and enhance the
effectiveness of its work on value chain development. Improved knowledge management within each
participating UN Agency will go hand in hand with interagency cooperation. And combining core UN
competencies will allow “One-UN” and other UN joint programmes to offer attractive service packages
for Value Chain related interventions, capitalizing on the comparative advantage of each involved
Agency.
UN past experience and interventions in agriculture has contributed to the improvement of livelihood of
the poor people especially when the intervention aim at linking the small holder farmers to markets. This
intervention has made a significant contribution when coupled with technical support in post-harvest
handling technologies. These two main interventions allow for maximization of the commercial value of
the farmers’ harvests through reduction of losses translating into higher income.
It has been observed that the value chain approach uses a full analysis of the system’s structural and
dynamic features helping to identify leverage points for catalyzing transformation. Value chain analysis
also enables an understanding of the system as a whole while identifying gaps at multi-leveled and
dynamic nature of value chain interventions. This Joint Program intends to use value chain analysis
approach for designing appropriate interventions for holistic development goals.

Page 24
Creating linkages and enabling accessibility of SMEs to affordable and appropriate technologies has been
found to be more impactful to the learning and development of such business entities. When SMEs are
enabled to adapt new comparatively low cost technology in their business, it helps them not only to
improve their productivity but also to engage in value addition.
Standardization has been very important component for international trade and exports require meeting
voluntary and mandatory standards. Consumer standards, though voluntary applicable, they have been a
hindrance to exports development. At the same time, SMEs need to comply to these standards in order to
enter these markets. It has been found that technical assistance in standards implementation by SMEs
helps them to comply with such voluntary and mandatory standards, enabling exports cross to the
markets and hence making products more competitive.
Regional integration within East Africa is an important piece of the market puzzle for Rwanda’s
agricultural produce and agro-industrial products. The UN will be positioned to assist not just with access
to national markets, but also with access to sub-regional markets.
With regards to tourism, there is need to diversify the existing tourism products by incorporating new
attractions and augmenting the existing ones. This will ensure the development of high-value products
that yield a diverse and distinct visitor experience. Diversification is necessary for various reasons: (i) over
reliance on gorilla tourism is creating environmental conservation concerns; (ii) length of stay for
international visitors is brief, generally four to eight days for most visitors; and (iii) there is relatively
low share of visitors travelling for leisure as compared to business.
Besides, more investment is needed in the training of human capital for the development of high quality
tourism and hospitality management skills. Research indicates that visitors perceive service to be of low
quality, excessively overcharged and of low value for money.
The recognition of the need to guarantee equal opportunities and benefits to men, women, girls and boys
is capital for a country’s equitable development. A rights-based approach will hence be applied to the
value chain development programme with particular focus on the elimination of discrimination against
women and girls whose number is still limited in the sector. The Joint Program will address the gendered
nature of value chain production, especially in agro-production and manufacturing industries, which

Page 25
imposes differential outcomes not only on productivity of men and women but also on returns to
production due to valuation bias on productive and reproductive work outputs
Value chain development does work in isolation; the complexity of interventions nevertheless requires
expertise in various areas and the Joint Programme is seen as a multi-disciplinary response to the support
the Government of Rwanda in shaping the future. The presence of a well-designed division of labor
among UN agencies is therefore likely to further increase efficiency of interventions. Agencies have
specific strengths and combining and coordinating these strengths will prove helpful in dealing with the
diverse actors and the specific challenges faced in the sectors. In a sense such a division of labor among
agencies is similar to the division of labor in a value chain: Agencies are to a certain extent specialized
and they have specific strengths, thus they can offer specific support services in specific contexts to
different actors in the value chain.
The holistic approach to value chain development fits well into the GoR support division of labor. Each
agency will bring its specific expertise based on its comparative advantage that fits better along the value
chain.
Based on the situation analysis, the UN pursues to contribute to a number of development objectives that
includes:
To increase agriculture productivity and agro-tourism development;
To strengthen value addition capacities of enterprises in post-harvest technologies and processing;
To improve employment opportunities;
To increase product quality and safety standards and market compliance;
To support the release of other Non-Trade Barriers;
To address cross-cutting issues such as gender, human rights, youth, and environment in order to
foster sustainable value chain development;
To increase capacities in Industrial diagnosis and Trade competitiveness;
Provide policy advice and share knowledge in Value Chain Development.

Page 26
The basic steps for those interventions include: support to selecting and prioritizing the value-chain
sectors for priority product or commodity; analyzing the selected value chains; formulating an upgrading
strategy for the selected value chain; and support the implementing the value chain upgrading strategy;
and monitoring and evaluation.
Table 2: Schematic approach to value chain development under this flagship
This figure illustrates a value chain development model with a wide perspective in the sectors of
agriculture transformation, postharvest and value addition, and industry and trade. The approach suggests
(1) beginning from tackling the challenges related to limited skills in farmer organizations and
cooperatives; (2) ensuring that strategies for food reserves are in place and (3) promoting innovative
Gender and human rights as cross cutting issues.

Page 27
sustainable agriculture. Further interventions cover the support to postharvest and value addition
technologies by participating business practitioners for selected priority commodities. National
institutions involved in trade are supported in terms of strategic planning, coordination and skills
development. Market access for the selected priority commodities is promoted through strategies that link
Rwanda’s commodities with export markets.
The strategic support to the Value Chain Development Joint programme by the UN in Rwanda involves
tackling a number of areas discussed in the following sections of this document.
2.3.1 POL I CY A ND R E GUL AT ORY RE V I E W , ANAL YS I S AND DE S I GNI NG S T RAT E GI C
I M PL E M E NT AT I ON PL ANS
The GoR has developed a number of policies and strategies including: a trade policy; an SMEs policy; a
cross border strategy; a Transformation of Rwanda agriculture strategy; an industrial policy; an export
strategy and many others. The key UN intervention in this perspective is to examine the linkages of these
policies and strategies and their contributions to the private sector development and how they impact on
business growth over a period of time. Emphasis will be put on research, surveys, analyses and diagnoses
so as to inform policy reviews and formulation.
2.3.2 AGRI CUL T URE M ODE RNI ZA T I O N , A GRI B US I NE S S I NCL UDI NG AGR O -T OURI S M ,
AGR O- I NDUS T RI E S A ND V AL UE CHAI NS ADDI T I ON PROM OT I O N
The UN interventions will focus on the support to national Institutions, Local Government authorities and
farmers’ cooperatives, professional organizations to induce a change from substance farming to modern
agriculture coupled with the promotion of value addition. Supporting the development of a more
productive agriculture will be done through the support to innovative approaches for sustainable
production of priority crops, the promotion of best practices and technology transfer in agriculture,
livestock and fisheries, support to agro-processing and agribusiness solutions, capacity building in
processing methods and support to market information linkages and access, especially for Women and
Youth. The UN interventions will also aim to strengthen linkages between the agriculture and tourism
sectors through customized and up-to-date tourism policy development, as well as targeted operations
aimed to enhance agro-tourism and livelihoods of farmers. Market access, analysis and regional
integration will be another area of support.

Page 28
Access to regional and international markets is crucial for Rwandan firms to develop their exports, and
for the country to reach the set targets for the overall trade balance through export growth and export
diversification. Noting that Rwanda has an opportunity in emerging international and regional markets
alongside domestic markets, the export promotion strategy has to strengthen the capacities of the private
sector to benefit these potential markets. This can be through information provision, and linking firms to
high-end services, including for reaching international standards. The UN interventions in this context
will cover the support to the removal of NTBs, capacities related to getting standards and certification to
international requirements, analysis of market demands and dissemination of information and
strengthening of coordination mechanisms within trade service providers.
2.3.4 PRI V AT E S E CTOR DE V E L O PM E NT
The leading role of the private sector is increasingly being recognized in the national development
framework and value chains development in particular. Not only is the private sector expected to commit
huge investments in the agriculture sector, but it is also better placed to assess markets and instil a
business attitude in value chain development actors. Rwanda Development Board will play a key role in
putting in place a conducive environment and needed infrastructures to promote Public Private
Partnerships (PPPs), as they particularly have a significant potential to achieve accelerated delivery of
strategic national infrastructures required to maximizing the interaction and co-operation between public
and private sectors and achieve steady economic growth.
Page 29
3. SUSTAINABILITY OF RESULTS
The value chain development will allow for realization of the intended objectives through enabling
economic, social and environmental sustainability. Value chain development provides clear guidance for
policy implementation through shaping interventions on the micro- and meso levels.
The distinguishing feature for value chain development is its specific component of technical expertise
and capacity to support value chain actors and service providers in the efforts to sustainably increase
productivity and value addition, strengthen producer-agribusiness linkages, and improve efficiency in
businesses. The UN agencies will provide specialized technical support for value chain development in
crop, livestock, and forestry and fishery sub-sectors, along with advisory support to national players on
enabling policies, institutional strengthening, and essential services including in the agro-tourism sub-
sector. An important priority for this Joint Program is to ensure that smaller and medium scale farmers,
processors and agribusiness SMEs are able to compete in rapidly demanding markets.
Sustainability will also be attained through adopting multi-stakeholder approaches to improve structural
conditions under which producers can access affordable global standards and certification systems, which
improves their profitability and business continuity. Organizing multi-stakeholders at country and
regional levels will facilitate dialogue, lessons learning, strategy development and action planning related
to specific value chains or aspects of value chain development, therefore ensuring institutional capacity
and sustainability.

Page 30
4. RESULTS FRAMEWORK
The result framework covers two main outcomes:
Outcome 1: Pro-poor growth and economic transformation enhanced for inclusive development and
poverty reduction
The outputs and indicative key actions covered under each respective outcome are the followings:
Strengthened Leadership and Capacities of National Institutions to Strategically Plan And Harness
Opportunities For Structural Economic Transformation
Provide support towards the creation of the required performing institutional framework focusing
on cooperatives, fora, platforms that will assist the development of an internationally competitive
SME sector
Provide support for strengthening Special Economic Zones and Industrial Parks
Provide support the development of Growth Anchor Initiative (anchor firms investing in SMEs
development), domestic market recapturing and manufacturing growth programs
Strengthen the Government capacity to coordinate implementation and dissemination of regional
trade agreements at national level.
Strengthen the national systems and frameworks for regional integration to involve all
stakeholders
Support development of knowledge products for policy analysis on regional integration
Support the implementation of the tourism policy, master plan and strategy formulation, including
monitoring and evaluation frameworks
Strengthened National Capacities for Industrial and Trade Competitiveness
Support industrial diagnosis, trade and SMEs competitiveness analysis and benchmarking for the
access to global sub-contracting and supply-chain and networks
Provide support to the strengthening of Industrial Information System (industrial observatory)
TA for policy and strategy development in the agri-food industry, tourism and other services
sectors incl. ICT
Support the set-up of trade information centres, including industry, and service related trade
observatory and investment monitoring platforms

Page 31
Support policy dialogue platform for public-private partnerships through Knowledge and
Capacity Development
TA to generate business transactions between Rwanda and selected markets by facilitating
investment and transfer of knowledge, expertise and technology
TA to enhance enterprise competitiveness through productivity, quality, business management
and packaging improvement and the use of ICT solutions that enhance business performance
Support value addition transactions that generate superior value retention through appropriate
certification, marketing, branding and labeling schemes
Support advise and facilitate SME market linkages for selected products, including client
identification and commercial approaches
TA to support business linkage options and facilitate business transactions, making extensive use
of e-commerce
Outcome 2: A diversified economic base allows Rwandans to tap into and benefit from expanded
international, regional and local markets, and improve agriculture value-chains (Diversified economic
base).Outputs and indicative key actions covered under each respective outcome include;
Equitable development and innovation in agriculture, post-harvest and value addition technologies,
best practices and marketing promoted and strengthened
TA and FA to strengthen Government capacity to enable farmer organizations and smallholder
farmers to produce quality commercial supplies and access to both local and international markets
benefiting male and female farmers.
Support to national institutions and cooperatives for the management of Strategic Food Reserve(s)
and to promote innovative agri-business solutions.
Capacity building for key national institutions and cooperatives to promote best practices and
technology transfer in agriculture, livestock, fisheries, and manufacturing sectors.
Support farmer cooperatives to expand the application of innovative approaches for sustainable
production of priority crops.

Page 32
Provide support for the upgrading small-scale food and cash crop agro-processing units in rural
areas incl. CPCs
National regulatory frameworks for quality standards and food safety strengthened and
implemented in accordance with regional and international guidelines
Support to strengthen national systems for quality and food safety inspections, food safety risk
analysis, animal epidemio-surveillance, institutional coordination, and establish information
exchange network system
TA to support accreditation processes for testing and metrology towards international recognition
Support for SMEs under priority sectors for acquiring certification.
TA to strengthen national capacities to participate in international standardization processes.
Further details of the activities are well elaborated under the enclosed results framework table.

Page 33
Figure 1: Result framework value chain development flagship
JP Outputs
(Give corresponding indicators and
baselines and targets)
Participating
UN
organization
Implementing
Partner
Indicative activities for each Output
Resource allocation and indicative time frame*
Y1 Y2 Y3 Y4 Total
UNDAP Outcome 1: Pro-poor growth and economic transformation enhanced for inclusive economic development and poverty reduction
Indicators:
1) % population below the poverty line
2) % exports to GDP(value of exports goods and services
3) Aid on budget
Baselines:
1) 44.9% Rwandans living below poverty line
2) 14.6%
3) 45% aid on budget
Targets:
1)<30%Rwandans living
below poverty line
2) 27.2%
3) 25% aid on budget
Output 1.1 Strengthened
Leadership And
Capacities Of
National
Institutions To
Strategically
Plan And
Harness
Opportunities
For Structural
Economic
Transformation
Indicators:
1) No. of
key sector
strategies
reflecting
structural
economic
transformat
ion
2) %
population
aware
Baselines:
1) 1 Sector
strategy reflecting
structural
economic
transformation
2) 20%
Targets 1) 4 sector
strategies
reflecting
structural
economic
transformation
2) 40%
ITC
UNECA
UNW
UNCTAD
UNIDO
WFP
UNDP
MINALOC
MINEAC
MINICOM PSF
NAEB
RDB RSB
Provide support towards the creation of the required
performing institutional framework focusing on
cooperatives, fora, platforms that will assist the
development of an internationally competitive SME
sector
40,029 70,301 64,976 79,299 254,605
Provide support for strengthening Special Economic
Zones and Industrial Parks
200,000 200,000 100,000 100,000 600,000
Provide support the development of Growth Anchor
Initiative (anchor firms investing in SMEs
development), domestic market recapturing and
manufacturing growth programs
155,581 108,381 55,581 55,581 275,124
Strengthen the Government capacity to coordinate
implementation and dissemination of regional trade
agreements at national level.
99,481 94,181 52,181 20,381 182,224
Strengthen the national systems and frameworks for
regional integration to involve all stakeholders
120,381 52,181 52,181 20,381 145,124
Support development of knowledge products for policy
analysis on regional integration
52,181 47,411 47,411 50,381 197,384

Page 34
Support the implementation of the tourism policy,
master plan and strategy formulation, including
monitoring and evaluation frameworks
125,563 125,563 43,623 40,116 334,864
Output 1.2 Strengthened
National
Capacities For
Industrial And
Trade
Competitiveness
Indicators:
1) No of
value chain
studies for
priority
commoditie
s conducted
2) % of
SMEs
using the
Investment
Monitoring
Platform
(IMP)
Baseline:
1) 3 value chain
studies conducted
2)20 % SMEs use
the IMP
Targets
1)3 value chain
studies conducted
annually
2) 60% SMEs use
IMP
UNIDO UNCTAD
UNECA
ITC ILO
UNDP
MINICOM RDB
PSF
Support industrial diagnosis, trade and SMEs
competitiveness analysis and benchmarking for the
access to global sub-contracting and supply-chain and
networks
252,944 140,080 211,120 169,520 673,664
Provide support to the strengthening of Industrial
Information System (industrial observatory)
50,000 50,000 50,000 50,000 200,000
TA for policy and strategy development in the agri-
food industry, tourism and other services sectors incl.
ICT
59,549 47,517 65,437 75,722 248,225
Support the set-up of trade information centres,
including industry, and service related trade
observatory and investment monitoring platforms
58,240 58,240 111,040 58,240 285,761
Support policy dialogue platform for public-private
partnerships through Knowledge and Capacity
Development
160,374 153,411 165,334 245,078 724,198
TA to generate business transactions between Rwanda
and selected markets by facilitating investment and
transfer of knowledge, expertise and technology
997,419 997,419 997,415 997,419 3,989,672
TA to enhance enterprise competitiveness through
productivity, quality, business management and
packaging improvement and the use of ICT solutions
that enhance business performance
235,803 221,863 136,462 123,271 517,400
Support value addition transactions that generate
superior value retention through appropriate
certification, marketing, branding and labeling schemes
160,144 166,973 67,485 64,669 259,271
Support advise and facilitate SME market linkages for
selected products, including client identification and
commercial approaches
58,781 68,381 49,181 58,781 235,124
TA to support business linkage options and facilitate
business transactions, making extensive use of e-
commerce
95,261 103,773 106,077 99,229 404,340
Page 35
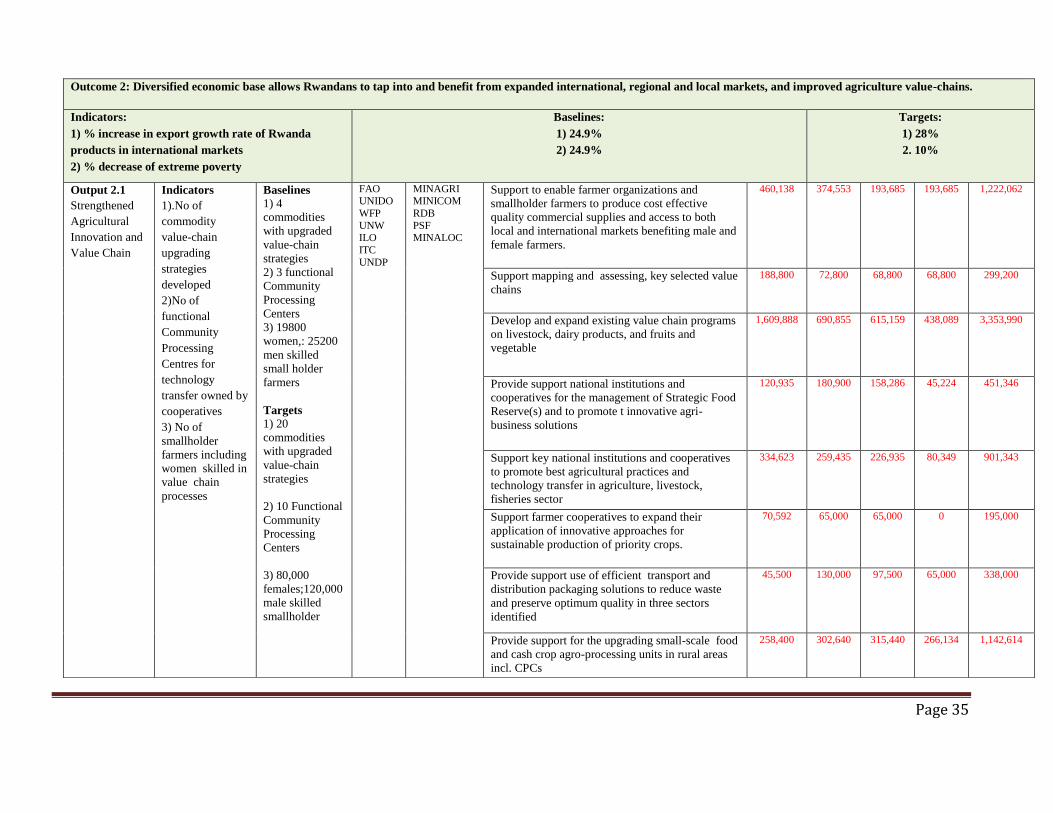
Outcome 2: Diversified economic base allows Rwandans to tap into and benefit from expanded international, regional and local markets, and improved agriculture value-chains.
Indicators:
1) % increase in export growth rate of Rwanda
products in international markets
2) % decrease of extreme poverty
Baselines:
1) 24.9%
2) 24.9%
Targets:
1) 28%
2. 10%
Output 2.1
Strengthened
Agricultural
Innovation and
Value Chain
Indicators
1).No of
commodity
value-chain
upgrading
strategies
developed
2)No of
functional
Community
Processing
Centres for
technology
transfer owned by
cooperatives
3) No of
smallholder
farmers including
women skilled in
value chain
processes
Baselines
1) 4
commodities
with upgraded
value-chain
strategies
2) 3 functional
Community
Processing
Centers
3) 19800
women,: 25200
men skilled
small holder
farmers
Targets
1) 20
commodities
with upgraded
value-chain
strategies
2) 10 Functional
Community
Processing
Centers
3) 80,000
females;120,000
male skilled
smallholder
FAO UNIDO
WFP
UNW ILO
ITC
UNDP
MINAGRI MINICOM
RDB
PSF MINALOC
Support to enable farmer organizations and
smallholder farmers to produce cost effective
quality commercial supplies and access to both
local and international markets benefiting male and
female farmers.
460,138 374,553 193,685 193,685 1,222,062
Support mapping and assessing, key selected value
chains
188,800 72,800 68,800 68,800 299,200
Develop and expand existing value chain programs
on livestock, dairy products, and fruits and
vegetable
1,609,888 690,855 615,159 438,089 3,353,990
Provide support national institutions and
cooperatives for the management of Strategic Food
Reserve(s) and to promote t innovative agri-
business solutions
120,935 180,900 158,286 45,224 451,346
Support key national institutions and cooperatives
to promote best agricultural practices and
technology transfer in agriculture, livestock,
fisheries sector
334,623 259,435 226,935 80,349 901,343
Support farmer cooperatives to expand their
application of innovative approaches for
sustainable production of priority crops.
70,592 65,000 65,000 0 195,000
Provide support use of efficient transport and
distribution packaging solutions to reduce waste
and preserve optimum quality in three sectors
identified
45,500 130,000 97,500 65,000 338,000
Provide support for the upgrading small-scale food
and cash crop agro-processing units in rural areas
incl. CPCs
258,400 302,640 315,440 266,134 1,142,614

Page 36
Output 2.2: Strengthened
National
Regulatory
Frameworks
For Quality
Standards
Compliance
Indicators:
1)No of national
systems acquiring
international
accredited
2)No of SMES
certified on food
safety standards
3)National Food
Safety
Coordination
Committee
established
Baselines
1) 0
2) 11.2%
1) No
Targets
1. 20
2. 40%
3. Yes
UNIDO
FAO
WHO ITC
UNDP
MINISANTE
MINAGRI
MINICOM RSB
RAB
NAEB
Strengthen national systems for quality and food
safety inspections, animal epidemio- surveillance,
institutional coordination, and establish information
exchange network systems.
544,252 388,159 406,024 409,014 1,697,449
Provide support establishment and management of
testing and metrology laboratories towards
international recognition
299,577 332,605 321,572 328,091 1,281,845
Support for SMEs under priority sectors for
acquiring standards certification.
209,521 192,048 187,255 315,218 904,042
Strengthen national capacities to participate in
international standardization processes
177,524 114,312 62,119 59,072 413,027
Output 2.3
1) Agricultural
value chain
financing is
developed
and
implemente
d at Macro,
Meso and
Micro
levels
Indicators:
1) Number of
FSPs
participating in
VCF
2)Number of
instruments
proposed to the
market
Baselines:
1)TBD
2)TBD
Targets
1)4
2)2
UNCDF
UNCTA
D
MINAGRI
SACCO
RAB
NAEB
TA and FA to support national institutions in
developing and implementing appropriate
agriculture VCF business models and agricultural
insurance strategies in Rwanda
115,200 94,648 97,120 70,472 377,440
Support the development of supportive
infrastructures (warehouse and warehouse receipt
system) and SACCO towards formation of
cooperative bank as a vessel for agriculture lending
91,000 120,000 90,000 90,424 391,424
Provide TA and FA for institutional capacity
building of SACCOs and MFIs to develop and
implement AVC financing instruments (products
and services, partnerships with other VC actors)
50,381 115,594 79,325 87,344 332,644
Agencies specific fund allocation and timeframe Year 1 Year2 Year 3 Year 4 TOTAL
UNIDO Programme Cost 1,200,522 1,222,581 1,255,984 1,320,913 5,000,000
ITC Programme Cost 1,941,881 1,928,514 2,009,013 2,020,590 7,899,998
FAO Programme Cost 1,931,167 825,500 617,500 292,500 3,666,667
WHO Programme Cost 158,999 126,543 136,361 111,271 533,174
UNW Programme Cost 42,250 169,000 211,250 211,250 633,750

Page 37
WFP Programme Cost 513,846 537,889 292,157 130,009 1,473,901
UNCTAD Programme Cost 542,857 566,857 536,857 506,857 2,153,428
UNECA Programme Cost 174,082 195,812 113,872 49,735 533,501
ILO Programme Cost 114,000 98,000 94,000 94,000 400,000
UNCDF Programme Cost 110,200 159,861 126,064 137,859 533,984
UNDP Program Cost 247,996 745,595 0 0 993,591
Total 6,977,800 6,576,152 5,393,058 4,874,984 23,821,994

Page 38
5. MANAGEMENT AND COORDINATION ARRANGEMENTS
UN agencies participating into the value chain Joint Program come together and plan the program and related activities. Individual agencies
make consultations with their national institutional counterparts to bring out strategic needs where UN has comparative advantage for
intervention. Other tools used in program planning are Country Common Assessment and EDPRS 2 that provide the government, other
national partners and the UN organizations with the analytical basis to identify priorities for the achievement of national goals. The UN
agencies will come together to make the assessment of needs identified by individual agencies and design interventions based on available
resources, timeframes and comparative advantages while focusing on the shared outputs. A key programming tool that is adopted by
participating agencies is the Joint Program Results Matrix, which sets out (in a logical framework) the outputs, outcomes and related
measurable indicators for the flagship.
All national and UN agencies participating in the value chain development work together to develop and agree on a common work plan. This
work plan sets out the activities that will be carried out during each year of the joint flagship, the expected outputs to which these activities
will contribute to, the inputs needed to carry out the activities, and the timeframe, budget, and responsibilities for completing the activities.
The next step after joint programming is implementation. Joint programming involves each of the UN agencies’ programs, funds, and
specialized expertise are brought together and work closely and with national partners to coordinate their interventions in support of results
which will lead to the achievement of the intended outcomes, as set out in the value chain Joint program Results Matrix.
The reporting of the joint Program will be done on quarterly basis. A lead agency shall consolidate reports of implementation from
participating agencies and make a single Joint Program quarterly report that will be shared to all stakeholders. The same shall be applied to
annual reports.
To enable easy collection of report in inputs, a list of implementation Focal Points should be developed and made available to the lead agency
and stakeholders.
The two UN agencies playing a role of lead agency in this Joint Program are FAO and UNIDO. The mandate of Lead Agencies is to ensure
coordination of Joint program implementation and reporting in accordance with UN existing framework through program management

Page 39
arrangement as required by DRGs, PPOC and UNCT. The implementations and reporting should also follow systems and procedures as
required by Government of Rwanda.
This Joint Program is co-chaired by the Ministry of Trade and Industry, together with Ministry of Agriculture and Animal Resources. The two
co-chairs will be responsible for coordinating other participating Institutions and particularly ensuring timely communication to enhance
effective implementation of the program. The co-chairs are responsible to keep regular communications with UN agencies to ensure same
level of understanding between both sides.

Page 40
6. FUND MANAGEMENT ARRANGEMENTS
The selected fund management for the value chain development Joint Program is “parallel option” whereby each participating agency shall
manage its own mobilized funds. The value chain joint program expects participating agency to mobilize funds as core, vertical or One fund.
The implementation of agreed up on activities under work plans by use of the available funds will done by agencies’ program management
team in consultation with IPs and other within UN agencies.
Funds management and coordination costs shall be done by each agency in accordance with its rules and regulations. The related coordination
between agencies and IPs shall be ensured within joint program through a single aggregated or consolidated reports shared among all
stakeholders.
Budget preparation shall be by each agency while following agency separate procedures and guidelines in consistent with program
components. Each UN organization will account for the income received to fund its program components in accordance with its financial
regulations and rules.
The program implementation shall be done according to work plans and each agency shall ensure the there is enough human resources related
to financial management and activity implementation. Both financial and narrative reports shall be done in line with government, and one UN
reporting requirements and frameworks.
Balance of funds shall be assessed and reported at every end of year and this shall constitute carry over funds that will be taken into the
following year. When each agency has recorded carry over funds into the following year, this will be considered and planned for expenditure
in that coming year.
Page 41
7. MONITORING, EVALUATION AND REPORTING
The Value chain development Joint Program log frame shall present the following key M&E parameters, (i) indicators, (ii) baseline data, (iii)
targets, (iv) means and source of verification, and (v) assumptions. The data on indicators, baseline and targets are aligned to those provided in
national planning tools and in UNDAP, and they will be disaggregated by gender wherever possible. A detailed monitoring framework
indicating methodology, format, frequency and responsibility for collecting data for indicators at outcome and output level will be developed
within the first six months of the Joint program implementation. This M&E plan will help ensure accountability, transparency, and will also
monitor progress and achievements against outcomes and related outputs.
Monitoring reviews will occur at annual and mid-term, as planned in the national system (to check with PPOC and harmonize with other
DRGs on the same cycle of Monitoring). Consultations and discussions will be conducted among agencies, to set up a calendar for an annual
planning and reporting
The Joint programme should represent collective desire, thus, necessitating a framework to report changes, gains or further challenges, aimed
at achieving the commitments. Monitoring & Evaluation and a functional database represent the heart of resource information from which
materials for reporting can be derived.
Information and data collected will be shared between all parties concerned and compiled accordingly against identified indicators, ensuring
gender-sensitive collection and analysis when possible. An update will be provided by each of the three Agencies on status of implementation.
In principle, each agency will appoint one officer responsible for the agency activities report within the Joint programme. The leader agency
for each Joint programme will be responsible for the entire reports related to the flagship, in joint collaboration with the agencies focal points,
and will report to the DRG co-chairs.
A technical Joint programme committee comprising of representatives of the participating agencies and involved national institutions will
be constituted and meet every three months to track progress toward planned results and make related decisions on subsequent needed action.
Potential risks will be assessed at these meetings and remedial measures envisaged to address them. . Reports of the steering committee,
updates and progress reports will be posted on agencies’ and ministries’ websites for user and right-holders information.
The UNDAP M&E will indicate how the Joint programmes will contribute to the whole Mid Tem Review (role and responsibilities of
participating DRG; agencies, GoR, assess progress related to delivery of outputs and achievement of outcomes.

Page 42
Figure 2: Joint Programme Monitoring Framework (JPMF)
Expected
Results
(Outcomes &
outputs)
Indicators (with baselines &
indicative timeframe)
Means of
verification
Collection
methods (with
indicative time
frame &
frequency)
Responsibilities Risks & assumptions
Outcome 1: Pro-poor growth
and economic
transformation
enhanced for
inclusive
economic
development
and poverty
reduction
Indicators:
1) % population below the
poverty line
2) % exports to GDP(value of
exports goods and services
Baselines:
1) 44.9% Rwandans living
below poverty line
2) 14.6%
Targets
1)<30%Rwandans living
below poverty line
2) 27.2%
3) 25% aid on budget
EICV
reports
Surveys every 3
years
MINECOFIN,
NIS Risk:
Instability in the sub-region
Assumption:
Continued partnerships
between Rwanda and DPs
Output 1.1:
Strengthened
Leadership And
National
Capacities to
Strategically
Plan and
Harness
Opportunities
Indicators: 1) No. of key sector strategies
reflecting structural economic
transformation
2) % population aware of
regional integration process
Baselines:
1) 1 Sector strategy reflecting
EICV
reports
Surveys every 3
years
MINECOFIN,
MINEAC Risk: Limited national capacity for
implementation
Assumption:
Continued prioritization of
regional integration

Page 43
for Structural
Economic
Transformation
structural economic
transformation
2) 20%
Targets
1) 4 sectors strategies
reflecting structural economic
transformation
2) 40%
Output 1.2: Strengthened
National
Capacities for
Industrial and
Trade
Competitiveness
Indicators: 1) No of value chain studies
for priority commodities
conducted
2) % of SMEs using the
Investment Monitoring
Platform (IMP)
Baselines:
1)2 value chain studies
conducted
2)20 % SMEs use the IMP
Targets
1)3 value chain studies
conducted annually
2) 60% SMEs use IMP
Study
reports
Annual studies MINICOM,
RDB, PSF Risks: Inadequate resources;
High staff turnover of national
institutions
Assumption:
Continued Government
commitment;
Adequate Government
resource allocation

Page 44
Outcome 2: A diversified
economic base
allows
Rwandans to tap
into and benefit
from expanded
international,
regional and
local markets,
and improved
agriculture
value-chains.
Indicators:
1) % increase in export growth
rate of Rwanda products in
international markets
2) % decrease of extreme
poverty
Baselines:
1) 24.9%
2) 24.9%
Targets
1) 28%
2. 10%
EICV
reports
Surveys every 3
years
MINECOFIN,
NIS Risks:
Lack of respect to and uneven
implementation of regional
agreements
Extreme climate changes
impacting negatively on
agriculture
Assumptions:
Conducive regional and global
markets;
Regional political and
economic stability
Output 2.1: Equitable
development
and innovation
in agriculture ,
post-harvest and
value addition
technologies ,
best practices
and marketing
promoted and
strengthened
Indicators:
1).No of commodity value-
chain upgrading strategies
developed
2)No of functional Community
Processing Centres for
technology transfer owned by
cooperatives
3) No of smallholder farmers
including women skilled in
value chain processes
Baselines:
4 commodities with upgraded
value-chain strategies
2) 3 functional Community
Processing Centres
Project
evaluation
reports
Evaluation and
assessment
MINAGRI,
MINICOM,
RDB
Risks:
Commodity saturation at
regional level
Inadequate marketing
infrastructure
Unfavourable climate effects
on agriculture
Assumption:
Continued commitment of the
Government and provision of
adequate resources by
Government and partners;
Marketable surplus is

Page 45
3) 19800 women,: 25200 men
skilled small holder farmers
Targets
1) 20 commodities with
upgraded value-chain
strategies
2) 10 Functional Community
Processing Centres
3) 80,000 females;
120,000 male skilled
smallholder
available,
Government continues to
support crop intensification;
Output 2.2: National
regulatory
frameworks for
quality
standards and
food safety
strengthened
and
implemented in
accordance with
regional and
international
guidelines
Indicators:
1) No. of national systems
accredited
2) % of industries ISO certified
3) National coordination
committee established
Baselines:
1) 0
2) 11.2%
3) No
Targets
1. 20
2. 40%
3. Yes
Reports of
evaluation
and
certification
s
Evaluation and
assessment
MINICOM, RBS Risks:
Limited capacity for national
institutions to develop and
participate in standardization
processes
Limited SME capacity to
implement standards
Assumptions:
Local market demands
certified products;
Continued Government
commitment to quality
standards

Page 46