workshop on using the national survey of children’s health … · agenda brief description of the...
TRANSCRIPT

Workshop on Using the National Workshop on Using the National Survey of ChildrenSurvey of Children’’s Health Dataset: s Health Dataset: Practical ApplicationsPractical Applications
Centers for Disease Control and PreventionNational Center for Health Statistics
Julian LukeJulian LukeStephen BlumbergStephen Blumberg

National Survey ofChildren’s Health, 2003
Sponsored by HRSA’s Maternal and Child Health BureauConducted by CDC’s National Center for Health StatisticsPart of the State and Local Area Integrated Telephone Survey (SLAITS) program

Agenda
Brief description of the NSCHKey sociodemographic variablesWeights and sampling variablesTips on preparing data for analysisFrequencies, crosstabs, and logistic regression examples in SUDAAN, SAS, and STATA

National Survey ofChildren’s Health, 2003
To produce national and state-based estimates on the health and well-being of children, their families, and their communities

Interview Process
Independent random-digit-dial samples for all 50 states plus D.C.Screened households for children under 18 years of ageOne child under 18 years of age was randomly selected to be the target of the interview

Final Sample
102,353 completed interviewsMinimum: 1,483 in UtahMaximum: 2,241 in Louisiana and Ohio25 states have more than 2,000 each
Overall response rate: 55.3%Minimum: 49.6% in New JerseyMaximum: 64.4% in South Dakota32 states were above 55%

Weighting and Estimation
Sampling weights to permit national and state-specific estimates of health and well-being Sampling weights are adjusted for potential non-response biasesSampling weights are adjusted to account for non-coverage of non-telephone households

Locating SLAITS Data
The SLAITS home page is located at http://www.cdc.gov/nchs/slaits.htm
SLAITS OverviewKey Features of the SLAITS MechanismFrequently Asked QuestionsExisting Survey Modules

Key Variables on Public Use File

Key Variables on Public Use File:
State of Residence
Name: STATELevels: Separate numeric code for each state

Key Variables on Public Use File:
Age
Name: AGEYR_CHILDLevels: Age in years
0 = Younger than one year

Key Variables on Public Use File:
Sex
Name: S1Q01Levels: 1 = male, 2 = female

ConfidentialityConfidentiality was guaranteed to participantsSection 308d of the Public Health Service Act (42 U.S.C. 242m):“No information…may be used for any purpose other than the purpose for which it was supplied…[and] may not be published or released…if the particular establishment or person supplying the information or described in it is identifiable.”
Prohibits the release of sub-state identifiers or contextual information

Key Variables on Public Use File:
RaceName: RACER, RACEAIAN, RACEASIA, RACE_HI
Levels:RACER = White, Black, Other, MultiraceRACEAIAN adds American Indian/AK NativeRACEASIA adds AsianRACE_HI adds Asian and Native Hawaiian / PI
Only RACER can be used for national estimates

Key Variables on Public Use File:
Family Structure
Name: FAMSTRUCTLevels:
1 = Two-parent biological/adoptive household2 = Two-parent household with at least one step-parent3 = One-parent household with a biological, step, foster, or adoptive mother and no father4 = All other family structures

Key Variables on Public Use File:
Relative Ages of ChildrenName: AGEPOS4Levels:
1 = Only child2 = Oldest child3 = Second oldest child4 = Third oldest child5 = Fourth oldest child or younger
Note: This variable refers to the relative ages of children in the household. If the child has siblings over 17 years of age or unrelated children live in the household, this variable should not be interpreted as birth order.

Key Variables on Public Use File:
Urban/Rural Identifier
Name: MSA_STATLevels: 1 = Yes, 0 = NoMissing Data: MSA_STAT was suppressed in 16 states to protect the confidentiality of participants

Key Variables on Public Use File:
IncomeName: POVERTY_LEVELRLevels: 8 categories relative to the Federal Poverty LevelDerived from: Total number of household members and household income valueMissing Data: Total household members and/or household income were missing

Key Variables on Public Use File:
Highest Education Achieved
Name: EDUCATIONRLevels:
1 = < 12 years2 = 12 years (including high school graduate)3 = More than high school (including college graduates)

Key Variables on Public Use File:
Primary Language in Home
Name: PLANGUAGELevels:
1 = English2 = Any other language

Key Variables on Public Use File:
Number of Adults in HH
Name: TOTADULT3Note: This variable refers to the number of adults in the household. It has been topcoded at 3+.

Key Variables on Public Use File:
Number of Children in HH
Name: TOTKIDS4Note: This variable refers to the number of children in the household. It has been topcoded at 4+.

Top-Coded and Bottom-Coded Variables
How many times (past 12 months) sample child (S.C.) saw a doctor, nurse, or other health care professional for preventative medical care ? (S4Q03R)How many times (past 12 months) S.C. go to a hospital emergency room about health? (S4Q04R)How many emergency room visits because of accident, injury, or poisoning (S4Q05R)Excluding emergency room visits, hospitalizations, and well-child care, how many times in last 12 months did S.C. see a doctor, nurse, or other health care professional for sick-child care? (S4Q06R)

Top-Coded and Bottom-Coded Variables
How old was S.C. when completely stopped breastfeeding or being fed breast milk? (S6Q60R)During past 12 months, about how many days did S.C. miss school because of illness or injury? (S7Q02R)During the past week, how many times did you or a family member take S.C. on any kind of outing (park, library, zoo, shopping, church, etc)? (S8Q01R) About how often does S.C. attend a religious service? (S8Q02R)How many times has S.C ever moved to a new address? (S11Q06R)

Key Variables on Public Use File:
Overweight
Name: BMICLASSLevels:
1 = Underweight2 = Normal weight3 = At risk of overweight4 = Overweight
Derived from: Parent-reported height and weight, which are top-coded and bottom coded (see HGHT_FLG and WGHT_FLG)

Weights and Sampling Variables

Use Weighted Data
Sampling weights to permit national and state-specific estimates Sampling weights are adjusted for potential non-response biasesSampling weights are adjusted to account for non-coverage of non-telephone households

Only One Weight
WEIGHT_I
The same weight is used for national and state-level analyses.

Variance Estimation
Sample design involved clustering of children within households and stratification of household within states.Therefore, SUDAAN, SAS survey procedures, STATA, or other such programs must be used to obtain estimates of variability and statistical significance.

Variance EstimationSeveral data users have noted that, within a given state, the NSCH sample was drawn as a simple random sample. Therefore, these data users have suggested that accurate variance estimates for a single state can be obtained from SAS if the sampling weights are normalized.
This is not true. SAS does not adequately account for the heterogeneous sampling weights. Therefore, the standard errors provided by SAS for normalized weights are smaller than they should be.

Sampling Variables
Stratum: State (STATE)PSU: Household (IDNUMR)
In SUDAAN…PROC … DESIGN=WR;NEST STATE IDNUMR;WEIGHT WEIGHT_I;

Statistical packages used to analyze Survey Data
SUDAAN – SUrvey DAta ANalysisSelected SAS procedures: SURVEYFREQ and SURVEYLOGISTICSTATA
Taylor series linearization method for estimating population characteristics from complex survey data

Preparing the Data for Analysis
Subsetting the population to analyze particular subgroups only
Dealing with question non-response values like “Don’t Know” and “Refused” responses
Categorical variables in SUDAAN
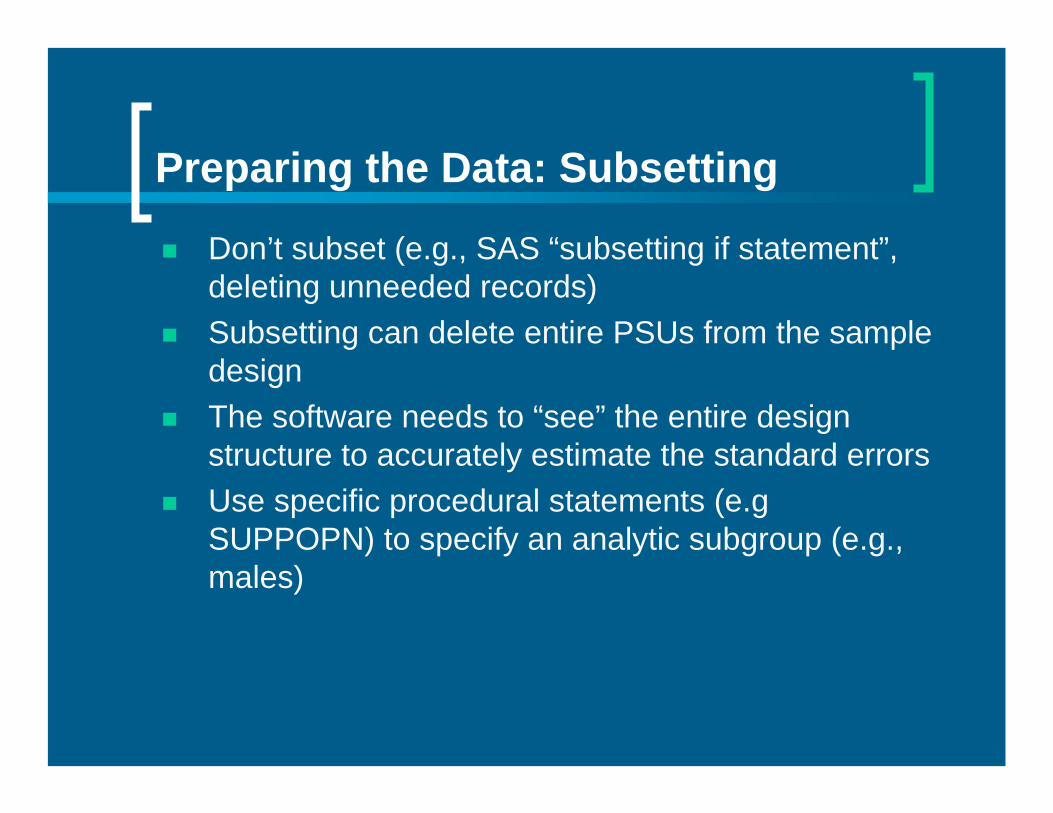
Preparing the Data: Subsetting
Don’t subset (e.g., SAS “subsetting if statement”, deleting unneeded records)Subsetting can delete entire PSUs from the sample design The software needs to “see” the entire design structure to accurately estimate the standard errorsUse specific procedural statements (e.gSUPPOPN) to specify an analytic subgroup (e.g., males)

Preparing the Data:Item Non-Response
Set “Don’t Know” and “Refused” responses to missing valuesDK = 6, 96, 996, 9996 RF = 7, 97, 997, 9997Variables with missing values set to “.” are excluded from the analysis

Preparing the data:Categorical Variables
SUDAAN variables require special preparation for some of types of analysis
Categorical variables must begin with 1 and increase in whole numbers with no integers missingYes/no – 1/0 recode to 1/2 Subgroup and Levels statementsWill become clear when we look at sample programs

Statistics
Frequency distributions and Crosstabs
Logistic regression
General SAS and SUDAAN Syntax
PROC _____ ;
Sample Design statements
Computational statements
Output specifications

Frequency Distributions:SUDAAN CROSSTAB Syntax
PROC CROSSTAB DESIGN = WR;NEST STATE IDNUMR;WEIGHT WEIGHT_I;SUBPOPN VAR1 = value;SUBGROUP VAR2 VAR3 VAR4;LEVELS n2 n3 n4;TABLES VAR2 VAR3*VAR4;PRINT NSUM WSUM ROWPER SEROW / STYLE = NCHS WSUMFMT = F7.0 SEROWFMT = F5.4;


Logistic Regression:SUDAAN LOGISTIC/RLOGIST Syntax
PROC LOGISTIC DESIGN=WR;PROC RLOGIST DESIGN=WR;
NEST STATE IDNUMR ;WEIGHT WEIGHT_I ;SUBGROUP IVAR1 IVAR2;LEVELS 2 4MODEL DVAR = IVAR1 IVAR2 IVAR3;REFLEVEL IVAR1=Value1 IVAR2=Value2;

Logistic Regression:SUDAAN LOGISTIC/RLOGIST Syntax
PROC LOGISTIC DESIGN=WR;PROC RLOGIST DESIGN=WR;
NEST STATE IDNUMR ;WEIGHT WEIGHT_I ;MODEL DVAR = IVAR1M IVAR2H IVAR2B
IVAR2O IVAR3;


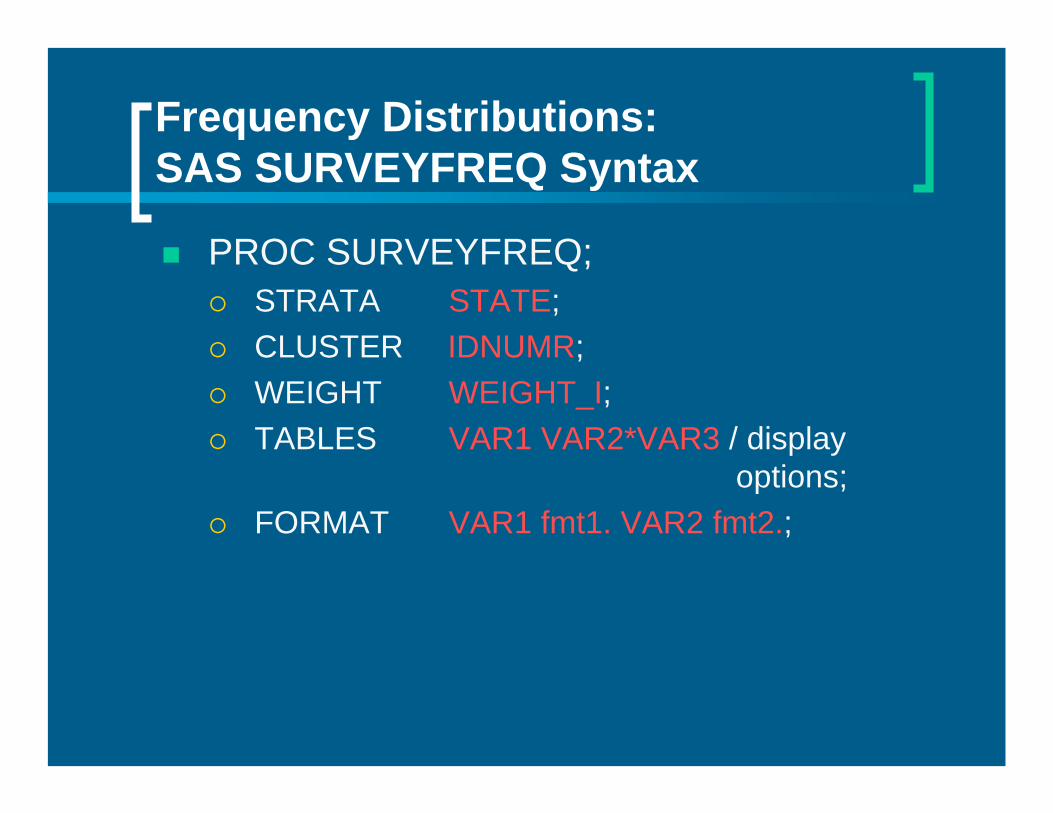
Frequency Distributions:SAS SURVEYFREQ Syntax
PROC SURVEYFREQ; STRATA STATE;CLUSTER IDNUMR;WEIGHT WEIGHT_I;TABLES VAR1 VAR2*VAR3 / display
options;FORMAT VAR1 fmt1. VAR2 fmt2.;


Logistic Regression:SAS SURVEYLOGISTIC Syntax
PROC SURVEYLOGISTIC; STRATA STATE ;CLUSTER IDNUMR ;WEIGHT WEIGHT_I ;CLASS IVAR1 (param=ref ref=‘VALUE’);MODEL DVAR = IVAR1 IVAR2 IVAR3;FORMAT IVAR1 fmt1. IVAR2 fmt2.;

Logistic Regression:SAS SURVEYLOGISTIC Syntax
PROC SURVEYLOGISTIC; STRATA STATE ;CLUSTER IDNUMR ;WEIGHT WEIGHT_I ;MODEL DVAR = IVAR1M IVAR2 IVAR3;FORMAT IVAR1 fmt1. IVAR2 fmt2.;


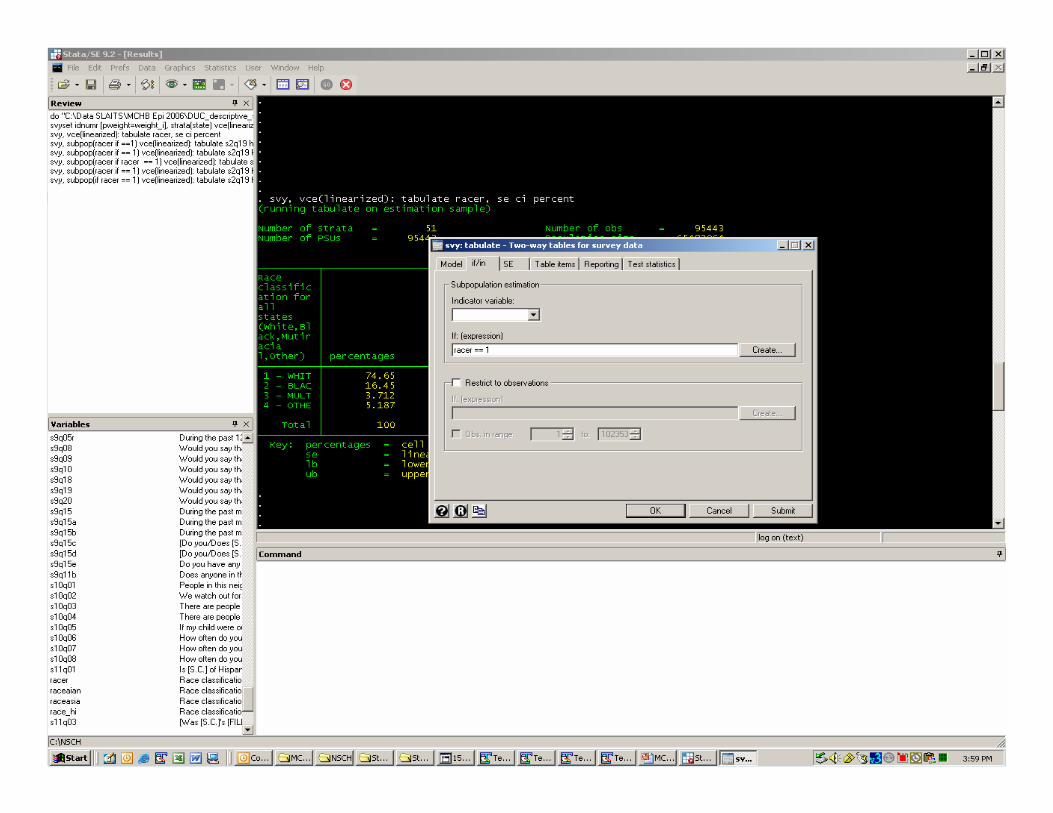
Frequency Distributions:STATA SVY: TABULATE Syntax
SVYSET [PWEIGHT=WEIGHT_I], STRATA(STATE) PSU(IDNUMR)
SVY:TABULATE V1 V2Declare analysis variablesDeclare the method used for variance estimationRequest specific table items such a standard errors, confidence limits, and row or column proportionsRequest additional test statistics such as Chi-square or likelihood ratiosDefine subgroup analyses


Logistic Regression:STATA SVY:LOGIT
SVYSET [PWEIGHT=WEIGHT_I], STRATA(STATE) PSU(IDNUMR)
SVY: LOGIT DVAR1 IVAR1 IVAR2 IVAR3, OR
Declare dependent analysis variableDefine subgroup analysesDeclare the method used for variance estimationDeclare reporting specifications such as the confidence interval levels and request odds ratios or dependent variable coefficientsDefine the maximum number or iterations to run


For More InformationFor More Information……
Julian Luke or Stephen BlumbergJulian Luke or Stephen BlumbergCenters for Disease Control and PreventionCenters for Disease Control and PreventionNational Center for Health StatisticsNational Center for Health Statistics3311 Toledo Road3311 Toledo RoadHyattsville, Maryland 20782 USAHyattsville, Maryland 20782 USA
[email protected]@cdc.gov or or [email protected]@cdc.gov