the influence of sociodemographic factors on the
TRANSCRIPT
The Influence of Sociodemographic Factorson the Theoretical Effectiveness of FirePrevention Interventions on FatalResidential Fires
Marcus Runefors *, Division of Fire Safety Engineering, Lund University,Lund, Sweden
Finn Nilson, Department of Political, Historical, Religious and Cultural Studies,Karlstad University, Karlstad, Sweden and Centre for Societal RiskResearch, Karlstad University, Karlstad, Sweden
Received: 6 November 2020/Accepted: 5 April 2021/Published online: 28 April 2021
Abstract. The risk of fatal residential fires is known to be differentiated by sociode-
mographic factors. However, often prevention measures are introduced generally in apopulation, thereby perhaps affecting the effectiveness of these interventions. By usinga 20-year high-quality register over fatal fires in Sweden and a previously validated
Boolean expressions regarding the effectiveness for specific interventions, this studyinvestigates the theoretical effectiveness of fire interventions in relation to differentsociodemographic variables and fatal residential fires. The results show that the effec-
tiveness of different fire-related prevention measures varies considerably in relation todifferent sociodemographic variables such as age, sex, municipal characteristics andliving conditions. As such, the paper highlights the importance of matching the cor-rect fire prevention measure to each individual depending upon sociodemographic
risk factors in order to achieve maximal effectiveness.
Keywords: Smoke alarms, Living conditions, Fire prevention, Sweden, Residential fires
1. Background
Despite considerable differences between countries [1, 2] and within countries [3]and the positive trend in the last half-decade [4], residential fire fatalities and asso-ciated injuries remain a major problem worldwide. In an attempt to further reducerates and absolute numbers, a number of different societal and individual inter-ventions have been introduced. Primarily, the focus has been on smoke alarminstallations, education or multi-faceted programs, and these have been introducedwidely with the expectation of preventing one or more of the five steps in the fireprocess; reducing heat; stopping the ignition of the first object; hindering firegrowth; initiating evacuation; and completing evacuation [5]. Whilst these inter-
*Correspondence should be addressed to: Marcus Runefors, E-mail: [email protected]
Fire Technology, 57, 2433–2450, 2021
� 2021 The Author(s)
Manufactured in The United States
https://doi.org/10.1007/s10694-021-01125-x
1

ventions have often shown an effect [6–9], other interventions, such as campaigns[10] and insurance-related incentives [11], as well as legal changes to cigarettes [12]and upholstery [13] have shown varied effectiveness.
Whilst the reason for the varied results regarding certain interventions could bemethodological or technical, it could also be that the effect differs depending uponthe group that receives the intervention. Specifically, although safety interventionscan be evaluated on a general, national or local level, it is widely known that firemortality is distinctly affected by sociodemographic factors [14]. Returning to thefive points in the fire process [5], it can be presumed that the overrepresentation ofcertain subgroups in term of the risk of fire mortality is due to sociodemographicfactors affecting one or several of these points. Consequentially, preventative mea-sures must be correctly matched with individuals who lack certain capabilities,thereby needing help to compensate for this factor. For example, a fire alarm isdesigned to assist in initiating evacuation. Whilst such an intervention will likelybe effective for able-bodied and cognitively-sound individuals, the effectiveness islikely to be considerably less for those with physical and cognitive disabilities, i.e.,groups that are known to be at higher risk for fire mortality [15, 16]. Therefore,the same intervention will have radically different effects for different individualsor groups [17], not least considering that certain groups, in particular householdswith higher education and homes including teenagers, have been shown to have ahigh risk of residential fire though low risk of fire mortality [18]. Put simply, itcould be that certain interventions will be more effective to implement for certainsociodemographic sub-groups as the safety intervention compensates a factor thatthe individual lacks. As such, it is also possible to ascertain which interventionshould be recommended to which individual.
Given the comprehensive data concerning fire fatalities in Sweden during thelast 20 years [19], a previous study has indicated that the theoretical effect ofinterventions can be assessed [5]. However, in the previous study, the databaseconsisted of relatively few cases, due to being limited to 2011 to 2014, meaningthat relatively few sociodemographic variables could be included given the inher-ent uncertainty. The Swedish fire fatality database has now been retrospectivelyquality-controlled as well as extended meaning that it now includes reliable dataover a 20-year time-period. As such, more precise analyses are possible. Therefore,this article aims to assess the theoretical effectiveness of fire interventions in rela-tion to sociodemographic variables.
2. Method
2.1. Data
The dataset used for this study included all fatal fires that occurred in residentialoccupancies (including care homes) in Sweden between January 1st, 1999 andDecember 31st, 2018. To be included in the dataset, the death was required tohave occurred within 30 days and as a direct effect of a fire or explosive combus-tion process. Indirect fatalities, where the victim died from, for example, fallingstructural members or jumping to safety, were not included. The reason to exclude
2434 Fire Technology 2021

indirect fatalities was that they were not included in the database until 2015, andthe inclusion criteria are still under development. The causality of the fire injuryand the fatality is assessed by a forensic pathologist through an autopsy which iscommon procedure for all unexpected deaths in Sweden.
The identification of cases was based on a combination of the database main-tained by the National Board of Forensic Medicine called ‘‘Rattsbase’’ and adatabase on fatal fires maintained by the Swedish Civil Contingencies Agency,which in turn is based on reports from Swedish rescue services and police. Thematching is primarily based on the Personal Identification Number (PIN), whichis a highly reliable [20] identification number given to all Swedish residents regard-less of citizenship. In cases where a PIN-number was lacking in either of the data-bases, the matching was based on city and date of the fire. For further details ofthe matching procedure, see [19]. This resulted in a total of 1856 fatalities duringthe studied period.
Cases where the cause, object of origin or room of origin was unknown in thefatal fire database, were matched with the incident reports, which are typically fil-led out in over 99% of the fires [21] where the rescue services responded. Forthese cases, both the categorical variables and the free-text-fields was examined toinvestigate if a probable cause, object or room could be determined.
The compiled database composed of a large number of variables regarding boththe fire and the individual as well as results from post-mortem blood analysis andthe type of municipality. A full list of included variables is available in ‘‘Ap-pendix’’.
2.2. Data Analysis
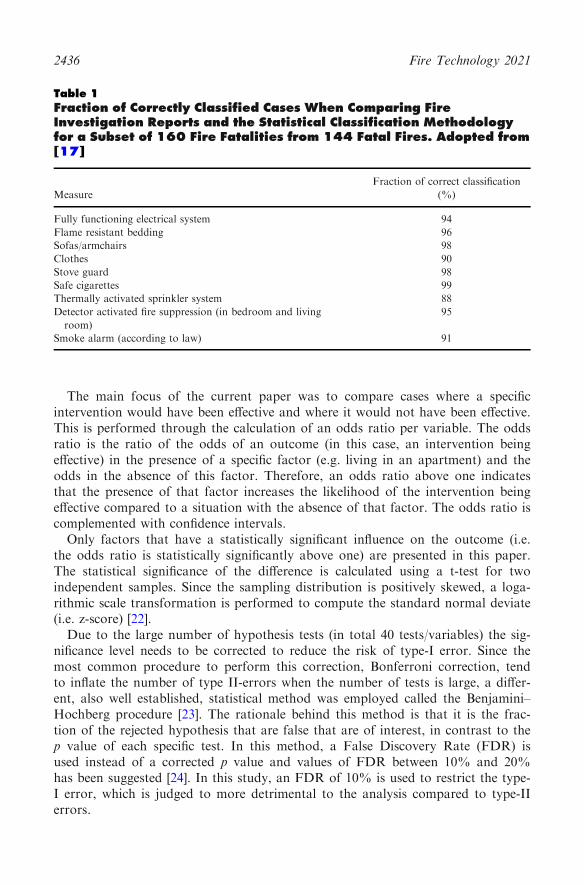
To assess the theoretical effectiveness of different fire prevention measures, a set ofpreviously validated [17]. Boolean expressions was implemented. This covers ninedifferent identified preventive measures presented in Table 1. The procedure fordeveloping the Boolean expression was that a preliminary set of expression wasdeveloped based on a qualitative understanding based on analysis of full investiga-tion reports. Those expressions were then validated by classifying the effectivenessof the nine measures in a set of 144 fatal fires where the effectiveness had previ-ously been assessed by analysis of the full fire investigation reports. Any discrep-ancies in the classifications were assessed to find the reason for misclassification,and the expression were corrected appropriately. The resulting fraction of correctclassification (i.e. effective or non-effective), per measure, is presented in Table 1.
The results showed a high level of agreement, and therefore, the same set ofexpressions was used on the larger dataset with 1856 cases in the current paper.
In terms of ‘‘effectiveness’’, this is a measure based on the assumption that theintervention would have both perfect reliability and be effective (e.g. a sprinklersystem would control a fire or a smoke alarm would wake the potential victim).In reality, of course, this is not always the case and should therefore be accountedfor when, for example, performing a cost–benefit-analysis based on the data pre-sented in this paper.
The Influence of Sociodemographic Factors on the Theoretical Effectiveness 2435
The main focus of the current paper was to compare cases where a specificintervention would have been effective and where it would not have been effective.This is performed through the calculation of an odds ratio per variable. The oddsratio is the ratio of the odds of an outcome (in this case, an intervention beingeffective) in the presence of a specific factor (e.g. living in an apartment) and theodds in the absence of this factor. Therefore, an odds ratio above one indicatesthat the presence of that factor increases the likelihood of the intervention beingeffective compared to a situation with the absence of that factor. The odds ratio iscomplemented with confidence intervals.
Only factors that have a statistically significant influence on the outcome (i.e.the odds ratio is statistically significantly above one) are presented in this paper.The statistical significance of the difference is calculated using a t-test for twoindependent samples. Since the sampling distribution is positively skewed, a loga-rithmic scale transformation is performed to compute the standard normal deviate(i.e. z-score) [22].
Due to the large number of hypothesis tests (in total 40 tests/variables) the sig-nificance level needs to be corrected to reduce the risk of type-I error. Since themost common procedure to perform this correction, Bonferroni correction, tendto inflate the number of type II-errors when the number of tests is large, a differ-ent, also well established, statistical method was employed called the Benjamini–Hochberg procedure [23]. The rationale behind this method is that it is the frac-tion of the rejected hypothesis that are false that are of interest, in contrast to thep value of each specific test. In this method, a False Discovery Rate (FDR) isused instead of a corrected p value and values of FDR between 10% and 20%has been suggested [24]. In this study, an FDR of 10% is used to restrict the type-I error, which is judged to more detrimental to the analysis compared to type-IIerrors.
Table 1Fraction of Correctly Classified Cases When Comparing FireInvestigation Reports and the Statistical Classification Methodologyfor a Subset of 160 Fire Fatalities from 144 Fatal Fires. Adopted from[17]
Measure
Fraction of correct classification
(%)
Fully functioning electrical system 94
Flame resistant bedding 96
Sofas/armchairs 98
Clothes 90
Stove guard 98
Safe cigarettes 99
Thermally activated sprinkler system 88
Detector activated fire suppression (in bedroom and living
room)
95
Smoke alarm (according to law) 91
2436 Fire Technology 2021

To be able to calculate odds ratios for smoking, a probability of an individualbeing a smoker was predicted using the fraction of smokers in the population in10-years-groups by gender obtained from a national survey of smoking habits per-formed in 2008 [25]. The reason for choosing this year was that there has been asignificant reduction in the number of smokers over the years, and therefore ayear in the middle of the studied period was chosen. Victims who died in a firecaused by their own smoking was given a 100% probability of being a smoker.Through this, the expected number of smokers could be calculated for both casesand controls.
3. Results
In this section, the sociodemographic factors that indicate that a specific interven-tion is more or less effective are presented. However, it should be noted thatalthough an intervention can break a causal chain in a specific scenario, no strictcausality is inferred between the studied sociodemographic variables (e.g. age, liv-ing conditions) and the effectiveness. Importantly, however, this is not neededsince the importance of the present study in relation to prevention is to map thesociodemographic cues that point towards a measure being more or less effectivefor a specific individual.
The results are presented as odds ratio (OR) with 95% confidence intervals, andonly statistically significant variables are presented. For a full list of included vari-ables, refer to ‘‘Appendix’’. To improve graphical interpretation, when a sociode-mographic factor was present for all (or none) of the cases, this is presented as across at odds ratio of 100 and 0.01, respectively, despite actually being at infinityand minus infinity.
The results for safe cigarettes can be found in Fig. 1. Apart from the obviousimportance of the individual being a smoker, the living conditions appear to bevery important where living in a care home (OR = 3.6; 95% CI 2.2 to 5.8) ismost important, followed by living alone (OR = 2.9; 95% CI 2.2 to 3.8) and inan apartment (OR = 2.2; 95% CI 1.7 to 2.7). Also, factors relating to age areimportant, specifically being between 65 and 79 years (OR = 2.1; 95% CI 1.6 to2.7) as well as alcohol intake [with an OR of 2.0 (95% CI 1.5–2.7) for BAC above2&]. Also, several factors relating to larger cities, such as a population above100k (OR = 1.7; 95% CI 1.4 to 2.2) appear to be indicators of high effectivenessof the intervention.
Many of the factors that indicate a lower effectiveness are the opposite of thefactors described above. For example, younger ages, with 20 to 44 years at OR of0.3 (95% CI 0.2 to 0.4) and no individuals where the measure would have beeneffective for victims below 20 years. Also, living with family (OR = 0.3; 95% CI0.2 to 0.4) and living in a house (OR = 0.3; 95% CI 0.2 to 0.4) as well as livingin smaller cities are indicators of the measure being less effective.
Factors relating to the effectiveness of a functional electrical system can befound in Fig. 2. In this context, a functional electrical system refers to both fixedinstallations and electrical consumer products. The strongest indicator of effective-
The Influence of Sociodemographic Factors on the Theoretical Effectiveness 2437

ness is the absence of smoking (OR = 7.3; 95% CI 4.2 to 12.6) which indicatesthat those individuals would benefit more from measures targeting smoking-re-lated fires. Also, younger people, specifically 5 to 19 years (OR = 5.5; 95% CI 2.8to 10.9) living in houses (OR = 2.6; 95% CI 1.8 to 3.8) with their family (OR =2.1; 95% CI 1.4 to 3.1) seems to benefit more from this intervention. Also, peo-
Figure 1. Odds-ratios of different sociodemographic factors on theeffectiveness of safe cigarettes.
Figure 2. Odds-ratios of different sociodemographic factors on theeffectiveness of functional electrical system.
2438 Fire Technology 2021

ple in high-income municipalities (OR = 2.4; 95% CI 1.4 to 4.1) and people notbeing under the influence of alcohol (OR = 1.5; 95% CI 1.1 to 2.2) tend to bene-fit more from this measure.
Factors influencing the effectiveness of fire resistance of sofas and armchairs canbe found in Fig. 3. Among the factors indicating a high level of effectiveness, thepresence of smoking can be found (OR = 4.2; 95% CI 2.9 to 6.1) as well as liv-ing in an apartment (OR = 3.4; 95% CI 2.3 to 5.0), a BAC above 2& (OR =2.7; 95% CI 1.9 to 3.9), living alone (OR = 2.2; 95% CI 1.5 to 3.3), and beingbetween 45 and 64 years of age (OR = 1.6; 95% CI 1.1 to 2.2).
The factors indicating low effectiveness are to a large degree the opposite of thefactors above, but it is interesting to note that the oldest age group, 80+, indi-cated a low effectiveness (OR = 0.4; 95% CI 0.2 to 0.6) as for those living in carehome (OR = 0.3; 95% CI 0.1 to 0.8).
The factors influencing the effectiveness of fire-resistant bedding is presented inFig. 4. Those factors are to a large degree similar to the factors found for fire-re-sistant sofas and armchairs, but factors relating to the type of municipality alsoshowed a significant predictive capability. It was found that individuals living inmetropolitan (OR = 1.7; 95% CI 1.2 to 2.4) and middle class (OR = 1.5; 95%CI 1.1 to 2.0) municipalities could be expected to benefit more from fire-resistantbedding.
Factors that indicate a high effectiveness of fire-resistant clothes can be found inFig. 5 and differs to a large degree from the ones presented above. In this case,the oldest group, 80+ years (OR = 4.9; 95% CI 3.4 to 7.1) and those living incare homes (OR = 11.9; 95% CI 7.4 to 19.1) benefit most. Interestingly, peoplewith moderate (OR = 0.4; 95% CI 0.2 to 0.7) or high (OR = 0.1; 95% CI 0.0 to0.3) alcohol levels benefit less. There also seems to be a gender difference, with
Figure 3. Odds-ratios of different sociodemographic factors on theeffectiveness of fire-resistant sofas or armchairs.
The Influence of Sociodemographic Factors on the Theoretical Effectiveness 2439

women benefiting more (OR = 2.6; 95% CI 1.8 to 3.8) and men benefiting less(OR = 0.4; 95% CI 0.3 to 0.5).
Factors that indicate the level of effectiveness of smoke alarms can be found inFig. 6. Among the factors that increase the effectiveness of smoke alarms, bothhigh (OR = 2.8; 95% CI 2.0 to 4.0) and low alcohol levels (OR = 1.8; 95% CI1.2 to 2.6) can be found. A higher effectiveness can also be expected in more spar-sely populated municipalities (OR = 2.4; 95% CI 1.1 to 5.2) and municipalities
Figure 4. Odds-ratios of different sociodemographic factors on theeffectiveness of fire resistant bedding.
Figure 5. Odds-ratios of different sociodemographic factors on theeffectiveness of fire resistant clothes.
2440 Fire Technology 2021

with a low average income (OR = 1.9; 95% CI 1.2 to 2.8) as well as for peopleliving in houses (OR = 2.0; 95% CI 1.5 to 2.6).
For thermally activated sprinkler systems, factors indicating the level of effec-tiveness can be found in Fig. 7. The most important factor is the absence ofsmoking (OR = 7.8; 95% CI 5.6 to 10.8) which is likely to be due to the fact thatfires affecting smokers tend to ignite in direct proximity to the victim where ther-mally activated sprinkler systems have been shown to be too slow to prevent thefatality [26]. Thermally activated sprinkler systems are more effective for youngerpeople, specifically 20 to 44 years (OR = 1.8; 95% CI 1.1 to 2.9), living in houses(OR = 2.2; 95% CI 1.6 to 2.9) and less effective for people in care homes (OR =0.3; 95% CI 0.2 to 0.5).As an alternative to the thermally activated sprinkler systems, there are sprin-
kler systems available that activate on a detector (usually based on a combinationof smoke and rate of temperature rise) which make the system significantlyquicker. Due to the more complex technology, they are typically only installed inspecific rooms such as bedroom and living room. Factors that indicate that thistype of system is more or less effective is presented in Fig. 8.
As for several other measures, the presence of smoking is a strong indicator ofthe effectiveness (OR = 3.5; 95% CI 2.8 to 4.3) as well as living alone (OR =1.6; 95% CI 1.3 to 1.9) and in an apartment (OR = 2.2; 95% CI 1.8 to 2.6). Forthis measure, also metropolitan (OR = 1.6; 95% CI 1.2 to 2.2) and middle class(OR = 1.5; 95% CI 1.2 to 1.8) municipalities indicate an increased effectiveness.
The results for the final intervention assessed in this study, stove guards, is pre-sented in Fig. 9. For this intervention, commuter municipalities (OR = 2.6; 95%CI 1.5 to 4.7) showed the greatest influence, followed by both low (OR = 1.9;95% CI 1.2 to 3.1) and high (OR = 1.9; 95% CI 1.2 to 2.9) alcohol levels. Also,
Figure 6. Odds-ratios of different sociodemographic factors on theeffectiveness of smoke alarms.
The Influence of Sociodemographic Factors on the Theoretical Effectiveness 2441

younger adults, 20 to 44 years (OR = 1.9; 95% CI 1.2 to 3.1), appear to benefitmore from stove guards.
Among the factors that indicate a lower effectiveness are the absence of alcohol(OR = 0.6; 95% CI 0.4 to 0.9) and being in the oldest age group, 80+ years(OR = 0.5; 95% CI 0.3 to 0.8).
Figure 7. Odds-ratios of different sociodemographic factors on theeffectiveness of thermally activated sprinkler systems.
Figure 8. Odds-ratios of different sociodemographic factors on theeffectiveness of detector activated sprinkler systems.
2442 Fire Technology 2021

4. Discussion
The results from this study clearly show the importance of matching the correctintervention to sociodemographic factors. This is perhaps most clearly illustratedby comparing the implementation of safe cigarettes and a functional electrical sys-tem. When recommending interventions to a household it is obvious that in onehousehold safe cigarettes could be exceedingly beneficial whilst in the non-smok-ing household this would have no effect. However, it is likely that in the non-smoking household a functional electrical system would be highly beneficial tolimit the likelihood of a fatal fire.
Similarly, sprinklers and detector-activated sprinklers are beneficial for differentsocietal groups. Specifically, sprinklers are more beneficial for younger non-smok-ers living in houses whilst detector-activated sprinklers are more beneficial forsmokers living alone in apartments. This is an important differentiation and canhave considerable effects on the recommendations surrounding the planning ofresidential properties.
The age-related element of flame-retardant materials is also a particularly inter-esting finding in this study. Previous studies have noted that cigarette-related fatalfires are not one type of fire, rather that there are two distinctly different types.The first is a group largely consisting of middle-aged men who are intoxicated andwhere the fire starts in the living room or on a sofa or bed. The second is a grouplargely consisting of older women, often in care homes, where the cigarette ignitestheir clothes [27]. These typologies are clearly visible in this study as well. In simi-larity to other interventions, therefore, flame-retardant products could be moreclearly marketed (from both prevention organisations and producers) to differentsociodemographic or age-related groups. Other groups, for example younger pop-ulations, seem to benefit considerably less or not at all from this type of interven-tion. This is particularly poignant given the adverse environmental effectsassociated with many flame-retardant materials meaning that for some groups thetotal risk may potentially increase rather than decrease as a consequence of imple-menting flame-retardant materials.
Another interesting finding is related to stove guards. Sweden has been highlyproactive in free-of-charge installing stove guards in the homes of elderly, in particu-
Figure 9. Odds-ratios of different sociodemographic factors on theeffectiveness of stove guards.
The Influence of Sociodemographic Factors on the Theoretical Effectiveness 2443

lar for those with cognitive disabilities [28]. As such, the results concerning stoveguards need to be elaborated on. Installing fire safety equipment in relation to cook-ing stoves is important and in particular for older individuals. In the US, people85 years and older have a 5.5 times greater risk of dying in a cooking fire comparedto the overall population [29]. As such, the Swedish programme of installing suchequipment free-of-charge is important. However, this also means that a large propor-tion of older individuals in Sweden have such safety equipment, and consequentially,the proportion of all fatal fires that are cooking-related is considerably less than inother countries. In the US, 21% of all residential fatal fires are caused by cooking-re-lated activities [29], and in London, UK, 14% are caused by cooking [30]. In Sweden,the figure is 6% [27]. Consequentially, the potential effectiveness of interventionssuch as stove guards will be severely limited for the older population in Sweden, andtherefore the results suggest a greater effect for younger populations. Whilst this islikely to be true for Sweden, the transferability to other countries is dubious.
The example with stove guards highlights some limitations of this study. Firstly,by using the methodology chosen for this study, the theoretical effectiveness of anintervention will be related to the current safety situation in the studied popula-tion. As such, a widely implemented intervention will only have a potential effec-tiveness in groups that have yet to accept or chose the intervention, but willbenefit from it. Although this is important knowledge, not least from a practi-tioner’s perspective, as it will therefore be known where to focus campaigns andinformation, the knowledge is contextual. As such, similar studies need to be per-formed in other contexts.
The stove guard example also highlights that whilst it would be beneficial toinstall such equipment in younger adult homes, no cost–benefit or return ofinvestment is possible to ascertain from the results. Most likely, given the rela-tively few fatal fires caused by stoves in Sweden, large resources would berequired in order to accomplish significant results. However, Sweden has a VisionZero policy in regards to residential fires meaning that a deontological, ratherthan utilitarian, perspective should be applied [31]. As such, in accordance withthe approach, if benefits can be achieved, they should be pursued.
The results for smoke alarms also highlight another limitation of the study sincethey indicate that high alcohol levels indicate a high level of effectiveness. Itshould, however, be noted that the concept of theoretical effectiveness is based onthe assumption that the preventive measure fills its purpose in the fire, which, inthe case of a smoke alarm, is to wake the individual. However, experiments onintoxicated individual indicate that waking those individuals is significantly moredifficult compared to non-intoxicated individuals [32] which is a factor one needsto account for when designing interventions.
As such, although the results in this study are somewhat contextual and there-fore need to be assessed as such, they clearly illustrate an important factor; thatone solution does not work for all. Rather, fire prevention interventions need tobe specifically chosen for each individual depending upon the potential benefit andimpact of an intervention. Currently, a ‘‘one size fits all’’ approach is commonlyseen in fire prevention. This study shows that this needs to change in order for fireprevention interventions to become as effective as possible.
2444 Fire Technology 2021

5. Conclusion
This study can show that in terms of different fire safety interventions, the effec-tiveness differs considerably depending upon sociodemographic factors. From aprevention, societal perspective it is exceedingly important to introduce the mosteffective intervention to the societal sub-group most in need. Hopefully, the resultsfrom this study can contribute to a more evidence-based, and effective, fire pre-vention strategies in the future.
Also, the results can be used as a basis for future studies investigating potentialcausal chains between the identified factors and the effectiveness, as well as inves-tigation of potential gaps where innovations are needed.
Funding
Open access funding provided by Lund University. Funding was provided byBrandforsk (Grant No. 202-181).
Declarations
Conflict of interest The authors declare that they have no conflict ofinterest.
Open Access
This article is licensed under a Creative Commons Attribution 4.0 InternationalLicense, which permits use, sharing, adaptation, distribution and reproduction inany medium or format, as long as you give appropriate credit to the originalauthor(s) and the source, provide a link to the Creative Commons licence, andindicate if changes were made. The images or other third party material in thisarticle are included in the article’s Creative Commons licence, unless indicatedotherwise in a credit line to the material. If material is not included in the article’sCreative Commons licence and your intended use is not permitted by statutoryregulation or exceeds the permitted use, you will need to obtain permissiondirectly from the copyright holder. To view a copy of this licence, visit http://creativecommons.org/licenses/by/4.0/.
Appendix: Detailed Results
See Table 2.
The Influence of Sociodemographic Factors on the Theoretical Effectiveness 2445

Table
2ListofVariable
sIn
cluded
inth
eAnaly
sis,
with
Data
Sourc
eand
OddsRatio
forth
eDiffe
rentPre
ventive
Measu
reswith
95%
Confidence
Inte
rvals
Variable
Category
N
Oddsratiofor
Electrical
system
Safe
cigar-
ettes
FR
Sofa/
arm
chair
FR
bed-
ding
FR
clothes
Smoke
alarm
Thermal
sprinkler
Detector
sprinkler
Stove
guard
Age
1.0
to4
21
2.1
(0.59to
7.48)
None
0.97(0.22
to4.28)
None
None
0.68(0.17
to2.72)
1.87(0.43
to8.14)
1.03(0.42
to2.54)
0.75(0.1
to
5.71)
2.5
to19
49
5.53(2.8
to
10.94)
None
0.39(0.09
to1.64)
0.24(0.06
to0.99)
0.99(0.35
to2.82)
1.13(0.48
to2.65)
9.23(1.26
to67.41)
0.99(0.54
to1.83)
0.63(0.15
to2.62)
3.20to
44
240
0.88(0.51
to1.52)
0.28(0.18
to0.42)
0.92(0.56
to1.52)
0.47(0.28
to0.78)
0.13(0.04
to0.41)
1.07(0.73
to1.56)
1.81(1.15
to2.85)
0.84(0.62
to1.12)
1.88(1.15
to3.06)
4.45to
64
573
0.68(0.44
to1.04)
1.48(1.16
to1.9)
1.58(1.12
to2.23)
1.39(1.04
to1.86)
0.19(0.1
to
0.35)
1.79(1.34
to2.4)
0.78(0.59
to1.03)
0.93(0.75
to1.15)
1.2
(0.79to
1.82)
5.65to
79
534
0.69(0.44
to1.06)
2.09(1.62
to2.69)
1.39(0.98
to1.99)
1.4
(1.04to
1.89)
1.14(0.78
to1.69)
0.97(0.71
to1.32)
0.64(0.48
to0.84)
1(0.8
to
1.25)
0.98(0.63
to1.53)
6.80+
439
1.37(0.92
to2.04)
0.83(0.63
to1.08)
0.36(0.21
to0.6)
0.85(0.61
to1.2)
4.92(3.4
to
7.11)
0.51(0.37
to0.7)
1.4
(1to
1.96)
1.23(0.97
to1.57)
0.46(0.25
to0.83)
Gender
Fem
ale
723
1.27(0.88
to1.83)
1.14(0.9
to
1.43)
0.75(0.53
to1.06)
0.93(0.7
to
1.24)
2.64(1.83
to3.81)
0.62(0.47
to0.82)
0.88(0.67
to1.15)
1.16(0.94
to1.42)
1.04(0.7
to
1.56)
Male
1133
0.79(0.55
to1.13)
0.88(0.7
to
1.11)
1.34(0.94
to1.9)
1.07(0.81
to1.43)
0.38(0.26
to0.55)
1.6
(1.21to
2.11)
1.14(0.87
to1.49)
0.86(0.7
to
1.06)
0.96(0.64
to1.43)
Alcohol
High
(>2&)
389
0.36(0.2
to
0.67)
2.03(1.54
to2.69)
2.73(1.91
to3.88)
1.46(1.06
to2.02)
0.1
(0.04to
0.28)
2.85(2.04
to3.98)
0.74(0.55
to1.01)
1.08(0.85
to1.38)
1.86(1.21
to2.85)
Low
(0.1&
to2&)
309
1.45(0.92
to2.28)
0.58(0.42
to0.81)
1.11(0.71
to1.73)
0.78(0.52
to1.17)
0.35(0.18
to0.7)
1.8
(1.25to
2.58)
1.43(0.96
to2.12)
0.92(0.7
to
1.21)
1.94(1.23
to3.06)
None
(<0.1&)
622
1.52(1.05
to2.18)
0.82(0.65
to1.05)
0.46(0.31
to0.68)
1.03(0.77
to1.38)
0.93(0.64
to1.34)
0.64(0.49
to0.85)
0.93(0.7
to
1.22)
0.98(0.79
to1.21)
0.57(0.36
to0.9)
2446 Fire Technology 2021

Table
2co
ntinued
Variable
Category
NOddsratiofor
Electrical
system
Safe
cigarettes
FR
Sofa/
arm
chair
FR
bed-
ding
FR
clothes
Smoke
alarm
Thermal
sprinkler
Detector
sprinkler
Stove
guard
Municipality
(class
1)
1Municipalities
with
highincome,
higheducation
141
2.41(1.43
to4.09)
0.65(0.41
to1.03)
0.62(0.3
to1.31)
0.59(0.32
to1.1)
0.82(0.41
to1.67)
1.02(0.61
to1.71)
1.47(0.82
to2.62)
1.06(0.72
to1.55)
0.73(0.31
to1.7)
2Traditionalmiddle
class
municipalities
800
0.79(0.55
to1.13)
1.73(1.38
to2.18)
1.14(0.82
to1.59)
1.52(1.15
to2.01)
1.25(0.87
to1.78)
0.69(0.53
to0.9)
0.79(0.6
to1.03)
1.49(1.22
to1.83)
0.96(0.64
to1.42)
3Municipalities
with
tourism
-related
economy
321
0.73(0.43
to1.27)
0.82(0.6
to1.12)
1.13(0.73
to1.76)
0.87(0.58
to1.29)
0.75(0.44
to1.28)
1.21(0.83
to1.77)
0.84(0.59
to1.19)
0.89(0.67
to1.17)
1.35(0.82
to2.23)
4Municipalities
with
traditionalindustries
340
1.27(0.8
to2)
0.62(0.45
to0.84)
0.69(0.42
to1.12)
0.65(0.43
to0.99)
1.14(0.72
to1.81)
0.97(0.69
to1.38)
1.27(0.88
to1.84)
0.75(0.58
to0.98)
1.06(0.63
to1.77)
5Smallmunicipalities
withlow
income,
low
education
and
negativepopulation
growth
254
0.79(0.42
to1.46)
0.88(0.61
to1.25)
1.27(0.78
to2.07)
1(0.65to
1.55)
0.75(0.4
to1.4)
1.85(1.24
to2.76)
1.3
(0.85
to1.99)
0.67(0.5
to0.91)
0.81(0.42
to1.54)
Municipality
1Metropolitanmunici-
palities
278
1.08(0.68
to1.72)
1.78(1.32
to2.41)
0.79(0.49
to1.27)
1.74(1.24
to2.44)
1.27(0.82
to1.98)
0.62(0.42
to0.91)
0.68(0.49
to0.94)
1.63(1.23
to2.17)
0.84(0.48
to1.48)
The Influence of Sociodemographic Factors on the Theoretical Effectiveness 2447

Table
2co
ntinued
Variable
Category
NOddsratiofor
Electrical
system
Safe
cigar-
ettes
FR
Sofa/
arm
chair
FR
bed-
ding
FR
clothes
Smoke
alarm
Thermal
sprinkler
Detector
sprinkler
Stove
guard
(class
2)
2Suburban
municipalities
225
1.43(0.88
to2.33)
0.92(0.65
to1.31)
0.92(0.56
to1.53)
1.05(0.7
to1.59)
0.57(0.3
to1.08)
0.76(0.5
to1.16)
0.92(0.62
to1.37)
1.13(0.83
to1.53)
0.71(0.36
to1.38)
3Largecities
440
0.81(0.52
to1.26)
1.35(1.04
to1.75)
1.43(0.99
to2.06)
0.88(0.63
to1.23)
1.31(0.88
to1.94)
1.01(0.74
to1.36)
1.09(0.8
to1.5)
1.2
(0.94
to1.52)
0.92(0.57
to1.47)
4Suburban
municipalities
tolargecities
67
1.13(0.44
to2.92)
0.56(0.29
to1.09)
0.88(0.34
to2.26)
0.93(0.43
to2.01)
1.08(0.42
to2.79)
1.29(0.64
to2.59)
1.02(0.49
to2.12)
0.86(0.5
to1.48)
1.44(0.56
to3.7)
5Commuter
municipalities
147
1.15(0.58
to2.28)
0.64(0.41
to1.00)
0.41(0.17
to1.04)
0.96(0.55
to1.68)
0.5
(0.2
to
1.24)
1.16(0.69
to1.96)
1.34(0.76
to2.35)
0.62(0.42
to0.91)
2.65(1.49
to4.7)
6Tourism
and
travel
industry
municipalities
94
0.64(0.23
to1.81)
1.03(0.6
to1.76)
1.32(0.64
to2.73)
0.68(0.32
to1.45)
0.79(0.31
to2.02)
2.15(1.11
to4.18)
0.82(0.46
to1.47)
0.89(0.56
to1.42)
1.03(0.41
to2.62)
Statisticallysignificantresults(FDR<
10%)ismarked
inbold
‘‘None’’/’’All’’indicate
thatthemeasure
waseff
ectivefornoneorallcasesin
thatcategory
2448 Fire Technology 2021

References
1. Haagsma JA, Graetz N, Bolliger I, Naghavi M, Higashi H, Mullany EC et al (2016)
The global burden of injury: incidence, mortality, disability-adjusted life years and timetrends from the global burden of disease study 2013. Inj Prev 22(1):3–18
2. Murray CJ, Vos T, Lozano R, Naghavi M, Flaxman AD, Michaud C et al (2012) Dis-
ability-adjusted life years (DALYs) for 291 diseases and injuries in 21 regions, 1990–2010: a systematic analysis for the global burden of disease study 2010. Lancet380(9859):2197–2223
3. Nilson F, Bonander C (2020) Societal protection and population vulnerability are
equally important in explaining local variations in fire mortality among older adults inSweden. Fire Technol 57:247–260
4. Jonsson A, Runefors M, Sardqvist S, Nilson F (2016) Fire-related mortality in Sweden:
temporal trends 1952 to 2013. Fire Technol 52(6):1697–17075. Runefors M, Johansson N, Van Hees P (2016) How could the fire fatalities have been
prevented? An analysis of 144 cases during 2011–2014 in Sweden: an analysis. J Fire
Sci 34(6):515–5276. Marshall SW, Runyan CW, Bangdiwala SI, Linzer MA, Sacks JJ, Butts JD (1998)
Fatal residential fires: Who dies and who survives?. JAMA 279(20):1633–16377. Ta VM, Frattaroli S, Bergen G, Gielen AC (2006) Evaluated community fire safety
interventions in the United States: a review of current literature. J Community Health31(3):176
8. Kendrick D, Young B, Mason-Jones AJ, Ilyas N, Achana FA, Cooper NJ et al (2013)
Home safety education and provision of safety equipment for injury prevention. EvidBased Child Health Cochrane Rev J 8(3):761–939
9. Warda L, Tenenbein M, Moffatt ME (1999) House fire injury prevention update. Part
II. A review of the effectiveness of preventive interventions. Inj Prev 5(3):217–22510. Lu S, Li G, Mei P, Zhang H (2016) Suppressive effects of fire prevention campaign in
China: a time series analysis. Saf Sci 86:69–7711. Hygge S (1989) Smoke detectors in apartments and one-family houses: a comparison
between the maintenance, care and performance of free and purchased smoke detectors.Fire Saf J 15(3):195–210
12. Bonander C, Jakobsson N, Nilson F (2017) Are fire safe cigarettes actually fire safe?
Evidence from changes in US state laws. Inj Prev 24:193–19813. Shaw SD, Blum A, Weber R, Kannan K, Rich D, Lucas D et al (2010) Halogenated
flame retardants: Do the fire safety benefits justify the risks?. Rev Environ Health
25(4):26114. Jonsson A, Jaldell H (2019) Identifying sociodemographic risk factors associated with
residential fire fatalities: a matched case control study. Inj Prev 26:147–15215. Warda L, Tenenbein M, Moffatt ME (1999) House fire injury prevention update. Part
I. A review of risk factors for fatal and non-fatal house fire injury. Inj Prev J Int SocChild Adolesc Inj Prev 5(2):145–150
16. Turner SL, Johnson RD, Weightman AL, Rodgers SE, Arthur G, Bailey R et al (2017)
Risk factors associated with unintentional house fire incidents, injuries and deaths inhigh-income countries: a systematic review. Inj Prev 23:131–137
17. Runefors M, Johansson N, van Hees P (2017) The effectiveness of specific fire preven-
tion measures for different population groups. Fire Saf J 91:1044–105018. Nilson F, Bonander C, Jonsson A (2015) Differences in determinants amongst individu-
als reporting residential fires in Sweden: results from a cross-sectional study. Fire Tech-nol 51(3):615–626
The Influence of Sociodemographic Factors on the Theoretical Effectiveness 2449

19. Jonsson A, Bergqvist A, Andersson R (2015) Assessing the number of fire fatalities in adefined population. J Saf Res 55:99–103
20. Ludvigsson JF, Otterblad-Olausson P, Pettersson BU, Ekbom A (2009) The Swedish
personal identity number: possibilities and pitfalls in healthcare and medical research.Eur J Epidemiol 24(11):659–667. https://doi.org/10.1007/s10654-009-9350-y
21. Mcintyre C (2014) Insatsstatistik 2013—beskrivning av statistiken [‘‘Incident statis-tics—description of the statistics’’; in Swedish]. Swedish Civil Contingencies Agency
(MSB), Karlstad22. Sheskin DJ (2020) Handbook of parametric and nonparametric statistical procedures.
CRC Press, Boca Raton
23. Benjamini Y, Hochberg Y (1995) Controlling the false discovery rate: a practical andpowerful approach to multiple testing. J R Stat Soc Ser B (Methodol) 57(1):289–300
24. McDonald JH (2009) Handbook of biological statistics. Sparky House Publishing, Bal-
timore25. Statistics S (2009) Living conditions in Sweden. http://www.ssd.scb.se/databaser/26. DCLG (2007) Final research report BD 2546 Sprinkler effectiveness in care homes.
London, UK
27. Jonsson A, Bonander C, Nilson F, Huss F (2017) The state of the residential fire fatal-ity problem in Sweden: epidemiology, risk factors, and event typologies. J Saf Res62:89–100. https://doi.org/10.1016/j.jsr.2017.06.008
28. Nygard L, Starkhammar S, Lilja M (2008) The provision of stove timers to individualswith cognitive impairment. Scand J Occup Ther 15(1):4–12
29. Ahrens M (2019) Home cooking fires. National Fire Protection Association, Quincy
30. Holborn PG, Nolan PF, Golt J (2003) An analysis of fatal unintentional dwelling firesinvestigated by London Fire Brigade between 1996 and 2000. Fire Saf J 38(1):1–42
31. Belin M-A, Tillgren P, Vedung E (2012) Vision zero–a road safety policy innovation.Int J Inj Control Saf Promot 19(2):171–179
32. Bruck D (2001) The who, what, where and why of waking to fire alarms: a review. FireSaf J 36(7):623–639
2450 Fire Technology 2021