workshop on the law and economics of intellectual property ... · is software piracy a middle ......
TRANSCRIPT
Università Carlo Cattaneo Castellanza, LIUC
Paper presented at
Workshop on the Law and Economics of Intellectual Property and Information Technology
July 22-23, 2005
Scientific Board
Eric Brousseau, Université de Paris X Nanterre Bruno Deffains, Université de Nancy Shubha Ghosh, SUNY at Buffalo
Sophie Harnay, Université de Reims Champagne Ardenne Rodolfo Helg, Università Carlo Cattaneo, LIUC Dennis Khong, University of Strathclyde
Alain Marciano, Université de Reims Champagne Ardenne Antonio Nicita, Università di Siena Donatella Porrini, Università di Lecce Ugo Pagano, Università di Siena
Giovanni B. Ramello, Università Carlo Cattaneo, LIUC (local organizer) FM Scherer, Harvard University and Haverford College
Francesco Silva, Università di Milano Bicocca
Details and Other Papers downloadable at http://www.liuc.it/ricerca/istitutoeconomia/laweconomicsjuly2005/program.asp
Is Software Piracy a Middle Class Crime?
Justina A.V. Fischer* Antonio Rodríguez Andres Department of Economic Department of Economics
University of St. Gallen University of Southern Denmark Bodanstrasse 8, 9000 St. Gallen Campusvej 55, 5230 Odense
DRAFT
Version: 27. April 2005
Abstract
This paper analyses the relationship between income distribution and software piracy rates. The empirical
analysis is carried out for a sample of 71 countries in a cross-country context. Income inequality is measured by
the Gini coefficient and quintile shares. The analysis remedies previous econometric studies by controlling for a
wide range of potential factors that may influence national piracy rates and employing an instrumental variables
approach. Results indicate that income inequality is negatively associated with piracy rates, but that the impact
of various income classes on piracy rates might depend on the region or national wealth of a country. Moreover,
the model predicts an inverted U relationship between piracy and per capita income. Individualism is inversely
related to software piracy. In addition, the results seem to be robust to a number of alternative specifications
often employed in predicting piracy rates and property crimes..
Keywords: Intellectual Property rights, software piracy, income inequality, crime. JEL Classification:
* Correspondence to: Justina A.V. Fischer, University of St. Gallen, SIAW, Room 23, Bodanstrasse 8, CH-9000 St.Gallen, Switzerland. Email: [email protected]
2
1. Introduction Piracy is equivalent to the theft of a good. Piracy can take several forms, depending of the type of information
good, and access (Watt, 2001). According to the International Planning and Research Corporation (IPRC, 2003),
the world piracy rate for PC business applications was 39% in 2002 that translated into a $13.1 billion loss in
revenue dollars. The emergence of digital technologies poses a new threat for business software publishers
because these technologies provide the opportunity to violate intellectual property law at a wide scale than ever
before (Gallegos, 1999; Gopal and Sanders, 2000; Moorehouse, 2001). Therefore, a better understanding of
pirate behaviors may be crucial to curb the software piracy problem.
Most economic studies on the causes of piracy have primarily focused on the role of factors such as economic
development, legal framework, institutions, culture, intellectual property rights protection, giving little attention
to the role of income inequality (Marron and Steel, 2000; Husted, 2000; Shadlen, Schrank, and Kurtz, 2005;
Van Kranenburg and Hogenbirk, 2005; Rodríguez, 2005b). In general, the findings of these papers support the
notion that economic and legal factors influence significantly piracy rates. Nevertheless, the empirical literature
on the impact of income inequality on piracy is scant. Only a few studies deal with the effects of income
distribution on piracy. This formal literature relies on cross-sectional estimation methods, and studies vary
significantly in terms of the countries included, the period of analysis, the measure of income distribution (GINI
coefficient, or the income of the top 10 percent), the set of explanatory variables included in the models. To
date, only a few studies included income inequality as explanatory for piracy and tested its significance through
Ordinary Least Squares (OLS) regressions (Husted, 2000; Rodriguez, 2005a). Husted (2000) shows that income
inequality, measured by the percentage, does have a negative effect on piracy after controlling for variables such
as economic development, and cultural characteristics. However, there are certainly a number of omitted
relevant variables. If these variables are correlated with some of the other explanatory variables, the parameter
estimates will be biased and inconsistent. However, when studying the relationship between inequality and
software piracy, it is not clear which part of the income distribution matters. Furthermore, the possible
mechanisms through inequality may impact software piracy rates are not really convincing, and need an
elaborate explanation. Both Husted (2000) and Rodríguez (2005a) do not instrument the income inequality
measure.
The contribution of this paper is two fold: one hand it attempts to assess the impact of income distribution in a
cross country context. For that purpose, we consider several measures of income inequality in trying to evaluate
which part of the income distribution matters most in determining software piracy rates. This paper also tries to
shed light on the possible theorethical arguments why inequality may influence piracy. Methodologically, the
paper explicitly addresses the possibility of measurement error of income inequality by using an instrumental
3
variables estimation approach. Finally, we also test the importance of other factors suggested by the economics
literature of crime that have been often neglected in empirical studies of piracy.
We find significant effect of inequality measures on piracy. In fact, the 2SLS estimates of the coefficients for
inequality measures are higher than the OLS estimates. This might suggest that attenuation bias due to
measurement error was presence in previous studies. Moreover, the magnitude of the effect of income inequality
measures is greater than that of per capita income. Our findings also corroborate previous recent empirical
research which shows that per capita income was associated with lower levels of piracy. Furthermore, an
inverted U shaped relationship between piracy and income is found. We also find that higher levels of
individualism are associated with lower levels of piracy.
In the next section, we present the theoretical arguments why inequality may impact piracy rates. We describe
the data and the econometric model used in the empirical analysis in Section 3. Empirical findings and
robustness tests are presented in Section 4. We conclude with some guidelines for future work on piracy.
2. Inequality and Piracy Even though several empirical studies have attempted to assess the effect of income inequality on software
piracy rates across countries, in general, the mechanisms through which inequality may impact piracy rates are
not well understood. In fact, the economic rationale for this relationship is derived from previous studies. Based
on this research, it is assumed that inequality has an inverse relationship with piracy rates. One of the arguments
is that the more income equality (the larger the middle class) the greater the share of illegal copying (Husted,
2000: Rodriguez, 2005a). However, there are some obvious questions left to the reader, how is defined the
middle class or why the middle class is expected to be more prone to piracy than others. Even if the size of
middle class is the correct, which is the most proper proxy variable (the Gini coefficient, the income of the top
percent, or other distribution measures). These questions still remain unanswered. In what follows, we develop
the arguments why inequality may influence piracy rates.
The first argument stems from the economic theory of crime (Becker, 1968). Individuals choose whether or not
to engage in illegal activities by comparing the returns from these activities to the returns from working legally.
The expected returns from illegal activities could be proxied by the mean income. The cost of committing crime
however increases with the potential legal income of the criminal through the opportunity cost of time. In
societies with high inequality, the gap between the mean income and the income will be large, being those at the
bottom part of the income distribution more prone to commit crime. Prior empirical literature is shown to be

4
consistent with this argument (Ehrlich, 1973; Gould et al., 2002; Machin and Meghir, 2000).1 An increase in
inequality could lead to what is called an envy effect, reducing the individual’s moral threshold, and therefore
exercing a positive impact on crime (Fajnzylber et al., 2002). Based on this argument, we should see a direct
relationship between inequality and piracy.
Another argument is that equal income distributions in many countries are the result of redistribution policies
that represent fairness opinions among its citizens. These policies are partially based on the principle that the
state is given the right to make a claim on a part of the citizens’ earnings and property rights. The decision to
pirate may be perceived as a redistribution problem from the rich to the poor by a violation of the intellectual
property rights law of the latter. It is plausible that in countries where citizens embrace the principles of
redistribution are more prone to find it morally acceptable to pirate legal software for redistributive purposes. In
addition, ilegall copying might be based on interpersonal trust. If someone copys or share software from other,
one must trust that the software does not contain viruses. The spread of illegal copying might be also based on
trust. If you give somebody an illegal copy, you must trust that this person will not report you. As Zak and
Knack (2001) argue, equality generates personal trust. Thus, higher levels of trust are expected in more equal
societies.
3. Data and Model Specification In this paper, we intend to examine whether economic inequality help to explain national piracy rates across
countries up to 84 countries. The studies that have investigated the link between inequality and piracy have used
small samples. For instance, Husted (2000) includes only a sample of 30 countries. In this paper, our initial
sample consists of a total of 71 countries from Europe, Africa, Asia and Latin America. European sample
include countries, Africa 10 countries, Asia 5 countries, and Latin America 9 countries. Countries with any
missing information were excluded from the empirical analysis. Since we are combining a number of datasets,
we have different numbers of observations for different variables, with some regressions covering as few as 42
countries. The list of countries included in the study is provided in Appendix.
(a) Dependent variable
To study the effect of inequality on piracy rates, we specify a reduced form regression equation, using piracy
rate as dependent variable. Admittedly, figures on piracy are likely to be underestimated because a large number
of software applications are sold without the computer hardware (Traphagan and Griffith, 1998; Husted, 2000;
Van Kranenburg and Hogenbirk, 2005). Nonetheless, this data source is the most reliable for cross-country
1 For reviews of the literature on crime and inequality, see Bourguignon (2001), Eide (1999), and Freeman (1999).
5
comparisons and is commonly employed in the empirical research (e.g. Husted, 2000; Marron and Steel, 2000;
Van Kranenburg and Hogenbirk, 2005).
(b) Explanatory variables
As regards the independent variables, because illegal copying may respond to differences in national income,
the natural log of per capita GNP (LGNP) for 1995 is included as control variable to capture the level of
economic development in any particular country. The rationale for this inclusion is as follows: Ginarte and Park
(1997), Rapp and Rozek (1990), and Maskus and Penubarti (1995) all find that countries with high income have
stronger patent protection. In contrast, intellectual property protection in less developed countries tends to be
“shorter, less comprehensive, and much less vigorously enforced” (Richardson and Gaisford, 1996, p. s376). In
their recent article, Shadlen, Schrank, and Kurtz (2005) note a relationship between income and intellectual
property protection which may be thought of in terms of the demand and supply of intellectual property
protection. On the demand side, as nations becomes wealthier, local producers devote more resources to
innovative activities and are more likely to demand that national governments increase IPR protection. On the
supply side, the degree of software protection may also depend on financial capacity: countries with a higher
level of GDP per capita are able to provide stronger protection simply because they can afford to (Varian, 1998;
Ostergard, 2000). Protection provision involves large fixed costs – for example, judicial courts and policing;
therefore, countries with large financial resources are more likely than nations with fewer resources to provide it
(Varian, 1998; Kanwar, 2002). For all these reasons, a negative correlation between GNP and piracy can be
expected. Indeed, previous empirical research corroborates the negative impact of income on piracy (e.g., Gopal
and Sanders, 1998; Gopal and Sanders, 2000; Holm, 2003; Shin, Gopal, Sanders and Whinston, 2004; Husted,
2000, Marron and Steel, 2000; Ronkainen and Guerrero-Cusumano, 2001, among others). In addition, the
relationship between the rate of piracy and GNP per capita may well be non-linear, with piracy first increasing
then later declining as the level of per capita income increases. To shed some light on this issue, the square term
of the log of the real GNP per capita (LGNP2) is included in the regression model based on the expectation that
the coefficient on income term will be positive while its quadratic term will be negative.
Cultural norms may influence the formation of individual behaviors. Individualism and collectivism are two of
the most important cultural dimensions emerging in many cultural studies. As Gopal and Sanders (1997) point
out, piracy is a group activity. One of the most is the distribution among friends, co-workers, It is therefore
hypothesized that cultural values may have an impact on national piracy rates. More individualistic societies
tend to experience less software piracy. Research evidence does show a negative significant effect of
individualism on piracy (e.g. Husted, 2000; Marron and Steel, 2000; Shin, Gopal, Sanders, and Whinston,
2004). Thus, in this empirical analysis, an index of individualism (IDV) is used to test whether cultural values

6
do matter when explaining cross-national variations in piracy rates. Hostfede’s cultural variables have been
employed in several piracy studies (Husted, 2000; Shin, Gopal, Sanders, and Whinston, 2004).
Economic inequality may also play an important role in our understanding of why national piracy rates differ
across countries. To date, as mentioned above, only a few studies have included inequality as covariate. In
contrast to the previous contributions, we employ and test several measures of income variables: three measures
of income shares, and a measure for the overall income distribution. The lowest income share is expected
neither to be an important determinant of piracy nor even exert a crime dampening impact because people with a
low income might not even be able to afford a computer. For this reason, the first income share neither
influences the demand nor the supply side of this crime. Following Husted (2000), we would expect the middle
income to influence piracy rates in a positive way because these are the people who can afford a PC, but not the
legal acquisition of all the software they want and need; thus, this income group constitutes the demand side
(and potentially) the supply side of piracy. The highest income share is expected to have a piracy dampening
impact because the potential opportunity (reputational) costs exceed the gain from having saved a few hundred
dollars on buying a legal copy. Based on these hypotheses on the various income shares, it is logical that we
expect a higher Gini coefficient to have a crime dampening influence: as the share of the higher income rises
beyond its “natural” income share, economic inequality within society rises.
The three variables just discussed constitute the baseline model of piracy. We now turn to discuss other two key
explanatory variables introduced to check the robustness of the baseline model. These variables are a measure of
the degree of intellectual property rights, and institutional quality. Legal tendencies towards or against protected
intellectual property rights (IPRs) may have an impact on piracy. An index of IPRs protection is included as a
representation of the strength of different national IPRs regimes. The index of IPRs, or patent protection
(PRIGHT), is based on the current national patent laws. The overall index ranges from zero to five with higher
values representing stronger patent rights protection.2 The risk of endogeneity bias stemming from a reverse
causality between software piracy and legal protection of intellectual property rights needs to be discussed.
Laws may impact piracy but so do many other factors such as technological progress and copying ability. High
piracy may indicate economic dependency of pirated copies of software: in which case, policy authority might
not strengthen the laws. On the other hand, a high share of illegal software may affect private business or firms,
who may then lobby for stronger laws. It is also reasonable to expect that the degree of endogeneity may not be
severe if one argues that policy makers’ response to changes in piracy may not be instantaneous. Nevertheless,
this variable might also be subject to measurement error. It is very likely that there are gaps between the
2 This measure is obtained as the unweighted sum of five different categories of patent laws. The five categories are: (i) extent of coverage, (ii) provisions for loss of protection, (iii) membership in international patent treaties, (iv) enforcement mechanism, and (v) duration of protection. Each category is coded between zero and one.

7
measure and actual protection. Nevertheless, this may not be so important, as it seems that countries with strong
statutory laws tend to be the ones that currently carry out the laws (Park, 2001). We expect that this variable will
have a negative effect on piracy. The literature on piracy has also emphasized the role of institutional quality on
this relationship. To shed some light on this issue, a measure of institutional quality, the rule of law (LAW), is
included in the regression model. In two recent articles, Holm (2003) and Rodríguez (2005a) note a strong
relationship between institutional quality proxied by the rule of law and software piracy.
Integration of the all above ideas yields the following cross-section regression
i
k
iiiiiiii ZLAWPRIGHTINEQIDVGNPGNPPR εββββββββ ++++++++= ∑*
6543
2
210 ))(ln()ln( (1)
where PR is the natural logarithm of the piracy rate in country i, ln(GNP) is the natural logarithm of the GNP
per capita, IDV is the individualism index, INEQ represents our different measures of income inequality,
PRIGHT is an index of patent protection, and LAW is a measure of institutional quality. The vector Zi includes a
set of k additional explanatory variables that are likely to influence piracy rates. The β are unknown parameters
to be estimated and iε is the usual random error term. The focus of this paper is on equation (1), which will be
estimated by using ordinary least squares (OLS) and two stage least squares (2SLS). The instrumental variables
approach account by the fact that inequality could be measured with error. Not only because threre is a cross-
national variation in income used (household, personal disposable, work income) but also because data
representativeness is not of an equal quality across countries. Numerous candidates for instruments were
identified and examined. They included geographical variables, cultural variables, and other variables possible
correlated with the economic inequality but uncorrelated with the dependent variable (the rate of piracy).3 We
utilize the following two: average life expectancy at birth (source: World Bank), and average birth rate per
1,000 people (source: World Bank) for 1970-95 to instrument income inequality (GINI). The notion behind is
that a missing social security system and high degrees of inequality induces to increase the number of children
to compensate an insecure income stream. On the other hand, a high degree of income inequality might cause a
bad health care and thus decrease life expectancy for most of the residents in one particular country. An
instrument is something that has some desirable statistical properties. To test the validity of our instruments we
first test that the instruments explain enough variation in income inequality. As additional check on instrument
validity, is whether the instruments are exogenous in all piracy equations. A Sargan’s statistic test indicates that
the null hypothesis of no overidentification cannot be rejected. We report p-values for the overidentification
tests, partial R2 and F-tests in the first stage regression for all 2SLS regressions.
3 Another potential problem with using as dependent variable the piracy rate is the possibility of measurement bias from using the estimated piracy rate instead of the actual piracy rate. This measurement error in the dependent variable is not usually a problem since it gets moved into the classical error term.

8
Since the Breusch-Pagan test for heteroscedasticity is rejected, no adjustment of the standard errors appears to
be necessary.4 The model functional form was checked with a Ramsey test (1969). We also assume that all
explanatory variables are strictly exogenous. In addition, in cross-sectional analysis, it is very likely that the
regression results may be sensitive to the presence of influential observations or outliers (Kennedy, 2001). We
make extensive use of several regression diagnostics such as Studentized residuals, and Cook’s D to test the
presence of influential cases. When our regression diagnostics suggest the presence of highly influential cases,
we rerun the analysis dropping those cases. If the pattern of the results is substantially changed, we present our
results removing these cases.
The empirical analysis is carried out in several steps: the first step is to run a simple regression model on the
level of economic development, individualism, and income inequality measures. The second step examines the
core specification for sub-regions. The third step splits the countries according to their income level. The fourth
step integrates the level of IPRs legal protection and institutional quality as additional predictors. The final step
controls for a number of other variables that are likely to be linked to piracy. The next subsection discusses the
data to be used to test these specifications.
3.2 DATA
3.2.1 Primary variables
Data on the variables used in the empirical analysis come from diverse sources. Data for the dependent variable,
the average piracy rate for 1994-2002, are obtained from the International Planning and Research Corporation
(IPRC) annual report for the year 2003 (IPRC, 2003). Piracy rates are available for more than 70 countries for
1994-2002. We have only considered observations from individual countries for which we had piracy rates.
Thus, we net out the merged observations from Belgium and Luxembourg. Piracy rate is defined as the
difference between software programs installed and software applications legally licensed. The variable is
reported as percentages, ranging from 0 percent (no piracy) to 100 percent (all software installed is pirated). As
shown in Table A.1 (Appendix), piracy rates vary a lot across countries. In some countries, like in Russia and
Vietnam, almost all software is pirated, while in other countries like Denmark, Norway, the proportion of illegal
software was below 25%. For subgroup of countries, the highest piracy rate was found in Eastern Europe,
followed by Middle East and Latin America. The lowest piracy rate is found in North America (USA and
Canada).
4 For some subsamples, the hypothesis of constant variance is rejected. In such cases, Huber/White Sandwich variance estimator is applied.

9
As measure of income inequality, we use Gini coefficients5 (GINI) and quintile shares (Q1-Q5) based on the
income distribution data gathered by Dollar and Kraay (2002). They compiled the data from four sources: the
United Nations-WIDER Income Inequality Database, Deininger and Squire (1997), Chen and Ravallion (1997),
and Lundberg and Squire (2000). Their dataset includes observations covering 137 countries for the period
1960-1999. We use average values of the GINI coefficient and quintile shares as measures of economic
inequality for the period of 1960-1999 for countries with at least one observations for that period. In our sample,
the Gini coefficient is highly correlated with the highest quintile share (Q5), and the second quintile share (Q2)
compared to other quintiles shares (see Table A.5, Appendix). Income inequality measures are not expected to
change a lot within countries over time. Much of the variation in income inequality measures might be due to
measurement error rather than reflecting a real change.
In addition to economic inequality, we also include other explanatory variables that might be correlated with
piracy. Data on GNP per capita for 1970-95 are extracted from World Development Indicators (WDI);
calculated by La Porta et al. (1999). The cultural dimension, the individualism index (INDIV)6, was derived
from an initial survey of over 72,000 IBM employees over the period of 1967-1973 in 40 countries (Hofstede,
1997; Hofstede, 2001). Two round of survey questionnaires were administered to 88,000 IBM employees in
1967 and 1973. Subsequently, Hofstede constructed estimates for additional countries. It assigns to a country a
value between 0 and 100. A higher value corresponds to a higher level of individualism in any particular
society. The data on this cultural attribute were missing largely for only a very few number of cases, and thus
we use the average of the individualism score achieved in the bordering countries. Individualism is measured
around 1970.
3.2.2. Other variables
The variables used in the robustness analysis are all from the World Bank World Development Indicators, with
the exception of the proxy variable for the degree of institutional quality, the rule of law (LAW) that comes from
Kauffman, Kraay and Mastruzzi (2003).7 This index ranges from -2.5 to 2.5, where higher values represent a
country with higher institutional quality. We also use the intellectual property rights or patent index (PRIGHT)
for 1995 from Ginarte and Park (1997), as a proxy for degree of protection of intellectual property rights.
Additional controls are included and discussed in the robustness analysis.
Descriptive statistics for all variables included in the analysis are provided in the Appendix. Pearson correlation
coefficients were computed for the main variables employed in this study. Results indicate that multicollinearity
5 The Gini index ranges from zero (perfect equality) to one (perfect inequality). 6 Individualism relates to the tendency of individuals to look after themselves and their immediate family. 7 The data are available at www.worldbank.org/wbi/governance/govdata2002.

10
does not appear to be a problem (see Table A.5 in Appendix). Definitions and sources for all variables used in
the paper are provided in Table A.3 in the Appendix.
4. Results
4.1 Baseline model All regression models have been tested with the Ramsey-specification test before instrumentation and the
Breusch-Pagan test of heteroscedasticity and, where necessary, a correction of the standard errors was carried
out. The hypothesis of normality of residuals cannot be rejected according to the Bera Jarque test statistics for
all specifications (results not reported).

Table 1: Empirical results: OLS and 2SLS estimates. Full sample. Dependent variable: Log of Piracy rate (94-02)
(1) OLS (2)
2SLS (3) OLS (4) 2SLS (5) OLS (6) 2SLS (7) OLS (8) 2SLS (9) OLS (10) 2SLS (11) OLS (12) 2SLS (13) OLS (14) 2SLS
LGNP 0.254* 0.261 0.288* 0.301(*) 0.289* 0.320(*) 0.268* 0.353(*) 0.291* 0.320(*) 0.285* 0.303* 0.273* 0.286*
(1.87) (1.56) (2.02) (1.78) (2.01) (1.84) (1.81) (1.81) (2.01) (1.85) (2.01) (1.78) (1.96) (1.69)
LGNP2 -0.025** -0.026* -0.028*** -0.029* -0.028*** -0.031** -0.027*** -0.034* -0.029*** -0.031** -0.028*** -0.029* -0.027*** -0.028*
(2.85) (2.36) (3.01) (2.63) (3.00) (2.69) (2.75) (2.62) (3.00) (2.71) (3.00) (2.63) (2.95) (2.54)
INDIV -
0.006*** -0.006** -0.006*** -0.006** -0.006*** -0.006** -0.005*** -0.006** -0.006*** -0.006** -0.006*** -0.006** -0.006*** -0.006**
(4.81) (5.24) (4.86) (5.33) (4.79) (5.27) (4.45) (4.81) (4.79) (5.30) (4.83) (5.32) (4.84) (5.28)
Q1 2.287** 2.445*
(2.68) (2.24)
Q2 2.191*** 2.439*
(3.13) (2.39)
Q3 2.160*** 3.017*
(2.93) (2.42)
Q4
1.975 5.772*
(1.64) (2.28)
Q2-Q4
0.835*** 1.124*
(2.99) (2.45)
Q5
-0.656*** -0.782*
(3.10) (2.42)
GINI
-0.005*** -0.006*
(2.90) (2.35)
Constant 3.787*** 3.747** 3.612*** 3.539** 3.528*** 3.309** 3.492*** 2.468* 3.452*** 3.232** 4.164*** 4.166** 4.112*** 4.101**
(7.17) (5.75) (6.47) (5.30) (6.15) (4.65) (5.32) (2.50) (5.87) (4.48) (8.16) (6.45) (8.19) (6.36)
# observations
68 67 68 67 68 67 68 67 68 67 68 67 68 67
Adj. R2 0.8147 0.8278 0.816 0.8293 0.8114 0.8222 0.7999 0.7828 0.8122 0.8236 0.8144 0.8272 0.8139 0.8269
F(income vars only)
40.59 (0.000)
26.75 (0.000)
46.48 (0.000)
30.60 (0.000)
47.87 (0.000)
29.97 (0.000)
36.19 (0.000)
22.57 (0.000)
47.00 (0.000)
30.26 (0.000)
46.61 (0.000)
30.59 (0.000)
46.86 (0.000)
30.15 (0.000)
Partial R2 (1 st)
0.5602 0.5606 0.4613 0.2569 0.486 0.5365 0.5606
F (1st) (p-value)
38.85 (0.000)
38.92 (0.000)
26.12 (0.000)
10.55 (0.000)
28.88 (0.000)
35.31 (0.000)
38.91 (0.000)
Sargan over-id test chi2
1.71
(0.191)
0.992 (0.319)
0.552
(0.457)
0.021 (0.885)
0.459
(0.498)
0.760 (0.383)
1.120
(0.290)
Notes: Absolute value of robust t-statistics in parentheses. ***, **, and *, indicate statistical significance at the 1%, 5% and 10% levels, respectively. Lebanon, Russia, and Ukraine are removed from the analysis because of influential cases. Results are robust to outliers and influential observations. In 2SLS, income inequality measures are instrumented, and instruments are the average life expectancy and birth rate for 1970-95. A Pagan Hall test does not reject homoscedastic errors in the IV regressions.

Table 1 displays the results obtained when estimating by OLS and 2SLS the baseline model using all countries
in the sample. Columns (1), (3), (5), (7), (9), (11), and (13) give OLS estimates of the core specification,
equation (1). The control variables reveal the expected sign and are highly significant with few exceptions.
Together with the constant term, the set of explanatory variables explanatory explains around 80% variation in
piracy rates, indicating a good fit of our models. The results show that the level of economic development is
negatively linked to piracy and statistically significant in all regression models. This is consistent with the
results in Marron and Steel (2000), Depken and Simmons (2004), Rodriguez (2005a, 2005b). As conjectured, a
non-linear relation between income per capita and piracy appears to be present. The explanatory power of the
models increased from the inclusion of the GNP squared term. In addition, the null hypothesis that the
coefficients on the GNP variable are jointly equal to zero cannot be rejected for all specifications. This means
that illegal copying tends to increase initially, but once nations reach some threshold value of per capita income,
their development generates improvements in the protection of intellectual property rights. This relation is
similar to the well-known environmental Kuznet’s curve (EKC) between per capita income and pollution
(Grossman and Krueger, 1995). Further, these results seem to be consistent with Rodriguez’s (2005b) finding
for a sample of 23 European countries that an inverted U-shaped relationship between per capita income and
piracy does exist.8 In addition, the individualism index (INDIV) is inversely related to the dependent variable.
Similar findings are reported by Husted (2000), Moores (2003), Depken and Simmons (2004), among others.
The idea is that in more individualistic countries, a person feels less group pressure to share her software with
her peer groups, and thus more individualistic countries tend to experience lower levels of piracy.
In terms of the variables of interest, in the first column (1), the significance and the positive sign of the
coefficient of the income share of the first quintile (Q1) contradicts our hypothesis that poor persons do not
influence piracy rates.9 In columns (3), (5), and (7), all coefficients of the three different single middle quantiles
are positive, but only the lower two are significant at the 1 percent level, whereas the one of the forth quantile is
rendered insignificant. In general, this result provides support to the hypothesis that middle classes are more
likely to be engaged in more intellectual theft, as they have the means to commit it and the least to loose.
Results with an aggregated middle class share (Q2(*) Q3(*) Q4), as usually employed in these kinds of studies,
are reported in column 9. Its coefficient is strongly significant and shows the expected positive sign, and is also
in line with our initial hypothesis. In column (11), we observe that the share of the fifth quintile (Q5), which is
the highest quintile, has a negative and strongly significant effect on piracy (at the 1 percent level). This
negative coefficient could be potentially interpreted as the rich can afford and prefer to buy all software legally.
8 Maskus (2000) also find a quadratic relationship between the level of economic development proxied by the GNP per capita and IPRs. 9 An explanation might be that the first quantile already includes too many households which are wealthy enough a PC, particularly because averages over a long time span are used.. A more accurate measure could be the first decile. Estimation of the same equation only using data for 1995 rendered an insignificant coefficient of the first quantile, which is in line with our prediction. 11 Husted (2000) and Rodriguez’s (2005a) estimated coefficient for GINI was around 0.006.

13
In column (13) of Table 1, we examine the overall impact of the degree of income inequality. We find that it
exerts a beneficial impact on piracy, as the coefficient for this variable is negative and significant at the 1
percent level: the more unequally the income is distributed in society, the less piracy occurs. The OLS estimated
coefficient on income inequality (0.005) is similar in magnitude with that obtained in previous cross-sectional
studies (Husted, 2000; Rodriguez, 2005a).11 Summing up, most of these empirical results are in line with our
hypotheses about the influence of income inequality on piracy rates.
The 2SLS estimates are statistically significant and much larger in magnitude than OLS estimates. Columns (2),
(4), (6), (8), (10), and (12) report the results when equation (1) is estimated using 2SLS to correct for the
possible measurement error of inequality measures. This indicates that using averages over a long time span
actually appear to have mitigated the (potential) measurement errors, which otherwise have been shown to
considerably bias its impact downwards.12 Moreover, the 2SLS estimates of the coefficients of rest of
explanatory variables are almost not affected by the instrumentation of the income inequality variable, while the
coefficients for income inequality variables greatly increase. The sole exception is the share of the forth quintile
in total income which exerts the predicted positive, piracy rising impact, this time with at the 10 percent level of
significance. For this reason we will from now on only report the results with the lowest quintile, the middle
income shares and the upper quintile. The F-value of our first stage regression indicates that the chosen
instruments are strong predictors of income inequality.
12 Using averages over 5 years or even of a single year instead an instrumentation of the Gini coefficient leads to a more sizeable coefficient. Hence, measurement error tends to bias the coefficient downwards.

14
4.1.1. Analysis on Regional data The results reported thus far are suggestive but are subject to distortion arising from the inability to adequately
control for country specific factors. So, the analysis is extended to examine the impact of income distribution
measures for various geographical regions in the world with the aim of providing a check on baseline model
results (see Table 1). Creating regional sub-samples has the advantage of controlling for regional unobserved
characteristics that are not accounted for in the full sample. Regional unobserved characteristics might include
factors such as cultural or geographical (climate, temperature, etc). The regions are classified according to the
regional groups defined by the World Bank.13 The regions were selected on the availability of sufficient number
of observations.14 In general, lack of significance levels probably caused small sample size or a too low
variation in the sample can be observed. Also the instruments in such small sample do not perform well because
of similar arguments. In such a case, only signs of coefficients might be interpreted.
Latin American and Caribbean countries
Table 2 reports the results obtained for the sample that includes only Latin American and Caribbean countries.
The coefficients on income distribution measures are insignificant in all regression models. The GNP variables
are, at least, jointly significant at 10 and 5 percent levels, but do not have the predicted signs. Individualism
exerts a positive, but quantitatively marginal impact which might be due to the cultural similarities of the
countries in that sample. Regards the signs of our variables of interest, we observe a piracy dampening impact of
the first and the middle quantiles, but a piracy rate increasing impact of the highest quantile. Obviously, in these
countries with a relatively low per capita income only the wealthier people are potential offenders (and
suppliers). Countries in these regions are known for their unevenly distributed income in society and the lack of
a middle class as it is known in the Europe and North America. For this reason, in the Latin American and
Caribbean countries software piracy appears to be an upper class crime, which is supported by the positive
estimate of the GINI measure.
13 Inclusion of regional dummies in the full sample takes out all the variation of the GNP and inequality variables and was not considered to be useful by the authors. 14 The number of observations varies across the regressions due to some missing data.

15
Table 2: Latin America and Caribbean. Dependent variable: Log of Piracy rate (94-02)
(2.1) (2.2) (2.3) (2.4)
LGNP -0.348 -0.432 -0.511 -0.613
(0.21) (0.34) (0.37) (0.4)
(LGNP)2 0.011 0.017 0.023 0.03
(0.10) (0.19) (0.24) (0.28)
IDV 0.003 0.001 0.001 0.002
(0.69) (0.58) (0.57) (0.61)
Q1 -8.208
(0.60)
Q2-Q4 -0.724
(0.36)
Q5 0.948
(0.46)
GINI 0.011
(0.55)
Constant 6.469 6.729 6.18 6.489
(1.08) (1.35) (1.34) (1.27)
# observations 19 19 19 19
R2 (centered) -0.0430 0.4891 0.3881 0.2711
F (income vars only) (p-value)
3.44 (0.061)
5.19 (0.020)
4.24 (0.036)
3.76 (0.049)
Partial R2 (1st) 0.0779 0.1799 0.1416 0.1262 Sargan over-id test chi2 (p-value)
0.013 (0.910)
0.864 (0.353)
0.579 (0.447)
0.315 (0.575)
Pagan Hall test (p-value)
1.194 (0.945)
1.421 (0.922)
1.428 (0.921)
1.483 (0.915)
F (1st) (p-value)
0.55 (0.590)
1.43 (0.276)
1.07 (0.371)
0.94 (0.416)
Notes: Absolute value of t-statistics in parentheses. ***, **, and *, indicate statistical significance at the 1%, 5% and 10% levels, respectively. Results are robust to outliers and influential observations. Income inequality measures are instrumented, and instruments are the average life expectancy and birth rate for 1970-95.
Western European and North American countries
Table 3 displays the results obtained for the sample including Western European and North American countries,
which leaves us with a sample of 13 countries. First, there does not seem to be any non-linear relationship
between income and piracy, but a F test on the joint significance of the GNP variables cannot reject the
hypothesis of no influence, probably caused by the high correlation between the GNP variables in this sub-
sample (rho = 0.9993). Also the individualism variable does not exert the predicted impact, although its effect is
marginal, which is probably because of the closeness in culture. Interestingly, the sign of both the middle
income shares as well as the high income shares are both piracy dampening, whereas the sign of the lowest is
piracy enhancing. This shows that in the wealthiest and most industrialized countries of the world, which are
contained in this sample, software piracy appears to be a lower class crime; as soon as persons have reached a
middle income class status, they obviously prefer buying legal software. The estimate of the GINI coefficient

16
corroborates this result: the higher the share of the highest and middle income shares relative to the lowest
income shares, the less piracy will occur in these countries.
Table 3: Western Europe and Northern America. Dependent variable: Log of Piracy rate (94-
02)
(3.1) (3.2) (3.3) (3.4)
LGNP -0.904 -0.423 -1.39 -1.357
(0.54) (0.20) (0.79) (0.72)
(LGNP)2 0.025 -0.003 0.051 0.051
(0.27) (0.02) (0.51) (0.47)
IDV 0.004 0.002 0.003 0.005
(0.95) (0.39) (0.75) (0.84)
Q1 3.224
(0.87)
Q2-Q4 -2.475
(0.65)
Q5 -0.305
(0.14)
GINI -0.016
(0.51)
Constant 9.511 9.196 12.149 12.185
(1.26) (1.17) (1.52) (1.46)
# observations 13 13 13 13
R2 (centered) 0.8844 0.8935 0.8721 0.8412
F (income vars only) (p-value)
19.61 (0.001)
27.75 (0.000)
24.10 (0.000)
14.37 (0.002)
Partial R2 (1st) 0.7436 0.1507 0.3881 0.1661 Sargan over-id test chi2 (p-value)
6.960 (0.008)
8.186 (0.004)
7.359 (0.007)
5.537 (0.019)
F (1st) (p-value)
10.15 (0.008)
0.62 (0.565)
2.22 (0.179)
0.70 (0.529)
Notes: Absolute value of t-statistics in parentheses. ***, **, and *, indicate statistical significance at the 1%, 5% and 10% levels, respectively. USA is removed from the analysis because it is an influential case. Results are robust to outliers and influential observations. Income inequality measures are instrumented, and instruments are the average life expectancy and birth rate for 1970-95. A Pagan Hall test does not reject homoscedastic errors in the IV-regressions.
European and Asian Countries
Table 4 presents the results obtained for European and Central Asian countries. In contrast to the previous table,
the North-American countries are excluded and the Eastern European countries are now included in the sample.
These countries form the biggest sub-sample based on the regional definitions of the World Bank. The GNP
variables do not appear to have a statistically significant impact. The hypothesis that all coefficients on the GNP
variables are jointly equal to zero is rejected in all regressions at 5 percent level. The coefficient on INDIV is
negative and significant at the 10 percent level. Moreover, we observe that the lowest quintile and the middle
quintiles exert a software piracy increasing influence, whereas the highest quintile appears to lower piracy

17
offences. The coefficient for the GINI is negative, although it is not significant. These findings are similar to
those found in the baseline model.
Table 4: Europe and Central Asia. Dependent variable: Log of Piracy rate (94-02)
(4.1) (4.2) (4.3) (4.4)
LGNP -0.333 -0.372 -0.373 -0.403
(0.34) (0.38) (0.39) (0.41)
(LGNP)2 0.006 0.008 0.008 0.01
(0.11) (0.14) (0.14) (0.17)
IDV -0.006* -0.006* -0.006* -0.006*
(1.85) (1.84) (1.85) (1.86)
Q1 1.651
(0.45)
Q2-Q4 0.296
(0.19)
Q5 -0.307
(0.28)
GINI -0.004
(0.45)
Constant 6.591 6.797 7.067 7.197
(1.56) (1.65) (1.66) (1.68)
# observations 26 26 26 26
R2 (centered) 0.6740 0.6868 0.6835 0.6759
F (income vars only) (p-value)
5.68 (0.011)
9.23 (0.001)
8.88 (0.002)
7.81 (0.003)
Partial R2 (1st) 0.4029 0.5786 0.5758 0.4756 Sargan over-id test chi2 (p-value)
0.296 (0.586)
0.527 (0.468)
0.470 (0.493)
0.308 (0.579)
F (1st) (p-value)
6.75 (0.006)
13.73 (0.000)
13.57 (0.000)
9.07 (0.002)
Notes: Absolute value of t-statistics in parentheses. ***, **, and *, indicate statistical significance at the 1%, 5% and 10% levels, respectively. Results are robust to outliers and influential observations. The hypothesis that all coefficients on the GNP variables are jointly equal to zero is rejected in all specifications at 5 percent level. Income inequality measures are instrumented, and instruments are the average life expectancy and birth rate for 1970-95. A Pagan Hall test does not reject homoscedastic errors in the IV-regressions.
Table 5 displays the results obtained for the sample that includes South Asia, East Asia, and Pacific.15 Dropping
Australia as potential outlier has not impact on the estimation results. In this sub-sample, the non-linear pattern
between income and piracy is detected as in the full sample. Individualism exerts a strong piracy dampening
impact. It should be noticed that Australia and New Zealand are part of this sample as well as China and
Vietnam so that the variation in the individualism variable is strong. In this sample the income shares have the
expected signs: the first quintile exerts a software piracy lowering impact, as does the upper quintile, whereas
the middle income classes affect piracy rates positively. Hence, in this sample of South East Asian and Pacific
15 This region comprises the World Bank regions South Asia (SA) and East Asia and Pacific (EAP). The majority of the countries in this sample belongs to the second region and only 1 to the first.

18
countries, which includes mainly OECD countries and the Asian tiger states, piracy does appear as a purely
middle class crime.
Table 5: South Asia East Asian and Pacific. Dependent variable: Log of Piracy rate (94-02)
(5.1) (5.2) (5.3) (5.4)
LGNP -0.097 0.368 0.197 0.020
(0.28) (0.63) (0.40) (0.04)
(LGNP)2 -0.003 -0.033 -0.022 -0.01
(0.14) (0.86) (0.68) (0.36)
IDV -0.009*** -0.010*** -0.009*** -0.009***
(8.86) (4.39) (5.93) (8.05)
Q1 -2.196
(0.77)
Q2-Q4 1.006
(0.47)
Q5 -0.204
(0.16)
GINI 0.002
(0.28)
Constant 5.512*** 3.195 4.363** 4.822**
(3.76) (1.07) (3.42) (3.71)
# observations 12 12 12 12
R2 (centered) 0.9856 0.9706 0.9798 0.9841
F (income vars only) (p-value)
29.50 (0.000)
17.83 (0.000)
24.30 (0.000)
32.38 (0.000)
Partial R2 (1st) 0.5375 0.1679 0.2127 0.3581 Sargan over-id test chi2 (p-value)
4.087 (0.043)
1.24 (0.27)
3.583 (0.058)
4.462 (0.034)
F (1st) (p-value)
3.49 (0.099)
0.61 (0.576)
0.81 (0.488)
1.67 (0.264)
Notes: Absolute value of t-statistics in parentheses. ***, **, and *, indicate statistical significance at the 1%, 5% and 10% levels, respectively. All outliers have been excluded from the analysis. The hypothesis that all coefficients on the GNP variables are jointly equal to zero is rejected in all specifications. Income inequality measures are instrumented, and instruments are the average life expectancy and birth rate for 1970-95. A Pagan Hall test does not reject the homoscedastic errors in the IV-regressions.
Taken together, the results from specific geographic regions show that changing the countries included in a
sample leads to different results concerning the impact of income classes on software piracy. It appears that the
influence of income classes on software piracy rates depend strongly on how wealthy the countries are which
form the sub-sample. For this reason, it appears to be useful to explore this issue further using groups of
countries selected by their national income, which we will present in section 4.

19
4.2. Robustness Analysis
4.2.1 Controlling for institutional and legal factors
To this point, we have only considered the effects of economic inequality, level of economic development,
individualism. However, previous empirical research suggests other factors such as may have a direct impact on
piracy. We consider two such variables: a measure of institutional quality (rule of law) and intellectual property
rights protection (the Ginarte and Park index). Both variables could be viewed as crime deterrents (see
discussion below). Table 6 reports the regression results of the baseline model above, with the rule of law and
the patent rights index added. Regressions 6.1 to 6.4 and 6.4 to 6.8 report the results if only one of the variables
is added, and columns 6.9 to 6.12 if both are included in the regressions at the same time.
Supporting previous research, the regression model also confirms the hypothesis that stronger intellectual
property rights protection may lower piracy rates (columns 6.1-6.4) (at the 10 percent level). This result is in
line with Rodriguez (2005b) who emphasizes that legal factors proxied by an index of copyright protection,
matter to piracy. Interestingly, the inclusion of this deterrent causes a drop in significance of the GNP variables
compared to the baseline model (Table 1), but both remain significant at the 5 and 10 percent level (and jointly
in 6.1). Tests of joint non-significance, however, reveal their joint importance unquestionably. Also, the non-
linear relationship between income and piracy persists after controlling for this measure of deterrence. Since
countries with a higher per capita income level also protect property rights stronger than poorer countries, as the
Table A.5 shows (rho = 0.79), the simultaneous significance both of the park index and the national income
variables is particularly noteworthy.
In regressions 6.5 to 6.8, the estimate of the impact of the effect of institutional quality on piracy rates is
negative and statistically significant at the 1 percent level. The stricter the rule of law, the lower the level of
piracy should be, very strongly at the 1 percent level of significance. The rationale behind is that a well working
enforcement of laws may raise the probability of punishment and or severity of punishment that in turn lets the
expected economic gains from any illegal activity decline. This is a usual result. Other empirical studies
typically find a negative relationship between software piracy rates and institutional quality, measured by the
rule of law piracy and institutional quality (Holm, 2003; Rodriguez, 2005a). Again, there is a positive link
between the rule of law variable and the GNP per capita variable as the correlation matrix indicates (see table
A.5 in Appendix). For this reason, it is not surprising that the GNP variables appear to be far less significant
than in the baseline model, but still at the 5 and 10 percent levels.
As a final step, the institutional quality and patent rights index were added at the same time to the basic
regression model. Again, the coefficient on the rule of law variable is negative and statistically significant at the

20
1 percent level in the piracy regressions. The intellectual property rights variable enters negatively although
never at standard significance levels, consistent with the results obtained in regressions 6.1 to 6.4. One
possibility is that the causal effect of PRIGHT variable is being usurped by our institutional quality variable. In
fact, when we drop our measure of institutional quality, the coefficients on PRIGHT becomes statistically
significant at percent level, and are larger in magnitude than before. Similarly, the regression results yield robust
results for the relationship between the level of economic development and piracy. The null hypothesis of zero
coefficients on the GNP variables could never be accepted at conventional significance levels.
As to the inequality measures, we observe that their impact is robust to the inclusion of either new deterrent
variable. In all specifications, our hypothesis about the impact of the middle and high income shares on piracy
rates are corroborated: the middle income is associated with rising piracy rates (regressions 6.2, 6.6, and 6.10),
and a higher share of the fifth quintile leads to lower intellectual theft rates (regressions 6.3, 6.7, and 6.11).
Again, the impact of the lowest quantile does not appear to be consistent with our a priori expectations.
Likewise, the coefficient on the GINI coefficient is always negative and statistically significant (regressions 6.4,
6.8, and 6.12).
In all regression models, our measure of individualism (IDV) has the expected negative sign and is statistically
significant. This result is particularly interesting as we might expect the state to take over the role of a
prosecutor and defender of societal rules in societies in which the control of the group/clan over the individual's
actions becomes looser. For this reason there should be a positive correlation between the degree of
individualism and the development of governing state structures as expressed by the rule of law. Indeed, the
correlation between the two institutional measures of deterrence and the individualism measure exceed the value
of 0.64 for each of them (see table A.5 in the Appendix). Finally, we achieve respectable F tests in the first stage
of the regressions, and the instruments pass standard overidentifying chi-square tests (reported below Table 6).
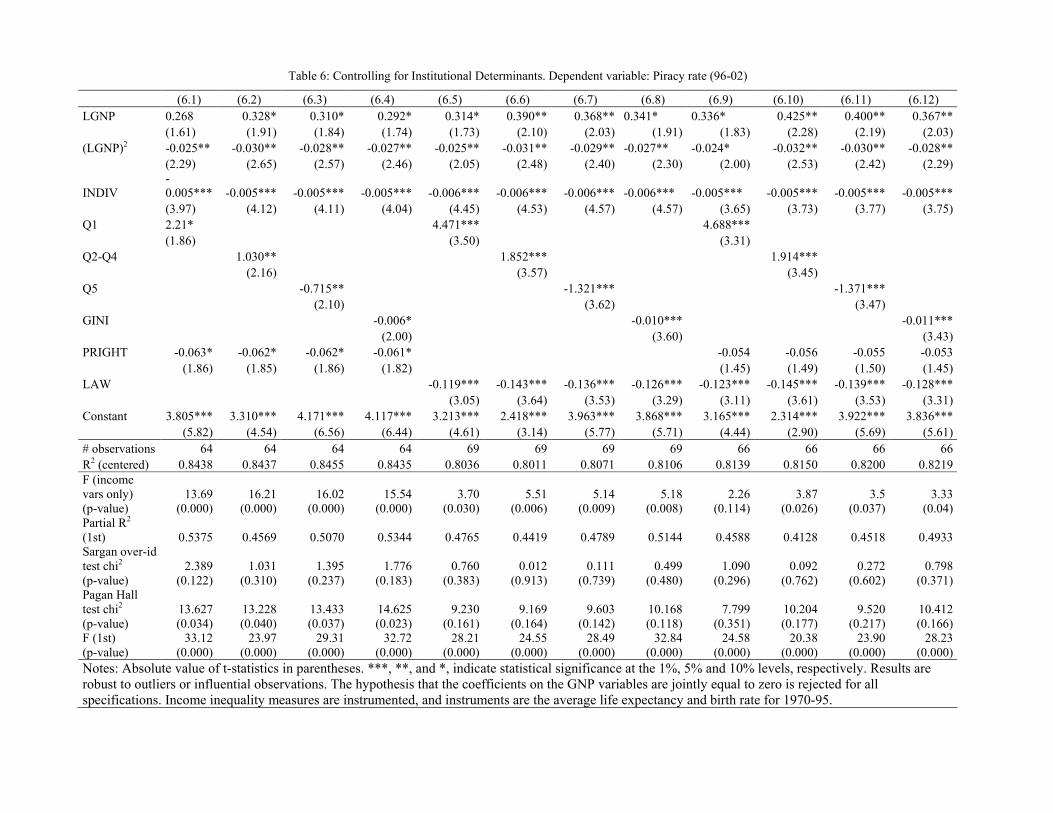
Table 6: Controlling for Institutional Determinants. Dependent variable: Piracy rate (96-02)
(6.1) (6.2) (6.3) (6.4) (6.5) (6.6) (6.7) (6.8) (6.9) (6.10) (6.11) (6.12)
LGNP 0.268 0.328* 0.310* 0.292* 0.314* 0.390** 0.368** 0.341* 0.336* 0.425** 0.400** 0.367**
(1.61) (1.91) (1.84) (1.74) (1.73) (2.10) (2.03) (1.91) (1.83) (2.28) (2.19) (2.03)
(LGNP)2 -0.025** -0.030** -0.028** -0.027** -0.025** -0.031** -0.029** -0.027** -0.024* -0.032** -0.030** -0.028**
(2.29) (2.65) (2.57) (2.46) (2.05) (2.48) (2.40) (2.30) (2.00) (2.53) (2.42) (2.29)
INDIV -0.005*** -0.005*** -0.005*** -0.005*** -0.006*** -0.006*** -0.006*** -0.006*** -0.005*** -0.005*** -0.005*** -0.005***
(3.97) (4.12) (4.11) (4.04) (4.45) (4.53) (4.57) (4.57) (3.65) (3.73) (3.77) (3.75)
Q1 2.21* 4.471*** 4.688***
(1.86) (3.50) (3.31)
Q2-Q4 1.030** 1.852*** 1.914***
(2.16) (3.57) (3.45)
Q5 -0.715** -1.321*** -1.371***
(2.10) (3.62) (3.47)
GINI -0.006* -0.010*** -0.011***
(2.00) (3.60) (3.43)
PRIGHT -0.063* -0.062* -0.062* -0.061* -0.054 -0.056 -0.055 -0.053
(1.86) (1.85) (1.86) (1.82) (1.45) (1.49) (1.50) (1.45)
LAW -0.119*** -0.143*** -0.136*** -0.126*** -0.123*** -0.145*** -0.139*** -0.128***
(3.05) (3.64) (3.53) (3.29) (3.11) (3.61) (3.53) (3.31)
Constant 3.805*** 3.310*** 4.171*** 4.117*** 3.213*** 2.418*** 3.963*** 3.868*** 3.165*** 2.314*** 3.922*** 3.836***
(5.82) (4.54) (6.56) (6.44) (4.61) (3.14) (5.77) (5.71) (4.44) (2.90) (5.69) (5.61)
# observations 64 64 64 64 69 69 69 69 66 66 66 66
R2 (centered) 0.8438 0.8437 0.8455 0.8435 0.8036 0.8011 0.8071 0.8106 0.8139 0.8150 0.8200 0.8219
F (income vars only) (p-value)
13.69 (0.000)
16.21 (0.000)
16.02 (0.000)
15.54 (0.000)
3.70 (0.030)
5.51 (0.006)
5.14 (0.009)
5.18 (0.008)
2.26 (0.114)
3.87 (0.026)
3.5 (0.037)
3.33 (0.04)
Partial R2 (1st) 0.5375 0.4569 0.5070 0.5344 0.4765 0.4419 0.4789 0.5144 0.4588 0.4128 0.4518 0.4933 Sargan over-id test chi2 (p-value)
2.389 (0.122)
1.031 (0.310)
1.395 (0.237)
1.776 (0.183)
0.760 (0.383)
0.012 (0.913)
0.111 (0.739)
0.499 (0.480)
1.090 (0.296)
0.092 (0.762)
0.272 (0.602)
0.798 (0.371)
Pagan Hall test chi2
(p-value) 13.627 (0.034)
13.228 (0.040)
13.433 (0.037)
14.625 (0.023)
9.230 (0.161)
9.169 (0.164)
9.603 (0.142)
10.168 (0.118)
7.799 (0.351)
10.204 (0.177)
9.520 (0.217)
10.412 (0.166)
F (1st) (p-value)
33.12 (0.000)
23.97 (0.000)
29.31 (0.000)
32.72 (0.000)
28.21 (0.000)
24.55 (0.000)
28.49 (0.000)
32.84 (0.000)
24.58 (0.000)
20.38 (0.000)
23.90 (0.000)
28.23 (0.000)
Notes: Absolute value of t-statistics in parentheses. ***, **, and *, indicate statistical significance at the 1%, 5% and 10% levels, respectively. Results are robust to outliers or influential observations. The hypothesis that the coefficients on the GNP variables are jointly equal to zero is rejected for all specifications. Income inequality measures are instrumented, and instruments are the average life expectancy and birth rate for 1970-95.

22
In summary, the impact of the income inequality measures appeared to be robust to the
inclusion of additional control variables which had a crime dampening impact. The
significance of the key variables enhances our confidence in the initial results displayed in
Table 1. Clearly, variables measuring deterrent influence piracy levels appear to be decisive
determinants, and therefore they should not be neglected in any future analysis of cross-
national piracy rates. For this reason, we will -from now on- always include these institutional
deterrents in our baseline model.
4.1.2. Results for Regions by Income Because the countries exhibit large variation in national income, and income is an important
determinant of piracy, we split the original countries into several groups according to their
income level. This step has the advantage that we can eliminate the national income
determinant from the specification and conserve a higher degree of freedom in our regression
analysis.17Countries are classified based on the OECD definitions of the country’s
development status. Due to the relatively small number of observations, and not all groups
could be used.18 Again, in all regressions we observe that the instruments are not as strong
predictors as in the full sample.
Table 7 shows the results for the lower middle income countries (17 observations). The
institutional deterrents are associated with lower piracy rates, with both coefficients being
jointly statistically significant (at the 1 or 5 percent level). In contrast, the individualism
variable exerts no impart influence, neither quantitatively nor statistically in this sub-sample.
It is possible that the variation in the degree of individualism is not sufficiently high to
produce a significant estimate. Regards our variables of interest, we observe a statistically
weak offense increasing impact of the lowest income share (at the 10 percent level) which
contradicts our predictions. In contrast, the influences of the middle and the highest income
classes are as expected (significantly at the 5 and 10 percent level, respectively). Higher
inequality is strongly associated with lower piracy rates (at the 5 percent level of
significance), which might be driven by an increase in the fifth quintile and a decrease in the
lowest quintile. These estimation results perfectly reflect the ones we obtained in the full
sample and the baseline model. Obviously, in these countries it is the middle class which
affects the occurrence of software piracy most strongly. 17 The inclusion of the GNP variables always rendered insignificant coefficient, both separately and jointly. In
most of the cases, the national income variable does not reach significance even if the institutional determinants are excluded from the analysis.
18 Due to the low number of observations, an analysis for the low income countries could not be carried out.

23
Table 7: Lower Middle Income Countries
(7.1) (7.2) (7.3) (7.4)
INDIV 0.001 0.001 0.001 0.001
(0.67) (0.73) (0.72) (0.57)
LAW -0.240*** -0.216*** -0.222*** -0.209***
(3.34) (3.51) (3.50) (3.42)
PRIGHT -0.054 -0.052 -0.053 -0.06
(1.30) (1.39) (1.38) (1.55)
Q1 2.971*
(2.07)
Q2-Q4 0.958*
(2.19)
Q5 -0.727*
(2.17)
GINI -0.006**
(2.24)
Constant 4.221*** 3.968*** 4.755*** 4.700***
(38.33) (20.35) (23.54) (26.83)
# observations 17 17 17 17
R2 (centered) 0.4447 0.5332 0.5179 0.5171
F (LAW and PRIGHT vars only)
5.70 (0.018)
6.30 (0.013)
6.25 (0.014)
6.04 (0.015)
Partial R2 (1st) 0.6037 0.6510 0.6508 0.6812 Sargan over-id test chi2 (p-value)
0.177 (0.674)
0.644 (0.422)
0.499 (0.480)
0.087 (0.77)
F (1st) (p-value)
8.38 (0.006)
10.26 (0.003)
10.25 (0.003)
11.75 (0.002)
Notes: Absolute value of t-statistics in parentheses. ***, **, and *, indicate statistical significance at the 1%, 5% and 10% levels, respectively. South Africa, Colombia, and Thailand are removed from the analysis because they are influential cases. Results are robust to outliers and influential observations. Income inequality measures are instrumented, and instruments are the average life expectancy and birth rate for 1970-95. A Pagan Hall test does not reject homoscedastic errors in the IV-regressions.
Table 8 reports the results for the upper middle income countries (11 observations). Again,
the signs of the coefficients of the institutional determinants point to the expected direction,
although neither of them becomes significant.19 The degree of individualism in society also
tests insignificantly but a higher degree of individualism is associated with lower piracy rates.
The income inequality measures are insignificant.20 We observe negative signs for both the
lowest quintile and the middle quintiles. The highest quintile, however, is associated with
higher piracy rates. It is possible that we have found a case where low income societies differ
with respect to their behaviour from the full sample model: In the sample of the upper middle
income countries, software piracy appears to be an offense committed by the richest
19 The significance levels of the coefficients of the rule of law variable vary between the 11 and 16 percent levels. 20 The signs of the inequality measures are robust to the replacement of the institutional determinants with the
GNP variables.

24
households in society. Consistently with these results for the quintiles, we find the Gini
coefficient to be piracy increasing. Again, this increase in the Gini coefficient might be
caused by a rise in that share of wealth and income of the highest income class in combination
with a decrease in the shares of the lower income classes.
Table 8: Upper Middle Income Countries
(8.1) (8.2) (8.3) (8.4)
INDIV -0.002 -0.003 -0.003 -0.002
(0.39) (1.12) (0.93) (0.74)
LAW 0.189 0.178 0.18 0.177
(1.87) (1.58) (1.64) (1.79)
PRIGHT -0.039 -0.043 -0.042 -0.043
(0.82) (0.85) (0.85) (0.92)
Q1 -1.643
(0.67)
Q2-Q4 -0.335
(0.47)
Q5 0.283
(0.52)
GINI 0.003
(0.54)
Constant 4.397*** 4.516*** 4.214*** 4.232***
(30.41) (18.60) (9.68) (11.02)
# observations 11 11 11 11
R2 (centered) 0.8260 0.7968 0.8039 0.8271
F (LAW and PRIGHT vars only) (p-value)
2.84 (0.135)
2.03 (0.213)
2.19 (0.194)
2.55 (0.158)
Partial R2 (1st) 0.3762 0.5210 0.5068 0.4191 Sargan over-id test chi2 (p-value)
1.090 (0.296)
1.227 (0.268)
1.212 (0.271)
1.389 (0.238)
Pagan Hall test chi2
(p-value) 1.722
(0.886) 3.070
(0.689) 2.936
(0.709) 2.419
(0.789) F (1st) (p-value)
1.51 (0.307)
2.72 (0.159)
2.57 (0.171)
1.80 (0.257)
Notes: Absolute value of t-statistics in parentheses. ***, **, and *, indicate statistical significance at the 1%, 5% and 10% levels, respectively. Czech. Rep, Chile and Venezuela are removed from the analysis because they are influential observations. Results are robust to outliers or influential observations. Income inequality measures are instrumented, and instruments are the average life expectancy and birth rate for 1970-95.

25
Table 9: High Income OECD and Non-OECD Countries
(9.1) (9.2) (9.3) (9.4)
INDIV -0.004 -0.002 -0.002 -0.003
(1.64) (0.37) (0.77) (0.83)
LAW -0.457** -0.401** -0.419** -0.367**
(2.33) (2.51) (2.83) (2.79)
PRIGHT 0.104 0.139 0.129 0.062
(0.60) (0.70) (0.77) (0.45)
Q1 -15.572
(1.02)
Q2-Q4 -6.982
(1.06)
Q5 4.841
(1.20)
GINI 0.037
(1.01)
Constant 5.462*** 7.697** 2.173 3.082*
(7.00) (2.74) (1.01) (1.83)
# observations 22 22 22 22
R2 (centered) 0.3528 0.3398 0.5012 0.4878
F (LAW and PRIGHT vars only) (p-value)
3.79 (0.043)
3.62 (0.049)
4.92 (0.020)
4.48 (0.027)
Partial R2 (1st) 0.093 0.1147 0.1795 0.1231 Sargan over-id test chi2 (p-value)
0.216 (0.642)
0.090 (0.765)
0.161 (0.689)
0.674 (0.412)
Pagan Hall test chi2
(p-value) 1.269
(0.938) 1.709
(0.888) 1.138
(0.951) 0.849
(0.974) F (1st) (p-value)
0.82 (0.456)
1.04 (0.377)
1.75 (0.205)
1.12 (0.350)
Notes: Absolute values of robust t-statistics are in parentheses. ***, **, and *, indicate statistical significance at the 1%, 5% and 10% levels, respectively. USA was removed from the analysis because it is an influential observation. Results are robust to outliers and influential observations. Income inequality measures are instrumented, and instruments are the average life expectancy and birth rate for 1970-95.
Regression results for high income countries, of which most are OECD-countries, are
presented in table 9 (22 observations).21 As expected, the degree of individualism in society
appears to be negatively associated with piracy rates in all regressions, although its coefficient
does not reach significance. Both measures of legal institutions are strongly associated with
less crime (jointly significant at the 5 percent level), which the rule of law, again, being the
more important factor (significant at the 5 percent level). Interestingly, the magnitude of the
coefficient on PRIGHT is higher for high income countries. This is consistent with the idea
that the impact of IPRs on piracy rates appears to be stronger in high income countries than in
low income countries.
21 The results for OECD countries alone do not change substantially from the ones presented here. See Appendix.

26
The coefficients on the income shares become insignificant. The negative sign on the lowest
income quintile confirms our hypothesis. The middle income classes are associated with
lower piracy rates, whereas the highest income class with higher rates. Thus, the results for
this sub-sample of high income countries are not support to our hypotheses and they do not
corroborate the findings for the full sample: With this specification, software piracy appears
to be a high income class offence rather than a middle income class crime; interestingly, an
identical pattern could observed for the group of upper middle income countries. Finally, the
Gini coefficient enters positively which is consistent with our estimates for the income shares.
Overall, the results for the various sub-samples grouped by national income show that
patterns of influence vary according to the wealth of a nation. Furthermore, these results also
made clear that it is not sufficient only to look at the impact of the overall inequality measure,
but that the effects of its various components have to be analyzed. Our findings for the various
quintiles reveal that software piracy appears to be a middle class crime in the group pf the
lower middle income countries, but an upper class crime in the groups of the upper middle
and high income countries.
4.2.2 Other variables
As a final check, we have tested the sensitivity of the inequality measures to the inclusion of
further variables (always also controlling or the two deterrents rule of law and park index).
The regressors, defined in the Appendix, include information and technology expenditures as
proportion of GDP (World Bank, 2003), educational attainment proxied by the secondary and
tertiary school enrollment (World Bank, 2003), trade openness measured as the share of
exports and imports in GDP (World Bank, 2003), urbanization that measures the percentage
of urban population in the total population (World Bank, 2003), R&D expenditures as a
percentage of GDP (World Bank, 2003), total number of internet users (World Bank, 2003),
computers per 1,000 inhab (World Bank, 2003), ethnolinguistic fractionalization (La Porta et
al. 1999), legal origin dummies of English common law, French Comercial Code,
Communist/Socialist Laws, German Commercial Code, and Scandinavian Commercial Code
(La Porta et al. 1999) variables, percentage of Protestant, Catholic, and Muslim population in
1980 (from La Porta et al. 1999), and the proportion of males aged 15-19, 20-29, and 30-39
years (United Nations, 2001). The reason for the inclusion of these additional controls stems
from a large body of the empirical literature on piracy (e.g. Van Kranenburg and Hogenbirk,
27
2005; Marron and Steel, 2000) as well as crime (Ehrlich, 1973). The results of this exercise
are presented in Table 10.
Overall, the impact of the income inequality measures remains robust to the inclusion of any
of these additional controls. The same holds with respect to the signs. There are two
exceptions. First, the coefficients on the income shares are less significant in the regressions
that include the unemployment rate among young males as additional control. It should be
noted that the number of observations for which the regression model is estimated is smaller
than the number of observations for which the baseline model is estimated. Second, in the
regression that include the communication and information technology expenditures variable,
the estimated coefficients on the income inequality measures are not significant, while the
middle income share enters positively and with a consistent sign.
Among the additional explanatory variables, only a few has a single significant impact on
piracy. The results indicate that number of computers, that account for the potential market
size, are negatively and significantly associated with lower piracy rates at the 5 percent level,
except for when the Gini coefficient is included, contrary to our expectations25. Nevertheless,
there may be a potential endogeneity problem (Osorio, 2002). It is very likely that the
promulgation of PCs is caused by a better availability of pirated software (thus causing
endogeneity). Similarly, the estimates of the number of internet users were significant at the
10 percent level (in the first model specifications), although with the wrong sign. Male youth
unemployment, however, is associated with an increasing piracy rate (at the 10 percent level)
that is consistent with the view that unemployed individuals have lower income and more free
time to steal legal software. Information and communication technology expenditures
appeared to be negatively correlated with piracy rates at the 5 percent level (not reported).
Since in the same regression model, the institutional quality, and intellectual property rights
become insignificant, we can interpret this finding as this variable serves a proxy for a well
developed legislative and executive institutions. Openness, defined as the sum of shares of
exports and imports in the GDP, account for the extent to which a country is linked
internationally. The stronger this link, the better property rights should be protected. The
25 In contrast, Van Kranenburg and Hogenbirk (2005) find an insignificant effect of number of computers on piracy rates.

28
results indicate that more open countries tend to provide weaker intellectual property rights
protection in all regression models (not reported), a finding that is inconsistent somewhat with
previous empirical studies of piracy. In addition, the Protestant, Catholic, and Muslim
population shares are negatively correlated with piracy rates, although only the coefficient on
Protestant was statistically significant at 5 percent level (not reported).
Table 10: Sensitivity Tests. Full sample. Dependent variable: Log of Piracy rate (94-02)
Additional variables(s)
Income Share Q1 (1)
Income Share Q2-Q4
(2)
Income Share Q5 (3)
GINI (4)
6.377 3.201* -2.407* -0.016* (1.38) (1.90) (1.85) (1.75)
Legal origin (German, French, English,
Socialist) n= 61 n= 61 n= 61 n= 61
5.168** 2.071** -1.488** -0.012** (3.23) (3.32) (3.36) (3.33)
Secondary and Tertiary school enrollment (%) n= 63 n= 63 n= 63 n= 63
2.251 1.028* -0.719* -0.006* (1.67) (2.10) (2.00) (1.84)
PCs in the population
n= 61 n= 61 n= 61 n= 61
4.025** 1.600** -1.157** -0.009**
(2.83) (3.05) (3.03) (2.95) Internet users in the
population n= 64 n= 64 n= 64 n= 64
3.494* 1.316** -0.960** -0.008** (2.60) (2.79) (2.77) (2.69)
Male youth Unemployment (%)
n= 54 n= 54 n= 54 n= 54
4.002** 1.601** -1.155** -0.009** (2.72) (2.87) (2.87) (2.79)
Total unemployment (%)
n= 63 n= 63 n= 63 n= 63
5.103** 1.729** -1.297** -0.011** (4.31) (4.43) (4.50) (4.65)
Openness (%)
n= 60 n= 60 n= 60 n= 60
3.830* 1.452* -1.063* -0.009*
(2.16) (2.36) (2.34) (2.25) Research and Development expenditure (% GDP) n= 50 n= 50 n= 50 n= 50
-0.128 0.295 -0.154 -0.001 (0.09) (0.62) (0.43) (0.21)
Information and technology expenditure (% GDP) n= 42 n= 42 n= 42 n= 42
3.939** 1.626** -1.163** -0.009** (2.79) (2.92) (2.93) (2.86) Urbanization
n= 65 n= 65 n= 65 n= 65
3.001* 1.211* -0.875* -0.007* (2.23) (2.44) (2.41) (2.29)
% Muslim, Catholic or Protestant
n= 63 n= 63 n= 63 n= 63
4.414** 1.782** -1.277** -0.011** (3.31) (3.17) (3.27) (3.28)
Ethnolinguistic fractionalization
n= 61 n= 61 n= 61 n= 61
0.855 0.563 -0.355 -0.002 (0.56) (0.86) (0.78) (0.67)
Share of young male, aged 15-19, 20-29, 30-39 years n= 59 n= 59 n= 59 n= 59
Specification (1), (2), (3), and (4) includes the log (GNP) and log (GNP)2 for 1970-1995, individualism, institutional quality (rule of law), and patent rights index. Each regression model contains a constant (not shown). Absolute values of robust t-statistics are in parentheses. ***, **, and *, indicate statistical

29
significance at the 1%, 5% and 10% levels, respectively. Number of observations in italics. Results are robust to outliers and influential observations. Income inequality measures are instrumented, and instruments are the average life expectancy and birth rate for 1970-95. A Pagan Hall test does not reject homoscedastic errors in the IV-regressions.
5. Conclusions
This paper has examined the relationship between income inequality and software piracy rates
using a rich data set on income distribution. The results show that income inequality appears
to have a negative and significant effect on piracy rates, and hence supporting previous
empirical studies (for instance, Husted, 2000). The regression results also reveal that per
capita income, rule of law, and the degree of individualism are important determinants when
explaining pirate behaviours at aggregate level. Most interestingly, the impacts of income
distribution might differ in smaller sub-samples defined by region or national income levels.
Software piracy appears to be a middle class crime in the full sample and in the counties with
a high income. However, in countries with a lower national income or in developing countries
also the upper income class might exert an important impact on piracy rates. This study has
also some policy implications. Results indicate that piracy may respond to economic
differences across the countries and that many other non-economic factors are importants as
well. Initiatives to fight piracy may interfere with the cultural and institutional values of a
nation. Therefore, there would be a need to adapt the preventive policies against piracy to the
cultural and institutional values of the nations. Economic policies should emphasize the role
of income distribution as well as which parts of the income distribution matters in reducing
the levels of piracy.
Obviously, this study has some limitations. First, the empirical analysis is based on a cross-
sectional estimation method and is limited by the data available. More research along these
lines is certainly necessary. In particular, the employ of panel data techniques that account for
unobserved country heterogeneity and reduces the omitted variable bias
30
References
Becker, G. “Crime and Punishment: An Economic Approach.” Journal of Political Economy, 76,
1968, 169-217.
Bourguignon, F. “Crime as a Social Cost of Poverty and Inequality: a Review Focusing on Developing
Countries.” In Facets of Globalization: international and local dimensions of development (eds.
Yussuf, S., S. Evenett, and W. Wu), World Bank, 2001, Washington.
Chen, S., and M. Ravallion. “What Can New Survey Data Tell Us About Recent Changes in
Distribution and Poverty.” The World Bank Economic Review, 11, 1997, 357-382.
Deininguer, K., and L. Squire. “A New Dataset Measuring Economic Inequality.” The World Bank
Economic Review, 10, 1997, 565-591.
Depken, C.A., and L.C. Simmons. “Social Construct and the Propensity for Software Piracy.” Applied
Economics Letters, 11, 2004, 97-100.
Dollar, D., and A. Kraay. “Growth is Good for the Poor.” Journal of Economic Growth, 7, 2002, 195-
222.
Ehrlich, I. “Participation in Illegitimate Activities: A Theoretical and Empirical Investigation.”
Journal of Political Economy, 81, 1973, 521-565.
Eide, E. “Economics of Criminal Behavior.” in Encyclopedia of Law and Economics, vol. 5 (eds
Bouckaert, B. and G. de Geest), 1999, Chentelham.
Fajnzylber, P., D. Lederman, and N. Loayza. “What Causes Violent Crime.” European Economic
Review, 46, 2002, 1323-1357.
Freeman, R. “The Economics of Crime.” In Handbook of Labor Economics, vol. 3C (eds Ashenfelter,
O.C. Ashenfelter, and D. Card), 1999, Elsevier, Amsterdam.
Gallegos, F. “Software Piracy: Some Facts, Figures, and Issues.” Information Systems Security. 8,
1999, 34-56.

31
Ginarte, J.C., and W. Park. “Determinants of Patent Rights: A Cross-National Study.” Research
Policy, 26, 1997, 283-301.
Gopal, R.D., and G.L. Sanders. “You Can’t Get Blood Out of a Turnip.” Communications of the ACM,
43, 2000, 83-89.
Gopal, R.D., and G.L. Sanders. “International Software Piracy: Analysis of Key Issues and Impacts.”
Information Systems Research, 9, 1998, 380-397.
Gopal, R.D, and G.L. Sanders. “Preventive and Deterrent Controls for Software Piracy.” Journal of
Management Information Systems, 13, 1997, 29-47.
Gould, E., B. Weinberg, and D. Mustard. “Crime Rates and Local Labor Market Opportunities in the
United States: 1979-1997.” The Review of Economics and Statistics, 84, 2002, 45-61.
Grossman, G.M., and A.B. Krueger. “Economic Growth and Environment.” Quarterly Journal of
Economics, 110, 1995, 353-377.
Hofstede, G. Cultures and Organizations: Software of the Mind. McGraw Hill, New York, 1997.
Hofstede, G. Culture’s Consequences: Comparing values, Behaviors, Institutions and Organizations
across nations (second edition). Thousand Oaks, CA: Sage Publications, 2001.
Holm, H.J. “Can Economic Theory Explain Piracy Behavior?.” Topics in Economic Analysis &
Policy, 3, 2003, article 5.
Husted, W.H. “The Impact of National Culture on Software Piracy.” Journal of Business Ethics, 26,
2000, 197-211.
IPRC (2003). Eighth Annual BSA Global Software Piracy Study. Trends in Software Piracy 1994-
2002.
Kanwar, S. “Does Intellectual Property lead to Intellectual Property Protection”. Working Paper No.
108, Center for Development Economics. Delhi School of Economics, 2002.
Kaufmann, D., A. Kraay, and M. Mastruzzi. “Governance Matters: Governance Indicators for 1996-
2002.” World Bank Discussion Paper No. 3106, World Bank, Washington, DC., 2003.
32
Kennedy, P. A Guide to Econometrics. Boston: Massachusetts Institute of Technology Press, 2001.
La Porta, R., F. Lopez-de-Silanes, A. Schleifer, and R.W.Vishny. “The Quality of Government.”
Journal of Law, Economics and Organization, 15, 1999, 222-279.
Lundberg, M., and L. Squire. “The Simultaneous Evolution of Growth and Inequality.” The Economic
Journal, 113, 2000, 3326-3344.
Machin, S., and C. Meghir. “Crime and Economic Incentives”. The Institute for Fiscal Studies, 2000,
Working Paper 00-17.
Marron, D.B., and D.G. Steel. “Which Countries Protect Intellectual Property?. The Case of Software
Piracy.” Economic Inquiry, 38, 2000, 159-174.
Maskus, K.E., and M. Penubarti. “How Trade-Related are Intellectual Property Rights?.” Journal of
International Economics, 39, 1995, 227-248.
Maskus, K.E. “The Gobal Effects of Intellectual Property Rights: Measuring what Cannot be Seen.” In
Intellectual Property Rights in the Global Economy, Washington DC: Institute for International
Economics. 2000.
Moorehouse, J.C. “Property Rights, Technology, and Internet Distribution.” Journal of Technology
Transfer, 26, 2001, 351-361.
Moores, T.T. “The Effect of National Culture and Economic Wealth on Global Software Piracy
Rates.” Communications of the ACM, September, 2003, 207-215
Osorio, C.A. “A Contribution to the Understanding of Illegal Copying of Software.” Working Paper,
June 2002.
Ostergard, R.L. “The Measurement of Intellectual Property Rights Protection.” Journal of
International Business Studies, 31, 2000, 349-360.
Park, W. “Intellectual Property and Economic Freedom.” In J. Gwartney and R. Lawson (eds.),
Economic Freedom of the World, Vancouver: Fraser Institute, 2001.

33
Ramsey, J.B. “Tests for Specification Errors in Classical Linear Least Squares Regression Analysis.”
Journal of the Royal Statistical Society, Series B, 31, 1969, 350-371.
Rapp, R.T., and R.P. Rozek. “Benefits and Costs of Intellectual Property Protection in Developing
countries.” Journal of World Trade, 24, 1990, 75-102.
Richardson, R.S., and J.D. Gaisford. “North-South Disputes over the Protection of Intellectual
Property.” Canadian Journal of Economics, 29, 1996, S376-S381.
Rodríguez, A. “Software Piracy and Income Inequality.” Applied Economics Lettters [In Press],
2005a.
Rodríguez, A. “The Relationship between Copyright Software Protection and Piracy: Evidence from
Europe.” Forthcoming European Journal of Law and Economics, 2005b.
Ronkainen, I.A., and J.L. Guerrero-Cusumano. “Correlates of Intellectual Property Violation.”
Multinational Business Review, Spring, 2001, 59-65.
Shadlen, K., A. Schrank, and M. Kurtz, M. “The Political Economy of Intellectual Property
Protection: The Case of Software.” Forthcoming in International Studies Quarterly, 2005.
Shin, S.K., R.D. Gopal, G.L. Sanders, and A.B. Whinston. “Global Software Piracy Revisited.”
Communications of the ACM, 47, 2004, 103-107.
Traphagan, M., and A. Griffith. “Software Piracy and Global Competitiveness: Report on Global
Software Piracy.” International Review of Law Computer, 12, 1998, 431-451.
Van Kranenburg, H.L., A.E. Hogenbirk. “Multimedia, Entertainment, and Business Software
Copyright Piracy: A Cross-national Study.” Forthcoming in Journal of Media Economics, 2005.
Varian, H.R. “Markets for Information Goods.” Mimeo. University of California, Berkeley, 1998.
Watt, R. “Prices in Cultural Markets: A Theoretical Introduction for Beginners.” Online document
available at http://www.serci.org/documents/pricing.pdf, 2001.
World Bank (2003). World Development Indicators. Washington, DC: World Bank, 2003.
Zak, P.J. and S. Knack. “Trust and Growth.” Economic Journal, 470, 2001, 295-321

34
Appendix Countries included in the sample: Argentina, Australia, Austria, Bahrain, Bolivia, Brazil, Bulgaria,
Canada, Chile, China, Colombia, Costa Rica, Croatia, Cyprus, Czech. Rep, Denmark, Dom. Rep,
Ecuador Egypt, El Salvador, Estonia, Finland, France, Germany, Greece, Guatemala, Honduras, Hong
Kong, Hungary, India, Indonesia, Ireland, Israel, Italy, Japan, Jordan, Kenya, Korea. Rep, Kuwait,
Lebanon, Lithuania, Malaysia, Malta, Mauritius, Mexico, Morocco, Netherlands, New Zealand,
Nicaragua, Nigeria, Norway, Oman, Pakistan, Panama, Paraguay, Peru, Philippines, Poland, Portugal,
Puerto Rico, Qatar, Reunion, Romania, Russia, Saudi Arabia, Singapore, South Africa, Spain,
Sweden, Switzerland, Taiwan, Thailand, Turkey, UAE, United Kingdom, Ukraine, Uruguay, United
States, Venezuela, Vietnam, Zimbabwe.
Table A.1:. Average piracy rates and income group 1994-2002.
Country Piracy 1994-2002
Low income countries
Lower middle income countries
Upper middle countries
High income OECD countries
High income countries
Argentina 66.89 0 0 1 0 0
Australia 32.55 0 0 0 1 1
Austria 39.00 0 0 0 1 1
Bolivia 85.11 0 1 0 0 0
Brazil 63.22 0 0 1 0 0
Bulgaria 85.55 0 1 0 0 0
Canada 40.78 0 0 0 1 1
Chile 56.78 0 0 1 0 0
China 94.33 0 1 0 0 0
Colombia 60.89 0 1 0 0 0
Costa Rica 74.44 0 0 1 0 0
Czech. Rep 49.55 0 0 1 0 0
Denmark 33.11 0 0 0 1 1
Dominican Republic 74.67 0 1 0 0 0
Ecuador 73.67 0 1 0 0 0
Egypt 74.11 0 1 0 0 0
El Salvador 85.00 0 1 0 0 0
Finland 36.11 0 0 0 1 1
France 44.89 0 0 0 1 1
Germany 34.22 0 0 0 1 1
Greece 73.55 0 0 0 1 1
Guatemala 82.11 0 1 0 0 0
Honduras 76.89 0 1 0 0 0
Hong Kong 59.55 0 0 0 0 1
Hungary 58.78 0 0 1 0 0
India 70.44 1 0 0 0 0
Indonesia 92.00 1 0 0 0 0
Ireland 56.89 0 0 0 1 1
Israel 54.00 0 0 0 0 1
Italy 50.55 0 0 0 1 1
Japan 40.55 0 0 0 1 1

35
Jordan 77.11 0 1 0 0 0
Kenya 73.67 1 0 0 0 0
Latvia 58.50 0 0 1 0 0
Lebanon 86.89 0 0 1 0 0
Malaysia 73.00 0 0 1 0 0
Mauritius 76.11 0 0 1 0 0
Mexico 62.44 0 0 1 0 0
Morocco 69.78 0 1 0 0 0
Netherlands 48.00 0 0 0 1 1
New Zealand 32.55 0 0 0 1 1
Nicaragua 83.55 1 0 0 0 0
Nigeria 72.66 1 0 0 0 0
Norway 42.78 0 0 0 1 1
Pakistan 86.89 1 0 0 0 0
Panama 68.55 0 0 1 0 0
Paraguay 83.67 0 1 0 0 0
Peru 68.67 0 1 0 0 0
Philippines 77.67 0 1 0 0 0
Poland 62.89 0 0 1 0 0
Portugal 49.67 0 0 0 1 1
Puerto Rico 52.67 0 0 1 0 0
Romania 82.78 0 1 0 0 0
Russia 90.44 0 1 0 0 0
Singapore 53.44 0 0 0 0 1
Slovakia 52.67 0 0 1 0 0
Slovenia 75.78 0 0 0 0 1
South Africa 48.00 0 1 0 0 0
Spain 59.11 0 0 0 1 1
Sweden 40.67 0 0 0 1 1
Switzerland 36.89 0 0 0 1 1
Taiwan 59.22
Thailand 81.00 0 1 0 0 0
Turkey 76.55 0 1 0 0 0
Uk 30.78 0 0 0 1 1
Ukraine 91.44 1 0 0 0 0
Uruguay 72.67 0 0 1 0 0
US 25.89 0 0 0 1 1
Venezuela 63.00 0 0 1 0 0
Vietnam 97.44 1 0 0 0 0
Zimbabwe 65.00 1 0 0 0 0
Note: Countries with no missing observations for estimating the baseline model (Table 1) Sources Detailed in the text

36
Table A.2: Average piracy rates by regions (1994-2002).
Regions Mean
Western Europe 39.89 Eastern Europe 74.67 North America 26.89 Latin America 64.22 Asia Pacific 55 Middle East 67.4 Africa 61
Table A.3: Definitions and sources
Variable Source
Software piracy rate (%) International Planning Research Corporation (IPRC, 2003)
Gross national product La Porta et al. (1999)
Gini index, and income shares (quintiles)
Dollar and Kraay (2002)
Individualism index Hofstede (1997,2000)
Patent rights index Ginarte and Park (1997)
Control of institutional quality Kaufman, Kraay and Mastruzzi (2003)
Secondary school enrollment, gross (%)
World Development Indicators database (World Bank, 2003)
Tertiary school enrollment, gross (%) World Development Indicators database (World Bank, 2003)
Internet Users World Development Indicators database (World Bank, 2003)
Urbanization World Development Indicators database (World Bank, 2003)
Male Youth unemployment World Development Indicators database (World Bank, 2003)
Male unemployment World Development Indicators database (World Bank, 2003)
Openness (% GDP) World Development indicators (World Bank, 2003)
Internet users World Development Indicators database (World Bank, 2003)
Number of computers (1,000 hab) World Development Indicators database (World Bank, 2003)
Legal origin (british, socialist, french, german, and Scandinavian)
World Development Indicators database (World Bank, 2003)
Ethnolinguistic fractionalization La Porta et al. (1999)
Information and technology expenditures (% GDP)
World Development Indicators database (World Bank, 2003)
Research and development expenditures (% GDP)
World Development Indicators database (World Bank, 2003)
% male 15-19 years Available throught http:www
% male 20-29 years Available throught http:www
% male 30-39 years Available throught http:www
Life expectancy World Development Indicators database (World Bank, 2003)

37
Birth rate World Development Indicators database (World Bank, 2003)
Table A.4: Summary statistics of variables
Variable Obs Mean Std. Dev Min Max LPR (94-02) 71 4.11 0.319 3.25 4.58 GINI (60-95) 71 39.43 10.08 20.55 60.8
LGDP (70-95) 71 7.83 1.24 5.31 10.52
IDV 71 41.52 22.97 6 91 Q1 71 0.06 0.022 0.025 0.113
Q2-Q4 71 0.476 0.068 0.328 0.564 Q5 71 0.46 0.086 0.329 0.648
LAW (96) 66 0.51 0.94 -1.14 2.05 PRIGHT (95) 69
Legal origin (British) 65 0.26 0.44 0 1 Legal origin (French) 65 0.46 0.50 0 1
Legal origin (Socialist) 65 0.15 0.36 0 1 Legal origin (German) 65 0.06 0.24 0 1
Male youth unemployment 56 16.03 9.09 3.56 51.45
Male unemployment rate 63 8.91 4.69 1.8 21.3 Secondary school
enrollment 66 78.73 30.16 25.55 146.47 Tertiary school
enrollment 66 31.23 19.49 1.75 78.85 % Urbanization (94-99) 66 64.09 19.34 19.43 100
Information and technology expenditures 46 5.17 1.98 1.32 9.33
Computers per 1,000 hab (94-99) 65 97.89 115.59 1.98 395.36
Internet users (94-99) Openess 66 75.09 50.88 18.22 321.72
Ethnolinguistic fractionalization 62 0.25 0.25 0.0025 0.8567
Research and Development
expenditure (94-99) 52 1.08 0.91 0.06 3.67 % male 15-19 years 63 4.58 0.93 2.93 6.16 % male 20-29 years 63 8.27 0.92 6.56 10.94 % male 30-39 years 63 7.07 1.01 5.16 10.55 % Protestant (80) 66 44.05 40.53 0 96.9 % Catholic (80) 66 13.02 23.25 0 97.8 % Muslim (80) 66 10.91 26.03 0 99.4
Life expectancy (70-95) 69 66.48 8.61 36.86 76.64
Birth rate (70-95) 69 24.47 10.83 10.87 47.35

38
Table A.5: Correlation matrix between the key variables (obs= 66)
LGNP IDV LAW PRIGHT Q1 Q2-Q4 Q5 GINI
LGNP 1
IDV 0.7306 1 LAW 0.8607 0.6675 1
PRIGHT 0.7916 0.7049 0.7072 1 Q1 0.1790 0.3510 0.1960 0.1462 1
Q2-Q4 0.5279 0.6059 0.5454 0.4413 0.8011 1 Q5 -0.4618 -0.5722 0.6283 -0.3851 -0.8808 -0.9890 1
GINI -0.4276 -0.5506 -0.4274 -0.3466 -0.9142 -0.9548 0.9812 1
Table A.6: High Income OECD Countries
(1) (2) (3) (4)
IDV -0.003 -0.002 -0.003 -0.01
(0.78) (0.31) (0.52) (0.4)
LAW -0.494** -0.363 -0.471* -0.322
(2.32) (1.59) (1.82) (0.9)
PRIGHT 0.086 0.148 0.247 0.437
(0.37) (0.38) (0.54) (0.31)
Q1 -10.246
(0.75)
Q2-Q4 -10.973
(0.63)
Q5 9.134
(0.74)
GINI 0.126
(0.36)
Constant 5.119*** 9.767 0.133 -0.915
(8.11) (1.22) (0.02) (0.06)
# observations 18 18 18 18
R2 (centered) 0.4809 -0.3458 -0.2884 -1.7520
F (LAW and PRIGHT vars only) (p-value)
4.78 (0.028)
1.30 (0.305)
1.85 (0.196)
0.63 (0.548)
Partial R2 (1st) 0.1992 0.047 0.068 0.015 Sargan over-id test chi2 (p-value)
1.106 (0.293)
0.184 (0.668)
0.005 (0.945)
0.180 (0.671)
Pagan Hall test (p-value)
1.788 (0.878)
0.985 (0.964)
0.748 (0.980)
0.397 (0.995)
F (1 st) (p-value)
1.49 (0.264)
0.29 (0.751)
0.44 (0.655)
0.09 (0.915)
Notes: Absolute value of t-statistics in parentheses. ***, **, and *, indicate statistical significance at the 1%, 5% and 10% levels, respectively. United Kingdom, and USA are removed from the analysis because they are influential observations. Results are robust to outliers and influential observations. Income inequality measures are instrumented.