workshop 5 - health of the bay of fundy assessing key...
TRANSCRIPT
Health of the Bay of Fundy: Assessing Key Issues
Proceedings of the 5th Bay of Fundy Science Workshopand Coastal Forum, “Taking the Pulse of the Bay”
Wolfville, Nova ScotiaMay 13-16, 2002
Editors
P. G.Wells, G. R. Daborn, J. A. Percy, J. Harvey and S. J. Rolston
Environment Canada – Atlantic RegionOccasional Report No. 21
Environment Canada, Dartmouth, NS and Sackville, NBMarch 2004
ii
Acknowledgements
This publication should be cited as:
P. G.Wells, G. R. Daborn, J. A. Percy, J. Harvey and S. J. Rolston. (Eds.). 2004. Health of the Bay ofFundy: Assessing Key Issues. Proceedings of the 5th Bay of Fundy Science Workshop and CoastalForum, “Taking the Pulse of the Bay”, Wolfville, Nova Scotia, May 13-16, 2002. Environment Canada- Atlantic Region, Occasional Report No. 21, Environment Canada, Dartmouth, Nova Scotia andSackville, New Brunswick, 416 pp.
Copies can be obtained from:
Ecosystem Science and Information DivisionCanadian Wildlife ServiceEnvironmental Conservation BranchEnvironment Canada - Atlantic Region45 Alderney DriveDartmouth, Nova Scotia, B2Y 2N6
Bay of Fundy Ecosystem Partnership (BoFEP)Acadia Centre for Estuarine ResearchAcadia UniversityWolfville, Nova Scotia, B4P 2R6
Published under the authority of the Minister of Environment
ISBN 0-662-32818-3ISSN 1195-664XCatalogue No. CW69-12/21-2004E

iii
Acknowledgements
Table of Contents
PrefaceWorkshop OrganizersSponsorsAcknowledgmentsThe Bay of Fundy Ecosystem Partnership (BoFEP)Global Programme of Action Coalition for the Gulf of Maine (GPAC)
Workshop Background Paper
Assessing the Health of the Bay of Fundy – Concepts and FrameworkPeter G. Wells 1
PAPER PRESENTATIONS
Session 1: Coastal Zone and Information Management
Coastal Zone Management and Integrated Ocean Management: Where do the Concepts Meet?Marianne Janowicz and Robert Rutherford 43
EMAN and Protected Areas: Co-operating in Providing Information for Ecozone andLocal Ecosystem ManagementBrian Craig and Hague Vaughan 51
Gulf of Maine Biogeographical Information System Pilot Study: Consolidation ofMarine Data SetsAngela J. Martin, Lou Van Guelpen, and Gerhard Pohle 58
Development of a Canadian Atlantic Biodiversity Information System by theAtlantic Reference CentreAmanda McGuire, Lou Van Guelpen and Gerhard Pohle 59
Geomatics Research Along the Bay of Fundy Coastal ZoneTim Webster, David Colville, Bob Maher and Dan Deneau 60
Session 2: Climate and Sea Level Change
Evidence of Late Holocene Sea Level and Tidal Changes in the Bay of Fundy: How RisingSea Level has Lowered the Flood RiskJohn Shaw, Carl L. Amos, Charles T. O’Reilly and George S. Parkes 63
iv
Contents
Changing Sea Level–Changing Tides in the Bay of FundyDavid Greenberg 64
Mitigation of Natural Hazards: Storm Surges, Rising Sea Levels and Coastal ErosionCharles T. O’Reilly, Glen King, John Shaw, Russ Parrott, Robert Taylor and George S. Parkes 65
Regional Climate Change Scenarios in Atlantic Canada Utilizing Statistical DownscalingTechniques: Preliminary ResultsGary S. Lines and Elaine Barrow 66
Session 3: Fish and Fisheries
Population Description, Status, Listing Under COSEWIC and Recovery Actions forInner Bay of Fundy Atlantic Salmon (Salmo salar)Peter G. Amiro 75
A Hypothesis Concerning the Decline of Adult Returns to Wild and Cultivated Populations ofAtlantic Salmon in the North Atlantic and the Relationship to Their Ocean MigrationMichael Dadswell, Michael Stokesbury, Joseph Rassmussen and Roger A. Rulifson 79
Local Knowledge and Local Stocks: Evidence for Groundfish Spawning Activity in theBay of FundyJennifer Graham 81
Distribution of Rare, Endangered and Keystone Marine Vertebrate Species inBay of Fundy SeascapesKate A. Bredin, Stefan H. Gerriets and Lou Van Guelpen 83
Changes in the Brown Seaweed Ascophyllum nodosum (Le Joly) Plant Structure andBiomass Produced by Cutter Rake Harvests in Southern New BrunswickRaul A. Ugarte and Glyn Sharp 99
Biological Reference Points for Bay of Fundy Alewife FisheriesJamie F. Gibson and Ransom A. Myers 100
Session 4: Wildlife and Habitat Conservation
The Semipalmated Sandpiper in the Bay of Fundy, 1981–2001: Declines in the Eastern PopulationPeter W. Hicklin and John W. Chardine 111
The Nature Conservancy of Canada – Upper Bay of Fundy ProjectJosette Maillet 118

v
Contents
Bird Communities of Bay of Fundy Coastal WetlandsAl Hanson 120
Monitoring of Common Loon (Gavia immer) Breeding Success on Wolfe Lake,Fundy National ParkDouglas Clay, Shirley Butland, Ewan Eberhardt, and Joseph Kerekes 121
Wildlife Habitat Stewardship in the Agricultural Landscape of Nova ScotiaJames Ferguson 123
Wetland and Riparian Edge Conservation in the Agricultural LandscapeReg B. Newell 124
Session 5: Contaminants and Ecosystem Health
An Empirical Model of Mercury Cycling in Passamaquoddy BayElsie Sunderland and Frank A.P.C. Gobas 129
Mathematical Models to Estimate the Freshwater and Contamination Discharge to Coastal AreasDue to Anthropogenic ActivitiesGhosh A. Bobba 139
Assessment of the Environmental Risks Associated with Chemical Use in Finfish AquacultureBill Ernst, Roy Parker, Ken Doe, Paula Jackman, Gary Julien and Jamie Aube 151
Assessment of Benthic Community Structure Near Mariculture Sites in Passamaquoddy Bayand the Letang InletGerhard Pohle, Vicky Merritt and Kats Haya 152
Heavy Metals in Rock Crab (Cancer irroratus), Lobster (Homarus americanus) and Sedimentsfrom the Inner Bay of Fundy, Atlantic CanadaChiu L. Chou, Lisa A. Paon, John D. Moffatt, and B. M. Zwicker 153
Assessment of Persistent Industrial Marine Debris: Charlotte County, New BrunswickChristine Anne Smith 160
The Comparative Toxicity of Orimulsion® and No. 6 Fuel Oil to the Sediment DwellingAmphipod, Corophium volutatorIsabel C. Johnson, Ken Doe and Paula Jackman 170
Assessing Nutrification in the Bay of Fundy: Seaweeds as Excellent but UnderutilizedBioindicators for Integrated Coastal ManagementThierry Chopin, Ellen Belyea, Christopher Pearce, Tara Daggett, Gary Saunders and Colin Bates 177

vi
Contents
The Helminth Communities of Five Shorebird Species in the Bay of Fundy,New Brunswick, CanadaAndy S. Didyk and Michael B. D. Burt 178
Annapolis River Guardians: Reflections on a Decade of Volunteer Water Quality MonitoringStephen Hawboldt and Shelley Pittman 179
The Canadian Community Monitoring Network (CCMN)Marieka Arnold 180
Panel Discussion 181
Session 6: Corophium and Mudflat Ecology
Spatial and Temporal Variation of Suspended Sediment Concentration in the Cumberland Basin,Bay of Fundy, CanadaJeff Ollerhead, Jennifer F. Parry and Robin G. D. Davidson-Arnott 187
Conceptual Model of the Seasonal and Spatial Controls on Sediment Deposition and Erosion in anUpper Bay of Fundy Salt MarshDanika van Proosdij, Robin G. D. Davidson-Arnott and Jeff Ollerhead 194
Mudflat Diatoms in the Bay of Fundy: What is Known About Them?Irene Kaczmarska and Marsha Trites 195
Benthic Diatoms from Two Intertidal Mudflats in the Upper Bay of FundyMarsha Trites, Peter Hicklin, Jeff Ollerhead, and Irena Kaczmarska 200
Population Dynamics of Corophium volutator in the Upper Bay of Fundy:Past and Present ResearchMyriam A. Barbeau and Diana J. Hamilton 208
Quantifying Relationships Among Species on Intertidal Mudflats in the Upper Bay of Fundy:Community-level Interactions and the Influence of Abiotic FactorsDiana J. Hamilton, Myriam A. Barbeau, and Antony W. Diamond 209
Laboratory Investigations of Ecosystem Health Using Corophium volutator: Chemical andBiological EndpointsJocelyne Hellou, Kerry Cheeseman, Elaine Desnoyers, Anette Gronlund, Dawn Johnston,Jim Leonard, Sarah Robertson and Sean Steller 210

vii
Contents
Does Parasitism Contribute to Segregation in Migrating Shorebirds?Andy S. Didyk 213
Panel Discussion 214
Session 7: Minas Basin
Moving Towards Integrated Management of the Minas Basin: A Capsule Summary of ProgressPat Hinch 221
Planning for Action in the Minas Basin Watershed: A Summary of the BoFEP Minas BasinCommunity ForumsRobin Willcocks-Musselman 228
“… through a glass, darkly”: Water and Climate Change in the Bay of Fundy WatershedGraham Daborn 248
East-flowing Rivers Baseline Water Quality SurveyMichael Brylinsky and N. Pindham 254
Tidal Restrictions: Opportunities for Salt Marsh and Tidal River Restoration in Nova ScotiaTony M. Bowron 256
A Stewardship Approach to Protect Shorebirds and Their Habitat in the Minas BasinDonald Sam 258
The Reference Condition Approach: On Trial in the Minas BasinMaxine C. Westhead and Trefor B. Reynoldson 262
Panel Discussion 267
Session 8: Ecotourism: Opportunities and Impacts
Gaining an Even Keel in Canada’s Coastal Zone: Towards Sustainable Tourism DevelopmentPeter W. Williams 277
Community-Based Tourism Case StudiesThomas Young 285
Fundy National Park, Human Use Impact Pilot ProjectSean Murphy 291

viii
Contents
From Conservation to Conversation – Why Biosphere Reserves MatterMunju Monique Ravindra 292
Considering Conservation and Ecotourism: From the Biosphere to the Classroom and BackBradley B. Walters 300
Panel Discussion
301The Bay of Fundy Coastal Forum: “Taking the Pulse of the Bay”
Taking the Pulse of the Seas. Can it be Done?J. B. (Jack) Pearce 309
Two Hundred Years of Ecosystem Change in the Outer Bay of FundyPart I – Changes in Species and the Food WebHeike K. Lotze, Inka Milewski and Boris Worm 320
Two Hundred Years of Ecosystem Change in the Outer Bay of FundyPart II – A History of Contaminants: Sources and Potential ImpactsInka Milewski and Heike K. Lotze 327
Poster Session
A. Organizations
Global Programme of Action Coalition for the Gulf of MaineJanice Harvey 337
Salt Marshes and Restricted Tidal Systems – A BoFEP Working GroupZsofi Koller 338
Canadian Climate Impacts and Adaptation Research Network (C-CIARN) AtlanticKyle MacKenzie 339
The Bay of Fundy Ecosystem Partnership (BoFEP)Jon Percy, Graham Daborn and Peter G. Wells 340
Marine Invertebrate Diversity Initiative (MIDI)Jayne Roma, Peter G. Wells and Derek Davis 341
ix
Contents
Current Activities of the Corophium Working Group (BoFEP) in the Upper Bay of FundyPeter G. Wells, Diana Hamilton, Myriam Barbeau, Peter Hicklin, Michael Brylinskyand Graham Daborn 342
B. Projects
A Multidisciplinary Approach with the Integration of Three Trophic Levels (Fish/Shellfish/Seaweed)for the Development of Sustainable Aquaculture SystemsSusan Bastarache, Thierry Chopin, Shawn Robinson, Terralynn Lander, Bruce MacDonald,Katsuji Haya, Dawn Sephton, Jennifer Martin, Frederick Page and Ian Stewart 343
Changes in Biological Productivity Induced by Barriers on Macro-tidal Systems: A Study of theWindsor Causeway and Associated Salt MarshesTony M. Bowron 344
Identification of Sensitive Marine and Coastal Areas in the Bay of Fundy, Gulf of Maine, CanadaMaria-Ines Buzeta, Rabindra Singh and Sharon Young-Lai 348
Predicting Mercury Abundances in Northeastern North American Freshwaters Using GISApproaches: From Local to Regional PerspectivesThomas A. Clair, Fan Rui Meng, Paul Arp and David Evers 349
Preliminary Results of a Study on the Prevalence and Bioaccumulation of Methyl Mercury in theFood Web of the Bay of Fundy, Gulf of MaineJohn Dalziel, Gareth Harding and Peter Vass 350
Modelling Salt Marsh Sedimentation, Sediment Accretion Rates and Sediment Budgets for ThreeDistinct Marsh GeometriesMarie-Therese Graf 352
Unintentional Use of Organic Contaminants in Aquaculture and Impact on SedimentsJocelyne Hellou, Katsuji Haya, Les Burridge and Sean Steller 353
Audit of Tidal Barriers in the Cumberland Basin and Memramcook River in the Upper Bay of Fundy,2001Zsofi Koller 356
Spatial Analysis of Spartina alterniflora Colonization on the Avon River Mudflats, Bay of Fundy,Following Causeway ConstructionSarah M. Townsend and Danika van Proosdij 357
x
Contents
Marine Environmental Quality (MEQ) Indicators for the Bay of FundyMaxine Westhead 358
C. Management Initiatives
Integrated Management of Canada’s Oceans and CoastsDavid Duggan 359
Integrated Management of Minas Basin, Bay of Fundy – Activities of the Minas BasinWorking Group, BoFEPPatricia Hinch, Michael Brylinsky, Robin Musselman, Jon A. Percy and Peter G. Wells 360
Upper Bay of Fundy Fisheries: An Integrated Management Pilot ProjectBarry C. Jones 361
Minutes of the BoFEP Annual General Meeting 365
List of Participants 373
Index 391

xi
Contents
Preface
The 5th BoFEP Bay of Fundy Science Workshop, the most recent in a series of Fundy Work-shops launched in 1996, was held at Acadia University, Wolfville, NS, May 13-16, 2002. Its theme was“The Health of the Bay of Fundy: Assessing Key Issues”. This reflected a desire to continue examiningissues in an integrated and ecosystem-based manner as they may affect the structure and function of thewhole bay, its watersheds and adjacent waters.
Following a trend set by the 2nd and 4th Fundy Science Workshops, this meeting also involved asecond major sponsor. GPAC (the Global Programme of Action Coalition for the Gulf of Maine) joinedBoFEP in conducting, as part of the workshop program, a Bay of Fundy Coastal Forum entitled “Tak-ing the Pulse of the Bay”. The forum was a Canadian contribution to the joint, on-going, Gulf of MaineCouncil on the Marine Environment – GPAC initiative to report on the state of the Gulf of Maine-Bayof Fundy by late 2004.
The workshop had 16 sponsors, 180 participants, six concurrent paper sessions, four paneldiscussions, an on-going poster session, and 1.5 days of plenary discussion and working sessions aspart of the Coastal Forum. It ran for 2.5 days. We were honored by the presence of two eminent guestspeakers, Mr. David Phillips of Environment Canada, Toronto, and Dr. J. A. (Jack) Pearce of the Buz-zards Bay Laboratory, Falmouth, Massachusetts. Some challenging Maritime spring weather notwith-standing, the workshop was judged a success by all who attended. It was especially encouraging thatparticipants represented many sectors, from scientific institutions to communities and non-governmen-tal groups, a true mixing of different interests. All were willing to share their ideas, knowledge, energyand thoughts of the future of the bay. More than 100 people contributed to the Coastal Forum.
These proceedings contain the abstracts and papers presented at the workshop and the paperspresented at the Coastal Forum. The workshop papers highlight eight current key topics: coastal zoneand information management; climate and sea level change; fish and fisheries; wildlife and habitatconservation; contaminants and ecosystem health; Corophium and mudflat ecology; Minas Basin; andecotourism opportunities and impacts. The principal panel discussions are summarized herein. Postersfeatured organizations, specific projects on Fundy, and diverse management initiatives. A backgroundpaper on Fundy health, prepared as a working document for this meeting, is included. The CoastalForum discussed and debated five key questions pertaining to the health of the Bay of Fundy. Thesediscussions are being prepared as a separate Fundy Coastal Forum report in 2004.
P. G. Wells1, G. R. Daborn2, J. A. Percy3, J. Harvey4, and S. J. Rolston5
Workshop Chairs and EditorsMarch 20041 Environmental Conservation Branch, Environment Canada2 Acadia Centre for Estuarine Research, Acadia University3 Sea Pen Communications4 Conservation Council of New Brunswick5 Seawinds Consulting Services

xii
Contents
Workshop Organizers
Workshop Co-chairsGraham Daborn and Peter Wells
Workshop Program CommitteePeter Wells and Jon Percy (Co-chairs)Mike BrylinskyThierry ChopinDebra DugasChris GreeneDiana HamiltonJanice HarveyStephen HawboltPat HinchBarry JonesJeff OllerheadNancy Roscoe-Huntley (Logistics Chair)Maxine Westhead
Logistics CommitteeNancy Roscoe-Huntley (Chair)Debra DugasBarry JonesJon PercyPeter WellsMaxine Westhead
Sponsors
The 5th Bay of Fundy Science Workshop and Coastal Forum were sponsored by:
Acadia Centre for Estuarine ResearchAcadia UniversityAcadia University BookstoreBay of Fundy Ecosystem Partnership (BoFEP)Conservation Council of New Brunswick.Environment Canada, Environmental Conservation BranchFisheries and Oceans Canada, Bedford Institute of OceanographyGlobal Programme of Action Coalition for the Gulf of Maine (GPAC)Gulf of Maine Council on the Marine EnvironmentHuntsman Marine Science CentreNova Scotia Department of Agriculture and FisheriesNova Scotia Department of Environment and LabourParks CanadaSodexho CanadaTown of WolfvilleWorld Wildlife Fund Atlantic Region
xiii
Contents
Acknowledgements
Many people and groups contributed to make the 5th Workshop and Coastal Forum a success. Inparticular, the authors of all contributions and the participants are greatly thanked for their interest andenthusiastic participation; the Fundy workshops are now a recognized biennial event reflecting theirwork and interests in the Bay of Fundy region. Members of the organizing committees worked long andhard, notably members of the logistics committee before and during the meeting, under the able hand ofNancy Roscoe-Huntley. The distinguished speakers David Phillips and Jack Pearce are thanked fortheir special efforts to attend the meeting. We had many sponsors and they were much appreciated.Acadia University hosted the workshop and made all participants very welcome throughout their stay inthe residences and in the meeting hall. Finally, Susan Rolston is warmly thanked for her skilled workcopy-editing the final Proceedings.
xiv
Contents
The Bay of Fundy Ecosystem Partnership (BoFEP)
The Bay of Fundy Ecosystem Partnership (BoFEP) was formed to identify and try to understandthe problems confronting the Bay and to find ways of working together to resolve them. It is a flexibleand still evolving organisation for encouraging and facilitating communication and co-operation amongindividuals and groups with a stake or an interest in Fundy and its resources. BoFEP is set up as a“Virtual Institute”, whose main objective is to foster wise conservation and management of the Bay’snatural resources and diverse habitats, by disseminating information, monitoring the state of the eco-system and encouraging co-operative research, conservation and other activities.
BoFEP welcomes all partners who share the vision of a healthy, diverse, productive Bay ofFundy, be they individuals, community groups, First Nation groups, resource harvesters, scientists,resource managers, coastal zone planners, businesses, government agencies, industries or academicinstitutions. By sharing our knowledge and coordinating our individual efforts we can ensure that presentand future generations will be able to benefit from Fundy’s rich and varied bounty and continue toappreciate its awesome beauty and diversity.
To learn more about BoFEP visit: <http://www.auracom.com/~bofep>
Global Programme of Action Coalitionfor the Gulf of Maine (GPAC)
In 1995 more than 100 countries, including the United States and Canada, adopted a GlobalProgramme of Action for the Protection of the Marine Environment from Land-based Activities (GPA).The GPA is administered through the United Nations Environment Programme. It requires participatingcountries to develop action plans to reduce the effects on the marine environment of activities takingplace on their lands.
Earlier, in 1993, the United States, Canada and Mexico had signed the North American Agree-ment on Environmental Cooperation, undertaking to work together to protect the environment in NorthAmerica. The North American Commission for Environmental Cooperation (CEC) was set up to pro-mote and coordinate the joint activities.
As one of these joint activities that also contributes to the GPA, the CEC created and providedresources for the Canada - United States Gulf of Maine Pilot Project from 1996 to 2000. The cross-sector working group known as the Global Programme of Action Coalition for the Gulf of Maine(GPAC), started in 1996, is continuing to work to reduce risks from land-based activities that affect theGulf of Maine.
To learn more about GPAC visit: <http://www.gpac-gom.org>

1
Workshop Background Paper
Workshop Background Paper
ASSESSING THE HEALTH OFTHE BAY OF FUNDY –
CONCEPTS AND FRAMEWORK
Peter G. Wells,Coastal and Water Science Section, Canadian Wildlife Service,Environmental Conservation Branch, Environment Canada,
Dartmouth, Nova Scotia
A version of this paper was published as P.G. Wells, “Assessing health of the Bay of Fundy–concepts andframework,” (2003) 46 Marine Pollution Bulletin 1059-1077.

2
Health of the Bay of Fundy: Assessing Key Issues

3
Workshop Background Paper
Abstract
A discussion of health and ecosystem health concepts and a conceptual framework for assess-ing health of the Bay of Fundy are presented. The framework includes:
1. Concepts – What is health? What is ecosystem health (EH) and marine ecosystem health(MEH)? How does EH relate to other closely related concepts and principles, i.e. environ-mental quality (especially marine), ecosystem integrity and ecosystem sustainability ?
2. Importance – Why is EH important, and what are the linkages to people, i.e. human health?3. Approaches and Techniques – How do we monitor and measure EH, and in that context,
ecosystem or ecological change? What are the monitoring approaches and tools? What is anappropriate set of EH indicators and indices for the Bay of Fundy and Gulf of Maine? At thepresent time, can we make unequivocal statements about the status and trends in EH meas-ures of the Bay of Fundy? Do we have adequate guidelines, objectives and standards forassessing environmental quality and EH?
4. Connecting with Management Needs – Do we have adequate mechanisms in place toaddress MEH, marine environmental quality (MEQ) and environmental sustainability in theBay of Fundy? What is the role of periodic marine assessments (e.g., state of the marineenvironment reports) in this activity? What kinds of new directions and new ecosystemscience should be given priority, given the above analysis and the collective answers of theworkshop participants? What kinds of other new activities should be pursued?
For the Bay of Fundy Coastal Forum at this workshop, five core questions flowing from the healthframework served to initiate and focus the discussions:
1. Current State – What is the present health or condition of the Bay of Fundy?2. Changes – Are conditions improving or deteriorating?3. Indicators – What kinds of indicators do we consider most useful in trying to answer these
questions?4. Existing Resources – Are there adequate resources (e.g., institutional, financial, scientific,
regulatory) to protect or restore the health of the Bay?5. Needs – What kinds of new information and approaches do we need to protect the health of
the Bay?
The background information and ideas of this paper were intended to assist discussion at theworkshop, and to help identify the next steps, both individual and collective, for assessing the healthof the Bay of Fundy.

4
Health of the Bay of Fundy: Assessing Key Issues
Contents
1. Introduction .................................................................................................................................... 5
2. Concepts of Health and Ecosystem Health ..................................................................................... 62.1 Current Health and State of the Ecosystem......................................................................... 7
2.1.1 Health .......................................................................................................................... 72.1.2 Ecosystem health ......................................................................................................... 82.1.3 Marine ecosystem health ........................................................................................... 132.1.4 Ecological condition and state of the environment ................................................... 162.1.5 Ecological integrity ................................................................................................... 172.1.6 Coastal health ............................................................................................................ 18
2.2 Longer-Term Ecosystem Change ...................................................................................... 182.2.1 Change and ecological change .................................................................................. 192.2.2 Marine environmental quality ................................................................................... 20
2.3 Connections Between Human Health and Ecosystem Health and Integrity ..................... 21
3. A Framework for Assessing Health of the Bay of Fundy ............................................................. 213.1 Dimensions of the Marine Ecosystem Health Concept – A Synopsis ............................... 223.2 Background Considerations and Importance of ‘Healthy Marine Ecosystems’ ............... 233.3. Approaches and Techniques for Assessing the Bay’s Health ........................................... 23
3.3.1 Monitoring approaches .............................................................................................. 243.3.2 Indicators and indices ................................................................................................ 253.3.3 Status and trends analysis .......................................................................................... 26
3.4 Connecting with Management Priorities and Needs ......................................................... 263.4.1 Mechanisms for action .............................................................................................. 273.4.2 New directions .......................................................................................................... 27
4. The Coastal Forum: “Taking the Pulse of the Bay of Fundy” ...................................................... 274.1 Guiding Questions for Discussion .................................................................................... 274.2 Developing the Synthesis .................................................................................................. 28
5. Summary and Conclusions ........................................................................................................... 29
6. Acknowledgments ........................................................................................................................ 29
7. Literature Cited ............................................................................................................................. 29

5
Workshop Background Paper
For whoever knows the ways of nature will more easily notice her deviations;and on the other hand, whoever knows her deviations will more accurately knowher ways.
Francis Bacon 1620, cited in Sherman, B. H. 2000
1. Introduction
The Bay of Fundy is a large macro-tidal embayment, forming the north-eastern arm of the Gulfof Maine. It is closely linked oceanographically to the greater Gulf of Maine, the Scotian Shelf andNorth-western Atlantic, and receives the inputs of 44 major rivers and countless smaller ones. It isbounded by two provinces with 1.5–2 million people, is extensively used by the fishing, shipping,aquaculture and other industries, and has two moderate-sized cities and many towns and villages alongits shores.
The workshop’s theme was the “Health of the Bay of Fundy – Assessing Key Issues”. The Bayof Fundy is faced with a number of major issues, 38 by our count at the first workshop in 1996 (Percyet al. 1997, Chapter 6). At this workshop, we wished to assess progress since 1996 (Percy et al. 1997)in identifying and clarifying the issues, and through panel and informal discussions to plot a pathforward for research, monitoring and management action. A primary objective of the workshop, throughthe Coastal Forum, was to contribute to the state of environment (SOE) assessment activities of boththe Global Programme of Action Coalition for the Gulf of Maine (GPAC) Summit process, and thethird Action Plan (2001–2006) of the Gulf of Maine Council on the Marine Environment (GOMCME2002).
For such SOE or health assessments, data and information are required from a large number ofindicators used for monitoring and describing the health of the environment – in this case, the Bay ofFundy. Also required is a process (an outline or framework) for producing periodic, carefully prepared,peer-reviewed reports on the Bay’s health, in the context of the greater Gulf of Maine. Such monitoring,analysis and reporting involves the contributions of many people and organizations (a consideration ofmany perspectives on the approach and necessary information), understanding of some key concepts,and the incorporation of the experiences and knowledge of people who know the Bay. It also requirescommitment, time and some money!
The task of assessing the Bay’s health is not simple. Many other ‘state of the environment’reports have shown the task of objective analysis and synthesis to be challenging – ecosystems arecomplex, incompletely known and always changing, and the measures of health, ecosystem health andenvironmental quality are in their infancy. It is important to avoid the pitfalls of the recent tome TheSkeptical Environmentalist (Lomborg 2001), where oversimplification, incomplete knowledge and biascolored the analysis, according to most reviewers. Once a credible approach is chosen for the Bay ofFundy, there is a very large literature and experience to distill. The north-west Atlantic and the Gulf ofMaine benefit from more than 100 years of oceanographic study (from the works of Bigelow andHuntsman, to Plant 1985, Backus and Bourne 1987, and Percy et al. 1997, amongst many other sources).
6
Health of the Bay of Fundy: Assessing Key Issues
The challenges notwithstanding, we should try to produce a current assessment of the Bay of Fundy,and in turn, a report for the greater Gulf of Maine. It is hoped that the current series of Fundy ScienceWorkshops, the GPAC forums, and many other meetings occurring in the Gulf of Maine watershed willcontribute substantially to this effort.
Given these objectives, this paper presents a brief review of current concepts of ecosystemhealth, environmental quality and ecosystem integrity; a summary of what is required in health meas-urements, e.g., the indicators of ecosystem health, for the Bay of Fundy; and a framework for theprocess of assessing the health of the Bay of Fundy and its key issues.
2. Concepts of Health and Ecosystem Health
Various conceptual frameworks have been presented for assessing ecosystem health and envi-ronmental quality. Rapport (1986) described a stress-response framework and used it as the basis forCanada’s early SOE reports. The Marine Environmental Quality (MEQ) Working Group of Environ-ment Canada built on Rapport’s stress-response model and presented a framework with four compo-nents – characteristics and uses, stress factors, ecosystem responses (using indicators), and health orcondition of the environment (Wells and Rolston 1991). Harding (1992) presented the MEQ model asincluding stressors, characteristics of exposure, measurement of effects, and indicators of quality. Mostrecently, Smiley et al. (1998) presented a modified MEQ framework, with the components being con-dition, stress, effects and response (indicators). Finally, Fisheries and Oceans Canada (2000) succinctlydescribed MEQ in the new Oceans Act as involving guidelines and objectives, indicators and assess-ment. Westhead elaborates on this framework in these Proceedings (see pages 262-266).
The various approaches show some common needs in coastal and ocean assessments. Theseare: (1) understanding of the habitats and ecosystem(s) under consideration, and recognition of whatwe do not know well or at all, given ecosystem complexity; (2) indicators of ‘health’ and ‘quality’ thatcan be developed by research and used in monitoring; and (3) a feedback loop via assessments, moni-toring, and management and societal action (through a range of mechanisms, including regulations).Mechanisms are required to complete the loop, such as this workshop, and periodic reports and report-cards on progress.
By necessity, various terms are used in this field, but not always in the same way. After all, thefield is interdisciplinary and evolving. However, this causes confusion both in conceptualizing theissue of ‘ecological or ecosystem health’ and in its application, i.e. conducting assessments and prioritizingissues. One solution, a major part of this paper, is to discuss the key terms and concepts; they includehealth, ecosystem health, ecological health, coastal health, ecological condition, ecological integrity,ecological change, and (marine) environmental quality.
One view of the relationship between the various health concepts, time and space, and level ofbiological organization is shown in Table 1. Health and integrity are a description of the current state,condition or status, a view over the short term (one to a few generations, varying with organism, lasting

7
Workshop Background Paper
from hours to decades). Quality and change are a description of trends from the ‘baseline’ or original,undisturbed conditions, a view over the longer term (many generations and life spans, covering dec-ades to centuries). In practice, as shown below, ecological or ecosystem integrity are used to describeboth short- and long-term conditions. Importantly, the terms are used precisely in relation to level ofbiological organization, i.e. an individual organism is healthy or unhealthy, whereas a community hasor lacks ecological integrity. These distinctions are not trivial as they reflect the need for quite differentindicators of condition across the structural and functional components of ecosystems.
Table 1. How the terms and concepts on health and ecosystem health relate, across time, space andlevels of biological organization
* Ecosystem health** Ecological or ecosystem integrity*** Environmental quality
2.1 Current Health and State of the Ecosystem
2.1.1 Health
Health, as in ocean health or health of the oceans, is a commonly used and publicly acceptedterm referring to the condition or state of the seas (note Goldberg 1976; Kullenberg 1982; Wells andRolston 1991; McGinn 1999; Knap et al. 2002). But, curiously, its users usually avoid exact definitionsof the word or phrase! Health is defined in the Oxford dictionary as “soundness or condition of body(good, poor, bad, ill, health)” (Sykes 1976). Health means freedom from or coping with disease on theone hand (the medical view), and the promotion of well-being and productivity on the other (the publichealth view); “in essence, there are two dimensions of health – the capacity for maintaining organiza-tion or renewal, and the capacity for achieving reasonable human goals or meeting needs” (Nielsen1999). Importantly, Nielsen states that “health is not a science per se; it is a social construct and itsdefining characteristics will evolve with time and circumstance”. Earlier, Rapport et al. (1980) consid-ered the concept of health and the need to recognize vital signs, a topic explored below under “indica-tors”. Finally, health is usually defined by what is NOT, such as “the occurrence of disease, trauma ordysfunction” (Gove 1993). Therefore, a healthy marine environment requires individuals (ecologically,individual organisms) with signs of wellness and productivity, based on vital signs, and the absence ofobvious disease or lack of function. Health as a concept is readily understood, has social capital, istransferable to ecosystems (as shown in Table 1 and below), and is measurable.
Levels of Biological Organization Time/space scale Individuals Populations Communities/Ecosystems Short term, local, current state Health Health EH*, Integrity** Long term, regional, changes/trends
– Quality, Change
Change, EQ*** Integrity**
8
Health of the Bay of Fundy: Assessing Key Issues
2.1.2 Ecosystem health
Ecosystem health, as a concept and practice, has been discussed at length for two decades.Papers include Costanza et al. (1992); Fairweather 1999; IJC (International Joint Commission) 1991;Kutchenberg 1985; Rapport (1989, 1992, 1998); Rapport et al. (1980, 1998, 1999); Schaeffer (1996);B. H. Sherman (2000); Tait et al. (2000); Vandermeulen (1998); and Wood and Lavery (2000).
Rapport and his colleagues are leaders in exploring the field of ecosystem health. Rapport et al.(1980) discussed early warning indicators of disease, hypersensitivity, epidemiological models, thecrucial role(s) of certain parts of a living system, Selye’s concept of stress without distress (Selye1974), and immune antibody responses. These topics have advanced further due to research in medi-cine, toxicology, and environmental toxicology since the 1980s. Rapport et al. (1980) stated that “thecorresponding ecological concept to health might be ecosystem persistence, or ecological resilience.Presumably this property can be assessed using a range of indicators ...; candidate vital signs includeprimary productivity, nutrient turnover rates, species diversity, indicator organisms, and the ratio ofcommunity production to community respiration.” A very important observation was that “once eco-systems are adequately characterized in terms of vital signs, the development of more comprehensivediagnostic protocols might be the next logical step”. Developing and standardizing such protocols havebeen at the heart of applied ecotoxicology for years now. In addition, this step has been taken by groupssuch as HEED (Center for Health and the Global Environment at Harvard University) (Sherman, B. H.2000) and Kenneth Sherman of NOAA with his internationally recognized work on large marine eco-systems or LMEs (Sherman, K. 2000). Much work is continuing with molecular biomarkers (M.Depledge, pers. comm.), and the connections across levels of biological organization to populationsand communities (e.g., Downs and Ambrose 2001).
A review of the core studies of ecological health and ecosystem health reveals some key obser-vations:
On indicators and indices, “ecosystem health is a characteristic of complex natural systems ...defining it is a process involving a) the identification of important indicators of health; b) the identifi-cation of important endpoints of health; and c) the identification of a healthy state incorporating ourvalues. Historically, the health of an ecosystem has been measured using indices of a particular speciesor component” (Haskell et al. 1992). It is clear that we need to choose indicators and monitor ecosys-tems with them, and then to summarize and interpret the responses using indices. This in fact is beingdone, for example, in EPA’s estuarine programs, in larger comprehensive coastal programs such as inChesapeake Bay, and in a multitude of community-led monitoring programs around the Gulf of Maine(Chandler 2001).
On the components of ecosystem health, Schaeffer et al. (1988) gave ten guidelines for assess-ing ecosystem health (Haskell et al. 1992). At two 1991 workshops, participants developed a workingdefinition of ecosystem health, defining health in terms of four characteristics applicable to any com-plex system – sustainability, which is a function of activity, organization, and resilience. Sustainability
9
Workshop Background Paper
implies that the ecosystem can maintain its structure and function over time. The conclusion was that“an ecological system is healthy and free of ‘distress syndrome’ if it is stable and sustainable – that is,if it is active and maintains its organization and autonomy over time, and is resilient to stress”. This, ofcourse, implies that activity, organization and resilience can be measured for at least each major com-ponent of each ecosystem, a daunting task indeed.
One problem of defining ecosystem health is choosing the appropriate scale, i.e. which ecosys-tem are we managing and what level are we focusing on? For example, for Chesapeake Bay, is the Bayand its many estuaries being considered, or is it the whole Chesapeake watershed? The same questionapplies to the Bay of Fundy – do we focus on the whole Bay (there are already 38+ issues), the exten-sive watersheds (the proposed approaches of the GOMCME, and the Minas Basin Working Group ofBoFEP), or just one part (e.g., Passamaquoddy Bay)? Choosing the appropriate spatial scale has impli-cations for a wide range of activities associated with managing and maintaining ecosystem health;issues of policy, governance, research, assessment, management tools, monitoring, communicationand stakeholder involvement ultimately have to be considered.
The human health assessment model was described by Haskell et al. (1992). It has six parts: a)identify symptoms; b) identify and measure vital signs; c) make a provisional diagnosis; d) conducttests to verify the diagnosis; e) make a prognosis; and f) prescribe a treatment. For a large marineecosystem, in this case the Bay of Fundy, this model of health assessment could work as below. Acompendium for a) and b) is as yet incomplete, so examples come from previous Fundy Science Work-shops, ongoing projects, and an aging memory!
a) Identify symptoms: What are the first signals that the system is ‘unhealthy’? From thephysical to the biotic environment, some are: physical changes to shorelines (e.g., barriers,such as causeways and dykes; increased coastal development, especially homes along theshorelines); changed sediment patterns in estuaries; contaminants in sediments and tissues;increased numbers of aquaculture sites in bays; abundant debris on shorelines; reduced fish-eries catches or failing fisheries; the requirement to open new fisheries on new or previously‘under-utilized’ species; reduced numbers of seabirds (Phalaropes), and marine mammals(Right Whales); and increased small boat traffic in bays and inlets (noise, water and airpollution).
b) Identify and measure vital signs: There are a number of critical changes in key attributes ofthe ecosystem that collectively show the system is under stress or change, e.g., loss of/re-duced fisheries (herring); loss or reduction of species (wild Atlantic salmon, Salmo salar);changed distributions of seabirds such as the Red-necked Phalarope, Phalaropus lobatus;high levels of some chemicals in biota (e.g., Cu in crustaceans, and PCBs in birds and mam-mals); changed water flows or hydrologies in estuaries; and overall reduced salt marsh acre-age in the upper Bay.
c) Provisional diagnosis: At the 1996 Fundy Science Workshop (Percy et al. 1997), the par-ticipants concluded that the Bay of Fundy was showing a number of signs of poor health andlowered quality, and a listing of 38 key issues was made. Many of these have been discussed
10
Health of the Bay of Fundy: Assessing Key Issues
at subsequent Fundy Science Workshops, and many other recent meetings around the Gulf ofMaine (e.g., Regional Association for Research on the Gulf of Maine (RARGOM) Confer-ence, Wallace and Braasch 1997; Rim of the Gulf Conference 1997; habitat conferences;further RARGOM meetings, e.g., Pesch 2000). The Conservation Council of New Bruns-wick has recently expressed concerns for coastal habitats throughout the Bay, with a carefulrecord of habitat loss or modification (Harvey et al. 1998), and there are marked changes infisheries over 200 years and the presence of chemical burdens in Passamaquoddy Bay spe-cies (Lotze and Milewski 2002).
d) Tests to verify diagnosis: Diagnostic tests include: monitoring for trace contaminants inmussels and in the food chain (levels, responses of biomarkers, effects); monitoring for algaltoxins; monitoring for bacterial pathogens; monitoring for effects of salmon aquaculturewastes on benthic species and communities; assessment of condition of remaining salt marshhabitat; and assessment of effects of tidal barriers (e.g., the 2000–02 tidal restriction auditsbeing completed in New Brunswick and Nova Scotia). This important verification step en-sures that the ecological health issue is real and important (economically and ecologically).It is also more tractable to address single issues than the whole system at once. With multipleissues, the potential for cumulative effects and the potential for confounding with naturalvariables in ways difficult to predict, diagnosing the whole system is the goal but can beachieved most successfully with ‘bite-sized’ efforts.
e) Make a prognosis for the Bay: This is the ‘ecosystem health report’ and a statement of thefuture for the Bay’s habitats, inhabitants, and natural and living resources (also see Section2.1.4). Is there a good chance of ‘recovery’, or ‘maintaining the status quo’ if we continue toact through protection, conservation and remediation efforts? This prognosis is probablymost effective if looked at by sector – fisheries, marine mammals, wildlife, sediments, coast-lines, estuaries, etc. – and by regions within the Bay – from Passamaquoddy Bay around toAnnapolis Basin, St. Mary’s Bay and the coast to Yarmouth. The prognosis is best capturedin periodic State of the Bay of Fundy and State of the Gulf of Maine reports.
f) Treatment: This step describes the actions required to restore ecosystem health to the Bayof Fundy. For example, recent positive actions include working with the International Mari-time Organization (United Nations) to relocate sea lanes away from the Northern Right Whalefeeding areas (a real success!); remediation of unused salt marsh in Shepody Bay; bettermanagement plans for specific fisheries species such as bait worms (polychaetes) and greensea urchins (Strongylocentrotus droebachiensis); gradually improved sewage treatment, suchas at Saint John; efforts to remediate a tidal river e.g., Petitcodiac River; improved aquaculturepractices in south-western NB; and identifying the potential for opening selected causewaysand restoring tidal flows in estuaries, e.g., Windsor, NS. Actions are small and large, most areopportunistic, but all contribute to the momentum of addressing issues confronting the Bay.
What is our capacity to conduct ecosystem health assessments? Many traditional state of theenvironment reports have been prepared, some very thoroughly (e.g., AMAP 1997, 2002; see Section2.1.4). But we may only be in the early stages of being able to do actual ‘ecosystem health assessments’well because we lack the medical encyclopedia for ecosystems (Haskell et al. 1992). As Norton et al.

11
Workshop Background Paper
(1991) and Haskell et al. (1992) point out (everyone knows this, but it is worth recalling), medicinedeals with the individual, whereas “ecosystems exist on many levels, can be described on many scales,and require a consensus of public goals on the road to having diagnostic tests for ecosystem stress”. Aframework for starting to evaluate an ecosystem could consist of a) types of stress; b) response vari-ables or symptoms of ecosystem distress; and c) monitoring, fiscal resource, management and otherneeds. The table in Percy et al. (1997), pages 140–141, is an excellent tool but requires an update! Wehave to move from the traditional environmental report, a valued but often uninspired tally of charac-teristics of the system, to an actual health assessment, which is an analysis of how the whole system isfunctioning or not. The Gulf of Maine and Bay of Fundy offer an opportunity few if any other placeshave to prepare such an ecosystem health assessment.
There are obviously limitations to the concept of ecosystem health, and especially to putting theconcept into practice. The concept has a history in Western-based science, medicine and conservation.It first formally “emerged in the mature thought of Aldo Leopold as a bridge between technical man-agement and formulation of management goals” (Leopold 1949; Haskell et al. 1992), hence it is notonly a scientifically-based concept. This is very important because there is great value, indeed crucialvalue, in the link to environmental management goals (see Section 3.4), and metaphorically, the con-cept and term have the strength of communicating the problem to a wide audience. The term ‘ecosys-tem health’ was used in the 1960s and 1970s in the context of the Great Lakes, especially Lake Erie,once considered ‘dead’, rather than having impaired ‘ecosystem health’! Lake Erie survives, with im-paired but improving health (it is alive and productive) and a lower quality (its current condition com-pared to the original state of the lake). Likewise, in the United States, the ecosystem health concept hasbeen applied to the important estuaries and coastal bays, such as Chesapeake and San Francisco (seenumerous EPA reports, such as EPA 1998, 1999, 2000a,b).
However, several important limitations with the ecosystem health concept should be kept inmind, as we consider the Bay of Fundy. First, “no longer are communities (natural) considered norma-tive. Disturbance is common; communities and ecosystems are in constant flux. Knowing what isnatural is difficult” (Ehrenfeld 1992). That is, the normal range for a variable may be quite wide (par-ticularly note Schindler 1987), and in this age of marked climate change, even more so, e.g., air tem-perature, storm events and levels of precipitation. The baseline for ‘normal ecosystem health’ fluctuates!Secondly, “a determination of ecosystem health can be a function of which process you are looking at,which in turn is determined by your own values” (Ehrenfeld 1992). Ecosystem health has a socialcontext, as does the science behind it. Thirdly, the word ‘health’ should not be defined or applied toorigorously because communities of plants, animals and micro-organisms comprising ecosystems varygreatly in their state of equilibrium. Hence, the term is best used as a bridging concept between thescience and non-scientists (Ehrenfeld 1992), a starting place for dialogue on issues, priorities and indi-cators.
Systems ecologists also have views as to what is meant by ecosystem health. These views shedlight on the selection of suitable indicators for the Bay of Fundy. For example, Ulanowicz (1992) statesthat “a healthy ecosystem is one whose trajectory towards a climax (referring to ecological succession)

12
Health of the Bay of Fundy: Assessing Key Issues
is relatively unimpeded and whose configuration is homeostatic to influences that would displace itback to early successional stages. Assessing the health of ecosystems requires a pluralistic approachand a number of indicators of system status” (also see Karr 1991; Schaeffer et al. 1988). Ulanowiczuses the approach of network ascendancy, an index that captures four key properties of quantifiednetworks of trophic interactions in healthy systems: greater species richness, more niche specialization,more developed cycling and feedback, and greater overall activity. This approach could be usefullyapplied to the Bay of Fundy and its various ecosystems and regions; one could hypothesize that in someplaces, e.g., near aquaculture sites, in urbanized harbours, near industrial effluent locations, these prop-erties have been diminished, and then investigate them accordingly (as in the aquaculture studies of G.Pohle, Huntsman Marine Science Centre).
Karr, a fisheries biologist, stated that “a biological system can be considered healthy when itsinherent potential, whether individual or ecological, is realized, its condition is stable (meta-stable), itscapacity for self-repair when perturbed is preserved, and minimal external support for management isneeded” (Karr et al. 1986). One can analyze the Bay of Fundy using this approach (Table 2). Hence,when evaluated as a system, the Bay of Fundy’s condition could be considered as deteriorating and inneed of enlightened integrated management.
Table 2. A hypothetical health status of the Bay of Fundy (based on approach in Karr 1992 and earlierpapers)
Finally, and following from above, consider which components of ecosystem health are re-quired. Costanza (1992) discusses ecosystem health in the context of a system’s overall performance.“To understand and manage complex systems, we need some way of assessing the system’s overallperformance (its relative health)”. He summarizes the components of ecosystem health as:
- homeostasis- the absence of disease- diversity or complexity- stability or resilience- vigour or scope for growth- balance between system components
“Systems are healthy if they can absorb stress and use it creatively, rather than simply resisting
System Criterion Health Status Good Fair Poor Inherent potential + > Condition + > Self-repair + > Management support <+
13
Workshop Background Paper
it and maintaining their former configurations”. “An ecological system is healthy and free from distresssyndrome if it is stable and sustainable – that is, if it is active and maintains its organization andautonomy over time, and is resilient to stress”. To be healthy and sustainable, the system must maintainits metabolic activity level, maintain its internal structure and organization, and be resilient to outsidestresses.
Costanza (1992) has attempted to quantify ecosystem health:
HI=overall health indexHI=V*O*R
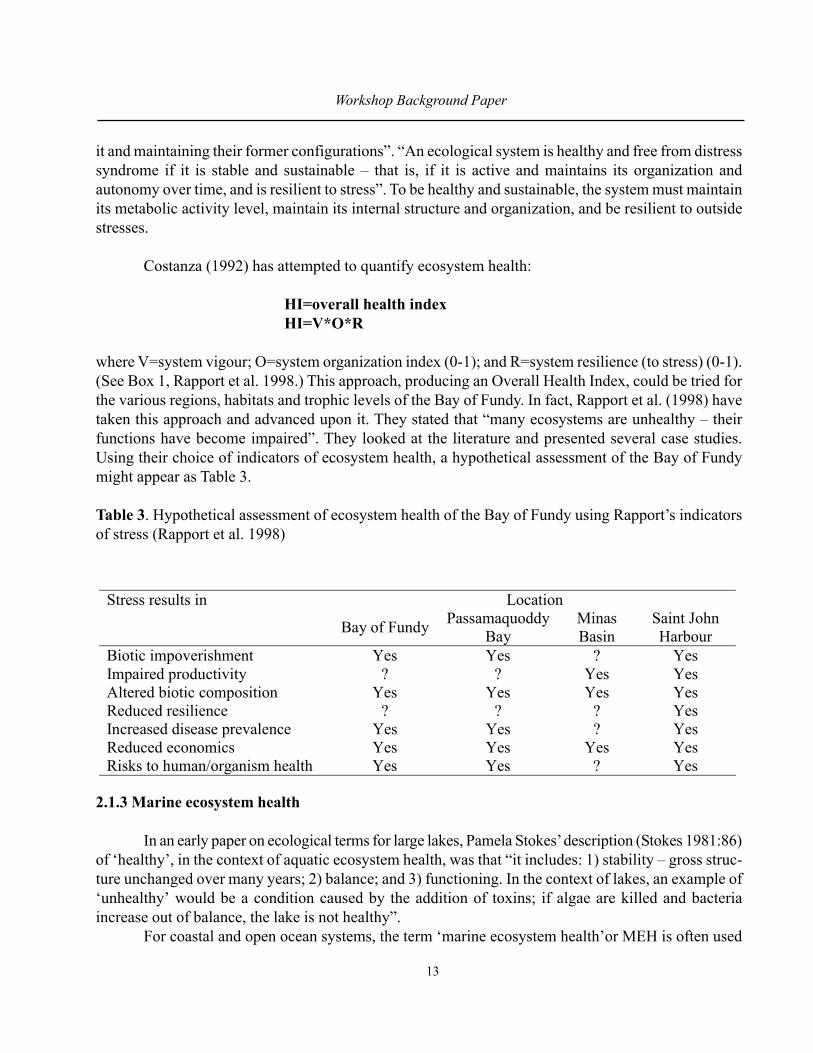
where V=system vigour; O=system organization index (0-1); and R=system resilience (to stress) (0-1).(See Box 1, Rapport et al. 1998.) This approach, producing an Overall Health Index, could be tried forthe various regions, habitats and trophic levels of the Bay of Fundy. In fact, Rapport et al. (1998) havetaken this approach and advanced upon it. They stated that “many ecosystems are unhealthy – theirfunctions have become impaired”. They looked at the literature and presented several case studies.Using their choice of indicators of ecosystem health, a hypothetical assessment of the Bay of Fundymight appear as Table 3.
Table 3. Hypothetical assessment of ecosystem health of the Bay of Fundy using Rapport’s indicatorsof stress (Rapport et al. 1998)
2.1.3 Marine ecosystem health
In an early paper on ecological terms for large lakes, Pamela Stokes’ description (Stokes 1981:86)of ‘healthy’, in the context of aquatic ecosystem health, was that “it includes: 1) stability – gross struc-ture unchanged over many years; 2) balance; and 3) functioning. In the context of lakes, an example of‘unhealthy’ would be a condition caused by the addition of toxins; if algae are killed and bacteriaincrease out of balance, the lake is not healthy”.
For coastal and open ocean systems, the term ‘marine ecosystem health’or MEH is often used
Stress results in Location Bay of Fundy Passamaquoddy
Bay Minas Basin
Saint John Harbour
Biotic impoverishment Yes Yes ? Yes Impaired productivity ? ? Yes Yes Altered biotic composition Yes Yes Yes Yes Reduced resilience ? ? ? Yes Increased disease prevalence Yes Yes ? Yes Reduced economics Yes Yes Yes Yes Risks to human/organism health Yes Yes ? Yes
14
Health of the Bay of Fundy: Assessing Key Issues
(amongst others, Wells and Rolston 1991; Wells 1996, 1999a; Smiley et al. 1998; Vandermeulen 1998;Sherman, B. H. 2000; Sherman, K. 1994, 2000). Paul Epstein’s definition of marine ecosystem healthis: “to be healthy and sustainable, an ecosystem must maintain its metabolic activity level, its internalstructure and organization, and must be resistant to stress over a wide range of temporal and spatialscales” (Epstein 1999).
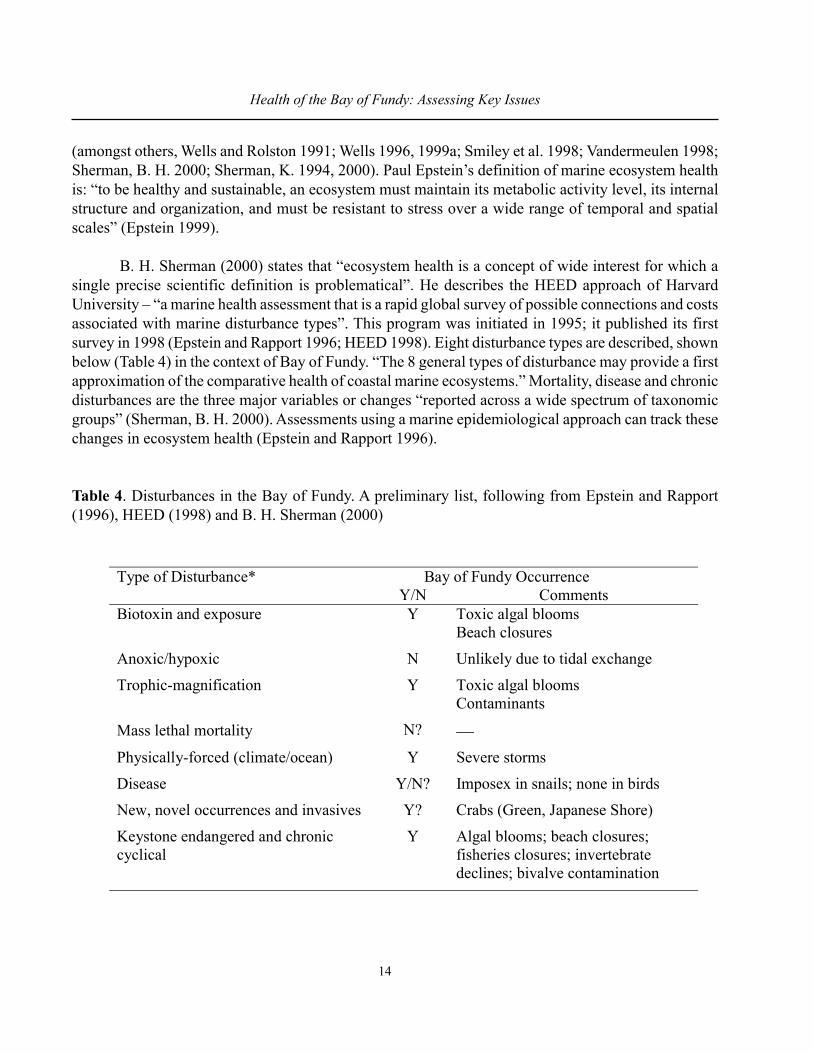
B. H. Sherman (2000) states that “ecosystem health is a concept of wide interest for which asingle precise scientific definition is problematical”. He describes the HEED approach of HarvardUniversity – “a marine health assessment that is a rapid global survey of possible connections and costsassociated with marine disturbance types”. This program was initiated in 1995; it published its firstsurvey in 1998 (Epstein and Rapport 1996; HEED 1998). Eight disturbance types are described, shownbelow (Table 4) in the context of Bay of Fundy. “The 8 general types of disturbance may provide a firstapproximation of the comparative health of coastal marine ecosystems.” Mortality, disease and chronicdisturbances are the three major variables or changes “reported across a wide spectrum of taxonomicgroups” (Sherman, B. H. 2000). Assessments using a marine epidemiological approach can track thesechanges in ecosystem health (Epstein and Rapport 1996).
Table 4. Disturbances in the Bay of Fundy. A preliminary list, following from Epstein and Rapport(1996), HEED (1998) and B. H. Sherman (2000)
Type of Disturbance* Bay of Fundy Occurrence Y/N Comments Biotoxin and exposure Y Toxic algal blooms
Beach closures
Anoxic/hypoxic N Unlikely due to tidal exchange
Trophic-magnification Y Toxic algal blooms Contaminants
Mass lethal mortality N? Physically-forced (climate/ocean) Y Severe storms
Disease Y/N? Imposex in snails; none in birds
New, novel occurrences and invasives Y? Crabs (Green, Japanese Shore)
Keystone endangered and chronic cyclical
Y Algal blooms; beach closures; fisheries closures; invertebrate declines; bivalve contamination
15
Workshop Background Paper
Kenneth Sherman’s large marine ecosystem (LME) approach (Sherman et al. 1996; Shermanand Skjoldal 2002; other LME publications), is applicable to the Gulf of Maine and Bay of Fundy.Indeed, the Gulf of Maine is part of an LME and is identified as the Northeast Shelf Ecosystem (unfor-tunately, the boundaries of which may be jurisdictional rather than ecological!). Methods to assess thehealth of LMEs are being developed from modifications to a series of indicators and indices describedby several investigators (see Costanza and Mageau 1999); the methods form part of the pollution andecosystem health module of the LME approach. Recent workshops sponsored by NOAA (USA) and theNordic Council of Environment Ministers (Europe) considered the concepts of ecosystem health andmarine ecosystem health (Sherman, K. 2000). The Pollution and Ecosystem Health module consists ofeutrophication, biotoxins, pathology, emerging disease and health indices. Five health indices (bio-diversity, productivity, yield, resilience, stability) are included as experimental measures of changingecosystem states and health. Hence, the module emphasizes stresses and indices (based on numerousindicators), consistent with current thought on how to approach marine ecosystem health.
In practice, the pollution and ecosystem health module of the LME uses benthic invertebrates,fish and other biological indicator species, and accepts the following set of measures (Sherman et al.1996; Sherman, K. 2000):
- bivalves (Musselwatch) (similar to Gulfwatch employed in Fundy, Chase et al. 2001)- patho-biological examination of fish- estuarine and nearshore monitoring of contaminants and contaminant effects in water,
sediments and organisms (note NOAA’s programs, Wade et al. 1998)- routes of bioaccumulation and trophic transfer of contaminants- examination of critical life stages and food chain organisms to demonstrate exposure- impaired reproductive capacity- organ disease- impaired growth- impacts on individuals and populations
Sherman et al. (1996) adopted a holistic approach inherent in the LME concept, as it encourages agen-cies and other stakeholders to address issues of over-fishing, habitat loss, pollution, and recreationneeds from a multi-disciplinary ecosystems perspective.
Vandermeulen (1998), in a Canadian summary, stated that MEH indicators are being identifiedin five categories: contaminants; biotoxins, pathogens and disease; species diversity and size spectrum;primary productivity and nutrients; and instability or “regime shifts”. These were adopted from theliterature, and hence are similar to MEH indicators chosen by the many expert groups involved in theLME approach (Sherman, K. 2000).
The terms marine ecosystem health (MEH) and marine environmental quality (MEQ – seebelow) are often used inter-changeably in the literature and in common practice when communicatingabout the health of coastal seas and the oceans (Wells 1991). The case made in this paper, however, is
16
Health of the Bay of Fundy: Assessing Key Issues
that the terms health and quality are not the same (Section 2, Introduction), and that there are benefitsfrom using them more precisely in an assessment of the health of coastal waters, in this case the Bay ofFundy, i.e. we want to maintain and sustain a healthy bay of high quality!
2.1.4 Ecological condition and state of the environment
Ecological condition and state of the environment are terms used in statements or reports on thecurrent condition of specific ecosystems, terrestrial to marine. Encouragingly, there are many recentexamples of such marine reports (AMAP 1997, 2002; Birkett and Rapport 1996; Crawford et al. 1994;EPA 1998, 1999; GESAMP 1990; Kay 1989; Konrad et al. 1990; Marine Institute 1999; Sheppard2000; Waldichuk 1989; Wallace and Braasch 1997; Wells and Rolston 1991; White and Johns 1997;Zaitsev and Mamaev 1997). Some reports are popular accounts for the general reader and the decisionmaker (e.g., Atkinson et al. 2000; Earle 1995; GESAMP 2001a; GOMCME 1989; Johnston et al. 1998;Marx 1999; McGinn 1999; Milewski et al. 2001). The ‘state of the environment’ literature reflects thepopular and accessible (not necessarily current) concepts of ecosystem health, and the suite of mostuseful indicators deployed by scientists and community volunteers to monitor the state of the marineenvironment (i.e. ocean health).
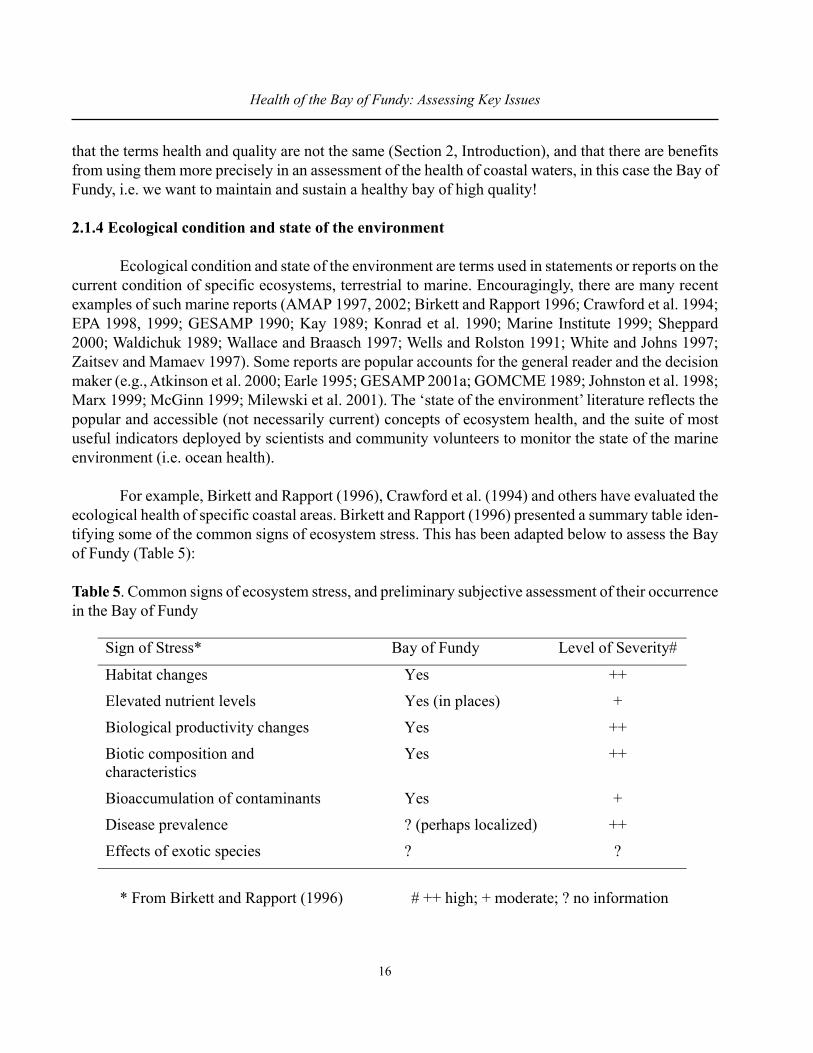
For example, Birkett and Rapport (1996), Crawford et al. (1994) and others have evaluated theecological health of specific coastal areas. Birkett and Rapport (1996) presented a summary table iden-tifying some of the common signs of ecosystem stress. This has been adapted below to assess the Bayof Fundy (Table 5):
Table 5. Common signs of ecosystem stress, and preliminary subjective assessment of their occurrencein the Bay of Fundy
* From Birkett and Rapport (1996) # ++ high; + moderate; ? no information
Sign of Stress* Bay of Fundy Level of Severity#
Habitat changes Yes ++
Elevated nutrient levels Yes (in places) +
Biological productivity changes Yes ++
Biotic composition and characteristics
Yes ++
Bioaccumulation of contaminants Yes +
Disease prevalence ? (perhaps localized) ++
Effects of exotic species ? ?
17
Workshop Background Paper
The above discussion shows that there is considerable commonality of the key components of anyassessment of ecosystem health. What are needed are the monitoring programs providing systemati-cally collected data over long time periods so that such assessments can be made reliably (see GESAMP1994b).
2.1.5 Ecological integrity
Ecological integrity (also called ecosystem integrity) is “the dimension of health that reflectsthe capacity to maintain organization; it is akin to the term ‘integrity’, especially when used at the scaleof ecosystems” (Karr, many refs.). It incorporates the ideas of resilience, vigour and homeostasis. “Manyregard integrity, when used in a purely ecological sense, to refer to the evolution of the ecosystemwithout human disturbance” (Nielsen 1999). Key papers include Karr (1981, 1992), Woodley et al.(1993), Noss (1995), Nielsen (1999), and Campbell (2000). Karr (1992) and Campbell (2000) dis-cussed the concept in detail. Integrity “implies an un-impaired condition, or the quality or state of beingcomplete or undivided” (Karr 1992). It also means “un-impaired when compared with the originalcondition” (Campbell 2000).
Systematic assessments of the status of ecological resources (i.e. ecological integrity) havethree requirements: they must be based on biology and biological processes; there must be a selectionof measures of health or integrity appropriate for the place and biological attributes of concern; andthere must be biological benchmarks or reference conditions (Karr 1992). On the second requirement,an array of attributes of biological/ecological integrity is used. Collectively, they must be very diagnos-tic of local conditions. For example, five attributes (individual health, species richness, relative abun-dance of species, population age structure, genetic diversity) measured together can describe localconditions. Efforts to assess ecological integrity are more likely to detect degradation if those effortsare conceptually diverse – from the use of individuals to populations to assemblages to landscapes, forthe measurement of attributes (Karr 1992).
Karr uses the terms ‘conditions’, ‘ecological health’ and ‘integrity’ interchangeably, not surpris-ing given the similarity of their components but unhelpful to using the concepts in practice with preci-sion! Campbell (2000) agrees with previous writers (Suter 1993) that we need operational definitionsof concepts such as ecosystem health, and by analogy, ecological integrity. Campbell concludes that“ecological integrity is an ecosystem property that is greatest when all the structural components of asystem that should be there, are there (i.e. structure is complete), and all the processes operating withinthe system are functioning optimally (i.e. the ecosystem is ‘healthy’)”. Perhaps what is important is thatcondition, ecological health and integrity refer to the current state of a system, how well it is composedand functioning now. Semantic arguments fall prey to practical needs!
Can we assess the Bay of Fundy with the more operationally useful definition of Campbell(2000) – Are all the structures/parts and functions of the Bay of Fundy’s ecosystems present and oper-ating optimally? Are we monitoring enough to be able to describe the integrity of natural communitiesand ecosystems in the Bay of Fundy as a whole, or will we do this only for selected sites e.g., salmonaquaculture sites, tidal barriers, harbours, points of industrial discharge?
18
Health of the Bay of Fundy: Assessing Key Issues
Finally, which of the terms, ecosystem health or ecological/ecosystem integrity, has more socialcapital associated with it? It is noteworthy and very encouraging that the GOMCME, in Goal 2 of itsthird five-year action plan (GOMCME 2002), addresses “… human health and ecosystem integrity”,with three social, management oriented objectives: increasing awareness and improving managementof priority contaminants, identifying reduction strategies for priority contaminants, and enhancing citi-zen stewardship. Protecting and assessing the ecological or ecosystem integrity of the Gulf of Maineand the Bay of Fundy has been identified as a long-term social goal of institutions around the Gulf.
2.1.6 Coastal health
Coastal health is a broad term signifying the interconnections and overlap between three areas– human health (as above); environmental health (as above, MEH and ecological integrity); and com-munity health. Community health involves all of the public(s) – all of the communities that are presentalong the shores of a water body, and within the watersheds. It covers many functions of each coastalcommunity. Community health includes consideration of economic sustainability and opportunities,and appropriate civic planning and conduct to enhance the quality of life in the community, e.g., parks,green spaces, public health and health care, education, opportunities for the young. Community healthand the ecological/environmental health of the surrounding watersheds and marine ecosystems of theBay of Fundy and Gulf of Maine are closely linked. There are many examples in the fishing communi-ties, as the economies of the fisheries are affected by issues such as contaminants (mercury, hydrocar-bons), natural toxins (PSP), and tourism and recreation.
Coastal health should be considered in the design and practice of integrated coastal manage-ment plans/programs. It also should be included in any assessment of the Bay of Fundy’s health, as it isa holistic representation of people, their activities and their impacts integrated with the ecology andliving resources of the coast.
2.2 Longer-Term Ecosystem Change
Change is constant, i.e. continual, in Earth’s ecosystems. Marine ecosystems are no exceptionto this rule. What is important is to distinguish between natural ecological change, important anthropo-genically driven change, and the two combined (Schindler 1987; Spellerberg 1991; Ollerhead et al.1999; Wells 1999b; Jackson 2001; amongst others), and to identify the important adverse change(s)that can be ameliorated (e.g., ozone depletion due to CFCs; contamination of food supplies and ecosys-tems by other synthetic chemicals; climate change if we control carbon dioxide emissions). Changesshould be observed or measured over the long term and compared to measurements of or approxima-tions of the original conditions (set at some arbitrary time). The choice of appropriate indicators (seesection 3.3.2), the monitoring design, and modeling (Jakeman et al. 1993) are critical to success. “Thequestion is how to better identify, monitor, anticipate, and respond to the network of changes in theecosystem” (Zelazny 2001), and how best to report periodically on and interpret such change for theBay of Fundy-Gulf of Maine.
19
Workshop Background Paper
2.2.1 Change and ecological change
Change and ecological change have been studied and/or discussed by Baird and Burton (2001);Clark and Frid (2001); Duarte et al. (1992); Epstein and Rapport (1996); Earle (1995); Harvell et al.(1999); HEED (1998); Jackson (2001); Jickells 1998; Lotze and Milewski (2002); Mann 2000; McGowanet al. (1998); McMichael (1993); Myers (1995); Rapport (1990); Rapport and Whitford. (1999); Roseet al. (2000); Schindler (1987); Spellerberg (1991); Wells (1999b); and others. Ecological change hasbeen taking place over the geological epochs, and in ‘recent time’ in the Bay of Fundy region. Since thelast ice cover 12,500-15,000 years ago (Atlantic Geoscience Society 2001), sea levels have risen andthe land has been re-occupied by plants and animals. Both gradual change and occasional abrupt occur-rences (disturbances, including extinction events) are normal to ecosystems. Organisms, populationsand communities adapt in a variety of ways, from physiological to reproductive to shifted distributionalpatterns. What must be understood is how ecosystems accommodate to the natural change and thechanges imposed by human activity at the same time, particularly when the latter includes largeperturbations such as biomass removal, habitat destruction or modification, chemical effects (toxicity),and competition from bio-invaders or exotics in coastal waters (Wells 1999a).
Ecological change can be subtle. A change in the health of the system may lead to a change inthe system’s overall quality, without being noticed or measured. Examples are numerous – the ecologi-cal effects of new fisheries for so-called under-utilized species (e.g., sea urchins, sea cucumbers,rockweed, gastropods, polychaetes), the impacts of barriers on tidal rivers on mudflats and other inter-tidal zones, the progressive loss of freshwater reproductive habitat (e.g., salmon), and the potentialimpact of tourism on migratory shorebirds (e.g., disturbance at critical feeding and roosting areas in theintertidal zones and on islands).
Ecological systems are complex and chaotic. Many interactions are non-linear (Myers 1995),and some species play pivotal roles in the transfer of energy between trophic layers (e.g., keystonespecies such as Corophium volutator, D. Hamilton, pers. comm.). Once disturbed by an anthropogenicstress(or), the ecosystem may not recover or offer the possibility for remediation (e.g., over-fishedareas, water bodies with introduced species, areas of coastal development, highly contaminated sites),the system entering a new and different ecological state.
Ecological change(s) occurs at different spatial and temporal scales. For example, compare theimpact of a single fishery for a keystone benthic species such as the sea urchin, the change caused byremoval occurring rapidly over many hectares, to the predicted impacts of global climate change on seatemperatures and sea surface levels, the change occurring gradually, by years and decades, over tens ofthousands of square kilometers. This range of change is probably very common in ecosystems, thoughmost of it goes undetected and unaccounted for. The challenge is to examine the Bay of Fundy as asystem and ecosystem, and to determine the type of change(s) occurring, the causes, the interactions,and the pragmatic actions society should take.
20
Health of the Bay of Fundy: Assessing Key Issues
2.2.2 Marine environmental quality (MEQ)
Papers covering the concepts and practice of marine environmental quality (MEQ) include DFO(2000), Harding (1992), IOC (1996), Lane (1998), NOAA’s many programs re the long-standing USAMEQ Status and Trends Program (T. O’Connor and D. Wolfe, pers. comm.), Percy and Wells (2002),Rapport’s many papers, Wells and Côté (1988), and Wells and Rolston (1991).
In Canada, MEQ was defined during the 1980s and early 1990s by the Environment CanadaMEQ Working Group (Wells and Côté 1988; Wells and Gratwick 1988; Wells 1991, 1996), and ac-cepted by the federal Interdepartmental Committee on Oceans in 1989.
MEQ is the condition of a particular marine environment measured in relation toeach of its intended uses and functions. It can be described subjectively, espe-cially if stresses impinging on the system are large and if the ecosystem or habi-tat are obviously degraded. However, MEQ is usually assessed quantitativelyfor each environmental compartment, on temporal and spatial scales. It is meas-ured using sensitive indicators of natural condition and change. Such measuresare interpreted using objectives and limits set by environmental, health and re-source agencies (Wells 1991).
MEQ differs from MEH; quality denotes historical recorded change in the condition, whereashealth is the present condition and the direction of change (as discussed above; A. Gaston, pers. comm.).However, the terms MEQ and MEH are often used synonomously in the literature, especially the non-technical literature, and importantly in day-to-day practice by conservation and protection groups, tomean ‘ocean health’ (e.g., IOC 1996; Frith 1999; McGinn 1999). The social and political currency ofthe term ‘health’ captured in the context of ‘oceans’ and ‘coastal’ was the compelling reason for callingthe 1991 report on Canadian MEQ, Health of Our Oceans, and likely the reason for the earlier reportHealth of the Northwest Atlantic (Wilson and Addison 1984).
Harding (1992) further explored the MEQ concept and measures, developing a framework fo-cused on chemical contaminants and incorporating the ecological risk assessment components of sources,exposure, effects (indicators), and risk estimation; this was an important conceptual advance to under-standing the breadth of MEQ and the importance of linking stresses and effects to management actionthrough risk analysis and management. Chang (1999) and Chang and Wells (2001) developed an MEQframework for the Bay of Fundy. It shows the linkages between research, monitoring (indicators),objectives/guidelines, assessments, and management response. This framework was very useful at evalu-ating selected stresses on the ecosystem, e.g., PCBs, mercury and algal toxins.
As with assessments of health and ecological health, MEQ requires indicators and marine envi-ronmental guidelines, objectives and standards. The objective is to take measurements of key ecosys-tem variables and compare values to original baseline conditions. Quantitative guidelines, objectivesor standards for air, water, sediments, tissues, and habitats are essential. Underpinning both the choice

21
Workshop Background Paper
of indicators and guidelines is research. For example, the Gulf of Maine mussel watch program(Gulfwatch) is an MEQ program, using an indicator species approach (the mussel), guidelines (largelyfrom human health), and supportive research. Contaminant levels in mussel tissues are measured annu-ally at various stations around the Gulf of Maine; values are compared to earlier ones, and all measure-ments over time, as part of a status and trends analysis, and the values are compared with environmentaland health advisory guidelines (Chase et al. 2001; Jones et al. 2001). The program has given a pictureof trace chemical contamination around and across the Gulf in the 1990s; tissue levels of trace contami-nants are elevated, stable or often declining, and largely below health guideline values (Chase et al.2001).
Within the new Canadian Oceans Act (1997), MEQ focuses on the requirement for objectivesand guidelines for protecting ocean health, the latter not being defined. However, MEQ activity underthe Oceans Act plans to cover research on and testing of indicators of ocean health, the developmentand use of objectives and guidelines, and the production of assessments of ocean health (DFO 2000). Ithas also taken on a broader context than just chemical contaminants, although that appears to be theemphasis in an excellent review of contaminants on the Scotian Shelf and the adjacent coastal waters(e.g., Stewart and White 2001). Most recently, the Oceans Strategy of DFO (DFO 2002a,b) considersMEQ under the umbrella of “Understanding and Protecting the Marine Environment”, with an empha-sis on science support for oceans management (which includes “assessing the state of ecosystem health”),marine protected areas (MPAs) and MEQ guidelines. Canada now has a mandated operational conceptof MEQ that should stimulate co-operative multi-agency and multi-partner research, monitoring, MPAs,ecosystem-based guideline development, and ecosystem assessments for its oceans, including the Bayof Fundy and its adjacent waters.
2.3 Connections Between Human Health and Ecosystem Health and Integrity
There are obvious connections between human and ecosystem health through air, water, andsediments and soils that have been discussed by many previous authors (e.g., McMichael 1993; diGuilio and Monosson 1996; Knap et al. 2002). These connections are well recognized by environmen-tal scientists, resource managers and policy makers in the context of the Bay of Fundy and greater Gulfof Maine, and they are the imperative for much action in its coastal waters (GOMCME 2002). Thesecond goal of the GOMCME 2001–2006 action plan is to “protect human health and ecosystem integ-rity” from contaminant exposures – to ensure that “ contaminants in the Gulf of Maine are at suffi-ciently low levels to ensure human health and ecosystem integrity”. The plan is currently addressingsewage, mercury and nitrogen. Sewage is the one priority pollutant in the Gulf and Bay of Fundyemphasizing the human-ecosystem health connections without doubt (Hinch et al. 2002, in prep;GESAMP 2001a,b), justifying the large expenditures to reduce the inputs.
3. A Framework for Assessing Health of the Bay of Fundy
The previous section reviewed the concepts of ‘ocean health’. This understanding is central toa rigorous technical assessment of the various environments and ecosystems of the Bay of Fundy and

22
Health of the Bay of Fundy: Assessing Key Issues
Gulf of Maine, including their watersheds. What follows is a brief discussion of some considerations inconducting such an assessment. These include: how (i.e. the contents and approach), how often (i.e. thenumber and frequency of reports) and with what resources should we be tackling the task of reportingon the State of the Bay of Fundy report(s), and ultimately, preparing the State of the Gulf of Mainereport(s)? Such assessment reports will likely appear as a State of the Gulf report or reports as plannedfor the next few years by the GOMCME (GOMCME 2002), GPAC (GPAC 2001) through its CoastalForum and Summit process, and BoFEP through its Minas Basin Working Group.
Assessing health of the Bay of Fundy includes: a) understanding the concepts, b) backgroundconsiderations and importance, c) approaches and techniques, d) indicators and early warning signals,e) status and trends analysis, f) identifying mechanisms for action, and g) identifying new directions forscientific, management and community-led activities. This framework (Figure 1) is meant as a startingpoint to preparing a comprehensive ecosystem health assessment on the Bay.
Figure 1. Components of a framework for an ecosystem health assessment for the Bay of Fundy/Gulfof Maine
3.1 Dimensions of the Marine Ecosystem Health Concept – A Synopsis
Understanding the concepts of ecosystem health and environmental quality is a cornerstone ofany successful report on the health of the Bay and the Gulf. The concepts have been reviewed in theabove sections. Marine ecosystems are complex, partially understood (even after >100 years of re-search), likely to change in unpredicted ways, and perceived differently by the various stakeholders.Having some consensus on the elements of ‘healthy ecosystems’ to measure and monitor in the habitatsaround the Bay, i.e. the indicators, and the integration of the data and information into statements of‘health’ would allow comparable assessments over the long term, and real knowledge of ‘how the Bayand Gulf are doing’. Whereas the 1989 GOMCME report (GOMCME 1989) and the Bay of Fundy
1. CONCEPTS
2. BACKGROUND AND IMPORTANCE
3. APPROACHES AND TECHNIQUES (MONITORING, INDICATORS/INDICES, STATUS AND TREND ANALYSES)
4. MANAGEMENT PRIORITIES AND NEEDS
23
Workshop Background Paper
report (Percy et al. 1997) were primarily descriptive of the current state or condition, new reports shouldbenefit from the current science of ecosystem health, and advances in many related areas, such asenvironmental monitoring, data retrieval, analysis and synthesis, and information management anddisplay.
3.2 Background Considerations and Importance of ‘Healthy Marine Ecosystems’
The Bay of Fundy and the greater Gulf of Maine are data and information rich areas, historicallyone of the most studied marine areas on the globe. The region has a number of large, well-establishedresearch institutions, many smaller ones, and many active community groups (e.g., GPAC, CoastalCommunities Network) and university groups (e.g., RARGOM) (see Schroeder et al. 2001). This putsthe region in the unique position of basing new ‘health assessments’ on the most current and state of theart ecological and resource information, and a background of enormous knowledge and understanding(see the references cited, but note the holdings of libraries such as at the Marine Biological Laboratory(MBL) at Woods Hole, MA and the Bedford Institute of Oceanography (BIO), Dartmouth, NS). Thechallenge will be in the approach, selection of indicators, analysis, synthesis and interpretation.
There are now well-recognized linkages between ecosystem health and human health (McMichael1993; di Guilo and Monosson 1996) or ocean health and human health in its widest context (Knap et al.2002; many refs.). For the marine environment, examples abound, e.g., algal toxin effects, sewageimpacts, trace chemical effects, quality of seafood, reduced use, aesthetics, quality of life. Internation-ally, the linkage between ocean and human health is being pursued actively through the IOC/UNESCO(Knap et al. 2002; A. Knap, pers. comm.), especially in the context of native subsistence users, and theinhabitants of small island states. For the Bay of Fundy, closed or restricted shellfish beds are the mostobvious sign of the social and health impacts of a degraded system (also see Section 2.3).
The other major imperative is an ethical one – that the Fundy and Gulf of Maine ecosystem andtheir inhabitants equally deserve protection and conservation, and that this should be done as a matterof good ethics and citizen and corporate responsibility. Arguments for the protection and conservationof the natural living resources come before the economic ones. The use of the non-living resources,e.g., minerals or aggregate rocks, which is a growing interest, solely for economic reasons should bepursued with great caution.
3.3 Approaches and Techniques for Assessing the Bay’s Health
This section describes some of the essential approaches and techniques for acquiring the dataand information, and the analyses essential for an assessment of the Bay of Fundy’s health. It refersback to how we study, measure and analyze ecosystem health, and in that context, ecological andecosystem change (Section 1). There is a large literature and many active programs pertaining to ap-proaches and techniques, not only relating to the Bay of Fundy and the Gulf of Maine. This section issimply meant to be a checklist of components to consider while organizing an assessment.
24
Health of the Bay of Fundy: Assessing Key Issues
3.3.1 Monitoring approaches
In Canada, the importance of monitoring and the data that it produces has been reiterated re-cently with the passage of the Oceans Act (1997). The MEQ component of the Oceans Act includesindicators, guidelines, assessments, but not research and monitoring, explicitly. However, the key roleof ocean monitoring is assumed and is slowly being strengthened in the context of programs such asGOOS or Global Ocean Observing System (P. Strain, pers. comm.) and harbour monitoring (e.g., Hali-fax, J. Hellou, pers. comm.). MEQ has been discussed at the CZC 2000 session on ocean health in SaintJohn, NB (S. Courtney, pers. comm.) and a Department of Fisheries and Oceans (DFO) winter 2001meeting on objectives and indicators for ecosystem-based management in Victoria (Jamieson et al.2001). There is continued monitoring, such as with the Gulf of Maine GOMCME EQ Monitoringcommittee, with Gulfwatch (Chase et al. 2001; Jones et al. 2001; Jones and Wells 2002). There are theoffshore EEM programs, using sophisticated methods of monitoring ocean change and contaminantsources, fate and effects (Gordon et al. 2000). There are also the environmental effects monitoring(EEM) programs applied to and by the pulp and paper industry that use current field ecotoxicologytechniques for monitoring.
It is important to mention monitoring activity sponsored by the United Nations. The Gulf ofMaine GOOS program is part of the larger global GOOS of UNESCO/IOC. Some of it goes on underthe auspices of Global Inland Waters Assessment (GIWA) and the Global Programme of Action for theProtection of the Marine Environment from Land-based Activities (GPA). There is also Global Envi-ronmental Facility/Large Marine Ecosystem (GEF/LME) activity (IUCN 1998), with LME assessmentstaking place globally. There is one for the US Northeast Shelf and one for the Scotian Shelf, both ofwhich overlap the Bay of Fundy (Sherman and Skjoldal 2002). As described above (Section 2.1.3), thepollution and ecosystem health module of each LME covers eutrophication, biotoxins, pathology, emerg-ing disease, and health indices.
Systematic monitoring data of bio-indicator species including bottom fish andmollusks (Musselwatch) are examined for endocrine disrupters and organ pa-thology. Water quality and plankton examinations are made for phytoplanktontoxicity, eutrophication, persistent organic pollutants, and evidence of emergingdisease. Examinations of changing states of health of LMEs are based on indicesof ecosystem biodiversity, productivity, yield, resilience, and stability (K.Sherman, pers. comm.).
These examples reiterate the role that systematic monitoring plays in providing the data, shortand long-term, essential for any ecosystem health assessment. The initial challenge is two-fold: agree-ing on the indicators and finding support for the programs. It should also be recognized that effectivemarine monitoring programs would benefit from having components of data analysis and interpreta-tion, sample and data management, research on new techniques, and communication, in addition to thebasic, routine sampling programs (Jones and Wells 2002).

25
Workshop Background Paper
3.3.2 Indicators and indices
There has been fair agreement in the area of MEH and MEQ indicators over the past few years.Useful papers and reports include: Bilyard 1987; Burger and Gochfeld 2001; EPA 2000a,b; GESAMP1994a; IJC 1991; Long and Buchman 1989; Nettleship 1997; NOAA 1999; O’Connor and Dewling1986; Rapport 1991b, 1999; Salánki 1986; Schwaiger 1997; Soule and Kleppel 1998; Thompson andHamer 2000; Vandermeulen 1998; Van Dolah 2000; and Wichert and Rapport 1998. A synthesis ofindicators currently used in USA NOAA coastal programs was assembled for the GOMCME (W.O’Bearne, pers. comm.). The reader should also refer to Section 4, the Coastal Forum, as one of thechallenges of this workshop was to discuss, identify and reach consensus on the suite (assemblages) ofsuitable indicators of health and quality for the Bay of Fundy (Question 3, Coastal Forum).
When one views and considers the size, dynamics and various ecologies and species in the Bay,it is very hard to imagine the Bay’s ecosystems being significantly impaired through human activity(with the obvious exception of fisheries; Jackson et al. 2001). The Bay simply appears too large, dy-namic, biologically diverse, and ever renewed by the tides. However, scientific programs of researchand monitoring tell a different story (e.g., see Proceedings of the first four Fundy Science Workshops –Percy et al. 1997; Burt and Wells 1998; Ollerhead et al. 1999; Chopin and Wells 2001). Parts of thesystem can become impacted or impaired, in both the short and long-term. So the question becomes:which indicators and indices, used in combination, give the ‘best’ measure of the state of the Fundysystem and/or its component places and parts?
Schaeffer et al. (1988) described four major measures of ecosystem health, which can be testedhere – sustainability, activity, organization, and resilience. As stated above, “sustainability implies thatthe system can maintain its structure and function over time”. Basically, the authors are saying that thebest indicators are structure, function and resilience of each ecosystem, and that there are readily meas-ured endpoints of these indicators to incorporate into a monitoring program. Karr (1992) states: “thedevelopment of indicators is, arguably, the most important step needed to mobilize social support forreversal of the trend towards biotic impoverishment”. Many ecological concepts, such as resilience,resistance, connectivity, and ascendancy, may suggest important indicators of a systems condition, butthey have practical difficulties – what do you measure operationally in the real world?
It is crucial to use practical, measurable, interpretable and current indicators. There may be adisconnect between the people discussing the concepts of ecosystem health and indicators (Rapport etal. many refs.; Constanza et al. 1992), basic ecologists, and those in the aquatic science field who havebeen deploying techniques in the field and assessing areas as to health and quality, i.e. condition, forseveral decades (Soule and Kleppel 1998; Simon 2002). Immense advances have been made in marineenvironmental monitoring approaches and techniques over the past 3–4 decades. We are not starting atthe beginning (e.g., B. H. Sherman’s work HEED and Ken Sherman’s work LME, above; the existingGulfwatch program, and similar programs worldwide; many others, especially in selected specializedfields such as the fate and effects of oils spills)! Dr. John Pearce, who has worked in this area for severaldecades (note McIntyre and Pearce 1980; Pearce 2000; Pearce and Wells 2002; Pearce, this volume,

26
Health of the Bay of Fundy: Assessing Key Issues
pages 309-319) has offered valuable insights as to the appropriate set(s) of indicators to use for measur-ing ecosystem health in the Gulf of Maine. As shown by Butler (1997), even single well-known speciesact as easily monitored ‘sentinel species’.
Finally, Smiley et al. (1998), in an internal Canadian review of indicators on MEH (not differ-entiated from MEQ), reached two conclusions useful to the discussion of appropriate indicators for theBay of Fundy: (1) The development of indicators to measure MEH generally involves the followingkey steps: a) scope the issues, b) evaluate the knowledge base, c) select indicators, and d) conducttargeted research and monitoring of the indicators; and (2) The ABC’s of selecting indicators are: a)some indicators should be related to ecosystem structure and function, b) some indicators should beselected (and deployed!) in combination, and c) indicators should be selected using the guidance ofcriteria acceptable to all involved parties.
3.3.3 Status and trends analysis
Indicators should be deployed so as to answer the question: Is the quality of the Fundy marineecosystem (or parts of it) getting better or worse in the short and longer term? This requires substantialdata bases for status and trends analysis. A number of monitoring programs for coastal waters haveselected measures of health and quality that allow for such analysis. That is, measurements of selectedvariables in water, sediments and biota are conducted over space and time to provide a longer termpicture of the magnitude of the response and the direction of change.
Examples include: Gulfwatch for trace chemical contaminants (Chase et al. 2001; Jones et al.2001); algal toxins (as per the Harmful Algal Blooms program); input of aerial contaminants (Clair etal. 2002, acid rain; R. Cox, pers comm., toxic chemicals in fog; E. Sunderland, pers. comm., mercury inair and marine sediments); bacterial levels along the coasts, especially at shellfish beds; condition, i.e.catch statistics, of specific fisheries; state of the water and benthic environments around aquacultureoperations; numbers and locations of tidal barriers or obstructions; location of dykes, maintained andun-maintained; sediment quality at selected sites (K. Tay, pers. comm.); nutrients, especially nitrogen;and sewage treatment and effects. Ultimately, the current status and trends programs will provide datafor a major chapter on this question of ‘better or worse’ or no change in the State of the Bay of Fundy/Gulf of Maine Report(s).
3.4 Connecting with Management Priorities and Needs
A section of the planned State of Fundy/State of the Gulf Reports should address managementpriorities and needs (at various levels, in various sectors), and present recommendations as to how toproceed with future reports. The whole process is started with and finished with management supportand involvement. No single report or report card on the Bay will be perfectly completed. How can suchreports be improved? What do we need? Is a series of reports on different issues, treated in depthseparately, more useful than periodic tomes covering all issues? These questions were addressed morefully in the Coastal Forum (see separate report, in prep., 2004 ). This is simply an introduction to

27
Workshop Background Paper
stimulate discussion between the practitioners of monitoring and assessments, and the clients, the man-agers and the coastal communities.
3.4.1 Mechanisms for action
Do we have the information, human capacity and resources to produce periodic State of the Bayof Fundy Reports? Importantly, do we have the resources to continue to monitor selected variables, i.e.indicators in the Bay, so that the data and information bases remain current and relevant? What else dowe need to have? Who do we direct these to?
3.4.2 New directions
There are a number of needs and new directions to consider (also see discussion from theCoastal Forum), given the role of research, monitoring, assessment and information management inreports on the ecosystem health of the Bay of Fundy. They include:
1. More of a collective vision of the stakeholders as to what they envisage the Bay of Fundyand its watershed(s) to be like in 20, 50, 100 years time, and the mechanisms to protect andconserve their natural features and living resources.
2. More research on practical monitoring tools (e.g., Rapid Assessment of Marine Pollution(RAMP), Wells et al. 2001; the expanded Gulfwatch program).
3. More resources into MEQ and MEH monitoring and data analysis (such as HEED effort).4. More attention to the networking of existing programs involved in monitoring and assess-
ment and guidelines – linked together.5. More practitioners in monitoring and assessments are needed.
4. The Coastal Forum: “Taking the Pulse of the Bay of Fundy”
4.1 Guiding Questions for Discussion
There are five important questions – simply stated but not necessarily simply answered. Thiswas a starting point to the open workshop discussions. It assumed and hoped that other pertinent ques-tions pertaining to the overall goal would likely appear! The five questions are:
1. What is the present health or condition of the Bay of Fundy?2. Are conditions improving or deteriorating?3. What kinds of indicators do we consider most useful in trying to answer these questions?4. Are there adequate resources (institutional, financial, scientific, etc.) to protect or restore the
health of the Bay?5. What kinds of new information and approaches do we need to protect the health of the Bay?

28
Health of the Bay of Fundy: Assessing Key Issues
As shown in these Proceedings (see separate report, in prep., 2004), the workshop participants ad-dressed the questions from their own perspectives, using their own knowledge, and making use of thenew information presented at the meeting (as well as at the previous meetings).
4.2 Developing the Synthesis
To assess the health of the Bay of Fundy, it is necessary to summarize and evaluate the datafrom the chosen suite of ecological health/environmental quality indicators. For example, and follow-ing from previous examples (various US Environmental Protection Agency (EPA) reports; Wells andRolston 1991; Costanza et al. 1992), one could take ten indicators, reached by consensus, and summa-rize the data for them in a number of locations around the edges of the Bay (Note: stresses often occurat edges or interfaces, a topic in itself!). The process is: rank the results of each of the ten indicators,each indicator being marked out of 10 (e.g., 1 – very clean/undisturbed, 10 – very dirty/very disturbed).Then add the scores, 100 being the top score (1–25: very good; 26–50: good to marginal; 51–75:compromised and disturbed; 76–100: very affected/extreme disturbance).
For some indicators, the values assigned could and should be determined by comparison withexisting guidelines, objectives or standards, e.g., contaminant levels in sediments, using the CanadianEnvironmental Protection Act values; tissue concentrations of contaminants, US Food and DrugAdminstration (FDA). The scores (1 to 100) could be portrayed as circles (open to filled in) or circleswith colors (green, yellow, orange, red – an EPA technique), and be placed on a map of the Bay ofFundy to give a visual portrayal of the health and quality, in general, of the Bay. (See EPA reports thathave used this technique (EPA 1998), as well as Chapter 6, Wells and Rolston 1991.) Arrows can alsobe included to show direction of change. The summary across the table, in a row, gives the extent of theproblem across the Bay using each indicator. The summary down the table, in a column, gives animpression of the number of stresses affecting one ecosystem or area of the water body (i.e. the Bay ofFundy), hence an impression of the potential for cumulative change in one area of the Bay.
It is important to recognize the problems with the above approach. The big problem with thisapproach is its linearity – all indicators and indexes are given the same weight in the analysis, whereasin reality, some stresses, e.g., habitat loss, may exceed in total impact another stressor, e.g., periodiclow DO (dissolved oxygen). However, this could be accommodated at a local level, with differentindicators being given different percentages of the total scores (up to 100). A second problem is that therelative impacts of stresses will change across seasons, e.g., bacterial levels in shellfish growing areas;tourism-wildlife interactions; harmful algal blooms. Finally, a number of the stresses cannot be easilyor accurately quantified, i.e. measured, so judgement has to be used, e.g., impact of whale watchingboats on the behaviour of whales. Certainly, the reader can think of more limitations and resolve them!The limitations notwithstanding, the approach is a beginning of a comprehensive discussion, rankingand synthesis of the issues and stresses on the Bay. As shown in these Proceedings, it was used success-fully in the Coastal Forum.
29
Workshop Background Paper
5. Summary and Conclusions
The paper discusses the concepts of health and ecosystem health, and introduces components ofa framework for assessing the Bay of Fundy. Several challenges faced the participants of this 5th Bay ofFundy Science Workshop and Coastal Forum, as they met and discussed issues, approaches and indica-tors for two and one half days. Some conclusions were reached by this author. We collectively have toaddress and understand the concepts and dimensions of the topic of ‘marine ecosystem health’ and‘marine environmental quality (MEQ)’ in the context of the Bay of Fundy and Gulf of Maine, if the goalremains to produce a ‘health assessment’. We will have to organize, assimilate and summarize a largeamount of historical and recent data and information in order to evaluate the ‘health’ of the Bay. Weshould strive to be constructively critical when interacting between disciplines and between sectors, inthis activity of ecosystem health assessment. Finally, we have to consider how often and with whatvenue we should continue to meet and discuss the benchmark measures or indicators, to organize asynthesis, and finally to assess whether we are or are not achieving the task of protection, conservationand restoration of the Bay, its vital watersheds, and their natural resources.
6. Acknowledgments
Many scholars have contributed to this field; they are thanked for their obvious dedication to anunderstanding of ecosystem health and to the ecology of the Bay of Fundy. Discussions with col-leagues, especially those with BoFEP, GESAMP, GOMCME and GPAC, encouraged continued thoughtabout this topic. Questions for the Fundy Coastal Forum were developed in discussion with GrahamDaborn, Barry Jones, Jon Percy and Maxine Westhead, all members of BoFEP. The paper is dedicatedto the memories of three outstanding Bay of Fundy scientists at the Bedford Institute of Oceanography,Dartmouth, NS – Dr. Kathy Ellis, Mr. Nicholas (Nick) Prouse, and Dr. Peter Schwinghamer.
7. Literature Cited
Arctic Monitoring and Assessment Programme (AMAP). 1997. Arctic Pollution Issues. A State of theArctic Environment Report. AMAP, Oslo, Norway. 188 pp.
AMAP. 2002. Arctic Pollution 2002. AMAP, Oslo, Norway. At: <http://www.amap.no>. Accessed: 22October 2002.
Atlantic Geoscience Society. 2001. The Last Billion Years. A Geological History of the Maritime Prov-inces of Canada. Nimbus Publ. Ltd., Halifax, NS. 212 pp.
Atkinson, J., P. M. Brooks, A. C. Chatwin, and P. Shelley. 2000. The Wild Sea. Saving Our MarineHeritage. Conservation Law Foundation, Boston, MA. 120 pp.
Backus, R. H. and D. W. Bourne (Eds.). 1987. Georges Bank. The MIT Press, Cambridge, MA andLondon, UK. 593 pp.
30
Health of the Bay of Fundy: Assessing Key Issues
Baird, D. J. and G. A. Burton (Eds.). 2001. Ecological Variability: Separating Natural from Anthropo-genic Causes of Ecosystem Impairment. SETAC Press, Pensacola, FL. 307 pp.
Bilyard, G. R. 1987. The value of benthic infauna in marine pollution monitoring studies. Marine Pol-lution Bulletin 18(11): 581–585.
Birkett, S. H. and D. J. Rapport. 1996. Comparing the health of two large marine ecosystems: the Gulfof Mexico and the Baltic Sea. Ecosystem Health 2(2): 127–144.
Burger, J. and M. Gochfeld. 2001. On developing bioindicators for human and ecological health. Envi-ronmental Monitoring and Assessment 66: 23–46.
Burt, M. D. B. and P.G. Wells (Eds.). 1998. Coastal Monitoring and the Bay of Fundy. Proceedings ofthe Maritime Atlantic Ecozone Science Workshop, November 1997. Huntsman Marine ScienceCentre, St. Andrews, NB and Environment Canada, Dartmouth, NS. 196 pp.
Butler, R.W. 1997. The Great Blue Heron. A Natural History and Ecology of a Seashore Sentinel.University of British Columbia Press, Vancouver, BC. 167 pp.
Campbell, D. E. 2000. Using energy systems theory to define, measure, and interpret ecological integ-rity and ecological health. Ecosystem Health 6(3): 181–204.
Chandler, H. 2001. Marine Monitoring Programs in the Gulf of Maine. An Inventory. Internal Report,prepared for the Gulf of Maine Council on the Marine Environment. Maine State PlanningOffice and the Gulf of Maine Council, Augusta, ME. 115 pp.
Chang, C. P. 1999. A Marine Environmental Quality Framework: Managing the Marine Ecosystem byChoosing Appropriate Guidelines, Objectives and Standards. Thesis, Master of Marine Man-agement, Dalhousie University, Halifax, NS. 88 pp.
Chang, C. P. and P. G. Wells. 2001. A marine environmental quality (MEQ) framework and the Bay ofFundy. Abstract, Page 127. In: Opportunities and Challenges for Protecting, Restoring andEnhancing Coastal Habitats in the Bay of Fundy. Proceedings of the 4th Bay of Fundy ScienceWorkshop, Saint John, NB, September 19-21st, 2000. T. Chopin and P.G. Wells, Eds. Environ-ment Canada – Atlantic Region, Occasional Report No. 17, Sackville, NB and Dartmouth, NS.
Chase, M. et al. 2001. Gulfwatch: Monitoring spatial and temporal trends of trace metal and organiccontaminants in the Gulf of Maine (1991-1997) with the blue mussel, Mytilus edulis L. MarinePollution Bulletin 42 (6): 491–505.
Chopin, T. and P. G. Wells (Eds.). 2001. Opportunities and Challenges for Protecting, Restoring andEnhancing Coastal Habitats in the Bay of Fundy. Proceedings of the 4th Bay of Fundy ScienceWorkshop, Saint John, NB, September 19-21, 2000. Environment Canada – Atlantic Region,Occasional Report No. 17. Environment Canada, Sackville, NB and Dartmouth, NS. 237 pp.
Clair, T. A. et al. 2002. Changes in freshwater acidification trends in Canada’s Atlantic provinces:1983–1997. Water, Air, and Soil Pollution 135: 335–354.
Clark, R. A. and C. L. J. Frid. 2001. Long-term changes in the North Sea ecosystem. EnvironmentalReview 9: 131–187.

31
Workshop Background Paper
Costanza, R. 1992. Chapter 14. Toward an operational definition of ecosystem health. Pages 239-256.In: Ecosystem Health. New Goals for Environmental Management. R. Costanza, B. G. Nortonand B. D. Haskell. Island Press, Washington, DC.
Costanza, R. and M. Mageau. 1999. What is a healthy ecosystem? In: The Gulf of Mexico Large MarineEcosystem: Assessment, Sustainability, and Management. H. Kumpf, K. Steidinger, and K.Sherman, Eds. Blackwell Science, Malden, MA.
Costanza, R., B. G. Norton and B. D. Haskell. 1992. Ecosystem Health. New Goals for EnvironmentalManagement. Island Press, Washington, DC. 269 pp.
Crawford, D. W., N. L. Bonnevie, C. A. Gillis and R. J. Wenning. 1994. Historical changes in theecological health of the Newark Bay estuary, New Jersey. Ecotoxicology and EnvironmentalSafety 29: 276–303.
Di Giulio, R. T. and E. Monosson (Eds.). 1996. Interconnections Between Human and Ecosystem Health.Ecotoxicology Series 3. Chapman and Hall, London, UK. 275 pp.
Downs, T. J. and R. F. Ambrose. 2001. Syntropic ecotoxicology: A heuristic model for understandingthe vulnerability of ecological systems to stress. Ecosystem Health 7(4): 266–283.
Duarte, C. M., J. Cebrian and N. Marba. 1992. Uncertainty of detecting sea change. Nature 356 (March19): 190.
Ehrenfeld, D. 1992. Ecosystem health and ecological theories. Pages 135-143. In: Ecosystem Health.New Goals for Environmental Management. R. Costanza, B. G. Norton and B. D. Haskell.Island Press, Washington, DC.
Environmental Protection Agency (EPA). 1998. Condition of the Mid-Atlantic Estuaries. USEPA Of-fice of Research and Development, Washington, DC. EPA 600-R-98-147. 50 pp.
EPA. 1999. The Ecological Condition of Estuaries in the Gulf of Mexico. USEPA Office of Researchand Development, Washington, DC. EPA 620-R-98-004. July 1999. 71 pp.
EPA. 2000a. Stressor Identification Guidance Document. USEPA, Office of Research and Develop-ment, Washington, DC. EPA/822/B-00/025. December.
EPA. 2000b. Evaluation Guidelines for Ecological Indicators. EMAP, USEPA, Office of Research andDevelopment, Washington, DC. EPA/620/R-99/005. 97 pp.
Epstein, P. R. 1999. Large marine ecosystem health and human health. Pages 417–438. In: The Gulf ofMexico Large Marine Ecosystem: Assessment, Sustainability, and Management. H. Kumpf, K.Steidinger, and K. Sherman, Eds. Blackwell Science, MA.
Epstein, P. R. and D. J. Rapport. 1996. Changing coastal marine environments and human health.Ecosystem Health 2(3): 166–176.
Earle, S. A. 1995. Sea Change. A Message of the Oceans. G. P. Putnam’s Sons, New York. 361 pp.
Fairweather, P. G. 1999. Determining the “health” of estuaries: Priorities for ecological research. Aus-tralian Journal of Ecology 24: 441–451.
32
Health of the Bay of Fundy: Assessing Key Issues
Fisheries and Oceans Canada (DFO). 2000. Working Together to Protect and Promote Canada’s Oceans.Booklet, Department of Fisheries and Oceans, Ottawa. 9 pp.
DFO. 2002a. Canada’s Oceans Strategy. Our Oceans, Our Future. Oceans Directorate, Department ofFisheries and Oceans, Ottawa. 30 pp.
DFO. 2002b. Canada’s Oceans Strategy. Our Oceans, Our Future. Policy and Operational Frame-work for Integrated Management of Estuarine, Coastal and Marine Environments in Canada.Oceans Directorate, Department of Fisheries and Oceans, Ottawa. 36 pp.
Frith, K. 1999. Ocean and Human Health: How the health of the oceans affects our well-being. Cur-rents, Bermuda Biological Station for Research, Inc. Spring. Pages 7–8.
GESAMP (Joint Group of Experts on the Scientific Aspects of Marine Environmental Protection).1990. The State of the Marine Environment. Blackwell Scientific Publications, Oxford, UK.146 pp.
GESAMP. 1994a. Biological Indicators and Their Use in the Measurement of the Condition of theMarine Environment. GESAMP Reports and Studies No. 55. United Nations Environment Pro-gramme, Nairobi. 56 pp.
GESAMP. 1994b. Guidelines for Marine Environmental Assessments. GESAMP Reports and StudiesNo. 54. International Maritime Organization, London. 31 pp.
GESAMP. 2001a. A Sea of Troubles. GESAMP Reports and Studies No. 70. GESAMP, London. 35 pp.
GESAMP. 2001b. Protecting the Oceans from Land-based Activities. GESAMP Reports and StudiesNo. 71. United Nations Environment Programme, Nairobi.
Goldberg, E. D. 1976. The Health of the Oceans. The Unesco Press, Paris. 172 pp.
GOMCME (Gulf of Maine Council on the Marine Environment). 1989. The Gulf of Maine: SustainingOur Common Heritage. Maine State Planning Office, Augusta, ME, November. 63 pp.
GOMCME. 2002. Gulf of Maine Council on the Marine Environment Action Plan 2001-2006. At:<http://www.gulfofmaine.org/action_plan2001_06.html>. Accessed: 5 October 2002.
Gordon, D. C., Jr., L. D. Griffiths, G. V. Hurley, A. L. Muecke, D. K. Muschenheim and P. G.Wells(Eds.). 2000. Understanding the Environmental Effects of Offshore Hydrocarbon Development.Canadian Technical Report of Fisheries and Aquatic Sciences 2311. Department of Fisheriesand Oceans, Dartmouth, NS. 82 pp. + appendices.
Global Program of Action Coalition (GPAC). 2001. The Gulf of Maine Summit: State of the Environ-ment Reporting from the Bottom-Up. A Handbook for Forum Conveners. GPAC, Blue Hill,ME. 18 pp.
Gove, P. B. (Ed.). 1993. Webster’s Third New International Dictionary, Unabridged. Merriam-Webster,Springfield, MA.
Harding, G. C. H. 1992. A Review of Major Marine Environmental Concerns Off the East Coast in the1980’s. Canadian Technical Report of Fisheries and Aquatic Sciences 1885. Department ofFisheries and Oceans, Dartmouth, NS. 38 pp.
33
Workshop Background Paper
Harding, L. E. 1992. Measures of marine environmental quality. Marine Pollution Bulletin 25(1–4):23–27.
Harvard Health, Ecological and Economic Dimensions of Global Change Program (HEED). 1998.Marine Ecosystems: Emerging Diseases as Indicators of Change. Health of the Oceans fromLabrador to Venezuela. Center for Health and the Global Environment, Harvard Medical School,Boston, MA. 85 pp.
Harvell, C. D. et al. 1999. Emerging marine diseases – climate links and anthropogenic factors. Science285: 1505–1510.
Harvey, J., D. Coon, and J. Abouchar. 1998. Habitat Lost: Taking the Pulse of Estuaries in the Cana-dian Gulf of Maine. Conservation Council of New Brunswick, Fredericton, NB. 79 pp.
Haskell, B. D. , B. G. Norton and R. Costanza. 1992. Introduction. What is ecosystem health and whyshould we worry about it? Pages 3-20. In: Ecosystem Health. New Goals for EnvironmentalManagement. R. Constanza, et al. Island Press, Washington, DC.
Hinch, P., S. Bryan and P. G. Wells (Eds.). 2002. Sewage Management in the Gulf of Maine. WorkshopReport. In preparation, July.
Intergovernmental Oceanographic Commission (IOC). 1996. A Strategic Plan for the Assessment andPrediction of the Health of the Ocean: A Module of the Global Ocean Observing System. IOC/UNESCO, IOC/INF-1044, May. IOC, Paris. 39 pp.
International Joint Commission (IJC). 1991. A Proposed Framework for Developing Indicators of Eco-system Health for the Great Lakes Region. Council of Great Lakes Research Managers, IJC,USA and Canada. July. 47 pp.
IUCN - The World Conservation Union. 1998. An Ecosystem Strategy for the Assessment and Manage-ment of International Coastal Ocean Waters. Brochure. IUCN, NOAA and IOC/UNESCO. 8pp.
Jackson, J. B. C. 2001. What was natural in the coastal oceans? Proceedings of the National Academyof Science 98(10): 5411–5418.
Jackson, J. B. C. et al. 2001. Historical over-fishing and the recent collapse of coastal ecosystems.Science 293: 629–638.
Jakeman, A. J., M. B. Beck and M. J. McAleer (Eds.). 1993. Modelling Change in Ecological Systems.John Wiley and Sons, Chichester, NY. 584 pp.
Jamieson, G. et al. 2001. Proceedings of the National Workshop on Objectives and Indicators for Eco-system-based Management. Sidney, BC, 27 February – 2 March, 2001. Canadian Science Advi-sory Secretariat Proceedings Series 2001/09. Department of Fisheries and Oceans, Ottawa.
Jickells, T. D. 1998. Nutrient bio-geochemistry of the coastal zone. Science 281: 217–222.
Johnston, P. et al. 1998. Report on the World’s Oceans. Greenpeace Research Laboratories Report,University of Exeter, UK, May. 154 pp.

34
Health of the Bay of Fundy: Assessing Key Issues
Jones, S. H. and P. G. Wells (Eds). 2002. Gulf of Maine Environmental Quality Monitoring Workshop,3 April – 1 May, 2001. Summary Report. In press, September. Gulf of Maine Council on theMarine Environment, Durham, NH and Dartmouth, NS.
Jones, S. H. et al. 2001. Monitoring for toxic contaminants in Mytilus edulis from New Hampshire andthe Gulf of Maine. Journal of Shellfish Research 20(3): 1203–1214.
Karr, J. R. 1981. Assessment of biotic integrity using fish communities. Fisheries 6: 21–27.
Karr, J. R. 1991. Biological integrity: A long-neglected aspect of water resource management. Ecologi-cal Applications 1: 66–84.
Karr, J. R. 1992. Chapter 13. Ecological integrity. Protecting Earth’s life support systems. Pages 223–238. In: Ecosystem Health. New Goals for Environmental Management. R. Constanza, et al.Island Press, Washington, DC.
Karr, J. R., K. D. Fausch, P. L. Angermeier, P. R. Yant, and I. J. Schlosser. 1986. Assessing BiologicalIntegrity in Running Water: A Method and its Rationale. Special Publication 5. Illinois NaturalHistory Survey, Champaign, IL. 28 pp.
Kay, B. H. 1989. Pollutants in British Columbia’s Marine Environment. A Status Report. SOE ReportNo 89-1, April 1989. Environment Canada, Ottawa. 59 pp.
Knap, A. H., et al. 2002. Indicators of ocean health and human health: Developing a research andmonitoring framework. Environmental Health Perspectives 110(9): 839–845.
Konrad, V., S. Ballard, R. Erb and A. Mortin. 1990. The Gulf of Maine: Sustaining Our CommonHeritage. Maine State Planning Office and the Canadian-American Center of the University ofMaine, Augusta, ME. 270 pp.
Kullenberg, G. 1982. The Review of the Health of the Oceans. GESAMP Reports and Studies No. 15.UNESCO, Paris. 108 pp.
Kutchenberg, T. C. 1985. Measuring the health of the ecosystem. Environment 27: 32–37.
Lane, P. A. 1998. Chapter 9. Assessing cumulative health effects in ecosystems. Pages 129–153. In:Ecosystem Health. D. Rapport et al., Eds. Blackwell Science, Oxford, UK.
Leopold, A. 1949. A Sand County Almanac, and Sketches Here and There. Oxford University Press,London. 226 pp.
Lomborg, B. 2001. The Skeptical Environmentalist. Measuring the Real State of the World. CambridgeUniversity Press, Cambridge, UK. 515 pp.
Long, E. R. and M. F. Buchman. 1989. An Evaluation of Candidate Measures of Biological Effects forthe National Status and Trends Program. NOAA Technical Memorandum NOS OMA 45. April,Seattle, WA (Executive Summary).
Lotze, H. and I. Milewski. 2002. Two Hundred Years of Ecosystem and Food Web Changes in theQuoddy Region, Outer Bay of Fundy. Conservation Council of New Brunswick, Fredericton,NB. 188 pp.
35
Workshop Background Paper
Mann, K. H. 2000. Ecology of Coastal Waters, with Implications for Management. Blackwell SciencePublications, Cambridge, UK. 406 pp.
Marine Institute. 1999. Ireland’s Marine and Coastal Areas and Adjacent Seas. An EnvironmentalAssessment. Marine Institute, Dublin, Ireland. 388 pp.
Marx, W. 1999. The Frail Ocean. A Blueprint for Change in the New Millennium. Hartley and Marks,Vancouver, BC. 272 pp.
McGinn, A. P. 1999. Safeguarding the Health of Oceans. Worldwatch Paper 145, March. WorldwatchInstitute, Washington, DC. 87 pp.
McGowan, J. A., D. R.Cayan and L. M. Dorman. 1998. Climate-ocean variability and ecosystem re-sponse in the Northeast Pacific. Science 281: 210–217.
McIntyre, A. D. and J. Pearce (Eds.) 1980. Biological Effects of Marine Pollution and the Problems ofMonitoring. Rapports Procès-Verbaux des Réunions Conseil International pour l’Explorationde la Mer 179, 1-346. ICES, Copenhagen, Denmark.
McMichael, A. J. 1993. Planetary Overload. Global Environmental Change and the Health of theHuman Species. Cambridge University Press, Cambridge, UK. 352 pp.
Milewski, I., J. Harvey and S. Calhoun. 2001. Shifting Sands. State of the Coast in Northern andEastern New Brunswick. Conservation Council of New Brunswick, Fredericton, NB. 144 pp.
Myers, N. 1995. Environmental unknowns. Science 269: 358–360.
National Oceanic and Atmospheric Administration (NOAA). 1999. National Status and Trends Pro-gram for Marine Environmental Quality. South Florida. NOAA, CCMA, Regional Report Se-ries 2. US Department of Commerce, NOAA. 40 pp.
Nettleship, D. N. 1997. Long-term monitoring of Canada’s seabird populations. Pages 16-23. In: Moni-toring Bird Populations: The Canadian Experience. E. H. Dunn, M. D. Cadman and J. B. Falls,Eds. Occasional Paper Number 95. Canadian Wildlife Service, Environment Canada, Ottawa.
Nielsen, N. O. 1999. The meaning of health. Ecosystem Health 5(2): 65–66.
Norton, B. G., R. E. Ulanawicz, and B. D. Haskell. 1991. Scale and Environmental Policy Goals.Report to the EPA, Office of Policy, Planning and Evaluation. Environmental Protection Agency,Washington, DC.
Noss, R. 1995. Maintaining Ecological Integrity in Representative Reserve Networks. World WildlifeFund Canada, WWF USA, Toronto and Washington, DC. 77 pp.
O’Connor, J. S. and R. T. Dewling. 1986. Indices of marine degradation: Their utility. EnvironmentalManagement 10(3): 335–343.
Ollerhead, J., P. W. Hicklin, P. G. Wells and K. Ramsey (Eds.). 1999. Understanding Change in the Bayof Fundy Ecosystem. Environment Canada - Atlantic Region, Occasional Report No. 12. Envi-ronment Canada, Sackville, NB and Dartmouth, NS. 143 pp.
Pearce, J. B. 2000. The New York Bight. Marine Pollution Bulletin 41(1-6): 44–55.

36
Health of the Bay of Fundy: Assessing Key Issues
Pearce, J. B. and P. G.Wells. 2002. Editorial. Key(s) to marine ecology and understanding pollutionimpacts. Marine Pollution Bulletin 44: 179–180.
Percy, J. A. and P. G. Wells. 2002. Taking Fundy’s Pulse: Monitoring the Health of the Bay of Fundy.BoFEP Fundy Issues #22, Autumn. Environment Canada, Dartmouth, NS. 8 pp.
Percy, J. A., P. G. Wells and A. J. Evans (Eds.). 1997. Bay of Fundy Issues: A Scientific Overview.Environment Canada - Atlantic Region, Occasional Report No. 8. Environment Canada,Sackville, NB and Dartmouth, NS (Reprinted April 2002).
Pesch, G. 2000. Establishing a Framework for Effective Monitoring of the Gulf of Maine. RARGOMReport 00-1. September 29, 2000. Regional Association for Research on the Gulf of Maine. 9pp.
Plant, S. 1985. Bay of Fundy Environmental and Tidal Power Bibliography. Canadian Technical Reportof Fisheries and Aquatic Sciences 1339. Department of Fisheries and Oceans, Dartmouth, NS.
Rapport, D. J. (Ed.). 1986. State of Canada’s Environment. Environment Canada, Ottawa.
Rapport, D. J. 1989. What constitutes ecosystem health? Perspectives in Biology and Medicine 33(1):120–132.
Rapport, D. J. 1990. Challenges in the detection and diagnosis of pathological change in aquatic eco-systems. Journal of Great Lakes Research 16(4): 609–618.
Rapport, D. J. 1992. Evaluating ecosystem health. Pages 15-24. In: Assessing Ecosystem Health: Ra-tionale, Challenges and Strategies. M. Munawar (Ed.). Kluwer, Amsterdam.
Rapport, D. J. 1998. Dimensions of ecosystem health. Pages 34-40. In: Ecosystem Health. D. J. Rap-port, et al., Eds. Blackwell Science, Oxford, UK.
Rapport, D. J. 1999. Epidemiology and ecosystem health: Natural bridges. Ecosystem Health 5(3):174–180.
Rapport, D. J., R. Costanza and A. J. McMichael. 1998. Assessing ecosystem health. TREE (Trends inEcology and Evolution) 13(10) (October 10): 397–401.
Rapport, D. J. and W. G. Whitford. 1999. How ecosystems respond to stress. Common properties toarid and aquatic systems. Bioscience 49(3): 193–203.
Rapport, D. J. et al. 1980. Commentary. Ecosystem medicine. Pages 180-189. In: Perspectives onAdaptation, Environment and Population. J. C. Calhoun, Ed. Praeger, New York.
Rapport, D. J. et al. 1998. Ecosystem Health. Blackwell Science, Oxford, UK. 372 pp.
Rapport, D. J. et al. 1999. Ecosystem health: the concept, the ISEH, and the important tasks ahead.Ecosystem Health 5(2): 82–90.
Rose, G. A. et al. 2000. Perspective. Distribution shifts and overfishing the northern cod (Gadus morhua):A view from the ocean. Canadian Journal of Fisheries and Aquatic Sciences 57: 644–663.

37
Workshop Background Paper
Salánki, J. (Ed.). 1986. Biological Monitoring of the State of the Environment: Bioindicators. An Over-view of the IUBS Programme on Bioindicators 1985. International Union of Biological Sci-ences, Paris.
Schaeffer, D. J. 1996. Diagnosing ecosystem health. Ecotoxicology and Environmental Safety 34: 18–34.
Schaeffer, D. J., E. E. Herricks and H. W. Kerster. 1988. Ecosystem health: 1. Measuring ecosystemhealth. Environmental Management 12: 445–455.
Schindler, D. W. 1987. Detecting ecosystem responses to anthropogenic stress. Canadian Journal ofFisheries and Aquatic Sciences 44 (Suppl. 1): 6–25.
Schroeder, P. C. et al. 2001. The Gulf of Maine Environmental Information Exchange: Participation,observation, conversation. Environment and Planning B: Planning and Design 28: 865–887.
Schwaiger, J. et al. 1997. The use of histopathological indicators to evaluate contaminant-related stressin fish. Journal of Aquatic Ecosystem Stress and Recovery 6: 75–86.
Selye, H. 1974. Stress Without Distress. Lippincott, Philadelphia, PA. 171 pp.
Sheppard, C. 2000. Seas at the Millennium. 3 vols. Pergamon Press, Oxford, UK.
Sherman, B. H. 2000. Marine ecosystem health as an expression of morbidity, mortality and diseaseevents. Marine Pollution Bulletin 41(1–6): 232–254.
Sherman, K. 1994. Sustainability, biomass yields, and health of coastal ecosystems: An ecologicalperspective. Marine Ecology – Progress Series 112: 277–301.
Sherman, K. 2000. Why regional coastal monitoring for assessment of ecosystem health? EcosystemHealth 6(3): 205–216.
Sherman, K., N. A. Jaworski, and T. J. Smayda. 1996. The North-East Shelf Ecosystem. Assessment,Sustainability and Management. Blackwell Science, Cambridge, MA. 564p.
Sherman, K. and H. R. Skjoldal (Eds.). 2002. Large Marine Ecosystems of the North Atlantic. Chang-ing States and Sustainability. In press.
Simon, T. P. (Ed.). 2002. Biological Response Signatures. Indicator Patterns Using Aquatic Communi-ties. CRC Press, Boca Raton, FL. 576p.
Smiley, B., D. Thomas, W. Duvall and A. Eade. 1998. State of the Environment Reporting. SelectingIndicators of Marine Ecosystem Health: A Conceptual Framework and an Operational Proce-dure. Environment Canada, Occasional Report Series No. 9, Environment Canada, Ottawa. 33pp.
Soule, D. F. and G. S. Kleppel (Eds.). 1998. Marine Organisms as Indicators. Springer-Verlag, NewYork.
Spellerberg, I. F. 1991. Monitoring Ecological Change. Cambridge University Press, Cambridge, UK.334 pp.

38
Health of the Bay of Fundy: Assessing Key Issues
Stewart, P. and L. White. 2001. A Review of Contaminants on the Scotian Shelf and in Adjacent Waters:1970–1995. Canadian Technical Report of Fisheries and Aquatic Sciences 2351. Department ofFisheries and Oceans, Dartmouth, NS. 158p.
Stokes, P. 1981. Discussion. Pages 85–89. In: Ecotoxicology and the Aquatic Environment. P. M. Stokes,Ed. Pergamon Press, Oxford.
Suter, G. W. 1993. A critique of ecosystem health concepts and indexes. Environmental Toxicology andChemistry 12(9): 1533–1539.
Sykes, J. B. 1976. The Concise Oxford Dictionary of Current English. 6th Edition. Oxford UniversityPress, Oxford, UK.
Tait, J. T. P., I. D. Cresswell, R. Lawson and C. Creighton. 2000. Auditing the health of Australia’secosystems. Ecosystem Health 6(2): 149–163.
Thompson, D. R. and K. C. Hamer. 2000. Stress in seabirds: Causes, consequences and diagnosticvalue. Journal of Aquatic Ecosystem Stress Recovery 7: 91–110.
Ulanowicz, R. E. 1992. Chapter 11. Ecosystem health and trophic flow networks. In: Ecosystem Health.New Goals for Environmental Management. R. Costanza et al. Island Press, Washington, DC.
Vandermeulen, H. 1998. The development of marine indicators for coastal zone management. Ocean &Coastal Management 39: 63–71.
Van Dolah, F. M. 2000. Marine algal toxins: origins, health effects, and their increased occurrence.Environmental Health Perspectives 108(Suppl. 1): 133–141.
Wade, T. L. et al. 1998. NOAA’s mussel watch project: current use of organic compounds in bivalves.Marine Pollution Bulletin 37: 20–26.
Waldichuk, M. 1989. The state of pollution in the marine environment. Marine Pollution Bulletin 20(12):598–602.
Wallace, G. T. and E. F. Braasch (Eds.). 1997. Proceedings of the Gulf of Maine Ecosystem Dynamics,Scientific Symposium and Workshop. September 1996, St. Andrews, NB. RARGOM Report 97-1. Regional Association for Research on the Gulf of Maine. 352p.
Wells, P. G. 1991. Chapter 6. Assessment. Pages 115–122. In: Health of the Oceans. A Status Report onCanadian Marine Environmental Quality. P. G. Wells and S. Rolston, Eds. Environment Canada,Ottawa and Dartmouth, NS.
Wells, P. G. 1996. Measuring ocean health: resetting a cornerstone of Canadian marine policy, scienceand management. Pages 241–249. In: Annexes of the Canadian Ocean Assessment. A Review ofCanadian Ocean Policy and Practice. International Ocean Institute, Halifax, NS.
Wells, P. G. 1999a. Biomonitoring the health of coastal marine ecosystems – the roles and challenges ofmicroscale toxicity tests. Marine Pollution Bulletin 39(1–12): 39–47.

39
Workshop Background Paper
Wells, P. G. 1999b. Understanding change in the Bay of Fundy ecosystem. Pages 4–11. In: Understand-ing Change in the Bay of Fundy Ecosystem. J. Ollerhead, P. W. Hicklin, P. G. Wells and K.Ramsey, Eds. Environment Canada - Atlantic Region, Occasional Report No. 12. EnvironmentCanada, Sackville, NB and Dartmouth, NS.
Wells, P. G. and R. P. Côté. 1988. Protecting marine environmental quality from land-based pollutants.Marine Policy 12: 9–21.
Wells, P. G., M. H. Depledge, J. N. Butler, J. J. Manock and A. H. Knap. 2001. Rapid toxicity assess-ment and biomonitoring of marine contaminants – exploiting the potential of rapid biomarkerassays and microscale toxicity tests. Marine Pollution Bulletin 42(10): 799–804.
Wells, P. G. and J. Gratwick (Eds.). 1988. Canadian Conference on Marine Environmental Quality:Proceedings. International Institute for Transportation and Ocean Policy Studies, DalhousieUniversity, Halifax, NS.
Wells, P. G. and S. J. Rolston (Eds.). 1991. Health of the Oceans. A Status Report on Canadian MarineEnvironmental Quality. Environment Canada, Ottawa and Dartmouth, NS. 187 pp. (Reprintedwith index, Fall 1991.)
White, L. and F. Johns. 1997. Marine Environmental Assessment of the Estuary and Gulf of St. Law-rence. Department of Fisheries and Oceans, Ottawa. 128 pp.
Wichert, G. A. and D. J. Rapport. 1998. Fish community structure as a measure of degradation andrehabilitation of riparian systems in an agricultural drainage basin. Environmental Manage-ment 22(3): 425–443.
Wilson, R. C. H. and R. F. Addison (Eds.). 1984. Health of the Northwest Atlantic. A Report to theInterdepartmental Committee on Environmental Issues. Environment Canada, Department ofFisheries and Oceans, Department of Energy, Mines and Resources, Ottawa. 174 pp.
Wood, N. and P. Lavery. 2000. Monitoring seagrass ecosystem health – the role of perception in defin-ing health and indicators. Ecosystem Health 6(2): 134–148.
Woodley, S., J. Kay and G. Francis. 1993. Ecological Integrity and the Management of Ecosystems. St.Lucie Press, Delray Beach, FL. 220 pp.
Zaitsev, Y. and V. Mamaev. 1997. Marine Biological Diversity in the Black Sea. A Study of Change andDecline. GEF Black Sea Environmental Programme. United Nations Publications, New York.208 pp.
Zelazny, D. E. 2001. Introduction. Great Lakes Research Review 5(2): i–ii.
Personal Communications
Simon Courtney, Department of Fisheries and Oceans, Moncton, NBMichael Depledge, University of Plymouth, UKAnthony Gaston, Canadian Wildlife Service, Ottawa, ONDiana Hamilton, University of New Brunswick, Fredericton, NB

40
Health of the Bay of Fundy: Assessing Key Issues
Jocelyne Hellou, Department of Fisheries and Oceans, Dartmouth, NSAnthony Knap, Bermuda Biological Station for Research, BermudaWilliam O’Bearne, National Oceanic and Atmospheric Administration, Washington, DCThomas O’Connor, National Oceanic and Atmospheric Administration, Washington, DCKenneth Sherman, National Oceanic and Atmospheric Administration, Narragansett, RIPeter Strain, Department of Fisheries and Oceans, Dartmouth, NSElsie Sunderland, Simon Fraser University, Burnaby, BCKok-leng Tay, Environment Canada, Dartmouth, NSDaniel Wolfe, National Oceanic and Atmospheric Administration, Washington, DC

41
Health of the Bay of Fundy: Assessing Key Issues
Session One
COASTAL ZONE ANDINFORMATION MANAGEMENT
Chair: Michael Butler, Atlantic Coastal Zone InformationSteering Committee, Halifax, Nova Scotia

42
Health of the Bay of Fundy: Assessing Key Issues
43
Session One: Coastal Zone and Information Management
COASTAL ZONE MANAGEMENT AND INTEGRATED OCEANMANAGEMENT: WHERE DO THE CONCEPTS MEET?
Marianne Janowicz1 and Robert Rutherford2
1 New Brunswick Department of the Environment and Local Government, Fredericton, [email protected]
2 Oceans and Coastal Management Division, Fisheries and Oceans Canada, Dartmouth, [email protected]
Background: Why are both the federal and provincial government now looking at ways tomanage the coastal zone?
The coastal zone can be defined as the zone where land, sea and air interact to yield an area ofsome of the highest biological productivity on earth. Coastal zone management is a tool for developingthe larger and longer term vision of how the coastal zone can be utilized today and in the future so thatit maintains its ecological integrity and provides the foundation for the continuing existence of coastalcommunities.
Over the years there have been many calls for improved coastal zone management in Canadafrom a broad range of groups. One such call was as early as 1977. A report by Marine Research Asso-ciates Ltd. identifying the effects of a proposed liquified natural gas terminal on the fisheries aroundLorneville, New Brunswick stated the following:
We must recommend that government should establish a coastal zone manage-ment system which identifies areas of vital resource value as well as suitablesites for industrial development; sites where stringent controls insure the co-existence of new industry and the fishery.
These requests for coastal zone management have resulted in several initial attempts to developcoastal zone management policies and programs by various federal or provincial departments. To datethere has not been a clear lead at either level of government, and the vision developed by these initia-tives has not always been reflective of the broader community interest. Community groups and net-works of organizations have also tried to take a lead but have been limited by a lack of funds, capacityand decision-making powers.
The result is that we have not yet been successful in developing and delivering a comprehensiveand integrated approach to coastal zone management. The reasons for this are as numerous as the pastattempts and the number of people you ask. However, they can be summed up by saying that a lack ofa defined goal on the part of all players has been a significant obstacle to progress.

44
Health of the Bay of Fundy: Assessing Key Issues
In the absence of an integrated approach to coastal zone management, development in the coastalzone is increasing at a rapid rate. Pollution from land-based activities is affecting the health of thecoastal ecosystems, often hurting traditional uses. Urban centers are growing in size and the develop-ment is spreading along the coast, there is more interest in tourism and coastal recreation, and newindustries are developing and taking space in an already heavily used coastal area.
Over the past few years there have been several positive changes that have moved both thegovernment policy and community involvement forward on coastal zone management. We intend topursue this positive direction to achieve a new way of doing business in the coastal zone.
The Federal Perspective
In 1997 the federal government recognized the need for one of their ministers to take the lead onoceans policy issues and to develop and deliver a program of oceans and coastal management in col-laboration with the other federal departments, the provincial governments, affected Aboriginal com-munities, users and coastal communities and the broader public. The Minister of Fisheries and Oceanswas given this role through the Oceans Act.
The first part of the Oceans Act formally extends Canada’s sovereignty and jurisdiction to thefull extent allowed under international law. The coastal baselines and 200 nautical mile (nm) exclusiveeconomic zone (EEZ) lines from the repealed Territorial Seas and Fishing Zones Act became regula-tions under the Oceans Act. It also made an extended continental shelf claim and set out a 12 nmterritorial sea and 24 nm contiguous zone. Along with claiming this huge territory and the managementof the resources came some responsibilities. The first is to manage the EEZ’s living resources in asustainable manner on behalf of the world community, and the second is to set up an effective andcomprehensive management process. Canada has decided to do this for all of its ocean areas, includingthe coastal waters in the territorial sea and marine waters inside of the baselines.
The Oceans Act sets out an oceans management strategy framework based on sustainable de-velopment, integrated management, and the precautionary, collaborative and ecosystem principles andapproaches. The meaning of these principles was not defined in operational terms but, when takentogether, they do provide guidance on direction and intent. In a word, the vision is to achieve sustainability.This means addressing the four aspects of sustainability: social or community, economic, environmen-tal, and the way we manage ourselves (institutional). The Department of Fisheries and Oceans (DFO)has recently released its strategy for tackling this task and an action plan (DFO 2002a and 2002b). Theoceans strategy will also outline a stewardship program. This will integrate similar programs within theDepartment and other federal departments in a way which ensures they work well together to supportcommunity stewardship of marine living resources and their habitats.
The Minister was also directed by Parliament to achieve this vision by leading and facilitatingthe development and implementation of integrated management plans, in collaboration with all inter-ests, for all activities in or affecting the marine ecosystem. This initiative has two focusses: a planning

45
Session One: Coastal Zone and Information Management
process which will develop oceans and coastal management plans, and working collaboratively todevelop social capital and capacity for the effective development and implementation of the plans.DFO intends to do this by involving the broad community of interests in defining the vision of wherewe want to be, balancing between the four elements of sustainability, and developing the indicatorsrelevant in the planning area with measurable target levels. This will be an open plan requiring updatesand regular review periods. An integrated management (IM) framework will be released for discussionin the near future.
The Oceans Act also includes authority and powers to implement marine environmental guide-lines, standards and regulations in support of the management plan. This is required in order to set acommon basis for all activities and to fill gaps between the current sector-based ecosystem protectionactivities. The framework for this aspect of the plans will be released soon.
The New Brunswick Perspective
In 1990, the Premier’s Roundtable on the Environment and the Economy issued a report, Sus-tainable Development in New Brunswick: Because We Want To Stay/Developpement durable au Nouveau-Brunswick: Nous tenons a y rester. It included a recommendation stating that the maintenance andsustainable use of the natural wealth of the oceans and the coastal zone will require integrated ap-proaches to coastal zone management.
In New Brunswick, 1993 was the pivotal year for initiation of a broader discussion withingovernment of coastal zone management. That year, the Commission on Land Use and the Rural Envi-ronment (CLURE) recommended that the province develop a coastal zone management plan. Govern-ment responded, saying that such a plan was in the development stages. The decision was made todevelop the coastal lands policy as the initial component while recognizing the marine portion wouldbe integrated at a later date.
In April 2000, the Government of New Brunswick created the Department of the Environmentand Local Government (DELG), with a mandate of integrating activities to develop a comprehensiveair, land and water management approach. This reinforced the opportunity to take planning into thecoastal zone.
The first stage of the New Brunswick coastal zone management policy is the Coastal AreasProtection Policy which was released earlier in 2002 for consultation (DELG 2002). The policy identi-fies two zones where activities are either restricted or go through a review process in order to protectthe integrity of the coastal zone. The three factors identified as influencing the attention to coastalprotection are: increased knowledge of how ecosystems in coastal areas function, greater pressure fordevelopment in coastal areas, and climate change and its associated risks to human health and safety.The next stage is the marine planning and management framework that is currently under development.Together, the two components will form the basis for the New Brunswick coastal zone managementframework.
46
Health of the Bay of Fundy: Assessing Key Issues
The legislative support for provincial activity in the marine environment comes from the WaterQuality Regulations of the Clean Environment Act, the Clean Water Act, the Crown Lands Act and theCommunity Planning Act. The Water Quality Regulation 82-126 identifies actions in or upon the “wa-ters of New Brunswick” that are in contravention of the Regulation and the Act. The Clean Water Actfurther defines waters of New Brunswick as “all waters in the Province of New Brunswick and, —includes coastal water within the jurisdiction of the Province”. Regulations under the Community Plan-ning Act state that the Lieutenant-Governor in Council may, on the recommendation of the Minister,make regulations respecting “land use and development policies including planning for coastal zones”.The Crown Lands Act governs submerged lands in the province. Which of these mechanisms willultimately be used to support coastal zone management is yet to be decided.
Provincially, the overriding intent in developing a marine planning and management frame-work to complement the coastal areas protection policy is to create a mechanism to manage human useand impacts in the marine environment in order to ensure a sustainable future for the marine ecosystemand the coastal communities dependent upon it. The principles to be used in the development of themarine component and the local visions are:
• Ensure ecological, social and economic sustainability• Protect biodiversity• Protect cultural and aesthetic values• Develop a mechanism for increased local management and decision making
It should be noted that the province is using the same general approach as the federal government andthe policy will be reflective of the community vision.
Institutional Arrangements
What measures or arrangements will be developed for the federal (DFO) and provincial (DELG)governments to co-operate in their approach? The current priorities for the two departments are tofurther develop their respective lead roles. This involves “writing the rules” for working together aswell as with the broader community. Formal arrangements may be put in place as required to effectivelyimplement the coastal zone programs.
Some of these areas of jurisdiction between the two governments are quite clear, while othersare shared. Others overlap, where either could have the jurisdiction or where neither has an appropriatelegislative base, due to the complexity of governance in the coastal area. This has been key to govern-ment inaction on many issues in the past, but has also allowed some interests to move forward withoutproper input from all interests. Both governments recognize the need to commit to an active program towork this out and to bring in other departments. In support of this priority, DELG has formed an inter-governmental committee of the relevant departments to act as a sounding board in the policy develop-ment process.
47
Session One: Coastal Zone and Information Management
Coastal zone planning creates the need for the governments to clearly identify their role incommunity development in order to ensure balanced input into the plan. The coastal zone planninginitiative provides the opportunity to work with the various community interests to develop a way ofworking together to create a vision and decision-making framework. There is a need to find a balancebetween community interests rather than just dealing with self-identified groups.
Methodology
The vision of the two levels of government is not really that different nor are either well enoughdefined to prevent co-development of the concepts and approaches. The differences that do exist aremost likely due to the different frameworks under which the departments work and the expertise withinthe departments. These differences in focus can be used to advantage to identify respective areas ofconcentration.
For the federal government, the emphasis is on identifying ecotypes and associated objectiveswith target levels to be met for the health of that ecosystem. This is based on the EEZ requirement topreserve ecological sustainability as a condition of sovereignty and to better our understanding of thisaspect of management over the social and economic or even the institutional aspects. DFO is workingto develop a balanced approach in pilot areas, but it is a learning experience for all of us. In the offshorepilot areas, DFO has engaged the community, developed a common vision, completed use audits, andcompiled legislative, regulatory and existing management documents, as well as ecosystem overviews.Inshore, DFO has engaged the community at several sites and completed many elements of a coastalmanagement plan. However, more effort is still required toward inter-government collaboration toeffectively develop and implement coastal plans.
The July 2001 DELG strategic plan embraces many of the activities that development of amarine component of coastal management will require. These include:
• Bringing government closer to the grassroots of communities to identify local needs andissues
• Promoting responsible stewardship of our air, water and land resources• Enhancing local autonomy within a provincial framework• Improving co-ordination and co-operation among agencies• Strengthening the focus on integrated ecosystem management
The envisioned first step is to engage coastal communities to articulate their relationship to their ma-rine area and to identify present usages of the marine environment and desirable and feasible futureusages. The province has experience in engaging local communities and may take the lead in this area.
Along with engaging communities comes developing local capacity for dialogue and leader-ship. One of the primary tools for this activity is to increase stewardship of the marine environment, in

48
Health of the Bay of Fundy: Assessing Key Issues
other words, to increase coastal people’s knowledge and curiosity about how the marine environmentworks. Much of this knowledge is already in these communities. Sometimes it is an intuitive knowl-edge that does not find expression in words. Stewardship, to a large extent, is a way of taking thisintuitive knowledge and putting it into words. Both the provincial and federal governments have pro-grams that can support stewardship initiatives in coastal communities.
There is also a need for very specific information and data that will help in the formulation ofplans for marine areas. Here, federal departments may assume the lead where they are more experi-enced in working with communities to compile information about the marine ecosystem and settingsustainability objectives.
As knowledge increases, so does discussion. Once communities and stakeholders are engaged,local capacity has increased and there is a better understanding of the marine ecosystem, then theframework for planning and management can be utilized to develop a management plan. The planwould be based on the overriding principles of ensuring ecological sustainability, protecting biodiversity,protecting cultural and aesthetic values, and developing effective local management and decision mak-ing.
Design of Community Involvement
Several activities could happen simultaneously to start the process of coastal zone planning.Focus groups may be established in the three coastal regions of the province to bring together a selectedgroup of coastal residents to help forward the ideas of how to proceed. This would include discussionabout possible pilot areas, boundaries of planning pilot areas, and methods of engaging coastal resi-dents and stakeholders. Presentations would also be made to community groups and to other agenciesto receive their input. The intent is to develop the vision with the whole community and to take thedecisions back to them with an explanation of why they were made.
In some instances, simultaneous with the focus groups, pilot projects may be initiated. Thepurpose of the pilot projects would be to try out some methods for community visioning. There are anumber of approaches that can be taken to engage communities. One approach could be to find willinglocal partners to take a lead in organizing the coastal peoples. They could engage the population on aone-on-one basis or in small kitchen table discussions to identify the present and future priorities in anarea. Once these priorities are known, the framework for a discussion document emerges.
The suggestion is often made that there has to be an issue-oriented exercise to capture theinterest of the residents. However, while we can use specific local coastal issues as a means to start thelarger debate on marine management, coastal zone management is not merely solving problems that areaffecting the quality of life along our shoreline, disrupting regular ways of doing business or cleaningup pollution sites. Coastal zone management is developing the larger and longer term vision for presentand future coastal zone usage that is compatible with maintaining ecological integrity and coastal com-munities. Resolving coastal environmental issues may be an outcome of the exercise, but it is not the
49
Session One: Coastal Zone and Information Management
goal. In effect, the vision identifies the blueprint for future community action. Many Maritime commu-nities are starting to work on coastal planning for social or economic reasons, or just to help ensure theecosystem stays the way it is now, without having been motivated by an environmental crisis.
Identification of the marine boundaries of the area that we want to develop a vision for is animportant part of the process. There are three potential ways to define the boundaries: community legalboundaries such as village or county lines, the area where a community utilizes the marine environ-ment, or ecological boundaries as defined by water circulation or habitats.
If the pure planning approach is taken, based on the existing provincial planning structure,existing legal boundaries would be utilized. However, in New Brunswick, simultaneous with the ma-rine planning exercise is an exercise to look at watersheds from an integrated planning perspective.Watershed boundaries do not coincide with existing legal boundaries. This multi-fronted integratedplanning exercise in the provincial arena fits well into using ecological boundaries for the marineplanning exercise. On the other hand, setting boundaries based on identified existing community usagepatterns in the marine environment may have considerable appeal in some areas. Obviously, this is anarea where discussion must occur on the federal/provincial/community front.
Tools: Planning Versus the Pure Ecosystem Approach
Once a vision has been articulated, objectives, goals and indicators can then be established.These may include water quality standards, zoning for various uses, etc., as well as indicators showinghow the process works in relation to ecological and economic health and social/cultural values. Thelists below are sample indicators for each aspect of sustainability.
Social/community sustainability includes:
1. Common vision2. Access to knowledge3. Traditions and cultural values4. Access for people5. Way of life6. Healthy community7. Balance between economic, environmental and social interests
Ecological/environmental sustainability includes:
1. Preserving natural biodiversity2. Resilience3. Living resource sustainability4. No net loss of productivity5. Habitat restoration
50
Health of the Bay of Fundy: Assessing Key Issues
Economic/social sustainability includes:
1. Income2. Health and safety3. Employment4. Profitability5. Indebtedness6. Diversity7. Resilience
Institutional sustainability includes:
1. Adequacy of management resources2. Integrated approach to management3. Participation and transparency4. Locally appropriate5. Inclusive decision-making process
Finding an acceptable balance between the four groupings of indicators will ensure a sustain-able coastal zone.
Conclusions
Coastal zone planning and management is about developing sustainability. Sustainability hassocial, economic, environmental, and institutional components. It is not just about protecting the envi-ronment or finding out how to economically develop without impacting the environment. Coastal zoneplanning and management is an effort that will provide security to our coastal communities and themarine environment that they are dependent upon.
References
Department of Fisheries and Oceans (DFO). 2002a. Oceans Strategy. Oceans Directorate, Fisheriesand Oceans Canada, Ottawa. 30 pp. URL: <http://www.dfo-mpo.gc.ca/oceanscanada/newenglish/htmdocs/cos/publications_e.htm>. Date accessed: 12 August 2002.
Department of Fisheries and Oceans. (DFO). 2002b. Policy and Operational Framework for Inte-grated Management of Estuarine, Coastal and Marine Environments in Canada. Oceans Di-rectorate, Fisheries and Oceans Canada, Ottawa. 30 pp. URL: <http://www.dfo-mpo.gc.ca/oceanscanada/newenglish/htmdocs/cos/publications_e.htm>. Date accessed: 12 August 2002.
Department of the Environment and Local Government (DELG). 2002. A Coastal Areas ProtectionPolicy for New Brunswick. Sustainable Planning Branch, New Brunswick Department of theEnvironment and Local Government, Fredericton, NB. 15 pp. URL: <http://www.gnb.ca/elg-egl/0371/0002>. Accessed 12 August 2002.

51
Session One: Coastal Zone and Information Management
EMAN AND PROTECTED AREAS:CO-OPERATING IN PROVIDING INFORMATION FOR ECOZONE
AND LOCAL ECOSYSTEM MANAGEMENT
Brian Craig and Hague Vaughan
Ecological Monitoring and Assessment Network Coordinating Office, Environment Canada,Burlington, ON. [email protected] and [email protected]
Abstract
The Ecological Monitoring and Assessment Network’s (EMAN) focus is the fostering of ascientifically sound, policy relevant ecosystem monitoring and research network based on a network ofcase-study sites operated by a variety of partners and developing a number of co-operative, dispersedmonitoring initiatives. These partnerships and initiatives will deliver unique and needed goods andservices which include efficient and cost-effective timely reporting of status and trends to meet therequirements of adaptive management and responsive priority setting.
EMAN is developing a set of standardized measurements which can be carried out by interestedsites, networks and communities to establish whether and how local ecosystems are changing while atthe same time contributing to timely status and trends reporting. These can serve as a basis for develop-ing partnerships with a variety of protected areas. EMAN proposes co-operative development andimplementation of a standard approach to ecosystem monitoring within such areas which includescost-effective strategies, protocols, data management, interpretation and communication and whichfills the information needs of local managers, associated communities, relevant supporting agencies,and Environment Canada.
Introduction
In 1994, Environment Canada created the Ecological Monitoring and Assessment NetworkCoordinating Office (EMAN CO) to augment Canada’s ability to describe ecosystem changes, to pro-vide timely information to decision makers, and to help inform the Canadian public. The EMAN COfacilitated the establishment of the Ecological Monitoring and Assessment Network (EMAN) whichlinks the many groups and individuals involved in ecological monitoring in Canada in order to betterdetect, describe and report ecosystem changes. Essential elements of EMAN include numerous na-tional and regional monitoring programs, over 80 long-term integrated ecosystem monitoring sites anda diversity of ecological monitoring initiatives conducted by numerous partners at all levels of govern-ment, by non-government organizations, and by volunteers (Vaughan et al. 2001). EMAN:
• engages in co-operative projects to collect, collate, manage, and interpret long-term ecologi-cal science;
52
Health of the Bay of Fundy: Assessing Key Issues
• promotes collaborative multidisciplinary research and assessment of long-term ecologicalmonitoring data to detect ecosystem changes;
• identifies information gaps and priorities, and facilitates development of monitoring initia-tives to address them;
• promotes standardized electronic information catalogue systems (metadata);• provides a central access point for long-term integrated monitoring and assessment informa-
tion;• develops and promotes needed ecological monitoring protocols, methods and standards in
co-operation with appropriate research institutes and agencies;• promotes and facilitates community and volunteer involvement;• delivers information and knowledge, including traditional knowledge; and• provides information for improved understanding about ecological changes to decision makers
and the public.
The EMAN web site (URL: <www.eman-rese.ca>) provides examples and describes current initiativespertaining to these activities.
Many parks and protected areas in Canada are EMAN partners. They include many relativelyundisturbed ecosystems that provide an opportunity to collect information on large-scale stressors,such as global climate change, increased UV-B radiation and long-range transport of atmospheric pol-lutants. The information can then be compared with that from working landscapes subject to these andother more localized anthropogenic stressors such as land conversion, habitat fragmentation, transpor-tation corridors, eutrophication and industrial effluents. Such comparisons can allow a better under-standing of the potential ecological impacts of large-scale stressors, local stressors, and the synergisticeffects of both on an ecosystem. Long-term monitoring in protected areas and in the working landscapewill also facilitate the early detection and description of emerging environmental issues at national,ecozone and local scales, providing timely information to facilitate adaptive management of science,development and policy.
The EMAN CO has been focussing on developing a set of standardized ecosystem monitoringprotocols (EMPs) that will work together as a suite to detect and track ecosystem changes over time,and which can be monitored in protected areas and working landscapes. A suite of about twenty EMPshas been selected that:
1. Will identify significant changes in ecosystems beyond normal ranges of fluctuations so asto trigger and guide the design of future more rigorous investigations;
2. Are suitable for measurement and comparison among a variety of sites;3. Are characterized by cost effective sampling methods; and,4. Will easily fit into existing monitoring programs (Environment Canada 2000a).

53
Session One: Coastal Zone and Information Management
The EMPs were distilled from 1,770 monitoring variables assembled from a variety of sourcesincluding major environmental monitoring programs around the globe. The variables were subjected toefficacy testing to ascertain their response to a variety of issues including:
• Endocrine disrupters• Invasive species• Global carbon cycle changes/global climate warming• Increased ultra violet “B” (UV-B) radiation• Habitat fragmentation• Transportation corridors• Acid rain• DDT• Eutrophication• Ground-level ozone• Pulp and paper mill effluent; and• Groundwater contamination (Environment Canada 2000b)
The majority of the selected variables are quite responsive to most of the stressors but redundancies andgaps were identified through this process and the suite was altered appropriately (Table 1).
Several EMPs can provide multiple measures of ecosystem change. For instance, measuringspecies diversity of frogs also provides measures of morphological symmetry, species richness, andexotic species. The total number of field measures can therefore be reduced while retaining the capacityto measure different aspects of ecosystem change. There is general consensus among the EMAN part-ners that this suite is a suitable starting point for the tracking and early detection of ecosystem change.The suite will no doubt evolve as pertinent new information on ecosystem changes becomes available.
An impediment to making comparisons at varying scales has been the lack of availability ofcomparable data: this can be addressed through development and implementation of standardized eco-system monitoring protocols. EMAN is making a concerted effort to use, adapt and develop standard-ized monitoring methods for each of the EMPs and for other aspects of ecosystem monitoring asopportunities arise. National standardized monitoring methods are currently in use for several of theEMPs, particularly stream flow (Water Survey of Canada) and ice phenology (Meteorological Serviceof Canada). Anuran (frogs and toads) and earthworm distribution and abundance monitoring methodsare currently being tested in all provinces and territories. However, for the majority of the EMPs, themonitoring methods have been developed at local, regional and national levels, and although oftensimilar, do not allow for direct comparisons at larger scales.
54
Health of the Bay of Fundy: Assessing Key Issues
For example, aquatic invertebrate monitoring programs have been implemented in the Provinceof Ontario by the Ministry of Environment, the Ministry of Natural Resources, individual conservationauthorities, universities, and citizens groups, among others. The sampling frame, sample design, fieldmethods, and data analysis, although similar, preclude regional and provincial comparisons. A work-shop hosted by the National Water Research Institute and EMAN CO was held in the spring of 2001and was attended by representatives from the aforementioned agencies. The representatives readilyreached a consensus to develop a standardized monitoring method that will contribute to local, provin-cial and national information needs. This attitude is proving typical for ecosystem monitoring practi-tioners, as there is a growing trend among the majority of agencies and non-governmental organizationsto maximize monitoring efforts by sharing information and adopting common field collection methods,lab protocols, taxonomies and data management systems. Workshops are being planned to engageother agencies and organizations in developing pan-Canadian aquatic invertebrate monitoring meth-ods. Similarly, initiatives are under way to develop pan-Canadian monitoring methods for lichen diver-sity, plant phenology, small-scale monitoring of bird diversity, and salamander diversity. A workingdraft, EMAN Monitoring Protocols (Environment Canada 2001), has been published and EMAN COis continuing to work with Network partners to define, describe and refine appropriate standardizedmonitoring protocols.
The proliferation of environmental non-governmental organizations (ENGOs) during the pastseveral decades points to a growing concern by Canadians towards maintaining healthy ecosystems.Many of these groups have established local ecosystem monitoring programs and are using the resultsto influence policy and decision making at local, regional and national scales. Progressive ENGOs areseeking assistance to develop and implement comprehensive community-based and volunteer monitor-ing programs.
EMAN, in partnership with the Canadian Nature Federation, has established a series ofNatureWatch programs that are designed to collect reliable information that can contribute to local,regional and national monitoring programs. Sound scientific protocols are established with relevantagencies and scientists. From these, succinct instructions are provided, informing volunteer observershow to collect reliable information. The NatureWatch programs are Internet based but allow for hardcopyobservation submissions. FrogWatch (URL: <www.frogwatch.ca>) was launched in the spring of 2000and collects information on the distribution and abundance of anurans across Canada. This program issupported by partnerships with anuran experts in each province and territory who check the submis-sions for accuracy and investigate outliers. WormWatch (URL: <www.wormwatch.ca>), developed inpartnership with Agriculture and AgriFood Canada, collects information on the distribution and abun-dance of earthworms in Canada and was launched in the fall of 2001. Developed in partnership with theMeteorological Service of Canada and Laval University, IceWatch (URL: <www.icewatch.ca>) col-lects information on lake and river ice phenology and was also launched in the fall of 2001. PlantWatch(URL: <www.plantwatch.ca>), developed in partnership with plant phenology experts in each prov-ince and territory, collects information on a suite of fifteen appropriate plants and was launched in thespring of 2002. NatureWatch programs are also under development for lichen and aquatic invertebrateabundance and diversity, and tree health.
55
Session One: Coastal Zone and Information Management
Community-based and volunteer monitoring benefits government agencies by increasing geo-graphical coverage of observations and generating community support for ecosystem monitoring pro-grams. Other benefits include the potential of reduced monitoring costs by engaging citizens in collectingcomplementary data and the potential to use citizens’ data to locate suspected problem sites and assessthe success of habitat restoration. Benefits are also accrued to the volunteers, such as: improving theirenvironmental awareness, the opportunity to interact with government professionals, the opportunityto play an active role in safeguarding the environment, and, perhaps the most important, providinginformation for better decision making by the local community.
Volunteer monitoring programs have been criticized as being incapable of providing data ofsufficient quality as they do not often address the quality assurance/quality control issues of sensitivity(recognition of species and individuals); reliability (reproducible results); and accuracy (lack of sys-tematic bias). The NatureWatch programs provide training and reference materials which exceed re-quirements to address the issue of sensitivity; provide scientifically sound, tested and easily understoodprotocols to address the issue of reliability; and offer a multitude of independent observers and obser-vations to address the issue of accuracy.
EMAN NatureWatch programs further define important but limited goals for the resulting data:goals that directly complement and augment professionally collected measurements and observations.NatureWatch programs are focussed on providing co-ordinated and timely information on ecosystemchanges so as to provide suitable input to policy development and priority setting. This is needed toaugment the peer review process that often requires 10–15 years of routine data gathering to establishstatistical certainty. Adaptive management of policy, science or sustainability requires timely feedbackwhich must as a result be openly based on risk or best judgement rather than certainty. Volunteer pro-grams therefore achieve their maximum utility when their information is used to provide initial indica-tions of a probable change in conditions that merits further scientific study or assessment. Well-designedvolunteer programs are unique in their ability to extend line agencies’ capacity to detect and respond tochanges.
The establishment of the Ecological Monitoring and Assessment Network is a giant step to-wards implementing effective national, regional and local integrated monitoring programs that willmeet the needs of decision makers and the public, and contribute to effective adaptive managementprograms at all scales. Protected area mangers across Canada are implementing standardized ecosys-tem monitoring methods, developed with their colleagues in EMAN, that will meet their local manage-ment needs as well as contribute to ecozone and national management needs. Network resourceconstraints have been partially overcome by forming efficient and practical partnerships that meet theneeds of the partners and of the Network, but much remains to be accomplished. However, the strengthof EMAN is people—people who are working collaboratively and tirelessly to provide timely informa-tion on ecosystem change to the Canadian public, protected area managers, and decision makers. Thefuture is bright!
56
Health of the Bay of Fundy: Assessing Key Issues
References
Environment Canada. 2000a. Selecting core variables for tracking ecosystem change at EMAN sites.Final consultants report prepared by Geomatics International Inc., Guelph, Ontario, for EMANCoordinating Office, Environment Canada, Burlington, Ontario. URL: <http://www.eman-rese.ca/eman/reports/publications/2000_eman_core_variables/>.
Environment Canada. 2000b. Case studies to test the efficacy of EMAN core monitoring variables.Final consultants report prepared by North-South Environmental Inc., Campbellville, Ontario,for EMAN Coordinating Office, Environment Canada, Burlington, Ontario. URL: <http://www.eman-rese.ca/eman/reports/publications/2000_eman_core_efficacy/>.
Environment Canada. 2001. EMAN core monitoring variables draft field methods manual: A first ap-proximation. Final consultants report prepared by North-South Environmental Inc. Campbellville,Ontario, for EMAN Coordinating Office, Environment Canada, Burlington, Ontario.
Vaughan, H., T. Brydges, A. Fenech, and A. Lumb. 2001. Monitoring long-term ecological changesthrough the Ecological Monitoring and Assessment Network: Science-based and policy rel-evant. Environmental Monitoring and Assessment 67(1–2): 3–28.
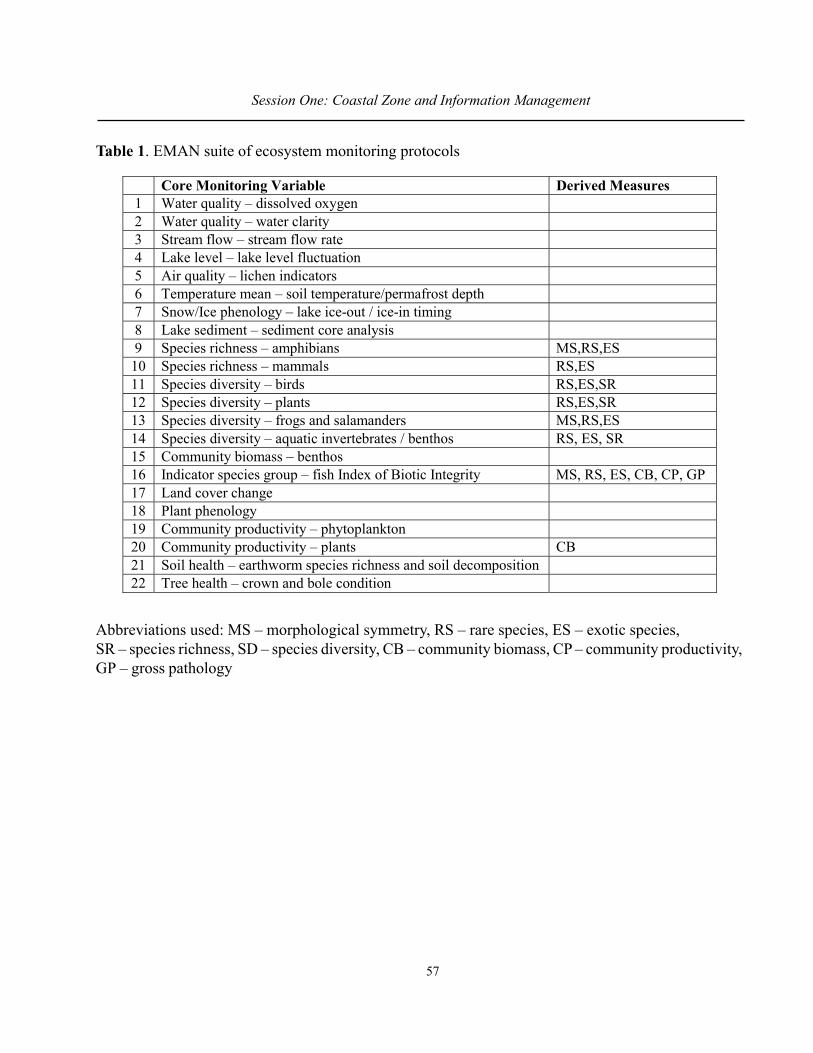
57
Session One: Coastal Zone and Information Management
Table 1. EMAN suite of ecosystem monitoring protocols
Abbreviations used: MS – morphological symmetry, RS – rare species, ES – exotic species,SR – species richness, SD – species diversity, CB – community biomass, CP – community productivity,GP – gross pathology
Core Monitoring Variable Derived Measures 1 Water quality – dissolved oxygen 2 Water quality – water clarity 3 Stream flow – stream flow rate 4 Lake level – lake level fluctuation 5 Air quality – lichen indicators 6 Temperature mean – soil temperature/permafrost depth 7 Snow/Ice phenology – lake ice-out / ice-in timing 8 Lake sediment – sediment core analysis 9 Species richness – amphibians MS,RS,ES
10 Species richness – mammals RS,ES 11 Species diversity – birds RS,ES,SR 12 Species diversity – plants RS,ES,SR 13 Species diversity – frogs and salamanders MS,RS,ES 14 Species diversity – aquatic invertebrates / benthos RS, ES, SR 15 Community biomass – benthos 16 Indicator species group – fish Index of Biotic Integrity MS, RS, ES, CB, CP, GP 17 Land cover change 18 Plant phenology 19 Community productivity – phytoplankton 20 Community productivity – plants CB 21 Soil health – earthworm species richness and soil decomposition 22 Tree health – crown and bole condition
58
Health of the Bay of Fundy: Assessing Key Issues
GULF OF MAINE BIOGEOGRAPHICAL INFORMATION SYSTEMPILOT STUDY: CONSOLIDATION OF MARINE DATA SETS
Angela J. Martin, Lou Van Guelpen, and Gerhard Pohle
Huntsman Marine Science Centre, St. Andrews, NB. [email protected]
We present the status of collaborative efforts under way by the Atlantic Reference Centre (ARC)in the development of large-scale marine biodiversity and biogeographic information systems. Asidefrom scientific literature, museum specimens and associated geographical information represent a keysource of largely untapped data for the determination, understanding and interpretation of patterns ofmarine diversity. Work on integrating available marine databases has begun to be addressed by organi-zations such as the Census of Marine Life (CoML) with the objective of assessing species diversity,distribution and abundance. The Ocean Biogeographic Information System (OBIS), the informationcomponent of CoML, was created to address the difficulty of data retrieval and integration of distrib-uted data. From this underlying problem came the creation of a pilot study focussing on the Gulf ofMaine. The goal of the Gulf of Maine Biogeographical Information System (GMBIS) is to provide aframework for the integration, visualization, analysis and dissemination of diverse types of biogeo-graphical and oceanographic information that can also be used as a fisheries management tool. Thepilot study consists of a compilation of databases that includes ARC. ARC represents the specimen-based species database used for the GMBIS objective. Information on taxonomy, distribution and ecol-ogy of species will be available through the ARC server to the GMBIS server, linking accessible data tothe public. This framework of public access projected by GMBIS is intended to create a global modelfor the development of biogeographic systems in other regions.

59
Session One: Coastal Zone and Information Management
DEVELOPMENT OF A CANADIAN ATLANTIC BIODIVERSITYINFORMATION SYSTEM BY THE ATLANTIC REFERENCE CENTRE
Amanda McGuire, Lou Van Guelpen and Gerhard Pohle
Atlantic Reference Centre, Huntsman Marine Science Centre, St. Andrews, [email protected]
Species are the basic measure of biodiversity within an ecosystem. Changes in species or theirabundance indicate environmental disturbance, which can only be quantified if there is baseline infor-mation. The long-term objective of the Atlantic Reference Centre (ARC) is to develop a detailedbiodiversity information system for Canadian Atlantic organisms. A project listing fishes found withinthe Canadian Atlantic waters, which developed into an on-line photographic compendium describingthe biological and ecological characteristics of each fish, served as a template to incorporate annelids,echinoderms and crustaceans of the Bay of Fundy. Each species is listed by its common and scientificnames and synonyms. Brief descriptions of reproduction, predators, maximum size and diet are alsogiven, though habitat, abundance and importance to the environment and man are the focus. An appli-cation is pending to add remaining organisms. The final product of this database will be an up-to-dateresource of biodiversity information encompassing all major taxonomic groups from phytoplankton tomammals for the Bay of Fundy. In the future, this database will be transformed into an on-line versionand will be expanded to include all Canadian Atlantic organisms. Ultimately, ARC will be linked tocomplementary biodiversity initiatives, both nationally and internationally, as well as to environmentaldata and tools to analyze these records. This will provide a comprehensive and easily accessiblebiodiversity information system, allowing researchers and managers to better protect the natural envi-ronment and to promote sustainable use of natural resources.
60
Health of the Bay of Fundy: Assessing Key Issues
GEOMATICS RESEARCH ALONG THE BAY OF FUNDY COASTAL ZONE
Tim Webster, David Colville, Bob Maher and Dan Deneau
Applied Geomatics Research Group, Centre of Geographic Sciences (COGS), Middleton, [email protected]
The Applied Geomatics Research Group (AGRG) has been involved in a study of the Bay ofFundy coastal zone, from Annapolis Basin to Minas Basin since 1999, when it received an infrastruc-ture grant to facilitate applied research. In the fall of 1999 the area was imaged by the airborne polari-metric synthetic aperture radar (SAR) system operated by Environment Canada. The system operates inthe C-band region of the spectrum in a quad-pole configuration similar to the sensor planned for Radarsat-2. The inter-tidal mudflats of the Minas Basin were exposed at low tide during the SAR acquisition.The data will be used to interpret the type of shoreline (cliff, sand, salt marsh, etc.), land cover and thecoastal geology. In the summer of 2000, high-resolution airborne laser altimetry (LIDAR) and airbornemulti-spectral imagery (CASI) were collected. During the image acquisition, a simultaneous field sam-pling campaign was undertaken, including the deployment of two tide gauges. The imagery collected in2000 will be used for the development of shoreline extraction routines. The land/water boundary repre-sents a snapshot in time of a given tidal level. By relating the image acquisition time with the tide gaugedata, an orthometric height can be assigned to the extracted inter-tidal shoreline. Several areas in theAnnapolis Basin were imaged at different tidal levels and multiple inter-tidal contours can be derived.These data can be used to extract information about the coastal zone, such as slope. The LIDAR datahave been used to construct a 2-metre resolution digital elevation model (DEM) for the area and, incombination with global positioning system (GPS) points collected in the field, have been used tovalidate the shoreline heights. Classification of the exposed inter-tidal zone has also been completedusing Ikonos satellite imagery. Related areas of AGRG research include using DEMs for watershedmodelling and flood-risk mapping associated with storm surges.
61
Health of the Bay of Fundy: Assessing Key Issues
Session Two
CLIMATE AND SEA LEVEL CHANGE
Chair: Michael Brylinsky, Acadia Centre for EstuarineResearch, Acadia University, Wolfville, Nova Scotia

62
Health of the Bay of Fundy: Assessing Key Issues
63
Session Two: Climate and Sea Level Change
EVIDENCE OF LATE HOLOCENE SEA LEVEL ANDTIDAL CHANGES IN THE BAY OF FUNDY:
HOW RISING SEA LEVEL HAS LOWERED THE FLOOD RISK
John Shaw1, Carl L. Amos2, Charles T. O’Reilly3, and George S. Parkes4
1 Natural Resources Canada, Dartmouth, NS. [email protected] Southampton Oceanography Centre, Southampton, UK
3 Canadian Hydrographic Service, Dartmouth, NS4 Meterorological Service of Canada (Atlantic), Dartmouth, NS
We discuss sea level change on several times scales. The configuration of the Bay of Fundy/western Gulf of St. Lawrence from 13000 (radiocarbon years) BP onwards is demonstrated by a seriesof high-resolution paleogeographic reconstructions. We use data from the Amherst Point area to dem-onstrate that during the last 3,000 years, sea level rise has been stepwise due to eustatic cycles imposedon regional crustal subsidence. As a result, marshes at the head of the Bay repeatedly alternated be-tween marine and brackish conditions. The modern rapid increase of sea level is merely the latest of thecycles and began c. 1600 AD. Data from Amherst Point, combined with data from elsewhere, revealthat tidal range c. 4000 BP was small. Tidal range expanded rapidly beginning 3400 BP and has contin-ued to increase, albeit at a lesser rate, since 2700 BP. We speculate on the mechanisms that caused tidalexpansion, and argue that the lessened risk of inundation due to storm surges in this region of extremetidal range is attributable to sea level rise and related factors.

64
Health of the Bay of Fundy: Assessing Key Issues
CHANGING SEA LEVEL—CHANGING TIDES IN THE BAY OF FUNDY
David Greenberg
Ocean Sciences Division, Fisheries and Oceans Canada, Dartmouth, [email protected]
This work addresses questions relating to flood risk from increasing high water levels in theBay of Fundy induced by climate change. High water levels can vary in time from both changing meansea level and from changing tides. We show here that the two are related. An analysis of long-term sealevel records has been done by Smith and Blanchard (Dalhousie University) as part of this study andwill be briefly reported here. That study showed that independent of climate change, sea level and tiderange are increasing in the Bay of Fundy/Gulf of Maine system. The modelling work shows that localtectonic changes in sea level are presently giving rise to increasing tides. The combined effects ofpresent day sea level rise, climate induced sea level rise, and the increasing tidal range they induce willgive rise to a flood risk significantly higher than that from considering the climate-induced sea level inisolation. If the model predictions are accurate, the risk of flooding at higher high water will increasedramatically over the coming century.

65
Session Two: Climate and Sea Level Change
MITIGATION OF NATURAL HAZARDS: STORM SURGES,RISING SEA LEVELS AND COASTAL EROSION
Charles T. O’Reilly1, Glen King1, John Shaw2, Russ Parrott2, Robert Taylor2 andGeorge S. Parkes3
1 Canadian Hydrographic Service (Atlantic), Dartmouth, NS. [email protected] Geological Survey of Canada (Atlantic), Dartmouth, NS
3 Meteorological Services Canada (Atlantic), Dartmouth, NS
Advances in remote sensing and global positioning system (GPS) technology have made itpossible to develop very high resolution digital elevation models of topographic landforms. Recentprojects utilizing airborne laser technology (LIDAR) have created three-dimensional (3-D) maps ofcoastal shore and inter-tidal areas with horizontal footprints of less than one meter square, containingdecimeter vertical precision. These data were reviewed by several partners, including hydrographers,geomorphologists, coastal engineers, academic researchers, emergency measures organizations, andthe Transportation Safety Board. The coastline can no longer be considered as two-dimensional lineson paper, but as a 3-D landform which is undergoing very dynamic physical change. It has been pro-posed to utilize remote sensing to initiate high resolution 3-D baseline mapping in low-lying areasunder threat of coastal flooding, rising sea level and tsunami run-up. This presentation discusses sev-eral applications of merging land and sea data sets for coastal zone management and natural disastermitigation. Stakeholders include all levels of governments, the insurance industry, the Department ofNational Defence, as well as numerous environmental and marine interests affected by climate change.
66
Health of the Bay of Fundy: Assessing Key Issues
REGIONAL CLIMATE CHANGE SCENARIOS IN ATLANTIC CANADAUTILIZING STATISTICAL DOWNSCALING TECHNIQUES:
PRELIMINARY RESULTS
Gary S. Lines1 and Elaine Barrow2
1 Climate Change Division, Meteorological Service of Canada (Atlantic), Dartmouth, [email protected]
2 Canadian Climate Impacts Scenarios (CCIS) Project, Environment Canada - Prairie and NorthernRegion, Regina, SK
Introduction
On a global scale, mean surface air temperature has been increasing over the past century by0.6°C (Houghton et al. 2001) due, directly or indirectly, to increasing greenhouse gas emissions. Globalclimate models (GCMs) provide projections of such climate changes into the next 100 years, but do iton a global, coarse-grid scale. Temperature trends differ on a regional scale, resulting in varying im-pacts at that scale. In order to best describe the expected climate change impacts for a region, climatechange scenarios and climate variables must be developed on a regional, or even site-specific, scale. Tobest provide those values, projections of climate variables must be “downscaled” from the GCM re-sults, utilizing a variety of techniques, both dynamic and statistical.
Two of the more popular methods are output from a regional climate model (RCM) and statis-tical techniques to “downscale” climate variables from global climate models. Since the RCM capabil-ity for Canadian territory is being developed and output for Atlantic Canada is not readily available, astatistical technique is explored in this study to generate the downscaled climate variables in this re-gion. Statistical techniques have the added advantage of being computationally efficient and afford-able. Most statistical models can be run on Pentium PCs in short time spans, at times allowing formultiple runs.
This study utilizes the statistical downscaling model (SDSM), developed by Wilby and Dawson,to construct a suite of climate change scenarios for Atlantic Canada. Observed data sets of daily tem-perature are used to initialize and validate the model. Values for climate variables such as minimumand maximum temperature are calculated at a specific location for various future times and differentGCM output experiments.
Background
Atlantic Canada includes Nova Scotia, New Brunswick, Prince Edward Island, Newfoundlandand Labrador. It is situated along the east coast of Canada covering nearly 20 degrees of latitude and 20

67
Session Two: Climate and Sea Level Change
degrees of longitude. The climate of the region is varied, including Atlantic, Boreal, and Sub-Arcticclimates and influenced by the warm Gulf Stream and the cold Labrador Current.
Utilizing GCM output over this region limits the researcher to six grid-boxes, spanning 300 x400 km each, to cover sites of interest. Also some of those boxes are defined as “ocean” boxes wherethe climate variables respond as if the surface boundary is North Atlantic ocean water.
Researchers require specific values for various climate variables at those sites of interest in theregion, based on the sensitivities of the species or ecosystem that they happen to be studying. If thespecies lives on the boundary of a grid box or two species with different sensitivities live in the samegrid box, no substantial conclusions can be made about the impact of climate change simply using thegrid box output.
Methodology
The statistical downscaling model (SDSM) is a hybrid of regression and stochastic downscalingmethods. It utilizes a predictor-predictand process to determine a set of parameters. The objective is tochoose a climate variable predictor, such as mean temperature, that can be projected into the future withsome reliability by the GCMs and calculate the statistical relationship between it and a climate variablethat may be physically related to it, such as minimum temperature. This statistical relationship nowconstitutes a set of parameters that can be used to reconstruct future sets of these climate variables andhence future climate scenarios.
In order to develop these parameters, the SDSM model is initiated with high quality observa-tional data from the site of interest and a specific climate variable chosen as the predictand; in this case,the minimum temperature. For a predictor, a set of variables that have been recalculated to the samegrid as the GCM, and based on an observational data set, are constructed. This study used the NationalCenters for Environmental Protection (NCEP) Reanalysis over Atlantic Canada as the comparativeobservational data set. These variables are then “screened” by the SDSM to determine what amount ofexplained variance exists when the predictand and predictor are statistically compared. The user thenchooses the predictor that has the best explained variance and some reasonable physical connection tothe predictand. In this study, the mean temperature was the most consistent variable that met thosecriteria.
The SDSM is then “calibrated” using the predictor-predictand relationship and a parameter fileis created. Once the parameter file has been created, an entire set of synthesized data for that site ofinterest can be developed over the normalized period 1961-1990. Since our observational data coverthe same period, a comparison can then be made between the original values and the synthesized ones.How they compare is a measure of how well the now-calibrated model behaves, and whether or not itcan effectively downscale that particular climate variable.

68
Health of the Bay of Fundy: Assessing Key Issues
The next steps involve running the SDSM using GCM output, for both the current period (1961-2000) and any future time. At each step the data results can be analyzed statistically to see if the valuesare within sensible ranges for significance.
Although the procedure sounds simple, early decisions can alter the final results in a dramaticway. The selection of predictors is crucial to meaningful downscaled values. The choice of GCM out-put and model experiment is instrumental in providing values that are neither too divergent from themodel solution nor not divergent enough. The SDSM model aids you in making these choices and, dueto its short computation times, allows you to experiment with various combinations of predictors andGCM output.
Data
The daily minimum, maximum and mean temperatures for 14 stations across Atlantic Canadaused in this analysis (see Figure 1) were extracted from the Historical Canadian Climate Database(HCCD). The HCCD consists of daily minimum, maximum and mean temperatures for 210 stationsacross Canada (Vincent 1998). The data have been adjusted for inhomogeneities caused by non-cli-matic factors, such as station relocation and changes in observing practices, using a regression modeltechnique. Monthly adjustment factors from previous work were interpolated to generate daily factors.These factors were used to obtain the adjusted daily temperatures resulting in the reliable long-termdaily temperature data set used in this analysis.
The global climate model output over Atlantic Canada was taken from the Canadian ClimateCentre for Modeling and Analysis (CCCma), the First Version of the Coupled General CirculationModel (CGCM1) and prepared by the Canadian Climate Impacts Scenario (CCIS) Project (conductedby Elaine Barrow) to provide a list of predictors ranging from basic variables such as mean temperatureand mean sea level pressure to calculated values such as specific humidity at 850 Pa. The output isavailable in two sets: the current period (1961-2000) and future periods in three 30-year slices, 2020s(2010-2039), 2050s (2040-2069) and 2080s (2070-2099). They are in the form of daily data from theCGCM1 GHG+A1* experiment normalized with respect to 1961-1990.
To provide a gridded observational data set, the NCEP Reanalysis data were interpolated to theCGCM1 grid over the Atlantic region. Both the GCM variables and the NCEP data set were madeavailable in the grid boxes illustrated in Figure 2 and contain the same list of variables as noted above.
* “GHG+A1” is a typical designation describing the type of “experiment” parameters that were used during a specificclimate model run. Most climate models are “forced” with a percentage of greenhouse gases (GHG), typically an increaseof 1% a year for 100 years, to give projections of their impacts out to 2100. Some models also add sulphate aerosols (A)as a controlling parameter, since aersols have the effect of “cooling” the atmosphere. A designation of GHG+A1 on aparticular set of climate model output refers to the fact that the results of the model run were done using greenhouse gasesand aerosols as controlling parameters. The 1 (one) refers to the fact that there may be more than one GHG+A experimentand this one happens to be number one.

69
Session Two: Climate and Sea Level Change
Results
Utilizing 30 years of data from the 14 observing sites across Atlantic Canada, a statisticaldownscaling model was used to produce new climate variable values for each of the sites. This reportdisplays results, focussing on the minimum temperature at those sites for the month of January (Table1). On the left hand-side the 14 sites are listed. Under “Obs” are the values available from the observa-tional data set. The synthesized data for each site are next under “Synth”, utilizing the NCEP data foreach of the grid boxes. The GCM model output values were extracted from the CCIS Project web-site.And finally, the last column has the downscaled values, those derived from using the GCM output fora future time, the 2080s (2070-2099).
For most sites, there is a strong correlation between the observed data and the synthesized data,supporting the correct choice of predictor parameter. Most of the sites show more warming than isevident in the GCM grid box model output. Most of that warming is related to the capability of themodel to properly identify regional climate forcing coupled with the large-scale forcing that is providedby the GCM grid box output.
Of interest is the much less significant warming at the last four sites. These locales are in theeasternmost portion of the region. This suggests that the GCM is overdoing the warming at these sitesand that the downscaling process has allowed the regional forcing to dominate.
Summary
This study examined downscaled values for the minimum temperature at 14 sites across Atlan-tic Canada utilizing a statistical downscaling model. These values were compared, internally to synthe-sized data as well as to non-downscaled values taken directly from the GCM model output.
This study highlights the ability of the SDM to deliver reasonable downscaled climate valuesutilizing economical computational methods. These techniques can allow regional climate forcings tobe taken into account in a much more meaningful way.
The next steps will be to expand the work into other sites in Atlantic Canada, other climatevariables, such as precipitation, and for other GCM models and experiments, such as the Hadley Gen-eral Circulation Model (HADGCM) and scenarios based only on greenhouse gases (GHGs) or on GHGand aerosol combinations.
Acknowledgments
I would like to acknowledge the vital role played by Rob Wilby, C. Dawson and Elaine Barrowin facilitating this paper. They were directly responsible for the existence of SDSM and the crucial datasets required to complete the downscaling process (Wilby et al. 2000 and 2001; Wilby and Dettinger2000).
70
Health of the Bay of Fundy: Assessing Key Issues
References
Houghton, J. T., Y. Ding, D. J. Griggs, M. Nogur, P. J. van der Linden, X. Dai, K. Maskell, and C. A.Johnson (Eds). 2001. Climate Change 2001: The Scientific Basis. Contribution of WorkingGroup I to the Third Assessment Report of the Intergovernmental Panel on Climate Change.Cambridge University Press, Cambridge.
Vincent, L. A., 1998. A technique for the identification of inhomogeneities in Canadian temperatureseries. Journal of Climate 11: 1094–1104.
Wilby, R. L., C. W. Dawson, and E. M. Barrow. 2001. SDSM a decision support tool for the assessmentof regional climate change impacts. Environmental and Modelling Software, in press.
Wilby, R. L., L. E. Hay, W. J. Gutowski, R. W. Arritt, E. S. Tackle, G. H. Leavesley, and M. Clark. 2000.Hydrological responses to dynamically and statistically downscaled general circulation modeloutput. Geophysical Research Letters 27: 1199–1202.
Wilby, R. L. and M. D. Dettinger. 2000. Streamflow changes in the Sierra Nevada, CA simulated usinga statistically downscaled General Circulation Model scenario of climate change. Pages 99–121. In: Linking Climate Change to Land Surface Change. S. J. McLaren and D. R. Kniveton(Eds.). Kluwer Academic Publishers, Dordrecht.
Canadian Climate Impacts Scenarios (CCIS) Project. URL: <http://www.cics.uvic.ca/scenarios>.
Statistical Downscaling Model Download Site. URL: <https://co-public.lboro.ac.uk/cocwd/SDSM/>.
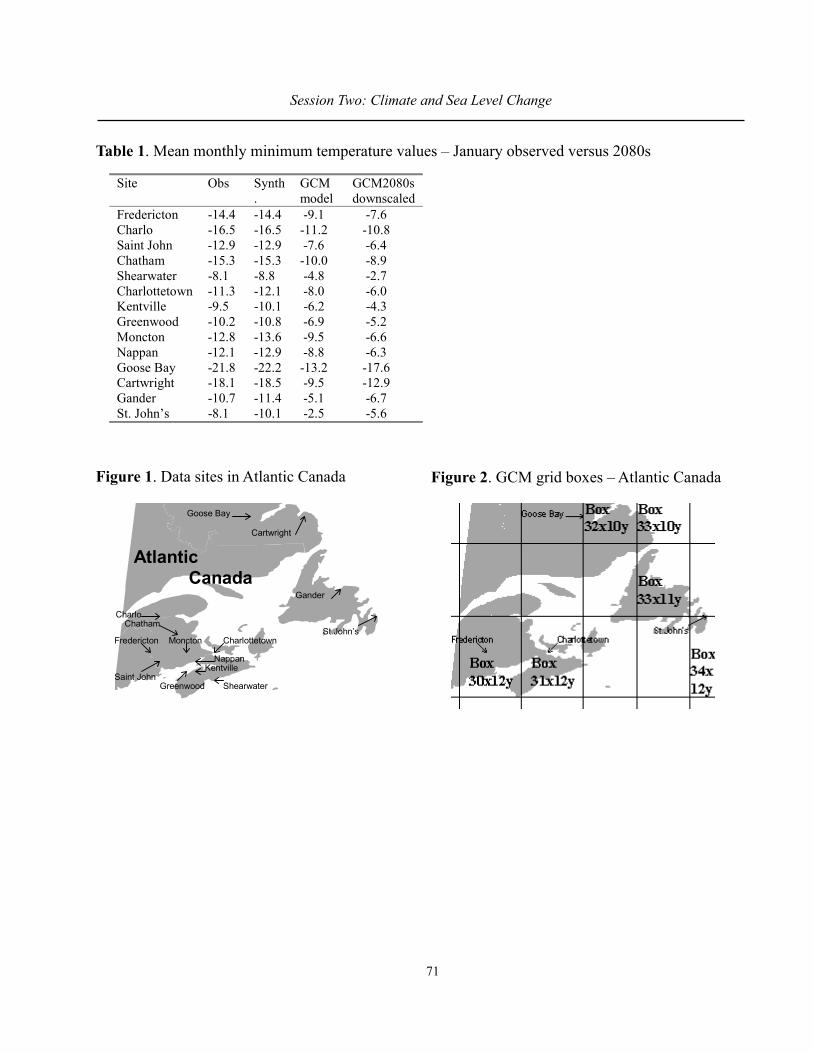
71
Session Two: Climate and Sea Level Change
Table 1. Mean monthly minimum temperature values – January observed versus 2080s
Figure 1. Data sites in Atlantic Canada
Site Obs Synth.
GCMmodel
GCM2080s downscaled
Fredericton -14.4 -14.4 -9.1 -7.6 Charlo -16.5 -16.5 -11.2 -10.8 Saint John -12.9 -12.9 -7.6 -6.4 Chatham -15.3 -15.3 -10.0 -8.9 Shearwater -8.1 -8.8 -4.8 -2.7 Charlottetown -11.3 -12.1 -8.0 -6.0 Kentville -9.5 -10.1 -6.2 -4.3 Greenwood -10.2 -10.8 -6.9 -5.2 Moncton -12.8 -13.6 -9.5 -6.6 Nappan -12.1 -12.9 -8.8 -6.3 Goose Bay -21.8 -22.2 -13.2 -17.6 Cartwright -18.1 -18.5 -9.5 -12.9 Gander -10.7 -11.4 -5.1 -6.7 St. John’s -8.1 -10.1 -2.5 -5.6
Greenwood
St.John’s
Gander
Goose Bay
ShearwaterSaint John
Charlottetown
Kentville
Fredericton Moncton
Nappan
Cartwright
ChathamCharlo
Atlantic Canada
Figure 2. GCM grid boxes – Atlantic Canada

72
Health of the Bay of Fundy: Assessing Key Issues
73
Health of the Bay of Fundy: Assessing Key Issues
Session Three
FISH AND FISHERIES
Chair: Rod Bradford, Fisheries and Oceans Canada,Halifax, Nova Scotia

74
Health of the Bay of Fundy: Assessing Key Issues

75
Session Three: Fish and Fisheries
POPULATION DESCRIPTION, STATUS, LISTING UNDER COSEWIC ANDRECOVERY ACTIONS FOR INNER BAY OF FUNDY ATLANTIC SALMON
(SALMO SALAR)
Peter G. Amiro
Science Branch, Fisheries and Oceans Canada, Dartmouth, NS. [email protected]
Abstract
Wild anadromous Atlantic salmon (Salmo salar) of the inner Bay of Fundy (iBoF) have de-clined 90% or more in abundance since 1989. Although the stock has historically varied in abundance,the current decline is more severe and the population is at a lower abundance than previously docu-mented. Annual recruitment to spawning of iBoF salmon stocks was not correlated with other Atlanticcoast salmon populations. Recognition of the distinct phenotypic features of these stocks dates to the19th century. Early maturity, successive annual spawning, local migration and distinct genetic profilescharacterize two distinct stocks within the iBoF. The population was estimated to have been as many as40,000 adult salmon in some years, likely less than 500 adult salmon in 1998, less than 250 in 1999,and showing signs of further reductions in 2000 and 2001. A reduction in repeat spawning survival andsurvival to first spawning placed the stock in a steep decline. Monitoring of juvenile salmon in the twolargest rivers, Stewiacke River and Big Salmon River, as well as in six other rivers of the iBoF, con-firmed that the decline is extensive within iBoF rivers and that the loss was marine based. River-specific population extinction has been noted. Since 1990, no fisheries have been permitted to harvestiBoF salmon. Based on numeric and genetic assessments of salmon populations within 32 rivers of theiBoF, the entire stock complex of iBoF salmon was listed as endangered by the Committee on theStatus of Endangered Wildlife in Canada (COSEWIC) in May, 2001. A recovery team comprised ofadvisory, planning and four technical committees (monitoring, fish culture, genetics, and research)prepared a formal recovery strategy following the listing by COSEWIC.
Biology
Adult salmon return to rivers to spawn in the late fall. Eggs are deposited in gravel redds andfertilized by mature male salmon or mature male parr. Young salmon actively feeding in freshwater aretermed parr. After two to three years in freshwater, parr undergo physiologic change and become smolts.Smolts attain the silvery colour of the adult and migrate to sea. Seaward migration may begin in au-tumn, but actual movement into saltwater normally occurs in late May or June. The majority of indi-viduals mature and spawn after one winter at sea. Prior to the recent decline, significant numbersreturned to spawn after a second and third winter at sea. Repeat spawners contributed to as much as60% of the annual egg deposition. Although post-smolts (immature salmon at sea) occur in areas rich inamphipods (small crustaceans) and juvenile herring, there is no published data on the diet or for agingbehaviour for these populations.
76
Health of the Bay of Fundy: Assessing Key Issues
Population and Distribution
Historically, inner Bay populations may have numbered 40,000 adults in some years. Theirnumbers declined to less than 500 by 1998, and to less than 250 in 1999. At least 32 of approximately42 rivers (Figure 1) that drain into the Minas Basin and Chignecto Bay, from Cornwallis River at thehead of the Annapolis Valley in Nova Scotia to the Black River in New Brunswick, were known to havesupported populations of salmon.
Habitat
In freshwater, salmon prefer natural stream channels with rapids and pools, a mixed substratebottom, and water temperatures between 15 and 25oC in summer. In the marine environment, the infu-sion of cold oceanic water into the Bay of Fundy and Gulf of Maine provides temperature and bioticconditions necessary to support Atlantic salmon on a year round basis. Salmon from these populationshave been documented within the Bay of Fundy as late as October as post-smolts and as early as Marchas pre-spawning adult salmon. However, it is not known where inner Bay of Fundy salmon winter.
Threats
Population growth appears to be limited by marine survival rather than freshwater productioncapacity. The cause of the collapse in marine survival is unknown, but may be due to ecological changesin the Bay of Fundy. Changes may originate from tidal barriers placed at the mouths of rivers andstreams, biological regime shifts caused by over-harvesting of commercially important species, andfrom increases in populations of higher trophic level animals. Commercial salmon farms may also be afactor in the decline since they may attract and modify predator behaviour, alter habitat, obstruct migra-tion, and/or harbour disease.
Protection
In Canada, the Atlantic salmon is protected under the Fisheries Act. The international NorthAtlantic Salmon Conservation Organization, established under the Convention for the Conservation ofSalmon in the North Atlantic, can propose regulatory measures for fishing in the area of fisheriesjurisdiction of a member country whose catches originate in rivers of other member countries.
Recovery Efforts
All commercial fishing for Atlantic salmon in the Bay of Fundy was stopped in 1985. Therecreational fishery in rivers of the inner Bay of Fundy has been closed since 1990. Supplementationthrough traditional parr and smolt stocking, grown from river-of-origin adult broodstock, began in1984 and stopped in 1994 when insufficient numbers of adult broodstock could be obtained to mini-mize genetic risks.
77
Session Three: Fish and Fisheries
Under the direction of an ad hoc Science Steering Sub-Committee of the inner Bay of FundySalmon Fishing Areas 22 and 23 Advisory Committee, a collection of wild salmon parr in Stewiackeand Big Salmon rivers was initiated in 1998. These fish have been reared to mature adults at fishbiodiversity facilities located at Coldbrook and Caledonia in Nova Scotia and at Mactaquac in NewBrunswick. An additional sub-population of Big Salmon origin is being held separately at Minto, NewBrunswick. Collections have been made annually and the first progeny from the genetically controlledpedigree-breeding program began in 2001. To maximize diversity re-selection of future broodstockfrom parr, smolts or adult collections will be controlled through genetic screening.
A recovery team comprised of advisory, planning and four technical committees (monitoring,fish culture, genetics and research) prepared a formal recovery strategy following the listing byCOSEWIC.
Summary of Progress to Date
Currently a total of 633 adult salmon broodstock from the Big Salmon River and 926 adultsalmon from the Stewiacke and Gaspereau Rivers are being held for spawning or release. The majorityof the broodstock were grown from parr collections made since 1998. Biodiversity facilities are hold-ing over 500,000 fry and parr of Minas Basin origin and over 750,000 fry and parr of Cobequid Basinorigin and released over 250,000 fry to three inner iBoF rivers in 2001.
In 2000, 42 rivers of the inner Bay were sampled by electrofishing, and remnant populationswere found in 19 rivers. Tissue samples are being analyzed to further describe the genetic phylogeny ofinner Bay of Fundy salmon.

78
Health of the Bay of Fundy: Assessing Key Issues
Figu
re 1
. Riv
ers d
rain
ing
into
the
Min
as B
asin
and
Chi
gnec
to B
ay

79
Session Three: Fish and Fisheries
A HYPOTHESIS CONCERNING THE DECLINE OF ADULT RETURNS TOWILD AND CULTIVATED POPULATIONS OF ATLANTIC SALMON
IN THE NORTH ATLANTIC AND THE RELATIONSHIPTO THEIR OCEAN MIGRATION
Michael Dadswell1, Michael Stokesbury2, Joseph Rassmussen3 and Roger A. Rulifson4
1 Department of Biology, Acadia University, Wolfville, NS. [email protected] Department of Biology, Dalhousie University, Halifax, NS3 Department of Biology, McGill University, Montreal, PQ
4 Department of Biology, East Carolina University, Greenville, NC
Adult returns to wild and cultivated populations of Atlantic salmon in the North Atlantic havedeclined severely since the mid-1930s. The decline has shown a south to north pattern, with Maine andBay of Fundy populations declining first, followed by more northern and European populations. Con-tinuous stock enhancement, commercial fishery closures, and angling restrictions, have not arrested thedecline and many wild salmon populations in Maine, the Canadian Atlantic and Europe are nearingextinction. Acid precipitation, hydroelectric projects, aquaculture and other human impacts have beensuggested for some population declines, but adult returns to many rivers and cultivated populationswith no obvious human impacts exhibit a similar pattern of decline. In addition, large numbers of adultor near adult aquaculture escapees, which were raised near to their freshwater origin, have failed toreturn to their natal watersheds.
Numerous studies have suggested that low adult returns have been caused by changes in oceanclimate or marine predator abundance but these hypotheses are unsubstantiated by the continued ab-sence of the former, annual cyclic behaviour in abundance of adult returns after ocean conditions re-turned to a favourable state and when possible predators are themselves exploited. Also, the continuedsuccess of the hatchery-supported Baltic Sea salmon fishery, which has annual landings in excess of3,000 t, and the fact that 43% of salmon captured by experimental long-line fishery off the FaeroeIslands during the 1990s were of aquaculture origin, indicate that hatchery production is effective andoceanic feeding grounds are healthy.
Recent and past research has demonstrated that salmon from Northwest Atlantic populationsmigrate for extended periods much further into the eastern Atlantic than was previously thought, plac-ing them in international and far territorial waters that lack surveillance and allow for exploitation byillegal and undirected fisheries. We propose that the loss of cyclic behaviour in adult return rates andtheir decline to low levels regardless of management, the probable migration pattern of ocean feedingsalmon, and the occurrence of legal and illegal fisheries all suggest marine exploitation, primarilyillegal, is the cause of low adult returns. Our study to date suggests salmon are being taken illegally onthe high seas by Danish, Spanish, Faeroes and possibly Japanese interests. The major site of exploita-tion appears to be in the region outside of EEZs south of the Faeroes and in the Norwegian Sea. During

80
Health of the Bay of Fundy: Assessing Key Issues
the period 1985-93, a considerable amount of this illegal catch was landed as supposed Baltic Seacaught salmon. As recently as March 30, 2002 it was reported in The Economist that Norwegian salmonwere being landed at Vigo, Spain.
Study Methods
We propose to examine marine migration patterns and ocean exploitation of Atlantic salmon ina two-part study.
First, we will examine the levels of the radioactive isotope Cesium 137 in the flesh and bonesand the pattern of microelement distribution in the otoliths of Atlantic salmon from a series of selectedsalmon populations including wild and cultivated stocks. A sample of post-smolts and returning adults(primarily grilse) from each population will be examined using excised heads and tails. Sample sizewill be 15-30 salmon/population and life stage. We propose to obtain samples from wild populations inthe Bay of Fundy, the Atlantic coast of Nova Scotia, the Gulf of St. Lawrence, Ireland, and aquaculturestocks in the Bay of Fundy and Ireland. The aquaculture stocks will include both pen-cultured fish andescaped adults returning to rivers in salmon farming regions.
Cesium 137 is a radioactive isotope from nuclear reactors that bioaccumulates in marine foodchains. Because of nuclear accidents around the Irish Sea and at Chernobyl, the eastern Atlantic hasmuch higher Cesium 137 levels than the western Atlantic and fish inhabiting or migrating throughthese regions bioaccumulate Cesium 137 considerably in excess of fish which remain in the westernAtlantic (Tucker et al. 1999). Otolith microelement analysis is a powerful research tool for determiningthe source and life history stanza movement patterns of fish.
The second part of the study will involve the technical development of a satellite tag capable ofbeing placed in a grilse-size or smaller salmon. These tags will be placed in either cultivated post-smolts or grilse-size salmon and released to migrate in the open ocean. Tags will be time-release so thatthe pattern of migration can be studied. Tags which report back before their specified time release maysuggest sites of illegal marine exploitation. We hypothesize that these sites will be largely in the easternAtlantic.
Reference
Tucker, S., I. Pazzia, D. Rowan and J. B. Rasmussen. 1999. Detecting Pan-Atlantic Migration inSalmon (Salmo salar) Using 137Cs. Canadian Journal of Fisheries and Aquatic Sciences 56:2235–2239.
81
Session Three: Fish and Fisheries
LOCAL KNOWLEDGE AND LOCAL STOCKS: EVIDENCE FORGROUNDFISH SPAWNING ACTIVITY IN THE BAY OF FUNDY
Jennifer Graham
Centre for Community-Based Management, St. Andrews, NB. [email protected]
Abstract
This project provides information on current and historic groundfish spawning in the Bay ofFundy, its timing and relationship to fish migrations, and overwintering stocks. It also presents somehypotheses for the decline of Fundy spawning grounds and local stocks. Active and retired ground-fishermen were interviewed about the location and timing of groundfish spawning activity in the Bayof Fundy. The project built on the work of Benham and Trippel (2002). The results are digitized mapsthat provide evidence for contemporary and historic groundfish spawning activity in the Bay of Fundyand the existence of local groundfish stocks in the Bay.
Bay of Fundy spawning grounds and associated local stocks have dramatically declined overthe last 50 years. Of the 19 distinct cod spawning areas identified by fishermen as active in the 1950s,only three are now considered to be active. Haddock spawning areas declined from 39 to two in thesame time period. Pollock spawning areas declined from 28 to four.
Introduction
This project documents fishermen’s knowledge of local groundfish stocks and spawning groundsin the Bay of Fundy. Such expertise can contribute to improved fisheries management but, to date, localknowledge has been underutilized in protecting and managing fish stocks. The report consolidates theknowledge of individual fishermen to assemble collective wisdom about Bay of Fundy groundfish.
Many traditional Bay of Fundy fisheries have already disappeared, and fishermen fear the re-maining groundfisheries will also be lost if current trends are not reversed. Many fishermen are con-vinced that the disappearance of inshore fisheries is related to the loss of local groundfish stocks thatspawn (spawned) in the Bay of Fundy.
At the heart of this report are maps showing where and when fishermen have caught spawningpollock, haddock and cod and the decline of these areas over time. This information was collectedthrough interviews with fishermen from New Brunswick and Nova Scotia. The text accompanying themaps explains the context in which spawning areas and local stocks were identified.
Local knowledge and scientific knowledge are both important to improved fisheries manage-ment. Fishermen have information that is very detailed and area specific. This information shouldshape the management of local stocks.

82
Health of the Bay of Fundy: Assessing Key Issues
Summary of the Report
Background and Previous Research. This project evolved out of an urgent need to betterunderstand Bay of Fundy groundfish. The Bay of Fundy was once an extremely productive system thatsupported a number of year-round inshore fisheries. The decline and collapse of many of these fisherieshas lead to demands for a management system designed by fishermen and based on their knowledgeand values. In many places, this frustration is driving a movement towards community-based manage-ment.
Methodology and Research Process. To address fishermen’s interests, this project evolvedfrom a simple mapping of groundfish spawning areas to a more holistic discussion of local stocks,inshore fisheries, habitat, and spawning activity. The information collected from fishermen was mappedon a geographic information system (GIS) so that seasonal changes over time could be illustrated.
Evidence for Local Stocks. Presently most groundfish stocks are managed under the assump-tion that they spawn on offshore banks such as Georges or Browns. Based on when and where fisher-men have caught spawning fish, there is strong evidence that cod, haddock and pollock also spawnwithin the Bay of Fundy. The loss of local inshore fisheries is associated with the disappearance of localspawning.
Inactive Spawning Areas. There has been a progressive loss of groundfish spawning areas inthe Bay of Fundy over the last 30 years. Fishermen attribute the loss to the effects of overfishing,habitat loss, diminished food availability, pollution, and ecosystem change.
Active Spawning Areas. There are a small number of fishing grounds that fishermen considerto be active spawning areas. These are mostly places where spawning groundfish have been protectedfrom overexploitation by weather conditions or bottom topography.
Conclusions and Recommendations for Further Research. Some of the spawning areas iden-tified in this report remain active and continue to support fisheries, but others have declined or disap-peared completely. There is an urgent need to learn more about groundfish stock structure in the Bay ofFundy so we can protect and rehabilitate local stocks. Fishermen’s knowledge can contribute greatly tothis endeavor and should play a significant role in driving research and management initiatives.
To obtain a copy of this report please contact: Centre for Community-Based Management, Bayof Fundy Program. Telephone: (506) 755-2893 or E-mail: [email protected]
Reference
Benham, A. A., and E. A. Trippel. 2002. Mapping Fishermen’s Knowledge of Groundfish and HerringSpawning and Nursery Areas in the Bay of Fundy, Gulf of Maine and Eastern Nova ScotianShelf. Canadian Technical Report of Fisheries and Aquatic Sciences (in press).
83
Session Three: Fish and Fisheries
DISTRIBUTION OF RARE, ENDANGERED AND KEYSTONE MARINEVERTEBRATE SPECIES IN BAY OF FUNDY SEASCAPES
Kate A. Bredin1, Stefan H. Gerriets1 and Lou Van Guelpen2
1 Atlantic Canada Conservation Data Centre and Atlantic Reference Centre, St. Andrews, [email protected]
2 Atlantic Reference Centre, Huntsman Marine Science Centre, St. Andrews, [email protected]
As part of a framework for marine protected areas planning, the World Wildlife Fund (WWF)has developed an oceanographically-based marine habitat classification system that uses abiotic fac-tors to identify a set of seascapes for the Scotian Shelf, including the Bay of Fundy. The WWF frame-work “uses an ecologically-based hierarchical classification of marine environments to determine thediversity of physical habitat types and ... reflects the range of conditions that influence species distribu-tion ... The classification ... uses physical attributes alone and essentially predicts the expected speciesassemblages on the basis of documented enduring or recurring geophysical characteristics” (Day andRoff 2000: vii). The physical attributes used to define the set of seascapes include water-mass tempera-ture, depth, bottom temperature, stratification, exposure, slope, and sediment type.
To test the classification framework, WWF Canada undertook a case study in 1998 on theScotian Shelf of Canada, including the Bay of Fundy. The study resulted in the preliminary identifica-tion of nine marine natural regions1 and 62 specific seascapes2. Two of the regions and 32 seascapeswere found within the Bay of Fundy with some of these extending outside the Bay (Figure 1).
In continuing to advance this case study and to build a practical case for marine protected areas(MPAs) in the Scotian Shelf/Bay of Fundy area, WWF Canada desired to incorporate biological andecological data to determine whether there are affinities by species and by communities to marinenatural regions and seascapes. Among the desirable biological data are locational information on anyrare, endangered and/or keystone3 species found within the area that might be strongly or moderatelyassociated with seascapes.
In 2001 the Atlantic Canada Conservation Data Centre (ACCDC) received funding from theGulf of Maine Council on the Marine Environment to map occurrence information for rare, endangeredand keystone marine vertebrates in the Bay of Fundy against WWF’s seascape classification for theBay. Based in Sackville, New Brunswick, the not-for-profit ACCDC exists to assemble and provideinformation and expertise on species and natural communities of conservation concern in AtlanticCanada, in support of decision making, research and education.
1 Broad, oceanographic and biophysical areas characterized by particular water-mass characteristics and sea-ice conditions.2 Marine areas that have a distinctive combination of enduring features as defined at scales of 1:250,000 to 1:500,000.3 Keystone species are species that play a critical role in maintaining food web relationships and the structure of biologicalcommunities.

84
Health of the Bay of Fundy: Assessing Key Issues
Identification of Rare, Endangered and Keystone Marine Vertebrates in the Bay of Fundy
Conservation data centres, including the ACCDC, determine the rarity status of species thatoccur in their jurisdiction. Through the international network of conservation data centres (CDCs),species rarity ranks are assigned at three geographic levels: global (G-rank), national (N-rank) and sub-national (S-rank), where sub-national refers to provincial or state-level rarity ranks, which are assignedby individual CDCs for species in their jurisdictions. Species rarity ranks are established on a basicscale of 1 to 5, with 1 being the most rare and 5 being the most common, but they also take into accountother factors that reflect a species’ status in a jurisdiction, such as extirpated or exotic status (see <http://www.accdc.com>). In Atlantic Canada, the ACCDC assigns S-ranks for five jurisdictions (New Bruns-wick, Nova Scotia, Prince Edward Island, Newfoundland, and Labrador). Rarity ranks are usually de-veloped in co-operation and collaboration with provincial natural resource departments and numerousspecies experts. Rarity ranks for anadromous fish species in New Brunswick were assigned this way.ACCDC has not yet assigned rarity ranks to exclusively marine fish species. The ACCDC assignedmarine mammal rarity ranks using the same process outlined above, but based geographically on sixocean regions comprising Atlantic Canada waters, rather than on a provincial jurisdictional basis.4
A rare or endangered marine or anadromous fish or marine mammal species was considered foroccurrence mapping within Bay of Fundy seascapes if: 1) it received an ACCDC rarity rank of S1 to S3(i.e. extremely rare, rare, or uncommon throughout its range in the Bay of Fundy); or 2) was listed asendangered, threatened or special concern by the Committee on the Status of Wildlife in Canada(COSEWIC); or 3) if it was listed as endangered, threatened, vulnerable or conservation dependant bythe American Fisheries Society (AFS) (see Musick et al. 2000). Table 1 lists rare or endangered fish andmarine mammals in the Bay of Fundy, along with COSEWIC status, ACCDC rarity rank (S-rank), andthe AFS status for the population segment present in the Bay, that were mapped against Bay of Fundyseascapes.
A keystone species plays a crucial role in its community (Norse 1993), or a pivotal role in thetrophic structure of an ecosystem (Paine 1966, in Costanza et al. 1995). Through consultation withMichael Dadswell at the Acadia Centre for Estuarine Research, Acadia University, the following spe-cies were identified as keystone marine fish species in the Bay of Fundy: Spiny Dogfish (Squalusacanthias), American Shad (Alosa sapidissima), Atlantic Herring (Clupea harengus), Rainbow Smelt(Osmerus mordax), Atlantic Cod (Gadus morhua), Haddock (Melanogrammus aeglefinus), Pollock(Pollachius virens), and Winter Flounder (Pleuronectes americanus) (and see Dadswell et al. 1984).No individual marine mammal species were considered keystone in the Bay of Fundy although taken asa group, the baleen whales may play an important role in ecosystem processes.
4 The six ocean regions are Labrador Shelf, Newfoundland Shelf, Grand Banks, Scotian Shelf, Bay of Fundy, and the Gulf ofSt. Lawrence: marine mammal rarity ranks have so far been assigned for the Scotian Shelf and the Bay of Fundy.

85
Session Three: Fish and Fisheries
Seascapes
Seascape data were obtained from World Wildlife Fund Canada (see Day and Roff 2000). Dayand Roff (2000) overlaid seven levels of abiotic parameters to create spatial areas differentiated bythose attributes; thirty-two seascapes were identified within the Bay of Fundy. Seascapes were mappedto show unique sets of values for the following abiotic parameters: 1) Climatic Zone (Boreal, Temper-ate, Subtropical); 2) Benthic temperature (Cold Subarctic(<6oC), Moderate Temperate (6-9oC), WarmGulf Stream (>9oC)); 3) Vertical Segregation Pelagic Realm (Epipelgic (0–200m), Mesopelagic (200–1000 m), Bathypelagic (1000–2000 m), Abyssal (>2000 m)); 4) Vertical Segregation Benthic Realm(Euphotic (0–50 m), Dysphotic/ Aphotic (50–200 m)); 5) Mixing and Wave Action: Pelagic Realm(Well-mixed (non-stratified), Frontal, Stratified); 6) Exposure and Slope Classes (Exposed – subject toexposure (depth < 50 m), Low Slope (<2%), High Slope (>2%)); and 7) Benthic Substrate (Mud,Mostly sand (20–80% sand), Partially sand (0–20% sand), Partially gravel (5–50% gravel), Mostlygravel (>50% gravel)).
Data Sources
Locational data for rare, endangered and keystone marine fish species were obtained fromdemersal (groundfish) research trawl surveys conducted on the east coast of North America by theDepartment of Fisheries and Oceans (DFO) in Canada and by the National Oceanic and AtmosphericAdministration, National Marine Fisheries Service (NMFS) in the United States (Brown et al. 1996).Trawl survey data were combined into a single database structured by data from individual trawl sets atdifferent geolocations, thereby permitting locational analysis for various species. Data were obtainedfrom DFO and were downloaded from the Gulf of Maine Biogeographic Information System (GMBIS)website: http://cephbase.biology.dal.ca/gmbis/aconscripts/GroundfishSurveyMap.html>.
Locational data for rare and endangered marine fish were also obtained from the literature, andfrom specimen records at the ARC at the Huntsman Marine Science Centre in St. Andrew’s, NewBrunswick. We received data for larval Atlantic Herring, Atlantic Cod and Haddock from DFO’s threeIchthyoplankton Survey Programs, one of which, the Larval Herring Program, covered the Bay ofFundy (see Hanke et al. 2000, 2001). The larval data are in units of density for an aggregate cell of threemiles and are expressed as number of larvae/100 m3 water (filtered), averaged for the number of sam-ples in that aggregate three mile cell. Cetacean data were obtained from the North Atlantic Right WhaleConsortium curated at the University of Rhode Island. This dataset is comprised of sightings of marinemammals (including the Basking Shark, Cetorhinus maximus) using a variety of sighting methodsincluding aerial surveys, opportunistic and historical sightings, and sightings from a wide variety ofvessels including ferries, US Coast Guard vessels, whale watch vessels and research vessels.
Mapping Species onto Seascapes Using Percent of Total Catch, Classed by Natural Breaks
Georeferenced point data of species’ catches from trawl surveys, or observations in the case ofmarine mammals, were linked to the seascape polygon layer. For each species, maps of percent total

86
Health of the Bay of Fundy: Assessing Key Issues
catch per seascape were produced. Seascapes were ranked into five groups based on percent total catchper seascape using the Natural Break algorithm, available within MapInfo, the geographic informationsystem (GIS) software used to create the maps.
Natural Break identifies breakpoints between classes using a statistical formula (Jenk’s optimi-zation) which reduces error by minimizing the sum of the variance within each of the classes. NaturalBreak emphasizes inherent clustering of scores, producing chloropleths (coloured map polygons) thatmay better approximate ecological preferences of a species than an arbitrary numerical division wouldproduce. For mapping purposes, seascapes were coloured according to their rank (i.e. according to thepercent total catch within them): First ranked seascapes (with the highest percent total catch) werecoloured red, second ranked seascapes were coloured orange, third ranked seascapes were colouredyellow-green, fourth ranked seascapes were coloured teal, and fifth ranked seascapes were colouredblue.
In the main series of maps, catch data were pooled for all seasons of the entire year, however,since the great majority of survey sets were conducted in the summer (June to August, 1970–2001)maps were biased towards summer distributions. If there were adequate data for keystone fish speciesfor spring (March to April, 1979–1984) and fall (September to November, 1978–1984) surveys, and ifthere was a suggestion of a shift in distribution between seasons as determined from exploratory mapsdownloaded from the GMBIS website, we produced seasonal distribution maps of seascapes by totalcatch.
Results and Discussion
Keystone Marine Fish Species Distribution with Bay of Fundy Seascapes
Two seascapes captured much of the locational information for five species of groundfish (see,for example, Figures 2-4). Atlantic Cod, Winter Flounder, Haddock, Pollock, and Spiny Dogfish wereall most abundant in seascapes 21 and 23. Although seascapes 21 and 23 do encompass most of themid-Bay, and distribution within these seascapes may be an artifact of a general abundance of groundfishthroughout the central area of the Bay, it is interesting to note that groundfish were not abundant inseascape 19, also in mid-Bay. Seascape 19 is one of thirteen frontal seascapes in the Bay—areas wherethere is upwelling caused by sudden changes in water temperature or salinity, or where there are con-vergences towards which surface waters flow from different or opposing directions, tending to sink atthe areas where they meet (Gross 1977). American Shad were also most abundant in seascape 21 and inseascape 67, another frontal seascape with potential areas of upwelling. As American Shad are plank-ton feeders, they may favour frontal areas where copepods and mysids are brought to the surface due toupwelling.
Seasonal movements and feeding habits of fish species appear to be related to seascape use.Atlantic Herring were most abundant in seascape 11, a primarily coastal seascape that encompasses thesummer feeding area for herring off Brier Island, NS. Rainbow Smelt, an anadromous species, were

87
Session Three: Fish and Fisheries
most abundant in seascape 29, close to major spawning rivers; no other species were found predomi-nantly in this seascape. In autumn, Pollock were most frequently caught in seascape 72, a frontal sea-scape with potential areas of upwelling near the mouth of the Bay. This may be a reflection of the factthat Pollock in the Bay of Fundy move south in fall or early winter to spawn in the southern Gulf ofMaine (Steele 1963). In the spring, Haddock were most highly correlated with seascape 72.
Spawning Areas and Larval Retention Locations for Selected Keystone Species
Larvae of three keystone species, Atlantic Herring, Atlantic Cod and Haddock, were most abun-dant off the southwest shore of Nova Scotia, south of Brier Island, in the lower sector of seascape 23.This ocean area is known to be a major spawning location for these species (Stephenson et al. 2000,Hanke et al. 2000, 2001). Oceanographic larval retention factors (e.g., temperature gradients) may be astronger determinant of larval fish distribution than seascape per se, since few larvae were present inthe upper sector of seascape 23. (In the event of future analyses, geographically disparate sectors of thesame seascape should be separated.)
Rare and Endangered Marine Fish Distribution with Bay of Fundy Seascapes
The distribution of rare fish species, as a group, in the Bay of Fundy did not clearly correspondwith just a few seascapes, as was the case, for example, for the keystone groundfish species. The rarefishes were a more disparate group, differing substantially in feeding and life history characteristics,than the keystone fish group, which included five species of groundfish (including Spiny Dogfish) andtwo members of the family Clupeidae (herring and shad). Rare fish distribution in the Bay of Fundywas more related to habitat preferences of individual species rather than to preferences of the group asa whole. For example, Halibut, a rare groundfish, showed the same preference for seascapes 21 and 23,as for the keystone groundfish species.
Because sufficient locational data were lacking for some rare and endangered species in the Bayof Fundy due to their rarity, attempting to demonstrate patterns of seascape for these species was notwarranted. And, most of the georeferenced data for the anadromous species Shortnose Sturgeon(Acipenser brevirostrum), Atlantic Sturgeon (Acipenser oxyrinchus), and Atlantic Salmon (Salmo salar),were for river and estuarine locations and would be unrelated to marine seascape parameters.
The greatest number of Basking Shark sightings occurred in seascape 29 and seascape 27, afrontal seascape where upwelling is likely to bring plankton to the surface for the sharks to feed on.Relatively few Barndoor Skate (Dipturus laevis) were caught during groundfish surveys, indicative ofthe precipitous decline of this species throughout the North Atlantic in the last two decades (Casey andMyers 1998). Greater numbers of Thorny Skate (Amblyraja radiata) were caught throughout the mid tolower part of the Bay, primarily in seascapes 21, 27 and 23. Atlantic Wolffish (Anarhichas lupus) preyupon a variety of bottom invertebrates (Scott and Scott 1988) and were most highly represented inseascape 21 and in seascape 23, similar to the distribution of groundfish. Acadian Redfish (Sebastesfasciatus) were most abundant at the mouth of the Bay in seascapes 72 and 67, frontal seascapes with
88
Health of the Bay of Fundy: Assessing Key Issues
potential areas of upwelling likely to produce an abundance of pelagic zooplankton upon which thisspecies feeds.
Rare and Endangered Marine Mammal Distribution with Bay of Fundy Seascapes
The distribution of most marine mammal species in the Bay of Fundy occurred within threeseascapes, 21, 27 and 29, situated at the mouth of the Bay. However, the majority of the cetaceansighting data was collected during surveys directed at North Atlantic Right Whale (Eubalaena glacialis)identification and research, and is thus concentrated in the Right Whale high-use area in the lower Bay.Although this data collection bias influenced the correlation of cetacean distribution with seascape,some interesting species-specific patterns emerged.
The most frequently sighted cetacean species in the Bay of Fundy was the Harbour Porpoise(Phocoena phocoena), which is consistent with a recent population estimate for the Bay of Fundy-Gulfof Maine stock of 89,000 animals (Palka 2000). As for other cetaceans, Harbour Porpoises were mostabundant in the lower Bay in seascapes 29 and 21, though with more systematic surveys they wouldlikely be found more widely in the Bay.
Long-finned Pilot Whale (Globicephala melas) distribution was different from other cetaceanspecies in that they were most frequently sighted further out of the Bay in seascape 67 and off DigbyNeck in the lower sector of seascape 21. Their distribution at sea is usually determined by their mainprey, squid, which frequently occur southwest of Brier Island and at the mouth of the Bay of Fundy (seemaps in Simon and Comeau 1994), in an area close to these Pilot Whale sightings.
Sightings of Atlantic White-sided Dolphins (Lagenorhynchus acutus) were concentrated in thearea between northern Grand Manan Island and Digby Neck, where their main prey, small schoolingfish such as Atlantic Herring and Rainbow Smelt were abundant (see above) (Katona et al. 1993).White-beaked Dolphins (Lagenorhynchus albirostris) and Killer Whales (Orcinus orca) are rare in theBay of Fundy and were infrequently sighted.
Humpback Whales (Megaptera novaeangliae), with their coarser baleen, tend to feed on smallschooling fish to a greater degree than other baleen whale species. They were overwhelmingly concen-trated in the lower sector of seascape 21 off Digby Neck, where small schooling fish such as herringand juvenile cod are concentrated (see above). Fin Whales (Balaenoptera physalus) occurred in analmost continuous line across the mouth of the Bay in the lower part of seascape 21 and in seascapes29, 27, and 51. Fin Whales eat both krill and schooling fish, and seemed to be frequenting both theherring rich areas off Digby Neck, as well as the areas of upwelling at the mouth of the Bay with theirrich concentrations of zooplankton (Daborn 1997). The few Sei Whales (Balaenoptera borealis) thatwere seen in the Bay of Fundy were concentrated on the Nova Scotia side off Digby Neck, and in thearea of upwelling at the mouth of the Bay. Sei Whales will also eat small schooling fish and krill andtheir distribution in the Bay corresponds with areas rich in both prey sources. North Atlantic RightWhales were most abundant in the frontal seascape 27, where upwelling produces rich concentrations
89
Session Three: Fish and Fisheries
of zooplankton that baleen whales feed upon. They were also sighted in seascape 29 and 51, in thecentre of the Grand Manan Basin. The Grand Manan Basin is a critical area for North Atlantic RightWhales in the summer and fall, functioning in part as a nursery where most of the cows bring theircalves, but also as a juvenile and adult feeding area (Brown and Kraus 1997).
Conclusions and Future Steps
One way to circumvent the frequent inadequacies of single-species occurrence data for conser-vation planning, especially in the marine realm, is to adopt an ecosystem-based conservation process,such as the WWF seascape approach. The addition of biological data layers to physical and oceano-graphic seascape information, as was done for this project, results in a set of enhanced seascapes andenables the identification and prediction of biologically important marine areas. These biologicallyimportant seascapes can be seen as conservation targets to be considered for possible future protectionthrough MPAs planning. The development of a scheme of MPAs that protects biologically importantseascapes can provide a surrogate for protection of individual marine species for which we lack ad-equate knowledge for conservation.
Two seascapes, for example, emerged as significant to the distribution of the keystone groundfishspecies assemblage. If additional biological data layers were added, such as data on benthic inverte-brate seascape associations, the resulting set of enhanced seascapes would be more powerful predictorsof biologically important ocean regions. Some types of invertebrate information would probably corre-late more closely with seascapes because many marine invertebrate taxa are lower in the food chain andmore directly tied to oceanographic and physiographic factors. As layers of biological information areadded and the seascapes are further refined (e.g., by incorporating seasonal values of seascape param-eters), their ability to predict distinct ocean areas with rich species assemblages, i.e. targets for MPAsplanning, will increase.
There are various ways seascape correlation with biological data could be taken further. Al-though statistical analyses were beyond the scope of this project, spatial statistics (e.g., cluster analysis)could be applied to further elucidate patterns of species-seascape relationships. Our maps of percentoccurrence per seascape failed to correct for seascape area, so that species occurrence in small sea-scapes was underrepresented, though they could be of prime biological importance (e.g., frontal sea-scape number 57 to baleen whales). Determining a way to correct for this bias is critical. There werealso several cases where seascapes existed as more than one discrete geographic area, but the clusteringof species records was skewed towards only one of the areas. If the current set of seascapes was to besubdivided in those cases where a seascape exists as more than one spatially discrete object, a reitera-tion of this exercise would produce finer and more clearly defined linkages of species to seascape. And,it would be enlightening to apply this methodology to a larger ocean area with a greater variety ofseascapes, such as the Scotian Shelf or the Gulf of Maine, using a larger set of biological data, most ofwhich are readily available.

90
Health of the Bay of Fundy: Assessing Key Issues
References
Brown. M. W. and S. D. Kraus. 1997. North Atlantic Right Whales. Pages 92–94. In: Bay of FundyIssues: A Scientific Overview. Workshop Proceedings, Wolfville, NS January 29 to February 1,1996. J. A. Percy, P. G. Wells and A. J. Evans (Eds.). Environment Canada – Atlantic RegionOccasional Report No. 8, Environment Canada, Sackville, NB. 191 pp.
Brown, S. K., R. Mahon, K. C. T. Zwanenburg, K. R. Buja, L. W. Claflin, R. N. O’Boyle, B. Atkinson,M. Sinclair, G. Howell, and M. E. Monaco. 1996. East Coast of North America Groundfish:Initial Exploration of Biogeography and Species Assemblages. National Ocean and Atmos-pheric Administration, Silver Spring, MD, and Department of Fisheries and Oceans, Dartmouth,NS. 111 pp.
Casey, J. and R. Myers. 1998. Near extinction of a large widely-distributed fish. Science 281: 690–692.
Costanza, R., M. Kemp, and W. Boynton. 1995. Scale and biodiversity in coastal and estuarine ecosys-tems. In: Biodiversity Loss: Economic and Ecological Issues. C. Perrings, K.-G. Maler, C. Folke,C. S. Holling, and B.-O. Jansson (Eds.).Cambridge University Press, Cambridge. 332 pp.
Daborn, G. R. 1997. Zooplankton. Pages 66–69. In: Bay of Fundy Issues: A Scientific Overview. Work-shop Proceedings, Wolfville, N.S. January 29 to February 1, 1996. J. A. Percy, P. G. Wells andA. J. Evans (Eds.). Environment Canada – Atlantic Region Occasional Report No. 8, Environ-ment Canada, Sackville, NB. 191 pp.
Dadswell, M. J., R. Bradford, A. H. Leim, D. J. Scarratt, G. D. Melvin, and R. G. Appy. 1984. A reviewof research on fishes and fisheries in the Bay of Fundy between 1976 and 1983 with particularreference to its upper reaches. In: Update on the Marine Environmental Consequences of TidalPower Development in the Upper Reaches of the Bay of Fundy. D. C. Gordon, Jr., and M. J.Dadswell (Eds.). Canadian Technical Report of Fisheries and Aquatic Sciences 1256. 686 pp.
Day, J. C. and J. C. Roff. 2000. Planning for Representative Marine Protected Areas: A Framework forCanada’s Oceans. Report prepared for World Wildlife Fund Canada, Toronto.
Gross, M. G. 1977. Oceanography: A View of the Earth. 2nd ed. Prentice-Hall, Englewood Cliffs, NJ.497 pp.
Hanke, A. R., F. H. Page, and J. Neilson. 2000. Distribution of Atlantic Cod (Gadus morhua) Eggs andLarvae on the Scotian Shelf. Canadian Technical Report of Fisheries and Aquatic Sciences2308. Department of Fisheries and Oceans, St. Andrews, NB. 140 pp.
Hanke, A. R., F. H. Page, and J. Neilson. 2001. Distribution of Haddock (Melanogrammus aeglefinus)Eggs and Larvae on the Scotian Shelf, Eastern Gulf of Maine, Bay of Fundy and Eastern GeorgesBank. Canadian Technical Report of Fisheries and Aquatic Sciences 2329. Department of Fish-eries and Oceans, St. Andrews, NB. 133 pp.
Katona, S. K., V. Rough and D. T. Richardson. 1993. A Field Guide to Whales, Porpoises, and Sealsfrom Cape Cod to Newfoundland. 4th ed., revised. Smithsonian Institution Press, Washington,

91
Session Three: Fish and Fisheries
DC. 316 pp.
Musick, J. A., M. M. Harbin, S. A. Berkeley, G. H. Burgess, A. M. Eklund, L. Findley, R. G. Gilmore, J.T. Golden, D. S. Ha, G. R. Huntsman, J. C. McGovern, S. J. Parker, S. G. Poss, E. Sala, T. W.Schmidt, G. R. Sedberry, H. Weeks, and S. G. Wright. 2000. Marine, estuarine, and diadromousfish stocks at risk of extinction in North America (exclusive of Pacific Salmonids). Fisheries25(11): 6–30.
Norse, E. A. (Ed.) 1993. Global Marine Biological Diversity. Island Press, Washington, DC. 383 pp.
Palka, D. 2000. Abundance of the Gulf of Maine/Bay of Fundy Harbor Porpoise Based on Shipboardand Aerial Surveys During 1999. Northeast Fisheries Science Center Reference Document 00-07. NMFS, Woods Hole, MA.
Scott, W. B. and M. G. Scott. 1988. Atlantic Fishes of Canada. Canadian Bulletin of Fisheries andAquatic Sciences 219. 731 pp.
Simon, J. E., and P. A. Comeau. 1994. Summer Distribution and Abundance Trends of Species Caughton the Scotian Shelf from 1970-92, by the Research Vessel Groundfish Survey. Canadian Tech-nical Report of Fisheries and Aquatic Sciences 1953. Department of Fisheries and Oceans,Dartmouth, NS. 145 pp.
Stephenson, R. L., M. J. Power, K. J. Clark, G. D. Melvin, F. J. Fife, T. Scheidl, C. Waters, and S.Arsenault. 2000. DFO Canadian Stock Assessment Secretariat Research Document 2000/065.2000 evaluation of 4VWX herring. 114 pp.
Steele, D. H. 1963. Pollock (Pollachius virens (L.)) in the Bay of Fundy. Journal of the Fisheries Re-search Board of Canada 20: 1267–1314.

92
Health of the Bay of Fundy: Assessing Key Issues
Table 1. Various status ranks for marine and anadromous fish and marine mammals
Common Name
Scientific Name (and synonyms) COSEWIC
AFS status for relevant distinct population segment (DPS)
GRANK NRANK AC CDC S-RANK
MARINE FISH (NS or NB)
Sand Tiger Carcharias taurus, Odontaspis taurus vulnerable
(w. Atlantic)
Basking Shark Cetorhinus maximus conservation dependent
(w. Atlantic)
White Shark; Great White Shark
Carcharodon carcharias conservation dependent
(w. Atlantic)
Barndoor Skate Dipturus laevis; Raja laevis; Raja granulata
vulnerable
Thorny Skate
Amblyraja radiata; Raja radiata; Raja scabrata; Raja clavata
not assessed (Canadian
stocks) vulnerable (US stocks).
Shortnose Sturgeon
Acipenser brevirostrum special concern conservation dependent
(Saint John River) S3 (NB); S2 (NS)
Atlantic Sturgeon
Acipenser oxyrinchus Acipenser oxyrhynchus; Acipenser sturio
endangered (N. Canadian rivers, St. Lawrence River); threatened (Saint John River)
S3 (NB); S2 (NS)
Atlantic Salmon Salmo salar
endangered (inner Bay of
Fundy populations)
Endangered (Inner Bay of Fundy
Rivers); threatened
(St. Croix R. to Saint John R.)
S3 (NB); S2 (NS)
Atlantic Cod Gadus morhua, Gadus morhua morhua
special concern
vulnerable (LB, NF, Grand Banks, Gulf of St. Lawrence.);
not at risk (though overfished, other
DPSs)
Atlantic Wolffish Anarhichas lupus special concern
Spotted Wolffish Anarhichas minor threatened
Acadian Redfish Sebastes fasciatus conservation dependent
(Gulf of Maine)
Atlantic Halibut Hippoglossus hippoglossus
threatened (US, eg Gulf of Maine)
vulnerable (Canada & Maritimes)

93
Session Three: Fish and Fisheries
MARINE MAMMALS
S-RANK for the Bay of
Fundy
White-beaked Dolphin
Lagenorhynchus albirostris
Not at Risk (1998)
G4 N4 S1
Atlantic White-sided Dolphin
Lagenorhynchus acutus, Leucopleurus acutus
Not at Risk (1991)
G4 N4 S3S4
Killer Whale Orcinus orca Data Deficient (1999)
G4G5 N3 S1
Long-finned Pilot Whale Globicephala melas Not at Risk
(1994)
G5 N4N5 S2S3
Harbour Porpoise Phocoena phocoena Threatened
(NW Atlantic population)
G4G5 N4N5 S4
Fin Whale
Balaenoptera physalus Special Concern G3G4 N3 S2S3
Sei Whale Balaenoptera borealis
G3 N3 S3
Humpback Whale
Megaptera novaeangliae Special Concern
G3 N3 S3
North Atlantic Right Whale Eubalaena glacialis Endangered
G1 N1 S1
Figure 1, continued
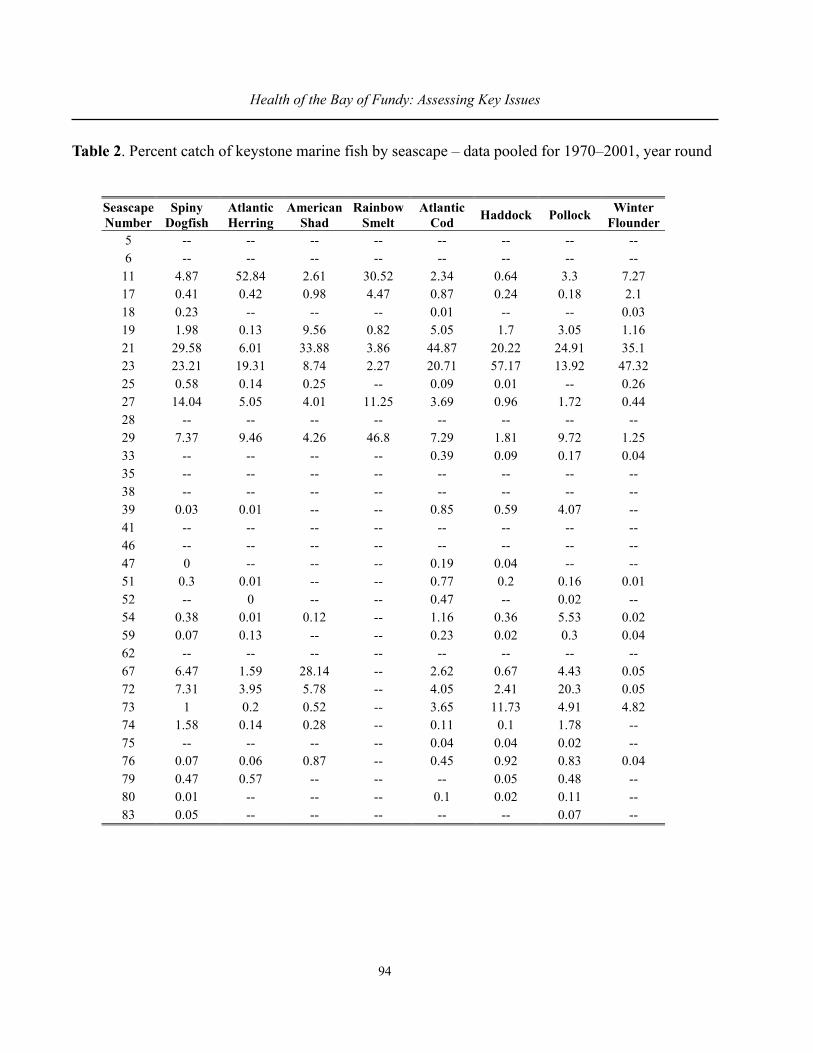
94
Health of the Bay of Fundy: Assessing Key Issues
Table 2. Percent catch of keystone marine fish by seascape – data pooled for 1970–2001, year round
Seascape Number
Spiny Dogfish
Atlantic Herring
American Shad
Rainbow Smelt
Atlantic Cod Haddock Pollock Winter
Flounder 5 -- -- -- -- -- -- -- -- 6 -- -- -- -- -- -- -- --
11 4.87 52.84 2.61 30.52 2.34 0.64 3.3 7.27 17 0.41 0.42 0.98 4.47 0.87 0.24 0.18 2.1 18 0.23 -- -- -- 0.01 -- -- 0.03 19 1.98 0.13 9.56 0.82 5.05 1.7 3.05 1.16 21 29.58 6.01 33.88 3.86 44.87 20.22 24.91 35.1 23 23.21 19.31 8.74 2.27 20.71 57.17 13.92 47.32 25 0.58 0.14 0.25 -- 0.09 0.01 -- 0.26 27 14.04 5.05 4.01 11.25 3.69 0.96 1.72 0.44 28 -- -- -- -- -- -- -- -- 29 7.37 9.46 4.26 46.8 7.29 1.81 9.72 1.25 33 -- -- -- -- 0.39 0.09 0.17 0.04 35 -- -- -- -- -- -- -- -- 38 -- -- -- -- -- -- -- -- 39 0.03 0.01 -- -- 0.85 0.59 4.07 -- 41 -- -- -- -- -- -- -- -- 46 -- -- -- -- -- -- -- -- 47 0 -- -- -- 0.19 0.04 -- -- 51 0.3 0.01 -- -- 0.77 0.2 0.16 0.01 52 -- 0 -- -- 0.47 -- 0.02 -- 54 0.38 0.01 0.12 -- 1.16 0.36 5.53 0.02 59 0.07 0.13 -- -- 0.23 0.02 0.3 0.04 62 -- -- -- -- -- -- -- -- 67 6.47 1.59 28.14 -- 2.62 0.67 4.43 0.05 72 7.31 3.95 5.78 -- 4.05 2.41 20.3 0.05 73 1 0.2 0.52 -- 3.65 11.73 4.91 4.82 74 1.58 0.14 0.28 -- 0.11 0.1 1.78 -- 75 -- -- -- -- 0.04 0.04 0.02 -- 76 0.07 0.06 0.87 -- 0.45 0.92 0.83 0.04 79 0.47 0.57 -- -- -- 0.05 0.48 -- 80 0.01 -- -- -- 0.1 0.02 0.11 -- 83 0.05 -- -- -- -- -- 0.07 --
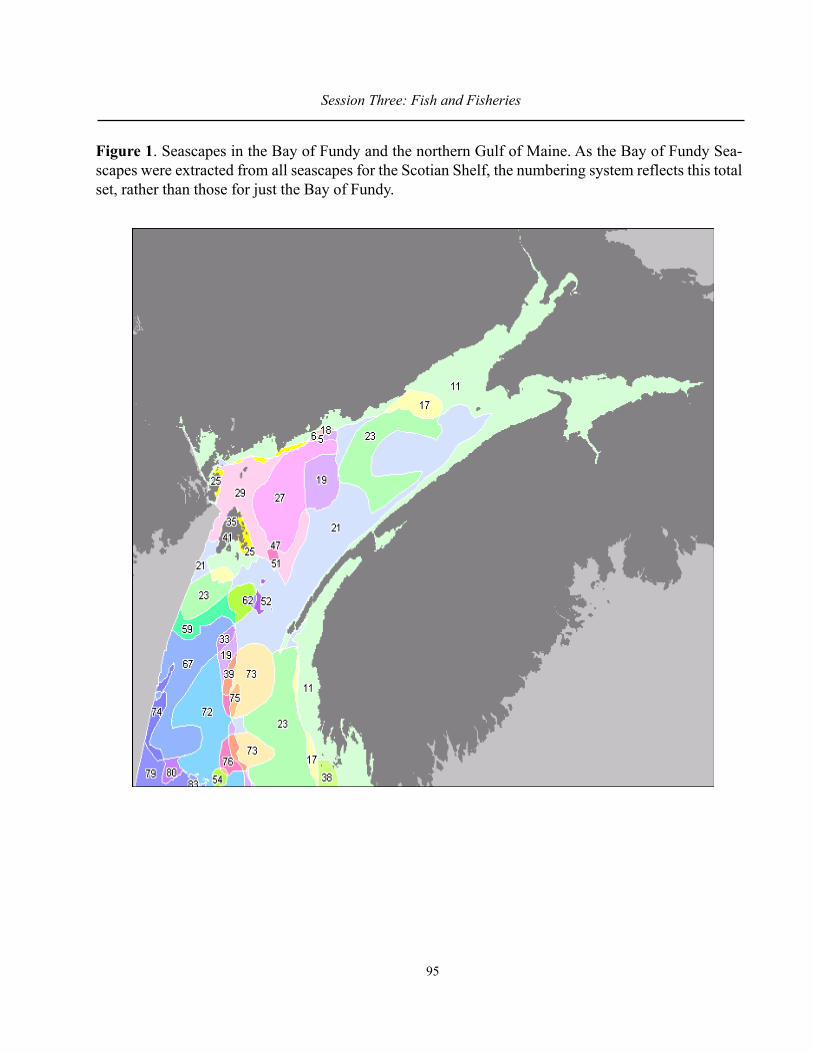
95
Session Three: Fish and Fisheries
Figure 1. Seascapes in the Bay of Fundy and the northern Gulf of Maine. As the Bay of Fundy Sea-scapes were extracted from all seascapes for the Scotian Shelf, the numbering system reflects this totalset, rather than those for just the Bay of Fundy.

96
Health of the Bay of Fundy: Assessing Key Issues
Figure 2. Total number of Atlantic Cod per trawl station from all groundfish surveys conducted from1970 to 2001. Map dots are scaled according to the total number of fish caught at each trawl station.Seascapes are coloured according to the percent of the total number of fish caught within their bounda-ries, with percent total catch per seascape indicated. The legend shows the range of percent total catchfalling within each colour category and the number of seascapes of each colour.

97
Session Three: Fish and Fisheries
Figure 3. Total number of Pollock per trawl station from all groundfish surveys conducted from 1970to 2001. Map dots are scaled according to the total number of fish caught at each trawl station. Sea-scapes are coloured according to the percent of the total number of fish caught within their boundaries,with percent total catch per seascape indicated. The legend shows the range of percent total catchfalling within each colour category and the number of seascapes of each colour.

98
Health of the Bay of Fundy: Assessing Key Issues
Figure 4. Total number of Winter Flounder per trawl station from all groundfish surveys conductedfrom 1970 to 2001. Map dots are scaled according to the total number of fish caught at each trawlstation. Seascapes are coloured according to the percent of the total number of fish caught within theirboundaries, with percent total catch per seascape indicated. The legend shows the range of percent totalcatch falling within each colour category and the number of seascapes of each colour.

99
Session Three: Fish and Fisheries
CHANGES IN THE BROWN SEAWEED Ascophyllum nodosum (Le Joly)PLANT STRUCTURE AND BIOMASS PRODUCED BY CUTTER RAKE
HARVESTS IN SOUTHERN NEW BRUNSWICK
Raul A. Ugarte1 and Glyn Sharp2
1 Acadian Seaplants Limited, Dartmouth, NS. [email protected] Invertebrate Fisheries Division, Fisheries and Oceans Canada, Dartmouth, NS
The harvest of the commercial brown seaweed Ascophyllum nodosum (Rockweed) in southernNew Brunswick completed its seventh year in 2001. Under a joint federal/provincial managementstrategy, several restrictions such as maximum exploitation rate, cutting height, gear type, and pro-tected areas were implemented to minimize risks to the resource and habitat. Though the maximumallowed exploitation rate in a given sector cannot exceed 17% of the harvestable biomass, it has beendetermined that due to several physical and environmental factors, the harvest is not homogenous,creating patches of higher exploitation rates within a rockweed bed.
Since 1996 we have monitored rockweed population structure in several harvesting experi-ments designed to evaluate the impact of the cutter rake on the plant’s size structure under differentexploitation rates. A novel technique to measure plant biomass before and after harvest was used tocomplement existing impact data. There was a direct relationship between plant vulnerability relativeto weight and length. The gear rarely impacts plants below 100 g or 60 cm in length and if the rakecontacts smaller plants, the changes in biomass or length were not significant. As plants increase inweight and length there was an increased impact on their length and biomass, with length being re-duced up to 40% and 60% of the biomass in plants larger than 130 cm and 300 g. The overall impact ofthe harvest is discussed in light of existing information on biomass, population structure and productiv-ity rates.

100
Health of the Bay of Fundy: Assessing Key Issues
BIOLOGICAL REFERENCE POINTS FOR BAY OF FUNDYALEWIFE FISHERIES
Jamie F. Gibson1 and Ransom A. Myers2
1 Acadia Centre for Estuarine Research, Acadia University, Wolfville, NS. [email protected] Department of Biology, Dalhousie University, Halifax, NS. [email protected]
Abstract
Alewife, Alosa pseudoharengus, is an anadromous species of fish indigenous to many rivers ineastern North America. Within the Bay of Fundy, they support commercial and recreational fisheries oflocal economic importance, are biologically important as both predators and prey, and can serve asvectors for nutrient transport from marine to freshwater ecosystems. Biological reference points (BRPs)are indices, based on the biological characteristics of a fish stock, that are used to gauge whetherspecific management objectives, such as maintaining stocks at a level capable of producing long-termmaximum sustainable yield (MSY), are being achieved. Using a meta-analysis of eight alewifepopulations in North America, including data for two rivers flowing into the Bay of Fundy, we haveestimated several BRPs that can be used to assess the status of alewife fisheries in this region. Using asimulation model, we found that an F35% strategy would produce greater than 90% MSY for populationsin this region, and was more precautionary than Fmsy if the maximum reproductive rate of a populationis overestimated. This rate corresponds to an exploitation rate of 38% for the Mactaquac Headpondpopulation and 42% for the Gaspereau River population.
Introduction
Alewife, Alosa pseudoharengus, is an anadromous member of the herring family that repro-duces in many rivers in eastern North America. Adults of this species ascend rivers during the spring tospawn in lakes, pools or stillwaters within the watershed. Young-of-the-year remain in freshwater untilmid-summer to late fall when they migrate to the sea. Fish mature at two to six years of age, andmaturity schedules vary among populations and years. The species is iteroparous and may spawn up tofive times over a lifespan of about ten years (these values can vary from river to river).
Within the Maritime provinces, alewife support both recreational and commercial fisheries.They are also taken in both directed and by-catch commercial fisheries during coastal migrations alongthe eastern seaboard (Rulifson 1994). They are a prey species both at sea and in freshwater and are apredator that can alter zooplankton composition within lakes. They may also serve as a vector fornutrient transport from the oceans to inland waters (Durbin et al. 1979; Garman and Macko 1998). Asa result, over-exploitation or extirpation of alewife populations may alter the productivity of their natalwatersheds, including production of freshwater and other anadromous fish.
101
Session Three: Fish and Fisheries
Using questionnaires mailed to fisheries biologists, Rulifson (1994) found that alewife occu-pied 59 of 62 Bay of Fundy rivers included in the survey. Only one of these populations was identifiedas increasing, while 53 were thought to be in decline. Causes were identified for 21 of these rivers anddams were the primary cause (20 rivers). Overfishing was not included in the survey.
Within the Maritime provinces, landings of this species are reported as river herring, and in-clude the combined landings of Blueback Herring, Alosa aestivalis, and alewife. Reported landings inthe Bay of Fundy averaged 2,493 t during the 1960 to 1999 time period, and ranged from 870 to 6,700t (DFO 2001). Since 1990, landings have been 50 to 70% of this average. The largest fishery in the Bayof Fundy is located on the Saint John River (1950 to 1999 mean landings = 2,303 t), with smallerfisheries in the Shubenacadie (1960 to 1999 mean landings ~ 130 t) and Gaspereau Rivers (1964 to1999 mean landings = 208 t). At the mouth of the Bay of Fundy, the Tusket and Annis Rivers alsosupport river herring fisheries (1960 to 1999 mean landings = 331 t). Several smaller fisheries arelocated around the Bay of Fundy (Jessop 1999).
Biological reference points (BRPs) are indices, based on the biological characteristics of a fishstock, that are used to gauge whether specific management objectives, such as maintaining stocks at alevel capable of producing long-term maximum sustainable yield, are being achieved. Many of thecommonly used BRPs are derived from spawner-recruit (SR), spawner per recruit and yield per recruitanalyses, although alternative approaches have been suggested for situations where little or no dataexist for the population of interest.
Gibson and Myers (in review) derived a production model for alewife and estimated severalreference points for four alewife populations in the Maritime provinces. They found that an F35% strat-egy (fish at a rate that reduces the spawning biomass produced per recruit to 35% that produced in theabsence of fishing) appeared reasonable for these populations. Additionally, Gibson and Myers (inpressa) carried out a meta-analysis of the population dynamics of eight anadromous alewife populationsin eastern North America, and found little variability in the empirical Bayes estimates of the maximumreproductive rates among populations. Together, these analyses suggest that the dynamics of most alewifepopulations are sufficiently similar that given a common management objective, target exploitationrates will also be similar.
In this paper, we present a summary of these analyses using the Gaspereau River, Nova Scotia,population as an example. First, we find the maximum likelihood estimate of the exploitation rate andspawner biomass that produces maximum sustainable yield for this population. We find that this dataset(as well as most other alewife datasets) contains only limited information about this reference point,and that the data do not preclude the possibility of larger catches than at present. We then use Bayesianand decision theoretic methods that explicitly include estimation uncertainty to find the exploitationrate that maximizes the expectation of the catch. Process variability (variability around the SR relation-ship and variability in maturity schedules) can also alter the size of in-river spawning migrations fromyear to year. Finally, we describe a simulation model that can be used to evaluate the effects of processvariability on the performance of target exploitation rates.

102
Health of the Bay of Fundy: Assessing Key Issues
Gaspereau River Alewife Data
Data for the Gaspereau River alewife population consist of the annual catch of the years 1964 to2001, spawning escapement counts at a fish ladder for the years 1970, 1982 to 1984 and 1997 to 2001,and estimates of the run composition by age, sex and previous spawning history during 1982 to 1984and 1997 to 2001 (Gibson and Myers 2001). These data were used to estimate the spawner abundancein each year, the number of age-3 recruits in each year, annual exploitation rates, maturity schedules,and natural mortality using a statistical, life history-based, age-structured, stock assessment modeldesigned specifically for Alosa (Gibson and Myers in pressb). The model output was used for the fol-lowing analyses. The catch for the Gaspereau River, reported as the number of 50 lb pails (about 120 to135 fish/pail), is shown in Figure 1. The catch peaked in 1978 at just over 20,000 pails, followed byvery low catches in the early 1980s. While the catch has fluctuated since then, each peak catch issmaller than the preceding peak. The median catch from 1964 to 2001 is 5,600 pails. Spawning escape-ment counts on the Gaspereau River have ranged between 50,400 in 1982 to 238,842 in 2001 (Table 1).Exploitation rate estimates range between 38.5% and 89.4%.
Alewife Population Dynamics and Production
In order to analyze their population dynamics, we divided the life cycle of alewife into twoparts. First we analyzed the rate at which spawners produce recruits. We chose three years of age as theage of recruitment, the earliest age at which we see mature fish in the Gaspereau River. We modelledthe number of recruits produced in each year as a function of spawner abundance using a Beverton-Holtspawner-recruit (SR) model, which gives the number of recruits in yearclass t, Rt as a function of thespawning biomass in year t, SSBt:
)R(1 0/SSBαSSBR
t
tt α+=
Here,α is the slope at the origin, and in the deterministic model is the maximum rate at whichspawners can produce recruits at low population sizes (Myers et al. 1999). R0 is the asymptotic recruit-ment level (expressed as the number of age-3 recruits), and is the limit approached by Rt as SSBt ap-proaches infinity (Beverton-Holt models are often written in terms of the half saturation constant, K,which is related to to R0 by: R0 = K). Parameter estimates for each population were obtained by usingmaximum likelihood assuming a lognormal error structure (Myers et al. 1995).
Second, we modelled the rate at which recruits produce spawners (the inverse of the slope ofthe replacement line) by calculating the spawning biomass per recruit (SPR) as a function of fishingmortality, F, maturity schedules, growth and natural mortality (Gibson and Myers in pressa). For a givenvalue of F, the spawning biomass produced by the number of recruits in year t is SSB = SPRF . Rt.Thecorresponding equilibrium spawning biomasses, recruitment levels and catches (C), denoted with as-terisks, are then:
103
Session Three: Fish and Fisheries
αα 0)1(* RSPRSSB F −= ,
0
*1
**
RSSB
SSBR αα
+=
, and FYPRRC ⋅= ** .
Here, YPRF is the yield per recruit at a given F and is found analogously to the spawning biomass perrecruit at a given F. From this equilibrium model, the fishing mortality rate that produces maximumsustainable yield, Fmsy, and the corresponding spawner biomass, SSBmsy and catch, Cmsy, are found usinga grid search across F.
The spawner recruit relationship for Gaspereau River alewife is shown in Figure 2. The maxi-mum likelihood estimate (MLE) of the maximum annual reproductive rate is 96.1, which, in the deter-ministic model is the maximum number of age-3 fish produced per kilogram of spawner biomass in asingle year in the absence of density dependent mortality. The MLE of the asymptotic recruitment levelis 1.56 million age-3 fish. The coefficient of variation is 0.43. The replacement line is also shown inFigure 2. In the absence of fishing mortality, a single age-3 recruit produces about 0.36 kg of spawnerbiomass (SPRF=0) throughout its life. The population equilibrium occurs where the replacement lineintersects the spawner-recruit relationship. As fishing mortality increases, the slope of the replacementline also increases, and the population equilibrium decreases (shifts to the left on the graph). If the slopeof the replacement line is steeper than the slope at the origin, the population equilibrium goes to zero.The MLE of the exploitation rate that produces MSY is 0.63 and that of the rate that produces stockcollapse is 0.93. Two things are evident from Figure 2: most spawner abundances are below the levelthat produces MSY, and there is considerable variability about the SR relationship. Clearly, the refer-ence points derived from this model are only as good as the SR parameter estimates for this model.
Uncertainty in the Spawner-Recruit Parameters
We evaluate the uncertainty of the SR relationship examining the joint log-likelihood surfacefor the SR parameters (Figure 3). The likelihood gives the probability of the observed data given a setof parameter values (we display the log-likelihood because likelihoods can be very small). The likeli-hood surface contains an “L”-shaped ridge along which parameter combinations are not significantlydifferent from each other at a 95% confidence level. The data do not preclude the possibility that largerrecruitments are possible at lower estimates of the maximum reproductive rate, or the possibility thatthe maximum reproductive rate is being under estimated.
Gibson and Myers (in pressa) carried out a meta-analysis of the maximum lifetime reproductiverates and habitat carrying capacities of alewife. We used the results of this analysis to derive probabilitydistributions for the SR parameters, and then used these probability distributions to assess the plausi-bility of the different combinations of SR parameters. These distributions suggest that the MLE of themaximum reproductive rate for the Gaspereau River population is high relative to other alewifepopulations, while the MLE of the asymptotic recruitment level is low relative to other populations.Using Bayesian and decision theoretic methods, these probability distributions can be combined withthe likelihood surface to obtain a probability surface for the SR parameters that include both the stock

104
Health of the Bay of Fundy: Assessing Key Issues
specific information and information from other populations. The equilibrium catch can be calculatedfor a set of SR parameters and exploitation rates, which can then be combined with the probabilitysurface to find the exploitation rate that maximizes the expectation of the catch. For the GaspereauRiver, this rate (0.56) is less than the MLE of the exploitation rate at MSY (0.63). This approach toestimating a target exploitation rate is preferable to finding the maximum likelihood estimate of Fmsybecause (for this population) the MLE is not well determined by the data, this uncertainty is explicitlyincluded when maximizing the expectation of the catch, and information from other populations is alsoincluded in the analysis.
An alternative perspective on reference points for fisheries when the spawner-recruit relation-ship is uncertain is to find the fishing mortality rate that reduces the spawning biomass produced by arecruit to some percentage of that in the absence of fishing (Mace and Sissenwine 1993). This referencepoint is called Fx%, where x is the percentage remaining. Typical values of x for many fisheries are in therange of 30 to 45%. For Gaspereau River alewife, the exploitation rate corresponding to F35% is 0.42(Gibson and Myers in review), slightly higher than those for the Mactaquac Headpond (0.40), theMiramichi River (0.39) and the Margaree River (0.37).
Using a simulation model, Gibson and Myers (in review) compared the performance of severalreference points for alewife, and found that, on average, an F35% strategy produced greater than 90% ofthe median catch when fishing at Fmsy. F35% was less than the rate that maximized the exploitation of thecatch. They concluded that that this reference point was precautionary if the maximum annual repro-ductive rate (and hence Fmsy) was being overestimated, but was not overly conservative because itprovided a large portion of catch if the estimate of maximum annual reproductive rate was correct.They also used the simulation models to compare average catches and spawning escapements for ex-ploitation rates ranging from 0 to 99% (Figure 4). The data points form a curve called the frontier,which separates the region of the possible from the region of the not possible. The best strategies fallalong this frontier (from any point within the region of the possible, either catches or spawning escape-ments can be improved by moving towards the frontier), and the most favourable strategies are closestto the upper right corner (both high catches and high spawner escapements). The simulations suggestthat both the equilibrium catch and spawning escapement would increase if the fishing mortality ratewas decreased from recent levels. Additionally, the model results suggest that the equilibrium catch atspawning escapements of about 500,000 fish would be similar to the equilibrium catch at current levelsof spawning escapement (typically less than 200,000 fish). Using similar models for three otherpopulations, Gibson and Myers (in review) concluded that the F35% performed well for all populations.
While this paper shows that fishing mortality rates have been high for Gaspereau River alewife,the outlook for this population is presently very positive. A fishery advisory committee has been estab-lished for the Gaspereau River alewife, and new regulations have been introduced in 2002 to reduceexploitation rates on this population. The population is not only affected by fishing, but also by hydro-electric development. New fish passage facilities (both upstream and downstream) were constructed onthis river system in 2001, and water management strategies have been developed to reduce the impactsof hydroelectric generation on fish populations in this watershed.
105
Session Three: Fish and Fisheries
References
Department of Fisheries and Oceans (DFO). 2001. Gaspereau Maritime Provinces Overview. DFOScience Stock Status Report D3-17 (2001). Fisheries and Oceans Canada, Ottawa.
Durbin, A. G. S., S. W. Nixon and C. A. Oviatt. 1979. Effects of the spawning migration of the alewifeon freshwater ecosystems. Ecology 60: 8–17.
Garman, G. C., and S. A. Macko. 1998. Contribution of marine-derived organic matter to an Atlanticcoast, freshwater, tidal stream by anadromous clupeid-fishes. Journal of the North AmericanBenthological Society 17: 277–285.
Gibson, A. J. F., and R. A. Myers. 2001. Gaspereau River alewife stock status report. CSAS Res. Doc.2001/061. Canadian Science Advisory Secretariat, Fisheries and Oceans Canada, Ottawa.
Gibson, A. J. F., and R. A. Myers. In pressa. A meta-analysis of the habitat carrying capacity and themaximum lifetime reproductive rate of anadromous alewife in eastern North America. Transac-tions of the American Fisheries Society.
Gibson, A. J. F., and R. A. Myers. In pressb. A statistical, age-structured, life history based, stock assess-ment model for anadromous Alosa. Transactions of the American Fisheries Society.
Gibson, A. J. F., and R. A. Myers. In review. Biological reference points for anadromous alewife (Alosapseudoharengus) fisheries in the Maritime Provinces. Canadian Technical Report of Fisheriesand Aquatic Sciences.
Jessop, B. M. 1999. The status (1960-1997) of alewife and blueback herring stocks in the Scotia-Fundyarea as indicated by Catch-Effort Statistics. CSAS Res. Doc. 1999/117. Canadian Science Ad-visory Secretariat, Fisheries and Oceans Canada, Ottawa.
Mace, P. M. and M. P. Sissenwine. 1993. How much spawning per recruit is enough? Pages 101–118.In: Risk Evaluation and Biological Reference Points for Fisheries Management. S. J. Smith, J.J. Hunt and D. Rivard (Eds.) Canadian Special Publication of Fisheries and Aquatic Sciences120.
Myers, R. A., K. G. Bowen, and N. J. Barrowman. 1999. The maximum reproductive rate of fish at lowpopulation sizes. Canadian Journal of Fisheries and Aquatic Sciences 56: 2404–2419.
Myers, R. A., J. Bridson, and N. J. Barrowman. 1995. Summary of Worldwide Spawner and Recruit-ment Data. Canadian Technical Report of Fisheries and Aquatic Sciences 2024. Department ofFisheries and Oceans, St. John’s, NL. 327 pp.
Rulifson, R. A. 1994. Status of anadromous Alosa along the east coast of North America. AnadromousAlosa Symposium, 1994, Tidewater Chapter, American Fisheries Society. pp. 134–158.

106
Health of the Bay of Fundy: Assessing Key Issues
Table 1. Summary of alewife counts at the White Rock fish ladder, estimated stock size, and the annualcatch and exploitation rates of the alewife fishery.
Figure 1. The reported alewife catch in the Gaspereau River, NS, from 1964 to 2001.
Catch Exploitation Year Alewife Count (number of fish) Stock Size Rate (%)
2001 238,842 149,422 388,264 38.5 2000 98,883 754,585 853,468 88.4 1999 81,326 698,600 770,926 89.4 1998 171,639 372,400 544,039 68.5 1997 95,433 611,520 706,953 86.5 1995 126,933 (partial) 954,960 >1,081,893 <88.3 1984 111,100 212,966 324,066 69.9 1983 114,800 150,408 265,208 56.7 1982 50,400 254,068 304,468 80.9 1970 60,527 480,000 540,527 88.9
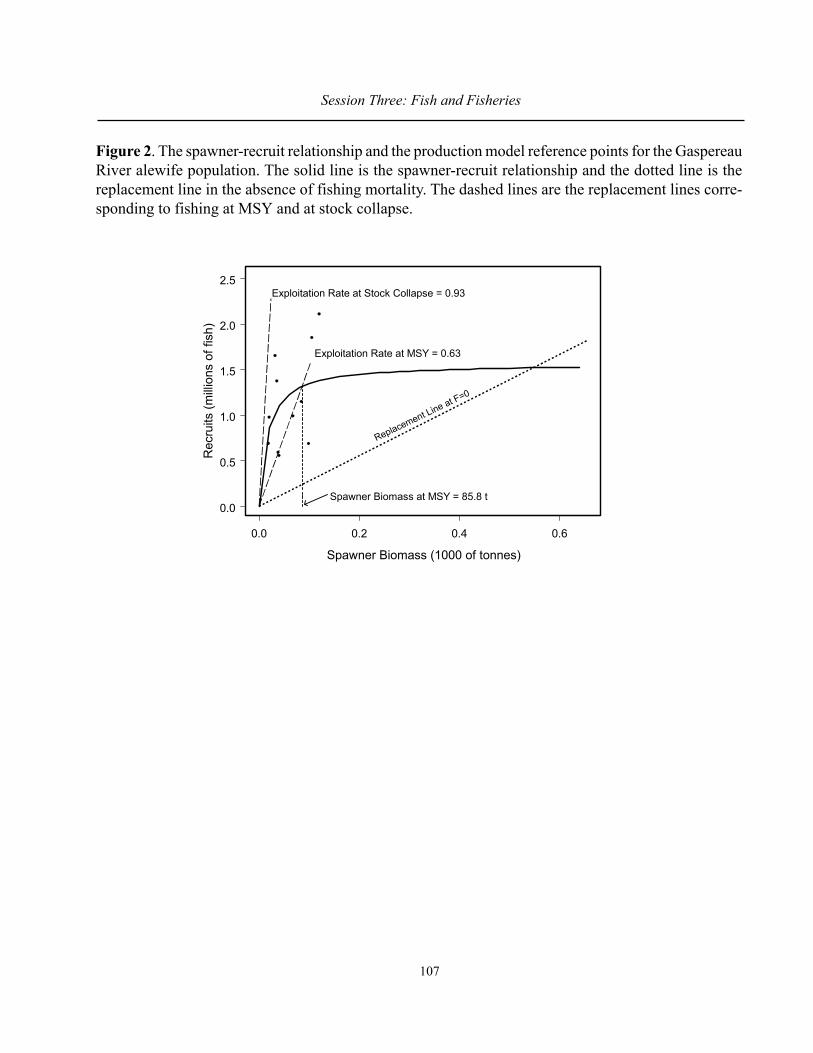
107
Session Three: Fish and Fisheries
Figure 2. The spawner-recruit relationship and the production model reference points for the GaspereauRiver alewife population. The solid line is the spawner-recruit relationship and the dotted line is thereplacement line in the absence of fishing mortality. The dashed lines are the replacement lines corre-sponding to fishing at MSY and at stock collapse.
0.0 0.2 0.4 0.6
0.0
0.5
1.0
1.5
2.0
2.5
Rec
ruits
(milli
ons
of fi
sh)
Spawner Biomass (1000 of tonnes)
Exploitation Rate at Stock Collapse = 0.93
Exploitation Rate at MSY = 0.63
Replacement Line at F=0
Spawner Biomass at MSY = 85.8 t

108
Health of the Bay of Fundy: Assessing Key Issues
Figure 3. The lower left panel is the log-likelihood surface for the maximum reproductive rate and theasymptotic recruitment level for the Gaspereau River alewife population. The black square shows thepoint where the log-likelihood is maximized. The contour interval is -1 and the grey shaded area is a95% confidence region for the two parameters. The top and right panels show probability distributionsfor the maximum reproductive rate and the asymptotic recruitment for alewife at the species level.
Figure 4. A summary of the simulation model results showing how spawning escapement and catchvary with exploitation rate (u). The uppermost point is u = 0.00, and u increases by 0.01 to a maximumof 0.99 in the lower left corner. Each point shows the mean spawning escapement and catch of 100 50-year Monte Carlo projections at the given exploitation rate. The “x”’s mark the mean exploitation rateon the Gaspereau River for the years 1982−1984 and 1997−2000, and the exploitation rate correspond-ing to F35%.
0.0 0.02 0.04 0.06 0.08 0.10 0.12
0.0
0.5
1.0
1.5
2.0
Esca
pem
ent (
milli
ons
of fi
sh)
Catch (thousands of tonnes)
increasing F
Region of the Possible
Region of theNot Possible
x
xF35%
current F
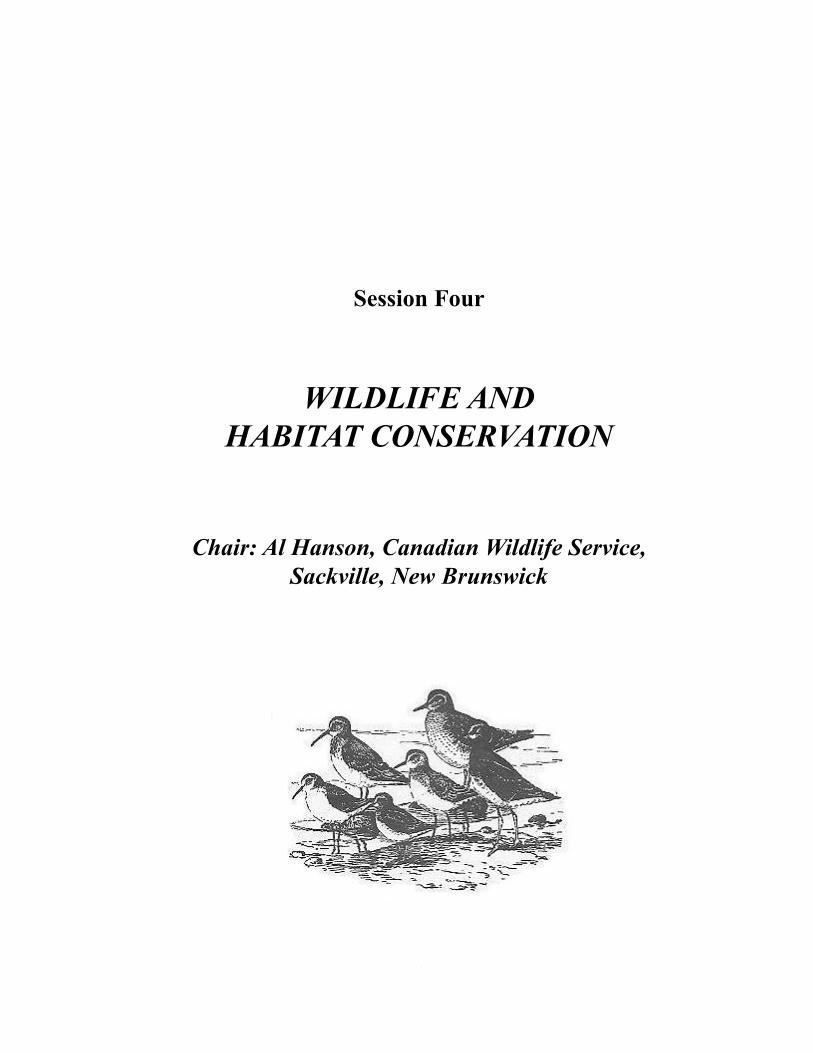
109
Session Four: Wildlife and Habitat Conservation
Session Four
WILDLIFE ANDHABITAT CONSERVATION
Chair: Al Hanson, Canadian Wildlife Service,Sackville, New Brunswick

110
Health of the Bay of Fundy: Assessing Key Issues
111
Session Four: Wildlife and Habitat Conservation
THE SEMIPALMATED SANDPIPER IN THE BAY OF FUNDY, 1981–2001:DECLINES IN THE EASTERN POPULATION
Peter W. Hicklin and John W. Chardine
Canadian Wildlife Service, Environment Canada, Sackville, NB. [email protected]
Introduction
Since the initiation of the of the Maritimes Shorebird Surveys in 1974 (see Howe et al. 1989),the populations of some species of North American migratory shorebirds have been in decline (Morrisonet al. 1994). Over the past three decades, six species of migrant shorebirds, including the SemipalmatedSandpiper, have been undergoing significant population declines. The other five species are: Red Knot,Least Sandpiper, Short-billed Dowitcher, Dunlin and Spotted Sandpiper. During the course of the an-nual southward migration to wintering grounds in South America, over 75% of the world population ofthe Semipalmated Sandpiper stop in the Bay of Fundy prior to completing the final leg of their migra-tion across the Atlantic to the northeastern coast of South America. Since 1981, before the birds de-parted from the Bay of Fundy to their wintering grounds, approximately 32,000 sandpipers have beencaptured and banded in Johnson’s Mills in Chignecto Bay; of these, the morphometrics (wing and billlengths) of slightly more than 15,000 birds were measured (see Table 1). Since the bill lengths ofSemipalmated Sandpipers display a cline of longer-billed to shorter-billed birds from east to west(Morrison and Harrington 1979), populations of this species can be distinguished on the basis of billlength. During the 1980s, early arrivals to the Bay of Fundy tended to be the long-billed eastern breed-ers with mean bill lengths greater than 20.0 mm.
Study Area and Methods
The birds were captured at Johnson’s Mills, N.B., along the beach bordering the Grande Ansemudflat, near Dorchester Cape. During the first three field seasons (1981, 1982 and 1986), we capturedsandpipers at Johnson’s Mills using mist nets and captured, on average, 74 birds/high tide (Table 1). Inorder to determine where the birds overwintered, larger numbers needed to be captured and banded.Consequently, we invented the Fundy Pull Trap (see Hicklin et al. 1989) and increased our daily cap-ture rates to 209 birds/high tide period. In the course of putting bands and leg flags on the birds, thefresh weights and bill and wing lengths of all the birds captured were recorded. Bill lengths weremeasured with dial-metric calipers (150 mm capacity; 0.1 mm divisions) from the base of the bill, atthe edge of feathering, to the bill tip; a 15 cm (right-handed) wing rule (Avinet Inc.) was used tomeasure wing lengths.

112
Health of the Bay of Fundy: Assessing Key Issues
Results and Discussion
Chronology of Migration
The movements of Semipalmated Sandpipers through the Bay of Fundy during the birds’ south-ward migration is rapid. Their numbers peak quickly through late July and early August and declineequally rapidly through the latter part of August (Figure 1).
The Capture of Birds and Morphometric Measurements
Over eleven field seasons, a total of 31,792 sandpipers were captured; of these, 15,252 werebanded and measured (all years except 1988), 15,446 were banded only (1987, 1988 and 1989) and1,094 were banded and weighed only (Table 1).
Based on museum specimens, Harrington and Morrison (1979) showed that the bill and winglengths of Semipalmated Sandpipers varied along a cline of declining lengths from east to west: thosebirds from the easternmost breeding areas (Belcher Islands and Hudson Bay) had significantly longerbills and wings than those of populations breeding west of Hudson Bay (e.g., Alaska and Banks Island)(Figure 2). Therefore, knowing the relevance of these morphometric measurements as a means of dis-tinguishing between eastern and western populations, we plotted the bill lengths of all the sandpiperscaptured in the Bay of Fundy for which data on bill lengths were available. The results illustrate cleardeclines in both the bill and wing lengths of Semipalmated Sandpipers captured at Johnson’s Mills(Figures 3 and 4, respectively). It may be noteworthy to point out a slight increase in mean bill length in2001 (Figure 3) although the significance of this cannot be recognized until a few more field seasonscan show if this is the beginning of a significant trend or simply a sampling error. The next few yearsshould clarify this. Along with five other species of migrant shorebirds in North America, the popula-tion of Semipalmated Sandpipers is known to be undergoing significant declines (Morrison and Hicklin2001). The evidence presented here suggests that this decline may be principally due to decliningnumbers of the eastern breeding population (i.e., the long-billed birds).
The Role of the Bay of Fundy
The banding and measuring of Semipalmated Sandpipers has continued intermittently in theBay of Fundy since 1981. Furthermore, the amphipod Corophium volutator, which constitutes the mainprey of the sandpipers during their stay in the Bay of Fundy, has been sampled fairly consistently inMinas Basin since 1976 (see Hicklin 1981) and annually in Chignecto Bay since 1997 (Hicklin unpub-lished). Over the eleven years that banding has occurred, the fresh body weights of the sandpipers havebeen recorded. In all years up to the present, average fresh weights of <30.0 grams have only occurredonce (in 1999; see Figure 5) and, except for significant reductions at the Grande Anse mudflat since1993, densities of Corophium remain high on all the major mudflats used by the sandpipers for forag-ing (see Shepherd et al. 1995).

113
Session Four: Wildlife and Habitat Conservation
The Bay of Fundy could only be considered as a source of mortality for the sandpipers if theywere unable to deposit, i.e. store, the sufficient levels of fat during their stay in Fundy. It is these storedepidermal lipids accumulated by the birds which fuel the non-stop migratory flight over the AtlanticOcean between the Maritime Provinces and wintering grounds in the Guyanas in northeastern SouthAmerica. However, all the available data indicate that, overall, Corophium densities remain high inboth Chignecto Bay and Minas Basin and the birds’ fresh weights also continue to attain high levelsprior to departure from Fundy. These data all suggest that the birds have not encountered any signifi-cant difficulties to deposit fat reserves in the Bay of Fundy during the southward migration. Therefore,since we know that the species is undergoing significant population declines in North America and thatthere appear to be no evident problems of food supply in the Bay of Fundy which might be impactingon the world’s population of this species, the observations of declining bill and wing lengths ofSemipalmated Sandpipers at Johnson’s Mills in Chignecto Bay suggest that problems may lie north orsouth of Fundy and within the species’ boundaries in the Western Hemisphere. Since the long-billedbirds appear to be the group most affected, it would appear that research in the birds’ easternmostbreeding areas (northern Quebec, Ontario and Manitoba) or wintering grounds in the Guyanas andBrazil (i.e. long-billed birds) would be the most promising regions to conduct studies which woulduncover the reasons for these severe population declines.
Acknowledgements
Nev Garrity, Julie Paquet and many volunteers (especially Paul Donahue and Teresa Wood)have assisted with capture, banding and data entry and analysis. Graham Daborn has always providedinteresting insights about the Bay of Fundy and Nancy Roscoe-Huntley did everything possible toensure the success of the 5th Bay of Fundy Science Workshop for which many of us are extremelygrateful. Richard Elliot has been a source of support since the beginnings of shorebird studies in theBay of Fundy.
References
Harrington, B. A. and R. I. G. Morrison.1979. Semipalmated Sandpiper migration in North America.In: Shorebirds in Marine Environments. F. Pitelka (Ed.). Studies in Avian Biology No. 2. Apublication of the Cooper Ornithological Society, Alien Press Inc., Lawrence, KS. 261 pp.
Howe, M. A., P. M. Geissler and B. A. Harrington. 1989. Population trends of North American shorebirdsbased on the International Shorebird Survey. Biological Conservation 49: 185–199.
Morrison, R. I. G. and P. W. Hicklin. 2001. Recent trends in shorebird populations in the AtlanticProvinces. In: Bird Trends, Number 8, Winter. J. Kennedy (Ed.). Canadian Wildlife Service,Environment Canada, Ottawa, ON. 52 pp.
Shepherd, P. C. F., V. A. Partridge and P. W. Hicklin. 1995. Changes in Sediment Types and InvertebrateFauna in the Intertidal Flats of the Bay of Fundy Between 1977 and 1984. Technical Report No.237, Canadian Wildlife Service, Atlantic Region, Sackville, NB. 165 pp.

114
Health of the Bay of Fundy: Assessing Key Issues
Table 1. The numbers of Semipalmated Sandpipers captured at Johnson’s Mills, 1981–2001 (n=31,792)
Year Banded and Measured
Banded Only
Banded and Weighed Only
1981 1,239 - - 1982 1,795 - - 1986 2,438 - - 1987 1,624 4,805 - 1988 - 9,738 - 1989 304 903 781 1997 1,800 - - 1998 1,604 - - 1999 1,600 - - 2000 932 - 313 2001 1,916 - -
11 years 15,252 15,446 1,094
Figure 1. The chronology of the migration of Semipalmated Sandpipers in the Bay of Fundy. The solidline represents the peak number of sandpipers roosting at Mary’s Point in Chignecto Bay over an 8-yearperiod (1978–1986) while the dotted line represents the average number over that time period.

115
Session Four: Wildlife and Habitat Conservation
Figure 2. Mean bill lengths of male and female Semipalmated Sandpipers. Locations are ordered fromwest to east. Data are taken from Harrington and Morrison (1979).

116
Health of the Bay of Fundy: Assessing Key Issues
Figure 3. Annual mean bill lengths of adult Semipalmated Sandpipers captured at Johnson’s Mills
Figure 4. Annual mean wing lengths of adult Semipalmated Sandpipers captured at Johnson’s Mills

117
Session Four: Wildlife and Habitat Conservation
Figure 5. Annual mean body mass of adult Semipalmated Sandpipers captured at Johnson’s Mills
118
Health of the Bay of Fundy: Assessing Key Issues
THE NATURE CONSERVANCY OF CANADA–UPPER BAY OF FUNDY PROJECT
Josette Maillet
The Nature Conservancy of Canada, Atlantic Region, Fredericton, [email protected]
Shepody and Chignecto Bays in New Brunswick and the Southern Bight of the Minas Basin inNova Scotia are characterized by extremely high tides, extensive mudflats, and the largest concentra-tion of salt marshes in the Bay of Fundy. Over 75 percent of the world population of SemipalmatedSandpipers (Calidris pusilla) leave their breeding grounds in Canada’s arctic and subarctic regions andfly non-stop to the upper Bay of Fundy, converging on the nutrient-rich mudflats. The inter-tidal andsub-tidal areas are undeeded and technically under the jurisdiction of the provinces. However, roostingbeaches and the adjacent upland habitat, critical to the shorebirds at high tide, are under private owner-ship and have strong recreation and development potential.
The Nature Conservancy of Canada (NCC) is dedicated to the creation of nature preserves andthe conservation of ecologically significant lands through outright purchase, donation, and conserva-tion agreements. NCC, in co-operation with the Canadian Wildlife Service, the New Brunswick De-partment of Natural Resources and Energy and the Nova Scotia Department of Natural Resources, isworking with willing landowners to secure critical shoreline properties throughout the Chignecto andShepody Bays and the Southern Bight of the Minas Basin. Three hundred acres of habitat have beensecured and efforts to secure additional land are ongoing.
The NCC uses a strategic, science-based approach to land securement which defines conserva-tion goals and measures of success across multiple geographic scales. Conservation planning is appliedto individual properties, as well as property assemblages (sites) that are ecologically connected, andsite assemblages (portfolios) within a common environmental zone (ecoregion). The initial phase ofthe process is developing an Ecoregional Plan called a Conservation Blueprint. It establishes biodiversityconservation priorities across jurisdictional, administrative and ownership boundaries.
The next phase is the design of a Site Conservation Plan. The goal of Site Conservation Plan-ning is the maintenance or enhancement of the long-term survival of species and habitats (conservationtargets) through science-based strategic planning. It is based on the Five-S Framework for Site Conser-vation designed by the Conservation Science Division of the The Nature Conservancy (TNC), oursister organization in the United States. The process evaluates information about a particular site, i.e.systems (conservation targets), stresses and sources of stress resulting in two specific products – con-servation strategies and measures of conservation success, all of which are documented in a completedplan. This approach to land conservation allows a more comprehensive examination of sites and poten-tial threats, in order to implement more effective and efficient conservation efforts.

119
Session Four: Wildlife and Habitat Conservation
The first Site Conservation Plan for the NCC Atlantic Regional office is currently under way forthe upper Bay of Fundy, with a focus on shorebirds and their habitat requirements as conservationtargets. It is anticipated that other Site Conservation Plans will be undertaken for priority conservationareas identified through the ecoregional planning process.

120
Health of the Bay of Fundy: Assessing Key Issues
BIRD COMMUNITIES OF BAY OF FUNDY COASTAL WETLANDS
Al Hanson
Canadian Wildlife Service, Environment Canada, Sackville, NB. [email protected]
Volunteers and Canadian Wildlife Service (CWS) staff are currently conducting a study to de-termine the abundance and diversity of birds using salt marshes and coastal wetlands in the Maritimes.A second objective is to identify habitat factors that explain the observed patterns of distribution.
The loss of coastal wetlands (salt marshes, barachois ponds, brackish marshes) in Atlantic Canadais one of the most severe and publicized cases of wetland loss in Canada. It has been estimated that 65percent of salt marshes have been lost in the upper Bay of Fundy. Recently, there has been much publicsupport for the conservation and restoration of coastal wetlands, including salt marshes in the Maritimes.However, there is little information on how these activities should be directed in order to conserve andrestore wildlife populations that use these habitat types.
Whereas the loss of coastal wetlands has been severe, there may have also been declines inpopulations of birds that are dependent on coastal wetlands. Bird surveys conducted for this projectprovide valuable information required for updated population estimates. Special wetland conservationand restoration projects may be required for species such as Willet (Catoptrophorus semipalmatus) andNelson’s Sharp-tailed Sparrow (Ammodramus nelsoni) whose populations may only be 2,500 and 750pairs respectively in the Maritimes (Erskine 1992).
The abundance and species of birds using coastal wetlands is determined using standard meth-ods developed by the Audubon Society for synoptic surveys of salt marshes in the US Gulf of Maine.Using the same methodology will allow for valid comparisons between the Maritimes and New Eng-land. CWS staff collect habitat data on local and landscape scales. Local data include information onwetland size, vegetation, number and size of ponds, and frequency of flooding. Landscape-level datainclude information on adjacent natural features such as estuaries, rivers, mudflats, as well as distur-bance features such as dwellings and roads. Preliminary results suggest that Nelson’s Sharp-tailedSparrows will use dykeland habitats, especially if large patches of Spartina pectinata are present. Habi-tat for Willets appears to be limited in many areas of the Bay of Fundy.
Reference
Erskine, A. J. 1992. Atlas of Breeding Birds of the Maritime Provinces. Nimbus Publishing, Halifax.
121
Session Four: Wildlife and Habitat Conservation
MONITORING OF COMMON LOON (Gavia immer) BREEDING SUCCESSON WOLFE LAKE, FUNDY NATIONAL PARK
Douglas Clay1, Shirley Butland2, Ewan Eberhardt2 and Joseph Kerekes3
1 135 Edgehill Dr. NW, Calgary, Alberta T2A 3W5 (formerly Fundy National Park)2 Fundy National Park, Parks Canada, Alma, NB
3 Canadian Wildlife Service, Environment Canada, Dartmouth, NS. [email protected]
The reproductive success of the Common Loon (Gavia immer) on Wolfe Lake (22 ha) has beencontinuously monitored since 1989. A pair of breeding loons has regularly occupied the lake in the lasttwo decades (Clay and Clay 1997). Eggs were laid in 12 years, chicks hatched in 11 years and theyoung fledged in 9 years during the 14 years of the study. Two young fledged in 7 years and one youngfledged on two occasions. Two adult loons and a juvenile were banded on Wolfe Lake in 1995. Oneadult female was recaptured in both 1996 and 1997 and a new juvenile was banded in those years (NeilBurgess, CWS, pers. com).
There are no lakes larger than Wolfe Lake within a 20-km distance from the park boundary. Itwas noted that all suitable and even marginal habitats (smaller lakes) are occupied by loons in thesummer in the Bay of Fundy areas of New Brunswick and Nova Scotia (Kerekes 1999).
This small oligotrophic lake (total phosphorus concentration 5-7 Fmg L-1) does not have enoughfish to support a family of loons with two young. It has been shown that for oligotrophic lakes, such asthat of Wolfe Lake, at least 40 ha in area is required to support a pair of loons with one chick to fledgingon a sustained basis (Kerekes 1990; Kerekes et al. 1994).
However, small oligotrophic lakes (–20 ha) are known to support loons to fledging if otherlakes are near by (e.g., Kejimkujik National Park), or close to the sea (e.g., Terra Nova National Park)where the adults can fly regularly to feed (Kerekes et al. 2000). Apparently Wolfe Lake is an example ofa small lake not producing enough fish that may support young loons to fledging where the adults areusing other lakes or the sea to supplement their nutritional requirements.
References
Clay, D. and H. Clay. 1997. Reproductive success of the Common Loon (Gavia immer), on a smalloligotrophic lake in Eastern Canada. Can. Field Nat. 111(4): 586–590.
Kerekes, J. 1990. Possible correlation of Common Loon population with the trophic state of waterbody. Internat. Verein. Limnol. Verh. 24: 349–353.
Kerekes, J. 1999. The loons the of Bay of Fundy. Pages 27–28. In: Proceedings of the 3rd Bay of FundyScience Workshop, “Understanding change in the Bay of Fundy Ecosystem”, Mount Allison

122
Health of the Bay of Fundy: Assessing Key Issues
University, Sackville, New Brunswick, April 22-24, 1999. J. Ollerhead, J., P. W. Hicklins, P. G.Wells and K. Ramsey (Eds.). Environment Canada - Atlantic Region. Occasional Report No.12. Environment Canada, Dartmouth, NS.
Kerekes, J., R. Tordon, A. Nieuwburg. and L. Risk. 1994. Fish Eating Bird Abundance in OligotrophicLakes in Kejimkujik National Park, Nova Scotia, Canada. In: J. Kerekes and B. Pollard (eds.).Proc. Symp. Aquatic Birds in the Trophic Web of Lakes. Sackville, N.B., Canada. August 19-22, 1991. Hydrobiol. 279/280: 57-61.
Kerekes, J., R. Knoechel, P. M. Ryan and G. Stroud. 2000. Common Loon breeding success in oligotrophiclakes in Newfoundland, Canada. Verh. Internat. Verein. Limnol. (Proceedings of the Interna-tional Association of Theoretical and Applied Limnology) 27: 171–174.
123
Session Four: Wildlife and Habitat Conservation
WILDLIFE HABITAT STEWARDSHIP IN THEAGRICULTURAL LANDSCAPE OF NOVA SCOTIA
James Ferguson
Wildlife Division, Department of Natural Resources, Kentville, NS.
Beginning with European settlement and continuing over approximately 400 years, wildlifeand their habitats have been impacted by a variety of human development activities. Intensive agricul-ture, urban expansion, and other development pressures have dramatically altered the landscape ofNova Scotia. For example, approximately 60% of the original salt marsh habitat in Kings County hasbeen dyked and drained since the early 1600s, 50% of the Annapolis Valley in Kings County has beencleared for agriculture production, and an estimated 80% of the freshwater wetlands of the area havebeen lost.
Currently the Wildlife Division, Nova Scotia Department of Natural Resources is co-operatingwith other government and non-government organizations involved in the agricultural and wildlifecommunities to develop a strategy to promote the stewardship of wildlife habitat within the agriculturallandscape of Nova Scotia. Some of the information in this strategy will be relevant to the Bay of Fundyand could be used to address important agriculture/habitat issues that relate directly or indirectly to theissues facing the Bay.

124
Health of the Bay of Fundy: Assessing Key Issues
WETLAND AND RIPARIAN EDGE CONSERVATION IN THEAGRICULTURAL LANDSCAPE
Reg B. Newell
Wildlife Division, Department of Natural Resources, Kentville, NS. [email protected]
Wetlands and riparian edges are an intricate and important component to the agricultural land-scape. Riparian edges are generally natural areas at the edges of wetlands/waterways where upland andaquatic processes/vegetation meet and, to some extent, overlap. In addition to providing essential habi-tats for wildlife species (both plants and animals), wetlands and riparian edges act as filters and watercontrol structures to reduce surface water contamination, erosion, flooding, and water runoff. The re-moval of wetlands or riparian edges from the ecosystem may result in the loss of wildlife habitat,increased erosion, increased surface water contamination, as well as increased flooding and more rapidwater runoff.
Since 1989, the Eastern Habitat Joint Venture (EHJV), a partnership of government and non-government agencies, has been involved in wetland conservation throughout Nova Scotia. Althoughthere are many partners in the NS-EHJV, the central core consists of the Canadian Wildlife Service, theNova Scotia Department of Natural Resources, Ducks Unlimited, Wildlife Habitat Canada, and theNature Conservancy of Canada. Since 1997, the NS-EHJV has been focussing much of its conservationeffort on the agricultural landscape throughout the province. One of these efforts has been a riparianfencing project that is designed to assist livestock producers in their efforts to fence livestock out ofwetlands and waterways. Between 1997 and 2001, over 1,700 acres of wetland/riparian edges havebeen protected on 60 sites in 10 counties. Concurrently, Ducks Unlimited, one of the NS-EHJV part-ners, has been delivering a small marsh project designed to re-establish wetlands in the agriculturallandscape. Eighty-two (82) projects have been completed with 455 acres of wetlands constructed through-out the agricultural regions of the province. Each of these projects has successfully protected and re-stored wildlife habitat, however, as they are spread over the entire province, they are not concentratedenough to have a major impact on water quality or to provide connective wildlife corridors. In anattempt to address this concern, several government and non-government organizations have formedthe Kings Agricultural Wetland Conservation Initiative (KAWCI). The partnership includes the ValleyWatershed Stewardship Association (VWSA), Friends of the Cornwallis River Society, Municipality ofKings, NS-Eastern Habitat Joint Venture (including the Nova Scotia Department of Natural Resourcesand Ducks Unlimited Canada), and the agricultural community along with the several other potentialpartners.
Kings County was selected for the pilot project as it is the most intensively farmed county inNova Scotia. Fifty-eight percent (58%) of the agricultural activities in the county are in the agriculturaldistrict located on the valley floor and includes the watersheds of the Cornwallis, Canard, Habitant, andPereau Rivers. Both the agriculture effort and the greatest population densities are centred around thesefour east-flowing rivers which ultimately enter in the Bay of Fundy through the Southern Bight of the
125
Session Four: Wildlife and Habitat Conservation
Minas Basin, a Ramsar site and a Western Hemisphere Shorebird Reserve. Although residential, indus-trial, and agricultural activities all affect these watersheds, this project focusses on assisting the agricul-tural community to reduce their impact. Irrigation, pesticide and nutrient applications, livestock accessto waterways, and agricultural waste runoff are common practices in these watersheds that can have anegative impact on both wildlife habitat and water quality. KAWCI partners have developed a multi-faceted approach to address these issues at the watershed level. This initiative, which will focus on theeastern flowing watersheds of Kings County, is primarily an incentive project with three different com-ponents: riparian fencing, riparian leasing and small marsh/constructed wetlands.
Riparian Fencing
This component is designed to encourage livestock producers to fence off livestock access towetlands (including salt marshes) and waterways and to leave a buffer strip (riparian edge) aroundthese areas. The minimum setback is 5 m. The fencing projects, including alternative water systems andstream crossings, is a cost sharing effort in which the partners in KAWCI will pay up to 40% of theinitial total cost of an approved project (maximum contribution is $5,000 per project). The producer isexpected to contribute the remaining 60% either financially or in kind and to maintain the fencing for15 years. This project will be undertaken in close association with the NS-EHJV Stewardship Coordi-nator and will follow the guidelines and agreements currently used by the NS-EHJV in their RiparianManagement Project.
Riparian Leasing
This component focusses primarily on crop farmers in the Pereau, Cornwallis, Canard, Habitant,and Gaspereau watersheds. Crop producers along the waterways will be approached with an offer tolease their riparian lands for 10 years at a reduced rate (much of the riparian edge, in terms of farming,is marginal land). The minimum setback from the stream/river edge will be 5 m (1 acre of a 5 m setbackis essentially 1 km). The setback distances will be established using semi-permanent markers and thelandowner will sign an agreement to allow the natural vegetation to reclaim the area. In addition, theagreement would allow VWSA personnel and volunteers to re-introduce natural vegetation and nativetree species and to monitor the area on a regular basis. (The landowner will still retain access to thewaterways for irrigation purposes.) Farmers/landowners would be paid in full on signing the agree-ment. This method provides the farmer/landowner with a more appealing financial offer and eliminatesthe need for yearly tracking and payments. The VWSA will hold the lease agreements.
Small Marsh/Constructed Wetland Component
(For this component, the Ducks Unlimited Canada will take the lead. DUC is one of the leadingagencies in Atlantic Canada in the development of small marshes and constructed wetlands.)
This component is designed for the enhancement, restoration and construction of small marsh-lands, and the establishment of constructed wetlands throughout the five Kings County watersheds.
126
Health of the Bay of Fundy: Assessing Key Issues
Ducks Unlimited Canada (one of the NS-EHJV partners) has been providing a Small Marsh Projectthroughout Nova Scotia for several years that involves the restoration, enhancement or development ofsmall marshes under 5 ha in size (generally in agricultural settings). Generally, DUC absorbs most ofthe cost of the construction and the landowner signs a management agreement to maintain the area aswildlife habitat for 20+ years. Although the marshes are not normally large enough for irrigation pur-poses, they can and have been used as a water supply for livestock. In addition, KAWCI will work withDUC, the NS-EHJV and crop producers in Kings County to install several experimental irrigationponds/marshes that can provide both wildlife habitat and a source of irrigation water.
In Kings County, there are a variety of uses for both small marshes and constructed wetlands inaddition to providing water sources for livestock and treating wastewater from intensive livestockoperations. Ducks Unlimited Canada has already been involved in the enhancement and restoration ofa wetland in King’s County to provide an emergency holding area should the holding lagoons fail tocontain the liquid manure. Although not designed to handle large volumes of waste, this type of systemmay be able to contain the waste material long enough to prevent a major contamination of the river/watershed. Intensive livestock producers will be encouraged with financial incentives to develop andmaintain constructed wetlands, where possible, to treat wastewater runoff or as emergency holdingareas.
Crop producers will also be encouraged with financial incentives to construct wetlands/holdingponds to help treat the runoff from their fields. Much of the crop land in Kings County is tile drained.These tiles are designed to drain the water into ditches that are connected to the waterways. If thedrainage ditches were altered somewhat so that they ran through a constructed wetland to a holdingpond, the potential runoff of contaminants may be reduced to a level that the water could be reused forirrigation. Constructed wetlands for assisting in the treatment of potential runoff would also comple-ment one of the agriculture industry’s current endeavours to address runoff concerns from a nutrient(fertilizer and manure) management perspective.
By focussing conservation efforts on a relatively small area such as the watersheds on the valleyfloor of Kings County, there is the potential to not only restore and protect wildlife habitat in theagricultural landscape, but to also improve water quality in the river systems. KAWCI currently hassome funds to undertake this project but additional funds and partners are required to re-establishsufficient riparian edges/wetlands to have a major impact on water quality.
127
Health of the Bay of Fundy: Assessing Key Issues
Session Five
CONTAMINANTS ANDECOSYSTEM HEALTH
Chairs: Thierry Chopin, Centre for Coastal Studies andAquaculture, Saint John, New Brunswick
and
Larry Hildebrand, Sustainable Communities andEcosystems Division, Environment Canada

128
Health of the Bay of Fundy: Assessing Key Issues
129
Session Five: Contaminants and Ecosystem Health
AN EMPIRICAL MODEL OF MERCURY CYCLINGIN PASSAMAQUODDY BAY
Elsie M. Sunderland and Frank A. P. C. Gobas
School of Resource and Environmental Management, Simon Fraser University, Burnaby, [email protected] and [email protected]
Abstract
We have collected data on the concentrations of mercury in water, sediment and biota inPassamaquoddy Bay. Our field research suggests that the majority of mercury is contained within thesediment compartment. Production of methyl mercury, the form of mercury that is readily accumulatedin organisms, also occurs primarily in the sediment phase. Thus, processes taking place at the sedi-ment-water interface are extremely important as a vector for mercury entry into the food chain. Pastresearch has demonstrated that a number of environmental factors can significantly influence thespeciation and distribution of mercury in sediments, which affects the rate of mercury accumulation inorganisms. Our research looks at several of these variables and examines their importance as controlson the speciation and mobility of mercury in Bay of Fundy sediments. Information on the fate andbioaccumulation of mercury in Passamaquoddy Bay is used to develop our understanding of thebioaccumulation of mercury in the larger Bay of Fundy food web, currently being investigated byresearchers at the Department of Fisheries and Oceans at the Bedford Institute of Oceanography (seeDalziel et al. poster session, this volume).
Introduction
Mercury is an ongoing environmental problem in the Northeast United States and Eastern Canada.Despite reductions in mercury emission of more than 50% since the 1970s (Sunderland and Chmura2000), there is no evidence that concentrations in aquatic organisms have fallen. Consumption advisoriesfor human populations eating fish are in place throughout the Northeastern United States and EasternCanada due to elevated levels of mercury (NESCAUM et al. 1998), and sensitive sub-populations suchas Aboriginal communities and pregnant women that consume large quantities of fish are believed tobe at risk.
The dynamics and speciation of mercury in the sediment compartment are critical for under-standing its overall fate and accumulation in the food web. The concentration of mercury in coastalsediments is, in general, several-fold greater than that in water, thus the overall reservoir of mercurycontained in the sediment compartment is relatively larger (Benoit et al. 1998; Gill et al. 1999). Thismeans that the dynamic processes occurring in the sediment phase (e.g., resuspension, settling andburial) are critical in determining the rate of response of coastal systems to changes in total mercuryloading, particularly those with a relatively short water-residence time. Sediments are also the principalsite of methyl mercury (MeHg) production, the form of mercury that bioaccumulates in the food web
130
Health of the Bay of Fundy: Assessing Key Issues
(Mason et al. 2000; Benoit et al. 1999a and 1999b). It has been postulated that in estuarine systems,methyl mercury enters the food chain through benthic organisms and is a function of the concentrationsin sediments and pore waters (Lawrence et al. 1999; Lawrence and Mason 2000; Lawson and Mason1998). Thus, the geochemical conditions that facilitate conversions between inorganic and organicmercury in estuarine sediments are also important for understanding how mercury enters the base of thefood web.
We present seasonal, spatial and stratigraphic data on the bulk phase and dissolved concentra-tions of total and methyl mercury in sediments from Passamaquoddy Bay and the outer Bay of Fundy.Our long-term objective is to identify and quantify the dominant environmental controls on speciationand distribution of mercury in Bay of Fundy sediments to estimate the fraction of mercury available foruptake into the food web, and ultimately incorporate this information into environmental models. Themajority of data presented in this study were collected in Passamaquoddy Bay, a coastal embaymentlocated on the southwestern coast of New Brunswick, near the mouth of the Bay of Fundy.
Analytical Methods
Bulk phase sediment samples for total mercury analysis were digested in 5:2 nitric-sulfuric acidsolution to ensure complete digestion of organic matter. Under cleanroom conditions, samples wereoxidized with bromine monochloride (BrCl). The excess oxidant was neutralized with 10% hydroxy-lamine hydrocholoride immediately prior to analysis. Aqueous samples were digested with BrCl atleast 12 hours prior to analyses and then neutralized with equivalent volume hydroxylamine hydrochlo-ride immediately before running. All samples were then reduced by tin chloride, purged, and trapped ongold in elemental form. Quantification was by dual-stage gold amalgamation/cold-vapor atomic fluo-rescence spectroscopy (CVAFS). The procedure used was based on EPA Method 1631 (U.S. Govern-ment Institutes 1996), Gill and Fitzgerald (1987) and Bloom and Fitzgerald (1988). MeHg was determinedby steam distillation, aqueous phase ethylation using sodium tetraethylborate, purging onto tenax, gaschromatography separation and CVAFS detection following a technique modified from Bloom andFitzgerald (1988) and Horvat et al. (1993), developed by Branfireun et al. (1999).
Total Mercury (HgT)
A preliminary mass budget for total mercury in Passamaquoddy Bay (Figure 1) indicates that>95% of the mercury in this system is contained in the sediment compartment. The estimates presentedare annual averages based on measured mercury concentrations in water and sediments, hydrodynamicdata from the major freshwater tributaries, incoming tidal waters and atmospheric monitoring stations(Dalzeil 1992 and 1995; Dalzeil et al. 1998; Gregory et al. 1993; Showell and Gaskin 1992).
Presently, there are no large point sources of mercury in Passamaquoddy Bay. However, in the1970s several pulp and paper and one chlor-alkali facility discharged mercury into the catchments ofthe St. Croix Estuary (Fink et al. 1976). Present local sources of mercury include diffuse dischargesfrom municipal water, golf courses and agriculture, as well as atmospheric deposition originating from

131
Session Five: Contaminants and Ecosystem Health
both local and long-range sources of contamination. Much of the mercury associated with freshwaterdischarges into Passamaquoddy Bay is expected to be the result of leaching of atmospherically depos-ited mercury from the major river catchments.
Concentrations of HgT in the surface sediments are enriched in areas with a greater proportionof muddy fine-grained sediments and low in sandy erosional regions, matching depositional areas pre-dicted by hydrodynamic and sediment transport models developed for the region (Greenberg and Amos1983; Greenberg et al. 1997). Maximum concentrations (>100 ppb) are found at the head of the St.Croix River, likely due to the presence of residual contamination associated with historical dischargesof mercury from a chlor-alkali facility that closed in the 1970s and present day anthropogenic dis-charges filtering through the river catchments (Figure 2). Overall, the HgT concentration distribution inthese sediments indicates that this is not a highly impacted system, as levels in sediments are approxi-mately an order of magnitude lower than contaminated systems discussed in the literature (e.g., Balti-more Harbour, Lavaca Bay, Scheldt Estuary). The percentage of fine-grained sediment solids is stronglycorrelated with the organic carbon content of the surficial sediments (Loring et al. 1998), and accord-ingly there is a strong and significant correlation between total organic carbon content and HgT.
Methyl Mercury (MeHg)
Bulk phase methyl mercury concentrations showed both spatial (Figure 3) and seasonal varia-tion in Passamaquoddy Bay. Methyl mercury concentrations are enriched at the head of the St. CroixRiver, but relatively homogenous on a seasonal basis in the well-mixed areas of Passamaquoddy Bay.Similar to the distribution of total mercury, areas with fine-grained, organic-rich sediments showed thehighest concentrations. Accordingly, both organic carbon and total mercury are significantly correlatedwith methyl mercury concentrations in the bulk phase sediments. The redox potential of the surfacesediments and sulfide concentrations show much weaker relationships, indicating that these variablesmay not be the dominant controls on mercury speciation in Passamaquoddy Bay sediments.
Sediment Cores
The profile of methyl mercury in the upper 15 cm of sediments at various sampling stationsindicates that the mechanism of methyl mercury formation varies between the well-mixed and deposi-tional sites (Figure 4). At well-mixed sites, organic-rich anoxic “pockets” in the sediments appear to beintegrated within the oxic surface sediments of Passamaquoddy Bay (Figure 5). We hypothesize thatthe resulting geochemical environment provides an increased volume of sediments with the specificconditions required by sulfate reducing bacteria (the principal methylators of mercury) where methyla-tion can occur, resulting in an increased overall mass of MeHg produced in this system. Mixing of thesurface sediments in Passamaquoddy Bay as the result of the dynamic tidal forces in the Fundy regionalso appears to increase the depth of the active sediment layer in this system.

132
Health of the Bay of Fundy: Assessing Key Issues
Hypotheses/Conclusions
Mixing of benthic sediments in Passamaquoddy Bay appears to increase the active sedimentlayer in this system to approximately 15 cm. Thus, there is a large reservoir of total mercury availablein the surface sediments that is integrated with incoming mercury from present-day sources. Given thatthe burial rate of sediments in the Bay is estimated to be on the order of 1 mm.yr-1, the time response ofthis system to lowered anthropogenic emissions of mercury is expected to be slow (Figure 6). In addi-tion, the physical mechanisms of mixing and resuspension of benthic sediments where methylation isoccurring in situ may provide a vector for methyl mercury entry into the food chain for organismsfeeding at the sediment-water interface and also for entry into the water column.
References
Benoit, J. M., C. C. Gilmour, R. P. Mason, G. S. Riedel, and G. F. Reidel. 1998. Behaviour of mercuryin the Patuxent River estuary. Biogeochemistry 40: 249–265.
Benoit, J., C. C. Gilmour, R. P. Mason, and A. Heyes. 1999a. Sulfide controls on mercury speciationand bioavailability to methylating bacteria in sediment pore waters. Environmental Science andTechnology 33: 951–957.
Benoit, J. M., R. P. Mason, and C. C. Gilmour. 1999b. Estimation of mercury-sulfide speciation insediment pore waters using octanol-water partitioning and implications for availability to meth-ylating bacteria. Environmental Toxicology and Chemistry 18: 2138–2141.
Bloom, N. and W. F. Fitzgerald. 1988. Determination of volatile mercury species at the picogram levelby low-temperature gas chromatography with cold-vapor atomic fluorescence detection. AnalyticaChemica Acta 208: 151–161.
Branfireun, B., N. T. Roulet, C. A. Kelly, and J. W. M. Rudd. 1999. In situ stimulation of mercurymethylation in a boreal peatland: Toward a link between acid rain and methyl mercury contami-nation in remote environments. Global Biogeochemical Cycles 13: 743–750.
Dalziel, J. A. 1992. Reactive mercury on the Scotian Shelf and in the adjacent Northwest AtlanticOcean. Marine Chemistry 37: 171–178.
Dalziel, J. A. 1995. Reactive mercury in eastern North Atlantic and southeast Atlantic. Marine Chemis-try 49: 307–314.
Dalziel, J. A., P. A. Yeats, and B. P. Amirault. 1998. Inorganic Chemical Analysis of Major RiversFlowing into the Bay of Fundy, Scotian Shelf, and Bras d’Or Lakes. Canadian Technical Reportof Fisheries and Aquatic Sciences 2226. Department of Fisheries and Oceans, Dartmouth, NS.140 pp.
Fink, L. K. J., D. M. Pope, A. B. Harris, and L. L. Schick. 1976. Heavy Metal Levels in SuspendedParticulates, Biota, and Sediments of the St. Croix Estuary in Maine. Land and Water Re-

133
Session Five: Contaminants and Ecosystem Health
sources Institute, University of Maine at Orono, Orono, ME. 59 pp.
Gill, G. A., N. S. Bloom, S. Cappellino, C. T. Driscoll, C. Dobbs, L. McShea, R. Mason, and J. W. M.Rudd. 1999. Sediment-water fluxes of mercury in Lavaca Bay, Texas. Environmental Scienceand Technology 33: 663–669.
Gill, G. A. and W. F. Fitzgerald. 1987. Picomolar mercury measurements in seawater and other materialusing stannous chloride reduction and two-stage gold amalgamation with gas phase detection.Marine Chemistry 20: 227–243.
Greenberg, D., J. Shore, and Y. Shen. 1997. Modelling tidal flows in Passamaquoddy Bay. pp. 58–64.In: Coastal Monitoring and the Bay of Fundy: Proceedings of the Maritime Atlantic EcozoneScience Workshop. M. D. B. Burt and P. G. Wells (Eds.). Huntsman Marine Science Centre, St.Andrews, NB.
Greenberg, D. A. and C. L. Amos. 1983. Suspended sediment transport and deposition modeling in theBay of Fundy, Nova Scotia – A region of potential tidal power development. Canadian Journalof Fisheries and Aquatic Sciences (Suppl. 1) 40: 20–34.
Gregory, D., B. Petrie, F. Jordan, and P. Langille. 1993. Oceanographic, geographic and hydrologicalparameters of Scotia-Fundy and southern Gulf of St. Lawrence inlets. Canadian Technical Re-port of Hydrographic Ocean Sciences 143. Department of Fisheries and Oceans, Dartmouth,NS. 248 pp.
Horvat, M., L. Liang, and N. S. Bloom. 1993. Comparison of distillation with other current isolationmethods for the determination of methyl mercury compounds in low level environmental sam-ples. Analytica Chemica Acta 282: 153–168.
Lawrence, A. L. and R. P. Mason. 2000. Factors controlling the bioaccumulation of mercury and me-thyl mercury by the estuarine amphipod, Leptocheirus plumulosus. Environmental Pollution111: 199–208.
Lawrence, A. L., K. M. McAloon, R. P. Mason, and L. M. Mayer. 1999. Intestinal solubilization ofparticle associated organic and inorganic mercury as a measure of bioavailability to benthicinvertebrates. Environmental Science and Technology 33: 1871–1876.
Lawson, N. M. and R. P. Mason. 1998. Accumulation of mercury in estuarine food chains. Biogeo-chemistry 40: 235–247.
Loring, D. H., T. G. Milligan, D. E. Willis, and K. S. Saunders. 1998. Metallic and Organic Contami-nants in Sediments of the St. Croix Estuary and Passamaquoddy Bay. Canadian Technical Re-port of Fisheries and Aquatic Sciences 2245. Department of Fisheries and Oceans, Dartmouth,NS. 38 pp.
Mason, R. P., J.-M. Laporte, and S. Andres. 2000. Factors controlling the bioaccumulation of mercury,methyl mercury, arsenic, selenium, and cadmium by freshwater invertebrates and fish. Archivesof Environmental Contamination and Toxicology 38: 283–297.
NESCAUM, NEWMOA, NEIWPCC and EMAN. 1998. The Northeast States and Eastern CanadianProvinces Mercury Study: A framework for action. Tatsutani, M. (Ed.). Northeast States/East-

134
Health of the Bay of Fundy: Assessing Key Issues
ern Canadian Provinces, Portland, ME.
Showell, M. A. and D. E. Gaskin. 1992. Partitioning of cadmium and lead within seston of coastalmarine waters of the western Bay of Fundy. Archives of Environmental Contamination andToxicology 22: 322–333.
Sunderland, E. M. and G. L. Chmura. 2000. An inventory of historical mercury pollution in MaritimeCanada: Implications for present and future contamination. The Science of the Total Environ-ment 256: 39–57.
U.S. Government Institutes. 1996. United States Environmental Protection Agency methods and guid-ance for analysis of water. CD-ROM compilation of analytical methods. Method 7131: Analy-sis of metal samples by furnace atomic absorption (GFAA). Method 1632: Analysis of arsenicby hydride generation GFAA. Method 1631: Mercury in water by oxidation, purge and trap andcold vapor atomic fluorescence spectrometry. Rockville, MD.
Figure 1. Preliminary mass budget for HgT in Passamaquoddy Bay
Sediment (1 760 000g)
Direct Atmospheric Inputs ~ 6 g.d-1
Rivers ~ 24 g.d-1
Tides ~ 407 g.d-1
Burial ~ 32 g.d-
1
Outflow~ 497 g.d-1
Volatilization<1 g.d-1
(Annual Averages)Buried Sediment
Water (860 g)
Mixed Layer~ 0.15 m
Resuspension/
Settling
Diffusion
Sediment (1 760 000g)
Direct Atmospheric Inputs ~ 6 g.d-1
Rivers ~ 24 g.d-1
Tides ~ 407 g.d-1
Burial ~ 32 g.d-
1
Outflow~ 497 g.d-1
Volatilization<1 g.d-1
(Annual Averages)Buried Sediment
Water (860 g)
Mixed Layer~ 0.15 m
Resuspension/
Settling
Diffusion

135
Session Five: Contaminants and Ecosystem Health
Figure 2. Spatial distribution of total mercury (HgT) in Passamaquoddy Bay
0 10Scale in Kilometers
Passamaquoddy Bay
<10
<10
<10
N.B., Canada
Maine, USA
8 45 82 120 157
HgT (ng.g-1 dw)
St. CroixEstuary
Deer Island
<10<10
Bay of Fundy
0 10Scale in Kilometers
0 10Scale in Kilometers
Passamaquoddy Bay
<10
<10
<10
N.B., Canada
Maine, USA
8 45 82 120 157
HgT (ng.g-1 dw)
8 45 82 120 1578 45 82 120 157
HgT (ng.g-1 dw)
St. CroixEstuary
Deer Island
<10<10
Bay of Fundy
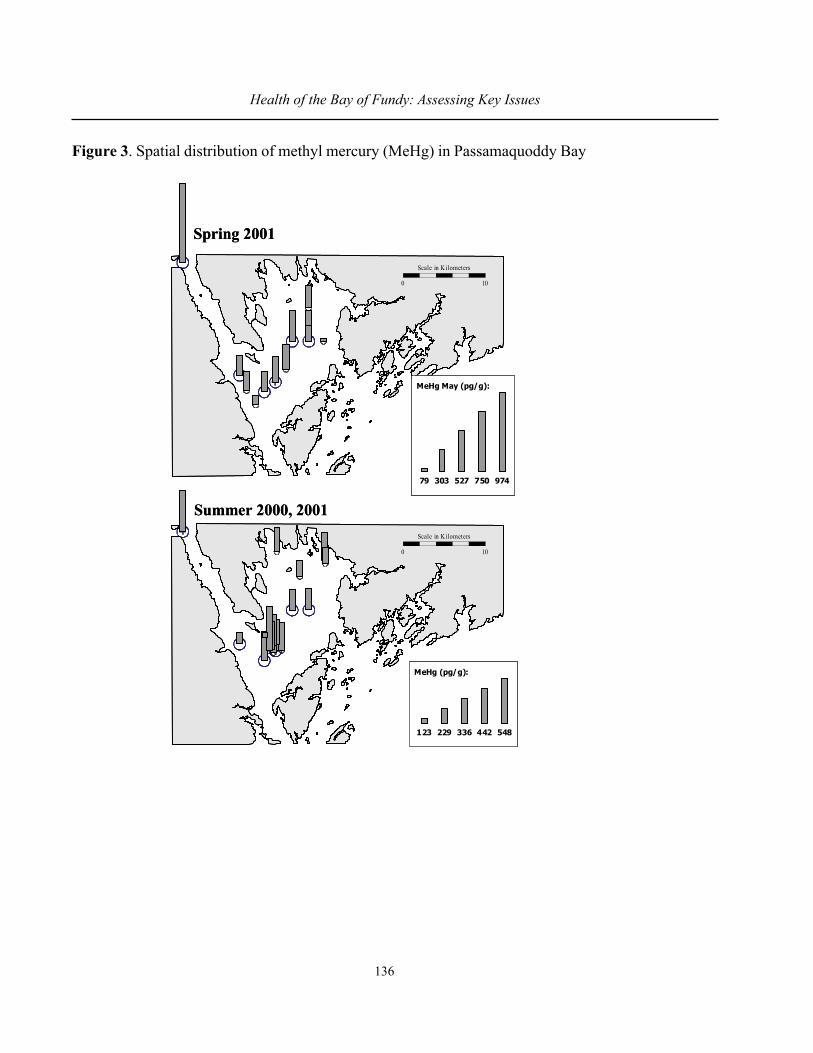
136
Health of the Bay of Fundy: Assessing Key Issues
Figure 3. Spatial distribution of methyl mercury (MeHg) in Passamaquoddy Bay
0 10
Scale in Kilometers
MeHg May (pg/g):
79 303 527 750 974
Spring 2001
0 10
Scale in Kilometers
MeHg (pg/g):
123 229 336 442 548
Summer 2000, 2001
0 10
Scale in Kilometers
MeHg May (pg/g):
79 303 527 750 974
Spring 2001
0 10
Scale in Kilometers
MeHg (pg/g):
123 229 336 442 548
Summer 2000, 2001

137
Session Five: Contaminants and Ecosystem Health
Figure 4. Stratigraphic profile of total and methyl mercury in push cores from contrasting depositionaland well-mixed sediments from the St. Croix River and Passamaquoddy Bay
Figure 5. Conceptual model of the effects of mixing on a) the depth of the active sediment layer and b)the volume of sediment suitable for methyl mercury production
MeHg (ηg/g)
0
2
4
6
8
10
12
14
0 25 50
HgT (ηg/g)
0
2
4
6
8
10
12
14
0.00 0.20 0.400
2
4
6
8
10
12
14
0.0% 0.5% 1.0%
MeHg/HgT (%)
Dep
th (c
m)
Middle of Bay (Well Mixed)
0
2
4
6
8
10
12
14
16
0 500 10000
2
4
6
8
10
12
14
16
0.00 1.00 2.000
2
4
6
8
10
12
14
16
0.0% 1.0% 2.0%D
epth
(cm
)
Upper Estuary (Depositional Area)
System 1 – Two Layer Model
Sed L1
Sed L2
Depth of Active Sediment Layer
System 2 – Mixed
Water
Oxic
Anoxic
Water
Interface
Methylation Zone
Anoxic
InterfaceOxic-Transitory
Org. C Rich (ANOXIC) Pockets
3-5 cm 12-15 cm
System 1 – Two Layer Model
Sed L1
Sed L2
Depth of Active Sediment Layer
System 2 – Mixed
Water
Oxic
Anoxic
Water
Interface
Methylation ZoneMethylation Zone
Anoxic
InterfaceOxic-Transitory
Org. C Rich (ANOXIC) Pockets
3-5 cm 12-15 cm

138
Health of the Bay of Fundy: Assessing Key Issues
Figure 6. Hypothesized effects of mixing on the response time of sediments and biota from PassamaquoddyBay to changes in total mercury inputs, where present and past inputs are integrated throughout theactive sediment layer resulting in a large lag time between ambient concentrations and present-dayinputs. Ongoing research will forecast the changes in mercury concentrations in the sediments andbiota in response to variations in inputs through the application of a marine mercury cycling model.
1900 2000
Regional HgEmissions
2100
Ambient Concentrations
Potential Lag TimeIntegration of Inputs
In Active Layer (15 cm)Removal via BurialSmall (0.1 cm.yr-1)
1900 2000
Regional HgEmissions
2100
Ambient Concentrations
Potential Lag TimeIntegration of Inputs
In Active Layer (15 cm)Removal via BurialSmall (0.1 cm.yr-1)
139
Session Five: Contaminants and Ecosystem Health
MATHEMATICAL MODELS TO ESTIMATE THE FRESHWATER ANDCONTAMINATION DISCHARGE TO COASTAL AREAS DUE TO
ANTHROPOGENIC ACTIVITIES
Ghosh A. Bobba
National Water Research Institute, Environment Canada, Burlington, ON. [email protected]
Abstract
Virtually every surface water in coastal watersheds, including rivers, lakes, wetlands, and estu-aries, interacts with adjacent subsurface water. This interaction affects the water quality and quantity inboth surface water and subsurface water. Subsurface water and surface water interaction affects chem-istry, especially acidity, temperature, dissolved solids oxygen, and reduction-oxidation potential. Asland and water resource development increases in coastal watersheds, it is becoming readily apparentthat subsurface water and surface water interaction must be considered in establishing water manage-ment policies. This interaction can take many forms, but the most common interactions are betweensubsurface water and stream water, lakes, and wetlands. In coastal areas, interactions between subsur-face water and seawater occur. All these interactions occur in the Bay of Fundy and other coastal areasof Canada.
There are a wide range of reasons and applications for the study of subsurface water relation-ships in the coastal zone. This diversity, in combination with the range of disciplines and the time andspace scales involved, complicate the use of data for purposes other than those envisioned by theoriginal investigator. The challenge is particularly great in the case of local type or case studies de-signed for global or regional extrapolation since errors or inappropriate assumptions will be greatlymagnified. Mathematical models have a wider range of application and are the concern of this paper.Due to the complex nature of the problem, each of these mathematical models is based on certainsimplifying assumptions and approximations. This paper examines the approaches of different types ofnumerical models, and presents the results of application of models to two different sites.
Introduction
Canada is a nation bordering on three oceans with a coastline of over 244,000 km (Figure 1). Anumber of major cities and highways border on the ocean. There are also hundreds of fishing villages,over one thousand small craft harbours, and numerous fishing plants along the coast. Many nativecommunities are also located close to the shore, near the marine natural resources upon which theytraditionally depend for food. Various industries, such as pulp and paper mills, coastal shipping, con-tainer ports, and oil refineries, are also located at the shore for obvious marine transportation advan-tages.

140
Health of the Bay of Fundy: Assessing Key Issues
In much of Canada, coastal impacts arising from higher ocean temperatures, changes to riverrunoff, and related changes to oceanography, circulation patterns, ice cover, and the hydrological cyclemay be more important than those resulting from sea level rise (Figures 1 and 3). However, the abilityto predict the impacts on natural ecosystems generally, and on marine ecosystems in particular, has notyet advanced very far, reflecting the complexities of those systems and the level of scientific ignorance.
Subsurface water contamination is becoming a common problem in coastal areas due to indus-trial and agricultural development (Figure 2). The contaminants travel to the coast with water and maycause considerable degradation of the coastal environment. Therefore, the discharge of contaminationconcentration at the beach face is an important parameter in assessing the impact of subsurface watercontamination on the coastal zone. In particular, since strong mixing with ambient coastal water willoccur once the contaminant enters the coastal area, the exit concentration at the breakthrough point willbe higher than elsewhere in the coastal zone. That is, for coastal ecosystems, these points likely presentthe worst scenario in assessing risk associated with contamination. The same situation occurs for sub-surface water discharging into a tidal estuary. Estuarine ecosystems involving subsurface water dis-charge regions will be affected by contaminant concentrations at the estuary-subsurface interface. Todetermine the exit of contamination concentration at the beach face, we need to understand and quan-tify the contamination transport and reaction processes in the coastal subsurface system. An essentialfeature of a coastal subsurface system is the influence of oceanic oscillations on flow and mixingprocesses in the mixing zone of the subsurface system. Hydrologic issues enter this process at two keypoints: in quantifying inputs to specific coastal budgets and in characterizing types of coastal environ-ments in terms of behaviour that will support extrapolation to a global model. Both are important, andtheir combined requirements represent a significant challenge. Beyond the hydrologic questions are thekey issues of geo-chemical fluxes, especially of nutrients, but also of carbon compounds and of othermaterials, natural or anthropogenic, that may affect biological and chemical cycles in the coastal zone.However, an understanding of solvent behavior is typically a prerequisite for predicting the action ofsolutes, so an initial focus on hydrology is essential.
Hydrological Setting of the Coast
A watershed is topographically defined as an area that water enters through precipitation andleaves as evapotranspiration, surface runoff and subsurface water discharge. In the case of a coastalwatershed, runoff and subsurface water discharge enter the sea (Figure 3). Rainfall and potential rate ofevapotranspiration are determined by climate. Actual evapotranspiration is limited by the climaticallycontrolled potential rate, but vegetation and the wetness of the soil also affect it. Soil properties, topog-raphy, and the history of rainfall and evapotranspiration determine runoff and subsurface water dis-charge. For the purpose of this discussion, surface runoff includes both direct runoffs, which occurs asstream flow immediately following a rainstorm, and drainage of subsurface water into creeks, whichaccounts for stream flow between storms. The amount of direct runoff generated by a storm depends onthe amount of rainfall and on the moisture conditions of the soil. In general, more runoff occurs whenthe soil is initially wet. Subsurface water discharge can be calculated by difference if rainfall, evapo-transpiration, runoff and the change in the amount of water stored on the watershed are known.
141
Session Five: Contaminants and Ecosystem Health
A link between rising sea level and changes in the water balance is suggested by the generaldescription of the hydraulics of subsurface water discharge at the coast. Fresh subsurface water rides upover denser saltwater in the subsurface system on its way to the sea (Figure 3), and subsurface waterdischarge is focused into a narrow zone that overlaps with the intertidal zone. The width of the zone ofsubsurface water discharge, measured perpendicular to the coast, is indirectly proportional to the dis-charge rate. The shape of the water table and the depth to the fresh/saline interface are controlled by thedifference in density between freshwater and saltwater, the rate of freshwater discharge and the hydrau-lic properties of the subsurface system. The elevation of the water table is controlled by mean sea levelthrough hydrostatic equilibrium at the shore.
Contamination and Water Pathways to the Coast
Figure 4 indicates two distinct subsets of the coastal zone environment. First, the estuarine zoneis intended to represent the typically narrow width of the marine environment that is most influenced byland and which often has relatively high levels of variability as well as productivity. The estuarine zoneincludes true estuaries, but is further represented by a narrow band of nearshore water masses in loca-tions where there are not streams adequate to form traditionally defined estuaries (Figure 5). The estua-rine zone is, inevitably, the area of the ocean most subject to direct anthropogenic alteration. On average,this zone is not dominated by fluxes from the world’s major rivers; advective processes are primarilyoceanic, and terrestrial influences are often a mix of subsurface water and runoff from local water-sheds. The remainder of the coastal zone environment is referred to here as the coastal shelf zone. Thisis the open-water part of the continental shelf that is dominated by oceanic advective processes andcharacterized by more nearly oceanic water characteristics.
Figures 4 and 5, considered together, illustrate both a conceptual and an operational problem inconsidering hydrologic inputs to the coastal zone. Conceptually, essentially all surface water flow en-ters the coastal zone through the estuarine zone. Although this is a convenient assumption for shallowsubsurface water, it is not necessarily correct; confined aquifer systems, karst formations, etc., mayresult in either localized or distributed discharges of subsurface water relatively far out on the continen-tal shelf or slope. This situation is illustrated in Figure 5, along with indications of processes that mustbe considered regarding subsurface water in the larger hydrological sense. These offshore dischargesare likely to be insignificant in terms of the water budget of the coastal shelf zone. However, becausethis water is likely to be more highly mineralized, it may be bio-geo-chemically significant, and theflux of subsurface water may also have an amplified influence on pore water environments and thebenthic community (Tribble et al. 1992; Tobias et al. 2001; Valiela et al. 1992).
The Saltwater Intrusion Process into Coastal Watersheds
The details of saltwater intrusion along coastal areas have been explained earlier by Bobba(1993a). The interface, consisting of the surface between the fresh and saline waters, has a parabolicform, with the saltwater tending to under ride the less dense freshwater. Figure 3 represents equilibriumbetween the seaward-flowing freshwater and seawater. Whatever the flow situation, a dynamic equilib-

142
Health of the Bay of Fundy: Assessing Key Issues
rium tends to develop. It can be shown that the length of the intruded wedge of saltwater varies in-versely with the magnitude of the freshwater flow to the sea. Thus, even a reduction of freshwater flowis sufficient to cause intrusion. The phenomenon of freshwater underlain by saltwater is quite complex.In reality the two fluids are miscible and are separated by a transition zone (Figure 6) with a continuousupward gradient of salt concentration from saltwater below to uncontaminated above. This results in aslight upward density gradient in the transition zone. The two fluids tend to mix by molecular diffusionand macroscopic dispersion. Because saltwater intrusion represents immiscible displacement of liq-uids in porous media, the processes of hydrodynamic dispersion and molecular diffusion tend to mixthe two fluids. As a result, the idealized interfacial surface becomes a transition zone (Figure 6). Thethickness of the zone depends upon the physical structure of the aquifer, the history of extractions fromthe aquifer, the variability of recharge, and the tides. The details of the mixture of freshwater andsaltwater have been explained earlier (Bobba 1993a). To understand and solve the complicated practi-cal saltwater intrusion problems, numerical modelling is very important before there can be exploita-tion of subsurface water along the coastal areas and small islands.
Application of Numerical Models to Coastal Watersheds
In the past four decades, modelling has become an important and powerful tool in many branchesof science. Models allow engineers and scientists to test hypotheses in a manner that is removed andnondestructive to the actual problem at hand. In studies involving saltwater intrusion, modelling hasbeen used for many purposes. A common goal of these models is to predict and characterize the move-ment of the transition zone in the aquifer where freshwater and saltwater meet. Another purpose ofmodelling is to predict the degree and extent of mixing that occurs in this transition region. In this way,models allow problems to be defined before they actually occur. The details of the models have beenpresented earlier by Bobba (1993a, 1996), Bobba and Singh (1995), and Bobba et al. (2000a).
This paper presents the application of finite element models applied for two case studies. Oneof the models is the SUTRA (Saturated - Unsaturated TRAnsport) model developed by Voss (1984).This model simulates fluid movement and the transport of either dissolved substances or energy in thesubsurface system. The model can be applied areally or in cross section. It uses a two-dimensional,combined finite-element and integrated-finite difference method to approximate the equations thatdescribe the two interdependent processes being simulated. When used to simulate saltwater move-ment in a subsurface system in cross section, the two interdependent processes are the densities-de-pendent saturated subsurface-water flow and the transport of dissolved solids in the subsurface water.Either local- or regional-scale sections having dispersed or relatively sharp transition zones betweensaltwater and freshwater may be simulated. The results of a SUTRA simulation of saltwater movementshow both distributions of fluid pressures and dissolved-solids concentrations as they vary with timeand the magnitude and direction of fluid velocities as they vary with time. Subsurface properties thatare entered into the model may vary in value throughout the simulated section. Sources and boundaryconditions may vary with time. The finite-element method using quadrilateral elements allows thesimulation of irregular areas with irregular mesh spacing. The model has been applied to real field dataand observed to give favourable results (Bobba 1993b, 1998a and 1998b; Bobba et al. 2000a and

143
Session Five: Contaminants and Ecosystem Health
2000b; Piggott et al. 1994 and 1996). Two examples are presented in this paper to identify subsurfacewater contamination to coastal areas.
Case Study 1: Port Granby radioactive disposal site (Bobba and Joshi 1988 and 1989)
Canada has a uranium refinery, at Port Hope, Ontario. The waste from the refinery was disposedat the Port Granby waste management site located on the north shore of Lake Ontario (Figure 7). Inrecognition of concern over the possible contamination of surface lake waters, the concentrations ofradium and uranium were measured in water samples collected from the Lake Ontario coastal zonenear the waste site. These data showed leachate infiltrating and seeping to the coastal zone of LakeOntario. The plume moved parallel to the shoreline in the direction of the prevailing wind (Figure 7).Figure 8 shows the geology, hydrogeology and computed hydraulic heads. The finite element modelwas applied to calculate hydraulic head and contamination discharge to the lake shore. Figure 9 showsthe predicted Ra-226 contamination concentration from the waste disposal site to the beach. Bobba andJoshi (1988 and 1989) present the details of the application of the model and interpret the results.
Case Study 2: Tongatapu Islands (Bobba 1999)
Tonga, with a population of about 96,000, is situated in the southwest Pacific Ocean some1,600 km northwest of New Zealand. Tongatapu, the largest island in the kingdom of Tonga with asurface area of 250 sq km, is located to the southeast of Fiji in the South Pacific at 175 12’ W 21. Bobba(1999) reports the details of geology and hydrogeology (Figure 10). A finite element grid was set up torepresent the Tongatapu Island as shown in Figure 10B. The grid consisted of 137 nodes and 97 ele-ments. The geometry is very similar to that used in Figure 10A. The results of the simulation wererepresented according to their three main characteristics, that is, water table levels, the position ofinterface between salt and freshwater, and the thickness of freshwater and saltwater available in theaquifer. Bobba et al. (2000a) present the details of the model application and interpretation.
In simulated areal contour maps representing the interface, the areas occupied by the interfaceof the freshwater and saltwater thicknesses are shown. Figure 11 shows the simulated hydraulic headand freshwater depth in the Tongatapu Island without sea level rise. The freshwater depth is greater inthe centre of the island than in coastal areas. The freshwater depth was reduced due to sea level rise andtidal action from both the north and south. Figures 12 and 13 depict the influence of sea level risevariations and El Niño effects on Tongatapu Island.
Conclusions
Mathematical and numerical models are useful to estimate subsurface water and contaminationdischarge to coastal areas from point and non-point source areas (Bobba et al. 2000a). This paperpresented applications of two types of numerical models. As an example, a finite element model, con-sidering open boundary conditions for coasts and a sharp interface between freshwater and saltwaterwas applied under steady-state conditions to the phreatic aquifer for freshwater surplus and deficits at

144
Health of the Bay of Fundy: Assessing Key Issues
the coastline due to the El Niño effect. When recharges of saltwater occur at the coastline, essentially offreshwater deficits, a hypothesis of mixing for the freshwater-saltwater transition zone allows the modelto calculate the resulting seawater intrusion in the aquifer. Hence, an adequate treatment and interpre-tation of the hydrogeological data that are available for a coastal aquifer are of main concern in satisfac-torily applying the numerical model. The results of the steady-state simulations showed reasonablecalculations of the water table levels and the freshwater and saltwater thicknesses, as well as the extentof the interface and seawater intrusion into the aquifer for the total discharges or recharges along thecoastline. As a result of the present hydrogeological simulations on the subsurface system, a consider-able advance in seawater intrusion would be expected in the coastal watershed if the sea level rises dueto climate change and El Niño effects.
References
Bobba, A. G. 1993a. Mathematical models for saltwater intrusion in coastal aquifers: Literature review.Water Resource Management 7: 3–37.
Bobba, A. G. 1993b. Field validation of ‘SUTRA’ groundwater flow model to Lambton County, On-tario, Canada.Water Resource Management 7: 289–310.
Bobba, A. G. 1996. Environmental modelling of hydrological systems. Doctoral dissertation submittedfor partial fulfillment of Doctor of Science, Lund University, Lund, Sweden.
Bobba, A. G. 1998a. Application of numerical model to predict fresh water depth in islands due toclimate change effect: Agati island, India. Journal of Environmental Hydrology 6: 1–13.
Bobba, A. G. 1998b. Application of numerical model to predict fresh water depth due to climate changeeffect in Laccadive Islands, India. EOS, Transactions, American Geophysical Union 79(17):S75.
Bobba, A. G. 1999. Prediction of freshwater depth due to climate change in islands by numerical simu-lation. Pages 823–838. In: Proceedings of the 1999 Canadian Coastal Conference, 19–22 May1999, Royal Roads University, Victoria, BC. C. J. Steward, Ed. Canadian Coastal Science andEngineering Association, Ottawa.
Bobba, A. G. and S. R. Joshi. 1988. Groundwater transport of Radium-226 and uranium from PortGranby waste management site to Lake Ontario. Nuclear and Chemical Waste Management 8:199–209.
Bobba, A. G. and S. R. Joshi. 1989. Application of an inverse approach to a Canadian radioactive wastedisposal site. Ecological Modelling 46: 195–211.
Bobba, A. G. and V. P. Singh. 1995. Groundwater contamination modelling. Pages 225–319. In: Envi-ronmental Hydrology. V. P. Singh, Ed. Kluwer Academic Publishers, Dordrecht.
Bobba, A. G., V. P. Singh, and L. Bengtsson. 2000a. Application of environmental models to differenthydrological systems. Journal of Ecological Modelling 125: 15–49.

145
Session Five: Contaminants and Ecosystem Health
Bobba, A. G., V. P. Singh, R. Berndtsson, and L. Bengtsson. 2000b. Numerical simulation of saltwaterintrusion into Laccadive island aquifers due to climate change. Journal of Geological Society ofIndia 55: 589–612.
Piggott, A. R., A. G. Bobba, and K. S. Novakowski. 1996. Regression and inverse analyses in regionalground-water modeling. Journal of Water Resources Planning and Management 122: 1–10.
Piggott, A. R., A. G. Bobba, and J. Xiang. 1994. Inverse analysis implementation of the SUTRA modelof groundwater flow and transport. Groundwater 32: 829–836.
Tobias, C. R., J. W. Harvey, and I. C. Anderson. 2001. Quantifying groundwater discharge throughfringing wetlands to estuaries: Seasonal variability, methods comparison, and implications forwetland-estuary exchange. Limnology and Oceanography 46: 604–615.
Tribble, G. W., F. J. Sansone, et al. 1992. Hydraulic exchange between a coral reef and surface seawater.Geological Society of America Bulletin 104: 1280–1291.
Vailela, I., K. Foreman, M. LaMotagne, D. Hersh, J. Costa, P. Peckol, B. DeMeo-Andreson, C. D’Avanzo,M. Babione, C. Sham, J. Brawley, and K. Lajtha. 1992. Couplings of watersheds and coastalwaters: Sources and consequences of nutrient enrichment in Waquoit bay, Massachusetts. Estu-aries 15: 443–457.
Voss, C. I. 1984. A Finite Element Simulation Model for Saturated-Unsaturated Fluid Density Depend-ent Groundwater Flow with Energy Transport or Chemically Reactive Single Species SoluteTransport. Water Resources Investigation Report 84-4369. U.S. Geological Survey, Reston,VA.
Figure 1. Sensitive coastal areas in Canada due to sea level rise (from Natural Resources Canada)
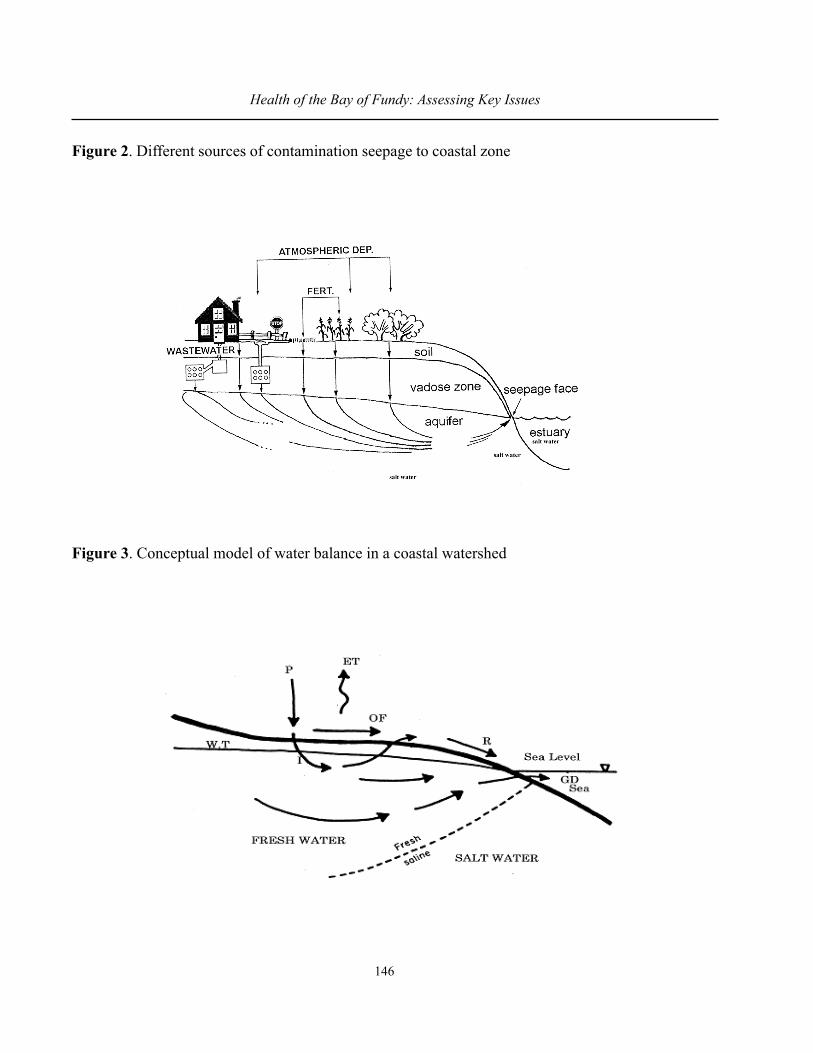
146
Health of the Bay of Fundy: Assessing Key Issues
Figure 2. Different sources of contamination seepage to coastal zone
Figure 3. Conceptual model of water balance in a coastal watershed

147
Session Five: Contaminants and Ecosystem Health
Figure 4. Conceptual model of the coastal zone, showing the different pathways of subsurface watersdischarge and the distinctions among the terrestrial compartment and the estuarine zone and the openshelf zone
Figure 5. Plan view of the coastal zone showing the relationships among the estuarine zone, open shelfzone, streams, and subsurface water discharge to the ocean and streams
148
Health of the Bay of Fundy: Assessing Key Issues
Figure 6. Schematic vertical cross section showing freshwater and saltwater in coast fluids of differentdensities
Figure 7. Location of waste site and Ra-226 concentrations in Lake Ontario

149
Session Five: Contaminants and Ecosystem Health
Figure 8. Geological cross section and simulated hydraulic head distribution of north-south geologicalcross section (Bobba and Joshi 1988 and 1989)
Figure 9. Computed Ra-226 concentration in waste site, beach and observed concentration at the coast(Bobba and Joshi 1988)
Figure 10. Hydrogeology (A) and finite element grid (B) to Tongatapu island
150
Health of the Bay of Fundy: Assessing Key Issues
Figure 11. Comparison of simulated hydraulic head (A), freshwater depth (C) with observed hydraulichead and freshwater depth data (B) of Tongatapu island
Figure 12. Simulated hydraulic head (A) and freshwater depth (B) due to tidal wave action from southand El Niño effect in Tongatapu island
Figure 13. Computed hydraulic head (A) and freshwater depth (B) due to tidal wave action from northand El Niño effect in Tongatapu island (Bobba 1999)

151
Session Five: Contaminants and Ecosystem Health
ASSESSMENT OF THE ENVIRONMENTAL RISKS ASSOCIATED WITHCHEMICAL USE IN FINFISH AQUACULTURE
Bill Ernst, Roy Parker, Ken Doe, Paula Jackman, Gary Julien and Jamie Aube
Environment Canada, Atlantic Region, Dartmouth, NS. [email protected]
The use of chemicals in aquaculture, particularly finfish aquaculture, has caused concern in theregulatory and public communities. One of the most contentious uses has been that of pesticide use forsea lice control which allegedly has caused commercial fisheries impacts (lobster kills). The emergingenvironmental fate and effects database indicates that the use of some products such as cypermethrin,which is used to control sea lice infestations, have the potential for area wide impacts because chemi-cals used in aquaculture are generally released freely to the environment. Recent inventory work byEnvironment Canada has revealed that a large number of chemicals are used in aquaculture, howevertheir impacts remain uncertain.
Concerns about possible chemical residues in the sediments that accumulate under salmon netpens has prompted Environment Canada to participate in a series of studies to collect samples of thesesediments and to analyze these samples for chemicals. Sampling surveys have been conducted since1998. Samples have been analyzed for metals, mercury, PCB, DDT, pesticides, and PAHs. To date theresults have indicated that copper and zinc were elevated at some salmon farm sites. Sediment toxicitytests have been conducted to assess the potential impact of the elevated metal levels.

152
Health of the Bay of Fundy: Assessing Key Issues
ASSESSMENT OF BENTHIC COMMUNITY STRUCTURENEAR MARICULTURE SITES IN PASSAMAQUODDY BAY
AND THE LETANG INLET
Gerhard Pohle1, Vicky Merritt1, and Kats Haya2
1 Huntsman Marine Science Centre, St. Andrews, NB. [email protected] Department of Fisheries and Oceans, St. Andrews, NB.
A comparison of three salmon aquaculture sites was undertaken to assess the benthic commu-nity structure as a measure of environmental impact along a distance gradient over time. Results areinterpreted based on findings of previous studies within the area. Depending on the site, data indicateeffects ranging from high to relatively low impact at or near net pens, generally with decreasing im-pacts over distance. However, one site, within an area of muddy substrate showed the sludge wormCapitella abundant at stations beyond cages. This worm is indicative of highly enriched areas. Otherimpact indicators corroborate that the impacted area extended beyond the immediate vicinity of opera-tions at that site. Another site with less silty substrate showed little impact on the benthos even near net-pens, demonstrating a wide range of site-dependent effects. Results are compared to site ratings basedon the New Brunswick Environmental Monitoring Program.
153
Session Five: Contaminants and Ecosystem Health
HEAVY METALS IN ROCK CRAB (Cancer irroratus), LOBSTER (Homarusamericanus) AND SEDIMENTS FROM THE INNER BAY OF FUNDY,
ATLANTIC CANADA
Chiu L. Chou, Lisa A. Paon, John D. Moffatt and B. M. Zwicker
Marine Environmental Science Division, Oceans Branch, Department of Fisheries and Oceans,Maritimes Region, Bedford Institute of Oceanography, Dartmouth, NS.
Introduction
The Bay of Fundy, Atlantic Canada is a habitat for important commercial stocks of the Ameri-can lobster, Homarus americanus, as well as a number of other marine species. In order to protect thesevalued resources, and consumers, information regarding contaminants and the associated environmentis essential. With the exception of work conducted in Saint John, New Brunswick (Dadswell 1979),data for metal contaminants in marine biota are largely unavailable for the Inner Bay of Fundy. It hasbeen shown that crustaceans can accumulate high concentrations of heavy metals (copper – Cu, cad-mium – Cd, zinc – Zn and silver – Ag) in the digestive gland and thus are good indicators for monitor-ing changes in environmental metal levels (Chou et al. 1987; Chou and Uthe 1978). Accordingly, thisresearch was undertaken to compile baseline data to assess the distribution of metals in lobster, craband the associated environment, with regard to the eco-health of the Bay of Fundy.
Materials and Methods
Market size lobsters (Homarus americanus), thirty per site (15 male, 15 female), preferablyweighing about 450 g, were purchased from lobster fishermen during the fishing season, May to July,1999, at each of the sample sites in the Inner Bay of Fundy (Figure 1). Twenty rock crabs (Cancerirroratus) per site, captured in traps with lobster, were collected in 2000. They were transported live tothe Bedford Institute of Oceanography, Dartmouth, NS, and held in tanks of running ambient seawaterfor 24 hours before dissection. Biological parameters were recorded, and upon dissection, digestiveglands were weighed, placed in labeled Whirl-Pak® bags, and frozen at -27°C to await chemical analy-sis. Six to eight sediments were also collected at each of the lobster capture sites, using a VanVeen grabsampler (approximate capacity of 0.015 m3). In preparation for sample digestion, thawed digestiveglands were homogenized by hand-kneading the Whirl-Pak® bags. Digestive glands were digested inHNO3 and sediment samples were prepared and digested following a HF and HNO3 procedure (Chou etal. 2000). For quality assurance/quality control, certified reference materials, TORT-1 and LUTS-1(lobster digestive gland) obtained from the National Research Council of Canada, were also preparedaccording to the sample procedure. Ag, Cd, Cu and Zn were determined using a Perkin-Elmer Model403 flame atomic absorption spectrophotometer equipped with deuterium arc background correction(Chou et al. 1987). Concentrations determined for the metals are listed as Fg/g wet wt. for digestiveglands and Fg/g dry wt. for sediment samples.
154
Health of the Bay of Fundy: Assessing Key Issues
Results and Discussion
Table 1 shows the metal concentrations for lobster digestive glands (Ag, Cd, Cu, Zn). LobsterCu values ranged widely over the different sites and were conspicuously elevated. Lobsters highlycontaminated with Cu, were observed in Cobequid Bay (CBY, 856 Fg/g), Cumberland Basin (CMB,836 Fg/g), Shepody Bay (SHB, 637 Fg/g), Minas Basin (MIB, 405 Fg/g), Saint John Harbour (SAJ,317 Fg/g), and Minas Channel (MIC, 110 Fg/g). These values were extremely high compared with Culevels reported to date for lobsters in the Maritimes Region, Canada (Chou and Uthe 1978). The Cudetermined for lobsters from the Inner Bay of Fundy was 10–80 times higher than that found in lobstersfrom other non-industrialized sites such as Pubnico, N.S. (Chou et al. 1998). For most sites, Zn inlobster digestive gland varied from 28.0–40.9 Fg/g, with the exception of Minas Basin which had 129Fg/g wet weight. MIB lobsters surpassed values of up to 50.8 Fg/g reported previously for MaritimesRegion lobsters (Chou et al. 1998; Chou and Uthe 1978), and ~25–35 Fg/g (Cooper et al. 1987; Pecci1987) in lobsters from the New England coast. Chou et al. (1987) reported that digestive gland Zn levelwas under biological control and independent of dietary Cd levels in juvenile lobster. At MIB, however,Zn may exceed a threshold, beyond which it can no longer be regulated as in other decapods (Nugegodaand Rainbow 1989). Further study on this point is required. Cadmium concentrations in Bay of Fundylobsters (11.6–22.9 Fg/g) were also more elevated than those reported for lobsters from other areas(Prince Edward Island, New Brunswick, Newfoundland, and elsewhere in Nova Scotia): 3.67–12.9 Fg/g (Chou et al. 1998). However, exceedingly high levels, peaking at 223 Fg/g, have been previouslyreported in lobsters from a site near a lead smelter plant at Belledune, New Brunswick, Canada (Utheand Chou 1985). The cause of the elevated Cd in Bay of Fundy lobsters, however, is unknown. Agconcentrations were also elevated and ranged from 2.5–11.5 Fg/g compared to 0.8-2.4 Fg/g (Chou etal. 1998) and 0.44–2.22 Fg/g (Chou and Uthe 1978) in previous surveys of Maritimes region harbours,Canada. Ag is known to interact highly with Cu in lobsters (Chou et al. 1987; Chou and Uthe 1978); asthe uptake of Cu increases, Ag concentration is also observed to increase. This relationship remainedintact for lobsters from the eastern and southern shores of Nova Scotia (Chou et al. 1998), and for somesites in this study.
Table 2 shows the concentrations of Ag, Cd, Cu and Zn (wet weight), in the digestive glands ofrock crabs from the Inner Bay of Fundy, Victoria Beach, Nova Scotia and Dalhousie, New Brunswick.Inner Bay, Victoria Beach, and Annapolis Basin Cu was highly elevated compared with 7.98 Fg Cu/gobserved in crabs sampled from Dalhousie, N.B. (unpublished data). In a study of Cu in crabs duringthe intermolt cycle, Martin (1975) reported 27 Fg Cu/g (wet wt.) in digestive glands. He also reported19.9±11.8 Fg Cu/g (wet wt.) in whole crab samples from Terence Bay, Nova Scotia (1974). VictoriaBeach, which is furthest from the Inner Bay, has the lowest Cu (69 Fg Cu/g) among the five study sitesin the Bay of Fundy, but is still elevated. The pattern in geographic distribution of Cu in rock crab isconsistent with the results for American lobster collected from the same study sites in the Inner Bay ofFundy (Chou et al. 2000). In comparison with Victoria Beach and Dalhousie, Zn is elevated in InnerBay crabs. This is noteworthy as Zn is normally regulated in decapod crustaceans (Bryan 1968). Thissupports the finding of highest Zn in lobster from MIB (129 Fg/g), although Zn accumulation in crab isone-third that found in lobsters (Chou et al. 2000). Cadmium concentration in crab from CBY, MIB,
155
Session Five: Contaminants and Ecosystem Health
and PARS (Parrsborro) are highly elevated compared with 7.53 Fg Cd/g in Dalhousie crab digestiveglands, and are ~10–30 times the 2.02 Fg Cd/g found in Victoria Beach crabs. Cadmium in crab ismuch higher (2–3 times) than the levels in lobster from the same sites (16.0–22.9 Fg/g) (Chou et al.,2000). The pattern of distribution, however, is consistent with the lobster results, and indicates con-tamination, in particular at PARS, MIB, and CBY sites. Silver concentrations in crab from the InnerBay of Fundy are more elevated than Ag in either Victoria Beach or Dalhousie crab, which also havelow digestive gland Cu levels. The inter-relationship and the uptake of Ag in invertebrates is part of adetoxification mechanism for coping with high Cu concentrations in the environment (Chou et al.,1987).
Table 3 shows the results for sediment Cd, Cu and Zn; Ag was not detected in sediments at anysite. Cu concentrations ranged from 9.3–19.2 Fg/g dry wt. and were comparable to Loring’s surveyresults which showed an average of 15 Fg/g from the Bay of Fundy (range 5–32 Fg/g) (Loring 1979).Sediment Zn ranged from 35.1–69.4 Fg/g which compares with the average of 51 Fg/g (range 18–104Fg/g) reported by Loring (1979). Our sediment Cd values ranged from 0.02–0.11 Fg/g which was alsosimilar to Loring’s range of 0.03–0.52 Fg/g for the Bay of Fundy. SAJ sediments had the highest levelsfor all metals. Relationships between sediment and digestive gland metals were not observed whichagrees with our previous findings for biota and associated sediments (Chou et al. 1999; Chou et al.1998). This suggests that the sediments are not the source of Cu in lobster and crab from the Bay ofFundy. This is consistent with reports from Francesconi et al. (1994) and Chou et al. (1987) that suggestthe major intake of metals in lobsters is via the diet.
These results demonstrated high Cu, Cd, and Zn levels in crab and lobster from the Inner Bay ofFundy, which pose a serious concern requiring identification of the unknown source of discharge to themarine environment. Gulf of Maine Council Mussel Watch Program did not detect elevated metallevels in these areas (Chase et al. 1998) which suggests that better indicator species, such as crab andlobster are needed for monitoring contaminant discharges in the area. Although lobster and crab appearto be able to withstand and concentrate extremely high copper levels when it is presented in the diet,there must be an upper limit beyond which there is an adverse effect with ultimately toxic and poten-tially negative consequences for the biota. Thus there is a need to pinpoint the source of Cu, Zn, and Cdand their impact on lobster and crab. Studies of the fate, transport and distributions in other speciesincluding commercially valuable species such as scallops, fish and other marine biota are imperative.
References
Bryan, G. W. 1968. Concentrations of zinc and copper in the tissues of decapod crustaceans. Journal ofthe Marine Biological Association of the United Kingdom 48: 303–321.
Chase, M., P. Hennigar, J. Sowles, S. Jones, R. Crawford, G. Harding, J. Pederson, C. Krahforst, D.Taylor and K. Coombs. 1998. Evaluation of Gulfwatch 1997: Seventh Year of the Gulf of MaineEnvironmental Monitoring Plan. The Gulf of Maine Council on the Marine Environment. 68pp., A1-F8.
156
Health of the Bay of Fundy: Assessing Key Issues
Chou, C. L., J. D. Castell, J. F. Uthe, and J. C. Kean. 1987. Effect of dietary cadmium on growth,survival, and tissue concentrations of cadmium, zinc, copper, and silver in juvenile Americanlobster (Homarus americanus). Canadian Journal of Fisheries and Aquatic Sciences 44: 1443–1450.
Chou, C. L., L. A. Paon, J. D. Moffatt, and B. Zwicker. 1998. Concentrations of Metals in the AmericanLobster (Homarus americanus) and Sediments from Harbours of the Eastern and SouthernShores and the Annapolis Basin of Nova Scotia, Canada. Canadian Technical Report on Fisher-ies and Aquatic Sciences 2254. Department of Fisheries and Oceans, Dartmouth, NS. 69 pp.
Chou, C. L., L. A. Paon, J. D. Moffatt, and B. Zwicker. 2000. Copper contamination and cadmium,silver, and zinc concentrations in the digestive glands of American lobster (Homarus americanus)from the Inner Bay of Fundy, Atlantic Canada. Bulletin of Environmental Contamination andToxicology 65: 470–477.
Chou, C. L., and J. F. Uthe 1978. Heavy metal relationships in lobster (Homarus americanus) and rockcrab (Cancer irroratus) digestive glands. International Council for the Exploration of the Sea.C.M. 1978/E:15.
Chou, C. L., B. M. Zwicker, J. D. Moffatt, and L. Paon. 1999 Elemental concentrations in the livers andkidneys of winter flounder (Pseudopleuronectes americanus) and associated sediments fromvarious locations in the Bras d’Or Lake, Nova Scotia, Canada. Canadian Technical Report onFisheries and Aquatic Sciences 2284. Department of Fisheries and Oceans, Dartmouth, NS. 116pp.
Cooper, R. A., A. Shepard, P. Valentine, J. R. Uzmann, and A. Hulbert. 1987 Pre and post drillingbenchmarks and monitoring data of ocean floor fauna, habitats, and contaminant loads on GeorgesBank and its submarine canyons. In: R. A. Cooper and A. N. Shepard (Eds) NOAA SymposiumSeries on Undersea Research 2(2): 17-48
Dadswell, M. J. 1979. Biology and population characteristic of the shortnose sturgeon, Acipenserbrevirostrum, LeSueur 1818 (Osteichtheyes: Acipenseridae) in Saint John Estuary, New Bruns-wick. Canadian Journal of Zoology 57: 2186–2210.
Francesconi, K.A., E. J. Moore and J. S. Edmonds. 1994. Cadmium uptake from seawater and food bythe Western rock lobster, Panulirus cygnus. Bulletin of Environmental Contamination andToxicology 53: 219–223.
Loring, D. H. 1979. Baseline levels of transition and heavy metals in the bottom sediments of the Bayof Fundy. Proceedings of the Nova Scotian Institute of Science 29: 335–346.
Martin, J. L. M. 1974. Metals in Cancer irroratus (Crustacea: Decapoda): concentrations, concentra-tion factors, discrimination factors, correlations. Marine Biology 28: 245–251.
Martin, J. L. M. 1975. Le cuivre et le zinc chez Cancer irroratus (Crustace: Decapode): metabolismecompare au cours du cycle d’intermue. Compartive Biochemistry and Physiology 51A: 777–784.

157
Session Five: Contaminants and Ecosystem Health
Nugegoda, D., and P. S. Rainbow.1989. Zinc uptake rate and regulation breakdown in the decapodcrustacean Palaemon elegans rathke. Ophelia 30(3): 199-212.
Pecci, K. J. 1987. Levels of heavy metals, petrogenic hydrocarbons, and polychlorinated biphenyls inselected marine samples from the New England coast. In: R. A. Cooper and A. N. Shepard(Eds) NOAA Symposium Series on Undersea Research 2(2): 127–140.
Uthe, J.F., and C. L. Chou. 1985. Cadmium in American Lobster (Homarus americanus) from the Areaof Belledune Harbour, New Brunswick, Canada – A Summary of Five Years Study. CanadianTechnical Report on Fisheries and Aquatic Sciences 1342. Department of Fisheries and Oceans,Halifax, NS. 20 pp.
Table 1. Ag, Cd, Cu, and Zn concentrations (µg/g wet wt.) in the digestive glands (pooled samples)in each of the males, female, and total sample means for lobster from the Inner Bay of Fundy, Atlan-tic Canada
Metal Location RangeSex SHB SAJ CMB CBY MIB MIC µg/g
Ag Male 12.3±0.4 6.3±0.3 2.2±0.01 11.1±0.3 9.2±0.1 3.0±0.2 2.2-12.3Female 9.3±0.1 7.7±0.3 2.8±0.2 11.8±0.4 10.8±0.1 2.7±0.2 2.7-11.8Mean 10.8 7.0 2.5 11.5 10.0 2.9 2.5-11.5
Cd Male 16.0±0.5 10.3±0.5 14.7±0.3 20.9±1.2 22.8±0.8 17.1±1.0 10.3-22.8Female 14.8±0.1 12.8±0.5 15.7±0.6 20.1±0.4 23.0±0.8 15.0±0.3 12.8-23.0Mean 15.4 11.6 15.2 20.5 22.9 16.0 11.6-22.9
Cu Male 673±32 303±6.8 818±12.0 816±20.1 426±8.3 136±6.7 136-818Female 600±2.6 332±8.4 853±14.7 896±7.7 385±2.4 85±4.3 85-896Mean 637 317 836 856 405 110 110-856
Zn Male 33.3±1.7 31.2±0.8 24.7±0.9 40.4±0.5 115±2.4 36.8±0.4 24.7-115Female 36.8±1.1 38.9±0.6 31.3±2.1 41.4±0.7 142±2.8 33.4±0.8 31.3-142Mean 35.1 35.1 28.0 40.9 129 35.1 28.0-129

158
Health of the Bay of Fundy: Assessing Key Issues
Metal MIC CBY MIB PARS Victoria Beacha Dalhousieb
Ag 3.76±1.88 3.59±1.47 4.09±1.24 5.09±1.54 1.51 0.29(0.60-8.42) (1.99-6.61) (0.57-6.50) (2.29-8.24) (0.47-2.47)
Cd 19.3±22.7 48.8±41.4 53.7±30.2 61.1±36.8 2.02 7.53(2.27-99.5) (8.76-187) (13.1-112) (8.37-143) (0.54-20.6)
Cu 79.9±58.9 165±95.3 150±62.8 215±126 69.7 7.98(8.8-286) (17.8-421) (20.6-294) (56.9-528) (21.8-192)
Zn 30.0±6.14 27.9±6.33 38.9±12.1 42.4±14.1 24.2 24.6(23.2-46.4) (19.7-46.4) (21.7-69.6) (23.7-70.4) (13.0-41.0)
Table 2. Ag, Cd, Cu, and Zn concentrations (µg/g wet wt.) in the digestive glands of Atlantic rockcrab (Cancer irroratus) from the Inner Bay of Fundy, Atlantic Canada
a Data originally published in Chou and Uthe (1978)b3 Pooled samples, collected in 2000, total = 80. Range of concentrations shown in brackets.
Table 3. Ag, Cd, Cu and Zn concentrations (µg/g dry wt.) in sediments from the Inner Bay of Fundy,Atlantic Canada
Metal Location RangeSHB SAJ CMB CBY MIB MIC µg/g
Ag N.D. N.D. N.D. N.D. N.D. N.D. N.D.
Cd 0.03 0.11 0.03 0.02 0.03 0.02 0.02-0.11
Cu 15.0 19.2 16.8 17.0 9.3 16.2 9.3-19.2
Zn 58.6 69.4 65.5 48.9 35.1 46.1 35.1-69.4N.D.: not detected

159
Session Five: Contaminants and Ecosystem Health
Figure 1. Lobster and crab sampling sites
160
Health of the Bay of Fundy: Assessing Key Issues
ASSESSMENT OF PERSISTENT INDUSTRIAL MARINE DEBRIS:CHARLOTTE COUNTY, NEW BRUNSWICK
Christine Anne Smith
School for Resource and Environmental Studies, Dalhousie Universityand EnviroSmith Atlantic, Halifax, NS. [email protected]
Abstract
Accumulation of persistent industrial marine debris (PIMD) in the environment adversely im-pacts coastal wetlands, marine species, and water quality. This paper is based on an environmentalassessment conducted in the coastal areas of Charlotte County, New Brunswick. The assessment stud-ied persistent debris (including plastic, synthetics and chemically-treated materials) that originates fromsuch marine industries as commercial fishing, aquaculture and marine transport. Findings are based ondata collected during preliminary site visits and environmental field surveys conducted in the springand summer of 2001. The preliminary assessment provided estimates on the type and amount of PIMDin areas subject to high coastal industry use. This was followed by a more detailed environmentalsurvey and collection of data from 17 sites along the shoreline. Analysis indicates that the majority ofPIMD was comprised of plastics, and that most material tends to accumulate above the high water line.The main methods of illegal PIMD disposal included burial or incineration along shorelines and oceandumping. This study identified the type, amount, sources and impacts of PIMD at the interface betweenland and water in coastal watersheds. In a broader sense the results assist in developing effective wastemanagement programs, regulations, and infrastructure that provide solutions to PIMD problems.
Introduction
The accumulation of domestic and industrial debris along the shore originates from land- andmarine-based industry, recreational activities, and residential garbage disposal. Persistent industrialmarine debris (PIMD) from aquaculture, commercial fishing, and other coastal industries is a growingproblem in the Bay of Fundy. PIMD includes fishing nets, aquaculture pens, tarpaulin or plastic sheeting,55-gallon drums, styrofoam floats, and pallets. Essentially these items originate from industries thatuse coastal resources, e.g., commercial fishing, aquaculture, recreational boating, marine transport, andfish packing plants. Many PIMD items consist of plastic and other synthetic materials that are notreadily biodegradable.
Study Objectives
The purpose of the study was to survey marine industrial debris in the Passamaquoddy area inorder to identify sources so that preventative strategies could be developed. The type, amount, distribu-tion, and sources of PIMD in the Passamaquoddy study area were determined through field surveys andreview of existing information. Study objectives address several questions. For example, How much

161
Session Five: Contaminants and Ecosystem Health
PIMD is in the study area? What are the potential and actual effects on the marine or coastal environ-ment? What are the most prevalent types of PIMD? Can they be traced to their sources? Is it all gener-ated locally or does some come from outside the area? The intent is to determine the nature and extentof the problem and then recommend solutions.
Definition of PIMD
PIMD is defined as persistent debris in the marine environment that originates from industrialactivities that operate and use resources in coastal areas. The definition of PIMD targets specific mate-rials that, due to composition and size, take a long time to degrade or break down in the marine environ-ment. Studies indicate that monofilament fishing line, plastic bottles, and styrofoam buoys have abiodegradation time of 600, 450, and 80 years respectively (Mote 1993). Manufacturers claim thatproducts such as plastic navigation or suspension buoys can endure Bay of Fundy conditions for hun-dreds and possibly thousands of years.
Environmental, Social and Economic Effects of PIMD
More than 50% of marine litter consists of plastics (Marine Conservation Society 2000). It isestimated that over one million birds and 100,000 marine mammals and sea turtles die every year fromentanglement in, or ingestion of, plastics. Of the 115 species of marine mammals, 47 are known tobecome entangled in and/or ingest marine debris. Approximately 30,000 northern fur seals die annuallydue to entanglement, primarily in net fragments (Marine Conservation Society 2000). Estimates ofmarine life endangered by debris include most of the world’s turtle species, 25 percent of marine mam-mal species, and more than 15 percent of seabird species. Plastic film and sheeting, can settle overplants and animals, covering ecosystem habitats such as coral reefs, effectively blocking out sunlightand nutrients (Sea Grant 2001). Economic losses include damage to nets, plastic sheets blocking waterintake pipes, damage to boats due to collision with metal drums or wooden pallets, ropes or nets gettingcaught in boat propellers, lost fishing opportunities (ghost fishing), and lost tourism potential due tounsightly beach litter (Butler et al. 1989:6). A lack of material recycling perpetuates use of virginmaterials in production, placing pressure on natural resources. For example, recycling metals and plas-tics reduces the need to mine or extract such material from the environment.
The study area overlaps Gulf of Maine watersheds. Four distinct environments are defined as:
1. The West Isles (Quoddy): island chain between Letete Passage extending south to Deer,Indian, and Campobello Islands
2. Passamaquoddy Bay: enclosed sea into which the St. Croix, Digdeguash, and MagaguadavicRivers flow
3. Letang Harbour: includes shoreline and islands in the Letang Harbour and along the northside of the Letete Passage
4. Southwest New Brunswick Coast: extends from Pea Point northeast to Pocologan Harbour,along the Bay of Fundy to Maces Bay
162
Health of the Bay of Fundy: Assessing Key Issues
Approach
The study methodology was essentially to gather data on PIMD at selected sites in the studyarea, to identify types of industries close to each site in the study area, and to determine the relationshipbetween the PIMD and industrial operations in the study area. Between May 31 and June 8, 2001 apreliminary assessment was conducted to determine the type, location, and amount of PIMD at targetedsites in the study area. This assessment involved field visits to sites by car, DFO vessel (Pandalus andzodiac), and an aerial survey. Video footage of shoreline in the Passamaquoddy region was recorded ona hand-held camcorder during both ground visits and the aerial survey. Approximately three hours ofvideocassette footage was shot and converted to videotape for all site visits. In addition, a total of 323photographs were taken at sites in the study region. Control sites (Figure 1) provided comparison in thepresence or absence of certain features. The presence and amount of PIMD in areas with no coastalindustry can be compared to areas close to coastal industry.
In this study, PIMD was broken down into five categories: plastic and synthetic fiber, polysty-rene or styrofoam, rubber, metal, and wood. A PIMD data record card was created listing the itemsincluded in each of these categories. Minimum sizes counted under each category included pieces andscraps from a few centimeters to approximately 0.5 m in length and/or width. Types of wood includelarge or treated items that take longer to biodegrade, i.e. weir poles, aquaculture pens and floatingdocks. Domestic marine debris (DMD) consists of items that originate from household or residentialuse. DMD data cards collected information on plastic, foam, rubber, metal glass, wood, paper, andcloth. Since the focus of the study is on PIMD, only one DMD data card was filled out for each area andused to count and identify items at control sites.
Results
All preliminary site visits took place during low tides. During these preliminary studies it wasalso noted that PIMD tends to accumulate closer to residential areas and industry operations. Due toarea size, resource, and time constraints, only 17 sites were selected for more detailed study (Table 1).Data were entered into spreadsheets, and tables were created to indicate the most prevalent items as apercentage of totals for each study area (Tables 2.1–2.5).
The total amount of PIMD items counted at the 13 PIMD study sites was 2,114 (Table 2). Theaverage amount of PIMD at each study site was 163 items. The total amount of PIMD counted at thefour control sites was 11 items. The average amount of PIMD at each control site was 2.75 items. Themost common debris category is plastic. From 41.1% to 57.1% of all materials in each area consisted ofplastic or PVC materials—with a total amount of 1,114 items counted at all sites collectively. Foamwas the second most common PIMD type—with 19.6% to 31.6% of all material counted at each siteidentified as styrofoam.

163
Session Five: Contaminants and Ecosystem Health
The site with the highest variety of PIMD was Fraiser Beach where a total of 31 different typesof PIMD items were found. Two other sites with highly diverse amounts of PIMD were Lords Cove andIndian Island with 28 and 27 different types of items respectively. Sites with the lowest variety of PIMDwere Ship Harbour (7), Frye Island (7), and Beaver Harbour (11).
Sites with the highest amounts of PIMD were identified along with sites where the largest itemswere found (Table 3). The estimated number of fish weirs, aquaculture sites and fish processing plantswithin four kilometres of each site in the study area (Figure 1 and Table 3) are also indicated for each ofthe study areas. Other coastal resource use activities relate to net and line fishers, tourism, research, andtransportation.
The total number of Riverdale coffee cups counted was 77. The highest amount was found inthe West Isles with a total of 33. The lowest number were found in the Southwest New Brunswick area(total of four). No Riverdale cups were found at the Sandy Island, Dear Island Point, Timber Cove,Beaver Harbour, and Pocologan Harbour sites. Riverdale coffee cups are found in areas with higherresidential populations and are closer to the Irving stores. This indicates that most floating debris is nottransported very far from place of origin by currents, winds and tides.
Conclusions
Overall observations in the Quoddy area indicate that the amount of debris is greater on shore-lines closer to municipal centres or with a greater industry presence nearby. The West Isles study areahas the highest amount of PIMD on average. The average amount of items counted at each site in theWest Isles was 204. This area also has the highest number of industry operations. The Southwest NewBrunswick coast has the lowest amount of PIMD on average for each site. In this area industry was notas prevalent, and the average number of PIMD items counted at each site was 66. This suggests acorrelation between amount of coastal-based industry in an area and amount of PIMD that washes upon shore. Selected locations are representative of the four study areas, so amounts at hundreds of othersites in this region may be similar to the 163-items per site average.
This suggests that an enormous amount of PIMD is accumulating in the study region. Thedynamics of oceanographic winds, currents and tides may have some influence on movement of mate-rial from water to shore. However, all identifiable items appear to be generated locally. For example,sites directly beside aquaculture operations tended to have a higher amount of feedbags, flotation pipes,cages, and cage parts, e.g., Indian Island, Fraiser Beach and Cummings Cove. Lightweight PIMD itemssuch as feedbags and styrofoam are transported into adjacent terrestrial ecosystems by wind. Heavy andentangled items may be lifted off shorelines and redistributed in the area by extreme tidal events.Potential impacts to the marine environment in the four study areas include release of toxins fromincineration of PIMD, leachate from unauthorized landfills, ingestion by seabirds, entanglement ofwildlife, and navigational hazards.

164
Health of the Bay of Fundy: Assessing Key Issues
Table 4 indicates where evidence of incineration was found in the four study areas. From a totalof 17 sites visited during the summer, eight were found to have evidence of PIMD incineration. Thisamount is high considering the fact that unauthorized open pit burning of waste material is not legal.The long-term impact of incineration on the local environment is not fully known—effects include therelease of carcinogenic compounds such as vinyl chloride into the atmosphere. In addition, burningplastics and other items that can be recycled places pressure on the environment due to the fact that newmaterials must be extracted from natural resources.
Other adverse environmental impacts from inappropriate PIMD disposal include leachate fromillegal landfill operations along the coast. Durable and buoyant plastic and foam items can carry colo-nies of bryozoans, barnacles, polychaetes, hydroids, and mollusks to distant locations. This is a threatto biodiversity since it encourages introduction of exotic marine flora and fauna to other areas of theworld (BBC 2002). Furthermore, studies conducted by Department of Fisheries and Oceans scientistsindicate that smaller marine animals such as sea urchins ingest plastic and foam. When metabolized,these materials release estrogenic compounds such as nonylphenol or bisphenol-A. World Health Or-ganization and the US Environmental Protection Agency findings indicate that estrogenic compoundsreleased by plastics interfere with human and wildlife endocrine systems leading to development, be-haviour and reproductive problems (EPA 2000).
Recommendations
1. Research current legislation to determine how effective it is at preventing marine debris andhow it may be improved. For example, should fines be increased? Do waste handling capa-bilities on shore provide reasonable support for the regulations?
2. Study how other regions or countries are solving the PIMD problem, e.g., placing responsi-bility on the manufacturer to take back and recycle packaging and items when the consumeris finished with them.
3. Research the effects of PIMD incineration on local air, soil and water and determine thetypes of toxic chemicals released by the different types of PIMD when incinerated.
4. Research effects of plastic metabolization on the food chain, e.g., determine if it is bioac-cumulative and what the effects are to living systems.
5. Improve waste handling infrastructure for coastal debris in each of the four study areas.6. Educate coastal resource users on the adverse impacts of PIMD and consult with public and
industry on solutions to PIMD problems.
Proper waste management requires an understanding of the material composition of tools, equip-ment and packaging used by industry that are likely to end up as PIMD. It also requires evaluation ofcurrent waste resource collection methods and handling operations as well as locating local markets forPIMD. If PIMD take-back, collection and handling facilities are inadequate, then regulations and wastemanagement programs will be ineffective.

165
Session Five: Contaminants and Ecosystem Health
Acknowledgements
I would like to thank Eastern Charlotte Waterways, the New Brunswick Salmon Growers Asso-ciation, Dalhousie University, the Department of Fisheries and Oceans, the St. Andrews BiologicalStation, Shubenacadie Education, and my thesis committee at SRES, Dalhousie University, for re-sources and support that made this study possible. To my family and friends for their encouragementand help – thank you. I would also like to express appreciation to the Bay of Fundy Ecosystem Partner-ship for the opportunity to communicate these findings.
References
British Broadcasting Corporation (BBC). 2002. “ Rubbish menaces Antarctic species”. 24 April, URL:<http://news.bbc.co.uk/hi/english/sci/tech/newsid1948000/1948714.stm>. Date of Access: April29, 2002.
Butler, M., A. Guinchard, O. Olojede, R. Parker, J. Ross, K. Soltan, M. Strickland, and S. Sweeny.1989. A Survey of Shoreline Litter in Halifax Harbour 1989 Joint Project. School for Resourceand Environmental Studies, Dalhousie University, Halifax.
Environmental Protection Agency (EPA). 2000. Endocrine Disruptor Screening Program. URL: <http://www.epa.gov/oscpmont/oscpendo/index.htm>. Date of access: 15 August, 2002.
Marine Conservation Society. 2000. “National Aquatic Litter Group”, last updated: not indicated. URL:<http://www.adoptabeach.org.uk/NALG/html/nalg_home.htm>. Date of access: March 15, 2001.
Mote Marine Laboratory. 1993. Marine biodegradation time line. Sarasota, FL.
Sea Grant National Media Relations Office. 1994–2001, “Sea Grant National Media Center”, last up-dated: not indicated. URL: <http://seagrantnews.org>. National Sea Grant College Program,Washington D.C. Date of access: March 15, 2001.

166
Health of the Bay of Fundy: Assessing Key Issues
∀
AREA 2: Passamaquoddy
MAINE AREA 1: West Isles Bay of Fundy
Names of sites with the most PIMD are identified along with # of items
Seelys Cove (61)
Pendelton Island (348)
Fraiser Beach (113)
Indian Island (387)
N.S
Sherard Beach
NEW BRUNSWI
AREA 3: Letang
NEW BRUNSWICK
AREA 4: Southwest New Brunswick
P.E.I.
Control
Control Control
Control
Figure 1. Study areas
Table 1. Data collection sites: Area use, PIMD, DMD and control amounts
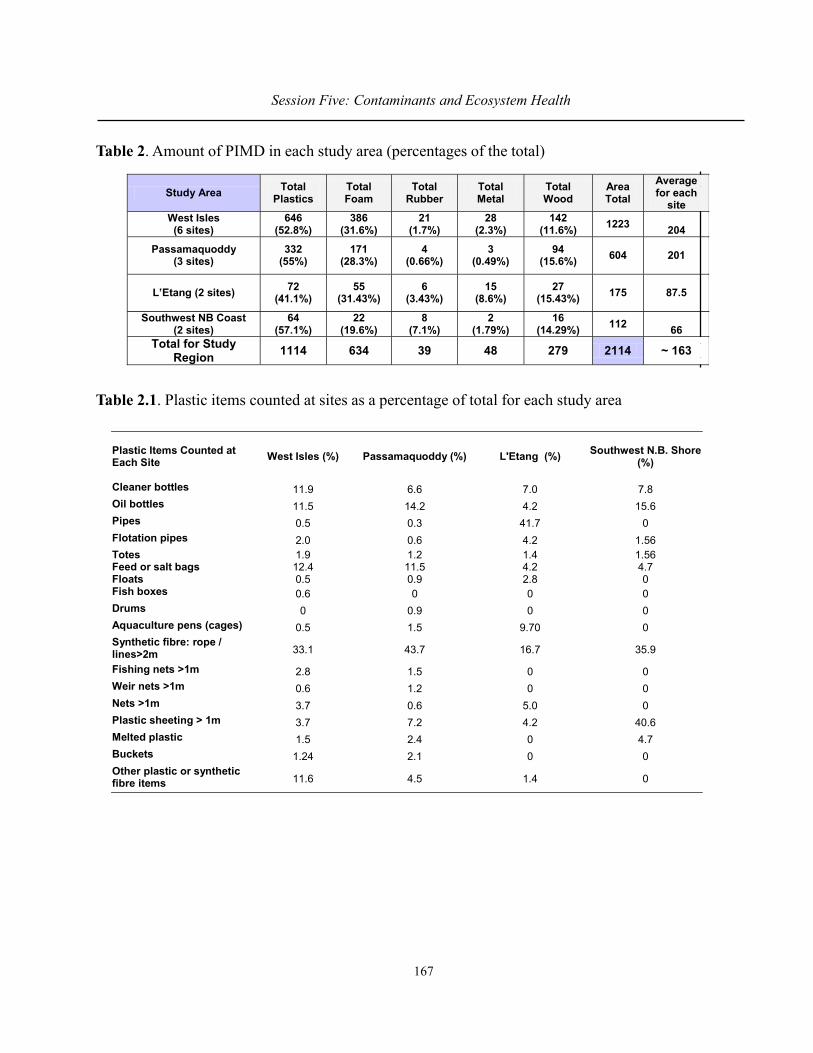
167
Session Five: Contaminants and Ecosystem Health
Table 2. Amount of PIMD in each study area (percentages of the total)
Table 2.1. Plastic items counted at sites as a percentage of total for each study area
Plastic Items Counted at Each Site
West Isles (%) Passamaquoddy (%) L'Etang (%) Southwest N.B. Shore (%)
Cleaner bottles 11.9 6.6 7.0 7.8 Oil bottles 11.5 14.2 4.2 15.6 Pipes 0.5 0.3 41.7 0 Flotation pipes 2.0 0.6 4.2 1.56 Totes 1.9 1.2 1.4 1.56 Feed or salt bags 12.4 11.5 4.2 4.7 Floats 0.5 0.9 2.8 0 Fish boxes 0.6 0 0 0 Drums 0 0.9 0 0 Aquaculture pens (cages) 0.5 1.5 9.70 0 Synthetic fibre: rope / lines>2m 33.1 43.7 16.7 35.9
Fishing nets >1m 2.8 1.5 0 0 Weir nets >1m 0.6 1.2 0 0 Nets >1m 3.7 0.6 5.0 0 Plastic sheeting > 1m 3.7 7.2 4.2 40.6 Melted plastic 1.5 2.4 0 4.7 Buckets 1.24 2.1 0 0 Other plastic or synthetic fibre items 11.6 4.5 1.4 0
Study Area Total Plastics
Total Foam
Total Rubber
Total Metal
Total Wood
Area Total
Average for each
site West Isles (6 sites)
646 (52.8%)
386 (31.6%)
21 (1.7%)
28 (2.3%)
142 (11.6%) 1223
204
Passamaquoddy (3 sites)
332 (55%)
171 (28.3%)
4 (0.66%)
3 (0.49%)
94 (15.6%) 604
201
L’Etang (2 sites) 72 (41.1%)
55 (31.43%)
6 (3.43%)
15 (8.6%)
27 (15.43%) 175
87.5
Southwest NB Coast
(2 sites) 64
(57.1%) 22
(19.6%) 8
(7.1%) 2
(1.79%) 16
(14.29%) 112 66
Total for Study Region 1114 634 39 48 279 2114 ~ 163

168
Health of the Bay of Fundy: Assessing Key Issues
Wood Items Counted at Each Site West Isles (%) Passamaquoddy (%) L'Etang (%) Southwest N.B. Shore
(%)
Weir poles 16.19 9.57 0 6.25
Finfish cages 2.11 1.06 48.15 0
Aquaculture (cage) parts 2.11 3.2 0 0
Crates 4.9 0 0 0
Pallets 6.34 9.57 3.7 0
Beams or planking 67.6 74.5 25.93 93.75
Other wood items 6.34 2.13 22.22 0
Rubber Items Counted at Each Site West Isles (%) Passamaquoddy (%) L'Etang (%) Southwest N.B. Shore
(%)
Rubber tires 80.96 25.0 66.66 50.0
Oher rubber items 19.0 75.0 33.33 50.0
Metal Items Counted at Each Site West Isles (%) Passamaquoddy (%) L'Etang (%) Southwest N.B. Shore
(%)
Crab or lobster traps 3.57 0 0 0
Aquaculture pens (cages) 0 0 0 0
Motors 0 0 20.0 0 Vessel parts 25.0 66.66 13.33 0 Rusty drums 17.86 0 0 0 New metal drums 0 0 0 0 Other metal items 42.86 33.33 66.66 100.0
Table 2.2. Foam items counted at sites as a percentage of total for each study area
Table 2.3. Metal items counted at sites as a percentage of total for each study area
Table 2.4. Rubber items counted at sites as a percentage of total for each study area
Table 2.5. Wood items counted at sites as a percentage of total for each study area
Foam Items Counted at Each Site West Isles (%) Passamaquoddy (%) L'Etang (%) Southwest N.B. Shore
(%)
Foam sheets > 0.25m 10.88 28.7 27.27 4.5 Foam floats 3.88 7.0 1.8 13.63 Foam packing: flotation or insulation 2.33 0 1.8 0 Foam Pieces < 0.25m 78.5 63.74 45.45 81.81 Other foam items 0.26 0.58 0 0
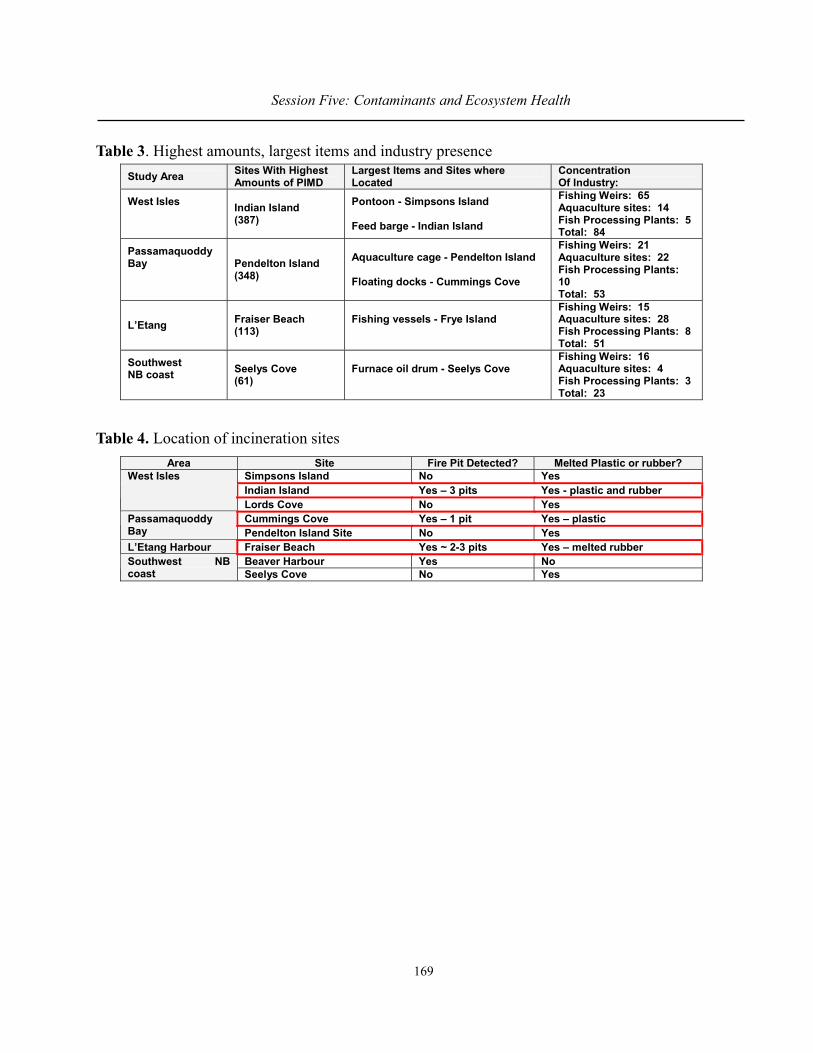
169
Session Five: Contaminants and Ecosystem Health
Table 3. Highest amounts, largest items and industry presence
Table 4. Location of incineration sites
Study Area Sites With Highest Amounts of PIMD
Largest Items and Sites where Located
Concentration Of Industry:
West Isles
Indian Island (387)
Pontoon - Simpsons Island Feed barge - Indian Island
Fishing Weirs: 65 Aquaculture sites: 14 Fish Processing Plants: 5 Total: 84
Passamaquoddy Bay
Pendelton Island (348)
Aquaculture cage - Pendelton Island Floating docks - Cummings Cove
Fishing Weirs: 21 Aquaculture sites: 22 Fish Processing Plants: 10 Total: 53
L’Etang Fraiser Beach (113)
Fishing vessels - Frye Island
Fishing Weirs: 15 Aquaculture sites: 28 Fish Processing Plants: 8 Total: 51
Southwest NB coast
Seelys Cove (61)
Furnace oil drum - Seelys Cove
Fishing Weirs: 16 Aquaculture sites: 4 Fish Processing Plants: 3 Total: 23
Area Site Fire Pit Detected? Melted Plastic or rubber? Simpsons Island No Yes Indian Island Yes – 3 pits Yes - plastic and rubber
West Isles
Lords Cove No Yes Cummings Cove Yes – 1 pit Yes – plastic Passamaquoddy
Bay Pendelton Island Site No Yes L’Etang Harbour Fraiser Beach Yes ~ 2-3 pits Yes – melted rubber
Beaver Harbour Yes No Southwest NB coast Seelys Cove No Yes
170
Health of the Bay of Fundy: Assessing Key Issues
THE COMPARATIVE TOXICITY OF ORIMULSION® AND NO. 6 FUEL OILTO THE SEDIMENT DWELLING AMPHIPOD, Corophium volutator
Isabel C. Johnson1, Ken Doe2 and Paula Jackman2
1 Golder Associates Inc., Gainesville, FL. [email protected] Environment Canada, Environmental Science Centre, Moncton, NB.
Abstract
ORIMULSION® is a bitumen-based fuel being transported and used worldwide as an alterna-tive fuel for power plant electric generation. Based on the increased use of ORIMULSION® in electricpower production, a significant effort has been devoted to research on the potential fate and effects ofaccidental marine spills of this fuel.
ORIMULSION® is an emulsion of bitumen particles (70 percent) in water (30 percent); theemulsion of bitumen particles is maintained through the use of a surfactant (alcohol ethoxylate) and anemulsion stabilizer (monoethanolamine). Research carried out at numerous research centers, laborato-ries, and universities worldwide indicate that should an accidental spill of ORIMULSION® occur inthe marine environment, ORIMULSION® will initially dilute in the upper few meters of the watercolumn as a dispersion of bitumen particles, dissolved aromatic hydrocarbons and surfactant. Exten-sive research has been carried out on the chemical and physical characteristics of ORIMULSION® aswell as its potential ecological effects.
Environment Canada’s Toxicology Laboratory in Moncton and Golder Associates Inc. evalu-ated the effects of both ORIMULSION® and Fuel Oil No. 6 on the sediment dwelling amphipod,Corophium volutator, an important benthic species in the Bay of Fundy (New Brunswick and NovaScotia). Acute and long-term sediment toxicity tests were conducted using both fuels. The toxicity testsendpoints were survival and growth. Exposure sediment concentrations of both fuels were confirmedby chemical analysis conducted by Environment Canada, Ottawa. C. volutator was found to be rela-tively insensitive to either fuel, although Fuel Oil No. 6 was 3 times more toxic to C. volutator thanORIMULSION®.
Introduction
Sediments from a clean reference site, Walton Beach, located on the Bay of Fundy coast ofNova Scotia, were spiked with a series of concentrations of ORIMULSION® and Fuel Oil No. 6.Spiked sediments were tested for acute toxicity (survival) and long-term effects (growth) to the marineamphipod, C. volutator, using the standard Environment Canada 10-day growth test (EnvironmentCanada 1992). The ORIMULSION® test was extended to 20 and 40 days.
171
Session Five: Contaminants and Ecosystem Health
Spiked sediment toxicity tests were initiated immediately after spiking with either fuel. Sedi-ment exposure concentrations were confirmed by chemical analysis for polynuclear aromatic hydrocar-bons (PAH) and total petroleum hydrocarbons (TPH). These chemical analyses were conducted byEnvironment Canada, Environmental Technology Centre, Ottawa.
Methods and Materials
Control Sediment Collection, Handling, and Spiking
Control sediment was collected from Walton Beach, Nova Scotia, using new non-toxic contain-ers. A 30-L batch of the sediment was collected on January 19, 2002 and taken to the ToxicologyLaboratory of Environment Canada in Moncton, New Brunswick, on January 21, 2002. The sedimentwas sieved through a 1 mm sieve to remove indigenous organisms and large particles, and thoroughlyhomogenized. Sediment subsamples were removed for chemical characterization, the parameters testedwere: grain size, total organic carbon (TOC), metals, polychlorinated biphenyls (PCBs), and PAHs.The storage containers were filled to eliminate any air space, refrigerated (4 ± 3°C) and kept dark toassure minimal changes between collection and use for spiking sediment for toxicity tests.
Sufficient sediment was spiked through direct addition of weighted fuel at each test concentra-tion for all replicates of the toxicity test and additional samples for chemical confirmation of initialexposure concentrations. Chemical confirmation of exposure concentrations were conducted as: totalsolvent extractable material (TSEM) and TPH. The Environment Canada Laboratory, EnvironmentalTechnology Centre, Ottawa, Ontario (Wang 2002a and 2002b), conducted these analyses.
The control sediment was spiked on a weight: weight basis [weight of test material (Fuel OilNo. 6 or ORIMULSION®) to wet weight of control sediment]. The required amounts of sediment andtest material were measured and the weights recorded. The spiked sediment was mixed thoroughly byhand in stainless steel trays with stainless steel spoons for approximately 10 minutes. The spikedsediments were used immediately to set up toxicity tests with C. volutator and for test concentrationchemical confirmation.
The nominal test concentrations prepared for ORIMULSION® were: control, 108, 429, 1,620,6,450 and 12,900 mg/g. For the Fuel Oil No. 6 tests, the concentrations were: control, 32.3, 61.7, 434,1,560 and 6,600 mg/g. These test sediment concentration ranges were selected based on previous un-published sediment toxicity test data conducted by the authors using these two fuels and freshwateramphipods (Hyalella).
Test Materials
The ORIMULSION® was provided by Bitor America Corporation from a shipment received atNB Power’s Dalhousie Generating Station in New Brunswick, Canada. The ORIMULSION® wasreceived in a barrel, which was subsampled at Golder’s HydroQual Laboratories in Calgary, Alberta.

172
Health of the Bay of Fundy: Assessing Key Issues
Fuel Oil No. 6 was provided by New Brunswick Power, from a Fuel Oil No. 6 shipment received for useat the Coleson Cove Generating Station, near Saint John, NB. The Fuel Oil No. 6 originated from theUS Gulf coast. Both the ORIMULSION® and the Fuel Oil No. 6 were chemically characterized byEnvironment Canada’s Environment Technology Center, Ottawa.
Test Protocol
C. volutator were collected by Harris Industrial Testing Services of Mount Uniacke, Nova Scotiaon January 19, 2002 and held in the collection site sediment with minimal disturbance at their labora-tory until January 21, 2002. The sediment samples (including the test organisms) were at 5 to 10°Cupon arrival at Environment Canada’s laboratory and were acclimated to and maintained at 15 ± 2°Cand 30 ± 2 ppt salinity until used for testing. The tests were started on January 25, 2002.
On the day prior to starting the test, each concentration of test sediment was spiked using theprocedure described above. One-litre mason jars were used as test containers and each test containerreceived 175 mL of spiked sediments; five replicates were used for each treatment and control. The testcontainers were then filled with 800 mL of clean seawater (salinity was 28 ppt), covered, and aeratedovernight. The seawater was natural water collected at Pointe-de-Chêne, NB, and filtered through a 5Fm filter. Tests were conducted according to Environment Canada (1992) standard acute tests forsediments using marine amphipods.
On day 0 of the test, twenty amphipods were added to each of the test containers. Testing wasperformed with a 24-hour light photoperiod with lighting provided by overhead fluorescent fixtures atan intensity of 500 to 1000 lux. C. volutator testing was performed at 15 ± 1°C. Tests were checkeddaily for observations, aeration and temperature. Three times a week a replicate of each sample wasmonitored for temperature, pH, salinity and dissolved oxygen.
After 10 days, the contents of each test chamber were sieved through a 0.750 mm sieve.Amphipods were observed under a microscope; death was defined as lack of all movement when ob-served under a dissecting microscope for 5 to 10 seconds. Any amphipods missing were assumed to bedead. The mean percentage survival of amphipods exposed to each of the test sediments was statisti-cally compared to the mean percent survival of amphipods exposed to the clean lab control sedimentusing ANOVA statistics in the SigmaStat software (SPSS 1997). The LC50, the concentration thatcaused a 50% decrease in mortality, was estimated for each fuel using the program Toxstat version 3.5(West 1996).
In addition to the standard 10-day survival assay, six additional replicates of the control, 108and 429 mg/g ORIMULSION® were prepared and tested. Testing methods for these additional repli-cates was the same as the standard test with the following exceptions: tests organisms were fed, 10organisms were used per vessel instead of 20, test duration was longer, and organism weights weredetermined at test initiation. Starting on day 11 until test termination, each test vessel was fed 30milligrams of finely ground dry food three times a week. The food consisted of 50% Tetramin, 25%

173
Session Five: Contaminants and Ecosystem Health
Tetramarin and 25% Enteromorpha. Overlying water was occasionally renewed at approximately 90%of the volume. The test duration was 20-days for three of the replicates and 40-days for the remainingthree replicates.
On the day the tests were started, five trays of ten organisms each were rinsed with distilledwater and transferred to a tared weighing dish. The animals were dried at 60°C for at least 24 hours,cooled in a dessicator for 15 minutes and the dry weight of the test organisms was determined. Animalswere dried to constant weight (+ 0.05 mg).
All surviving amphipods at the end of these tests were treated in a similar manner. The survi-vors from any one replicate of each treatment were pooled and dry weights determined. The averageweights of test animals from that replicate were then calculated. The average dry weight of test organ-isms for all replicates of a treatment was compared to the control sediment using ANOVA statistics inSigmaStat statistical software (SPSS 1997) to determine if exposure to the sediment caused a signifi-cant decrease in organism weight.
Results and Discussion
The results of the standard 10-day bioassay with the marine amphipod, C. volutator, forORIMULSION®-spiked sediments are summarized in Table 1. A summary of calculated toxicityendpoints using nominal and measured concentrations is provided in Table 2. The mean survival of theamphipods in control sediment was 98%. These values meet acceptability criteria as defined in the testmethod (Environment Canada 1992). Significant decreases in survival were observed at 6,450 and12,900 Fg/g nominal ORIMULSION® test concentrations. The LC50 was estimated at 6,540 Fg/gORIMULSION®, or 2,840 Fg/g TSEM, or 1,030 Fg/g TPH (Wang 2002a).
The results of the 10-day bioassay with the marine amphipod, C. volutator, for Fuel Oil No. 6-spiked sediment are summarized in Table 3. A summary of calculated toxicity endpoints is provided inTable 4. The mean survival of the amphipods in control sediment for this test was 91%. These valuesmeet acceptability criteria as defined in the test method (Environment Canada 1992). Significant de-creases in survival were observed at 1,560 Fg/g nominal Fuel Oil No. 6 concentration. The LC50 wasestimated at 1,990 Fg/g nominal concentration; or 1,310 Fg/g expressed as measured TSEM; or 575Fg/g expressed as measured TPH (Wang 2002b). Based on these 10-day acute toxicity tests Fuel OilNo. 6 was found to be more toxic to the amphipod, C. volutator, than ORIMULSION®.
The results of the 20-day bioassay using ORIMULSION® with the marine amphipod, C.volutator, are provided in Table 5. The mean survival of the amphipods in control sediment after 20days was 86.7%. The two ORIMULSION® test concentrations had higher survival than the lab con-trols (93 and 100 % for the 420 and 108 Fg/g, respectively). The average weight of organisms at thestart of the test was 0.75 mg. After 20-days the control organisms’ average weight was 1.11 mg , themean weight of the organisms from the 108 and 429 F/g ORIMULSION® were 1.18 and 0.89 mg,respectively. All test organisms had increased in weight. Neither ORIMULSION® test concentrationhad weights significantly different from the lab control.
174
Health of the Bay of Fundy: Assessing Key Issues
The results of the 40-day bioassay with the marine amphipod, C. volutator were consideredinvalid, as all the control animals were dead. Twenty-three percent survival was observed in the 108Fg/g ORIMULSION® test concentration after 40 days.
Conclusions
The 10-day standard bioassay using ORIMULSION®-spiked sediments conducted with themarine amphipod, C. volutator showed a significant decrease in survival at 6,450 Fg/g nominal con-centration. The 10-day LC50 was estimated to be 6,540 Fg/g nominal ORIMULSION® in the sediments.The 10-day standard bioassay using Fuel Oil No. 6-spiked sediments with the marine amphipod, C.volutator, showed significant decreases in survival at 1,560 Fg/g nominal concentration. The LC50was estimated to be 1,990 Fg/g nominal Fuel Oil No. 6 in the sediments. Based on nominal concentra-tions, Fuel Oil No. 6 was 3 times more toxic than ORIMULSION® to the marine amphipod C. volutator.
For the 20-day bioassay with the marine amphipod, C. volutator, for ORIMULSION® spikedinto sediment at 108 and 429 Fg/g, there was no effect on survival and growth. The 40-day test with themarine amphipod, C. volutator, was not valid as there was no survival of control animals.
References
Environment Canada. 1992. Biological Test Method: Acute Test for Sediment Toxicity Using Marine orEstuarine Amphipods. Report EPS 1/RM/26. Environment Canada, Ottawa, ON.
SPSS Inc. 1997. SigmaStat Version 2.0 Statistical Software. SPSS Inc., Chicago, IL.
Stephan, C. E. 1977. Methods for calculating an LC50. Pages 65–84. In: Aquatic Toxicology and Haz-ard Evaluation. F. L. Mayer and J. L. Hamelink (Eds.). ASTM STP 634. American Society forTesting and Materials, Philadelphia, PA.
Wang, Z. 2002a. Technical Memorandum to K. Doe and I. Johnson. February 19, 2002. Reference #2002-07. Environment Canada, Environmental Technology Centre, Ottawa, ON.
Wang, Z. 2002b. Technical Memorandum to K. Doe and I. Johnson. February 24, 2002. Reference #2002-08. Environment Canada, Environmental Technology Centre, Ottawa, ON.
West Inc. 1996. Toxstat Version 3.5. Statistical Software. Western EcoSystems Technology Inc.,Cheyenne, WY.
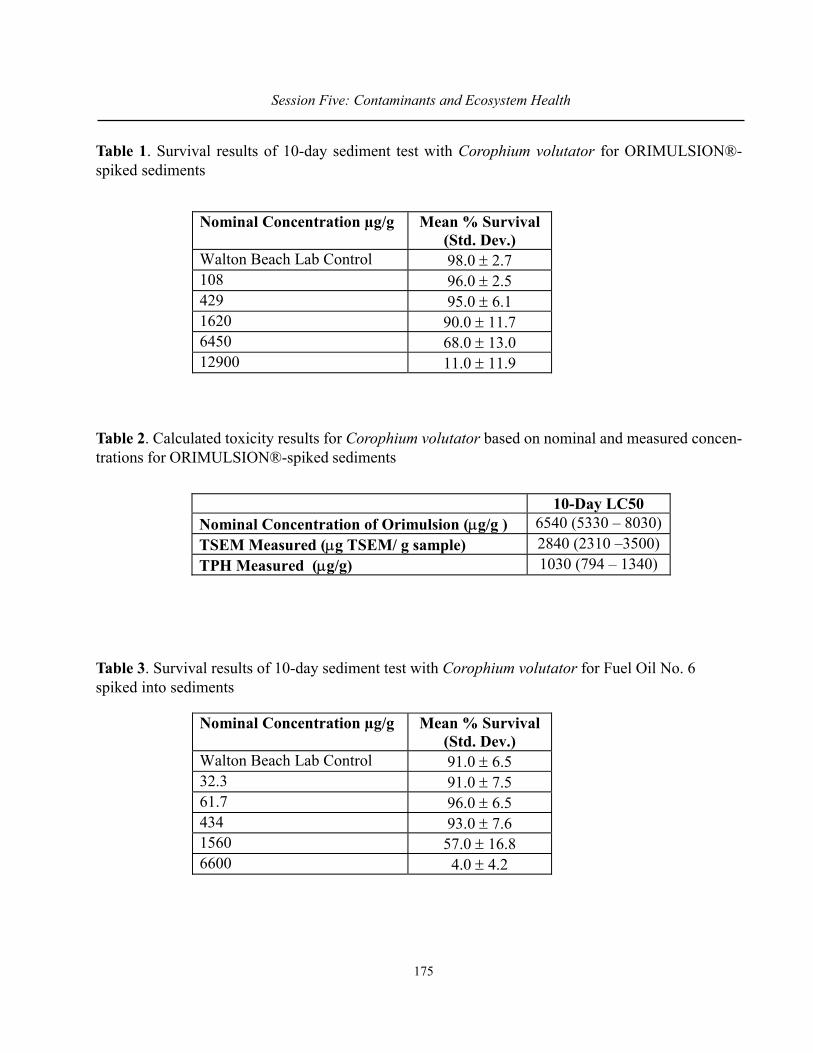
175
Session Five: Contaminants and Ecosystem Health
Table 1. Survival results of 10-day sediment test with Corophium volutator for ORIMULSION®-spiked sediments
Table 2. Calculated toxicity results for Corophium volutator based on nominal and measured concen-trations for ORIMULSION®-spiked sediments
Table 3. Survival results of 10-day sediment test with Corophium volutator for Fuel Oil No. 6spiked into sediments
10-Day LC50 Nominal Concentration of Orimulsion (µg/g ) 6540 (5330 – 8030) TSEM Measured (µg TSEM/ g sample) 2840 (2310 –3500) TPH Measured (µg/g) 1030 (794 – 1340)
Nominal Concentration µg/g Mean % Survival (Std. Dev.)
Walton Beach Lab Control 91.0 ± 6.5 32.3 91.0 ± 7.5 61.7 96.0 ± 6.5 434 93.0 ± 7.6 1560 57.0 ± 16.8 6600 4.0 ± 4.2
Nominal Concentration µg/g
Mean % Survival (Std. Dev.)
Walton Beach Lab Control 98.0 ± 2.7 108 96.0 ± 2.5 429 95.0 ± 6.1 1620 90.0 ± 11.7 6450 68.0 ± 13.0 12900 11.0 ± 11.9
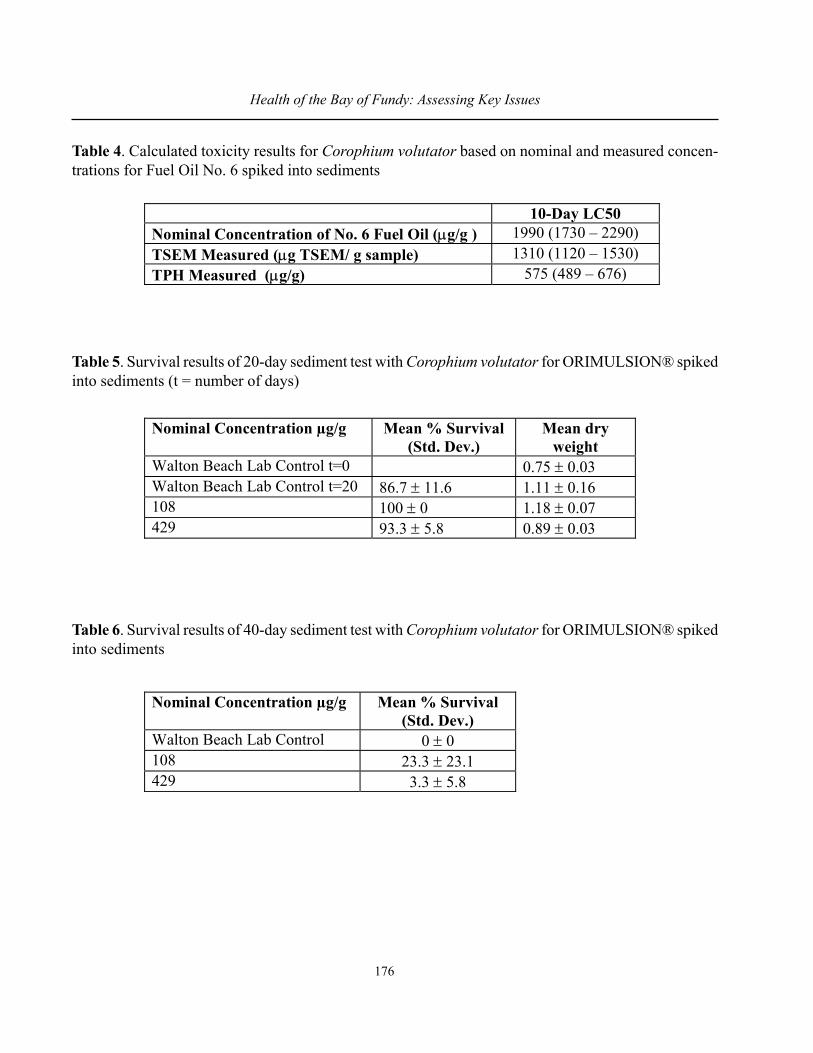
176
Health of the Bay of Fundy: Assessing Key Issues
Table 4. Calculated toxicity results for Corophium volutator based on nominal and measured concen-trations for Fuel Oil No. 6 spiked into sediments
Table 5. Survival results of 20-day sediment test with Corophium volutator for ORIMULSION® spikedinto sediments (t = number of days)
Table 6. Survival results of 40-day sediment test with Corophium volutator for ORIMULSION® spikedinto sediments
10-Day LC50 Nominal Concentration of No. 6 Fuel Oil (µg/g ) 1990 (1730 – 2290) TSEM Measured (µg TSEM/ g sample) 1310 (1120 – 1530) TPH Measured (µg/g) 575 (489 – 676)
Nominal Concentration µg/g Mean % Survival (Std. Dev.)
Mean dry weight
Walton Beach Lab Control t=0 0.75 ± 0.03 Walton Beach Lab Control t=20 86.7 ± 11.6 1.11 ± 0.16 108 100 ± 0 1.18 ± 0.07 429 93.3 ± 5.8 0.89 ± 0.03
Nominal Concentration µg/g Mean % Survival (Std. Dev.)
Walton Beach Lab Control 0 ± 0 108 23.3 ± 23.1 429 3.3 ± 5.8
177
Session Five: Contaminants and Ecosystem Health
ASSESSING NUTRIFICATION IN THE BAY OF FUNDY:SEAWEEDS AS EXCELLENT BUT UNDERUTILIZED
BIOINDICATORS FOR INTEGRATED COASTAL MANAGEMENT
Thierry Chopin1,2, Ellen Belyea1,2, Christopher Pearce3,1, Tara Daggett1,3, Gary Saunders2
and Colin Bates2
1 Centre for Coastal Studies and Aquaculture, University of New Brunswick, Saint John, [email protected]
2 Centre for Environmental and Molecular Algal Research, University of New Brunswick,Fredericton, NB. [email protected] and [email protected]
3 Ross Island Salmon Ltd., Grand Manan, NB.
One of the most difficult tasks scientists, resource managers and policy advisors face whenassessing the health of coastal ecosystems is understanding their assimilative capacity under cumula-tive pressure as anthropogenic activities increase in the coastal zone (sewage effluents, urban/ruraleffluents, precipitations, agricultural/industrial runoffs, aquaculture, etc.). The inorganic output of theseactivities is presently emerging as a pressing issue as nutrification of coastal waters is a worldwidephenomenon which does not spare the Bay of Fundy.
Assessing nutrification through seawater analyses can rapidly become a nightmare in highlydynamic systems, such as the Bay of Fundy, due to sampling logistics. Our results demonstrate thatseaweeds can be excellent bioindicators of nutrification because they are integrators of bioavailablenutrients over time. They can also be very useful tools for measuring the zone of influence of anaquaculture site. Our results will also emphasize the need to carefully choose the species selected asbiomonitors (benthic, reasonably abundant, easy to identify and sample near the low tide level, largeenough for analysis, tolerant of handling stress, resistant to a wide range of environmental conditions,and net accumulators of nutrients of interest without rapid saturation of algal tissues).
Considering seaweeds as renewable biological nutrient scrubbers allows for an understandingof one of their fundamental roles in coastal ecosystems, and validates their sustainable harvesting andtheir use for bioremediation and diversification in integrated aquaculture systems.
178
Health of the Bay of Fundy: Assessing Key Issues
THE HELMINTH COMMUNITIES OF FIVE SHOREBIRD SPECIESIN THE BAY OF FUNDY, NEW BRUNSWICK, CANADA
Andy S. Didyk1 and Michael B. D. Burt2
1 Faculty of Biology, University of New Brunswick, Moncton, NB. [email protected] Department of Biology, University of New Brunswick, Fredericton, NB. [email protected]
As part of a larger study examining the helminth communities of five sympatric species ofnearctic shorebirds collected at major stops along their entire migratory routes, 61 helminth species,comprising 23,668 individuals, were recovered from Least Sandpipers, Calidris minutilla (Vieillot),Semipalmated Sandpipers, C. pusilla (L.), Lesser Yellowlegs, Tringa flavipes (Gmelin), Short-billedDowitchers, Limnodromus griseus (Gmelin), and Semipalmated Plovers, Charadrius semipalmatusBonaparte, collected in the Bay of Fundy, New Brunswick, Canada. The most common and most abun-dant helminth species were the digeneans Maritrema subdolum and Spelotrema papillorobustum; to-gether the two species accounted for over 85% of all helminths recovered. Prevalence of infection washigh as 170 of 193 bird hosts (88.1%) were infected with an average of three helminth species. Theintensity of infections varied among the different hosts, being highest in Semipalmated Plovers andlowest in Semipalmated Sandpipers. The helminth communities of Least and Semipalmated Sandpi-pers and Lesser Yellowlegs exhibited high similarity as did the helminth communities of Short-billedDowitchers and Semipalmated Plovers. These similarities can be explained in terms of the importanceof the burrowing amphipod, Corophium volutator Pallas, in the diets of the staging shorebirds.
179
Session Five: Contaminants and Ecosystem Health
ANNAPOLIS RIVER GUARDIANS:REFLECTIONS ON A DECADE OF VOLUNTEER
WATER QUALITY MONITORING
Stephen Hawboldt and Shelley Pittman
Clean Annapolis River Project, Annapolis Royal, NS. [email protected]
The Clean Annapolis River Project (CARP) is a charitable, non-governmental organizationcreated to work with communities and organizations to foster the conservation, restoration and sustain-able use of the freshwater and marine ecosystems of the Annapolis watershed. Since its founding inMarch 1990 and its subsequent invitation in October 1991 to participate in the Atlantic Coastal ActionProgram (ACAP), the organization has initiated nearly 100 projects related to volunteer-based waterquality monitoring, environmental quality assessment, coastal zone management, fish habitat restora-tion, sustainable agriculture, environmental education, private stewardship, and conservation planning.The group has been honoured with several regional and international environment awards and used asa model for community-based environmental management at local, regional, national, and interna-tional levels.
With scientific support from the Acadia Centre for Estuarine Research and several other part-ners, CARP launched the Annapolis River Guardians, the first volunteer-based water quality monitor-ing program in Atlantic Canada, likely one of the first in the nation. In the past decade, approximately200 volunteers have participated in the collection of over 2,000 water samples and created a verycomprehensive picture of water quality issues in the Annapolis River and its tributaries.
The presentation will include a description of the program and how it has evolved over thedecade. Based on that background, the focus will be on the lessons learned about water quality in theAnnapolis and on the operations of a long-term, volunteer-based, water quality monitoring program.What are the strengths? What are the challenges? What could be done differently? How can volunteerwater quality monitoring programs lead to enhanced understanding by the general public of scientificprinciples and environment issues?
180
Health of the Bay of Fundy: Assessing Key Issues
THE CANADIAN COMMUNITY MONITORING NETWORK (CCMN)
Marieka Arnold
Canadian Community Monitoring Network, New Brunswick Federation of Naturalists,Fredericton, NB. [email protected]
Every day, Canadian coastal communities are exposed to many human-induced stresses, in-cluding harmful pollutants in our air, land and water. Knowing where and how our ecosystems arebeing affected by these multiple stresses—and what we can do to minimize their impacts on biodiversityand the sustainability of our resource-based economy— is crucial to our well-being, and the well-beingof all other biotic and abiotic components in our ecosystems.
The Canadian Community Monitoring Network (CCMN) was formed as a partnership betweenthe Canadian Nature Federation (CNF) and the Ecological Assessment and Monitoring Network (EMAN)of Environment Canada. As a regional co-ordinator with CCMN, we will involve Bay of Fundy coastalcommunities in our pilot project. One of our goals is to provide access at the community level toconsistent and well-developed tools for monitoring projects.
Within our first year we intend to meet with all interested stakeholders in each of the selectedcoastal communities and work together with the goal of establishing a new monitoring project in eachcommunity. We hope to involve and build the capacity of communities to address ecosystem and hu-man health. There are many monitoring tools currently in place and as a CCMN regional co-ordinatorwe will strive to share and standardize ecosystem monitoring at the local community level. In addition,CCMN aims to share/provide the tools that relate ecosystem sustainability and change to policy devel-opment.
181
Session Five: Contaminants and Ecosystem Health
PANEL DISCUSSION
Chair: Larry HildebrandRapporteur: Megan Trites-Tolson
Panellists: Members of audience
Question 1. What would be an appropriate integrated monitoring and research system for the Bay ofFundy? a) What are the best indicators to assess ecosystem health? b) Who should be involved in thismonitoring and research agenda?
We need to look at the many different regions around the Bay of Fundy because each area may havedifferent priorities or concerns. Communities need to be brought together with other ones facing simi-lar problems to share their concerns and resources.
Monitoring requires end points. What are the most appropriate measurements of change and who shoulddo the monitoring of these? How much can be done and by whom should it be done?
Students could be involved in monitoring projects in inter-tidal areas where sampling is somewhateasier and relatively inexpensive. However, once you move away from the shore into deeper water,there are increasing technical difficulties involved in sampling. In addition, it becomes much morecostly because of the need for ship support and more sophisticated sampling gear.
Question 2: Is what we’re doing in the Bay of Fundy good enough? Are we finding the solutions?
We need to look much further ahead down the road. We should be assessing how current developmentswill impact the area 20 to 50 years from now. Some ecological effects may be evident now, but othersmight only emerge sometime in the future.
We have to identify the problem, determine what is causing it and then find the resources to fix it.Physicians know that certain symptoms can indicate a specific health problem. They assess the symp-toms, give a diagnosis, and then start treating the problem to restore the patient’s health. We need tolook at the Bay of Fundy in the same way. What is it that we can measure that would be diagnostic andalso make a convincing case to gain support for making progress in resolving the environmental prob-lem?
Possible solutions are not being recognized or accepted by the people who could do something aboutthe problems. We need indicators that are unequivocal and will be widely accepted. A series of meas-urements is required that will help determine the causes of environmental changes so we can cure theproblems instead of simply going round in circles year after year.

182
Health of the Bay of Fundy: Assessing Key Issues
The work that is going on at present is relatively small-scale and does not trigger ACTION. Monitoringwould help to raise the profile of particular issues and elevate them on the political agenda.Perhaps as a group, we need to make the bold statement that we already know what many of theproblems are. We can still continue to do further research on these issues, but the time has also come tomove forward and take action.
“Assimilation capacity” is an important ecological concept pertaining to human impacts on the envi-ronment. However, finding the right balance is difficult on a regional scale.
In terms of climate change, we have a general sense of the sorts of ecological effects that may becoming, but we do not yet have definitive indicators of change. There are mechanisms to gauge risk. Ifyou are able to gauge the risk then some relative value can be placed on issues. Without this it is hard totake action on the planning side of Risk Management. Let’s determine how climate change may affectthe health of the Bay of Fundy and then take action to protect ourselves from any major future risks thatare identified.
There is a long history of environmental stress in the Bay of Fundy. The situation is comparable to aboat with a hole in it – you can continue to bail out the water, but it will keep coming in until you fix thehole. We cannot just continue monitoring; we have to try to fix some of the problems.
Question 3. What is the purpose of monitoring?
Some of the reasons to carry out monitoring programs include the protection of human health and toprotect the ecological integrity of the ecosystem. Sometimes “comfort monitoring” is engaged in, largelyto appease the public by giving the impression that something is being done to solve the problem. Thisis often just a way to buy time and to justify doing even more research and monitoring before making adecision about the issue. Other types of monitoring are carried out for regulatory purposes, such asrestricting effluent discharge.
Question 4. Can questions 1a and 1b serve as a framework for a monitoring program?
In any monitoring program there has to be a predetermined trigger point at which action should betaken. When that point is reached then you have to do something about the cause of the problem. Theresponse or action may involve mitigating the impacts, restoring the ecosystem or pushing for appro-priate social change.
Question 5. What do we need to go forward?
Unfortunately, we are still battling many of the same environmental issues over time without seemingto make any progress. We need to narrow the focus down to a few bioindicators that can be widely used.We also need to define thresholds for these indicators that will specify when we should begin to react toparticular environmental changes.
183
Session Five: Contaminants and Ecosystem Health
However, do we really have enough regional information to take such a bold step forward? We need aniterative process whereby we make a decision, monitor the indicators and then keep making furtherdecisions, so that we make progress while continually updating the decision-making framework.
The real problem is a lack of adequate funding and the inability to enforce existing regulations. By andlarge, we already know what some of the major problems are and what needs to be done to resolvethem.
Should we continue monitoring, if only to keep particular issues alive and in the public eye, so thatpeople do not simply assume the problem is solved or unimportant and can thus be ignored?

184
Health of the Bay of Fundy: Assessing Key Issues

Session Six
COROPHIUM ANDMUDFLAT ECOLOGY
Chair: Diana Hamilton, Atlantic Cooperative WildlifeEcology Research Network and Department of Biology,
University of New Brunswick, Fredericton, New Brunswick

186
Health of the Bay of Fundy: Assessing Key Issues

187
Session Six: Corophium and Mudflat Ecology
SPATIAL AND TEMPORAL VARIATION OF SUSPENDED SEDIMENTCONCENTRATION IN THE CUMBERLAND BASIN, BAY OF FUNDY,
CANADA
Jeff Ollerhead1, Jennifer F. Parry2 and Robin G.D. Davidson-Arnott2
1 Department of Geography, Mount Allison University, Sackville, NB. [email protected] Department of Geography, University of Guelph, Guelph, ON.
Abstract
A field investigation of variation in suspended sediment concentration (SSC) was conductedover a three-month period during the summer of 2000 at several salt marshes in the Cumberland Basin,Bay of Fundy, Canada. The purpose of the study was to examine some geomorphic controls affectingspatial and temporal variation in SSC. Five marshes were selected along the west side of the CumberlandBasin, representing a diversity of marsh morphologies. Rising stage bottles were deployed to collectsamples of SSC over the duration of individual tidal cycles and wind speed and direction were meas-ured continuously. Mean wave height was predicted for both the marshes and the mouth of the Basinfor each deployment. The results indicate that regional wave height is a key control on SSC at marshesthroughout the Basin and that tidal amplitude is a less influential control. Variation in local wave heightand differences in marsh morphology were found to be minor controls on variation in SSC betweenmarshes.
Introduction
The purpose of this study was to investigate some geomorphic controls influencing the spatialand temporal variation in suspended sediment concentration over a selection of salt marshes in theCumberland Basin, Bay of Fundy. It was hypothesized that suspended sediment concentration is afunction of local and regional wave height and tidal amplitude. The objectives of the study were to: 1)measure the spatial and temporal variation of suspended sediment concentration and temporal varia-tion in wind velocity along the Cumberland Basin at the scale of a tidal cycle; 2) predict wave heightand monitor tidal amplitude; and 3) examine the relationships between each geomorphic control andconcentrations of suspended sediment in the salt marshes of the Cumberland Basin.
Study Area
The study was conducted in the Cumberland Basin, Bay of Fundy (Figure 1). The Bay is char-acterized by a high concentration of suspended sediment (approximately 0.3 g/litre), which is subject toseasonal variation (Ollerhead et al. 1999). This sediment is derived from cliff line erosion of Paleozoicmudstone and sandstone and an eroding seabed of laminated silts and clays (Amos 1987). The sus-pended sediment is composed of 95% coarse silt, 2.5% clay and 1.5% sand, with a mean grain size of4.8 phi (0.036 mm) (van Proosdij et al. 1999). High sediment supply and large tidal range has allowed

188
Health of the Bay of Fundy: Assessing Key Issues
for the development of extensive salt marshes, mudflats and sandflats. Presently, the Bay of Fundy iscomposed of 17% salt marshes, 40% mudflats and 43% sandflats (Amos and Tee 1989).
The Cumberland Basin is an 118 km2 turbid estuary, with a semi-diurnal tide ranging between 10–13m. Salt marshes in the Basin are exposed to fetches that range from < 5 km to > 20 km, which maycontribute to observed differences in the morphology of the marshes. The dominant wind in thesummer is from the southwest with an average wind speed of 15 km/hr.
The five marshes chosen for the study are located at Pecks Cove (PC), West Allen Creek (AC),Westcock (WC), Tantramar (TR) and Fort Beauséjour (FB) (Figure 1). Marshes at Pecks Cove andWest Allen Creek are characterized by a gentle slope that is maintained across the marsh surface andextends out onto the mudflats. Located low in the tidal frame, both marshes are inundated with everytide. The dominant vegetation is a low marsh species, Spartina alterniflora.
The marshes at Westcock and Fort Beauséjour are similar, however quite different from PecksCove and West Allen Creek marshes. Westcock and Fort Beauséjour Marshes are both bounded by anearthen dyke at the back and sides and a two-tier marsh cliff approximately two m high delimits theseaward extent of the marshes. They sit significantly higher in the tidal frame than the marshes at PecksCove and West Allen Creek and are only inundated during very high spring tides. The dominant vegeta-tion is Spartina patens; Triglochin maritimum, Plantago maritima, Puccinellia maritima, Atriplex patula,Juncus gerardii, and Distichlis spicata are also found on these marshes.
Tantramar Marsh is similar to Westcock and Fort Beauséjour Marshes, but with some importantdifferences. Tantramar marsh is located approximately 2.25 km upstream from the mouth of the TantramarRiver, which is essentially a very large tidal creek at the head of the Cumberland Basin. Infrequentlyflooded, this marsh is characteristically composed of high marsh vegetation; however, at the base of thesmall cliff (approximately 0.3–0.5 m high) bounding the seaward extent of the high marsh is a narrowband of low marsh.
Methods
This study was carried out over an 8-week period between May 31 and July 22, 2000. Over thetemporal scale of a tidal cycle, measurements of suspended sediment concentration (SSC) and windspeed and direction were made. Rising stage bottles were used to collect samples of water and sus-pended sediment. Samples were filtered through 9-cm-diameter qualitative filter paper with a pore sizeof 1 µm. SSC was then calculated in mg/L.
Wind data collected at Amherst, Nova Scotia by the Atlantic Climate Centre, EnvironmentCanada were the primary source of wind speed and direction data for this study. Supplementary winddata were collected by a Davis Instruments anemometer and wind vane mounted on the rooftop of atwo-story house situated along the shore of the Cumberland Basin between West Allen Creek Marshand Westcock Marsh.
189
Session Six: Corophium and Mudflat Ecology
Wind speed, wind direction and fetch are required to predict significant wave height. Windspeed and wind directions were averaged for six hours prior to each high tide. Fetch was determinedfrom a 1:50 000 map of Amherst, New Brunswick/Nova Scotia (21 H/16, Edition 3) and a 1:250 000map of Amherst (21 H, Edition 3), both published by Natural Resources Canada. Significant waveheight was predicted using the averaged wind speed and wind direction, calculated fetch, and the ACES™(Automatic Coastal Engineering System) software of the U.S. Army Corps of Engineers. Significantwave height was calculated for the 6-hour period prior to high tide for each marsh.
Non-parametric statistical analyses were used to examine relationships between SSC and vari-ous geomorphic controls. Spearman’s rank-difference correlation was used to determine the degree ofassociation between variables. The Wilcoxon matched-pairs, signed ranks test was used to determine ifthere were significant differences between data sets. All statistics were calculated at the 90% confi-dence level.
Results
Variation in Suspended Sediment Concentration (SSC)
Using non-parametric statistical tests, variation in SSC between sites was analyzed. A strong tomoderate significant correlation was found between SSC for all sites with the exception of TantramarMarsh (Table 1). Lack of correlation between Tantramar Marsh and the other four sites suggests thatgeomorphic controls affecting SSC at Tantramar may be different or at least partially different thanthose affecting the remaining sites. The significant correlations between the sites (excluding Tantramar)suggest that these sites are collectively influenced to some degree by one or more geomorphic controls.
Of those sites with significantly correlated SSC, however, results indicate significant differ-ences in SSC between all sites, with the exception of Pecks Cove and Fort Beauséjour, and West AllenCreek and Westcock Marshes. It is important to note, however, that just because these sites are notstatistically different in terms of SSC, it does not mean that their comparable levels of SSC arise by thesame geomorphic controls. Based on these results it may be suggested that, although some controlsmay influence all sites, other controls are site specific allowing for local variation in SSC to occur.
In the scatterplots developed to illustrate the nature of these relationships, an outlier was dis-covered for July 5, 2000 (Julian day 186). This day was characterized by low wave height and low toaverage SSC at Pecks Cove and West Allen Creek Marshes. However, very high SSC was measured atWestcock and Fort Beauséjour Marshes (Figure 2). A thunderstorm with heavy intermittent rain passedover the upper portion of the Cumberland Basin during data collection. Thus, the outlier suggests thatrainfall may be an important geomorphic control on SSC. However, with only one observation, thiscontrol could not be further explored and the data for day 186 were excluded from the data set forsubsequent analyses.

190
Health of the Bay of Fundy: Assessing Key Issues
Variation in SSC as a Function of Local and Regional Wave Height
One of the geomorphic controls that may contribute to local variation in SSC is local waveheight (i.e., wave height predicted for the marsh margin). In a correlation of predicted significant waveheight for the marsh margin and SSC for each marsh, only West Allen Creek exhibited a significantcorrelation (r = 0.43), while the remainder of the sites showed no significant relationship between lo-cally generated significant wave height and SSC. However, when wind speed alone was correlated withSSC for each marsh, all relationships were significant (Table 2). This suggests that waves generatedelsewhere, perhaps at the mouth of the basin, are the dominant control on the level of SSC at themarshes.
Predicted significant wave height was calculated for an arbitrary point centred in the mouth ofthe Cumberland Basin. When predicted significant wave height was correlated with SSC, a significantstrong to moderate relationship was found at all sites but Fort Beauséjour (Table 2). The results of thesetests reveal the importance of regional waves to the level of SSC observed at the marsh margins; inother words, waves at the mouth of the basin account for a significant amount of the variation in SSCthroughout the Basin.
Variation in SSC as a Function of Tidal Amplitude
While regional waves appear to be the primary mechanism influencing SSC, tidal amplitudemay also play an important, albeit lesser role, in influencing levels of suspended sediment throughoutthe Basin. It was expected that higher current velocities, which occur during spring tides, would in-crease SSC. A correlation of tidal amplitude and SSC suggests that SSC at Westcock and Fort BeauséjourMarshes is moderately influenced by variation in tidal amplitude (Table 2). SSC at Pecks Cove andWest Allen Creek Marshes exhibited low to no relationship with tidal amplitude. However, scatter inthe data may be attributed to the influence of regional waves and other geomorphic controls, whichmay mask any relationship between SSC and tidal range. SSC remained relatively constant at TantramarMarsh regardless of variation in tidal amplitude.
Conclusions
Suspended sediment concentrations in the Cumberland Basin are the result of complex interre-lationships between various geomorphic controls. These results suggest that regional waves generatedat the mouth of the Cumberland Basin are the dominant factor influencing SSC throughout the Basin.Differences remain, however, in the absolute levels of SSC at each marsh. These differences may beattributed to several other variables. The contribution of locally generated waves to suspending sedi-ment is well recognized in the literature, as is the role of tidal currents (e.g., see van Proosdij et al.2000). The importance of rainfall in increasing SSC is suggested by the anomalous data for Julian day186. Furthermore, because the morphology of the chosen marshes differed throughout the Basin, itcannot be ruled out as an influential factor.
191
Session Six: Corophium and Mudflat Ecology
Acknowledgements
We thank Michelle Zehr, Jaime Dawson, Danika van Proosdij and Erin Whitley for their assist-ance in the field. The research was supported by research grants from the Natural Sciences and Engi-neering Research Council (NSERC) to JO and RD-A, and by a Latornell Graduate travel scholarshipand Ontario Graduate Scholarship in Science and Technology to JP.
References
Amos, C. L. 1987. Fine-grained sediment transport in Chignecto Bay, Bay of Fundy, Canada. Conti-nental Shelf Research 7: 1295–1300.
Amos, C. L. and K. T. Tee. 1989. Suspended sediment transport processes in Cumberland Basin, Bay ofFundy. Journal of Geophysical Research 94: 14407–14417.
Ollerhead, J., D. van Proosdij, and R. G. D. Davidson-Arnott. 1999. Ice as a mechanism for contribut-ing sediments to the surface of macro-tidal salt marsh, Bay of Fundy. Pages 345–358. In: Pro-ceedings of the 1999 Canadian Coastal Conference, 19-22 May 1999, Royal Roads University,Victoria, BC. Volume I. C. J. Steward, Ed. Canadian Coastal Science and Engineering Associa-tion, Ottawa, ON.
van Proosdij, D., J. Ollerhead, R. G. D. Davidson-Arnott, and L. Schostak. 1999. Allen Creek Marsh,Bay of Fundy: A macro-tidal coastal salt marsh. The Canadian Geographer 43: 316–322.
van Proosdij, D., J. Ollerhead, and R. G. D. Davidson-Arnott. 2000. Controls on suspended sedimentdeposition over single tidal cycles in a macrotidal salt marsh, Bay of Fundy, Canada. Pages 43–57. In: Coastal and Estuarine Environments: Sedimentology, Geomorphology and Geoarchaeology.K. Pye and J. R. L. Allen (Eds). Special Publication 175. Geological Society, London.

192
Health of the Bay of Fundy: Assessing Key Issues
Table 1. Correlation between samples of SSC from different marshes. Significant correlations are inbold italics (90% confidence level).
Table 2. Correlation between SSC at each marsh and wind speed, predicted local significant waveheight, predicted regional significant wave height, and tidal amplitude. Tantramar Marsh (TR) was notincluded in the correlations for wind speed or local wave height as there were no waves at this site.Significant correlations are in bold italics (90% confidence level).
Marsh Wind speed Predicted local Predicted regional Tidal significant wave height significant wave height amplitude
PC 0.49 -0.16 0.62 0.34 AC 0.80 0.43 0.80 0.23 WC 0.45 0.35 0.53 0.40 TR n/a n/a 0.64 0.13 FB 0.46 0.36 0.39 0.67
Variable pairs Spearman's R PC and AC 0.60 PC and WC 0.51 PC and TR 0.39 PC and FB 0.43 AC and WC 0.70 AC and TR 0.46 AC and FB 0.68 WC and TR 0.43 WC and FB 0.80 TR and FB 0.61
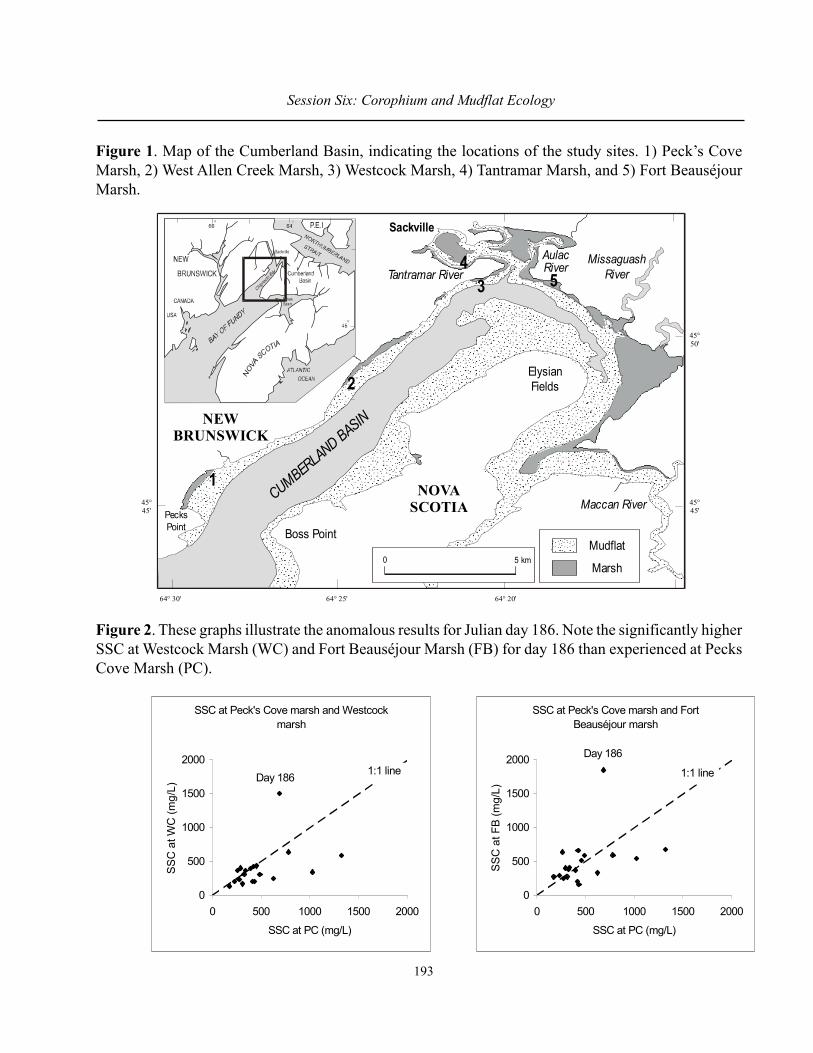
193
Session Six: Corophium and Mudflat Ecology
Figure 1. Map of the Cumberland Basin, indicating the locations of the study sites. 1) Peck’s CoveMarsh, 2) West Allen Creek Marsh, 3) Westcock Marsh, 4) Tantramar Marsh, and 5) Fort BeauséjourMarsh.
Figure 2. These graphs illustrate the anomalous results for Julian day 186. Note the significantly higherSSC at Westcock Marsh (WC) and Fort Beauséjour Marsh (FB) for day 186 than experienced at PecksCove Marsh (PC).
SSC at Peck's Cove marsh and Fort Beauséjour marsh
0
500
1000
1500
2000
0 500 1000 1500 2000
SSC at PC (mg/L)
SSC
at F
B (m
g/L)
1:1 line
Day 186
SSC at Peck's Cove marsh and Westcock marsh
0
500
1000
1500
2000
0 500 1000 1500 2000
SSC at PC (mg/L)
SSC
at W
C (m
g/L)
1:1 lineDay 186
CUMBERLAND BASIN
NOVASCOTIA
NEWBRUNSWICK
45°45'
45°45'
64° 30' 64° 25' 64° 20'
45°50'
ElysianFields
Sackville
MissaguashRiver
AulacRiver Tantramar River
Maccan River
Boss PointPecksPoint
0 5 kmMudflat
Marsh
1
2
34
5
194
Health of the Bay of Fundy: Assessing Key Issues
CONCEPTUAL MODEL OF THE SEASONAL AND SPATIAL CONTROLSON SEDIMENT DEPOSITION AND EROSION IN AN UPPER BAY OF
FUNDY SALT MARSH
Danika van Proosdij1, Robin G.D. Davidson-Arnott2 and Jeff Ollerhead3
1 Department of Geography, Saint Mary’s University, Halifax, NS. [email protected] Department of Geography, University of Guelph, Guelph, ON. [email protected]
3 Department of Geography, Mount Allison University, Sackville, NB. [email protected]
This paper presents results from a field study on the controls on the sediment budget of AllenCreek Marsh in the upper Cumberland Basin. Temporal and spatial variations in flow, suspended sedi-ment concentration (SSC) and sediment deposition were measured over single tidal cycles across themarsh surface. Data were collected over a range of tidal heights, wave conditions and vegetation char-acteristics. These data were combined with seasonal measurements of erosion and accretion into aconceptual model illustrating the seasonal and spatial patterns of the major mechanisms of accretionand erosion across the marsh surface at Allen Creek Marsh. Erosion occurs primarily through a cycle ofundercutting and block failure at the marsh margin. The dominant controls on sediment deposition varyseasonally: (winter) ice and high SSC; (spring) melting ice blocks, calm water with high SSC; (sum-mer) high SSC, calm water and (fall) high SSC from wave activity, high relative roughness of vegeta-tion to dampen wave energy. The relative significance of these processes will vary above and below themean high water line.
This empirically derived conceptual model demonstrates that the processes of erosion and depo-sition on the marsh surface exhibit considerable spatial and temporal variability. As a result, predictingmarsh ‘survival’ in the face of global warming scenarios cannot be achieved using single deterministicfunctions nor data collected using SET (sediment elevation table or sedimentation table) or markerhorizon data alone. Spatial and temporal variations in the processes of erosion and deposition must beincorporated into any predictive numerical models to be developed.

195
Session Six: Corophium and Mudflat Ecology
MUDFLAT DIATOMS IN THE BAY OF FUNDY:WHAT IS KNOWN ABOUT THEM?
Irena Kaczmarska and Marsha Trites
Department of Biology, Mount Allison University, Sackville, [email protected] and [email protected]
With lack of visible vegetation, mudflats appear to be barren. Upon closer examination, how-ever, it becomes evident that this impression is untrue. In addition to migratory shorebirds, epi- andinfaunal invertebrates, there is also a myriad of microorganisms living in and on the sediments. Thisattests to mudflats being diverse and productive ecosystems, or “secret gardens of unvegetated, shal-low-water marine habitats” (MacIntyre et al. 1996; Underwood and Kromkamp 1999). Mudflats ac-count for one third (or more) of the primary production in some shallow water estuaries (Pickney andZingmark 1993). In the upper Bay of Fundy, the amphipod Corophium volutator is considered a key-stone invertebrate species in the intertidal mud-flat community (Hicklin et al. 1980; Daborn et al.1993). This mud shrimp provides an essential ecological link between migratory shorebirds and themicrobial community in the sediments. Corophium, as many other tidal flat herbivores, thrive when thesediments are of optimal structure and contain favored psammic and epipelic microbial gardens (Jensenand Siegismund 1980; Créach et al. 1997; Underwood and Smith 1998). In the temperate latitudes,diatoms dominate such biofilms (Admiraal and Peletier 1980; Vos et al. 1988). Although significanceof microbial biofilms in a great variety of benthic environments worldwide is well established, verylittle is known about the structure and composition of these communities in North American mudflats(Table 1). Our data indicate that even closely located mudflats may differ significantly in compositionand abundance of diatom assemblages. Several seminal studies in this field were conducted either inthe laboratory or on European coasts where quantitative assessments were based on measurements ofchlorophyll a, polysaccharides or generic affinity of the native flora and fauna (Paterson 1989 and1990). In fact, little has changed since the 1980s when Admiraal (1984) pointed out the scarcity ofknowledge of the physiology and ecology of individual species of benthic diatoms.
Two different microhabitats occur within mudflat sediments, each with its own assemblage ofresident microalgae. In the upper Bay of Fundy, diatoms dominate these habitats, although euglenophytes,other colored micro-flagellates and cyanobacteria are also present. Here we will limit dicussion todiatoms. The first microhabitat is the sediment grains to which diatoms attach, e.g., sand grains, andremain sessile throughout their lifetime. This is the epipsammon and in the upper Bay of Fundy Delphineissurirella and Rhaphoneis amphiceros most often occupy this habitat.
Secondly, capillary spaces between sediment grains provide a three-dimensional network ofinterspaces. An assemblage of diatoms (called tychoplankton) which are immobile, suspended and/ortrapped between sediment particles inhabit this capillary network. These species await resuspensioninto position close to the sunlight in the sediments or in the water column. A more specialized categoryof these diatoms is the surfing species, whose life history cycles between benthic and planktonic stages.

196
Health of the Bay of Fundy: Assessing Key Issues
For example, a native Actinoptychus senarius is found living as a single-cell organism while in thesediments but at times develops organic “skirts” around cells to facilitate formation of plate-like colo-nies. In this colonial form A. senarius exists suspended in the water column as a temporary member ofthe phytoplankton. When colonies disaggregate, cells return to the benthic environment.
Lastly, through the same microcapillary net, motile (epipelic) diatom species migrate vertically,depending on light and tidal cycle (Palmer and Round 1967; Round 1971). These diatoms may concen-trate at the sediment surface at low tide on a sunny day, making a spectacular display of golden-brownpatches (Peterson 1986). Raphid diatoms with naviculoid and nitzschioid morphologies dominate thismicrohabitat. Locally, several species from the genus Gyrosigma and Nitzschia are the most commonmembers.
Sessile and mobile diatoms produce different types and different quantities of mucilaginousmatrices with the different potential to bind and consolidate sediments (Vos et al. 1988). Tychoplanktonadd to the pool of energy available for herbivores and deposit-feeding invertebrates.
Of the three assemblages, epipsammon, tychoplankton and epipelon, only the last have beenrigorously examined (Admiraal et al. 1984; Paterson 1989), although only the most common wereidentified to the species level. This assemblage of species is widely thought to play a very importantrole in intertidal mudflat ecology (Vos et al. 1988; Madsen et al. 1993). Sessile and suspended diatomshave received very little research attention worldwide (Zong and Horton 1998), but in our samples theywere found to make up as much as 47% of all live diatoms (Trites et al. this volume). The lack ofsimilarly comprehensive examinations of the diatom community, including all three functional groups,does not allow us to conclude whether this higher diversity is a typical or unusual characteristic of theupper Bay of Fundy intertidal mudflat diatoms.
References
Admiraal, W. 1984. The ecology of estuarine sediments inhabiting diatoms. Progress in PhycologicalResearch 3: 269–322.
Admiraal, W. and H. Peletier. 1980. Distribution of diatom species on an estuarine mudflat and experi-mental analysis of the selective effect of stress. Journal of Experimental Marine Biology andEcology 46: 157–175.
Admiraal, W., H. Peletier, and T. Brouwer. 1984. The seasonal succession patterns of diatom species onan intertidal mudflat: An experimental analysis. Oikos 42: 30–40.
Agatz, M., R. M. Asmus, and B. Deventer. 1999. Structural changes in the benthic diatom communityalong a eutrophication gradient on a tidal flat. Helgoland Marine Research 53: 92–101.
Créach, V., M. T. Schricke, G. Bertru, and A. Mariotti. 1997. Stable isotopes and gut analyses to deter-mine feeding relationships in salt marsh macroconsumers. Estuarine, Coastal and Shelf Science44: 599–611.
197
Session Six: Corophium and Mudflat Ecology
Daborn, G., C. Amos, M. Brylinsky, H. Christian, G. Drapeau, R. Faas, J. Grant, B. Long, D. Paterson,G. Perillo, and M. Piccolo. 1993. An ecological cascade effect: Migratory birds affect stabilityof intertidal sediments. Limnology and Oceanography 38: 225-231.
Hicklin, P., L. Linkletter, and D. Peer. 1980. Distribution and abundance of Corophium volutator (Pallas),Macoma balthica (L.) and Heteromastus filiformis (Clarapede). Canadian Technical Report ofFisheries and Aquatic Sciences 965. Department of Fisheries and Oceans, Ottawa. 56 pp.
Jensen, K. T. and H. R. Siegismund. 1980. The importance of diatoms and bacteria in the diet ofHydrobia-species. Ophelia, Supplement 1: 193–199.
Madsen, K. N., P. Nilsson, and K. Sundback. 1993. The influence of benthic microalgae on the stabilityof a subtidal sediment. Journal of Experimental Marine Biology and Ecology 170: 159–177.
MacIntyre, H. L., R. J. Geider, and D.C. Miller. 1996. Microphytobenthos: The ecological role of the“Secret Garden” of unvegetated, shallow-water marine habitats. I. Distribution, abundance andproduction. Estuaries 19: 186–201.
Palmer, J. D. and F. E. Round. 1967. Persistent, vertical-migration rhythms in benthic microflora. VI.The tidal and diurnal nature of the rhythm in the diatom Hantzschia virgata. Biological Bulletin132: 44–55.
Paterson, D. 1986. The migratory behaviour of diatom assemblages in the laboratory tidal micro-eco-system examined by low temperature scanning electron microscopy. Diatom Research 1: 227–239.
Paterson, D. 1989. Short-term changes in the erodibility of intertidal cohesive sediments related to themigratory behaviour of epipelic diatoms. Limnology and Oceanography 34: 223–234.
Paterson, D. 1990. The influence of epipelic diatoms on the erodibility of an artificial sediment. Pages245–355. In: Proceedings of the Tenth International Diatom Symposium, Joensuu, Finland,August 28–September 2, 1988. H. Simola (Ed.). Koeltz Scientific Books, Koenigstein.
Pickney, J. and R. G. Zingmark. 1993. Photophysiological responses of intertidal benthic microalgalcommunities to in situ light environments: Methodological considerations. Limnology andOceanography 38: 1373–1383.
Round, F. E. 1971. Benthic marine diatoms. Oceanography and Marine Biology, Annual Review 9: 63–75.
Trites, M., P. Hicklin, J. Ollerhead and I. Kaczmarska. 2003. Benthic diatoms from two intertidal mudflatsin the upper Bay of Fundy. This proceedings, pp. 200-207.
Underwood, G. J. C. and D. Smith. 1998. Predicting epipelic diatom exopolymer concentrations inintertidal sediments from sediment chlorophyll a. Microbial Ecology 35: 116–125.
Underwood, G. J. C. and J. Kromkamp. 1999. Primary production by phytoplankton andmircophytobenthos. Advances in Ecological Research 29: 93–153.
Vos, P. C., P. L. de Boer, and R. Misdrop. 1988. Sediment stabilization by benthic diatoms in intertidalsandy shoals; qualitative and quantitative observations. Pages 511–526. In: Tide-Influenced
198
Health of the Bay of Fundy: Assessing Key Issues
Sedimentary Enviroments and Facies. P. L. de Boer, A. van Gelder and S. D. Nio (Eds.). D.Riedel Publishing Company, Dordrecht and Boston.
Watt, D. A. 1998. Estuaries of contrasting trophic status in KwaZulu-Natal, South Africa. Estuarine,Coastal, and Shelf Science 47(2): 209–216.
de Winder, B., N. Staats, L. J. Stal, and D. M. Paterson. 1999. Carbohydrate secretion by phototrophiccommunities in tidal sediments. Journal of Sea Research 42(2): 131–146.
Wolfstein, K., F. Colijn, and R. Doerffer. 2000. Seasonal dynamics of microphytobenthos biomass andphotosynthetic characteristics in the Northern German Wadden Sea, obtained by the photosyn-thetic light dispensation system. Estuarine, Coastal and Shelf Science 51: 651–662.
Zong, Y. and B. P. Horton. 1998. Diatom zones across intertidal flats and coastal salt marshes in Britain.Diatom Research 13(2): 375-394.
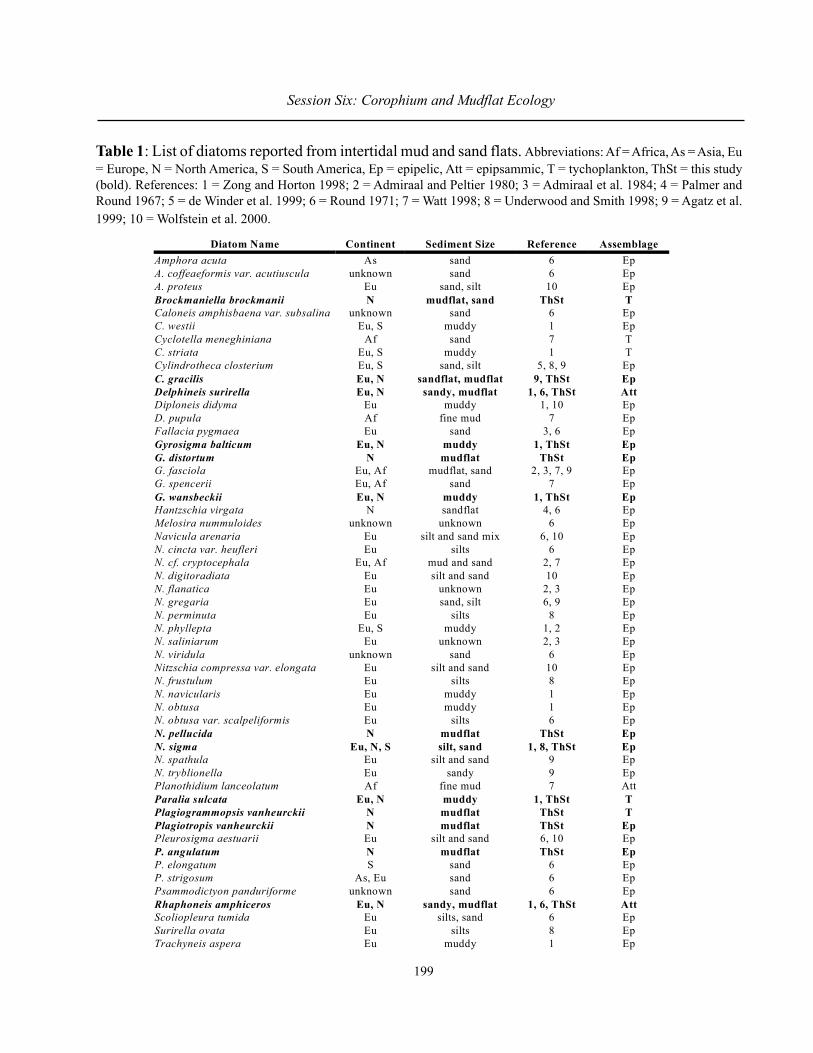
199
Session Six: Corophium and Mudflat Ecology
Table 1: List of diatoms reported from intertidal mud and sand flats. Abbreviations: Af = Africa, As = Asia, Eu= Europe, N = North America, S = South America, Ep = epipelic, Att = epipsammic, T = tychoplankton, ThSt = this study(bold). References: 1 = Zong and Horton 1998; 2 = Admiraal and Peltier 1980; 3 = Admiraal et al. 1984; 4 = Palmer andRound 1967; 5 = de Winder et al. 1999; 6 = Round 1971; 7 = Watt 1998; 8 = Underwood and Smith 1998; 9 = Agatz et al.1999; 10 = Wolfstein et al. 2000.
Diatom Name Continent Sediment Size Reference Assemblage Amphora acuta As sand 6 Ep A. coffeaeformis var. acutiuscula unknown sand 6 Ep A. proteus Eu sand, silt 10 Ep Brockmaniella brockmanii N mudflat, sand ThSt T Caloneis amphisbaena var. subsalina unknown sand 6 Ep C. westii Eu, S muddy 1 Ep Cyclotella meneghiniana Af sand 7 T C. striata Eu, S muddy 1 T Cylindrotheca closterium Eu, S sand, silt 5, 8, 9 Ep C. gracilis Eu, N sandflat, mudflat 9, ThSt Ep Delphineis surirella Eu, N sandy, mudflat 1, 6, ThSt Att Diploneis didyma Eu muddy 1, 10 Ep D. pupula Af fine mud 7 Ep Fallacia pygmaea Eu sand 3, 6 Ep Gyrosigma balticum Eu, N muddy 1, ThSt Ep G. distortum N mudflat ThSt Ep G. fasciola Eu, Af mudflat, sand 2, 3, 7, 9 Ep G. spencerii Eu, Af sand 7 Ep G. wansbeckii Eu, N muddy 1, ThSt Ep Hantzschia virgata N sandflat 4, 6 Ep Melosira nummuloides unknown unknown 6 Ep Navicula arenaria Eu silt and sand mix 6, 10 Ep N. cincta var. heufleri Eu silts 6 Ep N. cf. cryptocephala Eu, Af mud and sand 2, 7 Ep N. digitoradiata Eu silt and sand 10 Ep N. flanatica Eu unknown 2, 3 Ep N. gregaria Eu sand, silt 6, 9 Ep N. perminuta Eu silts 8 Ep N. phyllepta Eu, S muddy 1, 2 Ep N. saliniarum Eu unknown 2, 3 Ep N. viridula unknown sand 6 Ep Nitzschia compressa var. elongata Eu silt and sand 10 Ep N. frustulum Eu silts 8 Ep N. navicularis Eu muddy 1 Ep N. obtusa Eu muddy 1 Ep N. obtusa var. scalpeliformis Eu silts 6 Ep N. pellucida N mudflat ThSt Ep N. sigma Eu, N, S silt, sand 1, 8, ThSt Ep N. spathula Eu silt and sand 9 Ep N. tryblionella Eu sandy 9 Ep Planothidium lanceolatum Af fine mud 7 Att Paralia sulcata Eu, N muddy 1, ThSt T Plagiogrammopsis vanheurckii N mudflat ThSt T Plagiotropis vanheurckii N mudflat ThSt Ep Pleurosigma aestuarii Eu silt and sand 6, 10 Ep P. angulatum N mudflat ThSt Ep P. elongatum S sand 6 Ep P. strigosum As, Eu sand 6 Ep Psammodictyon panduriforme unknown sand 6 Ep Rhaphoneis amphiceros Eu, N sandy, mudflat 1, 6, ThSt Att Scoliopleura tumida Eu silts, sand 6 Ep Surirella ovata Eu silts 8 Ep Trachyneis aspera Eu muddy 1 Ep
200
Health of the Bay of Fundy: Assessing Key Issues
BENTHIC DIATOMS FROM TWO INTERTIDAL MUDFLATS IN THEUPPER BAY OF FUNDY*
Marsha Trites1, Peter Hicklin2, Jeff Ollerhead3 and Irena Kaczmarska 1
1 Department of Biology, Mount Allison University, Sackville, NB.2 Canadian Wildlife Service, Environment Canada, Sackville, NB.
3 Department of Geography, Mount Allison University, Sackville, NB.
Abstract
Little is known about benthic diatoms from Upper Bay of Fundy mudflats but they likely playan important role in the support of the mudflat keystone species, Corophium volutator. This studyexamined a tidal flat diatom community from a Corophium rich mudflat (Daniel’s Flat) and a Corophiumpoor mudflat (Grande Anse Flat) in Chignecto Bay. The mudflat sediments are very different physi-cally. Daniel’s Flat has lower water and organic content than Grande Anse Flat and a larger mean grainsize of sediments. Diatoms, especially mobile diatoms, were more abundant at Grande Anse Flat, whichcorrelates negatively to Corophium density. These differences in diatom abundance and compositioncould be the result of higher grazing pressure at Daniel’s Flat and/or higher water content at GrandeAnse Flat.
Introduction
Benthic diatoms, found both in and on sediments, dominate intertidal mudflats in cold temper-ate climates (Pickney and Zingmark 1993; Underwood and Smith 1998). In the Upper Bay of Fundy,the presence of these diatoms is of importance to the mudflat keystone species Corophium volutator,and possibly other animals, for two reasons. Diatoms increase stability of surface sediments throughthe production of polysaccharide exudates (Daborn et al. 1993; Pickney and Zingmark 1993) and act asa food source for benthic fauna (Créach et al. 1997). It is mobile diatoms that produce copious amountsof sediment binding polysaccharides. They move up through sediments at low tide to form denseaggregations which may discolour the mudflat surface.
The structure and composition of Fundy mudflat diatoms is virtually unknown. Research hasbeen conducted on these communities in the Minas Basin, but even in these seminal studies only a fewspecies of diatoms have been identified beyond the genus level. Furthermore, most intertidal mudflatdiatom studies focus on the physical interactions between diatom extracellular exudates and sediments(e.g., Daborn et al. 1993) and were conducted in a laboratory (e.g., Paterson 1989).
* This paper is based on a poster presented at this workshop, replacing the poster abstract.
201
Session Six: Corophium and Mudflat Ecology
Materials and Methods
Two different types of mudflats occur in Chignecto Bay in the Upper Bay of Fundy (Table 1).One contains relatively compact sediments and supports high densities of Corophium (Daniel’s Flat),while the other is more aqueous and supports few Corophium (Grand Anse Flat). This study examinedboth types of flat. Specifically, it explored how mudflat diatom communities may differ between thesetwo very different sites. It also relates differences in diatom communities to selected physical or bio-logical properties of mudflat sediments.
The two mudflats were each sampled prior to the arrival of Semipalmated Sandpipers, while thebirds were present in maximal densities, and after they had left. Sediment cores were taken alongshore-normal transects following Hicklin et al. (1980). The cores were cut in half vertically, with onehalf to be used for Corophium enumeration and the other for sediment analysis and diatom enumera-tion. Using EDS (energy dispersive X-ray spectroscopy), mineral composition of sediment grains wasanalyzed. Sediment grain size distribution was determined by laser diffraction, drying was used todetermine water content, and loss on ignition to calculate organic content. Corophium were enumer-ated with a 710 Fm sieve, following Hicklin et al. (1980). Light microscopy and scanning electronmicroscopy were used to identify and quantify diatoms present. Only live diatom cells were enumer-ated.
Results and Discussion
Sediment grains at both flats were mostly composed of quartz or one of several feldspars. Someof the rarer minerals were only found at one of the two mudflats (Table 2). An iron and magnesiumfeldspar, for example, was only observed at Daniel’s Flat while sodium feldspar was only observed atGrande Anse Flat. Using the Wentworth scale to classify particle sizes (Bearman 1989), the proportionof clay (0.5–2 Fm) and silt (2–62.5 Fm) was highest at Grande Anse Flat while Daniel’s Flat had alarger fraction of sands (62.5–2000 Fm). Also, sediments were more poorly sorted at Grande Anse Flat(Figure 1). Water and organic content were both highest at Grande Anse Flat. Water content rangedfrom 39–63% at Grande Anse Flat while values ranged from 22–42% at Daniel’s Flat. At Grande AnseFlat, organic carbon content ranged from 2.2–3.1% while at Daniel’s Flat it ranged from 0.8–2.4%.Clearly the sediment properties of these two mudflats are different in every aspect we examined.
The diatom flora encountered was diverse in terms of species and functional groups. Of 39counting categories, 13 were identified to the species level, and these comprised nearly 80% of cellsenumerated. Of the remaining counting categories, most were identified to genus and nearly all of theserepresented a single species. Only six categories were broadly defined, e.g., centric, pennate, or naviculoiddiatoms, and these represented 13% of cells. Naviculoid diatoms represented several genera similar insize and shape, making them unidentifiable while alive. This broad naviculoid category did not preventaccurate classification into functional categories. Diatom abundance was greatest at Grande Anse Flat,where densities often exceeded 200,000 cells per gram of wet sediment, while sediments from Daniel’s
202
Health of the Bay of Fundy: Assessing Key Issues
Flat rarely contained more than 150,000 cells per gram (Figure 2). Three functional groups of diatomswere present: epipelon, epipsammon, and tychoplankton. Epipelic diatoms are mobile and move bysecreting strands of mucilage through their raphe systems while epipsammic diatoms attach to sur-faces; most often to sand grains. Tychoplankton are a group of free-living diatoms that are usuallyassociated with the benthic and nearshore community but may be transported into the water column tolive as plankton. The most common diatoms at both mudflats were the tychoplanktonic Paralia sulcataand Brockmaniella brockmanni, together making up 47% of cells enumerated. The most commonepipsammic diatom, Delphineis surirella, accounted for approximately 11% of cells. The most com-mon epipelic species were Gyrosigma wansbeckii and Nitzschia sigma.
As expected, Corophium densities at Daniel’s Flat were high, up to 22,600 individuals/m2,while Corophium were undetectable by our methods from all but one core at Grande Anse Flat (Figure2). The density there was below 1000 individuals/m2. Corophium densities at Daniel’s Flat seem tohave increased when compared to Hicklin et al. (1980), who reported a mean density of 2,567 individu-als/m2 during July 1978. In contrast, the Corophium density at Grande Anse Flat decreased precipi-tously when compared to Hicklin et al. (1980). They reported a mean density of 5,162 individuals/m2
during July of 1978. The virtual absence of Corophium from Grande Anse Flat observed in our studywas also reported by Shepherd et al. (1995).
Similar to sediment data, the two mudflats are distinctly different in diatom and Corophiumabundances. The high abundance of diatoms at Grande Anse does not support a high abundance ofCorophium. Some functional groups show a relationship to Corophium density. At Daniel’s Flat, epipelicdiatoms were least abundant while Corophium were present in maximal densities and most abundant inlate August, after Corophium had suffered grazing from shorebirds, suggesting a causal relationship(Figure 3).
We thus speculate that Corophium grazing pressure reduces abundance of some benthic dia-toms, specifically the mobile species (e.g., large Gyrosigma and Nitzschia species) which aggregate insurface sediments during low tide. Alternatively, it could be that the physical characteristics of sedimentsat Grande Anse Flat render it more suitable for diatom growth. A Pearson correlation with Bonferonni’sadjustment showed that diatom density was most strongly positively correlated with water content ofsediments (0.744), which was highest at Grande Anse Flat. In a laboratory setting, Paterson (1990)found that diatom density was higher in wetter sediments, as would be expected for all aquatic plants.Because Grande Anse Flat supported the greatest abundance of diatoms, the low densities of Corophiumobserved at this mudflat cannot be attributed to a shortage of food in the form of diatoms.
References
Bearman, G. (Ed.). 1989. Waves, Tides, and Shallow-water Processes. Pergamon Press, Toronto. 187pp.

203
Session Six: Corophium and Mudflat Ecology
Créach, V., M. T. Schricke, G. Bertru, and A. Mariotti. 1997. Stable isotopes and gut analyses to deter-mine feeding relationships in saltmarsh macroconsumers. Estuarine, Coastal and Shelf Science44: 566–11.
Daborn, G., C. Amos, M. Brylinsky, H. Christian, G. Drapeau, R. Faas, J. Grant, B. Long, D. Paterson,G. Perillo, and M. Piccolo. 1993. An ecological cascade effect: migratory birds affect stabilityof intertidal sediments. Limnology and Oceanography 38: 225–231.
Hicklin, P., L. Linkletter, and D. Peer. 1980. Distribution and abundance of Corophium volutator (Pallas),Macoma balthica (L.) and Heteromastus filiformis (Clarapede). Canadian Technical Report ofFisheries and Aquatic Sciences 965. Department of Fisheries and Oceans, Ottawa.
Paterson, D. 1989. Short-term changes in the erodibility of intertidal cohesive sediments related to themigratory behaviour of epipelic diatoms. Limnology and Oceanography 34: 223–234.
Paterson, D. 1990. The influence of epipelic diatoms on the erodibility of an artificial sediment. Pages345–355 In: Proceedings of the Tenth International Diatom Symposium, Joensuu, Finland,August 28-September 2, 1988. Simola, H. (Ed.). Koeltz Scientific Books, Koenigstein.
Pickney, J. and R. G. Zingmark. 1993. Photophysiological responses of intertidal benthic microalgalcommunities to in situ light environments: Methodological considerations. Limnology and Ocea-nography 38: 1373–1383.
Shepherd, P., V. Partridge, and P. Hicklin. 1995. Changes in sediment types and invertebrate fauna inthe intertidal mudflats of the Bay of Fundy between 1977 and 1994. Technical Report SeriesNo. 237. Canadian Wildlife Service.
Underwood, G. J. C. and D. Smith. 1998. Predicting epipelic diatom exopolymer concentrations inintertidal sediments from sediment chlorophyll a. Microbial Ecology 35: 116–125.
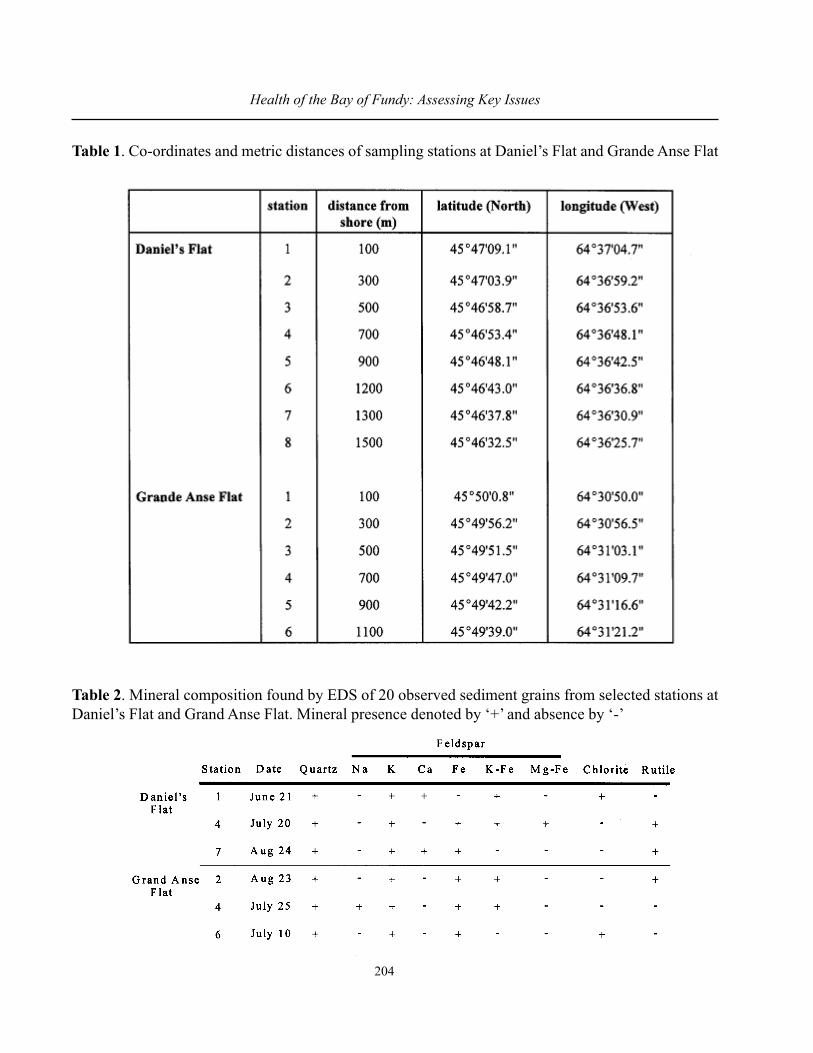
204
Health of the Bay of Fundy: Assessing Key Issues
Table 1. Co-ordinates and metric distances of sampling stations at Daniel’s Flat and Grande Anse Flat
Table 2. Mineral composition found by EDS of 20 observed sediment grains from selected stations atDaniel’s Flat and Grand Anse Flat. Mineral presence denoted by ‘+’ and absence by ‘-’
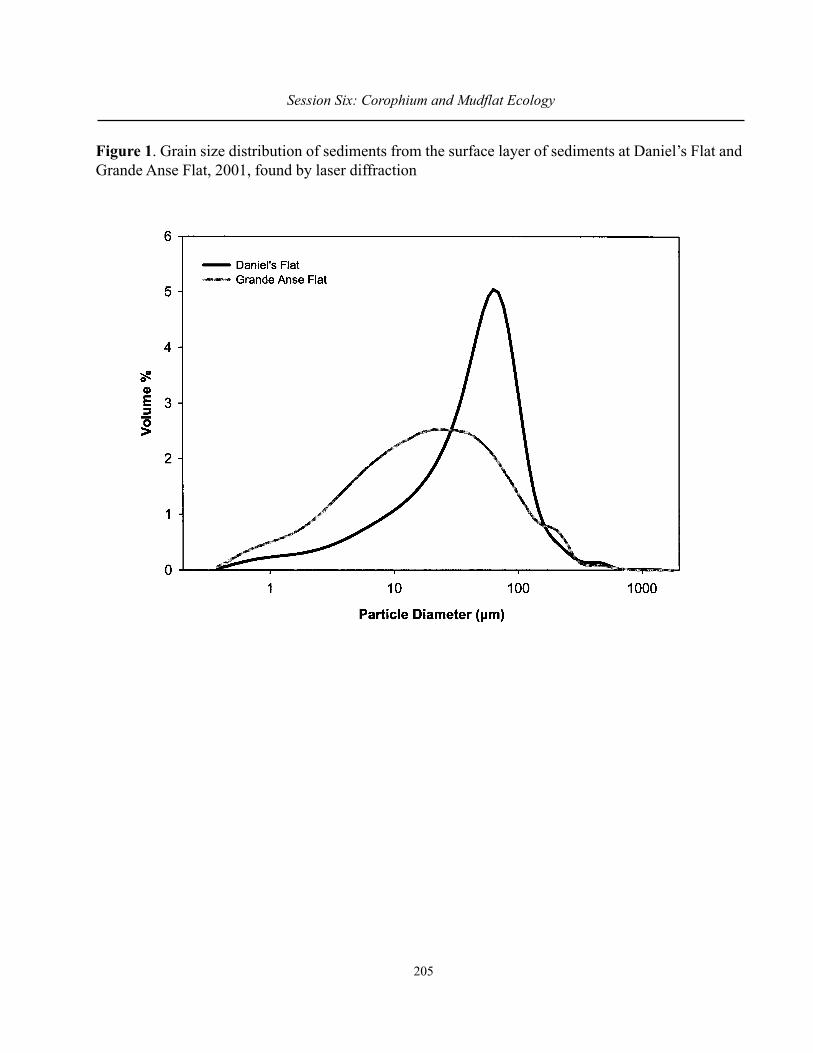
205
Session Six: Corophium and Mudflat Ecology
Figure 1. Grain size distribution of sediments from the surface layer of sediments at Daniel’s Flat andGrande Anse Flat, 2001, found by laser diffraction
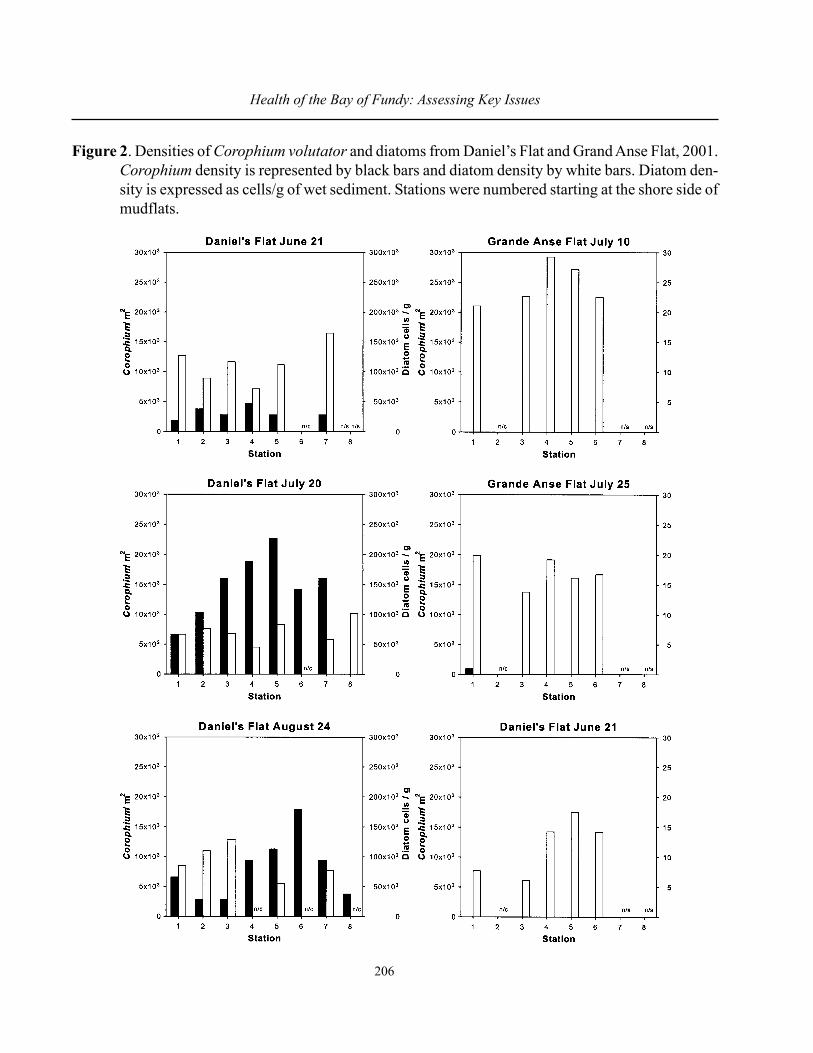
206
Health of the Bay of Fundy: Assessing Key Issues
Figure 2. Densities of Corophium volutator and diatoms from Daniel’s Flat and Grand Anse Flat, 2001.Corophium density is represented by black bars and diatom density by white bars. Diatom den-sity is expressed as cells/g of wet sediment. Stations were numbered starting at the shore side ofmudflats.

207
Session Six: Corophium and Mudflat Ecology
Figure 3. Relative contribution of the three functional groups of diatoms (tychoplankton, epipsammonand epipelon) to the diatom flora of Daniel’s Flat and Grand Anse Flat, 2001
208
Health of the Bay of Fundy: Assessing Key Issues
POPULATION DYNAMICS OF Corophium volutatorIN THE UPPER BAY OF FUNDY:
PAST AND PRESENT RESEARCH
Myriam A. Barbeau and Diana J. Hamilton
Department of Biology, University of New Brunswick, Fredericton, [email protected] and [email protected]
Mudflats in the upper Bay of Fundy are densely colonized by the amphipod Corophium volutator.These amphipods are major prey for fish and migratory shorebirds. Because C. volutator is so impor-tant in the estuarine food chain, its population dynamics provide a simple and informative index of theecological state of the Bay of Fundy. Various mudflats have been studied intensively at different timessince the1970s. The latest study of population abundance and structure of C. volutator was undertakenApril 1999–May 2001 at 2–4 sites (Daniel’s Flat, Grande Anse, Minudie, Avonport Beach). Densitiesof C. volutator ranged from ~ 1,000 to 70,000/m2, depending on site and season. The densities ob-served in 1999-2001 were much lower at Grande Anse than other sites. Furthermore, the densities atGrande Anse were much lower than observed 20 years earlier. Two generations of C. volutator areproduced per year; generations are more discrete in some populations than in others. Juveniles overwinterand dominate the population size structure, except in May when adults are more abundant. BetweenMay and August, ~30% (range 5-60%) of adult females are gravid (a few can be found in Septemberand October). Brood size is ~35 eggs/female (range 4–127). Adults experience high mortality from birdpredation in late summer. Year-round, sex ratios are skewed towards females. A few adults (2%) areintersex individuals (displaying male and female characteristics). These data will be used to quantifyvital rates (survival, growth, fecundity) of different C. volutator populations, and to develop models ofpopulation dynamics.

209
Session Six: Corophium and Mudflat Ecology
QUANTIFYING RELATIONSHIPS AMONG SPECIES ON INTERTIDALMUDFLATS IN THE UPPER BAY OF FUNDY: COMMUNITY-LEVEL
INTERACTIONS AND THE INFLUENCE OF ABIOTIC FACTORS
Diana J. Hamilton1,2, Myriam A. Barbeau2, and Antony W. Diamond1
1 Atlantic Cooperative Wildlife Ecology Research Network, University of New Brunswick,Fredericton, NB. [email protected]
2 Department of Biology, University of New Brunswick, Fredericton, [email protected] and [email protected]
Intertidal mudflats in the upper Bay of Fundy are home to dense populations of Corophiumvolutator. These amphipods are the main food for migrating Semipalmated Sandpipers (Calidris pusilla)which are present in the region annually during late summer. In an effort to understand Corophiumpopulation changes and movements of birds around the Bay, we undertook a sampling program at fourmudflats. During visits to each mudflat from June to September 2000, we collected samples to assessCorophium abundance, chlorophyll a concentration, and sediment characteristics (particle size, watercontent, nutrient availability). We also quantified mud whelk (Ilyanassa obsoleta) density and shorebirdabundance. We found that Corophium abundance correlated negatively with whelk density, and thatsmall Corophium were especially adversely affected by whelks. Whelks, which rapidly respond to highquality food sources, correlated positively with chlorophyll a concentration. Shorebird abundance couldbe predicted by the density of adult, but not juvenile, Corophium. This suggests that movements ofbirds around the Bay could be explained by small year-to-year changes in population dynamics ofCorophium at the various sites. There was also a strong indirect relationship between whelks andshorebirds; abundance of birds in an area could be predicted several weeks before they arrived byabundance of whelks. Finally, sediment water content and particle size varied among mudflats, andhelped to explain variation in Corophium abundance and outliers in the above-mentioned relationships.
210
Health of the Bay of Fundy: Assessing Key Issues
LABORATORY INVESTIGATIONS OF ECOSYSTEM HEALTH USINGCorophium volutator: CHEMICAL AND BIOLOGICAL ENDPOINTS
Jocelyne Hellou1, Kerry Cheeseman3, Elaine Desnoyers2, Anette Gronlund3, Dawn Johnston2,Jim Leonard1, Sarah Robertson3 and Sean Steller1
1 Marine Environmental Sciences Division, Bedford Institute of Oceanography, Dartmouth, [email protected]
2 Chemistry Department, Dalhousie University, Halifax, NS.3 Biology Department, Dalhousie University, Halifax, NS.
To determine marine environmental quality and ecosystem health, it is important to investigatethe type, level and fingerprint of contaminants and the proportion available for uptake that could belinked to potential biological effects. The level of contaminants in different marine environmentalcompartments is determined by the presence of sources of contamination, their transport, and type orphysical-chemical properties of the chemicals that determine their partitioning and reactivity. The riskassociated with exposure is linked to the importance of different uptake routes and will depend on thecharacteristics of the species under consideration. Small organisms like amphipods would be exposedthrough the carapace, feeding and respiration of water (Hellou 1996). The binding of chemicals tosediments will depend on the properties of the compounds, the grain size and total organic carbon (OC)content of sediments at one location (Law and Hellou 1999).
Polycyclic aromatic compounds (PACs) are ubiquitous contaminants found in air, soil, sediments,water and living organisms (Neff 1979). The sub-group of polycyclic aromatic hydrocarbons (PAHs)has been linked with a wide range of toxic effects, including behavioural, narcotic, immunologic, neu-rologic, physiologic, reproductive, carcinogenic and teratogenic effects. PAHs are recognized prioritypollutants worldwide, including in Canada, because of the potential toxic effects associated with envi-ronmental exposure.
In general terms, hydrocarbons are derived from biogenic, diagenetic and anthropogenic sources(Steinhauer and Boehm 1992). Biogenic sources include various plant waxes and animal lipids. Thedecomposition of natural products over geological time scales leads to the formation of hydrocarbons.Combustion and petroleum sources can be of natural or anthropogenic origin. The more common natu-ral combustion sources are forest fires and volcanic eruptions, while in the marine environment, hydro-carbons are also naturally introduced by underwater petroleum seeps. The main sources of concern inthe environment, however, are due to the use of petroleum products or combustion processes. The latterinclude automobile exhausts, coking plants, asphalt production and domestic or industrial incineration.Petroleum products include crude and refined oils, lubricating oils, creosote and coal. In the offshore,hydrocarbons are also found in produced water, oil-based muds and would be discharged if a spill orblow-out occurs, while spills of various origin can occur inshore or on land.
211
Session Six: Corophium and Mudflat Ecology
The fate of PACs, the most abundant organic priority pollutants in coastal sediments, was inves-tigated using a local marine amphipod, Corophium volutator, collected inter-tidally from the MinasBasin, Nova Scotia and exposed in the laboratory to contaminated sediments. The bioaccumulation ofPACs was examined with exposure time, different groups of animals and post-depuration. It took anincreasing length of time for the higher molecular weight PACs to reach equilibrium compared to lowermolecular weight compounds, but equilibrium was reached within the ten-day experiment performedat 150C. A first study performed with a particularly abundant and reactive PAC added to pristine sedimentsdetermined that the amphipods do not metabolize PACs even after ten days of exposure, since no phaseI or phase II, oxidation or conjugation products, respectively, were detected under the experimentalconditions. Other experiments compared the availability of PACs present in sediments that received anolder combustion source of contamination and mixed sources of PACs. Biota-sediment accumulationfactors (BSAF) representing the concentration in amphipods divided by the concentration in sediments,both in dry weights, differed with contamination sources and by specific structure/size of PAC. Usinglaboratory spiked or field collected sediments demonstrated a lower availability of pyrene from fieldrelative to spiked sediments.
A subset of results obtained for one of the more abundant PAHs examined in our studies, i.e.pyrene, a tetracyclic molecule that tends to partition into sediments is presented in Figure 1. Our obser-vations point to the importance of performing laboratory experiments that would represent worst casescenarios in terms of possible chemical-biological interactions, since availability was lower in fieldrelative to lab exposures. Laboratory experiments provide valuable data in the interpretation of fieldstudies.
Biological effects, i.e. amphipod survival, reproduction of females and behavioural responsewere also examined and interpreted relative to the source of contamination assigned according to thechemical profile. In all our studies, narcotic effects were observed only once and analytical resultscorrelated with the expected body burden leading to narcosis discussed in the literature (McCarthy andMackay 1991). In all tests, >80% of females survived and reproduced. This is somewhat similar to thereference site (>90%), however the health of the progeny should be further investigated. Avoidance andpreference of contaminated vs pristine sediments was observed for our most contaminated site andneeds further experiments to link cause to effects. The presence of PCBs was also assessed in somesediment samples and exposed animals. The lower abundance of PCBs, i.e. 100 times lower than PACs,and similarity to background and reference sites points to their minor role in toxicity. However, theunknown role of other contaminants discharged in harbours receiving raw sewage effluents could con-tribute to specific and cumulative biological effects. Investigations are ongoing.
Acknowledgements
Funding from the Environmental Sciences Strategic Research Fund (1997–2000 and 2000–2003) of the Department of Fisheries and Oceans is acknowledged.

212
Health of the Bay of Fundy: Assessing Key Issues
BSAF of pyrene from different sources
0
0
1
10
1 3 7 9
Days
BSA
F
mixed spiked older
References
Hellou, J. 1996. Polycyclic aromatic hydrocarbons in marine mammals, finfish and mammals. Pages229–250. In: Interpreting Concentrations of Environmental Contaminants in Wildlife TissuesN. Beyer and G. Heinz (Eds.). SETAC Special Publication, Pergamon Press.
Law, R. J. and J. Hellou. 1999. Contamination of fish and shellfish following oil spill incidents. Envi-ronmental Geosciences 6: 90–98.
McCarthy, L. S. and D. Mackay. 1991. Interpreting aquatic toxicity QSARs. The significance of toxicantbody residues at the pharmacologic endpoint. The Science of the Total Environment 109–110:515–525.
Neff, J. M. 1979. Polycyclic Aromatic Hydrocarbons in the Aquatic Environment: Sources, Fates andBiological Effects. Applied Sciences Publisher, London. 262 pp.
Steinhauer, M. S. and P. D. Boehm. 1992. The composition and distribution of saturated and aromatichydrocarbons in nearshore sediments, river sediments, and coastal peat of the Alaskan BeaufortSea. Implications for detecting anthropogenic hydrocarbon inputs. Marine Environmental Re-search 33: 223–253.
Figure 1. BSAF: biota-sediments accumulation factors. Mixed refers to sediments containing pyreneand numerous other compounds from mixed sources. ‘Spiked’ refers to adding pyrene to pristinesediments, in the laboratory. ‘Older’ refers to aged sediments containing a combustion source of manyPAHs.

213
Session Six: Corophium and Mudflat Ecology
DOES PARASITISM CONTRIBUTE TO SEGREGATION INMIGRATING SHOREBIRDS?
Andy S. Didyk
Department of Biology, University of New Brunswick, Moncton, NB. [email protected]
In many species of nearctic shorebirds there is a marked tendency for one of the parents, usuallythe female, to desert the family within days of hatch. A number of hypotheses have been put forward;some argue a benefit for the young while others suggest early departure increases the survival of thedeparting parent. None of the currently held hypotheses, however, adequately explain the phenomenon.The parasite-factor hypothesis proposes that selection should favour early departure from breedinggrounds to take advantage of optimal feeding conditions that would include a low prevalence of para-site-infected prey. It predicts differential infections according to the age and sex of the birds, differen-tial infectivity of the intermediate hosts, short parasite life cycles, and a benefit, in terms of condition,to individuals that leave the staging areas before others. The hypothesis considers the role of the bur-rowing amphipod Corophium volutator Pallas, a major prey item for staging shorebirds in the Bay ofFundy, as an important factor in shaping the migratory behaviour of the birds.
214
Health of the Bay of Fundy: Assessing Key Issues
PANEL DISCUSSION
Chair: Diana HamiltonRapporteur: Jennifer Whitney
Panellists: Myriam Barbeau, Jocelyne Hellou, Peter Hicklin, Irene Kaczmarska, Peter Wells
The panel discussion opened with each panellist describing his or her current research interestsin the Bay of Fundy.
Peter Wells discussed the formation of the Corophium Working Group of BoFEP in 1997. Itsprincipal goals are to synthesize the available information about Corophium as a keystone species inthe Bay of Fundy mudflats, identify key research questions, and plan and encourage relevant researchprojects. The group has developed an extensive, up-to-date bibliography on Corophium in support ofits activities. This bibliography and review underway by the working group is providing insight intonew research questions and directions relevant to the Bay of Fundy.
Myriam Barbeau’s research interests include assessment of the factors that influence Corophiumpopulation dynamics, using models developed to integrate population-related data. She is also cur-rently studying the spatial dynamics of Corophium distribution.
Peter Hicklin’s research examines the dependence of shorebird populations on Corophium. Hehas proposed a periodic resampling of Corophium densities and sediment characteristics at mudflatsites that he first examined in a study in the late 1970s. In his view, such continued monitoring may behelpful in determining if recent changes in sediment water content at the Grande Anse site are anexception to the less dramatic changes observed in some other areas of the Bay.
Jocelyne Hellou’s key interests are chemistry and ecotoxicology, particularly in relation to thepossible presence of contaminants in Corophium’s mudflat habitat. She is studying the amphipod’sability to survive under different environmental conditions, in order to develop the basic knowledgeneeded to predict or explain changes in Corophium populations that may occur as a result of habitatcontamination.
Irena Kaczmarska is studying the ecological relationships between herbivores and diatoms,including the relationship between diatom abundance and Corophium abundance. She is also interestedin the relationships between microorganisms and sediment characteristics, such as water chemistry,mineral composition and grain type, as well as how these factors affect the construction and composi-tion of diatom mats.
The panel chair invited suggestions from the panellists and the audience for the development ofresearch projects pertaining to Corophium.

215
Session Six: Corophium and Mudflat Ecology
The threshold Corophium population size needed to maintain a healthy shorebird populationwas discussed. The question was raised as to whether shorebird overfeeding on the second Corophiumgeneration of the year might have a negative effect on the subsequent year’s population. Peter Hicklinfelt that winter mortality is probably harder on Corophium populations than predation by shorebirds.Discussion turned to the question of what the Corophium are eating and how abundant the benthicdiatoms are on the mudflats. Irena Kaczmarska explained that her study contains little informationabout the consumption of diatoms by Corophium.
Although it may not be obvious from the numbers of Semipalmated Sandpipers that annuallyvisit the Bay of Fundy, Peter Hicklin reported that the eastern population is definitely declining. Therecent reintroduction of Peregrine Falcons to the area may be having an effect on the congregation ofshorebirds. Peter Wells noted that the investigation of the population decline requires trend informationfor both Corophium and shorebirds, which is only available from the late 1970s to the present. PeterHicklin suggested that information about habitat change is also required; for example, changes to theGrande Anse mudflats that may have been triggered by the opening of the Petitcodiac causeway.
There was a lengthy discussion about the observed changes in the composition of the mudflat atGrande Anse. It was noted that there is a need to study the factors that influence the health of Corophium.The physical nature of the Grande Anse mudflat system has changed, and the proposed removal ofdykes and dams to restore salt marshes may have a large impact on the abundance of Corophium anddiatoms. While the observed changes at Grande Anse may have been sudden, this does not necessarilyimply that the opening of the Petitcodiac Causeway was the primary cause. Irena Kaczmarska com-mented on the need for data on the sediments to aid in understanding changes at Grande Anse. Thefeasibility of attempting to define the fundamental state of such an ecosystem was questioned. Perhaps,individually predictable factors are impossible to combine to predict ecosystem equilibrium. It wassuggested that perhaps the habitat changes at Grande Anse have more to do with an incomplete under-standing of mudflat ecology, rather than to changes resulting from the opening of the causeway. JeffOllerhead felt that, while there may be some truth in this, the opening of gates or the removal of damsare major perturbations that would likely have some effect on surrounding ecosystems.
Myriam Barbeau asked how long Corophium have existed in the Bay of Fundy influencingmudflat ecology. Peter Wells stated that there is no conclusive evidence as to whether Corophium is anative or introduced species. However, as Corophium species are distributed almost worldwide it iscommonly assumed to be native to the Bay of Fundy. The question of shorebird feeding in the absenceof Corophium was discussed. Peter Hicklin reported that there is evidence that shorebirds on theirwintering grounds in French Guyana eat horseshoe crabs. Andy Didyk asked if an historical absence ofCorophium in the Bay of Fundy region might have prevented the shorebirds from migrating as far asthey do now, if their main prey at that time had less food energy. Peter Hicklin suggested that theshorebird migration path probably followed the coast, resulting in the discovery of the Corophiumconcentrations as a good food source of which the shorebirds have since taken full advantage.

216
Health of the Bay of Fundy: Assessing Key Issues
The discussion returned to a consideration of the changes observed at Grande Anse. It wasasked whether water height and depth measurements have been taken at the site. Peter Hicklin re-sponded that these had been measured as part of tidal power related study carried out in the 1980s. Thepossibility that Grande Anse has eroded and filled back in was proposed. Diana Hamilton noted that theunconsolidated layer at Grande Anse is much deeper and that the depth to the anoxic layer has in-creased. Peter Hicklin reported the existence of anecdotal evidence from the 1930s and 1940s, whichsupports the notion that erosion has caused significant changes at the site. However, there is no anecdo-tal evidence for the time period surrounding the opening of the Petitcodiac Causeway. Mike Brylinskyasked whether rocks carried onto the mudflat by ice floes might have changed the hydrology of thearea. Peter Hicklin replied that the rocks on the mudflat are too uniformly distributed to have beencarried there by ice floes; it is more likely that they were uncovered by erosion.
Mike Brylinsky asked about the abundance of diatoms at Grande Anse. Irena Kaczmarska re-plied that they are consistently abundant early in the season. She also noted that sediment in the areaappears to be subjected to very high turbidity (not through bioturbation), with the appearance of anoxicsediment on the surface of the mudflat noticeable even over the short period of a three-month study.The question was again raised as to whether the high level of unconsolidated mud observed at GrandeAnse could be explained by erosion. Jeff Ollerhead responded that, in his opinion, the rocks in the areawere likely ice-rafted onto the mudflat, as erosion would have exposed a harder substrate, rather thanthe soupy sediment currently found there. He noted that the relationship between the sedimentary andbiological systems is crucial – if the sediment system has not recovered, it may be because the biologi-cal system has yet to recover in some fundamental manner. He feels that it is possible that the biologicalsystems at Grande Anse have yet to regain their equilibrium state, if the observed changes are indeeddue to the opening of the Petitcodiac Causeway ten years previously. He and several others agreed thatten years is a relatively short period of time in this context.
Peter Wells reported on the existence of European literature on Corophium that demonstrates itsadaptability to different sediment conditions. For example, in sandier areas, Corophium builds tubes,rather than burrows. Such behavioural changes may occur in response to changes in sediment condi-tions. He suggested that the patchiness of the Corophium may change, and although animals may occurin decreased numbers, they will still be present. In his opinion, it is difficult not to find Corophium inthe Bay of Fundy. Peter Wells asked Myriam Barbeau about her Corophium research, which found twogenerations occurring in the inner Bay, while the literature suggests that only a single generation occursin the outer Bay. She replied that the number of generations is quite variable and that there may even bethree in some places. It is influenced by such environmental factors as temperature. Diana Hamiltoncited literature suggesting that heavy predation might also result in a second generation.
Diana Hamilton asked if there were any ideas for new research directions for the CorophiumWorking Group. Jocelyne Hellou suggested the possibility of doing some laboratory studies on theeffect of factors such as temperature, sediment composition, etc. on the number of generations eachyear in Corophium. Although Grande Anse still has Corophium, the numbers are greatly reduced. JocelyneHellou suggested that the group might investigate the factors contributing to such fluctuations in their

217
Session Six: Corophium and Mudflat Ecology
populations. Peter Wells commented that Corophium is a dominant, keystone species worthy of suchstudy. However, there are gaps in the Working Group’s current understanding of the dynamics of mudflatsand about how environmental factors, such as chemical changes in the water and sediments or theerection and removal of barriers, affects Corophium populations. This highlights the importance ofmore intensive studies on the ecology of mudflats. Jeff Ollerhead agreed that Corophium is a keystonespecies and that changes in mudflat ecology are very important. He also wondered why the GrandeAnse mudflats have not yet regained their equilibrium and are in fact worsening. He stressed the needto understand why these changes are taking place.
Mike Brylinsky wondered whether or not the amount of phytoplankton production in Fundy’supper basins is high enough to support the observed populations of Corophium. He also noted thatultraviolet radiation affects the production of diatom communities. Irena Kaczmarska responded thatthe diatoms are able to migrate up or down in the sediment in order to be exposed to the most favour-able illumination. Thus any factors that affect their vertical migration necessarily affect the productionof the diatom communities.
Andy Didyk asked whether too much emphasis is being placed on the events at Grande Anse. Isit possible that natural changes in the sediment composition or water content are taking place? Hewondered if perhaps the Working Group should be examining other sites where Corophium are thrivingin order to determine why they are so successful there. Someone also asked whether there are othersites where changes have been observed similar to those at Grande Anse. Mike Brylinsky respondedthat Starr’s Point has large numbers of Corophium, whereas Porter’s Cove has very few. And yet, thesetwo sites are very similar, particularly their diatom communities. Jamie Gibson asked whether therelative abundance of Heteromastus (Capitellid Thread Worms) might account for the observed differ-ences. Diana Hamilton and Mike Brylinsky responded that this is unlikely since Heteromastus is presentin every sample and the sites are very similar.
Jeff Ollerhead asked about the population densities of Corophium along riverbanks. Diana Ham-ilton responded that the population densities have generally been found to be lower along riverbanks.Jeff Ollerhead wondered whether, since the sediment is most soupy at the bottom of a river channel, theGrande Anse site might not be becoming part of the river system. He suggested that a comparison bemade of Corophium densities at Grande Anse with those in river channels. In response, Mike Brylinskysuggested that sediment soupiness is less crucial to Corophium since they are abundant at Starr’s Point.Jeff Ollerhead then proposed that the many sites around the Bay be studied for Corophium density andsediment characteristics such as weight loss on ignition (organic content), water content and grain size.Such data might be used to examine the relationship between site characteristics and population densi-ties. Diana Hamilton pointed out that much of this work has already been done; the necessary samplesand data have been collected and are simply awaiting analysis.
Peter Hicklin restated the importance of understanding the changes observed at the GrandeAnse site. Andy Didyk asked about the effect of the declining Corophium populations on shorebirds.What will happen to shorebirds if their primary food supply in the Bay of Fundy diminishes? Peter

218
Health of the Bay of Fundy: Assessing Key Issues
Hicklin replied that the reason for the decline in shorebird populations is not evident within the Bayitself, but is more likely a result of changes in the northern breeding grounds or southern winteringgrounds. He is uncertain as to what these changes might be, but may possibly involve climate changesor habitat changes.
Peter Wells closed the panel discussion by inviting anyone interested to participate in theCorophium Working Group. The Group is presently forming a network to facilitate the exchange ofideas and encourage co-operation in research activities. It is also drafting a review paper to consolidatethe available knowledge about Corophium and to serve as a guide in identifying new research direc-tions. Diana Hamilton concluded with a request for more contributions to the Corophium review paper.

219
Health of the Bay of Fundy: Assessing Key Issues
Session Seven
MINAS BASIN
Chair: David Duggan, Oceans and Coastal ManagementDivision, Bedford Institute of Oceanography,
Halifax, Nova Scotia

220
Health of the Bay of Fundy: Assessing Key Issues

221
Session Seven: Minas Basin
MOVING TOWARD INTEGRATED MANAGEMENT OF THEMINAS BASIN: A CAPSULE SUMMARY OF PROGRESS
Pat Hinch
Nova Scotia Department of Environment and Labour, Halifax, NS. [email protected]
Abstract
The Minas Basin is a highly productive and dynamic ecosystem which is blessed with manynatural resources that have been used for generations for the benefit of its surrounding communities.Some species, habitats, and ecological processes are now threatened by current and anticipated activi-ties in the Basin and its watershed. To sustain or rejuvenate this ecosystem requires co-operation amongscientists, researchers, resource users, residents of communities, the private sector, and government.The Minas Basin Working Group of the Bay of Fundy Ecosystem Partnership was established to facili-tate co-operative effort and partnerships to protect and sustain environmental quality in the region andto promote sustainable use of natural resources. The Working Group hopes to do this by working withcommunities and other interested groups to develop a broadly supported integrated management planfor the region. This presentation will provide an overview of the mission, goals and objectives of theWorking Group, its current activities, and future plans to engage multistakeholder groups in an inte-grated management approach to address issues of concern to communities.
Introduction
The Minas Basin, which is the southern branch of the upper Bay of Fundy, is a semi-enclosedsilted remnant of a 200 million-year old rift valley, once located near the Equator. Minas Basin iscomprised of four distinct regions: Minas Channel at the mouth, the central Minas Basin, a southwardbulge called the Southern Bight, and Cobequid Bay which forms the inner extremity. At its westernmostend, with Cape Chignecto to the north and Harbourville to the south, the Channel is 24 kilometreswide. Between Partridge Island (near Parrsboro) and Cape Blomidon, the Channel is only five kilome-tres wide. The water depth over much of the Minas Basin is less than 25 metres at low tide (average14.5 metres), although a deeper trench which runs through the Minas Channel from the west is up to115 metres deep (Percy 2001).
The tides of the Basin exceed those of any other place in the world. Tides rise and fall anaverage of 13 metres and to more than 16 metres during spring tides. (The world record tidal amplitudeof 16.27 metres occurs at Burntcoat Head on the southern shore of the Basin.) This amplitude causesmore than 10 cubic kilometres of seawater, weighing 10 billion tonnes, to flow into and out of the Basintwice daily, more than forty times the flow of the St. Lawrence River. Inrushing water reaches speeds offour metres per second (8 knots) past Cape Split. As the tide ebbs, the waterline may recede as much asfive kilometres seaward, exposing an intertidal zone of almost 40,00 hectares, more than a third of theBasin’s total area.
222
Health of the Bay of Fundy: Assessing Key Issues
The combined area of the Minas Basin and Channel is about 190,000 hectares. The watershedof the Minas Basin, which drains into and influences the marine ecosystem, is nearly five times larger,almost 900,000 hectares, over 20% of mainland Nova Scotia.
The Ecosystem
The Minas Basin is a highly productive and dynamic ecosystem with natural resources that forgenerations have sustained surrounding coastal communities (Thurston 1990). Characterized by ex-treme tides, turbulent currents, a soft substrate, and silt-laden waters, Minas Basin is also a highlystressful environment for marine species. Biodiversity in the Minas Basin is low by comparison tomarine areas, but for those species that can thrive, there is little competition and their populations arelarge and stable. Plant production (notably seaweeds) is lower than in most estuaries because of turbu-lence and turbidity.
Tidal mudflats and sandflats dominate over half of the Upper Bay of Fundy intertidal zone.Minas Basin has about 1,330 hectares of low salt marsh which fringe the mudflats. Almost 80% of saltmarshes lie in the Southern Bight. The large stretches of intertidal mudflat exposed to the sun at lowtide, provide a surface for benthic diatom populations, substrate for burrowing polychaetes such as thecommercial baitworm species, and burrowing amphipods including Corophium volutator. The mudflatsalso provide critical feeding grounds for shorebirds, particularly the plovers and the migratory Semi-palmated Sandpiper. The Southern Bight mudflat is in fact so important to these migratory species that26,800 hectares of coast have been designates a Ramsar site—a wetland of international importance.This area has also been designated as a Western Hemisphere Shore Bird Reserve to protect a series ofhabitats for migrating shorebirds extending from the Arctic to southern South America.
The Minas Basin supports over 50 species of fish including commercial fisheries for Americanshad, Atlantic salmon, winter flounder, and soft-shelled clam, Mya arenaria, which have since de-clined. Minas Basin offers a range of ecotourism activities including camping, coastal hiking, seakayaking, angling (trout, bass), rock and fossil hunting, and whale and birdwatching.
Change and Stress
Some species, habitats, and ecological processes are now threatened by current and anticipatedactivities in the Basin and its watershed. The 3rd BOFEP Science workshop held in 1999, focused onunderstanding change in the Bay of Fundy ecosystem. As indicated by Peter Wells (1999) during hisopening presentation during that workshop, there are a number of indicators of change from a naturalstandpoint in the Bay. These include: climate and local weather patterns (e.g., warming and extremeevents occurring more frequently); increases in coastal erosion and sedimentation in local areas; sealevel rise throughout the Bay; destruction of dykes by storm surges; occasional/potential flooding ofcoastal communities; sea surface temperature change; a possibly wider distribution and longer feedingperiod of migrating shorebirds on some of the mudflats of the upper Bay.
223
Session Seven: Minas Basin
There are many examples of human induced changes, some are well documented in the litera-ture, some observational and anecdotal. These changes include: loss of critical habitat, e.g., diminishedtotal areas of salt marsh spawning, and feeding areas for fish, notably salmon; construction of barrierson rivers, estuaries, shorelines and their related effects; the widespread presence of trace contaminants;increased numbers and types of industrial discharges causing a reduction in water quality; occasionaloil spills, increased numbers of shellfish closures due to high bacterial levels, increased paralytic shell-fish poison outbreaks; diminished fisheries, e.g., shad, winter flounder, salmon, alewives, and soft-shelled clam. Commercial and recreational salmon fisheries are now banned. There is also a reductionin wildlife populations, e.g., reduced numbers of shore birds and sea ducks, puffins, terns, and NorthernRight Whales. In addition, unregulated harvesting, the presence of many tidal barriers or restrictions,nutrification, potential mining activity (for hydrocarbons beneath Cobequid Bay, titanium and otherrare metals in the sediments along the southern shore and the lower areas of the Shubenacadie River),may also add stress to the natural environment. Several of these changes can be both natural and humaninduced, e.g., temperature change can be natural, as well as being caused by carbon dioxide input;shoreline erosion can be the result of climate change and also due to coastal development.
The Minas Basin Committee
For the past 400 years, European settlers to the Minas Basin area have utilized and dependedupon natural resources of the Bay of Fundy for their livelihood and well-being. The changes we arewitnessing are constant. Over some of these changes we have little or no control, others we have morepower to influence. Clearly if we are to continue to rely on the natural resource base indefinitely, wemust deal with several issues. People living in communities surrounding the Basin have come to real-ize:
1. The biodiversity, environmental quality, of the Basin are showing signs of deterioration.2. Habitats, biodiversity, environmental quality and a way of life based on natural resource use
are being compromised.3. The issues are highly complex.4. To understand the issues fully and to sustain or rejuvenate ecosystems requires the involve-
ment and co-operation of scientists, researchers, resource users, residents of communities,the private sector, and government.
The Minas Basin Committee was established to facilitate co-operative effort and partnerships to pro-tect and to sustain environmental quality in the region, and to promote sustainable use of natural re-sources.
History and Purpose of the Minas Basin Project Working Group
The Minas Basin Working Group was established in 1998 as a committee affiliated with theGulf of Maine (GOM) Council. As a Nova Scotia representative on the GOM Working Group, I wasasked to explore the possibility of a community group assuming responsibility for one of the projects
224
Health of the Bay of Fundy: Assessing Key Issues
under the Gulf of Maine Council Action Plan. This project involved the identification of significanthabitats and species in the Nova Scotia portion of the GOM watershed and the development of manage-ment recommendations to protect, conserve and sustain each species. This project was to continue thework of two pilot projects that had been conducted in Great Bay, New Hampshire and PassamaquoddyBay, New Brunswick.
An initial Minas Basin workshop was held in the summer of 1998 in Wolfville, at Acadia Uni-versity, to gauge the level of interest in the GOM project in Nova Scotia, and needless to say there wasstrong interest in the project. Those who attended the workshop chose the Minas Basin as the mostappropriate site to extend the project to Nova Scotia. (This decision was based on the value placed onthe resource base, current conservation programs in the area, the level of local expertise in species andhabitat management, research activity, the volume of existing information, and the availability of part-ners currently engaged in sustainable management.)
A steering committee and focus group were established to guide the development of the MinasBasin project. Project goals were:
• to promote the development of a more integrated systematic approach to management of theBay of Fundy as an ecosystem
• to increase accessibility and utility of resource data to decision makers, researchers, and thepublic
The objective was to engage stakeholders (government, non-government organizations, univer-sities, the private sector, and individuals) in a co-ordinated effort to identify critical habitats and de-velop management plans. Tangible products and outcomes of this project included:
• a demonstration of the use of existing knowledge (community, scientific) to identify signifi-cant habitats in the Minas Basin area;
• publication of a series of resource (species/habitat) maps and species/habitat profiles;• a report of important habitats identifying issues, gaps in habitat/species information, man-
agement priorities and options, and issues for future scientific investigation and research• a model for public participation and involvement in coastal zone management; and• an action plan for sustainable management of the Minas Basin as an ecosystem which would
subsequently be implemented over the long term through co-operative initiatives in habitatconservation involving government agencies, conservation groups and the scientific com-munity.
Between 1998 and 2000, the focus group developed the project outline, study approach, pre-pared a budget, identified potential partners and sources of funding, formed partnerships, determinedinformation and resource needs, identified priority actions, and developed a project work plan andschedule. The group submitted applications for funding, but applications to the Canada MillenniumFund, the Pew Foundation, and GOM Implementation Grants program were unsuccessful.
225
Session Seven: Minas Basin
Minas Basin Working Group (A Working Group of BOFEP)
In 2000, the Minas Basin Committee requested to become a Working Group of the Bay ofFundy Ecosystem Partnership and began to establish its own identity and to expand its purpose, mis-sion, and objectives. The Working Group adopted the mission statement of the Gulf of Maine Councilwhich is to maintain and enhance environmental quality in the Minas Basin and its watershed, and toallow for sustainable resource use by existing and future generations. Our objectives, are:
• to engage the public in identifying issues and actions pertaining to the sustainability of theBasin’s resources and its coastal communities (i.e., to encourage active community partici-pation in all aspects of the working group’s activities);
• to facilitate partnerships, collaboration and new funding opportunities among researchers,policy makers, resource managers and community groups pertaining to any aspect of thesustainable use and management of the Minas Basin.
• to work towards a multistakeholder-supported, integrated management plan for the MinasBasin, taking into account its natural resources (living and non-living), the needs for conser-vation and protection, and Canada’s long-term commitment to sustainable development;
• to facilitate co-ordination of efforts to identify critical habitats and living resources of theMinas Basin (i.e. to encourage conservation of the Basin’s biodiversity);
• to identify habitats and species issues for future scientific investigation and research; and• to enhance access to and interpretation of information on Minas Basin and its natural re-
sources.
Definition of Integrated Coastal Management
A definition of integrated coastal management (ICM) which closely matches the intent or pur-pose of the Minas Basin Working Group is “a continuous and dynamic process by which decisions aremade for the sustainable use, development and protection of coastal and marine areas and resources”.The goals of integrated coastal management are “to achieve sustainable development of coastal andmarine areas, to reduce vulnerability of coastal areas and their inhabitants to natural hazards, and tomaintain essential ecological processes, life support systems, and biological diversity in coastal andmarine areas” (Cicin-Sain and Knecht 1998).
ICM acknowledges the interrelationships that exist among coastal and ocean use and the envi-ronments they potentially affect, is designed to overcome the fragmentation inherent in the sectoralmanagement approach and is multipurpose oriented. It analyzes implications of development, conflict-ing uses, and interrelationships between physical processes and human activities. It also promoteslinkages and harmonization among sectoral coastal and ocean activities.
226
Health of the Bay of Fundy: Assessing Key Issues
Working Group Activities
During Phase I of activity (2000–2002), the Working Group was involved in gathering informa-tion about the Minas Basin and its watershed. The Working Group received funding from EnvironmentCanada and Department of Fisheries and Oceans to fund a research/co-ordinator position to:
• conduct an inventory of non-government organizations concerned with natural resource is-sues, the environment, and sustainable development of the Minas Basin and its watershedand their current activities;
• produce a bibliography of existing literature and information on the Minas Basin;• identify and categorize issues of concern to communities; and• produce a Minas Basin watershed profile—a compendium of socio-economic information
including population, demographics and labour force statistics, and land use in the MinasBasin watershed.
During Phase II, the Group held three community forums in Wolfville (January 24, 2002), Truro(February 27, 2002), and Parrsboro (April 18, 2002). At the request of the community, a fourth is beingplanned for the Noel shore in the near future.
The overall goal of these forums* was to initiate action toward sustainable management of thenatural and human resources of the Minas Basin and its watershed. Specific objectives were to:
• introduce the Minas Basin Working Group and this project;• increase awareness in the community of existing interest groups;• enhance co-operation and networking;• verify identified issues of concern with communities; and• establish the basis for an action plan development for the Minas Basin watershed.
In terms of future plans (Phase III) the Working Group will be involved in two major projectsover the next few years. The Working Group has re-initiated the original GOM Action Plan habitat andspecies project mentioned earlier to develop action plans for sustainable management of living re-sources. As a pilot, the initial project will map the resources of the Salmon River watershed near Truro.In terms of outcomes, this project will
• demonstrate the use of existing knowledge to identify significant habitats;• publish a series of resource (species/habitat) maps and profiles;
* Editors’ Note (3/03): Proceedings of the forums have now been published and are available from the BoFEP Secretariat,ACER, Acadia University, Wolfville, NS.

227
Session Seven: Minas Basin
• develop a model for public participation and involvement in coastal and watershed manage-ment;
• design an action plan for sustainable management of the Salmon River watershed area;• implement the plan through long-term through co-operative initiatives that involve all
stakeholders; and• evaluate the model and consider the value and feasibility of its application to other water-
shed areas.
The second project, which follows from the community forums, will involve a meeting of thosewho volunteered during the community forums as leaders of community action groups. Each leaderwill be asked to review issues of concern to the community and to call on community members to forman action group. Each group will be encouraged to establish priorities, goals, objectives, and veryimportantly, develop a project-oriented action plan. Members of the Minas Basin Working Group andothers will serve as a resource to assist the groups to identify, develop work plans, provide informationand/or identify appropriate contacts/experts to share information or advice on specific issues.
Over the next year, we hope to see the formation of several action groups that will join/work inpartnership with the Minas Basin Working Group to address community issues identified in commu-nity forums. The Working Group will continue to evaluate progress and to identify emerging issues andtrends in the Minas Basin as they arise to help define future initiatives.
References
Cicin-Sain, B. and R. W. Knecht. 1998. Integrated Coastal and Ocean Management: Concepts andPractices. Island Press, Washington, DC. 517 p.
Percy, J. A. 2001. Fundy’s Minas Basin: Multiplying the Pluses of Minas. Fundy Issue #19, Spring2001. Bay of Fundy Ecosystem Partnership, 12 pp. URL: <http://www.auracom/~bofep/publi-cations/fundy%20issues/minas1.htm>. Accessed 26 August 2002.
Thurston, H. 1990. Tidal Life: A Natural History of the Bay of Fundy. Camden House Publishing,Camden East, ON. 167 pp.
Wells, P. G. 1999. Understanding change in the Bay of Fundy ecosystem. In: Understanding Changes inthe Bay of Fundy Ecosystem. Proceedings of the 3rd Bay of Fundy Science Workshop, MountAllison University, Sackville, New Brunswick, April 22-24, 2000. J. Ollerhead, P. W. Hicklin, P.G. Wells and K. Ramsey (Eds.). Environment Canada, Atlantic Region, Occasional Report No.12. Environment Canada, Sackville, NB.
228
Health of the Bay of Fundy: Assessing Key Issues
PLANNING FOR ACTION IN THE MINAS BASIN WATERSHED:A SUMMARY OF THE BOFEP MINAS BASIN COMMUNITY FORUMS
Robin Willcocks-Musselman
Minas Basin Working Group, BoFEP, Halifax, NS. [email protected]
Introduction
The Integrated Management Project for the Minas Basin watershed was initiated by the MinasBasin Working Group of the Bay of Fundy Ecosystem Partnership with the goal of working towardssustainable management of the natural and human resources of the Minas Basin and its watershed.Initial concerns were primarily with the marine environmental quality of the Minas Basin, but since itis often land-based activities that affect marine quality, it was recognized the entire watershed neededto be included. The study area therefore is the watershed of the Minas Basin (Figure 1).
The Integrated Management Project is more aptly described as a “process” rather than a project.It is meant to be fluid and evolve as the process moves forward. The only requirement is that thecommunities throughout the watershed drive the process, as it is important that people see themselvesinvolved in the process and have a sense of ownership over it. Therefore, securing community involve-ment was an important first step and would be a requirement of the project’s success.
Community Involvement
The Minas Basin Working Group chose to have several community forums throughout thewatershed as a method of securing community involvement and support for the Integrated Manage-ment Project. Initially, it was thought that the forums would focus on gaining a better understanding ofissues of concern with an attempt to prioritize these issues. After talking with many community mem-bers, the Minas Basin Working Group became aware that many other public consultations had takenplace over the years. A brief inventory of projects/workshops held in Minas Basin was undertaken toensure that the community forums would not repeat previous work. The inventory revealed that manyworkshops had been undertaken to identify issues of concern, and there was a sense that the public wasfrustrated with repeatedly talking about issues with little action being taken. The Minas Basin WorkingGroup decided not to repeat previous efforts but rather build on them. Therefore, the goal of the com-munity forums was not only issue identification and prioritization but, more importantly, developmentof action plans with the communities to address the issues of concern.
Community Forums
The primary goal of the community forums was to initiate actions toward sustainable manage-ment of the natural and human resources of the Minas Basin and its watershed. They were meant to
229
Session Seven: Minas Basin
build on past initiatives by government and non-government organizations, which focussed on identi-fying issues of concern to residents living in the Minas Basin watershed.
The community forums had several objectives:
1. Introduce the Minas Basin Working Group of BoFEP and the Integrated Management Proc-ess and foster community involvement in the integrated management process
2. Obtain more input on issues of concern from watershed residents3. Increase awareness in the community of existing interest groups and their activities4. Enhance co-operation and networking among interest groups, government, etc.5. Develop action plans for communities in the Minas Basin watershed
Community Forum Planning
Planning of the community forums began in the fall of 2001 with the intent that the communityforums take place in late fall or early winter of 2002 (Table 1). The first step was to identify forumlocations and local co-hosts. Because of budget and time limitations, three initial community forumswere planned for Wolfville, Truro, and Parrsboro. If more were needed or desired by communities, theycould occur at a later date. The three initial community forums were chosen primarily because of theirgeographic location in the Minas Basin watershed.
From the database of groups/individuals working in the resource area, environmental manage-ment, or sustainable development around the Minas Basin watershed, several potential local co-hostswere identified for each of the community forums. Local co-hosts helped primarily in the forum plan-ning process and with logistics. It was felt local co-hosts would be extremely valuable in providinglocal knowledge about appropriate dates, locations, structure, etc.
The structure of each individual forum was worked out with the aid of local co-hosts. In order toachieve all the objectives, it was decided that the community forums should consist of two distinctparts: an open house with displays from local groups, and small group discussions on priority issues.
1. The Open House portion would provide a chance for participants to network and to increasepublic awareness of community groups and activities in the watershed. All groups, organiza-tions, and even individuals were encouraged to have displays at the Open House. This eventwas typically 1.5–2.0 hours in length.
2. The Focus Group Discussions would allow detailed discussion and action planning. By hav-ing several small discussion groups, this would also not allow for one issue to take over themeeting. Discussions were allotted 2.5–3 hours.

230
Health of the Bay of Fundy: Assessing Key Issues
Focus Group Discussions
Focus groups were decided by using coloured dots to prioritize issues. Each coloured dot repre-sented a priority – 1, 2 or 3. Participants were asked to place their dots on issues sheets, which weredeveloped from information obtained in the preliminary issue gathering study completed in the winterof 2001. Participants were also encouraged to add other issues of concern to the sheets.
This exercise allowed the Minas Basin Working Group to establish four or five focus groupdiscussions at each forum. The total number of dots and the quantity of priority 1 dots were the strong-est determinants for the development of focus groups. Figures 2–4 show the results of priority settingfor each forum and Charts 1–3 further illustrate the results. It is important to note that these results arereflective only of the people present at the forum, and they may not be indicative of the concerns of thecommunity as a whole.
A member of the Minas Basin Working Group and a local facilitator led each focus groupdiscussion. The structure of the discussion groups was developed in conjunction with the local co-hostswith the intention of identifying issues and problems and working towards developing actions for eachgroup. After each community forum, the Minas Basin Working Group reviewed and adjusted the struc-ture accordingly. For example, in Wolfville participant feedback indicated that the discussions stalledat identifying issues and discussing what others needed to do, not what the group could do. At the Truroforum, emphasis was therefore placed on having the groups focus on one or two issues that the groupwould like to deal with. Emphasis was put on developing specific actions they could do as a group, notwhat others needed to do. Unfortunately the Truro community forum was not as successful in thisregard because there were so few stakeholders from the area in attendance, and discussion groups feltthey could not make decisions for the stakeholders who were not in attendance. Feedback from thisforum indicated there is a need to go back to the area and repeat this process in smaller meetings withinterested stakeholders in specific areas of interest (i.e. agriculture, forestry, etc.). In Parrsboro, thefocus group discussions were less structured and consisted of comments, concerns and then actions.This was the most successful forum for developing specific actions. Table 2 outlines the focus groupstructures for each community forum.
Community Forum Results
Table 3 summarizes the main characteristics of each community forum. Attendance was highestin Parrsboro and Wolfville but a similar number of displays were found at all three forums. Attendancein Parrsboro was greatly affected by many participants thinking the forum was meant to discuss onlythe Fundy Biosphere Initiative. In all three community forums, however, fisheries management andwater quality/sewage were priority concerns and hence became discussion groups. In Wolfville andTruro, development, forestry practices, and agricultural practices were also priority concerns. The com-munity forum in Parrsboro differed somewhat with focus group discussions being held on recreation/tourism and the Fundy Biosphere Initiative.

231
Session Seven: Minas Basin
From these results the issues of most concern around the Minas Basin watershed are: agricul-tural practices, development, fisheries management, forestry practices, sewage treatment/water quality,tourism, and recreation. Consistently, sewage treatment/water quality and fisheries management wereof concern throughout the watershed, but geographic variations occurred with many of the other issues.For example, agricultural practices and development seem to be of greater concern in Colchester, Hantsand Kings Counties, where tourism and recreation are of more interest in Cumberland and ColchesterCounties. Specific to the north shore of the Minas Basin, was concern over the Fundy Biosphere Initia-tive. Chart 4 compares the priority issues for each of the community forums and illustrates their inten-sity of concern at each community forum.
Actions Developed
In the focus group discussions at each of the community forums, several actions were recorded.Tables 4 through 6 summarize these actions for each focus group discussion. A summary and compari-son of the actions developed at each community forum is displayed in Table 7. Table 8 outlines some ofthe common actions raised in all three community forums.
Common themes identified at the Wolfville Community Forum were:
1. More information about current conditions is needed, i.e. the “state of resources and qualityof environment” in Minas Basin Watershed.
2. Better communication between stakeholders and easier access to information for the publicis needed.
3. Coalitions or “united fronts” need to be created to tackle issues and take leadership roles.4. Strategic/management plans need to be developed for issues.5. The lack of resources (funding, volunteers, etc.) needs to be addressed.6. Education of resource users and the public on the impacts of practices and sustainable prac-
tices needs to be undertaken and or increased.
Common themes identified from the Truro Community Forum were:
1. There needs to be more cooperation and communication between those impacting the envi-ronment and those being impacted.
2. Education and awareness raising campaigns need to be undertaken for the public and re-source users (on sources of problems, impacts of practices, best management practices, trainingmechanisms etc.).
3. More research (before education) is needed on the impacts of practices. Community groupsare willing to do this, but they need assistance be it financial, logistical, expertise etc.
232
Health of the Bay of Fundy: Assessing Key Issues
4. There need to be changes to policies and legislation, and the introduction of positive incen-tives for resource users
5. Local groups need guidance and assistance rather than larger management approaches.
Common themes identified from the Parrsboro Community Forum include:
1. There needs to be more cooperation, communication and networking amongst variousstakeholders.
2. Coalitions or “united fronts” need to be created to tackle issues and take leadership roles.3. The community wants to gather more information and educate themselves on the issues,
more sustainable practices and how other communities are dealing with these issues.4. More research (before education) is needed on the impacts of practices.
Next Steps
As previously mentioned, the Minas Basin Working Group is approaching the Integrated Man-agement Project as a fluid process, and this approach will also apply to the next phase of the project.The intention of the Working Group is to revisit the focus groups from each of the community forumsand bring together individuals who identified themselves as potential leaders or expressed interest inparticipating in action groups. From the 14 focus groups, six individuals identified themselves as po-tential leaders and many more expressed interest in being involved in action groups. With the aid of theMinas Basin Working Group, these action groups will be encouraged to develop detailed action plansthat will establish goals, objectives, priorities, and specific work plan actions to undertake over the nextyear. Members of the Minas Basin Working Group and others will serve as resources to assist in thedevelopment of work plans. It is the desire of the Working Group to eventually have a network ofactions groups around the Minas Basin watershed.
Summary
The community forums that have taken place to date have achieved several of their objectives.They have also provided the Minas Basin Working Group of BoFEP with an initial step towards inte-grated management of the Minas Basin watershed.
Accomplishments of the community forums:
• The Working Group has become more aware of groups, organizations, and key individualsin the communities working in resource areas or that are interested in sustainable manage-ment of the Minas Basin watershed.
• Groups throughout the Minas Basin watershed were able to network with each other, and thepublic has become more aware of groups and activities in the watershed which they werepreviously unaware of.

233
Session Seven: Minas Basin
• The public and many community organizations were introduced to the Minas Basin Inte-grated Management Project.
• The Working Group was able to get a better understanding of the major issues of concernwithin communities and a sense of their relative priority. As well, other issues of concernthat were previously unknown were identified.
• Several leaders and interested individuals were identified to form action groups throughoutthe watershed.
• Many actions were identified that the Working Group can work with action groups to imple-ment.
• The Working Group has a clearer idea of the potential roles they can play in the integratedmanagement process.
Editors’ Note: Please also see the two reports on this project, published by BoFEP as BoFEP TechnicalReports Nos. 1 and 2, 2003. See: www. auracom.com/~bofep.
Table 1. Community Forum planning timeline
Fall 2001 Winter/ Spring 2002 Summer/ Fall 2002
• Review past and present
public consultation projects – decide to move beyond issue identification and focus on ACTIONS!
• Community Forum
planning begins: contact local co- hosts
• Community Forums
held in Wolfville, Truro and Parrsboro
• 4th Forum added for
Noel shore area (Fall 2002)
• Go back to
focus groups and work on developing actions/specific projects identified through forums

234
Health of the Bay of Fundy: Assessing Key Issues
Table 2. Focus Group discussion structure for each Community Forum
Wolfville Truro Parrsboro Discuss/answer the following questions: What is the issue of concern?
How do we address this issue? Who wants to be involved? (Check box on sign up sheet) Identify lead for group? (Put name on sign up sheet) Identify who else needs to be involved? What are the next steps to be taken? What do we need (resources, etc.)?
Turn discussion over to Facilitator to follow the next steps: BRAINSTORM What are the specific issues of concern in this broader issue – What are your concerns and why? FOCUS Focus the group by trying to pull together issues into “major issues” and identify the one(s) this group wants to address. SOLUTIONS How could we attempt to solve the problem? ACTIONS What are the specific actions we can undertake? WHO Who do we need to help us? RESOURCES What resources do we need (funding, maps, reports, technical data, access to government, etc)?
Turn discussion over to Facilitator to follow the next steps:
COMMENTS AND CONCERNS What are your concerns and why?
FOCUS Identify the major issue(s) from the brainstorming session above or those this group would like to focus on
ACTIONS What are the specific actions we can undertake?

235
Session Seven: Minas Basin
Table 3. Community Forum characteristics
Wolfville
(January 24th)
Truro
(February 27th)
Parrsboro (April 18th)
Number in attendance
112
58
161
Number of Open House
displays
23
24
20
Focus Groups
• Fisheries
Management • Water quality/ Sewage • Agricultural
Practices • Development • Forestry
Practices
• Fisheries
Management • Water quality/ Sewage • Agricultural
Practices • Development • Forestry
Practices
• Fisheries
Management • Water
quality/Sewage • Recreation/ Tourism • Fundy Biosphere
Initiative

236
Health of the Bay of Fundy: Assessing Key Issues
Table 4. Actions identified at Wolfville Community ForumAgricultural Practices:
• Unite like-minded groups/individuals and strengthen networking to provide leadership role • Research effects of practices on the environment and then review best management practices • Educate farmers and public on effects of practices, land ethics, best management practices, etc. • Work with government to create incentives and enforcement of best management practices • Create a strategy to collect information, clarify problems, and identify steps to make things happen
(involve community, farmers, government, etc.)! Development:
• Devote more effort to assessment and measurement of the impacts of development • Educate selves and public on the scope of the problem – need a communications and education strategy
to do this (pamphlets, fact sheets, newsletters, web page, etc.) • Create a development plan for Annapolis Valley area (identify areas of value in community; areas to be
protected (non-development) to ensure conservation of biodiversity/ecological integrity and function of critical ecosystem process; low impact recreation use (especially ensure coastal access maintained), etc.)
Fisheries Management: • Inventory historical and present status of fishery resources in Minas Basin (so appropriate targets can be
developed) • Inventory status of fish habitat (data could then be used to prioritize habitat for conservation/ protection/
restoration) • Identify all stakeholders (fishers, government, community groups, NGO’s, and non-fishing industries that
affect fish, fish habitat, and water quality) • Identify an organization or group to take the lead role as well as specific leaders • Explore links between fisheries and communities and include this information when assessing importance
fisheries • Identify sources of funding • Facilitate information exchange between DFO and user groups (stock status, water and habitat quality, etc• Develop integrated management for fisheries in Minas Basin (build on BoFEP Integrated Fisheries
Management Proposal) Forestry Practices:
• Inventory current forestry groups and activities • Identify and create incentive programs for foresters (money, publicity, taxes, etc.) • Review and recommend improvements to legislation • Have conference/meeting with all key players identified
Water Quality/Sewage: • Create State of Water Report for surface and groundwater (including quality/quantity; sources of
contamination and other threats; effects threats could/do have on aquatic resources, etc.) • Have more in-depth discussion and some priority given to issues and the ensuing actions • Work towards utilizing legislation more effectively, and developing standards rather than relying on
CCME guidelines • Establish a coalition with community water boards (include representative stakeholders and citizens) • Enhance communication between government and communities on water issues (ensure public has
access to water information and government is aware of publics concerns) • Educate and raise awareness about water issues with the wider public • Lobby government for more funding for water issues • Work toward jurisdictions clarifying their authority and responsibilities (federal-provincial-municipal) • Work on having formal environmental assessments of all projects affecting water resources (including
some already established projects) • Investigate local capacity (our capability) for water management • Develop a Water Strategy for the region (review existing models from elsewhere in Canada that could
be applied to area; use of report cards to see how well we are doing, etc.)
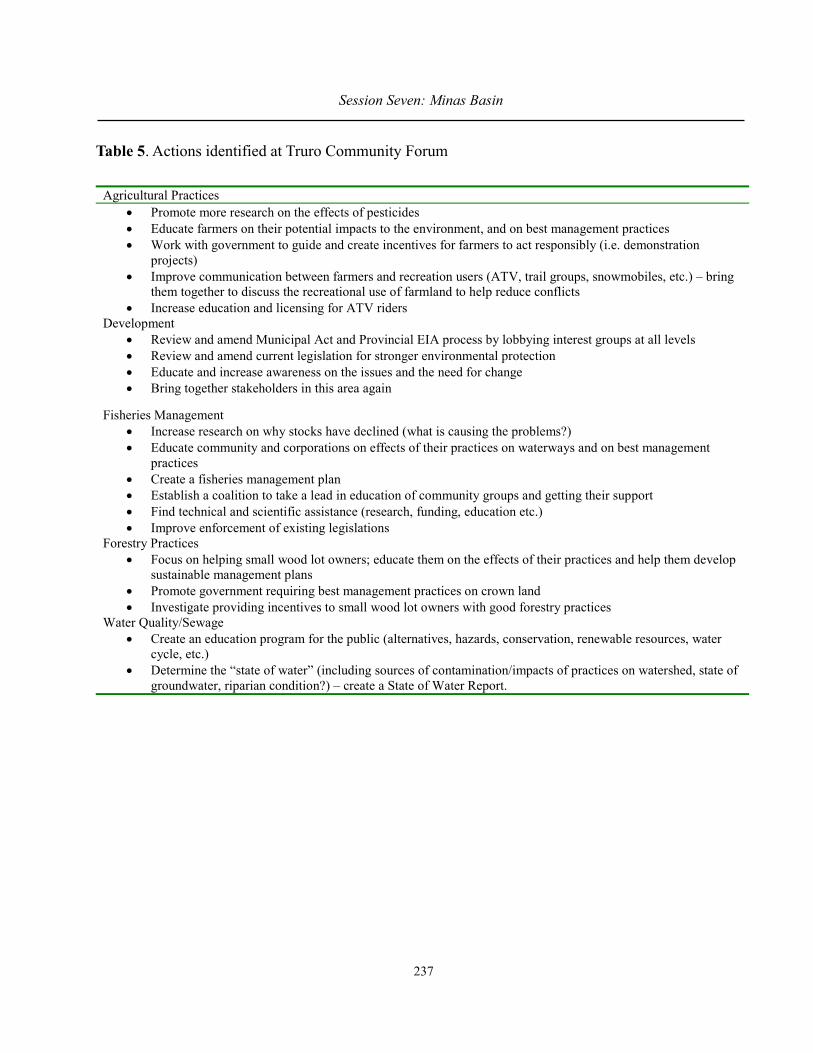
237
Session Seven: Minas Basin
Table 5. Actions identified at Truro Community Forum
Agricultural Practices • Promote more research on the effects of pesticides • Educate farmers on their potential impacts to the environment, and on best management practices • Work with government to guide and create incentives for farmers to act responsibly (i.e. demonstration
projects) • Improve communication between farmers and recreation users (ATV, trail groups, snowmobiles, etc.) – bring
them together to discuss the recreational use of farmland to help reduce conflicts • Increase education and licensing for ATV riders
Development • Review and amend Municipal Act and Provincial EIA process by lobbying interest groups at all levels • Review and amend current legislation for stronger environmental protection • Educate and increase awareness on the issues and the need for change • Bring together stakeholders in this area again
Fisheries Management • Increase research on why stocks have declined (what is causing the problems?) • Educate community and corporations on effects of their practices on waterways and on best management
practices • Create a fisheries management plan • Establish a coalition to take a lead in education of community groups and getting their support • Find technical and scientific assistance (research, funding, education etc.) • Improve enforcement of existing legislations
Forestry Practices • Focus on helping small wood lot owners; educate them on the effects of their practices and help them develop
sustainable management plans • Promote government requiring best management practices on crown land • Investigate providing incentives to small wood lot owners with good forestry practices
Water Quality/Sewage • Create an education program for the public (alternatives, hazards, conservation, renewable resources, water
cycle, etc.) • Determine the “state of water” (including sources of contamination/impacts of practices on watershed, state of
groundwater, riparian condition?) – create a State of Water Report.
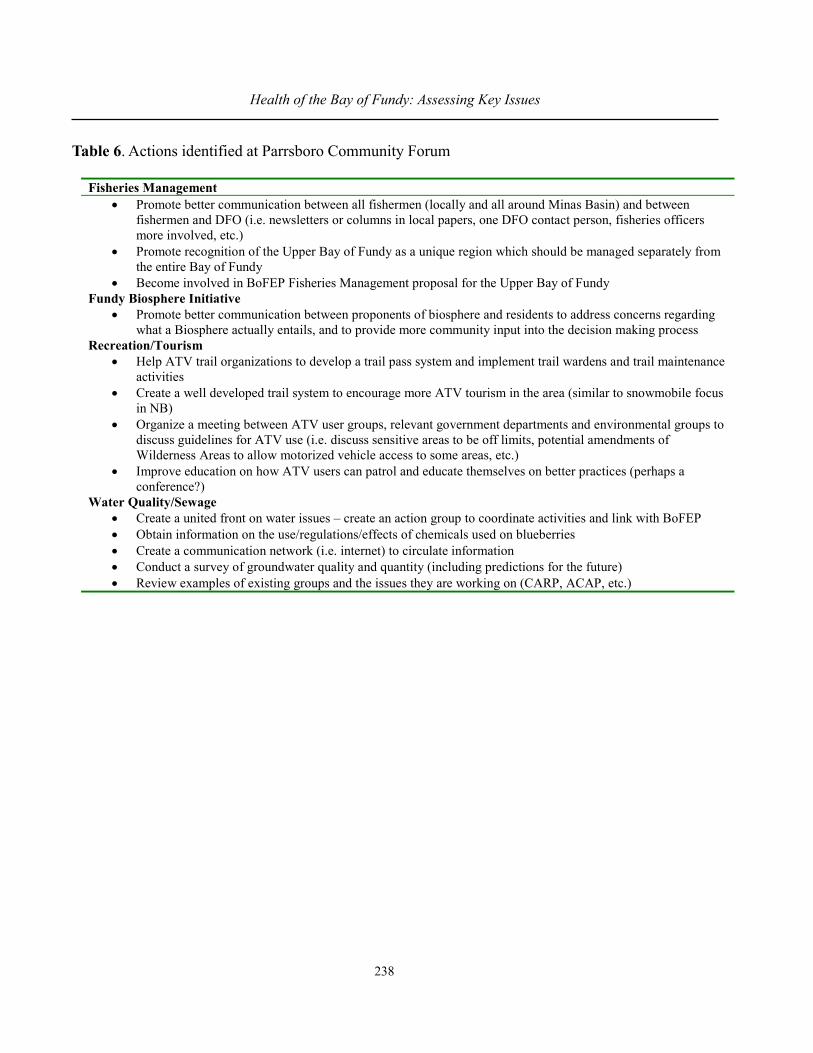
238
Health of the Bay of Fundy: Assessing Key Issues
Table 6. Actions identified at Parrsboro Community Forum
Fisheries Management • Promote better communication between all fishermen (locally and all around Minas Basin) and between
fishermen and DFO (i.e. newsletters or columns in local papers, one DFO contact person, fisheries officers more involved, etc.)
• Promote recognition of the Upper Bay of Fundy as a unique region which should be managed separately from the entire Bay of Fundy
• Become involved in BoFEP Fisheries Management proposal for the Upper Bay of Fundy Fundy Biosphere Initiative
• Promote better communication between proponents of biosphere and residents to address concerns regarding what a Biosphere actually entails, and to provide more community input into the decision making process
Recreation/Tourism • Help ATV trail organizations to develop a trail pass system and implement trail wardens and trail maintenance
activities • Create a well developed trail system to encourage more ATV tourism in the area (similar to snowmobile focus
in NB) • Organize a meeting between ATV user groups, relevant government departments and environmental groups to
discuss guidelines for ATV use (i.e. discuss sensitive areas to be off limits, potential amendments of Wilderness Areas to allow motorized vehicle access to some areas, etc.)
• Improve education on how ATV users can patrol and educate themselves on better practices (perhaps a conference?)
Water Quality/Sewage • Create a united front on water issues – create an action group to coordinate activities and link with BoFEP • Obtain information on the use/regulations/effects of chemicals used on blueberries • Create a communication network (i.e. internet) to circulate information • Conduct a survey of groundwater quality and quantity (including predictions for the future) • Review examples of existing groups and the issues they are working on (CARP, ACAP, etc.)

239
Session Seven: Minas Basin
Tabl
e 7.
Sum
mar
y of
act
ions
rais
ed a
t Com
mun
ity F
orum
s
Foru
m L
ocat
ion
Focu
s Gro
up
Disc
ussio
n W
olfv
ille
Trur
o Pa
rrsb
oro
Agr
icul
tura
l Pr
actic
es
• Cr
eate
a c
oalit
ion
•
Rese
arch
effe
cts o
f pra
ctic
es
• Ed
ucat
e th
e pu
blic
& fa
rmer
s •
Crea
te in
cent
ive
prog
ram
s •
Crea
te a
stra
tegy
!
• Re
sear
ch e
ffect
s of p
estic
ides
•
Educ
ate
farm
ers
• Cr
eate
ince
ntiv
es fo
r BM
Ps
• In
crea
se c
omm
unic
atio
n be
twee
n fa
rmer
s &
recr
eatio
n us
ers
• H
old
disc
ussio
ns b
etw
een
farm
ers a
nd
recr
eatio
n us
ers
• In
crea
se e
duca
tion
for A
TV u
sers
Dev
elop
men
t
• Cr
eate
a d
evel
opm
ent p
lan
•
Ass
ess &
mea
sure
impa
cts o
f de
velo
pmen
t •
Educ
ate
on th
e sc
ope
of p
robl
em
• Re
view
legi
slatio
n
• Ed
ucat
e &
incr
ease
aw
aren
ess o
f pub
lic
• Br
ing
stake
hold
ers f
rom
that
are
a to
geth
er
Fish
erie
s M
anag
emen
t
• In
vent
ory
statu
s of r
esou
rces
and
ha
bita
ts •
ID st
akeh
olde
rs &
fund
ing
• ID
org
aniz
atio
n to
take
lead
•
Incr
ease
com
mun
icat
ion
betw
een
DFO
an
d fis
herm
en
• Cr
eate
man
agem
ent p
lan
• M
ore
rese
arch
(why
stoc
ks in
dec
line?
) •
Incr
ease
edu
catio
n, c
omm
unic
atio
n, a
nd
coop
erat
ion
• Cr
eate
a c
oalit
ion
• Fi
nd te
chni
cal a
nd sc
ient
ific
assis
tanc
e •
Bette
r enf
orce
men
t of l
egisl
atio
n •
Crea
te a
man
agem
ent p
lan
• In
crea
se c
omm
unic
atio
n am
ongs
t se
lves
and
with
DFO
•
Incr
ease
reco
gniti
on o
f the
Upp
er
Bay
as d
istin
ct a
rea
• G
et in
volv
ed in
– B
oFEP
Fish
erie
s M
anag
emen
t pro
posa
l
Fore
stry
Pr
actic
es
• In
vent
ory
curre
nt a
ctiv
ities
•
Crea
te in
cent
ives
•
Revi
ew le
gisla
tion
• Br
ing
stake
hold
ers t
oget
her f
or
disc
ussio
ns
• Ed
ucat
e an
d he
lp sm
all w
oodl
ot o
wne
rs
deve
lop
man
agem
ent p
lans
•
Crea
te in
cent
ives
•
Lobb
y fo
r bes
t man
agem
ent p
ract
ices
on
Crow
n la
nd
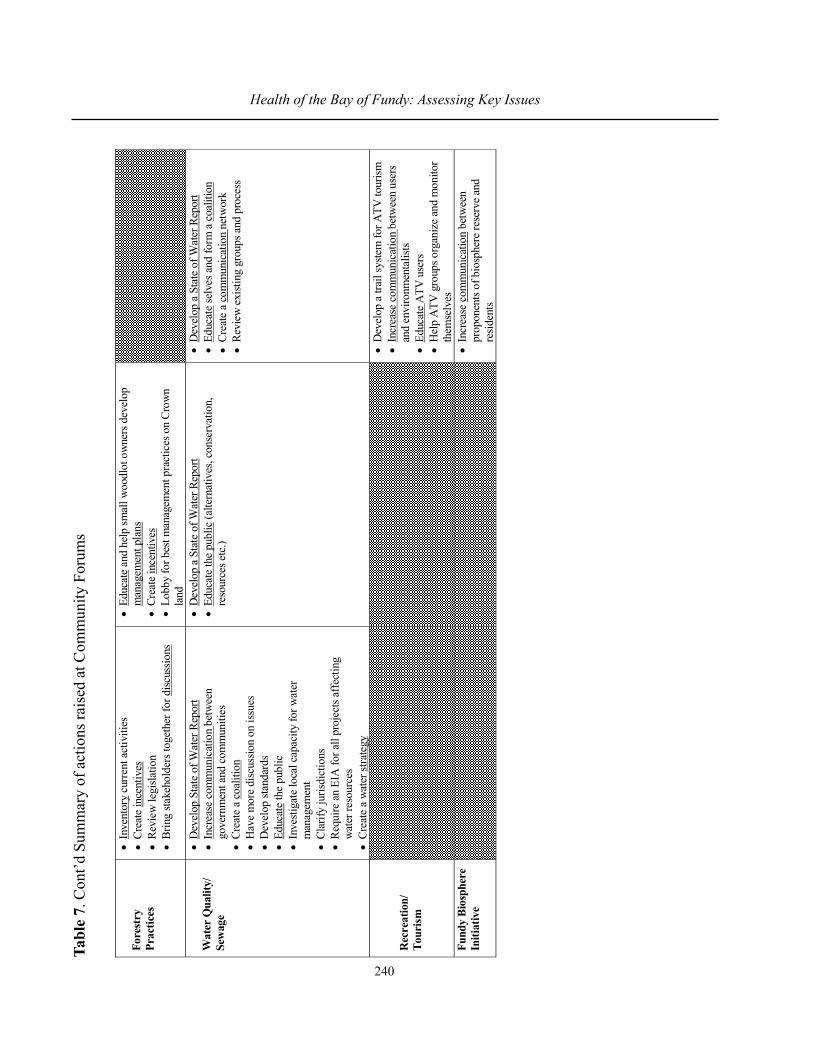
240
Health of the Bay of Fundy: Assessing Key IssuesTa
ble
7. C
ont’d
Sum
mar
y of
act
ions
rais
ed a
t Com
mun
ity F
orum
s
Fore
stry
Pr
actic
es
• In
vent
ory
curre
nt a
ctiv
ities
•
Crea
te in
cent
ives
•
Revi
ew le
gisla
tion
• Br
ing
stake
hold
ers t
oget
her f
or d
iscus
sions
• Ed
ucat
e an
d he
lp sm
all w
oodl
ot o
wne
rs d
evel
op
man
agem
ent p
lans
•
Crea
te in
cent
ives
•
Lobb
y fo
r bes
t man
agem
ent p
ract
ices
on
Crow
n la
nd
Wat
er Q
ualit
y/
Sew
age
• D
evel
op S
tate
of W
ater
Rep
ort
• In
crea
se c
omm
unic
atio
n be
twee
n go
vern
men
t and
com
mun
ities
•
Crea
te a
coa
litio
n •
Hav
e m
ore
disc
ussio
n on
issu
es
• D
evel
op st
anda
rds
• Ed
ucat
e th
e pu
blic
•
Inve
stiga
te lo
cal c
apac
ity fo
r wat
er
man
agem
ent
• Cl
arify
juris
dict
ions
•
Requ
ire a
n EI
A fo
r all
proj
ects
affe
ctin
g w
ater
reso
urce
s •
Crea
te a
wat
er st
rate
gy
• D
evel
op a
Sta
te o
f Wat
er R
epor
t •
Educ
ate
the
publ
ic (a
ltern
ativ
es, c
onse
rvat
ion,
re
sour
ces e
tc.)
• D
evel
op a
Sta
te o
f Wat
er R
epor
t •
Educ
ate
selv
es a
nd fo
rm a
coa
litio
n •
Crea
te a
com
mun
icat
ion
netw
ork
• Re
view
exi
sting
gro
ups a
nd p
roce
ss
Rec
reat
ion/
To
uris
m
• D
evel
op a
trai
l sys
tem
for A
TV to
urism
•
Incr
ease
com
mun
icat
ion
betw
een
user
s an
d en
viro
nmen
talis
ts •
Educ
ate
ATV
use
rs
• H
elp
ATV
gro
ups o
rgan
ize
and
mon
itor
them
selv
es
Fund
y Bi
osph
ere
Initi
ativ
e
• In
crea
se c
omm
unic
atio
n be
twee
n pr
opon
ents
of b
iosp
here
rese
rve
and
resid
ents
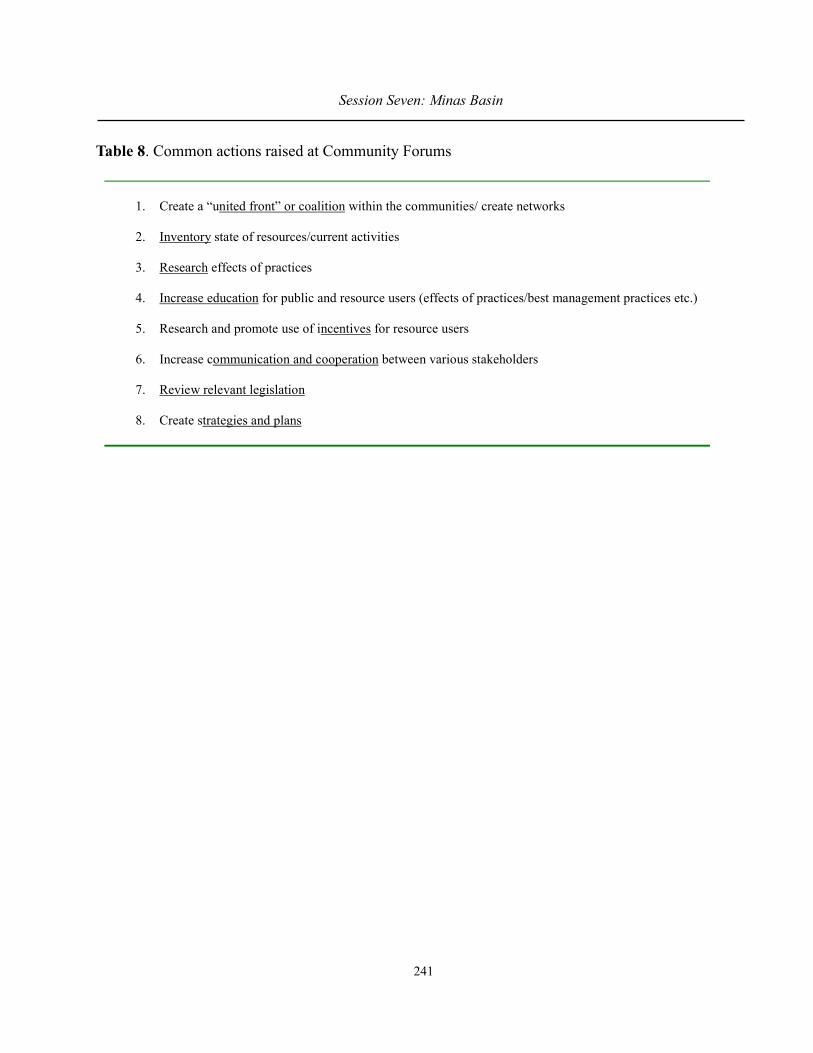
241
Session Seven: Minas Basin
Table 8. Common actions raised at Community Forums
1. Create a “united front” or coalition within the communities/ create networks
2. Inventory state of resources/current activities
3. Research effects of practices
4. Increase education for public and resource users (effects of practices/best management practices etc.)
5. Research and promote use of incentives for resource users
6. Increase communication and cooperation between various stakeholders
7. Review relevant legislation
8. Create strategies and plans
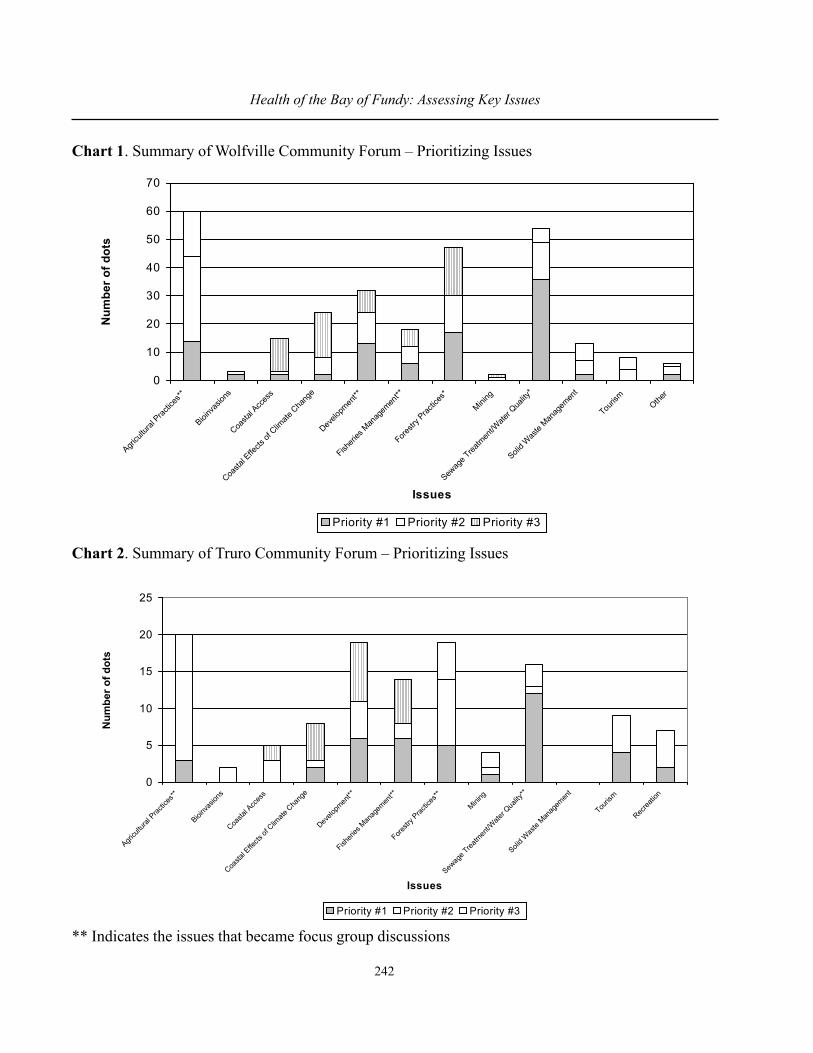
242
Health of the Bay of Fundy: Assessing Key Issues
Chart 1. Summary of Wolfville Community Forum – Prioritizing Issues
Chart 2. Summary of Truro Community Forum – Prioritizing Issues
** Indicates the issues that became focus group discussions
0
5
10
15
20
25
Agricu
ltural
Prac
tices
**
Bioinv
asion
s
Coasta
l Acc
ess
Coasta
l Effe
cts of
Clim
ate C
hang
e
Develo
pmen
t**
Fisheri
es M
anag
emen
t**
Forestr
y Prac
tices
**
Mining
Sewag
e Trea
tmen
t/Wate
r Qua
lity**
Solid W
aste
Manag
emen
t
Touris
m
Recrea
tion
Issues
Num
ber o
f dot
s
Priority #1 Priority #2 Priority #3
0
10
20
30
40
50
60
70
Agricu
ltural
Practic
es**
Bioinv
asion
s
Coasta
l Acc
ess
Coasta
l Effe
cts of
Clim
ate C
hang
e
Develo
pmen
t**
Fisheri
es M
anag
emen
t**
Forestr
y Prac
tices
*
Mining
Sewag
e Trea
tmen
t/Wate
r Qua
lity*
Solid W
aste
Manag
emen
t
Touris
mOthe
r
Issues
Num
ber o
f dot
s
Priority #1 Priority #2 Priority #3
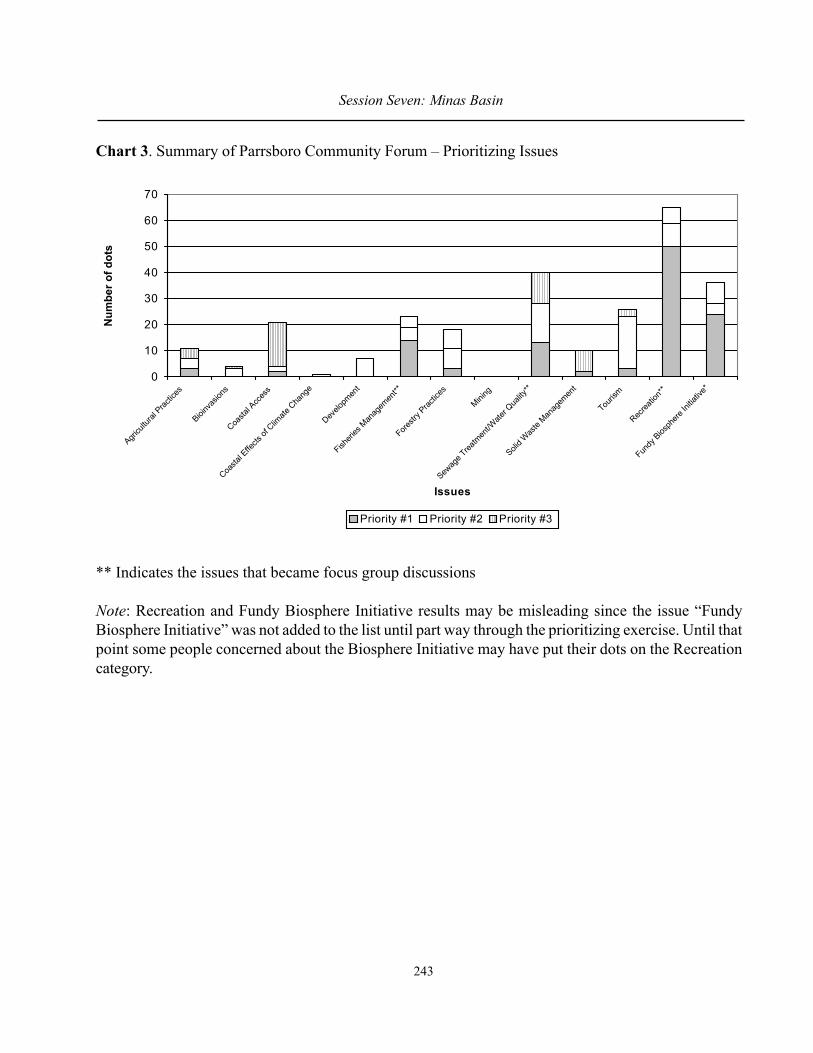
243
Session Seven: Minas Basin
Chart 3. Summary of Parrsboro Community Forum – Prioritizing Issues
** Indicates the issues that became focus group discussions
Note: Recreation and Fundy Biosphere Initiative results may be misleading since the issue “FundyBiosphere Initiative” was not added to the list until part way through the prioritizing exercise. Until thatpoint some people concerned about the Biosphere Initiative may have put their dots on the Recreationcategory.
0
10
20
30
40
50
60
70
Agricu
ltural
Practic
es
Bioinv
asion
s
Coasta
l Acc
ess
Coasta
l Effe
cts of
Clim
ate C
hang
e
Develo
pmen
t
Fisheri
es M
anag
emen
t**
Forestr
y Prac
tices
Mining
Sewag
e Trea
tmen
t/Wate
r Qua
lity**
Solid W
aste
Manag
emen
t
Touris
m
Recrea
tion*
*
Fundy
Bios
phere
Initia
tive*
Issues
Num
ber o
f dot
s
Priority #1 Priority #2 Priority #3

244
Health of the Bay of Fundy: Assessing Key Issues
Chart 4. Priority issues in Minas Basin Community Forums
0
10
20
30
40
50
60
70
Agricu
ltural
Prac
tices
Develo
pmen
t
Fisheri
es M
anag
emen
t
Forestr
y Prac
tices
Sewag
e Trea
tmen
t/Wate
r Qua
lity
Recrea
tion
Touris
m
Fundy
Bios
phere
Iniat
ive
Issue
Tota
l Num
ber o
f dot
s
Wolfville Truro Parrsboro
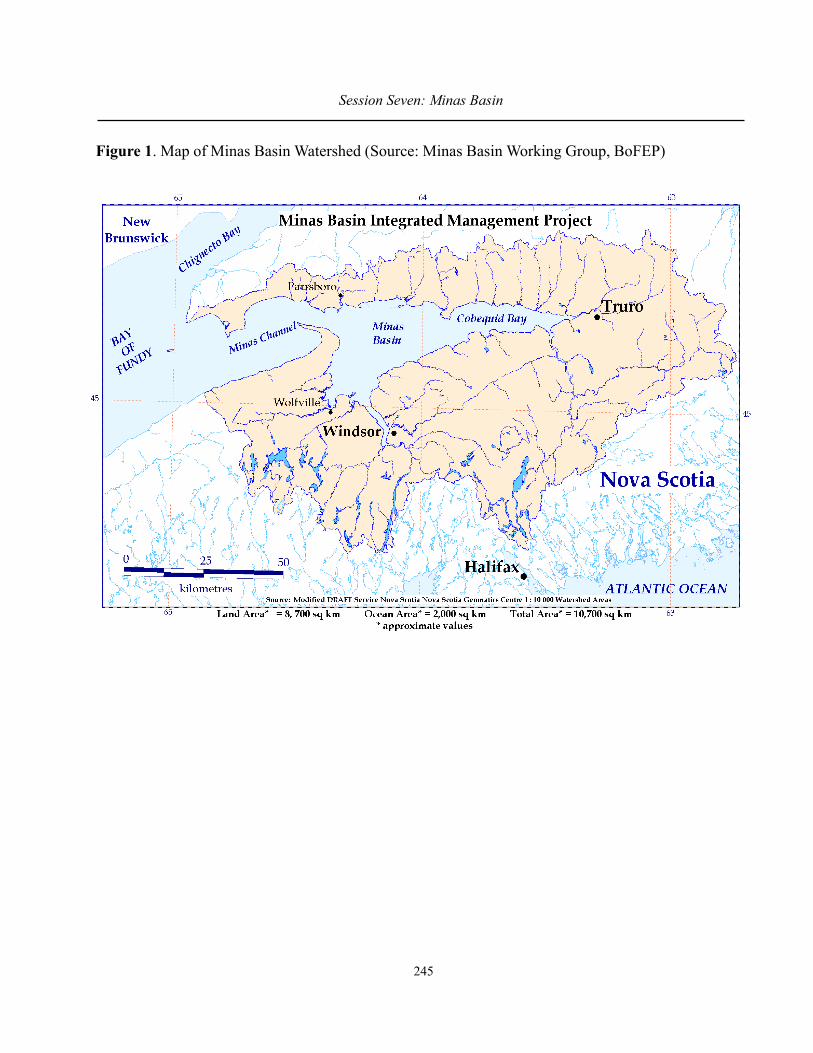
245
Session Seven: Minas Basin
Figure 1. Map of Minas Basin Watershed (Source: Minas Basin Working Group, BoFEP)
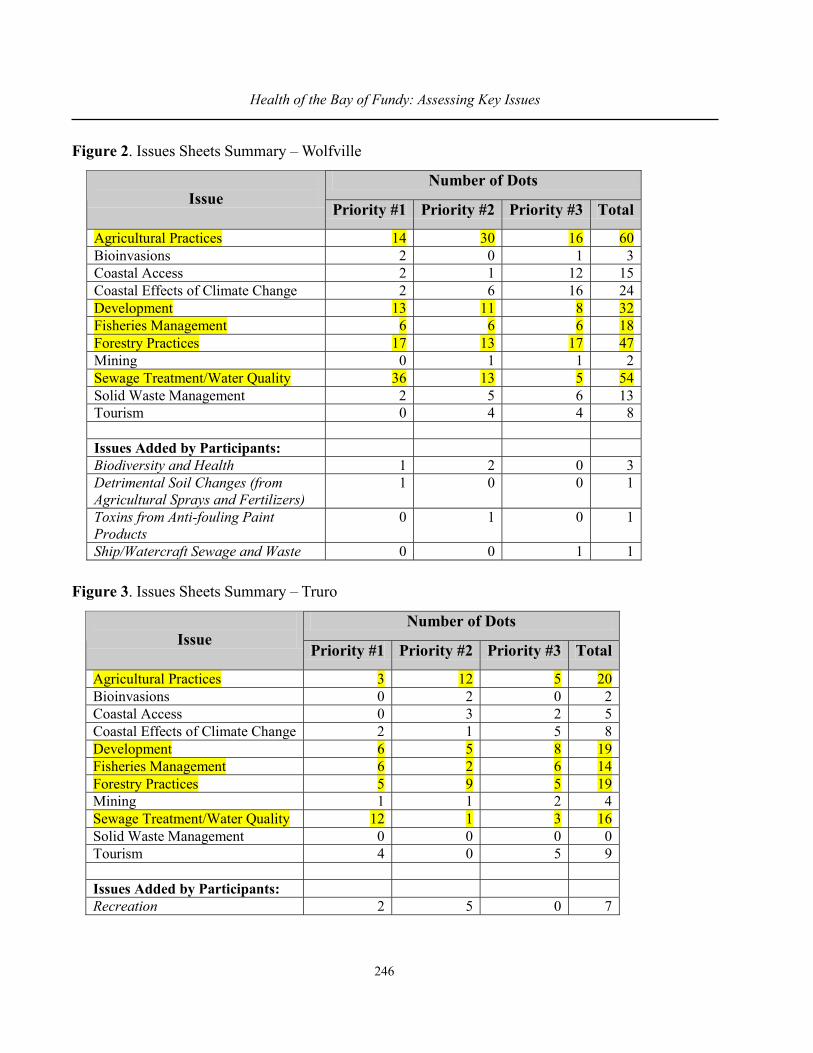
246
Health of the Bay of Fundy: Assessing Key Issues
Figure 2. Issues Sheets Summary – Wolfville
Figure 3. Issues Sheets Summary – Truro
Number of Dots Issue
Priority #1 Priority #2 Priority #3 Total
Agricultural Practices 14 30 16 60 Bioinvasions 2 0 1 3 Coastal Access 2 1 12 15 Coastal Effects of Climate Change 2 6 16 24 Development 13 11 8 32 Fisheries Management 6 6 6 18 Forestry Practices 17 13 17 47 Mining 0 1 1 2 Sewage Treatment/Water Quality 36 13 5 54 Solid Waste Management 2 5 6 13 Tourism 0 4 4 8 Issues Added by Participants: Biodiversity and Health 1 2 0 3 Detrimental Soil Changes (from Agricultural Sprays and Fertilizers)
1 0 0 1
Toxins from Anti-fouling Paint Products
0 1 0 1
Ship/Watercraft Sewage and Waste 0 0 1 1
Number of Dots Issue
Priority #1 Priority #2 Priority #3 Total
Agricultural Practices 3 12 5 20 Bioinvasions 0 2 0 2 Coastal Access 0 3 2 5 Coastal Effects of Climate Change 2 1 5 8 Development 6 5 8 19 Fisheries Management 6 2 6 14 Forestry Practices 5 9 5 19 Mining 1 1 2 4 Sewage Treatment/Water Quality 12 1 3 16 Solid Waste Management 0 0 0 0 Tourism 4 0 5 9 Issues Added by Participants: Recreation 2 5 0 7

247
Session Seven: Minas Basin
Figure 4. Issues Sheets Summary – Parrsboro
Number of Dots Posted Issue Priority #1 Priority #2 Priority #3 Total
Agricultural Practices 3 4 4 11 Bioinvasions 0 3 1 4 Coastal Access 2 2 17 21 Coastal Effects of Climate Change 0 1 0 1 Development 0 0 7 7 Fisheries Management 14 5 4 23 Forestry Practices 3 8 7 18 Mining 0 0 0 0 Sewage Treatment/Water Quality 13 15 12 40 Solid Waste Management 2 0 8 10 Tourism 3 20 3 26 Recreation 50 9 6 65 Issues Added by Participants: Fundy Biosphere Initiative 24 4 8 36

248
Health of the Bay of Fundy: Assessing Key Issues
“… THROUGH A GLASS, DARKLY”: WATER AND CLIMATE CHANGE INTHE BAY OF FUNDY WATERSHED
Graham Daborn
Acadia Centre for Estuarine Research, Acadia University, Wolfville, NS. [email protected]
Abstract
Water contamination and supply problems, coupled with large-scale land use and climate changes,are increasing anxiety among Fundy residents about their future water supplies. Proposals to minegroundwater, a resource that has not been adequately quantified, have implications for maintenance ofwater quality, and of habitat for fish and other wildlife. Research initiatives through the CanadianWater Network, and local groundwater interests, are aimed at developing a more comprehensive as-sessment of the sustainability of water use plans in the watershed of the Bay of Fundy.
Introduction
At first sight, the Atlantic region is blessed with an abundance of water: annual precipitationexceeds 1 m, and its arrival is distributed throughout the year; the landscape contains thousands of largeand small lakes, and numerous rivers; and water-based recreation is a growing interest throughout theregion. In spite of this, concerns over water quality and quantity have become commonplace, as moremembers of the public are forced to recognize that supplies are finite and the high quality of our surfacewaters more often is an illusion than a reality.
Water quality issues are not new. For more than a century, the region’s rivers have been dammedfor power generation, used to transport human waste away from its site of origin, and affected by avariety of land use practices. Maritime rivers are among the most modified rivers in the country. Theyhave been blocked, straightened, drained and contaminated. The rise of shellfish aquaculture in the1980s also focussed attention on the steady decline in water quality in the region’s estuaries, resultingfrom both local input and practices upstream. By the 1980s, the ineffectiveness of central governmentpolicies for protection of water had led to discussions of the potential for multi-stakeholder, commu-nity-based approaches to environmental management (Daborn and Hawboldt 1994; Daborn 1995, 1996;Daborn and Dickie 1997; Ellsworth et al. 1999).
Increasing uncertainty, fostered recently by successive years of lower than normal precipitationduring the growing season, has reinforced apprehensions over the regional effects of global warming.The agriculture sector, a major economic force in the Bay of Fundy watershed, sees its survival inincreasing access to fresh water; in many areas, surface supplies are already heavily overused and/orcontaminated beyond use, and hence new supplies must be extracted from the ground. Lost in the midstof such increasing demands, is the need for water to maintain ecosystem functions.

249
Session Seven: Minas Basin
Towards Watershed-based Planning and Management
Attempts to establish comprehensive, watershed scale management of water require severalvital pieces of information:
a) the present and future water availability;b) the existing suite of water uses and their trends;c) the impacts that existing uses have on water quantity, quality, and potential for reuse;d) the interactions and conflicts between different uses; ande) the capacity of local authorities and organizations to assess these stresses and manage them
into the future.
One might expect that information on existing water uses and trends is readily available, butcase studies have shown that is rarely the case. Similarly, the impacts of various activities are known ingeneral, but often the absence of effective monitoring means that little direct information is available toassess the state of the environment in any given catchment basin. Conflicts between alternative useshave been avoided in many areas by assigning water rights in a given watershed to one sector, andthereby precluding development of alternatives. These conflicts become evident when supplies areseen to be inadequate. Finally, almost nothing is clear about the factors influencing the capacity of localcommunities and governments to establish comprehensive and integrated watershed management.
These difficulties have led to a series of experiments in watershed management in the Bay ofFundy region. An enabling philosophy is found in several places: the Gulf of Maine Council on theMarine Environment (1989) adopted a whole watershed approach to addressing the threats to the Gulfof Maine-Bay of Fundy system; Canada’s ‘Green Plan’ provided the support for the Atlantic CoastalAction Program in 1991; Nova Scotia announced a ‘Coastal 2000’ policy in 1994, declaring that allprovincial land was functionally part of the coastal zone, and indicating a new partnership would beestablished between local communities and government agencies; and Canada’s Oceans Act (1997)explicitly requires an integrated ecosystem approach and a consideration of cumulative and interactiveeffects.
All of these policies tend to reflect the traditional assumption that ecosystems exist in somesteady-state condition that rarely changes except through human influence. It is a critical illusion: eco-systems, particularly coastal ecosystems, are constantly changing. Although many of the changes in theBay of Fundy watershed can be attributed to human interference and mismanagement (Lotze andMilewski 2002), some changes are undoubtedly independent of human influence. The spectre of globalclimate change, which will continue far into the future regardless of remedial measures, requires recog-nition of the dynamic nature of natural systems. Communities involved in integrated management haveto understand and act upon that recognition.
250
Health of the Bay of Fundy: Assessing Key Issues
Annapolis Valley – A Case Study
The Annapolis Valley has been identified as a good case study area for more than a decade. Itwas chosen for the first experiment in watershed management initiated under the Atlantic EstuariesCooperative Venture (1988) which eventually developed into the Atlantic Coastal Action Plan (ACAP)in 1991. The Clean Annapolis River Project (1990) became the first ACAP site. Among the reasons forits choice is that the Annapolis Valley is relatively small, covering about 1,300 km2. The AnnapolisRiver catchment area covers 1,020 km2, and drains westward through the Annapolis River, entering theBay of Fundy near Digby, Nova Scotia. A group of smaller catchments draining about 360 km2 flowseastward into the Minas Basin (Table 1, AGRA 2000).
Land and water use are notably different in these separate catchment areas. The Annapolis andCornwallis catchments are dominated by agricultural use, with some degree of domestic-residentialdevelopment, particularly at the eastern end of the Valley. In contrast, almost all of the Gaspereau-Black River system is committed for power production (AGRA 2000). Thus, the issues vary fromwatershed to watershed: water contamination from agricultural production predominates in the Annapolisand Cornwallis, whereas barriers to fish migration and cottage development are the principal issues inthe Gaspereau-Black River.
Even the form of agriculture varies between the catchments, and consequently the water qualityissue is somewhat different. For most of the Annapolis and Cornwallis catchments, the focus is onstock rearing, grains, orchard fruit and, more recently, soft fruits. In the Pereaux and Habitant catch-ments, major products are soft fruits and vegetables for export. These require irrigation with highquality water. Contamination of surface and ground waters by stock rearing and domestic waste, whichhas led to extremely high nitrate levels in near-surface ground water (Blair 2001), renders both sourcesof dubious quality for irrigation (Brylinsky 2001).
For the last decade, water quality of the Annapolis River has been regularly monitored by avolunteer group, the Annapolis River Guardians of the Clean Annapolis River Project Society (CARP).Despite major improvements in the functioning of waste treatment systems that each town operates,fecal coliform counts have consistently exceeded the maximum value for use in cattle watering andirrigation (100 coliforms/100ml), and usually exceeded the level permitting contact recreation (200coliforms/100ml).
Continued contamination of the Annapolis Valley rivers, is attributable to land use practices,the absence of riparian protection in agricultural lands, and the failure of on-site sewage treatmentsystems. Several community-based initiatives, organized under CARP and the Friends of the CornwallisSociety (FOCS), are aimed at rehabilitating the rivers through re-establishment of riparian zones andchanges in agricultural practice.
The poor condition of these surface waters has significant implications for the future of agricul-ture in the Annapolis Valley. Market forces are inducing shifts in local products from past focus on
251
Session Seven: Minas Basin
orchard fruits and cattle, to vegetables and soft fruits, that require irrigation with high quality water. Thefailure to maintain sufficiently high water quality places many of these products at risk.
For four of the last five years (1996–2001), annual rainfall has been significantly lower thanaverage, especially during the growing season. Water demand in Kings County has been rising at >1%p.a. (AGRA 2000), and during the recent droughts, shortages have become a serious problem for agri-culture. New crops, such as vegetables, soft fruits, and new apple varieties have high water demand. Arecent survey of water demand has shown that licenses approved for surface water withdrawal exceedthe average annual flow volumes of the five eastward-flowing rivers by 13% (AGRA 2000).
The only remaining source to meet increased demand, is groundwater. Proposals for majorirrigation projects in the Annapolis Valley are predicated upon the assumption that a large aquiferunderlies the Valley. Although more than 5,000 wells have been drilled into the aquifer in Kings Countyalone, few of these are monitored, and the total extraction of groundwater is currently unknown (AGRA2000). Contamination of groundwater by agricultural and domestic waste is known for several areas ofthe eastern end of the Valley (Blair 2001), and poses a potential threat to human health as well aslimiting legal use for irrigation. Assessment of the areas of groundwater recharge and capacity of theAnnapolis Valley aquifer is a critical need that has not yet been met.
Climate Change and Adaptation
Although it is still proving difficult to forecast future conditions for the Atlantic Region as aconsequence of global climate changes, there is strong belief that droughts will become commonplace.Climate change scenarios being developed by Environment Canada, will form the foundation of localinitiatives to adapt agricultural practices and domestic uses to meet growing water shortages. The At-lantic Environmental Science Network (AESN) is a multi-institutional initiative of Environment Canada,aimed at linking regional university, industry, and government research capacity to address environ-mental issues, particularly those associated with climate change and watershed management.
Adapting water demand and use requires a major increase in knowledge about water sources,supply and replenishment rates. It also requires an unprecedented degree of cooperation between users,governments and residents, and a planning process that does much more to integrate demands andefficient use of water into a strategy for sustainable living. With devolution of responsibility fromfederal to provincial, and thence to municipal governments, a major challenge is placed on local au-thorities to develop effective strategies for protecting and using fresh water.
The capacity of local communities to meet this responsibility is essentially unknown. The ca-pacity needed is of two kinds: a scientific capacity to assess water supply and quality, and the planningand decision-making capacity to allocate, reuse and protect water supplies. Because of past non-gov-ernment initiatives to deal with environmental aspects of water quantity and quality, the AnnapolisValley has become part of a comparative study of capacity issues in watersheds in Canada, fundedunder the Canadian Water Network (CWN) (de Loë et al. 2002). The CWN is a Network of Centres of
252
Health of the Bay of Fundy: Assessing Key Issues
Excellence developed to address the Environmental Implications of Clean Water; it involves research-ers at more than 30 universities, together with numerous industries and government agencies.
A significant part of capacity-building is the presence of legislation that enables local authori-ties and local users to plan and manage water supplies and uses. The long-anticipated Nova ScotiaWater Strategy, due to be released in October 2002, was originally designed to provide a locally-based,watershed-scale authority that would manage water issues. Intragovernmental conflicts, and the anxie-ties over liability issues in the post-Walkerton era, have both delayed and apparently diluted the strat-egy, especially by reducing the authority of local interests to manage their water supplies. What wasintended to be a community-based strategy that would permit an integrated and flexible approach towater management in the Fundy Watershed, now threatens to continue the toothless, top-down ap-proaches of the past. In the absence of significant capacity at the provincial level, and limited authorityat local levels, the future of water management in the region remains as opaque as the title suggests. Butone aspect of the future is clear:
“The value of water is known when the wells run dry.”Benjamin Franklin
References
AGRA Earth & Environmental Limited. 2000. Water Resources Needs of the Agricultural Industry inthe Annapolis Valley, Nova Scotia. Final Report. 134 pp.
Blair, K. 2001. Temporal and Spatial Profiles of Groundwater Nitrate Concentration in Kings County,Nova Scotia. Unpublished MES Thesis, Dalhousie University, Halifax, Nova Scotia.
Brylinsky, M. and N. Pindham. 2001. Eastern Rivers Baseline Water Quality Survey. Unpublishedmanuscript. Acadia Centre for Estuarine Research, Wolfville, NS. 34 pp.
Daborn, G. R. and S. Hawboldt. 1994. Incorporating volunteers in support of monitoring and researchon coastal zone problems. Pages 730–739. In: Coastal Zone Canada ’94: Cooperation in theCoastal Zone. Volume 2. P. G. Wells, P. Ricketts, S. M. Heming, J. Dale and G. R. MacMichael(Eds.). Coastal Zone Canada Association, Dartmouth, NS.
Daborn, G. R. 1995. Bridging the gap between science and people. Pages 73–82. In: Proceedings of theNational Habitat Workshop, 1995.
Daborn, G. R. 1996. Experiments in community involvement: volunteer-based monitoring programmes.In: Proceedings, 15th Eastern Regional Organisation for Planning and Housing (EAROPH)World Planning Congress, Auckland, New Zealand.
Daborn, G. R. and B. Dickie. 1997. The Whaingaroa (Raglan) Harbour Catchment Project. Pages 485–490. In: Proceedings Pacific Coasts and Ports Conference, Christchurch, New Zealand.
De Loë, R., R. Kreutzwiser and G. R. Daborn. 2002. Building Local Capacity to Provide Clean Water.Project No. P&Ga. Canadian Water Network.

253
Session Seven: Minas Basin
Ellsworth, J. P., L. P. Hildebrand and A. E. Glover. 1999. Canada’s Atlantic Coastal Action Program: Acommunity-based approach to collective governance. Oceans and Coastal Management 36:121–142.
Gulf of Maine Council on the Marine Environment. 1991. Annual Report 1990-91. 15 pp.
Lotze, H. and I. Milewski. 2002. Two Hundred Years of Ecosystem and Food Web Changes in theQuoddy Region, Outer Bay of Fundy. Conservation Council of New Brunswick. 188 pp.
Government of Canada, 1996. Bill C 26. An Act respecting the Oceans of Canada.
Table 1. Catchments draining into the Minas Basin
Figure 1. Mean fecal coliform concentrations of the Annapolis River, 1992–1998 (Brylinsky 2001)(Data for stations with at least six years of record; site # refers to the distance in km downstream fromAylesford, NS.)
0 10 20 30 40 50 60Site # (Distance)
0
100
200
300
400
500
Mea
n C
olifo
rms/
100
ml
Mean River Flow (m3.sec-1) Annapolis River
(at Lawrencetown) 23.8
Cornwallis River 8.58 Gaspereau & Black River
11.03
Pereaux, Habitant & Canard Rivers
2.99
Total 46.40
254
Health of the Bay of Fundy: Assessing Key Issues
EAST-FLOWING RIVERS BASELINE WATER QUALITY SURVEY
Michael Brylinsky1 and N. Pindham2
1 Acadia Centre for Estuarine Research, Acadia University, Wolfville, [email protected]
2 Environmental Science Program, Acadia University, Wolfville, NS.
The recent series of unusually hot, dry summers in Nova Scotia has resulted in the growing useof many rivers and their tributaries for irrigation of agricultural crops. This is especially true within theAnnapolis Valley where soils are relatively sandy and have limited capacity for retaining moisture overlong periods. In the case of the Canard, Habitant and Pereaux Rivers, all of which are currently beingused for crop irrigation, there have been no significant studies of water quality and no data exist thatallow an assessment of the water quality of these Rivers. The objective of this study was to carry out abasic water quality survey that would provide information useful to resource managers concerned withthe water quality of these three Rivers, not only with respect to crop irrigation, but also other activitiessuch as livestock watering, fisheries, and recreational uses.
Each of the three Rivers was sampled at bi-weekly intervals between 16 May and 28 August2001. The Habitant and Canard Rivers, each of which has a main stem of about 12 km, were sampledat six and five sites respectively. The Pereaux, which has a main stem less than 4 km in length, wassampled at three sites for most parameters, but was sampled at four sites for coliform numbers.
The water quality parameters measured were those typically used in general water quality as-sessments. These included: total suspended particulate matter (both inorganic and organic); water tem-perature; conductivity; total, calcium and magnesium hardness; alkalinity; pH; dissolved oxygen; percentdissolved oxygen saturation; total phosphorus; nitrate; chlorophyll a; and total and fecal coliform num-bers.
In general, there was little difference among the Rivers in the mean level of total suspendedparticulate matter over the entire survey period. Values were low most of the time, seldom exceeding10 mg/l. The generally low values observed, however, may be more a result of the lack of precipitation,and therefore surface run-off, during the survey period than evidence of the absence of sediment ero-sion.
There was considerable variation in temperature among the three Rivers. The mean water tem-perature at all stations for each River was 12.4, 15.8 and 17.7ºC for the Pereaux, Habitant and Canardrespectively, and the maximum summer temperature recorded at each River was 13.8, 21.1 and 19.1ºCfor the Pereaux, Habitant and Canard respectively. Water temperatures in the Pereaux River were sur-prisingly low and varied little, either spatially or seasonally. The Pereaux is a short river and appears tobe largely spring fed. In addition, it appears to be relatively more shaded by streamside vegetation thanthe other two Rivers. Water temperatures in the Canard and Habitant showed more spatial variation

255
Session Seven: Minas Basin
with significant increases in temperature from headwater to downstream stations. Increases of 10-12ºCwere typical for the Habitant. The Canard had increases in the range of 8-10ºC.
There is considerable variation in the mean levels of total hardness among the three Rivers.Total hardness for the Canard River is in the range of 50-60 mg/l, which is indicative of relatively softwater. The Pereaux River has the highest hardness values with a mean of about 170 mg/l, and theHabitant River is intermediate with a mean of about 150 mg/l. Calcium is the major salt in all of theRivers.
Alkalinity is reasonably high in all of the Rivers indicating they all have substantial bufferingcapacity and the ability to offset the negative affects of acid precipitation. This is also reflected in therelatively high pH levels, which were always above the neutral value of 7.
Dissolved oxygen levels and percent saturation values were high at all sample stations in thePereaux River, but varied considerably in the Canard and Habitant Rivers. The lowest values wereobserved in the upper part of the Canard, many of which were near and sometimes below the 50 percentsaturation level. A few instances of low dissolved oxygen values were also observed in the Habitant,but these never fell below the 50 percent saturation level. In some cases dissolved oxygen levels in theCanard and Habitant Rivers were well above the 100 percent saturation level. This typically occurred inthe lower portions of the Rivers and is probably a result of either heating of the water or production ofoxygen by photosynthesis of aquatic plants.
The levels of phosphorus and nitrogen were high in all of the Rivers, but varied greatly amongthe three Rivers. The Canard River had very high phosphorus levels, but the lowest nitrate levels. Theopposite was true for the Pereaux River where nitrate was much higher than phosphorus. In the Pereauxand Habitant Rivers, nitrate levels generally increased both downstream and over the study period. Inthe Canard River, nitrate levels varied little either spatially or temporally.
Total coliform bacteria numbers for all samples were always above the level that could beaccurately counted (2,419/100 ml). The numbers of fecal coliform bacteria measured at each samplestation ranged from a low of 5 to a high of greater than 2,400. The percentage of times fecal coliformnumbers exceeded 100, the level permissible for irrigation of crops for human consumption, was 67, 52and 58 for the Pereaux, Habitant and Canard Rivers respectively.
In summary, although there was considerable variation among the rivers in many of the param-eters monitored, all of the rivers exhibited evidence of impaired water quality.

256
Health of the Bay of Fundy: Assessing Key Issues
TIDAL RESTRICTIONS:OPPORTUNITIES FOR SALT MARSH AND
TIDAL RIVER RESTORATION IN NOVA SCOTIA
Tony M. Bowron
Ecology Action Centre, Halifax, NS. [email protected]
The reclamation of large areas of coastal salt marsh from the sea and conversion of it to agricul-tural land through the construction of dykes equipped with aboiteau, is a process that has importantcultural and historical significance throughout the Bay of Fundy. It is a practice that has resulted in thetrading of marine productivity for terrestrial productivity and contributed substantially to the loss ofupwards of 85% of salt marsh habitat in the upper Bay. The more recent construction of tidal crossings,such as causeways and roadways with poorly sized and improperly placed culverts and bridges, hasalso contributed significantly to the amount of tidal river and salt marsh habitat lost around the Bay.This is something that is both preventable and repairable.
In this project, carried out by the Ecology Action Centre with funding from the North AmericanFund for Environmental Co-operation, a focus was placed on the identification of the adverse effectsthat tidal crossings such as bridges, culverts and aboiteaux have had on salt marshes and river systemsalong Highway 215 in Hants County, Nova Scotia. The methodology used for the project was adaptedfrom the Parker River Clean Water Association’s Tidal Crossing Handbook (Purinton and Mountain1998) with adjustments made to compensate for the large tides in the Bay of Fundy.
Along Highway 215, twenty-one crossings were identified as influencing tide flow, four ofwhich were selected out for further study. Through collaboration with a number of groups, organiza-tions and government departments, notably the Nova Scotia Department of Transportation and PublicWorks, one of these crossings has been selected as the site for a pilot restoration project. Pre-restorationhabitat monitoring and baseline data collection are currently being carried out at this site. The nextphase of the project will include preparing a report detailing the results of the summer’s fieldwork andtalking further with property owners, the local community, and our other project partners about thefuture of the project.
During the summer of 2002, through a partnership between the Ecology Action Centre and theMunicipality of Colchester, two students were hired to conduct an inventory of tidal crossings along thecoast of Colchester County. To summarize, 52 crossings were assessed to determine if a restriction intidal flow due to the crossing was present. Of these 52 sites, 11 were determined to be complete restric-tions, 13 were considered partial restrictions, 23 were considered not to be restrictive, and the remain-ing 5 were not restrictive due to downstream obstructions such as dykes. The final results of this auditwill be detailed in a report titled “Marshes Tides & Crossings: Colchester County Tidal Barriers Audit2002” which will be available in the fall of 2002.
257
Session Seven: Minas Basin
Looking forward, it is hoped that 2003 will see further on-the-ground work at the restorationsite, a reference site (further monitoring and actual culvert replacement) and around the province (ex-pansion of the tidal barriers audit into one or more counties). For more information contact Tony M.Bowron at the Ecology Action Centre 1568 Argyle St. Suite 31 Halifax NS B3J 2B3 902.429.2202(ph);902.422.6410(fax); [email protected].
Reference
Purinton, T. A. and D. C. Mountain. 1998. Tidal Crossing Handbook: A Volunteer Guide to AssessingTidal Restrictions. Parker River Clean Water Association, Byfield, MA.
258
Health of the Bay of Fundy: Assessing Key Issues
A STEWARDSHIP APPROACH TO PROTECT SHOREBIRDSAND THEIR HABITAT IN THE MINAS BASIN
Donald Sam
Nova Scotia Nature Trust/Fundy Shorebird Project (NS), Halifax, NS. [email protected]
Introduction
I am here to speak about something that is a bit of a throwback in time. And like my mode ofpresentation—which includes some good old Kodachrome slides—its basis is time-tested and uncom-plicated. It is called stewardship, it has been around for hundreds of years and recently it has beenmaking a resurgence on conservation’s top ten charts.
In the case of Nova Scotia, private land stewardship is a must. Over 70% of the province is heldby small private and corporate owners, and many of these lands contain significant natural areas.
I wish to set the stage by giving you some background ecology on the fall migration of shorebirds.I will then describe the social and physical context of one of our working sites. Finally, I will tell youwhat we are doing to foster a stewardship ethic within our target areas.
The Fall Migration
A very quick primer on the migration of shorebirds. Each year, from June through September,millions of shorebirds migrate from Arctic nesting areas to wintering areas in South America.Semipalmated Sandpipers and Semipalmated Plovers comprise the bulk of the migration. The Bay ofFundy is a major stopover for migrating shorebirds during the fall. It is the last major stopover forshorebirds before they cross the Atlantic Ocean to reach the northern coast of South America. While inthe Bay of Fundy, shorebirds replenish their energy stores—body fat—and rest up for their pendingmarathon flight.
But if you had to pick one reason why shorebirds elect to stopover in the Bay of Fundy, it wouldhave to be Corophium volutator, the mud shrimp. This tiny shrimp (3–5 mm) by and large fuels thefinal leg of the shorebird migration. Perhaps by chance, but likely by design, shorebirds pass throughthis area just about when Corophium are most abundant and most available as forage. While in the Bayof Fundy, shorebirds dedicate their time to feeding on the mudflats whenever the tide allows, night orday, and conserving energy by gathering in communal resting areas, called roosts, on shore when thetide is high.
The availability of safe, undisturbed shoreline areas for shorebirds to roost is important to thesuccess of this migration. Remember, migratory shorebirds need a full tank of fuel to complete theirmigration; when not feeding, they cannot afford to waste energy. They need resting areas.

259
Session Seven: Minas Basin
The Fundy Shorebird Project (Nova Scotia)
The Fundy Shorebird Project is a joint effort of nine organizations (Eastern Habitat Joint Ven-ture, Wildlife Habitat Canada, US Fish and Wildlife Service, Canadian Wildlife Service, Ducks Unlim-ited Canada, Nature Conservancy of Canada, Nova Scotia Nature Trust, Nova Scotia Department ofNatural Resources, and New Brunswick Department of Natural Resources and Energy) working toconserve migratory shorebirds and their habitat in the upper Bay of Fundy in both New Brunswick andNova Scotia. I will describe the project’s efforts in Nova Scotia, and more particularly, the work in theMinas Basin. Our stewardship efforts attempt to preserve high quality roosting habitat for shorebirdsand, to a lesser degree, foraging habitat. The two sites in Nova Scotia we currently are targeting areBlue Beach, located north of Hantsport, and Evangeline Beach which is near Grand Pre. Both areassupport major roosts, at times exceeding 300,000 shorebirds a day, during the peak of migration.
Evangeline Beach
I am going to discuss our activities at Evangeline Beach to illustrate how we are protectingshorebird habitat through private land stewardship. The landscape of Evangeline Beach is a mixture ofintensive summer residential and agricultural farmland, including dykelands. In addition to these landuses, there are several commercial enterprises, including a motel, camp ground and canteen/commu-nity hall that draw summer visitors to the area. As you might imagine, during the summer months whenshorebirds are moving through the area, Evangeline Beach experiences its highest level of humanactivity for the year. And often this poses serious challenges to the well-being of migratory shorebirds.
As I mentioned earlier, shorebirds require safe, undisturbed areas to rest when their feedingflats are inaccessible. Ideally, roosting sites are close to feeding areas. Present levels of human activityalong the coast—residential, recreational, and commercial—make it difficult for shorebirds to findsuitable roosting areas.
The pattern of land ownership along the coast of Evangeline Beach shows that much of thecoastline is divided into many small parcels. Today, there are a handful of coastal properties alongEvangeline Beach that are large enough to merit protection via outright purchase. The Nature Conserv-ancy of Canada is working on acquiring suitable properties in the area. However, about half of thewaterfront area is currently occupied by residential lots, most of which are small lots. Habitat protec-tion through fee simple purchase would be expensive, but more importantly, it would be ineffective insecuring habitat, unless many contiguous parcels could be acquired—this is not practical at all.
A Stewardship Approach
The alternative? Private land stewardship. We are taking advantage of the fact that EvangelineBeach is a closely-knit community to foster a community-wide stewardship ethic.
260
Health of the Bay of Fundy: Assessing Key Issues
How are we doing this? Our approach is multi-pronged and based on the approach use by theNova Scotia Nature Trust in its other programs. We arrange to meet individually with landowners,usually in their home, to discuss shorebird conservation. Face-to-face meetings are essential. We wantto change human activity on the mudflats as well as along the shoreline. Therefore, we meet withowners of land along the coast, as well as owners of inland properties in the community, since localresidents—whether they live on the actual coast or not—are likely to be long-term users of the beach.
During our meeting, we discuss much of the background information that I have shared withyou today. More importantly, we advise local residents of things they can do (or not do) to reducedisturbance to shorebirds. The meeting is as much about building trust and co-operation as it is aboutexchanging technical information—we are trying to initiate a working relationship.
We strive to reach a land use agreement with landowners and enlist them as ‘Shorebird Stew-ards.’ This is an informal agreement based on good faith as opposed to legal enforcement. (The terms ofour Shorebird Stewardship Agreement appear in Appendix 1.) To ‘formalize’ a stewardship agreementwith a participating landowner, we present them with a Shorebird Stewardship Award. The certificaterecognizes their commitment to shorebird conservation, and outlines the stewardship practices theyhave agreed to observe and the rationale for doing so. We purposely included the stewardship informa-tion on the certificate to ensure that the suggested practices remained clear and visible at all times.
We also produced a distinctive garden flag to be displayed on the property of participatinglandowners. The flag publicly acknowledges the involvement of Shorebird Stewards within their com-munity. We also hope that the flags generate broad community awareness for the program, and perhapseven become ethical status symbols!
Finally, we are further promoting our stewardship initiatives within the greater community bysponsoring a variety of public walks and talks. We have forged links with many groups, including localnaturalists, community members, Grand Pre National Park, and Acadia University, to make these eventshappen. And the list grows.
Ultimately, at the end of the day, we want people and shorebirds to share resources and be ableto co-exist side by side.
Lessons Learned to Date
• Be patient. The successful negotiation of stewardship agreements is very much built onmutual trust; building trust may take quite some time.
• Follow-up is important. You must remain in contact with people you have contacted in thepast, e.g., annual newsletters, phone calls, etc.
• Do not eat the food offered. You might like it; you might not. In the interest of not offend-ing, politely say no thank you, ‘you just has a big meal before you came’.

261
Session Seven: Minas Basin
Appendix 1. Fundy Shorebird Project (NS)—Terms of Stewardship Agreement
Stewardship Practices for the Migration Period
At high tide, shorebirds seek suitable sections of shoreline to rest (roost). Land-based distur-bances can interfere with the ability of shorebirds to roost properly during their migratory period (Julythrough October, peaking in August). By observing the following land use practices when migratoryshorebirds are present in the Minas Basin, one can minimize disturbance to roosting birds.
• Schedule shoreline activities for months outside of the migration period whenever possible.• Complete shoreline improvements and maintenance activities, such as lawn cutting and con-
struction, during the periods of low tide, when feeding shorebirds tend to be in offshoremudflats.
• At sites that birds are known to frequent, avoid the beach area during periods of high tide, thetime when shorebirds are most likely to be present.
• Direct recreational activities, such as hiking, swimming and boating, away from areas knownto be used by shorebirds.
• Leash (or restrain) dogs and other pets at all times while they are on or near the beachfront ifshorebirds are present.
• Notify visitors and other beach users of the presence of shorebirds and encourage them toobserve appropriate practices.
Stewardship Practices for Year Round
All plans for beach and near shore development should consider any potential long-term effectsto the habitat of shorebirds and other wildlife. The following practices support shorebird conservationthroughout the year.
• Maintain a natural section of shrubs, unmowed grass and other vegetation by the shoreline.• Consult the Nature Trust before adding reinforcing structures/rock along the shoreline.• Consult the Nature Trust when planning construction of boat launches, walkways, or other
permanent beachfront structures.
All Shorebird Stewards shall alert the Nature Trust if they note persistent activities/uses thatappear to disrupt shorebirds or their habitat.
Shorebird Stewards who own property along the upper Bay of Fundy shall notify the NatureTrust when they transfer ownership of their property so that a representative can meet with new ownersto discuss shorebird conservation.

262
Health of the Bay of Fundy: Assessing Key Issues
THE REFERENCE CONDITION APPROACH:ON TRIAL IN THE MINAS BASIN
Maxine C. Westhead1 and Trefor B. Reynoldson2
1 Oceans and Coastal Management Division, Bedford Institute of Oceanography,Dartmouth, NS. [email protected]
2 Acadia Centre for Estuarine Research, Acadia University,Wolfville, NS. [email protected]
Context: Marine Environmental Quality and the Oceans Act
The Oceans Act was proclaimed in January of 1997, and provides a legislative framework forthe management of Canada’s oceans and marine resources. Part II calls for integrated managementplans, the development of a national system of marine protected areas, and the establishment of marineenvironmental quality guidelines, objectives and criteria. In this context, three interconnected OceansAct programs are presently being undertaken by the Department of Fisheries and Oceans (DFO): Inte-grated Management (IM), Marine Protected Areas (MPA), and Marine Environmental Quality (MEQ).
What is Marine Environmental Quality?
The definition of Marine Environmental Quality (also known as Marine Ecosystem Health) hasbeen a subject of debate for many years. For the purposes of the MEQ Program, DFO has adopted thedefinition from Skjoldal (1999) stating that Marine Environmental Quality:
... is an overall expression of the structure and function of the marine ecosystemtaking into account the biological community and natural physiographic, geo-graphic and climatic factors as well as physical and chemical conditions includ-ing those resulting from human activities.
Figure 1 conceptualizes the overall goals of the DFO Marine Environment Quality Program.
Components of Marine Environmental Quality
MEQ can be broken down into progressively smaller, nested components (Figure 2). Dale andBeyeler (2001) suggest that ecological indicators should be:
1. easily measured2. sensitive to stresses3. predictably responsive to stress

263
Session Seven: Minas Basin
To paint a true picture of ecosystem health over time, our selection of indicators should meetDale and Beyeler’s criteria, yet still be manageable—in terms of time, money, and ease of measure-ment. The indicators must also cover a wide range of ecosystem components, from broad ecosystemmeasurements to specific site measurements.
DFO is currently developing a broad MEQ framework for the entire Minas Basin, which willinclude other species and other factors such as contaminants, sediment dynamics, nutrient inputs, etc.This polychaete study is only a small portion of that framework.
Overall Goal of the Study
This study will test the use of the intertidal polychaete community as a Marine EnvironmentalQuality indicator in the Minas Basin mudflats. Specifically, polychaete community structure in mudflatsthat have been harvested for baitworms will be compared to unharvested areas. Habitat attributes willalso be evaluated to determine which have the largest influence on community structure.
Study Area—The Minas Basin Intertidal Mudflats
Low tide exposes approximately 400 km2 of intertidal area (Thomas 1977), which representsapproximately 30–40% of the Minas Basin (Yeo 1977). The intertidal benthic community is mainlycomprised of a few dominant species, mostly bivalves, deposit feeding crustaceans and burrowingpolychaetes (Percy et al. 1997).
Why Worms?Polychaetes are soft-bodied bristle worms that cover a wide size range, as both free-moving
burrowers and sedentary tube dwellers, and exhibit a wide range of feeding behaviour. Polychaetes areprey for bass, skates, dogfish, tomcod, eel, rockling, and hake (Yeo 1977), making them an intermedi-ate link between primary production and higher trophic levels.
There are four main advantages of using polychaetes for marine environmental monitoring:
1. They are easy to sample and typically abundant2. They include both sedentary and mobile species3. Their life histories cover a variety of trophic levels (Pocklington and Wells 1992; Mallin et
al. 1997)4. They are relatively long-lived (years rather than months) (Brown 1993)
Polychaetes have already proven to be useful indicators of chemical pollution (Pocklington andWells 1992). This study will be exploring another use of polychaetes—community structure as anindicator of sediment disturbance. It will also look at what habitat attributes play the biggest role indetermining community structure.
264
Health of the Bay of Fundy: Assessing Key Issues
The Reference Condition Approach
The Reference Condition Approach is a method based on establishing the natural diversity innormal, or reference, conditions of community assemblages in an area and linking this to habitat at-tributes (grain size, slope, salinity, etc.). Models are then developed from these reference databases thatallow us to predict the expected community assemblage at any specific site based on its habitat at-tributes.
This approach has been used successfully in freshwater streams and lakes (see Reynoldson etal. 1997 and Reynoldson et al. 2001), but has yet to be applied in a marine environment. This study willbe the first test of this approach in a coastal marine environment. This is accomplished by sampling awide range of environmental variability in the Minas Basin; 40–50 sites that are ‘undisturbed’ or ‘leastimpacted’ areas will be chosen to be reference sites. Test sites, or areas that have been harvested forbaitworms, will be compared to the reference sites to determine the degree of disturbance, if any exists.
Methods
Overlays of environmental variables in the Minas Basin will be mapped, and 40–50 referencesampling sites will be identified with the goal of covering as much environmental variability as possi-ble (e.g., sampling high and low intertidal areas, sandy and muddy areas, etc.). Areas harvested forbaitworms, and areas with other types of disturbance, will serve as test sites. The test sites are thencompared to the reference sites, and degree of impairment (if any) is determined.
As a management tool, this approach offers potential to be used for building predictive models,thereby allowing us to set marine environmental quality guidelines for the area.
References
Dale, V. H. and Beyeler, S. C. 2001. Challenges in the development and use of ecological indicators.Ecological Indicators 1: 3–10.
Mallin, M. A., L. B. Cahoon, M. R. McIver, D. C. Parsons and G. C. Shank. 1997. Nutrient Limitationand Eutrophication Potential in the Cape Fear and New River Estuaries. Report No. 313.Water Resources Research Institute, University of North Carolina, Raleigh, NC.
Percy, J. A., P. G. Wells and A. J. Evans (Eds). 1997. Bay of Fundy Issues: A Scientific Overview.Workshop Proceedings, Wolfville, NS, January 29 to February 1, 1996. Environment Canada -Atlantic Region Occasional Report #8, Environment Canada, Sackville, NB. 191 pp.
Pocklington, P. and P. G. Wells. 1992. Polychaetes: Key taxa for marine environmental quality monitor-ing. Marine Pollution Bulletin 24: 593–598.
Rapport, D., R. Costanza, P. R. Epstein, C. Gaudet and R. Levins (Eds). 1998. Ecosystem Health.Blackwell Science, Inc. Malden, MA.

265
Session Seven: Minas Basin
Reynoldson, T. B., R. H. Norris, V. H. Resh, K. E. Day and D. M. Rosenberg. 1997. The referencecondition: A comparison of multimetric and multivariate approaches to assess water-qualityimpairment using benthic macroinvertebrates. Journal of the North American BenthologicalSociety 16: 833–852.
Reynoldson, T. B., D. M. Rosenberg and V. H. Resh. 2001. Comparison of models predicting inverte-brate assemblages for biomonitoring in the Fraser River catchment, British Columbia. Cana-dian Journal of Fisheries and Aquatic Sciences 58: 1395–1410.
Skjoldal, H. R. 1999. Overview report on ecological quality (EcoQ) and ecological quality objectives(EcoQOs). Havforskningsinstituttet Rapport. Bergen, Norway.
Thomas, M. L. H. 1977. Intertidal resources of the Bay of Fundy. Pages 148–159. In: Fundy TidalPower and the Environment, Proceedings of a Workshop on the Environmental Implications ofFundy Tidal Power, held at Wolfville, Nova Scotia, November 4–5, 1976. G. Daborn (Ed.).Acadia University Institute Series No. 28. Acadia University Institute, Wolfville, NS.
Yeo, R. K. 1977. Animal-Sediment Relationships and the Ecology of the Intertidal Mudflat Environ-ment. Minas Basin, Bay of Fundy, Canada. M.Sc. Thesis, McMaster University. 396 pp.
To better understand marine ecosystems and their complexities, we need to gather information about them over time. Indicators will be selected and monitored over time to reveal areas that are changing – in both negative and positive ways.
MEQ activities will provide the baselines from which we can attempt to assess the state, or health, of the marine environment. These activities include delineating ecosystems into smaller, more manageable ‘chunks’, mapping human use, and using existing data to help paint a picture for an area such as the Minas Basin.
Once we have assessed the state of a given marine ecosystem, it can be used as the basis for future assessments. With time, ecosystem health can be tracked – to see where stresses are compromising health or where restoration efforts are making improvements.
MEQ activities aim to improve our knowledge of marine systems. This knowledge will be passed on to resource managers to provide a more solid scientific foundation on which to base decisions.
Reporting
Understanding Monitoring
Assessing
Figure 1. A conceptual framework for marine environmental quality
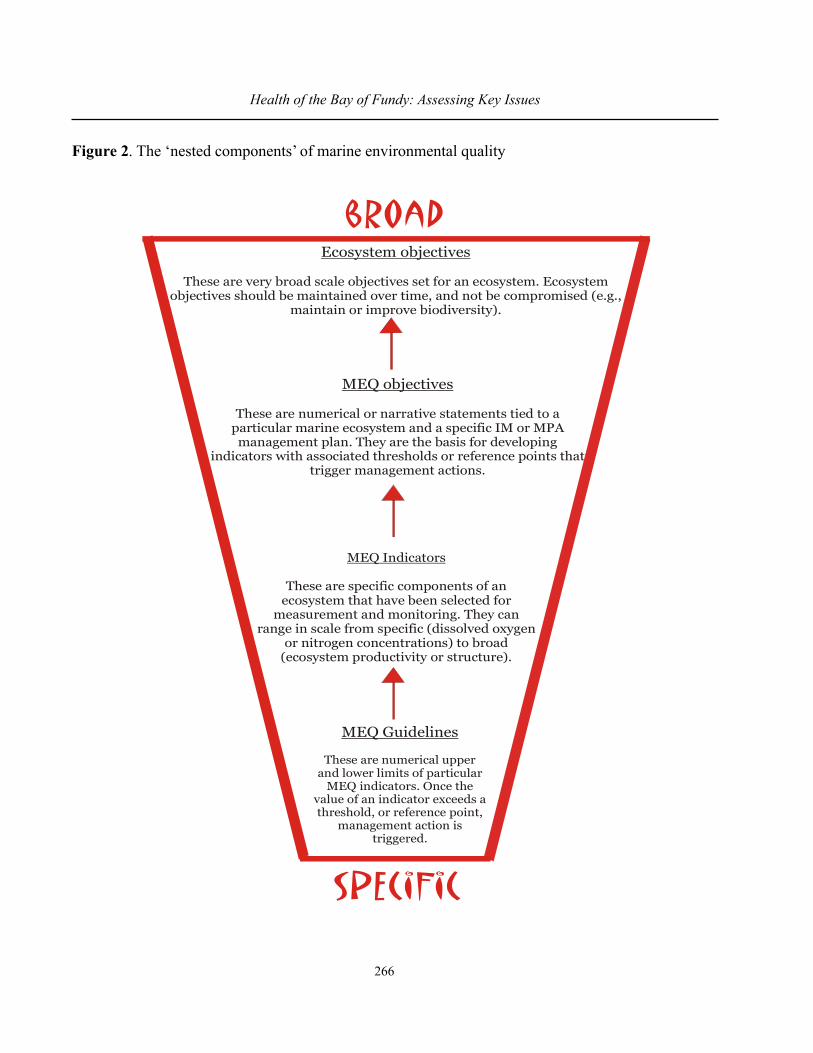
266
Health of the Bay of Fundy: Assessing Key Issues
Figure 2. The ‘nested components’ of marine environmental quality
MEQ Guidelines
These are numerical upper and lower limits of particular
MEQ indicators. Once the value of an indicator exceeds a threshold, or reference point,
management action is triggered.
MEQ Indicators
These are specific components of an ecosystem that have been selected for
measurement and monitoring. They can range in scale from specific (dissolved oxygen
or nitrogen concentrations) to broad (ecosystem productivity or structure).
MEQ objectives
These are numerical or narrative statements tied to a particular marine ecosystem and a specific IM or MPA management plan. They are the basis for developing
indicators with associated thresholds or reference points that trigger management actions.
Ecosystem objectives
These are very broad scale objectives set for an ecosystem. Ecosystem objectives should be maintained over time, and not be compromised (e.g.,
maintain or improve biodiversity).
267
Session Seven: Minas Basin
PANEL DISCUSSION CHAIR
Chair: Graham DabornRapporteur: Pat Hinch
Panel Members: Maxine Westhead, Robin Musselman, Pat Hinch, Barry Jones, Tony Bowron,Karen Beazley
Question 1. Why is there a Minas Basin Working Group and what are its objectives and roles?
Graham Daborn – The Minas Basin Project is an experiment in integrated coastal management. Wehave spoken to coastal communities and to government agencies concerning the use of integratedmanagement systems. We do not have accumulated experience on this issue, but we know that it isbeyond the scope of individual disciplines to deal with. The Minas Basin Project is trying to applyintegrated coastal management to a significant piece of the maritime region, while at the same timelearning how to deal with the issues and finding the best ways to approach communities. The commu-nity forums of the Minas Basin Project have had a similar format to that used for discussions of theBiosphere Reserve proposal. However, our approach has been to try to develop the forum agenda as wewent out to each of the communities. In contrast, the Biosphere Reserve meetings presented a predeter-mined proposal for evaluation and this typically created an immediate conflict situation. In most in-stances you really don’t know the dynamics of groups of people and how they will respond to anyparticular issue. The Minas Basin Project is thus very much an ongoing experiment in how to approachintegrated management.
When you initiate such activities you create an expectation that something will happen. However, thereare some fundamental things we don’t know about some of the issues. In addition, the Working Grouphas no power to make certain things happen. What happens after this workshop? Don’t we at somepoint need the legislative authority to take action, and where does this fit into the integrated manage-ment process?
Barry Jones – In 1997, the integrated management concept was put into the Oceans Act, and since thattime the Department of Fisheries and Oceans has been struggling with finding out how to make thisconcept a reality. The Minas Basin Project came along at a time when DFO was looking for an appro-priate mechanism. It looked like a viable marriage. Unfortunately, in the aftermath of the events ofSeptember 11, 2001, funding for many newer initiatives was reduced. There must be support from thecommunity if the process is to be of value to the community. Such local support will undoubtedly comebecause a few key people are now motivated enough to generate the interest in the wider community.Information about this developing initiative will be passed on to the appropriate decision-makers. Thus,now is the time for a groundswell of support by communities to make the concept happen. Integratedmanagement is already in the legislation. What we need now is community activation to make it areality.
268
Health of the Bay of Fundy: Assessing Key Issues
Graham Daborn – The Minas Basin Project does not have the capacity to do new research or gathermore information. Pitifully little is known about the dynamics of the Bay of Fundy. If you look at thepeople involved in this project, you will see that they are associated with a wide variety of groups anddisciplines. The ongoing activities of these different organisations could help us to fill in some of theenormous data gaps that exist. We need to scavenge support and information from wherever we canfind it. The local forums are also an opportunity for us to garner more information from coastal commu-nities to bring to the table.
We need to do something concrete now. A history of the previous attempts at implementing integratedcoastal management shows that there is usually a window of opportunity when effective action can bestbe initiated.
Does BoFEP have a sense of the scope of this window of opportunity and time over which actionshould be initiated?
Graham Daborn – The time is now; five years ago would have been better! However, we’ve beenstruggling to obtain funding. This hasn’t been successful yet, in spite of the fact that the project fits thecriteria for the Gulf of Maine Council Action Plan. We are also constrained at the political level inseeking available funding. Prior to September 11 there were a number of opportunities for funding, butsince then many of these have dried up. We also have a window of opportunity for involvement with thecommunities. I’ve been through a number of similar information gathering exercises before, wherenothing much happens subsequently. We can’t afford to allow things to languish for any extendedlength of time. Our present window of opportunity will close if we don’t take action very soon.
An expectation is building within the various communities already visited. What will happen after wehold the fourth community forum?
Graham Daborn – The plan is to go back to the people in the communities to identify leaders and otherindividuals who are interested in participating in action groups to work on some of the priority issues.We will need to ask these action groups to define specifically what they want to do and how they aregoing to do it.
One of the good things about the ACAP initiative is that many successful projects have been imple-mented. For instance, ACAP has collected the longest available data set on water quality in the AnnapolisRiver. ACAP has been able to do this and other such projects largely because government has funded it.Where is the government support in relation to the Minas Basin project?
To be fair to the government, ACAP would not now exist if Environment Canada had not been willingto take a gamble. Environment Canada did this in 1989–90, largely as a result of one individual in theDepartment taking the initiative. Success came from picking sites where there was an issue alreadyidentified and on the table and then making a commitment for funding a full-time co-ordinator. Withinfive years the designated ACAP sites were expected to develop a comprehensive management plan for
269
Session Seven: Minas Basin
their watershed. However, the Clean Annapolis River Project Society (CARP) wanted to start someconcrete projects. Thus there was some delay before CARP got a valid, comprehensive managementplan in place. But there was plenty of initiative from the community to begin specific activities. Ourexperience has been that once you start such a process it will usually take off on its own.
That’s part of the struggle involved in the whole process. We need to determine what communities canand will do. We are largely counting on communities to do much of the work themselves. Are theygoing to do it? Are they going to take up the challenge?
Barry Jones – There are many people who are not sure about their relationship to the Minas BasinWorking Group. The onus is on the Working Group to start the process and lead the charge. This isn’talways clear within the communities.
Graham Daborn – We got a bit off-track at the Parrsboro forum because both a watershed managementplan and a Biosphere Reserve proposal were put on the table at the same time. It is difficult enough forus to understand what is needed, let alone for the community to do so. We need to identify what re-sources the community groups need. Many available resources never see the light of day. The state ofthe environment in the area is often not well known. One of our important roles as a Working Group isto identify what information presently exists and what capacity is available in the scientific communityand government to fill in the blanks. If we look at the example of the Ecology Action Centre, we can seethat it does not take a lot of funding to gather and disperse information. A significant amount of moneyis being spent for environmental assessment relating to the Highway 101 twinning and on the proposedwidening of the Windsor Causeway. We may be able to tap into some of this funding.
Has there been any discussion about standardising sampling protocols and identifying specific studysites, since these are essential keys to effective long-term monitoring programs?
That’s a very good idea, although the Minas Basin Working Group is presently focussed on the commu-nity involvement angle, not so much on the science. The Working Group recognizes a priority forimplementing changes and is working in small steps to make such changes happen.
The Saltmarsh Working Group is also talking about establishing sampling standards and the develop-ment of protocols for collecting comparable ecological data and other information.
This raises an interesting question about who makes up the “community”. What about establishinglinks between the Working Group efforts and students who might potentially be involved in the re-search. Can the Working Group identify specific areas where we need more information or data? Manyothers, such as students, could contribute their expertise to the process. Is the community really com-posed of only farmers and fishermen? They are only a part of the community. There are also research-ers, scientists and students. I get tired of being discounted as a community member simply because I amfrom a university.
270
Health of the Bay of Fundy: Assessing Key Issues
I also wonder if, from the standpoint of community forums, we are not getting too caught up in discuss-ing the concept of integrated coastal management. There are communities that already know what theywant to do and how to put it into effect. The Minas Basin Working Group, as an integrated managementgroup, should be the one to gather the necessary information and help the communities out with theirproposed activities. The Working Group should not worry about having a plan that is integrated fromthe start but rather let people work on their own individual plans. Eventually, although they are notinitially integrated, many similar things will be going on which will further stimulate the communitiesinitiatives. We really need to get on with the activities.
That is a good point. Clearly the issues can, and should, be worked on from many directions. Forexample, in Summerville one group could be monitoring the bloodworm harvest while other groupscould work to stop clearcutting or herbicide spraying. Yet others could work on promoting energyconservation or wise resource use to ensure that people are using the land and water in a sustainablefashion. Another question relates to the sources of the data that is needed, and who should we be talkingto in government about this?
In BoFEP and the Minas Basin Working Group we have discussed the use of the concept of “integratedmanagement” for similar reasons. Our intent was to try to work from the top down as well as from thebottom up, feeling that there would be nested levels of integration involved. What we have been sug-gesting all along is the kind of approach that we are now moving toward.
Another important issue is effective communication. We are not asking communities to develop man-agement plans but to do what they can do to move forward on some of the more important issues. Weare asking them: How would you like to deal with the issues and how can we help you to bring peopletogether and encourage them to work together?
This was where Environment Canada made its first mistake. It decided to give funds to the ACAP sitesbut then wanted something tangible to come back fairly soon. This is where the concept of developingcomprehensive management plans came from. The communities were not initially interested in prepar-ing five-year management plans, but only later recognized the value of strategic plans for the identifi-cation and prioritisation of issues and for developing work plans. What was important about the ACAPprocess was that communities were eventually allowed to move forward with their own activities.Projects were never fully developed into a comprehensive action plan until the community identifiedthe need for one.
Communities really do not know where they stand. They need a clear mandate and adequate fundingfor community initiatives.

271
Session Seven: Minas Basin
Question 2. Do we know enough about the dynamics of Minas Basin to develop a management strat-egy? What will be included in such a management strategy?
No, we do not know enough about the dynamics but yes, we can develop a management strategy, notbecause we know everything but because we need one. We should start with something simple and thenmove forward. What the communities told us was that they wanted to see a state of the environment(SOE) report. They wanted to know if a SOE report could be a product of the Minas Basin WorkingGroup that might help identify any information gaps by bringing together all the available informationfrom governments, communities and other sources. Development of a comprehensive managementstrategy and an economic strategy are considered more distant possibilities. To start developing a SOEreport merely requires the collection of information from various sources and communicating with thepublic to make people aware of the initiative. You do not need to have a comprehensive managementplan to produce a SOE report.
At the Wolfville forum we were struck by the scale and diversity of the geographic area involved. Atsome point it will be useful to identify sub-watersheds. What may be an issue in one location may notbe in another nearby area.
We need to focus on the different components involved in the process. Throwing community concernstogether with scientific issues is not necessarily appropriate or useful. We need to subdivide the processto have one group focussing on the scientific aspects and another on the community issues; perhapshaving a session on science and another on community issues. We are trying to integrate everything,and we simply cannot. None of us is capable of dealing with all these different aspects. This is a hugeissue. Everyone is trying to deal with everything. We are trying to sensitize people in the communities.We are aware of the importance of integration, but to be a good scientist you really need to focus onscience. If you are focussing on community issues then you cannot properly focus on science. Theworking group is lacking a clear focus. It needs to focus on the different components separately.
About 10-15% of scientists are now working in association with communities and such local involve-ment is extremely important. The strength of the Minas Basin Working Group is that it is trying toperform the integration function. There is a great need for a multidisciplinary approach that bringseveryone together. You cannot keep all the different aspects separate.
We are losing out on the science. We have new people looking at many of the same old issues fromtwenty years ago. We need to field many balls at once. We need to design an approach whereby indi-viduals can focus primarily on their particular area of expertise. We also need to identify knowledgegaps.
272
Health of the Bay of Fundy: Assessing Key Issues
Question 3. How can community members be motivated to get involved and contribute needed re-sources?
In-kind support from communities is already happening. We have had more people coming forwardduring the community forums to ask to be part of the Working Group. Others have expressed an interestin being leaders in their communities and becoming more involved in BoFEP.
Question 4. What are the present and future issues facing the Minas Basin watershed?
Issues of importance to the communities have already been identified in the community forums. Whatare the science questions that people here feel have not been addressed or need to be addressed? Iwould suggest that you line up your scientists to tackle the important questions. You do not have a hopeof taking out the Windsor causeway because you do not have the science pertaining to its environmen-tal impacts. There may be as much biological production resulting from the presence of the causewayas was lost by its construction. You need to generate the necessary science data pertaining to this issue.It is important to ensure you have scientific understanding and to make sure you are fully prepared forthe question, especially when you know that it is coming fairly soon.
The causeway has moved the head of the tide 20 km downstream. In time, productivity will probablybuild up again. We need to have science data that will stand up in a court of law. We need to know thecause of any damage and prove that such damage has in fact occurred. There is no retroactivity in theFisheries Act. There is another causeway being proposed across the Avon River, or perhaps just anexpansion of the existing one. The basic question is whether we want to have the existing one taken outor not.
Question 5. How will the Minas Basin Working Group respond to other community or environmentalgroups with particular issues?
One way is through more community forums. For those groups who participated in the forums therewas an opportunity for dialogue and for initiating actions.
The Minas Basin Working Group has already interacted with some fisheries groups. A group cameforward with a fisheries management issue. The Working Group then raised the issue with the wholeBoFEP group and proposed that another working group, comparable to the Minas Basin Working Group,be set up to deal specifically with fisheries issues. This raised the profile of the issue enough to move itforward. A proposal for resolving the issue is now being considered by DFO. The Integrated FisheriesManagement Working Group is now working with the fishing community to determine how they canwork together to identify a specific project and how they can each contribute to it.
Some members of the Minas Basin Working Group are also on other BoFEP Working Groups. Thussome of the needed communication and integration structures may already be in place.
273
Session Seven: Minas Basin
Question 6. How could the government respond, going from where we are now, to identify projects toaddress specific issues?
By working with Community Action Groups on issues related to the mandates of their departments andperhaps also through other activities such as the Salmon River project and similar initiatives.
Question 7. Are there any other comments or observations?
Scientists need to know about community issues and the impacts of human activities on ecosystems. Itis important not to be 100% science-focussed because you are then isolated from the issues. We need tounderstand what issues are influencing science projects. We need to know which land-based activitiesare having an impact on marine environmental quality and also be aware of activities affecting suchthings as cold water coral “forests”. We need to be relating to almost everything. It is important that weall have an opportunity to speak on any issue. You really need to bring many diverse views and intereststogether to be successful.
Education and awareness were important issues identified in the community forums.
It is important that we recognize where science fits into the big picture. We need to ask why we aredoing this and how does it fit in? Maybe it is time to take the specific issue of the Windsor Causeway toa forum and to figure out what really needs to be studied. The Causeway is going to be constructed after2005, so we have time to focus, obtain scientific information and leverage the necessary funding. Weare attempting to pool resources and co-ordinate them one piece at a time. We need to pull together allthe available information into something more comprehensive.
There is a window with respect to the Windsor Causeway. We need to summarize the research informa-tion on mudflats and look at what we have lost in terms of river and estuarine productivity and what wehave gained in salt marsh productivity. We need to allow for fish passage, perhaps by replacing thecauseway with a bridge.
Is it appropriate to consider a Working Group focussing on the Windsor Causeway? Yes, maybe this issomething that BoFEP could consider. If BoFEP does not, then perhaps the local community mightwant to address this issue. I would suggest that BoFEP set up a Working Group to look at the entireissue, with the purpose of eventually providing sufficient data to make an informed decision.

274
Health of the Bay of Fundy: Assessing Key Issues
275
Health of the Bay of Fundy: Assessing Key Issues
Session Eight
ECOTOURISM:OPPORTUNITIES AND IMPACTS
Chair: Tom Young,Bay of Fundy Product Club, Parrsboro, Nova Scotia

276
Health of the Bay of Fundy: Assessing Key Issues
277
Session Eight: Ecotourism: Opportunities and Impacts
GAINING AN EVEN KEEL IN CANADA’S COASTAL ZONE:TOWARDS SUSTAINABLE TOURISM DEVELOPMENT
Peter W. Williams
Centre for Tourism Policy and Research, Simon Fraser University, Burnaby, [email protected]
Introduction
Commercial fishing has been an important resource-based industry along Canada’s coaststhroughout its history. However, over a series of decades, a combination of short-sighted resourceexploitation practices, unfettered environmental degradation, as well as ill-conceived government policyand management decisions have led to the demise of many long-standing commercial fishing opera-tions along the nation’s shorelines. This has created a growing, and in some cases urgent need, foralternate revenue sources for many fishing towns, villages and hamlets. One needs to look no furtherthan the tourism industry for a set of development options that offer the potential of combining theresources of coastal zones with other localized cultural and heritage assets to create sustainable coastaltourism communities and businesses. This paper discusses some of the key planning principles andchallenges which must be addressed for these communities to make the transition from being resource-dependent communities to becoming more multi-faceted resource and service centres.
Coastal Tourism Development
Government and industry travel statistics are generally not compiled in a manner which docu-ments the nature of coastal zone tourism’s magnitude and management components. Yet it is clear thatcoastal and marine areas are the focal point for a significant portion of tourism development and activ-ity around the globe. As well, the natural attributes of the coastal zone (terrestrial and marine) arefrequently used as the key attractions in the marketing of many tourism destinations. There are manyways in which the coastal and marine environment has been used to differentiate one tourism destina-tion from the next. The coastal zone has been used to position destinations as surface water basedactivity destinations (e.g., surfing - Hawaii; windsurfing - Washington state; sailing - New Zealand,Massachusetts; sea kayaking - Belize); underwater-based activity destinations (e.g., diving - CaymanIslands, Maldives; fishing - Mexico, Trinidad and Tobago); terrestrial-based activity destinations (e.g.,sunbathing - Canary Islands, Seychelles, and Florida; beach sports - Virginia and southern California;camping - Texas’s Gulf coast). From a nature-based perspective destinations have positioned them-selves on the basis of their unique marine wildlife (e.g., Mexico’s Baja California gray whales; Argen-tina’s birdlife); vegetation (e.g., Costa Rica’s coastal tropical rainforests); terrestrial wildlife (e.g.,Northwest Territory’s polar bears); geological formations (e.g., Australia’s Great Barrier Reef; the Re-public of Maldives’ coral reefs and atolls; Fiji’s coastal mountains; Mauritius’ coastal lagoons); andunique ecological characteristics (e.g., Ecuador’s Galapagos Islands).

278
Health of the Bay of Fundy: Assessing Key Issues
In each of these cases, the tourism destinations have been able to successfully use their area’soutstanding coastal attributes to attract new and growing numbers of travellers, create new forms ofeconomic development, and assist in the enhancement of the quality of life for local people. However,in all of these examples, there have been an ongoing set of challenges associated with planning andmanaging the environments of these areas, whist still meeting the needs and expectations of travellers.This paper outlines some of these overriding challenges in the context of coastal tourism in general andthe Bay of Fundy region in particular.
Coastal Tourism Development and Management Issues
Coastal regions provide a range of abiotic and biotic attractions for visitors within ever-chang-ing natural areas. Each destination offers the opportunity to tell its own story to interested travellers.The Bay of Fundy’s geological and ecological characteristics provide a unique but challenging com-petitive advantage for communities interested in using tourism to encourage sustainable economic andsocial-cultural development in the region. In many respects, the region’s tidal, fossil, wildlife and com-munity attributes have the kind of exaggerated distinctiveness which represent non-replicable competi-tive advantages. However, some of these same features also represent distinct disadvantages that maylimit the destinations appeal in the marketplace. In particular, the Bay’s cool water temperatures, attimes aggressive and dangerous tides, frequent foggy periods, and relatively short warm travel seasonrepresent challenges to the development of tourism. On a more positive note, these same destinationattributes also serve as natural inhibitors to potentially heavy traffic flows which might place unduestress on many of the area’s sensitive environments and smaller coastal communities. There are manycases where tourism destination’s faced with the same types of challenges are successfully movingforward with various forms of nature-based coastal tourism. Innovative North American examplesinclude cold water destinations such as British Columbia’s Clayoquot Sound and Queen CharlotteIslands, Washington state’s San Juan Islands Marine Sanctuary region, Oregon’s network of coastaltourism communities, Ontario’s Bruce Peninsula and Fathom Five Provincial Park region, and Que-bec’s Saguenay - St. Lawrence Marine Park destination.
While all of these are exciting examples of what can be done to stimulate nature-based tourismdevelopment in the coastal zone, none of them have attempted to build the type of formalized andsystematic strategic partnerships that have been initiated by this region’s fledgling Bay of Fundy Prod-uct Club initiative.
Organizing the Product Components of Coastal Tourism Destinations
Communities and destinations such as those associated with the Bay of Fundy region mustconsider at least three critical components when developing their coastal tourism product portfolios.The three components are: a set of distinctive core attractions, related peripheral support services, andhigh quality destination and touring packages. In various combinations and depending on the marketfor which they have been created, these components form the foundation for a wide-ranging set ofcoastal touring and destination experiences.
279
Session Eight: Ecotourism: Opportunities and Impacts
Core Attractions
The core attractions for most coastal destinations are intimately linked to the region’s naturaland cultural/heritage attributes. These assets provide the distinctive character and basis for establishinga unique position in the marketplace. By definition, these core attractions should offer enough distinc-tiveness and appeal to be able to draw travellers to them. For instance, various elements of the Bay ofFundy region’s distinctive marine, geological, terrestrial, and wildlife resources should form the coreattractors in the creation of coastal tourism products. These include but are not limited to:
• The tidal phenomena—vertical and horizontal dimensions of tidal change as well as tidalcurrents (tidal rips, whirlpools, and tidal bores).
• The coastal topography—cliffs and coastal formations caused by the tides making it one ofthe most distinctive coastal regions in eastern North America.
• The ecological phenomenon—habitat for the rare Northern Right Whale and seven otherspecies including Fin and Humpback and a critical feeding area for flocks of up to 100,000Semipalmated Sandpipers (90 % of the world’s population).
• The natural history—one of the oldest and most important Triassic-age dinosaur discoveriesin the world as well as Carboniferous-age fossils exposed through erosion.
• The cultural history—first European settlement in Canada (in fact, first on the North Ameri-can continent north of Florida) and site of the expulsion of the Acadians 150 years later. Thelifestyles and activities of the fishers, farmers and foresters who followed them.
Peripheral Support Services and Facilities
Although the core attractions are the essential magnet for tourists, they must be complementedby a set of supporting peripheral features which ensure the level of comfort, convenience and essentialservices needed for sustained enjoyment of the core attraction. In the Bay of Fundy region these serv-ices and facilities are found to varying degrees in many small to medium-sized communities. Theperipheral facilities and services typically include appropriate levels of food and beverage, accommo-dation, transportation, and information services and, in some cases, supplemental tourism activities.Developing and delivering these in forms which are seamlessly and appropriately linked to the carryingcapacities of the core attractions is a key to the long-term sustainability of the region’s resource base.
Market-Matched Destination and Touring Products
Coastal communities must compete with other domestic and international destinations for ma-rine-oriented travellers. To do this requires a strong appreciation of not only the natural and culturalassets of the coastal destination that are potentially available for attracting visitors, but also those assetswhich match best with travellers’ needs and interests. Coastal communities that have such marketintelligence can make more informed decisions about tourism product and market development.
280
Health of the Bay of Fundy: Assessing Key Issues
Information concerning the travel preferences, product requirements and travel planning char-acteristics of coastal tourists is particularly useful in this regard. The following section summarizesinformation from a secondary analysis of long-haul pleasure travel market information concerningtravellers from the United Kingdom, Germany and Canada (Williams and Dossa 1999). The informa-tion presented relates to the survey responses of an extensive sample of international and domestictravellers who indicated that “remote coastal attractions like fishing villages or lighthouses” were ei-ther always or often important places to visit on their long-haul pleasure travel trips. The distinguishingtraits of these coastal travellers included tendencies for them to be:
• married baby-boomers from households with two or more members over 18 years old;• looking for value oriented multi- as opposed to uni-dimensional experiences;• motivated to travel by varying factors (e.g., U.K. travellers are particularly cost and value
conscious; German tourists are seeking places with strong natural and environmental quali-ties; Canadians are motivated to visit places which offer a combination of these traits);
• selecting Canadian destinations for its perceived advantages linked strongly to the environ-mental quality of its natural and wilderness areas, as well as remote coastal areas;
• different with respect to their vacation trip patterns:1. U.K. coast travellers took pleasure/vacation trips of 15–28 nights travelling with their
spouse or significant other. They booked their trip shortly after planning it, and usedtravel agents as their most important sources of information to help make these decisions.They stayed at least one night at the home of friends/relatives and partook in samplinglocal foods, photography and shopping.
2. German coast travellers took pleasure/vacation trips of similar duration (15–28 nights)which also involved travelling with their spouse or significant other. Travel agents werethe most important source of information used to help plan their trips. They planned theirtrips quite far in advance but did not book it until a month prior to their departure. Theytended to stay at least one night at a mid-priced hotel and pursued photography, samplinglocal foods and shopping opportunities.
3. Canadian coastal travellers took pleasure/vacation trips of shorter duration (5 to 7 nights),often planned by their spouse or significant other. Advance planning for their trip wasvery short (a week or less) and they used friends/family members as their most importantsources of information. They stayed at least one night at the home of friends/relatives andparticipated in informal/casual dining with table service, photography and dining in fastfood restaurants/cafeterias most frequently.
Depending on their scope (e.g., geographic range, accessibility), permanency (e.g., seasonalavailability) and drawing power (e.g., uniqueness, abundance, quality, breadth of appeal) core attrac-tions and their supporting peripheral services are normally the central ingredients in the developmentof destination (extended stay) or touring (short stay) products. For destination tourism products thecore attraction must have sufficient appeal to attract visitors to a destination for several days (e.g., 3–15
281
Session Eight: Ecotourism: Opportunities and Impacts
days). In such cases, there must be sufficient things to see and do to keep all members of the travel partyoccupied in enjoyable pursuits. Such destination products require a well-developed combination ofcore and peripheral components which match with the needs and interests of the travel markets. In thecase of the Bay of Fundy region, the variety of products and services suited to retaining visitors atcoastal destinations is currently limited. If communities are seeking to attract and hold visitors to theregion, more must be done to create and promote a more dynamic and integrated range of cultural andnature-based activities. This type of development is dependent on destination communities providingopportunities for tourists to interact with local residents as well as with the natural attributes of suchareas. Ensuring the sustainability of such endeavors requires the active involvement of local communi-ties in planning, managing and monitoring the size, scope and impacts of such initiatives.
Touring products cater to visitors for much shorter periods of time (e.g., a few hours to a fullday). Primarily designed for day use or transient travellers, these products are dependent on not only thepresence of distinctive natural or cultural features but also ready access to well developed or promotedtransportation routes. The Bay of Fundy’s Evangeline Trail and emergent Bay of Fundy Ecotour trailrepresent routes which serve to link and provide thematic understanding of the region and its places forcoastal travellers. Given the limited scale and carrying capacity of most existing communities in theregion, this form of product development matches well with the needs of the region and the interests ofthe market place.
Encouraging Sustainable Tourism Practices
Beautiful and healthy physical and cultural environments provide the foundation for sustain-able tourism development in most coastal destinations. However, such foundations can be easily erodedwith inappropriate tourism activity. It is particularly critical that communities and their residents playleading roles in determining the type and extent of tourism to be promoted in their areas. Managingtourism’s growth should be first based on sound environmental principles. Environmental degradationrelated to excessive water and energy consumption, problems of waste and sewage disposal, shorelineerosion, vegetation disturbance, the loss of marine habitat and wildlife species are well documentedrepercussions associated with developing and operating tourism businesses in coastal zones. As a con-sequence, more and more tourism operators and the communities which are associated with them arefaced with mounting pressures to improve their environmental performance. These pressures comefrom a growing body of environmental regulation which tends to assign liability directly to polluters, aswell as a more informed travelling public that is familiar with the possibilities of environmental riskand less tolerant of environmental degradation.
As a consequence, for coastal tourism to flourish on the Bay of Fundy, there must be a firmcommitment to the principles and practices of sustainability. This commitment should be transparent tonot only industry partners but also to the travelling public. To create this readily apparent position withrespect to issues of sustainability, the region’s tourism operators should undertake at least four strategicinitiatives. These include: developing a universally agreed upon set of operating principles or code ofconduct with respect to environmental and social dimensions of the partner’s activities, translating

282
Health of the Bay of Fundy: Assessing Key Issues
these principles into “greening practices”, and implementing a credible monitoring and accreditationsystem to encourage continuous improvement of partner operations and to increase recognition ofthese activities in the market place.
Stage 1: Implement Codes of Conduct
Codes of conduct can be encouraged for two primary target groups. These are travellers to theBay of Fundy region, and the tourism industry partners linked to the development and delivery ofcoastal tourism opportunities. Codes of conduct aimed at travellers emphasize respect for other cul-tures and encourage sensitive resource use. Many examples of such codes exist. For example the Tour-ism Industry Association of Canada has developed and adopted a comprehensive Code of Ethics forSustainable Tourism for both industry and tourists. As well, the National Audobon Society has been aleader in developing such codes for travellers. Similarly, since the release of the Brundtland Report,Our Common Future in 1987 and the International Chamber of Commerce’s Charter for SustainableDevelopment in 1991, several tourism associations have produced their own codes of conduct. Exam-ples of these include the World Travel and Tourism Council’s Environmental Guidelines and the Pa-cific Area Tourism Association’s Code for Environmentally Responsible Tourism. While developed toaddress the needs of their specific stakeholder groups, each code has incorporated one or more overrid-ing actions required for a more sustainable tourism industry. All of these codes offer excellent exam-ples of what might form the foundation of an appropriate set of principles for guiding the tourismbehaviour of product club members and their customers. A particularly relevant prototype that might besuited to this project is produced by New Brunswick, Nova Scotia and East Coast Ecosystems. Devel-oped for the region’s whale watching community, this model is comprised of two critical components.The first component is a Whale Watching Code of Conduct signed by the Bay of Fundy whale watchingoperators “for the protection and safety of the whales and other marine wildlife, and the safety andunderstanding of passengers”. The second component is a Citizen’s Guide to Whale Watching whichhas been produced to inform the public about what they should know about whale watching so they candetermine whether or not their tour operator is acting responsibly. This prototype may have directapplicability to other Bay of Fundy coastal tourism operators who might jointly incorporate such prin-ciples into their practices.
Stage 2: Implement Sustainable Tourism Practices
Coastal tourism stakeholders are typically comprised of a range of industry and community-based organizations and individuals. Many of those partners are related to the accommodation, foodand beverage, transportation and tour operator sectors of the tourism industry, and others are linked tomore diverse community environmental and cultural groups. Given the nature and marine-orientedcharacter of most tourism which occurs in the coastal zone, all of them will be encouraged to adopt“greening” initiatives. On a global basis, the industry’s accommodation, restaurant, and transportationsectors have received the most attention for their greening programs. Hotel and other forms of lodgingsustainability programs have concentrated on waste reduction, energy conservation, and water conser-vation, the use of organic foods, non-toxic cleaning products, and chemical-free pest management

283
Session Eight: Ecotourism: Opportunities and Impacts
techniques. In the transportation sector, airline programs for noise reduction, fuel efficiency, and emis-sions reduction have been the most widely developed. Greening activities practiced in the restaurantsector have focused mainly on solid waste and energy reduction, as well as broader community conser-vation activities. For the most part, these sustainability practices have concentrated on activities thatreduce the environmental effects of operations by means of improved methods of waste reduction,energy conservation, and emissions control. As well, a few tourism organizations are now going be-yond their immediate environment by encouraging more sustainable practices amongst their suppliersand other related organizations. In the case of the Bay of Fundy region, significant opportunity exists touse community organizations to lead in the implementation of sound environmental programs. Withoutsuch community commitment, it is unlikely that other private sector-based initiatives achieve theirintended impacts.
From a coastal tourism development perspective, emphasis should be placed on creating notonly “low impact or traceless” visitor activities, but also strong community-based initiatives whichreduce the impact of traditional industrial and residential development on the coastal zone. WhileCanada’s coastal zone has traditionally been the waste disposal system of preference for communityand industrial wastes, many destinations are now recognizing the potentially tremendous and longerterm economic and social value associated with keeping waterfronts, shorelines, and marine habitatsclean. Numerous market surveys clearly indicate that the destinations of choice for most pleasure trav-ellers are characterized by safe and clean air, water and soil. Their stays in such areas produce signifi-cant benefits for the communities and industries which host them.
Stage 3. Implement an Assessment and Product Enhancement Program
The third component in a comprehensive program designed to encourage sustainable tourismpractice typically involves creating a monitoring and performance enhancement system. In this thirdstage, companies and communities participating in coastal tourism development should assess the ef-fectiveness of their operational practices. Environmental auditing has been the overriding term used todescribe many of these tracking processes. In the context of coastal tourism it entails reviewing on-going operations to determine how well the companies are safeguarding the environment through theiron-site practices. Typically such auditing is accomplished through a combination of self-administeredand third party operated testing and verification procedures. From a self-auditing perspective, manyself-assessment models exist. In this regard, the Tourism Industry Association of Nova Scotia has de-veloped A Question of Balance: Sustainable Tourism Self-Audit Workbook which provides a good basisof guiding the development of such practices by tourism operators. However, an important componentof any due diligence initiative by coastal tourism organizations should be a periodic professional thirdparty assessment. In the context of the Bay of Fundy region, there are several reputable third-partymonitoring organizations available for such auditing. While each of these monitoring organizationsoffers its own range of assessment services, some of them offer another advantage in the form of aneco-label or “stamp of approval”. Such accreditation can be used to competitively position coastaltourism destinations and their operators favorably in the minds of travellers. The practice of eco-labelingtourism products has progressed significantly over the past few years, and some organizations have

284
Health of the Bay of Fundy: Assessing Key Issues
been particularly successful in this regard. The following monitoring and eco-labelling models areparticularly useful options to examine in the context of the Bay of Fundy region: World Travel andTourism Council’s Green Globe 21 Program (URL: <http://www.greenglobe21.com/>; Pacific AsiaTravel Association’s Code for Sustainable Tourism (URL: <www.pata.org>); TerraChoice Environ-mental Services’ Audubon Green Leaf™ Eco-Rating Program (URL: <http://www.terrachoice.ca/hotelwebsite/indexcanada.htm> and HVS Eco Service’s ECOTEL (URL: <www.hvsecoservices.com/ecotel.htm>). As an alternative to these more commercial eco-labeling processes, the Bay of Fundyregion might want to develop a more “made at home” tourism destination and product accreditationprocess along the lines of that developed by the Saskatchewan Sustainable Tourism Council with theassistance of the Saskatchewan Watchable Wildlife Association. While experiencing some growingpains, this model is positioned as a consensus based approach to meeting the need for transparent andcredible assessment of tourism destination environmental practices.
Conclusions
The opportunities associated with tourism development are especially appealing but also quitechallenging for coastal communities. Faced with unanticipated and unplanned tourism development,communities and their surrounding environments can be harmed in insidious ways. However, whenprovided with opportunities to plan and manage tourism development in a sustainable fashion, tourismcan create the option of an economic engine, which delivers ongoing social and environmental ben-efits. In coastal areas such options are becoming more appealing, as the realities of changing marketdemands and more exploitive forms of resource development become apparent. Together, communitiesand their industry partners must work towards keeping an even keel in managing the growth of coastaltourism in their regions.
Reference
Williams, P. W. and K. B. Dossa. 1999. Potential Coastal Tourism Travel Markets: United Kingdom,Germany and Canada. Centre for Tourism Policy and Research, Simon Fraser University,Burnaby, BC.
285
Session Eight: Ecotourism: Opportunities and Impacts
COMMUNITY-BASED TOURISM CASE STUDIES
Thomas Young
Bay of Fundy Product Club, Parrsboro, NS. [email protected]
The development of tourism projects and infrastructure has been an important community de-velopment strategy for many coastal communities in the Bay of Fundy region during the past decade.Tourism development has been seen as a way to offset the decline in traditional resource industries andto diversify rural economies.
This study reviews three examples of community-based tourism development projects, exam-ines the reason for each project, and their effectiveness in contributing to economic and other commu-nity goals.
In 1993 a plan for economic development in West Cumberland was prepared for the WestCumberland Development Association (WCDA). The plan highlighted a number of important trendsthat affect the future of coastal communities in West Cumberland.
Census data showed that the population of West Cumberland declined by 15% between 1980and 1990. The population of Parrsboro, the only incorporated village in the district, declined by justunder 10% during the same period, the most recent episode of a long-term decline stretching to the turnof the century. The population of Parrsboro was roughly 50% greater in 1910 that in 1990. Employmentstatistics show that during the 1980s, there was a corresponding decline in employment (althoughemployment among the female portion of the workforce actually increased).
These trends have led to a number of issues that affect the economic viability of small commu-nities. With the decline in employment there has been a decline in community services, includingcritical health and education services. Retail and other local services face similar pressures.
In the 1993 report, a survey of community groups and businesses was conducted to determinewhat actions could be taken to mitigate these pressures on coastal communities. Included in the surveywere local sawmill owners, a bank manager, retail associations, and non-profit development and herit-age groups. In total, 25 interviews were conducted. Each respondent was asked to identify new projectsthat would contribute to economic and community viability. Of the projects identified, 75% were tour-ism related (Young 1993). This is consistent with the results of other community surveys which haveshown that tourism is frequently a priority for development. For example, in an unrelated door-to-doorsurvey of 350 residents (cottage and permanent) between Tidnish and Pugwash, 63% said they wouldlike to see an increase in tourism traffic in their area (Young 1993).

286
Health of the Bay of Fundy: Assessing Key Issues
Why Tourism?
This preference for tourism as a community development strategy may be explained by severalfactors. Tourism generates investment and provides employment (although in rural areas it is oftenseasonal). Clearly tourism is a step in diversifying economies of coastal communities, in addition toexisting primary industries such as fishing, However, tourism development is also a way to maintaincommunity infrastructure, both public (museums, parks, transportation) and private (food and bever-age, entertainment, etc.).
In the Minas Basin region of Nova Scotia, much of the development has been initiated by localgroups or community interests. Indeed, these community interests have often taken a lead role in thedevelopment and operation of these projects. The following are three examples:
1. The Age of Sail Heritage Centre, Port Greville
The Age of Sail Heritage Centre is an example of a small facility, owned and operated exclu-sively by a local group. Its focus is on local heritage. It incorporates heritage architecture, and its smallscale results in a limited environmental footprint.
In 1992, the Port Greville Museum Society proposed a local museum to preserve the shipbuild-ing heritage of the North Minas region and to stimulate economic development in the area. Over 400wooden ships were launched in various shipyards of the Upper Minas Basin. Port Greville was the lastof the wooden shipbuilding yards of the Bay of Fundy, closing in the 1970s.
With assistance through a local industrial adjustment committee of Human Resources Develop-ment Canada (HRDC), the group prepared background historical research, undertook fund raising, andpresented a concept plan and proposal to several federal and provincial agencies. While there weresignificant funds provided through the museum assistance program and related federal and provincialsources as well as local fund raising, a bank loan secured through personal assets of community mem-bers was needed to achieve the capital requirements.
The project, when completed, incorporated a 150-year old heritage building on a site donatedby Scott Paper Ltd. The building was saved from demolition and dismantled before being transportedto its present location. Shipbuilding artifacts were incorporated into a high quality interpretive display.When it opened, the project won an award for architectural design.
The Port Greville project is an example of a small-scale, high quality community heritage facil-ity that has received positive acclaim. It has assumed an important role in housing artifacts and com-memorating local heritage. It has generated a reasonable level of traffic (2,000–3,000 visitors annually)and helped stimulate new private sector tourism development. However the facility does not generatesufficient revenues to employ more than 2–3 seasonal staff and requires significant input from the localgroup. Importantly, it is part of a network of high quality tourism attractions which collectively com-prise an attractive destination for visitors.

287
Session Eight: Ecotourism: Opportunities and Impacts
2. The Devils Bend Trail
The Devils Bend Trail Project was proposed and administered by the Kenomee Trail Society. In1998, this group from the Economy and Great Village communities proposed the development of a trailthough Crown land to Economy Falls in Colchester County. In 1999, the group applied to HumanResource Development Canada for a Youth Services Program grant to plan and construct the trail.
The Project involved the development of a seven kilometre hiking trail on a combination ofprivate and publicly owned land. Sixteen young people were employed for six months to work on thetrail. The Project incorporated a two-week training period that covered basic ecological principles andenvironmental management, as well as trail planning and development techniques.
The Project also included the establishment of a water quality monitoring program managedand administered by the local school. The Trail Society acquired funds through the Shell Foundation tofinance the school environmental monitoring project for two years. Together with the trail developmentproject, this field program was instrumental in developing the knowledge and capacity of the youngpeople in the community to understand the dynamics of the local ecosystem.
The Kenomee Trail Project led to several forest management actions that effectively protectedthe watershed of the lower Economy River. First, in support of the trail project, the Department ofNatural Resources agreed to conduct a pilot integrated management plan on the Crown land along theEconomy River. This resulted in guidelines that would help maintain the integrity of the forest ecosys-tem in the river valley. Secondly, the province acquired a 200 hectare parcel of land encompassingEconomy Falls from the forestry conglomerate Kimberley Clarke through a land trade. This put thefalls, one of the most significant natural features of the area, in public hands.
The Devils Bend Trail has been highly successful in attracting visitors. At least one tour com-pany conducts several trips on the trail annually, staying at local accommodations and using localrestaurants. Participation of local landowners provides a level of community support that may not existwhere all land is publicly owned.
The weakness of the Project is in operational funding. There is no established fee system and allmaintenance activities are done by volunteers.
3. Cape Chignecto – Advocate Harbour
The project to develop Cape Chignecto Provincial Park is an example of a government/commu-nity partnership. The scale of this project is significantly greater that the preceding case and, as a result,there has been a much greater investment of public resources. In addition, there was an extensiveprocess of planning and consultation.

288
Health of the Bay of Fundy: Assessing Key Issues
In 1989 the Province of Nova Scotia acquired 6,000 hectares of land and coastal property atCape Chignecto from Scott Worldwide through a land exchange. Several local residents supported,indeed strongly promoted, this acquisition for the creation of a new provincial park. The area encom-passed forested coastal valleys with stands of old growth red spruce that were considered to havesignificant heritage value.
A 1991 study examined the potential economic impacts of a park development at Cape Chignecto.The study forecast that park operations would provide from 11 person years (low-case scenario) to 55person years (high-case scenario) of employment annually (Gardiner Pinfold 1992). This report wasused to encourage the province to designate the area as a provincial park.
In 1992, the minister of Natural Resources delegated an advisory committee to provide inputinto the project as required in the 1988 Nova Scotia Parks Policy Paper. The committee was chargedwith preparation of a management plan for the new provincial park at Cape Chignecto. The advisorycommittee consisted of 15 residents of Advocate and surrounding communities. The management plan-ning process included the identification of standards of use for the park, zoning, trail developmentoptions, proposed camping, etc.
During the planning process, the province informed the committee that it would not fund parkdevelopment or operation. They were willing however to consider a management agreement to allowthe regional development association to construct and operate park facilities including a 35 km coastalhiking trail. In 1994, the province entered into a management agreement with the Cumberland Re-gional Economic Development Association (CREDA) on behalf of the advisory committee. The advi-sory committee continued to provide the primary source of local input into the development process.
This structure was intended to provide a community planning and management framework,where a local organization acting on behalf of the community would obtain and manage resources inorder to bring the park into operation. The park was to generate new income to the community.
In 1995, CREDA obtained a commitment of funds through HRDC for a training and develop-ment program in park construction, management and operation and construction of the hiking trail overa two-year period. During this period (from 1995–1997), a 35 km coastal hiking trail was constructedby 15 workers under CREDA’s administration. On-site training was conducted during the winter sea-son. Dr. Marguerite Cassin (Dalhousie University) was employed under contract for training alongwith several other sessional trainers. Communications with the local community included newslettersdistributed monthly to all households in the community and open house events approximately eachquarter.
During this period, the Nova Scotia Department of Natural Resources (DNR) further developedthe management plan. Park planners developed operational standards, site plans for camping, entryarea design and function, and other general planning aspects. These plans were presented to the advi-sory committee at each stage, and incorporated in open house events and special presentations in Advo-cate.
289
Session Eight: Ecotourism: Opportunities and Impacts
In 1998 the park began operation. However, within a year, complaints and criticism began to beheard about restrictions on access to areas of traditional community use. This led to the formation of anadvocacy group that challenged the park advisory committee and several of the principles of park useincluded in the management plan. There was no resolution to these conflict over a period of two to threeyears.
There are several factors that may have caused this conflict situation once the park was inoperation. The community development process is based on local ownership, and control of the projectmust be responsive to local input and involve compromise. Park planners on the other hand determinedthat it was in the public’s interest to establish non-negotiable regulations that support conservationobjectives. The public (served by DNR) represents a large population outside the local community,including the urban population of the province. The project has both dimensions of a community devel-opment project and those of a provincial park project. This dual role fails to meet some fundamentalcriteria of community economic development and ultimately led to unresolved conflicts.
The Economic Argument
A 2000 study determined that the number of room nights sold in the North Minas region fromGlenholm to Advocate had increased by 50 percent over five years. Accommodations in this area areprimarily a combination of seaside cabin facilities and bed and breakfast establishments. This growthin room sales accounted for an increase of roughly half a million dollars in annual room sales. Sinceaccommodations generally account for less than 20% of travel expenditures (Nova Scotia StatisticalReview 1998), the total increase in revenues (net of any multiplier) is in the range of two and a halfmillion dollars each year.
Heritage and Environment Values
In each of the case studies cited above, there has been a significant component of heritageconservation. This includes cultural heritage (history of Port Greville’s local shipbuilding industry) andnatural heritage (the forested coastal valleys of Cape Chignecto). A heritage conservation ethic is a keycriteria in community-initiated tourism projects.
Indeed, in the case of Cape Chignecto, the economic argument alone could not support the costof the project. In fact it is a mix of economic and conservation objectives which supported the decisionby the Crown to acquire the land and provide resources to develop the recreational infrastructure andfor other agencies to invest. The Economy Falls project further integrated the natural and ecologicalvalues of the watershed into the school curriculum.
The Community
Port Greville is owned and operated by the local group and seems to be well accepted andappreciated locally. The Economy Falls project appears to have community acceptance largely because
290
Health of the Bay of Fundy: Assessing Key Issues
of the significant involvement of young people in the project. Cape Chignecto on the other hand hasresulted in some significant criticism within the community due to the conflict between communitydevelopment and park management approaches. Some negotiated settlement may alleviate this con-flict.
Conclusion
Community development can have strong local benefits and support. The contribution to eco-nomic sustainability appears to be significant in the North Minas Region. There is a strong componentof heritage conservation in most of these projects. The presence of a local champion strongly influencesthe level of community acceptance and support. Likewise, the degree of local investment also influ-ences the extent to which the community will support the project. Conversely, a high degree of publicinvestment means that management decisions will fall more in the hands of departmental staff. Thiscan put project managers in conflict with local stakeholders.
References
Gardiner Pinfold Consulting Economists. 1992. Northport Marina: Feasibility Study. Unpublished re-port prepared for the Northport Marina Association and the Amherst Industrial Commission.
Nova Scotia Statistical Review 1998. Halifax, NS: Voluntary Economic Planning Division, Departmentof Finance and Economics.
Young, T. 1993. Turning the Tide, A Plan for Economic Development in West Cumberland. Unpub-lished report prepared for the West Cumberland Development Association.
291
Session Eight: Ecotourism: Opportunities and Impacts
FUNDY NATIONAL PARK HUMAN USE IMPACT PILOT PROJECT
Sean Murphy
Fundy National Park, Alma, NB. [email protected]
This was the first project to attempt to integrate social and ecological sciences in order to studythe impacts of visitor use on national parks. Multidisciplinary research and analysis was conductedover the peak summer season of 2001 at Fundy National Park, New Brunswick. The study was com-prised of five components. Trail surveys were administered to gather visitor attitudes towards trailcrowding and to develop a standard for the number of hiker groups that become unacceptable on spe-cific trails. Trail assessments were also included to gather physical data regarding specific trails. Theassessments were conducted at 20 m intervals and information such as vegetation trampling, socialtrails, slope, surrounding vegetation, tree damage, etc. was gathered. Campground surveys were ad-ministered to gather camper opinions on their campsite and to develop some social indicators. Camp-site assessments were also performed on roughly 50% of the campsites at two campgrounds (similarinformation as collected the on trail assessments). The fifth component was comprised of detailedscientific analysis of ten campsites regarding such items as plant cover percentage by species, mineralsoil exposure, soil compaction, area of vegetation loss due to camping, etc. All of the informationcollected had a geomatics focus and it is expected that results from the social science section will bemerged with data from the Park’s ecological section to look at the overall impact of visitors on the Parkenvironments in these locations.
292
Health of the Bay of Fundy: Assessing Key Issues
FROM CONSERVATION TO CONVERSATION—WHY BIOSPHERE RESERVES MATTER
Munju Monique Ravindra
Fundy National Park, Alma, NB. [email protected]
Abstract
Biosphere reserves are established as places where people are living in harmony, or trying tounderstand how to live in harmony, with the natural environment. Participation in the development ofa regional biosphere reserve is not a panacea for the problems of parks and protected areas, however,such participation offers an opportunity for protected areas to work co-operatively with the broadercommunity to resolve conservation and land-use concerns. A biosphere reserve can be a mechanism forthe protected area to be involved in a ‘big picture’ approach to planning and management. It can fostera multidisciplinary approach to improving the knowledge and understanding of the region through theengagement of institutional and academic partners, but also through the engagement of the local popu-lation in setting the research agenda and conducting research. A biosphere reserve is a framework forco-operation, requiring the protected area to go outside of its traditional bailiwick and to collaboratewith groups and organizations who have different perspectives on ‘what is best’; and it is a place wherethe experiments in sustainable design and innovation necessary for living in harmony with the naturalenvironment occur.
A Going Concern
After an extended period in relative obscurity, biosphere reserves appear to be newly ‘hip’ inCanada. In May 2002 there were eleven places in Canada recognized by the United Nations Education,Scientific, and Cultural Organization (UNESCO) as ‘biosphere reserves’, and almost half of these havebeen designated since January 2000 (Canadian Biosphere Reserves Association 2002). Five of thedesignated biosphere reserves, and all four of the most active proposals, include national parks as ‘coreareas’. Assuming the current proposals remain active, almost a quarter of Canada’s national parks willbe part of biosphere reserves within the next few years. One of these is Fundy National Park—proposedas a ‘core area’ within the Upper Bay of Fundy Biosphere Initiative (Resource Management Associates2000).
This paper summarizes how the development of a regional biosphere reserve might be relevantto national parks and other protected areas. It also identifies several ways in which the process ofdeveloping a biosphere reserve in the upper Bay of Fundy region can support ecological integrity acrossthe land and seascape.

293
Session Eight: Ecotourism: Opportunities and Impacts
A Fundamental Notion
The ‘biosphere reserve’ concept is based on the fundamental notion that people and their com-munities are an integral part of a broad natural system. Learning to recognize and to live within thelimits imposed by ecological systems is perhaps the greatest challenge of the 21st century. Biospherereserves are recognized by UNESCO as places where people are figuring out and demonstrating howthey can meet their own needs while at the same time maintaining the health of the ecosystems thatsupport them (UNESCO 1996). Otherwise put, biosphere reserves are places where people are gettinginternational recognition for learning to live on the earth without spoiling it.
How It Works
The process of seeking and receiving such international recognition is often a long one—requir-ing the construction of healthy and functioning partnerships between communities, organizations, in-stitutions, and governments. Together, these groups work on three complementary biosphere reservefunctions:
- the conservation of landscapes, ecosystem, species and genetic diversity;- local development that is culturally, socially and ecologically sustainable;- and the building of local capacity for research, monitoring, education, training, and informa-
tion exchange related to conservation and development (UNESCO 1996).
In the biosphere reserve model, it is the dynamic relationship (and the ongoing study and communica-tion of that relationship) between benchmark protected areas, sustainably managed unprotected areas,and the life of the broader community that enables a region to fulfill these functions.
Why Does This Matter to Protected Areas?
Signs of Failure
National parks and other protected areas can be seen as an admission of failure (McNeely 1996).Their very existence reinforces the fact that, unlike most other species on the planet, human beingshave failed to live in harmony with the world around us. We have therefore had to ‘set aside’ repre-sentative pieces of nature where natural processes can carry on, ostensibly without our interference(Livingston 1981). A history of expropriation, ‘command and control’ management approaches, and,more recently, an emphasis on consultation rather than collaboration, has created a widespread sense ofmistrust in many communities adjacent to parks and protected areas, culturally isolating these areasfrom the communities that could support them.
294
Health of the Bay of Fundy: Assessing Key Issues
Isolated Islands
From a conservation biology perspective, the problems with this approach are well known. Insetting aside bits of nature, we have created isolated ‘islands’—often too small to effectively conservethe species and processes they claim to represent (Soulé and Wilcox 1980). The lack of integration withthe ‘outside world’ means that protected areas often end up with hard boundaries, for example, clearcuts or agricultural areas to the border of a national park. These edges limit the ability of a park orprotected area to adapt to turbulent conditions, or to massive change, such as the changes in climatecurrently taking place (IPCC 1995). Bill Freedman (2001) points out that this ecological differencebetween many protected places and their surrounding landscapes results in their being “embeddedwithin a hostile landscape”. The challenge facing parks and protected areas today is to reduce that‘hostility’—both in ecological and in socio-cultural realms.
Blinkered
Because the land-use and other decisions that affect biological diversity and ecosystem healthare decisions people make, the conservation of that diversity and health is necessarily a social process.Protected areas have, however, tended to focus on scientific tools (such as biological research andmonitoring) for conservation with little twin emphasis on social tools (such as communication, co-ordination, or partnership). There is, therefore, often a gap between what protected area managers andscientists understand about the health of the ecosystem and what resource users and visitors are doingthat directly or indirectly affects that health.
Opiates
While the constraints faced by parks and protected areas in carrying out their proclaimed task ofconservation are well known in conservation circles, the general public tends to be far less aware. Inpart, this is because protected areas work as opiates—lulling the public into believing that conservationof biodiversity and ecosystem health is ‘under control’. Communication and interpretation programsplay into this myth by presenting fascinating nature facts and astonishing close-up photographs of wildor rare species. Such programs tend to focus on the value of the protected area or protected area systemto the conservation of biological diversity rather than articulating the state of the ecosystem and therisks to ecological integrity or ecosystem health these areas, and their surrounding regions, actuallyface.
How Can the Development of a Biosphere Reserve Help?
The development of a regional biosphere reserve cannot solve all of the problems faced byparks and protected areas. Nevertheless, by participating in the development of a biosphere reserve,protected areas are able to engage constructively with each other and with the broader community inthe protection and maintenance of ecological integrity. Some benefits of participation in a biospherereserve can bring to protected areas are outlined in the following paragraphs.
295
Session Eight: Ecotourism: Opportunities and Impacts
1. A ‘big picture’ approach to protection and management. The Upper Bay of Fundy Bio-sphere Initiative (UBoFBI) is seeking UNESCO recognition for the two upper basins of the Bay ofFundy—Minas Basin and Chignecto Bay. From a conservation perspective, this means taking a large-scale view of the area and developing the partnerships necessary to effectively protect, maintain, orrestore ecosystem health. The ‘big picture’ approach necessary for development of a biosphere reservecan foster the development of a regional protected areas network, and this has been one of the initialpriorities identified in the UBoFBI draft plan (2002). Such a network provides opportunities for col-laboration on diverse protected areas activities, including scientific research and monitoring, commu-nication programing, and staff training.
Under the auspices of the proposed biosphere reserve, managers, planners and ecologists work-ing with regional protected areas have formed a ‘conservation working group’—the first step in thedevelopment of a protected areas network. The aim of this group is to develop a protected areas strategyfor the UBoFBI area. An early project will be the identification and mapping of corridors needed forwildlife and species movement between protected areas. Identification of these areas helps to establishthe groundwork for a broad collaboration with industry and landowners on stewardship and conserva-tion approaches in ‘working landscapes’. Collaboration with the forest industry to determine a cuttingcycle that accommodates the needs of wildlife is an example of the kind of initiative that could be takenin this ‘big picture’ approach to conservation.
Participating in these kinds of collaborative approaches with other protected areas, industry andprivate landowners encourages protected areas to share the responsibility for conservation and for use(e.g., tourism) with the greater community, promoting a collective responsibility for conservation, usemanagement and protection.
2. Multidisciplinary approach to improving knowledge and understanding of region. Oneof the functions of a protected area is to serve as a benchmark for scientific research and monitoring(Batisse 1997). While there have been some limits to the successful carrying-out of this role (inconsist-ent quality of research, lack of co-ordination in ecological monitoring, and ineffective communicationof results to managers and the public are some of the complaints), it is an essential role protected areasplay within biosphere reserves. The development of a regional biosphere reserve can help to strengthenthis benchmark role by connecting local research and monitoring to national and international net-works for information management and exchange (such as the Ecological Monitoring and AssessmentNetwork (EMAN), or Biodiversity Resources for Integrated Monitoring (BRIM)) (Francis 1993).
The development of a biosphere reserve also necessitates the development or strengthening ofpartnerships with research institutions, universities, communities, and international researchers. Thesepartnerships in turn can contribute to an improvement in the quality and thoroughness of research andcan help to attract research funds to the area.
Although thousands of land use and management decisions are made every day by people whoown, work and manage the land surrounding protected areas, these same people are rarely engaged in

296
Health of the Bay of Fundy: Assessing Key Issues
the setting of protected area research agendas or in doing the research and monitoring that takes place.By explicitly exploring opportunities for the local community to get involved in setting the agenda andconducting research, development of a biosphere reserve can act as a kind of framework for a moreregional approach to the creation and sharing of knowledge. In the UBoFBI case, engagement of thelocal community in the monitoring of ecological and social integrity indicators (and eventually marineenvironmental quality indicators) is an identified priority (UBoFBI 2002), and the prospective bio-sphere reserve plans to participate in the nascent Canadian Community Monitoring Network (itself ajoint project of the Canadian Nature Federation and EMAN). Local involvement in research and moni-toring in the greater ecosystem provides baseline reference data for comparative analyses, as well asinformation on change over time. Furthermore, it can generate knowledge that local residents andresource users identify and need and that can be used by the community in order to more effectively‘live on the earth without spoiling it’.
3. Framework for co-operation. All biosphere reserves in the world require community par-ticipation. In Canada, they require community leadership (Birtch 2001, pers comm). Biosphere re-serves cannot be established by protected area managers or by government agencies. Rather, localrepresentatives of government agencies and protected areas sit together with local residents, non-gov-ernmental organizations and other citizens, in some sort of local committee, to develop a co-operativeplan for their prospective biosphere reserve (Ramsay and Sian 2000; Ravindra 2001).
The committee of the Upper Bay of Fundy Biosphere Initiative includes members from govern-ment agencies, community development organizations, universities, heritage sites, non-governmentalorganizations, and industry. Merely by bringing together these diverse groups in order to look at the bigquestions of local and regional sustainability, constructive collaboration is achieved. In the early stagesof the UBoFBI, for example, representatives of conservation organizations and the tourism industry—two sectors that had previously had little contact with one another—sat down together to try to findconstructive solutions to the problem of visitation impacts on habitat conservation. It was a step in theright direction. A biosphere reserve cannot solve every problem relating to the intersection of conserva-tion and sustainable development, however, it can provide the co-operative framework and connec-tions through which issues such as this one are resolved.
Because of its emphasis on equal, transparent co-operation, a biosphere reserve can function asa forum for taking protected area managers out of an environment where they know ‘what is best’, to aroundtable environment where there are multiple other perspectives (such as tourism, fisheries, or localdevelopment) on ‘what is best’. This kind of direct engagement requires a degree of transparency andaccountability from protected areas managers, so that, for example, research conducted in protectedareas is properly communicated to the community and resource users in order that they can engage inan informed discussion about how to live and make a living without compromising the ability of futuregenerations to do the same.
Decisions made at the local, municipal, and county level have a significant influence on theecological integrity of the region and of individual protected areas (Parks Canada Agency 2000). As

297
Session Eight: Ecotourism: Opportunities and Impacts
participants in a regional biosphere reserve, protected areas have the opportunity to contribute (as amember of the community) to regional planning processes, collaborating with citizens and groups onthe planning of tourism, lodging, educational activities and so on from a conservation and sustainablecommunity development perspective. Once again, the biosphere reserve functions as a forum for com-munication and co-operation between the protected area and the greater community. This collaborationcan allow a kind of blurring of the boundaries between park and ‘non-park’, encouraging collectiveresponsibility not only for conservation, but also for other park activities such as lodging or interpreta-tion. In this way, the ecological integrity values of a protected area can be communicated beyond itsboundaries and the cultural, spiritual or economic values of the local community can be shared withprotected area visitors.
4. Design innovation for sustainable communities. Protected areas are fundamentally con-servative—mandated to protect representative parts of ecosystems and biological diversity unimpairedfor the future (Canada National Parks Act 2000). The state of the world today is such, however, that inorder to get to the future, human beings need to make some fundamental changes in the way we aredoing things today. Because biosphere reserves are focused on the long-term survival of human com-munities and the natural systems that sustain those communities, they are fora to work out how to makethe changes required to maintain and restore ecosystem health while at the same time meeting the needsof local communities. Some of these changes may involve rethinking and redesigning the way we liveand work in order to minimize our impacts on ecosystem health. Innovations in the design of energy,transportation, agriculture or housing systems are the kinds of things that would be experimented within a biosphere reserve, finding solutions or developing ideas that are then shared with the wider com-munity. Such creative, change-oriented thinking is outside of the purview of protected areas, however,for the reasons summarized above, it is essential to their long-term survival.
The collaborative, multidisciplinary approach necessary to the development of a functionalbiosphere reserve seems the appropriate way to find landscape level design solutions to problems ofconservation and development. For example, during the construction of a new highway in an arearecognized as a biosphere reserve, conservationists could work with engineers to protect sensitivewetlands or to create artificial dens or hibernacula for certain species. Parks and protected areas havetended to avoid or have little power in these kinds of ‘political’ decisions that are outside of theirborders, but which nevertheless affect their ecological integrity. Co-operation with planners, industryand government agencies through the biosphere reserve mechanism affords protected areas a way toparticipate constructively in finding a solution.
So, Why do Biosphere Reserves Matter?
In order to survive over the long-term, protected areas need to be embedded in healthy, sustain-able, ‘non-hostile’ landscapes. They need, as much as possible, to decrease the ecological differencebetween protected areas and their surrounding landscapes and to decrease the social and cultural dis-tance between conservation-thinking and community survival-thinking.

298
Health of the Bay of Fundy: Assessing Key Issues
Biosphere reserves matter because they are a step in this direction. They are a framework throughwhich citizens can try to resolve one of our most basic challenges—how can we maintain naturalecosystems while at the same time meeting the material needs and wishes of human beings? Theyprovide a forum for the resolution and integration of conflicting interests and pressures through co-operation. They are areas where we can experiment with approaches of how to live sustainably in ourlandscapes (through design innovations or transportation alternatives, for example). And they are placeswhere applied research can be done that is locally relevant to the very same land uses and managementapproaches which are sometimes perceived as ‘threats’ to protected areas. Finally, they matter becausethey are a venue and motivation for learning, researching, and information exchange—a kind of re-gional and global conversation about how to live on the earth without spoiling it. Protected areas, ofnecessity perhaps, have a more narrow focus. They are in the protection business and are thereforeconservative, unable to make decisions about regional sustainability and human livelihoods. By par-ticipating as an equal member of a broader community in the development a biosphere reserve, pro-tected areas can work towards conservation through conversation.
References
Batisse, M. 1997. Biosphere reserves: A challenge for biodiversity conservation and regional develop-ment. Environment 39(5): 7–15, 31–33.
Birtch, J. Executive Secretary of Canadian Biosphere Reserves Association. 2001. Personal communi-cation.
Canadian Biosphere Reserves Association (CBRA). 2002. CBRA URL: <www.cbra-acrb.ca>. AccessedMay 1, 2002
Canada National Parks Act. 2000, c. 32. An Act respecting the national parks of Canada.
Evernden, N. 1992. The Natural Alien: Humankind and Environment. Second Edition, University ofToronto Press, Toronto.
Francis, G. 1993. Towards a Great Lakes biosphere reserve: Linking the local to the global. In: Manag-ing the Great Lakes Shoreline: Experiences and Opportunities. P. L. Lawrence and J. G. Nelson(Eds). Occasional Paper 21. Heritage Resources Centre, University of Waterloo, Waterloo, On-tario.
Freedman, B. 2001. Presentation at National Forum on Protected Heritage Areas Planning and Man-agement, Halifax, Nova Scotia, 29-31 October 2001.
Intergovernmental Panel on Climate Change (IPCC). 1995. Climate Change 1995: The Science ofClimate Change. Cambridge University Press, Cambridge.
Livingston, J. 1981. The Fallacy of Wildlife Conservation. McClelland and Stewart, Toronto.
McNeely, J. 1996. Presentation at World Conservation Congress, Montreal.
299
Session Eight: Ecotourism: Opportunities and Impacts
Parks Canada Agency. 2000. Unimpaired for Future Generations? Conserving Ecological IntegrityWithin Canada’s National Parks. Report of the Panel on Ecological Integrity of Canada’s Na-tional Parks. Panel on the Ecological Integrity of Canada’s National Parks, Ottawa.
Ramsay, D. and S. Sian. 2000. Canada’s biosphere reserves: Examination of different models for or-ganization, implementation and community action. Paper presented at Fourth International Con-ference on Science and the Management of Protected Areas, May 14-19, University of Water-loo, Ontario.
Ravindra, M. 2001. So, you want to be a biosphere reserve? Information sheet available from CanadianBiosphere Reserves Association.
Resource Management Associates. 2000. Exploring the Bay of Fundy’s Potential as a Biosphere Re-serve. Discussion Paper, Resource Management Associates, Parrsboro, Nova Scotia.
Soulé, M. E. and B. A. Wilcox (Eds). 1980. Conservation Biology: An Evolutionary-Ecological Per-spective. Sinauer, Sunderland, Massachusetts.
UNESCO. 1996. Biosphere Reserves: The Seville Strategy and the Statutory Framework for the WorldNetwork. UNESCO, Paris.
Upper Bay of Fundy Biosphere Initiative (UBoFBI). 2002. Upper Bay of Fundy Biosphere InitiativeDraft Plan – Co-operation for conservation and sustainable development. Unpublished.
300
Health of the Bay of Fundy: Assessing Key Issues
CONSIDERING CONSERVATION AND ECOTOURISM: FROM THEBIOSPHERE TO THE CLASSROOM AND BACK
Bradley B. Walters
Geography Department, Mount Allison University, Sackville, NB. [email protected]
Biosphere reserves depend for their success on building local constituencies of support andbrokering partnerships that further conservation objectives. This paper will describe one such earlyexample of a partnership whereby efforts to further the Fundy Biosphere Reserve concept led to theredesigning of a course and participation of a class of students from Mount Allison University. Workingwith representatives of the proposed Fundy Reserve, students did background research in support of aplanning workshop and pursued independent projects exploring specific sites of conservation interestin the proposed Fundy Biosphere Reserve. The process demonstrates well the kind of win-win partner-ship that biosphere reserves aspire to achieve. Key findings from the student projects will be presentedto illustrate what they learned and how their findings may be of benefit to the proposed Fundy Bio-sphere Reserve.
301
Session Eight: Ecotourism: Opportunities and Impacts
PANEL DISCUSSION
Chair: Tom YoungRapporteur: Munju Ravindra
Panellists: Sean Murphy, Jon Percy, Joel Richardson, Colin MacKinnon, Peter Williams
Question 1. What do you consider to be critical issues with respect to tourism development and itsimpact on coastal environments of the Bay of Fundy?
Sean Murphy – Although I do not have a lot of experience in Fundy specifically, I would consider themain ecotourism issues to be sustainability, promotion of tourism outside the region, and communica-tion and education about the environmental impacts of tourism.
Jon Percy – I do not have any particular expertise in the tourism industry, but I do live on the Bay ofFundy and I am involved in co-ordinating the activities of naturalist groups who could be consideredlocally-based ecotourists. One of the important issues is the impact of the rapidly expanding ecotourismindustry on the environment. We particularly need to think carefully about tourism activities that aregenerally incompatible with nature and wildlife conservation. Recent ads in national newspapers urgedpeople to come and see the shorebirds of Fundy. Such visitors like to see the large flocks on the wing atthe very times when it is in the birds’ best interest to rest and conserve energy. Clearcutting is an activitythat is essentially incompatible with ecotourism; it is becoming increasingly difficult to enjoy a wilder-ness experience anywhere in the Maritimes without encountering large clear-cut tracts. Clearcutting iseven done right up to the boundaries of provincial and national parks and other protected areas, greatlydiminishing their aesthetic value and ecological integrity.
Joel Richardson – I am with the New Brunswick Tourism and Parks Department and am involved inlooking after the rapidly proliferating outdoor adventure companies that cater to ecotourists. There is acontinuing shift in the demographics of ecotourists, so that it is no longer only younger people who areinterested in nature-based and adventure tourism. There is a need to shift our focus from just the mar-keting perspective to preparing an inventory of existing and potential ecotourism opportunities and tothe development of new tourism products. There has been a positive change in the level of environmen-tal awareness among tourists. Communications and collaboration between government and the tourismindustry is improving and this needs to continue.
Colin MacKinnon – I am a biologist and also a local historian. I think two very important considera-tions in the ecotourism context are the occurrence of cumulative environmental effects and the need toapply the precautionary principle in developing the industry. There are a number of different perspec-tives on nature involved in developing ecotourism ranging from concerns about its conservation toexploiting it for economic benefit. I have seen a change in the ecotourism business, with an increasingnumber of participants mainly in it for the money.

302
Health of the Bay of Fundy: Assessing Key Issues
Peter Williams – Within the tourism market there is a tendency toward a rising level of expectation onthe part of the visitors. Clearly consumer choices are changing and nowadays visitors want clean,reasonably natural environments. Another important point is that ecotourism depends on using sharednatural resources – it doesn’t have its own resources. An intangible element in the development oftourism products is that the people of the area are often closely involved in the process. Working withthe communities of people in the area becomes the real challenge. Thus the sharing of information isvery important to the decision making process.
Question 2. What community issues relate to tourism development in positive or negative way?Question 3. What management options can serve to mitigate or address impacts?
Sean Murphy – ASC (Parks Canada – Atlantic Service Centre) does research on tourism and tourismproducts. They conducted a large study to assess the motivations for tourism travel. It found that “learn-ing travel” is one of the fastest growing markets. The ecotourism market is clearly there, but we need towork with communities on tourism development.
Parks generally want non-intrusive management options. They prefer to avoid closing down trails orcampsites in order to mitigate impacts. Some mitigation options might involve identifying times forviewing particular natural phenomena when ecological impacts are likely to be least, or somehowspreading out or diffusing the visitors in time or space to reduce their impacts.
Jon Percy – I sometimes get a bit concerned about the over emphasis on ecotourism as a commercial“product” or an economic development opportunity. I sometimes feel that governments and industrythink that the “eco” in ecotourism stands for “economy” not “ecology”.
At present around the upper Bay of Fundy there is no effective control of tourist access to shorebird birdroosting areas. We need to look at comparable wildlife areas, such as Cap Tourmente in Quebec, wherea system of boardwalks and blinds allow tourists get close to the Snow Geese without disturbing theircritical feeding. In Fundy, some critical shorebird areas should probably be declared off limits to visi-tors. Many of the existing shoreline areas that are designated as reserves are not really legally protected.One difficulty that sometimes arises is resistance from local communities to any sort of controls orregulations that limit their access to traditionally used shoreline areas.
Joel Richardson – New Brunswick is doing a good job in developing and promoting ecotourism. Theyare carrying out a lot of research on consumer preferences. Much of their product development is basedon this consumer research. Surveys indicate that there are three main motives that bring people to NewBrunswick: swimming beaches, whale watching and other natural attractions. New Brunswick Tour-ism can alter the exposure they give to a particular site or attraction in their various tourism promotionpublications and thus change the relative positioning of any given product.
Colin MacKinnon – At Johnson’s Mills, the Canadian Wildlife Service (CWS) has been working withthe Nature Conservancy of Canada (NCC) and other groups for the last 10 years. Ten years ago there
303
Session Eight: Ecotourism: Opportunities and Impacts
were no controls on visitor access in place. The village of Dorchester organized a shorebird “festival”.They did this in consultation with CWS and the Tantramar Tourism Association. An old cottage wasacquired and turned into an interpretation centre. It is important to continue building relationships withcommunities and non-governmental organizations such as the NCC. Expanding communications anddialogue with the growing tourism industry is also critical. One management option might be to en-courage visitors interested in waterfowl to visit areas such as the Sackville Waterfowl Park and thusleave the hinterland areas of the Tantramar Marsh largely undisturbed.
Peter Williams – There is need for capacity building in the ecotourism industry. There are examples oflocal people making good, informed decisions in this regard. Sometimes there is a need to augmenttheir knowledge about some of the newer things that are happening. An example of a community“doing the right thing” occurred in British Columbia where there is a land resource management plan-ning (LRMP) Process. Prince Rupert residents are using the LRMP process to understand how best toincorporate cruise ship activity into their region. Communities can make good decisions but sometimesneed a little support.
Question 4. What specific strategies are there for the Bay of Fundy region to address potential envi-ronmental impacts?
Sean Murphy – There is a need to increase the level of research activity, particularly multidisciplinaryresearch in this area. Related to this is a requirement to improve the communication of research resultsand scientific information. On the positive side, there are many groups out there, such as various “friendsof parks” organizations and other environmental groups, whose members are very knowledgeable anddedicated. We also need to encourage more collaborative activities with local communities.
Jon Percy – Coincidentally, 2002 has been designated as the Year of Ecotourism by the United Nations.One of the objectives is to raise awareness of the impacts of ecotourism on biodiversity. What are someof the other things that need to be done? There is a great need for education of tour operators andtourists about their possible impacts on the environment. There also has to be more dialogue with localcommunities that are likely to be affected by expanding ecotourism. The proposed Upper Bay of FundyBiosphere Reserve might be a useful tool for doing this and for working towards sustainable ecotourism.The existing interactions between the Canadian Wildlife Service and the tourism industry needs to becontinued and expanded in order to ensure that any growth in ecotourism is compatible with wildlifeand habitat conservation.
Joel Richardson – It is good to see tourism on the agenda for a science workshop. Provincial, federaland municipal governments have to get more involved with the scientific community in order to raiseawareness about the potential impacts of tourism on ecosystems.
Collin MacKinnon – The ACAP program is an ongoing experiment in environmental democracy. It is acommunity-based stakeholder initiative to take care of their own environment. The innovative processis still taking root and it is important that communities be given time to grow with it. It is also important

304
Health of the Bay of Fundy: Assessing Key Issues
to involve people and their communities in the research programs that are taking place in their area.Government people sometimes tend to exist in boxes, often with little contact with the local communi-ties that are influenced by their activities and decisions. It is important that they do not burn bridges tothe local communities and that they foster openness and dialogue in their dealings with them.
Peter Williams – If they are provided with the necessary resources and guidance students can assistgreatly in field research and monitoring. We need to capitalize on our connections with universities toencourage more student participation. The participation of graduate students can make a great differ-ence in carrying out research programs.
General Discussion
Judith Swindell – I appreciate that most people here see the world through their own eyes and in thelight of their own experiences and backgrounds in the natural sciences. I see the world through the eyesof a social worker (crisis intervention and suicide prevention officer). To me, the most important con-sideration is the sustainability of human life and all the things that this entails, from agricultural jobs torecreational opportunities. We must fight to ensure that the process for developing ecotourism is trulydemocratic; a process in which people share their ideas, listen to others and work co-operatively to-gether for the common good.
Brad Walters – What about the use of best practices and guidelines in ecotourism? Should we bethinking about regulating access to the use of this natural resource – if indeed it can be considered aresource-based industry? Or instead, should we be promoting voluntary, industry-led approaches toself-regulation?
Peter Williams – If the people involved in the industry do not believe in the fairness or efficacy of theregulations then they will cheat on them. Community-based regulatory systems work through volun-tary monitoring of activities. People tend to follow the accepted guidelines because of a fear of beingshamed or reproved by their peers and neighbours. This is what seems to be happening at Gwaii Haanasin British Columbia.
Jon Percy – In the outer Bay of Fundy, where whale watching has expanded rapidly in recent years, thetour boat operators have adopted a voluntary code of ethics concerning their interactions with thewhales. Often, it is a few tourists who try to bend the guidelines by urging boat captains to approachcloser to the whales than specified. However, the guidelines are usually posted prominently and mosttourists are sufficiently environmentally aware to understand the need for such restrictions.
Tom Young – There is a new accreditation program for whale watch operators in the Bay of Fundyregion of Nova Scotia and New Brunswick. Successful completion of the program leads to the designa-tion of the business as a “Bay of Fundy Recommended Experience”. The process also includes a “mys-tery shop” evaluation by an “undercover tourist”. The adoption of the 16-point whale watch operator’scode of ethics are a part of this accreditation process.

305
Session Eight: Ecotourism: Opportunities and Impacts
Renee Wissink – I am a park ecologist at Fundy National Park where we have huge numbers of visitorsevery year. One important question is when do we reach the threshold of too many tourists for such anarea to sustain? We need a much better and more comprehensive scientific assessment of thresholds oftourist numbers. Also, what efforts are the New Brunswick Department of Tourism making to assess thesustainability of new projects like the Fundy Trail Parkway?
Joel Richardson – The Fundy Trail Parkway is a private industry initiative, so New Brunswick Tourismhas no direct control over it. However, there is an environmental assessment process for the project andwe would expect to hear from Fundy National Park if there are any particular issues that need to beaddressed.
Peter Williams – In these situations adequate collaboration often does not take place in a timely fash-ion.
Renee Wissink – We really need to sit down together with all the interest groups to discuss potentialissues at the concept stage of any such large projects rather than waiting until it is designed and then usethe environmental assessment process to check for potential issues.
Jon Percy – Years ago when I visited Mount McKinley Park in Alaska they were determined not to havethe same problems of overuse by visitors that was plaguing Yellowstone and other national parks at thattime. They controlled visitor access by using a shuttle bus system for travel within the Park.
Munju Ravindra – Are there any plans to consider such a system in Fundy and other Eastern CanadianParks?Not really.
Joel Richardson – At present in New Brunswick there is a moratorium on government financial assist-ance for campground development.
Summary Comment – Tom Young, Chair
Tourism in the Bay of Fundy is largely motivated by the extraordinary natural landscape of theBay. With this in mind, tourism development representatives promote tourism development as a way tosupport the economies of local communities. Wildlife officials see the economic development agendaas a threat to the safety of vulnerable species and habitats. The purpose of this panel is to explore thesetwo perspectives and share information, to better understand the issues in each case and to work to-wards a common sustainable tourism strategy. As a “shared” resource there must ultimately be a co-operative relationship between users and managers.
The topic of sustainable tourism is confused somewhat by the interpretation of the word eco-tourism. Ecotourism means environmentally responsible travel. But there is no control over who can
306
Health of the Bay of Fundy: Assessing Key Issues
use the word ecotourism, and its use is frequently the domain of marketers. Perhaps we should considera sustainable tourism strategy that does not rely on this easily borrowed concept.
The one point that stands out among all the panellists is the need for local communities tobecome stewards of their local resources. There were a number of examples cited, but it was pointedout that this can take time to develop. The outcome of this panel generally suggests that a broad strategycan only work in conjunction with local community-based initiatives.
307
The Bay of Fundy Coastal Forum: “Taking the Pulse of the Bay”
The Bay of Fundy Coastal Forum*
TAKING THE PULSE OF THE BAY
Co-Chairs: Janice Harvey, Conservation Council of NewBrunswick, Waweig, New Brunswick
andPeter G. Wells, Coastal and Water Science Section,
Canadian Wildlife Service, Environmental Conservation Branch,Environment Canada, Dartmouth, Nova Scotia
* Note: Full text of discussion and results of the Forum is being published as a separate report (04/04).

308
Health of the Bay of Fundy: Assessing Key Issues

309
The Bay of Fundy Coastal Forum: “Taking the Pulse of the Bay”
TAKING THE PULSE OF THE SEAS:CAN IT BE DONE?
J. B. (Jack) Pearce
Buzzards Bay Marine Laboratory, Falmouth, MA. [email protected]
During the almost half century that I have been concerned with marine habitat quality andfisheries, there have been numerous positive changes in pollution sources, fates and effects. To a greatdegree this has been the result of ongoing research and monitoring by academics, government agenciesand environmental organizations. The question remains today, what else must be done? You will findthis an interesting question.
The literature is ‘fat’ with published papers documenting the effects of contaminants and physi-cal disruptions, as well as the interactions between these and the natural environment and certain cyclicenvironmental changes. Today I want to document how managers in recent years have measured thehealth of marine habitats and their contained living marine resources (LMR). By health I mean theassessment of “the condition of being sound in body ...; freedom from physical disease”, or “the generalcondition of the body”, i.e. the bodies of food chain organisms culminating in fish.
To assess relative health we must always keep in mind water quality, ‘a peculiar and essentialcharacter’, or ‘an inherent feature’. What was the quality of the habitat before man compromised thewater (or sediment) quality? This has most effectively been accomplished using ‘case studies’ andemphasizing ‘historical perspectives’. The scientist-manager must be willing to accept that data andinformation from one habitat or zoogeographic region (or large marine ecosystem) can be used inanother. Moreover, one must agree that changes observed or measured two centuries ago are validtoday. In other words, we must think in the context of ‘ecology through time’. Just such a program wassuggested in a recent issue of Science, where Jackson et al. (2001) considered “Historical overfishingand the recent collapse of coastal ecosystems” and Sugden and Stone (2001) wrote on “Filling genera-tion gaps”, a short essay on long-term monitoring.
These thoughts were further elaborated upon in more recent issues of Science where an author,Malakoff (2002), suggests that scientists might be “Going to the edge to protect the sea” and otherauthors ask, “Can we defy nature’s end?” (Pimm et al. 2001). To address the consequences of man-kind’s effects now, and in the future, scientists are considering new (and old) tools, high tech themes,and ‘new ways forward’. As Editor of Fishery Bulletin and North American Editor of the MarinePollution Bulletin I have, over the past decade, reviewed some 1,700 manuscripts dealing with theseissues in some manner. My files suggest that I have read another 5,000+ titles published in other jour-nals. Over the past half decade there has been a crescendo of titles in those fields concerned with 1)‘bioinvasions’, changes in diversity, 2) use of refuges or reserves for management of marine species, 3)management and protection of marine mammals (and other endangered species), and 4) overfishingand its effects on target species, incidental catches, and habitat quality. I have found that it is nigh

310
Health of the Bay of Fundy: Assessing Key Issues
impossible for any one human to ‘digest’ the resulting voluminous literature, much less to summarize iteffectively so as to allow for rational use of these data and information! Yet most of these papers andreports have, or will have, some applicability to the wide range of the marine environmental literature.
As this paper is being drafted, a new National Report – The State of the Nation’s Ecosystems –is being published by the Heinz Center (see Shouse 2002). This report grew out of the interests of theWhite House Office of Science and Technology Policy and had, as an important component, the devel-opment of indicators which integrate “biophysical and sociocultural measures”. Some scientists arenegative about such recommendations because “no attempt is made ... to relate human activities to thechanges in American ecosystems, and no attempt is made to evaluate the health of US ecosystems”(again, see Shouse 2002). Most of the remainder of this (my) paper deals with past attempts to demon-strate through history, and monitoring, how people’s activities have compromised estuaries and marinehabitats and their contained LMR.
Over two decades ago I was working in Washington, DC as Director of NOAA’s NationalEstuarine Program Office. A colleague, and close friend, Dr. James Thomas, suggested that this thennew NOAA office should organize a series of major seminars on the theme “NOAA’s Estuarine Semi-nar of the Month”. As these seminars were expedited, it emerged that it was possible to garner data ofan historical nature which demonstrated clearly how and where urbanization and industrialization re-duced the quality of estuarine and coastal habitats, and measurably affected the abundance and distri-bution of LMRs. One case study that I have used involves the whaling and fishing port, New Bedford,Massachusetts (see Pesch et al. 2001; Pesch and Garber 2001). Briefly, the authors have divided theecological history of New Bedford into four eras or periods: agriculture, 1650–1780; whaling, 1750–1900; textile, 1880–1940; and post-textile, 1940–present, which involved electrical equipment manu-facturing, increased harbour modifications, and transportation infrastructure. Although I will use some40 viewgraphs in my oral presentation, a few from New Bedford Harbour can serve here to detail howcoastal habitats change with development! Pesch and her co-workers have done an admirable job inusing indicators of development and simultaneous habitat degradation to suggest future managementsteps necessary to preventing further habitat degradation and losses of LMRs. Figures 1–6 includesome variables that indicate degradation in the context of time.
In addition to having an historical understanding of habitat quality and the status of the biota,agencies responsible for management of LMRs, and the status of habitats, must have current informa-tion on key variables, i.e. those biological, chemical, geological and physical parameters necessary toassess the health of estuaries, coastal and marine ecosystems. The Heinz Report – The State of theNation’s Ecosystems – notes that many variables necessary to an assessment of environmental healthare NOT being measured, or are being measured so infrequently or inefficiently that the data are mean-ingless (see Heinz Center 2002)! This situation has continued for some four decades in spite of theimplementation nationally and internationally of scores of marine monitoring and research programs.Recognizing the need to understand the status of key variables in specific zoogeographic provinces,‘large marine ecosystems’ and fishery management areas, the Northeast Fisheries Center of the Na-tional Marine Fisheries Service (NMFS) commissioned Characterizations of the Middle Atlantic Wa-

311
The Bay of Fundy Coastal Forum: “Taking the Pulse of the Bay”
ter Management Unit and Gulf of Maine (see Pacheco 1988; Reid, Ingham and Pearce 1987). Agenciesin Canada and northern Europe were doing and have done much the same. Most recently, the NortheastFisheries Science Center has produced the reference document, Status of the Northeast US ContinentalShelf Ecosystem (Link and Brodziak 2002), an update on the earlier Characterizations.
More recently, the concept of the large marine ecosystem (LME) has been elaborated upon bySherman and Skjoldal (2002). This latest volume in a series addresses changes in environmental qual-ity and resource status in certain LMEs of northern Europe. Particular emphasis is now placed onsustainability as based on information from studies of: 1) productivity, 2) fish and fisheries, 3) pollu-tion and ecosystem health, 4) socio-economics, and 5) governance (management?). Almost simultane-ously, Elsevier has published its Seas at the Millennium: An Environmental Evaluation (Sheppard2000). A three volume set, the title includes 106 chapters covering “manageable regions” around theworld, and in all hemispheres. A much smaller volume, published by the Worldwatch Institute, pro-vides a wealth of information on Safeguarding the Health of the Oceans (McGinn 1999). Again, McGinn1) covers the world’s seas, with illustrations of “hot spots”, 2) discusses the bridging of informationgaps (similar to the Heinz Report), and 3) considers international policies and national and local effortsto “protect oceans”.
Finally, almost all chapters in titles noted above ultimately conclude that the principal issuesbearing on habitat quality and status of LMRs are centered in overpopulation (and over use of re-sources) and urbanization. The Worldwatch Institute, again, addresses the latter in its small volume,Reinventing Cities for People and the Planet (O’Meara 1999). Its basic conclusion is that if we are tomanage, effectively, the coastal zone we must change how we allow our cities and industry to grow.Urban and industrial planning and population planning are absolutely essential, and not only in thecoastal zone but in all riparian habitats leading to the seas; river basins are key “conduits” for contami-nants from inland areas.
Because almost all the above reports and advisories are critical of past research and monitoring,it is essential that future research and habitat monitoring address the concerns brought forth from thislate twentieth century introspection. It is particularly important that interagency and international moni-toring programs 1) review past monitoring and research, 2) identify appropriate historical and casestudies and 3) make those adjustments necessary to ensure that all data collected will be meaningful,and useful, to the processes of management, prevention and rehabilitation.
A starting point in these regards is the use of papers such as the ICES volume Biological Effectsof Marine Pollution and the Problems of Monitoring (McIntyre and Pearce 1980). Although writtentwo decades ago, its focus was the defining of adequate monitoring strategies, a problem as currenttoday as in 1979 when the workshop was held at the Duke University Marine Lab. Working within thestructure of the Marine Environmental Quality Committee (MEQC) of the International Council for theExploration of the Seas (ICES), we established that responses to contaminants and habitat degradationwere best measured in the field, where changes in population dynamics and structure could be ob-served and measured at the same time as toxicity of contaminants, nutrient overloading and stress due
312
Health of the Bay of Fundy: Assessing Key Issues
to physical degradation. Since then, scores, yes hundreds, of volumes have been written on the subjectof environmentally appropriate research and monitoring. The monitoring of fish stocks has continuedfrom 1963 to the present using the same sampling gear. But even with robust biannual cruises, andconsistent use of sampling gear, the exigencies of the fisheries and fishing community may force theadoption of new methodologies (see Frasier 2002): Science, especially applied science tangential to‘economics’, is rarely simple or straightforward (see Bonner 2002)! The earlier mentioned volume, TheState of the Nation’s Ecosystems, in Chapter 5, “Indicators of the Condition and Use of the Coasts andOceans”, now suggests that past indicators and research may not be useful in assessing the status ofhabitats and contained LMRs (Heinz Center 2002). This will surely be questioned by the hundreds ofscientists and agencies which have conducted and sponsored thousands of research projects in order toevaluate man’s effects on marine and estuarine habitats.
For my part I remain convinced that many programs have measured successively and success-fully short and long-term changes in habitats and the contained biota. In fact, we have frequently takenthe pulse of the seas. Moreover, many of the past studies have yielded data and findings which form thebase and indicators for future long-term monitoring and research. What we must do now is to effec-tively educate the public and body politic as to the significance of past and future findings! As I read thefinal hand draft, my radio tells me that our local Congress-person has just countered a judicial decisionto restrain fishing so as to maintain some semblance of fish stocks in the northeast. It is more important(politically?) to him to support a crowd of marginal fishers, rather than use excellent science to managethe fisheries!
Literature Cited
Bonner, J. 2002. Lives of a Biologist: Adventures in a Century of Extraordinary Science. HarvardUniversity Press, Cambridge, MA. 215 pp.
Fraiser, D. 2002. Enmeshed in dispute. Cape Cod Times, 3 October, Hyannis, p. 1.
Heinz Center. 2002. The State of the Nation’s Ecosystems. The H. John Heinz Center for Science,Economics and the Environment, Washington, DC. 270 pp.
Jackson, J. and 18 co-authors. 2001. Historical overfishing and the recent collapse of coastal ecosys-tems. Science 293: 629–638.
Link, J. and J. Brodziac (Eds.). 2002. Status of the Northeast US Continental Shelf Ecosystem. NMFS/NOAA Northeast Fisheries Science Center (Woods Hole) Reference Document 02-11. 245 pp.
Malakoff, D. 2002. Going to the edge to protect the sea. Science 296: 459–461.
McGinn, A. 1999. Safeguarding the Health of Oceans. Worldwatch Paper 145. The Worldwatch Insti-tute, Washington, DC. 87 pp.
McIntyre, A. and J. Pearce. 1980. Biological Effects of Marine Pollution and the Problems of Monitor-ing. Proceedings from an ICES Workshop, Beaufort, NC, 26 February - 2 March 1979. ICES,Copenhagen. 350 pp.

313
The Bay of Fundy Coastal Forum: “Taking the Pulse of the Bay”
O’Meara, M. 1999. Reinventing Cities for People and the Planet. Worldwatch Paper 147. The WorldwatchInstitute, Washington, DC. 94 pp.
Pacheco, A. (Ed.). 1988. Characterization of the Middle Atlantic Water Management Unit of the North-east Regional Action Plan. NOAA Technical Memo NMFS-F/NEC-56, Woods Hole, MA. 322pp.
Pesch, C., R. Voyer, J. Copland and J. Lund. 2001. Imprint of the Past: Ecological History of NewBedford Harbour. US Environmental Protection Agency, Region 1, New England, Narragansett,RI. Lab. Paper 901-R-01-003.
Pesch, C. and J. Garber. 2001. Historical analysis, a valuable tool in community-based environmentalprotection. Marine Pollution Bulletin 42(5): 339–349.
Pimm, S. and 32 co-authors. 2001. Can we defy nature’s end? Science 293: 2207–2208.
Reid, R., M. Ingham and J. Pearce (Eds.). 1987. NOAA’s Northeast Monitoring Program: A Report onProgress of the First Five Years (1979–84) and a Plan for the Future. NOAA Technical MemoNMES-F/NEC-56, Woods Hole, MA. 138 pp.
Sheppard, C. (Ed.). 2000. Seas at the Millennium: An Environmental Evaluation, Vols. 1-3. Pergamon(Elsevier) Press, Amsterdam. 2080+ pp.
Sherman, K. and H. Skjoldal. 2002. Large Marine Ecosystems: Changing States and Sustainability.Elsevier, Amsterdam. 449 pp.
Shouse, B. 2002. Report takes stock of knowns and unknowns. Science 297: 2191.
Sugden, A. and R. Stone. 2001. Filling generation gaps. Science 293: 623.
Voyer, R., C. Pesch, J. Garber, J. Copland, and R. Comeleo. 2000. New Bedford, Massachusetts: Astory of urbanization and ecological connections. Environmental History 5(3): 352–377.
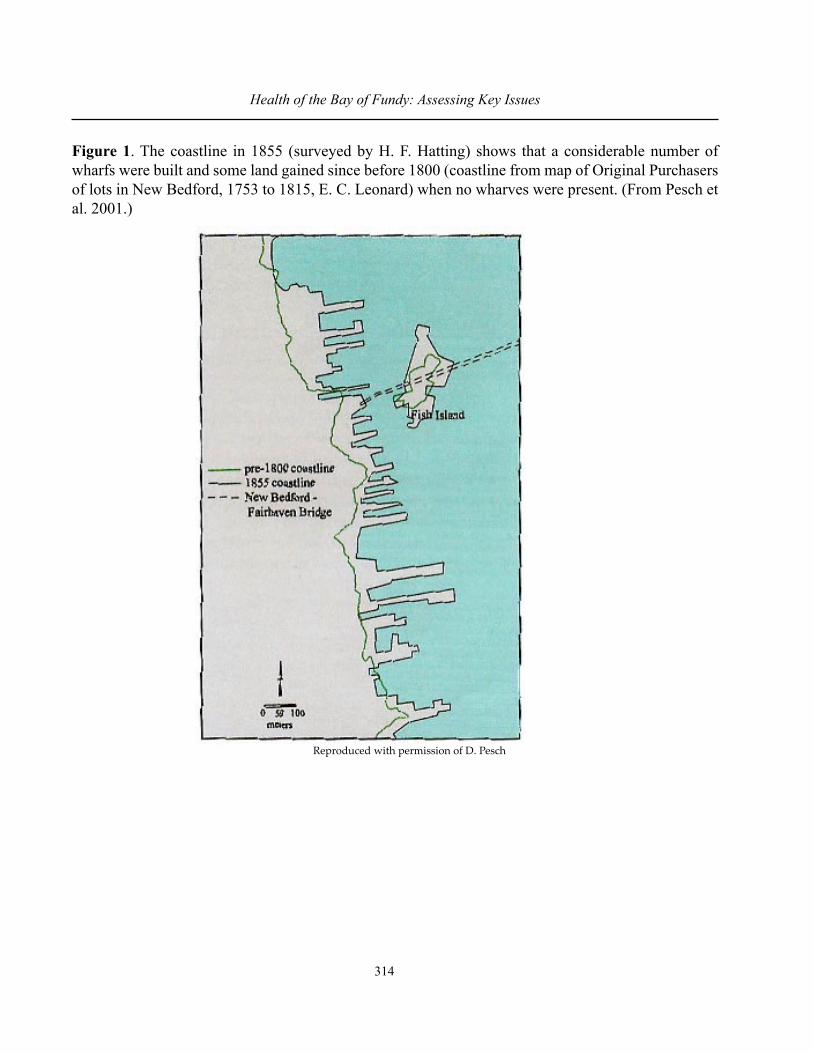
314
Health of the Bay of Fundy: Assessing Key Issues
Figure 1. The coastline in 1855 (surveyed by H. F. Hatting) shows that a considerable number ofwharfs were built and some land gained since before 1800 (coastline from map of Original Purchasersof lots in New Bedford, 1753 to 1815, E. C. Leonard) when no wharves were present. (From Pesch etal. 2001.)
Reproduced with permission of D. Pesch
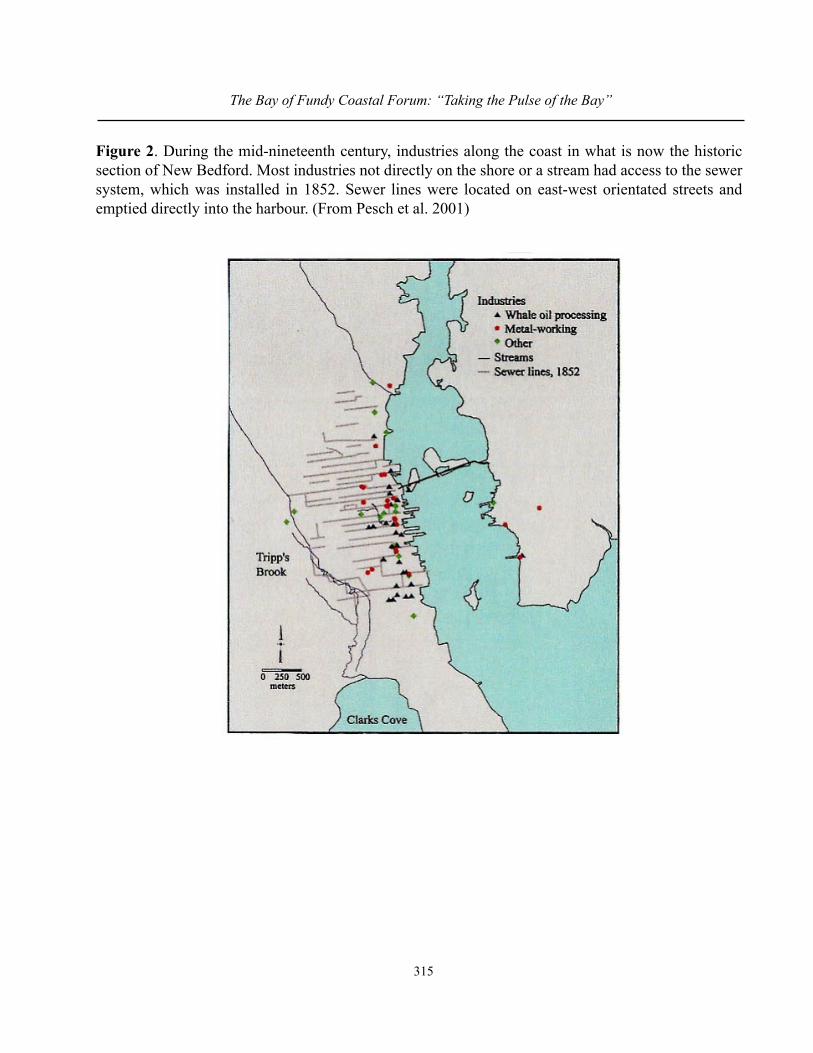
315
The Bay of Fundy Coastal Forum: “Taking the Pulse of the Bay”
Figure 2. During the mid-nineteenth century, industries along the coast in what is now the historicsection of New Bedford. Most industries not directly on the shore or a stream had access to the sewersystem, which was installed in 1852. Sewer lines were located on east-west orientated streets andemptied directly into the harbour. (From Pesch et al. 2001)
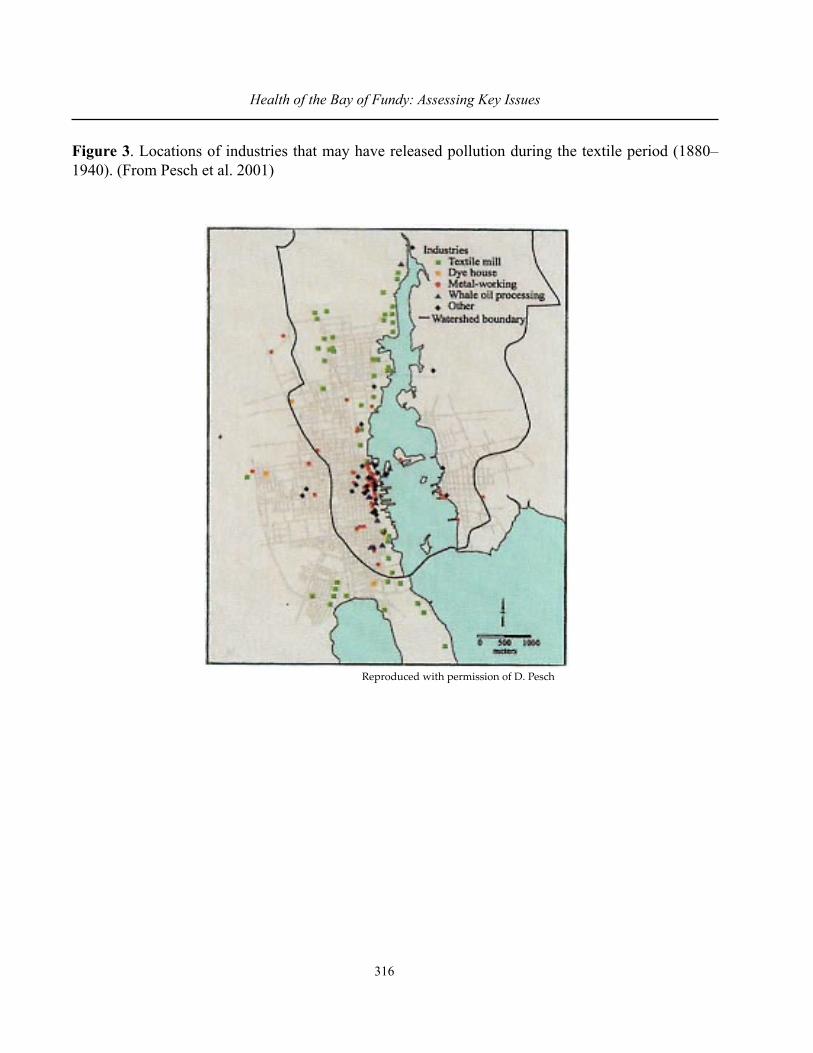
316
Health of the Bay of Fundy: Assessing Key Issues
Figure 3. Locations of industries that may have released pollution during the textile period (1880–1940). (From Pesch et al. 2001)
Reproduced with permission of D. Pesch
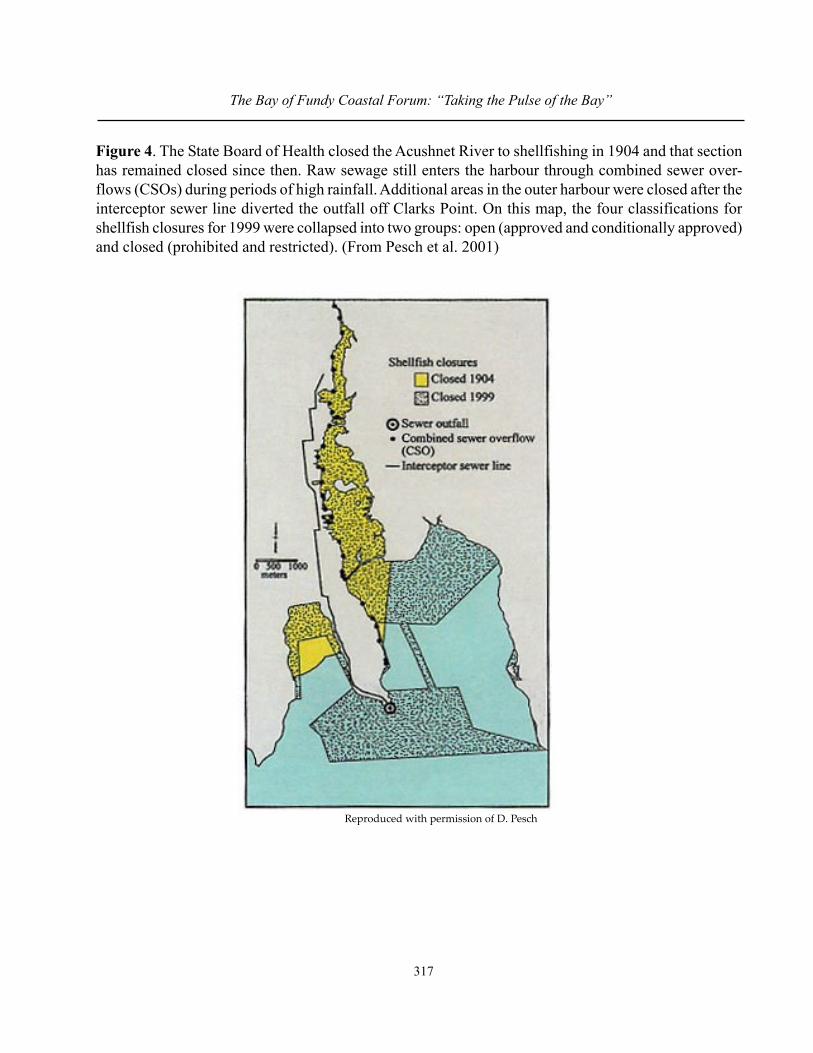
317
The Bay of Fundy Coastal Forum: “Taking the Pulse of the Bay”
Figure 4. The State Board of Health closed the Acushnet River to shellfishing in 1904 and that sectionhas remained closed since then. Raw sewage still enters the harbour through combined sewer over-flows (CSOs) during periods of high rainfall. Additional areas in the outer harbour were closed after theinterceptor sewer line diverted the outfall off Clarks Point. On this map, the four classifications forshellfish closures for 1999 were collapsed into two groups: open (approved and conditionally approved)and closed (prohibited and restricted). (From Pesch et al. 2001)
Reproduced with permission of D. Pesch
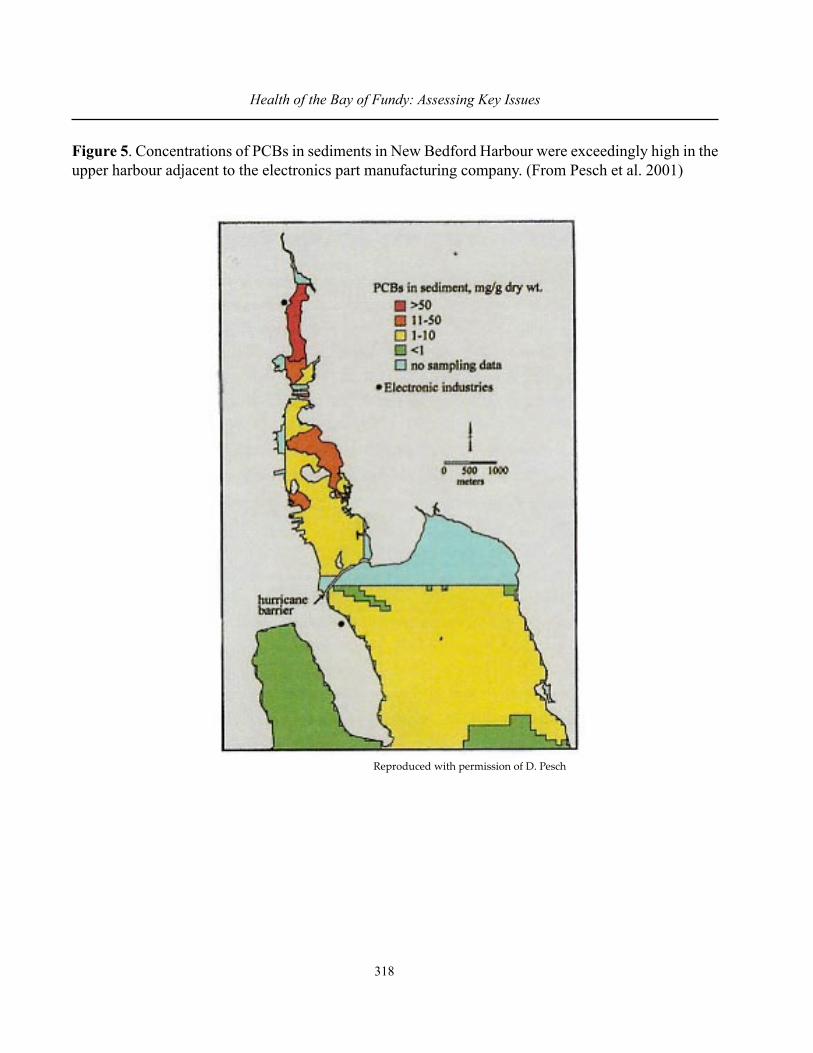
318
Health of the Bay of Fundy: Assessing Key Issues
Figure 5. Concentrations of PCBs in sediments in New Bedford Harbour were exceedingly high in theupper harbour adjacent to the electronics part manufacturing company. (From Pesch et al. 2001)
Reproduced with permission of D. Pesch
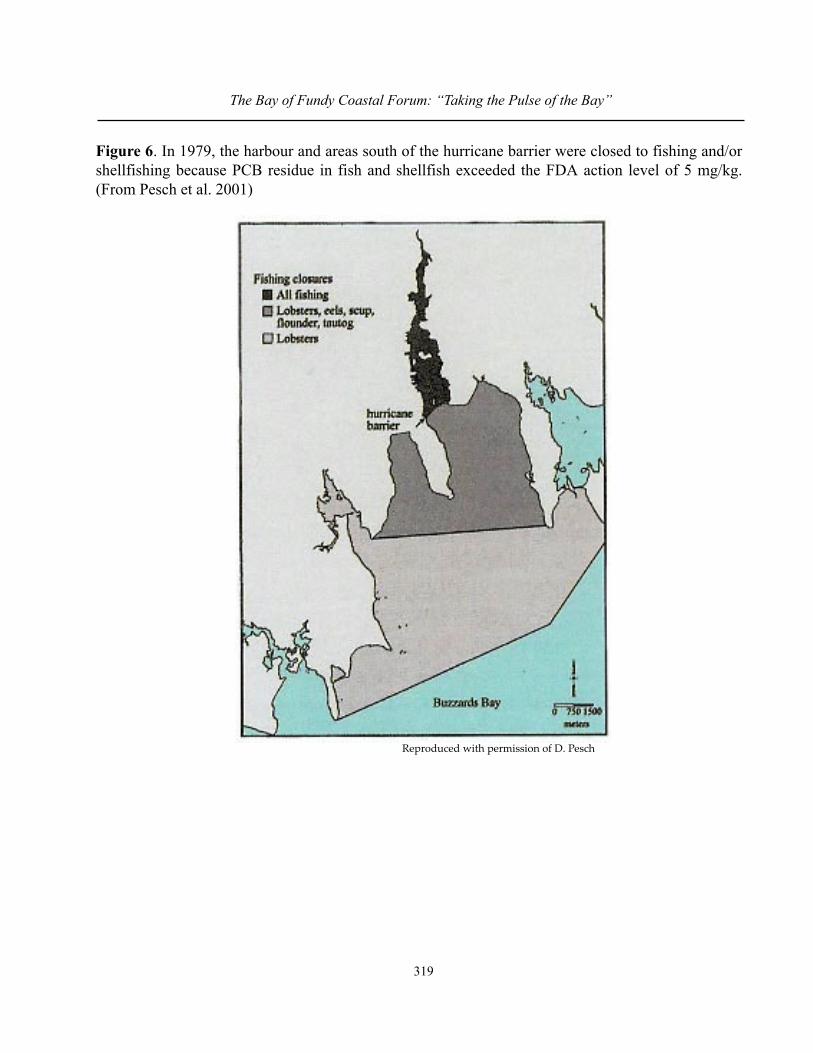
319
The Bay of Fundy Coastal Forum: “Taking the Pulse of the Bay”
Figure 6. In 1979, the harbour and areas south of the hurricane barrier were closed to fishing and/orshellfishing because PCB residue in fish and shellfish exceeded the FDA action level of 5 mg/kg.(From Pesch et al. 2001)
Reproduced with permission of D. Pesch
320
Health of the Bay of Fundy: Assessing Key Issues
TWO HUNDRED YEARS OF ECOSYSTEM CHANGE IN THEOUTER BAY OF FUNDY
PART I – CHANGES IN SPECIES AND THE FOOD WEB
Heike K. Lotze1, Inka Milewski2 and Boris Worm1
1 Department of Biology, Dalhousie University, Halifax, NS. [email protected] Conservation Council of New Brunswick, Fredericton NB. [email protected]
Abstract
The Quoddy Region and Grand Manan Archipelago form a hotspot of marine species diversityand productivity in the Northwest Atlantic. We present the history of major human impacts and theirconsequences on the ecosystem over the last centuries. Using all available data, we reconstructed his-torical changes that occurred in species of all trophic levels, from phytoplankton and invertebrates upto fish, birds and mammals.
Selective fishing and hunting, and increasing effort, efficiency, and spatial extent of exploita-tion over time resulted in marked declines of target species abundance and size. This resulted in majorshifts in dominance patterns and food-web structure, and shifts from high to low trophic level harvest-ing. Habitat degradation and destruction and chemical contamination reduced the amount of criticalspawning, breeding, nursing, and feeding habitat. Multiple pollutants affected health, survival andreproduction of many species, and increasing human activities in coastal waters enhanced the level ofstress and disturbance. Nutrient loads altered phytoplankton and phytobenthos communities, therebyfavouring less edible or toxic species and mass occurrences of annual seaweeds. We demonstrate thatthis unique ecosystem over time expressed well-known signs of degradation typical for human-im-pacted coastal waters worldwide. Multiple human impacts affected species and their interactions on alltrophic levels. This reduced productivity of traditional fisheries and predictability of the ecosystem.Compared to other degraded ecosystems, however, there is still potential to sustain a diverse and pro-ductive marine flora and fauna which could be restored if wise management actions are chosen.
Introduction
The Quoddy Region and the Grand Manan Archipelago form a hotspot of marine species diver-sity and productivity in the Northwest Atlantic. Ocean currents and circulation patterns, high tides,upwelling, and short, energy-efficient food chains support high concentrations of primary and second-ary producers (Hardie 1979; Thomas 1983; Lotze and Milewski 2002). These lower trophic level spe-cies attract a wide range of birds, predatory fish and mammals which depend on the area for at least partof their life. In addition to the rich food supply, the diverse underwater and terrestrial landscapes pro-vide an extraordinary variety of habitats fulfilling the species-specific needs for breeding, spawning,nursing, foraging, hiding and resting (Hardie 1979; Thomas 1983; Lotze and Milewski 2002). Thishabitat diversity, combined with the rich food supply, maintain the hotspot diversity and productivity.

321
The Bay of Fundy Coastal Forum: “Taking the Pulse of the Bay”
Human Activities in Coastal Waters
The archeological record shows that Indigenous peoples have recognized and valued these di-verse and abundant marine resources for several thousand years. Around Passamaquoddy Bay, prehis-toric people focussed especially on marine resources and used a more diverse shellfish fauna than theirneighbours in the Maritimes and Maine. Their distinct lifestyle was recognized as the ‘Quoddy Tradi-tion’ in the Maritime Woodland period (2200-350 B.P.) (Black and Turnbull 1986). In their words,‘Passamaquoddy’ denotes a “bay full of pollock” and “fishers of pollock” (Gatschet 1897). As huntersand gatherers, they targeted species from all trophic levels at low rates due to simple fishing and hunt-ing methods and low population size. Therefore, we may describe them as ‘low-impact omnivores’.Faunal remains from archaeological sites suggest that large cod, pollock and herring were used as foodresources for more than 4,000 years without a visible decrease in body size, usually the first sign ofoverfishing (Black and Turnbull 1986; Spiess et al. 1990; Steneck 1997).
With European settlement in the late 18th century and subsequent industrialization in the late19th century, human activities have altered this ecosystem at a rapidly increasing rate. Fishing andhunting pressure as ‘top-down’ impacts increased, especially on large species that were easy to catch.Whales were hunted from shore operations, seals were hunted for a bounty, and Harbour Porpoiseswere hunted by native people to trade oil with the Europeans (Ingersoll and Gorham 1978; Gaskin1983; Percy 1996b). Birds were hunted heavily for food, but egg and down collection also occurred(Christie 1979). Large groundfish, especially cod and pollock were caught in the area, and herring wasfished for bait (Perley 1852; Huntsman 1953). Thus, humans became ‘top predators’ in the food web,and by 1900 they had almost extirpated many birds and mammals.
In the case of fish, the first signs of overexploitation could be observed around 1900, when clearshifts in size distribution were observed. The size of cod and pollock strongly declined and the herringfishery shifted from large adults to medium “stringers” and further to small “sardines” (Perley 1852;Huntsman 1953). In the early 20th century, legal protection for some birds and mammals initiated slowrecovery of some top predators. However, humans increased their pressure on fish, especially groundfishand herring through increasing effort, efficiency and spatial extent of fishing grounds (Steneck 1997,Percy 2000). Humans became ‘highly efficient top predators’. Finally in the 1970s, a strong decline inabundance of groundfish and herring could be observed (Lotze and Milewski 2002). These strongrecent declines or collapses of certain fisheries may be not only the result of actual high fishing pres-sure, but also of overfishing for decades and even centuries in the past. Jackson et al. (2001) suggestedthat extended time lags might occur between the onset of overfishing and the visible consequences. Inour study area, the decline in formerly dominant groundfish species such as pollock and cod resulted ina shift in dominance patterns. Dogfish, hake and small groundfish such as sculpins increased in abun-dance over the last 20 years (Lotze and Milewski 2002).
The scarcity of traditionally abundant and valuable species induced the search for new resourcesand a shift to low-trophic level harvesting. Over the last 10–20 years, new fisheries for crabs, seaurchins and rockweed were developed, while traditional fisheries for periwinkles, scallops and lobster
322
Health of the Bay of Fundy: Assessing Key Issues
were intensified (Lotze and Milewski 2002). Further plans to develop fisheries for sea cucumbers, krilland mussels exist (Percy 1996a). This increasing exploitation of species at lower and lower levels ofthe food web has been identified as a global pathology, called “fishing down the food web” (Pauly et al.1998). Many of these species are important prey or (in the case of rockweed) habitat-building speciesfor upper trophic levels, including those species which were the traditional targets of the fishery. On theother hand, the fishery for large pelagic fish such as tuna, swordfish and sharks is of renewed interest.
Human Impacts in Coastal Waters
Around 2000, humans became ‘top omnivores’ targeting all trophic levels with increasing in-tensity. These strong top-down impacts resulted in clear shifts in food-web structure and species inter-actions. The loss or decline of high trophic level species resulted in shifts in species composition at thesame and lower trophic levels because of the release from competition and predation pressure. In ex-treme cases, successive changes can be observed at several lower trophic levels known as “trophiccascades” (Steneck 1998).
In addition to top-down impacts, humans activities also altered species composition and pro-ductivity by ‘bottom-up’ impacts such as nutrient enrichment and shifts in nutrient ratios (N:P:Si).Nutrient sources include sewage, aquaculture (fish food, fish excrements), municipal runoff (gardenand lawn fertilizer), organic discharges (food processing plants, pulp and paper mills), agriculturalrunoff (fertilizer, animal waste), burning of fossil fuel and atmospheric deposition (Bricker et al. 1999).This over-enrichment of the environment with the limiting plant nutrients nitrogen and phosphorus hassevere consequences on the species composition and productivity among primary producers. Com-pared to the 1930s, we find a clear shift in the phytoplankton community from non-harmful diatomdominance to increasing amounts of less edible or toxic diatoms and dinoflagellates (Gran and Braarud1935; Martin et al. 1999). In the phytobenthos, altered nutrient conditions result in a decline of long-lived rockweeds and eelgrasses, an increase in the amount of annual algal blooms, and partially a shiftto the dominance of filter feeders. These changes are most visible close to nutrient point sources suchas sewage outlets or fish farms (Worm 2000; Worm and Lotze 2000). In a recent eutrophication surveyof estuaries in the United States, the St. Croix River/Cobscook Bay estuary was listed among the 44 outof 138 estuaries which showed the highest levels of expression of eutrophic conditions, which wereexpected to worsen towards 2020 (Bricker et al. 1999). Wastewater treatment plants were listed as themost important measure to mitigate nutrient inputs into rivers and the sea (Bricker et al. 1999).
When Europeans settled in the area, their activities led to a successive alteration, degradationand destruction of the coastal environment, which reduced habitat availability, heterogeneity and com-plexity, as well as sediment and water quality. Damming of rivers, settlement on islands, coastal con-structions, dyking and draining of wetlands, bottom trawling and dragging, aquaculture operations, andother activities reduced the overall amount of undisturbed high-quality habitat in rivers, on land, and inthe sea (Percy 2000). Organic loads from pulp and paper mills, lumber harvest, fish processing plantsand aquaculture operations decrease water quality and clarity and degrade benthic habitat (Wildish etal. 1993; Pohle 1999). Chemicals from municipal and industrial discharges impair health, fecundity
323
The Bay of Fundy Coastal Forum: “Taking the Pulse of the Bay”
and survival (Wells et al. 1997). Moreover, increasing boat traffic, increasing noise, light and smell‘pollution’, and increasing human recreational activities such as whale, seal and bird watching increasethe level of stress for animals (Percy 1996b). All these impacts can be called ‘side-in’ impacts, whichhave severe consequences on the extent and quality of habitat for reproduction and recruitment (breed-ing, spawning, nursery), feeding and foraging, refuge from predators, and simply living (e.g., settling,growing, staging, resting, wintering) (Rangeley 1994, 2000; Percy 2000). For example, during severalperiods in the past, the St. Croix and Magaguadavic Rivers were not accessible (dams without func-tioning fishways) or had lethal water conditions to anadromous fish such as Atlantic salmon and gaspereau(Marshall 1976). Human settlements on shorelines and islands destroyed breeding colonies of manybirds (Christie 1979). Dragging and trawling, as well as recent rockweed harvesting, destroys impor-tant three-dimensional seafloor habitat (kelps, rockweed, eelgrass, mussel reefs, sponges, corals) forrecruitment, nursery and feeding as well as refuge for many fish, bird and invertebrate species, many ofwhich are of commercial interest (Rangeley 1994, 2000; Steneck 1997; DFO 1999; Percy 2000). Manyaquaculture operations are located within important feeding, nursing and recruitment habitat for fish,birds, mammals, and lobsters.
In essence, the hotspot of marine diversity and productivity became also a hotspot of humanactivities. Over time, this unique ecosystem expressed some well-known signs of degradation, whichare typical for human-impacted coastal waters worldwide (Vitousek et al. 1997; Pauly et al. 1998;Jackson et al. 2001). Unfortunately, many human activities concentrate within critical habitats that areused by many species at once such as West Isles archipelago, Grand Manan Archipelago, the Wolvesand Maces Bay (Lotze and Milewski 2002).
Conclusion
Today, most species are simultaneously affected by multiple top-down, bottom-up and side-ineffects that can create synergistic and feed-back effects. The cumulative effects of multiple humanstressors on single species and entire food webs are hardly—if at all—predictable on the base of ourcurrent knowledge of species and food-web interactions (Worm and Lotze 2000; Lotze and Milewski2002). This has important implications for any attempt of ‘species’ or ‘ecosystem management’. Itmight be more appropriate to consider strategies for ‘human-impact management’. Any integrated man-agement approach should include not only the diverse human interests but also the critical needs ofmarine species such as adequate food and habitat and undisturbed space and time (Lotze and Milewski2002).
Although human impacts widely affect coastal ecosystems, there are some encouraging conser-vation and restoration successes. In the Quoddy and Grand Manan regions, protection efforts enabledmany birds and some mammals to recover (Christie 1979; Lotze and Milewski 2002). Periods of lowerfishing pressure during World War II and after the extension of the 200-mile limit in the 1970s haveenabled fish stocks to increase in abundance until fishing effort increased again (Lotze and Milewski2002). Restoration of river habitat and effective fishways enabled gaspereau populations to increase(Lotze and Milewski 2002). The use of acoustic ‘pingers’ in gill nets reduces the by-catch of Harbour

324
Health of the Bay of Fundy: Assessing Key Issues
Porpoise (Trippel et al. 1999). In other marine habitats, effective sewage treatment plants reduced nutri-ent loads in the Baltic (Savchuk and Wulff 1999). Designation of protection zones resulted in therecovery of benthic habitat and the increase in fish biomass in tropical and temperate marine reserves,with beneficial effects on adjacent fisheries (Roberts and Hawkins 2000; Roberts et al. 2001). There-fore, we strongly recommend reducing the use of destructive and unselective fishing gear, protectingcritical habitats, reducing nutrient pollution and chemical contamination, and reducing stress and dis-turbance on species.
For the full report on this topic refer to: Lotze H.K. and I. Milewski. 2002. Two-hundred Yearsof Ecosystem and Food Web Changes in the Quoddy Region, Outer Bay of Fundy. Conservation Coun-cil of New Brunswick, Fredericton, New Brunswick, 188 pp.
References
Black, D. W. and C. J. Turnbull. 1986. Recent archaeological research in the insular Quoddy region,New Brunswick, Canada. Current Anthropology 27: 400–402.
Bricker, S. B., C. G. Clement, D. E. Pirhalla, S. P. Orlando and D. R. G. Farrow. 1999. National Estua-rine Eutrophication Assessment: Effects of Nutrient Enrichment in the Nation’s Estuaries. NOAA,National Ocean Service, Special Projects Office and the National Centers for Coastal OceanScience, Silver Spring, MD.
Canada. Department of Fisheries and Oceans (DFO). 1999. The Impact of the Rockweed Harvest on theHabitat of Southwest New Brunswick. DFO Maritimes Regional Habitat Status Report 99/2E.Maritime Regional Advisory Process, Department of Fisheries and Oceans, Dartmouth, NS.
Christie, D. S. 1979. Changes in maritime bird populations, 1878–1978. Journal of the New BrunswickMuseum 1979: 132–146.
Gaskin, D. E. 1983. The marine mammal community. Pages 245–268. In: Marine and Coastal Systemsof the Quoddy Region, New Brunswick. M. L. H. Thomas (Ed.). Canadian Special Publicationof Fisheries and Aquatic Sciences 64. Department of Fisheries and Oceans, Ottawa.
Gatschet, A. S. 1897. All around the Bay of Passamaquoddy – with the interpretation of its Indiannames of localities. National Geographic Magazine 8: 16–24.
Gran, H. H. and T. Braarud. 1935. A quantitative study of the phytoplankton in the Bay of Fundy andthe Gulf of Maine (including observations on hydrography, chemistry and turbidity). Journal ofthe Biological Board of Canada 1: 279–467.
Hardie, D. 1979. West Isles natural area of Canadian significance. Pages 101–107. In: Evaluation ofRecent Data Relative to Potential Oil Spills in the Passamaquoddy Area. D. J. Scarratt (Ed.).Fisheries and Marine Services Technical Report 901. Fisheries and Marine Services, St. An-drews, NB.
Huntsman, A. G. 1953. Movements and decline of large Quoddy herring. Journal of the Fisheries Re-search Board of Canada 10: 1–50.

325
The Bay of Fundy Coastal Forum: “Taking the Pulse of the Bay”
Ingersoll, L. K. and S. W. Gorham. 1978. A history of the mammals of Grand Manan. Grand MananHistorian 20: 31–54.
Jackson, J. B. C., M. X. Kirby, W. H. Berger, K. A. Bjorndal, L. W. Botsford, B. J. Bourque, R. H.Bradbury, R. Cooke, J. Erlandson, J. A. Estes, T. P. Hughes, S. Kidwell, C. B. Lange, H. S.Lenihan, J. M. Pandolfi, C. H. Peterson, R. S. Steneck, M. A. Tegner and R. R. Warner. 2001.Historical overfishing and the recent collapse of coastal ecosystems. Science 293: 629–638.
Lotze H. K. and I. Milewski. 2002. Two Hundred Years of Ecosystem and Food Web Changes in theQuoddy Region, Outer Bay of Fundy. Conservation Council of New Brunswick, Fredericton,NB. 188 pp.
Marshall, T. L. 1976. Historical Perspectives of Resource Development Branch Activities in RestoringAnadromous Fishes to the St. Croix River, New Brunswick – Maine. Internal Report SeriesMAR/I 76-2. Freshwater and Anadromous Division, Resource Branch, Fisheries and MarineService, Halifax, NS. 30 pp.
Martin, J. L., M. M. LeGresley, P. M. Strain and P. Clement. 1999. Phytoplankton Monitoring in theSouthwestern Bay of Fundy during 1993–96. Canadian Technical Report on Fisheries and AquaticSciences 2265. 132 pp.
Pauly, D., V. Christensen, J. Dalsgaard, R. Froese and F. Torres Jr. 1998. Fishing down marine foodwebs. Science 279: 860–863.
Percy, J. A. 1996a. Expanding Fundy’s harvest – Targeting untapped treasures. Fundy Issues, Bay ofFundy Ecosystem Partnership fact sheet 10. URL: <http://www.auracom.com/~bofep/underuti.htm>. Date accessed: 3 September 2002.
Percy, J. A. 1996b. Right Whales – Wrong places? North Atlantic Right Whales in the Bay of Fundy.Fundy Issues, Bay of Fundy Ecosystem Partnership fact sheet 6. URL: <http://netshop.net/~bofep/right.htm>. Date accessed: 3 September 2002.
Percy, J. A. 2000. Fishing in Fundy - Harming seafloor habitats? Fundy Issues, Bay of Fundy Ecosys-tem Partnership fact sheet 14. URL: <http://www.auracom.com/~bofep/Publications/Fundy%20issues/disturbance.htm>. Date accessed: 3 September 2002.
Perley, M. H. 1852. Reports on the Sea and River Fisheries of New Brunswick. Queen’s PrinterFredericton, NB. 294 pp.
Pohle, G. 1999. Benthos Assessment at Fallow Sites. Final Report to the New Brunswick Departmentof Fisheries and Aquaculture. Atlantic Reference Centre, Huntsman Marine Science Centre, St.Andrews, NB. 39 pp.
Rangeley, R. W. 1994. The effects of seaweed harvesting on fishes: A critique. Environmental Biologyof Fish 39: 319–323.
Rangeley, R. W. 2000. Aquatic macrophytes as foraging and refuging habitats for fish. Pages 18-23. In:Gulf of Maine Rockweed: Management in the Face of Scientific Uncertainty. R.W. Rangeleyand J. Davies (Eds.). Huntsman Marine Science Centre Occasional Report 00/1. HuntsmanMarine Science Centre, St. Andrews, NB.
326
Health of the Bay of Fundy: Assessing Key Issues
Roberts, C. M. and J. P. Hawkins. 2000. Fully-protected Marine Reserves: A Guide. WWF EndangeredSeas Campaign, 1250 24th Street, NW, Washington, DC 20037, USA and Environment Depart-ment, University of York, York, Y010 5DD, UK.
Roberts, C. M., J. A. Bohnsack, F. Gell, J. P. Hawkins and R. Goodridge. 2001. Effects of marinereserves on adjacent fisheries. Science 294: 920–1923.
Savchuk, O. and F. Wulff. 1999. Modelling regional and large-scale response of Baltic Sea ecosystemsto nutrient load reductions. Hydrobiologia 393: 35–43.
Spiess, A. E., E. Trautman and T. Kupferschmid. 1990. Prehistoric Occupation at Reversing Falls.Unpublished file report, Maine Historic Preservation Commission, Augusta, Maine, 28 pp.
Steneck, R. S. 1997. Fisheries-induced Biological Changes to the Structure and Function of the Gulf ofMaine Ecosystem. Proceedings of the Gulf of Maine Ecosystem Dynamics Scientific Sympo-sium and Workshop, Hanover, NH. Regional Association for the Research on the Gulf of Maine(RARGOM Report 91-1).
Steneck, R.S. 1998. Human influences on coastal ecosystems: does overfishing create trophic cas-cades? Trends in Ecology and Evolution 13(11): 429–430.
Thomas, M. L. H. 1983. Marine and Coastal Systems of the Quoddy Region, New Brunswick. CanadianSpecial Publication of Fisheries and Aquatic Sciences 64. 306 pp.
Trippel, E. A., M. B. Strong, J. M. Terhune and J. D. Conway. 1999. Mitigation of harbour porpoise(Phocoena phocoena) by-catch in the gillnet fishery in the lower Bay of Fundy. Canadian Jour-nal of Fisheries and Aquatic Sciences 56: 113–123.
Vitousek, P. M., H. A. Mooney, J. Lubchenco and J. M. Melillo. 1997. Human domination of Earth´secosystems. Science 277: 494–499.
Wells, P. G., P. D. Keizer, J. L. Martin, P. A. Yeats, K. M. Ellis and D. W. Johnston. 1997. The chemicalenvironment of the Bay of Fundy. Pages 37–61. In: Bay of Fundy Issues: A Scientific Overview.Proceedings of a workshop, January 29–February 1, 1996, Wolfville, NS. J. A. Percy, P. G.Wells and A. J. Evans (Eds.). Environment Canada Atlantic Region Occasional Report No. 8.Environment Canada, Atlantic Region, Environmental Conservation Branch, Sackville, NB.
Wildish, D. J., P. D. Keizer, A. J. Wilson and J. L. Martin. 1993. Seasonal changes of dissolved oxygenand plant nutrients in seawater near salmonid net pens in the macrotidal Bay of Fundy. Cana-dian Journal of Fisheries and Aquatic Sciences 50: 303–311.
Worm, B. 2000. Consumer Versus Resource Control in Rocky Shore Food Webs: Baltic Sea and NWAtlantic Ocean. Berichte aus dem Institut für Meereskunde 316. Institut für Meereskunde,Universität Kiel, Kiel. 147 pp.
Worm, B. and H. K. Lotze. 2000. Nutrient pollution, low-trophic level harvesting and cumulative hu-man impact on coastal ecosystems. Pages 40–41. In: Gulf of Maine Rockweed: Management inthe Face of Scientific Uncertainty. R.W. Rangeley and J. Davies (Eds.). Huntsman Marine Sci-ence Centre Occasional Report 00/1. Huntsman Marine Science Centre, St. Andrews, NB.
327
The Bay of Fundy Coastal Forum: “Taking the Pulse of the Bay”
TWO HUNDRED YEARS OF ECOSYSTEM CHANGE INTHE OUTER BAY OF FUNDY
PART II – A HISTORY OF CONTAMINANTS:SOURCES AND POTENTIAL IMPACTS
Inka Milewski1 and Heike K. Lotze2
1 Conservation Council of New Brunswick, Fredericton, NB. [email protected] Department of Biology, Dalhousie University, Halifax, NS. [email protected]
Introduction
The history of contaminants in the outer Bay of Fundy region follows the history of settlementand industrial development. Numerous publications have documented the history of human settlement,communities development and industrial activity in the area. An extensive bibliography of these publi-cations can be found in Harold Davis’s (1974) comprehensive history (from 1604 to 1930) of theCanadian and American communities that straddle the St. Croix River and estuary.
Beginning in the late 1700s, the rivers, estuaries and marine waters of this area were used totransport logs, harvest fish and power sawmills. As the population of the region increased and otherindustries developed, they were used as waste dumps for a wide range of activities including loggingoperations, sawmills, fish processing plants, private septic systems, municipal sewage plants, pulpmills, and, more recently, aquaculture operations (Figure 1).
This paper is an extended summary of a review of some of the major classes of contaminants(suspended solids, persistent organic pollutants (POPs), polycyclic aromatic hydrocarbons (PAHs),metals and metalloids) associated with major development activities in the Quoddy region, outer Bayof Fundy, over the past 200 years. Since not all contaminants found in this region were the result ofdirect discharges from an identifiable point source, the review also examined contaminants found insediments, water and/or organisms that were likely the result of atmospheric deposition, run-off orother non-point sources. The complete review appears in Two Hundred Years of Ecosystem and FoodWeb Changes in the Quoddy Region, Outer Bay of Fundy, a publication of the Conservation Council ofNew Brunswick (Lotze and Milewski 2002).
The list of contaminants reviewed was by no means complete. It has been estimated that 100,000-500,000 chemicals are now in regular industrial use and most have the potential to enter the marineenvironment through a variety of sources (Parrett 1998). For the purpose of the review, a contaminantwas defined as the introduction of any foreign, undesirable physical, chemical, or biological substanceinto the environment (Environment Canada 1991) and could include anything from sawdust to nutri-ents, suspended solids, pesticides, and industrial chemicals.
328
Health of the Bay of Fundy: Assessing Key Issues
Oceanographic Setting
Fresh water discharges, currents, and water circulation patterns are key parameters in character-izing the presence and concentrations of contaminants in a marine system. In the Quoddy region, achain of islands across the mouth of Passamaquoddy Bay effectively creates a ‘sea within a sea’. Threemain rivers, St. Croix, Digdequash and Magaguadavic, and many smaller rivers and streams dischargeinto Passamaquoddy Bay. Outflow from Passamaquoddy Bay is primarily through the Western Passageand to a lesser extent the Letete Passage. Ketchum and Keen (1953) estimated the flushing time for theSt. Croix Estuary at eight days, and that an additional 16 days were required for the exchange of waterin Passamaquoddy Bay with the Bay of Fundy. The flushing time for the Bay of Fundy has been esti-mated at 76 days (Ketchum and Keen 1953).
Within Passamaquoddy Bay, the surface currents move in a counterclockwise direction creatinga gyre or retention area in the centre of the Bay (Bailey 1957; Trites and Garrett 1983). Despite strongtidal currents, thermal stratification does take place in Passamaquoddy Bay (Robinson et al. 1996). TheBay is relatively shallow (an average depth of 27–30 m) and is identified as a depositional area (Loringet al. 1998). In depositional areas, suspended material is more likely to form into large fast sinkingaggregates which quickly settle to the bottom where little or no resuspension occurs after deposition(Loring et al. 1998). As for the outer Quoddy region, there is a weak clockwise gyre centered around theWolves (Figure 2).
Summary and Conclusions
Initially, the goal of this review was to link the impacts of the entire range of human activities,including contaminants, to changes in the ecosystem and food web of the region. Incorporating theecological impacts associated with exposure of animals to contaminants and subsequent changes inpopulation size and abundance, and ultimately to the food web, proved to be ambitious and, for the timebeing, impossible.
One key reason is a general lack of data, in particular long-term monitoring data, for the Quoddyregion. Unlike fisheries statistics where information on historic catch, abundance and distribution aremore readily available, long-term monitoring data on the type, amounts and distribution of contami-nants discharged from point and non-point sources are largely unavailable. This type of information isnecessary in order to examine the link between exposure to a particular contaminant and changes in thehealth or abundance of a population or species.
Moreover, demonstrating simple cause-and-effect links between exposure to a contaminant andpopulation-wide effects is difficult to do (Colborn et al. 1996; Johnston et al. 1996; Luoma 1999;Parrett 1998). Since natural populations can exhibit large year-to-year fluctuations in recruitment, it isdifficult to isolate natural changes in population abundance from pollution effects. Furthermore, as thisreview demonstrated, the concentration of contaminants in organisms were often not limited to onecompound. This fact makes interpretation of the results even more difficult because the additive,

329
The Bay of Fundy Coastal Forum: “Taking the Pulse of the Bay”
synergistic, and antagonistic effects of different contaminants must also be considered. Despite theselimitations, some general conclusions can be made about the concentration, distribution and impacts ofsome contaminants.
Large quantities of organic material (in the form of suspended solids) have been discharged inthe Passamaquoddy Bay/St. Croix Estuary over the past 200 years. A significant percentage of thesedischarges has likely remained in the area because of oceanographic conditions. An estimated threemillion tonnes of suspended solids were released into the St. Croix River from one pulp mill alone overa 60 year period. Pollution abatement measures to reduce and restrict the discharge of contaminants didnot come into force until the mid- to late-1970s. Large volumes of suspended solids are still beingdischarged into the region.
A range of chemical contaminants have been released from point and non-point sources. Thetrend over time shows decreased concentrations of some of these compounds, particularly DDT, PCBs,and dioxins, in sediments and marine organisms. PAH levels remain high in some locations and theconcentration of some metals (mercury, zinc and copper) and metalloids (selenium) are increasing inthe tissues of some marine organisms and sediments. There is renewed interest in monitoring mercurylevels.
The review identified two areas in the Quoddy Region as ‘hot spots’ where long-term habitatalteration and contamination have taken place: the St. Croix Estuary and the Letang Estuary. Theseareas have been and continue to be the focal points of considerable discharges from a wide range ofsources. Direct and indirect evidence indicates that species composition and abundances in both estuar-ies have shifted and changed (Pohle and Frost 1997; see Lotze et al. this volume; Pohle et al. 2001). Theevidence also identifies PAHs as the most significant toxic contaminant, particularly in the St. CroixEstuary.
The physical and oceanographic features of Passamaquoddy Bay (e.g., shallow, cyclonic circu-lation, stratified, and depositional) suggest that a significant portion of the large volume of organicmaterial discharged into the Bay over the past 200 years may have remained in the Bay. If this is thecase, several questions about the cumulative and long-term effects of organic enrichment on the benthiccommunity of Passamaquoddy Bay arise. Are the relatively low redox values now observed in thesediments of Passamaquoddy Bay (Wildish et al. 1999) ‘normal’ (i.e., historic background levels) or dothey reflect a modification from higher redox values to lower values as a result of two centuries of highsediment loading into the Bay?
If the benthic community in Passamaquoddy Bay has been affected by two centuries of organicenrichment, where along the pollution or benthic enrichment gradient, as proposed by Clarke and War-wick (1994) is Passamaquoddy Bay (Figure 3)? The response of marine/estuarine benthic communitiesto pollution, specifically organic enrichment, has been studied for relatively small (1–30 km2) spatialand short (1–5 years) temporal scales (Poole et al. 1977; Pearson and Rosenberg 1978; Warwick et al.1990; Clarke and Warwick 1994; Pohle and Frost 1997; Pohle et al. 2001). Larger regions such asPassamaquoddy Bay would benefit from this type of analysis as well.

330
Health of the Bay of Fundy: Assessing Key Issues
Finally, if the benthic community structure of Passamaquoddy Bay has changed (e.g., reduceddiversity) over the past 200 years, how have these changes impacted fish populations in the area? Codand pollock were known to spawn in Passamaquoddy Bay as late as the 1950s, but those spawningstocks have since disappeared from the area (Coon 1999). Passamaquoddy Bay provided vital habitatfor numerous other species such as haddock, herring, lobster, scallop, salmon, gaspereau, shad, smelt,and striped bass. The decline in fish populations began in the early 1960s and the groundfish fisherygradually dropped off to virtually nothing. After three decades of little fishing activity, and substantialimprovements in the nature and quantity of contaminants released into the Bay (more recent salmonaquaculture developments notwithstanding), those fish have not re-populated the Passamaquoddy Bayecosystem. The question is, why not? One part of the answer to these questions may well be linked tothe gradual changes that may have taken place in the benthic community structure of PassamaquoddyBay and the St. Croix Estuary over the past 200 years.
References
Bailey, W. B. 1957. Some Features of the Oceanography of the Passamaquoddy Region. MS Rep. Biol.Sta. 2. Fisheries Research Board of Canada, Atlantic Oceanographic Group, St. Andrews, NB.30 pp.
Clarke, K. R. and R. M. Warwick. 1994. Change in Marine Communities: An Approach to StatisticalAnalysis and Interpretation. National Research Council, UK. 144 pp.
Colborn, T., D. Dumanoski, and J. Peterson Myers.1996. Our Stolen Future: Are we threatening ourfertility, intelligence, and survival? A scientific detective story. Dutton, New York. 306 pp.
Coon, D. 1999. An Ecological Sketch of Some Fundy Fisheries. Conservation Council of New Bruns-wick. Fredericton, New Brunswick. 32 pp.
Davis, H. A. 1974. An International Community on the St. Croix (1604–1930). Maine Studies no. 64.University of Maine, Orono. 412 pp.
Environment Canada. 1991. The State of Canada’s Environment–1991. Ministry of Supply and Serv-ices, Ottawa, En21-54/1991E.
Johnston, P., D. Santillo, and R. Stringer. 1996. Risk assessment and reality: recognizing the limita-tions, pp. 223-239. In: Environmental Impact of Chemicals: Assessment and Control. M. D.Quint, D. Taylor, and R. Purchase (Eds.). Spec. Publ. 176, Royal Society of Chemistry, GreatBritain.
Ketchum, B. H. and D. J. Keen. 1953. The exchanges of fresh and salt waters in the Bay of Fundy andin Passamaquoddy Bay. Journal of the Fisheries Research Board of Canada 10 (3): 97–124.
Loring, D. H., T. G. Milligan, D. E. Willis and K. S. Saunders. 1998. Metallic and Organic Contami-nants in Sediments of the St. Croix Estuary and Passamaquoddy Bay. Canadian Technical Re-port of Fisheries and Aquatic Sciences 2245. Department of Fisheries and Oceans, Dartmouth,NS. 44 pp.
331
The Bay of Fundy Coastal Forum: “Taking the Pulse of the Bay”
Lotze H. K. and I. Milewski. 2002. Two Hundred Years of Ecosystem and Food Web Changes in theQuoddy Region, Outer Bay of Fundy. Conservation Council of New Brunswick, Fredericton,NB. 188 pp.
Luoma, S. N. 1999. Emerging contaminant issues from an ecological perspective In: U.S. GeologicalSurvey Toxic Substances Hydrology Program, Proceedings of the Technical Meeting, Charleston,South Carolina, March 8-12, 1999. US Geological Survey Water Resources Investigations Re-port 99-4018B, Vol. 2 of 3.
Parrett, A. 1998. Pollution Impacts on North Sea Fish Stocks. Prepared on behalf of the EuropeanCommission, DG XIV - Fisheries. World Wildlife Fund–UK, Surrey, England. 122 pp.
Pearson, T. H. and R. Rosenberg. 1978. Macrobenthic succession in relation to organic enrichment andpollution of the marine environment. Oceanography and Marine Biology Annual Review 16:229–311.
Pohle, G., B. Frost and R. Findlay. 2001. Assessment of regional benthic impact of salmon mariculturewithin the Letang Inlet, Bay of Fundy. ICES Journal of Marine Science 58: 417–426.
Pohle, G. and B. Frost. 1997. Establishment of Standard Benthic Monitoring Sites to Assess Long-termEcological Modification and Provide Predictive Sequence of Benthic Communities in the InnerBay of Fundy, New Brunswick. Huntsman Marine Science Centre, St. Andrews, NB. 119 pp.
Poole, N. J., R. J. Parkes and D. J. Wildish. 1977. Reaction of estuarine ecosystem to effluent from pulpand paper industry. Helgolander wiss. Meeresunters. 30: 622–632.
Robinson, S. M. C., J. D. Martin, F. H. Page and R. Losier. 1996. Temperature and Salinity Character-istics of Passamaquoddy Bay and Approaches Between 1990 and 1995. Canadian TechnicalReport of Fisheries and Aquatic Sciences 2139. Department of Fisheries and Oceans, St. An-drews, NB. 56 pp.
Trites R. W. and C. J. R. Garrett. 1983. Physical oceanography of the Quoddy Region. Pages 9–34. In:Marine and Coastal Systems of the Quoddy Region, New Brunswick, M. L. H. Thomas, Ed.Department of Fisheries and Oceans, Ottawa.
Warwick, R. M,, H. M. Platt, K. R. Clarke, J. Agard and J. Gobin. 1990. Analysis of macrobenthic andmeiobenthic community structure in relation to pollution and disturbance in Hamilton Harbour,Bermuda. Journal of Experimental Marine Biology and Ecology 138: 119–142.
Wildish, D. J., H. M. Akagi, N. Hamilton and B. T. Hargrave. 1999. A Recommended Method forMonitoring Sediments to Detect Organic Enrichment from Mariculture in the Bay of Fundy.Canadian Technical Report of Fisheries and Aquatic Sciences 2286. Department of Fisheriesand Oceans, St. Andrews, NB. 31 pp.
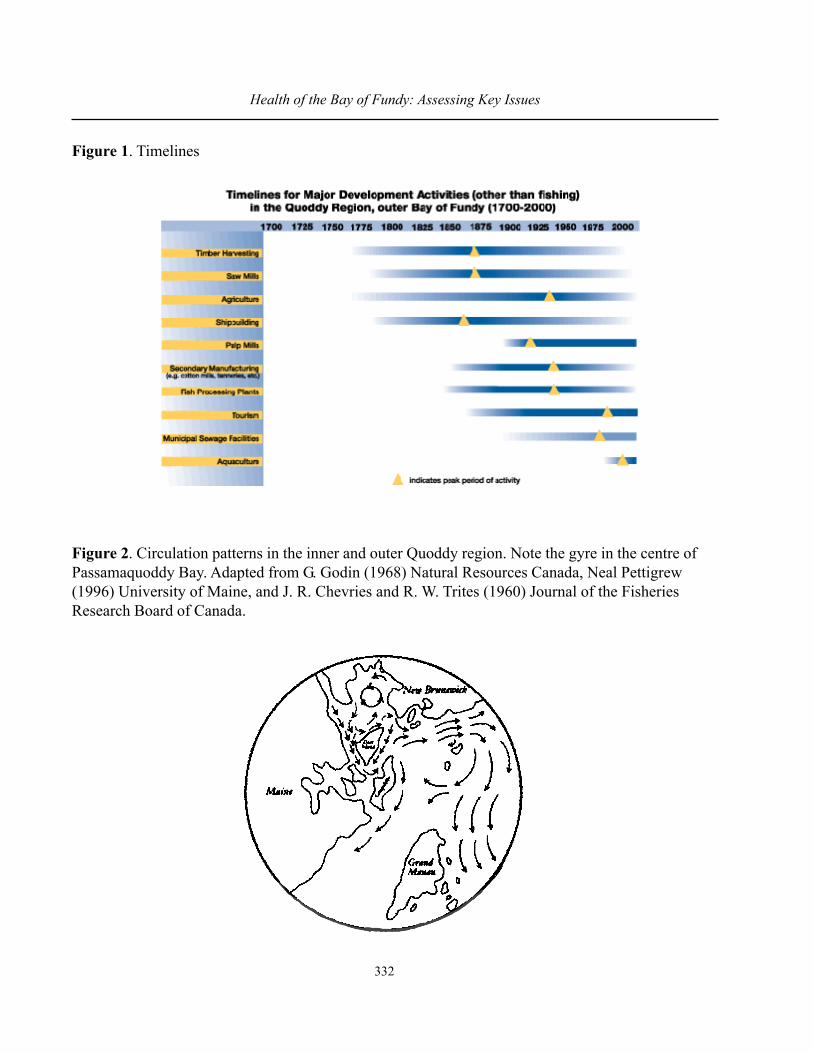
332
Health of the Bay of Fundy: Assessing Key Issues
Figure 1. Timelines
Figure 2. Circulation patterns in the inner and outer Quoddy region. Note the gyre in the centre ofPassamaquoddy Bay. Adapted from G. Godin (1968) Natural Resources Canada, Neal Pettigrew(1996) University of Maine, and J. R. Chevries and R. W. Trites (1960) Journal of the FisheriesResearch Board of Canada.

333
The Bay of Fundy Coastal Forum: “Taking the Pulse of the Bay”
Figure 3. Influence of enrichment on diversity as proposed by Clarke and Warwick (1994). Wherealong the enrichment gradient is Passamaquoddy Bay today?

334
Health of the Bay of Fundy: Assessing Key Issues

335
Poster Session
Poster Session

336
Health of the Bay of Fundy: Assessing Key Issues

337
Poster Session
A. ORGANIZATIONS
GLOBAL PROGRAMME OF ACTION COALITION FORTHE GULF OF MAINE
Janice Harvey
Conservation Council of New Brunswick, Waweig, NB. [email protected]
The Global Programme of Action Coaliton for the Gulf of Maine has instituted a two-yearbottom-up process to assess the state of health of the Gulf of Maine. In 2002, a series of watershed andcoastal forums will be held to produce local “state of” assessments. In 2003, a major Gulf of Mainesummit will pull together local reports and add to these to create a status report on the overall Gulfecosystem. This poster explains this process and how people can get involved.
338
Health of the Bay of Fundy: Assessing Key Issues
SALT MARSH AND RESTRICTED TIDAL SYSTEMS –A BOFEP WORKING GROUP
Zsofi Koller
Conservation Council of New Brunswick, Fredericton, NB. [email protected]
The BoFEP Working Group for Salt Marsh and Restricted Tidal Systems (SMaRTS) aims toadvance knowledge, science, and action on behalf of the Bay of Fundy to mitigate growing concernsabout the impacts of tidal barriers and salt marsh habitat loss. SMaRTS will achieve this goal througha plan to define and prioritize research goals and monitoring needs, and by developing a genuine valu-ation system for coastal, estuarine and wetland landscapes. SMaRTS is compromised of scientists,government employees, non-governmental organizations and concerned citizens working together toreduce the impact of tidal barriers and increase healthy salt marsh. SMaRTS’ mandate, terms of refer-ence, current on-going projects, and future goals should be expressed for open communication withinthe Bay of Fundy community.
339
Poster Session
CANADIAN CLIMATE IMPACTS AND ADAPTATION RESEARCHNETWORK (C-CIARN) ATLANTIC
Kyle McKenzie
Canadian Climate Impacts and Adaptation Research Network, Halifax, NS. [email protected]
C-CIARN Atlantic is the Atlantic region of the Canadian Climate Impacts and Adaptation Re-search Network (C-CIARN). Through this network, researchers and stakeholders will have a chance tointeract with each other, determine research priorities, contribute to the understanding of the potentialimpacts of climate change on the Atlantic provinces, and develop adaptation strategies.
While not a funding agency itself, C-CIARN Atlantic can assist researchers and stakeholdergroups find appropriate funding for their impacts and adaptation projects. Funding opportunities willbe listed on the website, as they become known. C-CIARN Atlantic may be able to assist members intravelling to impacts and adaptation related events in the Atlantic provinces.
C-CIARN Atlantic organizes an annual climate change impacts and adaptation workshop. Thisevent allows researchers, stakeholders, and policy makers from around the region to gather to discussthe issues that are important to this region. An important component of the workshop will be identify-ing knowledge gaps to help direct future research.
Joining the network is easy and free. Just go to the C-CIARN Atlantic website <http://atlantic.c-ciarn.ca> and click on “Join” under “The Network”. A form will allow you to choose as many nodes asyou care to participate in. Joining the network will help C-CIARN keep in touch with you, such as by e-mail when the website is updated. It will also facilitate networking among members interesting incontacting others with related interests or needs.

340
Health of the Bay of Fundy: Assessing Key Issues
THE BAY OF FUNDY ECOSYSTEM PARTNERSHIP (BOFEP)
Jon Percy1, Graham Daborn2 and Peter G. Wells3
1 Sea Pen Communication, Granville Ferry, NS. [email protected] Acadia Centre for Estuarine Research, Acadia University, Wolfville, NS.
[email protected] Environment Canada, Dartmouth, NS. [email protected]
The Bay of Fundy is a productive and diverse coastal ecosystem, rich in renewable resources.However, there are worrisome indications that all is not well with the Bay. Species and habitats are atrisk, and the sustainable use of living resources is being increasingly compromised. Sustaining a healthyecosystem requires co-operation among scientists, resource managers, business interests, resource us-ers and residents of coastal communities. The Bay of Fundy Ecosystem Partnership (BoFEP) was es-tablished to foster such co-operative efforts. It is comprised of individuals and groups committed topromoting the acquisition of knowledge about the coastal ecosystems of the region, as well as environ-mental conservation, sustainable resource use and integrated management in the Bay and its watershed.BoFEP sponsors the Biennial Bay of Fundy Science Workshops to review progress in our knowledge ofthe Bay’s ecosystems, to identify problems confronting them and to work towards finding solutions.Several Working Groups, dedicated to specific topics or issues, promote communication, co-operationand joint action among interested partners. BoFEP produces a variety of publications such as workshopproceedings, bibliographies, informative brochures and the Fundy Issues Series of fact sheets that re-view ecological processes and environmental issues in the Bay. A comprehensive website <http://www.auracom.com/~bofep> provides information about BoFEP and its activities, proceedings of itscommittees and working groups, copies of its publications, news from around the Bay, and links toinformation about the Bay of Fundy.
341
Poster Session
MARINE INVERTEBRATE DIVERSITY INITIATIVE (MIDI)
Jayne Roma1, Peter G. Wells2 and Derek Davis3
1 MIDI Society, Dartmouth, NS2 Environment Canada, Dartmouth, NS. [email protected]
3 MIDI, Nova Scotia Museum of Natural History, Halifax, NS. [email protected]
The Marine Invertebrate Diversity Initiative (MIDI) is producing a standard reference in theform of an interactive, on-line database of marine invertebrates of the Scotian Shelf, Bay of Fundy andGulf of Maine (<http://www.fundyforum.com/MIDI>). Its ultimate goal is to “increase our knowledgeof marine invertebrate biodiversity, and thereby to engage the widest possible audience in learning,conserving and caring more about the biodiversity of our oceans.” This project was initiated to remedythe lack of commonly accessible and comprehensive information on marine invertebrate biodiversityin eastern Canada and the Gulf of Maine, as well as to incorporate knowledge of marine invertebratesfully into the management of human activities affecting marine habitats and resources.
The MIDI structure consists of five inter-linked databases for species, habitat, location, photoand reference data. It is an interactive system, meaning that users can both extract and contribute infor-mation. In this manner, the information available through MIDI will always be current. The MIDIwebsite also includes a message board where users may post messages or photos, create discussions,and ask or answer questions.
MIDI has several applications to assessing the health of the Bay of Fundy’s ecosystems, includ-ing the Minas Basin, living resources and coastal communities. All types of marine invertebrate data(species descriptions, photos, location, habitat and references) can be entered into the MIDI on-linedatabase and be viewed and shared by a broad audience.

342
Health of the Bay of Fundy: Assessing Key Issues
CURRENT ACTIVITIES OF THE COROPHIUM WORKING GROUP (BOFEP)IN THE UPPER BAY OF FUNDY
Peter G.Wells1, Diana Hamilton2, Myriam Barbeau2, Peter Hicklin3, Michael Brylinsky4,and Graham Daborn4,
on behalf of Members of the Working Group
1 Environment Canada, Dartmouth, NS. [email protected] Department of Biology, University of New Brunswick, Fredericton, NB.
[email protected] and [email protected] Canadian Wildlife Service, Sackville, NB. [email protected]
4 Acadia Centre for Estuarine Research, Acadia University, Wolfville, NS.mike. [email protected] and [email protected]
The Corophium Working Group, formed in 1997, functions as an active, research-oriented group,focussing on the biology and ecology of the amphipod, Corophium volutator, on the mudflats in theupper Bay of Fundy. Of particular importance are studies of factors controlling the abundance anddistribution of Corophium on different mudflats. Several studies of the group have addressed this.Hamilton’s studies have elucidated some of the primary factors of nutrients and inter-specific competi-tion controlling numbers, conducting enclosure studies at Avonport Beach, and collecting at variousbeaches. Research by Barbeau has concentrated on the population dynamics of Corophium seasonallyat a number of beaches on both sides of the Bay. Hicklin continues yearly sampling and studies inShepody Bay in association with the predation by migratory shorebirds. Other studies continue on theecology, ecophysiology, parasitology and genetics of this amphipod, largely centred at the Acadia Cen-tre for Estuarine Research. The Group maintains a bibliography and collection of key literature to aidstudies and encourages student theses (honours to doctorate) on various topics. The group meets onceor twice a year to discuss findings and plan joint projects. Interested investigators are welcome to jointhis continuing interdisciplinary group.
343
Poster Session
B. PROJECTS
A MULTIDISCIPLINARY APPROACH WITH THE INTEGRATION OFTHREE TROPHIC LEVELS (FISH/SHELLFISH/SEAWEED) FOR THE
DEVELOPMENT OF SUSTAINABLE AQUACULTURE SYSTEMS
Susan Bastarache1, Thierry Chopin1, Shawn Robinson2, Terralynn Lander2,Bruce MacDonald3, Katsuji Haya2, Dawn Sephton2, Jennifer Martin2, Frederick Page2
and Ian Stewart4
1 Centre for Coastal Studies and Aquaculture and Centre for Environmental and Molecular AlgalResearch, University of New Brunswick, Saint John, NB. [email protected]
2 Department of Fisheries and Oceans, St. Andrews, NB.3 University of New Brunswick, Centre for Coastal Studies and Aquaculture, Saint John, NB.
4 Atlantic Silver Inc., St. George, NB.
As present monospecific aquaculture operations in North America and other parts of the worldare at environmental, economic and social crossroads, common sense suggests integrating differenttypes of aquaculture to develop responsible practices, optimizing the efficiency of aquaculture systemsand diversifying the industry, while maintaining the health of coastal waters through the understandingof their assimilative capacities. Nutrification of coastal waters is becoming a pressing issue worldwide,and the contribution of the organic and inorganic outputs of aquaculture to significant regional nutrientloading is becoming more widely recognized. To avoid pronounced shifts in coastal processes, a bal-anced ecosystem approach requires that fed aquaculture (finfish) be integrated with organic and inor-ganic extractive aquaculture (shellfish and seaweed). Such a bioremediative approach provides mutualbenefits to co-cultured organisms, economic diversification by producing other value-added marinecrops, increased profitability per cultivation unit, and cost-effective means for reaching effluent regula-tion compliance by reducing the internalization of the total environmental costs.
The present project is conducting research at an industrial pilot scale at a site in PassamaquoddyBay, Bay of Fundy. Salmon, mussels, and kelp are being grown together to develop an integratedaquaculture model and train students and professionals in this innovative approach to aquaculture. Theproductivity and role of each component (fish, shellfish and seaweed) is being analyzed so that theappropriate proportions of each of them can be defined in order to develop a sustainable system inwhich metabolic processes counter-balance each other within acceptable operational limits and accord-ing to food safety guidelines and regulations. The ultimate goal of this project is to transfer this modelto other sites and to make it a concept transferable to other aquaculture systems. The Canadian fishaquaculture industry is obviously here to stay in our “coastal scape”: it has its place in the globalseafood supply and demand, and in the economy of coastal communities. To help ensure its sustainability,it needs, however, to responsibly change its too often monotrophic practices by adopting polytrophicones to find increasing environmental, economic and social acceptability, and become better integratedinto a broader coastal management framework.

344
Health of the Bay of Fundy: Assessing Key Issues
CHANGES IN BIOLOGICAL PRODUCTIVITY INDUCED BY BARRIERS ONMACRO-TIDAL SYSTEMS: A STUDY OF THE WINDSOR CAUSEWAY AND
ASSOCIATED SALT MARSHES
Tony M. Bowron
School for Resource and Environmental Studies, Dalhousie University, Halifax, [email protected]
“… it must be confusing to dwell beside a river that runs one way and then the other, and then van-ishes altogether.” Charles Dudley Warner (Board of Trade 1909)
Introduction
This project looks at the type and range of ecological changes induced by tidal barriers, specifi-cally in the Avon River system in northwestern Nova Scotia (NS). It draws on experiences elsewhere inAtlantic Canada and the Gulf of Maine to develop indicators of ecological change. These indicatorswill be utilized to gain a better understanding of the ecological changes that have occurred in the AvonRiver system as a result of causeway construction. One indicator, changes in the extent and location ofsalt marsh habitat, will be examined in detail.
The study will help to determine how the construction of the Windsor Causeway in 1970 af-fected the extent, distribution and productivity of Spartina alterniflora dominated salt marsh habitat inthe Avon River system. Consideration will also be given to the potential impact of the proposed cause-way expansion on current
Background
The productivity of salt marshes and tidal rivers in the upper Bay of Fundy (BoF) represents asignificant contribution to the health and well being of the Greater Gulf of Maine ecosystem,providing important ecological services, food and habitat for a wide range of marine and terrestrialspecies and are a major source of food material for the marine ecosystem.
However, over the last 350 years human activities in the upper BoF have led to a significantreduction in the amount of salt marsh and free-flowing tidal river habitat. Many of these activities areof historical and social significance; however, the loss of habitat, productivity and species as result ofthe construction of modern tidal barriers (roads and causeways) also has significant ecological implica-tions and is both preventable and repairable.

345
Poster Session
Tidal Barriers
Tidal barriers are obstructions constructed in or across a tidal body (salt marsh, tidal river orestuary) that change the tidal flow in all or part of the water body, both above and below the obstruction(Wells 1999). Tidal barriers and activities that have led to the alteration and loss of salt marsh and tidalriver habitat around the BoF include dykes, dams, ditches, wharfs, breakwaters, railways, roads andcauseways (with bridges, culverts and dams which are often improperly sized or placed). The known orsuspected range of ecological changes induced by tidal barriers include:
• reduction in the length of tidal rivers;• change in freshwater discharge;• reduction or prevention of the movement of salt water upstream;• change, often severe, in hydroperiod, sedimentation and erosion;• alteration of flood pattern and potential increased flood risk;• reduction of open salt marsh habitat;• reduction of nutrient transfer (exchange) to the estuary; and• restriction or prevention of the movement (migration) of fish, invertebrates and other wild-
life (Wells 1999; Neckles and Dionne 1999).
Study Site
The Avon River, known at the time of European settlement as Pessyquid (Pisiquid), a Micmacword meaning “flowing squarely into the sea”, is situated in the north western portion of Hants County,Nova Scotia. It is a small river with a big estuary which flows into the Bay of Fundy’s Minas Basin. Arock-filled causeway was constructed across the Avon River in 1970, connecting Windsor and Falmouth.Where once the influence of the tides was felt as far upstream as Moses Mountain, today tidal flowstops at the causeway. A tidal gate, operated by the Nova Scotia Department of Agriculture and Fisher-ies, is manipulated to control water levels upstream in the head pond and river. Following construction,rapid accretion of sediment downstream of the causeway has resulted in the development of a mudflatthat stretches more than 9 km downstream. A developing salt marsh (predominately of S. alterniflora)is clearly visible today on the portion of the mudflat immediately adjacent to the causeway.
Objectives
This project will identify the indicators that signal ecological change in a macro-tidal systemfollowing the construction of a major tidal barrier. The goal is the application of these indicators to theAvon River system in order to assess the extent of change that can be attributed to the construction andcontinued operation of the Windsor Causeway, with a focus on the changes in distribution and size ofsalt marshes both upstream and downstream of the causeway. It will also estimate the changes biologi-cal productivity (based on amount of S. alterniflora dominant habitat) of the Avon River system over

346
Health of the Bay of Fundy: Assessing Key Issues
time due to the construction of the Windsor Causeway and how the system would potentially respond tothe planned expansion of the causeway.
Approach
The assessment of changes in the selected indicators in the Avon River system will encompassfive steps:
1. strategic review of the available ecological information on the observed changes caused bytidal barriers elsewhere in the BoF and Gulf of Maine and methodologies for assessment ofthese changes;
2. analysis of historical information (particularly the interpretation and analysis of air photo-graphs) available for the Avon River system both prior to and following causeway construc-tion;
3. field verification of information and findings;4. focussed analysis of the changes in size and distribution of S. alterniflora dominated salt
marsh habitat over time; and5. calculation of changes in productivity of available salt marsh habitat over time and ex-
trapolation of these to predict impacts of future causeway expansion.
Benefit
The study will contribute to the growing body of literature on the range of ecological changesthat may be induced by tidal barriers on macro-tidal systems. It will help to form a picture of thechanges, particularly in salt marsh abundance, location and productivity that have occurred in the AvonRiver system over time and as result of causeway construction. Plus, provide information on appropri-ate indicators of ecological change.
Progress
The project is currently in the early stage of literature review, development and testing of meth-odology and data collection. All available air photographs spanning the Avon River from Hantsport(downstream) to Moses Mountain (upstream) from the last 80 years are being collected. These will bedigitized and a time series of composite maps of the river will be produced. From these, it will bepossible to interpret and analyze the changes that have occurred.
References
Board of Trade. 1909. Windsor-on-Avon. Windsor, Nova Scotia. Dedicated to History, Literature andCommerce. Printed by the Windsor Tribune Publishing Company Limited. Windsor, Nova Scotia.
347
Poster Session
Neckles, H. and Dionne, M. (eds.) 1999. Regional Standards to Identify and Evaluate Tidal WetlandRestoration in the Gulf of Maine. A GPAC Workshop. Wells National Estuarine Research Re-serve, Wells, ME.
Wells, P. G. 1999. Environmental Impact of Barriers on Rivers Entering the Bay of Fundy: Report of anad hoc Environment Canada Working Group. Technical Report Series No. 334, Canadian Wild-life Service, Ottawa, ON.
348
Health of the Bay of Fundy: Assessing Key Issues
IDENTIFICATION OF SENSITIVE MARINE AND COASTAL AREAS IN THEBAY OF FUNDY, GULF OF MAINE, CANADA
Maria-Ines Buzeta, Rabindra Singh and Sharon Young-Lai
Department of Fisheries and Oceans, Biological Station, St.Andrews, NB. [email protected]
This document presents a summary of sensitive1 marine and coastal areas in the Bay of Fundy,as defined by their ecological sensitivity, high biodiversity, ecological, educational or scientific impor-tance, or their social or spiritual value. With the many pressures on our ecosystem, it is essential toidentify these areas and ascertain those that may require special protection or that may require immedi-ate attention.
The identification of these important sites can provide some of the groundwork towards plansfor integrated management areas and a system of marine protected areas (MPA), following the criteriaset out in Canada’s Oceans Act. Upon a recommendation from stakeholders, the document provides alist of potential MPA sites in order to bring them to the “table” for discussion.
Sensitive1 sites were identified through scientific literature, or suggested by experts and com-munities. Effort has been made to include local or traditional knowledge, along with scientific data,through a series of workshops. Many communities and local experts are yet to participate, however, theauthors feel that discussion should begin on the information collected so far. Also, it is hoped that thisdocument will promote more participation, and be seen as the first of a series of updates that willcontinue to include more scientific data and public knowledge.
The report contains a summary of existing information for each site presented as a series ofmaps. Also included are the results of information gathered during workshops held with communitiesand experts.
1Sensitive areas—This term is used to summarize the reasons associated with the scientific, social,economic or spiritual importance that people impart to areas of the sea.
349
Poster Session
PREDICTING MERCURY ABUNDANCES IN NORTHEASTERN NORTHAMERICAN FRESHWATERS USING GIS APPROACHES:
FROM LOCAL TO REGIONAL PERSPECTIVES
Thomas A. Clair1, Fan Rui Meng2, Paul Arp2, and David Evers3
1 Environment Canada, Atlantic Region, Sackville, NB.2 Faculty of Forestry, University of New Brunswick, Fredericton, NB.
3 Biodiversity Research Institute, Falmouth, ME 04105, USA
Though ubiquitous in freshwater environments, mercury (Hg) is not evenly distributed in water,sediments or biota. In this paper, we show that freshwater Hg concentrations in lakes and streams ofsouthwestern Nova Scotia can be predicted by knowing their basins’ geographical conditions. We de-velop a model which predicts annual total Hg (Hgt) and summer methyl mercury (MeHg+) concentra-tions in water, using basin and local wetness indices (calculated from abundances of flat areas creatingconditions for wetlands), slope, and the maximum summer sunlight irradiance index. In winter, MeHg+
is not generated in these basins and is found only at a low baseline level. The approach we developedfor water is now being modified to apply it to biota and sediments. The method, which we developed inNova Scotia, is now also being adapted to the whole of northeastern North America under a grantmanaged by the USDA and the Hubbards Brook Foundation. We have begun building a large regionaldatabase of water, sediment and biota data, which will be assessed using geographic information sys-tem (GIS) approaches in the upcoming year. In this presentation, we provide the data and organiza-tional framework for this large-scale approach.

350
Health of the Bay of Fundy: Assessing Key Issues
PRELIMINARY RESULTS OF A STUDY ON THE PREVALENCE ANDBIOACCUMULATION OF METHYL MERCURY IN THE FOOD WEB
OF THE BAY OF FUNDY, GULF OF MAINE
John Dalziel, Gareth Harding and Peter Vass
Marine Environmental Science Division, Bedford Institute of Oceanography, Dartmouth, [email protected]
Mercury enters the East Coast marine environment from many sources, most notably fromlong-range atmospheric transport, land runoff or river discharge, oceanic currents and migrating organ-isms. As a priority toxic substance, mercury, especially its methylated form, is of concern due to itspersistence, high toxicity, known bioaccumulation and biomagnification and suspected effects on thegenetic, developmental and reproduction of aquatic organisms. Despite infamous pollution events ofprevious decades, such as occurred in Minimata Bay, Japan, where people were poisoned by mercury inshellfish, little is known comprehensively about the fate of mercury in coastal marine ecosystems.
There is evidence in the Maritimes that our loon, which spends its life as a juvenile in coastalmarine waters and subsequently overwinters there as adults, has body mercury burdens well aboveinland populations. More recently, it has been reported from a joint United States-Canada, Gulf ofMaine-Bay of Fundy Mussel Watch Program that greater than 80% of the 56 study sites had mercurylevels exceeding the US National Status and Trends median values.
Our overall research objectives are to:
1. Assess the bioaccumulation of methyl mercury at various trophic levels in the pelagic anddemersal food webs of an East Coast, marine coastal ecosystem.
2. Assess the seasonal variation of methyl mercury in this ecosystem to better understand itsdynamics.
3. Create a preliminary budget for methyl mercury in an East Coast marine embayment byquantifying the various inputs, outputs and sinks for the system.
4. Model methyl mercury dynamics in the Bay of Fundy as an east coast marine embaymentcooperatively with Simon Fraser University (Frank Gobas and Elsie Sunderland).
Preliminary results support the hypothesis that methyl mercury is bioaccumulated in the pelagicfood chain. Methyl mercury levels consistently increase from phytoplankton (63:m; 0.33 ± 0.58 :g/gWet) to zooplankton (500 :m; 0.6 ± 0.6 :g/gWet) to macrozooplankton (2.0 mm; 1.4 ± 1.5 :g/gWet)to krill (8.0 mm; 4.4 ± 2.3 :g/gWet) to pelagic fish (herring; 24.6 ± 19.2 :g/gWet) to large pelagic fish(bluefin tuna; 726 ± 157 :g/gWet).

351
Poster Session
A study such as proposed here is a first step in determining whether current mercury levels arehigh enough to harm marine organisms or their consumers. This study will provide valuable insightsinto mercury biomagnification in a coastal ecosystem, and together with the integrated food-chain-contaminant modelling with our collaborators, should establish the basis for risk assessment of mer-cury in the marine coastal zone.

352
Health of the Bay of Fundy: Assessing Key Issues
MODELLING SALT MARSH SEDIMENTATION,SEDIMENT ACCRETION RATES AND SEDIMENT BUDGETS FOR
THREE DISTINCT MARSH GEOMETRIES
Marie-Therese Graf
Department of Geography, McGill University, Montreal, PQ. [email protected]
How does the shape of a salt marsh affect its response to changing sedimentation and erosionregimes? Detailed studies of processes of sedimentation and erosion and measurements of salt marshaccretion rates are two ways in which insight is gained into the functioning of these dynamic landforms. The purpose of this study was to develop a model which could realistically recreate salt marshsedimentation rates on an ‘individual tide’ time scale, and then use these rates to model sedimentbudgets of salt marshes over the time scale of centuries. The sedimentation model was calibrated usingtidal sedimentation data collected by van Proosdij et al. (2000) at Allen Creek Marsh and validatedagainst measurements made by Chmura et al. (2001) at Wood Point Marsh, directly adjacent to AllenCreek marsh. Sediment budgets were then modelled for three hypothetical marshes of identical volumebut with distinctly different areal geometries and hence, different deposition and erosion rates. Resultssuggest that long narrow bands of marsh with long open coastlines exposed to wave activity (i.e., thoseoften found seaward of dykes) may experience more rapid sediment loss by erosion than marshes thatextend farther inland and have only short open coastlines (i.e., those found in estuaries). The process ofselecting suitable sites for salt marsh restoration efforts could benefit from considering marsh geometrysince this may minimize seaward edge erosion upon dyke removal, thus increasing the chances ofsuccessful restoration.
References
Chmura, G. L., A. Coffey and R. Crago. 2001. Variation in surface sediment deposition in the Bay ofFundy. Journal of Coastal Research, 17(1): 221–227.
Van Proosdij, D., J. Ollerhead and R. G. D. Davidson-Arnott. 2000. Controls on suspended sedimentdeposition over single tidal cycles in a macrotidal salt marsh, Bay of Fundy, Canada. GeologicalSociety Special Publication No. 175. pp. 42–57.
353
Poster Session
UNINTENTIONAL USE OF ORGANIC CONTAMINANTS INAQUACULTURE AND IMPACT ON SEDIMENTS
Joceylne Hellou1, 2, Katsuji Haya3, Les Burridge3 and Sean Steller1
1 Marine Environmental Sciences Division, Fisheries and Oceans Canada, Halifax, [email protected]
2 Dalhousie University, Chemistry Department, Halifax, NS.3 St. Andrews Biological Station, St. Andrews, NB.
The offshore fisheries industry and land-based products are used in feed required by the inshoreaquaculture. Contaminants’ concentrations in feed will vary according to the type and origin of thecomponents being used (Frank et al. 1993; Hietaniemi and Kumpulainen 1994; Lodovici et al. 1995).One ingredient that could be of concern because it is rich in lipids and therefore would contain li-pophilic contaminants, is fish oil. Since salmon aquaculture is prospering in New Brunswick, the fateof unintentionally used non-polar organic contaminants and their deposition around cages was of inter-est in the present study. Commercial food pellets, fish oil used as an ingredient in feed, and sedimentscollected around cages in 1998 and 1999 were analyzed for three groups of priority contaminants,namely polycylic aromatic hydrocarbons (PAHs), polychlorinated biphenyls (PCBs) and pesticides,including the DDT family. In 1998, sampling was done directly under the cages and 25 m away, whilein 1999, sampling was extended further, going from 0 and 25 m to 50 and 100 m away from the centreof the cages. In most cases, sampling was done in the direction of the currents, but on one occasion,collection was done in a perpendicular direction to the currents. A remediated site was also examined.
In general terms, PAHs were more abundant than PCBs and pesticides in all sediments. Withinthe PAH group, alkylated naphthalenes (aNA) were detected in food pellets (25–51 ng/g, per aNA), fishoil (116–180 ng/g, per aNA) and sediments (<1–45 ng/g, dry, per aNA), where five compounds werepredominant. A large number of parental PAHs were detected at variable levels in sediments only (e.g.,23–1605 ng/g, dry for pyrene). The signature of PAHs observed in feed was not identical to that insediments, reflecting additional or different sources of alkylated PAHs in the aquaculture environment.Local combustion sources depositing in sediments could be deduced from examining the ratio of vari-ous PAHs in comparison to published data (Hellou et al. 2002). Some PCB congeners and p,p’-DDEwere also detected at low levels in all samples. Our analytical approach was changed from somewhatmore conventional gas chromatography-mass spectrometry (GC-MS) in the electron impact (EI) modeto GC-MS in the negative chemical ionisation (NCI) mode. This provided an improvement in thedetection limits, from nearly 1,000 pg/g to 10 pg/g, for the congeners with more than four chlorineatoms. Therefore more data were obtained to interpret geographical and temporal variability. However,as observed with the PAHs, the PCB profile displayed in feed and oil was not identical to that deter-mined in sediments, indicating a local background. The concentration of many organochlorine pesti-cides, except mainly for p,p’-DDE, were below detection limits using GC-MS-EI (<1 ng/g).

354
Health of the Bay of Fundy: Assessing Key Issues
Trends were observed during the first year of sediment sampling, with up to 6–8 times higherorganic carbon content (OC) and levels of PCBs and p,p’-DDE below the cages relative to 25 m away(Figure 1). During 1999 vs 1998 and therefore longer use of the sites, levels of p,p’-DDE and PCBswere somewhat reduced under the cages but detected up to 100m away from the cages (<1.8 vs <7 ng/g, dry, for p,p’-DDE and <1 vs <4 ng/g, dry, per PCB congener, 1999 vs 1998).
Three different types of sites were examined. Contaminants’ results agreed with the classifica-tion of the sites done by the province of New Brunswick (Burridge et al. 1999). Sites rated as A hadlower levels of contaminants around the cages than B and than C sites. Comparing sediment concentra-tions to those of other locations around the world indicated background levels for organochlorine com-pounds. However, variable and sometimes high concentrations, in the range of those observed in urbanisedharbours were obtained for PAHs (Hellou et al. In Preparation). This latter observation would raisequestions about the effect of the environment on salmon aquaculture and marine organisms living in thearea. This study was continued with sampling at many of the same locations during summer 2000 toexamine the fate of contaminants with longer use of the sites. Analyses of samples and interpretation ofresults is still ongoing.
The authors believe that it is important to determine if environmental changes are associatedwith the development of this new component of the aquatic food chain, to address the no net lossprovision of the Fisheries Act.
Acknowledgements
Funding from the Environmental Sciences Strategic Research Fund (1999-2002) of the Depart-ment of Fisheries and Oceans is acknowledged.
References
Burridge, L.E., K. Doe, K. Haya, P. M. Jackman, G. Lindsay, and V. Zitko. 1999. Chemical analyses andtoxicity tests on sediments under salmon net pens in the Bay of Fundy. Canadian TechnicalReport on Fisheries and Aquatic Sciences 2291, 12pp.
Frank, R., H. E. Braun and B. Thorpe. 1993. Comparison of DDE and PCB residue in the general dietand in human blood, Ontario 1986-87. Bulletin of Environmental Contamination and Toxicol-ogy 51: 146–152.
Hellou, J., S. Steller, V. Zitko, J. Leonard, T. King, T. Milligan, and P. Yeats. 2002. Distribution of PAHsin surficial sediments and bioavailability to mussels, Mytilus edulis, of Halifax Harbour. Ma-rine Environmental Research 53: 327–356.
Hellou, J., S. Steller, L. E. Burridge, and K. Haya. In preparation. Unintentionally used organic con-taminants in aquaculture and their fate in sediments.
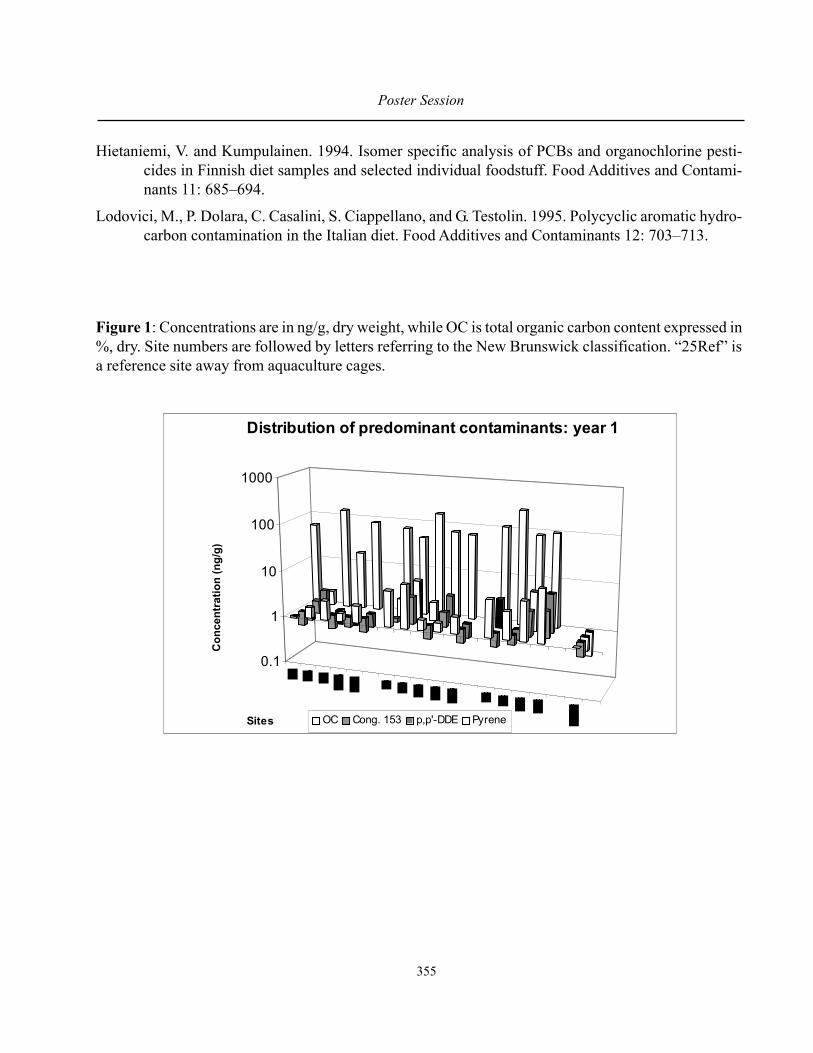
355
Poster Session
Hietaniemi, V. and Kumpulainen. 1994. Isomer specific analysis of PCBs and organochlorine pesti-cides in Finnish diet samples and selected individual foodstuff. Food Additives and Contami-nants 11: 685–694.
Lodovici, M., P. Dolara, C. Casalini, S. Ciappellano, and G. Testolin. 1995. Polycyclic aromatic hydro-carbon contamination in the Italian diet. Food Additives and Contaminants 12: 703–713.
Figure 1: Concentrations are in ng/g, dry weight, while OC is total organic carbon content expressed in%, dry. Site numbers are followed by letters referring to the New Brunswick classification. “25Ref” isa reference site away from aquaculture cages.
0.1
1
10
100
1000
Con
cent
ratio
n (n
g/g)
Sites
Distribution of predominant contaminants: year 1
OC Cong. 153 p,p'-DDE Pyrene
356
Health of the Bay of Fundy: Assessing Key Issues
AUDIT OF TIDAL BARRIERS IN THE CUMBERLAND BASIN ANDMEMRAMCOOK RIVER IN THE UPPER BAY OF FUNDY, 2001
Zsofi Koller
Conservation Council of New Brunswick, Fredericton, NB. [email protected]
Tidal barriers in the Bay of Fundy have long been recognized as a serious environmental prob-lem. To address this problem, it is useful to establish base-line information regarding the location andseverity of the small to medium-sized tidal barriers in the Bay. 2001 was the second field season of atidal barrier audit, initiated by the Conservation Council of New Brunswick and Environment Canada.The Cumberland Basin and Memramcook River systems comprised the study area. Using a two-phaseevaluation system of barrier characteristics and impacts, a total of 32 tidal barriers were audited. Of the32 sites investigated, it was concluded that 23 barriers showed either complete tidal restriction or wereimpacted by other sources of restriction. The results of this study support the concern that tidal barrierspose an environmental threat in the Bay of Fundy, and that restoration projects addressing this problemshould be a priority for resource managers.
357
Poster Session
SPATIAL ANALYSIS OF SPARTINA ALTERNIFLORA COLONIZATION ONTHE AVON RIVER MUDFLATS, BAY OF FUNDY,
FOLLOWING CAUSEWAY CONSTRUCTION
Sarah Merrill Townsend and Danika van Proosdij
Department of Geography, Saint Mary’s University, Halifax, NS. [email protected]
This poster presents results from a field study and geographic information system (GIS) analy-sis on quantifying the extent, distribution and rate of growth of Spartina alterniflora on a section of theAvon River mudflats in the Minas Basin since the construction of the Windsor-Falmouth Highway 101causeway in 1970. The extent and distribution of both the mature and expanding juvenile colonies of S.alterniflora were measured using differential global positioning system (GPS) from October to No-vember 2001. Data were collected during low tide and included observations of vegetation densitywithin the colonies. The historic spatial distribution covered by S. alterniflora was determined fromaerial photographs of the study area from 1972, 1981, 1992 and 1995. The annual rate of growth andchange in total salt marsh area from 1969 to 2001 was quantified and analyzed using a GIS.
The area and rate of growth of the marsh vegetation have been increasing since causeway con-struction as conditions on the mudflat surface have become more favourable, i.e., with a lower tidalinundation and lower wave energy due to an increase in sediment deposition initiated with causewayconstruction. Through ice and wave rafting of rhizome material from limited shoreline marsh in thestudy area, and possibly other sources already in existence prior to causeway, the pattern of growthexpansion is typical of other marsh study sites. Total area of marsh in 1973, 1981, 1992 and 1995 were1,443 m2, 4,146 m2, 14,232 m2, and 40,782 m2 respectively. In 2001 the established-only marsh areawas 199,083 m2 (approximately 0.2 km2) and the juvenile-only marsh area totaled 191,194 m2 (ap-proximately 0.2 km2). The rate of growth of the total S. alterniflora on the Avon River mudflat studyarea was calculated to be 29% per year between 1992 and 2001. Based on regression calculations fromthe GIS analysis, the predicted area of the marsh for 2006 is 2.5 km2. This research demonstrates thatthe Highway 101 causeway has acted as an important agent of change in this marsh/mudflat system.

358
Health of the Bay of Fundy: Assessing Key Issues
MARINE ENVIRONMENTAL QUALITY (MEQ) INDICATORSFOR THE BAY OF FUNDY
Maxine Westhead
Department of Fisheries and Oceans, Bedford Institute of Oceanography, Dartmouth, NS.
Canada’s Oceans Act was proclaimed in January 1997, and provides a legislative frameworkfor Canada’s oceans and marine resource management. The Oceans Act calls for the implementation ofintegrated management plans, the development of a national system of marine protected areas, and theestablishment of marine environmental quality guidelines, objectives and criteria. In this context, threeOceans Act programs are presently being undertaken: marine protected areas (MPA), integrated man-agement (IM), and marine environmental quality (MEQ).
The overall goal of the marine environmental quality program is to provide an ecosystem-basedsupport mechanism for the development of integrated management and marine protected area plans.MEQ activities in the Bay of Fundy will help provide the information needed to make sound decisions,and will offer the ecological basis needed for effective IM and MPA plan development. MEQ makes themuch-needed link between science and management, putting scientific information into a more usableformat for managers.
This poster highlights a potential marine environmental quality framework and associated indi-cators for the Bay of Fundy, with an emphasis on the Minas Basin.
359
Poster Session
C. MANAGEMENT INITIATIVES
INTEGRATED MANAGEMENT OF CANADA’S OCEANS AND COASTS
David Duggan
Oceans and Coastal Management Division, Bedford Institute of Oceanography, Dartmouth, [email protected]
Canada’s estuaries, coasts and oceans are the focus of major economic activity and are an inte-gral part of the country’s culture and identity. The coastline of Canada is the longest of any in the world,and its seabed represents an area two-thirds the size of its land mass. Oceans support commercial,recreational and Aboriginal fisheries, oil and gas exploration and development, marine recreation andtourism, aquaculture, shipping and transportation, and a variety of other economic uses that directlycontribute over $20 billion a year to Canada’s economy. Oceans also support high technology andpharmaceutical industries, potential mining opportunities, and scientific and technical research.
The Oceans Act calls on the Minister of Fisheries and Oceans to lead and facilitate the develop-ment of a national oceans strategy that will guide the management of Canada’s estuarine, coastal andmarine ecosystems. The Canada Oceans Strategy provides the overall strategic framework for Cana-da’s ocean-related programs and policies, based on the principles of sustainable development, inte-grated management and the precautionary approach. The central governance mechanism of the strategyis applying these principles through the development and implementation of integrated managementplans.
Marine and land-based activities have an impact on coastal waters and ocean waters. Intensivefishing, shipping, land-based pollution and development all have an impact on coastlines and oceanwaters. Developing an integrated management approach to oceans-related activities involves consider-ing the impact that a variety of activities may have at an ecosystem level. Integrated managementestablishes advisory bodies that consider both the conservation and protection of ecosystems, while atthe same time providing opportunities for creating wealth in oceans-related economies and communi-ties. It brings together the environmental, economic and social considerations by planning for sustain-able use.
360
Health of the Bay of Fundy: Assessing Key Issues
INTEGRATED MANAGEMENT OF MINAS BASIN, BAY OF FUNDY—ACTIVITIES OF THE MINAS BASIN WORKING GROUP, BOFEP
Patricia Hinch1, Michael Brylinsky2, Robin Musselman3, Jon A. Percy4 and Peter G.Wells5
on behalf of Members of the Working Group
1 Nova Scotia Department of Environment and Labour, Halifax, NS. [email protected] Acadia Centre for Estuarine Research, Acadia University, Wolfville, NS.
[email protected] Minas Basin Working Group, BoFEP, Halifax, NS. [email protected]
4 Seapen Communications, Granville Ferry, NS. [email protected] Environment Canada, Dartmouth, NS. [email protected]
The Minas Basin Working Group, initiated under the Gulf of Maine Council on the MarineEnvironment, is now operating as part of BOFEP (Bay of Fundy Ecosystem Partnership). Its purpose isto help the people living around the Minas Basin find ways to use the region’s natural resources care-fully and wisely, for the benefit of present and future generations. It will accomplish this goal by work-ing with local residents and groups around the Basin, identifying opportunities and forums for newprojects on the sustainable use, restoration and management of the Basin, and working towards a long-term integrated management plan for the Basin and its watershed. Membership is from a wide range ofsectors, and meetings are generally held at the Acadia Centre for Estuarine Research. To date, the grouphas initiated a collection and bibliography of literature pertaining to the Basin; an inventory of non-government groups working on local issues and concerns; and a series of community workshops de-signed to identify issues and initiate action groups to address them. This poster shows examples of thegroup’s accomplishments to date and encourages interested parties to join and contribute to the Group’sactivities.

361
Poster Session
UPPER BAY OF FUNDY FISHERIES:AN INTEGRATED MANAGEMENT PILOT PROJECT
Barry C. Jones
Fredericton, NB. [email protected]
The upper portion of the Bay of Fundy is a unique geographic region where natural conditionslimit small-scale fishermen in their harvesting activities, one of the principal elements of local commu-nity economies. In recent years, larger vessels from outside the region have followed and harvested fishstocks as they migrate into the upper Bay. This more flexible and more powerful fishing pressure,added to the local community fishery, has significantly reduced upper Bay fish stocks and their avail-ability to local economies. The management of these fisheries, exacerbated by the unknown effects ofother local marine resource uses is obviously not ecosystem-based, nor is it integrated within localeconomies, both directions mandated under the recent federal Oceans Act administered by Fisheriesand Oceans Canada. For this reason, upper Bay of Fundy fishermen and communities have bandedtogether to request the right and responsibility to develop an ecosystem-based fisheries managementpilot project in the area.

362
Health of the Bay of Fundy: Assessing Key Issues
Minutes of the BOFEPAnnual General Meeting

364
Health of the Bay of Fundy: Assessing Key Issues

365
Minutes of the BoFEP Annual General Meeting
BAY OF FUNDY ECOSYSTEM PARTNERSHIP (BOFEP)* ANNUAL GENERAL MEETING *
Acadia University, Wolfville, Nova ScotiaMay 15, 2002
from 18:10 to 21:15 pm
Participants: Graham Daborn, Acadia Centre for Estuarine Research (Chairperson); Nancy Roscoe-Huntley,Acadia Centre for Estuarine Research (Scribe); Hugh Akagi, Passamaquoddy First Nation; Peter Austin-Smith;Sean Brillant, ACAP Saint John; Mike Brylinsky, Acadia Centre for Estuarine Research; Maria-Ines Buzeta,Dept. of Fisheries & Oceans; Thierry Chopin, University of New Brunswick, Saint John; Chiu L. Chou,Fisheries & Oceans, Canada; Cameron Deacoff, Dalhousie University, student – Dalhousie University; DaveDuggan, Dept. of Fisheries and Oceans; Kathy Faulkner, Baymount Outdoor Adventures Inc.; Sheri Faulkner-Jackson, student – Simon Fraser University; Donald and Elaine Hendricks, Acadia Univeristy, Irving Project;Peter Hicklin, Canadian Wildlife Service, Environment Canada; Larry Hildebrand, Environment Canada;Patricia Hinch, NS Dept. of Environment and Labor; Marianne Janowicz, NB Dept. of Environment andLocal Government; Barry Jones, BoFEP Treasurer; Marty King, World Wildlife Fund Canada; Charles LeBlanc,Environment Canada; Colin MacKinnon, Canadian Wildlife Service; Teresa Newcomb; Jon Percy, BoFEP;Peter Lawton, Dept. of Fisheries and Oceans; Angela Martin, Huntsman Marine Science Centre; AmandaMcGuire, Huntsman Marine Science Centre; Vincent Mercier, Environment Canada; Lisa Paon, Dept. ofFisheries and Oceans; Pam Person, GPAC; Gerhard Pohle, Huntsman Marine Science Centre; Robert Rangeley,World Wildlife Fund; Bob Rutherford, Dept. of Fisheries and Oceans-BIO; Danika van Prooskij, Saint Mary’sUniversity; Brad Walters, Mount Allison University; Peter Wells, Environment Canada; Maxine Westhead,Dept. of Fisheries and Oceans; Renee Wissink, Fundy National Park; Thomas Young, Resource ManagementAssociates.
1. Call to OrderChair, G. Daborn welcomed members to the Annual General meeting and asked that everyone fill in thesign-up form and return to Nancy so we can have a record of those in attendance.
2. Additions to/Acceptance of the agendaMaxine announced an annual BoFEP run to be scheduled for tomorrow, May 16th, beginning at 6:30. Allinterested should meet in the lobby of Seminary House.
3. Approval of Minutes of AGM on November 2nd, 2001 in Sackville, NBGraham went through several points from the floor, including the interaction with the GPAC, points fromthe last AGM, the role of BoFEP in the Integrated Management proposal, and the process of electing a newSteering and Management Committee following the adjournment of this meeting. He noted that at the lastAGM, BoFEP By-Laws were adopted.
Item #12 from the last minutes referred to the Gulf of Maine Council and should have read “GPAC”.
Motion to approve the minutes Jones/Hildebrand. Motion carried.
4. Business arising from the previous AGMDealt with in the previous item.
366
Health of the Bay of Fundy: Assessing Key Issues
5. Acceptance of the BoFEP Strategic PlanJon provided an update of the BoFEP Strategic Plan he has been developing that will provide a frame-work to implement a work plan, providing direction to BoFEP. He noted the eight general areas that willbe developed including both long-term as well as short-term goals. When final and approved by BoFEP,the Strategic Plan will be placed on the web site. Jon indicated he was not seeking acceptance since this isa working document requiring revisions. Copies will be circulated to members of the Steering Committeefor review and comments. At the last BoFEP Steering Committee meeting the Strategic Plan was ap-proved in principle and will be circulated in its final form prior to acceptance.
Moved by L. Hildebrand, seconded by J. Ollerhead that the Strategic Plan be distributed toall members of BoFEP.The motion was then amended to include – to send out a ballot by email accepting, accept-ing with changes, or rejecting
Motion carried unanimously.
6. Update on BoFEP Working Group activitiesMinas Basin Working group chaired by Pat Hinch reported that this group has been very active.She spoke on the Gulf of Maine Habitat proposal, the work of the community forums was discussedincluding the upcoming leaders’ meeting.
Corophium group chaired by Peter Wells provided a brief update on recent meetings and activities. This isan active group and special thanks to Diana Hamilton for the successful panel discussion at the 5th Bay ofFundy Science Workshop.
Nutrification of Coastal Waters chaired by Thierry Chopin reported on the projects on which they arefocusing. He also noted that a nutrient workshop may be planned for the Bay of Fundy region.
Tidal Barriers and Saltmarshes, co-chaired by Janice Harvey and Jeff Ollerhead reported that they haveapproximately 25 members as a result of two groups merging. They have met a number of times. Jeffnoted the objectives they are focusing on and provided details.
Ecotourism chaired by Tom Young reported on the successful workshop held last fall with the financialassistance of BoFEP. He also reported on the activities of the Biosphere Reserve project, the committeestructure as well as the problems encountered. An ecotourism fact sheet (#21) has been released at thisworkshop thanks to Jon Percy. Tom also noted that 2002 is UN’s year of the tourist.
Defining stress/cumulative effects chaired by Mick Burt and reported via Peter Wells indicated that this isa small group, requiring additional members. They are in the early stages of a workplan. A PhD project atUNBSJ and the Huntsman Marine Science Centre is underway and being supervised by both Peter andMick.
Sedimentation working group chaired by David Mossman have provided a term of reference. They arediscussing an issue with the Tidal Group. This item will be placed on the Steering Committee’s nextagenda.

367
Minutes of the BoFEP Annual General Meeting
Fish Migration currently being chaired by Rod Bradford. He has voiced concern over not being able tocontinue to chair this group. Jamie Gibson will be asked to serve as chair for this group.
Resource Development- chaired by Peter Fenety began three years ago and has not been heard from sincethat time. This group was formed around the issue of mining. Following discussion it was agreed thatPeter Fenety would be contacted. It was suggested that issues such as Titanium could be dealt with by theMinas Basin Working group.
Motion to strike this committee from the BoFEP working groups B. Jones/J. OllerheadAmended to say subsume into the Minas Basin Working group.Following discussions on whether to merge this group or to keep the issue on the table, the questionwas called.
All in favour with the exception of one abstention vote.
This item would be placed on the next BoFEP Steering Committee agenda to see if someone is willing tocome forward to establish a committee to meet the issues of this committee as well as to chair the group.
Moved by B. Rutherford, seconded by D. Duggan to invite Gordon Fader to attend a Steering Com-mittee meeting to discuss issue dealing with Middle Bay).
Motion carried unanimously.
Toxic chemicals group currently needs an active chair. Following discussion, it was agreed to keep thisworking group on the books and an attempt will be made to find a chair as well as new members. Ifinterested, please contact Graham or Peter.
Marine Protected Areas group chaired by Maria-Ines Buzeta advised that their next meeting will be heldin Sackville, NB. Maria discussed issues of concern regarding finding a co-chair and the need for newmembers. Jon will review the membership forms to determine if there are members interested in joiningthis group (as well as other working groups and provide contact information to all chairs).
Graham provided clarification on what is a working group vs committee work. Emphasis should be on thework in progress.
Communications and Web Site- Jon Percy works single-handed on this committee, preparing variouspublications, posters and maintaining the BoFEP web site. Jon attends as many of the working groupmeetings as time permits. During the past year he has designed and constructed information kiosks thatwill be placed in various areas surrounding the Bay of Fundy; one is in the Visitors Centre at FundyNational Park, Alma, New Brunswick. Kiosks will be an ongoing project for Jon during the next severalmonths. During the past year Jon has worked on the BoFEP By-Laws, and prepared a Strategic Plan. Jonnoted he is trying to get more information into the Gulf of Maine Times. Editor of this publication, AndyReardon, has been covering the workshop this week. Jon has been the initiator of the BoFEP Slideproject. Anyone with slides, please contact Jon. Jon will scan, digitize, and eventually, there will be anavailable data base of slides to be used in presentations. Hugh is also working with elder, David Frances,to prepare a translation of fact sheets.

368
Health of the Bay of Fundy: Assessing Key Issues
Integrated Coastal Management Working group is co-chaired by B. Jones and L. Hildebrand. At the lastAGM, Barry made a proposal on Integrated Management. Since that time he has retired from DFO.Further discussions focused on the Oceans Strategy Act, and DFO’s role.
Coastal Development chaired by Allison Evans did not have a report.
Zooplankton is chaired by Jack Fife but appears to be inactive at this time.
Motion by L. Hildebrand/seconded by B. Jones that the new Steering Committee contactchairs of inactive working groups and determine if they wish to continue or make adecision whether the group should be dropped.
All in favour, motion carried.
7. Update on the Steering Committee/Management Committee activities/decisionsGraham reported that the Steering Committee had met three times since the last AGM in November2002, either in person or by conference call. They have discussed financial/budget concerns, astrategic working plan, the Integrated Management Plan, been involved with plans for the 5th Bay ofFundy Science workshop, and assisted working groups when necessary. A lengthy Integrated Fish-eries proposal was prepared and submitted to the Federal Minister of Fisheries. They have also beeninvolved in promoting interest in BoFEP and issues in the Bay of Fundy.
The Management Committee has dealt with financial requests from the Ecotourism Working groupfor assistance in a workshop as well as a request from the Minas Basin Working group to assist theircoordinator to complete the work started on community workshops.
8. DF0 Proposal re: BoFEP role in integrated management in the Bay of Fundy(deferred)
9. Work Plans and proposed budget for 2002-2003Barry Jones circulated financial statements for 2001-2002 and 2002-2003. After reviewing the 2001-2002financial statement,
Motion from P. Pearson/seconded by D. Duggan to accept the financial statement from 2001-2002.
All in favour, motion carried.
Following a lengthy discussion and questions relating to the 2002-2003 budget
Motion from J. Ollerhead/seconded by M. Janowicz to have the Steering Committee revisit a revisedbudget and to produce a new draft budget, distribute to the members for a yes/no ballot with anyother materials that are being forwarded to the membership.
All in favour, motion carried.

369
Minutes of the BoFEP Annual General Meeting
Motion from T. Chopin/seconded by C. Deacoff that the Steering Committee should reevaluate thenew numbers and the working groups to provide an estimate of what they will be asking for the nextyear.
All in favour, motion carried.
The question of auditors was discussed. Acadia has been the auditor for the BoFEP accounts. Thenew Steering Committee will be asked to assess how we handle the auditing of funds.
Motion from B. Jones/seconded by J. Ollerhead that the BoFEP auditor for the upcoming year beAcadia University.
All in favor, motion carried.
10. Nominations and Election of Steering CommitteeB. Jones reported on behalf of the nominating committee. All present members (20/24) areprepared to stay on the Steering Committee. The following individuals were elected to the Steer-ing Committee: Davd Duggan, Rob Rangeley and Maria-Ines Buzeta. Justin Huston also volun-teered to sit on the Steering Committee.All members declared elected.
11. Date and location of the next AGMMotion from B. Jones/seconded by P. Wells that the next AGM will be at the call of the chair andthe location will be determined at a later date.
12. Other BusinessThe Gulf of Maine Council has invited the Minas Basin Working group to give a presentation inJune.
Peter Wells reported that ~190 registrations have been received for the 5th Bay of Fundy ScienceWorkshop. It appears to have been a huge success.
Peter also noted that the expenses for publications from Environment Canada were $7,500 andexpects the extra costs for this year’s workshop, covered by Environment Canada, will be~$10,500.
13. AdjournmentMotion to adjourn made by J. Ollerhead at 9:15 pm.

370
Health of the Bay of Fundy: Assessing Key Issues

371
Minutes of the BoFEP Annual General Meeting
Participants List

372
Health of the Bay of Fundy: Assessing Key Issues
373
Participants List
Hugh AkagiPassamaquoddy First Nations48 Indian Pt.St. Andrews, NB E5B [email protected]
Peter AmiroDiadromous Fish DivisionFisheries and Oceans CanadaPO Box 1006Dartmouth, NS B2Y [email protected]
Joe ArbourOceans and Coastal Management DivisionFisheries and Oceans CanadaPO Box 1006Dartmouth, NS B2Y [email protected]
Marieka ArnoldNew Brunswick Federation of Naturalists924 Prospect Street, Suite 2Fredericton, NB E3B [email protected]
Peter Austin-Smith6133 Shirley StreetHalifax, [email protected]
Richard BambergerMarine Environmental Research InstitutePO Box 1652Blue Hill, ME 04614 [email protected]
Myriam BarbeauUniversity of New BrunswickPO Box 4400, 301 Charlotte StreetFredericton, NB E3B [email protected]
Angelika K. BayerUniversity of Toronto350 Atwood LaneOakville, ON L6H [email protected]
Karen BeazleySchool for Resources and Environmental StudiesDalhousie UniversityHalifax, NS B3H [email protected]
Jody BerryC-Ciarn Atlantic1312 Robie StreetHalifax, NS B3H [email protected]
374
Health of the Bay of Fundy: Assessing Key Issues
Kevin BlairEnvironment Canada45 Alderney Dr., Queen Square, 16th FloorDartmouth, NS B2Y [email protected]
Gosh BobbaEnvironment Canada867 Lakeshore RoadBurlington, ON L7R [email protected]
Angela BondASU Box 6874Wolfville, NS B0P [email protected]
Beth BoonCape ChignectoPO Box 581Amherst, NS B4H [email protected]
Tony M. BowronEcology Action Centre1568 Argyle Street, Suite 31Halifax, NS B3J [email protected]
Rod BradfordDiadromous Fish DivisionFisheries and Oceans CanadaPO Box 1006Halifax, NS B2Y [email protected]
Christine BrownDepartment of GeologyAcadia UniversityWolfville, NS B4P [email protected]
John BraznerPO Box 54Knife River, MN 55609 [email protected]
Monique BreauEnvironment Canada45 Alderney Drive, Queen SquareDartmouth, NS B2Y [email protected]
Kate BredinAtlantic Canada Conservation Data CentrePO Box 6416Sackville, NB E4L [email protected]
375
Participants List
Sean BrillantAtlantic Coastal Action Program Saint JohnPO Box 6878, Station ASaint John, NB E2L [email protected]
Sadie BryanBluenose Atlantic Coastal Action ProgramPO Box 10Mahone Bay, NS B0J [email protected]
Michael ButlerAtlantic Coastal Zone Information Steering Com-mittee Secretariat1226 LeMarchant StreetHalifax, NS B3H [email protected]
Michael BrylinskyAcadia Centre for Estaurine ResearchAcadia UniversityWolfville, NS B4P [email protected]
Maria-Ines BuzetaFisheries and Oceans CanadaSt. Andrews Biological Station531 Brandy Cove RoadSt Andrews, NB E3B [email protected]
Stacie CarrollUpper Bay Of Fundy Biosphere InitiativeRR#1Economy, NS B0M [email protected]
John ChardineCanadian Wildlife ServicePO Box 6227Sackville, NB E4L [email protected]
Tony CharlesDepartment of Finance and Management StudiesSaint Mary’s UniversityHalifax, NS B3H [email protected]
Chiu L ChouMarine Chemistry DivisionFisheries and Oceans CanadaPO Box 1006Dartmouth, NS B2Y [email protected]
Thierry ChopinDepartment of BiologyUniversity of New BrunswickPO Box 5050Saint John, NB E2L [email protected]

376
Health of the Bay of Fundy: Assessing Key Issues
Gail ChmuraDepartment of GeographyMcGill University805 Sherbrooke St. W.Montreal, PQ H3A [email protected]
Ann ClarkeSchool for Resources and Environmental StudiesDalhousie University1312 Robie StreetHalifax, NS B3H [email protected]
Brenda ColdwellPO Box 196Wolfville, NS B0P [email protected]
David ColvilleCentre for Geographical Sciences50 Elliott RoadLawrencetown, NS B0S [email protected]
Robert J. Conover7415 McAllister Rd, RR #2Bewdley, ON K0L [email protected]
Pam ComeauBay of Fundy Marine Resource CentrePO Box 273Cornwallis Park, NS BOS [email protected]
Gail CorkumGR Box AO-22, RR2Wolfville, NS BOP [email protected]
Mark CostelloHuntsman Marine Science Centre1 Lower Campus RoadSt. Andrews, NB E5B 2L7506-529-1224506-529-1212costello@huntsman marine .ca
Francine CottreauWestern Valley Development AuthorityPO Box 278Cornwallis Park, NS BOS [email protected]
Chantal CoutureOceans and Coastal Management DivisionFisheries and Oceans Canada1 Challenger Drive, 5th Floor PolarisPO Box 1006Dartmouth, NS B2Y [email protected]

377
Participants List
Brian CraigEnvironment Canada867 Lakeshore RoadBurlington, ON L7R [email protected]
Brad CreweNova Scotia Department of Agriculture and Fish-eriesPO Box 550Truro, NS B2N 5E3902-893-6578902-893-0335crewebc@ gov.ns.ca
Graham DabornAcadia Centre for Estuarine ResearchAcadia UniversityWolfville, NS B4P [email protected]
John A. DalzielMarine Environmental Sciences DivisionBedford Institute of OceanographyPO Box 1006Dartmouth, NS B2Y [email protected]
Jaclyn DannEnvironment Canada-Atlantic Region45 Alderney DriveDartmouth, NS B2Y [email protected]
Ryan DebruynApplied Geomatics Research Group50 Elliott RoadLawrencetown, NS B0S 1M0902-584-2076902-584-7211
Cameron Deacoff5681 Rhuland St., Apt 801Halifax, NS B3H [email protected]
Dan DeneauCentre for Geographical SciencesBox 1637Middleton, NS B0S [email protected]
Andy DidykFaculty of BiologyUniversity of New Brunswick100 Arden StreetMoncton, NB E1C [email protected]
Elwood Lewis DillmanScotia Investments Ltd.Box 393Hantsport, NS BOP [email protected]

378
Health of the Bay of Fundy: Assessing Key Issues
David DugganOceans and Coastal Management DivisionFisheries and Oceans CanadaPO Box 1006, Mail Stn. B500Dartmouth, NS B2Y [email protected]
Helene Maire Claire DupuisPolicy and Program PlanningFisheries and Oceans CanadaPO Box 5030Moncton, NB E1C [email protected]
Peter EatonEnvironment Canada45 Alderney Drive, Queen SquareDartmouth, NS B2Y [email protected]
Nestor Escara1391 Henry Street, Apt. 1Halifax, NS B3H [email protected]
Kathy FaulknerBaymount Outdoor Adventures Inc.17 Elvin Jay DriveHillsborough, NB E4H 2S9506-734-2660506-734-1980info@baymont&adventures.com
Sheri Faulkner JacksonSchool of Resources and Environmental Manage-mentSimon Fraser University27 Christopher Court Apt. 12Saint John, NB E2K [email protected]
James [email protected]
Cheryl FrailInvertebrate Fisheries DivisionFisheries and Oceans CanadaBedford Institute of OceanographyPO Box 1006Dartmouth, NS B2Y [email protected]
Jamie F. GibsonAcadia Centre for Estuarine ResearchAcadia UniversityPO Box 115Wolfville, NS B4P [email protected]
Jennifer GrahamCentre for Community Based Management278 Water StreetSt. Andrews, NB E5B [email protected]

379
Participants List
David GreenbergOceans Sciences DivisionFisheries and Oceans CanadaPO Box 1006Dartmouth, NS B2Y [email protected]
Jennifer Ruth HackettOceans and Coastal Management DivisionFisheries and Oceans CanadaPO Box 1006Dartmouth, NS B2Y [email protected]
Diana HamiltonDepartment of BiologyUniversity of New BrunswickBag Service 4511Fredericton, NB E3B 6E1506 453 [email protected]
Anita HamiltonHabitat Management DivisionFisheries and Oceans CanadaPO Box 1006Dartmouth, NS B2Y [email protected]
Alan HansonCanadian Wildlife ServicePO Box 6227Sackville, NB E4L [email protected]
Gareth C. H. HardingHabitat Ecology SectionFisheries and Oceans CanadaPO Box 1006Dartmouth, NS B2Y [email protected]
Tracy HartMaine Sea Grant1084 School St., Apt.3Veazie, ME 04401 [email protected]
Janice HarveyConservation Council of New Brunswick45 Libbey LaneWaweig, NB E3L [email protected]
Stephen HawboldtClean Annapolis River ProjectPO Box 395Annapolis Royal, NS B0S [email protected]
Jocelyne HellouMarine Chemistry SectionFisheries and Oceans CanadaBedford Institute of OceanographyPO Box 1006Dartmouth, NS B2Y [email protected].
380
Health of the Bay of Fundy: Assessing Key Issues
Elaine HendricksIrving ProjectAcadia UniversityPO Box 48Wolfville, NS B0P [email protected]
Donald HendricksIrving ProjectAcadia UniversityPO Box 48Wolfville, NS B0P [email protected]
Peter HicklinCanadian Wildlife ServicePO Box 6227Sackville, NB E4L 1G6506-364-5042506-314-5062peter.hicklin @ec.gc.ca
Larry HildebrandEnvironment Canada45 Alderney Drive, Queen Square, 16th FloorDartmouth, NS B2Y [email protected]
Patricia Hinch25 Hanover CourtHalifax, NS B3M [email protected]
Kelly Patrick HoneymanJ. D. Irving, Limited300 Union StreetSaint John, NB E2L [email protected]
Justin HustonNova Scotia Department Agriculture and Fisher-iesPO Box 2223Halifax, NS B3J [email protected]
Sherri JacksonKings Community Economic DevelopmentAgency28 Aberdeen Street, Suite 5Kentville, NS B4N [email protected]
Marianne JanowiczNew Brunswick Department of Environment andLocal GovernmentPO Box 6000Fredericton, NB E3B [email protected]
Isabel C. JohnsonGolder Associates Inc.6241 NW 23rd Street, Suite 500Gainesville, FL 32653 [email protected]

381
Participants List
Barry Jones626 Churchill RowFredericton, NB E3B [email protected]
Denise JoyNew Brunswick Department of Environment andLocal Government8 Castle StreetSaint John, NB E2L [email protected]
Gary JulienEnvironment Canada45 Alderney Drive, Queen SquareDartmouth, NS B2Y [email protected]
Irena Kaczmarska-EhrmanBiology DepartmentMount Allison University63B York StreetSackville, NB E4L [email protected]
Martin KayeBay of Fundy Marine Resource CentrePO Box 273Cornwallis Park, NS B0S [email protected]
Brian KeatingArea Habitat ManagementFisheries and Oceans Canada717 Main Street, Unit 3Sussex, NB E4E [email protected]
Sarah KennedyEnvironment Canada351 St. Joseph BlvdPlace Vincent Massey, 12th FloorHull, PQ K1A [email protected]
Joseph KerekesCanadian Wildlife ServiceEnvironment Canada45 Alderney Drive, 5th FloorDartmouth, NS B2Y [email protected]
Paul D. KeizerMarine Environmental Sciences DivisionFisheries and Oceans CanadaPO Box 1006Dartmouth, NS B2Y [email protected]
Marty KingWorld Wildlife FundSuite 504, 5251 Duke StreetHalifax, NS B3J [email protected]

382
Health of the Bay of Fundy: Assessing Key Issues
Andy KirkTown of WindsorPO Box 158Windsor, NS BON [email protected]
Karen KittilsenHants Regional Development AuthorityPO Box 2313Windsor, NS B0N 2T0902-798-8722902-798-3254Karen [email protected]
Zsofi KollerConservation Council of New Brunswick180 St.John StreetFredericton, NB E3B [email protected]
Hank KolsteeNova Scotia Department of Agriculture and Fish-eriesPO Box 550Truro, NS B2N [email protected]
Peter F. LarsenBigelow Laboratory for Ocean SciencesMckown PointWest Boothbay Harbor, ME 04575 [email protected]
Peter LawtonFisheries and Oceans CanadaSt. Andrews Biological Station531 Brandy Cove RoadSt. Andrews, NB E5B [email protected]
Charles LeBlancEnvironment CanadaEnvironment Science CentreMoncton, NB E1A 6S8506-851-7254506-851-6608charles [email protected]
Claudette LeBlancAtlantic Coastal Zone Information Steering Com-mittee Secretariat1226 LeMarchant StreetHalifax, NS B3H [email protected]
Heather LevyEnvirosphere Consultants Ltd.PO Box 2906Windsor, NS BON [email protected]
Allan LinesTitanium Corporation287 Lacewood Drive, Unit 103, Suite 432Halifax, NS B3M [email protected]
383
Participants List
Gary LinesEnvironment Canada45 Alderney Drive, Queen Square, 16th FloorDartmouth, NS B2Y [email protected]
JohnLoch52 Eaglewood driveBedford, NS B4A [email protected]
Heike LotzeDepartment of BiologyDalhousie UniversityHalifax, NS B3H [email protected]
Ron LoucksRH Loucks Oceanology Ltd.24 Clayton Park Dr.Halifax, NS B3M [email protected]
Carl MacDonaldFisherman & Scientists Research SocietyPO Box 25125Halifax, NS B3M 4H4902-461-8119902-461-0541
Colin MacKinnonCanadian Wildlife ServicePO Box 6227Sackville, NB E4L [email protected]
Josette MailletNature Conservancy of Canada-Atlantic Region924 Prospect St., Suite 2Fredericton, NB E3B [email protected]
Angela MartinHuntsman Marine Science Centre1 Lower Campus RoadSt. Andrews, NB E5B [email protected]
Amanda McGurireHuntsman Marine Science Centre1 Lower Campus RoadSt. Andrews, NB E5B [email protected]
Kyle McKenzieC-CIARN Atlantic1312 Robie StreetHalifax, NS B3H [email protected]
Syliva Betty McKoyJoggins Fossil Cliffs World Heritage CommitteePO Box 84River Hebert, NS B0L [email protected]

384
Health of the Bay of Fundy: Assessing Key Issues
Heather McCrackenApplied Geomatics Research Group50 Elliott RoadLawrencetown, NS B0S [email protected]
Shayne McQuaidHabitat Management DivisionFisheries and Oceans CanadaPO Box 1006Dartmouth, NS B2Y [email protected]
Stephanie MehlmanClean Annapolis River ProjectPO Box 395Annapolis Royal, NS B0A [email protected]
Vincent MercierEnvironment CanadaPO Box 23005Moncton, NB E1A [email protected]
Inka MilewskiConservation Council of New Brunswick254 Douglasfield RoadMiramichi, NB E1N [email protected]
Alex MosherApplied Geomatics Research GroupRR#1Bridgetown, NS B0S [email protected]
David J. MossmanDepartment of GeographyMount Allison University144 Main StreetSackville, NB E4L [email protected]
Sean MurphyParks Canada-Atlantic Service Centre1869 Upper Water StreetHalifax, NS B3J [email protected]
Steve Murray7 Shannon DriveTruro, NS B2W [email protected]
Kee MuschenheimAcadia Centre for Estuarine ResearchAcadia UniversityWolfville, NS B4P [email protected]
385
Participants List
Robin MusselmanBOFEP2497 Philip St.Halifax, NS B3L [email protected]
Jason NaugOceans and Coastal Management DivisionFisheries and Oceans CanadaPO Box 1006Dartmouth, NS B2Y [email protected]
Teresa NewcombRR#1 Barss CornerMaplewood, NS B0R [email protected]
Reg NewellNova Scotia Department of Natural Resources136 Exhibition StreetKentville, NS B4N [email protected]
Charles O’ReillyCanadian Hydrographic ServicesFisheries and Oceans CanadaPO Box 1006Dartmouth, NS B2Y [email protected]
Jeff OllerheadDepartment of GeographyMount Allison Unviersity144 Main St.Sackville, NB E4L [email protected]
Jackie OlsenEnvironment Canada45 Alderney Drive, Queen Square, 16th FloorDartmouth, NS B2Y [email protected]
Roger Alan OuthouseIsland Consolidated SchoolPO Box 80Freeport, NS B0V 1B0902-839-6300902-839-6303
Lisa PaonMarine Chemistry SectionFisheries and Oceans CanadaBedford Institute of OceanographyPO Box 1006Dartmouth, NS B2Y [email protected]
Ed ParkerNew Brunswick Department of Environment andLocal Government8 Castle StreetSaint John, NB E2L [email protected]
386
Health of the Bay of Fundy: Assessing Key Issues
Michael ParkerEast Coast AquaticsP.O. Box 129Bridgetown, NS B4S [email protected]
Jon PercyBOFEPPO Box 42Granville Ferry, NS BOS [email protected]
Pamela PersonGPAC479 Back Ridge RdOrland, ME 04472 [email protected]
Patricia PocklingtonArenicola MarinePO Box 1097Wolfville, NS B0P 1X0902-542-1903902-542-1903aremocp;@accesswave.ca
Gerhard PohleHuntsman Marine Science Centre1 Lower Campus RoadSt. Andrews, NB E5B [email protected]
Ivan RafuseIndian and Northern Affairs CanadaPO Box 160Amherst, NS B4H [email protected]
Robert RangeleyWorld Wildlife FundSuite 504, 5251 Duke StreetHalifax, NS B3J [email protected]
Munju Monique RavindraParks CanadaFundy National ParkAlma, NB E4A [email protected]
Janice RaymondPlanning DivisionFisheries and Oceans CanadaPO Box 1035Dartmouth, NS B2Y [email protected]
Trefor ReynoldsonEnvironment CanadaAcadia UniversityWolfville, NS B4P [email protected]
387
Participants List
Joel RichardsonNew Brunswick Department of Tourism and ParksPO Box 6000Fredericton, NB E3B [email protected]
David RobichaudFisheries and Oceans Canada531 Brandy Cove RdSt. Andrews, NB E5B [email protected]
Denise RoyNature Conservancy of Canada-Atlantic Region924 ProspectFredericton, NB E3B [email protected]
Kasia RozalskaApplied Geomatics Research GroupPO Box 259Lawrencetown, NS B0S [email protected]
Murray RuddFisheries and Oceans CanadaPO Box 1035Dartmouth, NS B2Y [email protected]
Bob RutherfordOceans and Coastal Management DivisionFisheries and Oceans CanadaPO Box 1006Dartmouth, NS B2Y 4A2902-426-8398902-426-3855RutherfordB@ mar.dfo-mpo.gc.ca
Donald SamNova Scotia Nature TrustPO Box 2202Halifax, NS B3J 3C4902-425-5263902-429-5263
Shannon ScottFishermen and Scientists Research SocietyPO Box 25125Halifax, NS B3M [email protected]
Glyn SharpInvertebrate Fisheries DivisionFisheries and Oceans Canada1 Challenger Drive, B500PO Box 1006Dartmouth, NS B2Y 4A2902-426-6042902-426-1862
John ShawGeological Survey of CanadaBedford Institute of OceanographyDartmouth, NS B2Y [email protected]

388
Health of the Bay of Fundy: Assessing Key Issues
Christine Anne Smith26 Remington Ct.Halifax, NS B2M [email protected]
Melanie Smith46 Millwood DriveLower Sackville, NS B4E [email protected]
Klaus SonnenbergGrand Manan Fishermen’s AssociationPO Box 907Grand Manan, NB E5G [email protected]
Herb SooleyHealth CanadaSuite 1625, 1505 Barrington StreetHalifax, NS B2W [email protected]
Cliff StanleyDepartment of GeologyAcadia UniversityWolfville, NS B4P [email protected]
Edward Peter SteenstraUS Fish and Wildlife Service306 Hatchery RoadEast Orland, ME 04431 USA207-469-6701, x [email protected]
Airin Stephens278 Water StreetSt Andrews, NB E5B [email protected]
Patrick StewartEnvirosphere Consultants LtdPO Box 2906Windsor, NS B0N [email protected]
Peter StrainMarine Environmental SciencesBedford Institute of OceanographyPO Box 1006Dartmouth, NS B2Y [email protected]
Michael StrongFisheries and Oceans Canada531 Brandy Cove RoadSt. Andrews, NB E5B [email protected]
Elsie SunderlandSchool of Resource and Environmental Manage-mentSimon Fraser University8888 University DriveBurnaby, BC V5A [email protected]

389
Participants List
Bill and Judith SwindellPO Box 111Advocate, NS B0U 1A0902-392-2646
Brian ThompsonHabitat Management DivisionFisheries and Oceans CanadaPO Box 1006Dartmouth, NS B2Y [email protected]
Sarah Townsend8 Tache StreetLower Sackville, NS B4C [email protected]
Marsha TritesBiology DepartmentMount Allison University63B York StreetSackville, NB E4L [email protected]
Megan Trites-TolsonEnvironment Canada45 Alderney Drive, Queen SquareDartmouth, NS B2Y [email protected]
Danika Van ProosdijDepartment of GeographySaint Mary’s University923 Robie StreetHalifax, NS B3H [email protected]
Bradley WaltersGeography DepartmentMount Allison UniversitySackville, NB E4L [email protected]
David WartmanEnvironment Canada45 Alderney Drive, Queen Square, 16th FloorDartmouth, NS B2Y [email protected]
Tim WebsterCOGS50 Elliott RoadLawrencetown, NS B0S [email protected]
Darrell WellsNew Brunswick Department of Environment andLocal GovernmentPO Box 6000Fredericton, NB E3B [email protected]
390
Health of the Bay of Fundy: Assessing Key Issues
Peter WellsEnvironment Canada45 Alderney Drive, 7th FloorDartmouth, NS B2Y [email protected]
Maxine WestheadOceans and Coastal Management DivisionFisheries and Oceans CanadaBedford Institute of OceanographyPO Box 1006Dartmouth, NS B2Y [email protected]
Bill WhitmanNova Scotia Department of Agriculture and Fish-eriesPO Box 280Cornwallis, NS B0S [email protected]
Jennifer Whitney301 Charlotte StreetFredericton, NB E3B [email protected]
Peter WilliamsSchool of Resource and Environmental Manage-mentSimon Fraser University1275 Mathers Ave.West Vancouver, BC V1T [email protected]
Renee WissinkFundy National ParkPO Box 1001Alma, NB E4H [email protected]
James WolfordFederation of Nova Scotia NaturalistsSite 1, Comp. 61, RR 3Wolfville, NS B0P [email protected]
Tom YoungResource Management AssociatesPO Box 818Parrsboro, NS B0M [email protected]
Colin ZwickerDepartment of GeologyAcadia UniversityWolfville, NS B4P [email protected]
Steve ZwickerEnvironment Canada45 Alderney Drive, Queen Square, 16th FloorDartmouth, NS B2Y [email protected]
391
Participants List
Acadia University, 260; Acadia Centre for EstuarineResearch, 84, 179, 342, 360
Acadian Redfish (Sebastes fasciatus), 87, 92
acid rain, 26, 53, 79, 255
action plans, 18, 224, 227, 228, 229, 232, 270
Advocate, NS, 287-290
agriculture, 123, 130, 140, 230-231, 235-237, 239, 242-247, 248, 250-251, 254-255, 322, 332; riparian edges,124-126, 250
Alaska, 112, 115
Alewife (Alosa pseudoharengus), 100-108
algal blooms, 14, 28, 322
Allen Creek Marsh, NB, 194, 352
American Fisheries Society, 84
American Shad (Alosa sapidissima), 84, 86, 87, 94, 222,330
Amherst Point, NS, 63
Anadromous fish, 84 (see also, Alewife; Atlantic Salmon)
Annapolis Basin, 10, 60, 154
Annapolis River, NS, 179, 250-251, 253, 268
Annapolis River Guardians, 179, 250
Annapolis Valley, NS, 123, 250-251, 254
Annis River, NS, 101
Anurans (see Frogs)
Applied Geomatics Research Group (AGRG), 60
aquaculture, 5, 9, 10, 12, 17, 26, 79, 151, 152, 160, 177,322, 323, 327, 330, 332, 343, 353-355; sea lice control,151
assessment, 5-6, 8-17, 20-22, 29; diagnostic tests, 10;peer-reviewed reports, 5; state of environment (SOE), 3,5-6, 10, 22, 27, 270-271, 337 (see also Indicators;Indices; Monitoring, approaches; Status and trendsanalysis)
Atlantic Canada Conservation Data Centre (ACCDC), 83-84
Atlantic Coastal Action Program (ACAP), 249, 268-269,303; Clean Annapolis River Project (CARP), 179, 250-251, 268
Atlantic Cod (Gadus morhua), 81-82, 84-87, 88, 92, 94,96, 321, 330
Atlantic Environmental Science Network (AESN), 251
Atlantic Halibut (Hippoglossus hippoglossus), 87, 92
Atlantic Herring (Clupea harengus), 84, 87, 88, 94, 321,330
Atlantic Ocean, 5, 258
Atlantic Reference Centre (ARC), St. Andrews, NB, 58, 59
Atlantic Salmon (Salmo salar), 9, 75-80, 87, 92, 222, 223,323, 330, 343 (see also Aquaculture)
Atlantic Sturgeon (Acipenser oxyrinchus), 87, 92
Atlantic White-sided Dolphin (Lagenorhynchus acutus),88, 93
Atlantic Wolffish (Anarhicus lupus), 87, 92
Atriplex patula, 188
Audubon Society, 120
Avon River, NS, 272, 344-346, 357
Avonport Beach, NS, 208, 342
Baltic Sea, 79-80
Banks Island, NWT, 112, 115
Beaver Harbour, NB, 163, 166
Bedford Institute of Oceanography, Dartmouth, NS, 23,129
Belcher Islands, NWT, 112, 115
Belledune, NB, 154
benthic species, see Diatoms; Invertebrates
Big Salmon River, NB, 75-77
bioaccumulation, 15, 16, 80, 129, 211, 350
biodiversity, 46, 48, 58, 59, 118, 180, 222-223, 225, 294,297, 309, 333, 341
Index
392
Health of the Bay of Fundy: Assessing Key Issues
Biodiversity Resources for Integrated Monitoring (BRIM),295
biogeographic information systems, 58, 59
bioinvasions, 246-247, 242, 243, 309
biomagnification, 351
biomarkers, 8, 10, 177, 182
biosphere reserves, 292-298 (see also, Upper Bay ofFundy Biosphere Initiative)
biotoxins, 14, 15, 20, 23, 24, 26; PSP, 18 (see also, Algalblooms)
Black River, NB, 76
Black River, NS, 250, 253
Blue Beach, NS, 259
Blueback Herring (Alosa aestivalis), 101 (see also,Alewife)
Bluefin Tuna, 350
BoFEP: Bay of Fundy Science Workshops, 6, 9-10, 25,340; Corophium Working Group, 214-218, 342;Integrated Fisheries Management Working Group, 272;Salt Marsh and Restricted Tidal Systems WorkingGroup (SMaRTS), 269, 338 (see also, Minas BasinWorking Group)
Brazil, 113
Brier Island, NS, 86-87, 88
Brown seaweed, see Rockweed
Browns Bank, 82
Burntcoat Head, NS, 221
Caledonia, NS, 77
Campobello Island, NB, 161
Canadian Climate Impacts and Adaptation ResearchNetwork (C-CIARN) Atlantic, 339
Canadian Climate Impacts Scenario (CCIS) Project, 68-69
Canadian Climate Centre for Modeling and Analysis(CCCma), 68
Canadian Community Monitoring Network (CCMN), 180
Canadian Nature Federation, 54, 180
Canadian Water Network, 248, 251-252
Canard River, NS, 124-125, 253, 254-255
Cape Blomidon, NS, 221
Cape Chignecto, NS, 221, 287-290
Cape Split, NS, 221
Carwright, NL, 71
causeways, see Tidal barriers
Census of Marine Life (CoML), 58
Charlo, NB, 71
Charlotte County, NB, 160-169
Charlottetown, PEI, 71
Chatham, NB, 71
Chesapeake Bay, 8-9, 11
Chignecto Bay, 76, 78, 111-113, 118, 200-202, 295
chlor-alkali industry, 130
chlorophyll a, 254
Clean Annapolis River Project, see ACAP
climate, 67
climate change, 11, 18, 45, 52, 53, 64, 65, 66-71, 182,218, 222, 246-247, 248, 249, 251-252, 339; seatemperature, 19; sea surface levels, 19
coastal communities, 27, 47-49, 50, 249, 267, 296-298,302, 306 (see also, Minas Basin Working Group,community forums; Stewardship; Tourism, community-based)
coastal development, 9, 139, 310-312, 320-324, 327-330,332
coastal health, 6, 18, 20, 44
Coastal Communities Network, 23
Cobequid Basin/Bay, 77, 154, 221, 223
Cobscook Bay, 322
Colchester Country, NS, 256
Coldbrook, NS, 77
Committee on the Status of Endangered Wildlife inCanada (COSEWIC), 75, 84
393
Index
Common Loon (Gavia immer), 121, 350
communication, 9, 11, 271, 301-303, 338 (see also, MinasBasin Working Group, community forums)
conservation, 23, 29, 89, 118, 225, 293-298, 303, 323 (seealso NCC)
Conservation Council of New Brunswick, 10, 356
contaminants, 9, 14, 15, 18, 21, 23, 24, 26, 210, 214, 309,311, 320, 322, 327-330; atmospheric deposition, 130,327; cadmium, 153-158; copper, 9, 151, 153-158, 329;DDT, 53, 151, 329, 353; fecal coliform bacteria, 250,254-255; mercury (methyl), 18, 21, 20, 129-138, 151,329, 349-351; hydrocarbons, 25, 171, 210; metals, 151,171, 327; nitrates, 255; nitrogen, 21, 26, 255; persistentorganic pollutants (POPs), 24, 327; polycyclic aromaticcompounds (PACs), 210-211; polycyclic aromatichydrocarbons (PAHs), 151, 171, 210-212, 327, 329,353-355; polychlorinated biphenyls (PCBs), 9, 20, 151,171, 211, 329, 353-355; pesticides, 151, 353-355;selenium, 329; silver, 153-158; zinc, 151, 153-158, 329
Convention for the Conservation of Salmon in the NorthAtlantic, 76
Copepods, 86
coral, 273, 323
Cornwallis River, NS, 76, 125-126, 253, 250
Corophium volutator, see Invertebrates
Cumberland Basin, 154, 187-192, 194, 356
Cumberland Regional Economic Development Associa-tion, 288
Cummings Cove, NB, 163, 166
Dalhousie, NB, 154, 155
Daniel’s Flat, NB, 200-202, 204-207, 208
Deer Island Point, NB, 163, 166
Deer Island, NB, 161, 166
Diatoms, 195-196, 199, 200-202, 206, 207, 214-217, 222,322; Actinoptychus senarius, 195; Brockmaniellabrockmanni, 202; Delphineis surirella, 195, 202;Gyrosigma wansbeckii, 202; Nitzschia sigma, 202;Paralia sulcata, 202; Rhaphoneis amphiceros, 195
Digby Neck, NS, 88
Digdeguash River, NB, 328
Dinoflagellates, 322
disease, 12-15, 16
Distichlis spicata, 188
Dorchester Cape, NB, 111
Ducks Unlimited Canada, 125-126, 259
Dunlin (Calidris alpina), 111
dykes, see Tidal barriers
Eastern Habitat Joint Venture (EHJV), 124-126, 259
Echinoderms, 59; sea cucumbers, 19, 322; sea urchins, 19,321
ecological change, 6, 18-19, 82, 222
ecological condition, 6, 16-17
ecological health, 8, 17
ecological integrity, 6-7, 17-18, 21, 294, 301
Ecology Action Centre, 256, 269
Economy, NS, 287, 289
Economy River, NS, 287
Ecosystem approach, 44, 49, 89
Ecosystem: change, 320; coastal, 140, 310; estuarine, 140,141, 208, 273, 310; health, 3, 5-16, 20-29, 47, 210, 262,294-295, 297, 309; integrity, 6-7; large marine (LME),8, 15, 24, 25, 311
ecotoxicology, 8, 24
ecotypes, 47
endocrine disrupters, 24, 53, 164, 309
Environment Canada, 171, 188, 226, 251, 268; CanadianWildlife Service, 118, 120, 124, 259, 302, 303;Ecological Monitoring and Assessment Network(EMAN), 51-57, 180, 295-296; Marine EnvironmentalQuality Working Group, 6, 20; NatureWatch programs(EMAN), 55 (see also ACAP; AESN)
environmental non-governmental organizations (ENGOs),54
environmental quality, 3, 5-6; marine (MEQ), 3, 6, 15, 20-21, 29, 210, 262-266, 358
394
Health of the Bay of Fundy: Assessing Key Issues
Environmental Protection Act (Canada), 28
erosion (coastal), 65, 124, 194, 216, 222, 271, 352
eutrophication, 15, 24, 53, 322
Evangeline Beach, NS, 259
exclusive economic zone (EEZ), 44, 47
Faeroe Islands, 79
fisheries, 5, 9, 10, 18, 25, 26, 43, 58, 59, 79-82, 100, 254,312, 320, 321, 324; by-catch, 100, 309, 324; closed orrestricted areas, 223; commercial, 76; illegal andundirected, 79; larval retention, 87; management, 230,231, 235-239, 242-247, 272, 361; native subsistenceusers, 23, 129; rare species, 83, 85, 87-89; recreational,76; spawning, 77, 81-82, 87, 330; stocking, 76
Fisheries Act (Canada), 76, 272
Fisheries and Oceans Canada, 24, 46-47, 85, 129, 226,262, 267, 272; Ichthyoplankton Survey Programs, 85;Oceans Strategy, 21, 44, 359
floods, 64-65, 124, 222; risk mapping, 60
food chain, 10, 15, 89, 129-130, 132, 208, 320-324, 328,350-351, 354
forestry practices, 230, 231, 235-237, 239, 242-247, 287
Fort Beauséjour, NS, 188-193
fossils, 222, 278, 279
Fraiser Beach, NB, 163, 166
Fredericton, NB, 71
Friends of the Cornwallis River Society, 124, 250
Frogs, 53, 54, 57
Frye Island, NB, 163, 166
Fundy National Park, NB, 291, 292, 305; Wolfe Lake, 121(see also, Upper Bay of Fundy Biosphere Initiative)
Fundy Pull Trap, 111
Fundy Shorebird Project (NS), 259, 261
Gander, NL, 71
Gaspereau, 323, 330
Gaspereau River, NS, 77, 100-104, 106-107, 125, 250,253
geographic information system (GIS), 82, 86, 349, 357
geomatics, 60
Georges Bank, 82
global positioning system (GPS), 60, 65, 357
Global Environmental Facility, 24 (see also Ecosystem,large marine)
Global Inland Waters Assessment (GIWA), 24
Global Ocean Observing System (GOOS), 24
Global Programme of Action Coalition for the Gulf ofMaine (GPAC), 5-6, 23, 337; Coastal Forum, 22, 26,27-28; Coastal Summit, 5, 22
Global Programme of Action for the Protection of theMarine Environment from Land-based Activities (GPA),24
Goose Bay, NL, 71
governance, 9
Government of New Brunswick: Clean Water Act, 46;Coastal Areas Protection Policy, 45, 46; CommunityPlanning Act, 46; Crown Lands Act, 46; Department ofNatural Resources and Energy, 118, 259; Department ofthe Environment and Local Government (DELG), 45-47; Department of Tourism and Parks, 301, 302, 305;Water Quality Regulations, 46
Government of Nova Scotia: Coastal 2000, 249;Department of Agriculture and Fisheries, 345;Department of Natural Resources, 118, 123, 124, 259,287-289
Grand Anse Flat, NB, 111-112, 200-202, 204-207, 208,215-217
Grand Banks, 84
Grand Manan Basin, 89, 320-324
Grand Manan Island, NB, 88
Great Bay, NH, 224
Great Lakes, 11
Greenwood, NS, 71
ground-level ozone, 53
groundwater contamination, 53, 251 (see also, Watersheds)

395
Index
guidelines, 6, 8, 20-21, 45, 262, 264, 266, 269, 304, 358
Gulf of St. Lawrence, 80, 84
Gulf of Maine Biogeographic Information System(GMBIS), 58, 85
Gulf of Maine Council on the Marine Environment(GOMCME), 5, 9, 21, 22, 25, 83, 223-225, 249, 268;State of the Gulf of Maine Reports, 10, 22, 26;Gulfwatch, 15, 21, 24, 25, 26, 27, 55; EnvironmentalMonitoring Committee, 24
Gulf Stream, 67
Guyana, 113
Habitant River, NS, 124-125, 250, 253, 254-255
habitat, 15, 16, 19, 20, 53, 82, 222, 224-225, 271, 320,322; quality, 123, 215, 223, 309-312; restoration, 124-126; seascape classification system, 83-98
Haddock (Melanogrammus aeglefinus), 81-82, 84-87, 94,330
Hake, 321
Hants County, NS, 256
Hantsport, NS, 259, 346
Harbour Porpoise (Phocoena phocoena), 88, 93, 321,323-324
Harbourville, NS, 221
Harvard University: HEED approach, 14, 25, 27
health (ocean), 5-7, 11-13, 16, 20-21, 29
Herring (see Altantic Herring; Bluefin Herring)
Historical Canadian Climate Database (HCCD), 68
Hudson Bay, 112
Huntsman Marine Science Centre, St. Andrews, NB, 85
hydroelectric generation, 79, 104, 250 (see also,Orimulsion®)
ice phenology, 54, 57
Indian Island, NB, 163, 166
indicators, 3, 5-13, 15, 16, 18, 20-29, 45, 49-50, 181, 262-263, 266, 296, 310-312, 344, 358; “sentinel species”,26; species, 15, 21, 57
indices, 15, 24-26, 349; biological reference points(BRPs), 100-101
information and data, 5, 22-23, 27-29, 48, 52, 58, 59, 65,224, 267-273, 309-312, 328, 348; gathering, 58, 120,229, 269; knowledge gaps, 3, 269, 273, 311, 339 (seealso, Assessment; Indicators; Indices; Monitoring;Research)
inter-tidal zone (see Diatoms; Mudflats; Salt Marshes)
Interdepartmental Committee on Oceans, 20
International Council for the Exploration of the Seas(ICES), 311
International Maritime Organization (IMO), 10
invasive species, 16, 19, 53
Invertebrates, 54, 89, 195, 329, 341; amphipods, 75;annelids, 59; Capitella (sludge worm), 152; capitellidthread worm (Heteromastus), 217; Corophiumvolutator, 19, 112-113, 170-177, 178, 195, 200-202,206, 208-218, 222, 258, 342; crustaceans, 59;earthworms, 53, 54, 57; gastropods, 19; Green seaurchins (Strongylocentrotus droebachiensis), 10; lobster(Homarus americanus), 153-157, 159, 321, 330;mollusks, 24; Mud whelk (Ilyanassa obsoleta), 209;mussels (Mytilus edulis), 322, 343; Mya arenaria (soft-shell clam), 222; mysids, 86; periwinkles, 321;polychaetes (bait worms), 10, 19, 263; Rock crab(Cancer irroratus), 153-155, 158, 159, 321; scallops,321, 330; shellfish, 23, 26, 28 (see also, Echinoderms;Keystone species)
Irish Sea, 80
Johnson’s Mills, Chignecto Bay, 111-117, 302
Juncus gerardii, 188
Kejimkujik National Park, NS, 121
kelp, 343
Kentville, NS, 71
keystone species, 19, 83-87, 200, 214, 217
Kings Agricultural Wetland Conservation Initiative, 124-126
Kings County, NS, 124-126
Krill, 88, 322, 350
L’Etete Passage, NB, 328

396
Health of the Bay of Fundy: Assessing Key Issues
Labrador Current, 67
Labrador Shelf, 84
Lake Erie, 11
Lavaca Bay, Texas, 131
Least Sandpiper (Calidris minutilla), 111, 178
Lesser Yellowlegs (Tringa flavipes), 178
Letang Harbour, NB, 163, 166-169
Letang Inlet, NB, 329
Lichen, 54, 57
Lobster, see Invertebrates
Lords Cove, NB, 163, 166
Lorneville, NB, 43
Maces Bay, NB, 323
Macrozooplankton, 350
Mactaquac Headpond, NB, 100, 104
Mactaquac, NB, 77
Magaguadavic River, NB, 323, 328
Maine Council Mussel Watch Program (see GOMCME,Gulfwatch)
management, 11, 26-27, 65; collaboration, 46-47;community-based, 82, 285-290; ecosystem-based, 24,224-225, 323; integrated, 12, 18, 43-50, 177, 221, 223-225, 249, 262, 267, 269-270, 323, 340, 348, 358, 359,360, 361; oceans, 21, 44-45; tools, 39, 302
Manitoba, 113
Margaree River, NS, 104
marine debris, 160-169
marine environmental quality (MEQ), see Environmentalquality, marine
marine mammals, 21, 88, 161, 309
marine pollution, 44; harbours, 12; industrial effluent, 12,53, 177, 223, 322, 327, 332; land-based, 273, 322;landfills, 160, 163-164; long-range transport ofatmospheric pollutants, 322; nutrient loads, 16, 343;radioactive waste, 143, 148-149; sewage, 21, 23, 26,126, 177, 211, 230, 231, 235-238, 240, 242-247, 250,
281, 322, 324, 327, 332 (see also, Pulp and paperindustry; Watersheds, contamination and supply)
marine protected areas, 21, 83, 89, 118, 262, 293, 309,325, 348, 358 (see also Biosphere reserves)
marine resource management (seaweed), 99
Marine Biological Lab, Woods Hole, MA, 23
Marine Invertebrate Diversity Initiative (MIDI), 341
Maritimes Shorebird Surveys, 111
Maritrema subdolum, 178
Memramcook River, NB, 356
Minas Basin, 13, 60, 76, 77, 78, 112-113, 118, 124-125,154, 200, 211, 221-273, 286, 295, 357, 358, 360
Minas Basin Working Group, 22, 221, 223-227, 267-273,360; community forums, 226-247, 267-272
Minas Channel, 154
Minto, NB, 77
Minudie, NS, 208
Miramichi River, NB, 104
models and modelling, 18, 60, 65, 101, 146-147, 194, 208,349, 352; global climate (GCM), 66-69; HadleyGeneral Circulation (HADGCM), 69; referencecondition approach, 264; regional climate (RCM), 66;statistical downscaling (SDSM), 66-69; SUTRA, 142-143
Moncton, NB, 71
monitoring, 3, 5, 9, 17, 18, 24, 25, 26, 179, 180, 181-183,269, 283, 287, 293, 295, 304, 309-312, 328, 338;community-support, 54-55; ecosystem monitoringprotocols (EMPs), 52-53, 57; environmental effects(EEM), 24; Rapid Assessment of Marine Pollution(RAMP), 27; subsurface and surface water interaction,139-150; tools, 27, 54 (see also, Environment Canada,EMAN; Tourism)
Moses Mountain, NS, 346
Mount Allison University, 300
mudflats, 19, 60, 65, 112, 118, 120, 188, 195-196, 200-202, 208, 209, 214-217, 222, 258, 263, 273, 342, 357
Nappan, NB, 71

397
Index
National Audubon Society, 282
National Centers for Environmental Protection (NCEP)Reanalysis, 67-68
National Marine Fisheries Service (NMFS) (US), 85
National Oceanic and Atmospheric Administration(NOAA) (US), 15, 25; Musselwatch, 15, 24
National parks, see Fundy National Park; KejimkujikNational Park; Marine protected areas; Terra NovaNational Park
National Water Research Institute, 54
natural disaster mitigation, 65
Nature Conservancy of Canada (NCC), 118-119, 124, 259,302; conservation blueprint, 118
Nature reserves, see Marine protected areas
Nelson’s Sharp-tailed Sparrow (Ammodramus nelsoni),120
New Bedford, MA, 310, 314-319
New Brunswick, 10, 45-49, 84, 99, 154, 353-355 (seealso, Government of New Brunswick)
New England, 120, 154
Newfoundland and Labrador, 84, 154
Newfoundland Shelf, 84
non-living resources (minerals), 23, 223
Nordic Council of Environment Ministers, 15
North Atlantic Right Whale Consortium, University ofRhode Island, 85 (see also, Whales, North AtlanticRight whale)
North Atlantic Salmon Conservation Organization, 76
Norwegian Sea, 79
Nova Scotia, 10, 80, 84, 154, 221 (see also, Governmentof Nova Scotia)
Nova Scotia Nature Trust, 259-261
Ocean Biogeographic Information System (OBIS), 58
Oceans Act (Canada), 6, 21, 44, 249, 262, 267, 348, 358,359, 361
Ontario, 54, 113
Orimulsion®, 170-176
Pacific Area Tourism Association, 282, 284
Parrsboro, NS, 155, 285
Partridge Island, NS, 221
Passamaquoddy Bay, NB, 9, 10, 13, 129-137, 152, 160,161, 166-169, 224, 321, 328-330, 332-333, 343
Pecks Cove Marsh, NB, 188-193
Pereau River, NS, 124-125, 250, 253, 254-255
Peregrine falcon (Falco peregrinus), 215
Petitcodiac Causeway, NB, 215
Petitcodiac River, NB, 10
Phytoplankton, 320, 322, 350 (see also, chlorophyll a;Diatoms)
planning, 18, 45-50, 311 (see also, Management)
Plantago maritima, 188
Pocologan Harbour, NB, 163, 166
Pollock (Pollachius virens), 81-82, 84, 86-87, 94, 97, 321,330
population growth, 311
Port Granby, ON, 143
Port Greville, NS, 286, 289
precautionary principle, 44, 301, 359
primary productivity and nutrients, 15
Prince Edward Island, 84, 154
public education, 179, 180, 226-227, 231-232, 236-241,251-252, 273, 293, 296, 301-303, 312, 338, 340, 348
Pubnico, NS, 154
Puccinellia maritima, 188
pulp and paper industry, 24, 332; effluents, 130, 322, 327(see also, Forestry practices)
Quebec, 113
Rainbow Smelt (Osmerus mordax), 84, 86, 88, 94, 330
Ramsar Convention, 125, 222
398
Health of the Bay of Fundy: Assessing Key Issues
recreation, 15, 18, 44, 160, 230, 231, 235-238, 240, 242-247, 250, 254, 259, 261, 323
Red Knot (Calidrius canutus), 111
Red-necked Phalarope (Phalaropus lobatus), 9
“regime shifts”, 15
Regional Association for Research on the Gulf of Maine(RARGOM), 10, 23
remediation, 19, 29, 182, 323
remote sensing, 65
research, 6, 9, 20, 83, 293, 295-296, 310, 312, 340; needs,27, 164, 216, 225, 231, 236-241, 251-252, 303, 339;student participation, 181, 304 (see also, Assessment;Monitoring)
resilience, 8-9, 12-13, 17, 25
risk analysis and management, 20, 182, 351
Rockweed (Ascophyllum nodosum), 19, 99, 321, 322, 323
Sackville, NB, 83 (see also, Tantramar Marsh)
St. John River, NB, 101
Saint John, NB, 10, 13, 71, 153, 154
salamander, 54, 57
Salmon River, NS, 226, 272
salt marshes, 9, 10, 118, 120, 123, 125-126, 187-188, 194,273, 338, 344-346, 352; reclamation, 256-257
San Francisco Bay, CA, 11
Sandy Island, NB, 163, 166
satellite imagery: LIDAR, 60, 65; CASI, 60
Scheldt Estuary, North Sea, 131
Scotian Shelf, 5, 21, 24, 83, 84, 89, 341
sea level change, 19, 65, 140-141, 143-144, 145; crustalsubsidence, 63; tectonic changes, 64
Seabirds, see Shorebirds
Seaweed, 177, 222, 320 (see also, Rockweed)
sediments, 9, 20, 26, 28, 57, 129-132, 151, 153, 158, 170-177, 195, 200-202, 204, 205, 209, 210-211, 214-217,263, 309, 322, 329, 353-355; deposition, 194, 352;SSC, 187-190, 194
Semipalamated Plover (Charadrius semipalmatus), 178,258
Semipalamated Sandpiper (Calidris pusilla), 111-118,178, 201, 209, 215, 222, 258, 279
sensitive areas, 348 (see also Marine protected areas)
severe storms, 14
Shad, see American Shad
Sharks, 322; Basking Shark (Cetorhinus maximus), 85, 87,92; Sand Tiger Shark (Carcharias taurus), 92; WhiteShark (Carcharodon carcharias), 92
Shearwater, NS, 75
Shepody Bay, NB, 10, 118, 154, 342
Ship Harbour, NB, 163, 166
shipping, 5
Shorebirds, 9, 54, 111-118, 178, 195, 201-202, 209, 214,302-303, 321, 323, 342; migratory behaviour, 19, 112,213, 215, 222, 258-261; population declines, 111-113,120, 208, 217-218
Short-billed Dowitcher (Limnodromus griseus), 111, 178
Shortnosed Sturgeon (Acipenser brevirostrum), 87, 92
Shubenacadie River, NS, 101, 223
Simon Fraser University, 350
Skate: Barndoor Skate (Dipturus laevis), 87, 92; ThornySkate (Amblyraja radiata), 87, 92
Smelt, see Rainbow Smelt
Snow Goose (Chen caerulescens), 302
South America, 258
Southern Bight, Minas Basin, 221-222
Spartina: Spartina alterniflora, 188, 344-346, 357;Spartina patens, 188; Spartina pectinata, 120
species diversity, distrubution and abundance, 15, 17, 58,84, 89, 222, 320-324
Spelotrema papillorobustum, 178
Spiny Dogfish (Squalus acanthias), 84, 86, 87, 94, 321
Spotted Sandpiper (Actitis macularia), 111
Spotted Wolffish (Anarhichas minor), 92
399
Index
St. Andrews, NB, 85
St. Croix River, NB, 131, 137, 161, 322, 323, 327-330
St. John’s, NL, 71
St. Lawrence River, 221
St. Mary’s Bay, NS, 10
Starr’s Point, NS, 217
Status and trends analysis, 26 (See also GOMCME,Gulfwatch)
stewardship, 44, 47-48, 123, 295; citizen, 18, 258-261,306
Stewiacke River, NS, 75-77
storm surges, 60, 63, 65, 222
stress, 9, 13, 16, 20, 28, 52, 324; anthropogenic, 19
Striped Bass (Morone saxatilis), 330
sustainability, 3, 8-9, 25, 44-45, 46, 48, 49-50, 59, 180,221, 223, 224-226, 248, 301, 311
sustainable development, 44, 228, 359
Swordfish, 322
Tantramar Marsh, NB, 188-192, 303
Tantramar River, NS, 188
Terence Bay, NS, 154
Terra Nova National Park, NL, 121
tidal barriers, 9-10, 17, 19, 26, 76, 120, 123, 215, 223,250, 272, 273, 322, 338, 344-346; restriction audits, 10,256-257, 356
tides, 25, 63, 64, 118, 131, 163, 187, 190, 192, 221, 279,320, 328
Timber Cove, NB, 163, 166
Tonga, 143, 149-150
tourism, 18, 19, 28, 44, 161, 222, 230, 231, 235, 238, 240,242-247, 277-291, 301-306, 332; Bay of FundyEcotour, 281; codes of conduct, 281-282; community-based, 285-290, 304; cruise ships, 303; cultural andheritage assets, 277-279; eco-labeling, 282-283;environmental auditing, 283; partnerships, 300;sustainable practices, 281-284, 305-306 (see also,Whale watching)
Tourism Industry Association of Canada, 282
Tourism Industry Association of Nova Scotia, 283
toxic chemicals in fog, 26
traditional knowledge, 52, 81-82, 348
transportation corridors, 10, 53
Triglochin maritimum, 188
tuna, 322
Tusket River, NS, 101
Tychoplankton, 195, 202, 207
United States Environmental Protection Agency, 8
United States Fish and Wildlife Service, 259
United States Food and Drug Administration, 28
Upper Bay of Fundy Biosphere Initiative, 230, 231, 235,238, 240, 243-244, 247, 267, 269, 292, 295-296, 300,303
upwelling, 86, 87, 88
urbanization, 9, 12, 44, 123, 230, 231, 235-237, 239, 242-247, 250, 261, 310, 311
UV-B radiation, 52, 53
Valley Watershed Stewardship Association, 124
Victoria Beach, NS, 154, 155
Vigo, Spain, 80
Walton Beach, NS, 170-176
watersheds: contamination and supply, 124-126, 140-144,248, 250, 254-255; planning and management, 248-252,269
West Allen Creek Marsh, NB, 188-192
West Cumberland County, NS, 285-290
West Isles (Quoddy), NB, 161, 163, 166-169, 320-324,332
Westcock Marsh, NB, 188-193
Western Hemisphere Shorebird Reserve, 125, 222
Western Passage, NB, 328
wetlands, 120, 123, 124-126, 222, 322 (see also, Saltmarshes)

400
Health of the Bay of Fundy: Assessing Key Issues
Whales, 84, 88-89, 321; Fin Whale (Balaenopteraphysalus), 88, 93, 279; Humpback Whale (Megapteranovaeangliae), 88, 93, 279; Killer Whale (Orcinusorca), 88, 93; Long-finned pilot Whale (Globicephalamelas), 88, 93; North Atlantic Right Whale (Eubalaenaglacialis), 9, 10, 88-89, 93, 223, 279; Sei Whale(Balaenoptera borealis), 88, 93
whale watching, 28, 302, 323; accreditation programs,304; code of ethics, 282, 304
White-beaked Dolphin (Lagenorhynchus albirostris), 88,93
Wildlife Habitat Canada, 124, 259
Willet (Catoptrophorus semipalmatus), 120
Windsor, NS, 10, 357 (see also, Tidal barriers)
Winter Flounder (Pleuronectes americanus), 84, 86, 94,98, 222
Wolves Bay, NB, 323
Wood Point, NB, 352
World Travel and Tourism Council, 282, 284
World Wildlife Fund (WWF), 83, 85, 89
Worldwatch Institute, 311
Yarmouth, NS, 10
Zooplankton, 86, 88, 89, 100, 350

401
Index
Other reports in the Series:
Report No.
1. Atlantic Maritime Ecozone Research and Monitoring, Workshop Proceedings, March 1993 (outof print)
2. Ecological Monitoring and Research at Kejimkujik National Park, 1978-1992 (out of print)
3. Kejimkujik Watershed Studies: Monitoring and Research Five Years After “Kejimkujik ’88”
4. Ecological Monitoring and Research in the Coastal Environment of the Atlantic MaritimeEcozone, Workshop Proceedings, Huntsman Marine Laboratory, March 9-11, 1994 (out of print)
5. Ecological Monitoring and Research in Atlantic Canada: A Focus on Agricultural Impacts inPrince Edward Island
6. Science and Policy Implications of Atmospheric Issues in Atlantic Canada, Workshop Proceed-ings, Halifax, NS, November 28-30, 1995
7. Canada Goose Studies in the Maritime Provinces 1950-1992, Compiled by Anthony Erskine,January 1997 (date of Pub. March 1997)
8. Bay of Fundy Issues: a scientific overview, Proceedings of a Workshop, Wolfville, NS, January29 to February 1, 1996 (date of Pub. March 1997)
9. Climate Change and Climate Variability in Atlantic Canada, Proceedings of a Workshop, Halifax,NS, December 3-6, 1996 (date of Pub. March 1997)
10. Trends of Acid Precipitation Chemistry Variables in some Atlantic Canada National Parks (dateof Pub. April 1997)
11. Using Environmental Prediction in Ecosystem Science in Atlantic Canada, Workshop Proceed-ings, Halifax, NS (date of Pub. March 1998)
12. Understanding Change in the Bay of Fundy Ecosystem, Workshop Proceedings, Sackville, NB(April 22-24, 1999)
13. Climate Change and Ecosystem Research in Canada’s North, A report to the Northern EcosystemInitiative Management Team, by Thomas A. Clair (March 2000, English/français)
14. Acid Precipitation Lake Monitoring Program in Canada’s Atlantic Provinces (March 2000,Report in CDROM format)
15. Multi-disciplinary Study of Metal Cycling, Primarily Hg, in Aquatic and Terrestrial Environ-ments, Workshop Proceedings, Sackville, NB (March 2000)

402
Health of the Bay of Fundy: Assessing Key Issues
16. Environment Canada’s Acid Precipitation Monitoring Networks in Atlantic Canada (March 2001,Report in CDROM format)
17. Opportunities and Challenges for Protecting, Restoring and Enhancing Coastal Habitats in theBay of Fundy. Proceedings of the 4th Bay of Fundy Science Workshop, Saint John, NB, Septem-ber 19-21, 2000
18. Cycling of mercury in Kejimkujik National Park. Toxic Substance Initiative Project/124 Sum-mary, December 2001
19. Petitcodiac River/Estuary Modelling Workshop Summary, Moncton, New Brunswick, Canada,March 3 to 5, 2002
20. Atlantic Canada National Park Aquatic Resources Inventories, Kejimkujik, Gros Morne and CapeBreton Highlands. Republished from: J. Kerekes and P Schwinghamer