workplace fatalities and self reports · health and safety executive the costs to britain of...
TRANSCRIPT

Health and Safety Executive
The costs to Britain of workplace injuries and work-related ill health in 2006/07 Workplace fatalities and self reports
Prepared by Risk Solutions for the Health and Safety Executive 2011
RR897 Research Report

Health and Safety Executive
The costs to Britain of workplace injuries and work-related ill health in 2006/07 Workplace fatalities and self reports
Risk Solutions Dallam Court Dallam Lane Warrington WA2 7LT
This research report presents an updated method for estimating the aggregate ‘costs to Britain’ of workplace injuries and new cases of work-related ill health, along with updated unit costs associated with an individual workplace injury or new case of ill health (‘appraisal values’).
The previous aggregate cost estimates were produced for 2001/02 and the previous unit cost estimates were in 2006 prices. The unit costs had developed separately and with a slightly different methodology to the aggregate costs and so were not strictly comparable.
This report provides a comprehensive update of the costs to Britain analysis, and includes:
n An improved cost estimation methodology, making best use of the data available at the time the project was undertaken.
n As close an estimate as possible of the aggregate costs to Britain of workplace fatalities, workplace injuries, and new cases of work-related ill health associated with working conditions in the financial year 2006/07.
n Corresponding estimates of the appraisal values for 2006/07 that are fully consistent with the aggregate cost estimates.
n Putting the aggregate costs and appraisal values on the same footing by calculating both in a single integrated spreadsheet model.
This report and the work it describes were funded by the Health and Safety Executive (HSE). Its contents, including any opinions and/or conclusions expressed, are those of the authors alone and do not necessarily reflect HSE policy.
HSE Books

© Crown copyright 2011
First published 2011
You may reuse this information (not including logos) free of charge in any format or medium, under the terms of the Open Government Licence. To view the licence visit www.nationalarchives.gov.uk/doc/open-government-licence/, write to the Information Policy Team, The National Archives, Kew, London TW9 4DU, or email [email protected].
Some images and illustrations may not be owned by the Crown so cannot be reproduced without permission of the copyright owner. Enquiries should be sent to [email protected].
ii

Summary The Health and Safety Executive (HSE) wishes to produce updated annual estimates of: (i) The aggregate ‘costs to Britain’ of workplace injuries and new cases of work-related
ill health, and (ii) The unit costs associated with an individual workplace injury or new case of ill
health, which HSE refers to as ‘appraisal values’. HSE currently relies on estimates from 2001/02 for aggregate costs, whilst appraisal values are more recent (Quarter 3 2006). The two estimates have developed separately however, and are based on different methodologies. This report therefore provides a comprehensive update of the costs to Britain analysis, and has the following principal objectives: • To improve the cost estimation methodology by making best use of the data
currently available • To provide as close an estimate as possible of the aggregate costs to Britain of
workplace fatalities, workplace injuries, and new cases of work-related ill health associated with working conditions in the financial year 2006/07
• To provide corresponding estimates of the appraisal values for 2006/07 that are fully consistent with the aggregate cost estimates
• To put the aggregate costs and appraisal values on the same footing by calculating both in a single integrated spreadsheet model.
Methodology The spreadsheet model aims to cost, as closely as possible, the injury and ill health outcomes associated with health and safety working conditions in 2006/07. This is relatively clear-cut for injury, since all cases of fatal and non-fatal injuries within a year relate to health and safety failings in that same year, although their consequences sometimes extend into future years. For health outcomes however it is more difficult. Some health outcomes result from prolonged exposure to certain working conditions rather than a single one-off exposure, and there can be a considerable time lag between exposure to a hazard and the eventual presentation of symptoms (several decades in the case of some cancers). The approach adopted to best capture costs arising from current working conditions has been to limit the estimate of the annual number of work-related ill health cases to self-reports of ‘newly-occurring’ cases (or incidence cases) of work-related ill health in people who have worked in the last 12 months. This represents a significant refinement to previous cost estimates, where both new and pre-existing cases of ill health were included. The Labour Force Survey (LFS) is used to estimate the number of cases of non-fatal workplace injury and work-related ill health, with estimates of fatal injuries sourced from statutory reports under the Reporting of Injuries, Diseases and Dangerous Occurrences Regulations (RIDDOR). The LFS is a very good source for estimating the incidence of common work-related injuries and ill health conditions, but it is severely limited in terms of measuring the much rarer long latency conditions such as occupational cancers or chronic obstructive pulmonary disease. One reason for this is that LFS estimates are based on individual’s self-assessment of the link between their newly occurring ill health and their work (which for long-latency diseases will include work from many years ago). Separate research has been commissioned by the HSE to estimate the current and future burden of occupational cancer. Although the numbers per year are relatively small, they would result in a high additional cost to society because of the large proportion that lead
iii

to premature death. As with previous estimates, the aggregate costs of ill health in this report are therefore an underestimate, and it is strongly recommended that research continues into the cost of long latency occupational diseases. The cost model identifies three distinct groups who bear the costs of injury and ill health: the individuals directly affected; their employers; and the government which pays for shared services such as the cost of NHS treatment and the administration of state benefit schemes. Separate totals have been calculated for each of these three groups and an overall cost to society is determined, net of transfers between one grouping and another. For example sick pay represents a cost to the employer but is an equal and opposite benefit to the individual who receives it (see Table 2). Appraisal values (unit costs) are calculated by dividing the aggregate costs to society in each category in 2006/07 by the number of new cases in that category in 2006/07.
Costs to society as a whole The total costs to society of workplace fatalities, workplace injuries and work-related ill health is estimated to be between £14.7 billion and £18.3 billion in 2006 prices (90% confidence interval), with a central estimate of £16.5 billion. As with previous studies, this excludes costs associated with road traffic accidents as these are not reportable under RIDDOR and are outside the remit of the HSE. Approximately £9.3 billion of this represents an estimate of the subjective value, expressed in money terms, that individuals would be willing to pay, over and above the direct financial consequences of such incidents, to avoid the adverse outcomes being realised and thereby avoiding the associated personal ‘pain, grief and suffering’ and loss of wellbeing to themselves, their friends and families. We shall refer to this element as the ‘non-financial human costs’. It is important to note that the ‘non-financial human costs’ are strictly speaking ‘values’, being the value that society would theoretically have been willing to pay before the event, to reduce the risk of the fatalities, injuries and cases of ill health in that year. These non-financial ‘values’ are not therefore representative of the damages that are actually borne by the individual, their family and friends after the event. For most people no amount of money could be compared to the death, serious illness or serious injury of a family member. Of the remaining direct financial costs, approximately £3.4 billion is actually incurred in 2006/07 and £3.8 billion is the net present value of future costs (e.g. future losses of gross output for those who never return to work). The breakdown of this aggregate estimate by injury and ill health, along with the estimated annual incidence of workplace injury and work-related ill health in 2006/07, and the corresponding appraisal values are summarised in Table 1.
iv

Table 1: Estimated annual incidence of workplace injury and work-related ill health and corresponding aggregate cost and appraisal values for 2006/07
Estimated annual incidence in
2006/071
Aggregate cost to society
£ million
Appraisal value for a single injury
or illness £
Workplace fatality 232 337 1,452,000
RIDDOR reportable injury (major or over three calendar days)
353,000 6,263 17,700
Non-reportable injury (three or fewer calendar days)
481,000 118 240
Ill health 551,000 9,764 17,700
Note1: Non-fatal injury and ill health incidence are rounded to the nearest 1,000. The fatality estimate is the RIDDOR reported annual average for 2005/06 to 2007/08; the nonfatal injury estimates are from the Labour Force Survey estimated annual average for 2006/07 to 2007/08; the ill health estimate is from the Labour Force Survey estimated annual average for 2005/06 to 2007/08.
Not surprisingly, the appraisal value for a fatality is substantially higher than for other injury and ill health types, reflecting the high ‘non-financial human cost’ of premature death. Correspondingly, non-reportable injury (i.e. resulting in three or fewer days away from work) has a relatively low appraisal value reflecting both the low ‘non-financial human cost’ and also the limited direct financial costs incurred. The difference in the aggregate cost between reportable injury and work-related ill health is driven by the difference in the underlying incidence, with the appraisal value for both being similar to three significant figures.
Costs to separate cost bearing groups The analysis below shows how the aggregate costs in 2006/07 are shared between three groups: individual employees directly affected; their employers; and the government. The total cost to individuals is estimated to be between £8.9 billion and £11.2 billion (90% confidence interval) in 2006 prices, with a central estimate of £10.1 billion. Out of this total, the major cost components are as follows: £1.7 billion is the financial cost of lost earnings (net of replacement income from sick pay and benefits) plus medical and administration costs; £9.3 billion is an estimate of the ‘non-financial human costs’; and £0.9 billion is the net financial compensation received from employers’ insurance to partially offset these costs. The total cost to employers is estimated to be between £3.0 billion and £3.2 billion (90% confidence interval) in 2006 prices, with a central estimate of £3.1 billion. Out of this total, the major cost components are as follows: £1.1 billion is for sick pay and £1.6 billion is for insurance premiums.
v

The total cost to the government is estimated to be between £2.7 billion and £4.0 billion (90% confidence interval) in 2006 prices, with a central estimate of £3.3 billion. Out of this total, the major cost components are as follows: £1.7 billion is for state benefits paid to those unable to work as a result of their ill health or injury; £1.0 billion is the reduction in income tax and national insurance received by the exchequer; and £0.7 billion is the cost of medical treatment and rehabilitation borne by the NHS. Figure 1 shows that 61% of the aggregate cost in 2006/07 was borne by the individual, with the remaining cost shared almost equally between the employer and the government.
Individual £10.1 bn
(61%)
Employer £3.1 bn (19%)
Government £3.3 bn (20%)
Figure 1: Aggregate cost of workplace injuries and work-related ill health in 2006/07 by cost bearer
A full summary of the aggregate costs by cost bearer is given in Table 2 overleaf.
vi

Tabl
e 2:
Bre
akdo
wn
of a
ggre
gate
cos
ts b
y co
st b
eare
r
Indi
vidu
al a
nd h
is /
A.
£m
B. E
mpl
oyer
£m
C
. Gov
ernm
ent
£m
D. S
ocie
ty a
s£m
he
r dep
ende
nts
a
who
le=
A +
B +
C
Loss
of I
ncom
e
Loss
of g
ross
fam
ily-5
,468
-5
,468
ea
rnin
gs
OS
P/S
SP
rece
ipts
1,
145
O
SP
/SS
P p
aym
ents
-1,1
37
SS
P re
imbu
rsem
ents
-8
0
net o
f rei
mbu
rsem
ents
Sta
te b
enef
it re
ceip
ts
1,67
1
Sta
te b
enef
its-1
,671
0
paym
ents
Inco
me
tax
and
NI n
ot1,
133
Nat
iona
l Ins
uran
ce
-147
N
et in
com
e ta
x an
d N
I-9
86
0 pa
id o
n lo
wer
inco
me
paid
on
OS
P/S
SP
re
duct
ion
Com
pens
atio
n E
L in
sura
nce
rece
ipts
917
EL
insu
ranc
e -1
,559
-6
42
net o
f leg
al c
osts
pr
emiu
ms
Non
-fina
ncia
lM
onet
ised
val
ue o
f-9
,301
-9
,301
hu
man
cos
t no
n-fin
anci
al h
uman
cost
s
Pro
duct
ion
Wor
k re
orga
nisa
tion
-67
-67
Dis
turb
ance
Rec
ruitm
ent a
nd
-74
-74
indu
ctio
n co
sts
for
tem
pora
ry /
perm
anen
tre
plac
emen
t sta
ff
Hea
lth a
nd
Out
of p
ocke
t fun
eral
-79
NH
S tr
eatm
ent a
nd
-723
-8
02
Reh
abili
tatio
n
expe
nses
, tra
vel
reha
bilit
atio
n co
sts
expe
nses
, pre
scrip
tion
(sho
rt an
d lo
ng te
rm)
char
ges,
hom
e ex
pens
es.
vii

Indi
vidu
al a
nd h
is /
A.
£m
B. E
mpl
oyer
£m
C
. Gov
ernm
ent
£m
D. S
ocie
ty a
s£m
he
r dep
ende
nts
a
who
le=
A +
B +
C
Pro
porti
on o
f ind
ivid
ual
-46
Pro
porti
on o
f cor
pora
te
-48
Val
ue o
f tre
atm
ent a
nd
73
-21
priv
ate
heal
th
priv
ate
heal
th
reha
bilit
atio
n co
vere
d in
sura
nce
prem
ium
sin
sura
nce
prem
ium
sby
priv
ate
heal
th
attri
buta
ble
to w
ork
attri
buta
ble
to w
ork
insu
ranc
e cl
aim
s re
late
d ill
hea
lth /
inju
ry
rela
ted
ill h
ealth
/ in
jury
Adm
inis
tratio
n
Adm
inis
tratio
n of
-10
Adm
inis
tratio
n of
SS
P
-23
Adm
inis
tratio
n of
SS
P
-27
-60
and
lega
l in
sura
nce,
/ OS
P, i
nsur
ance
and
an
d be
nefit
s cl
aim
s co
mpe
nsat
ion
and
com
pens
atio
n cl
aim
s be
nefit
cla
ims
Insu
ranc
e co
mpa
ny-1
4 -1
4 pr
ofit
mar
gin
and
adm
inis
tratio
n co
sts
on
othe
r ins
uran
ce
prod
ucts
HS
E o
r LA
-2
0 H
SE
or L
A
-13
-33
inve
stig
atio
n /
inve
stig
atio
n /
pros
ecut
ion
– in
tern
alpr
osec
utio
n –
inte
rnal
cost
s an
d le
gal c
osts
. co
sts
Fine
s pa
id
-14
Fine
s re
ceiv
ed
14
Tota
l cos
ts
-10,
052
-3,0
89
-3,3
41
-16,
482
Not
e: M
oney
out
flow
s ar
e sh
own
in re
d as
neg
ativ
es a
nd in
flow
s in
bla
ck a
s po
sitiv
es.
The
net c
ost t
o so
ciet
y is
the
sum
of c
olum
ns A
, B a
nd C
. K
ey
Abbr
evia
tions
: OSP
– O
ccup
atio
nal S
ick
Pay;
SSP
-St
atut
ory
Sick
Pay
; NI –
Nat
iona
l Ins
uran
ce; E
L –
Empl
oyer
s’ L
iabi
lity
Insu
ranc
e; H
SE
– H
ealth
and
Safe
ty E
xecu
tive;
LA
– Lo
cal A
utho
rity
0
viii

Acknowledgements This report was written for HSE by Chris Rees, Ian Dunbar, Mike Robertson and Michelle Boath of Risk Solutions, with significant contributions from Professor Graham Loomes (University of Warwick), Michael Spackman (Economics consultant), Dr Lesley Rushton (Imperial College), Anna Barnes, Ian Spencer and Heidi Edwards (HSE). Independent peer review was provided by Professor Mike Jones-Lee (University of Newcastle). We would like to acknowledge the considerable help and support provided by our HSE steering group during this project: Anna Barnes, Heidi Edwards, Alan Spence, Stavros Georgiou, Ian Spencer, Gavin Thompson and Anne Marie Grey.
ix

x

Table of Contents
1 Introduction 1
2 Scope and structure of analysis 2
3 Incidence of fatalities, injuries and ill health 5
4 Costs to individuals 10
5 Costs to employers 17
6 Costs to the government 23
7 Overall costs to society 27
8 Appraisal values 33
9 Priorities for further research 35
Appendix 1: Sources of replacement income 37
Appendix 2: Medical costs 41
Appendix 3: Non-financial human costs 45
Appendix 4: Regional and sectoral breakdown 52
Appendix 5: Methodological differences from previous studies 63
xi

xii

1 INTRODUCTION
1.1 The Health and Safety Executive (HSE) first produced aggregate estimates of the costs to Great Britain of workplace accidents and work-related ill health for 1990/91 in a seminal report by Davies and Teasdale1, separately identifying costs to the individual, to the employer and to society as a whole. These estimates were updated for 1995/96 by Gordon and Risley2, with an interim update for 2001/023 providing the most recent estimates.
1.2 The aggregate cost estimates of workplace accidents and work-related ill health are used for a range of purposes by HSE and other stakeholders, including: • To inform strategic policy and new programme development • To evaluate the scale of the problem and to provide evidence to the Treasury during
spending reviews • To address queries from other government departments; the press; private sector
organisations; employer organisations; trade unions; academics and the public. 1.3 HSE also produces estimates of the unit costs to society of individual workplace injuries and
work-related ill health4. These are referred to as the appraisal values, and are used to value the benefits of HSE interventions for the purpose of impact assessments. The methodology has developed separately to that for the aggregate costs so the two are not strictly comparable. The most recent estimates available are for Quarter 3, 20065.
1.4 The wide usage of these cost estimates highlights their importance both within and outside of HSE. The purpose of this report therefore is to provide a comprehensive update of the costs to Britain analysis, with the following principal objectives: • To improve the cost estimation methodology to make best use of the data currently
available • To provide an estimate of the aggregate cost to Britain of workplace fatalities, workplace
injuries, and work-related ill health for the financial year 2006/07 • To provide corresponding estimates of the appraisal values for 2006/07 that are fully
consistent with the aggregate cost estimates • To put the aggregate costs and appraisal values on the same footing by calculating both
in a single integrated spreadsheet model. 1.5 The cost estimates for 2006/07 will not be entirely comparable with previous years’ estimates
due to refinements in the methodology adopted. The Appendices explain the methodology in more detail, with Appendix 5 providing specific details on the main methodological differences that have been introduced.
1 Davies, NV and Teasdale, P, 1994. The costs to the British economy of work accidents and work related ill health. HSE Books ISBN 0 7176 0666 X
2 Gordon, F, Risley, D, and EAU economists, 1999. The costs to Britain of workplace accidents and work related ill health in 1995/96. Second Edition. HSE Books ISBN 0 7176 1709 2
3 Interim update available on-line at: http://www.hse.gov.uk/statistics/pdf/costs.pdf. 4 The Gordon and Risley analysis included an estimate of the aggregate costs of non-injury accidents, but unit costs
have never been presented for non-injury accidents because they are highly uncertain 5 HSE Economic Analysis Unit Appraisal Values available on-line at:
http://www.hse.gov.uk/economics/eauappraisal.htm
1

2 SCOPE AND STRUCTURE OF ANALYSIS
Workplace fatalities, workplace injuries, and work-related ill health 2.1 The analysis presented in this report is based on the estimated annual incidence of workplace
fatalities and the estimated annual incidence of self-reported workplace injuries and self-reported work-related ill health in Great Britain for the financial year 2006/07.
2.2 The number of workplace fatalities each year is determined from employer notifications under the Reporting of Injuries, Diseases and Dangerous Occurrences Regulations 1995 (RIDDOR)6, which are assumed to be fully comprehensive. However, reporting of non-fatal injuries under RIDDOR is known to be less complete and the coverage of illness is restricted to a defined list of diseases only.
2.3 Information about non-fatal workplace injuries and work-related ill health (including those who permanently withdraw from the workforce) has therefore been sourced from two HSE sponsored questionnaire modules attached to the national Labour Force Survey (LFS). The LFS is a national survey of households living at private addresses in the UK – consisting currently of about 53,000 responding households each quarter and is managed by the Office for National Statistics in Great Britain. HSE includes questions to gain a view of work-related ill health and workplace injury based on individual’s perceptions. 7
2.4 For this study, a workplace fatality is defined as the death of an employee or a self-employed person whilst at work. A notable exclusion to workplace fatalities under RIDDOR is deaths arising from road traffic accidents involving people travelling in the course of their work8; these are outside the remit of HSE.
2.5 Similarly, a workplace non-fatal injury is an injury suffered by an employee or self-employed person whilst at work. Again, the definition excludes injuries arising from road traffic accidents. Non-fatal injuries are divided into three main types, mirroring (as far as possible) the classification used in RIDDOR: • Reportable major injury – an injury broadly falling into one of the categories described in
Schedule 19 of the regulations • Reportable over three day injury – an injury which is not ‘major’ but results in the injured
person being away from work for more than three calendar days • Non-reportable under three day injury – all other injuries which result in three or fewer
calendar days away from work. (These injuries although not reportable under RIDDOR are captured by the LFS and do have a cost associated with them).
2.6 Work-related ill health is defined as individuals suffering new cases (as opposed to preexisting conditions) of ill health10 in the previous 12 months which they ascribe as being caused or made worse by work. This estimate is limited to people who have worked in the last 12 months (in order to limit the number of cases caused by working conditions some years ago).
6 A guide to the Reporting of Injuries, Diseases and Dangerous Occurrences Regulations 1995, Third Edition 2008, HSE books ISBN 978 0 7176 6290 6
7 Labour Force Survey, technical note available on HSE website, see: http://www.hse.gov.uk/statistics/lfs/technicalnote.htm
8 Other exclusions include accidents reportable under separate merchant shipping, civil aviation and air navigation legislation; and accidents to members of the armed forces.
9 Major Injuries are defined in Schedule 1 of RIDDOR. The categories available in the LFS have been grouped to mirror this definition as closely as possible, and include: Limb fractures, amputations, dislocations of the shoulder/hip/knee/spine, temporary or permanent eye injuries, and the catch-all category of ‘other major injuries’ that include injuries leading to hypothermia, heat induced illness or unconsciousness or requiring resuscitation or admittance to hospital for more than 24 hours.
10 This includes any illness, disability or other physical or mental problem.
2

2.7 Each year, a number of workers will withdraw from the labour force as a result of their workplace injuries or work-related ill health. It is likely that whilst for some individuals their injury or ill health will be so severe that they withdraw from the labour force at the time of their injury or ill health diagnosis, others will leave the labour force at some time in the future as their injury or ill health becomes more debilitating.
2.8 The costs associated with this group will be high – the fact that they are debilitated to the extent that they permanently leave the labour market implies a high non-financial human cost. Also, they will incur loss of income for the rest of their working life. The source of information for this group is also the LFS, and problems associated with this data are discussed further in Section 3.
Long latency occupational diseases 2.9 The LFS is a very good source of information for estimating the incidence of common work-
related injuries and ill health conditions, but it is limited in terms of capturing the much rarer long latency conditions such as cancers or chronic obstructive pulmonary disease, primarily because of the difficulty in respondents attributing these diseases to occupational or non-occupational exposures. The HSE publishes detailed statistics on mesothelioma arising from workplace exposure to asbestos11, and Imperial College is currently undertaking a major research study for the HSE on the full range of occupational cancers12 . Although the numbers per year are relatively small, they would result in a high additional cost to society because of the large proportion that lead to premature death, although it is not yet possible to quantify what the cost would be. The aggregate cost estimates for ill health in this report are therefore an underestimate. HSE has put in motion a short piece of research into the cost to society of long latency occupational diseases and it is intended that these additional costs will be included in future updates of the Costs to Britain report.
Impact on different parties and aggregate cost structure 2.10 The total costs to society include those borne by the individuals directly affected; the
employers directly affected; and the government who pay for general services such as the cost of NHS treatment and the administration of state benefit schemes. The analysis presented here only considers first-order effects; any second-order effects such as employers or government passing on the costs of workplace injury and ill health in the form of higher prices or taxation have not been considered.
2.11 The total cost to society is not a simple sum of the individual cost elements because a number of the payments involved are money transfers, for example state benefits represent income to individuals but are a cost to the government. The Gordon & Risley report presented only the net effect of these transfer costs, but for greater clarity we have chosen to show the money inflows and money outflows between each party as well as the net position, assuming that equal and opposite money transfers sum to zero and have no net social cost other than the administrative overhead. This is discussed further in Section 7.
11 HSE Mesothelioma statistics available on-line at: http://www.hse.gov.uk/statistics/causdis/mesothelioma/index.htm 12 HSE research project: The burden of occupational cancer in Great Britain. Available at:
www.hse.gov.uk/research/rrhtm/rr800.htm Also, see Rushton, L, Bagga S, Bevan R, Brown TP, Cherrie JW, Fortunato L, Holmes P. Slack R, Van Tongeren M, Young C, Hutchings S J. Occupation and Cancer in Britain. British Journal of Cancer 2010: 102: 1428 – 1437. This research has so far focussed on the current burden of occupational cancer, which inevitably therefore is reflective of past working conditions. The next phase of the work is looking at future burdens arising from current working conditions.
3

Cost model and uncertainty modelling 2.12 A detailed spreadsheet model, herein referred to as the cost model, has been developed in
support of this report. It is written in Microsoft Excel13 and has been structured to calculate both the aggregate costs and appraisal values.
2.13 Both the aggregate costs and the appraisal values are subject to uncertainty due to a number of factors including sampling error in the underlying survey data and the assumptions underpinning the cost model. The cost model has accounted for the uncertainty due to the survey based incidence data (since the incidence estimates are based on a sample survey they are subject to a degree of sample error). As a result each cost estimate produced by the cost model has an associated range in which we would expect the actual cost to fall if the true population incidence was known. The implications of key modelling assumptions are discussed in the Appendices.
2.14 The tables summarising the main cost categories for each cost bearer (see Sections 4, 5 and 6) are presented with central estimates and 90% confidence intervals. However, for the intermediate tables, for reasons of simplicity, just the central estimate is presented. The model uses the Monte Carlo simulation add-in @Risk published by Palisade14 to estimate the confidence intervals; more details on this can be found in Sections 4 to 8.
13 Microsoft Excel: http://office.microsoft.com/en-us/excel/ 14 @Risk Version 5.5, Palisade Corporation: http://www.palisade.com/risk
4

3 INCIDENCE OF FATALITIES, INJURIES AND ILL HEALTH
3.1 The cost estimates aim to reflect, as closely as possible, the cost of injury and health outcomes associated with current health and safety working conditions. Whilst for injury, this is relatively straight forward since all cases of fatal and non-fatal injuries within a year relate to health and safety failings in that same year, for health outcomes, this is more difficult. For example, some health outcomes result from prolonged exposure to certain working conditions rather than a single one-off exposure. Also, for some health outcomes there is a considerable time lag between exposure and the eventual health outcome (e.g. several decades in the case of some cancers).
3.2 The approach adopted to best capture costs arising from current working conditions has been to limit the estimate of the annual number of work-related ill health cases to self-reports of ‘newly-occurring’ cases (or incidence cases) of ill health caused or made worse by work in people who have worked in the last 12 months. This represents a significant refinement to previous cost estimates, where both new and pre-existing cases of ill health were included (since data sources at the time the first cost estimates were produced did not allow newly-occurring cases to be separately identified).
3.3 Table 3 summarises the data sources used in this report to quantify the incidence of fatalities, injuries and ill health in 2006/07.
Table 3: Data sources for estimating annual incidence of workplace injury and work-related ill health
Source Time Period Notes
Fatalities RIDDOR Annual average An annual average estimate has been used to 2005/06 to 2007/08 smooth out the random year-to-year variation
Workplace LFS Annual average Estimates from the LFS are subject to sampling Injuries 2006/07-2007/08 error (as are all survey estimates). To minimise
this sampling error, and ensure a sufficiently large sample, several years data has been pooled. For injuries, as it was required to disaggregate the estimates according to RIDDOR definitions, it was Work-related ill LFS Annual average only possible to use data from 2006/07 onwards. health 2005/06-2007/08 For ill health three years worth of data from 2005/06 has been combined
Permanent LFS 2008/09 This information has only been collected on the withdrawal from LFS since 2008/09 and reflects the number of the workforce workers who in 2008/09 expected never to return to
work as a result of their workplace injury or work-related ill health. The injury or ill health may not necessarily be a new case, therefore some cases of withdrawals will be based on previous working conditions (see paragraphs 3.10 to 3.14).
3.4 It is worth noting that, in the case of an individual sustaining more than one injury accident at work over the course of the year, only details of the most recent injury are recorded by the LFS. In the case of ill health, if an individual has suffered more than one work-related illness over the course of the year then the LFS captures the details of the most serious. Therefore the LFS provides an estimate of the count of the number of people suffering a workplace injury or work-related ill health rather than the number of distinct cases. No adjustment has been made for this potential underestimate of cases.
5

3.5 A summary of the incidence data used in the cost model for 2006/7 is given in Table 4.
Table 4: Incidence of workplace fatalities, workplace injury and work-related ill health in 2006/07
Central 90% confidence interval estimate
lower upper
Workplace fatalities 232 n/a n/a
RIDDOR reportable injuries
major injuries 144,000 133,000 155,000
over three day injuries 210,000 196,000 223,000
Non-reportable injuries (three or fewer 481,000 461,000 502,000 calendar days off work)
Ill-health
Musculoskeletal disorders (MSD) 193,000 183,000 203,000
Stress, depression, anxiety 223,000 212,000 234,000
Other ill health types15 135,000 126,000 144,000
Total ill health 551,000 534,000 569,000
Note: See Table 3 for details of the source data and time periods on which each estimate is based. Injuries and ill health are rounded to the nearest 1,000. There is a 90% chance that the incidence figures lie between the lower and upper limits due to the LFS sampling error.
3.6 Estimates derived from the LFS imply that 144,000 people suffered an injury that would be categorised as ‘major’ under RIDDOR, with approximately half of these due to fractures, and that a further 210,000 people suffered an injury that would be categorised as an ‘over 3 day injury’ under RIDDOR. The number of injuries actually reported to the authorities under RIDDOR was 29,738 major and 115,799 over 3 days, indicating a significant level of underreporting.
3.7 Of the total 551,000 new incidence cases of work-related ill health around three-quarters were due to stress, depression or anxiety or musculoskeletal disorders.
Time away from work 3.8 Table 5 presents an analysis of the time away from work in 2006/07 due to workplace injuries
and ill health.16 For each duration of absence category, the table shows the estimated population incidence and the average number of full day equivalent (FDE) working days lost per person. The FDE allows for variation in the daily hours worked (for example part time workers who may work a shorter day or people who work particularly long hours) – this adjustment is important to ensure working days lost are accurately costed. The FDE working days lost is calculated by correcting the actual duration of absence for weekends and the full time / part time status of the individual.17
15 ‘Other ill health types’ category includes all types of self reported ill health, other than those separately shown and excluding long-latency illness.
16 For injuries, days lost count the time lost between the accident and the return to work. It does not count any subsequent absences. For illness, the total time off work from all episodes of the illness over the year is counted.
17 Details of this adjustment can be found in the HSE technical note http://www.hse.gov.uk/statistics/lfs/techincal note.htm
6

Table 5: Estimated incidence of non-fatal workplace injury and work-related ill health and the corresponding estimated full day equivalent working days lost in 2006/07 by days absence form work for people working in the last 12 months
Time away from work category
no lost time part of a 1 to 3 days 4 to 6 days 1 to 2 2 weeks to 1 to 3 over 3 total day weeks 1 month months months
Reportable major injuries population incidence 21,000 14,000 19,000 11,000 14,000 24,000 28,000 12,000 144,000
average FDE time off in days 0.4 3.5 1.3 6.3 14.1 40.0 113.1
Reportable over three day injuries
population incidence 63,000 61,000 50,000 26,000 8,000 210,000
average FDE time off in days 3.3 6.6 13.4 33.8 111.5
Non-reportable under three day injuries
population incidence 296,000 91,000 94,000 481,000
average FDE time off in days 0.4 1.3
Musculoskeletal disorders
population incidence 82,000 x 22,000 9,000 16,000 22,000 24,000 15,000 193,000
average FDE time off in days 4.4 1.9 6.2 13.1 37.3 102.4
Stress, depression, anxiety
population incidence 65,000 x 18,000 10,000 12,000 34,000 47,000 38,000 223,000
average FDE time off in days 4.3 1.8 6.2 13.3 35.1 112.0
Other ill health
population incidence 35,000 x 23,000 11,000 16,000 22,000 14,000 11,000 135,000
average FDE time off in days 1.7 4.4 6.2 13.4 38.2 104.5
Note: Incidence estimates are rounded to the nearest 1,000. Cells marked with an x are unreliable as they contain fewer than 20 sample cases. All observations with greater than 3 months off work are merged into a single time off work category and the average FDE time off computed for the whole. All estimates are subject to sampling error.
7

3.9 It can be seen that the longest duration absences tend to be associated with stress, depression and anxiety. However, for all workplace injury and ill health categories, there are a significant number of individuals who do not take any time off work. For some people, this absence might fall on a non-working day and for others, their symptoms might not be bad enough to prevent them going into work.
Those who never return to work 3.10 The costs associated with permanent withdrawal from the workforce (known as ‘never
returns’) accounted for approximately 50% of the estimated total cost of work-related ill health in the previous studies18, but the incidence estimates were based on small sample sizes and had considerable uncertainty around them. The incidence estimates based on LFS data were last updated in 2002, although an HSE Analytical Services paper of 2008 by Pathak on the cost to employers19 used an alternative source of data, a one off study by the Department for Work and Pensions: Routes Onto Incapacity Benefit20 .
3.11 Improved questions were included in the 2008/09 LFS to get a better estimate of the number of never returns. Respondents were asked whether or not they expected to return to work in the future following their workplace injury or work related ill health. The 2008/09 LFS data indicates that 19,000 people were expected never to return to work due to a workplace injury sustained or ill health (either new or pre-existing) suffered in the last 12 months (90% confidence interval 14,000 to 25,000). The number of new never returns each year is assumed to be reasonably static so this estimate has been used as a proxy for 2006.
3.12 A limitation of this estimate for the purposes of our analysis is that it includes individuals who withdraw from the labour market due to pre-existing conditions. These cases are perhaps more likely to be due to previous working conditions, so do not fully meet the aim of only including the effects of current working conditions. In addition, the LFS returns do not allow us to estimate how many current incidence cases will result in premature departure from the labour market at some point in the future. These limitations will cancel each other out to some extent but notwithstanding this, the LFS returns currently provide the best basis for estimating the number of new never returns arising from current work conditions.
3.13 The costs associated with never returns need to be apportioned between injury cases and ill health cases in order to derive the aggregate costs and appraisal values. The number of sample cases in the 2008/09 dataset is not sufficient to do this accurately. Although the alternative data source, ‘Routes onto Incapacity Benefit’, was considered, this was a one-off survey and so would not provide continuous up to date estimates in future years. For this study the LFS based estimate of ‘never returns’ is apportioned between workplace injury and work-related ill health using the ratio of injuries to (injuries + ill health) that have resulted in at least 3 months off work in the past 12 months as an indicator of the likely proportion of people who will eventually decide to give up work as a result of their injury.
3.14 The improved questions on never returns will be repeated in future years of the LFS and so the never returns estimate will become steadily more robust. The final estimates used in the model are shown in Table 6 below.
18 Gordon and Risley, ibid. 19 Pathak, M., September 2008. The costs to employers in Britain of workplace injuries and work related ill health in
2005/06, HSE Analytical Services Division. Available at: www.hse.gov.uk/economics/research/injuryill0506.pdf 20 Kemp, A. and Davidson, J (2008) ‘Routes onto Incapacity Benefit: findings from a survey of recent claimants’,
Department for Work and Pensions Research Report.
8

Table 6: Estimated number of workers who in 2006/07 expected never to return to work as a result of a workplace injury or work-related ill health.
Central estimate
90% confidence interval
lower upper
Total number of ‘never returns’ 19,000 14,000 25,000
Proportion attributed to workplace injury 24%
Proportion attributed to work-related ill health
76%
Note: Estimates are rounded to the nearest 1000, calculated from the 2008/09 LFS. Estimate of never returns attributed to injury and ill health is based on an assumed split as detailed in Paragraph 3.13
3.15 One of the reasons that ‘never return’ injuries and ill health are so costly is because of the loss of future earnings suffered by the individual or their family. For example, a person suffering a serious incapacitating injury may become reliant on long term state benefits for the rest of their working life. The average age of a never return (54 years old based on the actual LFS never returns data) has been used to estimate future years lost earnings for individuals withdrawing from the workforce. The average age of a fatality in 2006/07 was slightly less at 45.
3.16 As noted in Section 2, this analysis defines a workplace fatality as a death caused almost immediately by an industrial accident, as there is no information available from the LFS to determine whether work related injuries or ill health suffered in the past twelve months may eventually result in premature death. Further work is needed in this area, see Section 9.
9

4 COSTS TO INDIVIDUALS
4.1 This section presents monetary estimates of the net costs of workplace injury and work-related ill health to victims and in some cases those who are close to them. The relevant cost categories can be summarised as follows: • Loss of net income. The loss of gross earnings due to temporary absence from work,
plus the present value of future gross earnings losses for those who are permanently withdrawn from the workforce, net of replacement income when not at work such as sick pay and state benefits.
• Compensation payments. (Offset against the loss of net income) Lump sum payments to individuals made from claims against employers’ liability insurance.
• Health and rehabilitation costs. Out of pocket medical expenses, travel costs to hospital, etc.
• Administrative costs. The costs to victims of administering sickness claims, compensation claims etc, and the costs to consumers as a whole of the associated overhead administrative costs of insurance companies21 .
• Non-financial human costs. Costs derived from the ex-ante monetary value placed on reducing the risk of ill health, injury or death, over and above the direct financial costs. This is a measure of social cost, similar to those used by governments worldwide for injuries and fatalities in transport and other policy fields. Of course there may often be no monetary sum that would compensate, ex-post, those individuals unfortunately affected by very serious injuries or fatalities.
Loss of net income
Loss of earnings 4.2 Data on earnings of people at work have been taken from the Annual Survey of Hours and
Earnings (ASHE) for 200622 . The average gross pay per full day equivalent (FDE) working day is £102, including overtime, bonus payments, etc. The gross salary not paid due to temporary absences of up to 12 months can be calculated by multiplying this average daily income rate by the estimated number of full day equivalent working days lost. Some of the incidence cases in 2006/07 will result in lost time at work in future years (and therefore future loss of income) though we are unable to quantify what the future losses may be (except for ‘never returns’).
4.3 Those individuals who never return to the workforce will also lose the gross salary that they would have earned from the date of their giving up work to the date of their normal retirement 23 . The total cost of this needs to be expressed in present value terms, taking into account: • The average salary for people of their age at the point of withdrawal
21 Payments against personal insurance policies following an accident are, of course, income to the individual, who has also been paying insurance premiums. For the purposes of this study we have shown the net national cash flow to the insurers, which is a cost to all insured individuals and, to a reasonable approximation, simply payment for the insurance companies’ administrative costs, including any return on capital achieved through underwriting gains.
22 Annual Survey of Hours and Earnings 2006, Office for National Statistics, available on-line at: http://www.statistics.gov.uk. Table 4.1a presents weekly and annual gross salaries for employees broken down by industry type. Table 6.7a presents annual gross salaries for employees broken down by age.
23 It is assumed that earnings after retirement are not affected. Individuals in company or private pension schemes may be entitled to retire early on medical grounds; the costs of this will be funded through pension contributions. Individuals reliant on the state pension would be entitled to claim additional state benefits if their entitlement was affected by being absent from the workforce for a long period.
10

• The number of working years lost, taking into account average life expectancy26
• The real growth in expected salary levels per year over and above inflation • The average increase or decrease in salary per year (due to age, experience etc from the
date of withdrawal from the workforce to the normal retirement age). 4.4 Most workplace fatalities are male, so it is appropriate to use male average earnings in the lost
income calculation for fatal injuries. For the ‘never returns’ however, it is more appropriate to use average earnings for both males and females as the LFS sample size is too small to reliably estimate a male/female proportion. The average annual gross salary for an 18-21 year old in 2006 was £11,100 for males and £9,500 for males and females, rising to £36,600 for males and £27,900 for males and females for a 40-49 year old. The average headline rate of earnings growth between January 2006 and March 2010 is 3.26%24 . After adjusting for inflation, the real rate of growth is estimated to be 0.4% per annum25 . This is then added to the future career growth in earnings foregone at point of withdrawal, based on (i) the average salary for the age band at which the withdrawal occurs, (ii) the change in average earnings if the individual were to have progressed from one age band to the next, and (iii) the probability that the individual might die in each age band, using standard life tables26 . Future costs are discounted to the present day using the HM Treasury discount rate for 2006/07 of 3.5%27 .
4.5 Table 7 summarises the aggregate loss of gross earnings calculated by the cost model. It can be seen that the present value of future lost earnings accounts for over two-thirds of the estimated total loss of gross earnings. This is particularly dominated by future losses for those who permanently withdraw from the workforce because of ill health. As noted in Section 3, there is considerable uncertainty in the incidence of never returns and particularly the assumed split between injury and ill health; the effects of this uncertainty are considered further in Paragraphs 4.20 through 4.22 below.
Table 7: Gross loss of earnings when absent from work
£ million not earned
Present Value of future lost earnings
Workplace fatalities 97
Never returns due to injury 854
Never returns due to ill health 2,694
Current year lost earnings
Reportable major injuries 310
Reportable over three day injuries 313
Non-reportable under three day injuries 16
Ill health 1,184
Total 5,468
Note: Aggregate costs are shown in 2006 prices, before sources of replacement income such as sick pay and state benefits are taken into account
24 Series number LNNC: Headline rate of average earnings growth, seasonally adjusted, Office for National Statistics, available on-line at: http://www.statistics.gov.uk
25 The real rate of growth is the difference between the annual growth in earnings and the annual growth in the retail prices index. Headline rate of average earnings growth is estimated to be 3.26% from 2006 to present and average rate of inflation from 2006 to present is 2.85%.
26 GB interim life table for 2005-07, available on-line at: http://www.statistics.gov.uk/downloads/theme_population/Interim_Life/iltgb-reg.xls
27 HM Treasury Green Book, available on-line at: http://www.hm-treasury.gov.uk/greenbook
11

Replacement income when absent from work 4.6 For a lot of people, absence from work means a reduction in income. The extent of the loss
however differs substantially between individuals. Many employers offer an occupational sick pay scheme (OSP), but others offer only statutory sick pay (SSP) and the self-employed will receive nothing at all from their employer. In addition there are a range of state benefits available to people who are not able to work because of injury or ill health, including incapacity benefit, industrial injuries disablement benefit, disability living allowance, attendance allowance, income support, and housing benefit28 . Finally, some families choose to insure against loss of income through mortgage protection or income protection insurance policies.
4.7 Table 8 summarises the aggregate sources of replacement income calculated by the cost model. More detail is provided in Appendix 1.
Table 8: Sources of replacement income when absent from work
£ million received or not paid
OSP and State Tax and NI SSP benefits saving
Present Value of income received beyond the current year
Workplace fatalities - 1 26
Never returns due to injury - 570 225
Never returns due to ill health - 1,067 711
Current year income
Reportable major injuries 195 5 29
Reportable over three day injuries 210 5 27
Non-reportable under three day injuries 8 - 2
Ill health 732 21 113
Total 1,145 1,671 1,133
Note: Aggregate costs are shown in 2006 prices. The Tax and NI savings to the individual represent tax no longer paid to the government as a result of a reduced income, based on the average tax rates that apply to workers earning the national average salary; they appear as an equal and opposite tax not received by the government in Section 6.
4.8 As was the case in Table 7 the largest figures are associated with those who never return to work. The £1,637 million in present value terms paid in state benefits to this group includes an estimated £578 million in long term incapacity benefit and £1,059 million in other benefits.
4.9 In addition to the above, an estimated £91 million was paid out in claims on mortgage and income protection policies and £5 million in life insurance claims29 . However, at the aggregate level the premiums paid by individuals more than offset the claims received, so the net effect is a cost to the individual arising from the insurance companies’ profit margin and overheads. This is included in the administrative costs and is discussed in Paragraphs 4.14 to 4.16.
28 Incapacity benefit and income support were replaced by employment and support allowance for new claimants after 27 October 2008, but we have assumed that existing claimants from 2006 continue to be paid under the old schemes. Current reforms of the benefits system being discussed by the new coalition government may require the cost model to be further updated in future years.
29 Based on an analysis of ABI UK Insurance key facts for 2006, available on-line at: http://www.abi.org.uk/
12

Compensation payments 4.10 All employers (except the state) are required by law to have Employers’ Liability (EL)
insurance cover. Data provided by the Association of British Insurers (ABI)30 puts the total claims value at £1,528 million. Gordon and Risley estimated that approximately 60% of the claims value would be received by the victims, the rest going on legal fees and expenses, representing a tax free payment of £917 million to individuals.
Health and rehabilitation costs 4.11 The majority of the health and rehabilitation costs associated with workplace injury and work-
related ill health will be borne by the government through funding the National Health Service. However, there are some out of pocket health related costs that the individual will have to fund personally, for example: • Prescription charges arising from visits to the GP or out-patient clinics • Additional travel and living costs • Home modifications to make living with permanently incapacitating injuries or ill health
easier, e.g. relocating a bathroom to the ground floor • Funeral expenses for workplace fatalities • Premiums for private medical insurance.
4.12 Information on the whole life costs of different medical conditions is difficult to find (number of visits to the GP per year, number of years this might continue, etc). The assumptions used in the cost model are described in more detail in Appendix 2 and a summary of the cost estimates in provided in Table 9.
Table 9: Health related costs borne by the individual or their family
£ million
Fatalities31 0.4
RIDDOR reportable injuries (major or over three days) * 31
Non-reportable injuries (under three days) 8
Ill health * 39
Total 79
Note: Aggregate costs are shown in 2006 prices, rounded to the nearest million. Rows marked with a * include the discounted long term medical costs for those who never return to work on a pro-rata basis. Even for cases where the worker does return to work, a proportion of the medical costs are in present value terms as periods of treatment can continue for more than one year in some cases.
4.13 In addition to the costs shown in Table 9, data provided by the private health insurance industry32 suggests that an estimated £46 million of the total premiums paid by individuals (rather than employers) for health insurance might be associated with work related incidents. This is a net cost to individuals at the aggregate level because the financial beneficiaries of the
30 ABI ‘INCOME AND OUTGO' spreadsheet, 1998-2008, which records premiums and claims totals across a number of product lines. Average of 2005, 2006 and 2007 returns taken to smooth in-year underwriting losses and gains.
31 The health related cost of a workplace fatality for the victim’s family consists primarily of the funeral cost. This is a present value cost rather than a current year cost because it represents the cost of bringing forward the funeral by approximately 30 years.
32 Private communication, Chief Actuaries Office, BUPA Healthcare.
13

claims paid out are the private health providers, and indirectly the government as cases treated in the private sector do not have to be treated by the NHS.
Administrative costs 4.14 The main administrative cost to the individual or their friends and family is the time spent
initiating and managing claims for sick pay and state benefits, and compensation and insurance payouts. The cost model assumes that this takes between half a day and a day per claim for absences of up to six months, rising up to three days per claim for long term absences. It is based on the ‘three administrative points’ (TAP) approach, i.e. assuming that administrative activity occurs at the beginning of a claim, at the mid point, and at the end of the claim. More details on the TAP approach can be found in the discussion of the administration costs for employers (see Section 5).
4.15 The time spent on administrative activity is an opportunity cost to the individual. The Department for Transport publishes a value for non-working time in its web based Transport Appraisal Guidance33 . The appropriate value for 2006/07 was £4.84 per hour. This multiplied by the number of claims and the administrative time spent per claim gives an aggregate cost to individuals of £10 million.
4.16 As mentioned in Paragraph 4.9, the costs of insurance include insurance company profit margin and administration costs. Taking into account the estimated proportion of workplace injuries and work related ill health events that are covered by some form of insurance, the net cost to individuals is estimated to be £14 million.
Non-financial human costs 4.17 Most injuries and ill health involve some temporary or permanent reduction in the quality of life
of the victims and in some cases those close to them. This is what has sometimes been referred to as the physical and/or mental ‘pain, grief and suffering’ involved. A monetary value can be assigned to such losses on the basis of estimates of what people would typically be prepared to pay ex-ante to reduce the risks of suffering them. The original Davies and Teasdale study, the revised edition by Gordon and Risley, and subsequent updates of the HSE appraisal values all include elements which attempt to reflect the value placed by individuals on the avoidance of such losses of personal wellbeing, over and above the direct financial costs. Similar subjective value elements are also included in aggregate cost estimates published in other countries34 .
4.18 The Department for Transport publishes regularly updated figures for the value placed on the prevention of fatal and non-fatal casualties due to road accidents in their web based Transport Appraisal Guide, webTAG unit 3.4.1 35 . Gordon and Risley based their valuations of the human costs of workplace injury and work-related ill health on the DfT methodology although they freely admitted that their judgments were highly speculative in nature and subject to considerable uncertainty. Appendix 3 describes the background to the DfT approach, Gordon and Risley’s interpretation, and an updated methodology recommended for use in the cost model for the current analysis. The revised approach can be summarised as follows:
33 webTAG module 3.5.6, Values of Time and Operating Costs, available on-line at: www.dft.gov.uk/webtag 34 For example: Access Economics, 2006, The economic and social costs of occupational disease and injury in New
Zealand, NOHSAC Technical Report 4, Available on-line at: http://www.nohsac.govt.nz/techreport4/index.php?section=index
35 webTag unit 3.4.1, The Accidents Sub-Objective, available on line at: www.dft.gov.uk/webtag. The DfT presentation of the various cost components do not exactly match the way the empirical data underlying the calculation was first derived, but they have used this presentation of the value of a prevented fatality (VPF) since 1987. The true derivation of the VPF is a WTP value plus net output that is lost to the surviving population and ambulance and hospital costs. However for the purposes of estimating aggregate costs of workplace accidents it is more convenient to retain the DfT presentation, especially as this fits more easily with the empirical basis of the non-fatal injury valuations, which are in this HSE context much more important than the VPF.
14
• The non-financial human cost of a workplace fatality is equated with the corresponding portion of the DfT value placed on a fatal road accident casualty, which for June 2006 was £976,363.
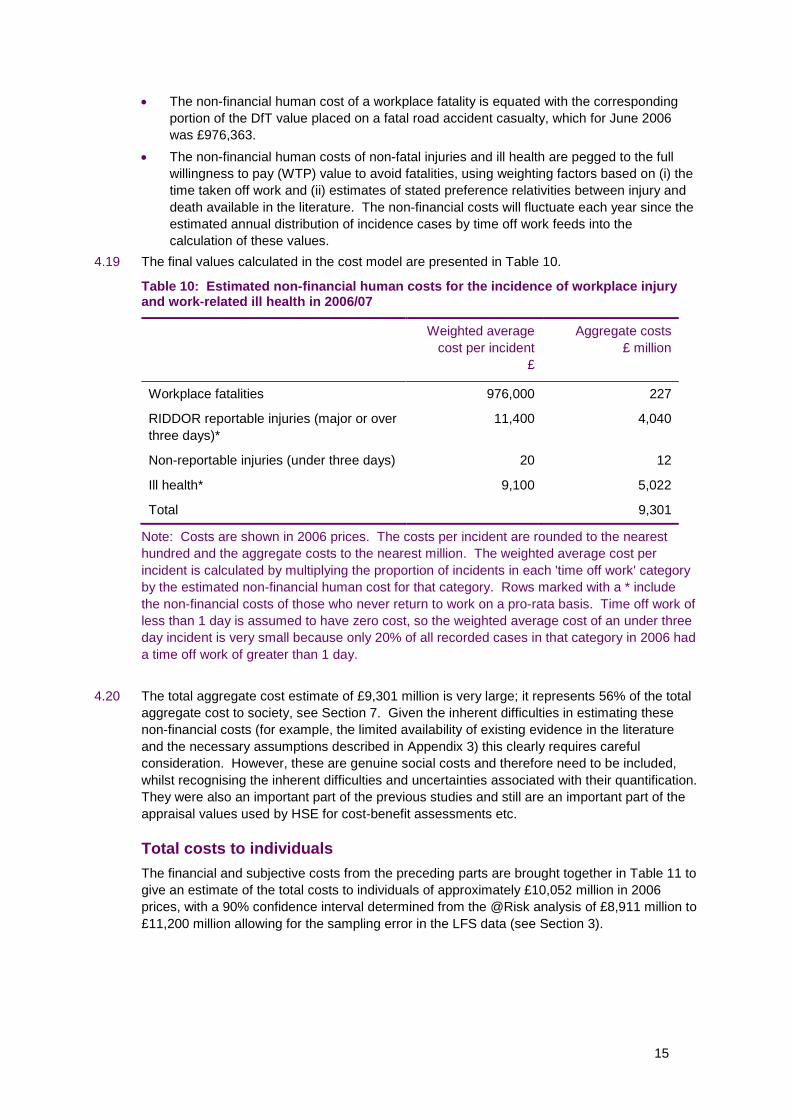
• The non-financial human costs of non-fatal injuries and ill health are pegged to the full willingness to pay (WTP) value to avoid fatalities, using weighting factors based on (i) the time taken off work and (ii) estimates of stated preference relativities between injury and death available in the literature. The non-financial costs will fluctuate each year since the estimated annual distribution of incidence cases by time off work feeds into the calculation of these values.
4.19 The final values calculated in the cost model are presented in Table 10.
Table 10: Estimated non-financial human costs for the incidence of workplace injury and work-related ill health in 2006/07
Weighted average Aggregate costs cost per incident £ million
£
Workplace fatalities 976,000 227
RIDDOR reportable injuries (major or over 11,400 4,040 three days)*
Non-reportable injuries (under three days) 20 12
Ill health* 9,100 5,022
Total 9,301
Note: Costs are shown in 2006 prices. The costs per incident are rounded to the nearest hundred and the aggregate costs to the nearest million. The weighted average cost per incident is calculated by multiplying the proportion of incidents in each 'time off work' category by the estimated non-financial human cost for that category. Rows marked with a * include the non-financial costs of those who never return to work on a pro-rata basis. Time off work of less than 1 day is assumed to have zero cost, so the weighted average cost of an under three day incident is very small because only 20% of all recorded cases in that category in 2006 had a time off work of greater than 1 day.
4.20 The total aggregate cost estimate of £9,301 million is very large; it represents 56% of the total aggregate cost to society, see Section 7. Given the inherent difficulties in estimating these non-financial costs (for example, the limited availability of existing evidence in the literature and the necessary assumptions described in Appendix 3) this clearly requires careful consideration. However, these are genuine social costs and therefore need to be included, whilst recognising the inherent difficulties and uncertainties associated with their quantification. They were also an important part of the previous studies and still are an important part of the appraisal values used by HSE for cost-benefit assessments etc.
Total costs to individuals The financial and subjective costs from the preceding parts are brought together in Table 11 to give an estimate of the total costs to individuals of approximately £10,052 million in 2006 prices, with a 90% confidence interval determined from the @Risk analysis of £8,911 million to £11,200 million allowing for the sampling error in the LFS data (see Section 3).
15

Table 11: Aggregate costs to individuals of workplace fatalities and injuries and work-related ill health in 2006/07
Central 90% confidence interval estimate £ million lower upper
Gross loss of earnings 5,468 4,466 6,473
Less replacement income (3,949) (3,333) (4,564)
Less compensation payments (917) n/a n/a
Health and rehabilitation costs 125 121 128
Administrative costs 24 23 26
Non-financial human costs 9,301 8,523 10,082
Total costs 10,052 8,911 11,200
Note: Costs are shown in 2006 prices, rounded to the nearest million. There is a 90% chance that the total cost lies between the lower and upper limit due to the LFS sampling error. Rows marked n/a are not affected by LFS sampling error.
4.21 Figure 2 shows the output from the @Risk simulation. The probability distribution is almost normal in shape, reflecting the standard error in the individual incidence estimates (number of major injuries, etc).
4.22 The sampling uncertainty in the underlying incidence data for never returns, together with the large unit cost applied to this estimate for non-financial human costs, explains the overwhelming majority of the spread observed in Figure 2. It is perhaps worth noting that as more years data becomes available we can base the estimate of never returns on an annual average estimate, which by virtue of being based on a larger sample, will have a lower standard error and so will narrow the confidence interval around the central cost estimate.
Figure 2: Probability distribution for total costs to individuals due to LFS sampling uncertainty, shown in £ billions
16

5 COSTS TO EMPLOYERS
5.1 This section presents monetary estimates of the costs to employers of workplace injury and work related ill health in 2006/07.
5.2 When an employee reports as sick, the employer has a basic choice to make: should it accept the loss of output that the missing employee would normally produce, or should it take action to maintain output. Firms usually operate with a degree of flexibility to cover a whole variety of short term absences (e.g. holidays and minor illnesses), but when the absence starts to become longer term in most situations it is in the firm’s best interest to replace the missing worker with either a temporary or permanent replacement, so long as this can be done at the same cost as employing the original employee. The assumption in the previous studies36 is therefore that the firm always seeks to maintain output, and this is the assumption we continue to make in the cost model.
5.3 The relevant cost categories for an employer can be summarised as follows: • Sick pay. Occupational sick pay and/or statutory sick pay paid to employees when
absent from work. • Insurance premiums. The cost of Employers’ Liability (EL) insurance premiums and the
cost of corporate private health insurance premiums attributable to workplace accidents and work-related ill health.
• Production disturbance. The costs associated with work reorganisation and recruitment and induction of temporary or permanent replacement staff, in order to maintain output.
• Administrative costs. The costs associated with administering sickness claims; insurance claims; compensation claims etc.
• Investigations and prosecutions. The internal and legal costs arising from investigations and prosecutions for health and safety breaches by HSE or local authorities.
Sick pay 5.4 If output is maintained at the same marginal cost of production, the net cost to the employer is
any sick pay that it also has to pay to the absent employee. As was stated in Section 4, this is a money outflow from the employer that becomes an equal and opposite money inflow to the affected individuals.
5.5 Almost 90% of employers provide occupational sick pay (OSP) at the full rate of basic pay (but excluding overtime and bonuses) for an average of 15 weeks, according to the Chartered Institute of Personnel and Development (CIPD).37,38 Of these, 87% pay it for the first three days of absence. Part salary is then paid for an average of an additional 16.4 weeks. Some firms impose a qualifying period before a new employee becomes eligible for OSP payments, but the effect of these variations has not been quantified in the cost model.
5.6 In addition, anyone who was working for an employer under a contract of service, who earned at least £84 per week in 2006, and who had been sick for at least four days in a row (including weekends and bank holidays and days not normally worked), was entitled to be paid statutory
36 Gordon and Risley, ibid. and Patak, ibid. 37 CIPD, 2007, 'Absence Management' annual survey report available on-line at: http://www.cipd.co.uk. 38 Patak’s analysis of costs to employers in 2005/06 used rates of OSP derived from the HSE 2005 SWASH survey
rather than the CIPD survey, because of concerns about the low response rate in the latter. However, the SWASH survey is not likely to be repeated in the future whereas a CIPD survey is undertaken every year, and the data in CIPD surveys from previous years appears to be consistent with 2007, so this is likely to be the most sustainable source of data in the future.
17

sick pay (SSP) if their employer did not offer OSP at a rate of £70.05 per week for the first 28 weeks of absence.39
5.7 Taking into account the approximately 13% of incidence cases that are suffered by the self-employed who receive no employer sick pay, the total amount estimated as paid by employers for OSP and SSP due to workplace injury and work related ill health in 2006 is summarised in Table 12. This is calculated in the cost model by multiplying the absence profiles in Table 5 by the sick pay rates and eligibility criteria described above.
5.8 Sick pay costs borne by employers are not normally recompensed by the government, and payments to absent employees continue to attract employers’ class 1 National Insurance contributions at a rate of 12.8%. However, if in a tax month, the total SSP paid to all employees (including the underlying SSP that is part of any OSP payments) is more than 13% of the total gross employers’ plus employees' class 1 National Insurance contributions for the same tax month, the excess can be reclaimed from HM Revenue and Customs under the Percentage Threshold Scheme. The scheme costs the government between £40m and £50m per year,40 and it is assumed that the proportion that covers work-related absence is 18%, (being the ratio of workdays lost per year due to work related absence compared to the total number of days sickness absence per year)41 .
Table 12: Costs to employers for sick pay
£ million
Occupational sick pay 1,125
Statutory sick pay (only) 20
Employers’ class 1 National Insurance contributions 147 on sick pay paid
Less reimbursement from HMRC under the (8) percentage threshold scheme
Total cost to employers 1,284
Note: Costs are shown in 2006 prices.
5.9 The total cost of sick pay to employers in 2006 is estimated to be £1.3 billion. This compares to the £1.6 to £1.8 billion estimate in Patak’s paper for 2005, using a slightly different and simplified methodology.
Insurance premiums 5.10 Firms choose to purchase many different types of insurance, for example cover for fire
damage and business interruption. The main insurance costs related to workplace injuries and work-related ill health however are (i) Employers’ Liability (EL) insurance and (ii) private health insurance provided for their employees.
5.11 As indicated in Section 4, EL insurance is compulsory for all employers (apart from the government) so the cost of premiums is a direct cost to employers. Information from the ABI (see Footnote 28) puts the total cost of premiums paid at £1,559 million, averaged over 2005, 2006 and 2007 returns to smooth in-year underwriting losses and gains.
39 Rates of Statutory Sick Pay for 2006 taken from HMRC leaflet E14(2006), available on-line at: http://www.hmrc.gov.uk/helpsheets/2006/e14.pdf
40 DWP Statutory Sick Pay Review Working Group, available on-line at: http://www.dwp.gov.uk/docs/ssp-review-finalreport-181006.pdf
41 HSE key facts document for 2006/07 (www.hse.gov.uk/statistics/overall/hssh0607.pdf ) reports that the average number of working days lost per worker per year due to work related absence is 1.5; this compares to 8.4 sickness days total per worker per year in 2006/07 from the CIPD survey,
18

5.12 Data provided by the private health insurance industry (see Footnote 30) suggests that an estimated £48 million of the total premiums paid by employers might be attributable to work related incidents.
Production disturbance 5.13 In its efforts to maintain output, the firm will inevitably incur a certain amount of disturbance to
normal production that represents an additional cost to employers. For example, for short duration absences there is likely to be some overhead cost associated with work reorganisation to cover the absent employee’s duties. For longer term absences, or following an employee’s permanent withdrawal from the workforce, the firm needs to recruit temporary or permanent replacement staff and provide them with suitable orientation and induction support.
5.14 SSP is payable for the first 28 weeks (six months) of absence, so it is reasonable to assume that most employers would wait that long before going to the expense of recruiting a replacement worker. For absences of between 4 days and six months therefore, the cost model assumes that an average of only half a day of managerial / supervisory time is spent per case on work reorganisation. The average salary of a manager for 2006/07 was £21.60 per hour,42 and typical non-wage costs add 29%43 to this total. Multiplying by the incidence of workplace injury and work-related ill health of 570,000 cases with between 4 days and six months away from work gives a total cost of £64 million.
5.15 There are an estimated 29,000 cases with between six months and 12 months away from work. Multiplying by the managerial wage cost for work reorganisation during the first six months adds a further £3 million to the total.
Recruitment costs 5.16 Employers are assumed to incur the cost of recruiting temporary or permanent replacement
staff and providing them with suitable orientation and induction support for all absences of greater than six months and for workplace fatalities. Both Gordon & Risley and Patak value the cost of recruitment as a ‘brought forward’ cost – someone leaves work now that would have left work in three years time, on the assumption that a person typically changes job every six years for other reasons. The net cost is therefore quoted as the NPV difference between recruiting now and three years in the future. However, this fails to take into account the fact that the new recruit is also likely to resign after another six years, so bringing forward all future recruitment. In addition, a large proportion of the recruitment events is likely to be for temporary replacements rather than to permanently replace a fatality or never return. The temporary replacement will often be on a fixed term contract and when the original worker returns there is no evidence to suggest that they will delay their future resignation beyond the original six years date. There is therefore no ‘brought forward’ argument for temporary replacements, and as the majority of the recruitment cost is for agency fees and advertising, temporary recruitment is in this case almost as expensive as permanent recruitment. On this basis the cost model values the recruitment cost at its full value, not as a brought forward cost.
5.17 The CIPD44 estimates that the typical external cost for recruiting clerical grade staff in 2006 was £2,000 (advertising and agency costs). The employee induction process and any losses of productivity whilst the new employee ‘learns the ropes’ are assumed to add another £528 to the unit cost45 , making a total of £2,528 per case. Multiplying by the incidence estimate for
42 2006 Annual Survey of Hours and Earnings, ibid. 43 The HM Treasury Green Book gives no specific guidance on the rate to use for non-wage costs, but for example
the Cabinet Office guidance document ‘Measuring Administrative Costs: UK Standard Cost Model Manual (2005)’ quotes a value of 30%. Available at: www.berr.gov.uk/files/file44503.pdf . The Gordon & Risley report used 29% so for consistency we have adopted the same figure.
44 2006 recruitment, retention and turnover survey, Chartered Institute of Personnel and Development, available online at: www.cipd.co.uk
45 Four days multiplied by the average daily wage of all employees of £102, plus 29% for non-wage costs.
19

absences greater than 6 months (29,000 cases) gives an aggregate recruitment cost estimate of £74 million.
5.18 The total costs to employers for production disturbance are summarised in Table 13.
Table 13: Costs to employers for production disturbance
£ million
Work reorganisation for short term absences (4 days to six months)
64
Work reorganisation for the initial period of long term absences and for permanent replacements
3
Recruitment costs 74
Total cost to employers 141
Note: Costs are shown in 2006 prices.
Administrative costs 5.19 Employers incur costs from the administrative activities necessary to deal with sickness
absence, for example processing sick pay claims and dealing with insurers over health insurance and compensation claims. These are in addition to the work reorganisation and recruitment costs discussed above.
5.20 Gordon and Risley assumed conservatively that these administrative activities would take half an hour per day for the duration of the absence. Pathak preferred the Three Administrative Points (TAP) approach, which assumes that the administrative burden occurs in three bursts of activity at the beginning, middle and end of the absence period. The cost model makes a similar assumption, allowing 2.5 to 3.5 hours per case for routine activities such as OSP/SSP claims, rising to 2.5 days per case for complex compensation claims arising from never returns. The average wage cost for clerical staff in 2006 was £9.48 per hour,46 and typical non-wage costs add 29% to this figure (see Footnote 41). Multiplying by an estimated 523,000 OSP/SSP claims; 56,000 health insurance claims; and 19,000 compensation claims (including those made by ‘never returns’) gives a total administrative cost of £23 million.
Investigations and prosecutions 5.21 Enforcement activities by the Health and Safety Executive or Local Authorities can result in
firms being investigated and ultimately prosecuted following more serious cases of workplace injury and work-related ill health. All workplace fatalities would also normally be investigated. This represents an additional cost to employers for management time in dealing with the investigation, and for legal costs and fines paid arising from prosecutions.
5.22 There were 846 convictions for H&S offences in 2006 from prosecutions by the HSE, with an average fine per conviction of £14,431. There were a further 314 convictions from prosecutions by local authorities, with an average fine of £6,98247 . The total cost of HSE and local authority inspector person hours for investigations and prosecutions is estimated to be £13 million (see Section 6); the employer’s investigation costs are assumed to be the same, on the assumption that a similarly qualified person would be expected to spend a similar amount of time per case.
46 2006 Annual Survey of Hours and Earnings, ibid. 47 Table EF6: Proceedings instituted in Great Britain by enforcing authorities by result 2004/05 - 2008/09, available
on-line at: http://www.hse.gov.uk/statistics/tables/ef6.htm. Figures exclude railway related incidents prosecuted by the Office of Rail Regulation.
20

5.23 Average legal costs per conviction are not recorded, but from an analysis of 46 successful prosecutions for fatalities48 occurring during 2006 the average fine is £49,050 and the average legal cost awarded to HSE is £12,395, which is 25% of the fine. We have assumed the same ratio applies to all convictions. The employer’s own legal costs are assumed to match those of the prosecuting authority, i.e. the total employer legal cost is equated to twice the legal costs awarded to the HSE and local authorities.
5.24 The aggregate costs to employers for investigations and prosecutions are summarised in Table 14.
Table 14: Costs to employers for investigations and prosecutions
£ million
Management time 13
Legal costs 7
Fines 14
Total cost to employers 34
Note: Costs are shown in 2006 prices.
Total costs to employers 5.25 The costs from the preceding parts are brought together in Table 15 to give an estimate of the
total costs to employers of approximately £3,089 million in 2006 prices, with a 90% confidence interval of £3,021 to £3,156 million allowing for the sampling uncertainty in the underlying incidence data. The confidence interval is much narrower than was the case for costs to individuals since never returns do not contribute as greatly to the overall cost, with the employers’ liability largely capped to a maximum of seven months of sick pay. Figure 3 shows the corresponding output from the @Risk analysis.
5.26 This compares with the £2.9 billion to £3.2 billion estimated by Pathak in 2005 money, using a different and simpler methodology. Note that the Gordon and Risley estimates are not comparable in this case because they also included damage only (non-injury) accidents in their analysis. A scoping study performed for HSE determined that there was insufficient evidence to include the costs of non-injury accidents in the current estimates.49
48 HSE public register of convictions, available on-line at: http://www.hse.gov.uk/prosecutions 49 HSE Research Report: ‘The costs of non-injury accidents. Scoping study. Prepared by the Health and Safety
Laboratory for the Health and Safety Executive 2007, Available at: www.hse.gov.uk/research/rrpdf/rr585.pdf
21

Table 15: Aggregate costs to employers of workplace fatalities and injuries and work-related ill health in 2006/07
Central 90% confidence interval estimate £ million lower upper
Sick pay 1,284 1,225 1,342
Insurance premiums (Employers’ 1,607 n/a n/a Liability and attributable fraction of corporate private health insurance)
Production disturbance 141 130 152
Administration 23 21 24
Investigations and prosecutions 34 n/a n/a
Total costs 3,089 3,021 3,156
Note: Costs are shown in 2006 prices, rounded to the nearest million. There is a 90% chance that the total cost lies between the lower and upper limit due to the LFS sampling error. Rows marked n/a are not affected by LFS sampling error.
Figure 3: Probability distribution for total costs to employers due to LFS sampling uncertainty, shown in £ millions
22

6 COSTS TO THE GOVERNMENT
6.1 This section presents monetary estimates of the costs to the government of workplace injury and work-related ill health in 2006/07, i.e. any costs arising from workplace injury and work-related ill health that are not borne directly by the affected individuals or their employers50 . The relevant costs can be summarised as follows: • Benefits payments. The state benefits paid to individuals who are not able to work
because of injury or ill health, including statutory sick pay reimbursements. • Reductions in income tax and national insurance receipts. The net effects of
changes to income tax and national insurance payments made by individuals and employers.
• Medical treatment and rehabilitation costs. The costs associated with providing National Health Service resources.
• Administration costs. The clerical overhead associated with administering state benefits and statutory sick pay.
• Investigation costs. The internal costs borne by the Health and Safety Executive and Local Authorities for investigating work related incidents. This is partially offset by the fines received for successful prosecutions.
Benefits payments 6.2 The state benefits paid by the Department for Work and Pensions are exactly equal and
opposite to the state benefits received by individuals not able to work, see Section 4 and Appendix 1. The aggregate estimate for 2006/07 was £1,671 million.
Reductions in income tax and national insurance receipts 6.3 Also from Section 4, the reduction in gross earnings for individuals away from work and
claiming sick pay or state benefits rather than earning a salary produces a corresponding reduction in the total income tax and class 1 employee’s national insurance contributions paid to HM Revenue and Customs. This represents a net cost to the government of £1,133 million.
6.4 Employers however are required to continue to pay class 1 employers’ national insurance contributions for employees that are on sick leave. As this is a net cost to the employer it represents an equal and opposite net benefit to the government of £147 million, although this is offset by £8 million for the national insurance contributions reclaimed by businesses under the percentage threshold scheme (see Section 5).
6.5 The total net cost to the government is therefore £994 million.
Medical treatment and rehabilitation costs 6.6 The majority of the treatment and rehabilitation costs associated with workplace injury and
work-related ill health will be borne by the government through funding the National Health Service (although some is funded directly by the individual, see Section 4). The main cost elements include: • Ambulance costs for workplace injuries and fatalities • Hospital and clinic costs (accident and emergency, in-patient and out-patient treatment,
physiotherapy, counselling, etc)
50 In Section 4 we estimated a small cost of insurance company administrative overheads which are distributed across all policy holders, but for simplicity these have been assigned to costs to individuals who are injured. A larger third party cost would arise if a shadow price were applied to taxation, to reflect the distortions it creates in markets.
23

• GP costs (patient consultations, writing out sick notes etc) • NHS prescription costs arising from visits to the GP or out-patient clinics.
6.7 Information on the whole life costs of different medical conditions is difficult to find (number of visits to the GP per year, number of years this might continue, etc). The assumptions used in the cost model are described in more detail in Appendix 2 and a summary of the cost estimates is provided in Table 16.
Table 16: Medical treatment and rehabilitation costs borne by the government
£ million
Fatalities 0.09
RIDDOR reportable injuries (major or over three days) * 449
Non-reportable injuries (under three days) 79
Ill health * 195
Total 723
Note: Aggregate costs are shown in 2006 prices, rounded to the nearest million. Rows marked with a * include the long term medical costs for those who never return to work on a pro-rata basis.
6.8 The total present value of the medical costs is £723 million and includes £53 million for the long term treatment of those who never return to work51 .
6.9 In addition to the costs shown in Table 16, data provided by the private health insurance industry (see Footnote 31) suggests that an estimated £73 million of the total medical insurance claims paid by insurers might be associated with work related incidents. This is a net benefit to the government as services delivered by the private sector do not have to be funded by the NHS.
Administration costs 6.10 The clerical overhead associated with administering state benefits and statutory sick pay is a
cost to the government. The cost model again uses the Three Administrative Points (TAP) approach, allowing 2.5 hours per case for SSP claims and 6 hours per case for short term benefits claims, rising to 2.5 days per case for long term benefits claims. The average wage cost for clerical staff in 2006 was £9.48 per hour,52 and typical non-wage costs add 29% to this figure (see Footnote 42). Multiplying by an estimated 523,000 SSP claims and 96,000 benefits claims gives a total administrative cost of £27 million.
Investigation costs 6.11 The internal costs borne by the Health and Safety Executive and Local Authorities for
investigating work related incidents are a cost to the government. The total cost recorded by the HSE in 2006/07 for investigations into workplace fatalities and injuries and work-related ill health is estimated at £9.5 million53 . Local Authority investigation costs are assumed to scale pro-rata according to the number of convictions they secured (see Section 5), adding £3.5 million to the total.
51 Medical costs in the future are inflated for the average real growth in NHS pay and prices above inflation, as measured by the Hospital & Community Health Services (HCHS) Pay and Prices Index adjusted for inflation, then discounted at the HM Treasury Green Book rate of 3.5%.
52 2006 Annual Survey of Hours and Earnings, ibid. 53 HSE, Private Communication
24
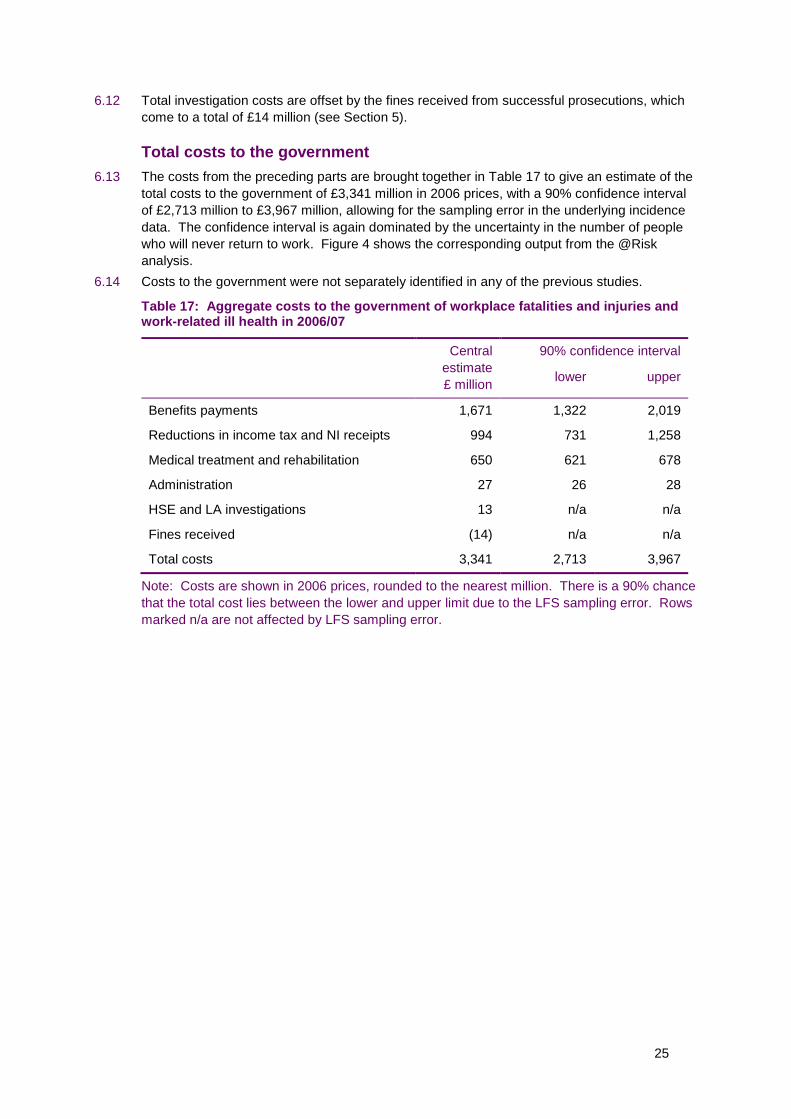
6.12 Total investigation costs are offset by the fines received from successful prosecutions, which come to a total of £14 million (see Section 5).
Total costs to the government 6.13 The costs from the preceding parts are brought together in Table 17 to give an estimate of the
total costs to the government of £3,341 million in 2006 prices, with a 90% confidence interval of £2,713 million to £3,967 million, allowing for the sampling error in the underlying incidence data. The confidence interval is again dominated by the uncertainty in the number of people who will never return to work. Figure 4 shows the corresponding output from the @Risk analysis.
6.14 Costs to the government were not separately identified in any of the previous studies.
Table 17: Aggregate costs to the government of workplace fatalities and injuries and work-related ill health in 2006/07
Central 90% confidence interval estimate £ million lower upper
Benefits payments 1,671 1,322 2,019
Reductions in income tax and NI receipts 994 731 1,258
Medical treatment and rehabilitation 650 621 678
Administration 27 26 28
HSE and LA investigations 13 n/a n/a
Fines received (14) n/a n/a
Total costs 3,341 2,713 3,967
Note: Costs are shown in 2006 prices, rounded to the nearest million. There is a 90% chance that the total cost lies between the lower and upper limit due to the LFS sampling error. Rows marked n/a are not affected by LFS sampling error.
25

Figure 4: Probability distribution for total costs to the government due to LFS sampling uncertainty, shown in £ millions
26

7 OVERALL COSTS TO SOCIETY
7.1 As noted in Section 1, the overall costs to society of workplace injury and work-related ill health in 2006/07 needs to include all genuine resource costs but should not include cost transfers between one sector of the economy and another, and only first-order effects are considered. For example state benefits represent income to individuals but are an equal and opposite cost to the government.
7.2 The cost structure presented in Table 18 shows the money inflows and outflows explicitly. The net cost to society is obtained by summing across the columns, leaving just the cost elements described below. The cost structure groups together similar costs into six broad categories for convenience.
Loss of output (gross loss of earnings) 7.3 We have made the assumption that the firm directly affected by the absent worker seeks to
maintain its output, for example through work reorganisation and by recruiting a temporary or permanent replacement. In a situation with an equilibrium level of unemployment however, the macroeconomic effect is that one fewer worker is in employment and producing output.
7.4 The transfer costs associated with sick pay, tax, national insurance and benefits all cancel each other out, leaving just the gross loss of earnings borne by society as a whole. Gordon and Risley argued that the marginal loss of output to the economy could be equated with the marginal value of input by adding 29% non-wage labour costs to this gross loss of earnings figure.
7.5 It seems reasonable to assume there would be some loss in output as there is one less employee in the labour market after the general churn to replace this worker. An employee generally produces output sufficient in value to recover the employee’s own wage and their associated overheads, so if the employee’s output is lost these overheads would, if they continued, be an ongoing extra cost, to be added to the total. However, most of these overheads would not in fact continue. Over a short period the economy will adjust to a world with one less employee and proportionately lower overheads. Thus they do not seem to be relevant to the costing of the long term loss of an employee from the labour force.
7.6 There is potentially an argument for saying the economy as a whole would suffer a small loss of profit associated with the removal of one member of the workforce, but it is very hard to put a figure on this so the cost model assumes it is zero.
7.7 The net cost to society of £5,468 million is therefore simply the gross loss of earnings from the absent worker.
Overhead cost of Employers Liability insurance 7.8 From Sections 4 and 5, the total premium paid by employers for EL insurance is £1,559 million
and the total claim value received by the affected individuals is £917 million. The £642 million difference between the two is the net cost to society, and represents the profit margin and overheads for the insurance companies and the claim value consumed in legal costs and expenses.
27

Table 18: Breakdown of aggregate costs by cost bearer (columns A to C) and net costs to society (column D)
A. Individual and his / her dependents
£m B. Employer £m C. Government £m D. Society as a whole = A + B + C
£m
Loss of Income Loss of gross family earnings
OSP/SSP receipts
-5,468
1,145 OSP/SSP payments net of reimbursements
-1,137 SSP reimbursements -8
-5,468
0
State benefit receipts
Income tax and NI not paid on lower income
1,671
1,133 National Insurance paid on OSP/SSP
-147
State benefits payments
Net income tax and NI reduction
-1,671
-986
0
0
Compensation EL insurance receipts net of legal costs
917 EL insurance premiums
-1,559 -642
Non-financial human cost
Monetised value of non-financial human costs
-9,301 -9,301
Production Disturbance
Work reorganisation -67 -67
Recruitment and induction costs for temporary / permanent replacement staff
-74 -74
Health and Rehabilitation
Out of pocket funeral expenses, travel expenses, prescription charges, home expenses.
-79 NHS treatment and rehabilitation costs (short and long term)
-723 -802
28

A. Individual and his / her dependents
£m B. Employer £m C. Government £m D. Society as a whole = A + B + C
£m
Proportion of individual private health insurance premiums attributable to work related ill health / injury
-46 Proportion of corporate private health insurance premiums attributable to work related ill health / injury
-48 Value of treatment and rehabilitation covered by private health insurance claims
73 -21
Administration and legal
Administration of insurance, compensation and benefit claims
-10 Administration of SSP / OSP, insurance and compensation claims
-23 Administration of SSP and benefits claims
-27 -60
Insurance company profit margin and administration costs on other insurance products
-14
HSE or LA investigation / prosecution – internal costs and legal costs.
Fines paid
-20
-14
HSE or LA investigation / prosecution – internal costs
Fines received
-13
14
-14
-33
0
Total costs -10,052 -3,089 -3,341 -16,482
Note: Money outflows are shown in red as negatives and inflows in black as positives. The net cost to society is the sum of columns A, B and C. Key Abbreviations: OSP – Occupational Sick Pay; SSP - Statutory Sick Pay; NI – National Insurance; EL – Employers’ Liability Insurance; HSE – Health and Safety Executive; LA – Local Authority
29

Non-financial human costs 7.9 The non-financial human costs borne by individuals are also included in the overall cost to
society. From Section 4, this is estimated to be £9,301 million but for the reasons described in Section 4 and Appendix 3, this value has a large uncertainty associated with it, which should be acknowledged where practical whenever the value is cited.
Production disturbance 7.10 The production disturbance costs are the additional costs incurred by employers seeking to
maintain their output when a regular employee is absent from work. From Section 5, these includes the cost of work reorganisation for short term absences and the recruitment and induction cost of hiring a temporary or permanent replacement worker as cover for long term absences. The total cost to society is estimated to be £141 million.
Health and rehabilitation 7.11 The majority of the health and rehabilitation costs associated with workplace injury and work-
related ill health are borne by the government through funding the National Health Service, but there are some additional costs borne by individuals for prescription charges etc. The sum of these two elements represents the total cost to society, estimated to be £802 million.
7.12 From Sections 4, 5 and 6, the total premium paid by individuals and employers for private health insurance attributable to work related incidents is £94 million and the total claim value paid out to fund treatment is £73 million. The £21 million difference between the two is the net cost to society, and represents the profit margin and overheads for the insurance companies.
Administration and legal 7.13 The administrative overhead associated with informing people about sickness absence and
processing the various money inflows and outflows from sick pay and benefits payments; compensation and insurance claims; etc, is a net cost to society. Individuals, employers and the government all incur some administrative costs. The total cost to society is estimated to be £74 million.
7.14 Fines paid by employers following successful prosecutions by the authorities are a transfer cost so are not included in the total cost to society. However, the total legal costs and internal manpower costs incurred by employers, the HSE and the local authorities are a resource cost arising from workplace injury so represent a net cost to society. The total is estimated to be £33 million.
Overall costs to society 7.15 The costs from the preceding parts are brought together in Table 19 to give an estimate of the
overall costs to society of approximately £16.5 billion in 2006 prices, with a 90% confidence interval of £14.7 billion to £18.3 billion allowing for the sampling uncertainty in the underlying incidence data. Figure 5 shows the corresponding output from the @Risk analysis.
7.16 Of the £16.5 billion, approximately £9.3 billion is for non-financial human costs, £3.4 billion is for financial costs actually incurred in 2006/07 and the remaining £3.8 billion is the present value of future costs.
7.17 The largest cost item is therefore the non-financial human costs, contributing 56% of the total. Given the subjective nature of this cost estimate, and the large uncertainties in its derivation, this needs to be acknowledged. However, these are genuine social costs and they were an important part of previous estimates of both the aggregate costs to society and the appraisal values. Consequently, they must be included here.
7.18 The aggregate costs (financial and non-financial) of the relatively small number of people who never return to work comes to approximately £6.0 billion, which represents 36% of the total.
30

This is a similar finding to that by Gordon and Risley, and is also potentially of concern since the incidence estimate is based on a single year’s LFS data. As more data is collected in future years we would hope that this part of the analysis will become more robust. The influence of the sampling error in the number of people who never return to work combined with their high unit cost is therefore the primary cause of the distribution spread observed in Figure 5.
7.19 An indicative breakdown of how the overall costs to society can be apportioned between industry categories and government office regions can be found in Appendix 4.
Table 19: Aggregate costs to society of workplace fatalities and injuries and work-related ill health in 2006/07, grouped by cost category
Central 90% confidence interval estimate £ million lower upper
Loss of output (gross loss of earnings) 5,468 4,466 6,473
Overhead cost of EL insurance 642 n/a n/a
Non-financial human costs 9,301 8,523 10,082
Production disturbance 141 130 152
Health and rehabilitation 802 771 833
Overhead cost of private health insurance 21 n/a n/a
Administration 74 70 78
Investigations and prosecutions 33 n/a n/a
Total costs 16,482 14,717 18,257
Note: Costs are shown in 2006 prices, rounded to the nearest million. There is a 90% chance that the total cost lies between the lower and upper limit due to the LFS sampling error. Rows marked n/a are not affected by LFS sampling error.
Figure 5: Probability distribution for overall costs to society due to LFS sampling uncertainty, shown in £ billions
31

7.20 Table 20 shows the overall costs to society grouped by injury and ill health category rather than by cost category. Most costs are computed bottom up in this way already (by multiplying an incidence estimate by a unit cost) but some lump sum costs, such as insurance, have had to be apportioned pro-rata between the categories.
Table 20: Aggregate costs to society of workplace fatalities and injuries and work-related ill health in 2006/07, grouped by injury and ill health category
Central 90% confidence interval estimate
lower upper£ million
Fatalities 337 n/a n/a
RIDDOR reportable injuries (major or over 6,263 5,672 6,864 three calendar days) *
Non-reportable injuries (three or fewer 118 112 123 calendar days)
Ill health * 9,764 8,450 11,078
Total costs 16,482 14,717 18,257
Note: Costs are shown in 2006 prices, rounded to the nearest million. Rows marked with a * include the costs of those who never return to work on a pro-rata basis. There is a 90% chance that the total cost lies between the lower and upper limit due to the LFS sampling error. Rows marked n/a are not affected by LFS sampling error.
32

8 APPRAISAL VALUES
8.1 The HSE appraisal values are the unit costs to society per incidence of workplace fatality, workplace injury and work-related ill health. They are calculated by dividing the aggregate costs to society in 2006/07 by the number of new incidence cases in 2006/07 for each category of injury and ill health. Strictly speaking therefore they are average costs rather than marginal costs, but as the majority of costs are proportional to the number of new incidence cases this subtlety is not likely to be significant.
8.2 The average appraisal values for all workers are summarised in Table 21, showing financial and subjective non-financial human costs separately.
Table 21: Average appraisal value estimates for 2006/07 for all workers
Financial Non-financial Total 90% confidence interval costs human costs costs
£ £ £ lower upper
Fatality 476,000 976,000 1,452,000 1,445,000 1,463,000
RIDDOR reportable injury 6,300 11,400 17,700 16,200 19,300 (major or over three calendar days) *
Non-reportable injury (three or 220 20 240 235 245 fewer calendar days)
Ill health * 8,600 9,100 17,700 15,300 20,100
Note: Costs are shown in 2006 prices, rounded to the nearest thousand for fatality and the nearest hundred for injury and ill health. The costs of those who never return to work are included in the items marked with a * on a pro-rata basis.
8.3 The financial costs associated with a fatality are of course much higher than those for nonfatal injuries and ill health because the loss of earnings is cumulative over (typically) twenty years. The total of £1,452,000 for a fatality is slightly lower than the Department for Transport June 2006 figure54 of £1,489,000 because our estimate of the financial costs is calculated bottom-up for workplace fatalities, rather than relying on the DfT estimates of lost output and medical costs for a road traffic accident55 . The methodology is broadly consistent with the principles of the original DfT methodology for fatal accidents, as described by O’Reilly56 , see Appendix 5. However there are some aspects of O’Reilly’s method that were considered inappropriate for use in the cost model, such as: the allowance for overheads (see paragraph 7.5 ); any allowance for economic activity rates (unlike traffic fatalities it is known that all workplace casualties economically active at time of injury) and; 1990 discount rates which are superseded by current government appraisal rates of 3.5%.
8.4 The data in Table 21 can be broken down further to estimate the unit costs per incidence for each of the main cost bearing groups. This is shown in Table 22.
54 Highways Economics Note No. 1, 2005 Valuation of the Benefits of Prevention of Road Accidents and Casualties, January 2007, Department for Transport
55 The original DfT research estimated a VPF of £1,000,000 in 1997 prices. The financial costs and human costs have been indexed year on year since then using the average growth in GDP per capita.
56 O’Reilly, D. M., 1993, Costing road traffic accidents: the value of lost output, TRL Working Paper WP/SRC/09/93
33

Table 22: Estimated unit costs per incidence for 2006/07 for all workers, by cost bearer
Individual Employer Government Society £ £ £ £
Fatality £1,211,000 £123,000 £118,000 £1,452,000
RIDDOR reportable injury £11,500 £2,700 £3,500 £17,700 (major or over three calendar days) *
Non-reportable injury (three £50 £30 £160 £240 or fewer calendar days)
Ill health * £10,300 £3,800 £3,600 £17,700
Note: Costs are shown in 2006 prices, rounded to the nearest thousand for fatality and the nearest hundred for injury and ill health. The costs of those who never return to work are included in the items marked with a * on a pro-rata basis.
34

9 PRIORITIES FOR FURTHER RESEARCH
9.1 The cost estimates presented in this report have been prepared using the best data currently available to the project team. However, there are inevitably areas where the cost estimates could be improved through additional research. The most significant areas where the methodology could be improved are summarised below, together with recommendations on how to address them.
Derivation of non-financial human costs 9.2 The calculation of the non-financial human costs has been put on a firmer footing than the
previous estimates, but it is still indicative only, and as can be seen from Appendix 3 the total costs are very sensitive to one or two key assumptions (for example the representative accident scenario equated to a ‘never return’, and the extrapolation of the methodology to incidents involving very little or zero time off work). Some fundamental new research is required to derive better estimates that are appropriate to work related incidents, for example building on current HSE research into the use of a ‘harm index’ that would allow different types and severities of injury and ill health to be compared on a consistent basis. Of particular interest would be a better understanding of the impaired quality of life suffered by those who permanently withdraw from the workforce, so the appropriate value can be placed on wishing to avoid such impairment.
Costs of long latency diseases 9.3 We have highlighted in several places in the report that the cost estimates for ill health largely
exclude long-latency chronic diseases, because the LFS is very unlikely to pick them up, and even if a respondent to the LFS happened to have recently been diagnosed with such a condition they would be very unlikely to attribute the condition to their work if the exposure happened many years ago. HSE have set a short piece of research in motion to value occupational cancer deaths and the associated period of morbidity. This is based on the recent publication of work done by Imperial College amongst others57 , and their methodology will make feasible the inclusion of the costs of other long latency diseases such as chronic obstructive pulmonary disease in future Costs to Britain estimates.
Estimating incidences of injury and ill health 9.4 The Labour Force Survey (LFS) is likely to remain the only comprehensive source of
information on non-fatal work related injury and ill health to inform the cost model, but at the moment it counts ‘people’ rather than ‘cases’. There is a potential difference between the two for the incidence estimates, because the LFS respondent is only asked to describe their most recent work related injury or their most serious case of work related ill health. Thus, the LFS will underestimate the time off work for those people who have suffered more than one incident in the year. HSE should consider whether further work is needed to quantify this underestimate.
Future burden arising from new incidence cases 9.5 Similarly, the LFS only asks respondents how much time off work they have taken in the past
12 months. For new incidence cases therefore, the time off work distribution is truncated to a maximum of 12 months and we have no information on the future burden of new incidence cases other than for those who definitely know that they will never return to work. The HSE should consider whether further work is needed to quantify this underestimate.
57 Rushton L, Bagga S, Bevan R, Brown TP, Cherrie JW, Fortunato L, Holmes P, Slack R, Van Tongeren M, Young C, Hutchings SJ. Occupation and cancer in Britain. British Journal of Cancer 2010: 102: 1428-1437
35

Those who never return to work 9.6 The first year where specific data to estimate the number of never returns has been gathered
through the LFS is 2008/09. However, as the ‘never return’ estimate is based on a small number of sample cases, the LFS is only able to provide a reliable top-level estimate – it is not possible to provide any additional breakdown, for example a reliable split between cases due to injury and cases due to ill health, and an age distribution that could be used to better estimate the present value of future years lost income. HSE should consider whether a more comprehensive survey of ‘never returns’ is justified. At the very least, data from future LFS returns should be pooled in order to build up a bigger sample size that may allow more robust population estimates to be determined.
Medical treatment costs 9.7 The estimate of medical treatment costs has been done in more detail than was possible in
previous reports, but is still an area that would benefit from further research. The unit costs for medical treatments were based on average figures published by the Personal Social Services Research Unit (PSSRU)58 but the number of visits to the GP, out-patient clinic, physiotherapy, counselling etc required for each condition still had to be estimated using expert opinion as this is not captured in the Labour Force Survey. This is particularly an issue for those who never return to work and has strong links with ‘derivation of non-financial costs’ above.
58 The PSSRU is a collaboration between the University of Kent at Canterbury; the London School of Economics and Political Science; and the University of Manchester. Their publications are available on-line at: http://www.pssru.ac.uk/
36

APPENDIX 1: SOURCES OF REPLACEMENT INCOME
For most people, absence from work means a reduction in income. However the extent of the reduction is complex, and differs substantially between individuals, depending on the types of replacement income that are available to them to offset their loss of salary. The cost model constructs a ‘bottom’ up estimate of the aggregate replacement income using data available in the public domain. The steps involved are as follows: • Identify the different sources of replacement income. • Determine what proportion of the fatality and self report cases are able to claim against
each type of replacement income, taking into account eligibility criteria, estimated take-up rates, and the fact that some sources of replacement income offer tiered payment rates (e.g. one rate for the first six months and a different rate for the next six months).
• Determine whether the replacement income is paid on the basis of duration of absence in calendar days or in terms of actual lost working time.
• For replacement income paid in the current year, multiply the time away from work (either calendar days or full day equivalent days, depending on the replacement income source) by the appropriate daily rate and the proportion of the population who are assumed to claim it.
• For replacement income paid in future years (such as long term state benefits), multiply the number of years claimed by the appropriate yearly rate and the proportion of the population who are assumed to claim it, and discount to the present day using the HM Treasury discount rate59 . At present, we can only reliably estimate future year replacement income streams for fatalities and those who never return to work; it is assumed that all other workers are able to return to their normal jobs at their pre-injury / ill health salary level.
Table A1.1 below summarises the sources of replacement income that have been modelled and the payment rates assumed.
59 The average age of those who never return to work is used to determine how many years worth of long term benefits are paid (between the date of the incident and the normal retirement date). Benefits are assumed to grow in line with inflation so the future costs are discounted at the current HM Treasury real discount rate of 3.50%.
37

Table A1.1: Sources of replacement income
Source of replacement income Assumptions in cost model
Occupational sick pay (OSP) 91% of employers provide OSP to their employees according to the Chartered Institute of Personnel Development 2007 survey (CIPD 2007)60 . However, the self-employed don't get any OSP so the proportion of all cases of injury and ill-health (employees + self-employed) that are compensated with OSP needs to be reduced accordingly. The effective proportion of self reported cases receiving OSP assumed in the cost model is 79%. Almost 90% of employers who provide OSP pay it at the full rate of salary for an average of 15 weeks, which falls part way through the 3 to 6 months off work category in the LFS. Part salary is then paid for an average of an additional 16.4 weeks. The calculation in the cost model therefore apportions the number of days paid at the higher rate and lower rate pro-rata, and corrects for the fact that OSP is paid on an FDE basis rather than a calendar day basis. Salary figures are reduced from 100% and 50% to 90% and 45% respectively to take account of bonuses and overtime that are not included in OSP.
Statutory sick pay only (SSP) According to CIPD 2007, the remaining 9% of employers offer SSP only to their employees. As above, this needs to be factored pro-rata to take account of the self-employed who don't qualify for SSP. The effective assumed proportion of self reported cases receiving SSP only is 8%. SSP is paid from the fourth day of absence for a total of 28 weeks at a rate of £70.05 per week61 if average gross earnings are £84 per week or more.
Incapacity benefit (IB) The take-up of income related benefits amongst those who are entitled to them is estimated to be around 90%62 . IB is payable at the short term lower rate (£59.20 per week 63 in 2006/07) to those who are unable to work due to ill health for the first 28 weeks, if they are not otherwise receiving OSP or SSP. In the cost model, this applies to those self reported cases which are associated with the self employed (13%). The short term higher rate of £70.05 is then payable for
60 Absence Management: Annual survey report 2007, CIPD, available on-line at: http://www.cipd.co.uk/) 61 Rates of Statutory Sick Pay for 2006 taken from HMRC leaflet E14(2006). Available on-line at:
http://www.hmrc.gov.uk/helpsheets/2006/e14.pdf 62 Income Related Benefits Estimates of Take-Up in 2007-08 by expenditure, which contains a comparison against
2006-07 figures, published by DWP and available on-line at: http://www.parliament.uk/deposits/depositedpapers/2009/DEP2009-2874.pdf
63 DWP leaflet BRA5DWP, 'Social Security Benefit Rates', April 2006
38
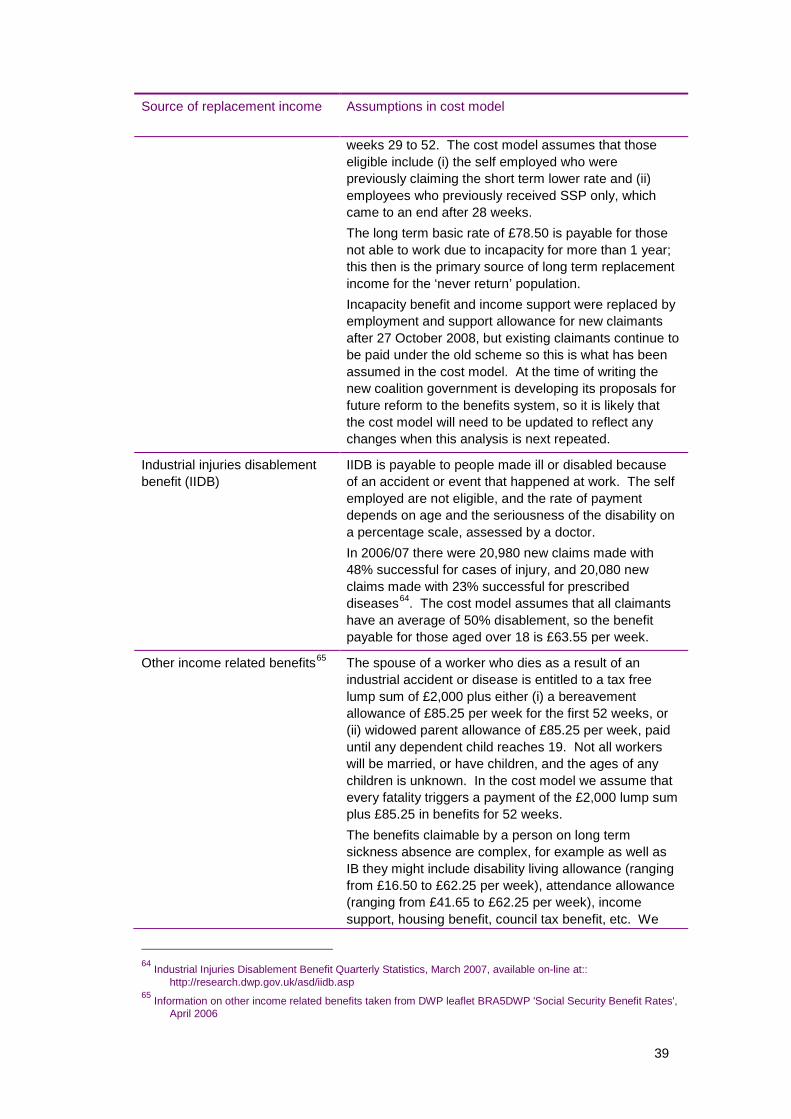
Source of replacement income Assumptions in cost model
Industrial injuries disablement benefit (IIDB)
weeks 29 to 52. The cost model assumes that those eligible include (i) the self employed who were previously claiming the short term lower rate and (ii) employees who previously received SSP only, which came to an end after 28 weeks. The long term basic rate of £78.50 is payable for those not able to work due to incapacity for more than 1 year; this then is the primary source of long term replacement income for the ‘never return’ population. Incapacity benefit and income support were replaced by employment and support allowance for new claimants after 27 October 2008, but existing claimants continue to be paid under the old scheme so this is what has been assumed in the cost model. At the time of writing the new coalition government is developing its proposals for future reform to the benefits system, so it is likely that the cost model will need to be updated to reflect any changes when this analysis is next repeated.
IIDB is payable to people made ill or disabled because of an accident or event that happened at work. The self employed are not eligible, and the rate of payment depends on age and the seriousness of the disability on a percentage scale, assessed by a doctor. In 2006/07 there were 20,980 new claims made with 48% successful for cases of injury, and 20,080 new claims made with 23% successful for prescribed diseases64 . The cost model assumes that all claimants have an average of 50% disablement, so the benefit payable for those aged over 18 is £63.55 per week.
Other income related benefits 65 The spouse of a worker who dies as a result of an industrial accident or disease is entitled to a tax free lump sum of £2,000 plus either (i) a bereavement allowance of £85.25 per week for the first 52 weeks, or (ii) widowed parent allowance of £85.25 per week, paid until any dependent child reaches 19. Not all workers will be married, or have children, and the ages of any children is unknown. In the cost model we assume that every fatality triggers a payment of the £2,000 lump sum plus £85.25 in benefits for 52 weeks. The benefits claimable by a person on long term sickness absence are complex, for example as well as IB they might include disability living allowance (ranging from £16.50 to £62.25 per week), attendance allowance (ranging from £41.65 to £62.25 per week), income support, housing benefit, council tax benefit, etc. We
64 Industrial Injuries Disablement Benefit Quarterly Statistics, March 2007, available on-line at:: http://research.dwp.gov.uk/asd/iidb.asp
65 Information on other income related benefits taken from DWP leaflet BRA5DWP 'Social Security Benefit Rates', April 2006
39
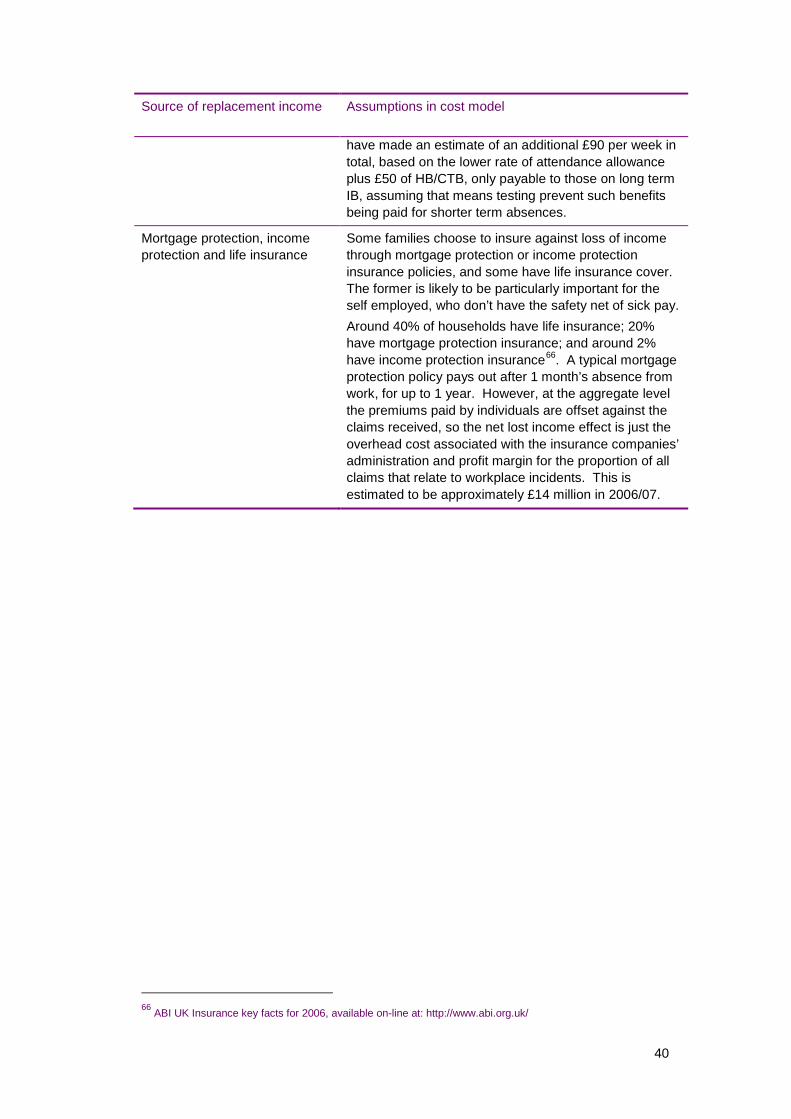
Source of replacement income Assumptions in cost model
Mortgage protection, income protection and life insurance
have made an estimate of an additional £90 per week in total, based on the lower rate of attendance allowance plus £50 of HB/CTB, only payable to those on long term IB, assuming that means testing prevent such benefits being paid for shorter term absences.
Some families choose to insure against loss of income through mortgage protection or income protection insurance policies, and some have life insurance cover. The former is likely to be particularly important for the self employed, who don’t have the safety net of sick pay. Around 40% of households have life insurance; 20% have mortgage protection insurance; and around 2% have income protection insurance66 . A typical mortgage protection policy pays out after 1 month’s absence from work, for up to 1 year. However, at the aggregate level the premiums paid by individuals are offset against the claims received, so the net lost income effect is just the overhead cost associated with the insurance companies’ administration and profit margin for the proportion of all claims that relate to workplace incidents. This is estimated to be approximately £14 million in 2006/07.
66 ABI UK Insurance key facts for 2006, available on-line at: http://www.abi.org.uk/
40

APPENDIX 2: MEDICAL COSTS
The Labour Force Survey contains no information on the medical treatment received by those who have reported work related absence, so the medical costs borne either by the individual or the taxpayer have to be estimated. Gordon and Risley treated all cases of injury and ill health equally and assumed that their medical costs increase in proportion to the duration of absence. We have taken a slightly different approach by separating out the different medical conditions captured in the LFS sample and using published data combined with expert judgement to estimate the whole life treatment costs for each.
Medical costs borne by the NHS The unit costs of services delivered by the NHS (GP consultations, Accident and Emergency investigations, in-patient and out-patient treatment episodes etc) have been taken from ‘Unit Costs of Health and Social Care, 2007’, which is an annual publication prepared by the Personal Social Services Research Unit (PSSRU)67 . The number of visits to the GP, outpatient clinic, physiotherapy, counselling etc required for each condition was estimated by a small group of occupational health experts at a workshop held at Warwick University on 25 May 2010. Table A2.1 below summarises the medical costs borne by the NHS that have been modelled and the assumptions used.
67 The PSSRU is a collaboration between the University of Kent at Canterbury; the London School of Economics and Political Science; and the University of Manchester. Their publications are available on-line at: http://www.pssru.ac.uk/
41

Table A2.1: Medical costs borne by the NHS
Medical condition Assumptions in cost model
Reportable major injuries Reportable major injuries include limb fractures, amputations, dislocations of the shoulder/hip/knee/spine, temporary or permanent eye injuries, and the catch-all category of ‘other major injuries’ that include injuries leading to hypothermia, heat induced ill health or unconsciousness or requiring resuscitation or admittance to hospital for more than 24 hours. All reportable major injuries are assumed to require the attendance of an ambulance (£257) plus a standard assessment at A&E (£84). If the time off work is greater than seven days, they are also assumed to require an in-patient stay. The average cost of an in-patient non-elective consultant led treatment episode is £1,502. The injured person is assumed to visit their GP once, for example to obtain a sick note. The NHS cost of this visit is £34 for the GP consultation and £44 for a GP dispensed prescription. In addition, the injured person is assumed to attend between two and five out-patient sessions, for example fracture clinics or physiotherapy sessions. The average cost of all adult follow-up attendances is £85, plus £44 for an additional prescription. All of these costs are assumed to occur within 12 months of the date of the injury, so are not discounted.
Reportable over 3 day injuries
Reportable over 3 day injuries include all injuries that result in more than 3 days absence from work and that are not classified as major. It is assumed that an ambulance transfer is not required, and that the initial medical assessment can be done in a non-24 hour A&E department or a minor injuries unit (£35). If the time off work is greater than seven days, they are also assumed to require non-elective consultant led treatment as a day patient (£751). The injured person is assumed to visit their GP once to obtain a sick note, and attend one follow-up out-patient clinic (costs as above). All of these costs are assumed to occur within 12 months of the date of the injury, so are not discounted.
Reportable injury ‘never returns’
The NHS costs within the first 12 months are assumed to be as for reportable major injuries above. However, it is then assumed that the injured person will require repeat visits to the GP and out-patient clinic at the same frequency per year for a further ten years. The future costs are adjusted for the estimated real growth in health costs above inflation using the difference between the average growth in the Hospital & Community Health Services (HCHS) Pay and Prices Index and the average growth in the retail prices index (RPI), then discounted to 2006 using the Treasury discount rate of 3.5%.
42

Medical condition Assumptions in cost model
Minor injuries less than 3 A minor injury is assumed to require initial examination at a days away from work minor injuries unit (£35) plus one outpatient visit and prescription
charge (£129). No sick note is required so no GP visit is necessary.
Fatalities The total cost to the NHS of a workplace fatality is estimated to be £402, made up of ambulance attendance (£257), emergency A&E intervention (£111), and death certification by a doctor (£34).
Ill health It is assumed that the vast majority of cases of ill health captured by the Labour Force Survey would be managed by the patients local GP. Treatment episodes for musculoskeletal disorders and stress, depression and anxiety are estimated to last for up to two years following diagnosis, with an average of two visits to the GP per patient per year each involving a standard consultation and a GP dispensed prescription (unit costs as above). Newly diagnosed chronic breathing and lung problems are assumed to involve an overnight stay in hospital if the time off work is greater than seven days; the GP led treatment following this is then estimated to last for ten years. Future year costs of these three conditions are adjusted for real growth above inflation using the Hospital and Community Health Services (HCHS) Pay and Prices Index and are then discounted to 2006, as described above. Other cases of ill health captured by the Labour Force Survey are treated similarly to musculoskeletal disorders and stress, although it is assumed that the treatment episode only lasts for one year. As noted elsewhere, this analysis largely excludes the costs of chronic industrial diseases with long latency such as cancer. If these conditions were to be included in future revisions to the analysis, their medical cost implications would be considerable (for example the average cost of treating mesothelioma68 has been estimated as £9,400 per case in 2006 prices and the average cost of treating all cancers69 has been estimated as £14,600 per case in 2006 prices).
Ill health ‘never returns’ The NHS costs within the first 12 months are assumed to be the same as for musculoskeletal disorders and stress (see above). As for injury ‘never returns’, it is then assumed that the sick person will require repeat visits to the GP at the same frequency per year for a further ten years. The future costs are adjusted for the estimated real growth in health costs above inflation and discounted to 2006.
68 The Economic Costs of Health Service Treatments for Asbestos-Related Mesothelioma Deaths, Watson et al, 2006, Annals of the New York Academy of Sciences
69 The governments Cancer reform strategy 2007 (available on-line at: http://www.dh.gov.uk/prod_consum_dh/groups/dh_digitalassets/documents/digitalasset/dh_081007.pdf) puts the total NHS cost of treating cancer at £4.35 billion per year in 2005 prices in England, with 309,000 new cases of cancer in 2006, giving an estimated unit cost of £14,600 in 2006 prices (inflated using Hospital & Community Health Services (HCHS) Pay and Prices Index)
43

Medical costs borne by the individual or their family There are some out of pocket health related costs that the individual will have to fund personally. The costs included in the model and the assumptions made are summarised in Table A2.2.
Table A2.2: Medical costs borne by the individual or their family
Medical condition Assumptions in cost model
Prescription charges
Travel costs
Home modifications
Funeral expenses
For every prescription dispensed (see Table A2.1), as well as the NHS cost of £44, the patient makes their own contribution through the standard tariff prescription charge. Note that we have assumed all patients have to pay this charge, which may be an over-estimate. The cost in 200670 was £6.65 per item.
Every visit to the GP or out-patient clinic will involve some additional travel expenses for the patient. These are estimated at £10 per round trip.
Permanently incapacitating injuries may require modifications to be made to the person’s home. These costs are often partially or wholly met by the local authority, although the eligibility criteria for grants and loans are complex. The PSSRU report (see Footnote 65) discusses a range of costs, from installation of a grab rail at £6 per year (annualised cost) to installation of a stair lift at £373 per year (annualised cost). We have assumed a nominal sum of £100 per year for cases of ‘other reportable major injury’ and ‘reportable injury never returns’ as these include the possibility of serious multiple injuries, but zero otherwise.
The out-of-pocket cost of a workplace fatality for the victim’s family consists primarily of the funeral cost. This is a present value cost rather than a current year cost because it represents the cost of bringing forward the funeral by approximately 30 years. The guide price of a funeral is estimated at £2,750 by the Office of Fair trading.71 The appropriate present value factor is 0.65, giving a present value cost of £1,787.
70 NHS leaflet HC12: Charges and optical voucher values 1 April 2006, available on-line at: http://www.dh.gov.uk/en/Publicationsandstatistics/Publications/PublicationsPolicyAndGuidance/DH_4131675
71 Office of Fair Trading guidance available on-line at: http://www.oft.gov.uk/oft_and_cd/
44

APPENDIX 3: NON-FINANCIAL HUMAN COSTS
In their 1999 revision of the Davies and Teasdale72 attempt to cost workplace-related accidents and ill health, Gordon and Risley (G&R)73 set out the ways in which they arrived at monetary values of the costs incurred by victims and their families, including the non-financial costs (which they refer to as ‘human’ or ‘subjective’ costs). The essence of what they did is explained in Paragraphs 86-99 inclusive of Chapter 3 of G&R, and in Paragraphs 11-16 inclusive of Appendix 4 of that report. The purpose of what follows is to discuss some of the difficulties they encountered and try to produce an updated approach which is transparent, consistent and makes the best use of the data available currently. In the course of doing so, the aim is to clarify issues which have sometimes caused confusion, and to identify those aspects of the available data that are less informative than might be desired. Limitations in existing databases necessarily result in some uncertainties about the estimates we can make, and this appendix will indicate ways in which those data, and hence the estimates of the non-financial costs, might in future be enhanced. The general approach, which underpinned G&R and which constitutes the basis for the present estimates of the non-financial costs, involves using the stated preferences of representative samples of members of the public. These preferences are elicited in the form of their expressed willingness to pay (WTP) for reductions in the risks of premature death, injury and ill health and also the trade-offs they say they are willing to make between different levels of these hazards. The lynchpin in what G&R did and in what follows is the value of preventing a fatality (VPF).
The Value of Preventing a Fatality (VPF) The Department for Transport has for more than twenty years used a WTP-based figure to value the benefit of measures designed to prevent one statistical fatality74 . As presented by DfT in Section 2.1.5 of its webTAG unit 3.4.175, and previously in their publication Highways Economics Note 176 , this total figure is composed of three elements: lost output, human costs, and medical and ambulance costs. The figures for June 2006 are shown below, calculated from the published June 2005 values and the appropriate uplift factor of 1.0427.
£ Lost output Human costs Medical and ambulance costs
Total
June 2005 490,960 936,380 840 1,428,180
June 2006 511,924 976,363 876 1,489,163
However, this way of decomposing the total does not exactly correspond with the conceptual and empirical basis for the figure. Setting the medical and ambulance costs aside – there is no issue about them – the preference-based approach entails separating the component which reflects people’s WTP to reduce their own risks of premature death from the component which reflects the loss to the rest of society of the surplus that the (typical) victim would have
72 Davies, NV and Teasdale, P, 1994. The costs to the British economy of work accidents and work related ill health. HSE Books ISBN 0 717 0666 X
73 Gordon, F, Risley, D, and EAU economists, 1999. The costs to Britain of workplace accidents and work related ill health in 1995/96. Second Edition. HSE Books ISBN 0 7176 1709 2
74 To be more precise, it is the value of safety improvements intended to reduce the risks of a large number of road users to the extent that, on average, they will prevent one fatality that could have been expected to occur in the absence of those safety improvements.
75 webTag unit 3.4.1, The Accidents Sub-Objective, available on line at: www.dft.gov.uk/webtag 76 Highways Economics Note No. 1, 2005 Valuation of the Benefits of Prevention of Road Accidents and Casualties,
January 2007, Department for Transport
45

produced over and above what he/she would have consumed. If we define Net Output as Gross Output (in the DfT’s table, Lost Output) minus (typical) Consumption, and if we suppose that the individual is stating their WTP for a reduction in the risk of dying – i.e. for a reduction in the risk of losing the benefit of that consumption and of all other pleasures of being alive that they would have enjoyed – then the total figure can be seen as being composed of WTP (covering ‘human costs’ and typical consumption) + Net Output + Medical and Ambulance. Notice that, by definition, this breakdown necessarily sums to precisely the same total figure for the VPF as that given by the DfT breakdown. G&R understood this, as is evident from their Paragraph 91 (p.32). Unfortunately, however, the way in which they expressed it was somewhat ambiguous. Nevertheless, what they clearly tried to do was to reconstitute the full WTP element by taking a weighted average of the 1995 and 1996 DfT human cost figures and adding to this weighted average the lost consumption (which they estimate as 80% of lost gross output) to arrive at a full WTP value, which they describe as “the human cost of a fatal injury”. In Paragraph 91, they give this value as £766,000 (see their Footnote 35 for the finer detail). Applying the same assumption that victim’s lost consumption constitutes 80% of lost gross output, the corresponding calculation for 2006 is that the full WTP element consists of £976,363 human costs plus £409,539 lost consumption, giving a full WTP value of about £1,386,00077 . However the cost model puts the Gross Lost Output resulting from a fatality on the Financial Cost side of the ledger. This seems well justified by the simplicity of presentation that it allows in this context. The consumption element therefore needs to be subtracted from the full WTP figure, as in the table above, to leave just the ‘human cost’ amount on the Non-Financial Cost side in order to avoid double-counting in deriving the total cost to society. It should be stressed that, for reasons explained in the next section, this subtraction applies only to fatalities and not to non-fatal injuries.
The value of preventing injuries and ill health: G&R’s general approach The general approach adopted by G&R was to try to use existing estimates of stated relativities between injury and death – primarily but not exclusively from the road safety literature – to assign values to various levels of non-fatal work-related injury and ill health. The main difficulty they wrestled with was (and still is) that the road safety research used injury descriptions which were, at the time they were devised, reasonably representative of the range of road injury types, but which were not necessarily so well-suited to work-related injuries. And they were even less easy to map to some important categories of work-related ill health. G&R tried to make sensible links and adjustments, but the difficulties were (and are) substantial. Essentially, what G&R tried to do was to take the key road accident injury descriptions used to inform transport policy and make the best match they could with workplace injuries. For example, as they explain in Paragraph 12(a) of their Appendix 4, they took the category ‘permanent incapacity following injury’ in Table 20 (p.33) to be something between the road injury labelled R and the road injury labelled S in the research reported by Jones-Lee et al78 . To update the non-financial values for those injuries to the 1995/6 base, G&R multiplied the mean ‘standard gamble’ relativities for R and S from Jones-Lee et al by the £766,000 WTP component of the VPF, thereby arriving at £178,480 for R (23.3% of £766,000) and £115,670 for S (15.1% of £766,000). In the interests of clarity, two points should be noted.
77 In fact, the cost model uses the directly calculated value of average lost output per workplace fatality rather than the DfT estimate, which comes to a WTP value of £1,212,000.
78 Jones-Lee M et al, 1993, The value of preventing non-fatal road injuries: the findings of a willingness to pay national sample survey, Transport Research Laboratory research report ISSN 0266 7045.
46
First, although G&R made the right calculations, their explanation in Paragraph 12(a) may cause confusion, because they refer to those figures as being, respectively, 23.3% of VPF and 15.1% of VPF, whereas to be absolutely accurate they should have said 23.3% of the WTP component of VPF and 15.1% of the WTP component of VPF, since the full VPF for that time was the £766,000 plus Lost Net Output plus Medical and Ambulance costs. Nevertheless, despite that unfortunate lapse of precision in their explanation, the calculations they actually did were the right ones, in the sense of being comparable with the way in which the non-financial component of the monetary value of preventing non-fatal road injuries was (and is) computed. This leads to a second point. Since the WTP component in the VPF includes the consumption that the individual loses by dying, it may appear that the relative values for the injuries can also be assumed to incorporate some allowance for anticipated loss of consumption due to loss of earnings – in which case, it might be argued, it would be double-counting to also enter lost earnings resulting from the non-fatal injury on the Financial Cost side of the ledger. However, it is important to bear in mind the way in which the standard gamble questions about the non-fatal injuries were put to respondents when their responses were being elicited. For the questions about non-fatal injuries, respondents were explicitly asked NOT to take account of any lost earnings resulting from the non-fatal injury. So what they were being asked to focus on was, in effect, the reduction in their ability to enjoy their (guaranteed) current level of income due to the damage to their health occasioned by the injury. If they did what they were asked to do (and in the absence of any firm evidence to the contrary, that is the default assumption), their standard gamble response should be linked to the full WTP component of the VPF. To the extent that the injury reduces gross output, that loss falls entirely on other parties, since those other parties – the employers (perhaps via insurance) and taxpayers (perhaps via the benefit system) – were being assumed to compensate the victim in full for any lost earnings. Thus in the case of non-fatal injuries, there is no issue of possible double counting and lost gross output should be included on the Financial Cost side in full and in addition to the standard gamble-based values. Having (hopefully) clarified that point of principle about the derivation of the non-financial values for R and S and the other road injury descriptions by linking the SG means to the full WTP component of the VPF, there remains the issue of how to map work-related injuries and ill health categories onto those road injuries and their values. G&R were quite open and frank about the judgments and assumptions they made – and the limitations of the evidence to hand. For example, in the Paragraph 12(a) referred to above, they end by saying (with reference to injuries R and S): “Since we do not have information on the number of cases in each state … we have used the average value …”. On the basis of this average value of R and S, they derived a figure of £147,100 per case, which they applied to each of the 3,000 or so injuries that had led to withdrawal from the labour force to give, in their Table 21, a total figure for that category of £430m as a measure of the ‘subjective costs’ involved. The same assumptions anchored to the WTP component of the 2007 VPF would generate a value of £293,050 for the non-financial human costs of each such case. On the more pessimistic assumption that R alone is typical of such injuries, the updated figure would be £355,560; if S were taken to be typical, the 2007 figure would be £230,430.
The valuation of work related injuries In Paragraph 12(b) of their Appendix 4, G&R assumed that the typical injury classified as ‘serious’ and involving an absence from work of more than 3 months could be mapped more or less directly to road injury W. Here, they eschewed the standard gamble value for W (2% of the WTP component of VPF) in favour of a figure based on a more recent study (Carthy et al (1999)) that had asked more directly for the WTP to prevent the certainty of W and also what amount the respondent would be willing to accept (WTA) to make up for the discomfort and loss of enjoyment entailed by W. For reasons not fully spelt out, G&R opted to use the higher mean WTA figure (which was nevertheless smaller than the standard gamble-based figure) for
47

injuries involving more than 3 months’ absence and the lower WTP figure as the basis for valuing ‘non-serious reportable’ injuries involving more than 3 days’ absence79 . They identified these latter as roughly corresponding with a road injury description labelled F, which was much like W but without any time as an in-patient. There appears to be a degree of arbitrariness about these judgments, reflecting, perhaps, the lack of any good evidence base about just what ‘serious’ and ‘non-serious reportable’ injuries involved in terms of time spent in hospital and the distribution of recovery times and working days lost. The problems involved in mapping to work-related ill health categories were even more challenging. Whereas many injuries may be related to specific, identifiable incidents, work-related ill health may be the product of exposure to noise, dust, chemicals, handling heavy/awkward objects, working in confined spaces, ongoing psychological pressure or stress, and so on, over long periods of time. So an individual who reports losing, say, 10 days of work in the course of the past year due to lower back pain may not have lost all 10 days in one ‘incident’, but may have had several periods of temporary incapacity in the course of a year – and may also have had some loss of enjoyment of leisure for many days or weeks when the discomfort, though being experienced, is not severe enough to result in time off work. To obtain a figure for ‘permanently incapacitating ill health’, G&R took the figure for ‘permanent incapacity following injury’ and subtracted £11,000 (an estimate of the allowance for the greater severity of pain, distress and incapacity during the first few weeks following a major injury – for details, see their Paragraph 13(a) in Appendix 4). This supposed that in all other respects the ill health condition would entail much the same reduction of quality of life as the consequences of such an injury. Little allowance appears to have been made for any difference in the individual’s age at onset of such ill health. All other cases of ill health involving absences of more than a calendar week were valued the same as the ‘non-serious reportable’ injuries. Although all this seems somewhat arbitrary, there appears to have been little firm basis to justify doing anything more sophisticated. The lack of a clear and sufficiently detailed picture of the nature and distribution of work-related injuries and ill health continues to limit our ability to derive well-founded cost estimates that are reasonably consistent (or at least, coherent) across the spectrum. In the current cost model, we are working with more sub-categories of both injury and ill health, but we still have quite imperfect knowledge about the different degrees of severity of impact on quality of life within these categories. For example, we may be able to access a sample of records describing (often from a lay perspective) the circumstances and initial impact of an accident on the injured person, but there is then little or no information about their subsequent fate – how long it took to recover, the extent and degree of any long-term disability (short of those ‘never return’ cases). Likewise with the ill health categories. In the absence of such data, one short-run option is to collapse the existing data into the categories used by G&R and simply update the values of the non-financial human costs by applying the ratio of the VPF figures for the two years. But this might appear to endorse various more or less arbitrary assumptions. An alternative short-run option (which is used in the cost model for the current analysis) is to try to use data about days off work to proxy the severity of injuries or episodes of ill health. One possible scheme for injuries might be as shown below. There are gaps between injury descriptions, but the general idea is that a particular description might serve as a proxy for the ‘central tendency’ of injuries entailing the ranges of days lost in the left-hand column.
79 The Appendix of Carthy et al (1999) considered the implications of using four possible functional forms to generate a value for W somewhere between the WTP and WTA figures. The midpoint of these calculations entails a value that translates into roughly 0.004 of the WTP component of the VPF.
48

Time off work Proxy Brief description of ‘typical’ injury injury
≤ 3 days Minor No time as in-patient, full recovery within a couple of weeks
4 - 6 days F No time as in-patient, 3-4 months to full recovery 1 - 2 weeks
2 weeks - 1 month W 2-7 days in hospital, 1 - 3 months 3-4 months to full recovery
3 - 6 months X 1-4 weeks in hospital, 1-3 years to full recovery
6 - 9 months 9 months - 1 year
S As X, but with some residual permanent adverse effects
Never return S As X, but with some residual permanent adverse effects
For example, if injury W involves 2-7 days in hospital, it seems unlikely (although, admittedly, not impossible) that it will entail less than 2 weeks off work. On the other hand, if someone is expected to recover fully from such an injury in 3-4 months, it seems very unlikely that they would need to take more than 3 months off work. On that basis, injuries involving between 2 weeks and 3 months off work have been ‘mapped’, on average, to injury W. On the assumption – and with little hard evidence to go on, it can be little more than an assumption – that injuries involving between 4 days and 2 weeks off work are less serious than W but more than minor, these are mapped, on average, to injury F. However, injuries involving 3-6 months off work are unlikely to fit with “full recovery in 3-4 months” and therefore seem better represented by “full recovery in 1-3 years”, with the result that they are mapped to injury X. All injuries involving more than 6 months off work are assumed to involve some residual permanent effects, as in injury S. Of course, this may not be true in some cases where there will be a full recovery; and in other cases where people never return to work, the permanent effects may be more substantial than the injury S description suggests. With a richer database, it might be possible to form a clearer picture that would either substantiate these assumptions or else allow them to be modified according to the evidence. However, on the basis of the current limited information, the model takes S as the ‘default’ basis for estimating the average non-financial costs of all injuries involving more than 6 months off work.
The valuation of work related ill health In the above discussion, an injury is taken to be an identifiable effect of a particular incident. The assumption is that the injury will have some health profile over some period of time, and the value assigned to it is supposed to take account of the profile as a whole. But ill health data cannot necessarily be interpreted in the same way. As discussed earlier, the loss of, say, 10 working days due to lower back pain may often not be traceable to a particular incident and may comprise of two or three shorter periods of absence and may recur each year for several years, possibly worsening over time. But such a profile may not be apparent in the LFS data. Moreover, the non-work impacts of some forms of ill health may be poorly correlated with – and possibly greatly understated by – days off work. For example, partial loss of hearing may not necessarily result in many (any) days off work, but could have significant adverse impacts upon social and leisure activities.
49
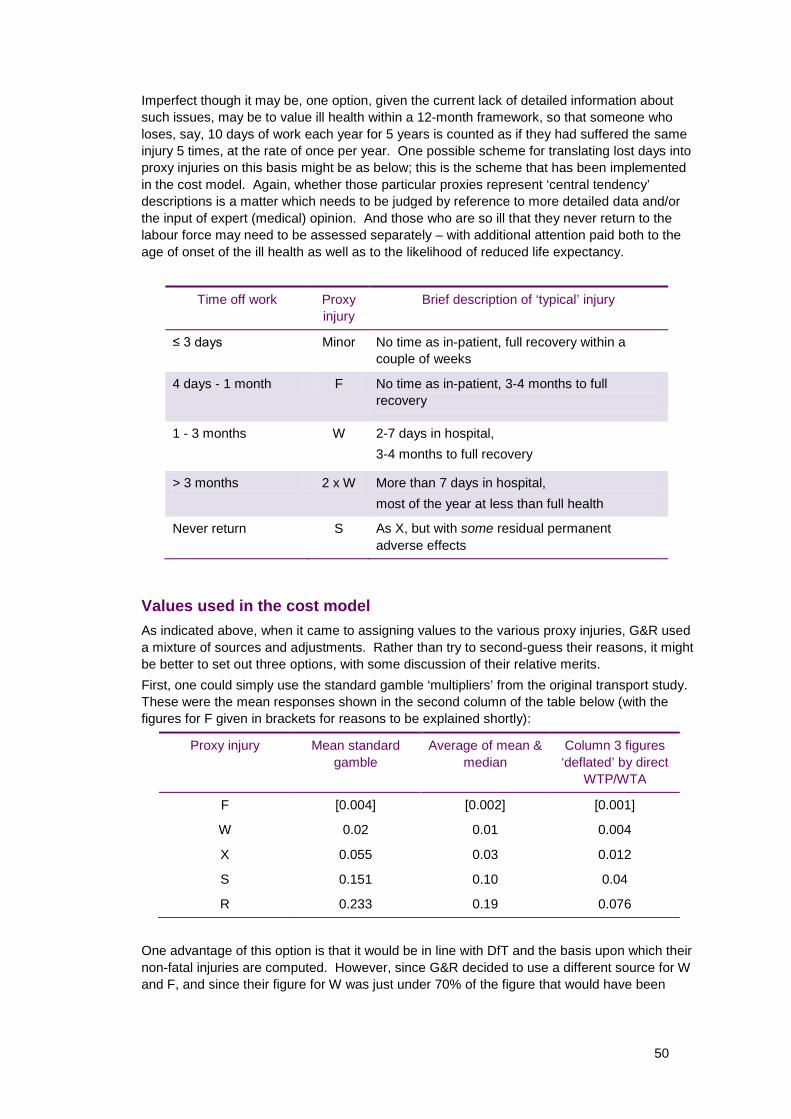
Imperfect though it may be, one option, given the current lack of detailed information about such issues, may be to value ill health within a 12-month framework, so that someone who loses, say, 10 days of work each year for 5 years is counted as if they had suffered the same injury 5 times, at the rate of once per year. One possible scheme for translating lost days into proxy injuries on this basis might be as below; this is the scheme that has been implemented in the cost model. Again, whether those particular proxies represent ‘central tendency’ descriptions is a matter which needs to be judged by reference to more detailed data and/or the input of expert (medical) opinion. And those who are so ill that they never return to the labour force may need to be assessed separately – with additional attention paid both to the age of onset of the ill health as well as to the likelihood of reduced life expectancy.
Time off work Proxy Brief description of ‘typical’ injury injury
≤ 3 days Minor No time as in-patient, full recovery within a couple of weeks
4 days - 1 month F No time as in-patient, 3-4 months to full recovery
1 - 3 months W 2-7 days in hospital, 3-4 months to full recovery
> 3 months 2 x W More than 7 days in hospital, most of the year at less than full health
Never return S As X, but with some residual permanent adverse effects
Values used in the cost model As indicated above, when it came to assigning values to the various proxy injuries, G&R used a mixture of sources and adjustments. Rather than try to second-guess their reasons, it might be better to set out three options, with some discussion of their relative merits. First, one could simply use the standard gamble ‘multipliers’ from the original transport study. These were the mean responses shown in the second column of the table below (with the figures for F given in brackets for reasons to be explained shortly):
Proxy injury Mean standard gamble
Average of mean & median
Column 3 figures ‘deflated’ by direct
WTP/WTA
F [0.004] [0.002] [0.001]
W 0.02 0.01 0.004
X 0.055 0.03 0.012
S 0.151 0.10 0.04
R 0.233 0.19 0.076
One advantage of this option is that it would be in line with DfT and the basis upon which their non-fatal injuries are computed. However, since G&R decided to use a different source for W and F, and since their figure for W was just under 70% of the figure that would have been
50

given by the mean standard gamble, the use of the mean standard gamble everywhere would increase the costs of that level of injury relative to G&R’s figure. There is a further and somewhat different possible concern about using the mean standard gamble figures (a concern which, if valid, would also have implications for DfT). While the use of means rather than medians may have some broad theoretical appeal, there is a practical concern about the possibility that a small minority of any sample who are not familiar with probabilities may unwittingly distort the means with errant responses. This is particularly likely to happen when the most plausible response is a low probability – e.g. something in the region of 0.01. Suppose 96 out of 100 people give an answer around 0.01, but suppose that the other 4 misunderstand and/or make some kind of mistake in forming or reporting their probability response which results in much higher figures – say an average of about 0.25 between the four of them80 . This will, in effect, double the mean. One way – somewhat arbitrary, admittedly – of trying to offset such effects is to take an average of the mean and the median, which would give the multipliers in the third column81 . A third option would be to take the direct money valuation of W, as G&R tried to do, and adjust the SG figures on that basis. However, as explained in Footnote 77 above, the WTA figure for W used by G&R is liable to overstate considerably the value implied by an appropriately weighted average of WTA and WTP. If we were to set the value of preventing W at 0.004 rather than at 0.01 for the reasons outlined in Footnote 77 and if we were then to apply the same adjustment to all of the other figures in the third column, this would give the figures in the fourth column of the table. No values, direct or indirect via SG, were elicited for F, and G&R simply took the WTP figure for W from Carthy et al (which was just over one-seventh of the WTA figure). Arguably, this is a little too extreme: although F excludes the period in hospital (something for which many people have a strong aversion) and may well entail a shorter recovery time, a figure in the region of a quarter to a fifth of W might be closer to the mark – although this is yet another somewhat arbitrary judgment that could be modified in the light of better data and greater medical expertise. However, that is the provisional basis for the multipliers for F shown in the table. With the figures in the second column being between three and five times higher than the figures in the fourth column, which should be used? Given the lack of a firm evidence base about the distribution of the nature and severities of injuries and ill health categories, it might be wise at this stage to regard the second column as giving an upper estimate and the fourth column as giving a lower estimate, and take the third column as a provisional best estimate. Those values are therefore the ones used in the cost model in the current analysis.
Final remarks There is clearly plenty of scope for the estimates to be improved and for the ‘confidence intervals’ to be narrowed in the light of better information about the wide variety of work-related injuries and ill health categories. The system of trying to map these to a set of road traffic injuries is clearly less than ideal, especially since that system itself has some gaps. Nevertheless, given the present state of knowledge and the past work of Davies and Teasdale and Gordon and Risley, it may be the best that can be done at the moment, with ‘time off work’ data being used to try to improve the mapping and with the valuation ‘multiplier’ options each being put on a more internally consistent (and more transparent) footing.
80 When dealing with probabilities that must lie somewhere between 0 and 1 inclusive, if the ‘true’ figure is at the low end of the range, there is much greater scope for errors on the high side to distort the mean more considerably than errors on the low side. For example, see Loomes, G. and Mehta, J., 2007, The Sensitivity of Subjective Probability to Time and Elicitation Method, Journal of Risk and Uncertainty, 34, 201-16.**
81 The medians for W, X, S and R were, respectively, 0, 0, 0.05 and 0.15.
51
APPENDIX 4: REGIONAL AND SECTORAL BREAKDOWN
Methodology A breakdown of the aggregate costs to society of workplace fatalities and self reports by both region and industry sector can be estimated by multiplying the estimated regional and industry incidence of work-related ill health and workplace injury by the relevant unit cost per case. For regional estimates, the unit cost per case is assumed to be the same across regions and equal to the national appraisal value (see Table 21). This approach does not allow for regional wage variations, which might be significant for Greater London where the average wage is markedly greater than in the rest of Great Britain. However, regional wage variations are affected by the industry composition of employment within a region (for example, a larger percentage of professional jobs in Greater London). Since the industry composition of employment within a region does not necessarily mirror the industry composition of workplace fatalities and self reports within a region, an adjustment for regional salary variations was judged as potentially having an unknown distorting effect on the cost estimates. It was therefore felt more prudent to use the appraisal values which are based on the national average salary. For cost estimates by industry, allowance for variation in wage rate by industry has been made to the unit cost per case, and industry specific unit cost values estimated. An analysis of the Annual Survey of Hours and Earnings data for 2006 suggests that the industry group ‘Agriculture, hunting, forestry and fishing’ have salary levels significantly less than the mean of all workers. The average gross wage per full-day equivalent (FDE) day for workers in this industry group is around a quarter less than the national average (£73 compared to £102), whilst the other industry groups have salary levels similar to the all industry average. In the cost model, industry specific unit cost estimates have been calculated by factoring the loss of earnings component of the national appraisal values by the ratio of industry wage to average wage (the loss of earnings component accounts for around 25% of the national appraisal values for injuries, and around 40% for ill health). All other components of the national appraisal value are assumed to be the same across industry. Industry specific aggregate costs have been estimated for four broad industry groupings, classified using the 1992 Standard Industrial Classification:
A, B agriculture, hunting, forestry and fishing C, D and E mining, quarrying, manufacturing and utilities supply F construction G to O services, public administration, education health and social work.
Regional employment and incidence profile Employment numbers vary significantly by region. In 2006, over a quarter of jobs in Great Britain were in London and the South East, whilst Wales and the North East each accounted for less than 5% of all jobs in Great Britain82 (see Figure A4.1). Figure A4.2 shows the regional breakdown of fatal injuries and new incidence cases of self-reported non-fatal injuries and work-related ill health to workers. Not surprisingly, this breakdown bears some resemblance to the regional employment profile, with Wales and the North East accounting for the fewest incidence cases. However, it should be noted that other factors as well as employment levels will determine the actual number of work related ill health and injury cases within a region, for example the industrial and occupational mix of employment.
82 Source: Annual Survey of Hours and Earnings, 2006
52

London
South East
North West
East
West Midlands
Scotland
South West
Yorkshire and the Humber
East Midlands
Wales
North East
0 500 1000 1500 2000 2500 3000 3500
Number of jobs (000s)
Figure A4.1: Jobs by region in 2006
Source: Annual Survey of Hours and Earnings, 2006
53

Scotland
North West
South East
West Midlands
South West
London
East
Wales
East Midlands
Yorkshire and The Humber
North East
Unknown
0 5 10 15 20 25 30 35
Number of fatal injuries
North West
South East
South West
Yorkshire and The Humber
West Midlands
East
Scotland
East Midlands
London
North East
Wales
0 10000 20000 30000 40000 50000 60000
Number of reportable injuries
Figure A4.2a: Incidence of fatal injuries and new incidence cases of self-reported nonfatal reportable injuries for workers by region in 2006
Note: The red bar shows the mean value and the black whiskers show the 90% confidence interval. The figures for fatal injuries are average annual numbers reported to all enforcing authorities for 2005/06 to 2007/08. The figures for non-fatal injuries are annual average numbers estimated from the Labour Force Survey for 2006/07 and 2007/08.
54

South East
West Midlands
South West
North West
Yorkshire and The Humber
Scotland
East
East Midlands
London
Wales
North East
0 20000 40000 60000 80000 100000
Number of minor injuries
South East
London
North West
East
Yorkshire and The Humber
South West
Scotland
East Midlands
West Midlands
North East
Wales
0 20000 40000 60000 80000 100000
Number of cases of ill health
Figure A4.2b: New incidence cases of self-reported minor injuries and work-related ill health for workers by region in 2006
Note: The red bar shows the mean value and the black whiskers show the 90% confidence interval. The figures for minor injuries are annual average numbers estimated from the Labour Force Survey for 2006/07 and 2007/08. The figures for ill health are annual average numbers estimated from the Labour Force Survey for 2005/06 to 2007/08.
55

Regional costs to society As with the national picture, the regional costs to society are dominated by self-reported ill health and reportable injury. (Whilst the unit cost of a fatality is high, the annual number of fatalities is comparatively low and conversely whilst the annual number of non-reportable injuries is high, the unit cost of a non-reportable injury is low). The aggregate costs to society of fatalities and self reports by region in 2006 are presented in Table A4.1. Figure A4.3 shows the total cost values with confidence intervals calculated from the @Risk analysis. The South East bears the highest cost (an estimated £2.5bn, largely reflecting the number of workers in this region), whilst Wales bears the lowest cost (an estimated £0.8bn, and again largely reflecting the employment total of the region).
Table A4.1: Aggregate costs to society of workplace fatalities, workplace injury and work-related ill health in 2006/07, broken down by government office region
£ millions Workplace fatalities
Reportable injuries
(major or over 3 days)
Minor injuries (under 3
days)
Ill health Total cost
South East 40 760 19 1,638 2,457
North West 42 802 11 996 1,852
South West 33 692 13 873 1,611
London 30 399 9 1,124 1,561
East 28 588 10 972 1,598
Yorkshire and The Humber
21 625 11 905 1,562
Scotland 45 582 10 828 1,466
West Midlands
35 599 13 797 1,444
East Midlands
22 521 10 807 1,360
North East 12 349 5 423 789
Wales 22 347 7 400 777
Total (inc. unknown)
337 6,263 118 9,764 16,482
Note: Costs are shown in 2006 prices
56

Agg
rega
te C
ost,
£ M
illio
ns
3000
2500
2000
1500
1000
500
95%
75%
Mean
25%
5%
Wal
es
Nor
th E
ast
Eas
t Mid
land
s
Wes
t Mid
land
s
Sco
tland
Y'sh
ire &
Hum
ber
Eas
t
Lond
on
Sou
th W
est
Nor
th W
est
Sou
th E
ast
Figure A4.3: Aggregate costs to society (in £millions) of workplace fatalities, workplace injury and work-related ill health in 2006/07, broken down by government office region
Note: 50% confidence intervals are shown by the red box and 90% confidence intervals are shown by the black whiskers
57

Industry employment and incidence profile The Services grouping accounts for the majority of UK employment (see Figure A4.4), and the incidence profile of self-reported work-related ill health and non-fatal workplace injury by industry largely reflects this (see Figure A4.5). In contrast, the breakdown of fatal injuries by industry is quite different from the overall employment profile – almost half of all workplace fatal injuries occurred to workers in the construction and agricultural groupings, despite these accounting for only around 5% of total employment. This reflects the higher risks posed in these two industry sectors.
Services, public administration, education health and social work
Mining, quarrying, manufacturing and utilities supply
Construction
Agriculture, hunting, forestry and fishing
0 4000 8000 12000 16000
Number of jobs (000s)
Figure A4.4: Jobs by industry grouping in 2006
Source: Annual Survey of Hours and Earnings, 2006
58

Services, public administration, education health and social work
Construction
Mining, quarrying, manufacturing and utilities supply
Agriculture, hunting, forestry and fishing
0 10 20 30 40 50 60 70 80 90
Number of fatal injuries
Services, public administration, education health and social work
Mining, quarrying, manufacturing and utilities supply
Construction
Agriculture, hunting, forestry and fishing
0 50 100 150 200 250 300
Number of reportable injuries (000s)
Figure A4.5a: Incidence of fatal injuries and new incidence cases of self-reported nonfatal reportable injuries for workers by industry grouping in 2006
Note: The red bar shows the mean value and the black whiskers show the 90% confidence interval. The figures for fatal injuries are average annual numbers reported to all enforcing authorities for 2005/06 to 2007/08. The figures for non-fatal injuries are annual average numbers estimated from the Labour Force Survey for 2006/07 and 2007/08.
59
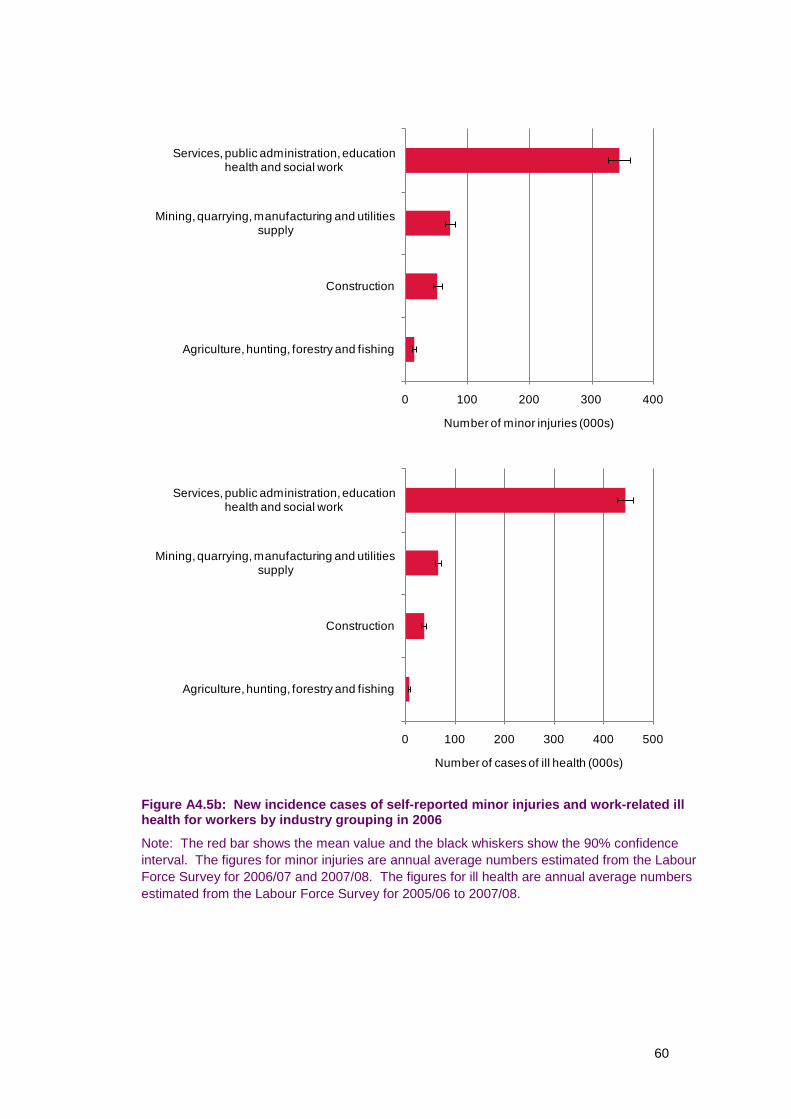
Services, public administration, education health and social work
Mining, quarrying, manufacturing and utilities supply
Construction
Agriculture, hunting, forestry and fishing
0 100 200 300 400
Number of minor injuries (000s)
Services, public administration, education health and social work
Mining, quarrying, manufacturing and utilities supply
Construction
Agriculture, hunting, forestry and fishing
0 100 200 300 400 500
Number of cases of ill health (000s)
Figure A4.5b: New incidence cases of self-reported minor injuries and work-related ill health for workers by industry grouping in 2006
Note: The red bar shows the mean value and the black whiskers show the 90% confidence interval. The figures for minor injuries are annual average numbers estimated from the Labour Force Survey for 2006/07 and 2007/08. The figures for ill health are annual average numbers estimated from the Labour Force Survey for 2005/06 to 2007/08.
60

Industry grouping costs to society The aggregate costs to society of fatalities and self reports by region in 2006 are presented in Table A4.2. Figure A4.6 shows the total cost values with confidence intervals calculated from the @Risk analysis. The Services grouping bears the highest cost (an estimated £12.4bn, largely reflecting the number of workers in this grouping).
Table A4.2: Aggregate costs to society of workplace fatalities, workplace injury and work-related ill health in 2006/07, broken down by industry grouping
£ millions Workplace Reportable Minor injuries Ill health Total cost fatalities injuries (under 3
(major or days) over 3 days)
Services, public administration, education, health and social work
Mining, quarrying, manufacturing and utilities supply
Construction
Agriculture, hunting, forestry and fishing
Total
113 4,358 84 7,853 12,409
64 879 17 1,149 2,109
103 804 13 665 1,584
53 219 3 108 383
333 6,259 118 9,776 16,486
Note: Costs are shown in 2006 prices. The total aggregate cost of £16,486 million does not exactly match the value in Tables 19 and 20 because of the methodology used to correct for industry specific wage costs.
61

Agg
rega
te C
ost,
£ M
illio
n
14000
12000
10000
8000
6000
4000
2000
0
95%
75%
Mean
25%
5%
Agriculture, hunting,
Construction Mining, quarrying,
Services, public
forestry and fishing
manufacturing and utilities supply
administration, education,
health and social work
Figure A4.6: Aggregate costs to society (in £millions) of workplace fatalities, workplace injury and work-related ill health in 2006/07, broken down by industry grouping
Note: 50% confidence intervals are shown by the red box and 90% confidence intervals are shown by the black whiskers
62
APPENDIX 5: METHODOLOGICAL DIFFERENCES FROM PREVIOUS STUDIES
It is difficult to directly compare the cost estimates presented in this report with previous estimates because of the significant changes in methodology that have been adopted. Some of the most important changes have been highlighted in the main text, but the purpose of this appendix is to bring them all together in one place and to discuss their implications.
Differences in the aggregate cost estimate The Gordon and Risley report estimated the aggregate cost to society at between £14.5 billion and £18.1 billion in 1995 prices, which represented between 1.9% and 2.4% of 1995/96 Gross Domestic Product (GDP). The 2001/02 interim update published by HSE used essentially the same methodology by combining illness and injury data for 2001 with unit cost data from the Gordon and Risley report, adjusted for inflation. It estimated the aggregate cost to society at between £20.0 billion and £31.8 billion in 2001 prices, which represented between 1.9% and 3.1% of 2001/02 GDP. In contrast, the current report has a central estimate for the aggregate cost to society of £16.5 billion with a 90% confidence interval of between £14.7 billion and £18.3 billion in 2006 prices. This represents a central estimate of 1.2% of 2006/07 GDP, with a 90% confidence interval of between 1.1% and 1.3% of 2006/07 GDP. It is therefore almost half the size of the previous estimate in real terms. The main reasons for this difference are as follows:
Use of incidence data rather than prevalence data for work-related ill health As discussed in Section 3 of the report, in order to reflect, as closely as possible, the cost of injury and health outcomes associated with current health and safety working conditions, the annual estimate of work-related ill health cases has been limited to self-reports of ‘newlyoccurring’ cases (or incidence cases) of ill health caused or made worse by work in people who have worked in the last 12 months. This is a refinement to the previous cost estimates which were based on both ‘newly-occurring’ and pre-existing cases (or prevalence cases) of ill health caused or made worse by work in people who have worked in the last 12 months. The 1990 self-reported work-related ill health estimates did not allow a distinction between incidence and non-incidence cases of ill health, and whilst that distinction was available in the 1995/96 data, to ensure comparability with the earlier cost estimates the distinction was ignored. So for example Table 8 on page 14 of the Gordon and Risley report lists prevalence estimates rather than incidence estimates. We can roughly estimate by how much the 2006/07 estimates would increase if we had based our cost estimates on prevalence cases as in previous methods. Over the four years 2005/06 – 2008/09 estimates from the LFS indicate that new incidence cases of ill health in people who had worked in the previous 12 months made up approximately 44% of the corresponding total prevalence in the year, with variation by ill health type. Scaling up the relevant costs in a similar proportion would add just less than £5 billion to the total aggregate cost estimate, with lost earnings increasing by around £1.4 billion and non-financial human costs by around £3.3 billion. However, it is arguable that the non-incident cases should never have contributed to the non-financial costs since this is a lifetime value and to avoid double counting should be attributed to the year in which the ill health first occurred. Therefore, even had the 2006/07 cost estimate been based on prevalence rather than incidence estimates, the method should still have been revised to ensure that a non-financial cost was not placed on non-incident cases.
63

Exclusion of damage costs and non-injury accidents Gordon and Risley included the costs of non-injury accidents in their aggregate totals, i.e. workplace incidents that result in damage to property and/or disruption to production that had the potential to cause injury as well, but did not in fact do so. Their rationale was that these incidents might be blamed at least in part on health and safety failings. The incidence data for this type of accident was very limited indeed (a one-off analysis performed by HSE in 1993 for five industry case studies), so their estimates relied on an ‘accident triangle’ argument to say that for every one incident resulting in an injury there might be a further twenty non-injury accidents83 . The data on the damage costs arising from non-injury accidents was equally limited. The data available on non-injury accidents today is little better, with a scoping study performed for HSE determining that there was insufficient evidence to include the costs of non-injury accidents in the current estimates. 84 Thus, all non-injury accidents have been excluded from the aggregate cost totals. If the cost of non-injury accidents was removed from the Gordon and Risley estimates their aggregate cost total would be reduced by between £1.4 billion and £4.5 billion.
Information on those who never return to work As noted in Section 3 of the report, the costs associated with permanent withdrawal from the workforce accounted for approximately 50% of the total cost to society in the Gordon and Risley report. They estimated that 27,000 people were forced to give up work in 1995/96 with a 90% confidence interval of between 16,000 and 42,000 people Likewise, in the 2006/07 cost estimates, the cost associated with permanent withdrawal from the workforce accounted for a large proportion of the total cost - some 36%. The 2006/07 estimate of people who permanently withdrew from the labour market as a result of a workplace injury or work-related ill health was 19,000 with a 90% confidence interval between 14,000 and 25,000. Comparing the central estimate, this is considerably less than in 1995/96. However, it should be noted that different definitions are used to define these ‘never return’ cases in the two time periods (the 2008/09 Labour Force Survey, on which the latter estimate is based, included specific questions to estimate never returns). If we ignore the definitional differences though, it is likely that the difference in the two estimates can be explained by sampling error alone – this can be seen by considering the large overlap in the confidence intervals of the two estimates. In the current model, the uncertainty in this ‘never returns’ estimate is reflected in the confidence interval around the cost estimate. For comparison purposes, if the 1995/96 never returns estimate is included in the current model as the estimate for never returns in 2006/07, then we would get an aggregate cost of £18.9 billion with a 90% confidence interval of £15.0 billion to £22.7 billion. Whilst this is an increase of £2.4 billion in our central estimate of the aggregate cost for 2006/07, considering the range of uncertainty around the estimates, the two cost estimates are not significantly different.
83 The ratio varies from industry to industry, but the average value is one to twenty, see paragraph 57 on page 23 of the Gordon & Risley report.
84 HSE Research Report: ‘The costs of non-injury accidents. Scoping study. Prepared by the Health and Safety Laboratory for the Health and Safety Executive 2007, Available at: www.hse.gov.uk/research/rrpdf/rr585.pdf
64

Non-financial human costs Appendix 3 describes in some detail the methodology used by Gordon and Risley and the revised methodology used in the current cost model. There are significant differences in the final values of the non-financial human costs for non-fatal injuries and ill health in our cost model compared to Gordon and Risley’s estimates (after allowing for indexation by GDP per capita). This becomes most apparent in the appraisal values. One of the most significant differences is that Gordon and Risley used a value of £147,100 in 1995 prices for permanent incapacity following injury and £136,100 in 1995 prices for permanently incapacitating ill health. They assumed that these figures were appropriate for the 3,000 never returns due to injury and the 24,000 never returns due to ill health respectively. These values are based on the average of injury category R and S, but without any strong justification (see Appendix 3). In the current cost model we assume that injury category S applies to all never return cases, based on the observation that the average age of a never return is 54 which is much older than the early 40’s average age applicable to the original road traffic accident willingness to pay surveys. If instead of injury S we used the average of injury R and injury S in our cost model for the 19,000 never returns, our aggregate cost estimate would increase by £0.9 billion. The sensitivity of the costs estimate to such a small change in assumptions is obviously an important factor that should be acknowledged when the cost model estimates are cited. This highlights the need for further research into the valuation of non-financial human costs, see Section 9.
Loss of output As noted in Section 7, Gordon and Risley estimated that the marginal loss of output to the economy as a whole from work related injury and ill health could be equated with the marginal loss of input by adding 29% non-wage labour costs to the gross loss of earnings calculated for the absent employees. We argued that most of these overheads would not in fact continue so could not be counted as an ongoing extra cost. The true additional loss to the economy as a whole is more accurately described as the lost profit or lost value added that the employees labour would normally produce, which is very hard to put a figure on but is likely to be very small at the margin. The cost model therefore assumed a zero% mark-up on top of the lost gross earnings. If instead of zero% we used Gordon and Risley’s 29% in the cost model, our aggregate cost estimate would increase by approximately £1.6 billion.
Use of age adjusted salaries The cost model uses weighted average salaries to take account of the fact that (i) part time workers earn slightly less per hour on average than full time workers and (ii) average salaries tend to increase with age from age 20 to 45, but then decrease again until retirement. This is particularly significant when calculating the loss of future earnings suffered by those who never return to work, whose average age is 54. Gordon and Risley used the full time wage rate averaged across all employees in each sector, so it is likely that they will have overestimated the loss of earnings suffered by the never return population.
65

Recruitment and administration costs Changes to the methodology for calculating recruitment and administration costs mostly affect the estimate of total costs borne by employers. As we noted in Paragraph 5.16, Gordon and Risley and Pathak have treated the cost of recruitment as a ‘brought forward’ cost – someone leaves work now that would have left work in three years time for other reasons. We argued that a more appropriate treatment was to include the full cost of recruitment in the year, because (i) the new recruit is themselves likely to change jobs and (ii) many of the recruitment events are likely to be for temporary contractors rather than permanent replacements, until the absent employee is able to return to work. The average cost of a recruitment event in the cost model is £2,528 in 2006 prices; this would be reduced to £531 if the Gordon and Risley methodology was used (neglecting their additional assumption of a four person recruitment chain that was dropped by HSE in the more recent updates). Using this lower figure would reduce our aggregate cost estimate by £58 million. Gordon and Risley also assumed that administrative activities by employers, DWP, etc would take half an hour per day for the duration of the absence. As noted in Pathak’s 2008 paper, this assumption seems unnecessarily conservative, so he introduced the Three Administrative Points (TAP) methodology that instead argued that administrative activity occurs in three bursts, at the beginning, middle and end of a period on absence. We adopted a similar approach in our cost model, though we also put a cost on the administrative activity undertaken by the affected individuals. The total administrative cost to society in the Gordon and Risley report (excluding non-injury accidents) was estimated at between £310 million and £590 million in 1995 prices. In comparison, the total administrative cost to society in the current estimate is £60 million in 2006 prices.
Health costs Appendix 2 describes the approach taken to estimate medical costs in our cost model. It is not straight forward to perform an alternative calculation in 2006 prices using Gordon and Risley’s assumptions, but to put the figures in context they estimated the total cost to society of medical treatment at between £208 million and £702 million in 1995 prices, compared to our central estimate of £823 million in 2006 prices (including £21 million overhead cost of private medical insurance).
66

Differences in the appraisal value estimates The table below compares our current estimates of the average cost to society per case with the previous estimates published by HSE and DfT. All costs are in 2006 prices.
Table A6.1: Comparison of current and previous estimates of the 2006/07 appraisal values
£ Previous estimate Current estimate
Financial Non- Total Financial Non- Total costs financial costs financial
human human costs costs
Fatality 520,600a
513,000b
Reportable injury 22,000c
(major or over 3,100d
three days)
Minor injury 150 (under three days)
Ill health 3,500
991,200a
976,000b
18,400c
2,700d
200
6,700
1,511,800 476,000 976,000 1,452,000 1.489,000
40,400c 6,300 11,400 17,700 5,800d
350 220 20 240
10,200 8,600 9,100 17,700
Note: The current estimates are rounded to the nearest thousand for fatality, the nearest hundred for reportable injury and ill health, and the nearest ten for minor injury. The previous estimates for fatality are as published by the HSE (marked a) and the DfT (marked b). The slight difference between the two is due to different indexation factors being applied; the HSE figures are for Quarter 3 (October to December 2006) and the DfT figures are for June 2006. The previous estimates for injury and ill health are as published by the HSE. Separate estimates were given for RIDDOR major injuries (marked c) and RIDDOR over 3 day injuries (marked d).
The average cost per fatality calculated by the cost model is £1,452,000. This uses the same non-financial human cost figure of £976,000 as the DfT valuation, but the financial costs are calculated from first principles so it is not surprising that they come to a slightly different total. The methodology that we have used to calculate the financial costs is consistent with the DfT methodology originally described by O’Reilly,85 except that (i) we do not include a mark up for non-wage costs in the loss of output calculation (see above), and (ii) we know that all workplace casualties are economically active at time of injury, whereas O’Reilly had to make an allowance for economic activity rates. In addition, average salaries and the age distribution for workplace fatalities might be different to that for road accidents; average salaries have not necessarily grown exactly in proportion to GDP per capita (the index used to inflate the DfT valuations since the original 1997 figure was derived); the medical cost assumptions for a road accident may be different to ours; the discount rate used by O’Reilly was higher than ours. The difference in non-financial human costs between current and previous estimates depends crucially on which assumptions are made, particularly regarding the never returns, see above. One other point worth noting is that we have assumed that ill health or injury that results in no
85 O’Reilly, D. M., 1993, Costing road traffic accidents: the value of lost output, TRL Working Paper WP/SRC/09/93
67

time off work has a zero non-financial human cost, which results in the low weighted average of only £20 per case compared to £200 previously for minor injuries. The previous estimate of the financial cost for an average case of ill health also looks low compared to the current estimate, especially when we take into account that the previous estimate will have also included the 29% non-wage cost mark-up for lost output discussed above. One of the main reasons for this is that the previous cost estimate does not include any allowance for the financial costs of ill health ‘never returns’.
Published by the Health and Safety Executive 11/11

Health and Safety Executive
The costs to Britain of workplace injuries and work-related ill health in 2006/07 Workplace fatalities and self reports
This research report presents an updated method for estimating the aggregate ‘costs to Britain’ of workplace injuries and new cases of work-related ill health, along with updated unit costs associated with an individual workplace injury or new case of ill health (‘appraisal values’).
The previous aggregate cost estimates were produced for 2001/02 and the previous unit cost estimates were in 2006 prices. The unit costs had developed separately and with a slightly different methodology to the aggregate costs and so were not strictly comparable.
This report provides a comprehensive update of the costs to Britain analysis, and includes:
n An improved cost estimation methodology, making best use of the data available at the time the project was undertaken.
n As close an estimate as possible of the aggregate costs to Britain of workplace fatalities, workplace injuries, and new cases of work-related ill health associated with working conditions in the financial year 2006/07.
n Corresponding estimates of the appraisal values for 2006/07 that are fully consistent with the aggregate cost estimates.
n Putting the aggregate costs and appraisal values on the same footing by calculating both in a single integrated spreadsheet model.
This report and the work it describes were funded by the Health and Safety Executive (HSE). Its contents, including any opinions and/or conclusions expressed, are those of the authors alone and do not necessarily reflect HSE policy.
RR897
www.hse.gov.uk