working with demographic life table data in statafm · working with demographic life table data in...
TRANSCRIPT

Working with Demographic Life
Table Data in Stata Daniel C. Schneider
Max Planck Institute for Demographic Research
Stata Conference, July 27, 2017, Baltimore

2 / 20
Contents
Demographic Life Tables
The Human Mortality Database
hmddata
text to .dta conversion
data usage and examples
life expectancy: Oeppen / Vaupel (2002)
mortality rates
lifetable
Demographic Life Table Data in Stata D.C.Schneider Stata Conference 2017

3 / 20
The Life Table
• displays death-related statistics of a
cohort/population
• columns: age and age-related functions
pertaining to mortality
• cohort life table vs. period life table:
"synthetic cohort"
• based on triangles from a Lexis diagram
• calculation of life expectancy
• related: ltable of official Stata
Demographic Life Table Data in Stata D.C.Schneider Stata Conference 2017

4 / 20
Life Table of the US, 2014
Demographic Life Table Data in Stata D.C.Schneider Stata Conference 2017
. hmddata use lifetables bothsexes, clear grid(5x1) popfilter(usa)
. list age mx-ex if year==2014, noobs sep(0)
[...]

5 / 20
Life Expectancy
• life expectancy (LE, ex):
• ex: average years ahead of a population
member aged X
• e0 (LE at birth):
• average years lived
= mean age at death
• e0 of period life table: average years lived
under current (period) mortality conditions
• All statements are made with respect to
members of a hypothetical cohort.
Demographic Life Table Data in Stata D.C.Schneider Stata Conference 2017

6 / 20
The Human Mortality Database (HMD)
Demographic Life Table Data in Stata D.C.Schneider Stata Conference 2017
• compiled by: UC Berkeley, Max Planck Institute for Demographic Research
• high-quality data
• variables: see next slide
• geographic coverage: • currently 39 countries / populations
• many European countries, plus: US, Canada; Japan, Taiwan; Australia; Chile; Israel; Russia
• time coverage: Sweden 1750-, France 1816-, 10 other countries start before 1900
• www.mortality.org
• companion / similar databases: HLD, HFD, HFC

7 / 20
HMD: Data Contents
Demographic Life Table Data in Stata D.C.Schneider Stata Conference 2017
8 / 20
HMD: Data Acquisition
Demographic Life Table Data in Stata D.C.Schneider Stata Conference 2017
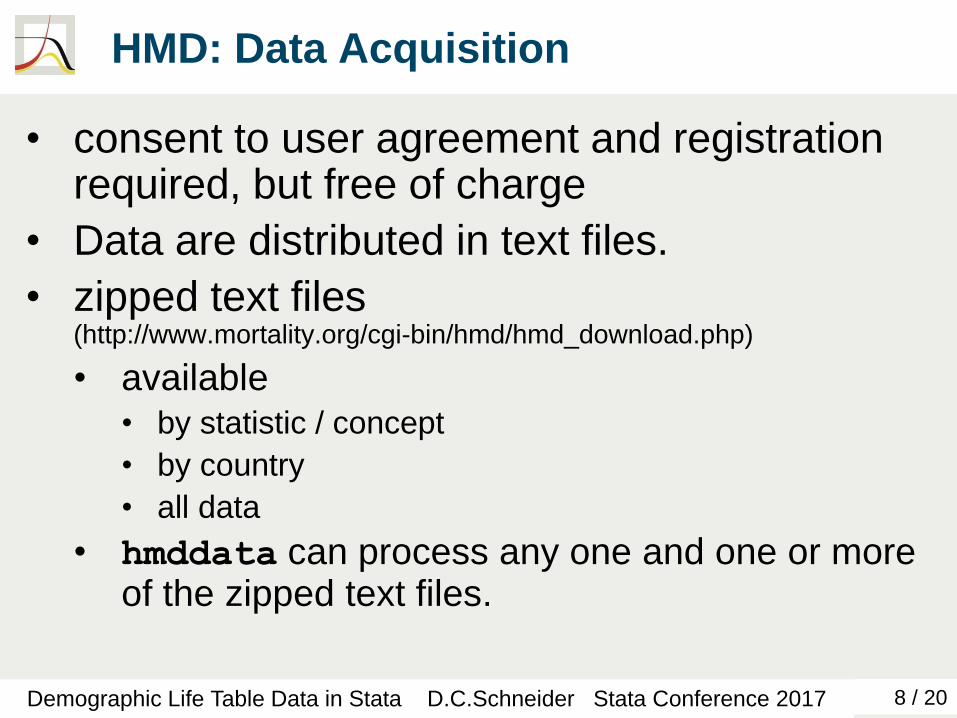
• consent to user agreement and registration required, but free of charge
• Data are distributed in text files.
• zipped text files (http://www.mortality.org/cgi-bin/hmd/hmd_download.php)
• available • by statistic / concept
• by country
• all data
• hmddata can process any one and one or more of the zipped text files.

9 / 20
hmddata
Demographic Life Table Data in Stata D.C.Schneider Stata Conference 2017
• development goal was a data exploration
tool for researchers:
• easy data access
• quick generation of working-quality tables and
graphs
• net install hmddata , from(http://user.demogr.mpg.de/schneider/stata)
10 / 20
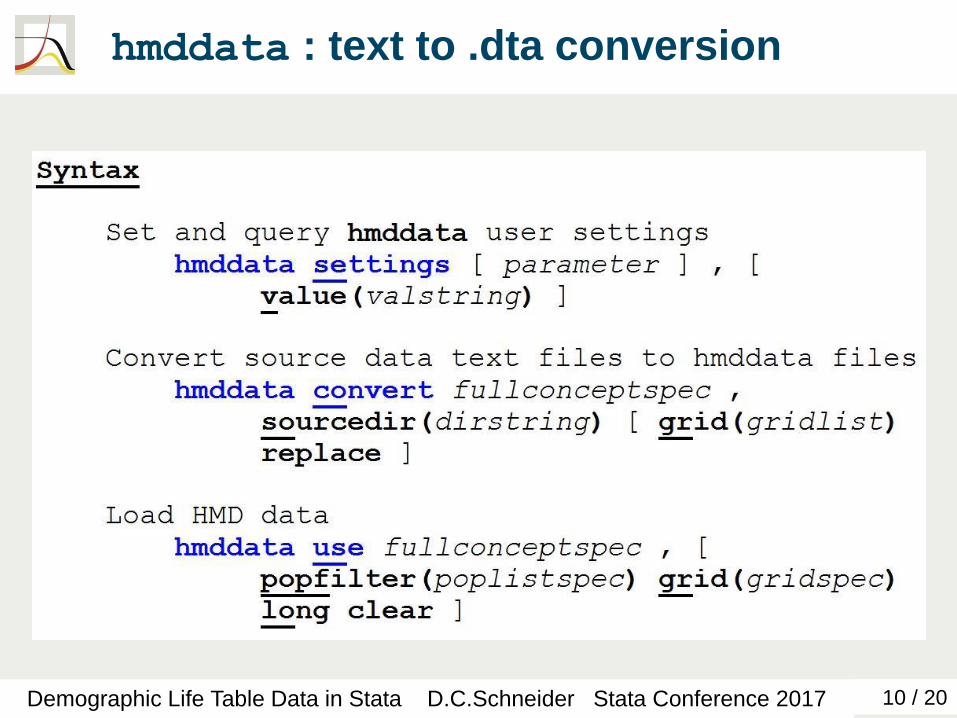
hmddata : text to .dta conversion
Demographic Life Table Data in Stata D.C.Schneider Stata Conference 2017

11 / 20
hmddata : data handling
Demographic Life Table Data in Stata D.C.Schneider Stata Conference 2017
12 / 20
Oeppen / Vaupel (2002)
Demographic Life Table Data in Stata D.C.Schneider Stata Conference 2017
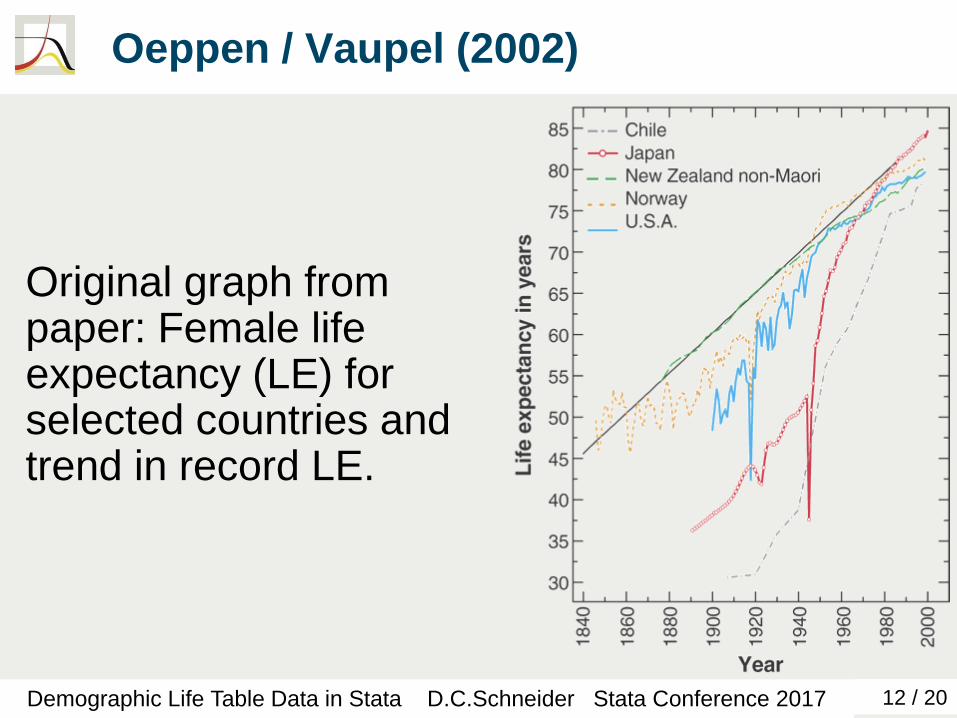
Original graph from paper: Female life expectancy (LE) for selected countries and trend in record LE.
13 / 20
Oeppen / Vaupel (2002)
Demographic Life Table Data in Stata D.C.Schneider Stata Conference 2017
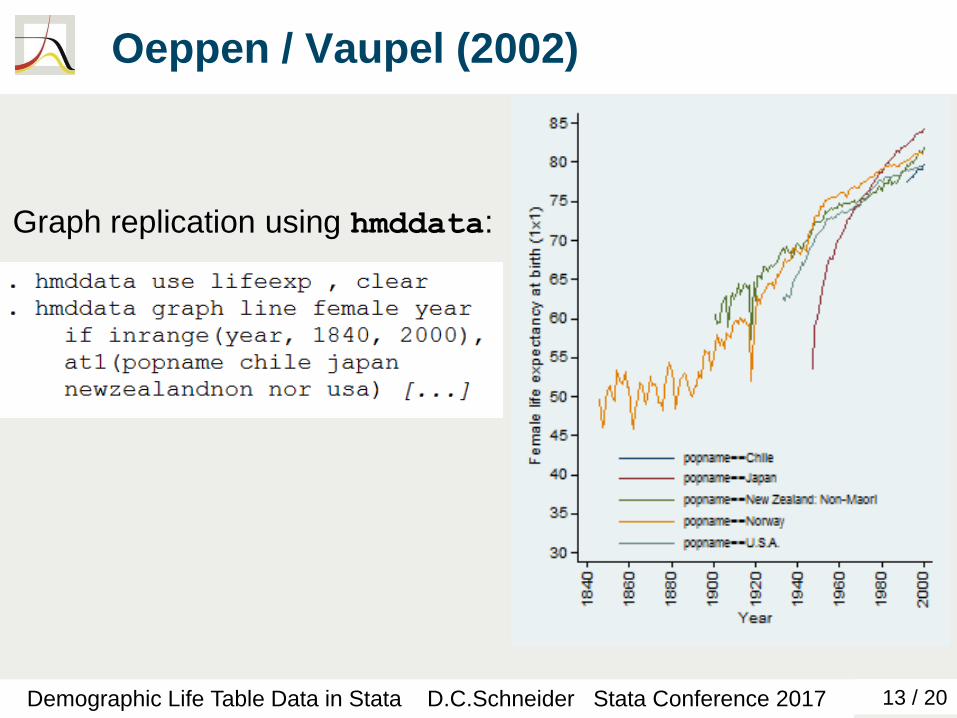
Graph replication using hmddata:
14 / 20
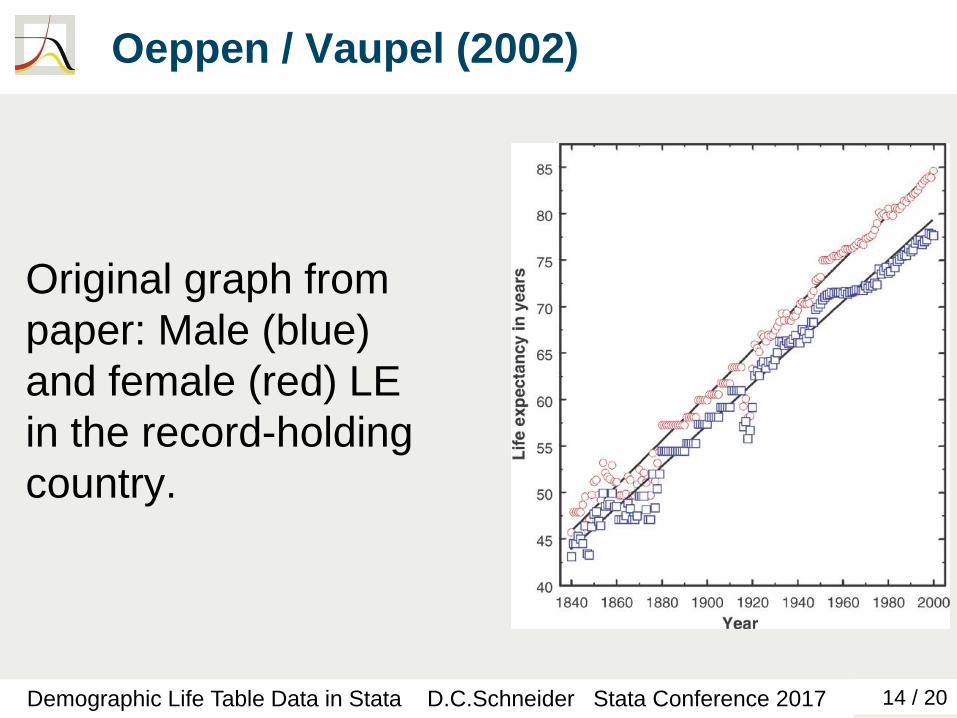
Oeppen / Vaupel (2002)
Demographic Life Table Data in Stata D.C.Schneider Stata Conference 2017
Original graph from
paper: Male (blue)
and female (red) LE
in the record-holding
country.
15 / 20
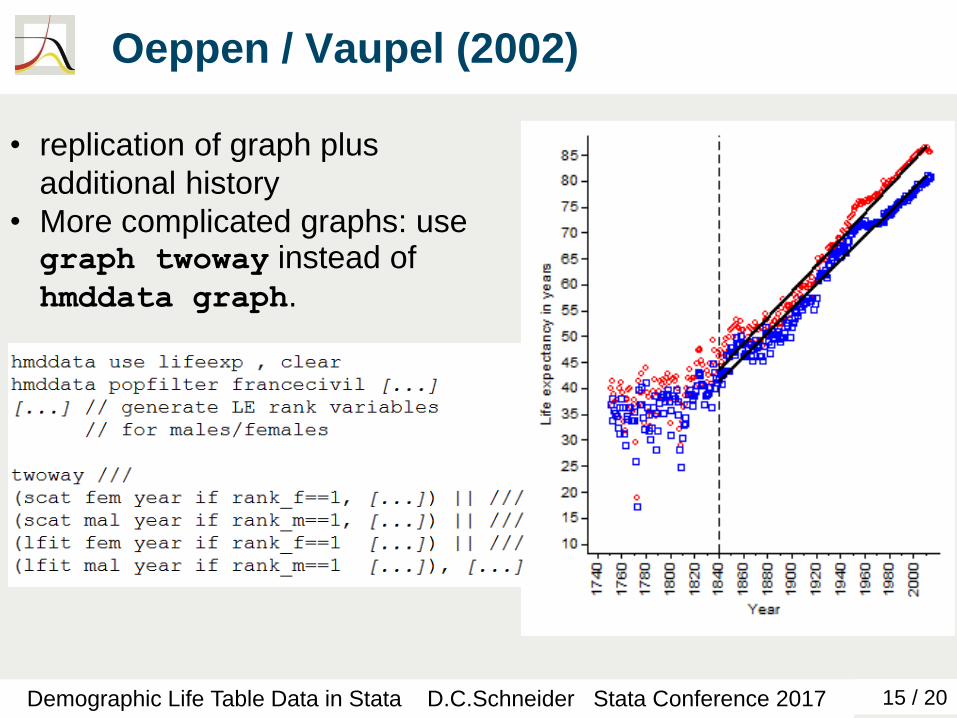
Oeppen / Vaupel (2002)
Demographic Life Table Data in Stata D.C.Schneider Stata Conference 2017
• replication of graph plus
additional history
• More complicated graphs: use graph twoway instead of
hmddata graph.
16 / 20
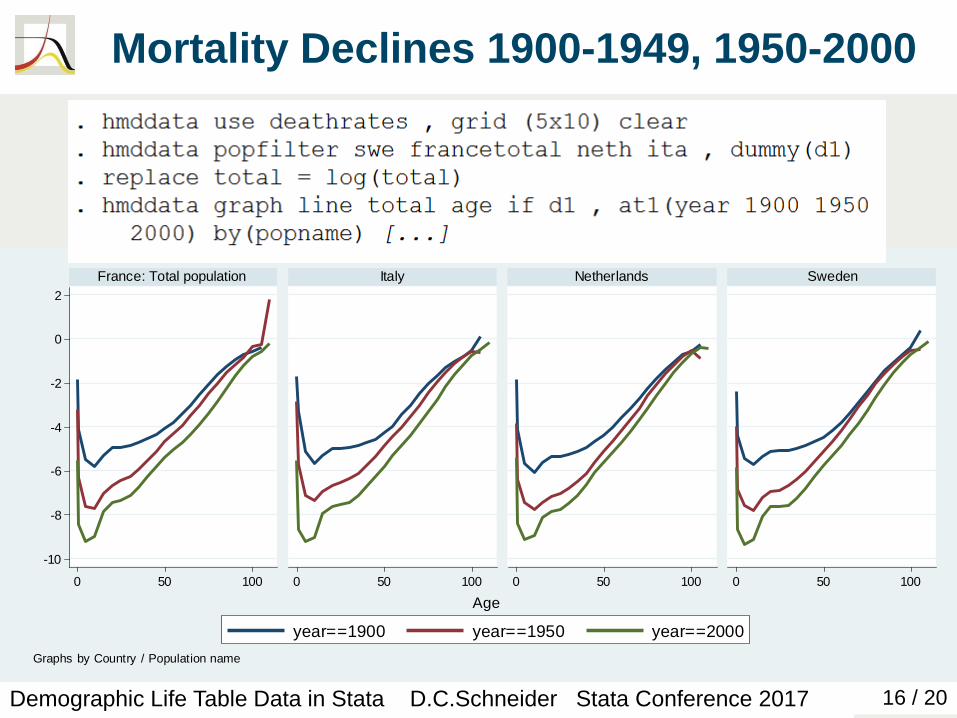
Mortality Declines 1900-1949, 1950-2000
Demographic Life Table Data in Stata D.C.Schneider Stata Conference 2017
-10
-8
-6
-4
-2
0
2
0 50 100 0 50 100 0 50 100 0 50 100
France: Total population Italy Netherlands Sweden
year==1900 year==1950 year==2000
Log
dea
th r
ate
s (
deca
de
s)
Age
Graphs by Country / Population name
17 / 20
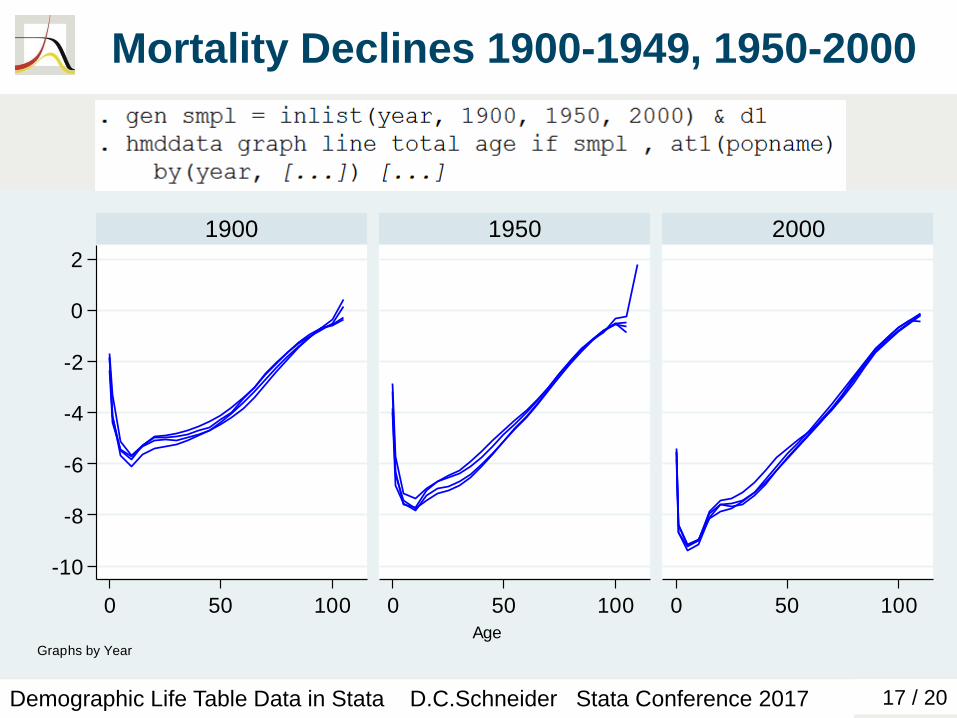
Mortality Declines 1900-1949, 1950-2000
Demographic Life Table Data in Stata D.C.Schneider Stata Conference 2017
-10
-8
-6
-4
-2
0
2
0 50 100 0 50 100 0 50 100
1900 1950 2000
Lo
g d
ea
th r
ate
s (
decad
es)
AgeGraphs by Year
18 / 20
lifetable
• not yet released
• development goal: versatile tool to generate and
manipulate demographic life tables
• principles / features:
• operation on multiple yet selected life tables at once
• standardized/prescribed variable names
• calculations using any valid minimum starting
information
• to be added before release: CIs, methods for
approximating nax, …
Demographic Life Table Data in Stata D.C.Schneider Stata Conference 2017
19 / 20
The End
Demographic Life Table Data in Stata D.C.Schneider Stata Conference 2017
Thank you!
Questions? Comments?
contact: [email protected]

20 / 20
References
Human Mortality Database. University of California, Berkeley
(USA), and Max Planck Institute for Demographic
Research (Germany). Available at www.mortality.org and
www.humanmortality.de.
J. Oeppen and James W. Vaupel (2002): Broken Limits to
Life Expectancy. Science, 5570 (296), pp. 1029-1031.
Demographic Life Table Data in Stata D.C.Schneider Stata Conference 2017