working poor in europe: a partial basic income for workers? · working poor in europe: a partial...
TRANSCRIPT
Working Poor in Europe:
A Partial Basic Income for Workers?
Wolfgang Strengmann-Kuhn*
DRAFT, SEPTEMBER 2002. NOT TO BE QUOTED WITHOUT PERMISSION OF THE AUTHOR(S).
The views expressed in this paper are those of the author(s), and do not necessarily represent the views of BIEN or BIEN-Suisse.
* University of Frankfurt, Germany.
9th International Congress Geneva, September 12th-14th
PDF created with FinePrint pdfFactory Pro trial version http://www.fineprint.com

PDF created with FinePrint pdfFactory Pro trial version http://www.fineprint.com
iii
Contents
1. Introduction.................................................................................................................. 1
2. The working poor in Europe........................................................................................ 1
2.1 Definition and measurement of poverty............................................................. 1
2.2 Definition of the “working poor” ....................................................................... 4
2.3 Database: The European Community Household Panel (ECHP) ...................... 5
2.4 Empirical results................................................................................................. 5
3. A partial basic income for workers? ............................................................................ 13
3.1 Goals of antipoverty policy ................................................................................ 13
3.2 A partial basic income for workers .................................................................... 14
3.3 Discussion .......................................................................................................... 16
4. Conclusion: A partial basic income – not only for workers? ...................................... 17
References ............................................................................................................................. 21
List of figures
Figure 1. Poverty rates in the member states of the European Union (%) ........................... 6 Figure 2: Shares of the working poor among all poor in the member states of the
European Union (%).............................................................................................. 7 Figure 3. Employment status of the working-aged poor in the member states of the
European Union (%).............................................................................................. 9 Figure 4. Working poor rates in the member states of the European Union (per cent of
the whole population)............................................................................................ 11 Figure 5. The income distribution process and poverty ....................................................... 12 Figure 6. Causes of poverty of workers in the member states of the European Union
(per cent of all working poor) ............................................................................... 12 Figure 7. A model for a partial basic income for workers.................................................... 15
PDF created with FinePrint pdfFactory Pro trial version http://www.fineprint.com

PDF created with FinePrint pdfFactory Pro trial version http://www.fineprint.com
1
1. Introduction
While the problem of working poor is broadly discussed in the United States
of America, there are very few empirical investigations about the working poor in
Europe. Moreover, workers play almost no role in the public and political debate
about poverty. In Europe it is typical to think of “the poor” as non-working people
like the unemployed, pensioners and children, or at least as people whose ability
to work is restricted, such as single parents. In contrast to this general opinion, I
will show in the next part of this paper that a substantial share of the poor work
and that the majority of the poor in Europe live in households with at least one
household member working.
These results raise the question of what means can prevent workers from
becoming poor. Since the working poor have an income of their own which is,
however, insufficient, even a partial basic income (PBI), in contrast to a full basic
income below the poverty line, could be a means of fighting poverty for this
group. In the third part of the paper, I will propose one concrete model of a partial
basic income for workers and discuss its consequences, advantages and
disadvantages.
2. The working poor in Europe
For the discussion it makes sense to have some basic empirical background
information about the working poor in Europe. For a few years a comparable data
set has been available for all countries in the European Union except Sweden.
Using this data set I will answer some simple questions, such as: How many
working poor are there in the European Union and its member states, and what are
the causes of poverty among the working poor?
2.1 Definition and measurement of poverty
The first question, however, is: what is poverty and how is it measured?
There is a variety of poverty definitions and measures (see Atkinson, 1998,
pp:10ff.; Hagenaars, 1986; Strengmann-Kuhn, 2000; Van den Bosch, 1999). It is
PDF created with FinePrint pdfFactory Pro trial version http://www.fineprint.com
2
not possible to discuss the alternatives here in detail, but the main questions and
the answers given for the investigations performed for this paper will be described
in following.
One basic distinction is the difference between direct and indirect measures
of poverty (see Ringen, 1988; Sen, 1981). Indirect measures are based on what is
known as the resource definition of poverty, that is, people are poor if they lack
resources, and are not poor if they have sufficient resources, independent of their
use. Direct measures of poverty are based on the observation of an individual’s
current living standard and supply of goods. Most international comparative
investigations, including this paper, use indirect measures on the basis of income.
When an income definition of poverty is used there are a number of questions
that have to be answered regarding measurement. The first question is what kind
of income should be used: the income period (monthly, yearly or weekly income),
the kinds of income sources (especially if non- monetary income can be included),
gross or net income and so on. Another question is the income unit. Typically the
household income is used. Thus it is presumed that income is equally distributed
within the household or – more precisely – that income is distributed in such a
way that the welfare of each household member is the same. This assumption can
be criticised (see Jenkins, 1991; Ruspini, 1998; Burri, 1998), because it is not
guaranteed that intra-household transfers actually take place or that they occur at
such a level that everyone in the household has the same welfare. Nevertheless it
cannot be observed how income is distributed within a household, and in any case
the assumption that income is not distributed within the household is even less
plausible than the equal distribution assumption.
Besides the problem of unequal distribution within the household, household
income itself is not a good measure for welfare. A more obvious measure would
be a per capita income. But this neglects economies of scale, i.e. a two-person
household does not need twice the income of a single household, and children
don't need as much as adults: for example, a household of two adults needs more
income for the same welfare than does a single parent with one child. The solution
to this problem is what is known as the equivalent income, which can be
PDF created with FinePrint pdfFactory Pro trial version http://www.fineprint.com
3
interpreted as a means-weighted per capita income. To calculate it one has to
define the equivalence weights, which constitute an equivalence scale. One
customary scale, the one used in this paper, is the (original) OECD scale, where
the weight of one adult is one, the weight of other persons aged 15 years or older
is 0.7, and each child under 15 years is weighted as 0.5. The equivalence scale is
then calculated by dividing the household income by the sum of weights of the
household.
Finally, the question of the income threshold below, which there is poverty,
has to be answered. Usually the poverty line is defined as a percentage of average
income. For this, too, several points must be clarified. The first is whether
national averages are used or a Europe-wide standard (see Atkinson, 2000,
pp27ff.; Vos/Zaidi, 1998). Typically poverty is defined by a national standard,
which corresponds to the poverty definition used by the Council of the European
Union. The second point is the percentage of the average to be used: typical are
40, 50 or 60 per cent. The third point is how to calculate the average. There are
several possibilities, each of which has advantages and disadvantages (see
Hagenaars et al., 1994). Usually the median or the (arithmetic) mean is used. The
median is the point at which exactly 50 per cent have an income above and 50 per
cent below. The mean, which is higher than the median, is the income of equal
distribution. In this paper I use 50 per cent of the mean as a poverty threshold, a
threshold also used by Eurostat (Eurostat, 1997). In newer publications of
Eurostat this was changed to 60 per cent of the median (Marlier/Ponthieux, 2000;
Mejer, 2000; see also Atkinson et al., 2002). However, both thresholds are about
the same for all member states of the EU (see Hauser et al., 1999).
In summary, in this paper I will use the following poverty measure: a person
is poor if she or he lives in a household with a monthly net equivalent income
below 50 per cent of the mean equivalent income (MEI), with the original OECD
scale used as the equivalent scale. However, the European Community Household
Panel provides the possibility of using several other poverty measures
(Strengmann-Kuhn, 2000). Results about working poor using alternative measures
of poverty can be found in Strengmann-Kuhn (2002). These alternatives are
PDF created with FinePrint pdfFactory Pro trial version http://www.fineprint.com
4
§ using yearly income instead of monthly income;
§ the Subjective Poverty Line, where both the poverty line and the
equivalence scale are estimated empirically and
§ a poverty line based on a welfare function which is dependent on both
income and direct measures of welfare.
2.2 Definition of the “working poor”
As a next step it must be clarified what is meant by “working poor”, a term
which remains rather ambiguous both in political discussions and in the academic
literature. One possibility is to say that the working poor are persons whose
individual wage lies below a certain threshold (Schäfer, 1997); this threshold may
be a poverty line, a percentage of average wage or determined in some other way.
In this case, however, the term 'poor' is misleading: workers with a low wage are
not necessarily poor, because it is possible that they receive income other than
wages, or that there are other household members with an income high enough to
avoid poverty for the whole household. For this reason the term working poor is
not used for this group in this paper.
An obvious possibility would be to define working poor as all workers who
are poor. That is, according to the definition of poverty used in this paper, all
workers who are living in a poor household. For employment the definition of the
ILO (International Labour Organisation) is used in this paper, that is, the term
“worker” designates all who worked at least one hour in the week before the
interview. In the literature about working poor this definition is sometimes
restricted further to some types of workers. On the other hand, in some studies the
definition of the working poor is extended to all household members who live in a
poor household with at least one worker (Knöpfel, 1999; Caritas Schweiz, 1998).
In this paper four different definitions are used:
§ all workers living in a poor household;
§ all full-time workers living in a poor household;
PDF created with FinePrint pdfFactory Pro trial version http://www.fineprint.com
5
§ all people living in a poor household with at least one working
household member (working poor household);
§ all people living in a poor household with at least one full-time
working household member (full-time working poor household).
2.3 Database: The European Community Household Panel (ECHP)
The database of the following empirical results is the European Community
Household Panel (ECHP). The ECHP is a data set provided by Eurostat, collected
in the countries of the European Union since 1994. The ECHP is a panel study,
i.e. the same households are interviewed each year. In 1994 the twelve countries
that were then EU members were included; Austria was added in 1995 and
Finland in 1996. Sweden does not take part in the ECHP. The aim of the ECHP is
to acquire comparable data for all countries using a similar questionnaire. The
advantage of this data set as regards poverty research is that it includes detailed
data on income and a number of additional indicators, which can be used for
poverty measurement. This paper analyses the data from 1996, the third wave.
2.4 Empirical results
In the following only some basic findings about working poor in Europe are
presented (for further results see Strengmann-Kuhn, 2001 and 2002). The first
question is: what are the poverty rates of workers? The results are shown in figure
1. In all countries the poverty rates of workers are below the average poverty
rates. In the whole EU (except Sweden) the poverty rate is 16.4 per cent in the
whole population, but “only” 9 per cent of all workers are poor. The poverty rate
in employed households, that is, households with at least one employed household
member, is higher than for the worker alone in all countries. For the EU this
poverty rate is 13.3 per cent, which is lower than the general poverty rate. This is
typical for all member states; only in Luxembourg is the poverty rate in employed
households slightly higher than for the whole population.
PDF created with FinePrint pdfFactory Pro trial version http://www.fineprint.com
6
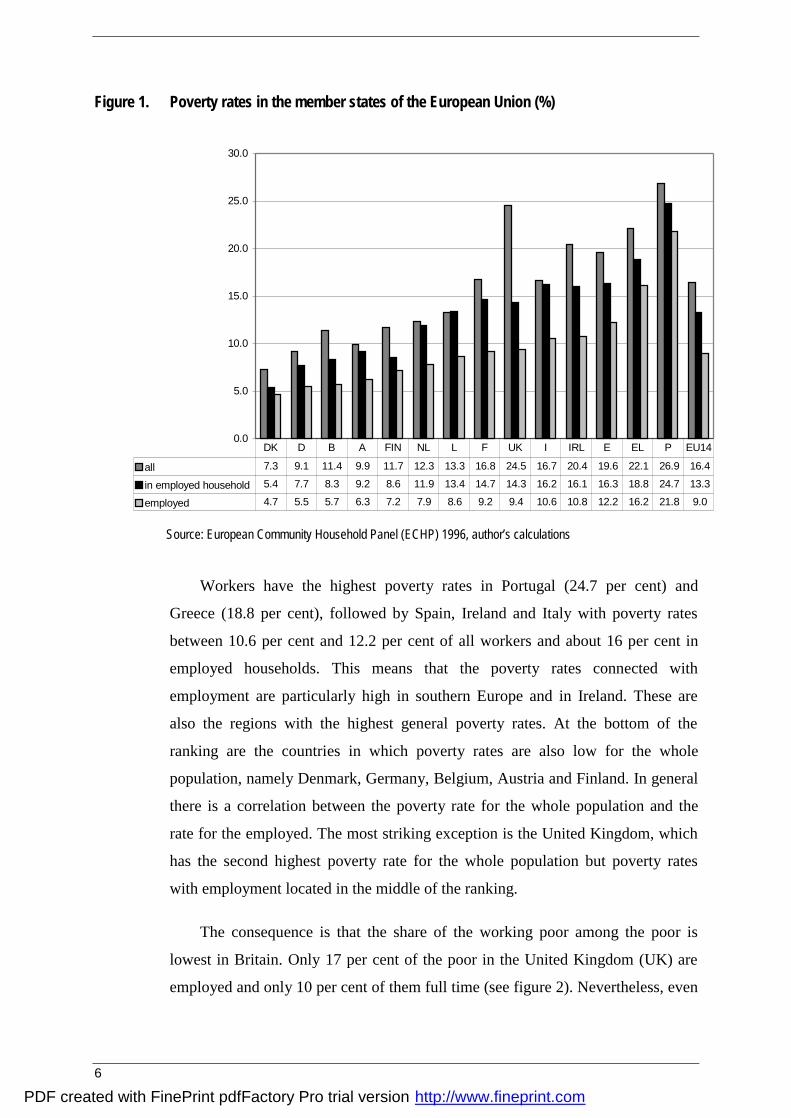
Figure 1. Poverty rates in the member states of the European Union (%)
Source: European Community Household Panel (ECHP) 1996, author’s calculations
Workers have the highest poverty rates in Portugal (24.7 per cent) and
Greece (18.8 per cent), followed by Spain, Ireland and Italy with poverty rates
between 10.6 per cent and 12.2 per cent of all workers and about 16 per cent in
employed households. This means that the poverty rates connected with
employment are particularly high in southern Europe and in Ireland. These are
also the regions with the highest general poverty rates. At the bottom of the
ranking are the countries in which poverty rates are also low for the whole
population, namely Denmark, Germany, Belgium, Austria and Finland. In general
there is a correlation between the poverty rate for the whole population and the
rate for the employed. The most striking exception is the United Kingdom, which
has the second highest poverty rate for the whole population but poverty rates
with employment located in the middle of the ranking.
The consequence is that the share of the working poor among the poor is
lowest in Britain. Only 17 per cent of the poor in the United Kingdom (UK) are
employed and only 10 per cent of them full time (see figure 2). Nevertheless, even
0.0
5.0
10.0
15.0
20.0
25.0
30.0
all 7.3 9.1 11.4 9.9 11.7 12.3 13.3 16.8 24.5 16.7 20.4 19.6 22.1 26.9 16.4
in employed household 5.4 7.7 8.3 9.2 8.6 11.9 13.4 14.7 14.3 16.2 16.1 16.3 18.8 24.7 13.3
employed 4.7 5.5 5.7 6.3 7.2 7.9 8.6 9.2 9.4 10.6 10.8 12.2 16.2 21.8 9.0
DK D B A FIN NL L F UK I IRL E EL P EU14
PDF created with FinePrint pdfFactory Pro trial version http://www.fineprint.com

7
in the UK, 30.5 per cent of the poor live in a full-time working poor household
and 42.5 per cent in a working poor household. In all other countries the majority
of the poor live in a working poor household: in Portugal and Luxembourg this
proportion is over 80 per cent; in the Netherlands, Italy and Austria still over 70
per cent and in Germany, Spain and France between 60 per cent and two thirds. In
the whole EU, 50.3 per cent of the poor live in households in which at least one
member works full time. Including all kinds of employment, this percentage
increases to about 61 per cent. The shares of employed persons themselves among
the poor are somewhat lower, between 17 per cent (UK) and 36.7 per cent
(Portugal). Between 9.9 per cent (UK) and 30.5 per cent (Portugal) of the poor are
full-time workers.
Figure 2: Shares of the working poor among all poor in the member states of the European Union (%)
Source: European Community Household Panel (ECHP) 1996, author’s calculations
These percentages refer to all poor including children and the elderly.
Focusing on people in the primary work age (25 to 55 years), the importance of
employment for the poor becomes even more apparent. More than a third of the
0.0
10.0
20.0
30.0
40.0
50.0
60.0
70.0
80.0
90.0
employed 17.0 22.9 19.2 31.2 19.5 27.4 19.8 26.3 21.7 28.0 21.6 27.8 36.7 25.8 22.2
full time employed 9.9 17.5 14.0 14.6 13.2 16.5 16.2 21.4 15.0 16.9 17.3 20.1 30.5 21.7 15.5
in employed household 42.2 49.4 51.6 56.5 60.7 61.9 62.9 65.3 66.4 73.9 73.9 75.1 78.1 78.3 61.0
in full time household 30.5 40.0 41.8 37.8 47.4 47.7 55.7 58.9 53.5 60.3 64.8 65.6 71.8 73.3 50.3
UK FIN B DK IRL D E EL F NL I A P L EU14
PDF created with FinePrint pdfFactory Pro trial version http://www.fineprint.com
8
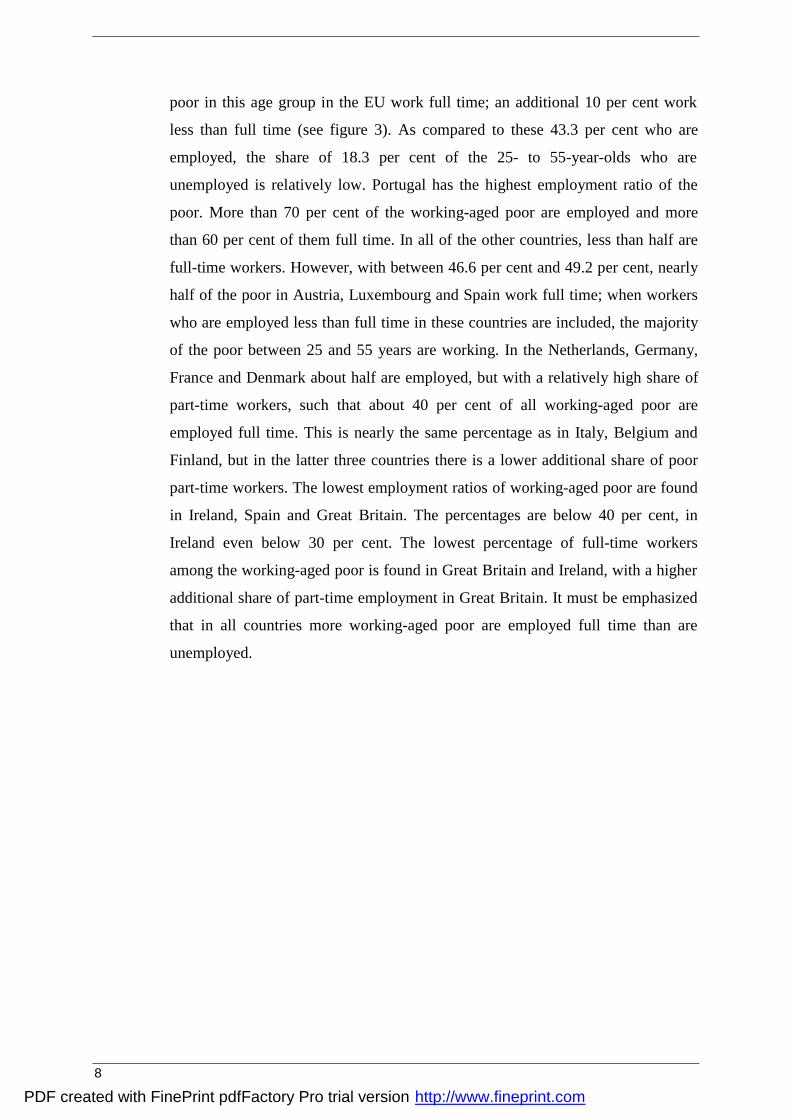
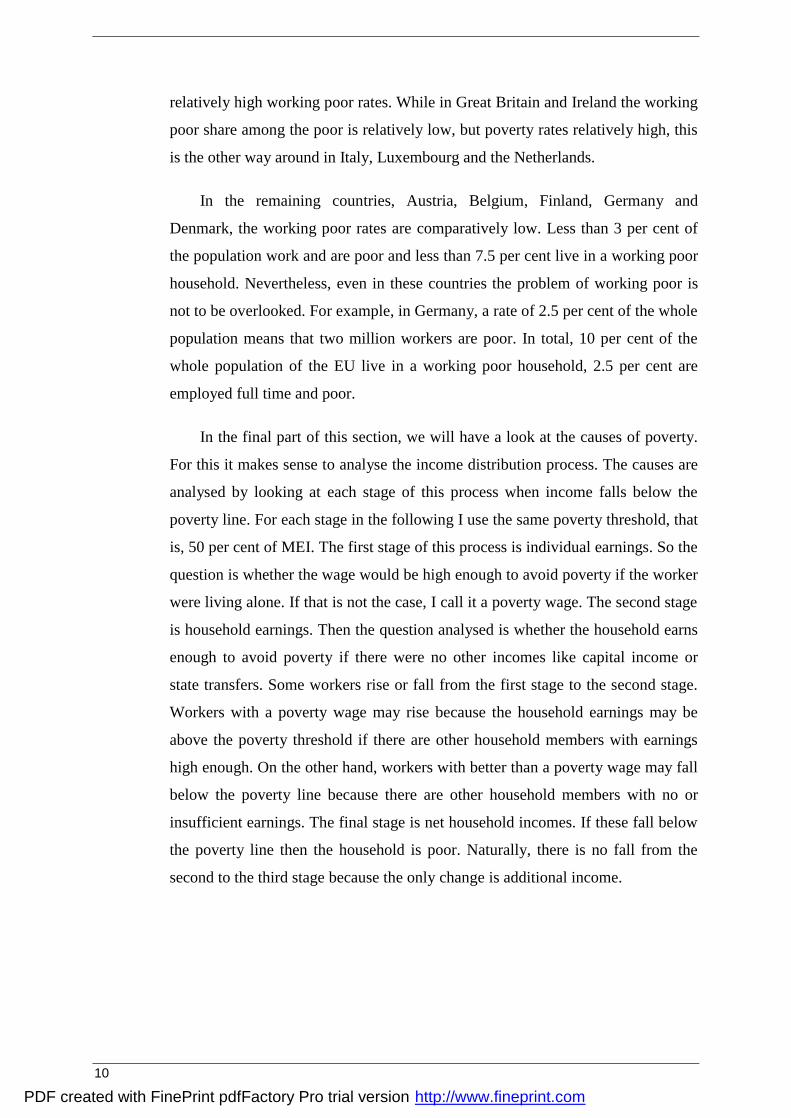
poor in this age group in the EU work full time; an additional 10 per cent work
less than full time (see figure 3). As compared to these 43.3 per cent who are
employed, the share of 18.3 per cent of the 25- to 55-year-olds who are
unemployed is relatively low. Portugal has the highest employment ratio of the
poor. More than 70 per cent of the working-aged poor are employed and more
than 60 per cent of them full time. In all of the other countries, less than half are
full-time workers. However, with between 46.6 per cent and 49.2 per cent, nearly
half of the poor in Austria, Luxembourg and Spain work full time; when workers
who are employed less than full time in these countries are included, the majority
of the poor between 25 and 55 years are working. In the Netherlands, Germany,
France and Denmark about half are employed, but with a relatively high share of
part-time workers, such that about 40 per cent of all working-aged poor are
employed full time. This is nearly the same percentage as in Italy, Belgium and
Finland, but in the latter three countries there is a lower additional share of poor
part-time workers. The lowest employment ratios of working-aged poor are found
in Ireland, Spain and Great Britain. The percentages are below 40 per cent, in
Ireland even below 30 per cent. The lowest percentage of full-time workers
among the working-aged poor is found in Great Britain and Ireland, with a higher
additional share of part-time employment in Great Britain. It must be emphasized
that in all countries more working-aged poor are employed full time than are
unemployed.
PDF created with FinePrint pdfFactory Pro trial version http://www.fineprint.com
9
Figure 3. Employment status of the working-aged poor in the member states of the European Union (%)
Source: European Community Household Panel (ECHP) 1996, author’s calculations
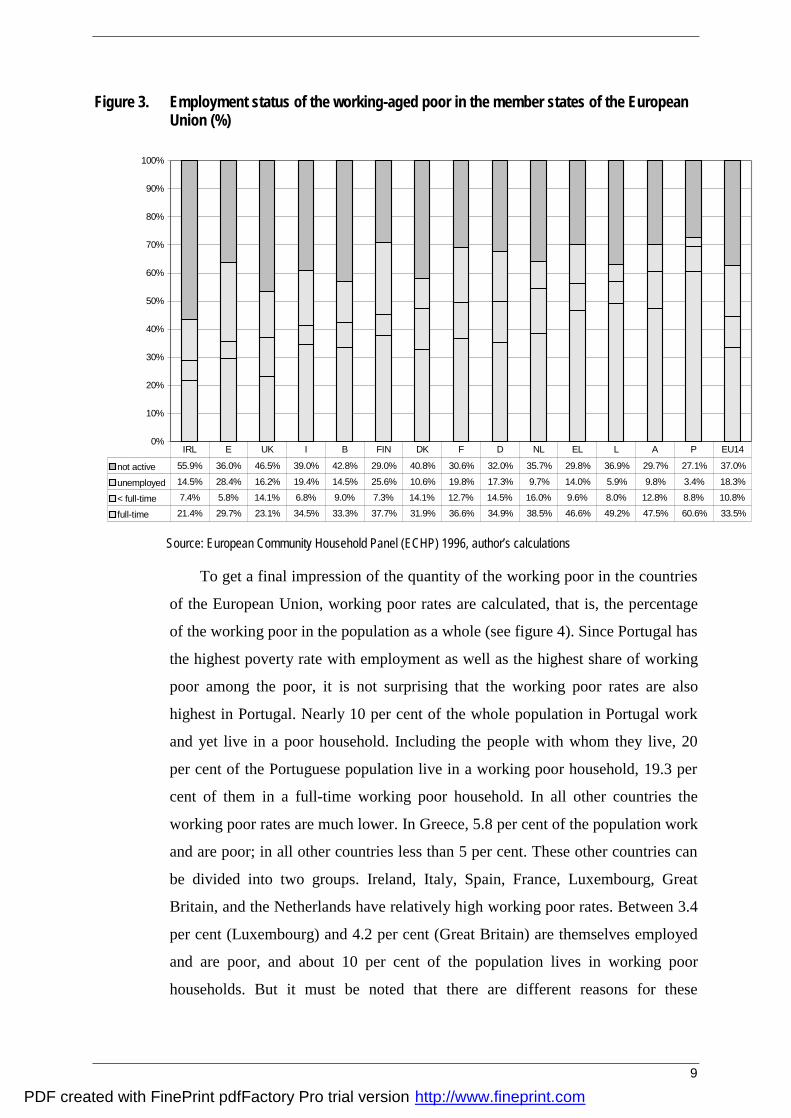
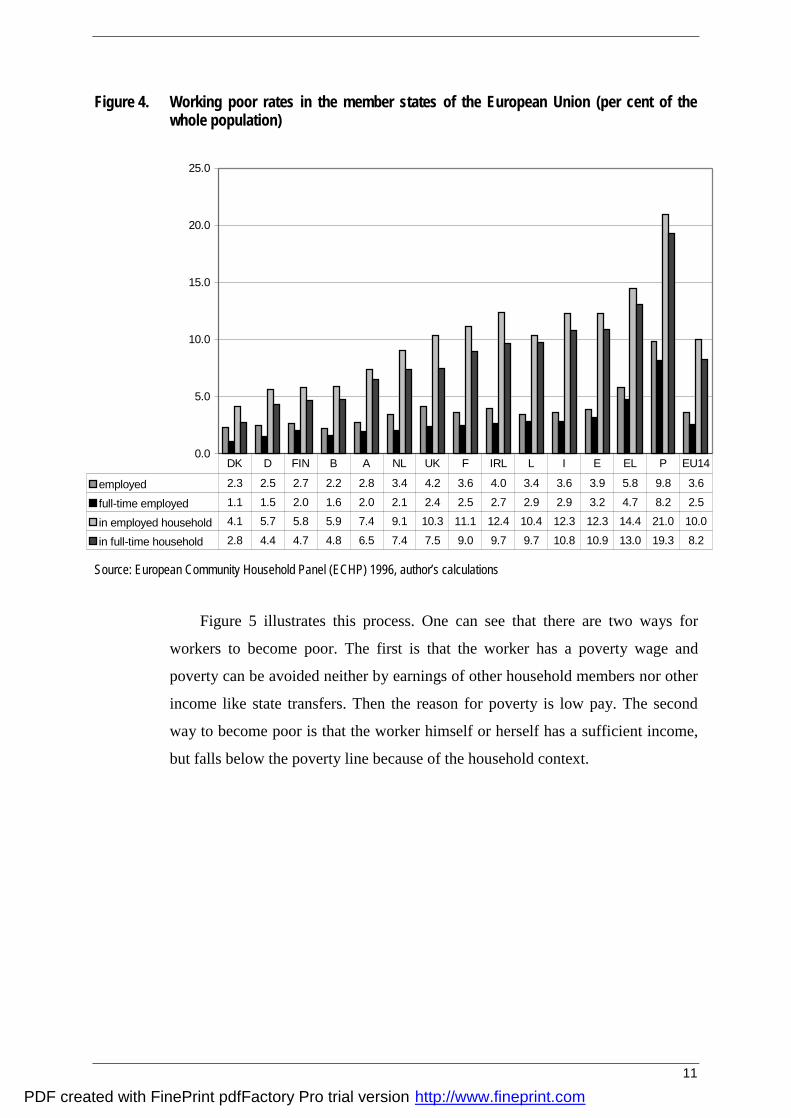
To get a final impression of the quantity of the working poor in the countries
of the European Union, working poor rates are calculated, that is, the percentage
of the working poor in the population as a whole (see figure 4). Since Portugal has
the highest poverty rate with employment as well as the highest share of working
poor among the poor, it is not surprising that the working poor rates are also
highest in Portugal. Nearly 10 per cent of the whole population in Portugal work
and yet live in a poor household. Including the people with whom they live, 20
per cent of the Portuguese population live in a working poor household, 19.3 per
cent of them in a full-time working poor household. In all other countries the
working poor rates are much lower. In Greece, 5.8 per cent of the population work
and are poor; in all other countries less than 5 per cent. These other countries can
be divided into two groups. Ireland, Italy, Spain, France, Luxembourg, Great
Britain, and the Netherlands have relatively high working poor rates. Between 3.4
per cent (Luxembourg) and 4.2 per cent (Great Britain) are themselves employed
and are poor, and about 10 per cent of the population lives in working poor
households. But it must be noted that there are different reasons for these
0%
10%
20%
30%
40%
50%
60%
70%
80%
90%
100%
not active 55.9% 36.0% 46.5% 39.0% 42.8% 29.0% 40.8% 30.6% 32.0% 35.7% 29.8% 36.9% 29.7% 27.1% 37.0%
unemployed 14.5% 28.4% 16.2% 19.4% 14.5% 25.6% 10.6% 19.8% 17.3% 9.7% 14.0% 5.9% 9.8% 3.4% 18.3%
< full-time 7.4% 5.8% 14.1% 6.8% 9.0% 7.3% 14.1% 12.7% 14.5% 16.0% 9.6% 8.0% 12.8% 8.8% 10.8%
full-time 21.4% 29.7% 23.1% 34.5% 33.3% 37.7% 31.9% 36.6% 34.9% 38.5% 46.6% 49.2% 47.5% 60.6% 33.5%
IRL E UK I B FIN DK F D NL EL L A P EU14
PDF created with FinePrint pdfFactory Pro trial version http://www.fineprint.com
10
relatively high working poor rates. While in Great Britain and Ireland the working
poor share among the poor is relatively low, but poverty rates relatively high, this
is the other way around in Italy, Luxembourg and the Netherlands.
In the remaining countries, Austria, Belgium, Finland, Germany and
Denmark, the working poor rates are comparatively low. Less than 3 per cent of
the population work and are poor and less than 7.5 per cent live in a working poor
household. Nevertheless, even in these countries the problem of working poor is
not to be overlooked. For example, in Germany, a rate of 2.5 per cent of the whole
population means that two million workers are poor. In total, 10 per cent of the
whole population of the EU live in a working poor household, 2.5 per cent are
employed full time and poor.
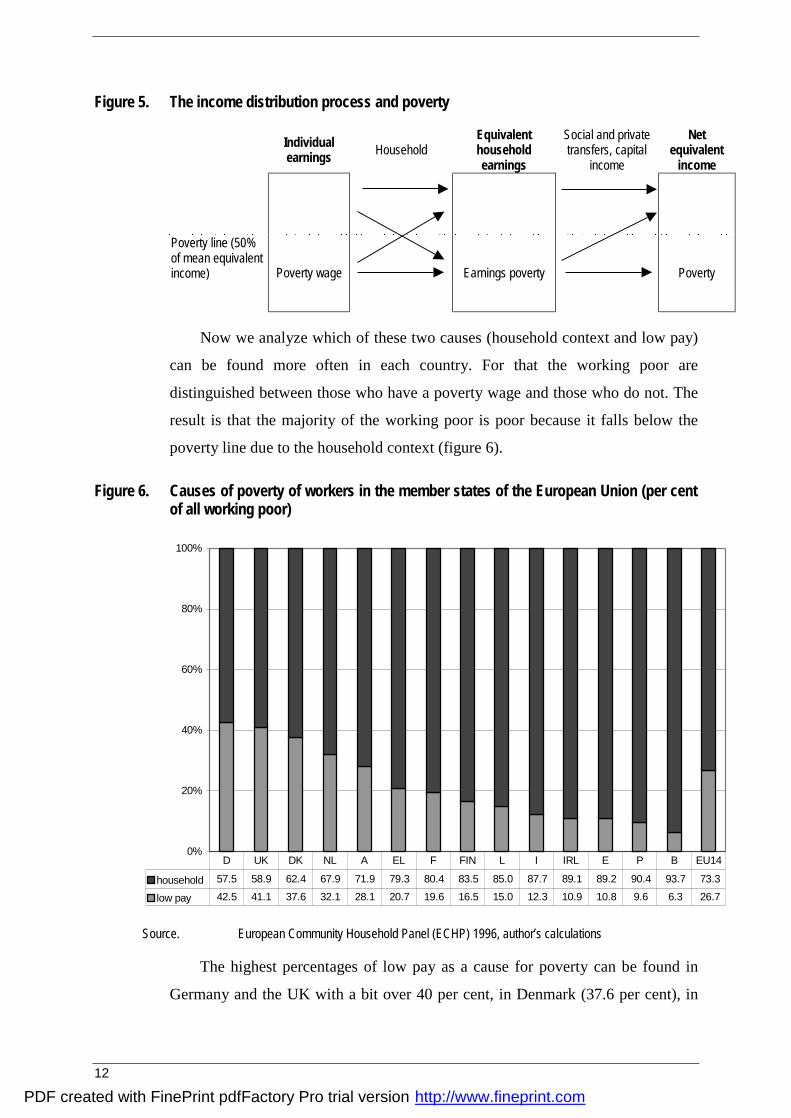
In the final part of this section, we will have a look at the causes of poverty.
For this it makes sense to analyse the income distribution process. The causes are
analysed by looking at each stage of this process when income falls below the
poverty line. For each stage in the following I use the same poverty threshold, that
is, 50 per cent of MEI. The first stage of this process is individual earnings. So the
question is whether the wage would be high enough to avoid poverty if the worker
were living alone. If that is not the case, I call it a poverty wage. The second stage
is household earnings. Then the question analysed is whether the household earns
enough to avoid poverty if there were no other incomes like capital income or
state transfers. Some workers rise or fall from the first stage to the second stage.
Workers with a poverty wage may rise because the household earnings may be
above the poverty threshold if there are other household members with earnings
high enough. On the other hand, workers with better than a poverty wage may fall
below the poverty line because there are other household members with no or
insufficient earnings. The final stage is net household incomes. If these fall below
the poverty line then the household is poor. Naturally, there is no fall from the
second to the third stage because the only change is additional income.
PDF created with FinePrint pdfFactory Pro trial version http://www.fineprint.com
11
Figure 4. Working poor rates in the member states of the European Union (per cent of the whole population)
Source: European Community Household Panel (ECHP) 1996, author’s calculations
Figure 5 illustrates this process. One can see that there are two ways for
workers to become poor. The first is that the worker has a poverty wage and
poverty can be avoided neither by earnings of other household members nor other
income like state transfers. Then the reason for poverty is low pay. The second
way to become poor is that the worker himself or herself has a sufficient income,
but falls below the poverty line because of the household context.
0.0
5.0
10.0
15.0
20.0
25.0
employed 2.3 2.5 2.7 2.2 2.8 3.4 4.2 3.6 4.0 3.4 3.6 3.9 5.8 9.8 3.6
full-time employed 1.1 1.5 2.0 1.6 2.0 2.1 2.4 2.5 2.7 2.9 2.9 3.2 4.7 8.2 2.5
in employed household 4.1 5.7 5.8 5.9 7.4 9.1 10.3 11.1 12.4 10.4 12.3 12.3 14.4 21.0 10.0
in full-time household 2.8 4.4 4.7 4.8 6.5 7.4 7.5 9.0 9.7 9.7 10.8 10.9 13.0 19.3 8.2
DK D FIN B A NL UK F IRL L I E EL P EU14
PDF created with FinePrint pdfFactory Pro trial version http://www.fineprint.com
12
Figure 5. The income distribution process and poverty
Individual earnings Household
Equivalent household earnings
Social and private transfers, capital
income
Net equivalent
income
Poverty line (50% of mean equivalent income)
Poverty wage
Earnings poverty
Poverty
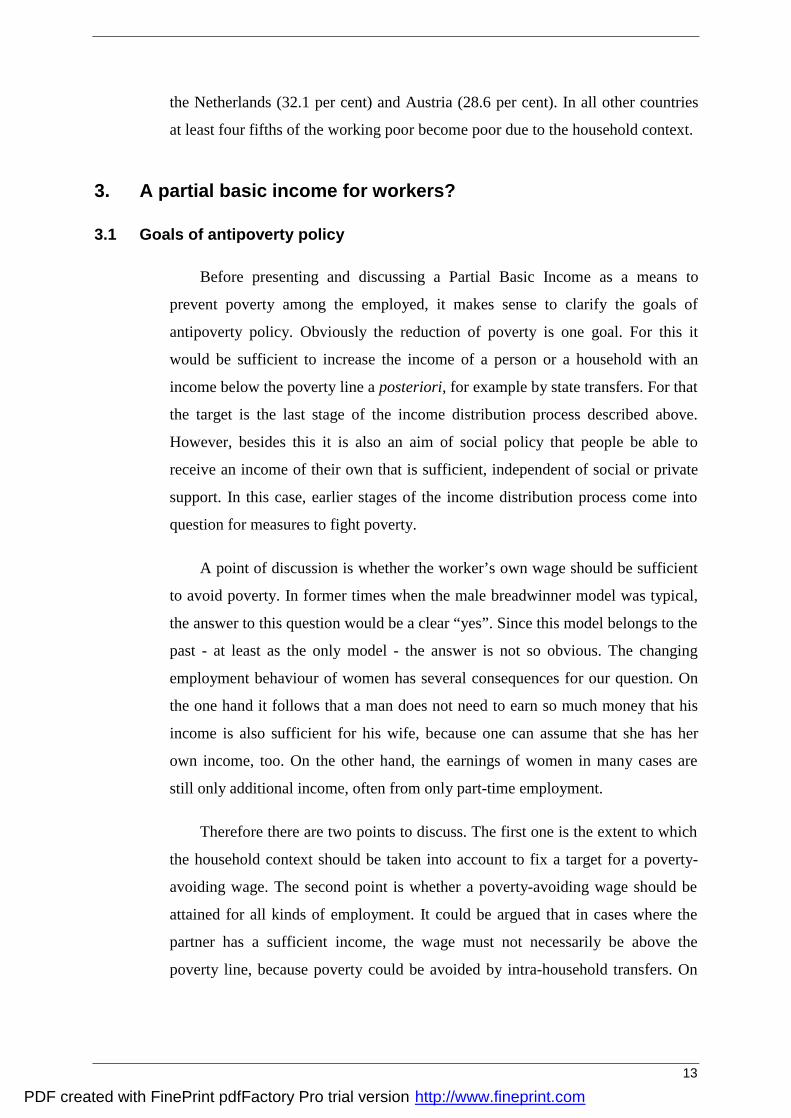
Now we analyze which of these two causes (household context and low pay)
can be found more often in each country. For that the working poor are
distinguished between those who have a poverty wage and those who do not. The
result is that the majority of the working poor is poor because it falls below the
poverty line due to the household context (figure 6).
Figure 6. Causes of poverty of workers in the member states of the European Union (per cent of all working poor)
Source. European Community Household Panel (ECHP) 1996, author’s calculations
The highest percentages of low pay as a cause for poverty can be found in
Germany and the UK with a bit over 40 per cent, in Denmark (37.6 per cent), in
0%
20%
40%
60%
80%
100%
household 57.5 58.9 62.4 67.9 71.9 79.3 80.4 83.5 85.0 87.7 89.1 89.2 90.4 93.7 73.3
low pay 42.5 41.1 37.6 32.1 28.1 20.7 19.6 16.5 15.0 12.3 10.9 10.8 9.6 6.3 26.7
D UK DK NL A EL F FIN L I IRL E P B EU14
PDF created with FinePrint pdfFactory Pro trial version http://www.fineprint.com
13
the Netherlands (32.1 per cent) and Austria (28.6 per cent). In all other countries
at least four fifths of the working poor become poor due to the household context.
3. A partial basic income for workers?
3.1 Goals of antipoverty policy
Before presenting and discussing a Partial Basic Income as a means to
prevent poverty among the employed, it makes sense to clarify the goals of
antipoverty policy. Obviously the reduction of poverty is one goal. For this it
would be sufficient to increase the income of a person or a household with an
income below the poverty line a posteriori, for example by state transfers. For that
the target is the last stage of the income distribution process described above.
However, besides this it is also an aim of social policy that people be able to
receive an income of their own that is sufficient, independent of social or private
support. In this case, earlier stages of the income distribution process come into
question for measures to fight poverty.
A point of discussion is whether the worker’s own wage should be sufficient
to avoid poverty. In former times when the male breadwinner model was typical,
the answer to this question would be a clear “yes”. Since this model belongs to the
past - at least as the only model - the answer is not so obvious. The changing
employment behaviour of women has several consequences for our question. On
the one hand it follows that a man does not need to earn so much money that his
income is also sufficient for his wife, because one can assume that she has her
own income, too. On the other hand, the earnings of women in many cases are
still only additional income, often from only part-time employment.
Therefore there are two points to discuss. The first one is the extent to which
the household context should be taken into account to fix a target for a poverty-
avoiding wage. The second point is whether a poverty-avoiding wage should be
attained for all kinds of employment. It could be argued that in cases where the
partner has a sufficient income, the wage must not necessarily be above the
poverty line, because poverty could be avoided by intra-household transfers. On
PDF created with FinePrint pdfFactory Pro trial version http://www.fineprint.com
14
the other hand, it is not certain that these transfers actually flow. Furthermore,
above it was argued that an aim of social policy is to make it possible for every
individual to receive a sufficient income independent of private or social transfers,
and there is no reason why this should not be the case with regard to private intra-
household transfers as well. So, if a wage above the poverty level could be
guaranteed, dependency (especially of women) on a partner could be decreased.
Therefore a goal could be that the individual wage should be above the individual
poverty line, that is the poverty line of a single household.
The second question is whether this should be a goal for all kinds of
employment. Should even people who work only one hour per week receive a
wage that is above the poverty line? I expect most people would answer this
question with “no”. One argument would be that the resulting hourly wage rate
would be too high. So, what could be an employment threshold above which an
individual income over the individual poverty line should be received? Surely
there is a consensus that a full-time worker should receive a wage that is sufficient
to avoid poverty for her or himself. If part-time workers also should receive an
individual income above the individual poverty line, then the following could be a
sensible threshold. Germany has instituted what is known as Geringfügige
Beschäftigung (minor employment), which is employment for fewer than 15 hours
per week and with a monthly wage less than 325 Euro. Such kinds of employment
are usually seen as additional employment and not intended to secure a
subsistence level of one’s own. Therefore it would make sense to say that a wage
for employment that is more than a Geringfügige Beschäftigung should be higher
than the individual poverty line. Incidentally, this threshold is about half of the
German poverty line, measured as the half of mean equivalent income. Thus this
goal can be generalized for other countries: workers who have a wage of more
than half of the poverty line should receive an additional income that is above the
individual poverty line.
3.2 A partial basic income for workers
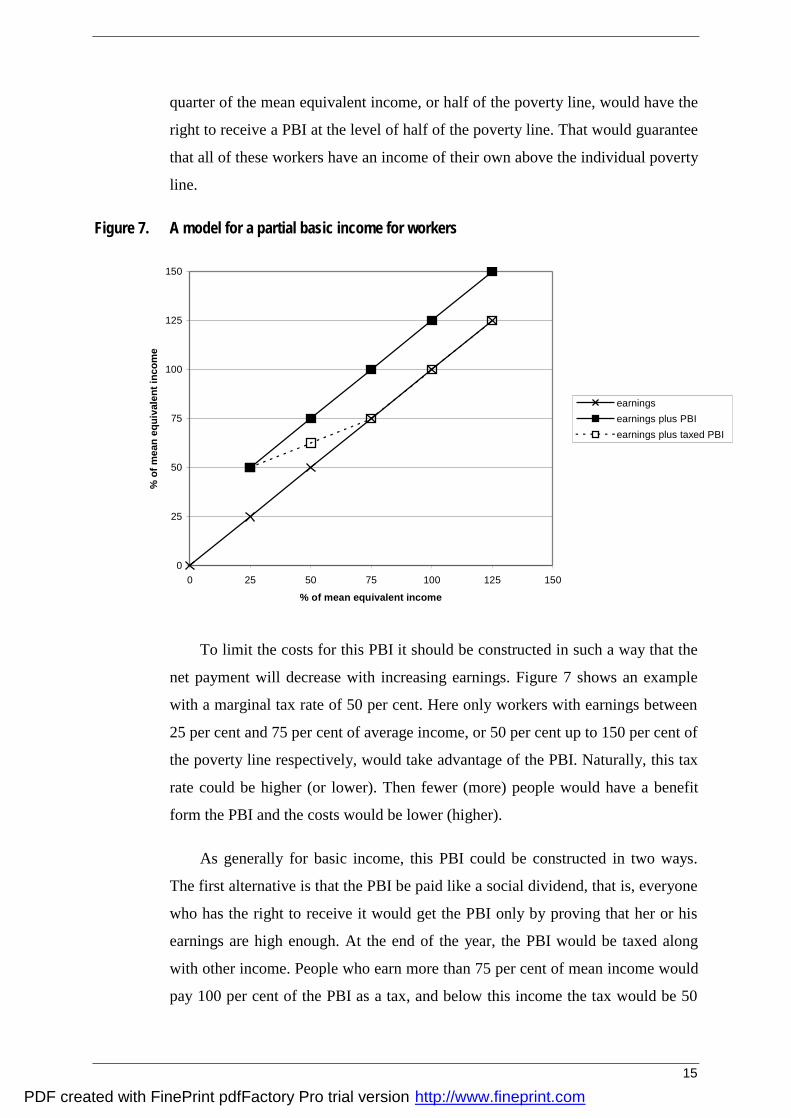
Means to reach this goal could be wage subsidies or a partial basic income
that looks like the following (see figure 7). Each worker who earns more than a
PDF created with FinePrint pdfFactory Pro trial version http://www.fineprint.com
15
quarter of the mean equivalent income, or half of the poverty line, would have the
right to receive a PBI at the level of half of the poverty line. That would guarantee
that all of these workers have an income of their own above the individual poverty
line.
Figure 7. A model for a partial basic income for workers
To limit the costs for this PBI it should be constructed in such a way that the
net payment will decrease with increasing earnings. Figure 7 shows an example
with a marginal tax rate of 50 per cent. Here only workers with earnings between
25 per cent and 75 per cent of average income, or 50 per cent up to 150 per cent of
the poverty line respectively, would take advantage of the PBI. Naturally, this tax
rate could be higher (or lower). Then fewer (more) people would have a benefit
form the PBI and the costs would be lower (higher).
As generally for basic income, this PBI could be constructed in two ways.
The first alternative is that the PBI be paid like a social dividend, that is, everyone
who has the right to receive it would get the PBI only by proving that her or his
earnings are high enough. At the end of the year, the PBI would be taxed along
with other income. People who earn more than 75 per cent of mean income would
pay 100 per cent of the PBI as a tax, and below this income the tax would be 50
0
25
50
75
100
125
150
0 25 50 75 100 125 150
% of mean equivalent income
% o
f m
ean
eq
uiv
alen
t in
com
e
earnings
earnings plus PBI
earnings plus taxed PBI
PDF created with FinePrint pdfFactory Pro trial version http://www.fineprint.com
16
per cent of the difference between gross earnings and the PBI, as shown in figure
7. The advantage of this type of social dividend is that everyone who is eligible
receives the PBI; there is no problem of non-take-up. The disadvantages are that
the gross costs are relatively high and that there is a high amount that must be
redistributed by the tax authorities. The second alternative is that the PBI be paid
like a negative income tax or like a transfer. In this case, only workers with an
income between 25 and 75 per cent of the mean income would be eligible and
they would only receive the difference between the PBI and the 'PBI tax.' Then
the gross costs would be much lower, but the earnings would have to be checked,
which might lead to non-take-up of the PBI. Beyond transaction costs, the costs
are equal for both of these alternatives.
3.3 Discussion
A main argument against a full basic income - that is, a basic income that is
at least as high as the poverty line - is that it is too expensive. A partial basic
income obviously has much lower costs. This is not only because the payment for
each person is lower, but also because the number of persons who are eligible for
a net payment is reduced substantially. In the case of a full basic income at the
level of 50 per cent of mean income and a marginal tax rate of 50 per cent,
everyone with an income below the mean income would receive a net payment.
This means that the majority of people would receive a net payment, which is the
main reason for the high costs of a full basis income. With a PBI as described
above, only people with earnings between 25 per cent and 75 per cent of the mean
income would receive a net payment, which limits costs.
What would be the effect on labour supply of the model above? There are
three kinds of incentives. First, it is worthwhile for non-active persons of working
age to become employed, particularly women. This is obviously positive. Second,
there would be a benefit for workers who have only a Geringfügige Beschäftigung
if they increase their employment above the 25 per cent threshold. This can also
be judged as positive. Third, there is an incentive for workers above the 75 per
cent line to decrease employment. This is positive in the sense that it would serve
as an incentive for part-time work, which has positive effects on the reduction of
PDF created with FinePrint pdfFactory Pro trial version http://www.fineprint.com
17
unemployment. On the other hand it might be argued from a feminist point of
view that this reduces the link to the labour market for part-time workers,
presumably more women than men. However, the other labour-supply effects are
positive even from a feminist point of view and may compensate for this.
The third point of discussion is the effects on poverty reduction. The
proposed PBI guarantees that the individual income of workers who earn at least
half of the poverty line by themselves is above the individual poverty line, which
reduces dependence on other household members, the state or other organizations
and thus the poverty risk. But it does not guarantee that the household income is
above the household poverty line. For that the subsistence level of the other
household members also must be satisfied. As shown in the empirical part of this
paper, only a minority of the working poor, albeit in some countries a large
minority, have earnings below the individual poverty line. The majority becomes
poor because other household members have either not enough income or no
income at all. For households in which one worker earns above the poverty line
and another earns below the poverty line, however, a PBI for workers would help
to reduce the poverty risk. Furthermore, one frequent reason why workers become
poor due to the household context is that their partners, in most cases women, are
not working. Since the described PBI has a positive effect on labour-market
participation, there would be another, indirect effect to reduce the poverty risk of
workers. Nevertheless, to avoid the possibility of workers falling below the
poverty line due to the household context, it is necessary for non-working
household members also to meet their individual subsistence level, particularly
children and unemployed.
4. Conclusion: A partial basic income – not only for workers?
Not only in the United States of America, but also in the member states of the
European Union there is a high number of working poor. Among the poor more
people are employed than unemployed, and the majority of the poor are living in
working poor households. It is not necessary for the working poor to receive a full
basic income, because they naturally have an income of their own. For workers
PDF created with FinePrint pdfFactory Pro trial version http://www.fineprint.com
18
whose earnings are at least half of the poverty line, a partial basic income as
proposed above would be sufficient to reach their individual subsistence level.
Compared to a full basic income it has much lower costs. Furthermore, there are
mainly positive labour supply effects and the poverty risks of workers would
decrease.
To guarantee that workers will not be poor, it is necessary for not only
workers, but also the other household members of a working poor household, to
have an income above their individual subsistence level. Children usually do not
receive any state allowance over their subsistence level, which is about the half of
the poverty line. One financially viable and very effective model to guarantee that
every child receive just this subsistence level was proposed by Hauser/Becker
(2001) and adopted by the German Green party (see Otto 2002, Otto et al. 2001),
who call it Kindergrundsicherung (Basic Income for Children). Poverty then can
arise only if the adults do not have sufficient income for themselves. That leads to
the thought of applying the idea of a partial basic income for workers to other
groups as well. Like workers, non-working adults, too, usually have an individual
income of their own: the unemployed usually receive unemployment benefits,
pensioner’s pensions and so on. Thus, an individual partial basic income at the
level of half of the poverty line for all children, and for all adults who have an
individual income of their own of more than the half of the poverty line, would
greatly reduce poverty such that only exceptional cases of poor households could
be imagined. For example, it would guarantee that single parents who have their
own income - including individual social transfers - at half of the poverty line
would no longer be poor.
Finally, the question is why adults with an individual income below half of
the poverty line should not be eligible for the PBI. Two reasons for this are that
the costs would be much higher and that the labour-supply incentives would be
not as strong as those described above. More important, however, is that many of
them do not need aid. Many of them are voluntarily unemployed or are voluntarily
earning only a small amount, for example because they have a partner with a high
income. It is not reasonable for the state to subsidize these individuals. Finally,
resistance against a basic income would be lower if it were paid only to those who
PDF created with FinePrint pdfFactory Pro trial version http://www.fineprint.com
19
make a contribution of their own to society, and if the recipients' own income
were higher than the basic income. Of course, in the case of a partial basic income
rather than a full basic income it would be necessary to have something like
means-tested social assistance for those who are not making ends meet even
though they receive a partial basic income. But then these would be only
exceptional cases.
PDF created with FinePrint pdfFactory Pro trial version http://www.fineprint.com

PDF created with FinePrint pdfFactory Pro trial version http://www.fineprint.com
21
References
Atkinson, Anthony B. 1998. Poverty in Europe (Oxford, Blackwell).
Atkinson, Anthony B./ Cantillon, Bea/ Marlier, Eric/ Nolan, Brian 2002. Indicators for Social Inclusion in the European Union (Oxford, Oxford University Press).
Burri, Stefan 1998. Methodische Aspekte der Armutsforschung (Bern; Stuttgart; Wien, Haupt).
Caritas Schweiz 1998. Trotz Einkommen kein Auskommen: working poor in der Schweiz (Luzern, Caritas-Verlag).
Eurostat,1997. "Income Distribution and Poverty in Europe – 1993". Statistics in Focus. Population and Social Conditions (Luxembourg, Eurostat), 6/1997.
Hagenaars, Aldi J.M. 1986. The Perception of Poverty (Elsevier).
Hagenaars, Aldi J.M./ de Vos, Klaas/ Zaidi, M.Asghar 1994. Poverty Statistics in the late 1980s: Research in micro-data (Luxembourg, Eurostat).
Hauser, Richard/ Becker, Irene 2001. "Lohnsubventionen und verbesserter Familienlastenausgleich als Instrumente zur Verringerung von Sozialhilfeabhängigkeit" in Mager, Hans-Christian/ Schäfer, Henry/ Schrüfer, Klaus (eds.) Private Versicherung und Soziale Sicherung. Festschrift zum 60. Geburtstag von Roland Eisen (Marburg, Metropolis Verlag).
Hauser, Richard/ Nolan, Brian with Beate Hock, Konstanze Mörsdorf and Wolfgang Strengmann-Kuhn 1999. Changes in Income Poverty and Deprivation over Time. A Comparison of Eight European Countries from the Mid-Eighties to the Mid-Nineties with Special Attention to the Situation of the Unemployed. EVS working paper No. 21. EVS-Project "Personelle Einkommensverteilung in der Bundesrepublik Deutschland" financed by the Hans-Böckler-Stiftung. (Goethe University Frankfurt/Main).
Jenkins, Stephen 1991. "Poverty Measurement and the Within Household Distribution: Agenda for Action" in Journal of Social Policy, 20(4), pp. 457-483.
Knöpfel, Carlo 1999. "Working poor: Stand des Wissens in der Schweiz" in Fluder R., Nolde M., Priester T. und Wagner A. (eds.) Berichterstattung zur Armut. Aktueller Stand und Perspektiven aus der Sicht der Statistik (Neuchâtel, Bundesamt für Statistik).
Marlier, Eric/ Ponthieux, Sophie 2000. "Low-wage employees in EU countries" Statistics in Focus. Population and Social Conditions (Luxembourg, Eurostat). Theme 3 - 11/2000.
PDF created with FinePrint pdfFactory Pro trial version http://www.fineprint.com
22
Mejer, Lene 2000. "Social Exclusion in the EU Member States". Statistics in Focus. Population and Social Conditions (Luxembourg, Eurostat). Theme 3 -1/2000.
Otto, Birgit 2002. Die sozioökonomischen Folgen eines einkommensabhängigen Kindergeldzuschlags. Eine Mikrosimulation der Grünen Kindergrundsicherung. DIW-discussion paper No. 273. (Berlin, Deutsches Institut für Wirtschaftsforschung).
Otto, Birgit/ Spiess, Katharina/ Teichmann, Dieter 2001. Berechnung des Grünen Kindergrunsicherungsmodells und einer Gegenfinanzierung durch ein Ehegattenrealsplitting. Kuzgutachten des DIW Berlin für die Bundestagsfraktion von Bündnis '90/ Die Grünen (Berlin, Deutsches Institut für Wirtschaftsforschung).
Ringen, Stein 1988. "Direct and Indirect Measures of Poverty" in Journal of Social Policy 17, 3, pp. 351-365.
Ruspini, Isabella 1998. "Women and Poverty Dynamics: The Case of Germany and Britain" in Journal of European Social Policy, 8(4), pp. 291-316.
Schäfer, Claus 1997. "Working Poor: 'Inequitable' Wages in Germany and Europe - (Higher) Minimum Wages as an Instrument of Justice?' in Ott, Notburga/ Wagner, Gert (eds.) Income Inequality Poverty in Eastern and Western Europe (Heidelberg, Physica).
Sen, A. K. 1981. Poverty and Famines. An Essay on Entitlement and Deprivation (Oxford, Clarendon Press).
Strengmann-Kuhn, Wolfgang 2000. Theoretical Definition and Empirical Measurement of Welfare and Poverty: A Microeconomic Approach. Paper to be presented at the 26th General Conference of the International Association for Research on Income and Wealth (IARIW), 27 August to 2 September, Cracow, Poland.
Strengmann-Kuhn, Wolfgang 2001. "Erwerbstätige Arme in den Ländern der Europäischen Union." in Becker, Irene/ Ott, Notburga/ Rolf, Gabriele (eds.) Soziale Sicherung in einer dynamischen Gesellschaft. Festschrift für Richard Hauser zum 65. Geburtstag (Frankfurt am Main, Campus).
Strengmann-Kuhn, Wolfgang 2002. Armut trotz Erwerbstätigkeit. Analysen und sozialpolitische Konsequenzen (Frankfurt am Main, Campus).
Van den Bosch, Karel 1999. Identifying the Poor, Using Subjective and Consensual Measures. Proefschrift voorgelegt tot het behalen van de graad van Doctor in de Politieke en Sociale Wetenschappen aan de Universiteit Antwerpen.
Vos, Klaas de; Zaidi, M. Asghar 1998. "Poverty Measurement in the European Union: Country-Specific or Union-Wide Poverty Lines?" in Journal of Income Distribution, 8(1) 77-92.
PDF created with FinePrint pdfFactory Pro trial version http://www.fineprint.com