working paper: you can only lead if someone follows: the
TRANSCRIPT

Working Paper:
You Can Only Lead if Someone Follows: The Role of Teachers’ Assessment of
Principal Quality in Principal TurnoverAliza N. Husain1, Luke C. Miller1, Daniel W. Player1
1University of Virginia
Updated April 2019
EdPolicyWorksUniversity of Virginia
PO Box 400879 Charlottesville, VA 22904
EdPolicyWorks working papers are available for comment and discussion only. They have not been peer-reviewed. Do not cite or quote without author permission. Working paper retrieved from:
http://curry.virginia.edu/uploads/epw/69_Teacher_Assessed_Principal_Quality_and_Turnover.pdf
Acknowledgements: We appreciate financial support from the National Center for the Analysis of Longitudinal Data in Education Research (CALDER). CALDER is supported by IES Grant R305A060018. The research is also supported by the Institute of Education Sciences, U.S. Department of Education, through Grant R305B100009 to the University of Virginia. We are also grateful to the Bankard Fund for Political Economy’s Pre-doctoral Fellowship in support of the pursuit of Aliza Husain’s dissertation. Finally, we are grateful to conference participants at the Association for Education Finance and Policy (AEFP) and the University Council for Educational Administration (UCEA), and James H. Wyckoff, Michelle D Young, and Daphna Bassok for their feedback. The views expressed in this article are solely those of the authors and do not reflect those of the funders.
Principals can have potentially large effects on their schools, and especially student outcomes. When they leave their roles, they cause disruptive effects to the school climate. If effective principals are more likely to leave than ineffective principals, the negative effects of principal turnover are likely exacerbated. Relatively little, however, is known about the quality of principals who leave the principalship. We use teachers’ perceptions of their principals as a measure of principal quality to understand the relationship between principal quality and turnover. Using local- as well as national-level data, we find that higher quality principals, as rated by their teachers, are less likely to leave the principalship. This finding persists across a host of contexts and time, indicating that inasmuch as principal turnover is a concern, it is not driven by higher quality principals. The paper concludes with some impli-cations of these findings and recommendations for further research.
EdPolicyWorks Working Paper Series No. 69. April 2019.Available at http://curry.virginia.edu/edpolicyworks/wp
Curry School of Education | Frank Batten School of Leadership and Public Policy | University of VirginiaWorking Paper © 2019 Rector and Visitors of the University of Virginia. For more information please visit www.curry.virginia.edu/edpolicyworks or contact [email protected]
1
Introduction
Principals are important drivers of school improvement (Clifford & Ross, 2012;
Leithwood, Louis, Anderson, & Wahlstrom, 2004; Sebastian & Allensworth, 2012). Their
behaviors and leadership practices are strongly correlated with student achievement (Waters,
Marzano, & McNulty, 2003). Yet, the same research also suggests that principals vary
meaningfully in their effectiveness. Some have significant positive effects on students while
others have significant negative effects. To date, research has failed to successfully identify
observable characteristics that predict ex ante whether or not a principal will be effective.
Researchers instead can only determine retrospectively and observe after the fact whether the
principal had a positive impact.
What is true for researchers might also be true for principals themselves; they might have
difficulty predicting their effectiveness beforehand and it might only be revealed after some time
on the job. National data suggest that approximately 20 percent of public school principals in the
United States leave their positions each year (Miller, 2013), which is of concern to policy
makers. But, the interplay between principal quality and principal turnover is critical to our
understanding of the causes and effects of principal turnover. If the most effective principals are
the ones leaving schools, it suggests that, on average, students would be better off with less
principal turnover, and that states and districts should seek broad solutions to increase principal
retention. On the other hand, if the principals leaving schools are relatively less effective than
those who remain, it could suggest that less-effective principals currently sort themselves out of
schools in a way that is not as negative for students as it might first appear. If this is the case,
broad efforts to increase principal retention would have unintended negative consequences for
the students in schools with lower-quality principals who now stay rather than exit. Any
2
individual principal’s decision to leave a school is obviously a function of many internal and
external factors that are difficult to predict. Nonetheless, gaining a better understanding of
general patterns of principal turnover could help policy makers understand the extent to which
policy solutions should seek to stem principal departures.
The purpose of this paper is to estimate the relationship between principal effectiveness
(which we capture with a principal quality measure) and turnover. Specifically, we assess
whether higher quality principals are more or less likely to leave their schools in New York City
(NYC) as well as at the national level. Results show that lower quality principals are more likely
to leave their schools than higher quality principals. This finding persists across school contexts
and time, lending robustness to our results. We discuss how these results contribute to the
literature around differential principal turnover and how future work can further inform our
understanding of principal mobility.
Background and Motivation
Prior research has established that principals matter for student achievement. School
leadership is considered the second most significant school-related factor impacting student
outcomes, after teaching (Leithwood et al., 2004). While principals do not directly affect student
achievement by instructing students as do teachers, they have a strong influence on student
outcomes through teacher hiring, development, and retention, and influencing teachers’ job
satisfaction and their perceptions of school culture (Glanz, Shulman, & Sullivan, 2007; Grissom
& Loeb, 2011; Harris, Rutledge, Ingle, & Thompson, 2010; Leithwood et al., 2004; Loeb,
Kalogrides, & Béteille, 2012). For instance, Grissom (2011) finds that principal effectiveness is
associated with greater teacher satisfaction and lower teacher attrition, with larger positive
impacts in disadvantaged schools. Similarly, when examining avenues through which principals
3
can build teacher capacity, Doll (2010) argues that principals can help foster strong relationships
between teachers, celebrate teachers’ successes, and help teachers problem solve. Effective
leaders are also individuals who strengthen support systems for teachers and allocate resources
effectively, “to make teachers’ work less burdensome and more appealing” (Loeb & Reininger,
2004, p. 55).
Given the beneficial impact principals can have, it is not surprising that turnover among
principals has negative consequences for teacher retention, student achievement gains, and
school culture (Béteille, Kalogrides, & Loeb, 2012; Griffith, 2004; Mascall & Leithwood, 2010).
Exploring school outcomes around a principal transition, Miller (2013) finds that the years
before and after a principal’s departure from a school are marked by increased teacher attrition
and decreased student achievement. Most principals serve less than five years at a given school
(Miller, 2013) which likely limits that principal’s potential effects on school outcomes via its
teachers. Branch and colleagues (2008) hypothesize that principals’ influence over the
composition of the school staff increases with their tenure at the school as it enriches their
knowledge of the school, its students, teachers, and community. The consequences of principal
turnover are therefore not necessarily felt equally.
Principals are more likely to leave disadvantaged schools than they are more advantaged
schools (Loeb, Kalogrides, & Horng, 2010). Unfavorable working conditions in these schools
may be a contributing factor (Yan, 2019). And, when principals move between schools, they are
more likely to transfer from schools that have greater proportions of minority, low-income, and
low-achieving students to schools that are relatively more “advantaged” (Béteille et al., 2012;
Branch, Hanushek, & Rivkin, 2008; DeAngelis & White, 2011; Fuller & Young, 2009; Gates et
al., 2006; Loeb et al., 2010). Such patterns of turnover are especially problematic if the negative
4
effects of principal turnover disproportionately harm high poverty, low-achieving schools
(Béteille et al., 2012). These studies, however, leave unanswered the question of whether all
principal turnover is a net negative for schools and students. Depending on the quality of the
principal, it is possible that these schools would have seen even worse outcomes had the
principal not departed.
While the importance of principals and the on average negative outcomes correlated with
principal turnover are well-established, little work examines whether higher quality principals
are more likely to leave schools. One reason for the lack of research on the topic is that
measuring principal effectiveness is challenging (Clifford & Ross, 2012; Goldring et al., 2009).
Race to the Top eligibility requirements included the design and implementation of rigorous
evaluation systems for teachers and principals as a criterion to submit grant applications (U.S.
Dept. of Ed., 2009). Approximately 40 states, as a result, tried to do as much (Chiang, Lipscomb,
& Gill, 2016). Of the states and districts that did implement principal evaluation systems, many
of them continue to struggle to effectively use these tools to assess principals – a problem that is
exacerbated by the “scant evidence on the validity and reliability of current principal evaluation
tools” (McCullough, Lipscomb, Chiang, Gill, & Cheban, 2016, p. 3). This is partly the case
because principals’ responsibilities span multiple areas, including administration, organization
management, day-to-day instruction, instructional program, internal relations, and external
relations (Horng, Klasik, & Loeb, 2010) as well as managing physical facilities and student
behavior (Goldring et al., 2009). Accurately evaluating school leaders on all these dimensions
proves incredibly hard.
The studies that do attempt to measure principal effectiveness face certain challenges.
Grissom, Kalogrides, and Loeb (2015) and Chiang et al. (2016) discuss the difficulties of
5
disentangling principals’ contribution to student outcomes from other factors over which
principals may not have control, such as teachers hired by prior principals. Additionally,
estimating principal value-added to student achievement imposes substantial data requirements;
namely, school observations over many years with the frequent turning over of the principal
(Fuller & Hollingworth, 2014).
Acknowledging these challenges, we leverage teacher perceptions of their principals as
an alternative. This method to evaluate school leaders has face validity because principals
primarily affect student outcomes through teachers (Hallinger & Heck, 1998; Hitt & Tucker,
2016). Teachers who are dissatisfied with their principals are more likely to leave schools
(Allensworth, Ponisciak, & Mazzeo, 2009; Boyd et al. 2011; Branch, Hanushek, & Rivkin, 2012;
Grissom, 2011; Waddell, 2010), negatively affecting students (Ronfeldt, Loeb, & Wyckoff,
2013). This is not a novel concept. Other researchers have examined a measure of principal
leadership included on many surveys of teachers. For instance, Louis, Dretzke, and Wahlstrom
(2010) use teacher ratings of their principal’s leadership to estimate the relationship between
principal leadership and student achievement. Similarly, Sebastian and Allensworth (2012) use
multilevel structural equation modeling to explore how organizational factors mediate the
relationship between a principal’s instructional leadership (as reported by teachers) and
classroom instruction and student achievement. Similar to these studies, we use teacher ratings of
their principals as a measure of principal quality and will hereon refer to it as such.
What is relatively novel is our use of this measure of principal quality to examine the
connection between principal effectiveness and principal turnover. Grissom and Bartanen (2018)
is the only study we are aware of that has also done this. Focusing on Tennessee, they construct
measures of principal quality from teachers’ survey responses as well as principal evaluation

6
information collected through the Tennessee Education Acceleration Model (TEAM). They find
that, on average, less effective principals, as measured by teacher ratings and TEAM scores, are
more likely to leave their schools. While TEAM may be a more valid measure of principal
effectiveness, teacher ratings are positively correlated with TEAM scores. Further, teacher
ratings are correlated with principal turnover (Grissom & Bartanen, 2018). These findings lend
support to the use of teacher ratings as a measure of principal quality. We add to this nascent
literature by examining the relationship between principal quality and principal turnover both in
another jurisdiction, New York City (NYC), as well as at the national level. Our exploration
speaks to the generalizability of findings while adding more nuance to the topic by understanding
the relationship of interest across a host of principal characteristics and school contexts.
Present Study
Our analysis answers the following policy-relevant question: are higher quality principals
less likely to leave their schools? We begin by addressing this research question in one large
urban district in the U.S., New York City. By focusing on one district over multiple consecutive
years, we can explore differences by context and time. We then replicate our analysis at the
national level using the Schools and Staffing Survey (SASS) data. The national-level data only
offers us a cross-sectional view of the data, but does allow us to explore if patterns from our
local setting results replicate across the nation. Regardless of the advantages of our two datasets,
the national-level analysis may mask heterogeneity in the relationship between principal quality
and turnover, and our local-level findings may not be generalizable to other contexts.
In addition to exploring whether Grissom and Bartanen’s (2018) findings persist in the
contexts we examine, we extend the earlier work in meaningful ways. One contribution is our
exploration of whether teacher ratings of their principals just reflect general teacher

7
dissatisfaction with the school rather than specifically about the principal’s leadership. Given the
earlier studies showing that principal effectiveness improves with experience in the position
(Branch et al., 2008), we also assess whether teacher ratings are differentially associated with
principal turnover by the number of years the principal has been at the school. Another important
contribution we make is to assess whether the pattern of more effective teachers being more
likely to leave high minority and high poverty schools (Author, 2011) is evident in principal
turnover, exacerbating any negative effects of principal turnover.
While we, like most other researchers, are unable to distinguish between voluntary and
involuntary turnover, teacher ratings of their principal’s quality potentially impact both types of
principal turnover. Superintendents, who initiate involuntary departures, may, formally or
informally, use teacher ratings to identify which principals will not be reappointed. With respect
to voluntary departures, principals may take how teachers at the school feel about their
leadership quality in determining whether to remain at the school. In both situations, teachers’
opinions about their principal’s quality matters given that principals’ ability to engage their
teaching staff in school improvement efforts is significantly limited should the teachers view
their principal’s leadership unfavorably.
Teacher ratings of principal quality could also have both a direct and indirect effect on
principal turnover. In NYC, the teacher surveys containing our measure of principal quality are
used to measure and improve school quality (“NYC School Survey,” n.d.). Survey results are
published on the district’s webpage. Superintendents and principals are very likely to review
them prior to the start of the following academic year, allowing teacher ratings to directly
influence both voluntary and involuntary turnover. NYC teacher ratings may also have an
indirect effect should the sentiment captured by the survey drive observable teacher behavior.

8
For example, teachers who rate their principal poorly are presumably less likely to behave in
ways that support their principal’s school improvement efforts and are more likely to directly
report their displeasure to the principal, superintendent, or other individuals who may share their
sentiments with the principal or superintendent. It is through these indirect avenues that teacher
ratings on the SASS could influence voluntary and involuntary principal turnover given that the
SASS results are unlikely to have been reviewed by either principals or their superintendents.
Similar to other measures of principal quality, teacher survey responses likely suffer from
biases. Despite teacher ratings being an imperfect method of evaluating principal quality, they
are an important measure in and of themselves. Teacher ratings of principal quality may be
qualitatively different from the principal’s “true” quality; however, given that principals
primarily affect students through teachers (Hallinger & Heck, 1998; Hitt & Tucker, 2016), we
argue that teachers’ perceptions of their principals are a relevant measure. This is especially true
because teachers’ perceptions of their principals are inversely related to teachers’ likelihood of
leaving the school (Grissom, 2011), and teacher turnover negatively affects student outcomes
(Ronfeldt et al., 2013). Teacher ratings of their principals are therefore an important measure of
principal quality, regardless of whether they reflect “true” principal quality.
By understanding how principal quality relates to principal turnover across a host of
school settings, principal characteristics, and timeframes, we aim to provide a more
comprehensive look at the issue than has previously been presented.
Data and Measures
Data
New York City. The New York City Department of Education (NYCDOE) annually
administers the NYC School Survey between February and April of the academic year to assess
9
each school’s climate (“NYC School Survey,” n.d.). We use data from the Teacher Survey
component for the 2012-13 to 2015-16 academic years. Across these years, we have a total of
about 266,000 teacher responses. We aggregate these responses to the school-year level,
resulting in between 1,700-1,900 schools for each year. We augment these survey data with
student-, teacher-, school-, and principal-level administrative data provided by the NYCDOE.
The administrative data include information on principal age, experience, gender, and race;
teacher experience, gender, race, and salary; student race and free and reduced-price lunch
eligibility (FRPL); and school level and AYP achievement.
Schools and Staffing Survey. We use the Teacher Surveys from the 2007-08 and 2011-
12 waves of SASS, and the corresponding Principal Follow-up Surveys from 2008-09 and 2012-
13. The SASS is a nationally representative dataset collected by the NCES. The 2007-08 SASS
was administered between September 2007 and June 2008, and the 2011-12 SASS was
administered in October 2011 (Cox, Palmer, Spiegelman, Strizek, & Thomas, 2017, p. 37).
Across the two waves we have 76,740 teachers across the nation.1 Similar to the NYC sample,
we aggregate teachers’ responses to the school-level for each wave and combine these data with
the Principal Follow-up Surveys. This leaves us with 7,110 schools with principals who
responded to the survey in 2008-09, and 7,080 schools with principals who responded to the
survey in 2012-13, for a total of 14,190 school-years. We also have information on student,
teacher, and principal demographics for each school including principal age, experience, gender,
and race, teacher race, student race, school level, AYP achievement, and rurality indicators.
Sample
Our final sample consists of 5,895 NYC principal-by-school year records and 14,120
SASS principal-by-wave observations. There is minimal missing data in both samples so as not
10
to trigger bias concerns by dropping cases with missing data. The final NYC sample excludes the
roughly 2 percent of total observations which we had to drop because the records identified more
than one principal for the school (we cannot disentangle which principal the teachers were
evaluating in these cases). We dropped 0.5 percent of the principals in the SASS that lacked
information on their following-year employment status.
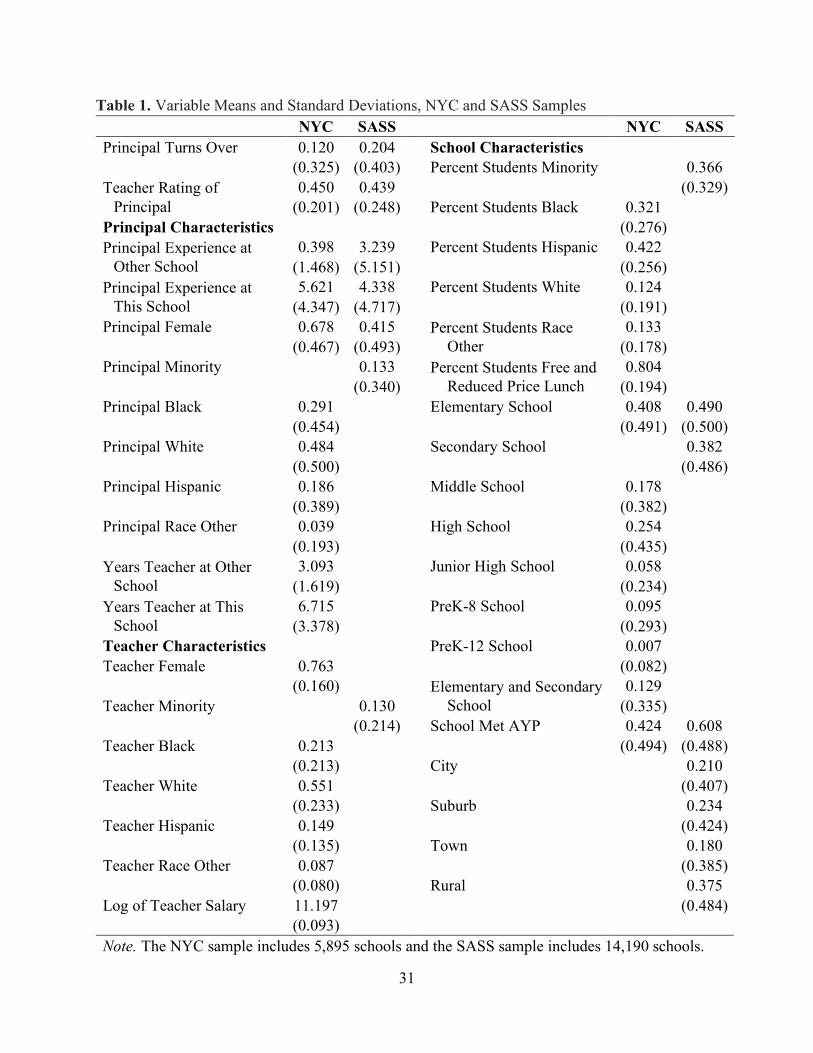
Unsurprisingly, characteristics of the two samples differ—NYC is not representative of
the entire United States (Table 1). For instance, NYC schools serve 87.6 percent minority
students on average, compared to the SASS average of 36.6 percent. Similarly, the NYC sample
has more minority principals than the SASS sample (51.6 percent compared to 13.3 percent) and
more female principals (67.8 percent compared to 41.5 percent). Lastly, NYC public schools are
served by 44.9 percent minority teachers compared to the SASS sample which contains 13
percent minority teachers. These differences support our interest in exploring whether the
relationship between principal quality and principal turnover differs in the two contexts.
{Insert Table 1 about here}
Measures
We construct a measure of principal turnover for New York City principals and use the
measure provided in the SASS dataset. In NYC, we identify principals not observed as a
principal in the school the following year as having exited the school. For the SASS sample,
NCES follows up with principals in the following year to determine whether they are still the
principal in the same school. Those who are not are identified as having exited the school.
Principals exit at a considerably higher rate in NYC than in the SASS sample (12.0 versus 20.4
percent) (Table 1).
11
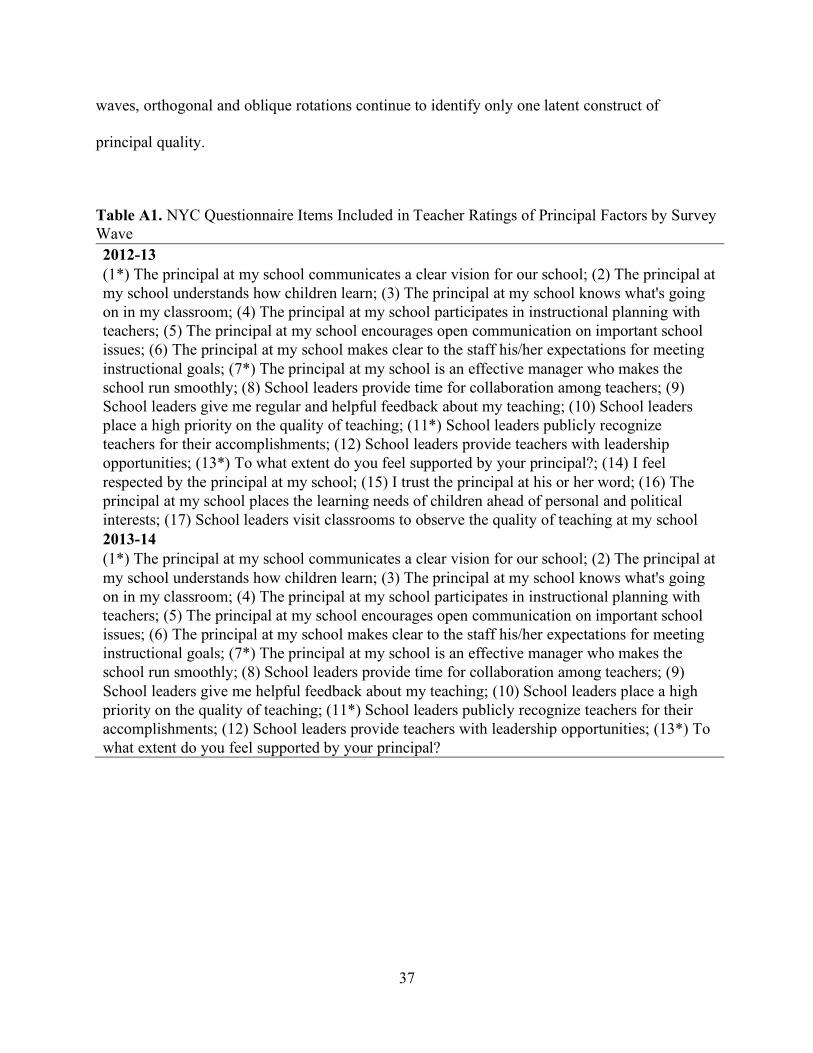
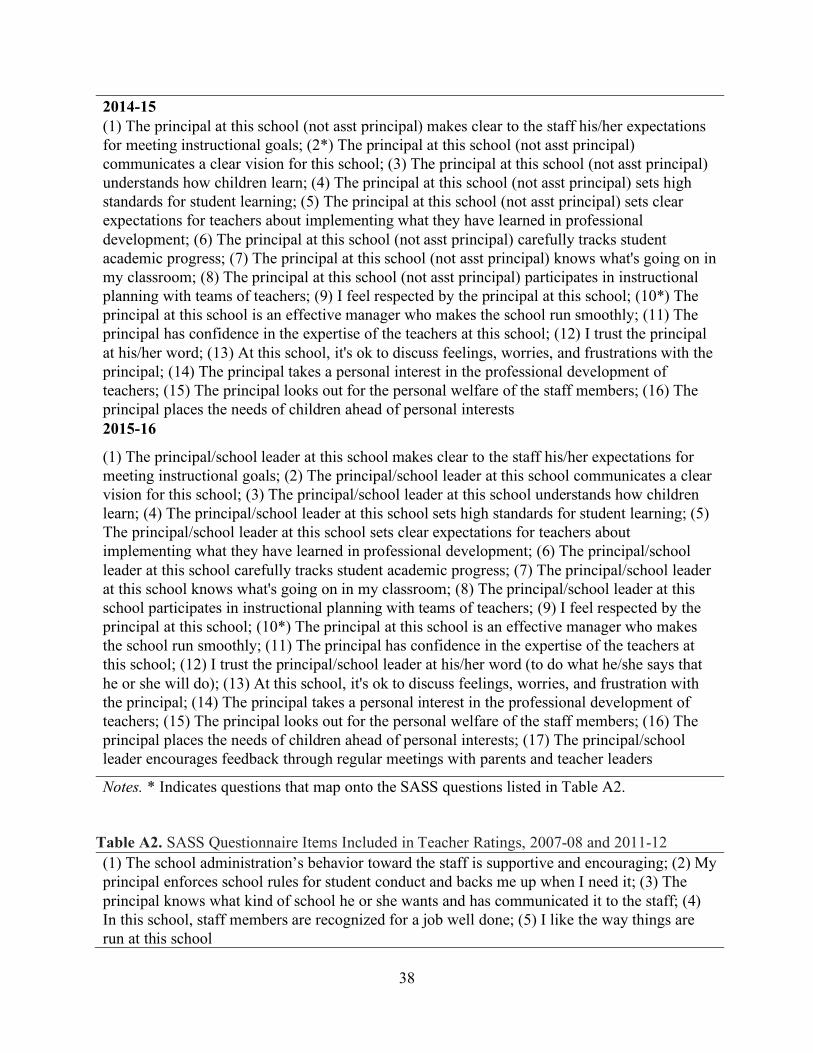
The NYC School Surveys and the SASS surveys all ask teachers a series of questions
about their school’s principal which we collapse into measures of principal quality via factor
analysis. We assess the factor structure separately by each year (wave) of each survey due to
differences in the survey questions (see Tables A1 and A2 in the appendix for the exact wording
of the NYC and SASS survey questions, respectively). Survey questions use a four-point Likert
scale (1 = strongly disagree to 4 = strongly agree) with the exception of the NYC 2014-15 survey
that used a six-point scale which we converted to a four-point scale.
Teachers rate principals highly on both the SASS and the NYC surveys. On the NYC
surveys, across all years, 45 percent of responses indicate a “strongly agree” rating and 37
percent of responses indicate an “agree” rating. Across the two SASS waves, 43 percent of
responses fall into the “strongly agree” category, and 38 percent of responses fall into the
“somewhat agree” category. The relatively high percentages of ratings for both categories and
the sharp right skew in overall ratings likely reflects a tendency for socially desirable responses
that differ from teachers’ “true” answers (Callegaro, 2008). Specifically, teachers may have a
general hesitance to be critical of their principals and therefore more likely to select “agree”
when they actually disagree with a statement. When they truly agree with something, however,
they may be more likely to select “strongly agree” instead of “agree” to differentiate their
responses from those that they rated affirmative even though they had ambivalent or somewhat
negative responses. Another reason we may be seeing the large percentage of positive statements
for NYC could be because NYC School Surveys are used for accountability and school
improvement purposes.2 To increase the chance that we capture teachers’ true agreement with a
statement and not the pressure to inflate answers, we convert the NYC and SASS survey scales
into a binary indicator (1 = strongly agree; 0 otherwise).3
12
Reliability analysis for questions on the NYC surveys, by year, yield Cronbach’s alphas
that are greater than 0.97. A similar exercise for questions on the SASS surveys by wave shows
Cronbach’s alphas that are greater than 0.86. After aggregating each question to the school-by-
year (wave) level, we therefore average all principal-related questions to create one measure of
teacher perceptions of their principal (i.e. principal quality).
On average, principals receive strikingly similar ratings from their teachers across the
two samples. Although the questions vary across the samples and waves (the importance of
which we examine later), the average principal has a 45.0 percent “strongly agree” rating in
NYC and a 43.9 percent “strongly agree” rating in the SASS. We standardized these measures
within year (wave) for our analysis for interpretational ease.
Analytic Strategy
To understand how teachers’ ratings of their principals relate to principal exits, we run
linear probability regressions of principal exits on our measure of principal quality, and cluster
standard errors at the school level.4 Our main model specification is given in equation 1 which
we estimate separately by the NYC and SASS samples.
(1) !"#$%&'( = +, + +./0#12345#$6%&'( + +789&'( + +:8/%&'( + +;8<&'( +=' + >( +?%&'(
We predict whether principal i at school j located in NYC community district or SASS state k
exits at the end of year t as a function of the teachers’ aggregated and standardized ratings of the
principal’s quality (/0#12345#$6%&'(); vectors of teacher, principal, and student characteristics
(9&'(, /%&'( , and <&'(, respectively); jurisdiction fixed effects (=', community district fixed effects
in the NYC models and state fixed effects in the SASS models), and year fixed effects (γ().
Our control variables vary somewhat across the NYC and SASS samples due to
differences in the data collected in each setting. We control for principal race, gender, and years

13
of experience (in their current school and at other schools) for both samples. With respect to
teacher characteristics, we control for teacher race for both the NYC and SASS models, but are
able to control for a richer set of teacher covariates for NYC models by including teacher gender,
salary, and years of experience. We capture differences in student characteristics across
principals in both the NYC and SASS models by controlling for the proportion of minority
students, whether or not the school met AYP, and the grade level of the school. In the NYC
models we include the proportion of FRPL-eligible students (as a proxy for socio-economic
status) while in the SASS models we include the school’s rurality status.
We augment these observed characteristics with jurisdiction and year fixed effects to help
account for unobservable differences between principals and their schools. NYC, as the largest
district in the country, organizes its schools into smaller community and high school districts,
each of which has its own superintendent. This allows us to include district fixed effects in our
model to compare schools within a district, as well as control for any unobservable
characteristics of the district that may offer competing hypotheses to our relationship of interest.
In a similar vein, we control for state fixed effects in the SASS model to account for
unobservable state-specific characteristics that may similarly influence both our dependent
variable and our main independent variable, while also ensuring that we are conducting within-
state comparisons. Finally, because we examine our relationship of interest over four years for
NYC and across two waves of the SASS data, we include year fixed effects to conduct a within-
year comparison and to control for any year-specific unobservable influences. As discussed
previously, within the NYC sample, questions relating to the principal as well as the scale of
ratings changed over time. The inclusion of year fixed effects also accounts for any resulting
variation in the principal quality measure across years.

14
While we include a host of covariates as well as jurisdiction and year fixed effects, we
are not making any causal claims about principal quality and principal turnover. It could be that
because principals know that their teachers do not think of them favorably, they leave their
position. This paper does not try to tease apart the directionality of the observed relationship
either, instead focusing on whether higher or lower quality principals, as rated by the teachers at
their schools, are more likely to exit. Despite these limitations, our analysis offers a way to
estimate principal quality – an undertaking that has proven challenging in the past. Our work also
presents a novel insight into how principal quality relates to principal turnover by examining our
research question across principal characteristics, school contexts, and time.
Results
We begin by showing results for our main model. We then run a series of alternate
specifications to assess whether findings from our main model can be explained by competing
hypotheses and whether they are robust to a variety of contexts.
Main Model
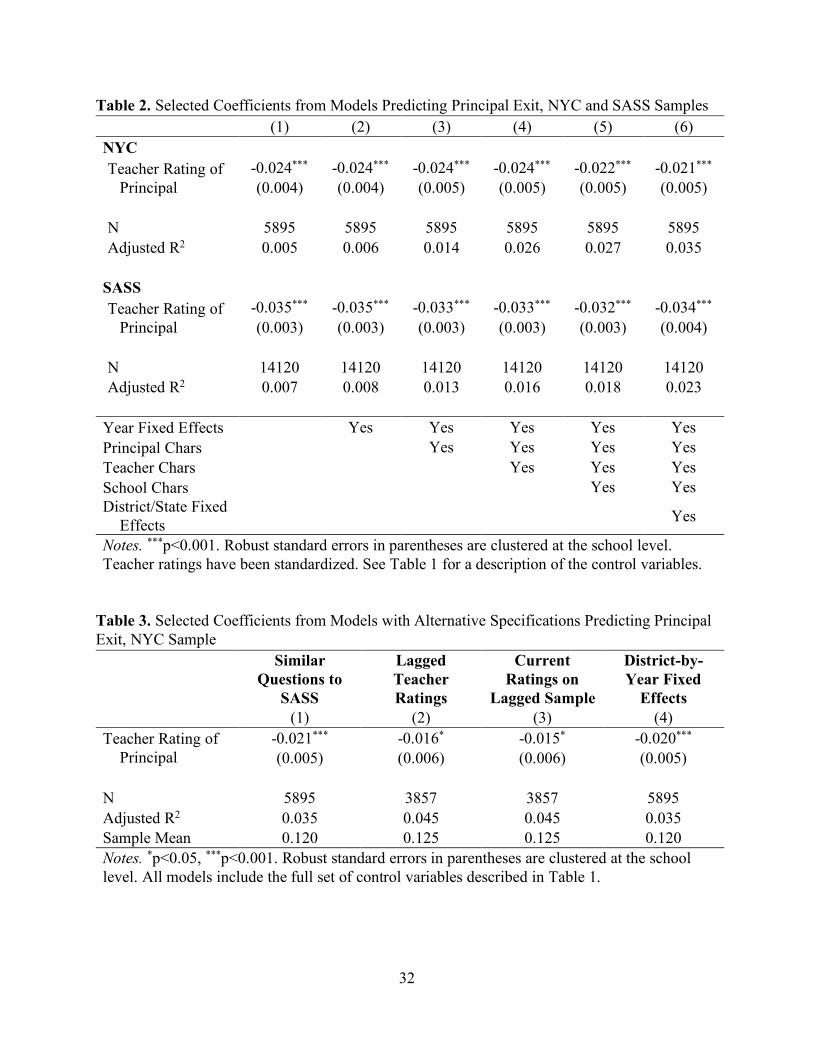
Our main results for both the NYC and SASS samples consistently show that principal
quality is negatively correlated with principal exits; higher quality principals are less likely to
turn over (Table 2). The relationship is remarkably robust for both samples as we include
additional control variables moving from the simple correlation between principal quality and
principal turnover (Column 1) to adding year fixed effects (Column 2), principal characteristics
(Column 3), teacher characteristics (Column 4), school characteristics (Column 5), and, finally,
district fixed effects (Column 6), enabling us to rule out numerous competing hypotheses. The
results from our preferred model specification (Column 6) indicate that, after controlling for the
full set of covariates, a one standard deviation increase in principal quality corresponds to a

15
statistically significant 2.1 percentage point decrease in the likelihood of a NYC principal
leaving. With the average principal turnover rate for NYC at 12 percent, a one standard deviation
change in principal quality represents 17.5 percent of the total turnover, making the results
substantively meaningful as well. On the national level, a one standard deviation increase in
principal quality predicts a 3.4 percentage point decrease in principal exits or 16.7 percent of the
average turnover among principals in the SASS sample.
{Insert Table 2 about here}
Robustness Checks
Even though our preferred specifications yield very similar and consistent results for both
the local and national samples, we might be concerned that despite our rich set of covariates, we
are detecting spurious associations between principal quality and principal turnover. To address
this concern, we estimate a series of models with alternative specifications as robustness checks.
Construction of principal quality variable. It may be that our results are unique to the
specific way in which we have chosen to create our principal quality measures. We chose to use
the full set of questions from each survey so as to get as comprehensive a rating as possible
despite the questions differing between the surveys and across waves in NYC. To ascertain
whether this decision influences our results, we identify a set of questions in the NYC surveys
that closely resemble those from the SASS surveys (see asterisked questions in Table A1 in the
appendix). These alternate NYC principal quality measures are created following the same
process as before. The association between principal quality and principal turnover remains
unchanged: a one standard deviation increase in principal quality correlates to a 2.1 percentage
point decrease in the likelihood of principals exiting (Table 3, Column 1). Our NYC finding is
not driven by differences in the composition of the principal quality measure.

16
{Insert Table 3 about here}
Lagged Ratings. Another concern is that teachers may respond differently to questions
in the principal’s last year in their position. Specifically, teachers may rate principals lower
knowing that they are about to leave, or principals may perform less than optimally because they
are about to leave, resulting in lower ratings. To address this “last year” effect, we run our main
model replacing teacher ratings of their principal with their ratings of their principal from the
prior year. Because we do not have the data to do this for the SASS, our analysis is limited to
NYC and necessarily excludes the first year of data.
Using teachers’ lagged ratings of the principal, principal quality continues to be
negatively associated with principal turnover. A one standard deviation increase in principal
quality corresponds to a statistically significant 1.6 percentage point decrease in the likelihood of
a principal exiting (Table 3, Column 2). Although the relationship has attenuated relative to our
main model (a 2.1 percentage point decrease), this decrease appears to be explainable by the
forced exclusion of the 2012-13 academic year and all first-year principals. Estimating our main
model specification on this reduced sample reveals a nearly identical 1.5 percentage point
decrease (Table 3, column 3), implying that teachers do in fact consistently rate principals.
Voluntary turnover. A principal involuntarily exits when the superintendent decides not
to renew the principal’s employment contract. Superintendents of each of NYC’s smaller
community and high school districts have control over principal contracts in their district.
Changes in superintendents from one year to the next may therefore affect principal turnover.
Although the data do not indicate if a principal exits voluntarily or involuntarily, we exploit this
feature in the NYC sample to control for this source of involuntary exit by adding district-by-
year fixed effects to our main model. The result is little changed—a one standard deviation
17
increase in principal quality corresponds to a statistically significant 2.0 percentage point
decrease in the likelihood of the principal exiting (Table 3, column 4), suggesting teacher ratings
predict voluntary exits.
Retirement. Another cause of principal departures, retirement, may also be driving our
results if principal age is correlated with teacher ratings of their leadership. We therefore run our
preferred model for principals not of retirement age, i.e. less than or equal to 55 years of age
(Table 4). In NYC, we exclude the 2015-16 wave as we are missing age data for 11 percent of
the principals. Again, this alternative model specification returns very similar results: a one
standard deviation increase in principal quality is statistically significantly associated with a 2.0
percentage decrease in the likelihood of a principal leaving in NYC (column 1) and a 3.4
percentage point decrease in the SASS sample (column 2). Our main results are not influenced
by age-related turnover.
{Insert Table 4 about here}
Collegiality. It may be that the consistent relationship that we find between principal
quality and principal turnover actually reflects teachers’ general perception about the school’s
environment and climate, and are not specifically evaluative of the principal’s quality. Teachers
could be unhappy with the level of collegiality they feel with other teachers at their school, and
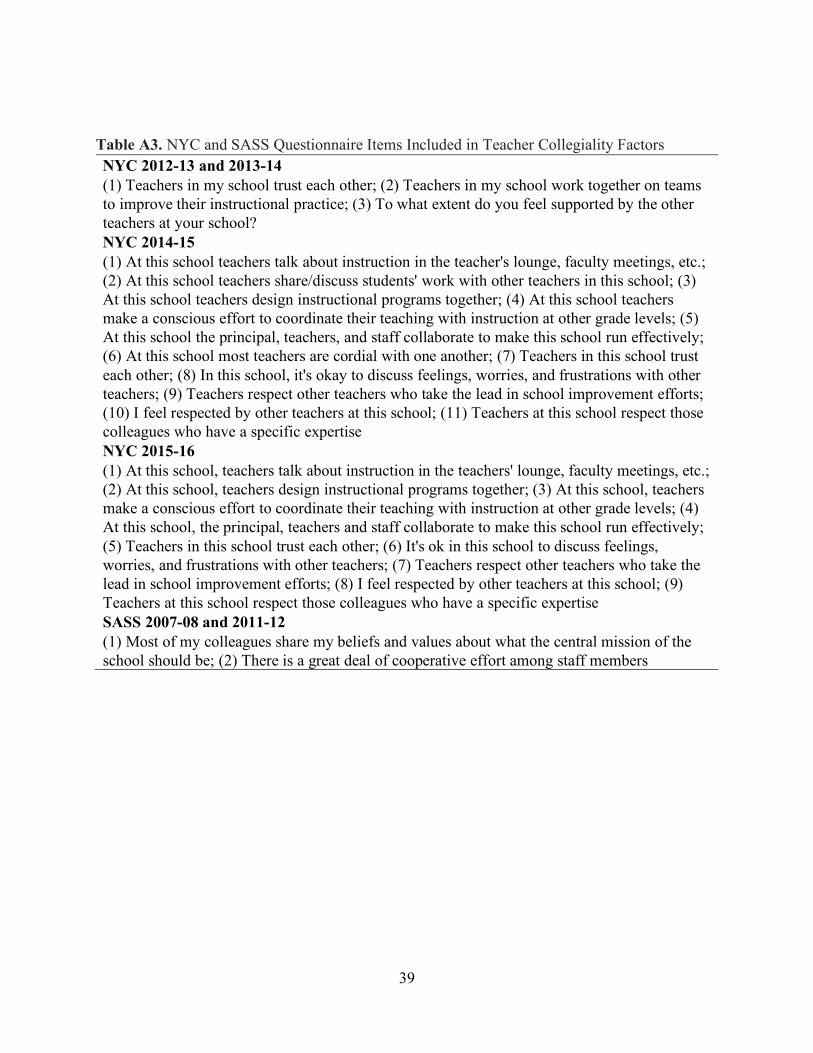
could be expressing this general level of discontent in their ratings of their principal. We
therefore construct a measure of teacher collegiality leveraging the relevant questions from both
the NYC and SASS surveys (see Table A4 in the appendix for the wordings of the survey
questions) using the same method as we did to create principal quality measures. The collegiality
measure for the NYC sample has a mean of 0.47 and a standard deviation of 0.19, and a mean of
0.38 and a standard deviation of 0.27 for the SASS sample.5
18
It is likely that teachers’ general perceptions of the school colors their interaction with
their principal. In fact, teacher ratings of principal quality are highly correlated with teacher
ratings of collegiality. Specifically, in the NYC sample, measures of school climate and principal
quality have a 0.74 correlation, and they share a 0.60 correlation in the SASS sample. To ensure
that teacher ratings of their principals do not include their views about other aspects of the
school, we add the measure of collegiality to our main model.
Yet, again, this alternative model specification has little effect on our main coefficient of
interest (Table 4, Columns 3 and 4). Principal quality continues to have a negative and
statistically significantly association with principal turnover. Teachers are separately identifying
their satisfaction with their principals from their perceptions of other factors of the school.
Further, teacher ratings of collegiality do not predict principal turnover, indicating that
principals’ departures from their roles are likely not influenced by levels of teacher collegiality.
Mobility. Related to whether principal quality is associated with departures is whether
principal quality predicts what they do next. This distinction helps us understand labor market
choices of more and less effective principals, and provides more information on the principal
pipeline and workforce composition. For instance, if less effective principals are more likely to
relocate to other schools, we may just be recycling ineffective principals and not really resolving
the concerns that are attached to lower quality leaders leading schools.
The SASS sample distinguishes principal departures between those that transfer between
schools versus those leaving the principalship altogether.6 We run our main model separately for
principals who move schools (Table 5, Column 1) and for principals who leave the principalship
altogether (Table 5, Column 2), relative to staying, in order to explore this issue. Results show
that a one standard deviation increase in principal quality is correlated with a 1.8 percentage
19
point decrease in the likelihood of principals moving to another school, and a 1.7 percentage
point decrease in the likelihood of principals leaving. Both results are statistically significant,
indicating that while principal quality is related to principal turnover, it does not share a
differential relation with the type of turnover.
{Insert Table 5 about here}
Heterogeneous Effects
Across the many variations of models presented above, we continue to see a consistent
result, lending support to our main effects: principal turnover is negatively correlated with
principal quality—higher quality principals as measured by teacher ratings are less likely to turn
over. We now examine how the association may differ with principal experience, academic year,
and student characteristics. For each factor, we divide principals into groups and estimate
separate models for each group to allow the associations of all the covariates with principal
turnover to vary across the groups.
Experience. Principal quality varies with the number of years at the school (Branch et
al., 2008); however, it is unclear if and how the relationship between principal quality and
principal turnover varies with experience. It could be that as principals gain more experience and
improve in quality, they are comfortable remaining at their same schools. Conversely, more
experienced and higher quality principals may realize their prospects for better jobs, and may
therefore be more likely to leave. To examine this relationship empirically, we evaluate if the
association between principal quality and turnover varies with principals’ levels of experience.
We divide principals into groups by their experience in the school—first year in the school,
second year in the school, third-fourth year in the school, fifth-tenth year in the school, and more
than 10 years in the school.
20
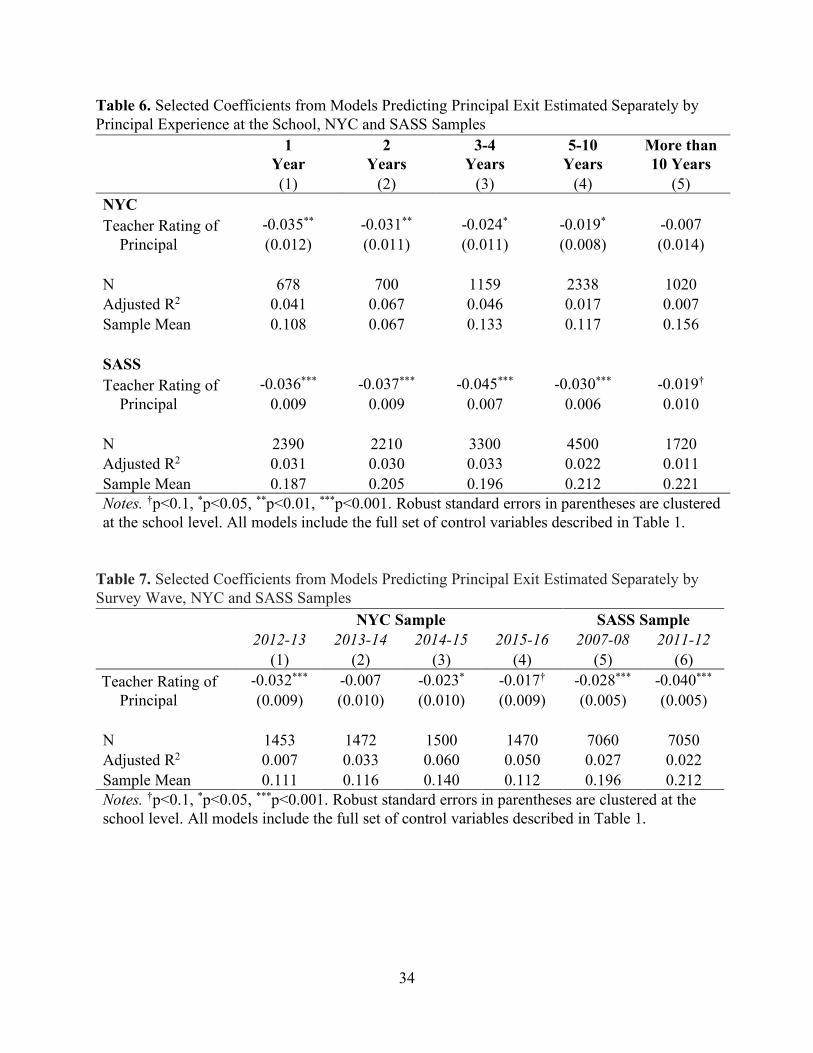
For NYC, we see that for each level of experience other than more than 10 years in the
school, teacher ratings negatively and statistically significantly predict principal turnover (Table
6). A post-estimation test using seemingly unrelated regressions (SUR) shows that the
coefficients from each of these models are in fact not different from each other. We similarly run
fully parametrized models for the SASS (Table 6) and find that across the levels of principal
experience, principal quality consistently and negatively predicts principal turnover. Here, a SUR
test suggests that the coefficients from the models for 3rd-4th year principals and principals who
have more than 10 years of experience at their schools are statistically different. The magnitudes
of the association between principal quality and principal turnover do vary between these two
models, but the directionality remains the same. It does seem that principal quality has a
relatively weaker association with principal turnover for principals who have been at their
schools for more than 10 years in both samples, implying that more experienced principals may
be less responsive to quality indicators when considering their mobility decisions.
{Insert Table 6 about here}
Academic Year. It could also be that principal quality has a differential relationship with
principal turnover over time that the year fixed effects we include in our preferred model
specification are absorbing. For the NYC sample, principal quality is negatively associated with
the likelihood of principal exits across all years (Table 7). However, the relationship is the
largest for 2012-13 (Column 1), not statistically significant for 2013-14 (Column 2), and
statistically significant at the 10 percent level for 2015-16 (Column 4). Results from SUR tests,
however, suggest that none of the coefficient across the years are statistically significantly
different from each other, indicating that while the relationship of interest may be stronger in

21
some years than in others, it appears to persist across all years. The SASS models show a similar
pattern of results (columns 5 and 6).
{Insert Table 7 about here}
Student Characteristics. Principals tend to leave schools that serve greater proportions
of minority and low-income students for schools that are relatively more “advantaged” (Loeb et
al., 2010). If higher quality principals are more likely to leave these high-need schools, the
adverse effects of principal turnover may further harm the students in these schools. To
understand the extent of this possibility, we examine whether our main finding varies by the
student populations that schools serve.
We explore the relationship between principal quality and principal turnover by levels of
student characteristics. For both school minority student share and school free and reduced-price
lunch share, we group schools into 20-percentage-point groups (0-20%, 21-40%, 41-60%, 61-
80%, and 81-100%). We only observe school free and reduced-price lunch share in NYC where
fewer than 5 percent of schools fall into the lowest group (20 percent or fewer students eligible).
We therefore collapse the first two groups into a single group.
Our results show limited heterogeneity in the association between principal quality and
principal turnover across school minority student share, but the results are not consistent across
the two samples. For NYC, principal quality is only statistically significantly correlated with
principal turnover for schools with the greatest concentration of minority students (Table 8,
column 5): a one standard deviation increase in principal quality is associated with a 2.9
percentage point decrease in the likelihood of the principal exiting. The SUR tests tell us that,
while the point estimates vary across the groups, principal quality is only differentially
associated with principal turnover between the schools with the highest and lowest

22
concentrations of minority students – higher quality principals are less likely than lower quality
principals to turn over in high minority share schools than in low minority share schools. This is
the opposite of the pattern found in the teacher literature. None of the other point estimates,
however, differ statistically from each other, implying that the relationship persists across most
schools. In the SASS sample, on the other hand, principal quality is negatively and statistically
significantly correlated with principal turnover across all the groups with the magnitude of this
association ranging between a 2.1 and a 5.9 percentage point decrease (Table 8). Here again,
most of the SUR tests indicate that principal quality is not differentially associated with turnover
across school minority share. The exceptions, however, mirror the teacher literature. The
difference in the turnover probability between a higher and lower quality principal is smaller in
schools with 41%-60% minority students than in schools with fewer minority students (0-20%
and 21-40%), echoing the teacher literature.
{Insert Table 8 about here}
We find no evidence that principal quality is differentially associated with principal
turnover based on the socio-economic status of the students in a school (Table 9). Although the
association is only significant in two of the four groups, none of the coefficients differ
statistically from each other, implying that principal quality has a similar negative relationship
with principal turnover across schools in these groups.
{Insert Table 9 about here}
Discussion
Our analyses show consistent evidence that principals who receive higher quality ratings
from their teachers are less likely to leave their positions than those who receive relatively lower
quality ratings. The principalship is a multifaceted job, and as the questions we used to construct

23
the principal quality measures across the surveys indicate, we may be measuring different
aspects of that job. Despite this, our findings are strikingly consistent. Teacher ratings of
principals’ leadership explains about one-fifth of the total variation in school departures. Schools
are, on average, more likely to lose principals who are relatively less effective, suggesting, that,
to the extent that principal turnover is a problem, it does not appear to be driven by higher
quality principals.
Our main result also echoes findings from the teacher literature, where more effective
teachers are less likely to leave schools (Boyd, Lankford, Loeb, Ronfeldt, & Wyckoff, 2011;
Author, 2011). The similarities suggest that more effective school personnel, on average, are
more likely to remain in their roles at their schools. We find no consistent evidence that higher
quality principals are differentially likely to exit more versus less disadvantaged schools.
Although we are unable to explore the mechanism through which this association operates,
principals are either aware of their teachers’ perceptions of them or their sense of their quality
maps onto teachers’ perceptions and they make labor market decisions accordingly.
Regardless of how the association operates, our findings offer encouraging news for the
field along with some policy implications. If higher quality principals are in fact more likely to
remain at their schools, broad emphasis on reducing overall principal turnover might be
somewhat misplaced and districts should instead focus on recruiting more higher quality
principals, which might naturally reduce principal turnover and the related negative
consequences. Our findings indicate that at least some principal turnover appears “well-
informed”, i.e. lower quality principals are leaving schools, vacating the position to perhaps be
filled by a higher quality principal.
24
This is one of the key policy-relevant question this study leaves unanswered. Who are
principals replaced by when they leave? If they are replaced by principals of similar quality, then
students and teachers at those schools are not any better off having the principal leave.
Understanding the quality of replacement principals will help add more nuance to the issue of
principal turnover. A related issue is whether principal effectiveness is situational. It could be
that a principal who is ineffective in one school is effective in another. Following principals who
switch schools would allow us to begin examining these questions and shed more light on the
complex relationship between principal turnover and principal quality. Unfortunately, our current
data do not include enough such transitions to warrant an exploration.
This paper is one of only a few to shed light on the interplay between principal quality
and principal turnover. Higher quality principals are less likely to exit their schools, implying
that at least some of the principal turnover we observe in schools might be part of an efficient
system in which ineffective principals are sorting (voluntarily or involuntarily) into other
positions. Moving forward, research should focus on enriching our understanding of differential
attrition patterns so that efforts to retain principals can be better targeted. Researchers should
also continue to seek ways to target improvement of existing principals. Such efforts would
reflect the findings presented in this paper and ultimately lead to better outcomes for students.
25
Notes
1 All sample sizes for the SASS are rounded to the nearest 10 to comply with NCES reporting
requirements.
2 Up until 2013, NYCDOE assigned schools grades based on a number of topics, including
“School Environment.” The NYC School Surveys would serve as the basis for determining these
grades. These grades would then feed into the creation of a Progress Report for each school.
After 2013, NYCDOE replaced the Progress Reports with School Quality Reports, which are
solely based on the results of the NYC School Surveys. The Progress Reports were used as a
school accountability tool, while the Quality Reports are used to create school improvement
plans and are available online for the public to see.
3 There are a few questions that are also rated on a four-point Likert scale but are worded
differently (4 = to a great extent and 1 = to no extent). When converting these to binaries, we
follow the same rule where 1 = to a great extent; 0 otherwise. See the appendix for more
information on the creation of these measures.
4 We also confirm our results using logit regressions. Available from authors on request.
5 Upon conducting a factor analysis on collegiality questions for each year for NYC, only one
factor has an eigenvalue greater than 1. Cronbach’s alphas for these questions are 0.7 for 2013
and 2014, and greater than 0.9 for 2015 and 2016. Collegiality questions on the SASS also load
onto only one factor with an eigenvalue greater than 1, and alpha reliability coefficients for these
questions in each wave are greater than 0.72.
6 While we are able to distinguish principal exits as movers versus leavers, there are too few
movers to run a separate model—only 10-25 principals move to the principalship at another
school in any given year.

26
References
Goldhaber, D., Gross, B., & Player, D. (2011). Teacher career paths, teacher quality, and
persistence in the classroom: Are public schools keeping their best? Journal of Policy
Analysis and Management, 30(1), 57-87.
Allensworth, E., Ponisciak, S., & Mazzeo, C. (2009). The schools teachers leave: teacher
mobility in Chicago public schools. Consortium on Chicago School Research.
Béteille, T., Kalogrides, D., & Loeb, S. (2012). Stepping stones: Principal career paths and
school outcomes. Social Science Research, 41(4), 904-919.
Branch, G. F., Hanushek, E. A., & Rivkin, S. G. (2008). Principal turnover and
effectiveness. Unpublished manuscript.
Branch, G. F., Hanushek, E. A., & Rivkin, S. G. (2012). Estimating the effect of leaders on
public sector productivity: The case of school principals (No. w17803). National Bureau
of Economic Research.
Boyd, D., Grossman, P., Ing, M., Lankford, H., Loeb, S., & Wyckoff, J. (2011). The influence of
school administrators on teacher retention decisions. American Educational Research
Journal, 48(2), 303-333.
Boyd, D., Lankford, H., Loeb, S., Ronfeldt, M., & Wyckoff, J. (2011). The role of teacher
quality in retention and hiring: Using applications to transfer to uncover preferences of
teachers and schools. Journal of Policy Analysis and Management, 30(1), 88-110.
Callegaro, M. (2008). Social desirability. Encyclopedia of survey research methods, 825-826.
Chiang, H., Lipscomb, S., & Gill, B. (2016). Is school value added indicative of principal
quality? Education Finance and Policy, 11(3), 283-309.
27
Clifford, M., & Ross, S. (2012). Rethinking principal evaluation: A new paradigm informed by
research and practice. National Association of Elementary School Principals and the
National Association of Secondary School Principals.
Cox, S., Parmer, R., Spiegelman, M., Strizek, G., & Thomas, T. (2017). Survey Documentation
for the 2011–12 Schools and Staffing Survey. National Center for Education Statistics,
Institute of Education Sciences, US Department of Education. Washington, DC.
DeAngelis, K. J., & White, B. R. (2011). Principal Turnover in Illinois Public Schools, 2001-
2008. Policy Research: IERC 2011-1. Illinois Education Research Council.
DoE, U. S. (2009). Race to the Top program: Executive summary. Race to the Top Fund.
Doll, B. (2010). Positive school climate. Principal Leadership, 11(4), 12-16.
Fuller, E. J., & Hollingworth, L. (2014). A bridge too far? Challenges in evaluating principal
effectiveness. Educational Administration Quarterly, 50(3), 466-499.
Fuller, E. J., & Young, M. D. (2009). Tenure and retention of newly hired principals in Texas.
Austin, TX: University Council for Educational Administration, Department of
Educational Administration, University of Texas at Austin.
Gates, S. M., Ringel, J. S., Santibanez, L., Guarino, C., Ghosh-Dastidar, B., & Brown, A. (2006).
Mobility and turnover among school principals. Economics of Education Review, 25(3),
289-302.
Glanz, J., Shulman, V., & Sullivan, S. (2007). Impact of Instructional Supervision on Student
Achievement: Can We Make the Connection? Online Submission.
Goldring, E., Cravens, X. C., Murphy, J., Porter, A. C., Elliott, S. N., & Carson, B. (2009). The
evaluation of principals: What and how do states and urban districts assess
leadership? The Elementary School Journal, 110(1), 19-39.
28
Grissom, J. A. (2011). Can good principals keep teachers in disadvantaged schools? Linking
principal effectiveness to teacher satisfaction and turnover in hard-to-staff
environments. Teachers College Record, 113(11), 2552-2585.
Grissom, J. A., & Bartanen, B. (2018). Principal Effectiveness and Principal
Turnover. Education Finance and Policy, (Just Accepted), 1-63.
Grissom, J. A., Kalogrides, D., & Loeb, S. (2015). Using student test scores to measure principal
performance. Educational Evaluation and Policy Analysis, 37(1), 3-28.
Grissom, J. A., & Loeb, S. (2011). Triangulating principal effectiveness: How perspectives of
parents, teachers, and assistant principals identify the central importance of managerial
skills. American Educational Research Journal, 48(5), 1091-1123.
Hallinger, P., & Heck, R. H. (1998). Exploring the principal's contribution to school
effectiveness: 1980-1995. School effectiveness and school improvement, 9(2), 157-191.
Harris, D. N., Rutledge, S. A., Ingle, W. K., & Thompson, C. C. (2010). Mix and match: What
principals really look for when hiring teachers. Education Finance and Policy, 5(2), 228-
246.
Hitt, D. H., & Tucker, P. D. (2016). Systematic review of key leader practices found to influence
student achievement: A unified framework. Review of Educational Research, 86(2), 531-
569.
Horng, E. L., Klasik, D., & Loeb, S. (2010). Principal's time use and school
effectiveness. American Journal of Education, 116(4), 491-523.
Kraft, M. A., Marinell, W. H., & Shen-Wei Yee, D. (2016). School organizational contexts,
teacher turnover, and student achievement: Evidence from panel data. American
Educational Research Journal, 53(5), 1411-1449.
29
Leithwood, K., Louis, K. S., Anderson, S., & Wahlstrom, K. (2004). How leadership influences
student learning.
Loeb, S., & Reininger, M. (2004). Public Policy and Teacher Labor Markets. What We Know
and Why It Matters. Education Policy Center.
Loeb, S., Kalogrides, D., & Béteille, T. (2012). Effective schools: Teacher hiring, assignment,
development, and retention. Education Finance and Policy, 7(3), 269-304.
Loeb, S., Kalogrides, D., & Horng, E. L. (2010). Principal preferences and the uneven
distribution of principals across schools. Educational Evaluation and Policy
Analysis, 32(2), 205-229.
Mascall, B., & Leithwood, K. (2010). Investing in leadership: The district's role in managing
principal turnover. Leadership and Policy in Schools, 9(4), 367-383.
McCullough, M., Lipscomb, S., Chiang, H., Gill, B., & Cheban, I. (2016). Measuring School
Leaders' Effectiveness: Final Report from a Multiyear Pilot of Pennsylvania's Framework
for Leadership. REL 2016-106. Regional Educational Laboratory Mid-Atlantic.
Miller, A. (2013). Principal turnover and student achievement. Economics of Education
Review, 36, 60-72.
NYC School Survey. (n.d.). Retrieved from https://www.schools.nyc.gov/about-
us/reports/school-quality/nyc-school-survey.
Ronfeldt, M., Loeb, S., & Wyckoff, J. (2013). How teacher turnover harms student
achievement. American Educational Research Journal, 50(1), 4-36.
Seashore Louis, K., Dretzke, B., & Wahlstrom, K. (2010). How does leadership affect student
achievement? Results from a national US survey. School effectiveness and school
improvement, 21(3), 315-336.

30
Sebastian, J., & Allensworth, E. (2012). The influence of principal leadership on classroom
instruction and student learning: A study of mediated pathways to learning. Educational
Administration Quarterly, 48(4), 626-663.
Waddell, J. H. (2010). Fostering relationships to increase teacher retention in urban
schools. Journal of Curriculum and Instruction, 4(1), 70-85.
Waters, T., Marzano, R. J., & McNulty, B. (2003). Balanced Leadership: What 30 Years of
Research Tells Us about the Effect of Leadership on Student Achievement. A Working
Paper.
Yan, R. (2019). The influence of working conditions on principal turnover in K-12 public
schools. Educational Administration Quarterly, 1-34. doi: 10.1177/0013161X19840391
31
Table 1. Variable Means and Standard Deviations, NYC and SASS Samples NYC SASS NYC SASS
Principal Turns Over 0.120 0.204 School Characteristics (0.325) (0.403) Percent Students Minority 0.366 Teacher Rating of
Principal 0.450 0.439 (0.329)
(0.201) (0.248) Percent Students Black 0.321 Principal Characteristics (0.276) Principal Experience at
Other School 0.398 3.239 Percent Students Hispanic 0.422
(1.468) (5.151) (0.256) Principal Experience at
This School 5.621 4.338 Percent Students White 0.124
(4.347) (4.717) (0.191) Principal Female 0.678 0.415 Percent Students Race
Other 0.133
(0.467) (0.493) (0.178) Principal Minority 0.133 Percent Students Free and
Reduced Price Lunch 0.804
(0.340) (0.194) Principal Black 0.291 Elementary School 0.408 0.490 (0.454) (0.491) (0.500) Principal White 0.484 Secondary School 0.382 (0.500) (0.486) Principal Hispanic 0.186 Middle School 0.178 (0.389) (0.382) Principal Race Other 0.039 High School 0.254 (0.193) (0.435) Years Teacher at Other
School 3.093 Junior High School 0.058
(1.619) (0.234) Years Teacher at This
School 6.715 PreK-8 School 0.095
(3.378) (0.293) Teacher Characteristics PreK-12 School 0.007 Teacher Female 0.763 (0.082) (0.160) Elementary and Secondary
School 0.129
Teacher Minority 0.130 (0.335) (0.214) School Met AYP 0.424 0.608 Teacher Black 0.213 (0.494) (0.488) (0.213) City 0.210 Teacher White 0.551 (0.407) (0.233) Suburb 0.234 Teacher Hispanic 0.149 (0.424) (0.135) Town 0.180 Teacher Race Other 0.087 (0.385) (0.080) Rural 0.375 Log of Teacher Salary 11.197 (0.484) (0.093) Note. The NYC sample includes 5,895 schools and the SASS sample includes 14,190 schools.
32
Table 2. Selected Coefficients from Models Predicting Principal Exit, NYC and SASS Samples (1) (2) (3) (4) (5) (6)
NYC Teacher Rating of
Principal -0.024*** -0.024*** -0.024*** -0.024*** -0.022*** -0.021*** (0.004) (0.004) (0.005) (0.005) (0.005) (0.005)
N 5895 5895 5895 5895 5895 5895 Adjusted R2 0.005 0.006 0.014 0.026 0.027 0.035
SASS Teacher Rating of
Principal -0.035*** -0.035*** -0.033*** -0.033*** -0.032*** -0.034*** (0.003) (0.003) (0.003) (0.003) (0.003) (0.004)
N 14120 14120 14120 14120 14120 14120 Adjusted R2 0.007 0.008 0.013 0.016 0.018 0.023
Year Fixed Effects Yes Yes Yes Yes Yes Principal Chars Yes Yes Yes Yes Teacher Chars Yes Yes Yes School Chars Yes Yes District/State Fixed
Effects Yes
Notes. ***p<0.001. Robust standard errors in parentheses are clustered at the school level. Teacher ratings have been standardized. See Table 1 for a description of the control variables.
Table 3. Selected Coefficients from Models with Alternative Specifications Predicting Principal Exit, NYC Sample
Similar Questions to
SASS
Lagged Teacher Ratings
Current Ratings on
Lagged Sample
District-by-Year Fixed
Effects (1) (2) (3) (4) Teacher Rating of
Principal -0.021*** -0.016* -0.015* -0.020*** (0.005) (0.006) (0.006) (0.005)
N 5895 3857 3857 5895 Adjusted R2 0.035 0.045 0.045 0.035 Sample Mean 0.120 0.125 0.125 0.120 Notes. *p<0.05, ***p<0.001. Robust standard errors in parentheses are clustered at the school level. All models include the full set of control variables described in Table 1.

33
Table 4. Selected Coefficients from Models with Alternative Specifications Predicting Principal Exit, NYC and SASS Samples
Restrict Sample to Non-
Retirement-Age Principals Include Teacher Ratings of
Collegiality as Control NYC SASS NYC SASS (1) (2) (3) (4) Teacher Rating of
Principal -0.020*** -0.034*** -0.020** -0.040*** (0.005) (0.004) (0.007) (0.004)
N 4203 10530 5895 14120 Adjusted R2 0.029 0.019 0.035 0.024 Sample Mean 0.090 0.183 0.120 0.204 Notes. **p<0.01, ***p<0.001. Robust standard errors in parentheses are clustered at the school level. All models include the full set of control variables described in Table 1.
Table 5. Selected Coefficients from Models Predicting Principals Moving Across Schools or Leaving the Principalship, SASS Sample Move vs. Stay Leave vs. Stay (1) (2) Teacher Rating of
Principal -0.018*** -0.017*** (0.003) (0.003)
N 12150 12870 Adjusted R2 0.014 0.019 Sample Mean 0.075 0.127 Notes. ***p<0.001. Robust standard errors in parentheses are clustered at the school level. All models include the full set of control variables described in Table 1.
34
Table 6. Selected Coefficients from Models Predicting Principal Exit Estimated Separately by Principal Experience at the School, NYC and SASS Samples
1
Year 2
Years 3-4
Years 5-10
Years More than 10 Years
(1) (2) (3) (4) (5) NYC Teacher Rating of
Principal -0.035** -0.031** -0.024* -0.019* -0.007 (0.012) (0.011) (0.011) (0.008) (0.014)
N 678 700 1159 2338 1020 Adjusted R2 0.041 0.067 0.046 0.017 0.007 Sample Mean 0.108 0.067 0.133 0.117 0.156 SASS Teacher Rating of
Principal -0.036*** -0.037*** -0.045*** -0.030*** -0.019†
0.009 0.009 0.007 0.006 0.010 N 2390 2210 3300 4500 1720 Adjusted R2 0.031 0.030 0.033 0.022 0.011 Sample Mean 0.187 0.205 0.196 0.212 0.221 Notes. †p<0.1, *p<0.05, **p<0.01, ***p<0.001. Robust standard errors in parentheses are clustered at the school level. All models include the full set of control variables described in Table 1.
Table 7. Selected Coefficients from Models Predicting Principal Exit Estimated Separately by Survey Wave, NYC and SASS Samples NYC Sample SASS Sample 2012-13 2013-14 2014-15 2015-16 2007-08 2011-12 (1) (2) (3) (4) (5) (6) Teacher Rating of
Principal -0.032*** -0.007 -0.023* -0.017† -0.028*** -0.040*** (0.009) (0.010) (0.010) (0.009) (0.005) (0.005)
N 1453 1472 1500 1470 7060 7050 Adjusted R2 0.007 0.033 0.060 0.050 0.027 0.022 Sample Mean 0.111 0.116 0.140 0.112 0.196 0.212 Notes. †p<0.1, *p<0.05, ***p<0.001. Robust standard errors in parentheses are clustered at the school level. All models include the full set of control variables described in Table 1.

35
Table 8. Selected Coefficients from Models Predicting Principal Exit Estimated Separately by School Minority Share, NYC and SASS Samples 0-20% 21-40% 41-60% 61-80% 81-100% (1) (2) (3) (4) (5) NYC Teacher Rating of
Principal 0.004 -0.020 -0.021 -0.018 -0.029***
(0.016) (0.013) (0.017) (0.015) (0.006) N 431 672 541 609 3637 Adjusted R2 0.040 0.053 0.040 0.016 0.045 Sample Mean 0.109 0.085 0.104 0.108 0.132 SASS Teacher Rating of
Principal -0.029*** -0.037*** -0.021* -0.059*** -0.039*** (0.005) (0.008) (0.010) (0.013) (0.009)
N 6310 2530 1740 1170 2370 Adjusted R2 0.014 0.022 0.011 0.034 0.039 Sample Mean 0.184 0.186 0.212 0.235 0.255 Notes. *p<0.05, ***p<0.001. Robust standard errors in parentheses are clustered at the school level. All models include the full set of control variables described in Table 1.
Table 9. Selected Coefficients from Models Predicting Principal Exit Estimated Separately by School Free/Reduced-Price Lunch Share, NYC Sample 0-40% 41-60% 61-80% 81-100% (1) (2) (3) (4) Teacher Rating of
Principal -0.012 -0.024 -0.022* -0.023*** (0.019) (0.019) (0.011) (0.006)
N 339 440 1303 3810 Adjusted R2 0.008 0.055 0.027 0.034 Sample Mean 0.097 0.136 0.122 0.119 Notes. *p<0.05, ***p<0.001. Robust standard errors in parentheses are clustered at the school level. All models include the full set of control variables described in Table 1.

36
Appendix
New York City and Schools and Staffing Survey Factor Analysis
The principalship is a multifaceted job, making the measurement of principal quality for
all aspects of leadership a challenging task. Surveys like NYC and the SASS therefore ask a
number of questions to get at least some of these facets. We combine all questions pertaining to
the principal into a single measure of principal quality for both the NYC and the SASS samples.
To assess whether these questions are capturing one or more dimensions of principal leadership,
we follow the approach of Kraft, Marinell, and Yee (2016) and conduct a factor analysis on
teacher ratings of their principals for each survey wave. We use a principal component analysis
to identify the number of leadership dimensions towards which the questions may be converging.
For each wave, all questions fall into a single component (eigenvalue > 1) which explains
between 83 and 86 percent of the total variance. We then apply both orthogonal as well as
oblique rotations to further differentiate between the latent factors that these questions may be
capturing. For the 2012-13 and 2013-14 school years for NYC, both rotations continue to
identify only one underlying measure of leadership quality. For the 2014-15 and 2015-16 school
years, however, both rotations present two dimensions of leadership quality. Upon examining the
relevant questions for these years, we find that based on the factor loadings, questions can be
categorized either as measures of principals’ general management skills or as measures of
principals’ instructional leadership abilities. The second component for both years has an
eigenvalue that is barely greater than one (1.0218 for 2015 and 1.0702 for 2016), relative to the
eigenvalue for the first component (12.9956 for 2015 and 12.8349 for 2016). Both components
for both years also correlate at values of around 0.8. Given this information, we collapse all
questions for each year onto one dimension of leadership quality. For the SASS sample, for both
37
waves, orthogonal and oblique rotations continue to identify only one latent construct of
principal quality.
Table A1. NYC Questionnaire Items Included in Teacher Ratings of Principal Factors by Survey Wave 2012-13 (1*) The principal at my school communicates a clear vision for our school; (2) The principal at my school understands how children learn; (3) The principal at my school knows what's going on in my classroom; (4) The principal at my school participates in instructional planning with teachers; (5) The principal at my school encourages open communication on important school issues; (6) The principal at my school makes clear to the staff his/her expectations for meeting instructional goals; (7*) The principal at my school is an effective manager who makes the school run smoothly; (8) School leaders provide time for collaboration among teachers; (9) School leaders give me regular and helpful feedback about my teaching; (10) School leaders place a high priority on the quality of teaching; (11*) School leaders publicly recognize teachers for their accomplishments; (12) School leaders provide teachers with leadership opportunities; (13*) To what extent do you feel supported by your principal?; (14) I feel respected by the principal at my school; (15) I trust the principal at his or her word; (16) The principal at my school places the learning needs of children ahead of personal and political interests; (17) School leaders visit classrooms to observe the quality of teaching at my school 2013-14 (1*) The principal at my school communicates a clear vision for our school; (2) The principal at my school understands how children learn; (3) The principal at my school knows what's going on in my classroom; (4) The principal at my school participates in instructional planning with teachers; (5) The principal at my school encourages open communication on important school issues; (6) The principal at my school makes clear to the staff his/her expectations for meeting instructional goals; (7*) The principal at my school is an effective manager who makes the school run smoothly; (8) School leaders provide time for collaboration among teachers; (9) School leaders give me helpful feedback about my teaching; (10) School leaders place a high priority on the quality of teaching; (11*) School leaders publicly recognize teachers for their accomplishments; (12) School leaders provide teachers with leadership opportunities; (13*) To what extent do you feel supported by your principal?
38
2014-15 (1) The principal at this school (not asst principal) makes clear to the staff his/her expectations for meeting instructional goals; (2*) The principal at this school (not asst principal) communicates a clear vision for this school; (3) The principal at this school (not asst principal) understands how children learn; (4) The principal at this school (not asst principal) sets high standards for student learning; (5) The principal at this school (not asst principal) sets clear expectations for teachers about implementing what they have learned in professional development; (6) The principal at this school (not asst principal) carefully tracks student academic progress; (7) The principal at this school (not asst principal) knows what's going on in my classroom; (8) The principal at this school (not asst principal) participates in instructional planning with teams of teachers; (9) I feel respected by the principal at this school; (10*) The principal at this school is an effective manager who makes the school run smoothly; (11) The principal has confidence in the expertise of the teachers at this school; (12) I trust the principal at his/her word; (13) At this school, it's ok to discuss feelings, worries, and frustrations with the principal; (14) The principal takes a personal interest in the professional development of teachers; (15) The principal looks out for the personal welfare of the staff members; (16) The principal places the needs of children ahead of personal interests 2015-16
(1) The principal/school leader at this school makes clear to the staff his/her expectations for meeting instructional goals; (2) The principal/school leader at this school communicates a clear vision for this school; (3) The principal/school leader at this school understands how children learn; (4) The principal/school leader at this school sets high standards for student learning; (5) The principal/school leader at this school sets clear expectations for teachers about implementing what they have learned in professional development; (6) The principal/school leader at this school carefully tracks student academic progress; (7) The principal/school leader at this school knows what's going on in my classroom; (8) The principal/school leader at this school participates in instructional planning with teams of teachers; (9) I feel respected by the principal at this school; (10*) The principal at this school is an effective manager who makes the school run smoothly; (11) The principal has confidence in the expertise of the teachers at this school; (12) I trust the principal/school leader at his/her word (to do what he/she says that he or she will do); (13) At this school, it's ok to discuss feelings, worries, and frustration with the principal; (14) The principal takes a personal interest in the professional development of teachers; (15) The principal looks out for the personal welfare of the staff members; (16) The principal places the needs of children ahead of personal interests; (17) The principal/school leader encourages feedback through regular meetings with parents and teacher leaders Notes. * Indicates questions that map onto the SASS questions listed in Table A2.
Table A2. SASS Questionnaire Items Included in Teacher Ratings, 2007-08 and 2011-12 (1) The school administration’s behavior toward the staff is supportive and encouraging; (2) My principal enforces school rules for student conduct and backs me up when I need it; (3) The principal knows what kind of school he or she wants and has communicated it to the staff; (4) In this school, staff members are recognized for a job well done; (5) I like the way things are run at this school
39
Table A3. NYC and SASS Questionnaire Items Included in Teacher Collegiality Factors NYC 2012-13 and 2013-14 (1) Teachers in my school trust each other; (2) Teachers in my school work together on teams to improve their instructional practice; (3) To what extent do you feel supported by the other teachers at your school? NYC 2014-15 (1) At this school teachers talk about instruction in the teacher's lounge, faculty meetings, etc.; (2) At this school teachers share/discuss students' work with other teachers in this school; (3) At this school teachers design instructional programs together; (4) At this school teachers make a conscious effort to coordinate their teaching with instruction at other grade levels; (5) At this school the principal, teachers, and staff collaborate to make this school run effectively; (6) At this school most teachers are cordial with one another; (7) Teachers in this school trust each other; (8) In this school, it's okay to discuss feelings, worries, and frustrations with other teachers; (9) Teachers respect other teachers who take the lead in school improvement efforts; (10) I feel respected by other teachers at this school; (11) Teachers at this school respect those colleagues who have a specific expertise NYC 2015-16 (1) At this school, teachers talk about instruction in the teachers' lounge, faculty meetings, etc.; (2) At this school, teachers design instructional programs together; (3) At this school, teachers make a conscious effort to coordinate their teaching with instruction at other grade levels; (4) At this school, the principal, teachers and staff collaborate to make this school run effectively; (5) Teachers in this school trust each other; (6) It's ok in this school to discuss feelings, worries, and frustrations with other teachers; (7) Teachers respect other teachers who take the lead in school improvement efforts; (8) I feel respected by other teachers at this school; (9) Teachers at this school respect those colleagues who have a specific expertise SASS 2007-08 and 2011-12 (1) Most of my colleagues share my beliefs and values about what the central mission of the school should be; (2) There is a great deal of cooperative effort among staff members