working paper series - unu-merit factors of competitiveness. the gci measures competitiveness as the...
TRANSCRIPT

#2017-047
Institutional diversity in the Euro area: any evidence of convergence? Salvador Pérez‐Moreno, Elena Bárcena‐Martín and Jo Ritzen
Maastricht Economic and social Research institute on Innovation and Technology (UNU‐MERIT) email: [email protected] | website: http://www.merit.unu.edu Maastricht Graduate School of Governance (MGSoG) email: info‐[email protected] | website: http://www.maastrichtuniversity.nl/governance Boschstraat 24, 6211 AX Maastricht, The Netherlands Tel: (31) (43) 388 44 00
Working Paper Series

UNU-MERIT Working Papers ISSN 1871-9872
Maastricht Economic and social Research Institute on Innovation and Technology UNU-MERIT Maastricht Graduate School of Governance MGSoG
UNU-MERIT Working Papers intend to disseminate preliminary results of research carried out at UNU-MERIT and MGSoG to stimulate discussion on the issues raised.

1
Institutional diversity in the Euro area: any evidence of convergence?
Salvador Pérez-Moreno
[email protected] University of Malaga
Elena Bárcena-Martín
[email protected] University of Malaga
Jo Ritzen
[email protected] Maastricht University
Abstract
The institutional characteristics of the 19 Euro countries, such as Government efficiency
or undue influence or corporate ethics, have diverged in the period 2006-2015. This endangers
the sustainability of the EMU, as institutional characteristics are an important element of
competitiveness. We find that the overall inequality in the state of institutions across the EMU,
as measured by the Gini coefficient, increased. The institutional changes across Euro area
countries are linked both to the differences in the intensity of the financial and economic crisis
(likely to have a two-way causality) as well as the policy responses in terms of fiscal
consolidation applied. The empirical findings tend to support the call for structural reforms
enhancing institutional quality in order to shorten the institutional gap between ‘core’ and
‘periphery’ Euro area countries.
Keywords: institutions, beta-convergence, inequality, Euro area, competitiveness
JEL codes: O43, 047, O52

2
1. Introduction
Since the onset of The Great Recession in 2007, the Euro area has been hit by numerous
interrelated shocks leading to banking crises and sovereign debt crises in several Euro
countries. The Euro zone ran the risk of falling apart. This demonstrated the weakness of the
Economic and Monetary Union (EMU): it did not exhibit sufficiently the characteristics of an
optimal currency area.
In 2015 the so-called Five Presidents' Report set out ambitious plans on how to deepen
the EMU and how to complete it by latest 2025, revived in the “State of the Union” of the
President of the European Commission, Juncker, in September 2017. In this address Juncker
even went further to suggest that all EU countries ought to be taken into the Euro sometime in
the near future.
The EMU would be strengthened through structural change achieving similarly resilient
economic structures throughout the Euro area (European Commission 2015) and thus boosting
competitiveness. In the past the substantial differences in competitiveness within the Euro area,
had not only been a cause of concern for individual Member States, but had also stood in the
way of a proper functioning of EMU and for the professed European ideal of an ever deeper
integration. This can only be achieved with a certain degree of convergence (Ritzen 2017).
Globalization and increasing economic interdependence have contributed to this strong
emphasis on national competitiveness despite the relative ambiguity of this term (see e.g.
Boltho 1996; Porter et al. 2008) and the scepticism of some notable economist on the
application of this concept to countries (see e.g. Krugman 1994, 1996). The broader concept of
competitiveness deals with the role of productivity and the capacity of countries to compete in
world markets to improve their economic performance and standards of living (see e.g. Porter
1990, De Grauwe 2010). One of the most widely used competitiveness indicators of a country -
among academics and policy-makers- is the Global Competitiveness Index (GCI), produced by
the Word Economic Forum (WEF) since 2004. This index focuses on both macroeconomic and
microeconomic factors of competitiveness. The GCI measures competitiveness as the set of
institutions, policies, and factors that determine the level of productivity of a country (see e.g.
Schwab 2015). It combines a set of indicators that capture diverse aspects that matter for
productivity. These are grouped into 12 areas or pillars.
Our analysis focuses on the first one: the institutional environment and the quality of
public and private institutions in the country, like the state of property rights, corruption or

3
accountability of private institutions. These variables are generally not part of the Country
Specific Recommendations originating from the EU’s new responsibilities which were
developed to safeguard the Stability and Growth Pact (SGP). We use data from 2006 and 2015.
From its inception, the EMU has been viewed as an instrument to achieve real
convergence in competitiveness departing from some nominal convergence requirements,
defined through the SGP. Gradually convergence in macroeconomic policies was regarded as a
prerequisite to accomplish convergence in competitiveness, as expressed in the formal adoption
of new provisions and one directive (the “Six Pack”) to the SGP, with enhanced surveillance
(the “Two Pack”). The European Central Bank (ECB) (2015, 2016) has put the spotlight on the
importance of sound institutions for the resilience and the long-term prosperity of the Euro
area, highlighting the need for convergence in the quality of national institutions. Institutional
diversity partly reflects the singularities of each society. At the same time, increasing cross-
country institutional differences undermine the smooth functioning of the EMU. The countries
with the lower-quality institutions countries become more vulnerable for adverse shocks and
make thereby the Euro area as a whole more susceptible to shocks.
In this paper we first assess whether the changes in the state of institutions show
convergence across Euro area countries between 2006 and 2015. Second, we estimate the
overall inequality in the institutional quality across the EMU, as measured by the Gini
coefficient, and the contribution of each country to overall inequality. We use the benchmark of
the country with the highest institutional quality to identify the countries that are the most
distant. Finally, according to these country contributions, we analyse possible distinct patterns
of convergence between ‘core’ and ‘periphery’ Euro area countries. Institutional changes across
Euro area countries are also related to both the differences in the intensity of the financial and
economic crisis, as well as the policy responses in terms of fiscal consolidation applied by the
respective national governments.
The remainder of the paper proceeds as follows. Section 2 discusses expectations on
institutional convergence/divergence across Euro area countries in the present case when
institutions are not part of EU policies. Section 3 describes the institutional indicators of the
GCI framework that we use. Section 4 presents the methodology employed in the study.
Section 5 displays and discusses the results. Lastly, some concluding remarks and policy
recommendations are offered.

4
2. Can we expect convergence in institutional quality across EMU countries?
Economic and monetary integration requires a considerable harmonization of policies for
economic agents in different countries to operate in. During last decades, the European
Commission and the ECB have systematically promoted ambitious structural reforms to
achieve this. These were typically associated with regulatory policies aimed at strengthening
market-based incentives in domestic product and labour markets. However, sound institutions,
such as legal certainty, efficient public administration and judicial systems or the absence of
corruption, provide the basis for the appropriate functioning of all specific economic structures,
such as labour and product markets, and for attracting investment in human capital and foreign
direct investment, and for the creation of new firms and as such should have been part of
harmonization as well (ECB, 2015, 2016). This makes institutional convergence an important
necessity for the EMU, even if there is no consolidated theory of institutional convergence to
be found in the literature (see, for example, Savoia and Sen, 2016).
In analogy with capital accumulation and income convergence (see, for example, Barro
and Sala-i-Martin, 1992), the concept of diminishing returns could also be applicable to
institutions, as the early ‘units’ of institutional reforms are relatively easier and less costly to
attain. Thus, particularly in the case of basic institutions such as the level of protection of
property rights, it would be much more difficult and costly to achieve a higher degree of
institutional quality from an initially high level than from a low level.
Nevertheless, the theoretical literature on institutional change suggests that the rate of
convergence may differ across different types of institutions, so that the equilibrium process for
some institutions may remain unchanged, leading to persistence of extractive institutions
(Acemoglu and Robinson, 2008). In this line, Acemoglu and Robinson (2012) argue that
certain institutional reforms may be hindered by dominant minorities who benefit from existing
institutions and do not have incentives to change them, so that low quality institutions may
persist.
The impact of business cycle on the assessment of the state of institutions has been also
pointed out in the literature. It is known that the state of institutions can be (negatively) affected
by economic downturns as has been the case during the Great Recession (Álvarez-Díaz et al.,
5
2015, Ritzen 2017), while at the same time these institutions might be a cause of the impact of
the crisis.
Economic downturn and political dissatisfaction go usually hand in hand. People tend to
assess and trust governments that are able to generate economic growth and create jobs (see, for
example, Stevenson and Wolfers, 2011, Roth et al., 2011), so it follows that a high level of
unemployment would imply a lower political assessment and a decline of trust in public
institutions.
Although the Great Recession has affected the entire Eurozone, the fall in economic
activity and growth of unemployment were much more intense in some Euro area countries,
particularly in certain ‘periphery’ countries that already held lower levels of institutional
quality, such as Cyprus, Greece, Spain, Italy or Portugal. This leads us to expect that the
financial and economic crisis might have contributed to increase the disparities in the
assessment of national institutions across Euro area countries.
Moreover, some peripheral Euro area countries hit hard by the crisis, particularly those
countries that needed financial assistance, had to conduct aggressive programs of fiscal
consolidation, including the reduction of social spending, which contributed to raise
unemployment in the short-term and to increase political dissatisfaction. In this sense, these
policy responses in terms of fiscal consolidation of national governments could worsen the
assessment of public institutions in these countries, contributing to expand the institutional gap
between ‘central’ and ‘periphery’ countries in the Eurozone.
All in all, neither the theoretical nor the empirical arguments discussed above offered any
clear and unambiguous answer on what we may expect on institutional convergence or
divergence across Euro area countries. Ultimately, it is a matter of empirical debate and of
policy. This paper provides evidence on whether EMU countries with lower quality institutions
catch up with countries with higher quality institutions over last decade in the absence of a
clear EMU or EU policy dedicated to institutions. To the best of our knowledge, this is the first
attempt in the literature in which institutional diversity and convergence in the Eurozone are
comprehensively addressed from a global competitiveness perspective.

6
3. Institutional quality indicators
The GCI is based on a weighted average of many different static and dynamic components,
each one measuring a different aspect of competitiveness. These components are grouped into
12 pillars of competitiveness, representing different dimensions, which in turn are classified
into 3 sub-indices: basic requirements sub-index (institutions, infrastructure, macroeconomics,
environment, health and primary education); efficiency enhancers sub-index (higher education
and training, goods market efficiency, labour market efficiency, financial market development,
technological readiness, market size); and innovation and sophistication factors sub-index
(business sophistication, innovation).
We focus our analysis on the institutional indicators included in the first pillar and
examine data for 2006 and 2015.1 These indicators are rated on a scale of 1 to 7, where 1
represents the worst possible situation and 7 the best. Institutions are measured along the lines
of the definition of North (1990, 1994), as ‘the rules of the game of a society’, or more
formally, ‘the humanly devised constraints that structure human interaction’ (1990, p. 3).
“Institutions” then are an approximation of the incentive structure of a society and, as a
consequence, the underlying determinants of economic performance. Two characteristics are
present in the analysis of the institutional indicators of the GCI. First, institutions set formal,
legally binding constraints –such as rules, laws, and the constitution– along with their
associated enforcement mechanisms. Second, institutions include informal constraints such as
norms of behaviour, conventions, and self-imposed codes of conduct such as business ethics
and norms of corporate governance (Schwab 2016).
The WEF distinguishes between public and private institutions, and assesses the quality
of the institutional environment, particularly property rights, ethics and corruption, undue
influence, government efficiency, security, corporate ethics and accountability.2
A fundamental role of the state is ensuring the protection of property rights, as a minimal
requirement for incentivizing economic activity. As property rights allow excluding legally
others from using a property, this affects resource allocation and shapes the incentives of
1 The first version of the GCI was presented in the 2004-2005 report, and it became the official index of the WEF in the 2005-2006 report. Since then, the GCI has experienced considerable methodological improvements, with a more robust conceptual structure and more rigorous statistical methodology (see, for example, Porter et al., 2008). Nowadays, the WEF provide a comparable and homogeneous dataset from 2006 with a range of indicators for each pillar. 2 The World Bank has developed the ease of doing business index (World Bank, 2016a), which includes some similar institutional indicators as measured in the CGI.
7
individuals to carry out productive activities, involving the use of the good or asset, and to trade
or lease it for other uses (Besley and Ghatak, 2009). The component Property rights rates the
level of protection of property rights, including financial assets, and intellectual property
protection.
Two key aspects related to institutional quality are corruption and undue influence on
government decisions and the judiciary, as distortionary and detrimental practices for economic
performance. Corruption breeds public distrust in government and weakens the state’s capacity
to perform its core functions. Corruption can distort resource allocation from productive to
rent-seeking activities, leading managers to focus less on increasing firms’ productivity (see
IMF, 2016, on economic and social costs of corruption). In this line, the component Ethics and
corruption deals with three questions: diversion of public funds to companies, individuals, or
groups due to corruption; the ethical standards of politicians; and undocumented extra
payments or bribes connected with imports and exports, public utilities, annual tax payments,
awarding of public contracts and licenses, and obtaining favourable judicial decisions.
Additionally, the component Undue influence takes into account to what extent the judiciary is
independent from influences of members of government, citizens, or firms, and to what extent
government officials show favouritism to well-connected firms and individuals when deciding
upon policies and contracts.
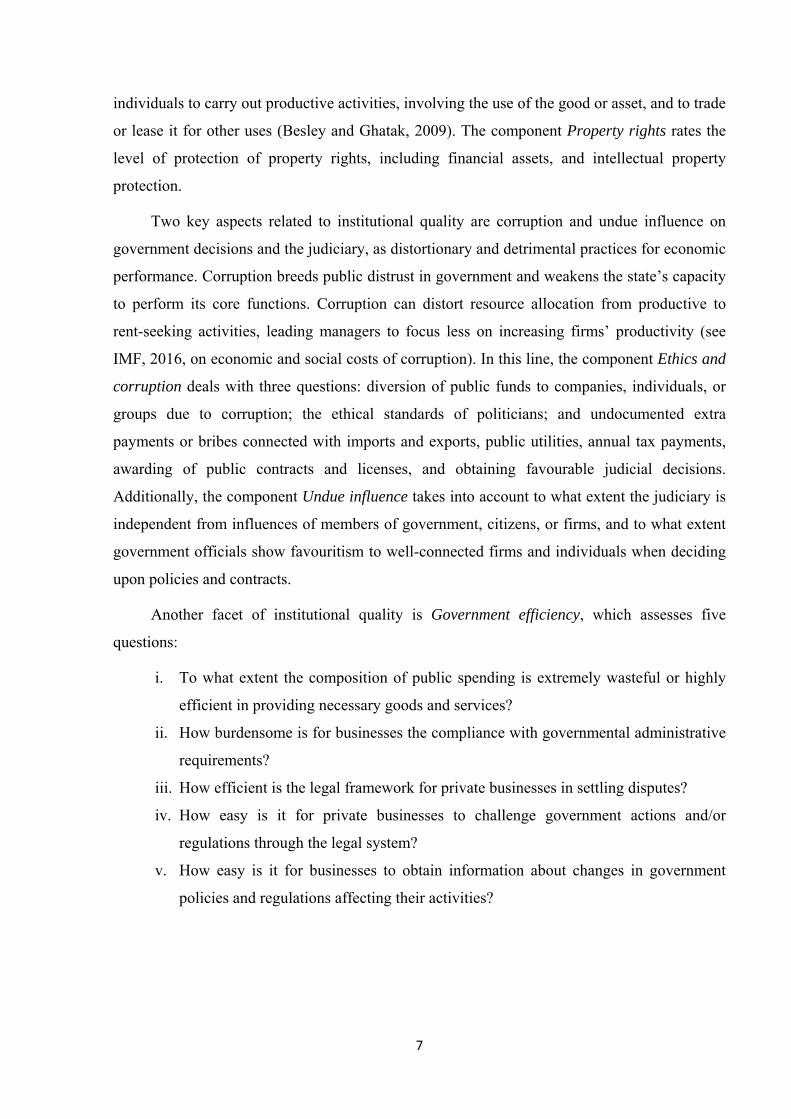
Another facet of institutional quality is Government efficiency, which assesses five
questions:
i. To what extent the composition of public spending is extremely wasteful or highly
efficient in providing necessary goods and services?
ii. How burdensome is for businesses the compliance with governmental administrative
requirements?
iii. How efficient is the legal framework for private businesses in settling disputes?
iv. How easy is it for private businesses to challenge government actions and/or
regulations through the legal system?
v. How easy is it for businesses to obtain information about changes in government
policies and regulations affecting their activities?
8
Additionally, as the guaranteeing of the physical security is an essential element for
economic performance,3 the component Security rates to what extent the threat of terrorism, the
incidence of crime and violence, and organized crime (mafia-oriented racketeering, extortion)
impose costs on businesses, as well as to what extent police services can be relied upon to
enforce law and order.
Corporate ethics and governance standards also contribute to productivity. Two
components are addressed in terms of private institutions. First, Corporate ethics, which refers
to ethical behaviour of companies in interactions with public officials, politicians, and other
firms. Second, Accountability, which jointly rates various aspects: auditing and reporting
standards; efficacy of corporate boards (if management is accountable to investors and boards);
protection of minority shareholders’ interests by the legal system; and strength of investor
protection (it rates transparency of transactions, liability for self-dealing, and shareholders’
ability to sue officers and directors for misconduct).
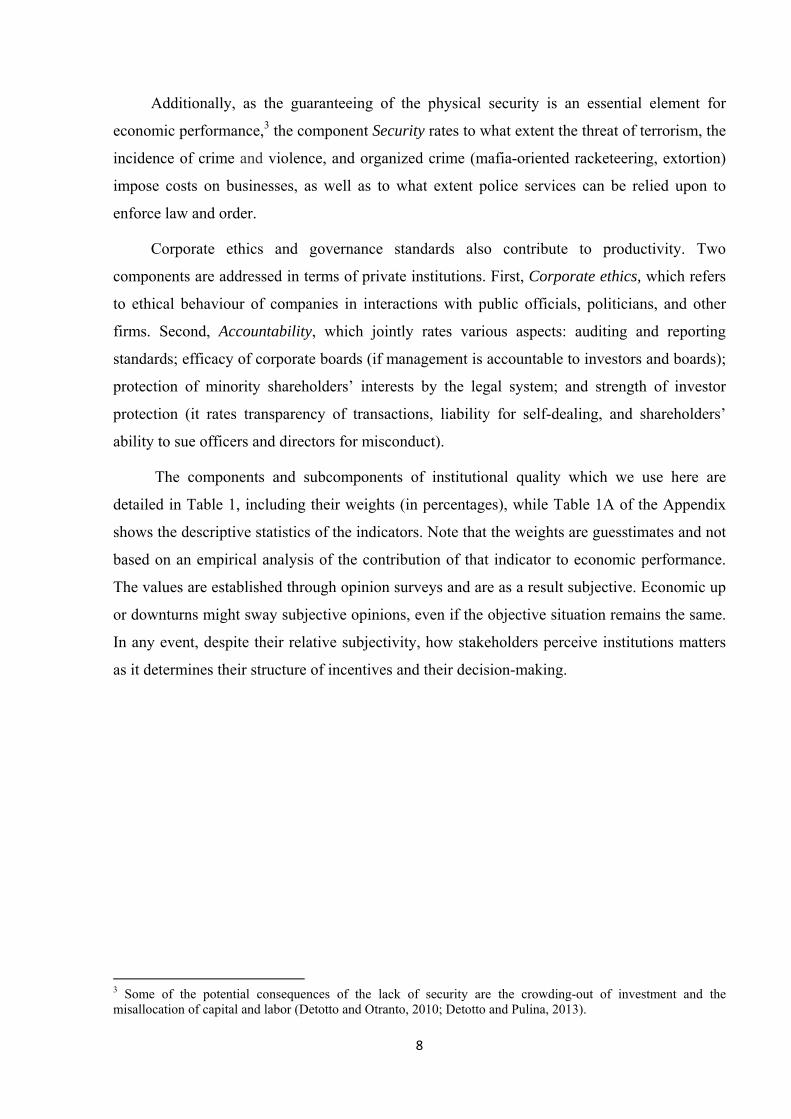
The components and subcomponents of institutional quality which we use here are
detailed in Table 1, including their weights (in percentages), while Table 1A of the Appendix
shows the descriptive statistics of the indicators. Note that the weights are guesstimates and not
based on an empirical analysis of the contribution of that indicator to economic performance.
The values are established through opinion surveys and are as a result subjective. Economic up
or downturns might sway subjective opinions, even if the objective situation remains the same.
In any event, despite their relative subjectivity, how stakeholders perceive institutions matters
as it determines their structure of incentives and their decision-making.
3 Some of the potential consequences of the lack of security are the crowding-out of investment and the misallocation of capital and labor (Detotto and Otranto, 2010; Detotto and Pulina, 2013).

9
Table 1: Components, subcomponents and weights (%) of institutional quality
A. Public institutions (75%) B. Private institutions (25%)
1. Property rights (20%) 1.01 Property rights 1.02 Intellectual property protection ½
2. Ethics and corruption (20%) 1.03 Diversion of public funds 1.04 Public trust in politicians 1.05 Irregular payments and bribes
3. Undue influence (20%) 1.06 Judicial independence 1.07 Favouritism in decisions of government officials
4. Government efficiency (20%) 1.08 Wastefulness of government spending 1.09 Burden of government regulation 1.10 Efficiency of legal framework in settling disputes 1.11 Efficiency of legal framework in challenging regulations 1.12 Transparency of government policymaking
5. Security (20%) 1.13 Business costs of terrorism 1.14 Business costs of crime and violence 1.15 Organized crime 1.16 Reliability of police services
1. Corporate ethics 50% 1.17 Ethical behaviour of firms
2. Accountability (50%) 1.18 Strength of auditing and reporting standards 1.19 Efficacy of corporate boards 1.20 Protection of minority shareholders’ interests 1.21 Strength of investor protection
Note: ½ This indicator enters the GCI in two different pillars (Institutions and Innovation) and, in order to avoid double counting, a half-weight is assigned in this pillar. Source: WEF (2016)
Figure 1 shows the mean values of GCI and the state of institutions (P1), as well as of
public and private institutions separately, in the Euro area countries during the period 2006-
2015. We observe that, on average, the state of both public and private institutions worsen in
the Eurozone, particularly since the onset of the financial and economic crisis in 2008. The
good news is that there appears to be a slight recovery from 2014 onwards.
This erosion in public and private institutions in the Euro area countries may also have
contributed to increasing distrust in the functioning of the democratic institutions of the states
involved. However, the institutional changes differ substantially between countries, as we note
in Figure 2 for a sample of four countries, so that potential processes of convergence or
divergence across EMU countries require to be examined empirically.

10
Figure 1. Mean GCI and institutional quality of the Euro area countries
Source: Own construction based on WEF (2016).
Figure 2. Institutional quality (P1) of four Euro area countries
Source: Own construction based on WEF (2016).
4. Methodology
4.1. Convergence
We analyse convergence in the state of institutions across EMU countries using the unified
framework proposed by Donghde and Silber (2016). This framework allows for the estimation
of measures of distributional change even when the number of observations is limited.4 This
methodology is particularly useful in the case of relatively small number of observations (19
4 This methodology has also been applied in Ayala, Bárcena-Martín and Martínez-Vázquez (2017).
4.5
4.6
4.7
4.8
4.9
5.0
5.1
5.2
2006 2007 2008 2009 2010 2011 2012 2013 2014 2015
GCI P1. Institutions A. Public institutions B. Private institutions
3.0
3.5
4.0
4.5
5.0
5.5
2006 2007 2008 2009 2010 2011 2012 2013 2014 2015
Belgium Greece Lithuania Slovakia

11
EMU countries). In such a case traditional econometric approaches to convergence analysis
cannot be used.
We consider the non-anonymous and the anonymous cases of convergence. In the non-
anonymous case, we compare the state of institutions in a country in 2006 with the state of
institutions corresponding to the same country in 2015, following Donghde and Silber (2016).
Let be country i’s (i=1 to 19) state of institutions at time , the number of countries
analyzed and the mean value of the state of institutions at time . Then and
refer to the relative value of the state of institutions in country i (i=1 to 19) at times
(2006) and (2015). Let us assume that countries are ranked by increasing values of the
shares . Note that denotes the position of the country when is arranged in ascending
order. In this case the index measures the degree of β-convergence across countries in the
non-anonymous case.
∑ ∑ ∑ ∑ ∑ [1]
We also compute the index of convergence in the various centiles, the anonymous case,
,that assesses the extent of σ-convergence in the state of institutions. The expression for
is the same than the one for but this time the shares are ranked by increasing values of the
share while the shares are ranked by increasing values of the share . In the anonymous
case i denotes the position, and it does not identify a country.
4.2. Country contribution to inequality
For the measurement of the inequality in the state of institutions, we will make use of the well-
known Gini coefficient. We omit the subindex t, but the following expression applies both to
2006 and 2015.
∑ ∑
2
[2]
always between 0 (e) and 1 (maximum inequality). The Gini index can be
decomposed to assess the contribution of each country to inequality. The absolute inequality
, , experienced by a country with institutional state , relative to where ,
can be considered to be the differential. That is
, 0 [3]

12
The average absolute inequality experienced by a country with outcome over the
whole set of countries, , is
1,
1 [4]
The average absolute inequality of the whole set of countries is :
1 1
12 1
[5]
As we want to analyse relative inequality in the state of institutions, and not absolute
inequality, we will compute inequality in relative terms. The contribution of each country to
overall inequality, considering as benchmark the countries with a highest assessment, is
/ [6]
This approach adopted is similar to that of Sen (1973), which is also closely related to
Pyatt's (1976) interpretation of the Gini coefficient as the expected gain of a game in which
each individual is able to compare himself or herself with someone drawn from the total
population.5
5. Results
5.1. Convergence in institutional quality?
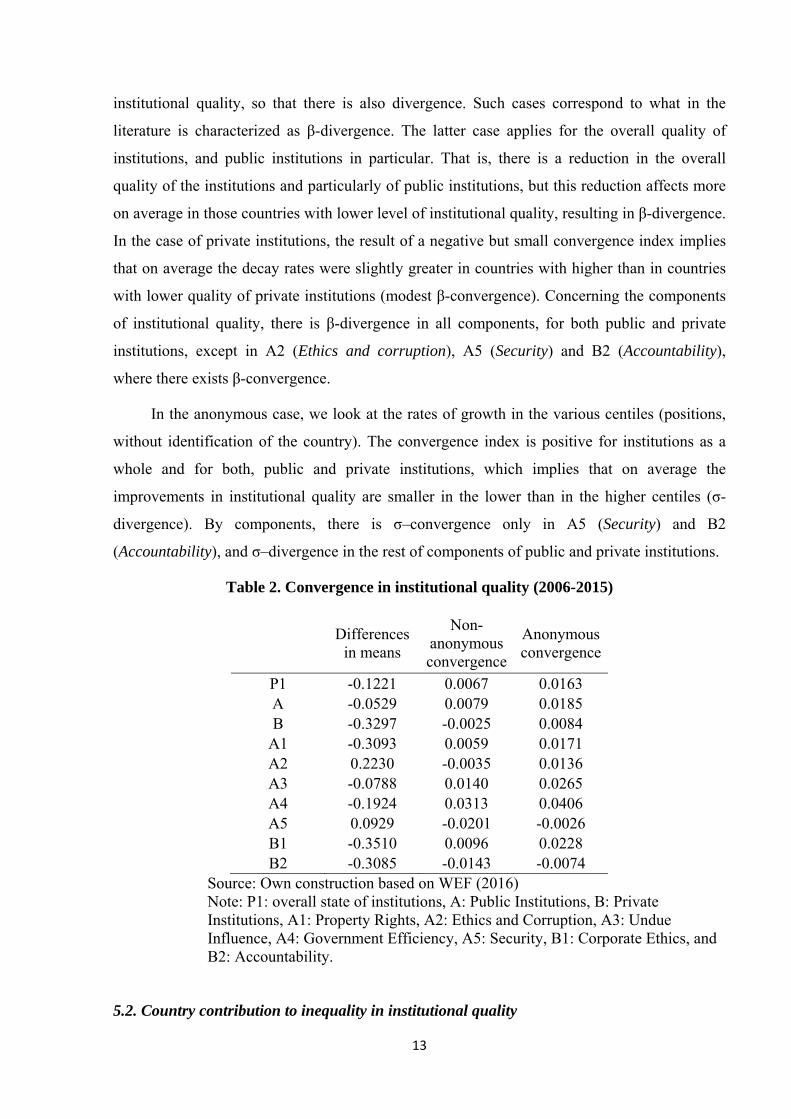
We consider the non-anonymous and the anonymous cases in the analysis of the distributional
change as they are connected to two different concepts of convergence. First, regarding the
non-anonymous case, in Table 2 (see Table A2 of the appendix for subperiods 2006-2008,
2008-2013, 2013-2015) we find that the estimated values of the indices have a positive sign for
the overall indicator of the institutional quality, P1, and for the category of public institutions,
A. This may imply that on average the growth rates (in institutional quality) in those countries
with greater initial values were higher than that of those with a low institutional quality,
signifying divergence. Equivalently, the positive sign may imply that on average the decay
rates in those countries with lower initial values are greater than that of those with a high
5 In our case, individuals may be interpreted as countries and total population would be all the Euro area countries.
13
institutional quality, so that there is also divergence. Such cases correspond to what in the
literature is characterized as β-divergence. The latter case applies for the overall quality of
institutions, and public institutions in particular. That is, there is a reduction in the overall
quality of the institutions and particularly of public institutions, but this reduction affects more
on average in those countries with lower level of institutional quality, resulting in β-divergence.
In the case of private institutions, the result of a negative but small convergence index implies
that on average the decay rates were slightly greater in countries with higher than in countries
with lower quality of private institutions (modest β-convergence). Concerning the components
of institutional quality, there is β-divergence in all components, for both public and private
institutions, except in A2 (Ethics and corruption), A5 (Security) and B2 (Accountability),
where there exists β-convergence.
In the anonymous case, we look at the rates of growth in the various centiles (positions,
without identification of the country). The convergence index is positive for institutions as a
whole and for both, public and private institutions, which implies that on average the
improvements in institutional quality are smaller in the lower than in the higher centiles (σ-
divergence). By components, there is σ–convergence only in A5 (Security) and B2
(Accountability), and σ–divergence in the rest of components of public and private institutions.
Table 2. Convergence in institutional quality (2006-2015)
Differences in means
Non-anonymous convergence
Anonymous convergence
P1 -0.1221 0.0067 0.0163 A -0.0529 0.0079 0.0185 B -0.3297 -0.0025 0.0084
A1 -0.3093 0.0059 0.0171 A2 0.2230 -0.0035 0.0136 A3 -0.0788 0.0140 0.0265 A4 -0.1924 0.0313 0.0406 A5 0.0929 -0.0201 -0.0026 B1 -0.3510 0.0096 0.0228 B2 -0.3085 -0.0143 -0.0074
Source: Own construction based on WEF (2016) Note: P1: overall state of institutions, A: Public Institutions, B: Private Institutions, A1: Property Rights, A2: Ethics and Corruption, A3: Undue Influence, A4: Government Efficiency, A5: Security, B1: Corporate Ethics, and B2: Accountability.
5.2. Country contribution to inequality in institutional quality

14
We observe in Table 3 that inequality in institutional quality increased, both for public and
private institutions, and for each of their components, except for A5 (Security) and B2
(Accountability).
Table 3. Inequality in institutional quality: Gini index
P1 A B A1 A2 A3 A4 A5 B1 B2 2006 0.080 0.082 0.074 0.08 0.106 0.103 0.071 0.052 0.086 0.062 2015 0.097 0.102 0.081 0.097 0.130 0.127 0.105 0.050 0.108 0.053
Variation Rate (2006-
2015) 21.3% 24.4% 9.5% 21.3% 22.6% 23.3% 47.9% -3.8% 25.6% -14.5%
Source: Own construction based on WEF (2016) Note: P1: overall state of institutions, A: Public Institutions, B: Private Institutions, A1: Property Rights, A2: Ethics and Corruption, A3: Undue Influence, A4: Government Efficiency, A5: Security, B1: Corporate Ethics, and B2: Accountability.
In order to analyse which countries are falling behind in terms of each institutional
indicator, we consider as benchmark the value of the country with the highest assessment in
each year. Table 4 shows the contribution of each country to overall inequality in the
institutional quality and in each of its components for 2006 while Table 5 shows the same
information corresponding to 2015.
Let us interpret the Gini index in terms of the expected gain of a game in which each
country compares itself with countries in a better position (Pryatt, 1976). We then observe that
the contribution of countries to the different outcomes is substantially differing. Nonetheless,
the extreme positions regarding the institutional quality in general, public and private
institutions, and each of its components are held by almost the same countries regardless of the
year analysed.

15
Table 4. Country contributions to inequality in the institutional quality indicators (2006)
Country P1 A B A1 A2 A3 A4 A5 B1 B2 Austria (AT) 0.56 0.65 0.37 0.51 1.05 1.29 0.89 0.31 0.35 0.47 Belgium (BE) 3.3 3.76 2.07 2.56 3.42 3.05 6.27 4.97 2.57 1.5 Cyprus (CY) 5.17 4.19 8.55 5.43 4.27 4.29 2.83 4.36 8.57 8.33 Estonia (EE) 4.61 4.21 5.82 5.22 5.79 3.91 1.98 4.46 6.99 4.15 Finland (FI) 0 0 0 0.24 0 0 0 0 0 0 France (FR) 2.33 2.67 1.23 1.01 3.19 2.63 3.6 3.84 1.29 1.29
Germany (DE) 0.25 0.27 0.17 0 1.17 0.07 1.03 0.36 0.29 0
Greece (EL) 7.58 7.16 8.79 7.76 7.29 8.07 8.56 2.78 10.15 6.98 Ireland (IE) 1.36 1.67 0.48 0.75 2.64 0.8 1.49 3.81 0.91 0.2 Italy (IT) 14.23 14.38 13.26 8.9 12.92 12.48 19.18 17.26 11.08 15.51Latvia (LV) 11.43 11.22 11.92 14.37 11.71 10.78 7.54 8.09 12.13 11 Lithuania (LT) 13.47 14.53 9.71 13.87 15.08 14.14 10.72 14.59 8.38 11.34Luxembourg (LU)
0.66 0.52 1.41 1.34 0.22 0.85 0.71 1.29 0.43 3.28
Malta (MT) 5.22 4.69 7.04 8.01 3.57 5.21 6.82 1.17 9.45 4.02 Netherlands (NT)
0.39 0.36 0.53 0.21 0.35 0 0.29 6.12 0.45 0.73
Portugal (PT) 3.07 2.54 5.16 4.04 2.96 1.59 4.91 0.77 5.42 4.73 Slovakia (SK) 11.24 11.75 9.29 10.54 12.88 12.99 8.95 8.7 9.46 8.8 Slovenia (SI) 8.16 7.85 8.84 9.8 6.37 7.38 8.33 6.16 7.37 11.1 Spain (ES) 6.97 7.58 5.36 5.43 5.14 10.48 5.91 10.97 4.68 6.55 Source: Own construction based on WEF (2016) Note: P1: overall state of institutions, A: Public Institutions, B: Private Institutions, A1: Property Rights, A2: Ethics and Corruption, A3: Undue Influence, A4: Government Efficiency, A5: Security, B1: Corporate Ethics, and B2: Accountability.

16
Table 5. Country contributions to inequality in the institutional quality indicators (2015)
P1 A B A1 A2 A3 A4 A5 B1 B2 Austria (AT) 1.41 1.64 0.73 0.84 2.54 2.91 1.88 0.48 0.91 0.43 Belgium (BE) 1.48 1.72 0.73 1.96 1.15 1.2 3.39 2.63 0.77 0.7 Cyprus (CY) 6.29 5.87 7.94 8.2 6.59 6.15 3.57 3.72 8.48 6.89 Estonia (EE) 2.07 1.79 3.17 2.89 2.17 1.58 1.58 1.72 3.12 3.17 Finland (FI) 0 0 0 0 0 0 0 0 0 0
France (FR) 3.3 3.58 2.32 1.49 3.36 2.82 3.56 12.4
8 2.77 1.35
Germany (DE) 1.31 1.33 1.47 1.01 1.52 1.01 0.68 5.95 1.51 1.33
Greece (EL) 11.21 11.0
3 11.6
8 11.9
4 10.7 8.81
11.83
10.18
10.61
13.74
Ireland (IE) 0.54 0.44 0.99 0.36 0.47 0.24 0.7 0.82 0.87 1.22
Italy (IT) 14.37 14.7
5 12.6
9 11.5
3 12.9
2 12.1
5 17.3
9 19.9
5 11.9
8 13.88
Latvia (LV) 7.02 7 7.15 7.19 7.94 7.66 6.2 3.82 7.45 6.56
Lithuania (LT) 7.56 8 6.1 9.84 6.81 7.49 6.26 10.5
1 5.77 6.58
Luxembourg (LU)
0.2 0.18 0.25 0.09 0.08 0.28 0.1 0.54 0.17 0.4
Malta (MT) 4.76 4.63 5.17 5.58 5.33 5.13 3.55 2.43 5.97 3.49 Netherlands (NT)
0.42 0.43 0.39 0.37 0.36 0.15 0.32 2.65 0.35 0.47
Portugal (PT) 5.58 5.13 7.27 6.31 5.15 5.11 7.84 0.9 6.03 10.16
Slovakia (SK) 14.32 14.9 11.9 11.7
2 14.6
1 17.5
3 13.0
3 13.8
4 13.7
1 8.8
Slovenia (SI) 9.12 8.65 10.7
9 8.74 8.09
10.43
10.19
3.01 9.85 12.53
Spain (ES) 9.04 8.95 9.25 9.95 10.2 9.36 7.93 4.37 9.67 8.29 Source: Own construction based on WEF (2016) Note: P1: overall state of institutions, A: Public Institutions, B: Private Institutions, A1: Property Rights, A2: Ethics and Corruption, A3: Undue Influence, A4: Government Efficiency, A5: Security, B1: Corporate Ethics, and B2: Accountability.
Those countries with zero contribution in Tables 4 and 5 are the ones with the highest
value of the corresponding indicator in the respective year. We observe that Belgium, Estonia,
Latvia, Lithuania and Luxembourg shortened the relative distances with respect to better
countries in all institutional indicators, while some southern and eastern countries such as
Greece, Italy, Portugal, Slovakia and Spain, as well as some central European countries such as
Austria, France and Germany, increased the relative distances to the benchmark for most
institutional indicators.
The computation of relative distances allows us to identify homogenous groups of
countries according to their similarities or dissimilarities regarding the contribution of each

17
country to inequality in the diverse institutional components. We make a cluster analysis for
2006 and another for 2015 in order to identify relevant differences in the composition of
clusters and distances between them. A hierarchical cluster analysis using the Ward’s linkage
method and the squared Euclidean as dissimilarity measure yields the dendrograms of relative
similarity of countries for years 2006 and 2015 of Figures 3 and 4.
Figure 3. Dendrogram (2006)
Source: Own construction.
01
00
02
00
03
00
0L
2sq
ua
red
dis
sim
ilari
ty m
ea
sure
Au
stri
a
Ger
man
y
Fin
lan
d
Lux
embo
urg
Fra
nce
Ire
land
Ne
the
rland
s
Be
lgiu
m
Po
rtug
al
Cyp
rus
Est
onia
Gre
ece
Mal
ta
Slo
ven
ia
Sp
ain
Italy
Lith
uani
a
Lat
via
Slo
vaki
a

18
Figure 4. Dendrogram (2015)
Source: Own construction.
In Figures 3 and 4 the height of the vertical lines and the range of the dissimilarity axis
give visual clues about the strength of the clustering. Long vertical lines at the top of the
dendrogram indicate that the groups represented by those lines are well separated from one
another. Shorter lines indicate groups that are not as distinct.
The dendrograms indicates the presence of three groups of countries in 2006 and 2015.
In 2006 Austria, Germany, Finland, Luxembourg, France, Ireland, and The Netherlands form a
first group (G1) on the left. On the right, we observe a small group of four countries (G3: Italy,
Lithuania, Latvia and Slovenia). The rest of the countries belong to G2: a group in the middle
of the dendrogram.
The composition of groups is rather stable across years. Nonetheless, in 2015 Belgium
and Estonia join G1 and Lithuania and Latvia join G2. Consequently, G3 has only 2 countries
(Italy and Slovakia) left in 20015. Nonetheless, this time the distance between G1 and G2 is
increases and G2 is now closer to the rear group (G3). In this way the dendograms highlight the
increase in the gap between the group of countries with higher-quality institutions and the
others.
01
00
02
00
03
00
04
00
0L
2sq
ua
red
dis
sim
ilari
ty m
ea
sure
Au
stri
a
Be
lgiu
m
Est
onia
Ger
man
y
Fin
lan
d
Lux
embo
urg
Ire
land
Ne
the
rland
s
Fra
nce
Cyp
rus
Lat
via
Mal
ta
Po
rtug
al
Lith
uani
a
Gre
ece
Sp
ain
Slo
ven
ia
Italy
Slo
vaki
a
19
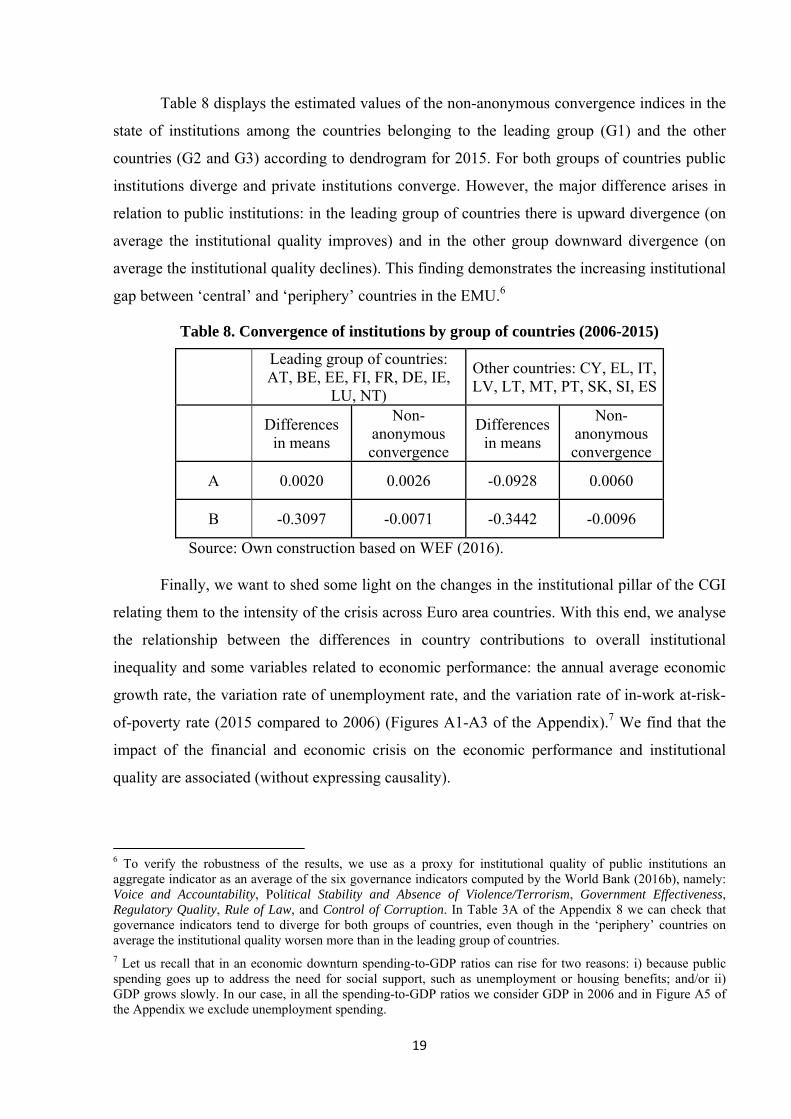
Table 8 displays the estimated values of the non-anonymous convergence indices in the
state of institutions among the countries belonging to the leading group (G1) and the other
countries (G2 and G3) according to dendrogram for 2015. For both groups of countries public
institutions diverge and private institutions converge. However, the major difference arises in
relation to public institutions: in the leading group of countries there is upward divergence (on
average the institutional quality improves) and in the other group downward divergence (on
average the institutional quality declines). This finding demonstrates the increasing institutional
gap between ‘central’ and ‘periphery’ countries in the EMU.6
Table 8. Convergence of institutions by group of countries (2006-2015)
Leading group of countries: AT, BE, EE, FI, FR, DE, IE,
LU, NT)
Other countries: CY, EL, IT, LV, LT, MT, PT, SK, SI, ES
Differences
in means
Non-anonymous convergence
Differences in means
Non-anonymous convergence
A 0.0020 0.0026 -0.0928 0.0060
B -0.3097 -0.0071 -0.3442 -0.0096
Source: Own construction based on WEF (2016).
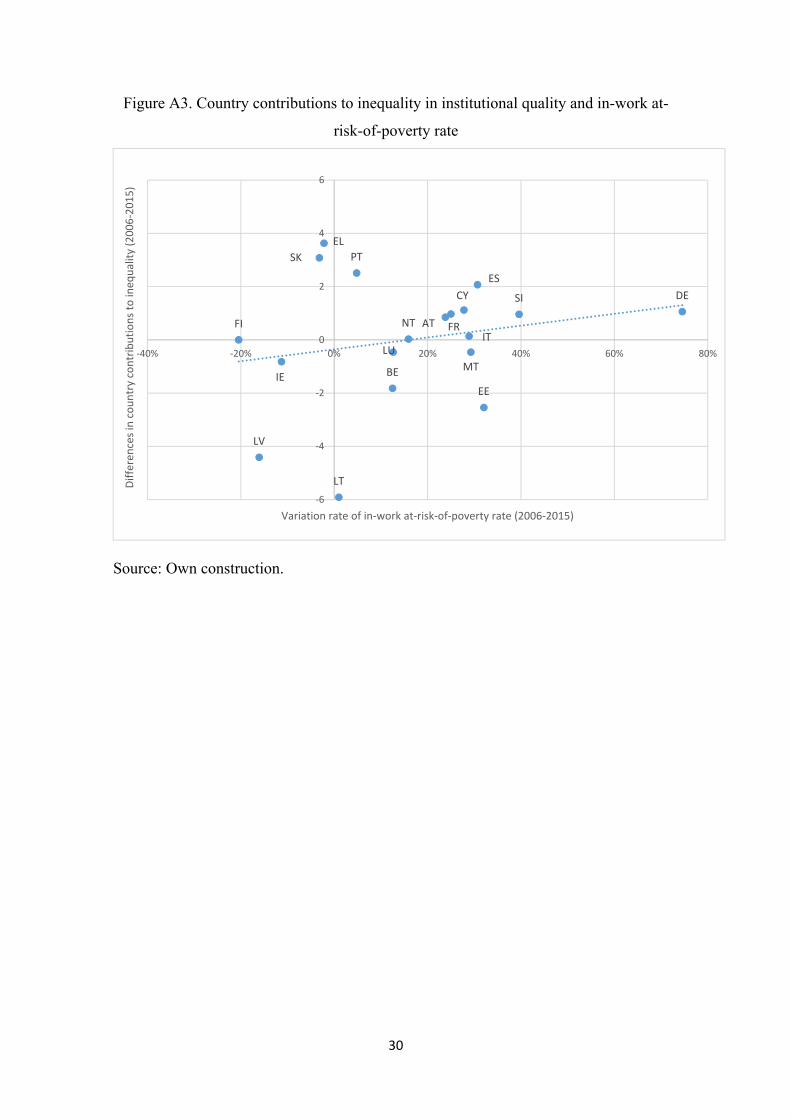
Finally, we want to shed some light on the changes in the institutional pillar of the CGI
relating them to the intensity of the crisis across Euro area countries. With this end, we analyse
the relationship between the differences in country contributions to overall institutional
inequality and some variables related to economic performance: the annual average economic
growth rate, the variation rate of unemployment rate, and the variation rate of in-work at-risk-
of-poverty rate (2015 compared to 2006) (Figures A1-A3 of the Appendix).7 We find that the
impact of the financial and economic crisis on the economic performance and institutional
quality are associated (without expressing causality).
6 To verify the robustness of the results, we use as a proxy for institutional quality of public institutions an aggregate indicator as an average of the six governance indicators computed by the World Bank (2016b), namely: Voice and Accountability, Political Stability and Absence of Violence/Terrorism, Government Effectiveness, Regulatory Quality, Rule of Law, and Control of Corruption. In Table 3A of the Appendix 8 we can check that governance indicators tend to diverge for both groups of countries, even though in the ‘periphery’ countries on average the institutional quality worsen more than in the leading group of countries. 7 Let us recall that in an economic downturn spending-to-GDP ratios can rise for two reasons: i) because public spending goes up to address the need for social support, such as unemployment or housing benefits; and/or ii) GDP grows slowly. In our case, in all the spending-to-GDP ratios we consider GDP in 2006 and in Figure A5 of the Appendix we exclude unemployment spending.

20
Likewise, we consider the variation rate of the expenditure in social protection benefits8
(as a percentage of GDP in 2006), including and excluding unemployment spending (Figures
A4 and A5 of the Appendix). They suggest that the policy responses in terms of fiscal
consolidation applied by the respective national governments also seem to be associated with
changes in the institutional quality across countries, so that larger fiscal consolidations
affecting social spending seem to go hand in hand with a higher loss of institutional quality.
Although these findings are preliminary and require further research, they offer new
insights on possible underlying factors explaining the institutional disparities across the Euro
area countries that should be taken into consideration by academics and policy makers.
6. Concluding remarks
Institutional quality worsened in the EMU between 2006 and 2015 in general terms, despite
some countries experiencing improvements. We find β-divergence (and σ-divergence) in the
state of institutions across Euro area countries, so that on average the decay in the institutional
quality in 2015 compared to 2006 has been greater for those countries with lower quality than
for high institutional quality countries. Public institutions are observed to diverge (except the –
perhaps very important– institutional components related to ethics and corruption and security),
while private institutions slightly converge (particularly accountability, not so corporate ethics).
Inequality in the state of institutions increased during the period 2006-2015, both for
public and private institutions, as for each of their components, except for security and
accountability, with government efficiency as the institutional component where inequality
increased the most.
The contribution of each country to the overall inequality in the state of institutions,
differs across countries and among the institutional indicators. Lithuania, Latvia, Estonia and
Belgium show the higher reductions in the relative distance to the benchmark for different
institutional components, while Greece, Slovakia, Portugal, and Spain display higher
increments.
We have identified clusters of countries with similar properties in the development of
institutions. The composition of these clusters is rather stable in both years, even though in
2015 the gap between the leading group of countries with higher quality institutions and the
8 Social protection benefits are transfers to households, in cash or in kind, intended to relieve them of the financial burden of several risks and needs. These include disability, sickness/healthcare, old age, survivors, family/children, unemployment, housing and social exclusion not covered elsewhere.

21
others broaden. Both groups of countries diverge in public institutions and converge in private
institutions. However, –to make matters worse–, the leading group, on average, improves the
quality of their public institutions while the other countries see their public institutions
deteriorating. This increasing disparity in the institutional structure between both groups of
countries highlights the divergence in competitiveness between ‘core’ and ‘periphery’ Euro
area countries.
The deterioration of institutions particularly in some Euro area countries is associated
with the intensity of the impact of the financial and economic crisis in terms of economic
growth and employment. Nevertheless, the causality of this association is not easily
established. There may be a measurement explanation. Institutional quality is measured through
questionnaires. Perhaps the subjective answers depend to some extent on the external economic
environment. We also find an association between institutional quality and the policy responses
in terms of fiscal consolidation. The intense and rapid pace of fiscal consolidation carried out in
some countries may have also contributed to widen the disparities across EMU countries in
terms of institutional quality.
The overall finding is that the sustainability of the EMU is in serious danger as a result of
the divergence in institutional quality and the corresponding divergence in competitiveness.
Given that in a monetary union there are many channels through which the national economic
performance may affect other member countries and the Euro area as a whole, low quality
national institutions may increase the vulnerabilities of the countries in question and undermine
the smooth functioning of the EMU. This begs the question of how to recreate convergence
through the combination of European and national actions. The institutional environment is
mainly a national responsibility. Nevertheless some structural reforms enhancing the quality of
institutions at the national level should be introduced and coordinated at the European level,
particularly in areas such as government efficiency or undue influence. Both EU-wide and
domestic policies must improve public institutions and create the conditions for firms to
operate smoothly and efficiency, taking into account that a certain convergence in basic
institutions is essential to accomplish an effective and competitive EMU.
References
Acemoglu, D. and Robinson, J.A. (2008). Persistence of power, elites and institutions. The
American Economic Review, 98, 267–293.

22
Acemoglu, D., Robinson, J. A. and Verdier, T. (2012). Can’t we all be more like
Scandinavians? Asymmetric growth and institutions in an interdependent world. NBER
Working Paper No. 18441.
Álvarez-Díaz, M., Caballero, G., Manzano, B. and Martín-Moreno, J.M. (2015). Assessment of
Political Situation over the Business Cycle in Spain: A Time Series Analysis. Hacienda
Pública Española / Review of Public Economics, 213(2): 41-62
Ayala, L, Bárcena-Martín, E. and Martínez-Vázquez, J. (2017). “The unintended distributional
costs of devolution in the U.S. welfare reform of 1996”. Applied Economics Meeting,
June 8-9, 2017. http://encuentros.alde.es/fotosbd/310320170027248813.pdf
Barro, R.J., and Sala-i-Martin, X. (1992) “Convergence”. Journal of Political Economy 100(2):
223-251.
Besley, T.J. and Ghatak (2009), M. Property Rights and Economic Development. CEPR
Discussion Paper No. DP7243. Volume V of the Handbook of Development Economics
edited by Dani Rodrik and Mark Rosenzweig
Boltho, A. (1996). The Assessment: International Competitiveness. Oxford Review of
Economic Policy, 12(3), 1–16.
De Grauwe, P. 2010 (Ed.) Dimensions of Competitiveness. Cambridge: The MIT Press.
Detotto, C. and M. Pulina (2013). Assessing Substitution and Complementary Effects amongst
Crime Typologies. European Journal of Criminal Policy and Research, 19: 309-32.
Detotto, C. and Otranto, E. (2010). Does Crime Affect Economic Growth? Kyklos, 63(3): 330-
45.
Donghde, S. and Silber, J. (2016). “On Distributional change, pro-poor growth and
convergence”. The Journal of Economic Inequality, 14(3), pp. 249-267.
European Central Bank (2015): “Real convergence in the Euro area: evidence, theory and
policy implications”, ECB Economic Bulletin 5/2015.
European Central Bank (2016): “Increasing resilience and long-term growth: the importance of
sound institutions and structures for Euro area countries and EMU”, ECB Economic
Bulletin, 5/2016.
European Commission (2015): The Five President's Report: Completing Europe's Economic
and Monetary Union. Luxembourg, European Commission.

23
International Monetary Fund (2016). Corruption: Costs and Mitigating Strategies. Staff
Discussion Note No. 16/05.
Krugman, P. (1994). Competitiveness: A Dangerous Obsession. Foreign Affairs 73(2), 28-44.
Krugman, P. (1996). Making sense of the competitiveness debate. Oxford Review of Economic
Policy, 12(3), 17-25.
North, D.C. (1990). Institutions, Institutional Change, and Economic Performance. Cambridge:
Cambridge University Press.
North, D.C. (1994) “Economic Performance through Time.” American Economic Review 84
(3): 359–67.
Porter, M.E. (1990). The Competitive Advantage of Nations. New York: The Free Press.
Porter, M.E., Delgado, M., Ketels, C. & Stern, S. (2008). Moving to a New Global
Competitiveness Index. In The Global Competitiveness Report 2008-2009 (pp. 43-63).
Geneva: The World Economic Forum.
Pyatt, G. 1976. "On the Interpretation and Disaggregation of Gini Coefficients" Economic
Journal, 86, 243-55.
Ritzen, J. (Ed.) (2017). A Second Chance for Europe. Economic, Political and Legal
Perspectives of the European Union. Springer.
Roth, F., Nowak-Lehmann, F.D. and Otter, T. (2011) “Has the financial crisis shattered
citizens’ trust in national and European governmental institutions? Evidence from the EU
member states, 1999-2010”. CEPS Working Documents Nº 343. Centre for European
Policy Studies.
Savoia, A. and Sen, K. (2014). Do We See Convergence in Institutions? A Cross-Country
Analysis. The Journal of Development Studies, 52(2), 166-185.
Schwab, K. (2015). Global Competitiveness Report 2015-2016. Geneva: The World Economic
Forum.
Schwab, K. (2016). Global Competitiveness Report 2016-2017. Geneva: The World Economic
Forum.
Sen, A. K. 1973. On Economic Inequality, Oxford, U.K.: Clarendon Press.
Stevenson, B and Wolfers, J. (2011) “Trust in Public Institutions over the Business Cycle”,
American Economic Review: Papers and Proceedings, 101(3), 281-287

24
World Bank (2016a). Doing Business 2016: Measuring Regulatory Quality and Efficiency.
Washington, DC: World Bank.
World Bank (2016b). Worldwide governance indicators project. Accessed 16 October 2016.
World Economic Forum (2016). The Global Competitiveness Index Historical Dataset.
Accessed 3 March 2016.

25
Appendix
Table A1. Descriptive statistics
Variable 2006 2015
Min. Max. MeanStandard deviation
Min. Max. Mean Standard deviation
GCI 4.121 5.505 4.777 0.440 4.024 5.529 4.773 0.483
P1. Institutions 3.734 6.026 4.771 0.687 3.422 6.096 4.649 0.806A. Public institutions 3.574 5.957 4.661 0.708 3.264 6.121 4.608 0.852B. Private institutions 4.182 6.232 5.101 0.663 3.850 6.021 4.771 0.688A1. Property rights 4.295 6.576 5.374 0.709 4.026 6.387 5.064 0.828A2. Ethics and
corruption 2.640 6.001 4.142 0.954 2.665 6.229 4.365 1.098A3. Undue influence 2.966 5.641 4.315 0.899 2.223 5.998 4.237 1.086A4. Government
efficiency 2.741 5.357 4.037 0.650 2.201 5.320 3.845 0.893A5. Security 4.416 6.538 5.437 0.565 4.380 6.672 5.530 0.559B1. Corporate ethics 4.034 6.451 5.032 0.792 3.350 6.298 4.681 0.920B2. Accountability 4.239 6.016 5.169 0.565 4.173 5.745 4.860 0.471
Source: Own calculations based on WEF (2016)

26
Table A2. Convergence of institutions by subperiods (2006-2015)
2006-2008 2008-2013 2013-2015
Differences in means
Non-anonymous convergence
Anonymous convergence
Differences in means
Non-anonymous convergence
Anonymous convergence
Differences in means
Non-anonymous convergence
Anonymous convergence
P1 0.1234 -0.0008 0.0018 -0.2904 0.0096 0.0131 0.0448 0.0002 0.0015
A 0.1602 -0.0022 0.0014 -0.2625 0.0113 0.0155 0.0494 0.0000 0.0018
B 0.0131 -0.0013 0.0015 -0.3739 0.0015 0.0057 0.0311 -0.0003 0.0013
A1 0.0975 -0.0068 -0.0046 -0.4792 0.0149 0.0211 0.0725 -0.0018 0.0008
A2 0.1098 0.0075 0.0126 -0.0264 -0.0075 0.0032 0.1396 -0.0053 -0.0020
A3 0.2322 0.0068 0.0100 -0.4054 0.0038 0.0135 0.0944 0.0004 0.0030
A4 -0.0082 0.0002 0.0043 -0.2347 0.0298 0.0363 0.0505 -0.0011 0.0001
A5 0.3698 -0.0184 -0.0131 -0.1670 -0.0029 0.0055 -0.1099 0.0029 0.0050
B1 -0.0243 0.0072 0.0106 -0.2444 0.0069 0.0097 -0.0823 0.0001 0.0024
B2 0.0504 -0.0096 -0.0084 -0.5034 -0.0055 0.0011 0.1445 -0.0026 -0.0002
Source: Own construction based on WEF (2016) Note: P1: overall state of institutions, A: Public Institutions, B: Private Institutions, A1: Property Rights, A2: Ethics and Corruption, A3: Undue Influence, A4: Government Efficiency, A5: Security, B1: Corporate Ethics, and B2: Accountability.

27
Table A3. Sensitivity analysis: convergence of governance indicators by group of countries (2006-2015)
Leading group of
countries: AT, BE, EE, FI, FR, DE, IE, LU, NT)
Other countries: CY, EL, IT, LV, LT, MT, PT, SK,
SI, ES
Differences
in means
Non-anonymous convergence
Differences in means
Non-anonymous convergence
Voice and Accountability
-0.2121 0.0135 -0.0806 0.0088
Political Stability and Absence of
Violence/Terrorism -0.1441 0.0227 -0.0108 0.0099
Government Effectiveness
-0.4161 0.0011 -0.2898 -0.0040
Regulatory Quality -0.3078 -0.0005 -0.3099 0.0020
Rule of Law 0.0718 0.0165 0.2928 -0.0015
Control of Corruption
-0.0799 0.0206 -0.0784 0.0142
Aggregate indicator
-0.1239 0.0328 -0.2240 0.0253
Source: Own construction based on World Bank (2016b).

28
Figure A1. Country contributions to inequality in institutional quality and economic
growth
Source: Own construction.
AT
BE
CY
EE
FI
FR DE
EL
IE
IT
LV
LT
LU
MT
NT
PT
SK
SI
ES
‐6
‐4
‐2
0
2
4
6
‐4% ‐3% ‐2% ‐1% 0% 1% 2% 3% 4%
Differencesincountrycontributionsto
ineq
uality(2006‐2015)
Annual average economic growth rate (2006‐2015)

29
Figure A2. Country contributions to inequality in institutional quality and
unemployment rate
Source: Own construction.
AT
BE
CY
EE
FI
FRDE
EL
IEIT
LV
LT
LUMT
NT
PT
SK
SI
ES
‐6
‐4
‐2
0
2
4
6
‐100% ‐50% 0% 50% 100% 150% 200% 250%
Differencesincountrycontributionsto
ineq
uality(2006‐2015)
Variation rate of unemployment rate (2006‐2015)
30
Figure A3. Country contributions to inequality in institutional quality and in-work at-
risk-of-poverty rate
Source: Own construction.
AT
BE
CY
EE
FI FR
DE
EL
IE
IT
LV
LT
LU
MT
NT
PTSK
SI
ES
‐6
‐4
‐2
0
2
4
6
‐40% ‐20% 0% 20% 40% 60% 80%
Differencesincountrycontributionsto
ineq
uality(2006‐2015)
Variation rate of in‐work at‐risk‐of‐poverty rate (2006‐2015)

31
Figure A4. Country contributions to inequality in institutional quality and expenditure
in social protection
Source: Own construction.
AT
BE
CY
EE
FI
FRDE
EL
IE
IT
LV
LT
LU
MT
NT
PT
SK
SI
ES
‐6
‐4
‐2
0
2
4
6
‐10% ‐5% 0% 5% 10% 15% 20% 25% 30% 35% 40%
Differences in country contributions to ineq
uality in insitutions (2006‐2015)
Variation rate of expenditure in social protection (% of GDP 2006) (2006‐2015)

32
Figure A5. Country contributions to inequality in institutional quality and expenditure
in social protection (except unemployment)
Source: Own construction.
AT
BE
CY
EE
FI
FRDE
EL
IE
IT
LV
LT
LU MT
NT
PT
SK
SI
ES
‐6
‐4
‐2
0
2
4
6
‐10% ‐5% 0% 5% 10% 15% 20% 25% 30% 35% 40%
Differences in country contributions to ineq
uality in insitutions (2006‐2015)
Variation rate of expenditure in social protection except unemployment (% of GDP 2006) (2006‐2015)

The UNU‐MERIT WORKING Paper Series 2017-01 The economic impact of East‐West migration on the European Union by Martin
Kahanec and Mariola Pytliková 2017-02 Fostering social mobility: The case of the ‘Bono de Desarrollo Humano’ in Ecuador
by Andrés Mideros and Franziska Gassmann 2017-03 Impact of the Great Recession on industry unemployment: a 1976‐2011
comparison by Yelena Takhtamanova and Eva Sierminska 2017-04 Labour mobility through business visits as a way to foster productivity by
Mariacristina Piva, Massimiliano Tani and Marco Vivarelli 2017-05 Country risk, FDI flows and convergence trends in the context of the Investment
Development Path by Jonas Hub Frenken and Dorcas Mbuvi 2017-06 How development aid explains (or not) the rise and fall of insurgent attacks in Iraq
by Pui‐Hang Wong 2017-07 Productivity and household welfare impact of technology adoption: Micro‐level
evidence from rural Ethiopia by Tigist Mekonnen 2017-08 Impact of agricultural technology adoption on market participation in the rural
social network system by Tigist Mekonnen 2017-09 Financing rural households and its impact: Evidence from randomized field
experiment data by Tigist Mekonnen 2017-10 U.S. and Soviet foreign aid during the Cold War: A case study of Ethiopia by Tobias
Broich 2017-11 Do authoritarian regimes receive more Chinese development finance than
democratic ones? Empirical evidence for Africa by Tobias Broich 2017-12 Pathways for capacity building in heterogeneous value chains: Evidence from the
case of IT‐enabled services in South Africa by Charlotte Keijser and Michiko Iizuka 2017-13 Is innovation destroying jobs? Firm‐level evidence from the EU by Mariacristina
Piva and Marco Vivarelli 2017-14 Transition from civil war to peace: The role of the United Nations and international
community in Mozambique by Ayokunu Adedokun 2017-15 Emerging challenges to long‐term peace and security in Mozambique by Ayokunu
Adedokun 2017-16 Post‐conflict peacebuilding: A critical survey of the literature and avenues for
future research by Ayokunu Adedokun 2017-17 Effects of health insurance on labour supply: A systematic review by Nga Le, Wim
Groot, Sonila M. Tomini and Florian Tomini\ 2017-18 Challenged by migration: Europe's options by Amelie F. Constant and Klaus F.
Zimmermann 2017-19 Innovation policy & labour productivity growth: Education, research &
development, government effectiveness and business policy by Mueid Al Raee, Jo Ritzen and Denis de Crombrugghe
2017-20 Role of WASH and Agency in Health: A study of isolated rural communities in Nilgiris and Jalpaiguri by Shyama V. Ramani
2017-21 The productivity effect of public R&D in the Netherlands by Luc Soete, Bart Verspagen and Thomas Ziesemer
2017-22 The role of migration‐specific and migration‐relevant policies in migrant decision‐making in transit by Katie Kuschminder and Khalid Koser

2017-23 Regional analysis of sanitation performance in India by Debasree Bose and Arijita Dutta
2017-24 Estimating the impact of sericulture adoption on farmer income in Rwanda: an application of propensity score matching by Alexis Habiyaremye
2017-25 Indigenous knowledge for sustainable livelihoods: Lessons from ecological pest control and post‐harvest techniques of Baduy (West Java) and Nguni (Southern Africa) by Leeja C Korina and Alexis Habiyaremye
2017-26 Sanitation challenges of the poor in urban and rural settings: Case studies of Bengaluru City and rural North Karnataka by Manasi Seshaiah, Latha Nagesh and Hemalatha Ramesh
2017-27 Heterogeneous effects of bilateral investment treaties by Rod Falvey and Neil Foster‐McGregor
2017-28 Willingness to pay for agricultural risk insurance as a strategy to adapt climate change by Tigist Mekonnen
2017-29 Social protection investments, human capital, and income growth: Simulating the returns to social cash transfers in Uganda by Stephan Dietrich, Daniele Malerba, Armando Barrientos, Franziska Gassmann, Pierre Mohnen, Nyasha Tirivayi, Susan Kavuma and Fred Matovu
2017-30 Opening and linking up: Firms, global value chains and productivity in Latin America by Pierluigi Montalbano, Silvia Nenci and Carlo Pietrobelli
2017-31 Husbands' return migration and wives' occupational choices by Clotilde Mahé 2017-32 The need to customise innovation indicators in developing countries by Michiko
Iizuka and Hugo Hollanders 2017-33 Economic diversification: Explaining the pattern of diversification in the global
economy and its implications for fostering diversification in poorer countries by Clovis Freire
2017-34 How inequality hurts growth: Revisiting the Galor‐Zeira model through a Korean case by Bogang Jun, Mary Kaltenberg and Won‐Sik Hwang
2017-35 Is the demand‐pull driver equally crucial for product vs process innovation? by Herbert Dawid, Gabriele Pellegrino and Marco Vivarelli
2017-36 Testing linear growth rate formulas of non‐scale endogenous growth models by Thomas HW Ziesemer
2017-37 Promoting structural transformation: Strategic diversification vs laissez‐faire approach by Clovis Freire
2017-38 On the relationship between the breadth of PTAs and trade flows by Rod Falvey and Neil Foster‐McGregor
2017-39 Occupational choice of return migrants: Is there a 'Jack‐of‐all‐trades' effect? by Clotilde Mahé
2017-40 Rates of return to antipoverty transfers in Uganda by Stephan Dietrich, Daniele Malerba, Armando Barrientos and Franziska Gassmann
2017-41 Multinational firms and the extractive sectors in the 21st century: Can they drive development? by Rajneesh Narula
2017-42 Financial mechanism to invest in knowledge from natural resource revenues: Experiences from Bolivia, Chile, Colombia and Peru by Michiko Iizuka, Fernando Vargas, Jakob Baumann
2017-43 Ageing, human capital and demographic dividends with endogenous growth, labour supply and foreign capital by Anne Edle von Gäßler and Thomas Ziesemer

2017-44 The healthy immigrant paradox and health convergence by Amelie F. Constant 2017-45 Stock‐flow consistent data for the Dutch economy, 1995‐2015 by Joan Muysken,
Bas Bonekamp and Huub Meijers 2017-46 Emergent structures in faculty hiring networks, and the effects of mobility on
academic performance by Robin Cowan and Giulia Rossello 2017-47 Institutional diversity in the Euro area: any evidence of convergence? by Salvador
Pérez‐Moreno, Elena Bárcena‐Martín and Jo Ritzen