working paper series 9 16 public service motivation as a...
TRANSCRIPT

Working Paper Series
WP-19-16
Public Service Motivation as a Predictor of Altruism, Dishonesty, and Corruption
Jordan Gans-Morse Associate Professor of Political Science and IPR Associate
Northwestern University
Alexander Kalgin National Research University Higher School of Economics
Version: May 30, 2019
DRAFT Please do not quote or distribute without permission.
Andrei KlimenkoNational Research University Higher School of Economics
Dmitriy VorobyevUral Federal University and CERGE-EI
Andrei YakovlevNational Research University Higher School of Economics

ABSTRACT
Understanding how Public Service Motivation (PSM) is tied to ethical or unethical behavior is critically important, given that civil servants and other public sector employees throughout the world have been shown to exhibit high PSM levels. However, empirical evidence about the relationship between PSM and ethical conduct remains limited, due in part to the challenges of observing illicit behaviors and overcoming social desirability bias in self-reported measures. The researchers address these challenges by employing incentivized experimental games to study the relationships between PSM and altruism, dishonesty, and propensity to engage in corruption. Based on data from approximately 1870 university students at three research sites in Russia and Ukraine, they find evidence of a robust positive association between PSM and altruistic behavior and negative association between PSM and willingness to engage in corruption. Results concerning dishonesty are more mixed. The researchers’ extension of the study of PSM to Russia and Ukraine, two countries that consistently rank poorly on international corruption indicators, additionally offers the opportunity to analyze the role of PSM in a context in which corruption and rule breaking are widespread.
Funding Acknowledgment: This study was prepared within the framework of the HSE University Basic Research Program and funded by the Russian Academic Excellence Project '5-100'. Support was also received from the Equality Development and Globalization Studies (EDGS) program at Northwestern University, funded by the Rajawali Foundation in Indonesia.

1
Are individuals with high levels of Public Service Motivation (PSM) more likely to exhibit
altruism, less likely to behave dishonestly, or less willing to engage in corruption? Since Perry
& Wise’s (1990) seminal formulation of the concept of PSM, scholars of Public Administration
have recognized that some individuals are motivated less by self-interest and more by a desire to
contribute to the public good, help others, or improve society. And given that a number of the
values underlying PSM – compassion, social justice, self-sacrifice – also are the bedrock for
ethical behavior (Maesschalck et al. 2008), it follows that high levels of PSM are likely to be
associated with ethical conduct. Conversely, it would seem reasonable to expect low levels of
PSM to be associated with unethical conduct.
Whether PSM levels predict individuals’ propensity for ethical or unethical behavior has
important policy implications, for abundant evidence suggests that civil servants and other public
sector employees have higher levels of PSM than their private sector counterparts (see, e.g.,
Crewson 1997; Houston 2000; Lewis & Frank 2002) and that university students with high PSM
levels are more likely to aspire to public sector careers (see, e.g., Vandenabeelee 2008; Liu et al.
2011; Carpenter et al. 2012; Clerkin & Coggburn 2012; Gans-Morse et al. 2019). Yet due to a
dearth of Public Administration research on ethical and unethical conduct, empirical analysis
evaluating propositions about PSM’s relationship to ethical behavior is only beginning to
emerge.1 Early evidence of a link between PSM and ethical conduct was indirect, such as Brewer
& Selden’s (1998) study showing that federal employees’ motivations for reporting rule
violations (i.e., whistle blowing) are more consistent with a theory of PSM than with competing
theories. Later studies that examined the correlation between direct measures of PSM and ethical
or pro-social behaviors relied on self-reported activities such as volunteering, charitable
contributions, or donating blood (e.g., Houston 2005; Coursey et al. 2011; Wright et al. 2016),
1 See Belle & Cantarelli (2017) for a recent review of the Public Administration literature on unethical conduct.
2
leaving open the possibility that these measures suffer from respondents’ inclination to
exaggerate their engagement in activities perceived as socially desirable. Meanwhile, because of
the challenge of observing or collecting accurate self-reported data on illicit behavior, the small
handful of studies that have investigated the relationships between PSM and unethical or corrupt
practices have relied on hypothetical vignettes (e.g., Lim Choi 2004; Kwon 2012). Consequently,
despite these studies’ important contributions, nearly all existing PSM-related research2 on
ethical or unethical conduct falls short of offering evidence regarding the relationships between
PSM and observable behavior.
In this article, which draws on three studies conducted with approximately 1870 university
students in Russia and Ukraine, we address the challenges of social desirability bias and the
difficulties inherent in measuring illicit behavior by employing incentivized experimental games.
Frequently used by behavioral economists, these games offer subjects cash payments, the value
of which is conditional on choices made during the study, to elicit observable behavior indicative
of revealed preferences. First, following studies such as Banuri & Keefer (2013), Hanna & Wang
(2017), and Barfort et al. (2019), we measure altruism using a modified dictator game in which
subjects are given an initial endowment and then must choose how much of the payment to keep
for themselves and how much to donate to local charities. The game therefore presents subjects
with a real-world tradeoff between their personal financial wellbeing and the opportunity to help
others at one’s own expense. Second, we utilize a dice task game developed by Barfort et al.
(2019) and Olsen et al. (2019) to measure dishonesty.3 This game requires subjects to repeatedly
guess the outcome of a dice roll. The subject earns three times as much for correct guesses as for
2 Two recent and important exceptions, Esteve et al. (2016) and Olsen et al. (2019), are discussed below. 3 Barfort et al. (2019) and Olsen et al. (2019) were conducted by the same research team with overlapping samples of Danish university students. The two studies, however, focus on different research questions and accordingly we cite each study separately at points throughout this article.
3
incorrect guesses, and the game’s setup presents participants with the opportunity to earn more
money by dishonestly exaggerating the number of correct guesses reported. A comparison of the
observed distribution of an individual’s correct guesses over 40 repeated dice rolls to the
expected distribution of an honest individual allows for estimation of each subject’s cheat rate.
Finally, to measure subjects’ propensity to engage in corruption, we utilize a modified version of
a laboratory bribery game developed by Barr & Serra (2010). In contrast to our indicator for
dishonesty, the bribery game captures the multi-dimensional nature of a bribe transaction, such
as the need to find a willing bribe partner, the harm incurred to other members of society, and the
moral element of engaging in an act explicitly labeled as a “bribe.” As we discuss below, the
external validity of all three games has been demonstrated in various settings, indicating that
subjects’ choices in these experimental games reflect choices made in real-world situations.
Using the 16-item PSM scale developed by Kim et al. (2012), we find a robust positive
correlation between PSM and altruistic behavior and a robust negative correlation between PSM
and propensity to engage in corruption.4 These findings hold not only for the full 16-item PSM
scale but also for each of Kim et al.’s (2012) four PSM dimensional scales – Attraction to Public
Service (APS), Commitment to Public Values (CPV), Compassion (COM), and Self-Sacrifice
(SS). Moreover, the findings are robust to controlling for potentially confounding factors such as
gender, risk aversion, ability (measured by self-reported GPA), family income, class year, and
academic specialization (i.e., in which university department the participant is enrolled). By
contrast, while we find that PSM is negatively correlated with dishonesty, the correlations are
substantively small and statistically insignificant once we control for potential confounders.
4 The Kim et al. (2012) scale builds on Perry’s (1996) original PSM scale but was designed by an international team of scholars to account for cross-cultural distinctions

4
These findings are most closely related to two recent studies, Esteve et al. (2016) and Olsen
et al. (2019). The former shows a positive correlation between PSM and pro-social behavior
measured by contribution levels in a public goods game conducted with university students in the
Netherlands; the latter finds a negative correlation between PSM and dishonesty as measured by
a dice task game conducted with university students in Denmark. However, our research
advances the literature in several important ways. First, this article is among the handful of
studies that explicitly investigate the relationship between PSM and corruption and the first to do
so using a comprehensive PSM scale and experimental measure of corruption. Second, our use of
data from three distinct research sites – and the remarkable consistency of our results across
three subject pools – attests to the generalizability of our findings in a way that research
conducted at a single site cannot. Third, our reliance on multiple experimental games, rather than
a single experimental task, facilitates fine-grained analysis of PSM’s relationship to similar yet
conceptually distinct phenomena. For example, if we had only employed the dice task game, we
would have found no relationship between PSM and unethical behavior in the form of
dishonesty, in direct contrast to Olsen et al.’s (2019) results. But our more nuanced finding of a
weak relationship between PSM and dishonesty yet also a robust negative association between
PSM and willingness to engage in corruption may indicate that these relationships are moderated
by the type and severity of the unethical behavior.
Finally, the stark contrast of our research environment in Russia and Ukraine to the research
environment of these earlier studies facilitates analysis of how societal levels of corruption affect
the ways PSM operates. As Olsen et al. (2019) emphasize, Denmark is among the least corrupt
countries in the world, ranking either first or second out of 180 countries and territories in
Transparency International’s Corruption Perceptions Index (TI-CPI) every year between 2016
5
and 2018. During this three-year interval, the Netherlands consistently ranked eighth. On the
other end of the spectrum, Russia’s rankings ranged between 131st to 138th; Ukraine’s, from
120th to 131st.5 Little is known about PSM in high-corruption contexts.6 One possibility is that
PSM plays a distinctly different role when corruption is widespread, in line with Cowley &
Smith’s (2014) finding that public sector employees exhibit higher levels of intrinsic motivation
and pro-social behavior than private sector employees in low-corruption countries but not in
high-corruption countries. These results could indicate that individuals with high PSM either
avoid joining or do not remain for long in the civil service when faced with high corruption
levels.7 Yet even if individuals with high PSM avoid the civil service in high-corruption
countries, it may also be true that these individuals behave more ethically. Our findings here
suggest that the relationships between PSM and ethical and unethical conduct are similar across
the high-corruption context of Russia and Ukraine and the low-corruption context of Denmark
and the Netherlands.
The following section examines the existing literature on PSM and its relationships to
altruism, dishonesty, and corruption in greater detail. We then turn to discussion of our research
design before presenting our results.
Theory
Public Service Motivation (PSM) frequently is defined as individuals’ predispositions for
responding to motives related to the well-being of others, the public interest, and the
5 See www.transparency.org/research/cpi/overview. 6 Olsen et al. (2019) analyze differences in levels of dishonesty, as measured by incentivized dice task games, across high and low-corruption environments but do not analyze how the relationships between PSM and ethical or unethical behaviors differs across such environments. 7 Contrary to this proposition, we have shown recently in related research that PSM predicts a preference for public sector employment among university students in Russia (Gans-Morse et al. 2019), a finding similar to that of Liu et al. (2011) in China, which in 2018 was ranked 87th in the TI-CPI.

6
improvement of society as a whole (Perry & Wise 1990), or in the words of Vandenabeele (2007,
547) “the beliefs, values, and attitudes that go beyond self-interest and organizational interest,
that concern the interest of a larger political entity and that motivate individuals to act
accordingly whenever appropriate.” Given that PSM and ethical conduct exhibit a number of
underlying shared values – a focus on fairness, social justice, and self-sacrifice, among others –
there are sound reasons to expect that higher PSM should be associated with higher levels of
ethical behavior (see, e.g., Maesschalck et al. 2008).
Until recently, however, evidence of the correlation between PSM and ethical conduct was
circumscribed. Rather than directly assessing the link between indicators of PSM and pro-social
behaviors, early work offered indirect evidence. Brewer & Selden (1998) demonstrated, for
example, that whistleblowers in the federal government are more motivated by regard for the
public interest, and less motivated by personal reward or job security, than colleagues who are
unwilling to whistle blow. Houston (2005), meanwhile, found that public employees – who in
earlier studies had been shown to exhibit higher levels of PSM – are more likely than their
private sector counterparts to volunteer for charities or donate blood. More recent work has
considered the relationship between direct measures of PSM, such as the PSM scale developed
by Perry (1996), and pro-social behavior such as willingness to volunteer (Coursey et al. 2011;
Lee & Jeong 2015) or report unethical behavior in one’s organization (Wright et al. 2016).
However, these studies continued to rely on self-reported measures of behavior, with the
attendant risk of bias resulting from survey respondents’ efforts to portray themselves in a
positive light. Only one study, Esteve et al. (2016), has linked PSM to observable pro-social
behavior, showing that participants with higher PSM contribute more in an incentivized public
goods game. Although these studies were conducted in low-corruption contexts, further
7
distinguishing our study from the existing literature, we draw on them to derive our first
hypothesis:
Hypothesis 1: Higher PSM levels will be associated with higher levels of altruism.
If PSM has shared underlying values with ethical behavior, then it should follow that it
would have the opposite relationship with unethical behavior. However, as Belle & Cantarelli
(2017) make clear, Public Administration research in general, and research on PSM in particular,
rarely has examined the roots of unethical conduct. A rare exception among earlier work on PSM
is Lim Choi (2004), who showed that civil servants in the United States with higher levels of
PSM are more likely to select the moral choice when presented with hypothetical vignettes about
ethical dilemmas. More recently, Olsen et al. (2019) find robust evidence that PSM is negatively
associated with dishonesty among university students in Denmark, as measured by a repeated
dice task game.8 We employ the same approach Olsen et al. (2019) use in the low-corruption
context of Denmark in the high-corruption contexts of Russia and Ukraine, presenting a tougher
test of whether individuals with high levels of PSM are less prone to dishonesty even in an
environment where rule-breaking is common:
Hypothesis 2: Higher PSM levels will be associated with lower dishonesty. Given its emphasis on the public interest, it might be expected that PSM would be
particularly incompatible with corruption – a specific type of unethical behavior involving the
abuse of public sector resources for private gain. However, Public Administration research on
corruption is scant, as noted in Bozeman et al.’s (2018) recent literature review, and research
devoted specifically to PSM and corruption is nearly nonexistent. Kwon’s (2012) study of civil
8 In another recent study about PSM and unethical conduct, Christensen & Wright (2018) found in laboratory experiments with US university students that priming subjects with exercises known to activate a sense of PSM did not reduce propensity to engage in unethical conduct, as measured by willingness to cheat in an incentivized dice task game. However, this null finding may have resulted from unusually low cheat rates in their experiments.

8
servants in South Korea finds that a component of PSM – intrinsic motivation – is associated
with a lower propensity for corruption, as measured using a hypothetical vignette. Cowley &
Smith (2014), meanwhile, show that while intrinsic motivation is higher among public
employees relative to private sector workers throughout much of the world, this association is
weaker in countries with high levels of corruption. Our study, however, is the first to examine
the link between PSM and corruption while utilizing a direct measure of PSM and an indicator of
observable behavior related to corruption. In line with broader expectations about PSM and
unethical conduct, we test the hypothesis that PSM and corruption will be negatively correlated:
Hypothesis 3: Higher PSM levels will be associated with a lower propensity to engage in corruption.
Research Design
Sampling and Implementation
We conducted our studies with undergraduate and masters students at three different sites:
A top-five Russian university located in Moscow, a major regional Russian university, and a
Ukrainian university located in a major regional city. At the research sites in Russia we focused
on social science departments, a group that exhibits a significant number of students with an
interest in public sector careers, including students from Public Administration departments. In
Ukraine, where Public Administration programs are less developed, we chose a law academy as
a site where we could reasonably expect a concentration of students with public sector ambitions.
For the two Russian research sites, we recruited students using flyers, emails, and classroom
announcements by research assistants and also allowed students to invite other students to
participate via a module at the end of the survey. The survey and experimental games were
conducted online using Qualtrics. To mitigate concerns about participants’ attentiveness in an

9
online study, we employed screener questions (Berinsky et al. 2014). The overall level of
attentiveness was high, particularly in Moscow, and results for both studies are robust to the
exclusion of inattentive participants. The Moscow study, which was conducted between May 27
and June 15 of 2016, included 804 participants; the regional study, which was conducted
between December 8, 2017 and January 22, 2018, included 376.9
For the Ukrainian research site, we recruited a random sample stratified by class year and
department using enrollment data provided by the university administration. Research assistants
visited classrooms and requested the participation of students from the sample. When students
were not present, their names were replaced with the next person on the list until quotas for each
department and class year were filled.10 Those that agreed to participate were then directed to the
university’s computer labs and presented with instructions on the computer screens. The survey
and experimental games were again conducted using Qualtrics. The study was carried out
between October 25 to November 3, 2017 and included 695 participants.11
On average, participants in the Moscow study received the equivalent of approximately 14
USD, participants in the regional study received the equivalent of approximately 9 USD, and
participants in the Ukraine study received the equivalent of approximately 4 USD. It was made
9 The academic departments most heavily represented in the Moscow sample were Public Administration, comprising 25 percent; Economics, with 14 percent; Sociology, with 14 percent; Business, with 12 percent; Political Science, with 10 percent; and Communications, with 6 percent. For the regional sample, 56 percent were from the university’s Institute of Economics and Economic Management, 34 percent from the Institute of Public Administration and Entrepreneurship, and 10 percent were from other institutes. 10 Students were notified of the potential to earn money but were given the option to refuse to participate. Response rates varied by department from 14 percent to 41 percent, with an average response rate for the sample of 27 percent. Students rarely refused to participate, but on any given day for any given auditorium or classroom in which recruiting was conducted a number of students were either absent or in a different location than indicated by the university administration. 11 Within the legal academy where the study was conducted, distinct departments are devoted to specialized legal training. Nineteen percent of students were from the Institute of Criminal Justice; 14 percent, the Faculty of Social Law; 14 percent, the Faculty of Advocacy; 14 percent, the Judicial and Administrative Faculty; 13 percent, the Faculty of Civil and Commercial Justice; and 9 percent, the Investigator Training Faculty. Additionally, 10 percent were from the academy’s Department of Journalism and 6 percent from the Department of Political Science, Sociology, and Psychology.

10
clear to participants that the payoffs for each of the experimental games were independent and
that their total payoff would be the sum of their earnings from across the games.12 All
experimental games were conducted at the outset of the study to ensure that responses to survey
questions would not influence participants’ choices.13 The language of the research instruments
in all three studies was Russian.14
Measurement – Experimental Games
A significant challenge for studies of unethical conduct such as dishonesty or corruption is
that respondents may be unlikely to offer sincere responses to interview or survey questions.
Meanwhile, respondents may be prone to exaggerate self-reported behavior related to ethical
conduct or pro-social activities. To mitigate these challenges, our study employed experimental
games that utilize incentive payments to elicit observable behavior, allowing researchers to make
inferences about participants’ preferences from the choices they make when confronted with
decisions that lead to real-world financial loss or gain. Three games were employed to measure
altruism, dishonesty, and propensity for corruption. The full scripts for all games can be found in
the Online Appendix.
Pro-Social Preferences Game: To measure altruism, we employed a modified dictator game,
an approach frequently used by economists (see, e.g., Banuri & Keefer 2013; Hanna & Wang
2017; Barfort et al. 2019). We allotted participants a sum of money and then allowed participants
12 Students in the Moscow study were required to appear in person to present a unique, randomly generated code received at the end of the online study in order to receive their incentive payments. Payments for the regional study and Ukraine study were made via participants’ mobile phones following the study’s completion. 13 All participants first engaged in a modified dictator game, then in 20 rounds of the dice task game, then in the bribery game, then in a lottery game measuring risk aversion, and then in another 20 rounds of the dice task game. Survey questions, including items for the PSM scale, then followed. 14 The university at which the Ukraine study was conducted is located in a region where Russian is the predominant language and one of the official regional languages.

11
to keep this money or donate to charity. Actual donations were made in accordance with the
participants’ preferences. The game therefore places participants in a scenario that encompasses
a direct tradeoff between personal financial gain and efforts to promote broader societal goals.
Dice Task Game To measure dishonesty, the study utilized the dice task game developed
by Barfort et al. (2019) and Olsen et al. (2019).15 Respondents were asked to imagine a dice roll,
guess a number between 1 and 6, and then click to the next screen. On this screen a picture of a
dice was shown with a randomly generated outcome. Participants were then asked to record the
number they had imagined and then click to the next screen. For correct guesses, participants
earned three times more than for incorrect guesses. Since there was no way for our research team
to observe participants’ guesses, an incentive existed to dishonestly report guesses that matched
the randomly generated outcome in order to increase one’s payoff. Participants engaged in 20
rounds of this exercise at two points in the study, for a total of 40 rounds. An honest participant
on average would guess between 6 and 7 rolls correctly. Comparison of a participant’s number of
successful guesses reported to the expected distribution of successful guesses under the
assumption of honest reporting allows for estimation of the participant’s cheat rate, as discussed
in greater detail below.
Bribery Game Unlike the dice task game, which focuses narrowly on willingness to increase
one’s payoff by acting dishonestly, the bribery game encompasses multiple dimensions of a real-
world bribery experience: the question of ethical norms, strategic uncertainty about whether a
bribe will be accepted, and the potential harm to other members of society.16
15 The approach introduced and utilized in Barfort et al. (2019) and Olsen et al. (2019) builds on Hanna and Wang (2017), which in turn is a modification of Fischbacher & Föllmi-Heusi (2013). 16 The bribery game uses explicit corruption framing rather than neutral language (e.g., we use the term “bribes” rather than “transfers” and label the players “citizen” and “bureaucrat” rather than Player A and Player B). As Alatas et al. (2009) note, explicit framing may offer more direct insights into participants’ motivations for engaging or not engaging in corruption, and like Alatas et al. (2009) we asked subjects to elaborate on the motivations underlying their decisions at the end of the game. For further consideration of framing effects, see Barr & Serra (2009).
12
The bribery game used in the study builds off of Barr & Serra (2010) (for similar games, see
Abbink et al. 2002 and Cameron et al. 2009). Participants were randomly assigned to the role of
citizen or bureaucrat and subjects in both roles received an initial endowment of equal value. The
citizen then was presented with a scenario in which she could more than double her initial
endowment by obtaining a permit. When she seeks to obtain the permit, however, she is denied
and informed that to avoid a long and burdensome reapplication process, she may offer a bribe to
the bureaucrat. Bribing entails a risk of punishment, so for offering a bribe the citizen loses
approximately one-third of the initial endowment, regardless of whether the bureaucrat accepts
or rejects the offer.17 The bureaucrat next decides whether or not to accept the bribe, incurring a
fine of approximately two-fifths of the initial endowment for engagement in corruption, a cost
larger than that imposed on the citizen to reflect the greater harm done to society when officials
act corruptly. If the bureaucrat accepts the bribe, the citizen receives the permit and the
correspondingly higher payoff.18 Additionally, when the citizen offers and the bureaucrat
accepts a bribe, then two additional participants (chosen at random) each incur a small loss
(approximately one-seventh of the initial endowment), representing the harm that corruption
inflicts on society at large.
We constructed payoffs so that participants could, with the aid of a payoff matrix, easily
identify the range of bribes that increase the overall payoffs for both the bureaucrat and citizen
and therefore should be accepted by participants guided solely by self-interest. However, if the
bureaucrat incorporates considerations other than financial payoffs into her decision and rejects
17 To avoid the conflation of risk aversion and aversion to corruption, we chose, following Barr & Serra (2010), not to make punishment probablistic. 18 We use strategy elicitation for the bureaucrat role, in which the participant indicates whether she would accept or reject each possible bribe amount. After the study concluded, payoffs were determined by randomly sorting participants into pairs of citizens and bureaucrats. This process was made explicit to participants.

13
the citizen’s offer, the citizen is strictly worse off, receiving a payoff of about two-thirds the
initial endowment with which she began the game.
The primary indicator of interest for the purpose of our study was whether an individual
offers (in the role of citizen) or accepts (in the role of bureaucrat) a bribe.
External Validity These experimental games facilitate measurement based on observed
behavior, but an important question concerns the extent to which behavior in the experimental
setting correlates with real-world behavior. Fortunately, abundant evidence indicates that
concerns about the artificiality of these experimental measures should not be overstated. With
respect to our measure of altruism, a number of studies show that donations in laboratory games
are strong predictors of real-world pro-social behavior such as charitable giving (see, e.g., Benz
and Meier, 2008; Franzen & Pointner 2013). Dice task games have been similarly validated, with
several studies showing that dishonesty in these games is correlated with various forms of
cheating, fraud, and rule breaking in schools, the workplace, and prisons (Cohn et al. 2015;
Hanna & Wang 2017; Cohn & Maréchal 2018). Finally, Barr & Serra (2010) demonstrate a
remarkable connection between real-world conditions and outcomes in their bribery games,
which were conducted at Oxford University: Oxford students from foreign countries that rank
poorly on global corruption indicators were significantly more likely to engage in corruption in
the laboratory than students from low-corruption countries. In short, when real-world behavior is
difficult to observe, the existing evidence suggests that indicators derived from experimental
games offer a valuable alternative.
14
Measurement – Public Service Motivation and Control Variables
To measure Public Service Motivation (PSM), we used a 16-item scale developed by Kim et
al. (2012). This version of the scale builds on Perry’s (1996) original scale but was designed by
an international team of scholars to account for cross-cultural distinctions. The scale consists of
an unweighted average of a series of attitudinal questions, shown in English and in Russian
translation in the Online Appendix, measuring four dimensions of PSM: (1) Attraction to Public
Service (APS), (2) Commitment to Public Values (CPV), (3) Compassion (COM), and (4) Self-
Sacrifice (SS). The Online Appendix also presents the results of confirmatory factor analysis
(CFA) showing that the four-factor model is a reasonable fit to the data for all three research
sites.19 Moreover, for all three samples, reliability coefficients (Cronbach’s α) for the full PSM
scale were above 0.85 and at or above the 0.70 threshold for acceptable internal consistency for
each of the four dimensions with the exception of CPV in the Moscow study.
We additionally collected a wide variety of data on demographic and attitudinal indicators
that could potentially be correlated with both PSM and altruism, dishonesty, or propensity to
engage in corruption. To measure risk aversion, we used a series of paired lottery choices in
which participants selected between a series of fixed payoffs and lotteries with a 50 percent
chance of receiving no payment and a 50 percent chance of receiving a higher payment (see Holt
& Laury 2002). The indicator of interest is the number of certain payoffs an individual chooses
before switching to a riskier – though potentially higher paying – lottery. We also collected data
on gender, class year (i.e., first-year, second-year, MA student), academic specialization, family
income, and ability (measured with self-reported GPA).
19 For all samples, the fit is improved if the COM dimension is excluded, but for the sake of comprehensively evaluating the relationship between PSM and ethical and unethical behavior we retain all dimensions in our analyses. Our findings are qualitatively and quantitatively similar if we use a PSM scale excluding the COM dimension.

15
Results
Descriptive Statistics
Before turning to our primary analysis, we present a brief overview of the outcomes from the
experimental games and summary statistics for the PSM scale, beginning with measures of
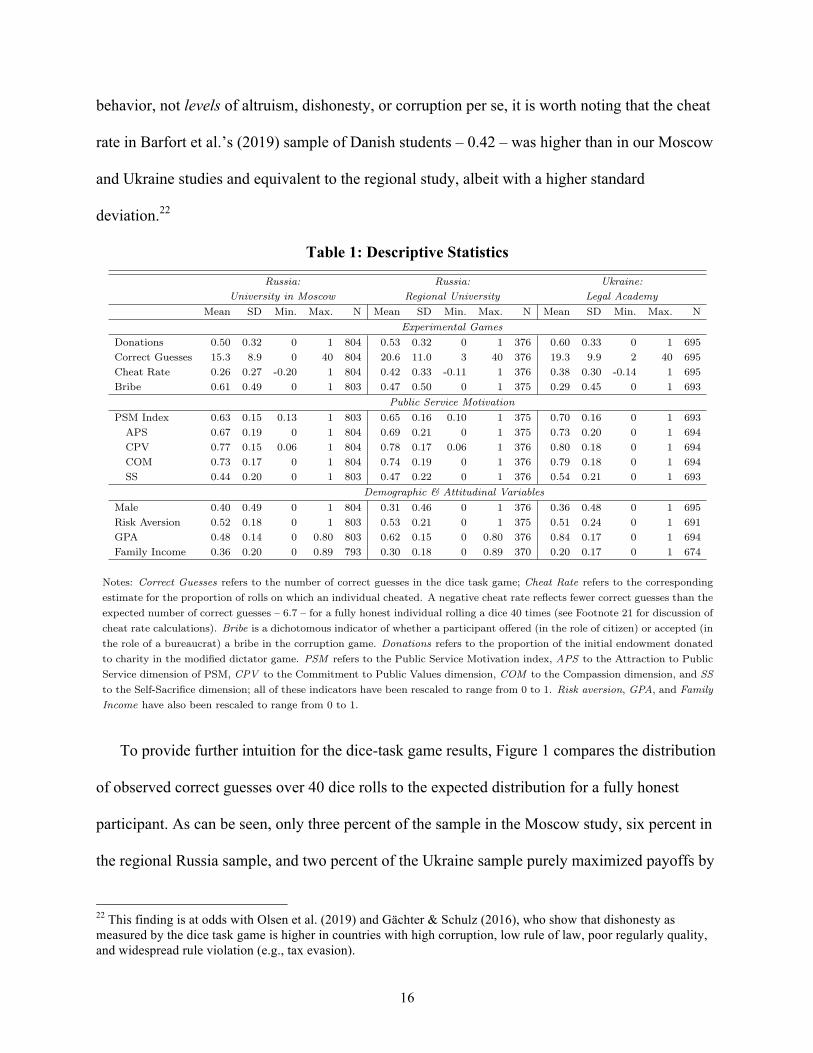
altruism from the dictator game. As can be seen in Table 1, on average participants in the
Moscow study donated approximately 50 percent of their initial endowment to charity, compared
to 53 percent in the regional Russia study and 60 percent in the Ukraine study. It should be noted
that the Ukrainian students participated in a university laboratory, whereas the participants at
both Russian sites participate online at a time and location of their choosing, meaning that results
across the Russian and Ukrainian studies are not strictly comparable.20
With respect to measures of dishonesty from the dice task game, Table 1 shows that the
average number of reported correct guesses was approximately 15 in the Moscow study, 19 in
the Ukraine study, and 21 in the Russian regional study – far higher than the 6.7 correct guesses
that would be expected on average from a fully honest individual reporting correct guesses for 40
dice rolls. Following Barfort et al. (2019) and Olsen et al. (2019), we estimate cheat rates, or the
proportion of the 40 rolls on which an individual likely reported dishonestly.21 Average cheat
rates range from 0.26 in Moscow (meaning that in Moscow on average participants reported
dishonestly on just over every fourth dice roll) to 0.38 in the Ukraine study and 0.42 in the
Russian regional study. Although our focus is on the correlation between PSM and observable 20 For point of reference, Danish students in Barfort et al. (2019) – which used an online research instrument as in our two studies in Russia – donated around 45 percent of the initial endowment on average, despite a slightly different set up of the dictator game in which researchers matched contributions as participants’ donations increased. (Note that unlike our study, Barfort et al. 2019 does not examine the relationship between PSM and altruism.) 21 Each participant’s reported number of correct guesses Yi is a function of the number of dice rolls K = 40, the probability of a correct guess p = 1/6, and individual i’s CheatRate, such that Yi = K(p+(1−p)CheatRatei). Rearranging produces the estimated cheat rate:
𝐶ℎ𝑒𝑎𝑡𝑅𝑎𝑡𝑒 =65
𝑌!40 −
16
Note that a downside of this estimator is that for sufficiently small Yi (i.e., for individuals who are both honest and unlucky), the estimated cheat rate can be negative.
16
behavior, not levels of altruism, dishonesty, or corruption per se, it is worth noting that the cheat
rate in Barfort et al.’s (2019) sample of Danish students – 0.42 – was higher than in our Moscow
and Ukraine studies and equivalent to the regional study, albeit with a higher standard
deviation.22
Table 1: Descriptive Statistics
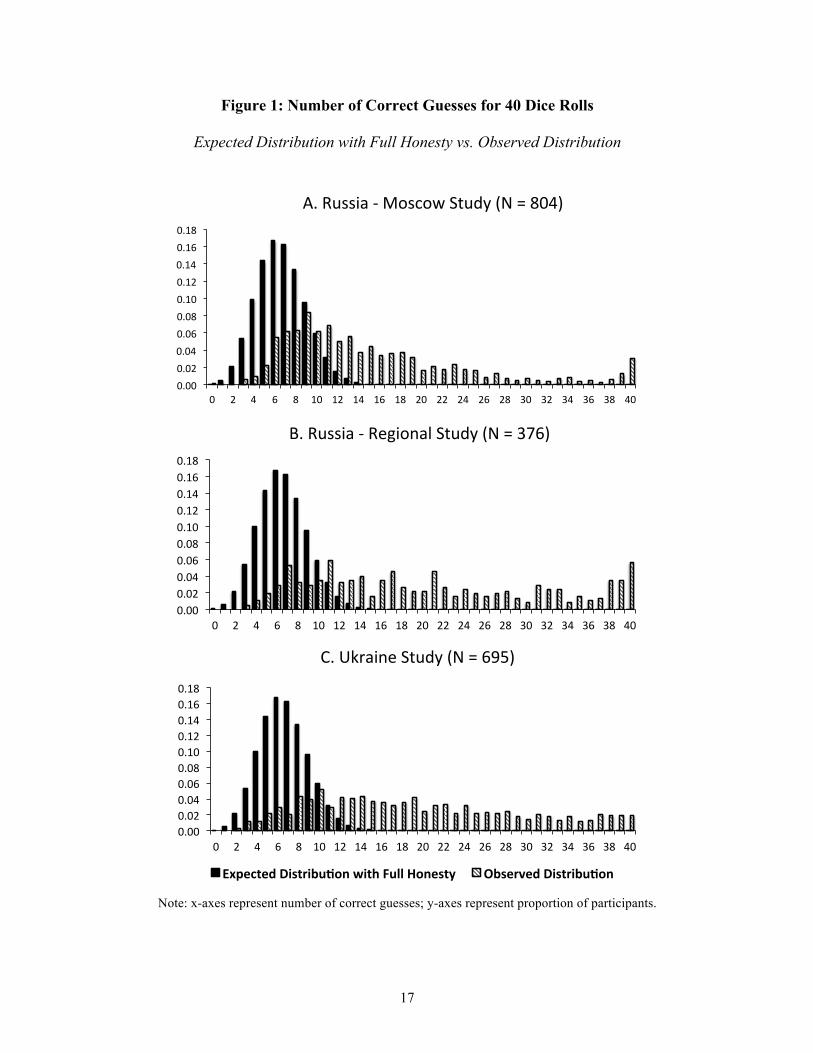
To provide further intuition for the dice-task game results, Figure 1 compares the distribution
of observed correct guesses over 40 dice rolls to the expected distribution for a fully honest
participant. As can be seen, only three percent of the sample in the Moscow study, six percent in
the regional Russia sample, and two percent of the Ukraine sample purely maximized payoffs by
22 This finding is at odds with Olsen et al. (2019) and Gächter & Schulz (2016), who show that dishonesty as measured by the dice task game is higher in countries with high corruption, low rule of law, poor regularly quality, and widespread rule violation (e.g., tax evasion).
Table 1: Descriptive Statistics
Russia: Russia: Ukraine:University in Moscow Regional University Legal Academy
Mean SD Min. Max. N Mean SD Min. Max. N Mean SD Min. Max. NExperimental Games
Donations 0.50 0.32 0 1 804 0.53 0.32 0 1 376 0.60 0.33 0 1 695Correct Guesses 15.3 8.9 0 40 804 20.6 11.0 3 40 376 19.3 9.9 2 40 695Cheat Rate 0.26 0.27 -0.20 1 804 0.42 0.33 -0.11 1 376 0.38 0.30 -0.14 1 695Bribe 0.61 0.49 0 1 803 0.47 0.50 0 1 375 0.29 0.45 0 1 693
Public Service MotivationPSM Index 0.63 0.15 0.13 1 803 0.65 0.16 0.10 1 375 0.70 0.16 0 1 693
APS 0.67 0.19 0 1 804 0.69 0.21 0 1 375 0.73 0.20 0 1 694CPV 0.77 0.15 0.06 1 804 0.78 0.17 0.06 1 376 0.80 0.18 0 1 694COM 0.73 0.17 0 1 804 0.74 0.19 0 1 376 0.79 0.18 0 1 694SS 0.44 0.20 0 1 803 0.47 0.22 0 1 376 0.54 0.21 0 1 693
Demographic & Attitudinal VariablesMale 0.40 0.49 0 1 804 0.31 0.46 0 1 376 0.36 0.48 0 1 695Risk Aversion 0.52 0.18 0 1 803 0.53 0.21 0 1 375 0.51 0.24 0 1 691GPA 0.48 0.14 0 0.80 803 0.62 0.15 0 0.80 376 0.84 0.17 0 1 694Family Income 0.36 0.20 0 0.89 793 0.30 0.18 0 0.89 370 0.20 0.17 0 1 674
Notes: Correct Guesses refers to the number of correct guesses in the dice task game; Cheat Rate refers to the correspondingestimate for the proportion of rolls on which an individual cheated. A negative cheat rate reflects fewer correct guesses than theexpected number of correct guesses – 6.7 – for a fully honest individual rolling a dice 40 times (see Footnote 21 for discussion ofcheat rate calculations). Bribe is a dichotomous indicator of whether a participant offered (in the role of citizen) or accepted (inthe role of a bureaucrat) a bribe in the corruption game. Donations refers to the proportion of the initial endowment donatedto charity in the modified dictator game. PSM refers to the Public Service Motivation index, APS to the Attraction to PublicService dimension of PSM, CPV to the Commitment to Public Values dimension, COM to the Compassion dimension, and SSto the Self-Sacrifice dimension; all of these indicators have been rescaled to range from 0 to 1. Risk aversion, GPA, and FamilyIncome have also been rescaled to range from 0 to 1.
1
17
Figure 1: Number of Correct Guesses for 40 Dice Rolls
Expected Distribution with Full Honesty vs. Observed Distribution
Note: x-axes represent number of correct guesses; y-axes represent proportion of participants.
0.00#0.02#0.04#0.06#0.08#0.10#0.12#0.14#0.16#0.18#
0# 2# 4# 6# 8# 10# 12# 14# 16# 18# 20# 22# 24# 26# 28# 30# 32# 34# 36# 38# 40#
A.#Russia#0#Moscow#Study#(N#=#804)#
0.00#0.02#0.04#0.06#0.08#0.10#0.12#0.14#0.16#0.18#
0# 2# 4# 6# 8# 10# 12# 14# 16# 18# 20# 22# 24# 26# 28# 30# 32# 34# 36# 38# 40#
B.#Russia#0#Regional#Study#(N#=#376)#
C.#Ukraine#Study#(N#=#695)#
0.00#0.02#0.04#0.06#0.08#0.10#0.12#0.14#0.16#0.18#
0# 2# 4# 6# 8# 10# 12# 14# 16# 18# 20# 22# 24# 26# 28# 30# 32# 34# 36# 38# 40#
Expected(Distribu/on(with(Full(Honesty( Observed(Distribu/on(

18
reporting 40 correct guesses in the dice task game. In Moscow, 16 percent reported 7 or fewer
correct guesses – the amount of or lower than the number of correct guesses an honest individual
would be expected to make by chance. In the regional Russia study, the comparable figure was
12 percent; in the Ukraine study, 10 percent. Meanwhile, approximately 63 percent of
respondents in the Moscow study, 79 percent of respondents in the regional Russia study, and 77
percent of respondents in the Ukraine study reported 10 or more correct guesses, despite the fact
that the probability of honestly guessing right 10 or more times is around 12 percent.23
In the bribery game 61 percent of participants in the Moscow study engaged in a bribe
transaction, compared to 47 percent and 29 percent in the Russian regional study and Ukraine
study, respectively. Two factors should be considered when interpreting the lower rate in the
Ukraine study. First, as mentioned above, participants in this study participated on university
territory in a computer laboratory, which may have created an environment in which students felt
more compelled to avoid behavior labeled as “corrupt.” Second, the sample composition of the
two Russia studies, in which participants were primarily from the social sciences, differed
markedly from the Ukraine study in which 83 percent of participants were studying to be
lawyers, judges, and prosecutors.24
In all studies, altruism is negatively correlated with dishonesty and propensity to engage in
corruption, while dishonesty and propensity to engage in corruption are positively correlated. In
the Moscow study, those who gave or accepted bribes in the bribery game donated around 13
percentage points less of the initial endowment than those who did not. In the regional study and
23 As a point of comparison, 13 percent of Barfort et al.’s (2019) sample of Danish students reported 40 correct guesses, while 10 percent of the Danish sample reported 7 or fewer correct guesses. Seventy-three percent of the Danish sample reported 10 or more correct guesses. 24 The Ukraine study also included an information experiment in which subjects were randomly assigned to view an anti-corruption poster before participating in the experimental games. The bribe rate in the control group, which was not exposed to the poster, was higher than the sample average – 32 percent – but still noticeably lower than rate in the Russia studies.

19
Ukraine study, the corresponding figures were 12 and 19 percentage points. Meanwhile, in all
three studies those who engaged in a bribe transaction in the bribery game had a cheat rate
between 10 and 11 percentage points higher in the dice game. In all cases these differences are
statistically significant at p < 0.001. That said, while the measures of dishonesty and propensity
for corruption clearly are related, they capture distinct information about unethical behavior, as
discussed in more detail in the analyses below.
Finally, Table 1 provides descriptive statistics for PSM scores. The 5-point scales on which
these were initially measured have been rescaled to range from 0 to 1.25 Overall PSM scores
were similar across the Moscow and regional study – 0.63 and 0.65, respectively – and
moderately higher in the Ukraine study at 0.70. As a benchmark, these scores are similar to the
0.63 reported in Olsen et al.’s (2019) sample of Danish students.26 At all three research sites,
average scores for the Commitment to Public Values (CPV) dimension of PSM were highest,
followed by Compassion (COM), Attraction to Public Service (APS), and then Self-Sacrifice
(SS).
PSM as a Predictor of Altruism, Dishonesty, and Corruption
This section now turns to our primary analysis. Table 2 presents OLS regressions evaluating
the association between PSM and altruism, as measured by the proportion of the initial
endowment donated to charity in the dictator game. All PSM variables have been rescaled to
range from 0 to 1, such that regression coefficients can be interpreted as the average percentage
point difference in the proportion donated by an individual at the high end of the PSM spectrum 25 We use this rescaling to make our results regarding PSM and cheating in the dice-task game directly comparable to Olsen et al. (2019). On the original 5-point PSM scale, sample averages were 3.62 for the Moscow study, 3.67 for the regional Russia study, and 3.86 for the Ukraine study. 26 Olsen et al. (2019) use a similar but not identical measure of PSM based off of Perry (1996). Our measure, based off Kim et al. (2012), has the advantage of having been created by an international team of scholars seeking to adapt the original Perry scale for use in the cross-cultural context. Oslen et al. (2019) also limit their sample to students aspiring to a career in public administration. If we similarly limit our sample to students seeking public employment, then the average PSM scores are 0.67 and 0.68 for the Moscow and regional study, respectively.

20
and an individual at the low end of the PSM spectrum. Odd numbered columns show bivariate
regressions; even numbered columns show specifications including control variables for
confounders that could potentially be correlated with both PSM and altruism, including gender,
risk aversion, ability (measured as self-reported GPA), family income, class year, and academic
specialization.
The results show a positive and robust relationship between PSM and altruism. In bivariate
regressions (Column 1), an individual with high PSM levels on average donates 63 percentage
points more of the initial endowment than the low-PSM individual in the Moscow study, 41
percentage points more in the regional Russian study, and a 50 percentage points more in the
Ukraine study. In all cases the results are statistically significant at p < 0.001. While the overall
relationship between PSM and altruism is consistent across the research sites, and while the
relationship between the four dimensions of PSM and altruism are all positive and mostly
statistically significant, which dimension exhibits the strongest correlation differs across the
studies. In Moscow the CPV and SS dimensions are largest; in the regional study, APS; and in
the Ukraine study, APS, COM, and SS are all approximately equal in magnitude, with CPV
slightly smaller.27
Table 3 presents results from OLS regressions analyzing the association between PSM and
dishonesty, as measured by cheat rates in the dice task game. Regression coefficients can be
interpreted as the percentage point difference in cheat rates between a high and low-PSM
individual. In contrast to Olsen et al. (2019) who, using the same dice task we employed, identify
27 These results contrast with Esteve et al.’s (2016) study of Dutch university students, which finds that despite an overall positive correlation between PSM and contributions in a public goods game, the COM dimension has a negative correlation with contributions. Esteve et al. (2016) do not present separate analyses for the other dimensions of PSM beyond the COM dimension.

21
Table 2: PSM as a Predictor of Altruism
Dependent Variable: Proportion of Endowment Donated to Charity in Dictator Game
a robust negative correlation between PSM and cheating among Danish students, we find more
mixed results. For the Moscow study, moving from the lowest to highest PSM levels is
associated with approximately a 15 percentage points decline in the cheat rate, but while the
bivariate results are statistically significant at p < 0.05, they are not robust to the inclusion of
Table 4: PSM as Predictor of Altruism
(1) (2) (3) (4) (5) (6) (7) (8) (9) (10) (11) (12)Panel A: Russia – University in Moscow
PSM 0.628⇤⇤⇤ 0.553⇤⇤⇤(0.075) (0.078)
APS 0.392⇤⇤⇤ 0.332⇤⇤⇤ 0.140† 0.072(0.061) (0.064) (0.081) (0.082)
CPV 0.252⇤⇤⇤ 0.198⇤⇤ -0.023 -0.012(0.072) (0.071) (0.077) (0.078)
COM 0.444⇤⇤⇤ 0.355⇤⇤⇤ 0.217⇤⇤ 0.112(0.063) (0.066) (0.076) (0.078)
SS 0.437⇤⇤⇤ 0.433⇤⇤⇤ 0.278⇤⇤⇤ 0.351⇤⇤⇤(0.056) (0.055) (0.069) (0.069)
Constant 0.104⇤ 0.249⇤⇤ 0.239⇤⇤⇤ 0.389⇤⇤⇤ 0.306⇤⇤⇤ 0.463⇤⇤⇤ 0.174⇤⇤⇤ 0.347⇤⇤⇤ 0.306⇤⇤⇤ 0.415⇤⇤⇤ 0.141⇤ 0.325⇤⇤⇤(0.049) (0.087) (0.042) (0.083) (0.057) (0.091) (0.048) (0.087) (0.027) (0.072) (0.060) (0.093)
Controls no yes no yes no yes no yes no yes no yesObservations 803 789 804 790 804 790 804 790 803 789 803 789R-squared 0.083 0.149 0.055 0.125 0.014 0.096 0.057 0.122 0.074 0.159 0.093 0.164
Panel B: Russia – Regional UniversityPSM 0.407⇤⇤⇤ 0.358⇤⇤
(0.108) (0.109)APS 0.302⇤⇤⇤ 0.267⇤⇤ 0.214† 0.179
(0.087) (0.085) (0.127) (0.124)CPV 0.208† 0.165 -0.009 0.010
(0.108) (0.109) (0.133) (0.132)COM 0.284⇤⇤ 0.209⇤ 0.140 0.035
(0.092) (0.096) (0.117) (0.119)SS 0.223⇤⇤ 0.225⇤⇤ 0.046 0.112
(0.079) (0.079) (0.105) (0.106)Constant 0.262⇤⇤⇤ 0.224⇤ 0.317⇤⇤⇤ 0.274⇤ 0.362⇤⇤⇤ 0.319⇤ 0.316⇤⇤⇤ 0.286⇤ 0.422⇤⇤⇤ 0.335⇤⇤⇤ 0.260⇤⇤ 0.246†
(0.071) (0.114) (0.062) (0.108) (0.086) (0.127) (0.069) (0.121) (0.038) (0.100) (0.091) (0.131)Controls no yes no yes no yes no yes no yes no yesObservations 375 368 375 368 376 369 376 369 376 369 375 368R-squared 0.043 0.100 0.040 0.098 0.012 0.073 0.029 0.081 0.024 0.089 0.047 0.103
Panel C: Ukraine – Legal AcademyPSM 0.504⇤⇤⇤ 0.476⇤⇤⇤
(0.082) (0.084)APS 0.339⇤⇤⇤ 0.326⇤⇤⇤ 0.089 0.111
(0.064) (0.065) (0.093) (0.093)CPV 0.290⇤⇤⇤ 0.279⇤⇤⇤ 0.124 0.120
(0.075) (0.074) (0.093) (0.091)COM 0.349⇤⇤⇤ 0.314⇤⇤⇤ 0.103 0.060
(0.075) (0.075) (0.095) (0.095)SS 0.331⇤⇤⇤ 0.317⇤⇤⇤ 0.220⇤⇤ 0.210⇤⇤
(0.059) (0.061) (0.073) (0.078)Constant 0.253⇤⇤⇤ 0.206⇤ 0.356⇤⇤⇤ 0.312⇤⇤⇤ 0.370⇤⇤⇤ 0.333⇤⇤⇤ 0.329⇤⇤⇤ 0.292⇤⇤ 0.426⇤⇤⇤ 0.358⇤⇤⇤ 0.239⇤⇤⇤ 0.196†
(0.058) (0.095) (0.048) (0.090) (0.062) (0.099) (0.060) (0.097) (0.034) (0.085) (0.071) (0.104)Controls no yes no yes no yes no yes no yes no yesObservations 693 668 694 669 694 669 694 669 693 668 693 668R-squared 0.060 0.118 0.041 0.105 0.025 0.090 0.036 0.095 0.045 0.106 0.062 0.120
Note: ⇤⇤⇤ p<0.001, ⇤⇤ p<0.01, ⇤ p<0.05, † p<0.10. OLS regressions with robust standard errors in parentheses. For theUkraine study (Panel C), standard errors are clustered at the session level. PSM refers to the Public Service Motivation index,APS to the Attraction to Public Service dimension of PSM, CPV to the Commitment to Public Values dimension, COM to theCompassion dimension, and SS to the Self-Sacrifice dimension. The specifications with controls include variables for gender,risk aversion, GPA, family income, class year, and academic specialization.
4

22
control variables.28 Moreover, the magnitude of this correlation is strikingly lower than the
approximately 70 percentage point decline found in Olsen et al.’s (2019) Danish sample. And
while Olsen et al. (2019) found a robust and negative correlation between each dimension of
PSM and cheating, ranging in magnitude from 19 to 44 percentage points, the dimensions in our
study are associated with a decline in the cheat rate of around 7 to 11 percentage points.
Beyond the Moscow study, the results diverge further. For both the overall PSM scale and its
dimensions, in nearly all specifications in the regional and Ukraine studies there are no
statistically significant relationships; the one exception is that in the Russian regional study SS –
which of all the PSM dimensions in Olsen et al. (2019) exhibits the largest negative correlation
with dishonesty29 – is positively and statistically significantly correlated with cheat rates.
The final part of our analysis offers novel insights into the relationship between PSM and
willingness to engage in a behavior framed explicitly as a corrupt activity, as measured by
whether or not participants offered (in the role of citizen) or accepted (in the role of bureaucrat) a
bribe in the bribery game. Because the outcome variable is dichotomous, Table 4 presents results
from linear probability models. (Results are robust to the use of logit regressions and average
marginal effects from logit models are similar in magnitude to the coefficients in Table 4). In the
Moscow study, participants exhibiting the highest levels of PSM are on average nearly 90
percentage points less likely than participants exhibiting the lowest levels of PSM to engage in a
bribe transaction; in the Russian regional and Ukraine studies, the corresponding figure is around
60 percentage points. In all studies these findings are statistically significant at p < 0.001.
28 Olsen et al. (2019) limit their analysis to students aspiring to public-sector careers. But even if we similarly limit our sample, the magnitude of the negative correlation between PSM and cheat rates rises only to 24 percentage points in the Moscow study. 29 Lim Choi (2004) also finds that SS is the dimension of PSM most strongly associated with more ethical reasoning in vignettes posing hypothetical ethical dilemmas to US civil servants.

23
Table 3: PSM as a Predictor of Dishonesty
Dependent Variable: Cheat Rate in Dice Task Game
Moreover, in all three studies all dimensions of PSM are negatively correlated with willingness
to engage in the bribe transaction and with just one exception – the COM dimension in the
Russian regional study – are significant at p < 0.01 in all bivariate specifications and p < 0.05 in
Table 2: PSM as Predictor of Dishonesty
(1) (2) (3) (4) (5) (6) (7) (8) (9) (10) (11) (12)Panel A: Russia – University in Moscow
PSM -0.146⇤ -0.121(0.073) (0.074)
APS -0.105† -0.085 -0.069 -0.050(0.054) (0.056) (0.072) (0.074)
CPV -0.112† -0.092 -0.058 -0.048(0.068) (0.070) (0.076) (0.077)
COM -0.084 -0.079 -0.019 -0.031(0.063) (0.065) (0.080) (0.084)
SS -0.068 -0.054 -0.012 -0.006(0.052) (0.053) (0.062) (0.065)
Constant 0.353⇤⇤⇤ 0.246⇤⇤ 0.331⇤⇤⇤ 0.224⇤⇤ 0.347⇤⇤⇤ 0.239⇤⇤ 0.323⇤⇤⇤ 0.226⇤⇤ 0.291⇤⇤⇤ 0.191⇤⇤ 0.371⇤⇤⇤ 0.266⇤⇤(0.048) (0.078) (0.038) (0.072) (0.054) (0.083) (0.048) (0.077) (0.026) (0.063) (0.061) (0.088)
Controls no yes no yes no yes no yes no yes no yesObservations 803 789 804 790 804 790 804 790 803 789 803 789R-squared 0.007 0.033 0.006 0.032 0.004 0.031 0.003 0.031 0.003 0.030 0.007 0.033
Panel B: Russia – Regional UniversityPSM 0.102 0.102
(0.112) (0.117)APS -0.006 -0.004 -0.156 -0.150
(0.088) (0.092) (0.122) (0.126)CPV -0.126 -0.141 -0.088 -0.101
(0.116) (0.118) (0.140) (0.141)COM 0.044 0.046 -0.069 -0.086
(0.097) (0.102) (0.128) (0.136)SS 0.243⇤⇤ 0.245⇤⇤ 0.374⇤⇤⇤ 0.382⇤⇤⇤
(0.077) (0.084) (0.106) (0.115)Constant 0.351⇤⇤⇤ 0.511⇤⇤⇤ 0.421⇤⇤⇤ 0.573⇤⇤⇤ 0.517⇤⇤⇤ 0.669⇤⇤⇤ 0.386⇤⇤⇤ 0.538⇤⇤⇤ 0.305⇤⇤⇤ 0.463⇤⇤⇤ 0.471⇤⇤⇤ 0.625⇤⇤⇤
(0.075) (0.134) (0.065) (0.126) (0.093) (0.140) (0.075) (0.134) (0.040) (0.117) (0.100) (0.150)Controls no yes no yes no yes no yes no yes no yesObservations 375 368 375 368 376 369 376 369 376 369 375 368R-squared 0.003 0.020 0.000 0.018 0.004 0.023 0.001 0.019 0.027 0.044 0.043 0.060
Panel C: Ukraine – Legal AcademyPSM -0.041 -0.071
(0.074) (0.074)APS -0.013 -0.032 0.031 0.028
(0.058) (0.058) (0.083) (0.084)CPV -0.027 -0.045 -0.017 -0.035
(0.059) (0.060) (0.076) (0.078)COM -0.054 -0.061 -0.066 -0.041
(0.068) (0.068) (0.086) (0.087)SS -0.018 -0.048 -0.002 -0.036
(0.055) (0.057) (0.067) (0.071)Constant 0.406⇤⇤⇤ 0.472⇤⇤⇤ 0.387⇤⇤⇤ 0.444⇤⇤⇤ 0.399⇤⇤⇤ 0.456⇤⇤⇤ 0.420⇤⇤⇤ 0.472⇤⇤⇤ 0.387⇤⇤⇤ 0.450⇤⇤⇤ 0.421⇤⇤⇤ 0.484⇤⇤⇤
(0.053) (0.090) (0.044) (0.083) (0.049) (0.085) (0.055) (0.092) (0.032) (0.082) (0.061) (0.095)Controls no yes no yes no yes no yes no yes no yesObservations 693 668 694 669 694 669 694 669 693 668 693 668R-squared 0.001 0.051 0.000 0.050 0.000 0.051 0.001 0.051 0.000 0.051 0.001 0.052
Note: ⇤⇤⇤ p<0.001, ⇤⇤ p<0.01, ⇤ p<0.05, † p<0.10. OLS regressions with robust standard errors in parentheses. For theUkraine study (Panel C), standard errors are clustered at the session level. PSM refers to the Public Service Motivation index,APS to the Attraction to Public Service dimension of PSM, CPV to the Commitment to Public Values dimension, COM to theCompassion dimension, and SS to the Self-Sacrifice dimension. The specifications with controls include variables for gender,risk aversion, GPA, family income, class year, and academic specialization.
2
24
specifications including control variables.30 However, there are, as in the case of our analysis of
PSM and altruism, some discrepancies across research sites with respect to which dimensions of
PSM are most strongly correlated with propensity for corruption, with APS emerging as the
strongest predictor in the two Russian studies and COM as the strongest predictor in the Ukraine
study.
In summary, we find that PSM is robustly positively associated with altruism and negatively
associated with propensity to engage in corruption. Our findings regarding PSM and dishonesty
are more mixed. Although PSM is negatively correlated with dishonesty, the magnitude of these
correlations is relatively small, and results are no longer statistically significant in specifications
including a full set of control variables.
Discussion
Given that civil servants and other public sector employees throughout the world have been
shown to exhibit high PSM levels, understanding how PSM is tied to ethical or unethical
behavior has important implications. With rare exceptions, earlier research on this topic has been
limited by reliance on self-reported measures subject to social desirability bias or hypothetical
vignettes about illicit behaviors. This study has sought to advance the literature by employing
incentivized experimental games to study the relationships between PSM and observable
behavior indicative of altruism, dishonesty, and propensity to engage in corruption. Most
notably, our study represents the first research on PSM to utilize a behavioral measure of
corruption. Moreover, our simultaneous use of three experimental games facilitates nuanced
interpretation of the findings in ways that studies employing a single game cannot. In particular,
30 If “citizens” bribe offers and “bureaucrat” acceptances of bribes are analyzed separately, the correlation is negative in all analyses and statistically significant with the single exception of bribe offers in the Russian regional study. The magnitude of the correlation is larger, however, for analyses of bureaucrats’ bribe acceptances.

25
Table 4: PSM as a Predictor of Propensity to Engage in Corruption
Dependent Variable: Gave/Accepted Bribe in Bribery Game
our finding that PSM in the Russian and Ukrainian context is robustly negatively correlated to
propensity to engage in corruption but only weakly associated with dishonesty suggests that the
relationships between PSM and unethical conduct may depend on the type and severity of the
unethical behavior.
Table 3: PSM as Predictor of Propensity for Corruption
(1) (2) (3) (4) (5) (6) (7) (8) (9) (10) (11) (12)Panel A: Russia – University in Moscow
PSM -0.875⇤⇤⇤ -0.751⇤⇤⇤(0.099) (0.102)
APS -0.607⇤⇤⇤ -0.488⇤⇤⇤ -0.348⇤⇤ -0.206†(0.080) (0.083) (0.118) (0.119)
CPV -0.486⇤⇤⇤ -0.386⇤⇤⇤ -0.124 -0.108(0.107) (0.107) (0.126) (0.127)
COM -0.528⇤⇤⇤ -0.444⇤⇤⇤ -0.147 -0.103(0.093) (0.096) (0.118) (0.121)
SS -0.531⇤⇤⇤ -0.505⇤⇤⇤ -0.260⇤ -0.332⇤⇤⇤(0.078) (0.077) (0.101) (0.099)
Constant 1.158⇤⇤⇤ 1.026⇤⇤⇤ 1.009⇤⇤⇤ 0.863⇤⇤⇤ 0.981⇤⇤⇤ 0.830⇤⇤⇤ 0.993⇤⇤⇤ 0.862⇤⇤⇤ 0.841⇤⇤⇤ 0.761⇤⇤⇤ 1.156⇤⇤⇤ 0.993⇤⇤⇤(0.062) (0.124) (0.054) (0.119) (0.083) (0.137) (0.069) (0.126) (0.037) (0.106) (0.085) (0.139)
Controls no yes no yes no yes no yes no yes no yesObservations 802 788 803 789 803 789 803 789 802 788 802 788R-squared 0.070 0.120 0.058 0.105 0.024 0.084 0.035 0.093 0.048 0.113 0.073 0.123
Panel B: Russia – Regional UniversityPSM -0.589⇤⇤⇤ -0.573⇤⇤⇤
(0.154) (0.163)APS -0.564⇤⇤⇤ -0.538⇤⇤⇤ -0.566⇤⇤ -0.509⇤⇤
(0.110) (0.117) (0.171) (0.178)CPV -0.450⇤⇤ -0.444⇤⇤ -0.104 -0.148
(0.152) (0.156) (0.187) (0.189)COM -0.166 -0.143 0.283† 0.313†
(0.137) (0.145) (0.161) (0.176)SS -0.329⇤⇤ -0.330⇤⇤ -0.139 -0.183
(0.115) (0.118) (0.149) (0.157)Constant 0.854⇤⇤⇤ 1.033⇤⇤⇤ 0.861⇤⇤⇤ 1.021⇤⇤⇤ 0.827⇤⇤⇤ 1.007⇤⇤⇤ 0.597⇤⇤⇤ 0.799⇤⇤⇤ 0.628⇤⇤⇤ 0.842⇤⇤⇤ 0.801⇤⇤⇤ 0.964⇤⇤⇤
(0.104) (0.180) (0.080) (0.164) (0.122) (0.188) (0.104) (0.188) (0.060) (0.160) (0.136) (0.199)Controls no yes no yes no yes no yes no yes no yesObservations 374 367 374 367 375 368 375 368 375 368 374 367R-squared 0.037 0.064 0.057 0.080 0.023 0.053 0.004 0.035 0.021 0.052 0.064 0.089
Panel C: Ukraine – Legal AcademyPSM -0.620⇤⇤⇤ -0.557⇤⇤⇤
(0.112) (0.117)APS -0.409⇤⇤⇤ -0.363⇤⇤⇤ -0.096 -0.106
(0.091) (0.094) (0.133) (0.136)CPV -0.332⇤⇤⇤ -0.249⇤ -0.066 0.003
(0.099) (0.100) (0.125) (0.130)COM -0.539⇤⇤⇤ -0.472⇤⇤⇤ -0.358⇤⇤ -0.282⇤
(0.102) (0.106) (0.134) (0.138)SS -0.357⇤⇤⇤ -0.375⇤⇤⇤ -0.146 -0.199†
(0.080) (0.084) (0.096) (0.102)Constant 0.716⇤⇤⇤ 0.825⇤⇤⇤ 0.584⇤⇤⇤ 0.685⇤⇤⇤ 0.553⇤⇤⇤ 0.612⇤⇤⇤ 0.710⇤⇤⇤ 0.811⇤⇤⇤ 0.477⇤⇤⇤ 0.652⇤⇤⇤ 0.768⇤⇤⇤ 0.855⇤⇤⇤
(0.083) (0.140) (0.071) (0.133) (0.083) (0.139) (0.085) (0.141) (0.048) (0.125) (0.101) (0.149)Controls no yes no yes no yes no yes no yes no yesObservations 691 666 692 667 692 667 692 667 691 666 691 666R-squared 0.049 0.078 0.032 0.066 0.018 0.051 0.046 0.074 0.028 0.069 0.053 0.082
Note: ⇤⇤⇤ p<0.001, ⇤⇤ p<0.01, ⇤ p<0.05, † p<0.10. Linear probability models with robust standard errors in parentheses. Forthe Ukraine study (Panel C), standard errors are clustered at the session level. PSM refers to the Public Service Motivationindex, APS to the Attraction to Public Service dimension of PSM, CPV to the Commitment to Public Values dimension, COMto the Compassion dimension, and SS to the Self-Sacrifice dimension. The specifications with controls include variables forgender, risk aversion, GPA, family income, class year, and academic specialization.
3

26
Our extension of the study of PSM to Russia and Ukraine, two countries that consistently
rank poorly on international corruption indicators, additionally facilitates analysis of PSM in a
context in which corruption and rule breaking is widespread. Our findings of a strong positive
association between PSM and altruism and negative association between PSM and willingness to
engage in corrupt practices are similar to earlier research in low-corruption contexts such as the
Netherlands and Denmark (Esteve et al. 2016; Olsen et al. 2019), indicating that PSM may
operate in similar ways across high and low-corruption environments.
Our results concerning the overall PSM scale are remarkably consistent across three research
sites. Results concerning the individual dimensions of PSM, however, are less consistent.
Though the signs of the correlations remain similar, the magnitude of the correlations – that is,
which dimensions are the strongest predictors of altruism and propensity to engage in corruption
– differ across the research locations. Additional theorizing about the distinct role of PSM’s
different dimensions and additional collection of empirical evidence based on disaggregated
analysis of PSM remain important areas of investigation for future research.
While our use of experimental games marks a contribution to the existing literature, future
research would benefit from finding ways to analyze the relationships between PSM and
unethical behaviors in a non-laboratory context. Hanna & Wang (2017), for example, validate
the dice task game by comparing public employees’ cheating in the laboratory with
administrative data on the same employees’ fraudulent absenteeism, the claiming of a paycheck
for time not worked. Building on this approach, future studies could collect measures of PSM for
samples of subjects for whom such administrative data exists, facilitating analysis of PSM’s
associations with real-world behavior. Our study also makes no claims regarding the causal
impact of PSM, only that individuals with high PSM levels are also more likely to engage in pro-

27
social behavior and avoid unethical conduct. Future experimental work that primes individuals in
ways known to increase PSM levels, in line with recent work by Christensen & Wright (2018),
may be able to offer insights into whether managers can purposefully activate PSM in socially
beneficially ways.
For now, what is clear is that individuals with high PSM are more likely to engage in
altruism, (possibly) less likely to act dishonestly, and less willing to engage in corruption, and
that these associations hold true even in some contexts in which societal levels of corruption and
rule breaking are high.
References
Abbink, Klaus, Bernd Irlenbusch, and Elke Renner. “An experimental bribery game.” Journal of Law, Economics, and Organization 18, no. 2 (2002): 428–454.
Alatas, Vivi, Lisa Cameron, Ananish Chaudhuri, Nisvan Erkal, and Lata Gangadharan. “Subject pool effects in a corruption experiment: A comparison of Indonesian public servants and Indonesian students.” Experimental Economics 12, no. 1 (2009): 113–132.
Banuri, Sheheryar, and Philip Keefer. “Intrinsic motivation, effort and the call to public service.” World Bank Policy Research Working Paper 6729 (December 2013).
Barfort, Sebastian, Nikolaj Harmon, Frederik Hjorth, and Asmus Leth Olsen. “Sustaining honesty in public service: The role of selection.” American Economic Journal: Economic Policy. Forthcoming.
Barr, Abigail, and Danila Serra. “The effects of externalities and framing on bribery in a petty corruption experiment.” Experimental Economics 12, no. 4 (2009): 488–503.
Barr, Abigail, and Danila Serra. “Corruption and culture: An experimental analysis.” Journal of Public Economics 94, no. 11-12 (2010): 862-869.
Belle, Nicola, and Paola Cantarelli. “What Causes Unethical Behavior? A Meta‐Analysis to Set an Agenda for Public Administration Research.” Public Administration Review 77, no. 3 (2017): 327-339.
Benz, Matthias, and Stephan Meier. “Do people behave in experiments as in the field? Evidence from donations.” Experimental Economics 11, no. 3 (2008): 268–281.
Berinsky, Adam J., Michele F. Margolis, and Michael W. Sances. “Separating the shirkers from the workers? Making sure respondents pay attention on self‐administered surveys.” American Journal of Political Science 58, no. 3 (2014): 739-753.

28
Bozeman, Barry, Angel Luis Molina Jr, and Wesley Kaufmann. “Angling for sharks, not pilot fish: Deep corruption, venal corruption, and public values failure.” Perspectives on Public Management and Governance 1, no. 1 (2017): 5-27.
Brewer, Gene A., and Sally Coleman Selden. “Whistle blowers in the federal civil service: New evidence of the public service ethic.” Journal of public administration research and theory 8, no. 3 (1998): 413-440.
Cameron, Lisa, Ananish Chaudhuri, Nisvan Erkal, and Lata Gangadharan. “Propensities to engage in and punish corrupt behavior: Experimental evidence from Australia, India, Indonesia and Singapore.” Journal of Public Economics 93, no. 7 (2009): 843–851.
Carpenter, Jacqueline, Dennis Doverspike, and Rosanna F. Miguel. “Public service motivation as a predictor of attraction to the public sector.” Journal of Vocational Behavior 80, no. 2 (2012): 509-523.
Christensen, Robert K., and Bradley E. Wright. “Public service motivation and ethical behavior: Evidence from three experiments.” Journal of Behavioral Public Administration 1, no. 1 (2018): 1-8.
Clerkin, Richard M., and Jerrell D. Coggburn. “The dimensions of public service motivation and sector work preferences.” Review of Public Personnel Administration 32, no. 3 (2012): 209-235.
Clerkin, Richard M., Sharon R. Paynter, and Jami Kathleen Taylor. “Public service motivation in undergraduate giving and volunteering decisions.” The American Review of Public Administration 39.6 (2009): 675-698.
Cohn, Alain, and Michel André Maréchal. “Laboratory measure of cheating predicts school misconduct.” The Economic Journal 128, no. 615 (2018): 2743-2754.
Cohn, Alain, Michel André Maréchal, and Thomas Noll. “Bad boys: How criminal identity salience affects rule violation.” The Review of Economic Studies 82, no. 4 (2015): 1289-1308.
Coursey, David, Jeffrey L. Brudney, Laura Littlepage, and James L. Perry. “Does public service motivation matter in volunteering domain choices? A test of functional theory.” Review of public personnel administration 31, no. 1 (2011): 48-66.
Cowley, Edd, and Sarah Smith. “Motivation and mission in the public sector: Evidence from the World Values Survey.” Theory and decision 76, no. 2 (2014): 241-263.
Crewson, Philip E. “Public-service motivation: Building empirical evidence of incidence and effect.” Journal of public administration research and theory 7, no. 4 (1997): 499-518.
Esteve, Marc, Diemo Urbig, Arjen Van Witteloostuijn, and George Boyne. “Prosocial behavior and public service motivation.” Public Administration Review 76, no. 1 (2016): 177-187.
Fischbacher, Urs, and Franziska Föllmi-Heusi. “Lies in disguise—an experimental study on cheating.” Journal of the European Economic Association 11, no. 3 (2013): 525-547.
Franzen, Axel, and Sonja Pointner. “The external validity of giving in the dictator game.” Experimental Economics 16, no. 2 (2013): 155-169.
Gächter, Simon, and Jonathan F. Schulz. “Intrinsic honesty and the prevalence of rule violations across societies.” Nature 531, no. 7595 (2016): 496.
Gans-Morse, Jordan, Alexander Kalgin, Andrei Klimenko, Dmitriy Vorobyev, Andrei Yakovlev. “Public Service Motivation and Occupational Preferences in Russia.” Northwestern University, Higher School of Economics, and Ural Federal University Working Paper (2019).
Hanna, Rema, and Shing-Yi Wang. “Dishonesty and selection into public service: Evidence from India.” American Economic Journal: Economic Policy 9, no. 3 (2017): 262-90.
29
Holt, Charles A., and Susan K. Laury. “Risk aversion and incentive effects.” American economic review 92, no. 5 (2002): 1644-1655.
Houston, David J. “Public-service motivation: A multivariate test.” Journal of public administration research and theory 10, no. 4 (2000): 713-728.
Houston, David J. “ ‘Walking the walk’ of public service motivation: Public employees and charitable gifts of time, blood, and money.” Journal of Public Administration Research and Theory 16, no. 1 (2005): 67-86.
Kim, Sangmook, Wouter Vandenabeele, Bradley E. Wright, Lotte Bøgh Andersen, Francesco Paolo Cerase, Robert K. Christensen, Céline Desmarais et al. “Investigating the structure and meaning of public service motivation across populations: Developing an international instrument and addressing issues of measurement invariance.” Journal of Public Administration Research and Theory 23, no. 1 (2012): 79-102.
Kwon, Illoong. “Motivation, discretion, and corruption.” Journal of Public Administration Research and Theory 24, no. 3 (2012): 765-794.
Lee, Young-Joo, and Jin-Woo Jeong. “The link between public service motivation and volunteering: The case of South Korean civil servants.” International Journal of Public Administration 38, no. 5 (2015): 355-363.
Lewis, Gregory B., and Sue A. Frank. “Who wants to work for the government?” Public Administration Review 62, no. 4 (2002): 395-404.
Lim Choi, Do. “Public service motivation and ethical conduct.” International Review of Public Administration 8, no. 2 (2004): 99-106.
Liu, Bangcheng, Chun Hui, Jin Hu, Wensheng Yang, and Xinli Yu. “How well can public service motivation connect with occupational intention?” International Review of Administrative Sciences 77, no. 1 (2011): 191-211.
Maesschalck, Jeroen, Zeger van der Wal, and L.W.J.C. Huberts. “Public Service Motivation and Ethical Conduct,” in James Perry and Annie Hondeghem (eds.), Motivation in Public Management: The Call of Public Service. Oxford University Press, 2008.
Olsen, Asmus Leth, Frederik Hjorth, Nikolaj Harmon, and Sebastian Barfort. “Behavioral dishonesty in the public sector.” Journal of Public Administration Research and Theory (2019). Forthcoming.
Perry, James L. “Measuring public service motivation: An assessment of construct reliability and validity.” Journal of public administration research and theory 6, no. 1 (1996): 5-22.
Perry, James L., and Lois R. Wise. “The motivational bases of public service.” Public administration review 50, no. 3 (1990): 367-373.
Wright, Bradley E., Shahidul Hassan, and Jongsoo Park. “Does a public service ethic encourage ethical behaviour? Public service motivation, ethical leadership and the willingness to report ethical problems.” Public Administration 94, no. 3 (2016): 647-663.
Vandenabeele, Wouter. “Toward a public administration theory of public service motivation: An institutional approach.” Public Management Review 9, no. 4 (2007): 545-556.
Vandenabeele, Wouter. “Government calling: Public service motivation as an element in selecting government as an employer of choice.” Public Administration 86, no. 4 (2008): 1089-1105.