working paper 242 february 2011 - cgdev.org
TRANSCRIPT
Working Paper 242February 2011
West African Experience with the World Rice Crisis, 2007 –2008
Abstract
Rice production in Africa has tended to be low-yielding, geographically dispersed, and uncompetitive against low-cost Asian imports, even when protected by high freight costs and substantial trade barriers. Skyrocketing prices in world markets in 2007¬–08 were a shock to African consumers, producers, and governments alike. When international rice prices were relatively low, rice imports did not pose economic or political problems for West African governments. Extremely expensive imports reverse that equation. This paper addresses the response to that reversal first by presenting a historical review of trends in the West African rice sector and, second, by assessing the effect of world rice prices on domestic prices, primarily at the consumer level.
www.cgdev.org
Jenny C. Aker, Steven Block, Vijaya Ramachandran, and C. Peter Timmer
West African Experience with the World Rice Crisis, 2007–2008
Jenny C. AkerSteven Block
Vijaya RamachandranC. Peter Timmer
This paper has appeared as a chapter in The Rice Crisis—Markets, Policies and Food Security (FAO and Earthscan, 2010). The view expressed in this publication are those of the authors and do not necessarily reflect the views of the Food and Agriculture Organization of the United Nations.
Copyright © FAO/Earthscan 2010. All rights reserved.
CGD is grateful for contributions from the Australian Agency for International Development and the William and Flora Hewlett Foundation in support of this work.
Jenny C. Aker, Steven Block, Vijaya Ramachandran, and C. Peter Timmer. 2011.“West African Experience with the World Rice Crisis, 2007–2008.” CGD Working Paper 242. Washington, D.C.: Center for Global Development.http://www.cgdev.org/content/publications/detail/1424823
Center for Global Development1800 Massachusetts Ave., NW
Washington, DC 20036
202.416.4000(f ) 202.416.4050
www.cgdev.org
The Center for Global Development is an independent, nonprofit policy research organization dedicated to reducing global poverty and inequality and to making globalization work for the poor.
The views expressed in CGD Working Papers are those of the authors and should not be attributed to the board of directors or funders of the Center for Global Development.
I. Introduction
Historically, rice production in Africa has tended to be low-yielding, geographically
dispersed, and uncompetitive against low-cost Asian imports, even when protected by high
freight costs and substantial trade barriers. Skyrocketing prices in world markets, however,
were a shock to African consumers, producers, and governments alike, and numerous
initiatives have been announced to stimulate rice production on the continent.1
Although most African countries produce at least small amounts of rice, we focus here
on the rice economy of West Africa and its response to the 2007/08 food crisis. The West
African rice industry has deep historical roots. The West African Rice Development
Authority (WARDA) was founded in 1971. The classic commodity-system analysis of the
West African rice economy by Pearson, Stryker and Humphreys was published in 1981. The
International Rice Research Institute (IRRI) has undertaken collaborative research on rice
varieties suitable for West African conditions for decades.
Despite this long history, the West African rice economy (with the exception of Nigeria)
has shown surprisingly little progress over the past half century, and has become
increasingly dependent on imports to meet rapidly growing consumer demand, especially in
urban areas. Although grown efficiently by small farmers, a successful rice economy needs
sophisticated engagement from governments to develop the economies of scale and scope
that permit a low-cost rice system. This engagement has largely been missing in West
Africa.
Research and extension, rural infrastructure, a stable marketing environment, and a
broad base of consumer demand all depend to a greater or lesser degree on effective
government investments and policies. Asian governments learned long ago how to provide
these essentials if they were to survive and their economies to grow. Not a single West
African country has sustained such investments and policies for more than a few years at a
time. This lack of investment, along with geographic, technological, and market constraints,
1 Inter-réseaux Développement Rural, No. 42, June-August, 2008. (http://www.inter-reseaux.org/
rubrique.php3?id_rubrique=8/)
2
has resulted is an import-dependent region, where urban demand for cheap rice has
overwhelmed local production capacity. Without sustained government investment in
West African’s rural economy, and its rice economy in particular, rice imports have
dominated consumption.
When international rice prices were relatively low, rice imports did not pose economic
or political problems for West African governments. Extremely expensive imports reverse
that equation. This paper addresses the response to that reversal. As already noted,
farmers, consumers, investors, donors and West African governments have all taken notice
of the new price environment. The first response in most countries was to lower or remove
import barriers for rice to protect consumers. But this response quickly shifted as Senegal
and several of its neighbors announced various strategies to spur domestic rice production
in response to high international prices.2 This might be risky, as the world rice market is
notoriously volatile, and the price spike in 2008 has turned out to be quite short-lived. Will
West Africa’s new-found interest in stimulating local rice production survive a return to
cheap rice in world markets?
We address that question in three stages. Section II presents a historical review of
trends in the West African rice sector. Section III assesses the impact of world rice prices on
domestic prices, primarily at the consumer level. This involves understanding the
mechanisms of price transmission from world markets to domestic markets, and the
efficiency of domestic rice marketing. Finally, in Section IV, we discuss some of the steps
needed to make the West African rice economy competitive with our vision of the future
world rice economy. We begin by reviewing recent rice trends in West Africa.
II. Recent Trends for Rice in West Africa3
Rice production in West Africa has doubled since 1985; yet rice consumption has increased
even more rapidly, resulting in a growing shortfall of local rice production. This increasing
dependence on imports has left West African rice consumers – mainly those located in
urban markets -- increasingly vulnerable to volatility in world rice markets. Though the
extent of import dependence varies substantially across the different countries of West
Africa, Figure 1 summarizes the regional trend.
2 Senegal’s response to the crisis, dubbed the Big Agricultural Offensive for Food and Abundance (GOANA), promised to
dedicate over two-thirds of the programme’s $792 million budget to subsidizing the purchase of fertilizers, seeds and
pesticides. Similarly, the Malian government implemented a “Rice Initiative”, which provided input subsidies for rice. 3 This section draws heavily on WARDA (2008).
3
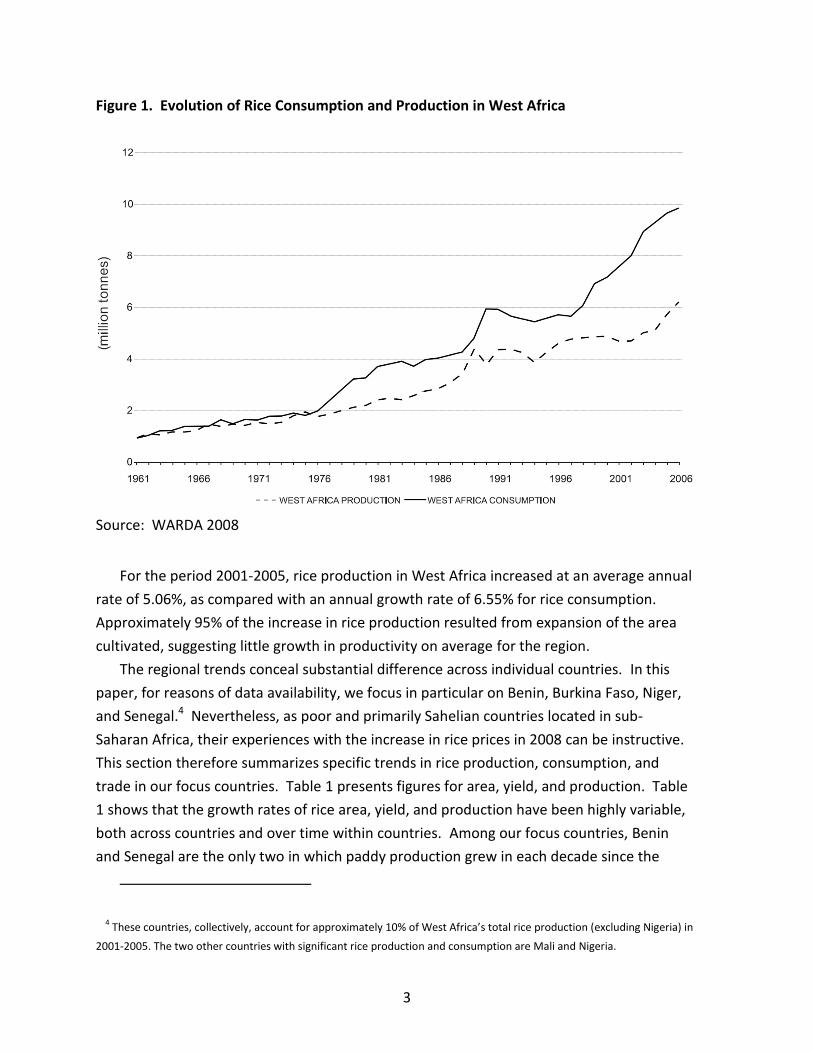
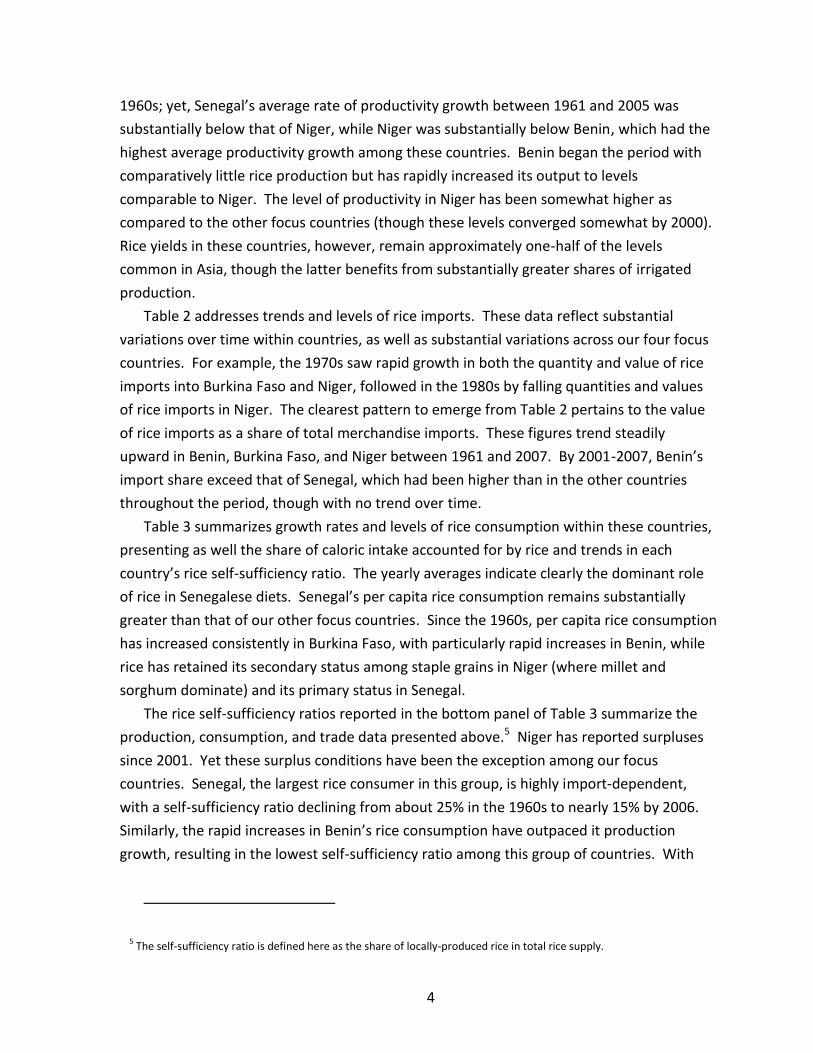
Figure 1. Evolution of Rice Consumption and Production in West Africa
Source: WARDA 2008
For the period 2001-2005, rice production in West Africa increased at an average annual
rate of 5.06%, as compared with an annual growth rate of 6.55% for rice consumption.
Approximately 95% of the increase in rice production resulted from expansion of the area
cultivated, suggesting little growth in productivity on average for the region.
The regional trends conceal substantial difference across individual countries. In this
paper, for reasons of data availability, we focus in particular on Benin, Burkina Faso, Niger,
and Senegal.4 Nevertheless, as poor and primarily Sahelian countries located in sub-
Saharan Africa, their experiences with the increase in rice prices in 2008 can be instructive.
This section therefore summarizes specific trends in rice production, consumption, and
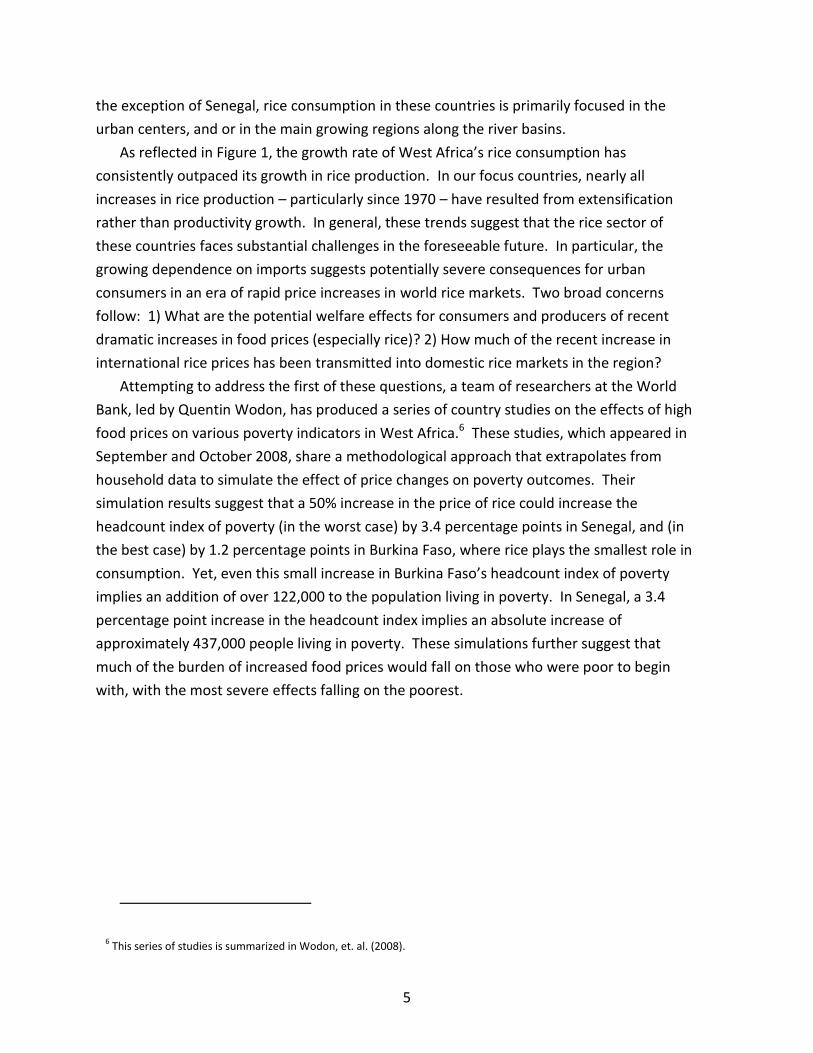
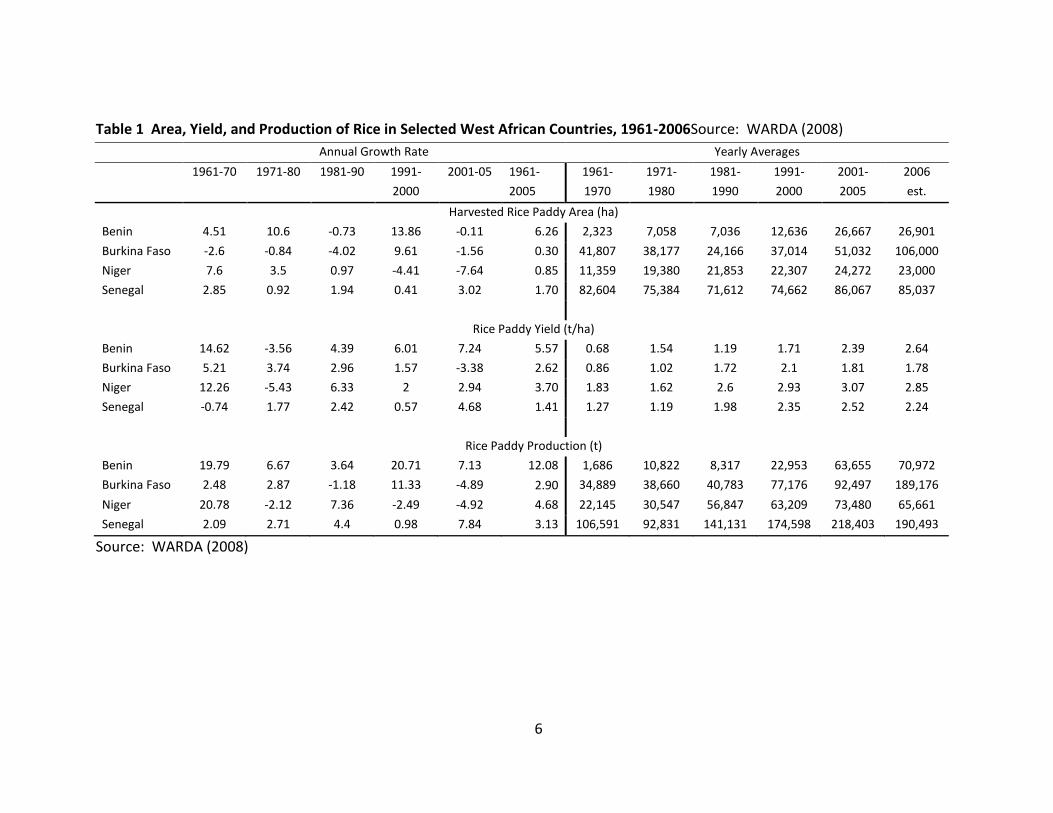
trade in our focus countries. Table 1 presents figures for area, yield, and production. Table
1 shows that the growth rates of rice area, yield, and production have been highly variable,
both across countries and over time within countries. Among our focus countries, Benin
and Senegal are the only two in which paddy production grew in each decade since the
4 These countries, collectively, account for approximately 10% of West Africa’s total rice production (excluding Nigeria) in
2001-2005. The two other countries with significant rice production and consumption are Mali and Nigeria.
4
1960s; yet, Senegal’s average rate of productivity growth between 1961 and 2005 was
substantially below that of Niger, while Niger was substantially below Benin, which had the
highest average productivity growth among these countries. Benin began the period with
comparatively little rice production but has rapidly increased its output to levels
comparable to Niger. The level of productivity in Niger has been somewhat higher as
compared to the other focus countries (though these levels converged somewhat by 2000).
Rice yields in these countries, however, remain approximately one-half of the levels
common in Asia, though the latter benefits from substantially greater shares of irrigated
production.
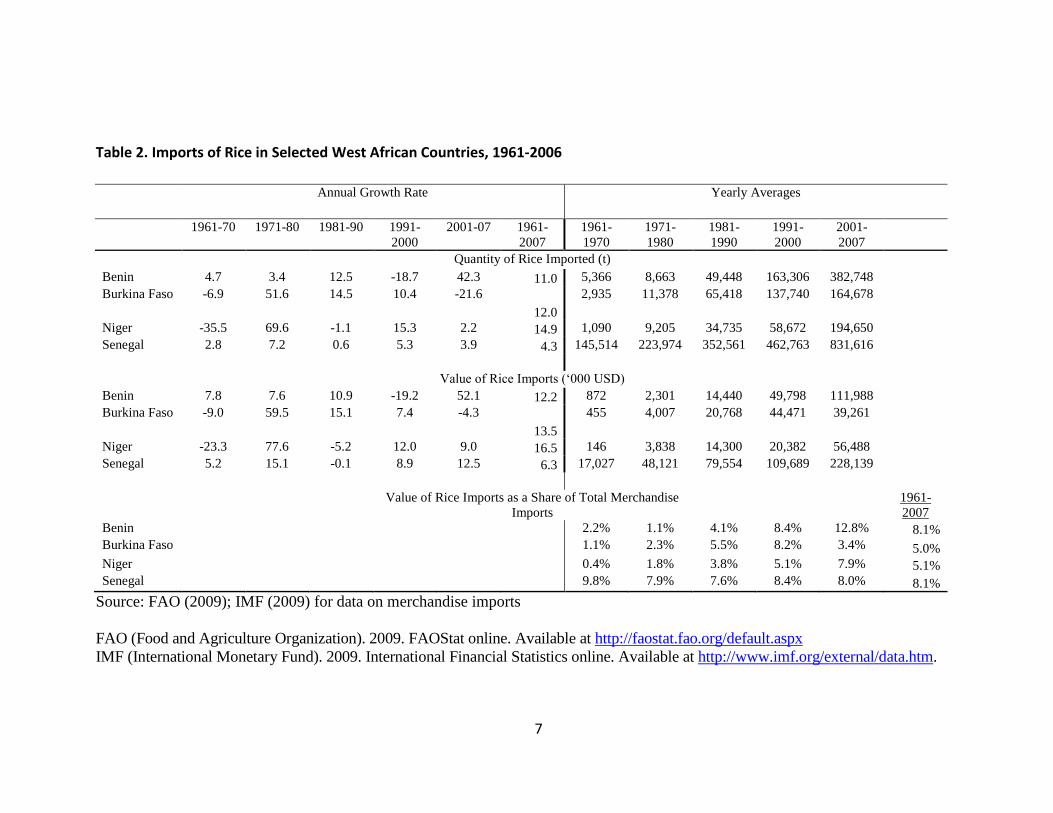
Table 2 addresses trends and levels of rice imports. These data reflect substantial
variations over time within countries, as well as substantial variations across our four focus
countries. For example, the 1970s saw rapid growth in both the quantity and value of rice
imports into Burkina Faso and Niger, followed in the 1980s by falling quantities and values
of rice imports in Niger. The clearest pattern to emerge from Table 2 pertains to the value
of rice imports as a share of total merchandise imports. These figures trend steadily
upward in Benin, Burkina Faso, and Niger between 1961 and 2007. By 2001-2007, Benin’s
import share exceed that of Senegal, which had been higher than in the other countries
throughout the period, though with no trend over time.
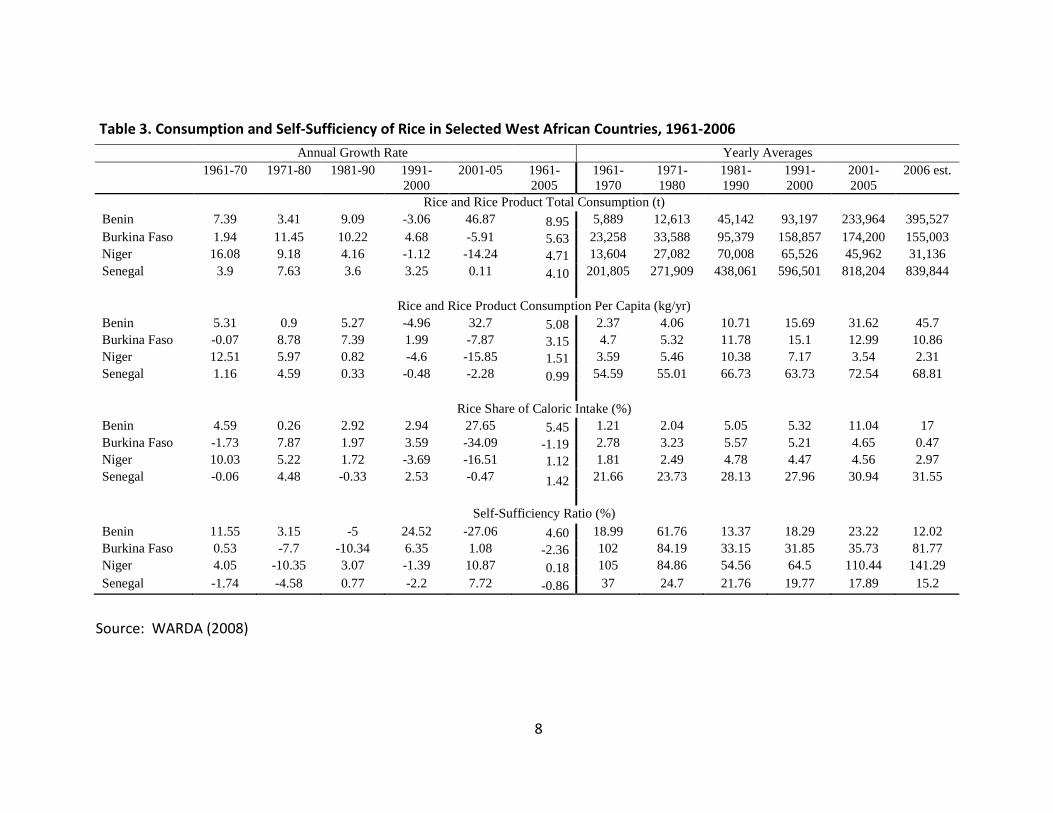
Table 3 summarizes growth rates and levels of rice consumption within these countries,
presenting as well the share of caloric intake accounted for by rice and trends in each
country’s rice self-sufficiency ratio. The yearly averages indicate clearly the dominant role
of rice in Senegalese diets. Senegal’s per capita rice consumption remains substantially
greater than that of our other focus countries. Since the 1960s, per capita rice consumption
has increased consistently in Burkina Faso, with particularly rapid increases in Benin, while
rice has retained its secondary status among staple grains in Niger (where millet and
sorghum dominate) and its primary status in Senegal.
The rice self-sufficiency ratios reported in the bottom panel of Table 3 summarize the
production, consumption, and trade data presented above.5 Niger has reported surpluses
since 2001. Yet these surplus conditions have been the exception among our focus
countries. Senegal, the largest rice consumer in this group, is highly import-dependent,
with a self-sufficiency ratio declining from about 25% in the 1960s to nearly 15% by 2006.
Similarly, the rapid increases in Benin’s rice consumption have outpaced it production
growth, resulting in the lowest self-sufficiency ratio among this group of countries. With
5 The self-sufficiency ratio is defined here as the share of locally-produced rice in total rice supply.
5
the exception of Senegal, rice consumption in these countries is primarily focused in the
urban centers, and or in the main growing regions along the river basins.
As reflected in Figure 1, the growth rate of West Africa’s rice consumption has
consistently outpaced its growth in rice production. In our focus countries, nearly all
increases in rice production – particularly since 1970 – have resulted from extensification
rather than productivity growth. In general, these trends suggest that the rice sector of
these countries faces substantial challenges in the foreseeable future. In particular, the
growing dependence on imports suggests potentially severe consequences for urban
consumers in an era of rapid price increases in world rice markets. Two broad concerns
follow: 1) What are the potential welfare effects for consumers and producers of recent
dramatic increases in food prices (especially rice)? 2) How much of the recent increase in
international rice prices has been transmitted into domestic rice markets in the region?
Attempting to address the first of these questions, a team of researchers at the World
Bank, led by Quentin Wodon, has produced a series of country studies on the effects of high
food prices on various poverty indicators in West Africa.6 These studies, which appeared in
September and October 2008, share a methodological approach that extrapolates from
household data to simulate the effect of price changes on poverty outcomes. Their
simulation results suggest that a 50% increase in the price of rice could increase the
headcount index of poverty (in the worst case) by 3.4 percentage points in Senegal, and (in
the best case) by 1.2 percentage points in Burkina Faso, where rice plays the smallest role in
consumption. Yet, even this small increase in Burkina Faso’s headcount index of poverty
implies an addition of over 122,000 to the population living in poverty. In Senegal, a 3.4
percentage point increase in the headcount index implies an absolute increase of
approximately 437,000 people living in poverty. These simulations further suggest that
much of the burden of increased food prices would fall on those who were poor to begin
with, with the most severe effects falling on the poorest.
6 This series of studies is summarized in Wodon, et. al. (2008).
6
Table 1 Area, Yield, and Production of Rice in Selected West African Countries, 1961-2006Source: WARDA (2008)
Annual Growth Rate Yearly Averages
1961-70 1971-80 1981-90 1991-
2000
2001-05 1961-
2005
1961-
1970
1971-
1980
1981-
1990
1991-
2000
2001-
2005
2006
est.
Harvested Rice Paddy Area (ha)
Benin 4.51 10.6 -0.73 13.86 -0.11 6.26 2,323 7,058 7,036 12,636 26,667 26,901
Burkina Faso -2.6 -0.84 -4.02 9.61 -1.56 0.30 41,807 38,177 24,166 37,014 51,032 106,000
Niger 7.6 3.5 0.97 -4.41 -7.64 0.85 11,359 19,380 21,853 22,307 24,272 23,000
Senegal 2.85 0.92 1.94 0.41 3.02 1.70 82,604 75,384 71,612 74,662 86,067 85,037
Rice Paddy Yield (t/ha)
Benin 14.62 -3.56 4.39 6.01 7.24 5.57 0.68 1.54 1.19 1.71 2.39 2.64
Burkina Faso 5.21 3.74 2.96 1.57 -3.38 2.62 0.86 1.02 1.72 2.1 1.81 1.78
Niger 12.26 -5.43 6.33 2 2.94 3.70 1.83 1.62 2.6 2.93 3.07 2.85
Senegal -0.74 1.77 2.42 0.57 4.68 1.41 1.27 1.19 1.98 2.35 2.52 2.24
Rice Paddy Production (t)
Benin 19.79 6.67 3.64 20.71 7.13 12.08 1,686 10,822 8,317 22,953 63,655 70,972
Burkina Faso 2.48 2.87 -1.18 11.33 -4.89 2.90 34,889 38,660 40,783 77,176 92,497 189,176
Niger 20.78 -2.12 7.36 -2.49 -4.92 4.68 22,145 30,547 56,847 63,209 73,480 65,661
Senegal 2.09 2.71 4.4 0.98 7.84 3.13 106,591 92,831 141,131 174,598 218,403 190,493
Source: WARDA (2008)
7
Table 2. Imports of Rice in Selected West African Countries, 1961-2006
Annual Growth Rate Yearly Averages
1961-70 1971-80 1981-90 1991-
2000
2001-07 1961-
2007
1961-
1970
1971-
1980
1981-
1990
1991-
2000
2001-
2007
Quantity of Rice Imported (t)
Benin 4.7 3.4 12.5 -18.7 42.3 11.0 5,366 8,663 49,448 163,306 382,748
Burkina Faso -6.9 51.6 14.5 10.4 -21.6
12.0
2,935 11,378 65,418 137,740 164,678
Niger -35.5 69.6 -1.1 15.3 2.2 14.9 1,090 9,205 34,735 58,672 194,650
Senegal 2.8 7.2 0.6 5.3 3.9 4.3 145,514 223,974 352,561 462,763 831,616
Value of Rice Imports (‘000 USD)
Benin 7.8 7.6 10.9 -19.2 52.1 12.2 872 2,301 14,440 49,798 111,988
Burkina Faso -9.0 59.5 15.1 7.4 -4.3
13.5
455 4,007 20,768 44,471 39,261
Niger -23.3 77.6 -5.2 12.0 9.0 16.5 146 3,838 14,300 20,382 56,488
Senegal 5.2 15.1 -0.1 8.9 12.5 6.3 17,027 48,121 79,554 109,689 228,139
Value of Rice Imports as a Share of Total Merchandise
Imports
1961-
2007
Benin 2.2% 1.1% 4.1% 8.4% 12.8% 8.1%
Burkina Faso 1.1% 2.3% 5.5% 8.2% 3.4% 5.0%
Niger 0.4% 1.8% 3.8% 5.1% 7.9% 5.1%
Senegal 9.8% 7.9% 7.6% 8.4% 8.0% 8.1%
Source: FAO (2009); IMF (2009) for data on merchandise imports
FAO (Food and Agriculture Organization). 2009. FAOStat online. Available at http://faostat.fao.org/default.aspx
IMF (International Monetary Fund). 2009. International Financial Statistics online. Available at http://www.imf.org/external/data.htm.
8
Table 3. Consumption and Self-Sufficiency of Rice in Selected West African Countries, 1961-2006
Annual Growth Rate Yearly Averages
1961-70 1971-80 1981-90 1991-
2000
2001-05 1961-
2005
1961-
1970
1971-
1980
1981-
1990
1991-
2000
2001-
2005
2006 est.
Rice and Rice Product Total Consumption (t)
Benin 7.39 3.41 9.09 -3.06 46.87 8.95 5,889 12,613 45,142 93,197 233,964 395,527
Burkina Faso 1.94 11.45 10.22 4.68 -5.91 5.63 23,258 33,588 95,379 158,857 174,200 155,003
Niger 16.08 9.18 4.16 -1.12 -14.24 4.71 13,604 27,082 70,008 65,526 45,962 31,136
Senegal 3.9 7.63 3.6 3.25 0.11 4.10 201,805 271,909 438,061 596,501 818,204 839,844
Rice and Rice Product Consumption Per Capita (kg/yr)
Benin 5.31 0.9 5.27 -4.96 32.7 5.08 2.37 4.06 10.71 15.69 31.62 45.7
Burkina Faso -0.07 8.78 7.39 1.99 -7.87 3.15 4.7 5.32 11.78 15.1 12.99 10.86
Niger 12.51 5.97 0.82 -4.6 -15.85 1.51 3.59 5.46 10.38 7.17 3.54 2.31
Senegal 1.16 4.59 0.33 -0.48 -2.28 0.99 54.59 55.01 66.73 63.73 72.54 68.81
Rice Share of Caloric Intake (%)
Benin 4.59 0.26 2.92 2.94 27.65 5.45 1.21 2.04 5.05 5.32 11.04 17
Burkina Faso -1.73 7.87 1.97 3.59 -34.09 -1.19 2.78 3.23 5.57 5.21 4.65 0.47
Niger 10.03 5.22 1.72 -3.69 -16.51 1.12 1.81 2.49 4.78 4.47 4.56 2.97
Senegal -0.06 4.48 -0.33 2.53 -0.47 1.42 21.66 23.73 28.13 27.96 30.94 31.55
Self-Sufficiency Ratio (%)
Benin 11.55 3.15 -5 24.52 -27.06 4.60 18.99 61.76 13.37 18.29 23.22 12.02
Burkina Faso 0.53 -7.7 -10.34 6.35 1.08 -2.36 102 84.19 33.15 31.85 35.73 81.77
Niger 4.05 -10.35 3.07 -1.39 10.87 0.18 105 84.86 54.56 64.5 110.44 141.29
Senegal -1.74 -4.58 0.77 -2.2 7.72 -0.86 37 24.7 21.76 19.77 17.89 15.2
Source: WARDA (2008)
9
III. Transmission of International Prices into Domestic Rice Markets
In practice, the magnitude of the impact of rapid increases in the international price of
rice depends directly on the extent to which those increases are transmitted to
domestic markets. The previous sections have described the dramatic price fluctuations
in global rice markets since 2000, as well as recent trends in the rice sector in West
Africa and the potential welfare consequences of high food prices in these countries. It
is clear that high food prices have the potential to increase both poverty and perhaps
malnutrition in the region. Senegal in particular may be particularly vulnerable to rapid
increases in rice prices. Thus, it is critical to assess the extent to which recent
fluctuations in global rice prices have been transmitted into domestic markets in West
Africa.
The extent of transmission is important for two reasons. First, it is domestic, not
world, prices that affect the welfare of poor consumers and farmers. Second, the
magnitude of price transmission will influence the extent to which adjustments by
producers and consumers help stabilize world price movements. These adjustments
(reduced consumption, increased production) will only take place if world prices are
transmitted to domestic prices (Imai, Gaiha, and Thapa, 2008). Finally, domestic price
changes can also have implications for the political stability of governments in West
Africa. In fact, numerous demonstrations and riots took place in capital cities of West
Africa in response to higher food prices, with large-scale riots taking place in Burkina
Faso (February 22, 2008), Cameroon, Guinea, Ivory Coast (March 31, 2008), Senegal
(March 31, 2008).
The link between rice price increases and conflict is more than a theoretical concern
for West Africa. The surge in rice prices in 1979 contributed to Liberia's descent into
chaos, sparking riots and a political crisis that led to the coup that brought Samuel Doe
to power and the onset of a decade-long civil war in the 1990s. Liberia and Sierra Leone
are both emerging from protracted civil conflicts, and price increases and riots can be
risk factors for both countries.7
The extent of price transmission is a function of two key variables: 1) the exchange
rate at which US dollar prices are converted to domestic currency prices; and 2) trade
policies at the border, which restrict (or enhance) the flow of commodities. The time
7 http://www.irinnews.org/Report.aspx?ReportId=77932. http://www.irinnews.org/Report.aspx?ReportId=76905
http://www.irinnews.org/report.aspx?ReportID=77539
10
horizon of adjustment is a third factor, as normal marketing lags as well as policy
interventions delay the immediate transmittal of international prices into domestic
economies (though the longer there is a substantial difference between the two prices,
the more pressure there is for convergence).8
Exchange Rate Effects
Even before the dramatic surge in prices in 2008, world market prices had increased
substantially in real US dollar terms. Comparing the last quarter of 2007 with the last
quarter of 2003, world market prices increased 56 percent for rice, 91 percent for
wheat, 40 percent for maize and 107 percent for urea (a primary source of nitrogen in
fertilizer). During that time, the US dollar depreciated substantially against the
currencies of several large rice exporting countries, putting upward pressure on world
prices quoted in dollars.9
Real exchange rate (RER) appreciation vis-à-vis the US dollar, to the extent that it
occurs, will neutralize some of the impact of increased prices in US dollar terms. Thus,
in assessing the extent to which increases in the international price of rice were
transmitted to domestic markets in West Africa, we must first calculate the change in
each country’s real exchange rate, calculated as:
(1) i
US
ii CPIGDPDefleRER %%%%
where RERi is the real exchange rate for country i, ei is the country’s nominal exchange
rate, CPI is the consumer price index and the GDPDefl is the GDP of that country
deflated by US prices.
Since each of the focus countries presented in this paper (Benin, Burkina Faso, Niger
and Senegal) is a member of the CFA Zone -- thus sharing a common currency that is
fixed relative to the Euro -- they experienced the same 14% nominal appreciation
against the U.S. dollar between 2003 and 2007. Since domestic inflation in these
countries was both similar across countries (owing to the regulation of monetary policy
within the CFA Zone) and approximately equal to the rate of inflation in the U.S. (the
change in the US GDP deflator over this period was 12.8%), the price effects essentially
cancel out, leaving these countries with a real exchange rate appreciation of
8 This section draws on Dawe (2008) for its methodology.
9 In fact, this depreciation is one cause of the recent high commodity prices.
11
approximately 14% (roughly equivalent to their nominal appreciation). Real
appreciation over this period thus tended to mitigate the effects of increases in the
international price of imports.
The next step in assessing the pass-through to domestic markets of a given real
increase in the dollar-denominated international price of rice is to filter that increase
through the change in each country’s RER, resulting in the real change in the domestic
currency-denominated international price of rice. This effect is presented in column 2
of Table 4. For the CFA-zone countries, the real domestic currency-denominated
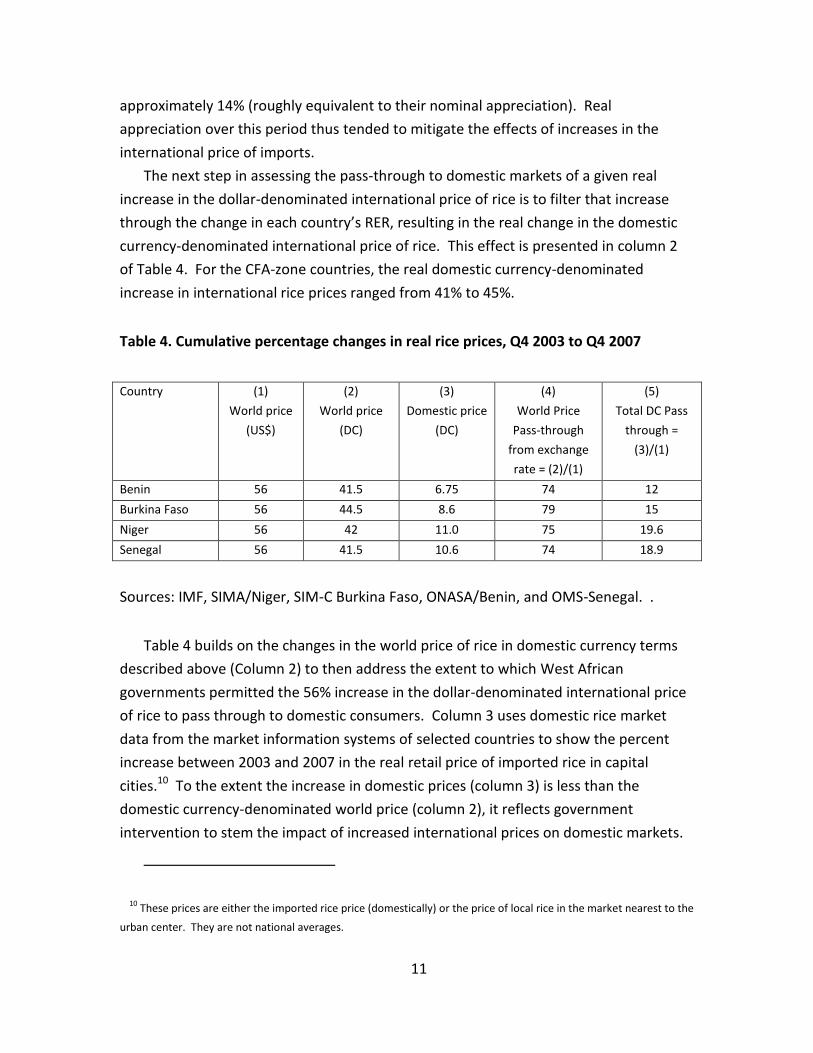
increase in international rice prices ranged from 41% to 45%.
Table 4. Cumulative percentage changes in real rice prices, Q4 2003 to Q4 2007
Country (1)
World price
(US$)
(2)
World price
(DC)
(3)
Domestic price
(DC)
(4)
World Price
Pass-through
from exchange
rate = (2)/(1)
(5)
Total DC Pass
through =
(3)/(1)
Benin 56 41.5 6.75 74 12
Burkina Faso 56 44.5 8.6 79 15
Niger 56 42 11.0 75 19.6
Senegal 56 41.5 10.6 74 18.9
Sources: IMF, SIMA/Niger, SIM-C Burkina Faso, ONASA/Benin, and OMS-Senegal. .
Table 4 builds on the changes in the world price of rice in domestic currency terms
described above (Column 2) to then address the extent to which West African
governments permitted the 56% increase in the dollar-denominated international price
of rice to pass through to domestic consumers. Column 3 uses domestic rice market
data from the market information systems of selected countries to show the percent
increase between 2003 and 2007 in the real retail price of imported rice in capital
cities.10 To the extent the increase in domestic prices (column 3) is less than the
domestic currency-denominated world price (column 2), it reflects government
intervention to stem the impact of increased international prices on domestic markets.
10
These prices are either the imported rice price (domestically) or the price of local rice in the market nearest to the
urban center. They are not national averages.
12
Clearly, in the four countries for which we have domestic market price data, the
combination of RER appreciation and government interventions provided a substantial
buffer between international and domestic rice markets in the period leading up to the
crisis.
Column (4) presents the proportion of the dollar price increase that remained net of
the exchange rate effects, while (for selected countries) column (5) presents the
proportion of the dollar price increase that remained net of both the exchange rate
effects and the effects of each country’s border price interventions. As is evident from
the fact that the numbers in column (5) are much less than those in column (4), most of
the buffering of domestic rice markets from the dramatic increase in international prices
was the result of border price interventions, rather than an artifact of RER appreciation.
In each case for which we have domestic price data, approximately two-thirds of the
pass-through effect is the result of border price interventions (a topic to which we
return below).
We gain further insights into the nature of commodity markets in our countries and
the effects of the crisis by comparing several sets of prices: 1) world versus domestic
prices of imported rice, 2) the price of millet versus the price of imported rice, and 3)
the price of imported versus domestically-produced rice. We begin simply by
summarizing the levels and changes in the prices of millet, imported rice, and domestic
rice before and during the crisis. Table 5 presents the data.
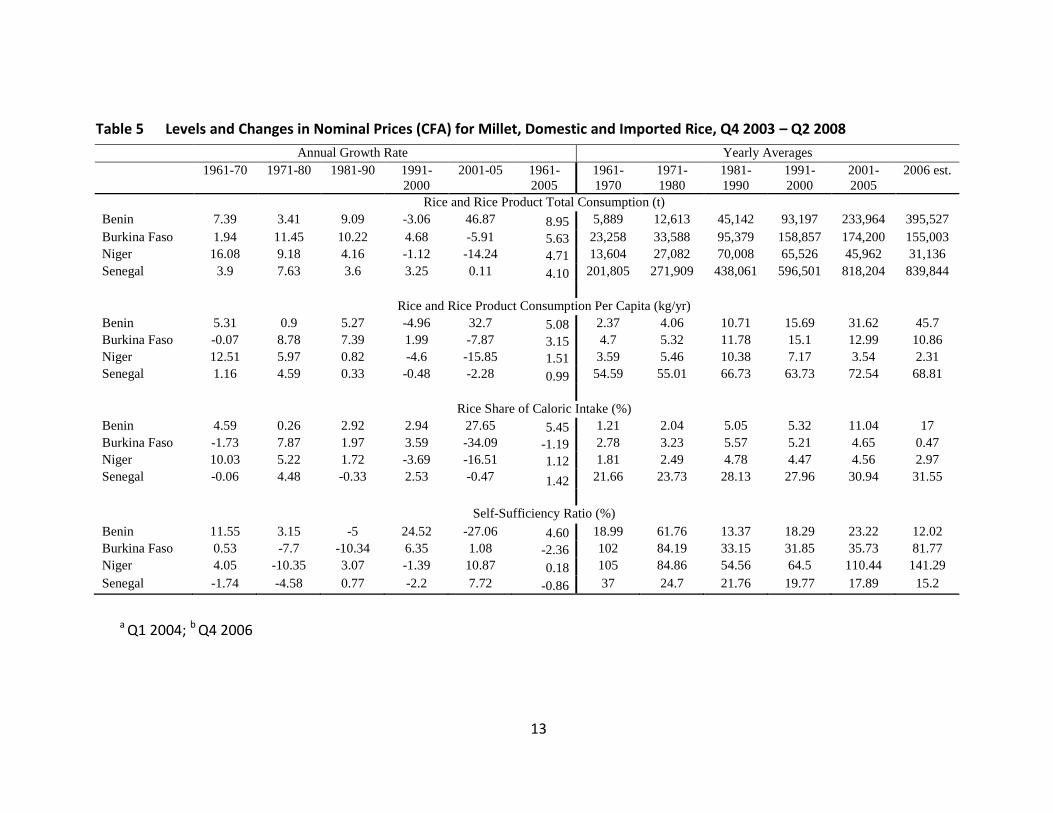
13
Table 5 Levels and Changes in Nominal Prices (CFA) for Millet, Domestic and Imported Rice, Q4 2003 – Q2 2008
Annual Growth Rate Yearly Averages
1961-70 1971-80 1981-90 1991-
2000
2001-05 1961-
2005
1961-
1970
1971-
1980
1981-
1990
1991-
2000
2001-
2005
2006 est.
Rice and Rice Product Total Consumption (t)
Benin 7.39 3.41 9.09 -3.06 46.87 8.95 5,889 12,613 45,142 93,197 233,964 395,527
Burkina Faso 1.94 11.45 10.22 4.68 -5.91 5.63 23,258 33,588 95,379 158,857 174,200 155,003
Niger 16.08 9.18 4.16 -1.12 -14.24 4.71 13,604 27,082 70,008 65,526 45,962 31,136
Senegal 3.9 7.63 3.6 3.25 0.11 4.10 201,805 271,909 438,061 596,501 818,204 839,844
Rice and Rice Product Consumption Per Capita (kg/yr)
Benin 5.31 0.9 5.27 -4.96 32.7 5.08 2.37 4.06 10.71 15.69 31.62 45.7
Burkina Faso -0.07 8.78 7.39 1.99 -7.87 3.15 4.7 5.32 11.78 15.1 12.99 10.86
Niger 12.51 5.97 0.82 -4.6 -15.85 1.51 3.59 5.46 10.38 7.17 3.54 2.31
Senegal 1.16 4.59 0.33 -0.48 -2.28 0.99 54.59 55.01 66.73 63.73 72.54 68.81
Rice Share of Caloric Intake (%)
Benin 4.59 0.26 2.92 2.94 27.65 5.45 1.21 2.04 5.05 5.32 11.04 17
Burkina Faso -1.73 7.87 1.97 3.59 -34.09 -1.19 2.78 3.23 5.57 5.21 4.65 0.47
Niger 10.03 5.22 1.72 -3.69 -16.51 1.12 1.81 2.49 4.78 4.47 4.56 2.97
Senegal -0.06 4.48 -0.33 2.53 -0.47 1.42 21.66 23.73 28.13 27.96 30.94 31.55
Self-Sufficiency Ratio (%)
Benin 11.55 3.15 -5 24.52 -27.06 4.60 18.99 61.76 13.37 18.29 23.22 12.02
Burkina Faso 0.53 -7.7 -10.34 6.35 1.08 -2.36 102 84.19 33.15 31.85 35.73 81.77
Niger 4.05 -10.35 3.07 -1.39 10.87 0.18 105 84.86 54.56 64.5 110.44 141.29
Senegal -1.74 -4.58 0.77 -2.2 7.72 -0.86 37 24.7 21.76 19.77 17.89 15.2
a Q1 2004; b Q4 2006
14
For most of the cases presented in Table 5, the rate of increase in nominal prices
accelerated dramatically between the fourth quarter of 2007 and the second quarter of
2008 (as compared with the quarterly average growth rate for the 15 quarters from the
fourth quarter of 2003 to the third quarter of 2007).
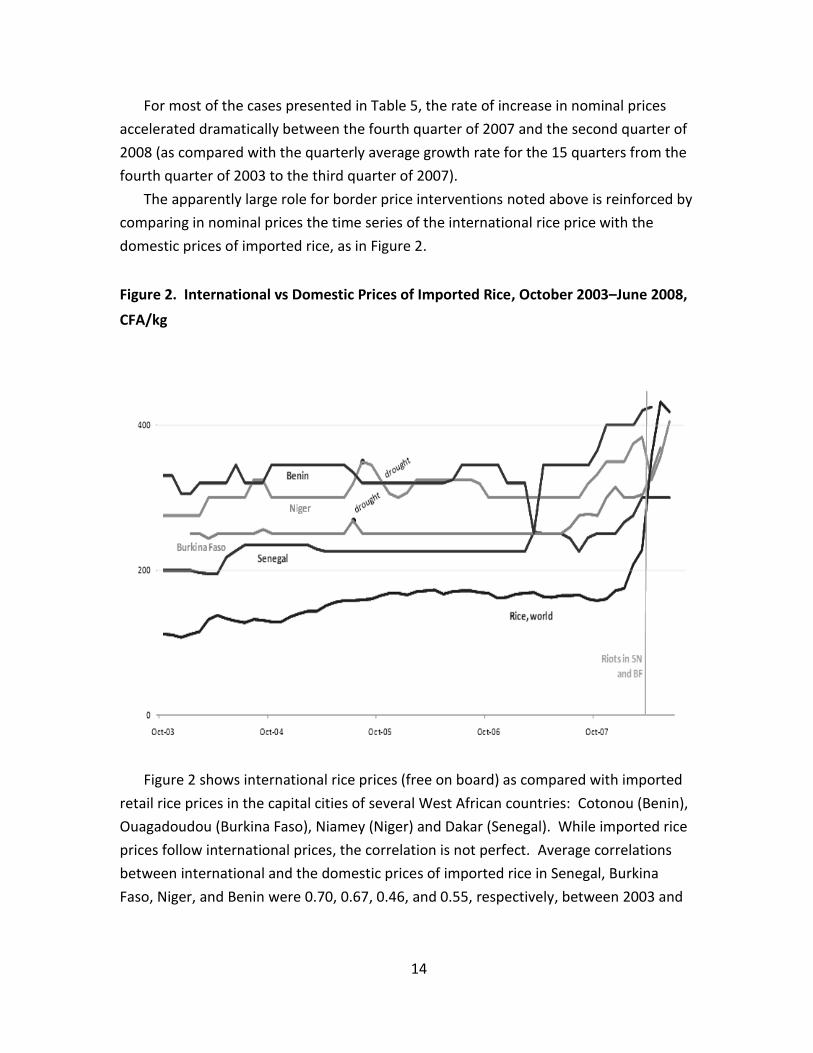
The apparently large role for border price interventions noted above is reinforced by
comparing in nominal prices the time series of the international rice price with the
domestic prices of imported rice, as in Figure 2.
Figure 2. International vs Domestic Prices of Imported Rice, October 2003–June 2008,
CFA/kg
Figure 2 shows international rice prices (free on board) as compared with imported
retail rice prices in the capital cities of several West African countries: Cotonou (Benin),
Ouagadoudou (Burkina Faso), Niamey (Niger) and Dakar (Senegal). While imported rice
prices follow international prices, the correlation is not perfect. Average correlations
between international and the domestic prices of imported rice in Senegal, Burkina
Faso, Niger, and Benin were 0.70, 0.67, 0.46, and 0.55, respectively, between 2003 and
15
2008. Imported rice prices in these countries have been strikingly stable during this
period, primarily due to: 1) import tax regimes; and 2) floor/ceiling prices.11 The
increases in imported rice prices in 2004/2005 in Burkina Faso and Niger were primarily
due to regional droughts and food crises during that year. During that time, staple food
prices (millet and sorghum) were the highest on record, and in some cases consumers
switched to rice – thereby increasing demand for rice and increasing prices.
On average, imported rice prices in West Africa followed the surge in international
rice price increases in late 2007 and early 2008. In many cases, this increase actually
preceded the international rice price increase, starting in August/September 2007 in
most West African countries, whereas the international rice price increase did not seem
to begin until late 2007 or early 2008. One potential reason for this increase in West
Africa is the increases in shipping costs. Virtually all of the rice imported into West
Africa originates in Asia. During the months from February 2007 to November 2007
(e.g., the period when we observe increasing domestic prices in advance of the
increased international price), the Baltic Dry Goods Index more than doubled.12 This
increase could have reduced the demand for imports, thus contributing to increased
domestic prices by reducing available supplies. In any case, it is clear that in the face of
the dramatic surge in the international price beginning in late 2007, these countries
were unable to afford sufficient import subsidies to protect domestic rice consumers
from world markets.
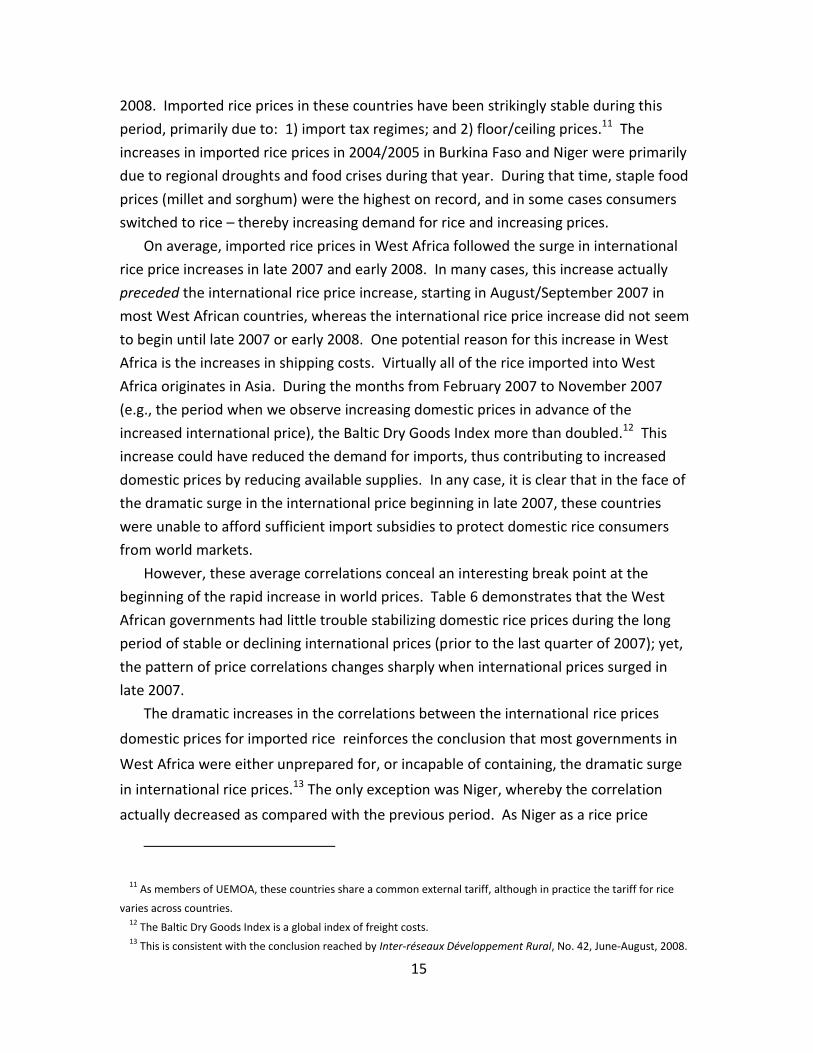
However, these average correlations conceal an interesting break point at the
beginning of the rapid increase in world prices. Table 6 demonstrates that the West
African governments had little trouble stabilizing domestic rice prices during the long
period of stable or declining international prices (prior to the last quarter of 2007); yet,
the pattern of price correlations changes sharply when international prices surged in
late 2007.
The dramatic increases in the correlations between the international rice prices
domestic prices for imported rice reinforces the conclusion that most governments in
West Africa were either unprepared for, or incapable of containing, the dramatic surge
in international rice prices.13 The only exception was Niger, whereby the correlation
actually decreased as compared with the previous period. As Niger as a rice price
11
As members of UEMOA, these countries share a common external tariff, although in practice the tariff for rice
varies across countries. 12
The Baltic Dry Goods Index is a global index of freight costs. 13
This is consistent with the conclusion reached by Inter-réseaux Développement Rural, No. 42, June-August, 2008.
16
stabilization scheme, this suggests that the government did not change its price ceiling
when international rice prices changed, thereby lowering the correlation between the
two.
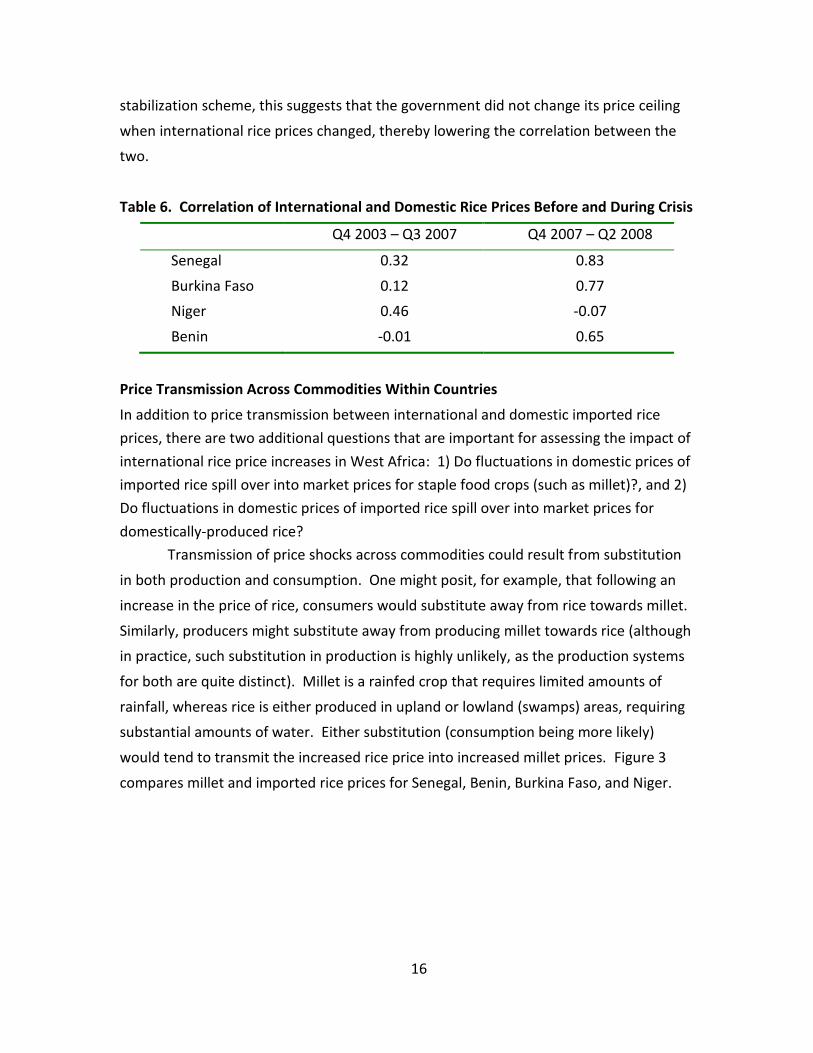
Table 6. Correlation of International and Domestic Rice Prices Before and During Crisis
Q4 2003 – Q3 2007 Q4 2007 – Q2 2008
Senegal 0.32 0.83
Burkina Faso 0.12 0.77
Niger 0.46 -0.07
Benin -0.01 0.65
Price Transmission Across Commodities Within Countries
In addition to price transmission between international and domestic imported rice
prices, there are two additional questions that are important for assessing the impact of
international rice price increases in West Africa: 1) Do fluctuations in domestic prices of
imported rice spill over into market prices for staple food crops (such as millet)?, and 2)
Do fluctuations in domestic prices of imported rice spill over into market prices for
domestically-produced rice?
Transmission of price shocks across commodities could result from substitution
in both production and consumption. One might posit, for example, that following an
increase in the price of rice, consumers would substitute away from rice towards millet.
Similarly, producers might substitute away from producing millet towards rice (although
in practice, such substitution in production is highly unlikely, as the production systems
for both are quite distinct). Millet is a rainfed crop that requires limited amounts of
rainfall, whereas rice is either produced in upland or lowland (swamps) areas, requiring
substantial amounts of water. Either substitution (consumption being more likely)
would tend to transmit the increased rice price into increased millet prices. Figure 3
compares millet and imported rice prices for Senegal, Benin, Burkina Faso, and Niger.
17
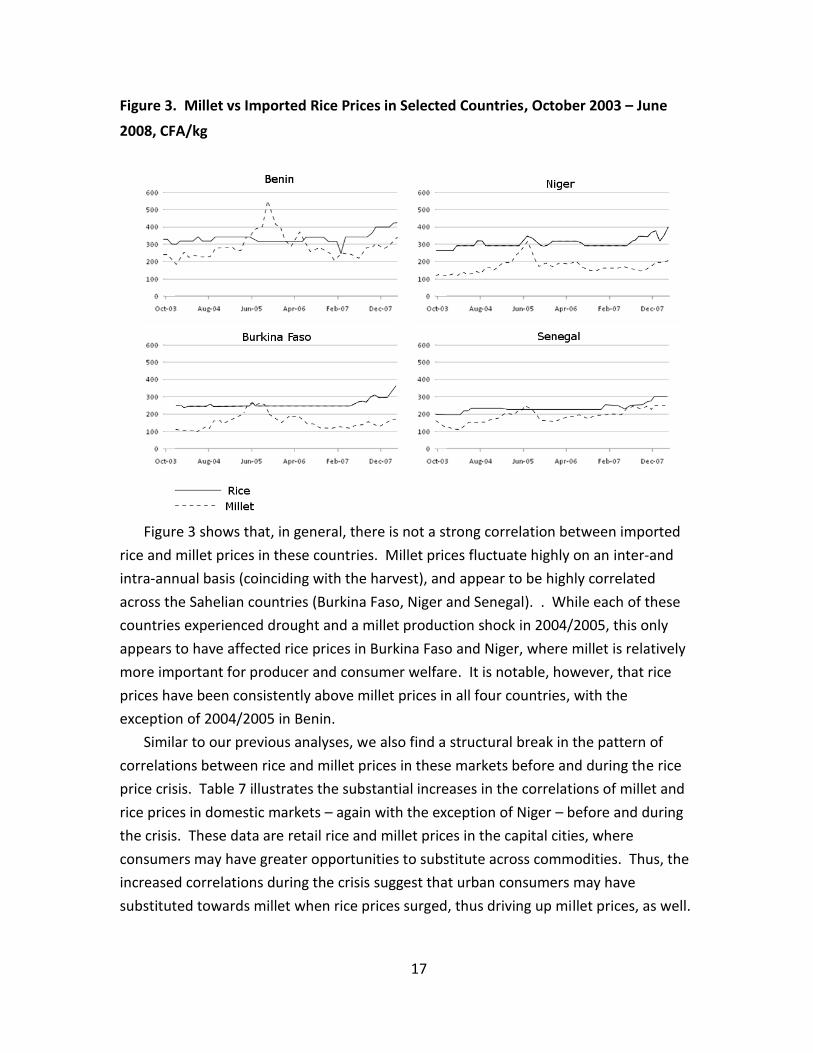
Figure 3. Millet vs Imported Rice Prices in Selected Countries, October 2003 – June
2008, CFA/kg
Figure 3 shows that, in general, there is not a strong correlation between imported
rice and millet prices in these countries. Millet prices fluctuate highly on an inter-and
intra-annual basis (coinciding with the harvest), and appear to be highly correlated
across the Sahelian countries (Burkina Faso, Niger and Senegal). . While each of these
countries experienced drought and a millet production shock in 2004/2005, this only
appears to have affected rice prices in Burkina Faso and Niger, where millet is relatively
more important for producer and consumer welfare. It is notable, however, that rice
prices have been consistently above millet prices in all four countries, with the
exception of 2004/2005 in Benin.
Similar to our previous analyses, we also find a structural break in the pattern of
correlations between rice and millet prices in these markets before and during the rice
price crisis. Table 7 illustrates the substantial increases in the correlations of millet and
rice prices in domestic markets – again with the exception of Niger – before and during
the crisis. These data are retail rice and millet prices in the capital cities, where
consumers may have greater opportunities to substitute across commodities. Thus, the
increased correlations during the crisis suggest that urban consumers may have
substituted towards millet when rice prices surged, thus driving up millet prices, as well.
18
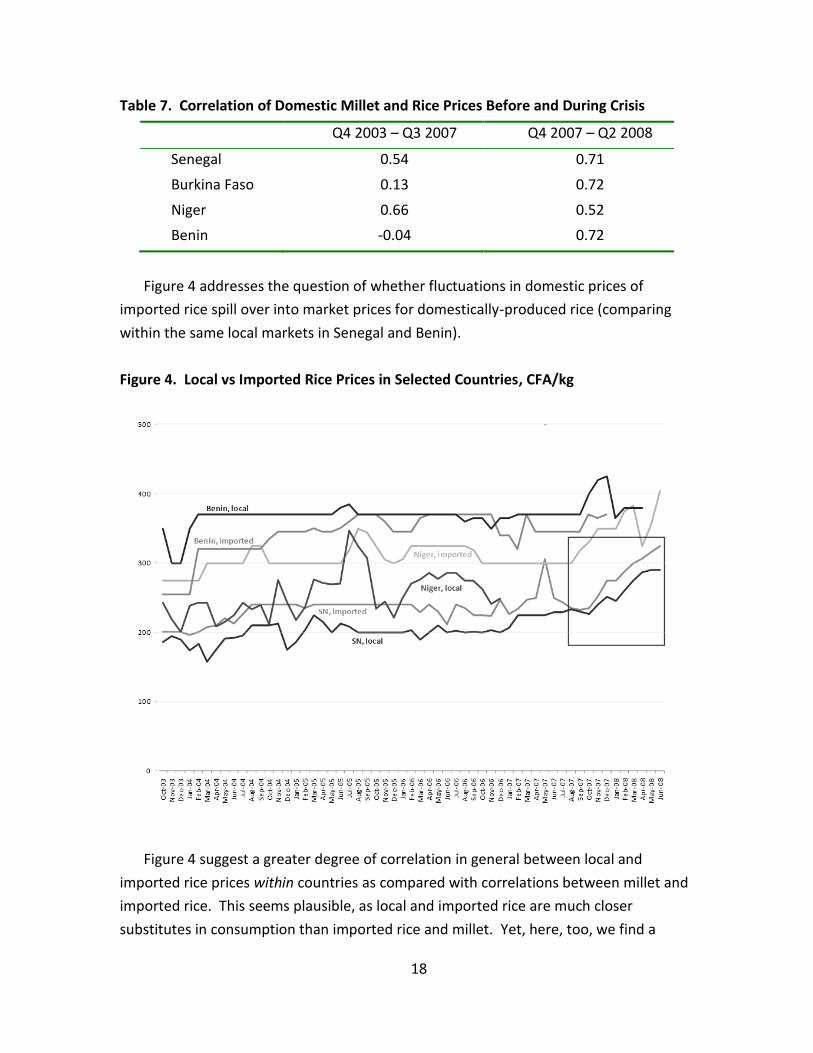
Table 7. Correlation of Domestic Millet and Rice Prices Before and During Crisis
Q4 2003 – Q3 2007 Q4 2007 – Q2 2008
Senegal 0.54 0.71
Burkina Faso 0.13 0.72
Niger 0.66 0.52
Benin -0.04 0.72
Figure 4 addresses the question of whether fluctuations in domestic prices of
imported rice spill over into market prices for domestically-produced rice (comparing
within the same local markets in Senegal and Benin).
Figure 4. Local vs Imported Rice Prices in Selected Countries, CFA/kg
Figure 4 suggest a greater degree of correlation in general between local and
imported rice prices within countries as compared with correlations between millet and
imported rice. This seems plausible, as local and imported rice are much closer
substitutes in consumption than imported rice and millet. Yet, here, too, we find a
19
substantial difference in these correlations before and during the crisis, as illustrated in
Table 8.
Table 8. Correlation of Domestic and Imported Rice Prices Before and During Crisis
Q4 2003 – Q3 2007 Q4 2007 – Q2 2008
Senegal 0.62 0.98
Benin 0.66 0.86
Comparing levels, rather than correlations, imported rice acts as a price ceiling on
local rice for Niger and Senegal, but not Benin. This suggests that border price
interventions on rice may be a powerful tool in shaping incentives facing domestic rice
producers in these countries, but may not be sufficient to increase rice yields and
production.
Historical Trade Policy Responses to Rice Price Fluctuations
In examining the policy implications of the recent surge in world rice prices, it is useful
to review countries’ border price policy reactions to past fluctuations in world prices. A
new dataset, recently released by the World Bank’s Distortions to Agricultural Incentives
Project, includes nominal rates of assistance (NRAs) for rice for a broad cross-section of
countries since the early 1960s.14 Among our focus countries, this dataset includes only
Senegal. The NRA is the percentage difference between the domestic price and the
border price of a commodity. Positive NRAs indicate that governments are intervening
to protect domestic producers of the import-competing commodity by taxing imports;
negative NRAs indicate import subsidies to protect consumers by lower domestic prices
below border prices.
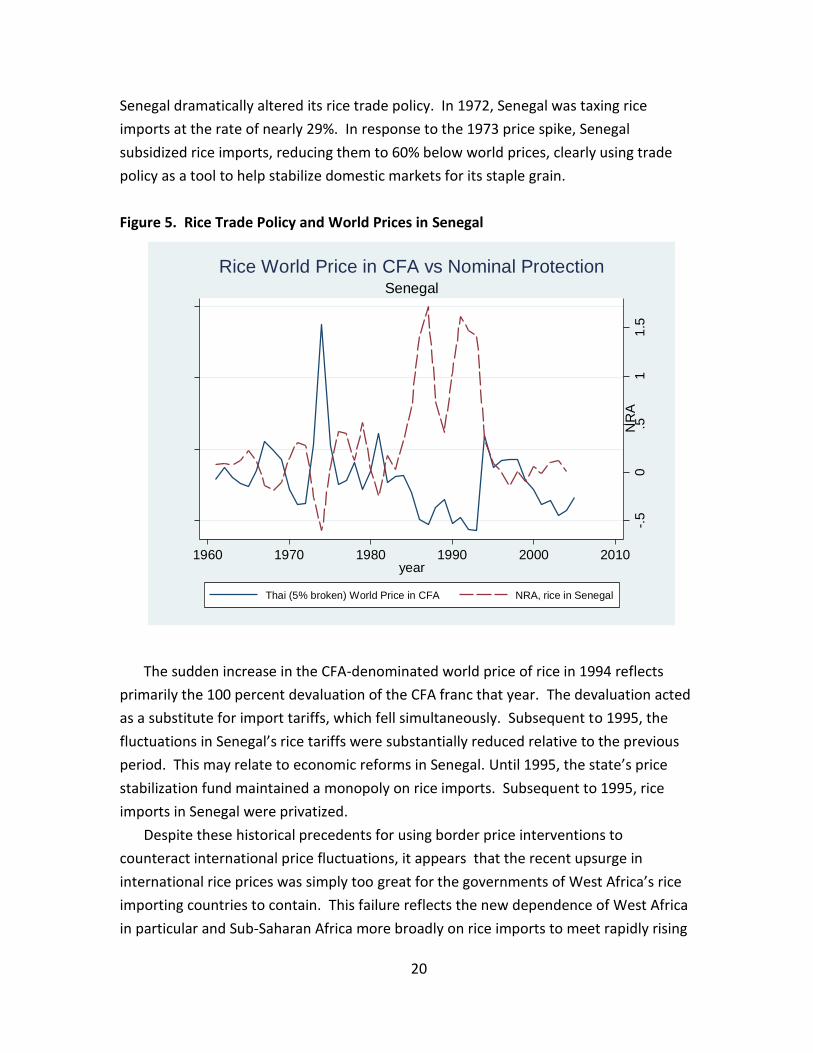
Figure 5 illustrates the trade policy responses of governments in Senegal to historical
fluctuations in the price of rice on world markets. The left-hand axis scales constant
world rice prices (the export price for 5% broken Thai) in CFA francs, and the right-hand
axis scales the NRA for rice. It is clear that Senegalese governments have generally used
trade policy to counteract fluctuations in world rice prices, thus tending to stabilize
domestic prices. The most striking example of this tendency occurred in response to the
global food crisis of 1973, during which time world rice prices tripled. In response,
14
This dataset, along with relevant background and working papers, is available at:
www.worldbank.org/agdistortions.
20
Senegal dramatically altered its rice trade policy. In 1972, Senegal was taxing rice
imports at the rate of nearly 29%. In response to the 1973 price spike, Senegal
subsidized rice imports, reducing them to 60% below world prices, clearly using trade
policy as a tool to help stabilize domestic markets for its staple grain.
Figure 5. Rice Trade Policy and World Prices in Senegal
-.5
0.5
11
.5N
RA
100
00
02
00
00
03
00
00
04
00
00
0
CF
A fra
ncs
1960 1970 1980 1990 2000 2010year
Thai (5% broken) World Price in CFA NRA, rice in Senegal
Senegal
Rice World Price in CFA vs Nominal Protection
The sudden increase in the CFA-denominated world price of rice in 1994 reflects
primarily the 100 percent devaluation of the CFA franc that year. The devaluation acted
as a substitute for import tariffs, which fell simultaneously. Subsequent to 1995, the
fluctuations in Senegal’s rice tariffs were substantially reduced relative to the previous
period. This may relate to economic reforms in Senegal. Until 1995, the state’s price
stabilization fund maintained a monopoly on rice imports. Subsequent to 1995, rice
imports in Senegal were privatized.
Despite these historical precedents for using border price interventions to
counteract international price fluctuations, it appears that the recent upsurge in
international rice prices was simply too great for the governments of West Africa’s rice
importing countries to contain. This failure reflects the new dependence of West Africa
in particular and Sub-Saharan Africa more broadly on rice imports to meet rapidly rising
21
demand. With imports now a significant share of total consumption, as Denning and
Gajigo (2009) document, it is no longer logistically or financially possible for most
African countries to isolate themselves from the world market. Although this
dependence grows out of the cheaper rice available in the world market compared with
domestic production, and is thus good for consumers, it does come with the added cost
of exposure to price fluctuations in the world market. Most of these fluctuations must
now be passed on to domestic consumers and, with considerable lags and variation, to
domestic rice producers.
Policy Responses to Recent Rice Price Increases
West African governments reacted to the rapid increase in international rice prices in a
variety of ways, none of which appears to have been greatly effective in mitigating the
impact of international price increases on their domestic markets.15 The most common
response was to eliminate pre-existing tariffs and value-added taxes on imported rice.
Senegal initiated rice import subsidies beginning in 2008, adding to the fiscal strain
caused by eliminating a significant source of government revenue. As public anger
mounted in the face of continued increases in rice prices (along with the prices of other
commodities), governments in Guinea, Mali, Burkina Faso, and Senegal reacted by
attempting to fix consumer rice prices, and by prohibiting exports (though, in practice,
their ability to implement this policy was limited).
In addition to trade policies, governments across the region (Burkina Faso, Mali,
Niger and Senegal) attempted to use the rice price crisis of 2008 as an opportunity to
reinvigorate domestic rice production, as higher international prices appeared to
increase the competitiveness of their domestic producers. In Senegal, for example, the
government initiated the Big Agricultural Offensive for Food and Abundance (GOANA),
promising to dedicate over two-thirds of the program’s $792 million budget to
subsidizing the purchase of fertilizers, seeds and pesticides. GOANA’s target was to
produce in the next season 500,000 tons of rice—2.5 times more than the current
production. Similarly, the Malian government implemented a “Rice Initiative”, which
provided input subsidies for rice. Finally, the Emergency Rice Initiative for Africa was
launched in late 2008, providing assistance to rice-growing countries in Africa in four
major areas: seed; fertilizer; best-bet technologies; and post-harvest and marketing.
15
This discussion is based on reporting by analysts from Oxfam and Fewsnet, presented in Inter-réseaux
Développement Rural, No. 42, June-August, 2008.
22
This initiative was launched jointly by the Africa Rice Center (WARDA), Food and
Agriculture Organization of the United Nations (FAO), IFDC, Catholic Relief Services (CRS)
and International Fund for Agricultural Development (IFAD).16 Nevertheless, these
initiatives focus primarily on increased production, rather than processing and
marketing, which are important determinants of domestic rice prices. In addition, the
rapid decline in international rice prices during late 2008 calls into question the
sustainability of these initiatives.
IV. Summary and Conclusions
Rice consumption in West Africa has increased rapidly over the past decade,
substantially outpacing the growth rate of local production. The importance of rice in
local consumption and production varies widely across countries in the region. Coastal
countries in particular, have been largely dependent on low cost Asian exports to meet
the growing gaps between production and consumption. For those countries in which
per capita rice consumption is substantial (Senegal in particular, but also Mali and
Benin), the rice crisis of 2007-2008 was a severe shock, with potential consequences for
both under-nutrition and poverty.
In recent decades, governments in the region tended to intervene in trade with the
goal of buffering consumers from international market price fluctuations. This objective
presented little challenge during the long period of stable or declining international rice
prices. Between 2003 and 2007, rice consumers in Senegal, Benin, Burkina Faso, and
Niger saw only a small share of the gradual increases in international prices. However,
the dramatic surge in international rice prices during 2007-2008 undermined these
efforts, as governments in the region had neither the financial nor the physical capacity
to provide sufficient quantities of rice to consumers at pre-crisis prices.
Governments across West Africa responded to the crisis, first by reducing or
eliminating rice import tariffs. Several countries also responded by prohibiting cereals
exports. Though costly to the governments, these efforts were insufficient to buffer
domestic consumers from the increase in international prices. Senegal went further,
subsidizing rice consumption in 2008. In addition, Senegal and other countries
announced plans to reinvigorate domestic rice production in the face of high prices.
While these initiatives have taken different forms in different countries, the steep
16
http://allafrica.com/stories/200806180893.html
23
decline in international rice prices in late 2008 calls into question the sustainability of
these efforts, however well-intentioned by the governments.
24
V. References
Dawe D (2008). “Have recent increases in international cereal prices been transmitted
to domestic economies? The experience in seven large Asian countries,” Agricultural
and Development Economics Division (ESA) Working paper 08-03. Food and
Agricultural Organization, Rome.
Denning, Glenn, and Ousman Gajigo, “Rice in Africa: Will Imports Continue to Grow?,”
mimeo prepared for a Workshop on the World Rice Crisis, Chiang Mai, February,
2009
Imai, Katsushi, Raghav Gaiha, and Ganesh Thapa. 2008. “Transmission of World
Commodity Prices to Domestic Commodity Prices in India and China.” (June) School
of Social Sciences (Economics), University of Manchester, UK.
International Monetary Fund, International Financial Statistics, various issues. IMF:
Washington, D.C.
Inter-réseaux Développement Rural, No. 42, June-August, 2008. (http://www.inter-
reseaux.org/rubrique.php3?id_rubrique=8/)
Pearson, Scott R., J. Dirk Stryker and Charles P. Humphreys, 1981. Rice in West Africa:
Policy and Economics. Stanford University Press, Stanford, CA.
WARDA. 2008. 2007 Rice Trends. West Africa Rice Development Authority: Cotonou,
Benin.
Wodon, Quentin, “Potential Impact of Higher Food Prices on Poverty: Summary
Estimates for a Dozen West and Central African Countries,” World Bank Policy
Research Working Paper No. 4745, Oct. 2008, World Bank: Washington, D.C.